Tom Wallace www.tfwallace.com by Tom Wallace for OMTEC – Chicago – June 16, 2010 Sales & Operations Planning A workshop on: • what it is • how it can help • how to make it work

Welcome message from author
This document is posted to help you gain knowledge. Please leave a comment to let me know what you think about it! Share it to your friends and learn new things together.
Transcript

Tom Wallace www.tfwallace.com
by Tom Wallace
for OMTEC – Chicago – June 16, 2010
Sales & Operations Planning A workshop on:
• what it is • how it can help • how to make it work

Tom Wallace www.tfwallace.com
Objectives of this Session Objectives of this Session Enable each attendee to:
• Understand where Executive S&OP fits, what it does, why it’s important
• Understand and explain the logic and mechanics of Executive S&OP
• Explain the elements of the monthly process
• Be exposed to a highly effective implementation process.
• Other?

Tom Wallace www.tfwallace.com
Where is Your Company Relative to Executive SOP? Where is Your Company
Relative to Executive SOP?
1 – Successfully implemented
2 – Implemented but not working well
3 – Implementing now
4 – Not yet implementing

Tom Wallace www.tfwallace.com
Outline XXXXX Outline XXXXX
• Sales & Operations Planning Role, Scope, Benefits
• Display of S&OP Information
• The Executive S&OP Process – Demand Planning (Forecasting) – Supply (Capacity) Planning – Pre-meeting – Exec Meeting
• Global Executive S&OP
• Risk Management
• Implementation
• Problem Solving Session
• The Future of Sales & Operations Planning

Tom Wallace www.tfwallace.com
Complexity, Change and Coordination
Complexity, Change and Coordination
COMPLEXITY AND THE RATE OF CHANGE
NEED FOR EFFECTIVE COORDINATION P
ROCESSES: S&OP
Impact of: Lean Mfg? Global Businesses? Lengthy Supply Chains?
Tom Wallace www.tfwallace.com

Tom Wallace www.tfwallace.com

Tom Wallace www.tfwallace.com
The Four Fundamentals The Four Fundamentals
Demand Supply
Volume
Mix
Sales & Operations Planning X
How Much? Rates The Big Picture Product Families
Strategy/Policy/Risk Monthly/18 months+
Top Management
Which Ones? Timing/Sequence The Details Products, SKUs, Orders
Tactics/Execution Weekly/Daily .56 mos
Middle Management

Tom Wallace www.tfwallace.com
Sales & Operations Planning Sales & Operations Planning
Demand Supply
Volume
Mix
Executive S&OP
Master Scheduling Plant, Supplier and Distribution Scheduling
(Kanban, APS, etc.)
Demand Planning/ Forecasting
Supply (Capacity) Planning
Operational S&OP
Volume Planning for Demand and Supply Medium to LongTerm Financial Planning
Support for Earnings Calls, Risk Mgmt, Strategy

Slide 9
b6 I think the key thing to hit is "what is Executive S&OP"? Should we have some bullet points somewhere that give some basic description? And can we link this back to some key points:?
1) This is about Executive" Decision Making" 2) This is about" Business Performance" (not just demand/supply balancing) 3) This is not "detailed execution review" bodell, 8/16/2006

Tom Wallace www.tfwallace.com
Executive S&OP . . . Executive S&OP . . .
• Is an executive decision-making process
• Balances demand and supply
• Deals with volume in both units and $$$
• Links operational plans to financial plans: one set of numbers
• facilitates risk management
• Is the forum for setting relevant strategy and policy

Tom Wallace www.tfwallace.com
Executive S&OP . . . Executive S&OP . . .
. . . is essential for the elements within Operational S&OP –
Master Scheduling
Distribution Requirements Planning
Plant Scheduling – APS, Kanban, etc.
Supplier Scheduling
– to function well and contribute to their full potential.

Tom Wallace www.tfwallace.com
Sales/Marketing (Units/$$$ by Family)
Operations (Units/hours/Material)
Finance (Dollars)
Product Development (New Product Issues)
From 5,000 Feet From 5,000 Feet
Executive S&OP A process to reconcile, agree upon, and communicate the
company game plan
Centripetal
Shared View
Teamwork

Tom Wallace www.tfwallace.com
Where Executive S&OP Fits Where Executive S&OP Fits
Strategic Planning Strategic Planning
Detailed Planning, Scheduling & Execution
Detailed Planning, Scheduling & Execution
Business Planning Business Planning
Disconnect!!! Disconnect!!! Executive S&OP Executive S&OP

Tom Wallace www.tfwallace.com
Business Plan Characteristics Business Plan Characteristics
• Dollars • 3 to 5 Years • Annual Budget • Entire Business • Ownership

Tom Wallace www.tfwallace.com
Levels of Business Planning Levels of Business Planning
Y E A R S
1 2 3 4 5 Long Range Planning
Annual $$$ Plan
Executive S&OP
Rolling monthly check on the Business Plan
(units and $$$)

Tom Wallace www.tfwallace.com
The Leader of the Business Unit (General Manager, President, COO) Needs to be Hands-On with Executive S&OP:
1. Stewardship
The Role of Top Management The Role of Top Management

Tom Wallace www.tfwallace.com
Strategic Planning Strategic Planning
Detailed Planning, Scheduling & Execution
Detailed Planning, Scheduling & Execution
Business Planning Business Planning
Disconnect!!! Disconnect!!! Disconnect!!! Disconnect!!!

Tom Wallace www.tfwallace.com
The Leader of the Business Unit (General Manager, President, COO) Needs to be Hands-On with Executive S&OP:
1. Stewardship 2. Leadership
• Break ties
The Role of Top Management The Role of Top Management

Tom Wallace www.tfwallace.com
Executive S&OP Executive S&OP
Sales/Marketing (Units/$$$ by Family)
Operations (Units/hours/Material)
Finance (Dollars)
Product Development (New Product Issues)
President
The Role of The President The Role of The President (CEO, COO, GM, MD, etc.) (CEO, COO, GM, MD, etc.)

Tom Wallace www.tfwallace.com
The Leader of the Business Unit (General Manager, President, COO) Needs to be Hands-On with Executive S&OP:
1. Stewardship 2. Leadership
• Break ties • Set high standards • Motivate
Monthly Time Commitment: 1.5
The Role of Top Management The Role of Top Management
hours

Tom Wallace www.tfwallace.com
Hard Benefits Hard Benefits
• Customer Service UP • Inventory DOWN • Obsolescence DOWN • Freight Costs DOWN • Order Lead Times DOWN • Supplier Lead Times DOWN • Time to Launch New Products DOWN • Plant Productivity UP

Tom Wallace www.tfwallace.com

Tom Wallace www.tfwallace.com

Tom Wallace www.tfwallace.com
Soft Benefits Soft Benefits
• Enhanced Teamwork • Improved Communications – Institutionalized • Better Decisions with Less Effort and Time • Better $$$ Plans with Less Effort and Time • Greater Accountability • Greater Control • Window into the Future
Top Management’s Handle on the Business

Tom Wallace www.tfwallace.com

Tom Wallace www.tfwallace.com
Bad Day at Acme Widget Bad Day at Acme Widget
Product Manager, reviewing forecast for 1st time in 3 mos.
Product Manager revises the forecast downward.
Feb Mar Apr May Jun Jul Aug Sep Forecast (000) 100 100 100 100 120 120 120 120
Actual Sales 90 95 85 Difference 10 5 15 Cum Difference 15 30
Feb Mar Apr May Jun Jul Aug Sep Forecast (000) 100 100 100 Old Forecast 100 120 120 120 120
New Forecast 90 90 90 90 90 Actual Sales 90 95 85 Difference 10 5 15 Cum Difference 10 15 30

Tom Wallace www.tfwallace.com
Production Plan Production Plan
Current Production Plan.
Plant Manager gets bad news & adjusts Production Plan.
Feb Mar Apr May Jun Jul Aug Sep Plan Production (000) 100 100 100 110 120 120 120 120
Actual Production 98 100 101 Difference 2 0 +1 Cum Difference 2 2 1
Feb Mar Apr May Jun Jul Aug Sep Plan Production (000) 100 100 100 Old Plan 110 120 120 120 120
New Plan 110 100 100 90 90 Actual Production 98 100 101 Difference 2 0 +1 Cum Difference 2 2 1

Tom Wallace www.tfwallace.com
Inventory Review Inventory Review
CFO observes the high inventories.
Feb Mar Apr May Jun Jul Aug Sep Plan Inventory (1 Mo) 100 100 100 120 120 120 120 120 Actual Inv. 103 111 116 132 Difference +11 +16 +32
Average Standard Cost ~ $100 per unit April Ending Inventory ~ $13,200,000

Tom Wallace www.tfwallace.com
Inventory Review Inventory Review
CFO gets new Forecast and Production Plan. Feb Mar Apr May Jun Jul Aug Sep
Forecast (000) New Forecast 90 90 90 90 90 Actual Sales 90 95 85 Difference 10 5 15 Cum Difference 10 15 30
Plan Production New Plan 110 100 100 90 90 Actual Production 98 100 101 Difference 2 0 +1 Cum Difference 2 2 1
Current Inventory 132 New Inv. Plan 152 162 172

Tom Wallace www.tfwallace.com
Sally Smith’s Spreadsheet Sally Smith’s Spreadsheet FEB MAR APR MAY JUN JUL AUG SEP
FORECAST 100 100 100 100 120 120 120 120
ACTUAL SALES 90 95 85
DIFFERENCE -10 -5 -15
CUM DIFFERENCE -15 -30
PLANNED PRODUCTION 100 100 100 110 120 120 120 120
ACTUAL PRODUCTION 98 100 101
DIFFERENCE -2 0 +1
CUM DIFFERENCE -2 -1
PLANNED INV (1 MONTH SUPPLY) 100 100 100 ???
ACTUAL INVENTORY (JAN=103) 111 116 132
DIFFERENCE +11 +16 +32

Tom Wallace www.tfwallace.com
FEB MAR APR MAY JUN JUL AUG SEP
FORECAST 100 100 100 100 120 120 120 120
ACTUAL SALES 90 95 85
DIFFERENCE -10 -5 -15
CUM DIFFERENCE -15 -30
PLANNED PRODUCTION 100 100 100 110 120 120 120 120
ACTUAL PRODUCTION 98 100 101
DIFFERENCE -2 0 +1
CUM DIFFERENCE -2 -1
PLANNED INV (1 MONTH SUPPLY) 100 100 100 142 142 142 142 142
ACTUAL INVENTORY (JAN=103) 111 116 132
DIFFERENCE +11 +16 +32
Is this plan okay?
Sally Smith’s Spreadsheet Sally Smith’s Spreadsheet

Tom Wallace www.tfwallace.com
FEB MAR APR MAY JUN JUL AUG SEP
FORECAST 100 100 100 100 120 120 120 120
ACTUAL SALES 90 95 85
DIFFERENCE -10 -5 -15
CUM DIFFERENCE -15 -30
PLANNED PRODUCTION 100 100 100 110 120 120 120 120
ACTUAL PRODUCTION 98 100 101
DIFFERENCE -2 0 +1
CUM DIFFERENCE -2 -1
PLANNED INV (1 MONTH SUPPLY) 100 100 100 142 142 142 142 142
ACTUAL INVENTORY (JAN=103) 111 116 132
DIFFERENCE +11 +16 +32
Sally Smith’s Spreadsheet Sally Smith’s Spreadsheet

Tom Wallace www.tfwallace.com
Sally Smith’s Spreadsheet Sally Smith’s Spreadsheet
FEB MAR APR MAY JUN JUL AUG SEP
FORECAST 100 100 100 100 120 120 120 120
ACTUAL SALES 90 95 85
DIFFERENCE -10 -5 -15
CUM DIFFERENCE -15 -30
PLANNED PRODUCTION 100 100 100 110 110 110 120 120
ACTUAL PRODUCTION 98 100 101
DIFFERENCE -2 0 +1
CUM DIFFERENCE -2 -1
PLANNED INVENTORY (1-MO) 100 100 100 142
ACTUAL INVENTORY (JAN=103) 111 116 132
DIFFERENCE +11 +16 +32
Tom Wallace www.tfwallace.com
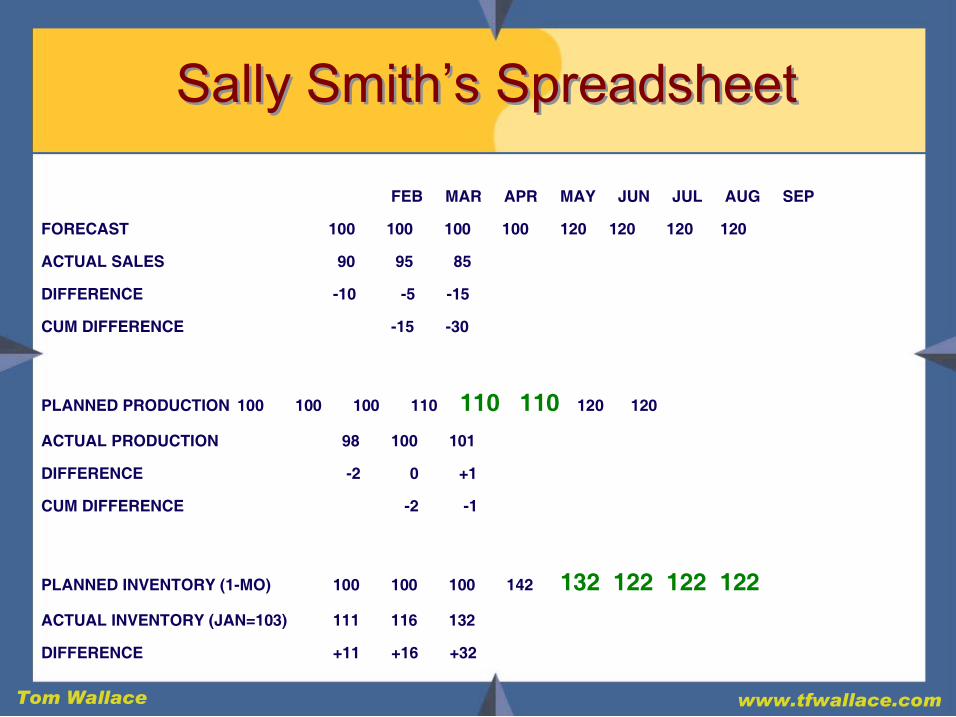
Sally Smith’s Spreadsheet Sally Smith’s Spreadsheet
FEB MAR APR MAY JUN JUL AUG SEP
FORECAST 100 100 100 100 120 120 120 120
ACTUAL SALES 90 95 85
DIFFERENCE -10 -5 -15
CUM DIFFERENCE -15 -30
PLANNED PRODUCTION 100 100 100 110 110 110 120 120
ACTUAL PRODUCTION 98 100 101
DIFFERENCE -2 0 +1
CUM DIFFERENCE -2 -1
PLANNED INVENTORY (1-MO) 100 100 100 142 132 122 122 122 ACTUAL INVENTORY (JAN=103) 111 116 132
DIFFERENCE +11 +16 +32

Tom Wallace www.tfwallace.com
Outline Outline
• Sales & Operations Planning Role, Scope, Benefits
• Display of S&OP Information
• The Executive S&OP Process – Demand Planning (Forecasting) – Supply (Capacity) Planning – Pre-meeting – Exec Meeting
• Global Executive S&OP
• Implementation
• Problem Solving Session
• The Future of Sales & Operations Planning

Tom Wallace www.tfwallace.com
Step #5 Executive Meeting
Decisions & Game Plan
Step #4 Pre
Meeting Conflict Resolution, Recommendations & Agenda for Exec. Mtg.
Step #1 Data
Gathering
End of Month
Sales Actuals, Statistical Forecasts
& Supply Actuals
Step #2 Demand Planning Management Forecast
1stpass spreadsheets
Step #3 Supply Planning Capacity constraints
2ndpass spreadsheets
Heavy
Lifting
The Executive S&OP Process

Tom Wallace www.tfwallace.com
Exec Meeting
Pre Meeting
Data Gathering
Demand Planning
Supply Planning
New P
roduct
Devel
opment
Involv
ement
Financ
e Depa
rtment
Involv
ement
Role of Finance and Role of Finance and New Product Development New Product Development

Tom Wallace www.tfwallace.com

Tom Wallace www.tfwallace.com

Tom Wallace www.tfwallace.com
Alternative Scenarios Alternative Scenarios Situation: Indiana plant is heavily overloaded, can’t
meet the newly-increased demand plan
Alternatives Cost Issues a. Add a shift at Indiana Supervision,
hiring, training
b. Offload to plant in Utah Freight, cost difference
c. Outsource Total cost to acquire
d. Combination Most or all of the above

Tom Wallace www.tfwallace.com
Alternative Scenarios Alternative Scenarios Alternatives Cost Issues a. Add a shift at Indiana Supervision,
hiring, training
b. Offload to plant in Utah Freight, cost differential
c. Outsource Total cost to acquire
d. Combination Most or all of the above
Other implementation issues: time, duration
Other operational issues: quality, lead time, flexibility etc.

Tom Wallace www.tfwallace.com
Where Will The Decision Be Made? Where Will The Decision Be Made?
Step 1 Data
Gathering
Step 2 Demand Planning
Step 3 Supply Planning
Step 4 Pre
Meeting
Step 5 Exec
Meeting

Tom Wallace www.tfwallace.com
The 5 The 5 Step Executive S&OP Process Step Executive S&OP Process Decisions & Updated
Game Plan
Decisions, Recommendations, Scenarios, & Agenda for Exec Meeting
Step 1 Data
Gathering
End of Month
Actual Demand, Supply,
Inventory, & Backlog + Statistical Forecasts and Worksheets
Management Forecast 1stpass spreadsheets
Resource Requirements Plan Capacity Constraints 2ndpass spreadsheets
Step 2 Demand Planning
Step 3 Supply
Planning
Step 4 Pre
Meeting
Step 5 Exec
Meeting Heavy
Lifting

Tom Wallace www.tfwallace.com
Sample Agenda – Exec Meeting Sample Agenda – Exec Meeting
• Macro $$$ Review – All Families Combined • Customer Service Performance – Order Fill • New Product Issues • Family-by-Family Review and Decisions • Production/Procurement Rate Changes • Collective Impact on Business Plan • Recap of Decisions Made • Critique of Meeting

Tom Wallace www.tfwallace.com
Exec Meeting Participants Exec Meeting Participants
Essential: • SBU Leader (Pres./GM) • VP Sales • VP Marketing • VP Operations/Logistics • VP Product Development • VP Finance Probable: • Exec. S&OP Process Owner • PreMeeting Facilitator • Demand Manager • Supply Chain Manager
Possible: • Controller • Customer Service Manager • Forecast Analyst • Human Resource Manager • Master Scheduler • Plant Manager • Product Development Manager • Product Manager • Purchasing Manager • ????

Tom Wallace www.tfwallace.com
Executive S&OP Timetable Executive S&OP Timetable
Working Day of the Month
Step 1 2 3 4 5 6 7 8 9 10 11 12 13 14 15
Exec. Meeting l Pre Meeting l Supply Planning Demand Planning Data Gathering

Tom Wallace www.tfwallace.com
Strategic or Tactical? Strategic or Tactical?
Strategy
Tactics
Executive S&OP

Tom Wallace www.tfwallace.com

Tom Wallace www.tfwallace.com
Executive S&OP and Risk Executive S&OP and Risk The 21 st Century Supply Chain: • Extended • Brittle • Longer lead times • More variable lead times
Supply Chain disruptions: • Potential • Actual

Tom Wallace www.tfwallace.com
Types of Supply Chain Disruptions Types of Supply Chain Disruptions
• Supply crash
• Demand spike
• Demand crash
• Supply spike

Tom Wallace www.tfwallace.com
Executive S&OP and Risk Executive S&OP and Risk The 21 st Century Supply Chain: • Extended • Brittle • Longer lead times • More variable lead times
Supply Chain disruptions: • Potential • Actual
Executive S&OP can help with: • Anticipating potential disruptions • Recovering from actual disruptions

Tom Wallace www.tfwallace.com
Executive S&OP’s Role in Anticipation
Executive S&OP’s Role in Anticipation
• Initially set hedges: safety stock safety time location consignment finished products components/raw materials
• Review and revise hedges during the Executive S&OP cycle
• Permanent agenda item – PreMeeting and Exec Meeting

Tom Wallace www.tfwallace.com
Executive S&OP’s Role in Recovery
Executive S&OP’s Role in Recovery
• Minor Disruption: probably no role
• Moderate to Major Disruption:
The “MiniS&OP Cycle”

Tom Wallace www.tfwallace.com
The MiniS&OP Cycle The MiniS&OP Cycle • Focus on affected parts of the business • Solve the problem at the earliest step possible:
Step 2 Demand Planning
Step 3 Supply
Planning
Step 4 Pre
Meeting
Step 5 Exec
Meeting

Tom Wallace www.tfwallace.com
The MiniS&OP Cycle The MiniS&OP Cycle • Focus on affected parts of the business • Solve the problem at the earliest step possible:
• Use the same people, report formats, and processes as in the regular monthly cycle
Step 2 Demand Planning
Step 3 Supply
Planning
Step 4 Pre
Meeting
Step 5 Exec
Meeting

Tom Wallace www.tfwallace.com
Outline Outline
• Sales & Operations Planning Role, Scope, Benefits
• Display of S&OP Information
• The Executive S&OP Process – Demand Planning (Forecasting) – Supply (Capacity) Planning – Pre-meeting – Exec Meeting
• Global Executive S&OP
• Implementation
• Problem Solving Session
• The Future of Sales & Operations Planning

Tom Wallace www.tfwallace.com
Executive S&OP Process Executive S&OP Process
Step #4 PreMeeting Conflict Resolution,
Recommendations & Agenda for Exec. Mtg.
Step #1 Data
Gathering
End of Month
Sales Actuals, Statistical Forecasts
& Supply Actuals
Step #2 Demand Planning Management Forecast
Step #3 Supply Planning Capacity constraints
Step #5 Executive Meeting
Decisions & Game Plan

Tom Wallace www.tfwallace.com
The Global Challenge: The Global Challenge:
To coordinate an organization doing business in many different countries, on many different continents . . .
. . . without inhibiting accountability, and stifling local initiatives and ways of doing business.

Tom Wallace & Bob Stahl www.tfwallace.com
Global Executive S&OP Global Executive S&OP
• Entities: areas (regions) where demand and supply align
How One Company Does It:

Tom Wallace www.tfwallace.com
Regions & Entities: Example Regions & Entities: Example
Regions Plants Entities North America Mexico, US South America Europe Belgium Middle East/Africa Asia/Pacific China, Australia

Tom Wallace & Bob Stahl www.tfwallace.com
Regions & Entities: Example Regions & Entities: Example
Regions Plants Entities North America Mexico, US South America Europe Belgium Middle East/Africa Asia/Pacific China, Australia
Y N Y N Y

Tom Wallace & Bob Stahl www.tfwallace.com
Global Executive S&OP Global Executive S&OP
• Entities: areas (regions) where demand and supply align
• Executive S&OP occurs within each Entity – up to and including the Exec S&OP meeting
How One Company Does It:

Tom Wallace & Bob Stahl www.tfwallace.com
Step #5 Executive Meeting
Step #4 PreS&OP Meeting
Step #1 Data
Gathering
Step #2 Demand Planning
Step #3 Supply Planning
E n t i
t y A
Global Executive S&OP Global Executive S&OP

Tom Wallace & Bob Stahl www.tfwallace.com
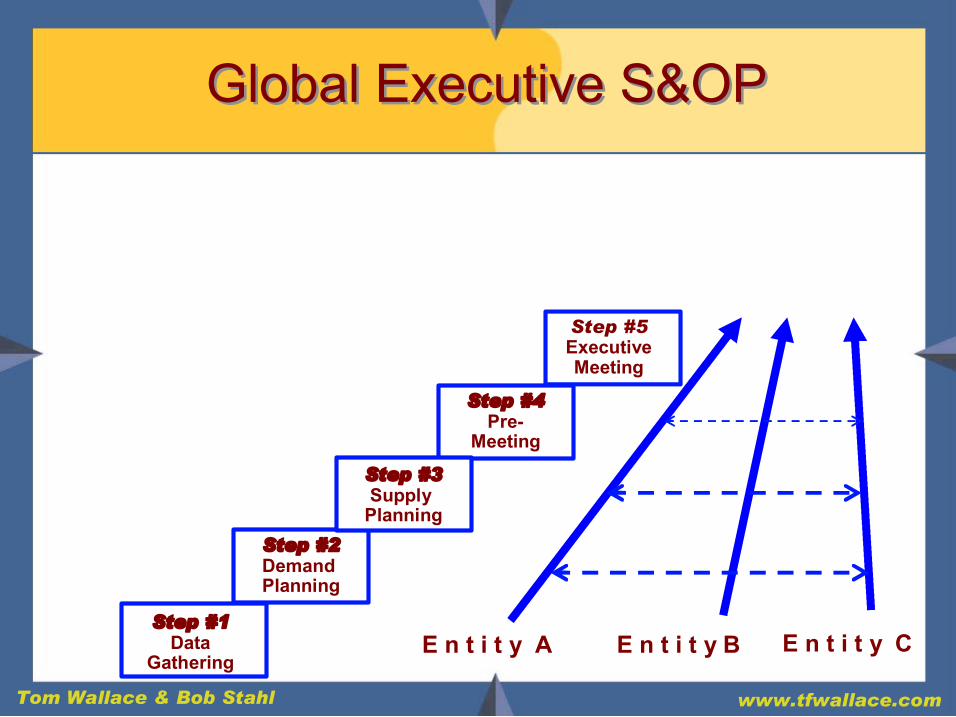
Global Executive S&OP Global Executive S&OP
• Entities: areas (regions) where demand and supply align
• Executive S&OP occurs within each Entity – up to and including the Exec S&OP meeting
• Inter-entity Coordination – primarily within Demand Planning and Supply Planning, also at Pre-Meeting
How One Company Does It:
Tom Wallace & Bob Stahl www.tfwallace.com
Step #5 Executive Meeting
Step #4 Pre
Meeting
Step #1 Data
Gathering
Step #2 Demand Planning
Step #3 Supply Planning
E n t i t y A E n t i t y B E n t i t y C
Global Executive S&OP Global Executive S&OP

Tom Wallace & Bob Stahl www.tfwallace.com
Global Executive S&OP Global Executive S&OP
• Entities: areas (regions) where demand and supply align
• Executive S&OP occurs within each Entity – up to and including the Exec S&OP meeting
• Inter-entity Coordination – primarily within the Demand Planning and Supply Planning phases
• Global Consolidation – at world HQ, following Exec meetings in the Entities
• Global Exec Meeting – primarily, but not exclusively, financial
How One Company Does It:

Tom Wallace & Bob Stahl www.tfwallace.com
Step #5 Executive Meeting
Step #4 PreS&OP Meeting
Step #1 Data
Gathering
Step #2 Demand Planning
Step #3 Supply Planning
Step #6 Global
Consolidation
E n t i t y A E n t i t y B E n t i t y C
Step #7 Global Exec Meeting
Global Executive S&OP Global Executive S&OP

Tom Wallace & Bob Stahl www.tfwallace.com
Step #5 Executive Meeting
Step #4 PreS&OP Meeting
Step #1 Data
Gathering
Step #2 Demand Planning
Step #3 Supply Planning
Step #6 Global
Consolidation
Step #7 Global Exec Meeting
Global Executive S&OP Global Executive S&OP
Question: If you sell products around the world but have supply in only one region, do you need Global S&OP?

Tom Wallace & Bob Stahl www.tfwallace.com
Step #5 Executive Meeting
Step #4 PreS&OP Meeting
Step #1 Data
Gathering
Step #2 Demand Planning
Step #3 Supply Planning
Global Executive S&OP Global Executive S&OP
Question: If you sell products around the world but have supply in only one region, do you need Global S&OP?

Tom Wallace & Bob Stahl www.tfwallace.com
The Global Challenge The Global Challenge
“We are a series of organizations doing business locally, with intense global coordination.” – Percy Barnevik
Former CEO ABB
Executive S&OP should support these dual objectives.

Tom Wallace & Bob Stahl www.tfwallace.com

Tom Wallace www.tfwallace.com
Outline Outline
• Sales & Operations Planning Role, Scope, Benefits
• Display of S&OP Information
• The Executive S&OP Process – Demand Planning (Forecasting) – Supply (Capacity) Planning – Pre-meeting – Exec Meeting
• Global Executive S&OP
• Implementation
• Problem Solving Session
• The Future of Sales & Operations Planning

Tom Wallace www.tfwallace.com
Implementing Executive S&OP Implementing Executive S&OP
Bad News • Change
• 812 Months
Good News • Few People
(several dozen)
• Early Results ( 23 Months)
• Low Cost (< $100K)

Tom Wallace www.tfwallace.com
The ABC’s of Implementation The ABC’s of Implementation
C – Computer
B – Data
A – People

Tom Wallace www.tfwallace.com
C Item Software for S&OP C Item Software for S&OP
Traditional: Spreadsheet Software
• Advantages: – Ultra low cost – Quick to come up – No learning curve
• Disadvantages: – Simulation > Slow – Unit and Dollar Alignment > Weak – Volume and Mix Alignment > Weak – “Blood, Sweat, and Excel” – Dead End

Tom Wallace www.tfwallace.com
Software for S&OP – Cont’d Software for S&OP – Cont’d
New: S&OP Specific Software
• Disadvantages: – Can Slow Down the Implementation – Cost – Learning Curve
• Advantages: – Simulation > Rapid, Real Time – Unit and Dollar Alignment > Strong, Constant – Volume and Mix Alignment > Strong, Constant – Fast Preparation – Supports Growth and Greater Complexity

Tom Wallace www.tfwallace.com
So, What To Do About Software? So, What To Do About Software?
Options:
1. Use spreadsheet software
2. Use S&OP specific software
3. Hybrid: start with spreadsheet switch to specific later
When in doubt, pick 3.

Tom Wallace www.tfwallace.com
B Item: DATA ISSUES B Item: DATA ISSUES • Families and Subfamilies • Resources

Tom Wallace www.tfwallace.com
Product Families and Supply Resources
Product Families and Supply Resources
Product Families
- Customers
- Markets
- Application
- How the Product is Used
What works best for Marketing and Sales
Supply Resources
-Plants
-Departments
-Suppliers
-How the Product
is Made
What works best for Operations, Supply Chain, Logistics, etc.

Tom Wallace www.tfwallace.com
B Item: DATA ISSUES B Item: DATA ISSUES
• Families and Subfamilies • Resources • Units of Measure • Load Profiles/Bills of Resources • Average Selling Prices and Gross Margins • Actuals: Sales, Bookings, Production, Inventories, Backlog • Demand/Supply Strategies:
Where “Meet the Customer” – (MTS, MTO, FTO) Target Fill Rates Target Finished Goods Inv: Days On Hand Target Customer Order Backlog: Days On Hand Target Module Inv: Days On Hand

Tom Wallace www.tfwallace.com
A Item: People A Item: People
The problem is not understanding Executive S&OP. It’s simple
The hard part is
Organizational Behavior Change . . . changing how we collectively manage the business.
Issues: Discipline/Self-discipline Accountability Conflict Management

Tom Wallace www.tfwallace.com
Implementing Executive S&OP Is Different
Implementing Executive S&OP Is Different
Active, Hands-on Participation by the President and Staff
The president must provide: • Support • Funding • Commitment • Leadership
So what’s new?
Each and Every Month

Tom Wallace www.tfwallace.com
Implementation Principles Implementation Principles
• People are the A item
• Implementation begins and ends with the Leader of the business
• “Hold the high ground” – involve top management at the very outset of the implementation, and throughout – and you will probably succeed
•“Build it and they will come” – design it first, get the mechanics working, and then try to sell it to top management – carries a lower probability for success

Tom Wallace www.tfwallace.com
Implementation Path Implementation Path
1 2 3 4 5 6 7 8 9 Months
Phase I Phase I Live Pilot
Phase II Phase II Expansion
Live Pilot Go/NoGo #2
Executive Briefing
Go/NoGo #1
Kickoff Session
Low Risk Low Cost High Impact
B U S I N E S S
I M P R O V E M E N T
Phase III Phase III Financial Integration

Tom Wallace www.tfwallace.com
Identifying a Broken Process Identifying a Broken Process
Executive S&OP is “broken” if: • Top management is not involved • Teamwork has not visibly improved • Meeting attendance is poor • Focus is on mix and the short term • Conflict is not resolved • Finger-pointing is not “off limits” • Decisions are not made • and so on

Tom Wallace www.tfwallace.com
Fixing a Broken Executive S&OP Process
Fixing a Broken Executive S&OP Process
• Convene a group, including a member of the executive staff
• Conduct a self-audit
• Answer the question: do the President and staff participate each month?
• If yes, fix problems shown in self-audit • If no, begin a re-implementation

Tom Wallace www.tfwallace.com
Reimplementing Executive S&OP Reimplementing Executive S&OP
• Will top management agree to an Executive Briefing? • If yes, proceed on the Implementation Path • If no, will they agree to an “Outsider Audit”? • If they agree:
– present audit results to top management – include a “mini Executive Briefing” – get agreement to do one product family correctly
• If no, don’t give up • Keep it alive, improve it, and keep the executive staff
member involved.

Tom Wallace www.tfwallace.com
The Future of S&OP: Growth Factors
The Future of S&OP: Growth Factors
• Success breeds success • Lean Manufacturing and S&OP • Globalization • New users outside traditional manufacturing • S&OP specific software • Greater financial integration, power and utility • A growing presence in the executive suite


Tom Wallace www.tfwallace.com
Thanks for Being Here! Thanks for Being Here!
Go to www.tfwallace.com for:
• S&OP 101 (free)
• Implementation Information (free)
• Periodic newsletters (free)
• White papers (free)
• S&OP Effectiveness Checklist (free)
• Books and videos ($$$)
To talk: 513-281-0500
Good Luck and Godspeed
Related Documents