Baird 2019 Industrial Conference Sachin Lawande, President and CEO November 6, 2019

Welcome message from author
This document is posted to help you gain knowledge. Please leave a comment to let me know what you think about it! Share it to your friends and learn new things together.
Transcript
Baird 2019 Industrial ConferenceSachin Lawande, President and CEO
November 6, 2019

Forward-Looking Information
• This presentation contains "forward-looking statements" within the meaning of the Private Securities Litigation Reform Act of 1995. The words "will," "may," "designed to," "outlook," "believes," "should," "anticipates," "plans," "expects," "intends," "estimates," "forecasts" and similar expressions identify certain of these forward-looking statements. Forward-looking statements are not guarantees of future results and conditions but rather are subject to various factors, risks and uncertainties that could cause our actual results to differ materially from those expressed in these forward-looking statements, including, but not limited to:
• conditions within the automotive industry, including (i) the automotive vehicle production volumes and schedules of our customers, (ii) the financial condition of our customers and the effects of any restructuring or reorganization plans that may be undertaken by our customers, including work stoppages at our customers, and (iii) possible disruptions in the supply of commodities to us or our customers due to financial distress, work stoppages, natural disasters or civil unrest;
• our ability to execute on our transformational plans and cost-reduction initiatives in the amounts and on the timing contemplated;
• our ability to satisfy future capital and liquidity requirements; including our ability to access the credit and capital markets at the times and in the amounts needed and on terms acceptable to us; our ability to comply with financial and other covenants in our credit agreements; and the continuation of acceptable supplier payment terms;
• our ability to satisfy pension and other post-employment benefit obligations;
• our ability to access funds generated by foreign subsidiaries and joint ventures on a timely and cost effective basis;
• general economic conditions, including changes in interest rates and fuel prices; the timing and expenses related to internal restructurings, employee reductions, acquisitions or dispositions and the effect of pension and other post-employment benefit obligations;
• increases in raw material and energy costs and our ability to offset or recover these costs, increases in our warranty, product liability and recall costs or the outcome of legal or regulatory proceedings to which we are or may become a party; and
• those factors identified in our filings with the SEC (including our Annual Report on Form 10-K for the fiscal year ended December 31, 2018).
• Caution should be taken not to place undue reliance on our forward-looking statements, which represent our view only as of the date of this presentation, and which we assume no obligation to update. The financial results presented herein are unaudited; Information herein represents information included in the Company's Quarterly Report on Form 10-Q for the fiscal quarter ended September 30, 2019. New business wins, re-wins and backlog do not represent firm orders or firm commitments from customers, but are based on various assumptions, including the timing and duration of product launches, vehicle production levels, customer cancellations, installation rates, customer price reductions and currency exchange rates.
2

Visteon At A Glance
3
Leading supplier of cockpit electronics and autonomous driving
systems to carmakers across the world
$3B annual sales 10,000 employees 18 countries
20 manufacturing locations 18 technical centers
Leading the evolution of automotive digital cockpits and
safety solutions
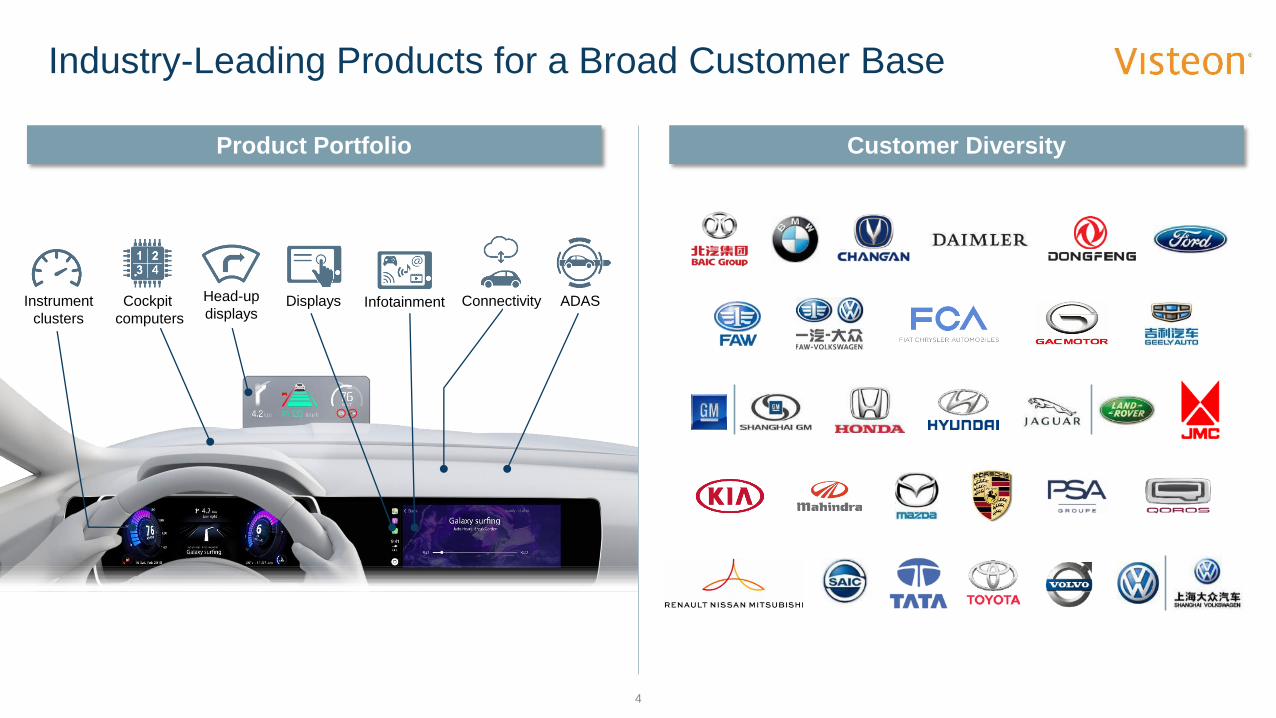
Industry-Leading Products for a Broad Customer Base
4
Customer DiversityProduct Portfolio
Instrument
clusters
Head-up
displaysInfotainmentDisplays ADASConnectivityCockpit
computers

Financial Performance Driven by NBWs and Launches
5
Outperforming the Market
• Visteon sales up 7% Y/Y
• 10 pct. points growth over market
• Strong growth in digital clusters
Strong Financial Results
• Sales of $731 million
• Adj. EBITDA of $62 million
• Adj. FCF of $23 million
NBWs
Program
Launches35
(YTD)58 47 56
(Dollars in Billions)
$4.1$4.6
$5.4$4.6
$5.4
$7.0 $6.9
2016 2017 2018 2019
Q3 YTDFull Year
New Business Wins and LaunchesQ3 Key Financial Highlights
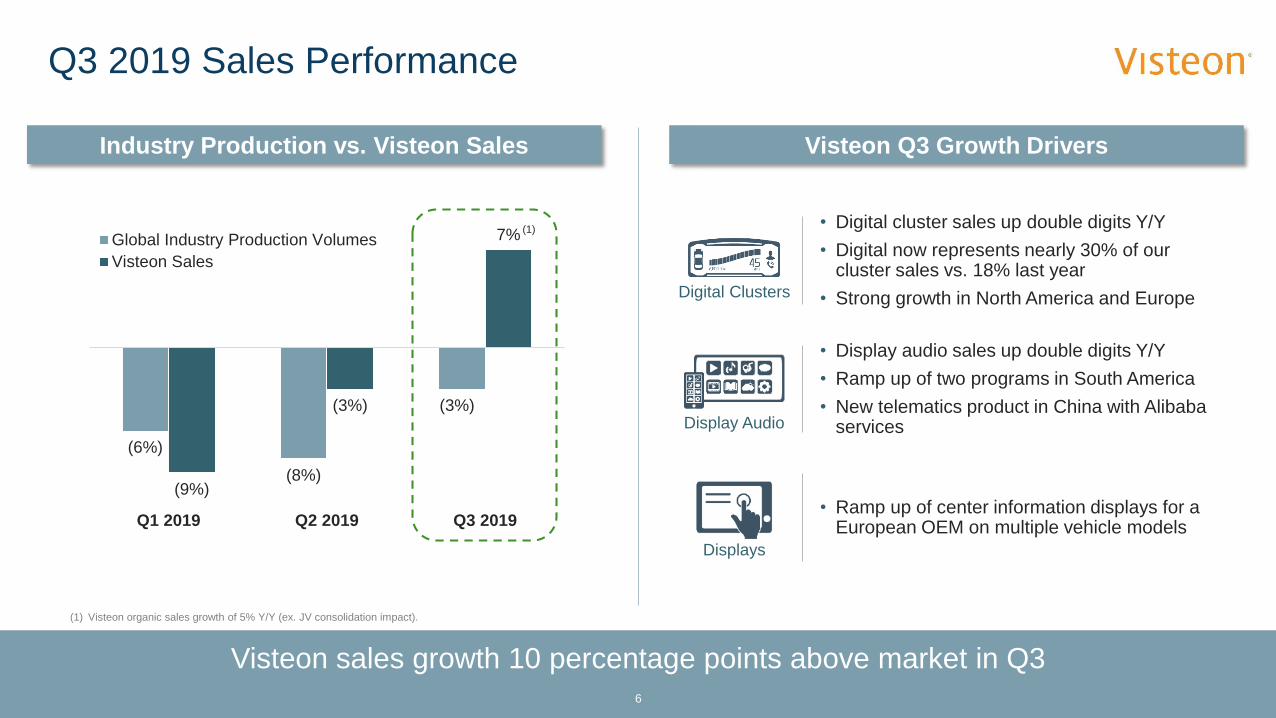
Q3 2019 Sales Performance
Visteon sales growth 10 percentage points above market in Q3
6
(6%)
(8%)
(3%)
(9%)
(3%)
7%
Q1 2019 Q2 2019 Q3 2019
Global Industry Production Volumes
Visteon Sales
• Digital cluster sales up double digits Y/Y
• Digital now represents nearly 30% of our cluster sales vs. 18% last year
• Strong growth in North America and EuropeDigital Clusters
Display Audio
• Display audio sales up double digits Y/Y
• Ramp up of two programs in South America
• New telematics product in China with Alibaba services
Displays
• Ramp up of center information displays for a European OEM on multiple vehicle models
(1)
(1) Visteon organic sales growth of 5% Y/Y (ex. JV consolidation impact).
Visteon Q3 Growth DriversIndustry Production vs. Visteon Sales

Cockpit Electronics and Safety Trends
7
Cockpit Domain
Controller
Automated
Emergency Braking
All-Digital Cluster
Lane Keep Assist
Apple Car Play
Android Auto
Single-Lane
Highway Assist
Highway Co-Pilot
with Lane Change
Native
Android
Infotainment
Multi-Display
Module
WP29
Standard for
L2 Hands-off
UN
Regulation for
L2 Hands-off
Embedded Infotainment
Cockpit Domain
Controller for
Mass Market
Driver
Monitoring
AI-Based Solutions
Over-the-Air Updates
Third-Party Apps
Child Safety
Detection
• Cockpit evolving into multi-display environment
• Separate ECUs converging into single cockpit computer
• AI and downloadable apps drive value add
• EuroNCAP 5-star safety drives cockpit safety features
• UN regulation for hands-free driving expected in 2022
• Increased interest in safety and UX integration
2008 - 2018 2020 2021 2022
Co
ckp
it T
ren
ds
Safe
ty T
ren
ds
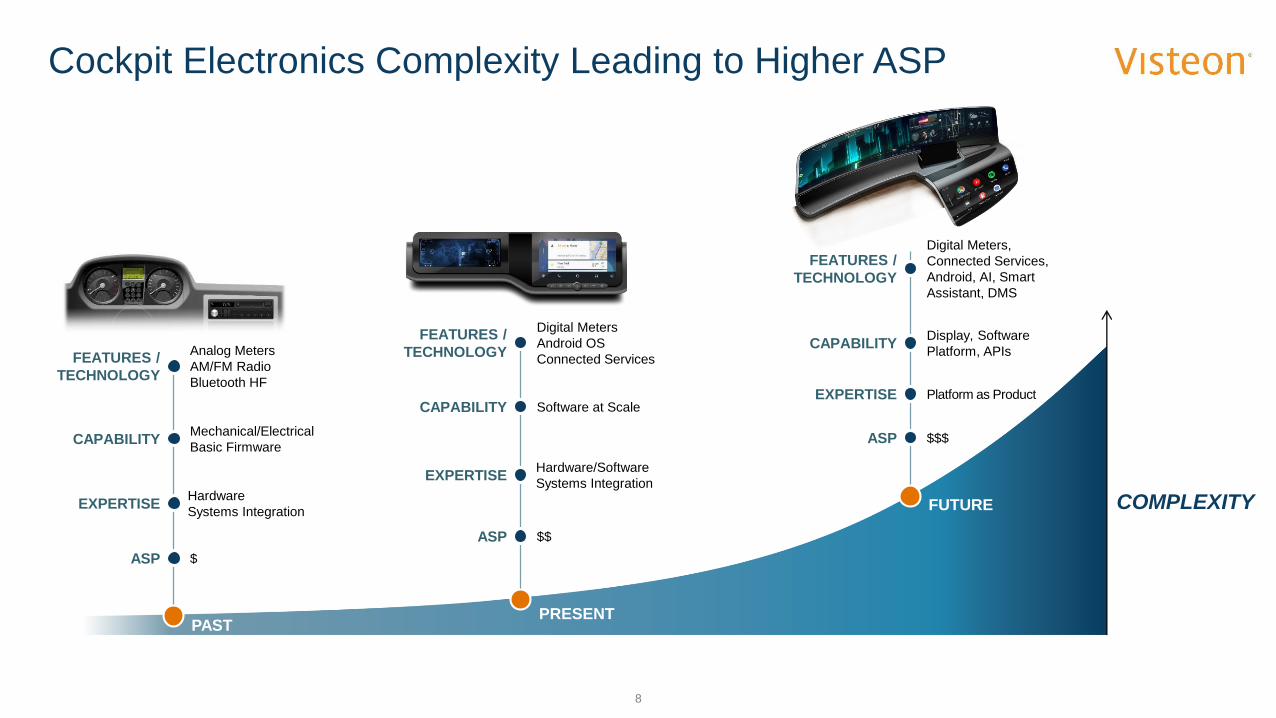
Cockpit Electronics Complexity Leading to Higher ASP
PAST
FEATURES /
TECHNOLOGY
Analog Meters
AM/FM Radio
Bluetooth HF
CAPABILITYMechanical/Electrical
Basic Firmware
EXPERTISEHardware
Systems Integration
ASP $
PRESENT
FEATURES /
TECHNOLOGY
Digital Meters
Android OS
Connected Services
CAPABILITY Software at Scale
EXPERTISEHardware/Software
Systems Integration
ASP $$
FUTURE
FEATURES /
TECHNOLOGY
Digital Meters,
Connected Services,
Android, AI, Smart
Assistant, DMS
CAPABILITYDisplay, Software
Platform, APIs
EXPERTISE Platform as Product
ASP $$$
COMPLEXITY
8
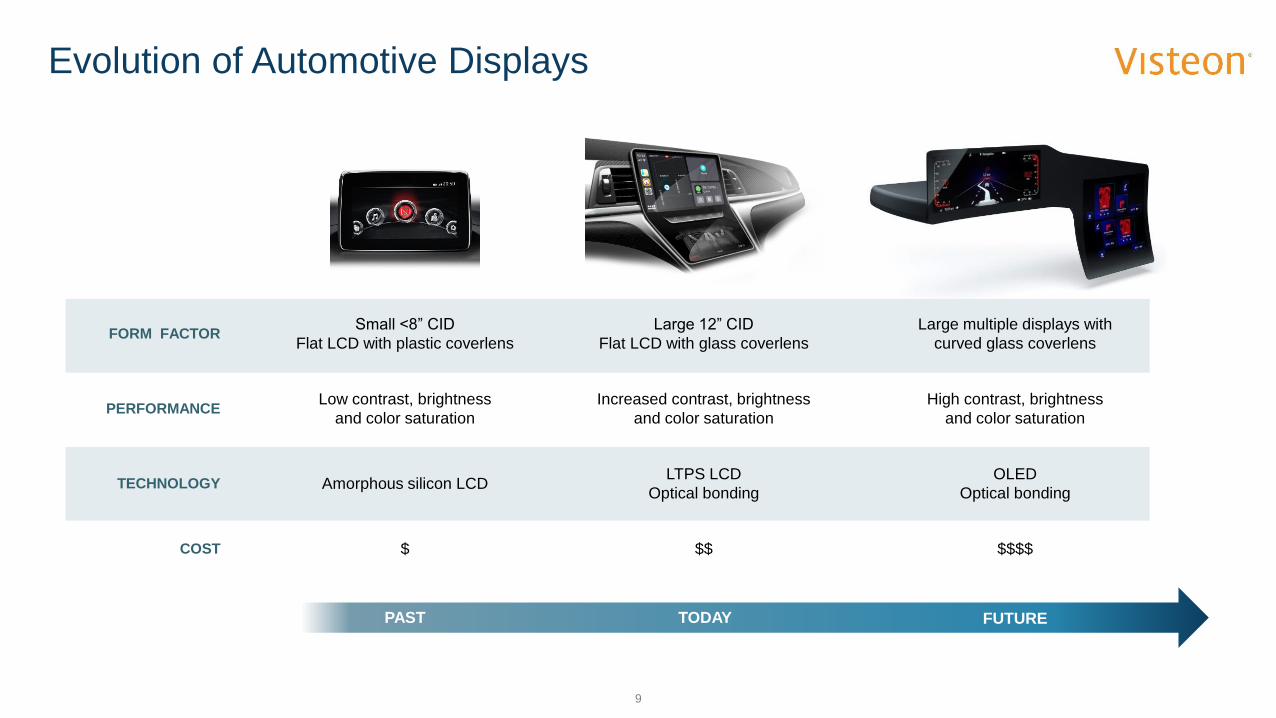
Evolution of Automotive Displays
FORM FACTORSmall <8” CID
Flat LCD with plastic coverlens
Large 12” CID
Flat LCD with glass coverlens
Large multiple displays with
curved glass coverlens
PERFORMANCELow contrast, brightness
and color saturation
Increased contrast, brightness
and color saturation
High contrast, brightness
and color saturation
TECHNOLOGY Amorphous silicon LCDLTPS LCD
Optical bonding
OLED
Optical bonding
COST $ $$ $$$$
PAST TODAY FUTURE
9

Edge
Backlight
MicroZone™ CellColor TFT
OLED
Visteon MicroZone™ High-Performance Automotive Display
MicroZone™ provides high-performance and cost-efficient alternative to OLED
Backlight
80,000:1 1,000,000:11000:1CONTRAST
85% NTSC 104% NTSC 100% NTSCCOLOR
850 Nits 850 Nits 600 NitsBRIGHTNESS
Visteon MicroZone™LCD OLED
10


Appendix
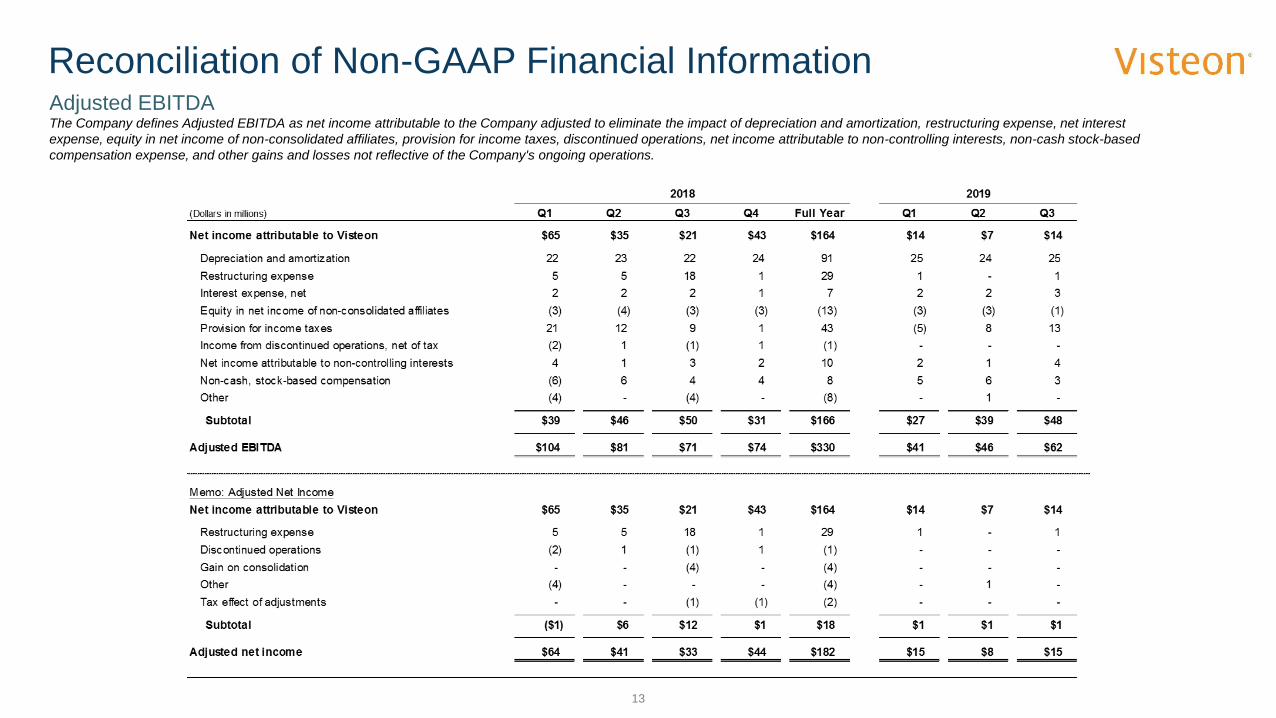
Reconciliation of Non-GAAP Financial InformationAdjusted EBITDAThe Company defines Adjusted EBITDA as net income attributable to the Company adjusted to eliminate the impact of depreciation and amortization, restructuring expense, net interest
expense, equity in net income of non-consolidated affiliates, provision for income taxes, discontinued operations, net income attributable to non-controlling interests, non-cash stock-based
compensation expense, and other gains and losses not reflective of the Company's ongoing operations.
13
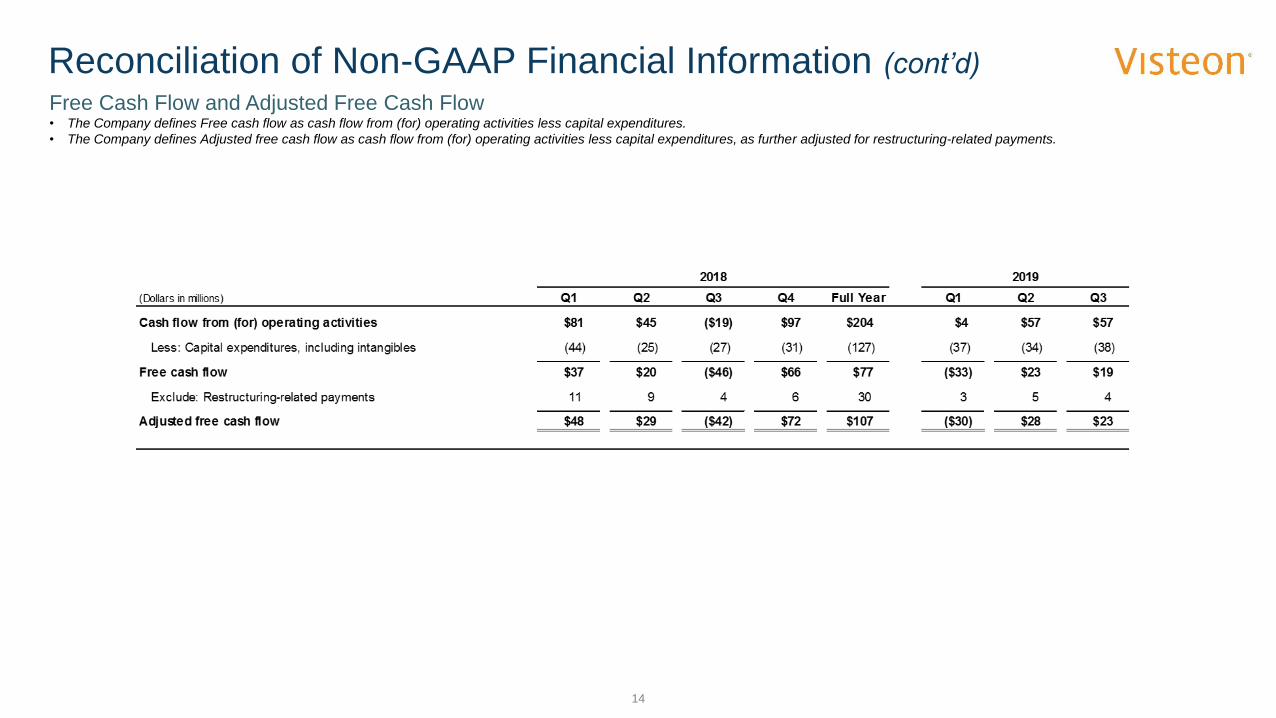
Reconciliation of Non-GAAP Financial Information (cont’d)Free Cash Flow and Adjusted Free Cash Flow• The Company defines Free cash flow as cash flow from (for) operating activities less capital expenditures.
• The Company defines Adjusted free cash flow as cash flow from (for) operating activities less capital expenditures, as further adjusted for restructuring-related payments.
14
Related Documents