R K G J O U R N A L O F M A N A G E M E N T SAARANSH SAARANSH MANAGEMENT OF RURAL MARKETING OPPORTUNITIES AND CHALLENGES AHEAD Jagdish Prakash & Akanksha Srivastava CONSUMER PERSONALITY AND RETAILER PERFORMANCE: WHAT IS THE CONNECTION? Hafedh Ibrahim BASEL-II ACCORD AND INDIAN BANKS S. P. Srivastava & Sanjay Kr. Patel SUCCESS AND FAILURE ATTRIBUTES OF MANAGEMENT STUDENTS: A CASE STUDY IN THE UNIVERSITIES OF ETHIOPIA R. Renjith Kumar BRIDGING GAP BETWEEN DESIRABILITY AND AVAILABILITY OF BANKING SERVICE: AN EXCELLENT ROAD MAP IN THE EMERGING COMPETITION R.K. Uppal & Rosy Chawla ETHICS IN RETAILING: PERCEPTIONS OF CONSUMERS R. D. Sharma, Bodh Raj Sharma RETAILING TREND & RETAILERS PERCEPTION: A STUDY ON BISCUIT INDUSTRY G.Vani, M.Ganesh Babu & N. Panchanatham DOES CADRE DIFFERENCE AND CERTAIN DEMOGRAPHIC FACTORS INFLUENCE ETHICAL ORIENTATION: A STUDY AMONG BANK PERSONNEL Anand R. Krishnan & M. M. Sulphey HUMAN RESOURCE DEVELOPMENT SCENARIO IN INDIAN INFORMATION TECHNOLOGY COMPANIES Manish Agarwal & Tapan Kumar Nayak MERGERS AND ACQUISITIONS AS STRATEGIC DRIVERS FOR ECONOMIC GROWTH: A REVIEW Sheeba Kapil MARKETING STRATEGY FOR DREAM SHELTER FINANCING Ashish K. Srivastava, H. M. Jha “Bidyarthi”& Devesh K. Sharma INSIGHTS INTO THE RETENTION OF HUMAN CAPITAL IN INDIAN CORPORATES: A POINT OF VIEW AND METHOD G.L.Narayanappa, N.Suhasini & T. Naresh Babu CREATING AND SUSTAINING CORPORATE ADVANTAGE – THE HUMAN RESOURCES WAY S. Husain Ashraf SUPPLY CHAIN MANAGEMENT – A CRITICAL REVIEW OF ITS IMPACT ON COMPETITIVE POTENTIAL Vikram Sharma & G. D. Sardana BUSINESS ETHICS- BACK TO SCRIPTURES Manish Dhingra & Vaishali Dhingra FUTURE TRADING IN INDIAN COMMODITY EXCHANGES Swati & Kanchan Shukla BOOK REVIEW ISSN 0975 - 4601 No. 1 Vol. 1 JULY 2009

Welcome message from author
This document is posted to help you gain knowledge. Please leave a comment to let me know what you think about it! Share it to your friends and learn new things together.
Transcript
R K G J O U R N A L O F M A N A G E M E N TSAARANSHSAARANSH
MANAGEMENT OF RURAL MARKETING OPPORTUNITIES ANDCHALLENGES AHEADJagdish Prakash & Akanksha Srivastava
CONSUMER PERSONALITY AND RETAILER PERFORMANCE:WHAT IS THE CONNECTION?Hafedh Ibrahim
BASEL-II ACCORD AND INDIAN BANKSS. P. Srivastava & Sanjay Kr. Patel
SUCCESS AND FAILURE ATTRIBUTES OF MANAGEMENT STUDENTS: A CASE STUDY IN THE UNIVERSITIES OF ETHIOPIAR. Renjith Kumar
BRIDGING GAP BETWEEN DESIRABILITY AND AVAILABILITY OF BANKING SERVICE: AN EXCELLENT ROAD MAP IN THE EMERGING COMPETITIONR.K. Uppal & Rosy Chawla
ETHICS IN RETAILING: PERCEPTIONS OF CONSUMERSR. D. Sharma, Bodh Raj Sharma
RETAILING TREND & RETAILERS PERCEPTION: A STUDY ON BISCUIT INDUSTRYG.Vani, M.Ganesh Babu & N. Panchanatham
DOES CADRE DIFFERENCE AND CERTAIN DEMOGRAPHIC FACTORSINFLUENCE ETHICAL ORIENTATION: A STUDY AMONG BANK PERSONNELAnand R. Krishnan & M. M. Sulphey
HUMAN RESOURCE DEVELOPMENT SCENARIO IN INDIAN INFORMATION TECHNOLOGY COMPANIESManish Agarwal & Tapan Kumar Nayak
MERGERS AND ACQUISITIONS AS STRATEGIC DRIVERS FOR ECONOMIC GROWTH: A REVIEWSheeba Kapil
MARKETING STRATEGY FOR DREAM SHELTER FINANCINGAshish K. Srivastava, H. M. Jha “Bidyarthi”& Devesh K. Sharma
INSIGHTS INTO THE RETENTION OF HUMAN CAPITAL IN INDIAN CORPORATES: A POINT OF VIEW AND METHODG.L.Narayanappa, N.Suhasini & T. Naresh Babu
CREATING AND SUSTAINING CORPORATE ADVANTAGE – THE HUMAN RESOURCES WAYS. Husain Ashraf
SUPPLY CHAIN MANAGEMENT – A CRITICAL REVIEW OF ITS IMPACT ON COMPETITIVE POTENTIALVikram Sharma & G. D. Sardana
BUSINESS ETHICS- BACK TO SCRIPTURESManish Dhingra & Vaishali Dhingra
FUTURE TRADING IN INDIAN COMMODITY EXCHANGESSwati & Kanchan Shukla
BOOK REVIEW
ISSN 0975 - 4601
No. 1 Vol. 1 JULY 2009
CHIEF PATRONShri Dinesh Kumar Goel
Chairman, RKG Group of Institutions
Dr B. K. GuptaAdvisor, RKG Group of Institutions
Dr M. P. JakhanwalDirector, RKGIT, Ghaziabad
PATRONS
CHIEF EDITORDr Arvind SinghPrincipal, CMS-RKGITGhaziabad
EDITORDr Vinay K Srivastava
Asst Professor, CMS-RKGITGhaziabad
EDITORIAL BOARD
Dr N. K. RaiDirector-RKGCMTGarh Mukteswar, Ghaziabad
Dr V. K. JainDirector-RKGITWGhaziabad
Ms. VibhutiDean,CMS-RKGITGhaziabad
Dr. N.K. SharmaDirector-RKGECPilakhuwa
ADVISORY BOARD
Prof B. N. AsthanaEx Vice ChancellorKanpur University, Kanpur
Prof Bhagwati PrasadEx Director, KIMS, Karnataka University, Karnataka
Prof Sanjay KumarDirectorInstitute of Business Management,CSJM University, Kanpur
Prof T.P.N. SrivastavaHead & Dean, Department of Commerce,DDU Gorakhpur University, Gorakhpur
Prof. D.N. KakkarHead,Deptt. of ManagementIET Campus, Lucknow
Prof Jagdish PrakashEx Vice Chancellor,University of Allahabad,Allahabad
Prof K. M. UpadhyayEx Head, Commerce & ManagementJamia Milia Islamia University, New Delhi
Prof M. B. ShuklaDirector & DeanInstitute of Management StudiesM. G. Kashi VidyapeethVaranasi
Prof. Jawahar Lal Deptt. of CommerceDelhi School of EconomicsDelhi University, Delhi
Prof. N. Panchanatham Professor and HeadDepartment of Business Administration Annamalai University,Tamil Nadu
Prof Nageshwar RaoVice ChancellorUPRT Open University, Allahabad
Dr S. P. SrivastavaProfessor, Faculty of Commerce, BHU, Varanasi
Prof A. K. SarkarHead & Dean, Department of Business Admin.,MJPR University, Bareilly
Prof. Ashok KumarProfessor of OB & HRMIndian Institute of ManagementIndore
Dr S. P. SinghHead & Dean, FMSGurukul Kangri VishwavidyalayaHaridwar
Layout & DesignVishal Srivastava & Ashish Singh
Publicity & Circulation Meenu & Ajay Rathore
Administrative SupportPankaj Kumar & Baldev Singh
Aims and ScopeSaaransh is a bi-annual referred Journal published by CMS-RKGIT, Ghaziabad. The objective of the Journal is to provide a forum for discussion of advancement in the area of management. The Journal publishes research papers, articles, book reviews and case studies. The Journal invites manuscripts on all aspects of management and business environment.
The information, contents, opinion and data appearing in the articles and advertisement in the Journal are the sole responsibility of the concerned author(s) or the advertisers. The Editor, Editorial Board and publisher disclaim responsibility and liability for any statement or opinion made by the contributors.
All disputes will be subject of the jurisdiction of Ghaziabad only.
Commandment from the Founder
We are building our institute as an ideal family the RKGIT PARIWAR
where members strive for the development, well being and promotion of each other.Founder
(Late) Sri Raj Kumar Goel
vKkusuko‘raa KkuaAJhen Hkxor xhrk v/;k; 5] ’yksd-15
C o n t e n t sPages
MANAGEMENT OF RURAL MARKETING OPPORTUNITIES AND 01
CHALLENGES AHEAD
Jagdish Prakash & Akanksha Srivastava
CONSUMER PERSONALITY AND RETAILER PERFORMANCE: 07
WHAT IS THE CONNECTION?
Hafedh Ibrahim
BASEL-II ACCORD AND INDIAN BANKS 16
S. P. Srivastava & Sanjay Kr. Patel
SUCCESS AND FAILURE ATTRIBUTES OF MANAGEMENT STUDENTS: 24
A CASE STUDY IN THE UNIVERSITIES OF ETHIOPIA
R. Renjith Kumar
BRIDGING GAP BETWEEN DESIRABILITY AND AVAILABILITY OF BANKING 35
SERVICE: AN EXCELLENT ROAD MAP IN THE EMERGING COMPETITION
R.K. Uppal & Rosy Chawla
ETHICS IN RETAILING: PERCEPTIONS OF CONSUMERS 43
R. D. Sharma, Bodh Raj Sharma
RETAILING TREND & RETAILERS PERCEPTION: 56
A STUDY ON BISCUIT INDUSTRY
G.Vani, M.Ganesh Babu & N. Panchanatham
DOES CADRE DIFFERENCE AND CERTAIN DEMOGRAPHIC FACTORS 60
INFLUENCE ETHICAL ORIENTATION: A STUDY AMONG BANK PERSONNEL
Anand R. Krishnan & M. M. Sulphey
HUMAN RESOURCE DEVELOPMENT SCENARIO IN INDIAN 64
INFORMATION TECHNOLOGY COMPANIES
Manish Agarwal & Tapan Kumar Nayak
MERGERS AND ACQUISITIONS AS STRATEGIC DRIVERS 68
FOR ECONOMIC GROWTH: A REVIEW
Sheeba Kapil
MARKETING STRATEGY FOR DREAM SHELTER FINANCING 74
Ashish K. Srivastava, H. M. Jha “Bidyarthi”& Devesh K. Sharma
INSIGHTS INTO THE RETENTION OF HUMAN CAPITAL IN INDIAN 78
CORPORATES: A POINT OF VIEW AND METHOD
G.L.Narayanappa, N.Suhasini & T. Naresh Babu
CREATING AND SUSTAINING CORPORATE ADVANTAGE – 84
THE HUMAN RESOURCES WAY
S. Husain Ashraf
SUPPLY CHAIN MANAGEMENT – A CRITICAL REVIEW OF ITS IMPACT ON 88
COMPETITIVE POTENTIAL
Vikram Sharma & G. D. Sardana
BUSINESS ETHICS- BACK TO SCRIPTURES 93
Manish Dhingra & Vaishali Dhingra
FUTURE TRADING IN INDIAN COMMODITY EXCHANGES 96
Swati & Kanchan Shukla
BOOK REVIEW 100
Pages
SAARANSHRKG JOURNAL OF MANAGEMENTVol . 1 No. 1 JULY 2009• •

SAARANSHRKG JOURNAL OF MANAGEMENTVol . 1 No. 1 JULY 2009• •
Success is not a destination, but a journey’. Innovation and Evolution are essential
attributes of every successful organization. Even after scaling heights our quest for perfection
continues. We persistently endeavour to serve our customers/consumers with a passion.
Satisfied customers/consumers are the lifeblood of every organization.
An important element in the strategy of managing the customer value is to continuously
strive to meet the challenges of globlisation, technological change, competition and rivalry,
workforce diversity an changing customer expectations successfully. An organisation’s
success story state with its employees who are open to learning and practice innovative skills
which can be fostered through teamwork and creation of a new organizational culture .Creating
an paradigms requires a strong link between strategic focus and operational reality.
In the present scenario, global economy is in the state of flux and the role of leadership is
changing. Considering the recession, one thing that educators across the globe can emerge
new opportunities in various sectors. In view of that RKG group of Institutions made efforts
towards presenting ‘SAARANSH’ RKG Journal of Management. It includes number of research
articles/papers received from Prominent educationists & professionals throughout the globe.
Globalisation and Liberalisation have led to stiff among the firms. This resulted in a new
marketing phenomenon ‘Management of Rural Marketing Opportunities & Challenges Ahead.
Professor Jagdish Prakash & Akanksha Srivastav have analysed the new dimensions in the
rural marketing.
I am delighted to present before you ‘SAARANSH’ RKG Journal of Management, which
contains research papers pertain to varied areas of Business: Marketing, finance & Banking,
Human Resource Development and Supply Chain Management.
I express my gratitude to eminent researchers/ academicians/ professionals for their
valuable & overwhelming response to ‘SAARANSH’. I also extent my heartiest gratitude to
several experts who help us by way of assessing research papers/articles and making
critical comments and suggestions for making ‘SAARANSH’ effective. I extend my sincere
thanks to each one those who made efforts in creation of ‘SAARANSH’.
Prof. Arvind Singh
From the Desk of Chief Editor....
MANAGEMENT OF RURAL MARKETING OPPORTUNITIES AND CHALLENGES AHEAD
Jagdish Prakash* Akanksha Srivastava**
ABSTRACTRural marketers are thriving and even the economic slowdown could not affect them. Rural consumers have sufficient disposable income and are appreciating brands, customer service, aesthetics and products. They are better exposed and informed and are in a position to demand. Because of saturation of urban markets for several categories of consumer goods, marketers are discovering the strengths of large rural markets and trying to formulate suitable strategies to meet the demand offered by robust and rapidly growing rural markets. This paper focuses on the status of rural marketing in the present scenario, reasons responsible for boom in these markets , opportunities waiting to be exploited and challenges ahead.Keywords: Rural Market, Consumer Goods, Consumer Demand
01
INTRODUCTION
Rural Markets have acquired significance, as overall growth
of the economy and positive policies in favour of rural masses
have resulted into substantial increase in the purchasing
power of people in rural areas. The economic slowdown has
adversely affected the urban organised retail, especially the
manufacturing and services sector, which has in turn slowed
down the urban market. On the other hand, its rural
counterpart is thriving. Rural areas are consuming large
quantities of industrial and urban manufactured products. In
this context, a special marketing strategy, namely, 'rural
marketing' has emerged. The fear of joblessness and credit
crunch has made the urban consumer extra cautious about
his expenditures relating to housing, automobiles and even
FMCG products. Marketers, today, have realised that there is
a huge potential in the rural market, and have started
finalising strategies in this area, Rural Market, have fostered
the growth of industries like automobiles, cement, consumer
electronics, textiles, telecommunications and fast moving
consumer goods, among others. This paper has been
prepared mainly with a view to focus on study of the status of
rural marketing in the present scenario in comparison to its
urban counterpart; To study the reasons responsible for the
booming rural markets; the various opportunities waiting to
be exploited and challenges yet to be met out in this area of
rural marketing and to offer various suggestions in this
regard.
PRESENT STATUS OF RURAL
MARKETS
Rural markets are thriving and even the economic slowdown
could not affect them. Rural families have shown no
intentions of cutting down their expenditures on weddings,
pilgrimages, construction or consumption. They have their
own set of aspirations and are willing to pay right price for
right product. Tata sky chief Marketing officer Vikram Mehra
says, "Marketers often have this sorry image of rural
consumer as a guy who is little more than a poor country
*Former Vice Chancellor, Professor, Head & Dean, University of Allahabad. **UGC Senior Research Fellow, MONIRBA, University of Allahabad
cousin. But that is not so. The consumer in the village knows
his math and doesn't merely want the cheapest product. The
way they define value is similar to the urban consumers."
They have sufficient disposable income and are
appreciating brands, customer service, aesthetics and
products. There is a growing demand for television sets, two
wheelers, cars etc. There are three fastest selling categories
in rural market. - Rural-rural, i.e. products mainly used in rural
markets eg. tractors, seeds, fertilizers etc., Rural-urban , i.e.,
products like bicycle, transistors, soap, shampoo, battery,
washing powder etc. and Urban- urban and the best
penetration in this segment is mobile phones. Nokia have
found that farmers are now getting more familiar with the
handsets and it has became a tool of prosperity for them.
Nokia has therefore, lined up various applications exclusively
for non-urban population which will be providing
entertainment, education and agricultural information to
subscribers. The village folks previously have no televisions,
but now they are skipping cables and going straight to DTH.
The interactive applications of Tata Sky along with its gaming,
contest, matrimonial and horoscope options have a wide
demand in rural markets. Moerover, ITC's e-chaupal has
been a win-win initiative. In this the company had directly
established links with rural farmers for the purpose of
procurement of agricultural products thereby bypassing the
middle man. As a result farmers earn a fair deal and have
higher profit margins. Even in fast moving consumer goods
(FMCG) segment rural consumers are outpacing urban
shoppers. Abhijeet Kundu, Vice President, Antique stock
Broking's, says, "Rural demand and an increased focus on
rural markets is driving the overall FMCG sector." From 2004
to 2008 FMCG sales have grown at 11% in rural India.
Packaged goods market is growing at about 15% in rural
areas. Mid-tier FMCG companies like Godrej consumer
products, Marico, Dabur and Nesttle have reported strong
growth in rural marketing. Dabur has about 35% of its
portfolio focused on rural market and reported growth of
about 13%-14%. The company has also decided to push
fast growing categories like personal care products,
toiletries, soaps and soft drinks in rural markets. Marico's
connectionms, 50 per cent are in small towns and villages
and of 6 lakh villages 5.22 lakh have village public telephone,
various large format retail stores which have made
successful dive in the rural markets include DSCL Hariyali
Stores, M&M Subh Labh Stores, Tata/Rallis Kisan Kendras,
Escort Rural Stores and Warna Bazaar, Maharashtra. Thus,
we can see that village folks now have surplus money and
good awareness and knowledge about various products and
services. They are better exposed, better informed, have a
greater choice and are in a position to demand. This has led
them to demand genuine products even if they are at a higher
price. The rural and semi-urban markets account for 60 per
cent of FMCG sales in the country while 63 percent of durable
sales come from these markets. This rising status of rural
marketing, at present can be studied under the following
heads.
Parachute Co-conut oil has shown strong growth in rural
India. Company's 25% sales revenue comes from there
areas, therefore, it is focusing its distribution promotion
programmes towards these areas. Hindustan Unilever
Limited (HUL) has highest sales from rural India. Similarly,
Colgate, Britannia, Nestle have a strong rural focus as well.
Hero Hondas also has a strong rural reach which has greatly
helped the company in beating the downturn. About 40% of
its income comes from rural markets. Company made good
sales in rural India especially in wedding and festive seasons.
Moreover because of growing purchasing power in rural
areas the consumers relied less on bank loans and as a
result high interest rate and credit crunch have not affected
their purchase plans. The villagers have also shown great
interest in insurance policies. In 2001-02, LIC sold 55 percent
of its policies in rural India. Again of two million BSNL mobile
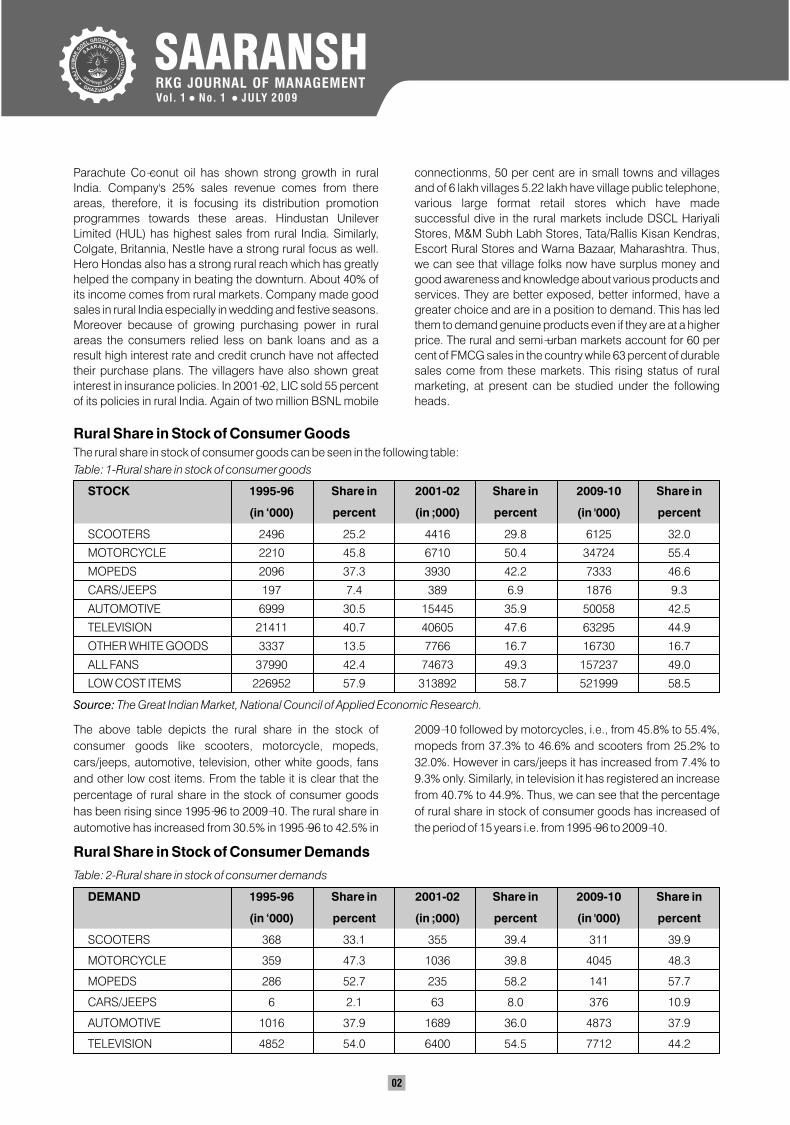
Rural Share in Stock of Consumer Goods The rural share in stock of consumer goods can be seen in the following table:
Table: 1-Rural share in stock of consumer goods
STOCK 1995-96
(in ‘000) percent (in ;000) percent (in '000) percent
SCOOTERS 2496 25.2 4416 29.8 6125 32.0
MOTORCYCLE 2210 45.8 6710 50.4 34724 55.4
MOPEDS 2096 37.3 3930 42.2 7333 46.6
CARS/JEEPS 197 7.4 389 6.9 1876 9.3
AUTOMOTIVE 6999 30.5 15445 35.9 50058 42.5
TELEVISION 21411 40.7 40605 47.6 63295 44.9
OTHER WHITE GOODS 3337 13.5 7766 16.7 16730 16.7
ALL FANS 37990 42.4 74673 49.3 157237 49.0
LOW COST ITEMS 226952 57.9 313892 58.7 521999 58.5
Source: The Great Indian Market, National Council of Applied Economic Research.
Share in 2001-02 Share in 2009-10 Share in
The above table depicts the rural share in the stock of
consumer goods like scooters, motorcycle, mopeds,
cars/jeeps, automotive, television, other white goods, fans
and other low cost items. From the table it is clear that the
percentage of rural share in the stock of consumer goods
has been rising since 1995-96 to 2009-10. The rural share in
automotive has increased from 30.5% in 1995-96 to 42.5% in
2009-10 followed by motorcycles, i.e., from 45.8% to 55.4%,
mopeds from 37.3% to 46.6% and scooters from 25.2% to
32.0%. However in cars/jeeps it has increased from 7.4% to
9.3% only. Similarly, in television it has registered an increase
from 40.7% to 44.9%. Thus, we can see that the percentage
of rural share in stock of consumer goods has increased of
the period of 15 years i.e. from 1995-96 to 2009-10.
Rural Share in Stock of Consumer Demands
Table: 2-Rural share in stock of consumer demands
DEMAND 1995-96 Share in 2001-02 Share in 2009-10 Share in
(in ‘000) percent (in ;000) percent (in '000) percent
SCOOTERS 368 33.1 355 39.4 311 39.9
MOTORCYCLE 359 47.3 1036 39.8 4045 48.3
MOPEDS 286 52.7 235 58.2 141 57.7
CARS/JEEPS 6 2.1 63 8.0 376 10.9
AUTOMOTIVE 1016 37.9 1689 36.0 4873 37.9
TELEVISION 4852 54.0 6400 54.5 7712 44.2
02
SAARANSHRKG JOURNAL OF MANAGEMENTVol . 1 No. 1 JULY 2009• •
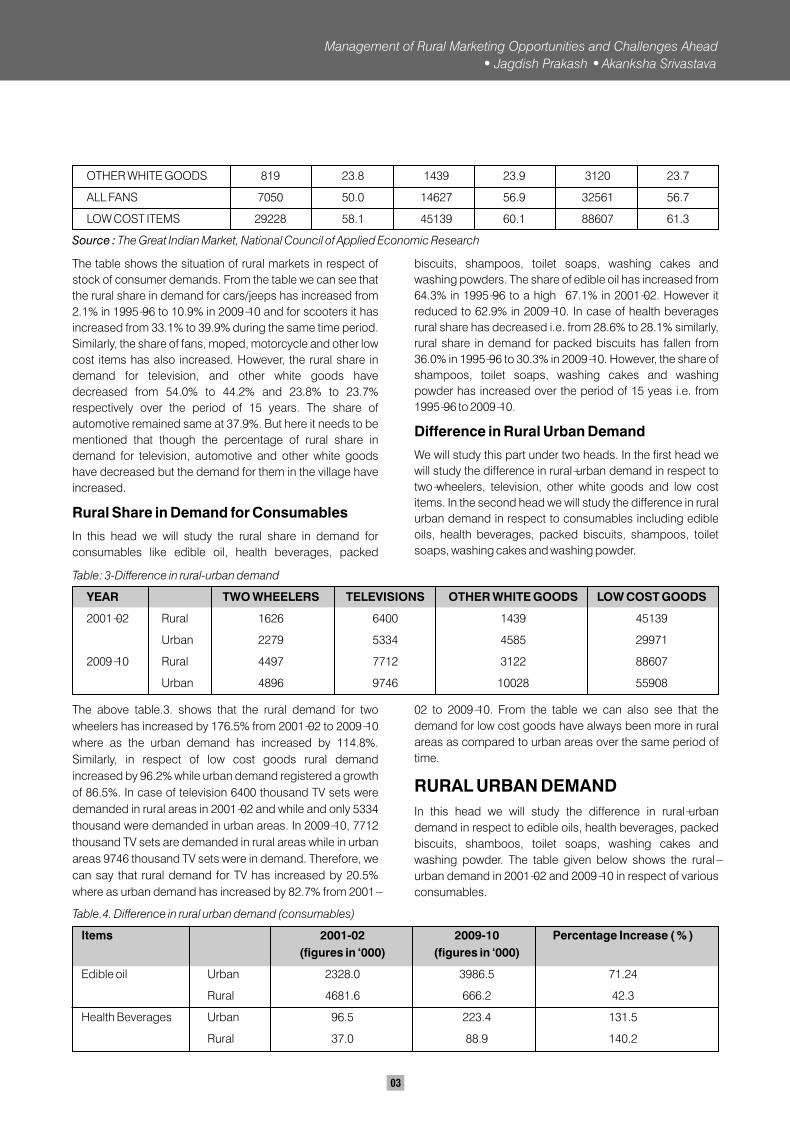
OTHER WHITE GOODS 819 23.8 1439 23.9 3120 23.7
ALL FANS 7050 50.0 14627 56.9 32561 56.7
LOW COST ITEMS 29228 58.1 45139 60.1 88607 61.3
Source : The Great Indian Market, National Council of Applied Economic Research
The table shows the situation of rural markets in respect of
stock of consumer demands. From the table we can see that
the rural share in demand for cars/jeeps has increased from
2.1% in 1995-96 to 10.9% in 2009-10 and for scooters it has
increased from 33.1% to 39.9% during the same time period.
Similarly, the share of fans, moped, motorcycle and other low
cost items has also increased. However, the rural share in
demand for television, and other white goods have
decreased from 54.0% to 44.2% and 23.8% to 23.7%
respectively over the period of 15 years. The share of
automotive remained same at 37.9%. But here it needs to be
mentioned that though the percentage of rural share in
demand for television, automotive and other white goods
have decreased but the demand for them in the village have
increased.
Rural Share in Demand for Consumables
In this head we will study the rural share in demand for
consumables like edible oil, health beverages, packed
biscuits, shampoos, toilet soaps, washing cakes and
washing powders. The share of edible oil has increased from
64.3% in 1995-96 to a high 67.1% in 2001-02. However it
reduced to 62.9% in 2009-10. In case of health beverages
rural share has decreased i.e. from 28.6% to 28.1% similarly,
rural share in demand for packed biscuits has fallen from
36.0% in 1995-96 to 30.3% in 2009-10. However, the share of
shampoos, toilet soaps, washing cakes and washing
powder has increased over the period of 15 yeas i.e. from
1995-96 to 2009-10.
Difference in Rural Urban Demand
We will study this part under two heads. In the first head we
will study the difference in rural-urban demand in respect to
two-wheelers, television, other white goods and low cost
items. In the second head we will study the difference in rural
urban demand in respect to consumables including edible
oils, health beverages, packed biscuits, shampoos, toilet
soaps, washing cakes and washing powder.
The above table.3. shows that the rural demand for two
wheelers has increased by 176.5% from 2001-02 to 2009-10
where as the urban demand has increased by 114.8%.
Similarly, in respect of low cost goods rural demand
increased by 96.2% while urban demand registered a growth
of 86.5%. In case of television 6400 thousand TV sets were
demanded in rural areas in 2001-02 and while and only 5334
thousand were demanded in urban areas. In 2009-10, 7712
thousand TV sets are demanded in rural areas while in urban
areas 9746 thousand TV sets were in demand. Therefore, we
can say that rural demand for TV has increased by 20.5%
where as urban demand has increased by 82.7% from 2001-
02 to 2009-10. From the table we can also see that the
demand for low cost goods have always been more in rural
areas as compared to urban areas over the same period of
time.
RURAL URBAN DEMAND
In this head we will study the difference in rural-urban
demand in respect to edible oils, health beverages, packed
biscuits, shamboos, toilet soaps, washing cakes and
washing powder. The table given below shows the rural-
urban demand in 2001-02 and 2009-10 in respect of various
consumables.
Table.4. Difference in rural urban demand (consumables)
Items 2001-02 2009-10 Percentage Increase ( % )
(figures in ‘000) (figures in ‘000)
Edible oil Urban 2328.0 3986.5 71.24
Rural 4681.6 666.2 42.3
Health Beverages Urban 96.5 223.4 131.5
Rural 37.0 88.9 140.2
Table: 3-Difference in rural-urban demand
YEAR TWO WHEELERS TELEVISIONS OTHER WHITE GOODS LOW COST GOODS
2001-02 Rural 1626 6400 1439 45139
Urban 2279 5334 4585 29971
2009-10 Rural 4497 7712 3122 88607
Urban 4896 9746 10028 55908
Management of Rural Marketing Opportunities and Challenges Ahead
Jagdish Prakash Akanksha Srivastava
03
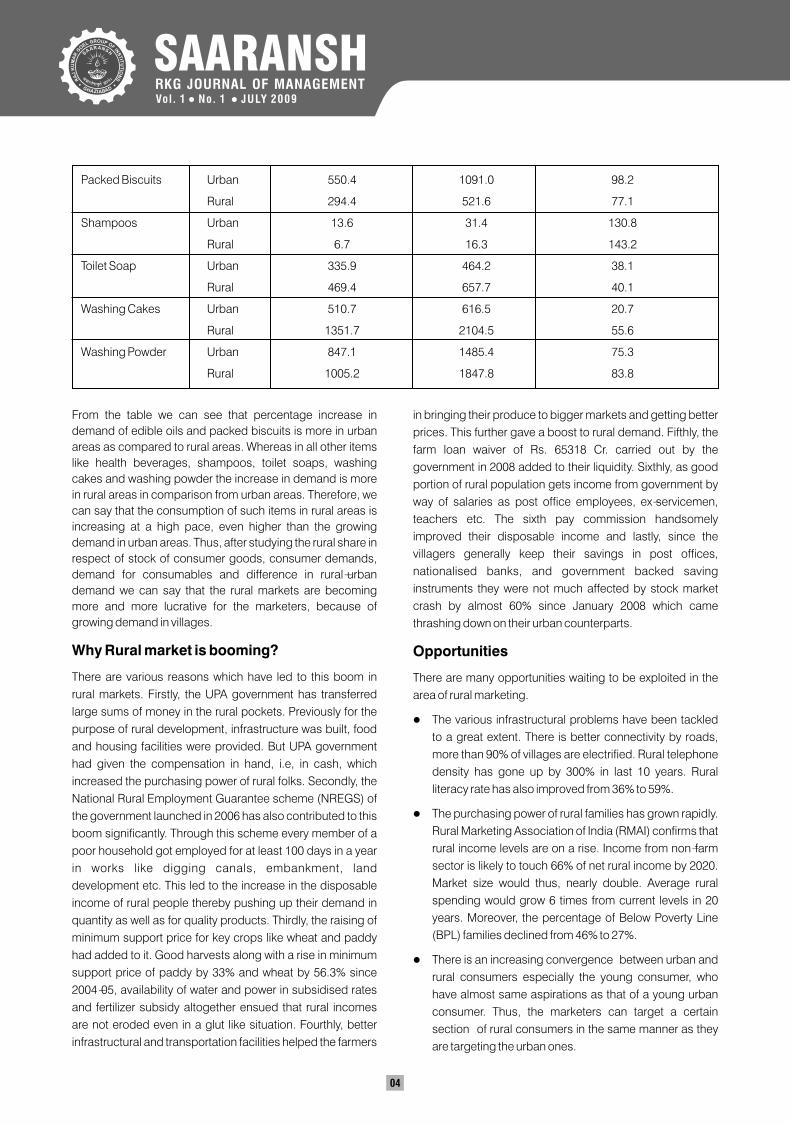
Packed Biscuits Urban 550.4 1091.0 98.2
Rural 294.4 521.6 77.1
Shampoos Urban 13.6 31.4 130.8
Rural 6.7 16.3 143.2
Toilet Soap Urban 335.9 464.2 38.1
Rural 469.4 657.7 40.1
Washing Cakes Urban 510.7 616.5 20.7
Rural 1351.7 2104.5 55.6
Washing Powder Urban 847.1 1485.4 75.3
Rural 1005.2 1847.8 83.8
From the table we can see that percentage increase in
demand of edible oils and packed biscuits is more in urban
areas as compared to rural areas. Whereas in all other items
like health beverages, shampoos, toilet soaps, washing
cakes and washing powder the increase in demand is more
in rural areas in comparison from urban areas. Therefore, we
can say that the consumption of such items in rural areas is
increasing at a high pace, even higher than the growing
demand in urban areas. Thus, after studying the rural share in
respect of stock of consumer goods, consumer demands,
demand for consumables and difference in rural-urban
demand we can say that the rural markets are becoming
more and more lucrative for the marketers, because of
growing demand in villages.
Why Rural market is booming?
There are various reasons which have led to this boom in
rural markets. Firstly, the UPA government has transferred
large sums of money in the rural pockets. Previously for the
purpose of rural development, infrastructure was built, food
and housing facilities were provided. But UPA government
had given the compensation in hand, i.e, in cash, which
increased the purchasing power of rural folks. Secondly, the
National Rural Employment Guarantee scheme (NREGS) of
the government launched in 2006 has also contributed to this
boom significantly. Through this scheme every member of a
poor household got employed for at least 100 days in a year
in works like digging canals, embankment, land
development etc. This led to the increase in the disposable
income of rural people thereby pushing up their demand in
quantity as well as for quality products. Thirdly, the raising of
minimum support price for key crops like wheat and paddy
had added to it. Good harvests along with a rise in minimum
support price of paddy by 33% and wheat by 56.3% since
2004-05, availability of water and power in subsidised rates
and fertilizer subsidy altogether ensued that rural incomes
are not eroded even in a glut like situation. Fourthly, better
infrastructural and transportation facilities helped the farmers
in bringing their produce to bigger markets and getting better
prices. This further gave a boost to rural demand. Fifthly, the
farm loan waiver of Rs. 65318 Cr. carried out by the
government in 2008 added to their liquidity. Sixthly, as good
portion of rural population gets income from government by
way of salaries as post office employees, ex-servicemen,
teachers etc. The sixth pay commission handsomely
improved their disposable income and lastly, since the
villagers generally keep their savings in post offices,
nationalised banks, and government backed saving
instruments they were not much affected by stock market
crash by almost 60% since January 2008 which came
thrashing down on their urban counterparts.
Opportunities
There are many opportunities waiting to be exploited in the
area of rural marketing.
The various infrastructural problems have been tackled
to a great extent. There is better connectivity by roads,
more than 90% of villages are electrified. Rural telephone
density has gone up by 300% in last 10 years. Rural
literacy rate has also improved from 36% to 59%.
The purchasing power of rural families has grown rapidly.
Rural Marketing Association of India (RMAI) confirms that
rural income levels are on a rise. Income from non-farm
sector is likely to touch 66% of net rural income by 2020.
Market size would thus, nearly double. Average rural
spending would grow 6 times from current levels in 20
years. Moreover, the percentage of Below Poverty Line
(BPL) families declined from 46% to 27%.
There is an increasing convergence between urban and
rural consumers especially the young consumer, who
have almost same aspirations as that of a young urban
consumer. Thus, the marketers can target a certain
section of rural consumers in the same manner as they
are targeting the urban ones.
l
l
l
04
SAARANSHRKG JOURNAL OF MANAGEMENTVol . 1 No. 1 JULY 2009• •
l
l
l
l
l
l
Moverover, the per capita income of top 20%-30% of rural
segment is not much different from urban middle class.
This means that the affordability of the segment of rural
consumers will be almost equal to that of the urban
middle class. Thus, marketers can tap this segment as
well with the product he is targeting the urban middle
class.
Lastly, as we know that India's rural population accounts
for 12.5% of the world's total population, 600,000 villages
with 700 million peoples, the country side thus, offers a
huge consumer base and huge opportunity for rural
marketers in India.
Challenges Ahead
For the purpose of optimally exploiting the opportunities at
hand in rural areas, the marketers have to cope up the various
challenges before them.
The first challenge before them is to communicate the
value to the rural consumers properly. Though these
consumers understands value the marketers are
generally not able to communicate the value properly. As
Zia Hajeebhoy, head Chemistry Business and Marketing,
Monsanto says, "The amazing part for rural consumer is
that he understands value. Delivery and communication
of value to the customer in rural areas are the key
challenges."
Another challenge is to educate the rural consumer about
the requirements and uses of the products. The
marketers should also make the rural consumers
understand how their product is different from similar
products offered by competitors. This leads to better
involvement on part of buyer and fosters long lasting
relationship between consumer and company.
Another challenge is to have a strategic intent on the
company's part and not an opportunistic mindset.
Generally companies approach rural consumers only
when growth from urban market is hard to be attained.
This approach is detrimental and needed to be changed.
In the words of Sumit Sehgal, Vice president, Marketing,
Max New York life, "Rural marketing requires huge
amount of time, money and perseverance, on the part of
the marketer. It has to be a strategic intent for the
companies. A strip down version from urban to rural does
not work." Thus, there is need of a well laid out strategy at
the corporate level.
Fourthly, the lack of adequate number of people in rural
areas who can provide the last mile service also pose
difficulties for the marketers. There are not enough job
opportunities in rural areas which result in migration of
capable workforce.
l
l
l
l
l
l
l
l
l
l
Improving distribution channel and also involving rural
people in the network as they easily relate with the
consumer in those areas is another challenge to be
tackled by the rural marketers.
Trust is another key factor which has to be properly delt
with. Thus, one of the biggest challenge to be met out is
to create trust among the rural folks regarding the
products. According to Sanjay Muthal, Managing
Director, Nugrid Consulting, "Trust is another key factor-
rural consumers are suspicious of urban market thinking.
Rural consumers only buy from people they identify with."
Rural folks are now more likely to spend on items that
give them status. In the words of Sunil Duggal, CEO,
Dabur India, "Rural markets continue to surge ahead of
urban markets. We will have to suit rural needs more and
invest in understanding the spending pattern there."
Therefore, studying the pattern of rural spending is
another challenge to be faced.
Certain other factors which make the situation even more
challenging are shortage of electricity, water, poor
logistic support, poor telecommunication facilities, lack
of micro financing, fragmented market, inadequate is
distribution network, difficult consumer engagement and
a value for money mentality.
Only when these marketers successfully tackle these
challenges then only they would be able to fully reap the
benefits of growing opportunities in rural marketing.
SUGGESTIONS
Solutions to the various problems should be designed
collaboratively.
Major problems should be identified and solved with
efficiency and transparency.
Marketing research should be undertaken involving
focus groups.
Marketers should also build prototypes while strategizing
for marketing.
The supply chain management has to be more effective.
Thus, taking into consideration the various challenges
and opportunities which rural areas are offering to the
marketers, it may be stated that the future of rural market
is quite promising and fruitful. Several challenges are
there before the market managers and they have to
chalkout strategies to meet the demands being offered
by robust and rapidly growing rural markets. They should
not forget that today it is not possible to ignore a market
that houses three of every four people living in the rural
areas with rising income level.
Management of Rural Marketing Opportunities and Challenges Ahead
Jagdish Prakash Akanksha Srivastava
05
REFERENCES
Sayantani Kar and Byravee iyer (April 2009), "Bharat
Rescues India Inc", Indian Management AIMA, Vol 48,
Issue 4.
"You can not keep the rural market waiting", Indian
Management ibid.
"Emerging opportunities and strategies for Rural
marketing", The Economic Times, Lucknow, 9th April
2009, p.13.
Sapna Agarwal "Mid-tier FMCG Firms move faster than
large-cap players in volumes growth", Business
standard, Lucknow, 15th May 2009, Pg. 4
l
l
l
l
l
l
l
l
Suvi Dogra, Pradipta Mukherjee, Sapna Agarwal, "FMCG
cos strategise to capture higher rural spending",
Business standard, Lucknow, 4th May 2009.
"Table on Rural Share is stock of consumer goods", The
Great Indian market, National Council of Applied
Economic Research, New Delhi,
"Table on Rural share in stock of consumer demands",
The Great Indian Market, National Council of Applied
Economic Research, New Delhi.
www.Coolavenues.com/know/mktg/ruchi_1.php
06
SAARANSHRKG JOURNAL OF MANAGEMENTVol . 1 No. 1 JULY 2009• •
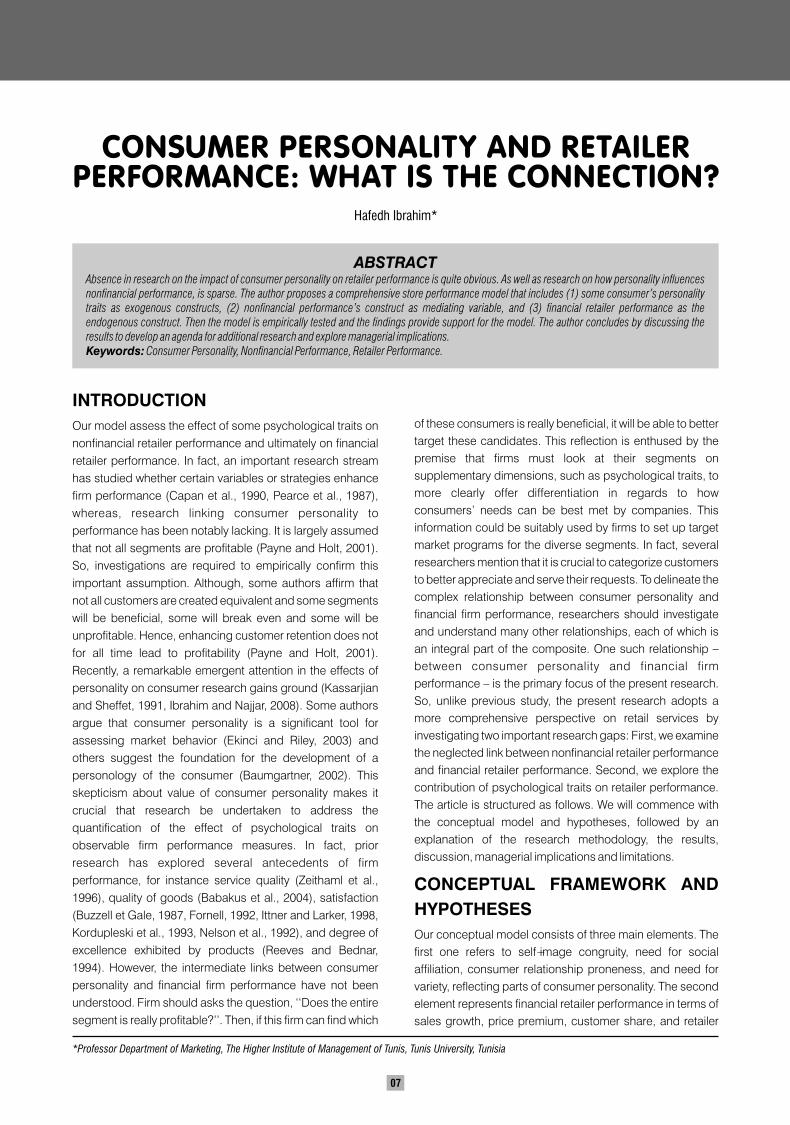
CONSUMER PERSONALITY AND RETAILER PERFORMANCE: WHAT IS THE CONNECTION?
Hafedh Ibrahim*
ABSTRACTAbsence in research on the impact of consumer personality on retailer performance is quite obvious. As well as research on how personality influences nonfinancial performance, is sparse. The author proposes a comprehensive store performance model that includes (1) some consumer’s personality traits as exogenous constructs, (2) nonfinancial performance’s construct as mediating variable, and (3) financial retailer performance as the endogenous construct. Then the model is empirically tested and the findings provide support for the model. The author concludes by discussing the results to develop an agenda for additional research and explore managerial implications.Keywords: Consumer Personality, Nonfinancial Performance, Retailer Performance.
of these consumers is really beneficial, it will be able to better
target these candidates. This reflection is enthused by the
premise that firms must look at their segments on
supplementary dimensions, such as psychological traits, to
more clearly offer differentiation in regards to how
consumers’ needs can be best met by companies. This
information could be suitably used by firms to set up target
market programs for the diverse segments. In fact, several
researchers mention that it is crucial to categorize customers
to better appreciate and serve their requests. To delineate the
complex relationship between consumer personality and
financial firm performance, researchers should investigate
and understand many other relationships, each of which is
an integral part of the composite. One such relationship –
between consumer personality and financial firm
performance – is the primary focus of the present research.
So, unlike previous study, the present research adopts a
more comprehensive perspective on retail services by
investigating two important research gaps: First, we examine
the neglected link between nonfinancial retailer performance
and financial retailer performance. Second, we explore the
contribution of psychological traits on retailer performance.
The article is structured as follows. We will commence with
the conceptual model and hypotheses, followed by an
explanation of the research methodology, the results,
discussion, managerial implications and limitations.
CONCEPTUAL FRAMEWORK AND
HYPOTHESES
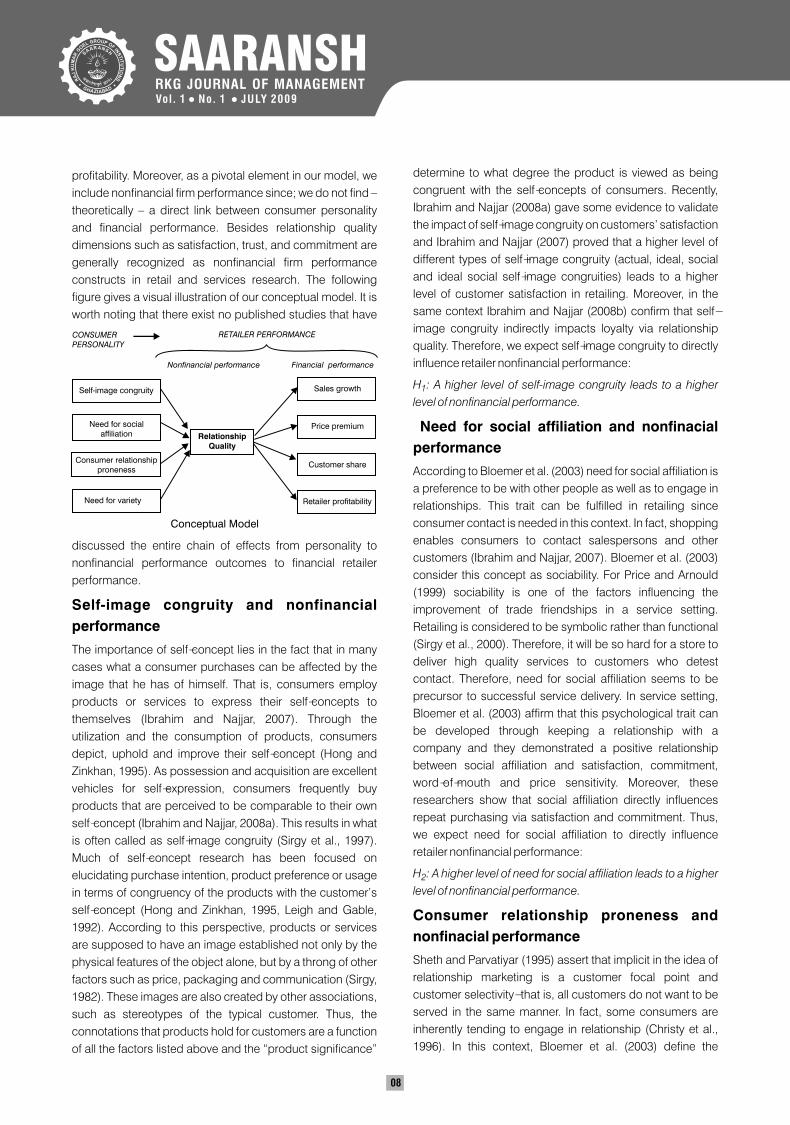
Our conceptual model consists of three main elements. The
first one refers to self-image congruity, need for social
affiliation, consumer relationship proneness, and need for
variety, reflecting parts of consumer personality. The second
element represents financial retailer performance in terms of
sales growth, price premium, customer share, and retailer
*Professor Department of Marketing, The Higher Institute of Management of Tunis, Tunis University, Tunisia
INTRODUCTION
Our model assess the effect of some psychological traits on
nonfinancial retailer performance and ultimately on financial
retailer performance. In fact, an important research stream
has studied whether certain variables or strategies enhance
firm performance (Capan et al., 1990, Pearce et al., 1987),
whereas, research linking consumer personality to
performance has been notably lacking. It is largely assumed
that not all segments are profitable (Payne and Holt, 2001).
So, investigations are required to empirically confirm this
important assumption. Although, some authors affirm that
not all customers are created equivalent and some segments
will be beneficial, some will break even and some will be
unprofitable. Hence, enhancing customer retention does not
for all time lead to profitability (Payne and Holt, 2001).
Recently, a remarkable emergent attention in the effects of
personality on consumer research gains ground (Kassarjian
and Sheffet, 1991, Ibrahim and Najjar, 2008). Some authors
argue that consumer personality is a significant tool for
assessing market behavior (Ekinci and Riley, 2003) and
others suggest the foundation for the development of a
personology of the consumer (Baumgartner, 2002). This
skepticism about value of consumer personality makes it
crucial that research be undertaken to address the
quantification of the effect of psychological traits on
observable firm performance measures. In fact, prior
research has explored several antecedents of firm
performance, for instance service quality (Zeithaml et al.,
1996), quality of goods (Babakus et al., 2004), satisfaction
(Buzzell et Gale, 1987, Fornell, 1992, Ittner and Larker, 1998,
Kordupleski et al., 1993, Nelson et al., 1992), and degree of
excellence exhibited by products (Reeves and Bednar,
1994). However, the intermediate links between consumer
personality and financial firm performance have not been
understood. Firm should asks the question, ‘‘Does the entire
segment is really profitable?’’. Then, if this firm can find which
07
SAARANSHRKG JOURNAL OF MANAGEMENTVol . 1 No. 1 JULY 2009• •
profitability. Moreover, as a pivotal element in our model, we
include nonfinancial firm performance since; we do not find –
theoretically – a direct link between consumer personality
and financial performance. Besides relationship quality
dimensions such as satisfaction, trust, and commitment are
generally recognized as nonfinancial firm performance
constructs in retail and services research. The following
figure gives a visual illustration of our conceptual model. It is
worth noting that there exist no published studies that have
discussed the entire chain of effects from personality to
nonfinancial performance outcomes to financial retailer
performance.
Self-image congruity and nonfinancial
performance
The importance of self-concept lies in the fact that in many
cases what a consumer purchases can be affected by the
image that he has of himself. That is, consumers employ
products or services to express their self-concepts to
themselves (Ibrahim and Najjar, 2007). Through the
utilization and the consumption of products, consumers
depict, uphold and improve their self-concept (Hong and
Zinkhan, 1995). As possession and acquisition are excellent
vehicles for self-expression, consumers frequently buy
products that are perceived to be comparable to their own
self-concept (Ibrahim and Najjar, 2008a). This results in what
is often called as self-image congruity (Sirgy et al., 1997).
Much of self-concept research has been focused on
elucidating purchase intention, product preference or usage
in terms of congruency of the products with the customer’s
self-concept (Hong and Zinkhan, 1995, Leigh and Gable,
1992). According to this perspective, products or services
are supposed to have an image established not only by the
physical features of the object alone, but by a throng of other
factors such as price, packaging and communication (Sirgy,
1982). These images are also created by other associations,
such as stereotypes of the typical customer. Thus, the
connotations that products hold for customers are a function
of all the factors listed above and the “product significance”
08
RETAILER PERFORMANCECONSUMER PERSONALITY
Nonfinancial performance Financial performance
Sales growth
Customer share
Price premium
Retailer profitability
Conceptual Model
Relationship Quality
Need for variety
Self-image congruity
Consumer relationship proneness
Need for social affiliation
determine to what degree the product is viewed as being
congruent with the self-concepts of consumers. Recently,
Ibrahim and Najjar (2008a) gave some evidence to validate
the impact of self-image congruity on customers’ satisfaction
and Ibrahim and Najjar (2007) proved that a higher level of
different types of self-image congruity (actual, ideal, social
and ideal social self-image congruities) leads to a higher
level of customer satisfaction in retailing. Moreover, in the
same context Ibrahim and Najjar (2008b) confirm that self-
image congruity indirectly impacts loyalty via relationship
quality. Therefore, we expect self-image congruity to directly
influence retailer nonfinancial performance:
H : A higher level of self-image congruity leads to a higher 1
level of nonfinancial performance.
Need for social affiliation and nonfinacial
performance
According to Bloemer et al. (2003) need for social affiliation is
a preference to be with other people as well as to engage in
relationships. This trait can be fulfilled in retailing since
consumer contact is needed in this context. In fact, shopping
enables consumers to contact salespersons and other
customers (Ibrahim and Najjar, 2007). Bloemer et al. (2003)
consider this concept as sociability. For Price and Arnould
(1999) sociability is one of the factors influencing the
improvement of trade friendships in a service setting.
Retailing is considered to be symbolic rather than functional
(Sirgy et al., 2000). Therefore, it will be so hard for a store to
deliver high quality services to customers who detest
contact. Therefore, need for social affiliation seems to be
precursor to successful service delivery. In service setting,
Bloemer et al. (2003) affirm that this psychological trait can
be developed through keeping a relationship with a
company and they demonstrated a positive relationship
between social affiliation and satisfaction, commitment,
word-of-mouth and price sensitivity. Moreover, these
researchers show that social affiliation directly influences
repeat purchasing via satisfaction and commitment. Thus,
we expect need for social affiliation to directly influence
retailer nonfinancial performance:
H : A higher level of need for social affiliation leads to a higher 2
level of nonfinancial performance.
Consumer relationship proneness and
nonfinacial performance
Sheth and Parvatiyar (1995) assert that implicit in the idea of
relationship marketing is a customer focal point and
customer selectivity- that is, all customers do not want to be
served in the same manner. In fact, some consumers are
inherently tending to engage in relationship (Christy et al.,
1996). In this context, Bloemer et al. (2003) define the
09
Consumer Personality and Retailer Performance: What is the Connection?
concept consumer relationship proneness as the relatively
stable and conscious tendency of a consumer to engage in
relationships with the company. The documented research
relative to this concept is little and recent, it being recognized
that consumer relationship proneness differs between
consumers, whereas there is limited empirical studies of this
(Liljander and Roos, 2002). Firms should discern which of
consumers really intend to put up a long-term relationship, it
will be able to better target these candidates to invest in a
relationship building. When a customer has low level of
relationship proneness, he is transactional oriented (Ibrahim
and Najjar, 2008). Transactional orientation is a short-term
attitude of the customers. The customers with transactional
orientation do not aspire to construct any relationship with the
company as well as they purchase with no commitment.
Whereas, those with high level of relationship proneness are
strongly prepared to build up a relationship with the
company. From the works of Bloemer and Odekerken-
Schröeder (2002), De Wulf et al. (2001), Odekerken-
Schröder et al. (2003) and Vazquez-Carrasco and Foxall
(2006), it appears the key role played by consumer
relationship proneness trait in determining customer
satisfaction. In the same context, Bloemer et al. (2003) found
strong support for the direct impact of relationship proneness
on commitment and the indirect effect on this construct on
word of mouth, price sensitivity and repeat purchasing, via
commitment. Hence;
H : A higher level of relationship proneness leads to a higher 3
level of nonfinancial performance.
Need for variety and nonfinancial
performance
Customer can be influenced by personality traits to look for
variety as something primeval as well as desirable in itself.
The propensity to search for activities has been explained by
the Optimum Stimulation Level (OSL) paradigm. A
commonly conventional treatment of need for variety is that
each entity has preference for a given level of stimulation. If
the level of stimulation at a certain time decreases under the
optimum level, the individual will look for supplementary
variety from the surroundings in order to raise stimulation. On
the other hand, when the stimulation level is over this
optimum level, the individual will make an effort to lessen it
(Zuckerman, 1994). In marketing and consumer studies,
need for variety has an obvious implication since it helps to
clarify dissimilarities between customers in relation to
numerous aspects of consumer behavior. The majority of
activities persons accomplishes in order to improve their OSL
have been elucidated by the construct ‘‘customer exploratory
behavior’’ which can be defined as the search for newness
(Waters, 1974). To the best of our knowledge, there are little
investigations suggesting a direct link between need for
variety and nonfinancial performance. Burgess and Harris
(1998) announce that the OSL is essential to differentiate
disloyal and loyal customers. Need for variety motivates
customer switching behavior despite a perception of good
relationship quality (Hennig-Thurau and Klee, 1997). All of
the evidence adduced on this psychological trait leads to
propose that customers with a high need for variety may
have a low level of relationship quality and loyalty. This is
since their intrinsic need for change would make them less
attached to the relationship developed with their firm.
Therefore;
H : A higher level of need for variety leads to a lower level of 4
nonfinancial performance.
Nonfinacial retailer performance and
financial retailer performance
We discern a significant difference between nonfinancial and
financial firm performance measures (Homburg et al., 2002).
Nonfinancial firm performance is allied to the success of a
company’s marketing activities and consists of variables
such as market share, customer loyalty, customer benefit as
well as customer satisfaction (Menon et al., 1996, Morgan
and Piercy, 1996). Financial firm performance essentially is
linked to profitability measures comprising return on assets,
return on sales, and return on investment (Chakravarthy,
1986). Prior research maintains the thought that nonfinancial
performance leads to enhanced financial performance (Rust
et al., 1995). Nevertheless, the understanding of whether
marketing strategies activities influence the retailer’s
financial performance is still at a less-than-desible stage. As
said by Srivastava et al. (1998), in the lack of a satisfactory
understanding of the marketing-finance interface, marketers
have big difficulty in evaluating the implication of marketing
activities. This, in sequence confines the investment in
marketing activities. This point is also discussed by Webster
(1981). In this research we look at three nonfinancial
dimensions represented by relationship quality (satisfaction,
commitment, and trust) and four diverse financial outcomes
(sales growth, price premium, customer share, and retailer
profitability). Relationship quality has long been an area of
interest in marketing literature since it is considered to be
imperative in the maintenance of customer-firm relationship
(Hennig-Thurau, 2000). This construct has been defined by
Smith (1998) as a general estimation of the strength of the
relationship and the extent to which it meets the desires and
anticipations of the parties derived from a history of
successful encounters or events. Crosby et al. (1990)
developed a model demonstrating that relationship quality is
studied from a customer’s viewpoint. It can also be seen
from the firm’s perspective. In fact, Roberts et al. (2003)
Hafedh Ibrahim
SAARANSHRKG JOURNAL OF MANAGEMENTVol . 1 No. 1 JULY 2009• •
10
assert that firms must be able to monitor the quality of their
consumers’ relationship with them, as well as the efficiency
of their relationship programs aimed at constructing
relationship quality, since relationship quality offers
quantification for such estimation. Generally, the construct of
relationship quality is considered as a multi-dimensional
construct (Woo and Ennew, 2004). It is conceptualised as a
higher-order construct consisting of several dimensions
(Kumar et al., 1995). Recently, Palmatier et al. (2006)
recognized that commitment, satisfaction and trust are the
dimensions of relationship quality that most often studied, as
relationship quality is a composite measure of relationship
strength. Therefore, the present study views relationship
quality as a higher order construct that includes these three
dimensions. Past researches have found a positive
connection between customer satisfaction and the firm’s
profitability (Anderson et al., 1994, Rust and Zahorik, 1993).
Palmatier et al. (2007) hypothesize that relationship quality
have an effect on service provider. Their findings confirm that
relationships developed with persons and firms function in a
different way and have potentially distinct influences on
outcomes. In fact, relationship quality with the salesperson
impinges on three financial outcomes (price premium, sales
growth, and customer share) and has a superior effect on
customer share and sales growth than did with the price
premium. Medlin et al. (2005) prove empirically that
commitment affects directly firm performance (profit, sales,
market share, and growth in market share). Also, it affects
indirectly performance outcomes via trust. As well, trust has a
direct and positive effect on the firm’s performance.
According to Ittner and Larcker (1998) nonfinancial
measures are good leading indicators of financial
performance. Therefore, we suggest the following
hypotheses:
H : A higher level of nonfinancial performance leads to a 5a
higher level of sales growth.
H : A higher level of nonfinancial performance leads to a 5b
higher level of price premium.
H : A higher level of nonfinancial performance leads to a 5c
higher level of customer share.
H : A higher level of nonfinancial performance leads to a 5d
higher level of retailer profitability.
METHODOLOGY
Data were collected from in two phases. Collecting
responses separately for every stage guarantees no bias in
the connection between the variables caused by asking the
respondent to give both sets of answers in the same
questionnaire. Both phases were done for the period of
three-months. Details concerning the measures and
procedures employed in the study are illustrated in the
remainder of this section.
Phase 1: Data collection from retail store managers
Data collection: All measures in phase 1 were collected
from the survey responses provided by managers. They were
solicited to answer a series of questions. 303 questionnaires
were sent with a letter elucidating the scholastic object of our
research and reassuring confidentiality. Followed-up
personal phone contacts in order to persuade them to
complete the questionnaire. 112 completed surveys were
returned, for a response rate of 37%. Then the sample was
divided into late and early respondents and the two groups
were compared in terms of the retail store performance
outcomes (sales growth and retailer profitability). This
evaluation indicated similarity in variances and means
between the groups, which denotes that nonresponse bias in
phase 1 is unlikely to distort the results of this study.
Measures: Retail store managers provide 2006 and 2007
sales revenues which enabled us to calculate the raw
percentage and then sales growth was measured on a five-
point Likert scale. The retailer profitability also was measured
with a single item, the question was: what was the profit as a
percentage of sales of your store on average over the last two
years? (1 = negative, 2 = 0% - 2%, 3 = 2.1% - 3.5%, 4 = 3.6%
- 5%, 5 = 5.1% and more).
Phase 2: Data collection from shoppers
Data collection: 20 students from the higher institute of
management of Tunis collected data on consumer
personality, relationship quality, customer share, and price
premium. Their work was supervised by random call-backs
(to telephone numbers obtained in the interviews). 1000
patrons of discount retail stores were drawn in five big cities
in Tunisia. After screening the questionnaire for
incompleteness a 836 usable sample was utilized.
Measures: Based on a review of the relevant literature
measures were generated for customer share (Palmatier et
al., 2007), price premium (Palmatier et al., 2007), need for
social affiliation (Bloemer et al., 2003, Shim et Eastlick, 1998),
consumer relationship proneness (Bloemer et al., 2003) and
Need for variety (Steenkamp and Baumgartner, 1995).
Relationship quality was conceptualized as a higher-order
construct comprising trust, commitment, and satisfaction
(De Wulf et al., 2003) and self-image congruity was
measured by four items five point numeric scale following
Ibrahim and Najjar (2008a). The items related to all variables
are exposed in (see table 1).
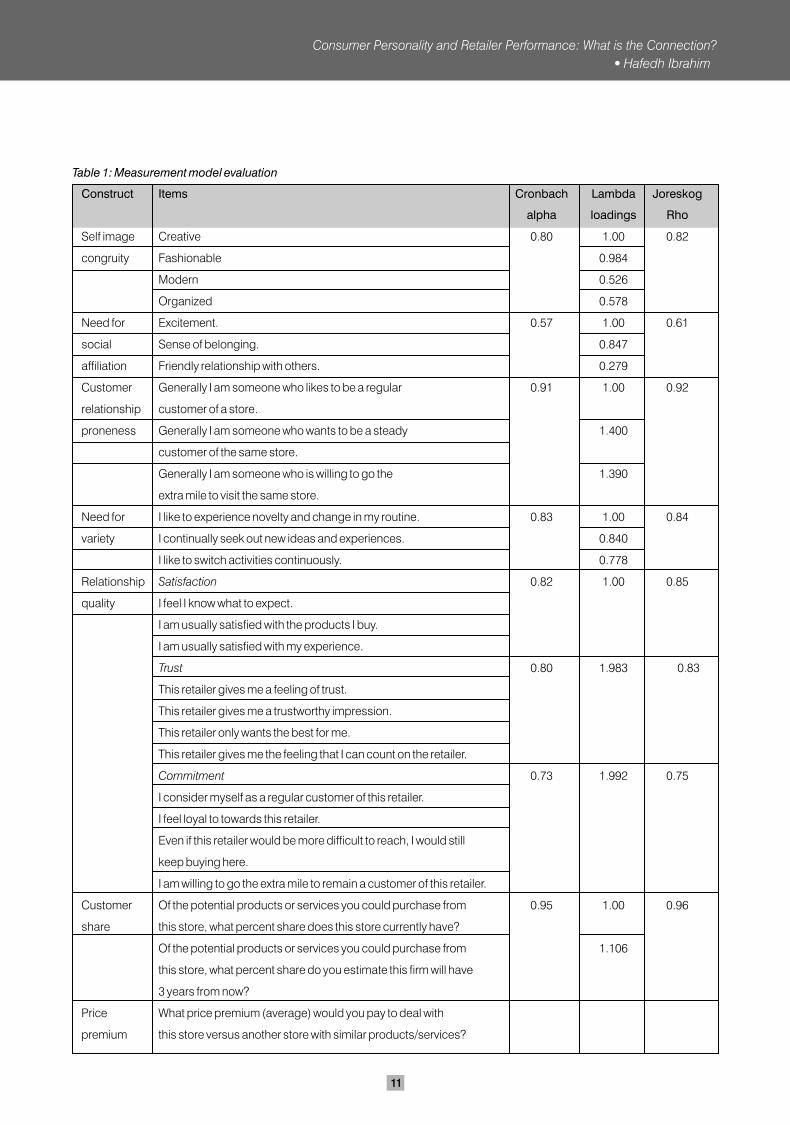
11
Consumer Personality and Retailer Performance: What is the Connection?
Table 1: Measurement model evaluation
Construct Items Cronbach Lambda Joreskog
alpha loadings Rho
Self image Creative 0.80 1.00 0.82
congruity Fashionable 0.984
Modern 0.526
Organized 0.578
Need for Excitement. 0.57 1.00 0.61
social Sense of belonging. 0.847
affiliation Friendly relationship with others. 0.279
Customer Generally I am someone who likes to be a regular 0.91 1.00 0.92
relationship customer of a store.
proneness Generally I am someone who wants to be a steady 1.400
customer of the same store.
Generally I am someone who is willing to go the 1.390
extra mile to visit the same store.
Need for I like to experience novelty and change in my routine. 0.83 1.00 0.84
variety I continually seek out new ideas and experiences. 0.840
I like to switch activities continuously. 0.778
Relationship Satisfaction 0.82 1.00 0.85
quality I feel I know what to expect.
I am usually satisfied with the products I buy.
I am usually satisfied with my experience.
Trust 0.80 1.983 0.83
This retailer gives me a feeling of trust.
This retailer gives me a trustworthy impression.
This retailer only wants the best for me.
This retailer gives me the feeling that I can count on the retailer.
Commitment 0.73 1.992 0.75
I consider myself as a regular customer of this retailer.
I feel loyal to towards this retailer.
Even if this retailer would be more difficult to reach, I would still
keep buying here.
I am willing to go the extra mile to remain a customer of this retailer.
Customer Of the potential products or services you could purchase from 0.95 1.00 0.96
share this store, what percent share does this store currently have?
Of the potential products or services you could purchase from 1.106
this store, what percent share do you estimate this firm will have
3 years from now?
Price What price premium (average) would you pay to deal with
premium this store versus another store with similar products/services?
Hafedh Ibrahim
SAARANSHRKG JOURNAL OF MANAGEMENTVol . 1 No. 1 JULY 2009• •
12
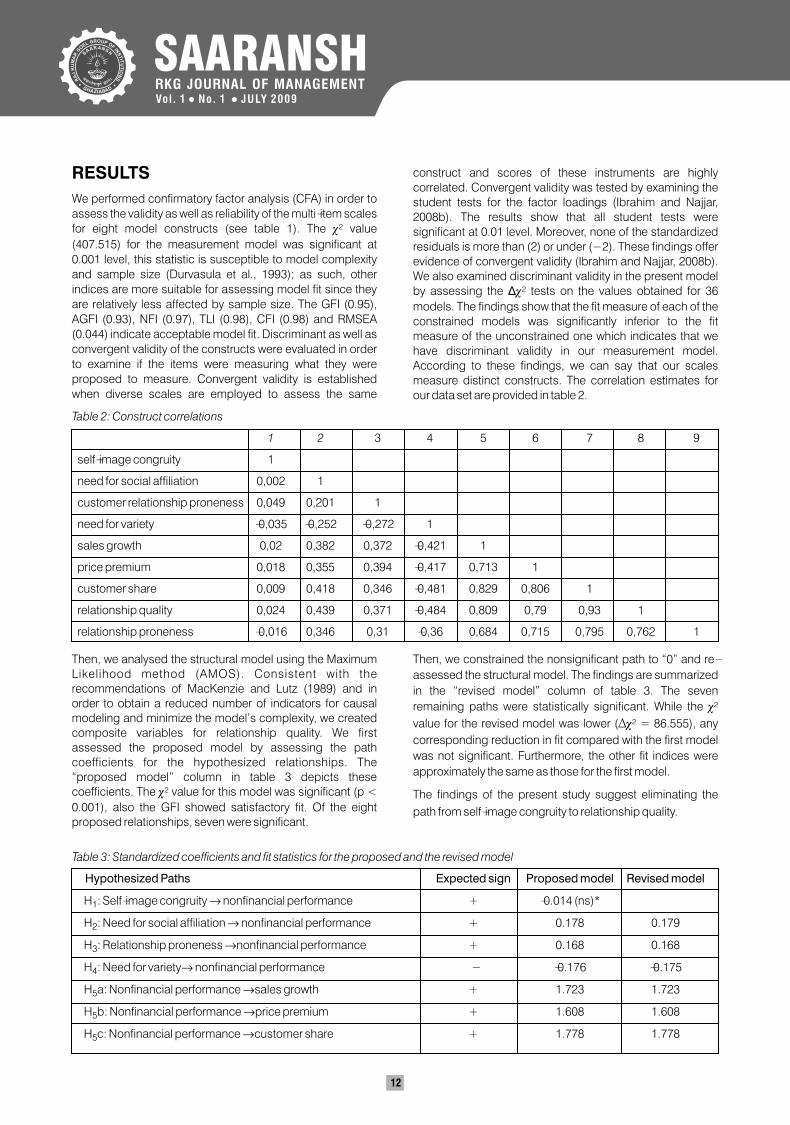
RESULTS
We performed confirmatory factor analysis (CFA) in order to
assess the validity as well as reliability of the multi-item scales
for eight model constructs (see table 1). The c² value
(407.515) for the measurement model was significant at 0.001 level, this statistic is susceptible to model complexity
and sample size (Durvasula et al., 1993); as such, other indices are more suitable for assessing model fit since they
are relatively less affected by sample size. The GFI (0.95),
AGFI (0.93), NFI (0.97), TLI (0.98), CFI (0.98) and RMSEA (0.044) indicate acceptable model fit. Discriminant as well as
convergent validity of the constructs were evaluated in order to examine if the items were measuring what they were
proposed to measure. Convergent validity is established when diverse scales are employed to assess the same
construct and scores of these instruments are highly correlated. Convergent validity was tested by examining the student tests for the factor loadings (Ibrahim and Najjar, 2008b). The results show that all student tests were significant at 0.01 level. Moreover, none of the standardized residuals is more than (2) or under (- 2). These findings offer evidence of convergent validity (Ibrahim and Najjar, 2008b). We also examined discriminant validity in the present model by assessing the ?c² tests on the values obtained for 36
models. The findings show that the fit measure of each of the constrained models was significantly inferior to the fit measure of the unconstrained one which indicates that we have discriminant validity in our measurement model. According to these findings, we can say that our scales measure distinct constructs. The correlation estimates for our data set are provided in table 2.
Then, we analysed the structural model using the Maximum Likelihood method (AMOS). Consistent with the recommendations of MacKenzie and Lutz (1989) and in order to obtain a reduced number of indicators for causal modeling and minimize the model’s complexity, we created composite variables for relationship quality. We first assessed the proposed model by assessing the path coefficients for the hypothesized relationships. The “proposed model” column in table 3 depicts these coefficients. The c² value for this model was significant (p <
0.001), also the GFI showed satisfactory fit. Of the eight proposed relationships, seven were significant.
Table 2: Construct correlations
1 2 3 4 5 6 7 8 9
self-image congruity 1
need for social affiliation 0,002 1
customer relationship proneness 0,049 0,201 1
need for variety -0,035 -0,252 -0,272 1
sales growth 0,02 0,382 0,372 -0,421 1
price premium 0,018 0,355 0,394 -0,417 0,713 1
customer share 0,009 0,418 0,346 -0,481 0,829 0,806 1
relationship quality 0,024 0,439 0,371 -0,484 0,809 0,79 0,93 1
relationship proneness -0,016 0,346 0,31 -0,36 0,684 0,715 0,795 0,762 1
Then, we constrained the nonsignificant path to “0” and re-
assessed the structural model. The findings are summarized
in the “revised model” column of table 3. The seven
remaining paths were statistically significant. While the c²
value for the revised model was lower (Äc² = 86.555), any
corresponding reduction in fit compared with the first model
was not significant. Furthermore, the other fit indices were
approximately the same as those for the first model.
The findings of the present study suggest eliminating the
path from self-image congruity to relationship quality.
Table 3: Standardized coefficients and fit statistics for the proposed and the revised model
Hypothesized Paths Expected sign Proposed model Revised model
H : Self-image congruity 2 nonfinancial performance + -0.014 (ns)*1
H : Need for social affiliation 2 nonfinancial performance + 0.178 0.1792
H : Relationship proneness 2nonfinancial performance + 0.168 0.1683
H : Need for variety2 nonfinancial performance - -0.176 -0.1754
H a: Nonfinancial performance 2sales growth + 1.723 1.7235
H b: Nonfinancial performance 2price premium + 1.608 1.6085
H c: Nonfinancial performance 2customer share + 1.778 1.7785
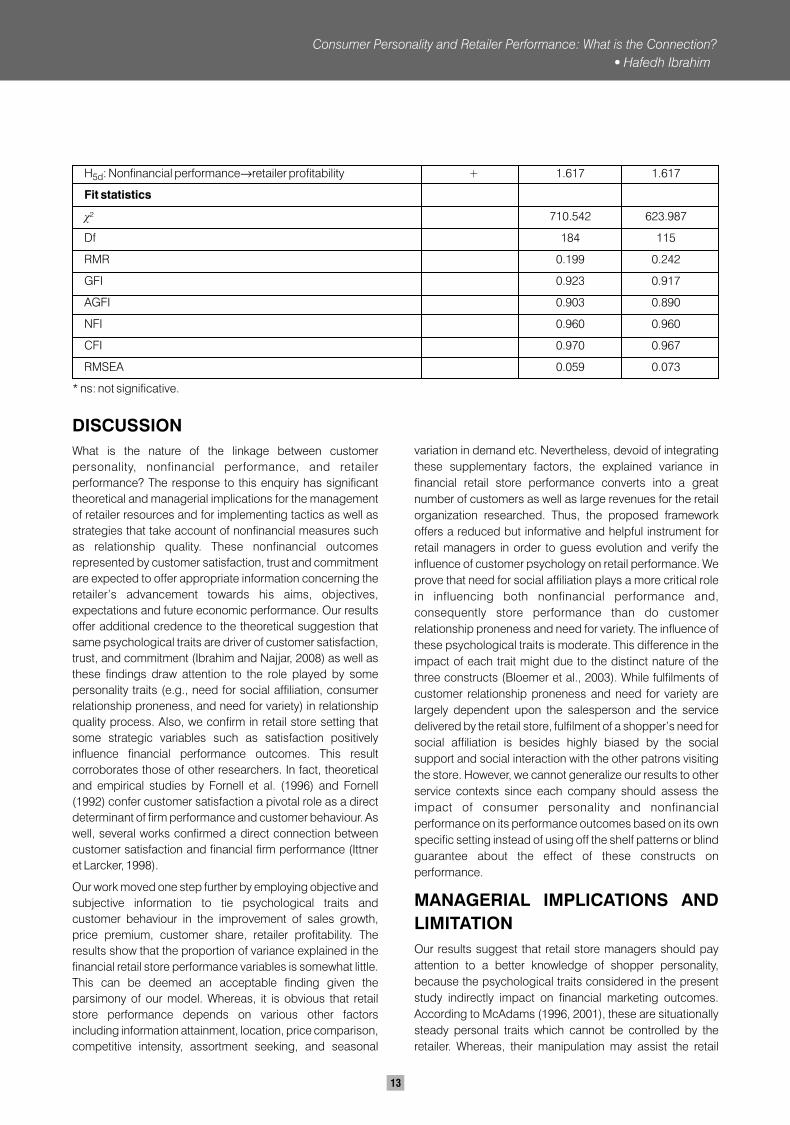
H : Nonfinancial performance2retailer profitability + 1.617 1.6175d
Fit statistics
?² 710.542 623.987
Df 184 115
RMR 0.199 0.242
GFI 0.923 0.917
AGFI 0.903 0.890
NFI 0.960 0.960
CFI 0.970 0.967
RMSEA 0.059 0.073
* ns: not significative.
DISCUSSION
What is the nature of the linkage between customer
personality, nonfinancial performance, and retailer
performance? The response to this enquiry has significant
theoretical and managerial implications for the management
of retailer resources and for implementing tactics as well as
strategies that take account of nonfinancial measures such
as relationship quality. These nonfinancial outcomes
represented by customer satisfaction, trust and commitment
are expected to offer appropriate information concerning the
retailer’s advancement towards his aims, objectives,
expectations and future economic performance. Our results
offer additional credence to the theoretical suggestion that
same psychological traits are driver of customer satisfaction,
trust, and commitment (Ibrahim and Najjar, 2008) as well as
these findings draw attention to the role played by some
personality traits (e.g., need for social affiliation, consumer
relationship proneness, and need for variety) in relationship
quality process. Also, we confirm in retail store setting that
some strategic variables such as satisfaction positively
influence financial performance outcomes. This result
corroborates those of other researchers. In fact, theoretical
and empirical studies by Fornell et al. (1996) and Fornell
(1992) confer customer satisfaction a pivotal role as a direct
determinant of firm performance and customer behaviour. As
well, several works confirmed a direct connection between
customer satisfaction and financial firm performance (Ittner
et Larcker, 1998).
Our work moved one step further by employing objective and
subjective information to tie psychological traits and
customer behaviour in the improvement of sales growth,
price premium, customer share, retailer profitability. The
results show that the proportion of variance explained in the
financial retail store performance variables is somewhat little.
This can be deemed an acceptable finding given the
parsimony of our model. Whereas, it is obvious that retail
store performance depends on various other factors
including information attainment, location, price comparison,
competitive intensity, assortment seeking, and seasonal
variation in demand etc. Nevertheless, devoid of integrating
these supplementary factors, the explained variance in
financial retail store performance converts into a great
number of customers as well as large revenues for the retail
organization researched. Thus, the proposed framework
offers a reduced but informative and helpful instrument for
retail managers in order to guess evolution and verify the
influence of customer psychology on retail performance. We
prove that need for social affiliation plays a more critical role
in influencing both nonfinancial performance and,
consequently store performance than do customer
relationship proneness and need for variety. The influence of
these psychological traits is moderate. This difference in the
impact of each trait might due to the distinct nature of the
three constructs (Bloemer et al., 2003). While fulfilments of
customer relationship proneness and need for variety are
largely dependent upon the salesperson and the service
delivered by the retail store, fulfilment of a shopper’s need for
social affiliation is besides highly biased by the social
support and social interaction with the other patrons visiting
the store. However, we cannot generalize our results to other
service contexts since each company should assess the
impact of consumer personality and nonfinancial
performance on its performance outcomes based on its own
specific setting instead of using off the shelf patterns or blind
guarantee about the effect of these constructs on
performance.
MANAGERIAL IMPLICATIONS AND
LIMITATION
Our results suggest that retail store managers should pay
attention to a better knowledge of shopper personality,
because the psychological traits considered in the present
study indirectly impact on financial marketing outcomes.
According to McAdams (1996, 2001), these are situationally
steady personal traits which cannot be controlled by the
retailer. Whereas, their manipulation may assist the retail
Consumer Personality and Retailer Performance: What is the Connection?
Hafedh Ibrahim
13
14
manager accomplish a better management of relationship
with shoppers. So, service providers might consider
understanding survey research on these constructs, in
conjunction with the traditional surveys. It is worth noting that
because of the presence of a suppressor effect derived from
the model complexity, we could not support the path from
self-image congruity to nonfinancial firm performance, which
has been established in past researches (e.g., Ibrahim and
Najjar, 2008b). Whereas, the insertion of other constructs in
our model leads us to important managerial implications.
Many research opportunities come from the exploratory
nature of the present study, given the integration of
constructs and relationships between them which have
hardly been questioned in consumer behavior and
marketing. This limitation opens up an attractive line of
research, which allows us to go even deeper into human
personality as a predictor of performance. For example, how
would influence in our model the inclusion of the
psychological traits such as extroversion, openness to
experience, open-minded, etc.?
REFERENCES
Anderson EW., et. al. (1994). “Customer satisfaction,
market share, and profitability: findings from Sweden”,
Journal of Marketing, Vol. 58, pp. 53-66.
Baumgartner, H. (2002). “Toward a personology of the
consumer”, Journal of Consumer Research, 29, 286-292.
Bloemer et Oderken-Schröder (2002). ). “Store
satisfaction and store loyalty explained by customer and
store related factors”, Journal of Satisfaction,
Dissatisfaction and Complaining Behavior, vol. 15, pp.
68-80.
Bloemer J., et. al. (2003). The impact of need for social
affiliation and consumer relationship proneness on
behavioral intentions : An empirical study in a
hairdresser’s context. Journal of Retailing and Consumer
Services, 10, pp.231-240.
Buzzell R., et. al. (1987). “The PIMS principles: Linking
strategy to performance”, New York: The Free Press.
Capon N., et. al. (1990). “Determinants of financial
performance: A meta-analysis”, Management Science,
36 (10), 1143-1159.
Christy R., et. al. (1996). “Relationship marketing in
consumer markets”, Journal of Marketing Management,
Vol. 12, pp. 175-187.
De Wulf K., et. al. (2001). ‘‘Investments in consumer
relationships: A cross-country and cross-industry
exploration’’, Journal of Marketing, vol. 65, n°4, pp. 33-
50.
Durvasula S., et. al. (1993). “Assessing the cross national
applicability of consumer behavior models: A model of
attitude toward advertising in general”, Journal of
Consumer Research, 19, 626-636.
l
l
l
l
l
l
l
l
l
l
l
l
l
l
l
l
l
l
l
l
l
l
l
l
Ekinci Y. et Riley M. (2003). “An investigation of self-
concept: actual and ideal self-congruence compared in
the context of service evaluation”, Journal of Retailing
and Consumer Services, vol. 10, pp. 201-14.
Fornell C, (1992). “A national customer satisfaction
barometer: the Swedish experience”, Journal of
Marketing, Vol. 56, pp. 6-21.
Homburg C. et Giering A. (2002). “Personal
characteristics as moderators of the relationship
between customer satisfaction and loyalty-an empirical
analysis”, Psychology & Marketing, vol. 18, pp. 43-66.
Hong JW., et. al. (1995). “Self concept and advertising
effect iveness: the inf luence of congruency,
conspicuousness, and response mode”, Psychology &
Marketing, Vol. 19, pp. 235-266.
Ittner C., et. al. (1998). “Are nonfinancial measures
leading indicators of financial performance? An analysis
of customer satisfaction, Journal of Accounting
Research, 36, 1-36.
Ibrahim H., et. al. (2007). “A multi-dimensional approach
to analyzing the effect of self congruity on shopper's retail
store behaviour”, Innovative Marketing, Vol. 3, pp. 54-68.
Kassarjian H., et. al. (1991). “Personality and consumer
behavior: An update. In: Kassarjian H, Robertson T (Eds),
Perspectives in consumer behavior, fourth ed., Prentice-
Hall, New Jersey.
Kordupleski R., et., al. (1993). “Why improving quality
doesn’t improve quality”. California Management
Review, 35, 82-95.
Leigh JH et. al. (1992). “Symbolic Interactionism: its
effects on consumer behavior and implications for
marketing strategy”. The Journal of Services Marketing,
Vol. 6, pp. 5-16.
Liljander V., et. al. (2002). “Customer relationship levels
from spurious to true relationships”. Journal of Services
Marketing, 16 (7), 593-614.
McAdams DP (1996). “Personality, moderating and the
storied self: a contemporary framework for studying
persons”. Psychological Inquiry, Vol. 7, pp. 295-321.
McAdams DP (2001). “The person: an integrated
introduction to personality psychology”, Third Ed.
Harcourt College Publishers, Fort Worth, TX.
Morgan N., et. al. (1996). “Exploring the relationship
between marketing and quality functions at the SBU
level: Influences and outcomes”. Research papers in
management Studies, N°. 19, University of Cambridge.
Nelson E., et. al. (1992). “Do patient perceptions of
quality relate to hospital financial performance?”. Journal
of Health Care Marketing, 13, 1-13.
Odekerken-Schröder G, et. al. (2003). “Strengthening
outcomes of retailer-consumer relationships: the dual
SAARANSHRKG JOURNAL OF MANAGEMENTVol . 1 No. 1 JULY 2009• •
impact of relationship marketing tactics and consumer
personality”. Journal of Business Research, 56, 177-190.
Pearce J., et. al. (1987). “The impact of grand strategy
and planning formality on financial performance”,
Strategic Management Journal, 8 (2), 125-134.
Payne A., et. al. (2001). “Diagnosing customer value:
Integrating the value process and relationship
marketing”. British Journal of Marketing, Vol.12, 159-182.
Price L., et. al. (1999). Commercial friendships : Service
provider–client relationships in context. Journal of
Marketing, 63, pp.38-56.
Palmatier P., et. al.Grewal, D. et Evans K.R. (2006).
‘‘Factors influencing the effectiveness of relationship
marketing: A meta-analysis’’, Journal of Marketing, vol.
70, (Octobre), pp. 136-156.
Reeves C., et. al. (1994). “Defining quality: Alternatives
and implications”. Academy of Management Review, 19
(3), 419-445.
Rust R., et. al. (1993). “Return on quality: Measuring the
financial impact of your company’s quest for quality”.
Chicago Probus Publishing Company.
Rust R., et. al. (1995). “Return on quality (ROQ):
Makingservice quality financially accountable”. Journal
of Marketing, 59, 58-70.
Roberts K., et. al. (2003). “Measuring the quality of
relationships in consumer services: an empirical study”,
European Journal of Marketing, Vol. 37, pp. 169-196.
Sheth JN., et. al. (1995). “Relationship marketing in
consumer markets: antecedents and consequences”,
Journal of the Academy of Marketing Science, Vol. 23, pp.
255-271.
Shim S., et. al. (1998). “On mall shopping attitude and
behavior”. Journal of Retailing, 74 (1), 139-160.
l
l
l
l
l
l
l
l
l
l
l
l
l
l
l
l
l
l
l
l
Smith B (1998). “Buyer-seller relationships: bonds,
relationship management and sex-type”, Canadian
Journal of Administrative Sciences, Vol. 15, pp. 76-92.
Sirgy MJD., et. al. (1997), “Assessing the predictive
validity of two methods of measuring self-image
congruence”, Academy of Marketing Science Journal,
Vol. 25, pp. 229-242.
Srivastava R., et. al. (1998). “Market-based assets and
shareholder value: A framework for analysis”, Journal of
Marketing, 62, 2-18.
Steenkamp J., et. al. (1995). “Assessing measurement
invariance in cross national consumer research”, Journal
of Consumer Research, 25, 78-90.
Vazquez-Carrasco R. et Foxall G.R. (2006). “Influence of
personality traits on satisfaction, perception of relational
benefits, and loyalty in a personal service context”,
Journal of Retailing and Consumer Services, vol. 13,
Issue 3, pp. 205-219.
Woo K. et Ennew C.T. (2004). ‘‘Business-to-business
relationship quality: An IMP interaction-based
conceptualisation and Measurement’’, European Journal
of Marketing, vol. 38, n°(9/10), pp. 1252-1271.
Webster F. (1981). “Top management’s concerns about
marketing: Issues for the 1980s”, Journal of Marketing,
45, 9-16.
Waters C. (1974). Multidimensional measures of novelty
experiencing, sensation seeking and ability :
Correlational analysis for male and female college
samples. Psychological Reports, 34, pp.43-46.
Zuckerman M. (1994). Behavioral expressions and
biosocial bases of sensation seeking. Cambridge
University Press, New York.
Zeithaml VA., et. al. (1996). “The behavioral
consequences of services quality”, Journal of Marketing,
Vol. 60, pp. 31-46.
Consumer Personality and Retailer Performance: What is the Connection?
Hafedh Ibrahim
15
SAARANSHRKG JOURNAL OF MANAGEMENTVol . 1 No. 1 JULY 2009• •
16
BASEL-II ACCORD AND INDIAN BANKS
ABSTRACTThe Basel Accord(s) refers to the banking supervision Accords, Basel I and Basel II issued by the Basel Committee on Banking Supervision. They are called the Basel Accords as the BCBS maintains its secretariat at the Bank of International Settlement in Basel, Switzerland and the committee normally meets there. Tha present paper is an attempet to check the impact of Basel II accord on Indian BanksKeywords: Consumer Personality, Nonfinancial Performance, Retailer Performance.
known as Basel II are in the process of implementation by
several countries.
Main framework
Basel I, that is, the 1988 Basel Accord, primarily focused on
credit risk. Assets of banks were classified and grouped in
five categories according to credit risk, carrying risk weights
of zero (for example home country sovereign debt), ten,
twenty, fifty, and up to one hundred percent (this category
has, as an example, most corporate debt). Banks with
international presence are required to hold capital equal to 8
% of the risk-weighted assets. Currently numbering over 100
countries, have also adopted, at least in name, the principles
prescribed under Basel I. The efficiency with which they are
enforced varies, even within nations of the Group of Ten.
BASEL II ACCORD
The New Basel Capital Accord, as Basel II, was approved by
the Basel Committee on Banking Supervision of Bank for
International Settlements in June 2004 and suggests that
banks and supervisors implement it by beginning 2007,
providing a transition time of 30 months. It is estimated that
the Accord would be implemented in over 100 countries,
including India.
What is Basel II?
Basel II is the second of the Basel Accords recommended on
banking laws and regulations issued by the Basel Committee
on Banking Supervision. The purpose of Basel II is to create
an international standard that banking regulators can use
when creating regulations about how much capital banks
need to put aside to guard against the types of financial and
operational risks (these terms are explained in later sections)
banks face. These international standards can help protect
the international financial system from the types of problems
that might arise should a major bank or a series of banks
collapse. Basel II insists on setting up rigorous risk and
capital management requirements designed to ensure that a
*Professor, Faculty of Commerce, Banaras Hindu University, Varanasi-221005**Research Scholar, Faculty of Commerce, Banaras Hindu University, Varanasi-221005
S. P. Srivastava* Sanjay Kr. Patel**
BACKGROUND
The Committee was formed in response to the messy
liquidation of a Cologne-based bank in 1974 when the Bank
Herstatt was liquidated by German regulators. This incident
prompted the G-10 nations to form, towards the end of 1974,
the Basel Committee on Banking Supervision, under the
auspices of the Bank of International Settlements (BIS)
located in Basel, Switzerland. The Basel Committee on
Banking Supervision provides a forum for regular
cooperation on banking supervisory matters. Its objective is
to enhance understanding of key supervisory issues and
improve the quality of banking supervision worldwide. It
seeks to do so by exchanging information on national
supervisory issues, approaches and techniques, with a view
to promoting common understanding. At times, the
Committee uses this common understanding to develop
guidelines and supervisory standards in areas where they
are considered desirable. In this regard, the Committee is
best known for its international standards on capital
adequacy; the Core Principles for Effective Banking
Supervision; and the Concordat on cross-border banking
supervision. The Committee encourages contacts and
cooperation among its members and other banking
supervisory authorities. It circulates to supervisors
throughout the world both published and unpublished
papers providing guidance on banking supervisory matters.
Contacts have been further strengthened by an International
Conference of Banking Supervisors (ICBS) which takes
place every two years.
BASEL I
Basel I is the round of deliberations by central bankers from
around the world, and in 1988, the Basel Committee (BCBS)
in Basel, Switzerland, published a set of minimal capital
requirements for banks. This is also known as the 1988 Basel
Accord, and was enforced by law in the Group of ten (G-10)
countries in 1992, with Japanese banks permitted an
extended transition period. Basel I is now widely viewed as
outmoded, and a more comprehensive set of guidelines,
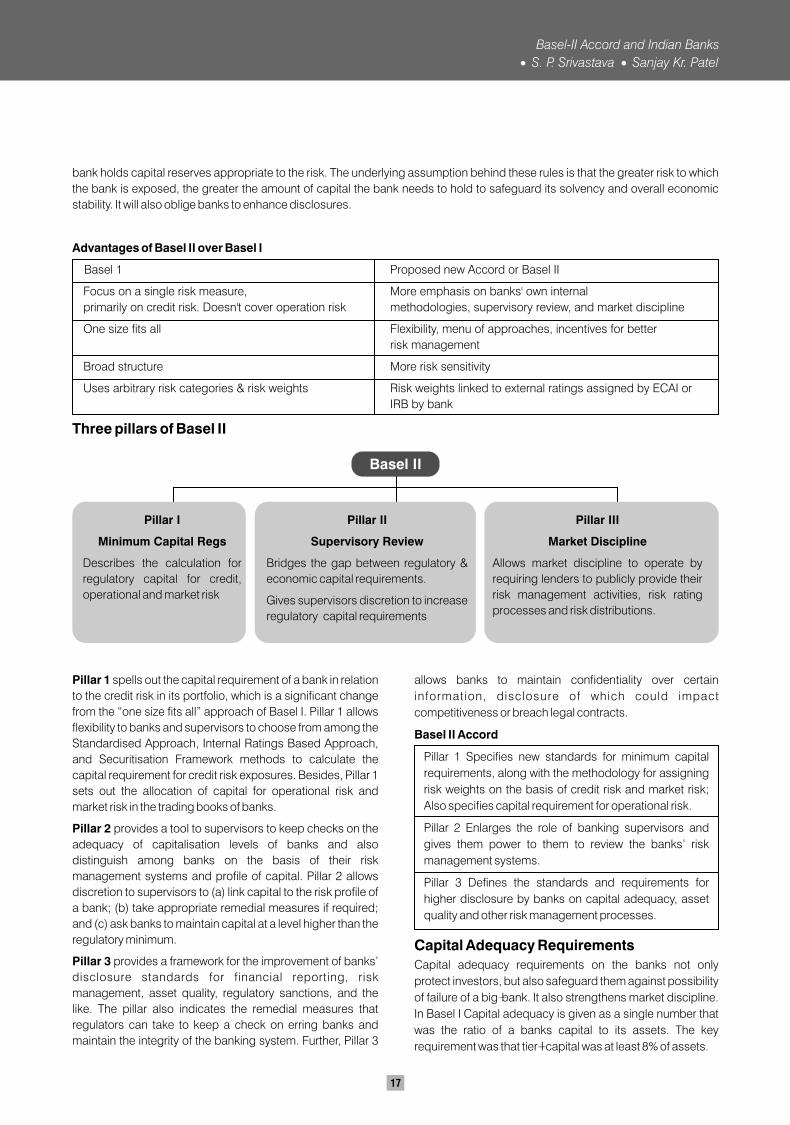
bank holds capital reserves appropriate to the risk. The underlying assumption behind these rules is that the greater risk to which
the bank is exposed, the greater the amount of capital the bank needs to hold to safeguard its solvency and overall economic
stability. It will also oblige banks to enhance disclosures.
Advantages of Basel II over Basel I
Basel 1 Proposed new Accord or Basel II
Focus on a single risk measure, More emphasis on banks' own internal
primarily on credit risk. Doesn't cover operation risk methodologies, supervisory review, and market discipline
One size fits all Flexibility, menu of approaches, incentives for better
risk management
Broad structure More risk sensitivity
Uses arbitrary risk categories & risk weights Risk weights linked to external ratings assigned by ECAI or
IRB by bank
Three pillars of Basel II
Basel II
Pillar I
Minimum Capital Regs
Describes the calculation for
regulatory capital for credit,
operational and market risk
Pillar II
Supervisory Review
Bridges the gap between regulatory &
economic capital requirements.
Gives supervisors discretion to increase
regulatory capital requirements
Pillar III
Market Discipline
Allows market discipline to operate by
requiring lenders to publicly provide their
risk management activities, risk rating
processes and risk distributions.
Pillar 1 spells out the capital requirement of a bank in relation
to the credit risk in its portfolio, which is a significant change
from the “one size fits all” approach of Basel I. Pillar 1 allows
flexibility to banks and supervisors to choose from among the
Standardised Approach, Internal Ratings Based Approach,
and Securitisation Framework methods to calculate the
capital requirement for credit risk exposures. Besides, Pillar 1
sets out the allocation of capital for operational risk and
market risk in the trading books of banks.
Pillar 2 provides a tool to supervisors to keep checks on the
adequacy of capitalisation levels of banks and also
distinguish among banks on the basis of their risk
management systems and profile of capital. Pillar 2 allows
discretion to supervisors to (a) link capital to the risk profile of
a bank; (b) take appropriate remedial measures if required;
and (c) ask banks to maintain capital at a level higher than the
regulatory minimum.
Pillar 3 provides a framework for the improvement of banks’
disclosure standards for financial reporting, risk
management, asset quality, regulatory sanctions, and the
like. The pillar also indicates the remedial measures that
regulators can take to keep a check on erring banks and
maintain the integrity of the banking system. Further, Pillar 3
allows banks to maintain confidentiality over certain
information, disclosure of which could impact
competitiveness or breach legal contracts.
Basel II Accord
Pillar 1 Specifies new standards for minimum capital
requirements, along with the methodology for assigning
risk weights on the basis of credit risk and market risk;
Also specifies capital requirement for operational risk.
Pillar 2 Enlarges the role of banking supervisors and
gives them power to them to review the banks’ risk
management systems.
Pillar 3 Defines the standards and requirements for
higher disclosure by banks on capital adequacy, asset
quality and other risk management processes.
Capital Adequacy Requirements
Capital adequacy requirements on the banks not only
protect investors, but also safeguard them against possibility
of failure of a big-bank. It also strengthens market discipline.
In Basel I Capital adequacy is given as a single number that
was the ratio of a banks capital to its assets. The key
requirement was that tier-I capital was at least 8% of assets.
Basel-II Accord and Indian Banks
S. P. Srivastava Sanjay Kr. Patel
17
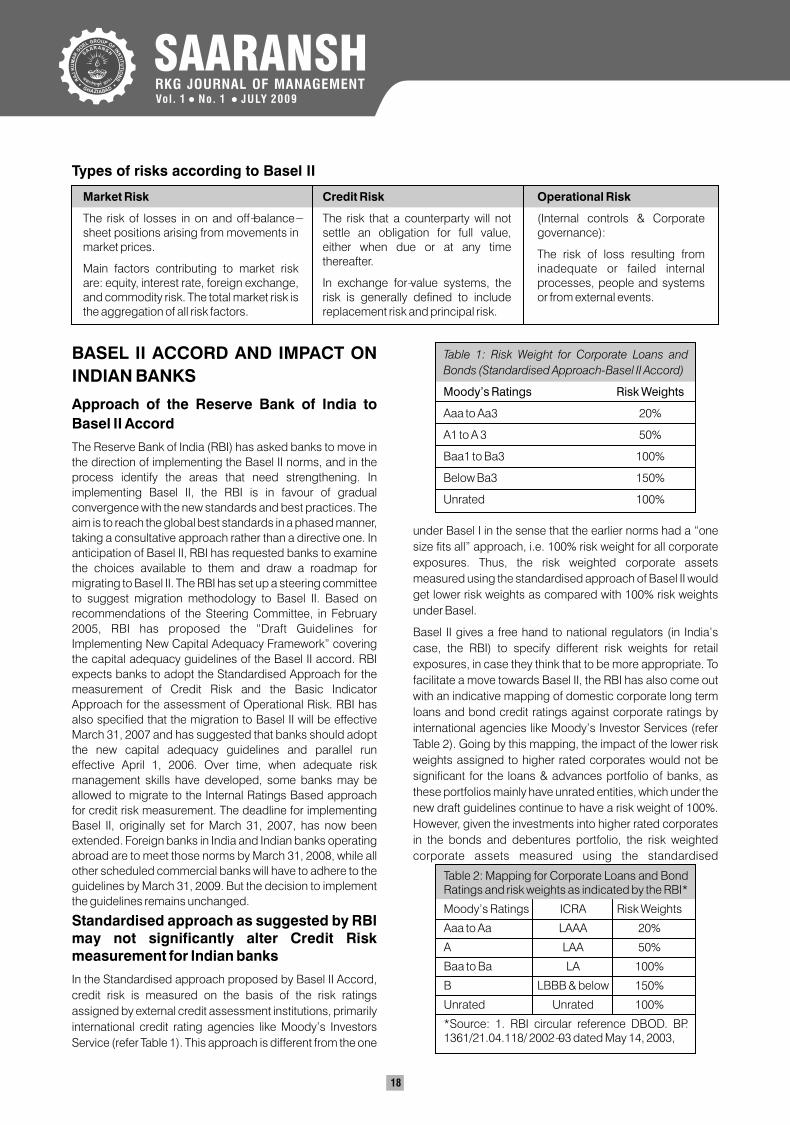
SAARANSHRKG JOURNAL OF MANAGEMENTVol . 1 No. 1 JULY 2009• •
18
Market Risk
The risk of losses in on and off-balance-sheet positions arising from movements in market prices.
Main factors contributing to market risk are: equity, interest rate, foreign exchange, and commodity risk. The total market risk is the aggregation of all risk factors.
Operational Risk
(Internal controls & Corporate governance):
The risk of loss resulting from inadequate or failed internal processes, people and systems or from external events.
Credit Risk
The risk that a counterparty will not settle an obligation for full value, either when due or at any time thereafter.
In exchange for-value systems, the risk is generally defined to include replacement risk and principal risk.
BASEL II ACCORD AND IMPACT ON
INDIAN BANKS
Approach of the Reserve Bank of India to
Basel II Accord
The Reserve Bank of India (RBI) has asked banks to move in
the direction of implementing the Basel II norms, and in the
process identify the areas that need strengthening. In
implementing Basel II, the RBI is in favour of gradual
convergence with the new standards and best practices. The
aim is to reach the global best standards in a phased manner,
taking a consultative approach rather than a directive one. In
anticipation of Basel II, RBI has requested banks to examine
the choices available to them and draw a roadmap for
migrating to Basel II. The RBI has set up a steering committee
to suggest migration methodology to Basel II. Based on
recommendations of the Steering Committee, in February
2005, RBI has proposed the “Draft Guidelines for
Implementing New Capital Adequacy Framework” covering
the capital adequacy guidelines of the Basel II accord. RBI
expects banks to adopt the Standardised Approach for the
measurement of Credit Risk and the Basic Indicator
Approach for the assessment of Operational Risk. RBI has
also specified that the migration to Basel II will be effective
March 31, 2007 and has suggested that banks should adopt
the new capital adequacy guidelines and parallel run
effective April 1, 2006. Over time, when adequate risk
management skills have developed, some banks may be
allowed to migrate to the Internal Ratings Based approach
for credit risk measurement. The deadline for implementing
Basel II, originally set for March 31, 2007, has now been
extended. Foreign banks in India and Indian banks operating
abroad are to meet those norms by March 31, 2008, while all
other scheduled commercial banks will have to adhere to the
guidelines by March 31, 2009. But the decision to implement
the guidelines remains unchanged.
Standardised approach as suggested by RBI may not significantly alter Credit Risk measurement for Indian banks
In the Standardised approach proposed by Basel II Accord,
credit risk is measured on the basis of the risk ratings
assigned by external credit assessment institutions, primarily
international credit rating agencies like Moody’s Investors
Service (refer Table 1). This approach is different from the one
under Basel I in the sense that the earlier norms had a “one
size fits all” approach, i.e. 100% risk weight for all corporate
exposures. Thus, the risk weighted corporate assets
measured using the standardised approach of Basel II would
get lower risk weights as compared with 100% risk weights
under Basel.
Basel II gives a free hand to national regulators (in India’s
case, the RBI) to specify different risk weights for retail
exposures, in case they think that to be more appropriate. To
facilitate a move towards Basel II, the RBI has also come out
with an indicative mapping of domestic corporate long term
loans and bond credit ratings against corporate ratings by
international agencies like Moody’s Investor Services (refer
Table 2). Going by this mapping, the impact of the lower risk
weights assigned to higher rated corporates would not be
significant for the loans & advances portfolio of banks, as
these portfolios mainly have unrated entities, which under the
new draft guidelines continue to have a risk weight of 100%.
However, given the investments into higher rated corporates
in the bonds and debentures portfolio, the risk weighted
corporate assets measured using the standardised
Table 1: Risk Weight for Corporate Loans and
Bonds (Standardised Approach-Basel II Accord)
Moody’s Ratings Risk Weights
Aaa to Aa3 20%
A1 to A 3 50%
Baa1 to Ba3 100%
Below Ba3 150%
Unrated 100%
Table 2: Mapping for Corporate Loans and Bond Ratings and risk weights as indicated by the RBI*
Moody’s Ratings ICRA Risk Weights
Aaa to Aa LAAA 20%
A LAA 50%
Baa to Ba LA 100%
B LBBB & below 150%
Unrated Unrated 100%
*Source: 1. RBI circular reference DBOD. BP. 1361/21.04.118/ 2002-03 dated May 14, 2003,
Types of risks according to Basel II
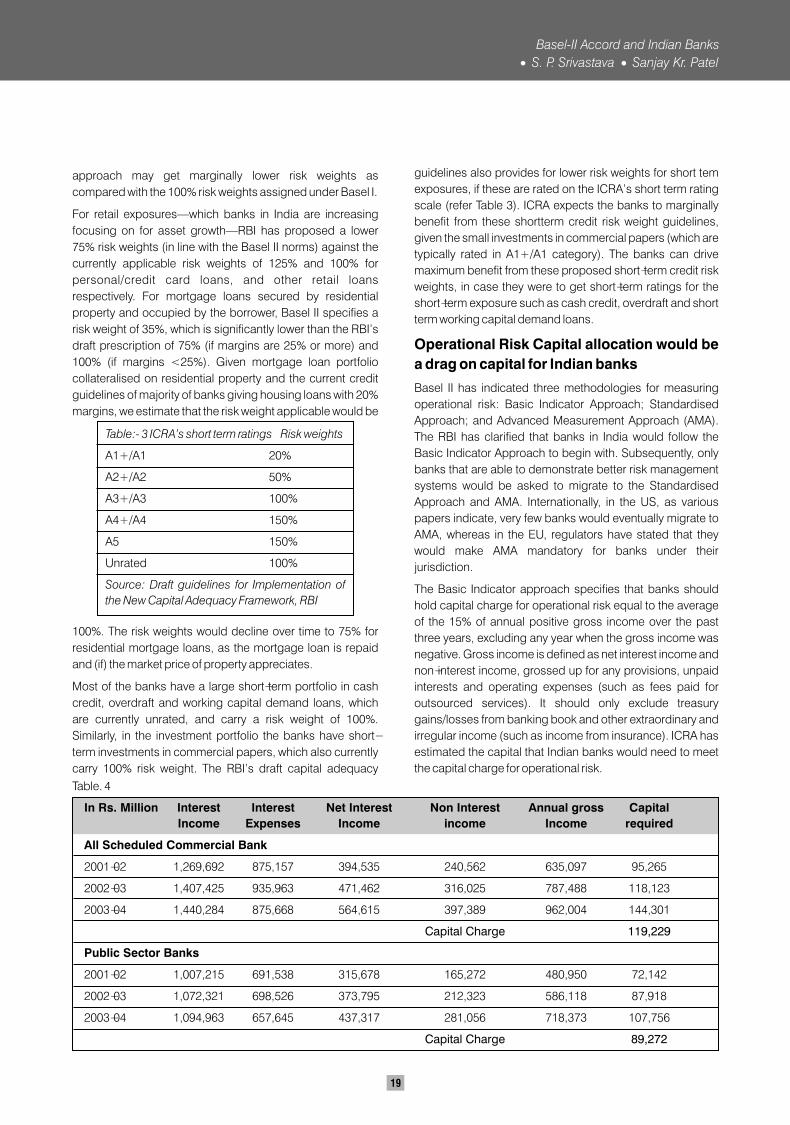
approach may get marginally lower risk weights as
compared with the 100% risk weights assigned under Basel I.
For retail exposures—which banks in India are increasing
focusing on for asset growth—RBI has proposed a lower
75% risk weights (in line with the Basel II norms) against the
currently applicable risk weights of 125% and 100% for
personal/credit card loans, and other retail loans
respectively. For mortgage loans secured by residential
property and occupied by the borrower, Basel II specifies a
risk weight of 35%, which is significantly lower than the RBI’s
draft prescription of 75% (if margins are 25% or more) and
100% (if margins <25%). Given mortgage loan portfolio
collateralised on residential property and the current credit
guidelines of majority of banks giving housing loans with 20%
margins, we estimate that the risk weight applicable would be
100%. The risk weights would decline over time to 75% for
residential mortgage loans, as the mortgage loan is repaid
and (if) the market price of property appreciates.
Most of the banks have a large short-term portfolio in cash
credit, overdraft and working capital demand loans, which
are currently unrated, and carry a risk weight of 100%.
Similarly, in the investment portfolio the banks have short-
term investments in commercial papers, which also currently
carry 100% risk weight. The RBI’s draft capital adequacy
guidelines also provides for lower risk weights for short tem
exposures, if these are rated on the ICRA’s short term rating
scale (refer Table 3). ICRA expects the banks to marginally
benefit from these shortterm credit risk weight guidelines,
given the small investments in commercial papers (which are
typically rated in A1+/A1 category). The banks can drive
maximum benefit from these proposed short-term credit risk
weights, in case they were to get short-term ratings for the
short-term exposure such as cash credit, overdraft and short
term working capital demand loans.
Operational Risk Capital allocation would be
a drag on capital for Indian banks
Basel II has indicated three methodologies for measuring
operational risk: Basic Indicator Approach; Standardised
Approach; and Advanced Measurement Approach (AMA).
The RBI has clarified that banks in India would follow the
Basic Indicator Approach to begin with. Subsequently, only
banks that are able to demonstrate better risk management
systems would be asked to migrate to the Standardised
Approach and AMA. Internationally, in the US, as various
papers indicate, very few banks would eventually migrate to
AMA, whereas in the EU, regulators have stated that they
would make AMA mandatory for banks under their
jurisdiction.
The Basic Indicator approach specifies that banks should
hold capital charge for operational risk equal to the average
of the 15% of annual positive gross income over the past
three years, excluding any year when the gross income was
negative. Gross income is defined as net interest income and
non-interest income, grossed up for any provisions, unpaid
interests and operating expenses (such as fees paid for
outsourced services). It should only exclude treasury
gains/losses from banking book and other extraordinary and
irregular income (such as income from insurance). ICRA has
estimated the capital that Indian banks would need to meet
the capital charge for operational risk.
Table:- 3 ICRA’s short term ratings Risk weights
A1+/A1 20%
A2+/A2 50%
A3+/A3 100%
A4+/A4 150%
A5 150%
Unrated 100%
Source: Draft guidelines for Implementation of
the New Capital Adequacy Framework, RBI
Table. 4
In Rs. Million Interest Interest Net Interest Non Interest Annual gross Capital
Income Expenses Income income Income required
All Scheduled Commercial Bank
2001-02 1,269,692 875,157 394,535 240,562 635,097 95,265
2002-03 1,407,425 935,963 471,462 316,025 787,488 118,123
2003-04 1,440,284 875,668 564,615 397,389 962,004 144,301
Capital Charge 119,229
Public Sector Banks
2001-02 1,007,215 691,538 315,678 165,272 480,950 72,142
2002-03 1,072,321 698,526 373,795 212,323 586,118 87,918
2003-04 1,094,963 657,645 437,317 281,056 718,373 107,756
Capital Charge 89,272
Basel-II Accord and Indian Banks
S. P. Srivastava Sanjay Kr. Patel
19
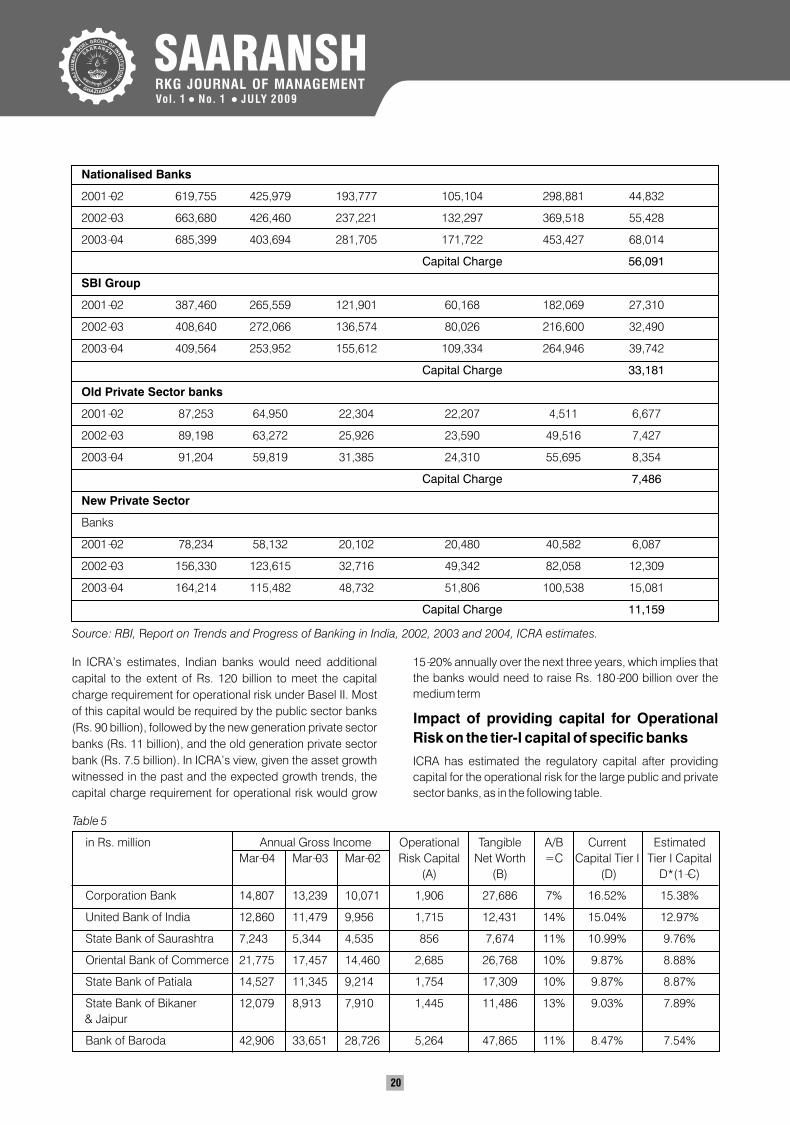
SAARANSHRKG JOURNAL OF MANAGEMENTVol . 1 No. 1 JULY 2009• •
20
Nationalised Banks
2001-02 619,755 425,979 193,777 105,104 298,881 44,832
2002-03 663,680 426,460 237,221 132,297 369,518 55,428
2003-04 685,399 403,694 281,705 171,722 453,427 68,014
Capital Charge 56,091
SBI Group
2001-02 387,460 265,559 121,901 60,168 182,069 27,310
2002-03 408,640 272,066 136,574 80,026 216,600 32,490
2003-04 409,564 253,952 155,612 109,334 264,946 39,742
Capital Charge 33,181
Old Private Sector banks
2001-02 87,253 64,950 22,304 22,207 4,511 6,677
2002-03 89,198 63,272 25,926 23,590 49,516 7,427
2003-04 91,204 59,819 31,385 24,310 55,695 8,354
Capital Charge 7,486
New Private Sector
Banks
2001-02 78,234 58,132 20,102 20,480 40,582 6,087
2002-03 156,330 123,615 32,716 49,342 82,058 12,309
2003-04 164,214 115,482 48,732 51,806 100,538 15,081
Capital Charge 11,159
In ICRA’s estimates, Indian banks would need additional
capital to the extent of Rs. 120 billion to meet the capital
charge requirement for operational risk under Basel II. Most
of this capital would be required by the public sector banks
(Rs. 90 billion), followed by the new generation private sector
banks (Rs. 11 billion), and the old generation private sector
bank (Rs. 7.5 billion). In ICRA’s view, given the asset growth
witnessed in the past and the expected growth trends, the
capital charge requirement for operational risk would grow
15-20% annually over the next three years, which implies that
the banks would need to raise Rs. 180-200 billion over the
medium term
Impact of providing capital for Operational
Risk on the tier-I capital of specific banks
ICRA has estimated the regulatory capital after providing
capital for the operational risk for the large public and private
sector banks, as in the following table.
Table 5
in Rs. million Annual Gross Income Operational Tangible A/B Current Estimated
Mar-04 Mar-03 Mar-02 Risk Capital Net Worth =C Capital Tier I Tier I Capital
(A) (B) (D) D*(1-C)
Corporation Bank 14,807 13,239 10,071 1,906 27,686 7% 16.52% 15.38%
United Bank of India 12,860 11,479 9,956 1,715 12,431 14% 15.04% 12.97%
State Bank of Saurashtra 7,243 5,344 4,535 856 7,674 11% 10.99% 9.76%
Oriental Bank of Commerce 21,775 17,457 14,460 2,685 26,768 10% 9.87% 8.88%
State Bank of Patiala 14,527 11,345 9,214 1,754 17,309 10% 9.87% 8.87%
State Bank of Bikaner 12,079 8,913 7,910 1,445 11,486 13% 9.03% 7.89%
& Jaipur
Bank of Baroda 42,906 33,651 28,726 5,264 47,865 11% 8.47% 7.54%
Source: RBI, Report on Trends and Progress of Banking in India, 2002, 2003 and 2004, ICRA estimates.
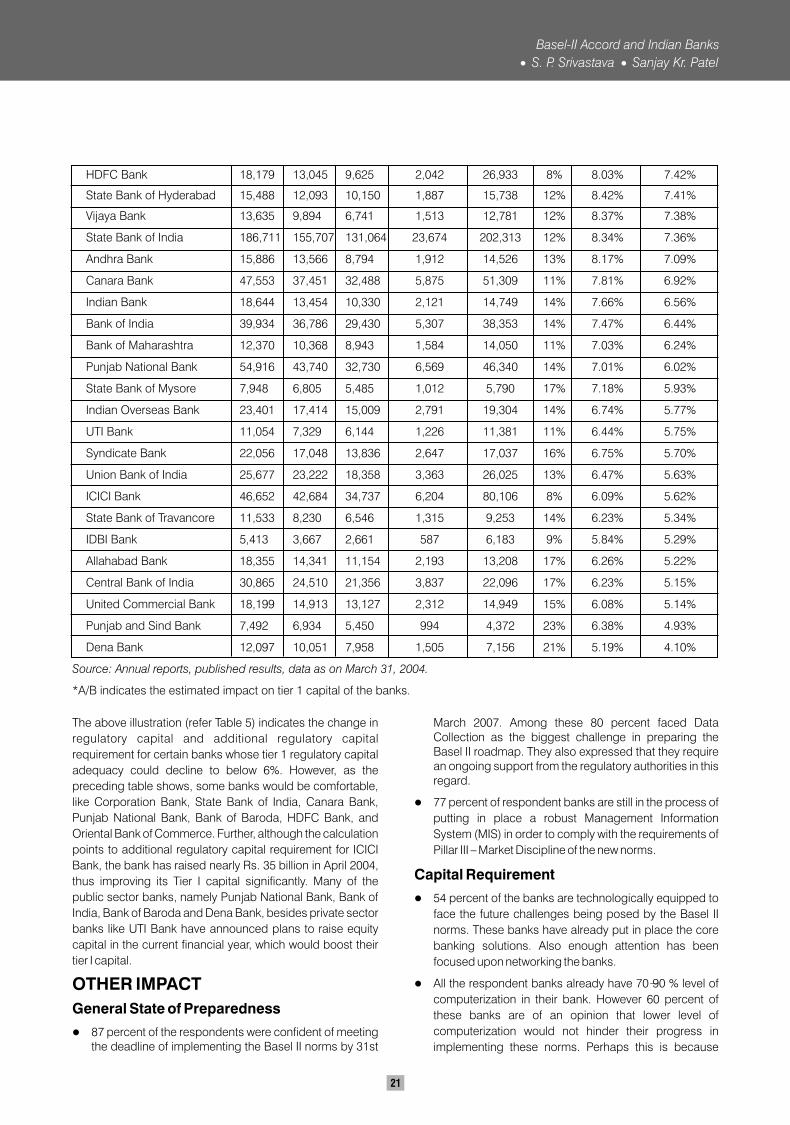
HDFC Bank 18,179 13,045 9,625 2,042 26,933 8% 8.03% 7.42%
State Bank of Hyderabad 15,488 12,093 10,150 1,887 15,738 12% 8.42% 7.41%
Vijaya Bank 13,635 9,894 6,741 1,513 12,781 12% 8.37% 7.38%
State Bank of India 186,711 155,707 131,064 23,674 202,313 12% 8.34% 7.36%
Andhra Bank 15,886 13,566 8,794 1,912 14,526 13% 8.17% 7.09%
Canara Bank 47,553 37,451 32,488 5,875 51,309 11% 7.81% 6.92%
Indian Bank 18,644 13,454 10,330 2,121 14,749 14% 7.66% 6.56%
Bank of India 39,934 36,786 29,430 5,307 38,353 14% 7.47% 6.44%
Bank of Maharashtra 12,370 10,368 8,943 1,584 14,050 11% 7.03% 6.24%
Punjab National Bank 54,916 43,740 32,730 6,569 46,340 14% 7.01% 6.02%
State Bank of Mysore 7,948 6,805 5,485 1,012 5,790 17% 7.18% 5.93%
Indian Overseas Bank 23,401 17,414 15,009 2,791 19,304 14% 6.74% 5.77%
UTI Bank 11,054 7,329 6,144 1,226 11,381 11% 6.44% 5.75%
Syndicate Bank 22,056 17,048 13,836 2,647 17,037 16% 6.75% 5.70%
Union Bank of India 25,677 23,222 18,358 3,363 26,025 13% 6.47% 5.63%
ICICI Bank 46,652 42,684 34,737 6,204 80,106 8% 6.09% 5.62%
State Bank of Travancore 11,533 8,230 6,546 1,315 9,253 14% 6.23% 5.34%
IDBI Bank 5,413 3,667 2,661 587 6,183 9% 5.84% 5.29%
Allahabad Bank 18,355 14,341 11,154 2,193 13,208 17% 6.26% 5.22%
Central Bank of India 30,865 24,510 21,356 3,837 22,096 17% 6.23% 5.15%
United Commercial Bank 18,199 14,913 13,127 2,312 14,949 15% 6.08% 5.14%
Punjab and Sind Bank 7,492 6,934 5,450 994 4,372 23% 6.38% 4.93%
Dena Bank 12,097 10,051 7,958 1,505 7,156 21% 5.19% 4.10%
Source: Annual reports, published results, data as on March 31, 2004.
*A/B indicates the estimated impact on tier 1 capital of the banks.
The above illustration (refer Table 5) indicates the change in
regulatory capital and additional regulatory capital
requirement for certain banks whose tier 1 regulatory capital
adequacy could decline to below 6%. However, as the
preceding table shows, some banks would be comfortable,
like Corporation Bank, State Bank of India, Canara Bank,
Punjab National Bank, Bank of Baroda, HDFC Bank, and
Oriental Bank of Commerce. Further, although the calculation
points to additional regulatory capital requirement for ICICI
Bank, the bank has raised nearly Rs. 35 billion in April 2004,
thus improving its Tier I capital significantly. Many of the
public sector banks, namely Punjab National Bank, Bank of
India, Bank of Baroda and Dena Bank, besides private sector
banks like UTI Bank have announced plans to raise equity
capital in the current financial year, which would boost their
tier I capital.
OTHER IMPACT
General State of Preparedness
87 percent of the respondents were confident of meeting the deadline of implementing the Basel II norms by 31st
l
March 2007. Among these 80 percent faced Data Collection as the biggest challenge in preparing the Basel II roadmap. They also expressed that they require an ongoing support from the regulatory authorities in this regard.
77 percent of respondent banks are still in the process of
putting in place a robust Management Information
System (MIS) in order to comply with the requirements of
Pillar III – Market Discipline of the new norms.
Capital Requirement
54 percent of the banks are technologically equipped to
face the future challenges being posed by the Basel II
norms. These banks have already put in place the core
banking solutions. Also enough attention has been
focused upon networking the banks.
All the respondent banks already have 70-90 % level of
computerization in their bank. However 60 percent of
these banks are of an opinion that lower level of
computerization would not hinder their progress in
implementing these norms. Perhaps this is because
l
l
l
Basel-II Accord and Indian Banks
S. P. Srivastava Sanjay Kr. Patel
21
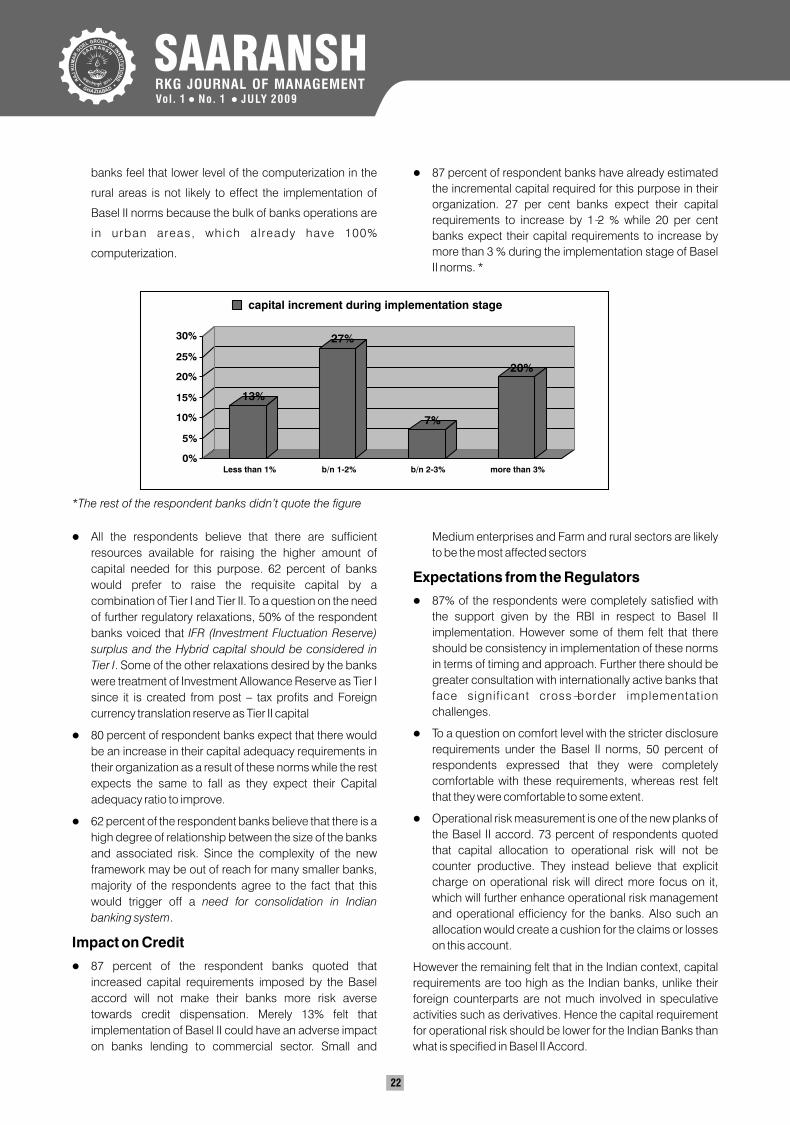
SAARANSHRKG JOURNAL OF MANAGEMENTVol . 1 No. 1 JULY 2009• •
22
banks feel that lower level of the computerization in the
rural areas is not likely to effect the implementation of
Basel II norms because the bulk of banks operations are
in urban areas, which already have 100%
computerization.
l87 percent of respondent banks have already estimated
the incremental capital required for this purpose in their
organization. 27 per cent banks expect their capital
requirements to increase by 1-2 % while 20 per cent
banks expect their capital requirements to increase by
more than 3 % during the implementation stage of Basel
II norms. *
l
l
l
l
All the respondents believe that there are sufficient
resources available for raising the higher amount of
capital needed for this purpose. 62 percent of banks
would prefer to raise the requisite capital by a
combination of Tier I and Tier II. To a question on the need
of further regulatory relaxations, 50% of the respondent
banks voiced that IFR (Investment Fluctuation Reserve)
surplus and the Hybrid capital should be considered in
Tier I. Some of the other relaxations desired by the banks
were treatment of Investment Allowance Reserve as Tier I
since it is created from post – tax profits and Foreign
currency translation reserve as Tier II capital
80 percent of respondent banks expect that there would
be an increase in their capital adequacy requirements in
their organization as a result of these norms while the rest
expects the same to fall as they expect their Capital
adequacy ratio to improve.
62 percent of the respondent banks believe that there is a
high degree of relationship between the size of the banks
and associated risk. Since the complexity of the new
framework may be out of reach for many smaller banks,
majority of the respondents agree to the fact that this
would trigger off a need for consolidation in Indian
banking system.
Impact on Credit
87 percent of the respondent banks quoted that
increased capital requirements imposed by the Basel
accord will not make their banks more risk averse
towards credit dispensation. Merely 13% felt that
implementation of Basel II could have an adverse impact
on banks lending to commercial sector. Small and
*The rest of the respondent banks didn’t quote the figure
Medium enterprises and Farm and rural sectors are likely
to be the most affected sectors
Expectations from the Regulators
87% of the respondents were completely satisfied with
the support given by the RBI in respect to Basel II
implementation. However some of them felt that there
should be consistency in implementation of these norms
in terms of timing and approach. Further there should be
greater consultation with internationally active banks that
face signif icant cross-border implementation
challenges.
To a question on comfort level with the stricter disclosure
requirements under the Basel II norms, 50 percent of
respondents expressed that they were completely
comfortable with these requirements, whereas rest felt
that they were comfortable to some extent.
Operational risk measurement is one of the new planks of
the Basel II accord. 73 percent of respondents quoted
that capital allocation to operational risk will not be
counter productive. They instead believe that explicit
charge on operational risk will direct more focus on it,
which will further enhance operational risk management
and operational efficiency for the banks. Also such an
allocation would create a cushion for the claims or losses
on this account.
However the remaining felt that in the Indian context, capital
requirements are too high as the Indian banks, unlike their
foreign counterparts are not much involved in speculative
activities such as derivatives. Hence the capital requirement
for operational risk should be lower for the Indian Banks than
what is specified in Basel II Accord.
l
l
l
13%
27%
7%
20%
0%
5%
10%
15%
20%
25%
30%
Less than 1% b/n 1-2% b/n 2-3% more than 3%
capital increment during implementation stage
CONCLUSION
Implementation of Basel II is likely to improve the risk
management systems of banks as the banks aim for
adequate capitalization to meet the underlying credit risks
and strengthen the overall financial system of the country. In
India, over the short term, commercial banks may need to
augment their regulatory capitalization levels in order to
comply with Basel II. However, over the long term, they would
derive benefits from improved operational and credit risk
management practices. Basel II, on the other hand, seeks to
extend the breath and precision of Basel I, bringing in factors
such as market and operational risk, market-based discipline
and surveillance, and regulatory mandates. As envisaged by
the Basel Committee, the accounting profession too, will
make a positive contribution in this respect to make Indian
banking system stronger.
REFERENCES
ICRA - www.icraratings.com
BASEL II ACCORD: IMPACT ON INDIAN BANKS BY
ICRA.
Radhakrishnan R PGDM, Class of '09 and Ravi Bhatia
PGDCM, Class of '09 “Adoption of Basel II Norms: Are
Indian Banks Ready?” Indian Institute of Management
Calcutta (IIM Calcutta).
The Hindu Business line feb 20,2007, “Basel II and India's
banking structure” by C. P. Chandrasekhar and Jayati
Ghosh.
www.ficci.com “Basel II – A Challenge and an
Opportunity to Indian Banking: Are we ready for it?
Survey Highlights” Survey on state of preparedness of
Commercial banks in respect to Basel II.
l
l
l
l
l
Basel-II Accord and Indian Banks
S. P. Srivastava Sanjay Kr. Patel
23
SAARANSHRKG JOURNAL OF MANAGEMENTVol . 1 No. 1 JULY 2009• •
increased annually due to their poor performance. Those
students who are graduating fail to perform better also.
Management students are supposed to make better
decisions and manage the organizational activities.
Moreover the feed back from the stakeholders of
management graduates reported that they are poor in ethics
and well as in practical knowledge and decision making
abilities. This study is therefore focused to identify the
success and failures attributes of management graduates
among the universities in Ethiopia. A study in this area is also
limited in Ethiopian context.
OBJECTIVES OF THE STUDY
The objectives of the study are as follows;
1. To identify the level of success attributes among the
management graduates.
2. To find out the most successful attribute of the students.
3. To determine whether there is any relation between
gender, family income, medium of instruction and the
region with the success factors.
4. To explore the type of success attribute that is more
consistent and reliable.
5. To find out the failure attributes of the management
students and to suggest suitable measures to enhance
its application.
RESEARCH METHODOLOGYThe area of study comprises the Universities in Ethiopia and
the population comprises management graduates. A
sample size of 224 students is collected and these are
selected at random. The samples are collected from four
universities- Arbaminch University, Awassa University,
24
SUCCESS AND FAILURE ATTRIBUTES OF MANAGEMENT STUDENTS: A CASE STUDY
IN THE UNIVERSITIES OF ETHIOPIAR. Renjith Kumar*
ABSTRACTThe objective of this study is to determine the success attributes of management graduates of universities. The population defined for this study is management students of universities in Ethiopia. A sample of 224 students is taken for the study. The success factors for the students are found to be pro-activity and their usage of support systems in their academic achievement. The failure factors can be attributed to lack of perseverance, emotional coping strategies and goal setting. The research reveals that male management students have more self awareness and goal setting than the female students. Whereas success attributes like pro-activity, perseverance, and emotional coping strategy are more for females than the male students. It is also found that there is a difference in the success attributes of the students based on their family income, medium of instruction and their home region.Keywords: Self awareness, Pro-activity, Perseverance
*Lecturer, Department of Management, Arbaminch University, Ethiopia
INTRODUCTION
There are various factors that influence the success and failures of students in their academic career. The success attributes have shown a greater influence on life success than academic achievement, gender, socioeconomic status, ethnicity, and even IQ. Research has statistically confirmed that successful persons are much more likely to have these attributes, and that their presence increases the chances for positive life outcomes. A teacher has to foster these attributes is a step towards helping their students reach their optimal potential and lead happy, satisfying, and rewarding lives. A brief summary of each success attribute are - Self-Awareness: (1) recognition of one’s strengths, weaknesses, special talents, and passions; (2) acceptance of the learning problems; (3) ability to identify the learning problem by oneself. Pro-activity: (1) being actively engaged in world; (2) belief in power to control own destiny; (3) ability to make and act upon decisions and take responsibility for outcomes (4) willingness to consult with others; (5) flexibility in considering options. Perseverance: (1) persistence in pursuing goals despite adversity; (2) ability to modify goals; (3) ability to learn from hardships; (4) recognition of the value of adversity. Goal-Setting: (1) ability to set specific and flexible goals; (2) development of strategies and understanding of the step-by-step process necessary to reach goals; (3) setting goals that are realistic and attainable. Presence and use of effective support systems: (1) presence of clear and realistic expectations; (2) willingness to actively seek the support of others. Emotional coping strategies: (1) development of effective means of reducing and coping with the stress, frustration, and emotional aspects of learning problems; (2) maintenance of a positive and hopeful outlook (Higgins et al 2004).
STATEMENT OF THE PROBLEMThe academic success of University students especially for
management students has been low over the years. It is also
observed by the researcher that the drop out of students has
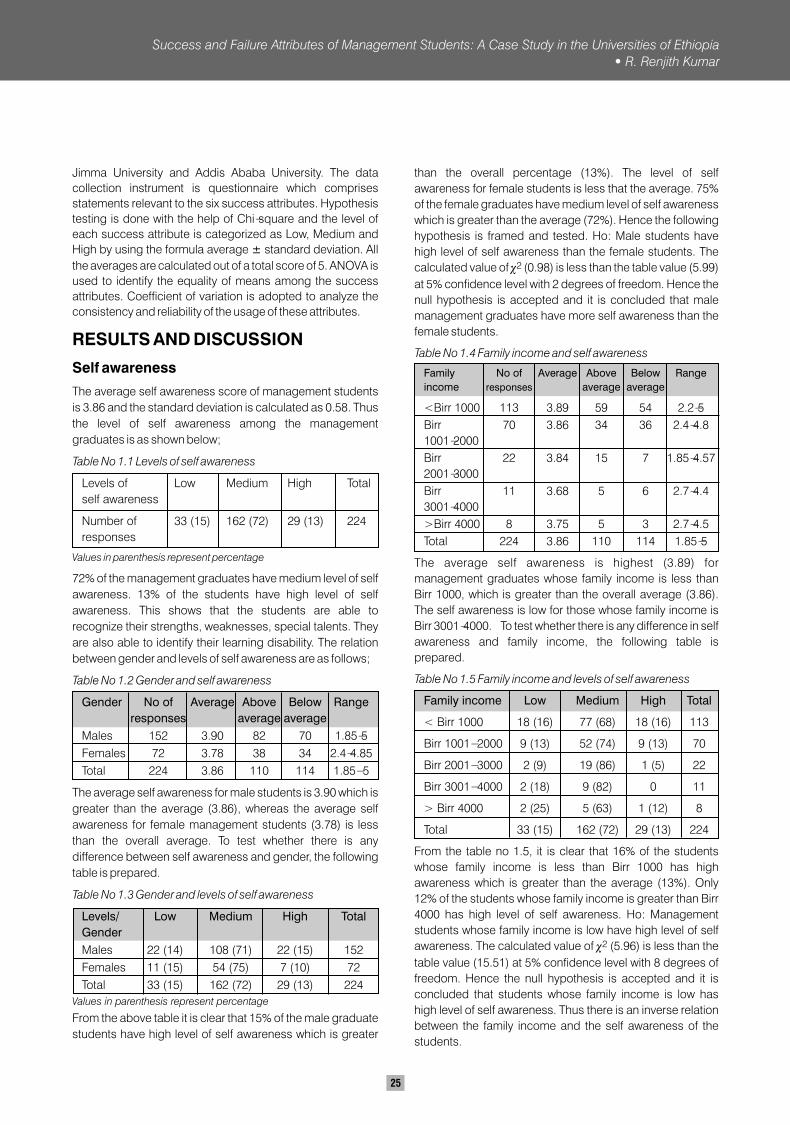
23
Jimma University and Addis Ababa University. The data
collection instrument is questionnaire which comprises
statements relevant to the six success attributes. Hypothesis
testing is done with the help of Chi-square and the level of
each success attribute is categorized as Low, Medium and
High by using the formula average ± standard deviation. All
the averages are calculated out of a total score of 5. ANOVA is
used to identify the equality of means among the success
attributes. Coefficient of variation is adopted to analyze the
consistency and reliability of the usage of these attributes.
RESULTS AND DISCUSSION
Self awareness
The average self awareness score of management students
is 3.86 and the standard deviation is calculated as 0.58. Thus
the level of self awareness among the management
graduates is as shown below;
Table No 1.1 Levels of self awareness
Levels of Low Medium High Total
self awareness
Number of 33 (15) 162 (72) 29 (13) 224
responses
Values in parenthesis represent percentage
72% of the management graduates have medium level of self
awareness. 13% of the students have high level of self
awareness. This shows that the students are able to
recognize their strengths, weaknesses, special talents. They
are also able to identify their learning disability. The relation
between gender and levels of self awareness are as follows;
Table No 1.2 Gender and self awareness
Gender No of Average Above Below Range
responses average average
Males 152 3.90 82 70 1.85-5
Females 72 3.78 38 34 2.4-4.85
Total 224 3.86 110 114 1.85- 5
The average self awareness for male students is 3.90 which is
greater than the average (3.86), whereas the average self
awareness for female management students (3.78) is less
than the overall average. To test whether there is any
difference between self awareness and gender, the following
table is prepared.
Table No 1.3 Gender and levels of self awareness
Levels/ Low Medium High Total
Gender
Males 22 (14) 108 (71) 22 (15) 152
Females 11 (15) 54 (75) 7 (10) 72
Total 33 (15) 162 (72) 29 (13) 224
Values in parenthesis represent percentage
From the above table it is clear that 15% of the male graduate
students have high level of self awareness which is greater
than the overall percentage (13%). The level of self
awareness for female students is less that the average. 75%
of the female graduates have medium level of self awareness
which is greater than the average (72%). Hence the following
hypothesis is framed and tested. Ho: Male students have
high level of self awareness than the female students. The 2calculated value of c (0.98) is less than the table value (5.99)
at 5% confidence level with 2 degrees of freedom. Hence the
null hypothesis is accepted and it is concluded that male
management graduates have more self awareness than the
female students.
Table No 1.4 Family income and self awareness
Family No of Average Above Below Range
income responses average average
<Birr 1000 113 3.89 59 54 2.2-5
Birr 70 3.86 34 36 2.4-4.8
1001-2000
Birr 22 3.84 15 7 1.85-4.57
2001-3000
Birr 11 3.68 5 6 2.7-4.4
3001-4000
>Birr 4000 8 3.75 5 3 2.7-4.5
Total 224 3.86 110 114 1.85-5
The average self awareness is highest (3.89) for
management graduates whose family income is less than
Birr 1000, which is greater than the overall average (3.86).
The self awareness is low for those whose family income is
Birr 3001-4000. To test whether there is any difference in self
awareness and family income, the following table is
prepared.
Table No 1.5 Family income and levels of self awareness
Family income Low Medium High Total
< Birr 1000 18 (16) 77 (68) 18 (16) 113
Birr 1001- 2000 9 (13) 52 (74) 9 (13) 70
Birr 2001- 3000 2 (9) 19 (86) 1 (5) 22
Birr 3001- 4000 2 (18) 9 (82) 0 11
> Birr 4000 2 (25) 5 (63) 1 (12) 8
Total 33 (15) 162 (72) 29 (13) 224
From the table no 1.5, it is clear that 16% of the students
whose family income is less than Birr 1000 has high
awareness which is greater than the average (13%). Only
12% of the students whose family income is greater than Birr
4000 has high level of self awareness. Ho: Management
students whose family income is low have high level of self 2awareness. The calculated value of c (5.96) is less than the
table value (15.51) at 5% confidence level with 8 degrees of
freedom. Hence the null hypothesis is accepted and it is
concluded that students whose family income is low has
high level of self awareness. Thus there is an inverse relation
between the family income and the self awareness of the
students.
Success and Failure Attributes of Management Students: A Case Study in the Universities of Ethiopia
R. Renjith Kumar
25
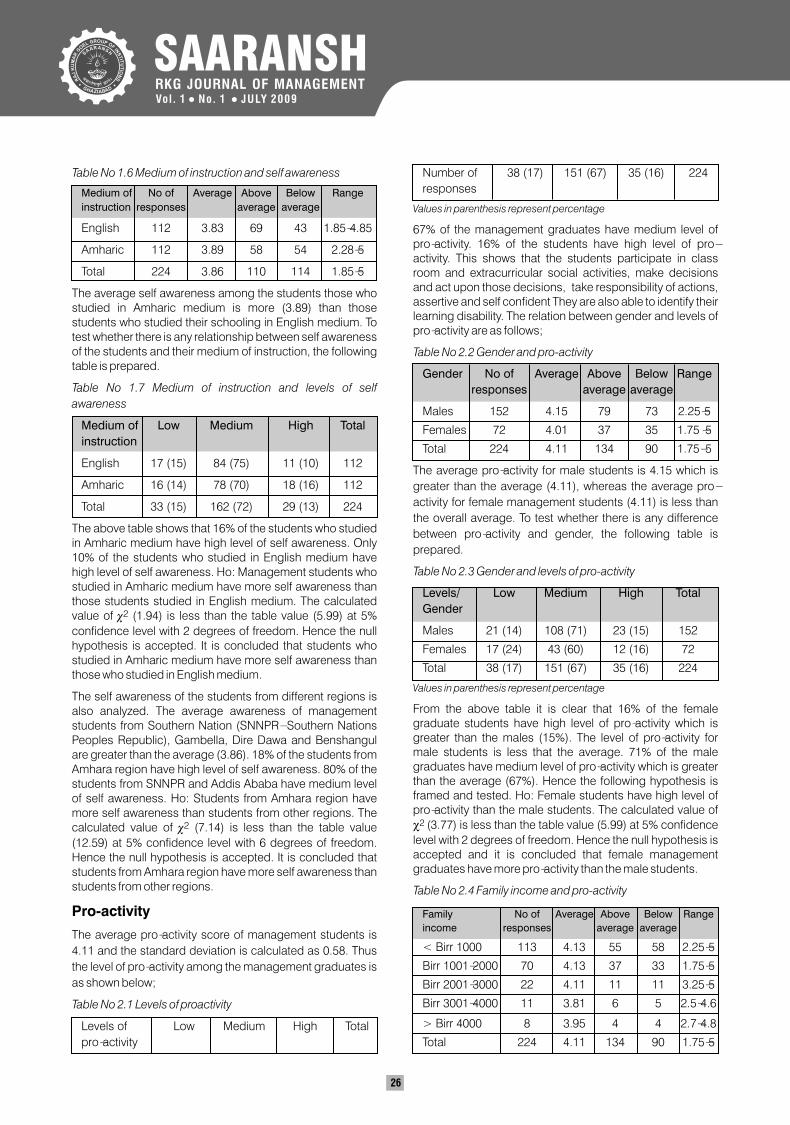
SAARANSHRKG JOURNAL OF MANAGEMENTVol . 1 No. 1 JULY 2009• •
26
Table No 1.6 Medium of instruction and self awareness
Medium of No of Average Above Below Range
instruction responses average average
English 112 3.83 69 43 1.85-4.85
Amharic 112 3.89 58 54 2.28-5
Total 224 3.86 110 114 1.85-5
The average self awareness among the students those who studied in Amharic medium is more (3.89) than those students who studied their schooling in English medium. To test whether there is any relationship between self awareness of the students and their medium of instruction, the following table is prepared.
Table No 1.7 Medium of instruction and levels of self
awareness
Medium of Low Medium High Total
instruction
English 17 (15) 84 (75) 11 (10) 112
Amharic 16 (14) 78 (70) 18 (16) 112
Total 33 (15) 162 (72) 29 (13) 224
The above table shows that 16% of the students who studied in Amharic medium have high level of self awareness. Only 10% of the students who studied in English medium have high level of self awareness. Ho: Management students who studied in Amharic medium have more self awareness than those students studied in English medium. The calculated
2value of c (1.94) is less than the table value (5.99) at 5%
confidence level with 2 degrees of freedom. Hence the null hypothesis is accepted. It is concluded that students who studied in Amharic medium have more self awareness than those who studied in English medium.
The self awareness of the students from different regions is also analyzed. The average awareness of management students from Southern Nation (SNNPR- Southern Nations Peoples Republic), Gambella, Dire Dawa and Benshangul are greater than the average (3.86). 18% of the students from Amhara region have high level of self awareness. 80% of the students from SNNPR and Addis Ababa have medium level of self awareness. Ho: Students from Amhara region have more self awareness than students from other regions. The
2calculated value of c (7.14) is less than the table value
(12.59) at 5% confidence level with 6 degrees of freedom. Hence the null hypothesis is accepted. It is concluded that students from Amhara region have more self awareness than students from other regions.
Pro-activity
The average pro-activity score of management students is
4.11 and the standard deviation is calculated as 0.58. Thus
the level of pro-activity among the management graduates is
as shown below;
Table No 2.1 Levels of proactivity
Levels of Low Medium High Total
pro-activity
Number of 38 (17) 151 (67) 35 (16) 224
responses
Values in parenthesis represent percentage
67% of the management graduates have medium level of pro-activity. 16% of the students have high level of pro-activity. This shows that the students participate in class room and extracurricular social activities, make decisions and act upon those decisions, take responsibility of actions, assertive and self confident They are also able to identify their learning disability. The relation between gender and levels of pro-activity are as follows;
Table No 2.2 Gender and pro-activity
Gender No of Average Above Below Range
responses average average
Males 152 4.15 79 73 2.25-5
Females 72 4.01 37 35 1.75 -5
Total 224 4.11 134 90 1.75- 5
The average pro-activity for male students is 4.15 which is
greater than the average (4.11), whereas the average pro-
activity for female management students (4.11) is less than
the overall average. To test whether there is any difference
between pro-activity and gender, the following table is
prepared.
Table No 2.3 Gender and levels of pro-activity
Levels/ Low Medium High Total
Gender
Males 21 (14) 108 (71) 23 (15) 152
Females 17 (24) 43 (60) 12 (16) 72
Total 38 (17) 151 (67) 35 (16) 224
Values in parenthesis represent percentage
From the above table it is clear that 16% of the female graduate students have high level of pro-activity which is greater than the males (15%). The level of pro-activity for male students is less that the average. 71% of the male graduates have medium level of pro-activity which is greater than the average (67%). Hence the following hypothesis is framed and tested. Ho: Female students have high level of pro-activity than the male students. The calculated value of
2 c(3.77) is less than the table value (5.99) at 5% confidence
level with 2 degrees of freedom. Hence the null hypothesis is accepted and it is concluded that female management graduates have more pro-activity than the male students.
Table No 2.4 Family income and pro-activity
Family No of Average Above Below Range
income responses average average
< Birr 1000 113 4.13 55 58 2.25-5
Birr 1001-2000 70 4.13 37 33 1.75-5
Birr 2001-3000 22 4.11 11 11 3.25-5
Birr 3001-4000 11 3.81 6 5 2.5-4.6
> Birr 4000 8 3.95 4 4 2.7-4.8
Total 224 4.11 134 90 1.75-5
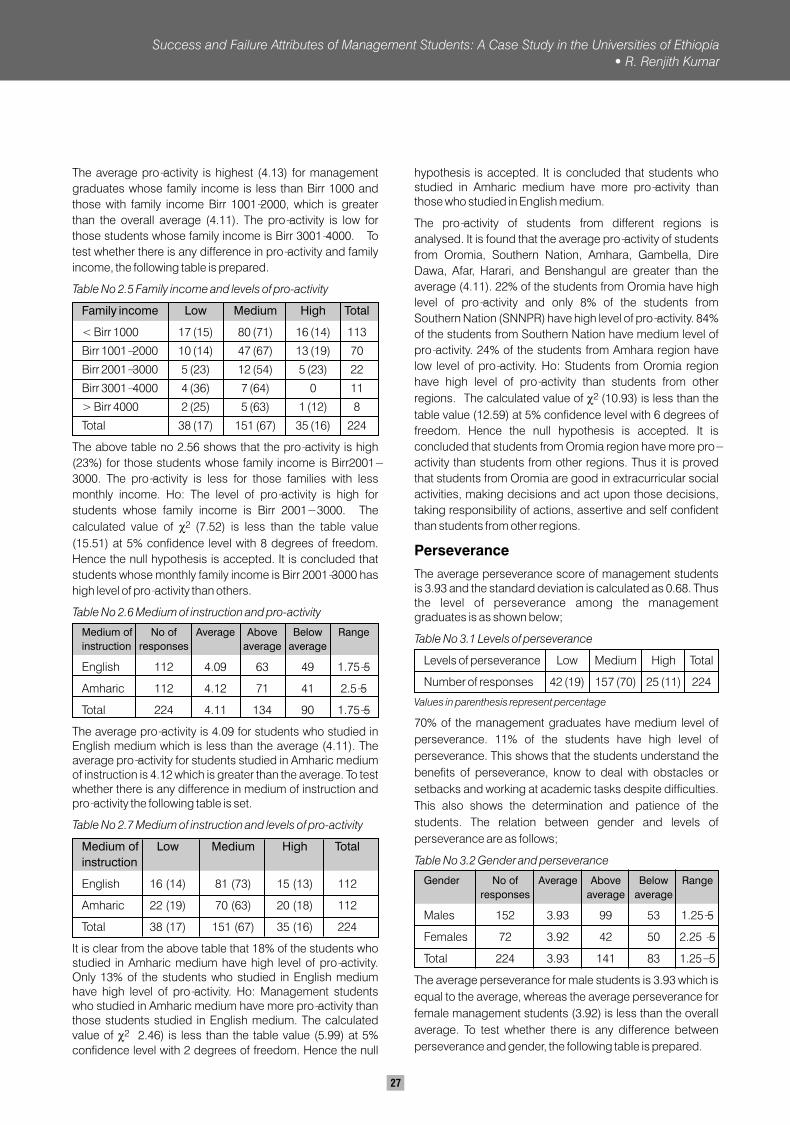
The average pro-activity is highest (4.13) for management
graduates whose family income is less than Birr 1000 and
those with family income Birr 1001-2000, which is greater
than the overall average (4.11). The pro-activity is low for
those students whose family income is Birr 3001-4000. To
test whether there is any difference in pro-activity and family
income, the following table is prepared.
Table No 2.5 Family income and levels of pro-activity
Family income Low Medium High Total
< Birr 1000 17 (15) 80 (71) 16 (14) 113
Birr 1001- 2000 10 (14) 47 (67) 13 (19) 70
Birr 2001- 3000 5 (23) 12 (54) 5 (23) 22
Birr 3001- 4000 4 (36) 7 (64) 0 11
> Birr 4000 2 (25) 5 (63) 1 (12) 8
Total 38 (17) 151 (67) 35 (16) 224
The above table no 2.56 shows that the pro-activity is high
(23%) for those students whose family income is Birr2001-
3000. The pro-activity is less for those families with less
monthly income. Ho: The level of pro-activity is high for
students whose family income is Birr 2001- 3000. The 2 calculated value of c(7.52) is less than the table value
(15.51) at 5% confidence level with 8 degrees of freedom.
Hence the null hypothesis is accepted. It is concluded that
students whose monthly family income is Birr 2001-3000 has
high level of pro-activity than others.
Table No 2.6 Medium of instruction and pro-activity
Medium of No of Average Above Below Range
instruction responses average average
English 112 4.09 63 49 1.75-5
Amharic 112 4.12 71 41 2.5-5
Total 224 4.11 134 90 1.75-5
The average pro-activity is 4.09 for students who studied in English medium which is less than the average (4.11). The average pro-activity for students studied in Amharic medium of instruction is 4.12 which is greater than the average. To test whether there is any difference in medium of instruction and pro-activity the following table is set.
Table No 2.7 Medium of instruction and levels of pro-activity
Medium of Low Medium High Total
instruction
English 16 (14) 81 (73) 15 (13) 112
Amharic 22 (19) 70 (63) 20 (18) 112
Total 38 (17) 151 (67) 35 (16) 224
It is clear from the above table that 18% of the students who studied in Amharic medium have high level of pro-activity. Only 13% of the students who studied in English medium have high level of pro-activity. Ho: Management students who studied in Amharic medium have more pro-activity than those students studied in English medium. The calculated
2 value of c2.46) is less than the table value (5.99) at 5%
confidence level with 2 degrees of freedom. Hence the null
hypothesis is accepted. It is concluded that students who studied in Amharic medium have more pro-activity than those who studied in English medium.
The pro-activity of students from different regions is
analysed. It is found that the average pro-activity of students
from Oromia, Southern Nation, Amhara, Gambella, Dire
Dawa, Afar, Harari, and Benshangul are greater than the
average (4.11). 22% of the students from Oromia have high
level of pro-activity and only 8% of the students from
Southern Nation (SNNPR) have high level of pro-activity. 84%
of the students from Southern Nation have medium level of
pro-activity. 24% of the students from Amhara region have
low level of pro-activity. Ho: Students from Oromia region
have high level of pro-activity than students from other 2 regions. The calculated value of c(10.93) is less than the
table value (12.59) at 5% confidence level with 6 degrees of
freedom. Hence the null hypothesis is accepted. It is
concluded that students from Oromia region have more pro-
activity than students from other regions. Thus it is proved
that students from Oromia are good in extracurricular social
activities, making decisions and act upon those decisions,
taking responsibility of actions, assertive and self confident
than students from other regions.
Perseverance
The average perseverance score of management students is 3.93 and the standard deviation is calculated as 0.68. Thus the level of perseverance among the management graduates is as shown below;
Table No 3.1 Levels of perseverance
Levels of perseverance Low Medium High Total
Number of responses 42 (19) 157 (70) 25 (11) 224
Values in parenthesis represent percentage
70% of the management graduates have medium level of
perseverance. 11% of the students have high level of
perseverance. This shows that the students understand the
benefits of perseverance, know to deal with obstacles or
setbacks and working at academic tasks despite difficulties.
This also shows the determination and patience of the
students. The relation between gender and levels of
perseverance are as follows;
Table No 3.2 Gender and perseverance
Gender No of Average Above Below Range
responses average average
Males 152 3.93 99 53 1.25-5
Females 72 3.92 42 50 2.25 -5
Total 224 3.93 141 83 1.25- 5
The average perseverance for male students is 3.93 which is
equal to the average, whereas the average perseverance for
female management students (3.92) is less than the overall
average. To test whether there is any difference between
perseverance and gender, the following table is prepared.
Success and Failure Attributes of Management Students: A Case Study in the Universities of Ethiopia
R. Renjith Kumar
27
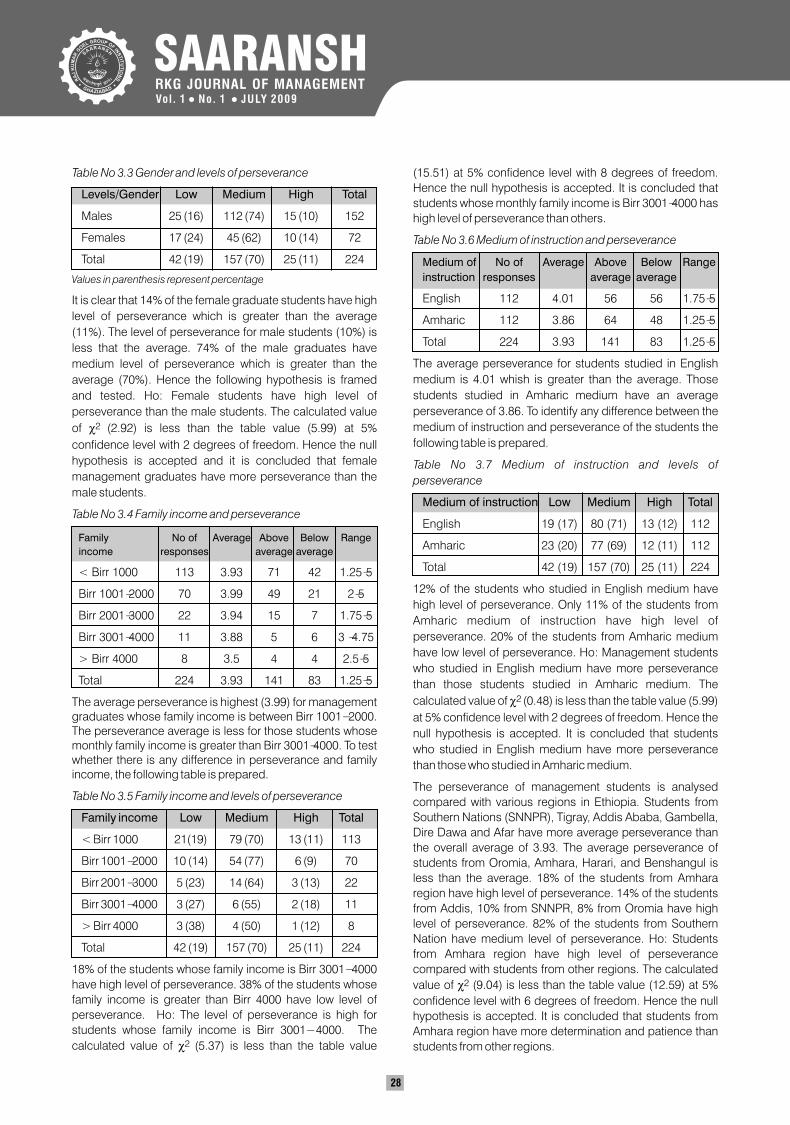
28
Table No 3.3 Gender and levels of perseverance
Levels/Gender Low Medium High Total
Males 25 (16) 112 (74) 15 (10) 152
Females 17 (24) 45 (62) 10 (14) 72
Total 42 (19) 157 (70) 25 (11) 224
Values in parenthesis represent percentage
It is clear that 14% of the female graduate students have high
level of perseverance which is greater than the average
(11%). The level of perseverance for male students (10%) is
less that the average. 74% of the male graduates have
medium level of perseverance which is greater than the
average (70%). Hence the following hypothesis is framed
and tested. Ho: Female students have high level of
perseverance than the male students. The calculated value 2 of c(2.92) is less than the table value (5.99) at 5%
confidence level with 2 degrees of freedom. Hence the null
hypothesis is accepted and it is concluded that female
management graduates have more perseverance than the
male students.
Table No 3.4 Family income and perseverance
Family No of Average Above Below Range
income responses average average
< Birr 1000 113 3.93 71 42 1.25-5
Birr 1001-2000 70 3.99 49 21 2-5
Birr 2001-3000 22 3.94 15 7 1.75-5
Birr 3001-4000 11 3.88 5 6 3 -4.75
> Birr 4000 8 3.5 4 4 2.5-5
Total 224 3.93 141 83 1.25-5
The average perseverance is highest (3.99) for management graduates whose family income is between Birr 1001- 2000. The perseverance average is less for those students whose monthly family income is greater than Birr 3001-4000. To test whether there is any difference in perseverance and family income, the following table is prepared.
Table No 3.5 Family income and levels of perseverance
Family income Low Medium High Total
< Birr 1000 21(19) 79 (70) 13 (11) 113
Birr 1001- 2000 10 (14) 54 (77) 6 (9) 70
Birr 2001- 3000 5 (23) 14 (64) 3 (13) 22
Birr 3001- 4000 3 (27) 6 (55) 2 (18) 11
> Birr 4000 3 (38) 4 (50) 1 (12) 8
Total 42 (19) 157 (70) 25 (11) 224
18% of the students whose family income is Birr 3001- 4000
have high level of perseverance. 38% of the students whose
family income is greater than Birr 4000 have low level of
perseverance. Ho: The level of perseverance is high for
students whose family income is Birr 3001- 4000. The 2 calculated value of c(5.37) is less than the table value
(15.51) at 5% confidence level with 8 degrees of freedom.
Hence the null hypothesis is accepted. It is concluded that
students whose monthly family income is Birr 3001-4000 has
high level of perseverance than others.
Table No 3.6 Medium of instruction and perseverance
Medium of No of Average Above Below Range
instruction responses average average
English 112 4.01 56 56 1.75-5
Amharic 112 3.86 64 48 1.25-5
Total 224 3.93 141 83 1.25-5
The average perseverance for students studied in English
medium is 4.01 whish is greater than the average. Those
students studied in Amharic medium have an average
perseverance of 3.86. To identify any difference between the
medium of instruction and perseverance of the students the
following table is prepared.
Table No 3.7 Medium of instruction and levels of
perseverance
Medium of instruction Low Medium High Total
English 19 (17) 80 (71) 13 (12) 112
Amharic 23 (20) 77 (69) 12 (11) 112
Total 42 (19) 157 (70) 25 (11) 224
12% of the students who studied in English medium have
high level of perseverance. Only 11% of the students from
Amharic medium of instruction have high level of
perseverance. 20% of the students from Amharic medium
have low level of perseverance. Ho: Management students
who studied in English medium have more perseverance
than those students studied in Amharic medium. The 2 calculated value of c(0.48) is less than the table value (5.99)
at 5% confidence level with 2 degrees of freedom. Hence the
null hypothesis is accepted. It is concluded that students
who studied in English medium have more perseverance
than those who studied in Amharic medium.
The perseverance of management students is analysed
compared with various regions in Ethiopia. Students from
Southern Nations (SNNPR), Tigray, Addis Ababa, Gambella,
Dire Dawa and Afar have more average perseverance than
the overall average of 3.93. The average perseverance of
students from Oromia, Amhara, Harari, and Benshangul is
less than the average. 18% of the students from Amhara
region have high level of perseverance. 14% of the students
from Addis, 10% from SNNPR, 8% from Oromia have high
level of perseverance. 82% of the students from Southern
Nation have medium level of perseverance. Ho: Students
from Amhara region have high level of perseverance
compared with students from other regions. The calculated 2value of c (9.04) is less than the table value (12.59) at 5%
confidence level with 6 degrees of freedom. Hence the null
hypothesis is accepted. It is concluded that students from
Amhara region have more determination and patience than
students from other regions.
SAARANSHRKG JOURNAL OF MANAGEMENTVol . 1 No. 1 JULY 2009• •
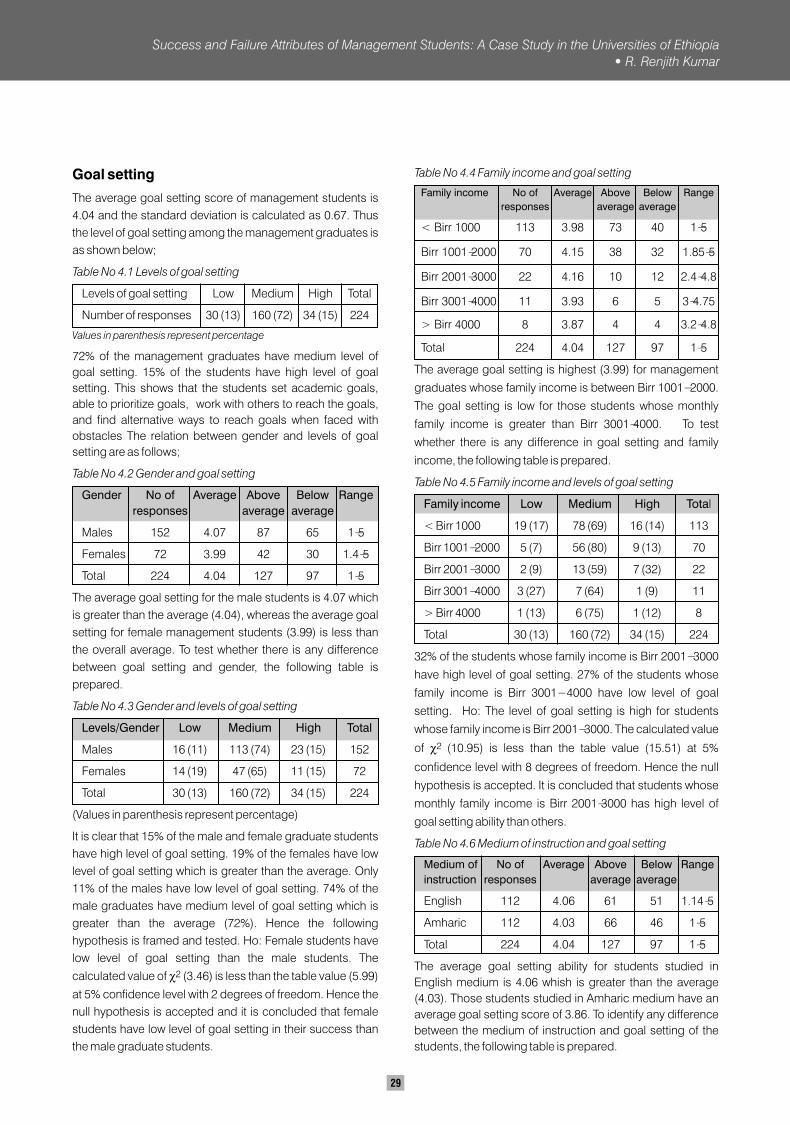
Goal setting
The average goal setting score of management students is
4.04 and the standard deviation is calculated as 0.67. Thus
the level of goal setting among the management graduates is
as shown below;
Table No 4.1 Levels of goal setting
Levels of goal setting Low Medium High Total
Number of responses 30 (13) 160 (72) 34 (15) 224
Values in parenthesis represent percentage
72% of the management graduates have medium level of
goal setting. 15% of the students have high level of goal
setting. This shows that the students set academic goals,
able to prioritize goals, work with others to reach the goals,
and find alternative ways to reach goals when faced with
obstacles The relation between gender and levels of goal
setting are as follows;
Table No 4.2 Gender and goal setting
Gender No of Average Above Below Range
responses average average
Males 152 4.07 87 65 1-5
Females 72 3.99 42 30 1.4-5
Total 224 4.04 127 97 1-5
The average goal setting for the male students is 4.07 which
is greater than the average (4.04), whereas the average goal
setting for female management students (3.99) is less than
the overall average. To test whether there is any difference
between goal setting and gender, the following table is
prepared.
Table No 4.3 Gender and levels of goal setting
Levels/Gender Low Medium High Total
Males 16 (11) 113 (74) 23 (15) 152
Females 14 (19) 47 (65) 11 (15) 72
Total 30 (13) 160 (72) 34 (15) 224
(Values in parenthesis represent percentage)
It is clear that 15% of the male and female graduate students
have high level of goal setting. 19% of the females have low
level of goal setting which is greater than the average. Only
11% of the males have low level of goal setting. 74% of the
male graduates have medium level of goal setting which is
greater than the average (72%). Hence the following
hypothesis is framed and tested. Ho: Female students have
low level of goal setting than the male students. The
2calculated value of c (3.46) is less than the table value (5.99)
at 5% confidence level with 2 degrees of freedom. Hence the
null hypothesis is accepted and it is concluded that female
students have low level of goal setting in their success than
the male graduate students.
Table No 4.4 Family income and goal setting
Family income No of Average Above Below Range
responses average average
< Birr 1000 113 3.98 73 40 1-5
Birr 1001-2000 70 4.15 38 32 1.85-5
Birr 2001-3000 22 4.16 10 12 2.4-4.8
Birr 3001-4000 11 3.93 6 5 3-4.75
> Birr 4000 8 3.87 4 4 3.2-4.8
Total 224 4.04 127 97 1-5
The average goal setting is highest (3.99) for management
graduates whose family income is between Birr 1001- 2000.
The goal setting is low for those students whose monthly
family income is greater than Birr 3001-4000. To test
whether there is any difference in goal setting and family
income, the following table is prepared.
Table No 4.5 Family income and levels of goal setting
Family income Low Medium High Total
< Birr 1000 19 (17) 78 (69) 16 (14) 113
Birr 1001- 2000 5 (7) 56 (80) 9 (13) 70
Birr 2001- 3000 2 (9) 13 (59) 7 (32) 22
Birr 3001- 4000 3 (27) 7 (64) 1 (9) 11
> Birr 4000 1 (13) 6 (75) 1 (12) 8
Total 30 (13) 160 (72) 34 (15) 224
32% of the students whose family income is Birr 2001- 3000
have high level of goal setting. 27% of the students whose
family income is Birr 3001- 4000 have low level of goal
setting. Ho: The level of goal setting is high for students
whose family income is Birr 2001- 3000. The calculated value
2 of c(10.95) is less than the table value (15.51) at 5%
confidence level with 8 degrees of freedom. Hence the null
hypothesis is accepted. It is concluded that students whose
monthly family income is Birr 2001-3000 has high level of
goal setting ability than others.
Table No 4.6 Medium of instruction and goal setting
Medium of No of Average Above Below Range
instruction responses average average
English 112 4.06 61 51 1.14-5
Amharic 112 4.03 66 46 1-5
Total 224 4.04 127 97 1-5
The average goal setting ability for students studied in
English medium is 4.06 whish is greater than the average
(4.03). Those students studied in Amharic medium have an
average goal setting score of 3.86. To identify any difference
between the medium of instruction and goal setting of the
students, the following table is prepared.
Success and Failure Attributes of Management Students: A Case Study in the Universities of Ethiopia
R. Renjith Kumar
29
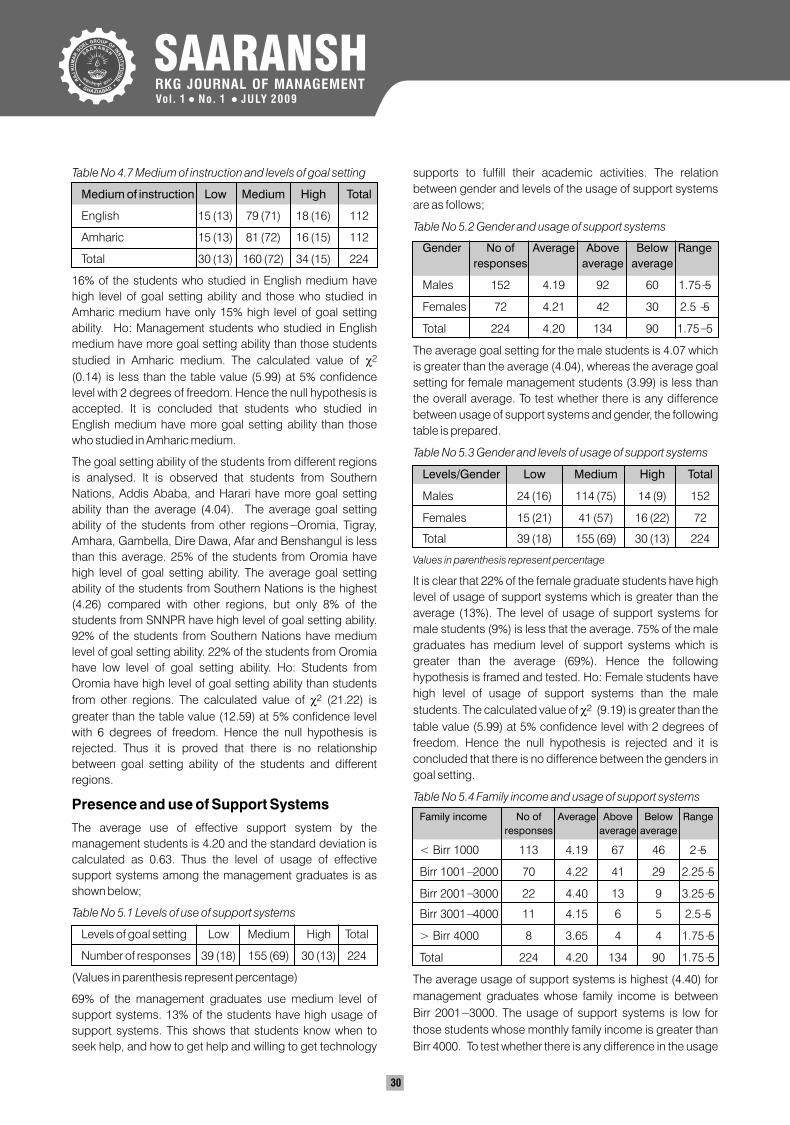
SAARANSHRKG JOURNAL OF MANAGEMENTVol . 1 No. 1 JULY 2009• •
30
Table No 4.7 Medium of instruction and levels of goal setting
Medium of instruction Low Medium High Total
English 15 (13) 79 (71) 18 (16) 112
Amharic 15 (13) 81 (72) 16 (15) 112
Total 30 (13) 160 (72) 34 (15) 224
16% of the students who studied in English medium have
high level of goal setting ability and those who studied in
Amharic medium have only 15% high level of goal setting
ability. Ho: Management students who studied in English
medium have more goal setting ability than those students 2 studied in Amharic medium. The calculated value of c
(0.14) is less than the table value (5.99) at 5% confidence
level with 2 degrees of freedom. Hence the null hypothesis is
accepted. It is concluded that students who studied in
English medium have more goal setting ability than those
who studied in Amharic medium.
The goal setting ability of the students from different regions
is analysed. It is observed that students from Southern
Nations, Addis Ababa, and Harari have more goal setting
ability than the average (4.04). The average goal setting
ability of the students from other regions- Oromia, Tigray,
Amhara, Gambella, Dire Dawa, Afar and Benshangul is less
than this average. 25% of the students from Oromia have
high level of goal setting ability. The average goal setting
ability of the students from Southern Nations is the highest
(4.26) compared with other regions, but only 8% of the
students from SNNPR have high level of goal setting ability.
92% of the students from Southern Nations have medium
level of goal setting ability. 22% of the students from Oromia
have low level of goal setting ability. Ho: Students from
Oromia have high level of goal setting ability than students 2from other regions. The calculated value of c (21.22) is
greater than the table value (12.59) at 5% confidence level
with 6 degrees of freedom. Hence the null hypothesis is
rejected. Thus it is proved that there is no relationship
between goal setting ability of the students and different
regions.
Presence and use of Support Systems
The average use of effective support system by the
management students is 4.20 and the standard deviation is
calculated as 0.63. Thus the level of usage of effective
support systems among the management graduates is as
shown below;
Table No 5.1 Levels of use of support systems
Levels of goal setting Low Medium High Total
Number of responses 39 (18) 155 (69) 30 (13) 224
(Values in parenthesis represent percentage)
69% of the management graduates use medium level of
support systems. 13% of the students have high usage of
support systems. This shows that students know when to
seek help, and how to get help and willing to get technology
supports to fulfill their academic activities. The relation
between gender and levels of the usage of support systems
are as follows;
Table No 5.2 Gender and usage of support systems
Gender No of Average Above Below Range
responses average average
Males 152 4.19 92 60 1.75-5
Females 72 4.21 42 30 2.5 -5
Total 224 4.20 134 90 1.75- 5
The average goal setting for the male students is 4.07 which
is greater than the average (4.04), whereas the average goal
setting for female management students (3.99) is less than
the overall average. To test whether there is any difference
between usage of support systems and gender, the following
table is prepared.
Table No 5.3 Gender and levels of usage of support systems
Levels/Gender Low Medium High Total
Males 24 (16) 114 (75) 14 (9) 152
Females 15 (21) 41 (57) 16 (22) 72
Total 39 (18) 155 (69) 30 (13) 224
Values in parenthesis represent percentage
It is clear that 22% of the female graduate students have high
level of usage of support systems which is greater than the
average (13%). The level of usage of support systems for
male students (9%) is less that the average. 75% of the male
graduates has medium level of support systems which is
greater than the average (69%). Hence the following
hypothesis is framed and tested. Ho: Female students have
high level of usage of support systems than the male 2 students. The calculated value of c (9.19) is greater than the
table value (5.99) at 5% confidence level with 2 degrees of
freedom. Hence the null hypothesis is rejected and it is
concluded that there is no difference between the genders in
goal setting.
Table No 5.4 Family income and usage of support systems
Family income No of Average Above Below Range
responses average average
< Birr 1000 113 4.19 67 46 2-5
Birr 1001- 2000 70 4.22 41 29 2.25-5
Birr 2001- 3000 22 4.40 13 9 3.25-5
Birr 3001- 4000 11 4.15 6 5 2.5-5
> Birr 4000 8 3.65 4 4 1.75-5
Total 224 4.20 134 90 1.75-5
The average usage of support systems is highest (4.40) for
management graduates whose family income is between
Birr 2001- 3000. The usage of support systems is low for
those students whose monthly family income is greater than
Birr 4000. To test whether there is any difference in the usage
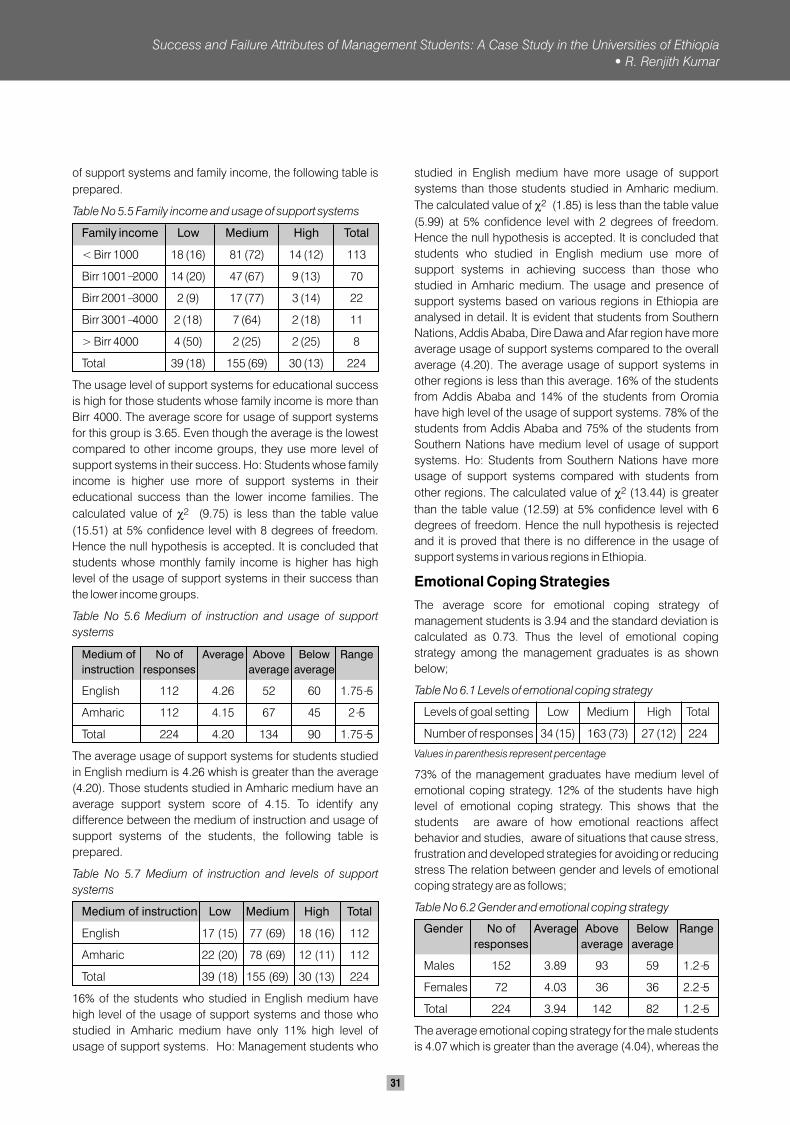
of support systems and family income, the following table is
prepared.
Table No 5.5 Family income and usage of support systems
Family income Low Medium High Total
< Birr 1000 18 (16) 81 (72) 14 (12) 113
Birr 1001- 2000 14 (20) 47 (67) 9 (13) 70
Birr 2001- 3000 2 (9) 17 (77) 3 (14) 22
Birr 3001- 4000 2 (18) 7 (64) 2 (18) 11
> Birr 4000 4 (50) 2 (25) 2 (25) 8
Total 39 (18) 155 (69) 30 (13) 224
The usage level of support systems for educational success
is high for those students whose family income is more than
Birr 4000. The average score for usage of support systems
for this group is 3.65. Even though the average is the lowest
compared to other income groups, they use more level of
support systems in their success. Ho: Students whose family
income is higher use more of support systems in their
educational success than the lower income families. The 2 calculated value of c (9.75) is less than the table value
(15.51) at 5% confidence level with 8 degrees of freedom.
Hence the null hypothesis is accepted. It is concluded that
students whose monthly family income is higher has high
level of the usage of support systems in their success than
the lower income groups.
Table No 5.6 Medium of instruction and usage of support
systems
Medium of No of Average Above Below Range
instruction responses average average
English 112 4.26 52 60 1.75-5
Amharic 112 4.15 67 45 2-5
Total 224 4.20 134 90 1.75-5
The average usage of support systems for students studied
in English medium is 4.26 whish is greater than the average
(4.20). Those students studied in Amharic medium have an
average support system score of 4.15. To identify any
difference between the medium of instruction and usage of
support systems of the students, the following table is
prepared.
Table No 5.7 Medium of instruction and levels of support
systems
Medium of instruction Low Medium High Total
English 17 (15) 77 (69) 18 (16) 112
Amharic 22 (20) 78 (69) 12 (11) 112
Total 39 (18) 155 (69) 30 (13) 224
16% of the students who studied in English medium have
high level of the usage of support systems and those who
studied in Amharic medium have only 11% high level of
usage of support systems. Ho: Management students who
studied in English medium have more usage of support
systems than those students studied in Amharic medium. 2 The calculated value of c (1.85) is less than the table value
(5.99) at 5% confidence level with 2 degrees of freedom.
Hence the null hypothesis is accepted. It is concluded that
students who studied in English medium use more of
support systems in achieving success than those who
studied in Amharic medium. The usage and presence of
support systems based on various regions in Ethiopia are
analysed in detail. It is evident that students from Southern
Nations, Addis Ababa, Dire Dawa and Afar region have more
average usage of support systems compared to the overall
average (4.20). The average usage of support systems in
other regions is less than this average. 16% of the students
from Addis Ababa and 14% of the students from Oromia
have high level of the usage of support systems. 78% of the
students from Addis Ababa and 75% of the students from
Southern Nations have medium level of usage of support
systems. Ho: Students from Southern Nations have more
usage of support systems compared with students from 2other regions. The calculated value of c (13.44) is greater
than the table value (12.59) at 5% confidence level with 6
degrees of freedom. Hence the null hypothesis is rejected
and it is proved that there is no difference in the usage of
support systems in various regions in Ethiopia.
Emotional Coping Strategies
The average score for emotional coping strategy of
management students is 3.94 and the standard deviation is
calculated as 0.73. Thus the level of emotional coping
strategy among the management graduates is as shown
below;
Table No 6.1 Levels of emotional coping strategy
Levels of goal setting Low Medium High Total
Number of responses 34 (15) 163 (73) 27 (12) 224
Values in parenthesis represent percentage
73% of the management graduates have medium level of
emotional coping strategy. 12% of the students have high
level of emotional coping strategy. This shows that the
students are aware of how emotional reactions affect
behavior and studies, aware of situations that cause stress,
frustration and developed strategies for avoiding or reducing
stress The relation between gender and levels of emotional
coping strategy are as follows;
Table No 6.2 Gender and emotional coping strategy
Gender No of Average Above Below Range
responses average average
Males 152 3.89 93 59 1.2-5
Females 72 4.03 36 36 2.2-5
Total 224 3.94 142 82 1.2-5
The average emotional coping strategy for the male students
is 4.07 which is greater than the average (4.04), whereas the
Success and Failure Attributes of Management Students: A Case Study in the Universities of Ethiopia
R. Renjith Kumar
31
SAARANSHRKG JOURNAL OF MANAGEMENTVol . 1 No. 1 JULY 2009• •
32
average emotional coping strategy for female management
students (3.99) is less than the overall average. To test
whether there is any difference between emotional coping
strategy and gender, the following table is prepared.
Table No 6.3 Gender and levels of emotional coping strategy
Levels/Gender Low Medium High Total
Males 25 (16) 109 (72) 18 (12) 152
Females 9 (12) 54 (75) 9 (13) 72
Total 34 (15) 163 (73) 27 (12) 224
Values in parenthesis represent percentage
It is clear that 13% of the female graduate students have high
level of emotional coping strategy which is greater than the
average (12%). The level of emotional coping strategy for
male students (12%) is equal to the average. 75% of the
female graduates have medium level of emotional coping
strategy which is greater than the average (73%). Hence the
following hypothesis is framed and tested. Ho: Female
students have high level of emotional coping strategy than 2 the male students. The calculated value of c (0.59) is less
than the table value (5.99) at 5% confidence level with 2
degrees of freedom. Hence the null hypothesis is accepted
and it is concluded that female graduates have more
emotional coping strategy than the male students.
Table No 6.4 Family income and emotional coping strategy
Family income No of Average Above Below Range
responses average average
< Birr 1000 113 3.87 71 42 1.2-5
Birr 1001- 2000 70 4.09 34 36 1.8-5
Birr 2001-3000 22 4.03 13 9 1.2-5
Birr 3001-4000 11 3.89 5 6 3.2-4.6
> Birr 4000 8 3.4 4 4 2.4-4.8
Total 224 3.94 142 82 1.2-5
The average emotional coping strategy is highest (4.09) for management graduates whose family income is between Birr 1001- 2000. The emotional coping strategy is low for those students whose monthly family income is greater than Birr 4000.To test whether there is any difference in emotional coping strategy and family income, the following table is prepared.
Table No 6.5 Family income and levels of emotional coping
strategy
Family income Low Medium High Total
< Birr 1000 21 (19) 82 (72) 10 (9) 113
Birr 1001- 2000 6 (8) 53 (76) 11(16) 70
Birr 2001- 3000 3 (14) 14 (64) 5 (22) 22
Birr 3001- 4000 1 (9) 10 (91) 0 11
> Birr 4000 3 (37) 4 (50) 1(13) 8
Total 34 (15) 163 (73) 27(12) 224
The level of emotional coping strategy is high for those
students whose family income is more than Birr 2001-3000.
Emotional coping strategy is low for students whose family
income is greater than Birr 4000. Ho: Students whose family
income is Birr 2001- 3000 has more emotional coping
strategies than students from other income groups. The 2 calculated value of c (12.35) is less than the table value
(15.51) at 5% confidence level with 8 degrees of freedom.
Hence the null hypothesis is accepted. It is concluded that
students whose monthly family income is Birr 2001- 3000 has
high level of emotional coping strategy than students from
other income groups.
Table No 6.6 Medium of instruction and emotional coping
strategy
Medium of No of Average Above Below Range
instruction responses average average
English 112 3.93 71 41 1.2-5
Amharic 112 3.95 71 41 1.8-5
Total 224 3.94 142 82 1.2-5
The average emotional coping strategy for students studied
in English medium is 3.93 whish is greater than the average
(3.94). Those students studied in Amharic medium have an
average emotional coping strategy score of 3.95. To identify
any difference between the medium of instruction and
emotional coping strategy of the students, the following table
is prepared.
Table No 6.7 Medium of instruction and levels of emotional
coping strategy
Medium of Low Medium High Total
instruction
English 17 (15) 81 (72) 14 (13) 112
Amharic 17 (15) 82 (73) 13 (12) 112
Total 34 (15) 163 (73) 27 (12) 224
13% of the students who studied in English medium have
high level of the usage of emotional coping strategy and
those who studied in Amharic medium have only 12% high
level of emotional coping strategy. Ho: Management
students who studied in English medium have more
emotional coping strategy than those students studied in 2 Amharic medium. The calculated value of c (0.04) is less
than the table value (5.99) at 5% confidence level with 2
degrees of freedom. Hence the null hypothesis is accepted.
It is concluded that students who studied in English medium
have more emotional coping strategy than those students
who studied in Amharic medium.
The emotional coping strategy of the students from various
regions is evaluated. The average emotional coping strategy
is more for students from Southern Nation, Addis Ababa,
Gambella, Dire Dawa and Afar regions than the overall
average (3.94). The average emotional coping strategy of
students from Oromia, Tigray, Amhara, Harai and
Benshangul is less than this average. 18% of the students
from Addis Ababa have high level of emotional coping
strategy. 14% of the students from Amhara region and 12% of
the students from Oromia have high level of emotional coping
strategy. 90% of the students from Southern Nations have
medium level of emotional strategy. 22% of the students from
Oromia have low level of emotional coping strategy. Ho:
Students from Addis Ababa have high level of emotional
coping strategy than students from other regions. The 2 calculated value of c(12.36) is less than the table value
(12.59) at 5% confidence level with 6 degrees of freedom.
Hence the null hypothesis is accepted and it is proved that
students from Addis Ababa have more emotional coping
strategy compared with students from other regions in
Ethiopia
Table No 7.1 Coefficient of variation of success attributes
Attributes Average S.D C.V
Self awareness 3.86 0.58 15.02
Pro-activity 4.11 0.58 14.11
Perseverance 3.93 0.68 17.30
Goal setting 4.04 0.67 16.58
Presence and use 4.20 0.63 15
of support systems
Emotional coping 3.94 0.73 18.52
strategies
Among the success attributes, students possess more of
usage of support systems with an average of 4.20. The least
attribute to their success is self awareness with a mean of
3.86. The coefficient of variation values further reveals the
consistency and reliability of success attributes among the
students. The coefficient of variation is less for pro-activity
and this success attribute is highly consistent and reliable
among the students. Students are not consistent in coping
emotional strategies and also perseverance. This analysis
shows that the success factors are pro-activity and their
usage of support systems in their achievement. The failure
factors can be attributed to perseverance, emotional coping
strategies and goal setting.
Table 7.2 Comparison of success attributes
Success attributes Low Medium High
Self awareness 33 (15) 162 (72) 29 (13)
Pro-activity 38 (17) 151 (67) 35 (16)
Perseverance 42 (19) 157 (70) 25 (11)
Goal setting 30 (13) 160 (72) 34 (15)
Presence and use of 39 (18) 155 (69) 30 (13)
support systems
Emotional coping 34 (15) 163 (73) 27 (12)
strategies
The level of pro-activity is high (16%) compared with the other
success attributes. 73% of the management graduates have
a medium level of emotional coping strategies which is
greater than the other factors. 19% of the students have a
low level of perseverance which is also greater compared
with other success factors. To identify the equality of means
of the various success attributes, the following hypothesis is
framed and tested. Ho: There is equality among the means of
success attributes among the management graduates.
Table 7.3 ANOVA table showing the difference in success
attributes
Source
of squares of square ratio
variation freedom
Between 62,610 2(k-1) 31,305 31,305
group /18.53
=1689.42Within group 278 15 (n-k) 18.53
Total 62,888 17 (n-1)
The calculated value of F ratio is greater than the table value
(F = 3.68) (a = 0.05) and hence the hypothesis is 2, 15
rejected. Thus it is proved that there is no relationship and
equality among the means of the various successes
attributes of the students.
FINDINGS OF THE STUDY
1. Among the success attributes the use of support systems
used by management students is the highest (4.20). The
average pro-activity score of management students is 4.11.
The average goal setting score of management students is
4.04. These are the success factors for the management
students. The attribute with the lowest score is self
awareness (3.86) perseverance (3.93) and emotional coping
strategy (3.94).
2. The most successful attribute among the management
graduates is pro-activity which is followed by the use of
support systems in their academics.
3. It is proved that male management graduates have more
self awareness and goal setting than the female students.
Whereas success attributes like pro-activity, perseverance,
and emotional coping strategy are more for females than the
male students. Students whose monthly family income is Birr
2001-3000 has high level of pro-activity, goal setting ability
and emotional coping strategy. Students’ whose family
income is low has high level of self awareness. Students’
whose monthly family income is higher has high level of the
usage of support systems in their success than the lower
income groups. Those students who studied in English
medium in school education has more perseverance, goal
setting ability, use more of support systems, and emotional
coping strategy than those students studied in Amharic
medium. Students who studied in Amharic medium have
more self awareness and pro-activity than those who studied
in English medium. Students from Amhara region have more
self awareness, determination and patience than students
Sum of Degrees Mean F
Success and Failure Attributes of Management Students: A Case Study in the Universities of Ethiopia
R. Renjith Kumar
33
34
from other regions. Students from Oromia region have more
pro-activity than students from other regions. Students from
Addis Ababa have more emotional coping strategy. There is
no relationship between goal setting ability, usage of support
systems with students from different regions.
4. The coefficient of variation is less for pro-activity (14.11)
and this success attribute is highly consistent and reliable
among the students. Students are not consistent in coping
emotional strategies (CV= 18.52) and also perseverance
(CV=17.30). Thus the most success factors are pro-activity
and usage of support systems in their achievement.
5. The failure factors can be attributed to perseverance,
emotional coping strategies and goal setting.
CONCLUSION
Thus this quantitative research tried to identify those factors
that lead to positive outcome in their life through academic
success. This research also helped to reveal meaningful and
significant differences based on the factors that affect
academic achievement. The analysis proved more fruitful in
revealing a set of success attributes that differentiated the
factors, illustrating the levels of each attributes. Students
should realize these variations of factors in their academic
achievement. Also this research would be of tremendous
value in helping students reach their full potential. The self
awareness of the students is low compared with the other
success factors and it can be improved by; a) Being with
students to develop and discuss their individual strengths,
weaknesses, and special talents. b) Allowing students
choose potential careers that best match their abilities and
discuss their choices. Individuals who lack perseverance
should pursue alternative strategies for reaching their goal,
or know when the goal itself might have to be modified. They
should not give up their goals till they succeed. The following
strategies can be adopted; a) Share inspirational stories of
people who have persevered in the face of adversity. b) Let
students share their own stories about times when they have
or have not persevered and the consequent outcomes. c) Let
students self-monitor their behavior and attitude when
playing games that require perseverance. In order to improve
the emotional coping strategy, develop effective means of
reducing and coping with stress, frustration, and the
emotional aspects of learning problems. a) Students should
discuss or write about the circumstances that create the
greatest stress in their lives. b) Make a list of how the body
feels when one begins to feel stressed. c) Teach students
basic relaxation or stress-reduction techniques like deep
breathing and muscle relaxation. It is recommended that the
emerging male management graduates should focus more
on pro-activity, perseverance, and emotional coping
strategy. Female management graduates should try to
improve their self awareness and goal setting. These
strategies should be implemented properly at the school
level for students attending in both Amharic medium and
English medium. Students should be given counseling on
these success attributes. The teachers and the family
members should create more awareness regarding the
success attributes and how to adopt these strategies to the
students. To be successful with goal setting strategy,
students should set goals that are specific, and flexible. a)
Students should write down a short-term academic goal and
set a long-term goal and discuss the step-by-step process.
b) Study or discuss successful individuals and determine the
experiences, backgrounds, opportunities, and critical events
that led these individuals to their ultimate positions.
REFERENCES
Bryan, T. (1974). Peer Popularity of Learning Disabled
Children. Journal of Learning Disabilities, 7, 261-268.
Eaton, H., et. al.(1998). Transitions to postsecondary
learning. Vancouver, BC, Canada: Eaton Coull Learning
Group, Ltd.
Elbaum, B., et. al. (2003).Self-concept and students with
learning disabilities. In H.L. Swanson, K.R. Harris, & S.
Graham (Eds.) Handbook of learning disabilities. New York:
The Guilford Press. (pp. 229-241).
Eleanor Higgins et. al. (2004) Life Success For Students With
Learning Disabilities: A Teacher Guide, The Frostig Center
Pasadena, California.
Field, S. (1996). Self-determination instructional strategies
for youth with learning disabilities. Journal of Learning
Disabilities, 29(1), 40-52.
Field, S., et. al. (1998). A practical guide for teaching self-
determination. Reston, VA: The Council for Exceptional
Children.
Gerber, P., et. al. (1992). Identifying alterable patterns of
vocational success in highly successful adults with learning
disabilities. Journal of Learning Disabilities, 25, 475-487.
Goldberg, R.J., et. al. (2003). Predictors of success in
individuals with learning disabilities: A qualitative analysis of
a 20-year longitudinal study. Learning Disabilities Research &
Practice, 18, 222-236.
Pearl, R. (2002). Students with learning disabilities and their
classroom companions. In B.Y.L. Wong & M.L. Donahue
(Eds.), The social dimensions of learning disabilities: Essays
in honor of Tanis Bryan Mahwah, NJ: Lawrence Erlbaum
Associates, Inc. (pp. 77-92).
SAARANSHRKG JOURNAL OF MANAGEMENTVol . 1 No. 1 JULY 2009• •
35
BRIDGING GAP BETWEEN DESIRABILITY AND AVAILABILITY OF BANKING SERVICE:
AN EXCELLENT ROAD MAP IN THE EMERGING COMPETITION
ABSTRACTThe widening gap between desirability and availability is becoming a major cause of dissatisfaction in the banking industry. The bridging of this gap is one of the solutions to make the customers delight. The present study analyzes the widening gap between desirability and availability regarding reliability, accuracy, confidentiality, flexibility, e-channels, high attention to customers, low service charges and overall satisfaction of customers in three bank groups i.e. public sector banks, Indian private sector banks and foreign banks. The survey was conducted in Chandigarh in the month of October, 2008. Three banks have been selected one each from three bank groups; PNB from public sector banks, HDFC bank from Indian Private Sector banks and Amro bank from foreign banks have been taken for consideration. On the basis of five point Likert type scale, survey concludes that desirability regarding all the parameters is very high as compared to availability of banking services and on the basis of this empirical survey, study recommends some measures to bridge this gap between the D/A of service quality parameters in the banking sector in the emerging competition
KEYWORDS: Desirability and Availability of Service Quality, Gap between Desirability and Availability, Measures to Bridge the Gap
R.K. Uppal* Rosy Chawla **
INTRODUCTION
Globalization, liberalization, deregulation have resulted in a
sea change in the form of time and cost effective consumer
banking services (Javalgi, 1992). These competitive
innovations have made bank customers more concerned
about their money value and surrounding environment that
leads to high customer expectations from service providers.
In fact the customer expectations rise with the use of latest
technology, like on-line services or e-banking, inspiring them
to explore the alternatives available to all from around the
world and eventually arming them with an unprecedented
amount of market knowledge (Parasuraman, 2000) Thus,
with ever escalating customer expectations, companies have
to offer additional values to make an ever-lasting impression
in the minds of customers (Gurney, 1999), because merely
delivery of satisfaction as the confirmation of expectations is
considered as minimum threshold. Hence, it is important for
business managers to understand the provisions, symbols
and tangible clues used by the customers in evaluating the
service offered by business organizations. Quality is thus
relative and subjective and depends on the perceptions and
expectations of the customer with respect to the service
offered. For service sector companies such as banking,
insurance, and tourism, the issues and challenges of service
quality are of the utmost significance. Poor service quality
places such organizations at a competitive disadvantage. If
*Director, ICCSR Sponsored Major Research Project, D.A.V. College, Malout (Punjab) **Research Investigator, IIPA sponsored Major Research Project, D.A.V College Malout (Punjab)
customers perceive that service quality is unsatisfactory,
they will not hesitate to switch over business elsewhere. In
recent years, it has been witnessed that there is
discontentment with regard to service quality, even when the
quality of many manufactured goods appear to have
improved significantly. The recent trend in many service
organizations is to consider service quality as a critical factor
enabling them to achieve a differential advantage over their
competitors (Kotler, 2006). Increasingly, quality is becoming
a key variable in strategic planning. Organizations which are
becoming leaders in service quality are characterized by the
commitment of the top management and a corporate culture
that encourages a focus on customer and quality throughout
the company (Albrecht and Zemke, 1985). In India, public
sector banks meet nearly 90 pc banking needs of the country
and retail banking constitutes 80 pc of this total banking
business (Ram Mohan, 2002). Many academicians and
practitioners have highlighted the need for better service
quality in banks. Several researchers have suggested the
adoption of modern banking technology as a means to
improve customer services (Sundaram, 1984; Nageswar,
1987; Nageshwar and Parmod, 1990; Brahmanand and
Narayana, 1990; Seshasai, 1999; Gani and Bhat, 2003).
These studies have made public sector banks aware that if
the present trend of customer dissatisfaction continues, they
SAARANSHRKG JOURNAL OF MANAGEMENTVol . 1 No. 1 JULY 2009• •
36
will loose their valuable clients to their competitors especially
to private and foreign banks. In fact this was realized much
earlier when the Rangarajan Committee Report (1989)
stressed the need for mechanization of the Indian banks.
Many other researchers have suggested the adoption of
modern banking technology as a means to improve
customer services (Ammayya, 1996). Therefore, the banks
have to provide quality service to their customers for survival,
as well as to have competitive advantage.
Scheme of Paper
The present paper has been divided into six sections. After
the introduction, section II reviews some related studies.
Section III fixes some research objectives, hypothesis &
highlights the research methodology and the data base.
Section IV is devoted to the results and discussion. Section V
gives some recommendations to enhance the service quality
in banking industry, implications of the study, limitations of
the study and future areas for comprehensive research and
last section concludes the paper.
REVIEW OF LITERATUREThere are a number of studies that refer to the importance of
clients/ customers' perceptions of quality (Takeuchi and
Quelch, 1983). These result from comparisons by
expectations of service with actual performance (Gronroos,
1982 and Berry, et al, 1985). Berry (1980) along with Booms
and Bitner (1981) argued that due to intangible nature of
services, customers use elements associated with the
physical environment when evaluating service quality.
Managing the evidence and using the environmental
psychology are often seen as important marketing tools.
Levitt (1981) proposed that customers use appearances to
make judgments about realities. The less tangible a product
is the more powerful shall be the effect of packaging while
judging that product. Gronroos (1982) had identified two
service quality dimensions, viz., functional quality and
technical quality. Functional quality represents the
perception of the manner in which the services are delivered.
Technical quality or outcome quality on the other hand,
represents the outcome of the service act or what the
customer receives in the end (Brady and Cronin, 2001).
Parasuraman, et al. (1985) suggested that the criteria used
by consumers mould their expectations and perceptions of
delivered service quality fit into ten dimensions: tangibility,
reliability, responsiveness, communication, credibility,
security, competence, courtesy, understanding/knowing the
customer and access. Subsequent researches, by
Parasuraman, et al. (1988) have condensed these into five
dimensions of service quality. The Penta-dimentional model
has now become the standard way of measuring service
quality in banking sector.
Tangibility includes physical facilities, equipment,
appearance of personnel.
Reliability includes ability to perform the promised
service accurately and with reliability.
Responsiveness includes willingness to help customers
and provide prompt Service.
Assurance includes knowledge & courtesy of
employees and their ability to convey trust
and confidence.
Empathy includes caring and individualized
attention the company provides to its
customers.
Parasuraman, et al. (1988) developed a 22-item scale,
referred to as SERVQUAL Scale, which is widely used as a
generic instrument for measuring service quality. The basis
for identifying the five components was factor analysis of the
22-item scale developed from focus groups and from the
specific industry applications undertaken by the authors
(Parasuraman, et al., 1985,1988; and Zeithaml, et al., 1990).
Though, the veracity of conceptualising the SERVQUAL
scale has been questioned by Carman (1990), the validity of
the 22 individual performance scale items that make up the
SERVQUAL scale appears to be well supported both by the
procedures used to develop the items and by their
subsequent use as reported in the literature (Brown and
Swartz, 1989; Zeithaml, et al., 1990; Lewis, 1991; Young, et
al., 1994; Berry and Parasuraman, 1997). There are some
limitations with SERVQUAL, which have been highlighted by
the authors themselves (Parasuraman, et al., 1991) and also
by other researchers (Babakhus and Boiler, 1992; Lewis and
Mitchell, 1990; Lewis, 1993; and Smith, 1992). These relate to
respondents' difficulties with negatively-worded statements
using two lists of statements for the same items. There is also
a disagreement among various researchers regarding the
number of dimensions of service to be assessed. Another
problem relates to the time factor at which the service quality
has to be measured, i.e., before, during or after a service
encounter, while there is a healthy and productive debate
regarding the dimensionality of SERVQUAL items to be
included to service quality scale across different industries.
Researchers, however, generally agree that the scale items
are good predictors of overall service quality (Bolton and
Drew, 1991; and Cronin and Taylor, 1992). A number of other
empirical studies have been conducted using the
SERVQUAL scale which include car retailing (Carman, 1990),
travel and tourism (Fick and Ritchie, 1991), and hospitality
(Saleh and Ryan, 1991), banks (Lewis, 1991), and medical
services (Brown and Swartz, 1989). There have been a
number of such studies that deal with service quality in
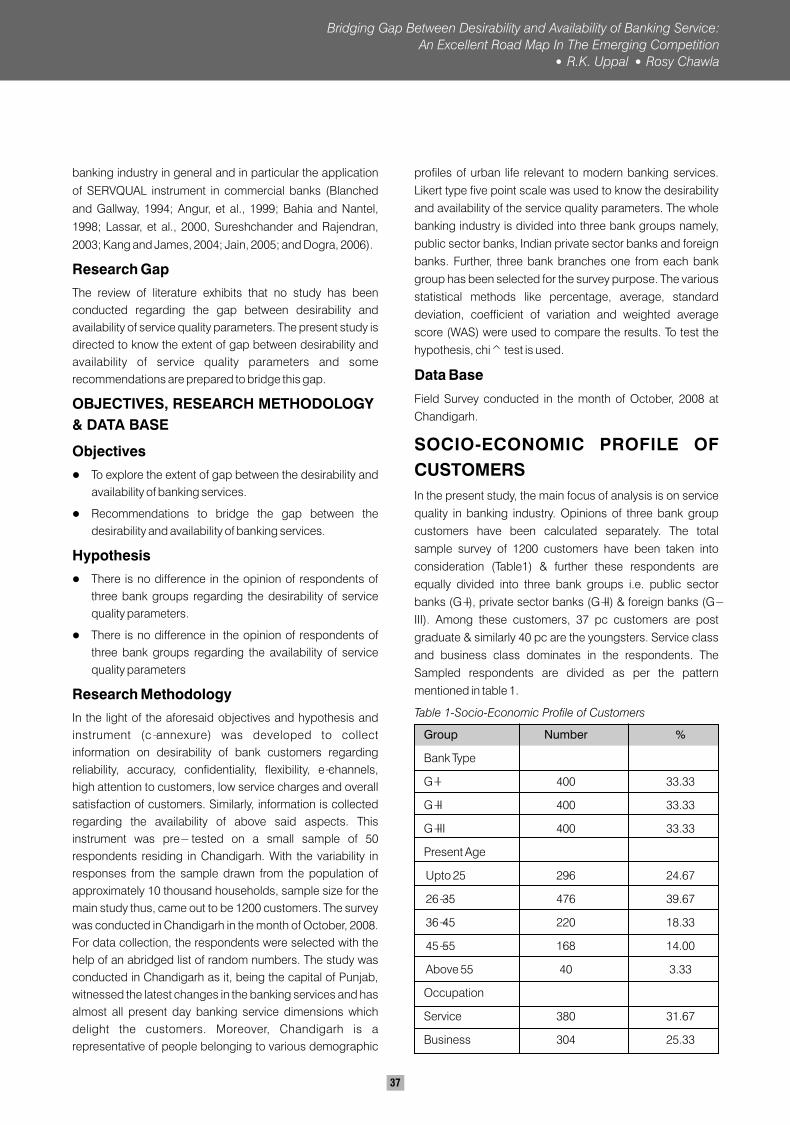
banking industry in general and in particular the application
of SERVQUAL instrument in commercial banks (Blanched
and Gallway, 1994; Angur, et al., 1999; Bahia and Nantel,
1998; Lassar, et al., 2000, Sureshchander and Rajendran,
2003; Kang and James, 2004; Jain, 2005; and Dogra, 2006).
Research Gap
The review of literature exhibits that no study has been
conducted regarding the gap between desirability and
availability of service quality parameters. The present study is
directed to know the extent of gap between desirability and
availability of service quality parameters and some
recommendations are prepared to bridge this gap.
OBJECTIVES, RESEARCH METHODOLOGY
& DATA BASE
Objectives
To explore the extent of gap between the desirability and
availability of banking services.
Recommendations to bridge the gap between the
desirability and availability of banking services.
Hypothesis
There is no difference in the opinion of respondents of
three bank groups regarding the desirability of service
quality parameters.
There is no difference in the opinion of respondents of
three bank groups regarding the availability of service
quality parameters
Research Methodology
In the light of the aforesaid objectives and hypothesis and
instrument (c-annexure) was developed to collect
information on desirability of bank customers regarding
reliability, accuracy, confidentiality, flexibility, e-channels,
high attention to customers, low service charges and overall
satisfaction of customers. Similarly, information is collected
regarding the availability of above said aspects. This
instrument was pre- tested on a small sample of 50
respondents residing in Chandigarh. With the variability in
responses from the sample drawn from the population of
approximately 10 thousand households, sample size for the
main study thus, came out to be 1200 customers. The survey
was conducted in Chandigarh in the month of October, 2008.
For data collection, the respondents were selected with the
help of an abridged list of random numbers. The study was
conducted in Chandigarh as it, being the capital of Punjab,
witnessed the latest changes in the banking services and has
almost all present day banking service dimensions which
delight the customers. Moreover, Chandigarh is a
representative of people belonging to various demographic
l
l
l
l
37
profiles of urban life relevant to modern banking services.
Likert type five point scale was used to know the desirability
and availability of the service quality parameters. The whole
banking industry is divided into three bank groups namely,
public sector banks, Indian private sector banks and foreign
banks. Further, three bank branches one from each bank
group has been selected for the survey purpose. The various
statistical methods like percentage, average, standard
deviation, coefficient of variation and weighted average
score (WAS) were used to compare the results. To test the
hypothesis, chi^ test is used.
Data Base
Field Survey conducted in the month of October, 2008 at
Chandigarh.
SOCIO-ECONOMIC PROFILE OF
CUSTOMERS
In the present study, the main focus of analysis is on service
quality in banking industry. Opinions of three bank group
customers have been calculated separately. The total
sample survey of 1200 customers have been taken into
consideration (Table1) & further these respondents are
equally divided into three bank groups i.e. public sector
banks (G-I), private sector banks (G-II) & foreign banks (G-
III). Among these customers, 37 pc customers are post
graduate & similarly 40 pc are the youngsters. Service class
and business class dominates in the respondents. The
Sampled respondents are divided as per the pattern
mentioned in table 1.
Table 1-Socio-Economic Profile of Customers
Group Number %
Bank Type
G-I 400 33.33
G-II 400 33.33
G-III 400 33.33
Present Age
Upto 25 296 24.67
26-35 476 39.67
36-45 220 18.33
45-55 168 14.00
Above 55 40 3.33
Occupation
Service 380 31.67
Business 304 25.33
Bridging Gap Between Desirability and Availability of Banking Service:
An Excellent Road Map In The Emerging Competition
R.K. Uppal Rosy Chawla
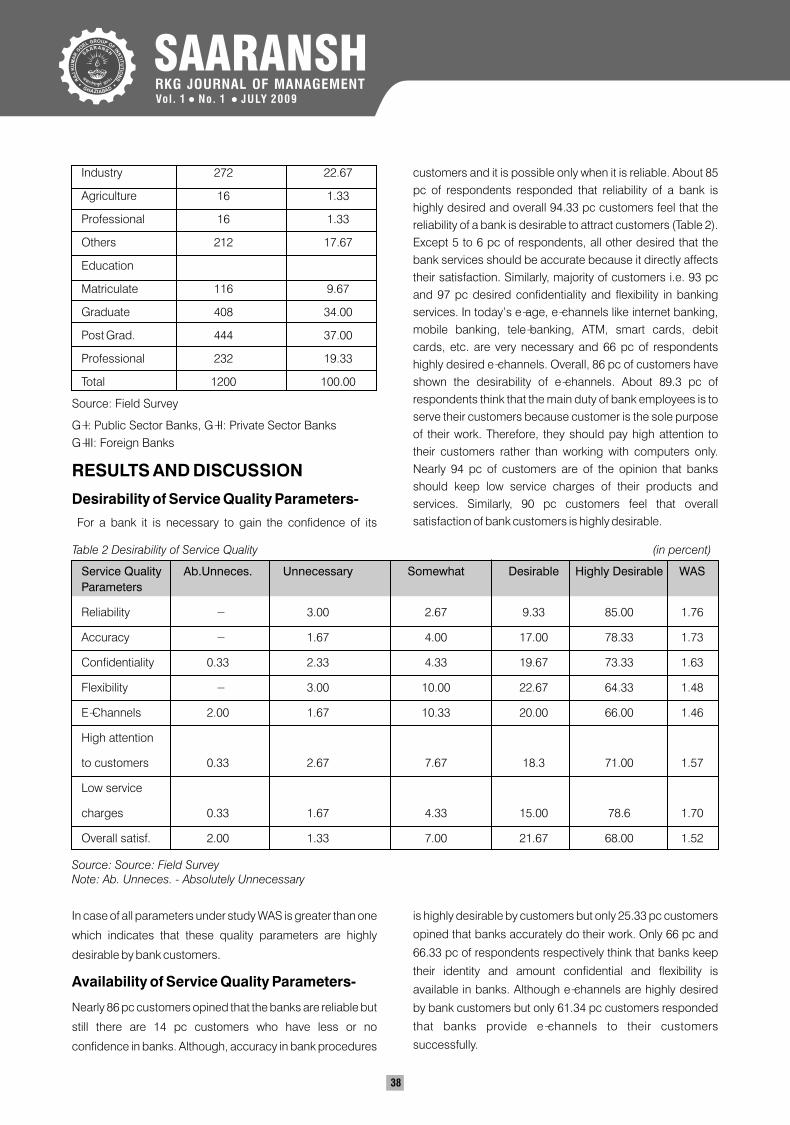
SAARANSHRKG JOURNAL OF MANAGEMENTVol . 1 No. 1 JULY 2009• •
38
Industry 272 22.67
Agriculture 16 1.33
Professional 16 1.33
Others 212 17.67
Education
Matriculate 116 9.67
Graduate 408 34.00
Post Grad. 444 37.00
Professional 232 19.33
Total 1200 100.00
Source: Field Survey
G-I: Public Sector Banks, G-II: Private Sector Banks
G-III: Foreign Banks
RESULTS AND DISCUSSION
Desirability of Service Quality Parameters-
For a bank it is necessary to gain the confidence of its
In case of all parameters under study WAS is greater than one
which indicates that these quality parameters are highly
desirable by bank customers.
Availability of Service Quality Parameters-
Nearly 86 pc customers opined that the banks are reliable but
still there are 14 pc customers who have less or no
confidence in banks. Although, accuracy in bank procedures
customers and it is possible only when it is reliable. About 85
pc of respondents responded that reliability of a bank is
highly desired and overall 94.33 pc customers feel that the
reliability of a bank is desirable to attract customers (Table 2).
Except 5 to 6 pc of respondents, all other desired that the
bank services should be accurate because it directly affects
their satisfaction. Similarly, majority of customers i.e. 93 pc
and 97 pc desired confidentiality and flexibility in banking
services. In today’s e-age, e-channels like internet banking,
mobile banking, tele-banking, ATM, smart cards, debit
cards, etc. are very necessary and 66 pc of respondents
highly desired e-channels. Overall, 86 pc of customers have
shown the desirability of e-channels. About 89.3 pc of
respondents think that the main duty of bank employees is to
serve their customers because customer is the sole purpose
of their work. Therefore, they should pay high attention to
their customers rather than working with computers only.
Nearly 94 pc of customers are of the opinion that banks
should keep low service charges of their products and
services. Similarly, 90 pc customers feel that overall
satisfaction of bank customers is highly desirable.
is highly desirable by customers but only 25.33 pc customers
opined that banks accurately do their work. Only 66 pc and
66.33 pc of respondents respectively think that banks keep
their identity and amount confidential and flexibility is
available in banks. Although e-channels are highly desired
by bank customers but only 61.34 pc customers responded
that banks provide e-channels to their customers
successfully.
Table 2 Desirability of Service Quality (in percent)
Service Quality Ab.Unneces. Unnecessary Somewhat Desirable Highly Desirable WAS
Parameters
Reliability - 3.00 2.67 9.33 85.00 1.76
Accuracy - 1.67 4.00 17.00 78.33 1.73
Confidentiality 0.33 2.33 4.33 19.67 73.33 1.63
Flexibility - 3.00 10.00 22.67 64.33 1.48
E-Channels 2.00 1.67 10.33 20.00 66.00 1.46
High attention
to customers 0.33 2.67 7.67 18.3 71.00 1.57
Low service
charges 0.33 1.67 4.33 15.00 78.6 1.70
Overall satisf. 2.00 1.33 7.00 21.67 68.00 1.52
Source: Source: Field Survey Note: Ab. Unneces. - Absolutely Unnecessary
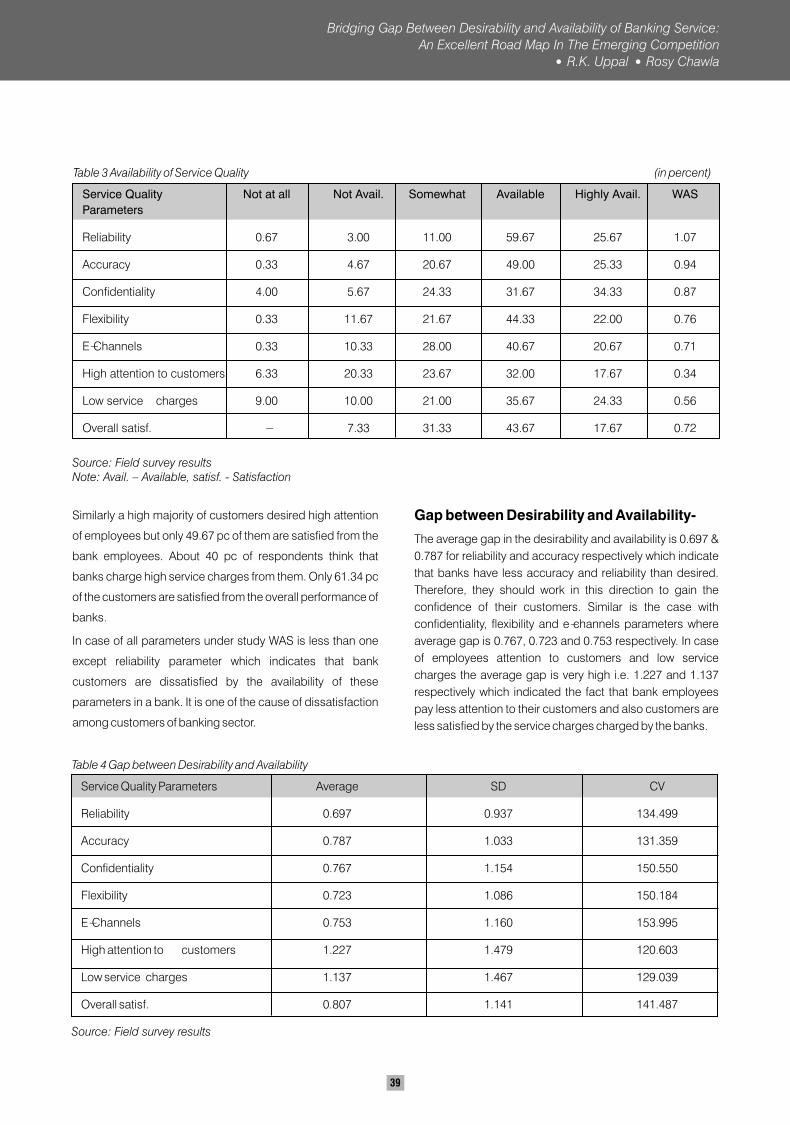
39
Source: Field survey resultsNote: Avail. – Available, satisf. - Satisfaction
Table 3 Availability of Service Quality
Service Quality Not at all Not Avail. Somewhat Available
Parameters
Reliability 0.67 3.00 11.00 59.67 25.67 1.07
Accuracy 0.33 4.67 20.67 49.00 25.33 0.94
Confidentiality 4.00 5.67 24.33 31.67 34.33 0.87
Flexibility 0.33 11.67 21.67 44.33 22.00 0.76
E-Channels 0.33 10.33 28.00 40.67 20.67 0.71
High attention to customers 6.33 20.33 23.67 32.00 17.67 0.34
Low service charges 9.00 10.00 21.00 35.67 24.33 0.56
Overall satisf. - 7.33 31.33 43.67 17.67 0.72
(in percent)
Highly Avail. WAS
Similarly a high majority of customers desired high attention
of employees but only 49.67 pc of them are satisfied from the
bank employees. About 40 pc of respondents think that
banks charge high service charges from them. Only 61.34 pc
of the customers are satisfied from the overall performance of
banks.
In case of all parameters under study WAS is less than one
except reliability parameter which indicates that bank
customers are dissatisfied by the availability of these
parameters in a bank. It is one of the cause of dissatisfaction
among customers of banking sector.
Gap between Desirability and Availability-
The average gap in the desirability and availability is 0.697 &
0.787 for reliability and accuracy respectively which indicate
that banks have less accuracy and reliability than desired.
Therefore, they should work in this direction to gain the
confidence of their customers. Similar is the case with
confidentiality, flexibility and e-channels parameters where
average gap is 0.767, 0.723 and 0.753 respectively. In case
of employees attention to customers and low service
charges the average gap is very high i.e. 1.227 and 1.137
respectively which indicated the fact that bank employees
pay less attention to their customers and also customers are
less satisfied by the service charges charged by the banks.
Table 4 Gap between Desirability and Availability
Service Quality Parameters Average SD CV
Reliability 0.697 0.937 134.499
Accuracy 0.787 1.033 131.359
Confidentiality 0.767 1.154 150.550
Flexibility 0.723 1.086 150.184
E-Channels 0.753 1.160 153.995
High attention to customers 1.227 1.479 120.603
Low service charges 1.137 1.467 129.039
Overall satisf. 0.807 1.141 141.487
Source: Field survey results
Bridging Gap Between Desirability and Availability of Banking Service:
An Excellent Road Map In The Emerging Competition
R.K. Uppal Rosy Chawla
SAARANSHRKG JOURNAL OF MANAGEMENTVol . 1 No. 1 JULY 2009• •
40
Overall satisfaction of bank customers is not a different
aspect and average gap in this case is 0.807. Coefficient of
Variation indicates that there is instability in the opinion of
bank customers on confidentiality, flexibility, e-channels and
overall satisfaction aspects of banks. While comparatively
consistency is found in their opinions in case of other aspects
under study. The present study clearly indicates that in the e-
age, customers have become more concerned about their
money & time and have become more demanding. They
highly desire reliability, accuracy, confidentiality, flexibility, e-
channels, employees attention to customers. Moreover, they
desire these services at low service charges. But responses
of these customers regarding the availability of these
parameters is not satisfactory which has created a wider gap
between the desirability and availability of service quality
parameters in banking industry.
RECOMMENDATIONS
The present paper attempts to give fol lowing
recommendations for banks to bridge the gap between the
desirability and availability of service quality parameters and
to win the confidence of new customers and to retain their old
and valuable customers:
Banks should reliable to win the confidence of potential
customers and to retain the old ones.
The various procedures of banks should be transparent
and accurate e.g. working of bank employees with
computers should also be displayed to customers sitting
on front chair and money counting machines should be
available for customers also.
Banks should keep the identity, amount deposited, etc. of
their customers should be confidential.
The various procedures of banks should not be rigid.
They should be flexible to facilitate the customers.
Present age is a e-age. Therefore, it is necessary for all
banks to provide more and more e-channels. Public
sector banks need to give more attention in this regard.
It is crystal clear from our study that the customers are
less satisfied by the services provided by bank
employees. Therefore, it is necessary that bank
employees should pay high attention to their valuable
customers. They should serve their customers with
smiling face. Further, they should be polite and co-
operative.
Bank customers experienced that banks charge high
service charges for their products and services offered.
This impression is more for private sector banks.
Therefore, all banks, particularly, the private sector banks
should work in this direction and they should charge as
low service charges as possible.
l
l
l
l
l
l
l
l
l
l
l
l
l
l
l
Overall- satisfaction of a customer from his bank is very
necessary because this is the only factor that helps any
organization to increase its business because a
delighted customer will give you one more customer but
an unhappy customer will curtail your ten customers.
Thus, it is expected that if all bank groups add quality to their
work their business can further be multiplied because in the
e-age, customers judge an organization not only by the
number of products offered by it but by the quality of that
products and services. Same is for banking industry because
‘quality counts in services too’.
IMPLICATIONS
The analysis indicates a widening gap between the
desirability and availability of the service quality parameters
in banking industry. This gap between desirability and
availability is an alarming bell for some banks, particularly,
the public sector banks. The bridging of this gap is the need
of the hour. The analysis of this study is very useful for the
banking industry as well as for other organizations.
LIMITATIONS
Due to the problem of space, separate analysis of
responses gender-wise, age-wise, occupation-wise and
bank group wise has not been shown in the paper.
Due to the same reason, chi^ test is not shown in the
analysis.
Only three banks working in Chandigarh are taken due to
shortage of time.
The analysis is based on the responses of customers.
FUTURE AREAS OF COMPREHENSIVE
RESEARCH
Gap between desirability and availability of remaining
service quality parameters like responsiveness,
Courtesy, Professionalism, etc.
Gap between desirability and availability of service
quality parameters for rural and urban sectors.
Desirability of bank employees from bank management
and its customers.
CONCLUSION
The paper concludes that desirability regarding reliability,
accuracy, confidentiality, flexibility, e-channels, high attention
to customers, low service charges and overall satisfaction is
much higher than the availability. This is the cause of
dissatisfaction among the customers and to some extent the
customers are shifting from one bank to another. Bridging
this gap will increase the reputation of the bank and hence
the customer base. The banking industry should be reliable,
41
Brady, M.K., and J.J. Cronin, (2001), "Some New Thoughts
on Conceptualising Perceived Service Quality: A
Hierarchical Approach", Journal of Marketing, July, pp. 65-
77.
Brahmanandam, G.N., and M.S. Narayana, (1990), "A Study
on Customer Service in Commercial Banks", Indian Journal
of Marketing, Vol. 20, No. 5, pp. 7-8 and 16.
Brown, S. W., and T.A. Swartz (1989), "A Gap Analysis of
Professional Service Quality" Journal of Marketing, Vol. 57,
April, pp. 92-100.
Carman, J.M. (1990), "Consumer Perceptions of Service
Quality: An Assessment of the SERVQUAL Dimensions",
Journal of Retailing, Vol. 66, Spring, pp. 33-56.
Cronin, J.J., and S.A. Taylor (1992), "Measuring Service
Quality: A Re-examination and Extension", Journal of
Marketing, Vol. 60, July, pp. 55-68.
Dogra, B., and Awasthi A. K. (2005), "Measuring Service
Quality in Banks: An Assessment of Service Quality
Dimensions", in Conference Proceeding on 'Global
Competitiveness' at the Indian Institute of Management
Kozhikode, October.
Elias, A. H. ( 1982), "Indian Banking Service", Journal of
Indian Institute of Bankers, Vol. 35, No.3, pp. 119-124
Fick, G.R., and J.R.B. Ritchie (1991), "Measuring Service
Quality in the Travel and Tourism Industry", Journal of Travel
Research, Vol. 30, No.3, pp. 2-9
Gani, A., and Mushtaq A Bhat (2003), "Service Quality in
Commercial Banks: A Comparative Study", Paradigm, Vol.7,
No.l, pp. 24-36.
Gronroos, C. (1982), "Strategies Management and
Marketing in the Services Sector" in Parasuraman A., V.A
Zeitilaml, and L.L Berry (1985) "A Conceptual Model of
Service Quality and its Implications for Future Research",
Journal of Marketing, Vol. 50, No.4, pp. 41-50.
Jain, S.K. (2005), "Searching for Critical Success Factors: A
Dimension-Specific Assessment of Service quality and its
relationship with Customer Satisfaction and Behavioural
Intentions in Fast Food Restaurants', Paper from the
International Conference on Service Management (pp. 111-
125), Institute for International Management and Technology,
Gurgaon, India.
Kang, G.D. and J. James (2004), "Service Quality
Dimensions: An Examination of Gronroos' Service Quality
Model", Managing Service Quality, Vol. 14, No. 4, pp. 267-
277.
Kotler, Philip (2006), Marketing Management, 12th ed.
(Delhi: Pearson Education (Singapore) pvt. Ltd.)
accurate and customers should be overall satisfied. E-
Banking services are the need of hour. The present line well
summarizes the paper “Zero plus zero will always remain zero
no matter how many zeros you add to it”. The same is for
banking industry i.e. banks should add more and more
qualitative services.
REFERENCES
Albrecht, K., and R. Zemke (1985), "Service America: Doing
Business in the New York in Lewis, Barbara (1991) Service
Quality: An International Comparison of Bank Customers
Expectations and Perceptions", Journal of Marketing
Management, Vol. 7, pp. 47- 62.
Ammayya, T. (1996), 'Developing Competitive Advantage
through Absorption of Technology in Knowledge, Skills and
Attitudes of People', IBA Bulletin, Vol. 18, No. 12, pp. 38-42.
Angur, M.G., R. Nataraajan Jr. and J.S. Jahera (1999),
"Service Quality in the Banking Industry: An Assessment in a
Developing Economy", International journal of Bank
Marketing, Vol. 17, No. 3, pp. 16-123.
Babakus, E., and G.W. Boiler (1992), "An Empirical
Assessment of the SERVQUAL Scale", Journal of Business
Research, Vol. 24, pp. 253-268.
Bahia, K., and Nantel, J. (1998), "A Reliable and Valid
Measurement Scale for the Perceived Service Quality of
Banks", International Journal of Bank Management, Vol. 18,
No. 2, pp. 84-91.
Berry, L.L., V.A. Zeithaml, and A. Parasuraman (1985),
"Quality Counts in Services Too", Business Horizons, May-
June, pp. 44.52
Berry, L.L. (1980), "Services Marketing is Different", Business,
May-June, pp. 8-30
Berry, L.L., and A. Parasuraman, (1997) "Listening To the
Customer -The Concept of A Servjce-Quality Information
System", Sloan Management Review, Spring, pp. 65- 76.
Bitran, G., and H. Lojo (1993), 'A Framework for Analysing
Service Operations', European Management Journal, No. 2,
Vol. 3, pp. 271-282.
Blanchard, R.F., and R.L. Galloway (1994), "Quality in Retail
Banking", International Journal of Service Industry
Management, Vol. 5, pp. 5-23.
Bolton, R.N., and J.H. Drew (1991), "A Multistage Model of
Customer's Assessment of. Service Quality and Value",
Journal of Consumer Research, Vol. 17, No. 4, pp. 375-384.
Booms, B.H., and M.J. Bitner (1981), "Marketing Strategies
and Organisation Structures for Services Firms", in Zeithaml
V.A., A. Parnasuraman, and L.L Berry (1985) "Problems and
Strategies in Service Marketing", Journal of Marketing, Vol.
49, No. 2, pp. 33-46.
Bridging Gap Between Desirability and Availability of Banking Service:
An Excellent Road Map In The Emerging Competition
R.K. Uppal Rosy Chawla
SAARANSHRKG JOURNAL OF MANAGEMENTVol . 1 No. 1 JULY 2009• •
42
Kwan, W., and T. J. Lee (1994), "Measuring Service Quality in
Singapore Retail Banking", Singapore Management Review,
Vol. 6, No. 4, pp. 7-11.
Lassar, W.M.; C Manolis; and R. D. Winsor (2000), "Service
Quality Perspectives and Satisfaction in Private Banking",
Journal of Services Marketing, Vol. 14, Nos. 2 and 3, pp. 244-
272.
Levitt, T. (1981), "Marketing Intangible Products and Product
Intangibles", Harvard Business Review, May-June, pp. 94-
102.
Lewis, B.R. (1991), "Service Quality: An International
Comparison of Bank Customers Expectations and
Perceptions", Journal of Marketing Management, Vol. 7, pp.
47-62.
Lewis, B.R. (1993), "Service Quality Measurement",
Marketing Intelligence and Planning, Vol. 11, No. 4, pp. 4-12.
Lewis, B.R., and V.W. Mitchell (1990), "Defining and
Measuring the Quality of Customer Service", Marketing
Intelligence and Planning, Vol. 8, No. 6, pp. 11-18.
Nageswar, R. (1987), "Customer Service in Banks Must
Improve", Yojana, Vol. 31, No. 13, pp. 20-31.
Nageswar, R., and P. Pramod (1990) "Customer Services and
Banks", Yojana, Vol. 34, No. 13, pp. 15- 22.
Panasuraman, A., V.A. Zeithaml, and L. L. Berry (1988),
"SERVQUAL: A Multiple Scale for Measuring Consumer
Perceptions of Service Quality", Journal of Retailing, Vol. 64,
No. 1, pp. 12-40.
Parasuraman, A., L. L. Berry, and V A. Zeithaml (1985), "A
Conceptual Model of SQ and its Implications for Future
Research", Journal of Marketing, Vol. 49, Fall, pp. 41-50.
Parasuraman, A., L. Berry, and V Zeithaml (1993), "Research
Note: More on Improving SQ Measurement", Journal of
Retailing, Vol. 69, No. 3, pp. 140-147
Parasuraman, A., L.L. Berry, and V.A. Zeithaml (1991),
"Undertaking Customer Expectations of Service", Sloan
Management Review, Vol. 32, No. 3, pp. 44.
Ram Mohan (2002), "Deregulation and Performance of
Public Sector Banks", Economic and Political Weekly, Vol. 7,
No. 5.
Rangarajan, C. (1982), "Innovation in Banking; Impact on
Deposits and Credit", Indian Express, October, p. 12.
Saleh, F, and C Ryan (1991), "Analysing Service Quality in the
Hospitality Industry Using the SERVQUAL Model", Service
Industries Journal, Vol. 11, No. 3, pp. 324-343.
Seshasai, P.V (1999), "Customer Service - Some HRD
Interventions", IBA Bulletin, Vol. 21, No. 2, pp. 11-16.
Smith, A.M. (1992), "The Consumer's Evaluation of Service
Quality: Some Methodological Issues" in Glynn, W.J., and
J.G. Barnes (1995) Understanding Services Management,
New York, John Willey & Sons, pp. 57-88.
Sundararn, S. (1984), 'Customer Service in Banks at
Crossroads', The Journal of the Indian Institute of Bankers,
Vol. 55, No. 4, pp. 217-223.
Sureshchandar, G.S., and Rajendran C. (2003), 'Customer
Perceptions of Service Quality in Banking Sector of a
Developing Economy: A Critical Analysis, International
Journal of Bank Marketing, Vol. 21, No. 5, pp. 233-242.
Takeuchi, Hv and J.A Quelch (1983), "Quality is more than
Making a Good Product", Harvard Business Review, July-
Aug,pp.l39-145.
Young, C, L. Cunningham, and M. Lee (1994), "Accessing
Service Quality as an Effective Management Tool: The Case
of Airdne Industry", Journal of Marketing, Vol. 63, Spring, pp.
76-95.
43
ETHICS IN RETAILING: PERCEPTIONS OF CONSUMERS
ABSTRACTBusiness ethics has been gaining the attention of business houses, business schools, researchers and media etc. The retail sector, being the growing sector and in direct connection with the ultimate consumers, also gives weight to ethical values. This paper thus studies the nature and extent of existing ethical values in retailing practices on the basis of information obtained from fifty randomly selected consumers from Gandhi Nagar colony of Jammu city. The findings reveal legal rules and some of the ethical values being followed satisfactorily at retail level but to some extent retailers do hoard gifts given to them by the marketers as consumer sales promotion incentives for passing on the same to the ultimate consumers, employ minors, do not protect consumer rights and also follow deceptive sales promotion. Moreover, majority of the respondents are of the opinion that retailers who are educated and senior in age are more ethical and they do abide by laws and regulations better than their less educated and younger counterparts. Finally the paper suggests an action plan for better ethical values in retailing practices.Keywords: Convenience goods, Specialty Goods, Shopping Goods
R. D. Sharma *
Bodh Raj Sharma**
BACKGROUND
Ethics plays a very significant role in every walk of life
including business and profession, and thus the same is
indispensable for the progress of any civilized society. It is in
this context there is a widespread concern about ethical
issues in different walks of life (Peterson, Rhoads & Vaught
2001). Consequently, it has gained the attention of business
firms, researchers, regulatory bodies and media etc. (Mc
Cabe, Ingram & Data-on 2006). Business Schools, have
introduced business ethics as one of the compulsory
courses in their curriculum (Abratt & Penman 2002). In fact,
the present period can be described as ‘ethics era’ (Smith
1995) because ethics alone and no other regulation can
regulate and protect the society. A business firm has to
operate in socioeconomic fabric and, thus, involves a large
number of stakeholders having different expectations
(Reynolds, Schulz & Hekman 2006, Kujala 2001 and Whysall,
1998). The aim of every business is to earn profit and satisfy
the expectations of stakeholders in a truthful manner
(Kaptein 2008, Napal 2003). It is widely said that ‘ethical
business is good business’. Those businesses which act
ethically enjoy more sales volume, profitability and strong
image, that too with increasing and sustainable market share
(Lavorata & Pontier 2005). On the contrary, businesses which
do unfair or unethical practices reduce their image,
profitability (Orlitzky, Schmidt & Rynes 2003), credibility and
even the survival of business may be in danger (Grant &
Visconti 2006, Mazzola, Ravasi & Gabbioneta 2006).
Moreover, in a modern competitive and complex business
scenario, ethics serves as a corporate strategy against the
competitors (Behnam & Rasche 2009) and thus, helps in
meeting competition. Marketing in general, and retailing in
particular, stands often criticised on the grounds of unfair and
unethical practices (Bone & Corey 2006, Akash & Lund
1994). The retailers have much more moral obligation to act
ethically while dealing with different stakeholders like
consumers, employees, suppliers, financers, government
agencies and community at large (Whysall 2000). A retailer is
said to be ethical when he acts fairly, honestly and with a
sense of respect and trustworthiness with each stakeholder.
The consumers and some other stakeholders are of the
opinion that they are being treated unethically. Even the
media being ‘the fourth pillar of democracy’, has highlighted
the unfair business practices and scandals (Berman &
Evans, 2007, p. 44). On the contrary the business concerns
and retailers claim to be doing fair practices. So there is a
controversy between the perceptions of retailers and
consumers. Ethics in retailing originates from the concept of
marketing itself. In fact, the concept of marketing not only
both starts and ends with the consumer (Kotler 2005, P. 7),
but revolves around the consumer only, indicating that the
consumer is the nucleus around whom all other marketing
activities revolve. The aim of the marketer is not only selling
but to satisfy the consumer and other stakeholders (Fassin
2009). It is in this context the retailers, being the last point in
the distribution chain (Cox & Brittain 2006), are in direct and
regular contact with ultimate consumers. The behaviour of
retailers is more significant than other intermediaries
because they affect the lives of ultimate consumers i e the
whole of the society (Abratt, Bendixen & Drop 1999).
Today the retail sector is growing day by day with the increase
in consumers’ disposable income, high spending habits and
change in consumers tastes and preferences (Bajaj, Tulip &
*Coordinator, SAP in commerce, University of Jammu, Jammu**Ph.D. Research Schoolar in Commerce, University of Jammu, Jammu
SAARANSHRKG JOURNAL OF MANAGEMENTVol . 1 No. 1 JULY 2009• •
44
Srivastava 2007, Nicholls 2002; and Whysall 1998). Keeping
in view such changes, many big business houses like
Reliance, Vishal Marts etc have been investing in retailing by
opening their shopping malls in different parts of India. The
retail sector has shown tremendous progress and has
become a prominent sector all over the world including India.
Its share to the world GDP is about 27% from both organised
and unorganised retail business (Vedamani 2008, P. 3).
Though in developed countries like USA and UK organised
retailing is dominating, yet in developing countries like India,
unorganised retailing is still dominating with over 12 million
retail outlets of different types and sizes (Bajaj, Tulip &
Srivastava 2007, p. 9). Only about 6% outlets are in organised
retail sector and remaining (94%) outlets are part of
unorganised retail business. In the year 2007, the retail
business in India was US$ 385 billion and Mc Kinsey study
estimated this increase of about US$ 1.52 trillion by the year
2025 (Vedamani 2008, P. 4). Indeed, the retail business in
India is the second largest employer after agriculture.. It is in
this context the paper studies ethical practices in Indian retail
on the basis of consumer perceptions.
REVIEW OF LITERATURE
Numerous studies have been conducted on business ethics.
Only one journal i.e. ‘Journal of Business Ethics’ has
thousands of papers on business and marketing ethics.
However the focus of these studies increasingly remained on
the areas like advertising, consumer ethics in general
marketing research etc., thus retailing practices received less
attention so far. Before taking up the empirical work under
reference, a few of the existing studies on ethical values in
retailing stand reviewed as under -
Rallapalli et. al. (1994) studied the relationship between
consumers’ ethical beliefs and their personality traits and
found that only 14 out of 40 personality traits and consumer
ethical pairs had significant relationship. Rawass, Vitell & Al-
Khatib (1994) investigated the ethical beliefs, ethical
ideologies and degree of Machiavellianism (egoism) of
consumers from two countries viz. Egypt and Lebanon and
provided that the two samples differed significantly in terms
of ethical beliefs, ethical ideologies and Machiavellianism.
They also opined that Egyptian consumers view all types of
questionable statements as more unethical than the
Labanese consumers.
Abratt, Bendixen & Drop (1999) explored the ethical beliefs of
executives, managers and retail salespeople in South Africa
by collecting data through a 38 statements based
questionnaire, covering both work related and customer
related issues. The results indicated that salespeople were
more likely to do something unethical than managers and
executives regarding both work related and customer related
factors. The authors also suggested that retailers must
formulate ethical policies and procedures for their
salespeople which must be communicated and is clearly
understood by all salespeople. Honeycutt et. al. (2001)
found age as significantly associated while education was
insignificantly associated with ethical behaviour.
Ergeneli & Ankan (2002) studied the effect of some
demographic factors like age and income etc on ethical
behaviour.and revealed that there was no significant
difference in ethical perceptions based on gender. However,
female salespeople had more ethical score than their male
counterparts at two age groups viz. less than 20 years of age
and age group of 40-49 years. Similarly, regarding the effect
of income, the results indicated that the only significance
between male and female salespeople was the income level
of 200-300 millions at which female salespeople had higher
ethical scores than male salespeople.
Dubinsky, Nataraajan & Huang (2004) investigated the
relationship between retail salespersons’ moral philosophy
(idealism and relativism) and their perceptions about
ethically troublesome situations. Factor analysis identified
five factors namely psychological pressure on customers,
salesperson deception, poor customer service, price related
items and salespersons’ excuses. The results provided that
relativism was not associated with all five factors of ethical
retail practices while idealism was negatively associated with
retail salespeople’ attitude towards four out of five factors.
The study finally suggested that retail managers should
provide training to their salespeople and should show
themselves as ethical model to their salespeople. Lavorata &
Pontier (2005) identified the ethical practices of convenience
retailers and also assessed the ultimate relevance of ethical
marketing for a retailer. The findings revealed that ethics
must be integrated into the marketing strategies of the
retailers.
Roman & Munuera (2005) in their research paper
‘Determinants and consequences of ethical behaviour: an
empirical study of salespeople’, highlighted several key
detertiments and consequences of ethical behaviour of
salespeople. The determinants of ethical behaviour were
reward system, control system, age and education. On the
other hand, the consequences were role conflict,
performance and job satisfaction. Sarma 2007, examined
the ethical practices of retailers and the ethical beliefs of
salespeople by collecting data through a questionnaire from
62 salespersons of eight major retail outlets in Guwahati. The
study found that salespeople did face ethical dilemma while
dealing with different stakeholders. The results highlighted
that retailers had no clear policies and code of ethics for
guiding their salespeople. They had developed some norms
which they communicate at the time of induction, but not
monitored thereafter.
RESEARCH METHODOLOGY
The various aspects of empirical study under reference are
summarized as under:
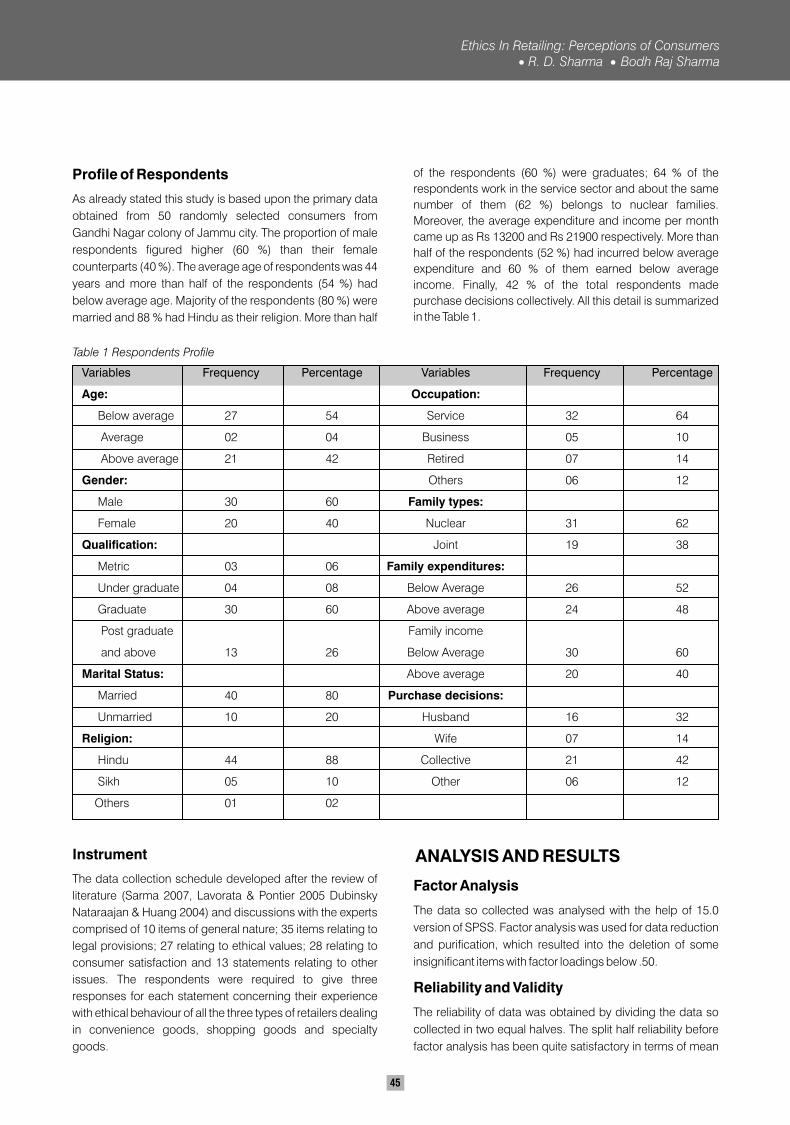
45
Profile of Respondents
As already stated this study is based upon the primary data
obtained from 50 randomly selected consumers from
Gandhi Nagar colony of Jammu city. The proportion of male
respondents figured higher (60 %) than their female
counterparts (40 %). The average age of respondents was 44
years and more than half of the respondents (54 %) had
below average age. Majority of the respondents (80 %) were
married and 88 % had Hindu as their religion. More than half
of the respondents (60 %) were graduates; 64 % of the
respondents work in the service sector and about the same
number of them (62 %) belongs to nuclear families.
Moreover, the average expenditure and income per month
came up as Rs 13200 and Rs 21900 respectively. More than
half of the respondents (52 %) had incurred below average
expenditure and 60 % of them earned below average
income. Finally, 42 % of the total respondents made
purchase decisions collectively. All this detail is summarized
in the Table 1.
Variables Frequency Percentage Variables Frequency Percentage
Age:
Below average 27 54 Service 32 64
Average 02 04 Business 05 10
Above average 21 42 Retired 07 14
Gender: Others 06 12
Male 30 60 Family types:
Female 20 40 Nuclear 31 62
Qualification: Joint 19 38
Metric 03 06 Family expenditures:
Under graduate 04 08 Below Average 26 52
Graduate 30 60 Above average 24 48
Post graduate Family income
and above 13 26 Below Average 30 60
Marital Status: Above average 20 40
Married 40 80 Purchase decisions:
Unmarried 10 20 Husband 16 32
Religion: Wife 07 14
Hindu 44 88 Collective 21 42
Sikh 05 10 Other 06 12
Others 01 02
Occupation:
Instrument
The data collection schedule developed after the review of
literature (Sarma 2007, Lavorata & Pontier 2005 Dubinsky
Nataraajan & Huang 2004) and discussions with the experts
comprised of 10 items of general nature; 35 items relating to
legal provisions; 27 relating to ethical values; 28 relating to
consumer satisfaction and 13 statements relating to other
issues. The respondents were required to give three
responses for each statement concerning their experience
with ethical behaviour of all the three types of retailers dealing
in convenience goods, shopping goods and specialty
goods.
ANALYSIS AND RESULTS
Factor Analysis
The data so collected was analysed with the help of 15.0
version of SPSS. Factor analysis was used for data reduction
and purification, which resulted into the deletion of some
insignificant items with factor loadings below .50.
Reliability and Validity
The reliability of data was obtained by dividing the data so
collected in two equal halves. The split half reliability before
factor analysis has been quite satisfactory in terms of mean
Table 1 Respondents Profile
Ethics In Retailing: Perceptions of ConsumersR. D. Sharma Bodh Raj Sharma
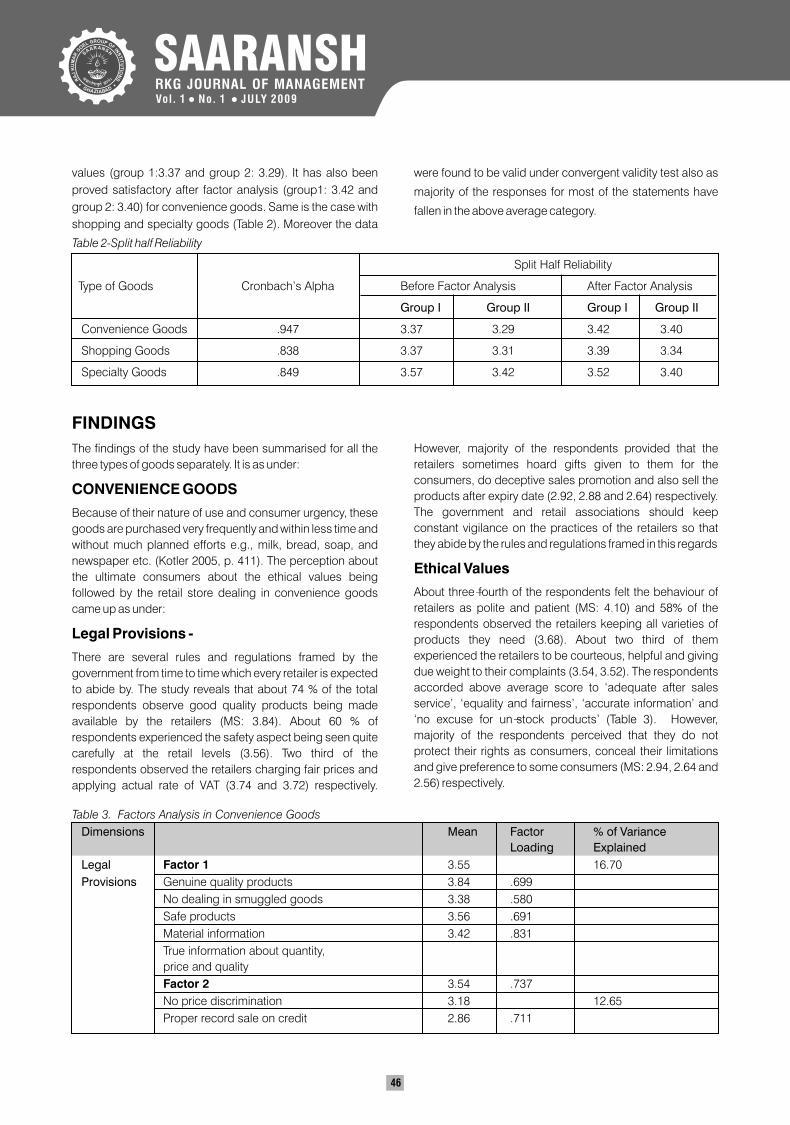
SAARANSHRKG JOURNAL OF MANAGEMENTVol . 1 No. 1 JULY 2009• •
Table 2-Split half Reliability
Split Half Reliability
Type of Goods Cronbach’s Alpha Before Factor Analysis After Factor Analysis
Group I Group II Group I Group II
Convenience Goods .947 3.37 3.29 3.42 3.40
Shopping Goods .838 3.37 3.31 3.39 3.34
Specialty Goods .849 3.57 3.42 3.52 3.40
46
values (group 1:3.37 and group 2: 3.29). It has also been
proved satisfactory after factor analysis (group1: 3.42 and
group 2: 3.40) for convenience goods. Same is the case with
shopping and specialty goods (Table 2). Moreover the data
were found to be valid under convergent validity test also as
majority of the responses for most of the statements have
fallen in the above average category.
FINDINGS
The findings of the study have been summarised for all the
three types of goods separately. It is as under:
CONVENIENCE GOODS
Because of their nature of use and consumer urgency, these
goods are purchased very frequently and within less time and
without much planned efforts e.g., milk, bread, soap, and
newspaper etc. (Kotler 2005, p. 411). The perception about
the ultimate consumers about the ethical values being
followed by the retail store dealing in convenience goods
came up as under:
Legal Provisions -
There are several rules and regulations framed by the
government from time to time which every retailer is expected
to abide by. The study reveals that about 74 % of the total
respondents observe good quality products being made
available by the retailers (MS: 3.84). About 60 % of
respondents experienced the safety aspect being seen quite
carefully at the retail levels (3.56). Two third of the
respondents observed the retailers charging fair prices and
applying actual rate of VAT (3.74 and 3.72) respectively.
However, majority of the respondents provided that the
retailers sometimes hoard gifts given to them for the
consumers, do deceptive sales promotion and also sell the
products after expiry date (2.92, 2.88 and 2.64) respectively.
The government and retail associations should keep
constant vigilance on the practices of the retailers so that
they abide by the rules and regulations framed in this regards
Ethical Values
About three-fourth of the respondents felt the behaviour of
retailers as polite and patient (MS: 4.10) and 58% of the
respondents observed the retailers keeping all varieties of
products they need (3.68). About two third of them
experienced the retailers to be courteous, helpful and giving
due weight to their complaints (3.54, 3.52). The respondents
accorded above average score to ‘adequate after sales
service’, ‘equality and fairness’, ‘accurate information’ and
‘no excuse for un-stock products’ (Table 3). However,
majority of the respondents perceived that they do not
protect their rights as consumers, conceal their limitations
and give preference to some consumers (MS: 2.94, 2.64 and
2.56) respectively.
Table 3. Factors Analysis in Convenience Goods
Dimensions Mean Factor % of Variance
Loading Explained
Legal Factor 1 3.55 16.70
Provisions Genuine quality products 3.84 .699
No dealing in smuggled goods 3.38 .580
Safe products 3.56 .691
Material information 3.42 .831
True information about quantity,
price and quality
Factor 2 3.54 .737
No price discrimination 3.18 12.65
Proper record sale on credit 2.86 .711
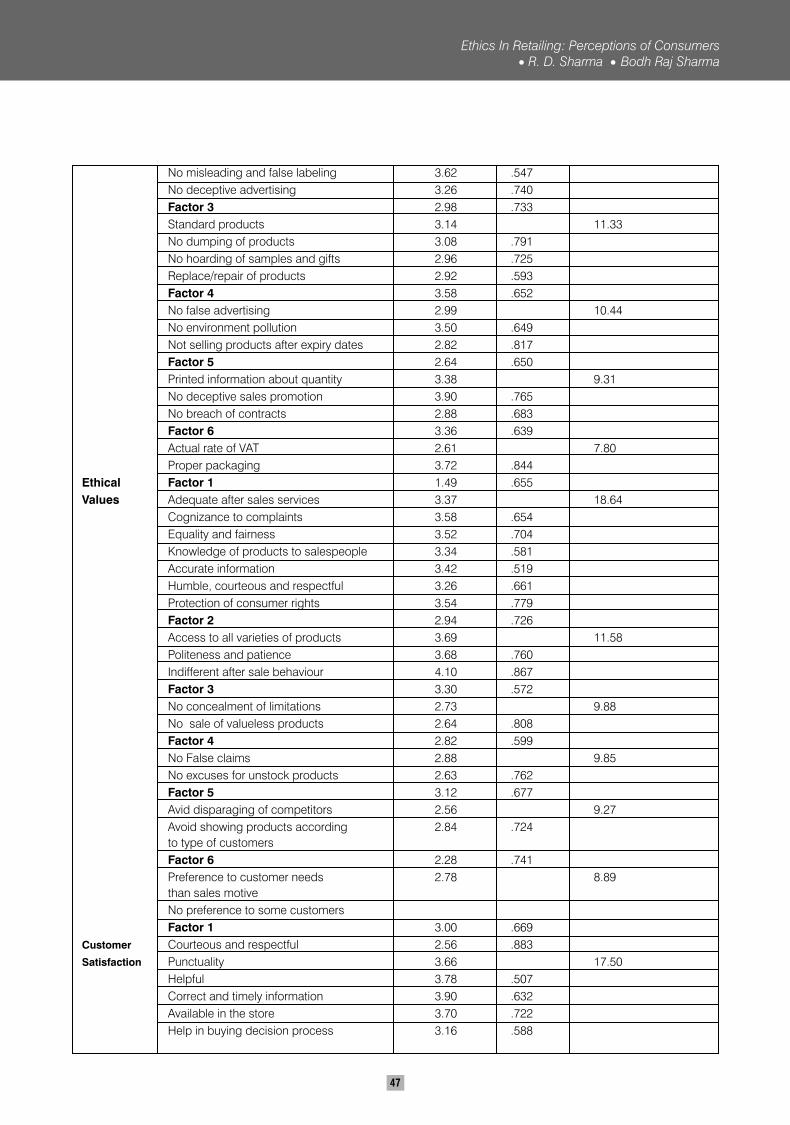
47
No misleading and false labeling 3.62 .547
No deceptive advertising 3.26 .740
Factor 3 2.98 .733
Standard products 3.14 11.33
No dumping of products 3.08 .791
No hoarding of samples and gifts 2.96 .725
Replace/repair of products 2.92 .593
Factor 4 3.58 .652
No false advertising 2.99 10.44
No environment pollution 3.50 .649
Not selling products after expiry dates 2.82 .817
Factor 5 2.64 .650
Printed information about quantity 3.38 9.31
No deceptive sales promotion 3.90 .765
No breach of contracts 2.88 .683
Factor 6 3.36 .639
Actual rate of VAT 2.61 7.80
Proper packaging 3.72 .844
Ethical Factor 1 1.49 .655
Values Adequate after sales services 3.37 18.64
Cognizance to complaints 3.58 .654
Equality and fairness 3.52 .704
Knowledge of products to salespeople 3.34 .581
Accurate information 3.42 .519
Humble, courteous and respectful 3.26 .661
Protection of consumer rights 3.54 .779
Factor 2 2.94 .726
Access to all varieties of products 3.69 11.58
Politeness and patience 3.68 .760
Indifferent after sale behaviour 4.10 .867
Factor 3 3.30 .572
No concealment of limitations 2.73 9.88
No sale of valueless products 2.64 .808
Factor 4 2.82 .599
No False claims 2.88 9.85
No excuses for unstock products 2.63 .762
Factor 5 3.12 .677
Avid disparaging of competitors 2.56 9.27
Avoid showing products according 2.84 .724
to type of customers
Factor 6 2.28 .741
Preference to customer needs 2.78 8.89
than sales motive
No preference to some customers
Factor 1 3.00 .669
Customer Courteous and respectful 2.56 .883
Satisfaction Punctuality 3.66 17.50
Helpful 3.78 .507
Correct and timely information 3.90 .632
Available in the store 3.70 .722
Help in buying decision process 3.16 .588
Ethics In Retailing: Perceptions of ConsumersR. D. Sharma Bodh Raj Sharma
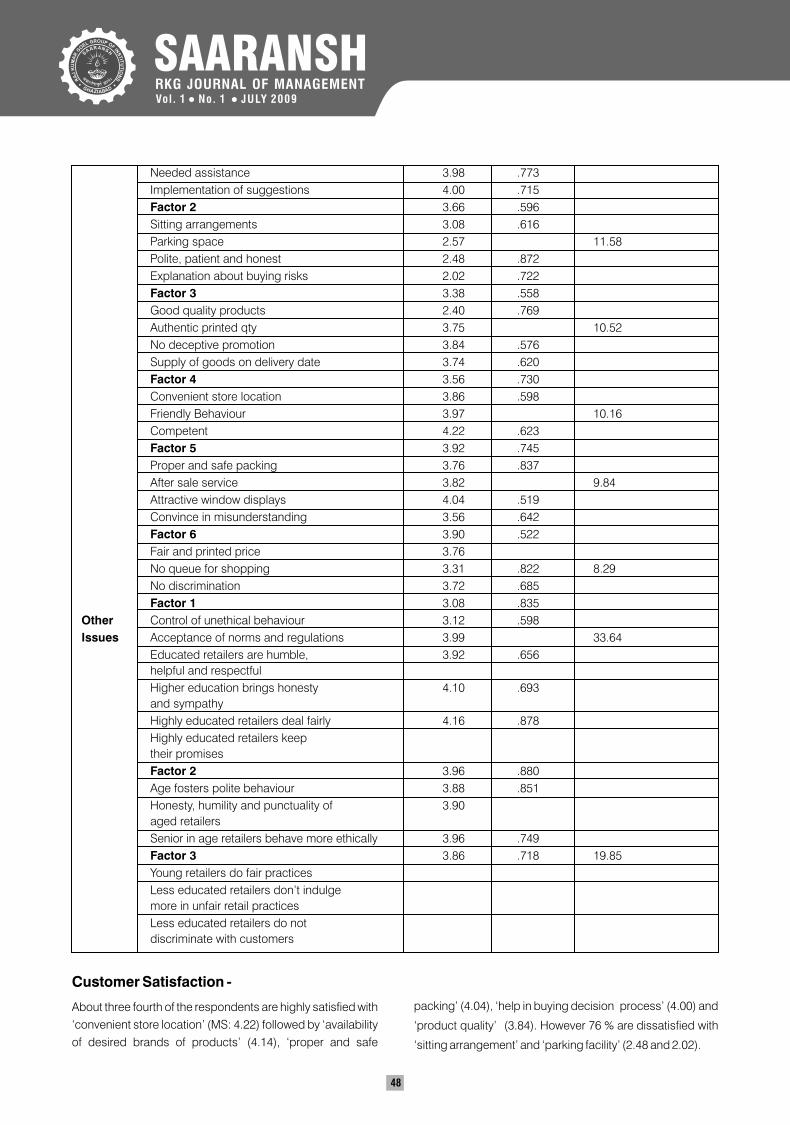
48
Needed assistance 3.98 .773
Implementation of suggestions 4.00 .715
Factor 2 3.66 .596
Sitting arrangements 3.08 .616
Parking space 2.57 11.58
Polite, patient and honest 2.48 .872
Explanation about buying risks 2.02 .722
Factor 3 3.38 .558
Good quality products 2.40 .769
Authentic printed qty 3.75 10.52
No deceptive promotion 3.84 .576
Supply of goods on delivery date 3.74 .620
Factor 4 3.56 .730
Convenient store location 3.86 .598
Friendly Behaviour 3.97 10.16
Competent 4.22 .623
Factor 5 3.92 .745
Proper and safe packing 3.76 .837
After sale service 3.82 9.84
Attractive window displays 4.04 .519
Convince in misunderstanding 3.56 .642
Factor 6 3.90 .522
Fair and printed price 3.76
No queue for shopping 3.31 .822 8.29
No discrimination 3.72 .685
Factor 1 3.08 .835
Other Control of unethical behaviour 3.12 .598
Issues Acceptance of norms and regulations 3.99 33.64
Educated retailers are humble, 3.92 .656
helpful and respectful
Higher education brings honesty 4.10 .693
and sympathy
Highly educated retailers deal fairly 4.16 .878
Highly educated retailers keep
their promises
Factor 2 3.96 .880
Age fosters polite behaviour 3.88 .851
Honesty, humility and punctuality of 3.90
aged retailers
Senior in age retailers behave more ethically 3.96 .749
Factor 3 3.86 .718 19.85
Young retailers do fair practices
Less educated retailers don’t indulge
more in unfair retail practices
Less educated retailers do not
discriminate with customers
Customer Satisfaction -
About three fourth of the respondents are highly satisfied with
‘convenient store location’ (MS: 4.22) followed by ‘availability
of desired brands of products’ (4.14), ‘proper and safe
packing’ (4.04), ‘help in buying decision process’ (4.00) and
‘product quality’ (3.84). However 76 % are dissatisfied with
‘sitting arrangement’ and ‘parking facility’ (2.48 and 2.02).
SAARANSHRKG JOURNAL OF MANAGEMENTVol . 1 No. 1 JULY 2009• •
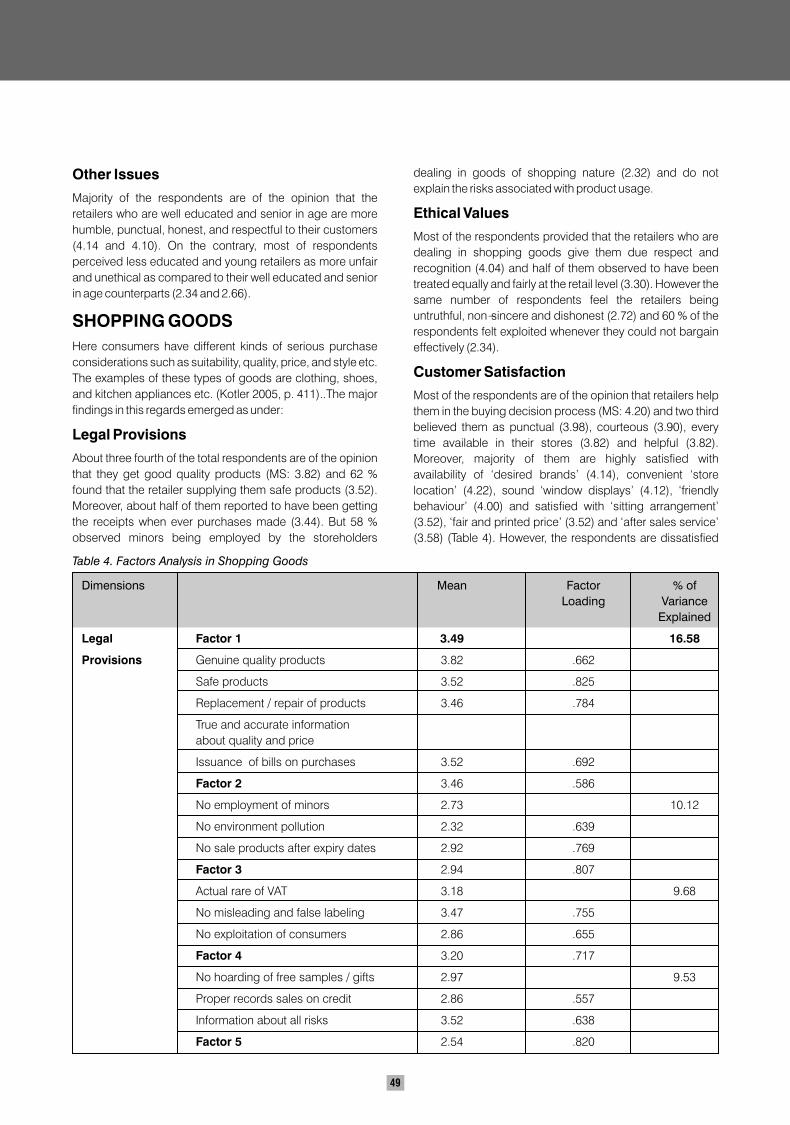
49
Other Issues
Majority of the respondents are of the opinion that the
retailers who are well educated and senior in age are more
humble, punctual, honest, and respectful to their customers
(4.14 and 4.10). On the contrary, most of respondents
perceived less educated and young retailers as more unfair
and unethical as compared to their well educated and senior
in age counterparts (2.34 and 2.66).
SHOPPING GOODS
Here consumers have different kinds of serious purchase
considerations such as suitability, quality, price, and style etc.
The examples of these types of goods are clothing, shoes,
and kitchen appliances etc. (Kotler 2005, p. 411)..The major
findings in this regards emerged as under:
Legal Provisions
About three fourth of the total respondents are of the opinion
that they get good quality products (MS: 3.82) and 62 %
found that the retailer supplying them safe products (3.52).
Moreover, about half of them reported to have been getting
the receipts when ever purchases made (3.44). But 58 %
observed minors being employed by the storeholders
Table 4. Factors Analysis in Shopping Goods
Dimensions Mean Factor % of
Loading Variance
Explained
Legal Factor 1 3.49 16.58
Provisions Genuine quality products 3.82 .662
Safe products 3.52 .825
Replacement / repair of products 3.46 .784
True and accurate information
about quality and price
Issuance of bills on purchases 3.52 .692
Factor 2 3.46 .586
No employment of minors 2.73 10.12
No environment pollution 2.32 .639
No sale products after expiry dates 2.92 .769
Factor 3 2.94 .807
Actual rare of VAT 3.18 9.68
No misleading and false labeling 3.47 .755
No exploitation of consumers 2.86 .655
Factor 4 3.20 .717
No hoarding of free samples / gifts 2.97 9.53
Proper records sales on credit 2.86 .557
Information about all risks 3.52 .638
Factor 5 2.54 .820
dealing in goods of shopping nature (2.32) and do not
explain the risks associated with product usage.
Ethical Values
Most of the respondents provided that the retailers who are
dealing in shopping goods give them due respect and
recognition (4.04) and half of them observed to have been
treated equally and fairly at the retail level (3.30). However the
same number of respondents feel the retailers being
untruthful, non-sincere and dishonest (2.72) and 60 % of the
respondents felt exploited whenever they could not bargain
effectively (2.34).
Customer Satisfaction
Most of the respondents are of the opinion that retailers help
them in the buying decision process (MS: 4.20) and two third
believed them as punctual (3.98), courteous (3.90), every
time available in their stores (3.82) and helpful (3.82).
Moreover, majority of them are highly satisfied with
availability of ‘desired brands’ (4.14), convenient ‘store
location’ (4.22), sound ‘window displays’ (4.12), ‘friendly
behaviour’ (4.00) and satisfied with ‘sitting arrangement’
(3.52), ‘fair and printed price’ (3.52) and ‘after sales service’
(3.58) (Table 4). However, the respondents are dissatisfied
Ethics In Retailing: Perceptions of ConsumersR. D. Sharma Bodh Raj Sharma
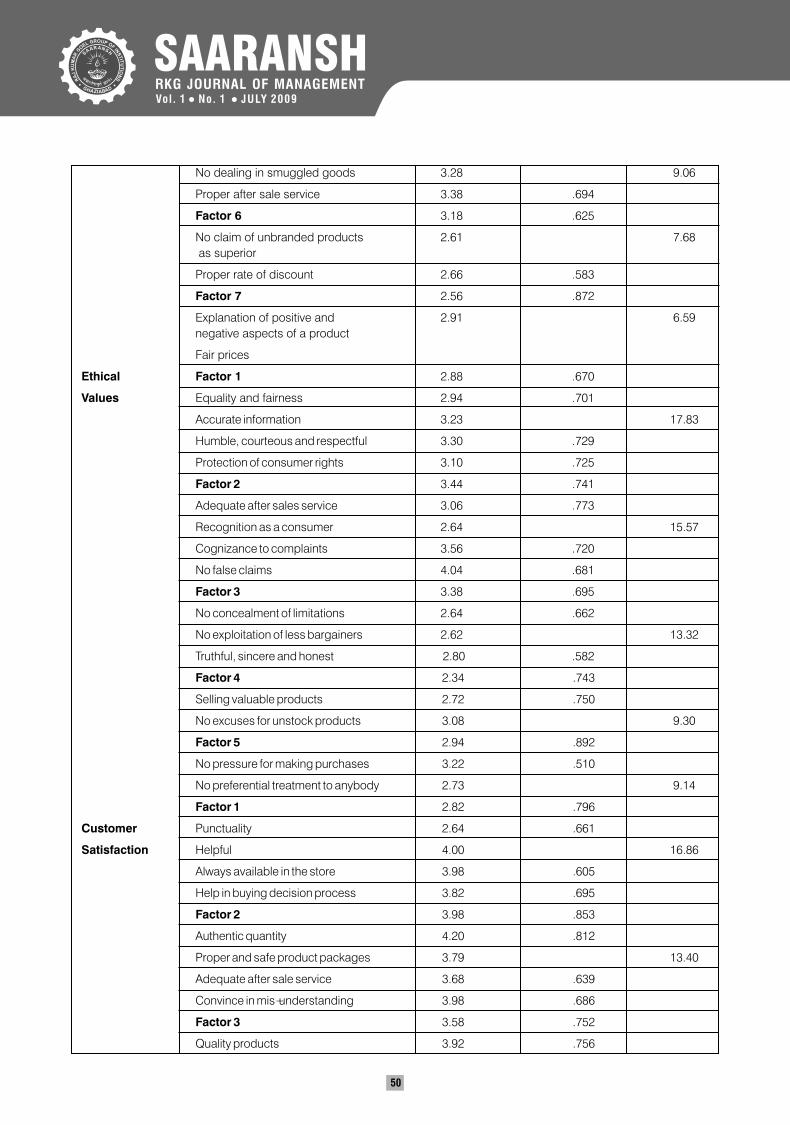
SAARANSHRKG JOURNAL OF MANAGEMENTVol . 1 No. 1 JULY 2009• •
50
No dealing in smuggled goods 3.28 9.06
Proper after sale service 3.38 .694
Factor 6 3.18 .625
No claim of unbranded products 2.61 7.68
as superior
Proper rate of discount 2.66 .583
Factor 7 2.56 .872
Explanation of positive and 2.91 6.59
negative aspects of a product
Fair prices
Ethical Factor 1 2.88 .670
Values Equality and fairness 2.94 .701
Accurate information 3.23 17.83
Humble, courteous and respectful 3.30 .729
Protection of consumer rights 3.10 .725
Factor 2 3.44 .741
Adequate after sales service 3.06 .773
Recognition as a consumer 2.64 15.57
Cognizance to complaints 3.56 .720
No false claims 4.04 .681
Factor 3 3.38 .695
No concealment of limitations 2.64 .662
No exploitation of less bargainers 2.62 13.32
Truthful, sincere and honest 2.80 .582
Factor 4 2.34 .743
Selling valuable products 2.72 .750
No excuses for unstock products 3.08 9.30
Factor 5 2.94 .892
No pressure for making purchases 3.22 .510
No preferential treatment to anybody 2.73 9.14
Factor 1 2.82 .796
Customer Punctuality 2.64 .661
Satisfaction Helpful 4.00 16.86
Always available in the store 3.98 .605
Help in buying decision process 3.82 .695
Factor 2 3.98 .853
Authentic quantity 4.20 .812
Proper and safe product packages 3.79 13.40
Adequate after sale service 3.68 .639
Convince in mis-understanding 3.98 .686
Factor 3 3.58 .752
Quality products 3.92 .756
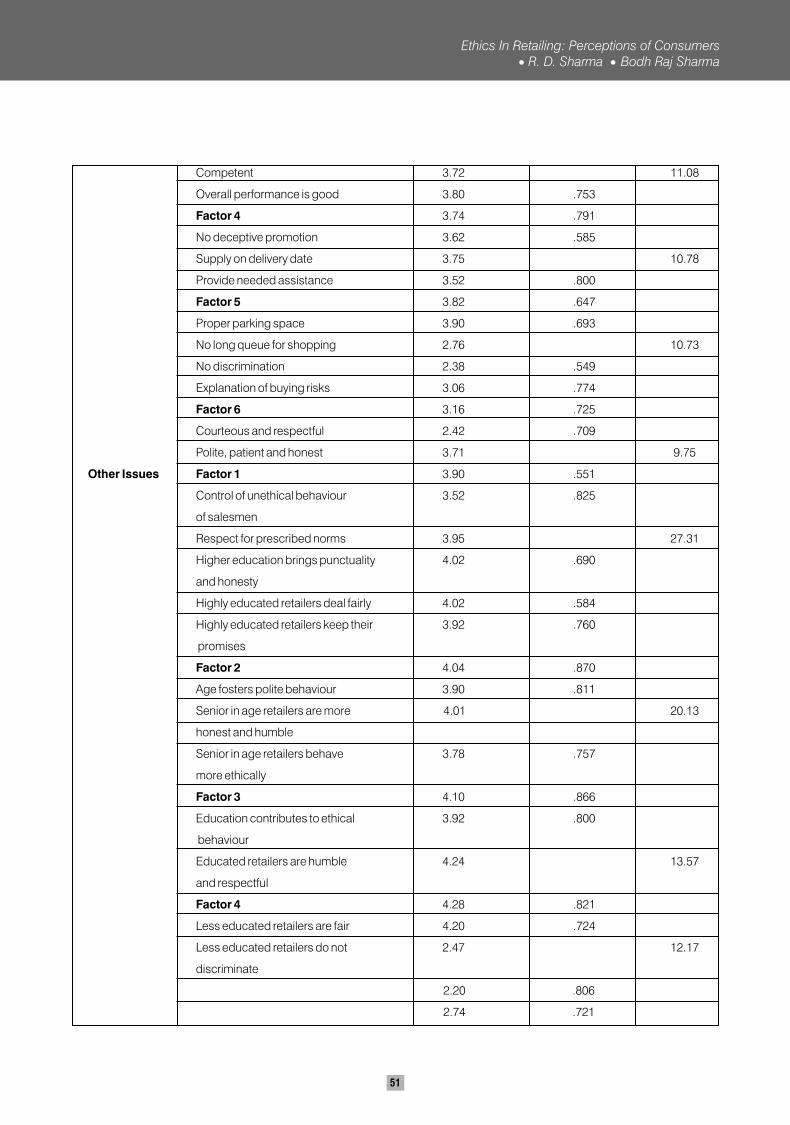
51
Competent 3.72 11.08
Overall performance is good 3.80 .753
Factor 4 3.74 .791
No deceptive promotion 3.62 .585
Supply on delivery date 3.75 10.78
Provide needed assistance 3.52 .800
Factor 5 3.82 .647
Proper parking space 3.90 .693
No long queue for shopping 2.76 10.73
No discrimination 2.38 .549
Explanation of buying risks 3.06 .774
Factor 6 3.16 .725
Courteous and respectful 2.42 .709
Polite, patient and honest 3.71 9.75
Other Issues Factor 1 3.90 .551
Control of unethical behaviour 3.52 .825
of salesmen
Respect for prescribed norms 3.95 27.31
Higher education brings punctuality 4.02 .690
and honesty
Highly educated retailers deal fairly 4.02 .584
Highly educated retailers keep their 3.92 .760
promises
Factor 2 4.04 .870
Age fosters polite behaviour 3.90 .811
Senior in age retailers are more 4.01 20.13
honest and humble
Senior in age retailers behave 3.78 .757
more ethically
Factor 3 4.10 .866
Education contributes to ethical 3.92 .800
behaviour
Educated retailers are humble 4.24 13.57
and respectful
Factor 4 4.28 .821
Less educated retailers are fair 4.20 .724
Less educated retailers do not 2.47 12.17
discriminate
2.20 .806
2.74 .721
Ethics In Retailing: Perceptions of ConsumersR. D. Sharma Bodh Raj Sharma
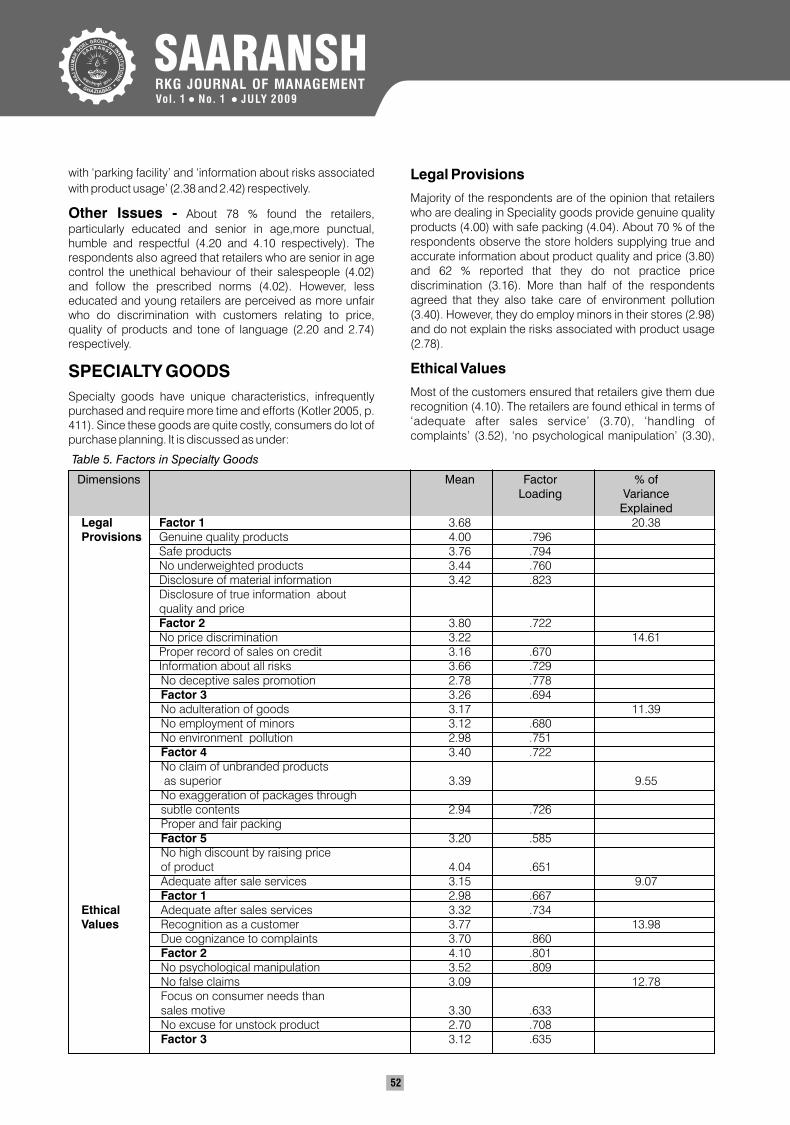
SAARANSHRKG JOURNAL OF MANAGEMENTVol . 1 No. 1 JULY 2009• •
52
with ‘parking facility’ and ‘information about risks associated
with product usage’ (2.38 and 2.42) respectively.
Other Issues - About 78 % found the retailers,
particularly educated and senior in age,more punctual, humble and respectful (4.20 and 4.10 respectively). The respondents also agreed that retailers who are senior in age control the unethical behaviour of their salespeople (4.02) and follow the prescribed norms (4.02). However, less educated and young retailers are perceived as more unfair who do discrimination with customers relating to price, quality of products and tone of language (2.20 and 2.74) respectively.
SPECIALTY GOODS
Specialty goods have unique characteristics, infrequently purchased and require more time and efforts (Kotler 2005, p. 411). Since these goods are quite costly, consumers do lot of purchase planning. It is discussed as under:
Legal Provisions
Majority of the respondents are of the opinion that retailers who are dealing in Speciality goods provide genuine quality products (4.00) with safe packing (4.04). About 70 % of the respondents observe the store holders supplying true and accurate information about product quality and price (3.80) and 62 % reported that they do not practice price discrimination (3.16). More than half of the respondents agreed that they also take care of environment pollution (3.40). However, they do employ minors in their stores (2.98) and do not explain the risks associated with product usage (2.78).
Ethical Values
Most of the customers ensured that retailers give them due recognition (4.10). The retailers are found ethical in terms of ‘adequate after sales service’ (3.70), ‘handling of complaints’ (3.52), ‘no psychological manipulation’ (3.30),
Table 5. Factors in Specialty Goods
Dimensions Mean Factor % of
ExplainedLegal Factor 1 3.68 20.38Provisions Genuine quality products 4.00 .796
Safe products 3.76 .794No underweighted products 3.44 .760Disclosure of material information 3.42 .823Disclosure of true information about quality and priceFactor 2 3.80 .722No price discrimination 3.22 14.61Proper record of sales on credit 3.16 .670Information about all risks 3.66 .729No deceptive sales promotion 2.78 .778Factor 3 3.26 .694No adulteration of goods 3.17 11.39No employment of minors 3.12 .680No environment pollution 2.98 .751Factor 4 3.40 .722No claim of unbranded products as superior 3.39 9.55No exaggeration of packages through subtle contents 2.94 .726Proper and fair packingFactor 5 3.20 .585No high discount by raising price of product 4.04 .651Adequate after sale services 3.15 9.07Factor 1 2.98 .667
Ethical Adequate after sales services 3.32 .734Values Recognition as a customer 3.77 13.98
Due cognizance to complaints 3.70 .860Factor 2 4.10 .801No psychological manipulation 3.52 .809No false claims 3.09 12.78Focus on consumer needs than sales motive 3.30 .633No excuse for unstock product 2.70 .708Factor 3 3.12 .635
Loading Variance
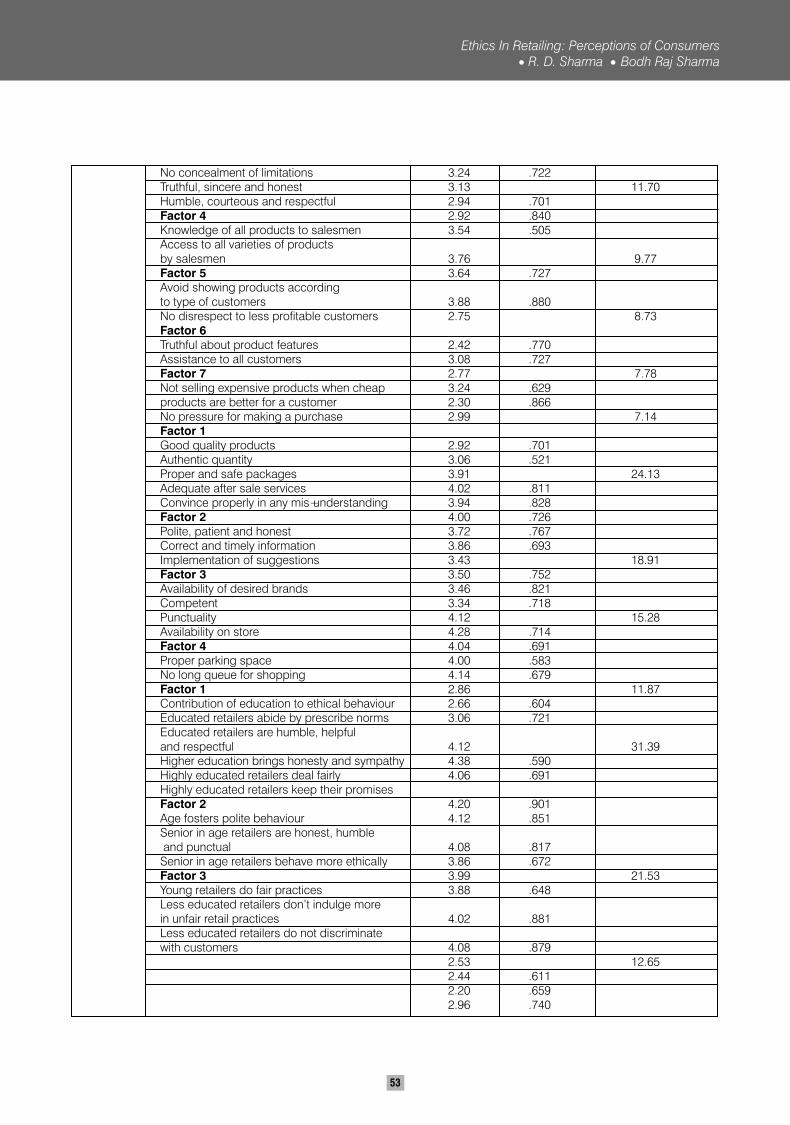
53
No concealment of limitations 3.24 .722Truthful, sincere and honest 3.13 11.70Humble, courteous and respectful 2.94 .701Factor 4 2.92 .840Knowledge of all products to salesmen 3.54 .505Access to all varieties of products by salesmen 3.76 9.77Factor 5 3.64 .727Avoid showing products accordingto type of customers 3.88 .880No disrespect to less profitable customers 2.75 8.73Factor 6Truthful about product features 2.42 .770Assistance to all customers 3.08 .727Factor 7 2.77 7.78Not selling expensive products when cheap 3.24 .629
products are better for a customer 2.30 .866No pressure for making a purchase 2.99 7.14Factor 1Good quality products 2.92 .701Authentic quantity 3.06 .521Proper and safe packages 3.91 24.13Adequate after sale services 4.02 .811Convince properly in any mis-understanding 3.94 .828Factor 2 4.00 .726Polite, patient and honest 3.72 .767Correct and timely information 3.86 .693Implementation of suggestions 3.43 18.91Factor 3 3.50 .752Availability of desired brands 3.46 .821Competent 3.34 .718Punctuality 4.12 15.28Availability on store 4.28 .714Factor 4 4.04 .691Proper parking space 4.00 .583No long queue for shopping 4.14 .679Factor 1 2.86 11.87Contribution of education to ethical behaviour 2.66 .604Educated retailers abide by prescribe norms 3.06 .721Educated retailers are humble, helpful
and respectful 4.12 31.39Higher education brings honesty and sympathy 4.38 .590Highly educated retailers deal fairly 4.06 .691Highly educated retailers keep their promisesFactor 2 4.20 .901Age fosters polite behaviour 4.12 .851Senior in age retailers are honest, humble and punctual 4.08 .817Senior in age retailers behave more ethically 3.86 .672Factor 3 3.99 21.53Young retailers do fair practices 3.88 .648Less educated retailers don’t indulge more
in unfair retail practices 4.02 .881Less educated retailers do not discriminate with customers 4.08 .879
2.53 12.652.44 .6112.20 .6592.96 .740
Ethics In Retailing: Perceptions of ConsumersR. D. Sharma Bodh Raj Sharma
SAARANSHRKG JOURNAL OF MANAGEMENTVol . 1 No. 1 JULY 2009• •
54
‘no excuse for unstock products’ (3.24) ‘focus on consumer needs than sales motive’ (3.12), ‘no disrespect to less profitable customers’ (3.08) and ‘no pressure for making a purchase’ (3.06) (Table 6). But the below average score accorded to ‘concealment of limitations’ (2.94), ‘truthful, sincere and honest’ retail behaviour (2.92), ‘ showing products according to type of customers’ (2.42) and ‘assistance to all customers’ (2.30) indicates unethical behaviour of retailers (Table 5).
Customer Satisfaction -
Customers are found highly satisfied with ‘availability of
desired brands’ (4.28), ‘retailers’ availability on store’ (4.14),
‘competency’ (4.04), ‘genuine quality products’ (4.02),
‘punctuality’ (4.00), ‘proper and safe packing’ (4.00) and are
moderately satisfied with ‘after sales service’ (3.72), ‘polite
and patient behaviour’ (3.70), ‘correct and timely information’
(3.46), ‘implementations of suggestions’ (3.37). But they
were dissatisfied with ‘proper parking facility’ (2.66)
Other Issues -
Majority of the respondents strongly agreed that education of
the retailers contributes to ethical behaviour (4.38) quite
significantly. The respondents perceived educated retailers
as more helpful and humble (4.20) and follower of prescribed
norms and regulations (4.06). The respondents felt retailers’
age fostering their polite behaviour (3.88) as they found
those senior in age as more humble and punctual (4.02) and
more ethical (4.08) than their less educated and younger
counterparts.
STRATEGIC ACTION PLAN
The strategic action plan emerging from the study is
summarized as under:
Regular and effective vigilance over the illegal retail
practices needs to be kept in place. Those who are
responsible for illegal activities should be punished and
the same be publicised.
The loopholes in existing laws coming in the way of fair
retail transactions need to be plugged immediately
Concerned agencies are required to make the retailers
aware about consumer rights and consequences if the
same are violated... Moreover consumers ought to be
sensitized about their own rights. Consumer
organisations should play their role significantly by
awakening the general public and protecting consumers.
The functioning of these organisations needs to be
monitored.
Retailers’ associations need to evolve code of conduct
for its own members. Though these associations are
formed to protect the interest of its members, yet it can
not ignore illegal transactions by its members. Similarly
ethical issues can be strengthened much more
effectively by these associations on the lines of American
Marketing Association..
l
l
l
l
l
l
l
l
l
l
l
In fact the retailers and their sales people need to
undergo some orientation training programmes to
understand customer focused retail business and ethical
operations for their own long term and sustainable
benefits and also for the benefit of the society as a whole.
Retailers should behave honestly, humbly and truthfully.
These virtues pay more and more in the long run.
It is really surprising that in this age of planned shopping
markets the customers do not find adequate parking and
sitting arrangements. In fact it the joint responsibility of
both the administration and retailers. It can also be
looked into by the consumer associations.
As observed by many earlier similar studies, the present
study also identifies the younger and less educated
retailers much more unethical in their operations as
compared to their counterparts of higher age and
qualification. Thus the study enshrines upon all the
parties concerned to make needed efforts in making the
retailers aware about the benefits they get while
behaving ethically.
FUTURE RESEARCH
No research is perfect one. The present study does remain
incomplete with regards to some of the fast emerging ethical
and legal issues in retail practices. Hence future research
needs to focus on the following considerations:
The present research is based on the perceptions of one
of the constituencies in retailing i.e. consumers. Further
research thus needs to take the perceptions of other
constituencies of retail practices like retailers, suppliers,
consumer associations, NGOs, regulatory bodies etc.
The sample size is small and that too from limited area.
Hence, future research needs to take adequately larger
sample size covering different parts of the country.
The infrances have been drawn in the present study
through mean values after proper data purification,
Moreover, reliability and validity were also examined with
split half test and convergent validity. Thus, other
techniques to measure variability in responses need to
be applied in future research.
REFERENCES
Abratt, Russell and Neale Penman (2002), Understanding
Factors Affecting Salespeople’s Perceptions of Ethical
Behavior in South Africa, Journals of Business Ethics, Vol. 35,
269-280.
Abratt, Russell, M Bendixen and K Drop (1999), Ethical
perceptions of South African retailers: management and
salespersonnel”, International Journal of Retail and
Distribution Management, Vol. 27 (2), 91-105
Akash, Ishmael P and Daulatram Lund (1994), The Influence
of Personal and Organizational Values on Marketing
55
Professionals’ Ethical Behavior, Journal of Business Ethics,
Vol. 13, 417-430.
Bajaj, Cretan, Rajneesh Tulip and Niche V Srivastava (2007),
Retail Management, Seventh Edition, Oxford University
Press, New Delhi.
Behnam, Michael and Andreas Rasche (2009), Are
Strategists from Mars and Ethicists from Venus-Strategizing
as Ethical Reflection, Journal of Business Ethics, Vol. 84, 79-
88.
Berman, Berry and Joel R Evans (2007), Retail Management,
Tenth edition, Prentice Hall of India Pvt Ltd, New Delhi..
Bone, Paula Fitzgerald and Robert John Corey (2000),
Packaging Ethics: Perceptual Difference among Packaging
Professionals, Brand Managers and Ethically-Interested
Consumers, Journal of Business Ethics, Vol. 24, 199-213.
Cox, Roger and Paul Brittain (2006), Retailing, Fifth Edition,
Pearson Education, New Delhi..
Dubinsky, Alan J, Rajan Nataraajan and Wen-Yeh Huang
(2004 ), The Influence of Moral Philosophies on Retail
Salespeople’s Ethical Perceptions, The Journal of Consumer
Affairs, Vol. 38 (2), 297-317.
Ergeneli, Azize and Semra Ankan (2000), Gender Difference
in Ethical Perceptions of Salespeople: An Empirical
Examination in Turkey, Journal of Business Ethics, Vol. 40,
247-260.
Fassin Yves (2009), The Stakeholder Model Refined, Journal
of Business Ethics, Vol. 84, 113-135.
Grant, R M and M Visconti (2006), The Strategic Background
to Corporate Accounting Scandals, Long Range Planning,
Vol. 39, 361-383.
Honeycutt, Jr Earl D, Myron Glassman; M T Zugelder and
Kiran Karande (2001), Determinants of Ethical Behaviour: A
Study of Autosalespeople, Journal of Business Ethics, Vol.
32, 69-79.
Kaptein, Muel (2008), Developing a Measure of Unethical
Behavior in the Workplace: A Stakeholder Perspective,
Journal Of Management, Vol. 34 (October), 978-1008.
Kotler Philip (2005), Marketing Management, Eleventh
edition, Pearson Education, Indian branch, Delhi.
Kujala, Johanna (2001), Analysing Moral Issues in
Stakeholder Relations, Business Ethics: A European Review,
Vol. 10, 233-247
Lavorata, Laure and Suzanne Pontier (2005),The Success of
a Retailers’ Ethical Policy: Focusing on Local Actions, The
Journal of Academy of Marketing Science Review, Vol. 2005
(12), 1-9.
Mazzola, P, D Ravasi and C Gabbioneta (2006), How to Build
Reputation in Financial Mrkets, Long Range Planning, Vol.
39, 385-407.
Mc Cabe, A Catherine, Rhea Ingram and Mary Conway Dato-
on (2006), The Business of Ethics and Gender, Journal of
Business Ethics, Vol. 64, 101-116.
Napal, Geetanee (2003), Ethical Decision Making in
Business: Focus on Mauritius, Business Ethics: A European
Review, Vol. 12 (1), 54-63.
Nicholls, Alexander James (2002), Strategic Options in Fair
Trade Retailing, International Journal of Retail and Distribution
Management, Vol. 30 (1), 6-17.
Orlitzky, M, F L Schmidt and S L Rynes (2003), Corporate
Social and Financial Performance: A Meta Analysis,
Organization Studies, Vol. 24, 403-441.
Peterson, D, A Rhoads and B C Vaught (2001), Ethical Beliefs
of Business Professionals: A Study of Gender, Age and
External Factor, Journal of Business Ethics, Vol. 31, 225-231.
Rallapali, Kumar C, Scott J Vitell, Frank A Wiebe and James H
Barnes (1994). Consumer Ethical Beliefs and Personality
Traits: An Exploratory Analysis, Journal of Business Ethics,
Vol. 13, 487-495.
Raman Sergio and J L Munuera (2005), Determinants and
Consequences of Ethical Behaviour: An Empirical Study of
Salespeople, European Journal of Marketing, Vol. 39 (5), 473-
495.
Rawwas, Mohammed Y A, Scott J Vitell and Jamal A Al-
Khatib (1994), Consumer Ethics: The Possible Effects of
Terrorism and Civil Unrest on the Ethical Values of
Consumers, Journal of Business Ethics, Vol. 13, 223-231.
Reynolds, J Scott, Frank C Schultz and David R Hekman
(2006), Stakeholder Theory and Managerial Decision
Making: Constraints and Implications of Balancing
Stakeholders’ Interests, Journal of Business Ethics, Vol. 64,
285-301.
Sarma, Nripendra Narayan (2007), Ethics in Retailing-
perception of management and sales personnel, (http://
dspace.iimk.ac.in/bitstream/2259/388/1/61-68.pdf), last
accessed on Sep 20, 2007.
Smith, N Craig (1995), Marketing Strategies for the Ethics
Era, Sloan Management Review/summer, 85-97.
Vedamani, Gibson G (2008), Retail Management, Third
Edition, Jaico Publishing House, Mumbai.
Whysall, Paul (1998), Ethical Relationship in Retailing: Some
Cautionary Tales, Business Ethics: A European Review, Vol. 7
(2), 103-110.
Whysall, Paul (2000), Stakeholder Mismanagement in
Retailing: A British Perspective, Journal of Business Ethics,
Vol. 23, 19-28.
Ethics In Retailing: Perceptions of ConsumersR. D. Sharma Bodh Raj Sharma
SAARANSHRKG JOURNAL OF MANAGEMENTVol . 1 No. 1 JULY 2009• •
56
RETAILING TREND & RETAILERS PERCEPTION: A STUDY ON BISCUIT INDUSTRY
ABSTRACT
Among food industries, Biscuit industry is the largest having a turnover of around Rs.4000 crores. The per capita consumption of biscuits in our country is 2.1 K.g., and it is increasing. The Biscuit industry comprises of the segments, the organized and unorganized. Major players in biscuits who dominate the industry were Britannia, Parle and of late ITC’s Sun feast. One of the major factors for the success of all this companies lie’s in distribution and its channel members. The nearest contact point to know about the market and consumers in channel distribution is retailers. The retailer also acts as a source of knowledge about the brands for consumers which help them in purchase decision making. As like consumer satisfaction is important for the success of the brand, the retailing trend and perception of retailers towards a brand is also more important. This study aims to bring out the retailing trend, perception & influencing attributes of retailers towards biscuit brands and industry. KEYWORDS: Retail, Food Industry, Biscuit Industry
G.Vani * M.Ganesh Babu** N.Panchanatham***
INTRODUCTION To Market the products knowing the consumers is not the only part for the companies, Also they have to concentrate the channel members. “Consumer is king”, the statement carries profound truth in it. Today the success of any firm depends upon consumer satisfaction. To contact, to convince, to stimulate the consumers, help of retailers is most important. Retailers are considered as main source to contact all kinds of consumers irrespective of market areas like rural, urban, & semi-urban. Retailers’ perception is playing a pivotal role for gaining consumer attention. This study deals with the retailing trend and perception of retailers towards biscuit industry.
OBJECTIVES OF THE STUDYFollowing are the objectives of the present study
To find out retailer perception for biscuit brands.
To find out the retailing trend in biscuit Industry.
To determine retailer preference towards biscuit brands.
To find the attribute which highly influence the retailer.
SOURCES OF DATAData was gathered mainly from primary sources. Data from primary sources have been collected mainly by conducting survey with the help of structured, undisguised questionnaire.
GEOGRAPHICAL AREA OF STUDYThe survey was done in the city of Chennai, covering the following areas- Adyar, Mylapore, Ashok Nagar, T. Nagar, Tambaram, Triplicane, Thiruvanmiyur, Guindy, Saidapet, Vadapalani, Poonamalle, Porur and Paris.
SAMPLEThe elements were chosen non-probabilistically as per the “Convenience sampling” approach. The respondents are infinite in numbers. The number of respondents selected was 200. The study area is broadly classified in to three Locations such as Urban, Semi-urban and Rural.
l
l
l
l
LIMITATIONSFollowing are the limitations of the study
The study is based on the attitude and preference of respondents. This attitude may change.
The sampling size of retailers is two hundred. This does not represent the exhaustive population of respondents.
This study was restricted to Chennai City.
Some time the wrong opinion expressed by the respondent can also affect genuinity of the results.
TOOLS USED IN ANALYSIS OF DATAThe following statistical tests were used to analyse the data collected: 1. Percentage Analysis and 2. Chi-Square Test. The square of a standard normal variate is called chi-square variate with 1 degree of freedom, i.e., if x variable is normally
mdistributed with mean and standard deviation {(X-M)/O}2 is a chi-square variate with 1d.f abbreviated by the letter X2 of the Greek Alphabet).
If x , x ,……x are n independent random variables following 1 2 nnormal distribution with mean , and standard deviation O mrespectively, then the variate,
2 2 c = S (O – E) / E
which the sum of squares of n independent standard normal variate, follows Chi-square distribution with n degrees of freedom.
2 The chi-square, denoted by the Greek letter c, is frequency
used testing hypothesis concerning the difference between a set of observed frequencies. In other words, a test statistic which measures the discrepancy between observed
2frequencies e, e,…….…e is called Chi-square (c) 1 2 n
statistic.
Where E = Row Total * Column Total
Grand Total
l
l
l
l
*Faculty, Marketing and HR, Acharya Institute of Technology, Bangalore 560090, India**Assistant Manager, ICICI Bank, Bangalore, India***Professor & Head Department of Business Administration, Annamalai University, Chidambaram, Tamil Nadu
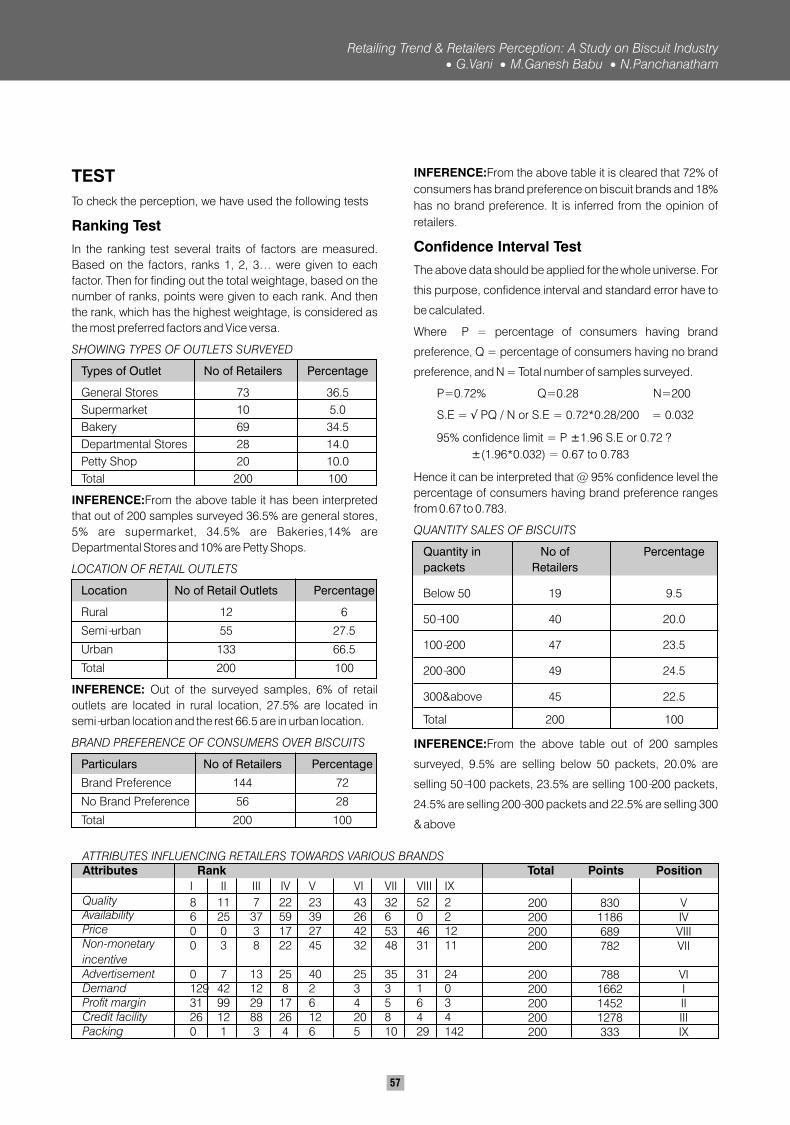
57
TEST
To check the perception, we have used the following tests
Ranking Test
In the ranking test several traits of factors are measured.
Based on the factors, ranks 1, 2, 3… were given to each
factor. Then for finding out the total weightage, based on the
number of ranks, points were given to each rank. And then
the rank, which has the highest weightage, is considered as
the most preferred factors and Vice versa.
SHOWING TYPES OF OUTLETS SURVEYED
Types of Outlet No of Retailers Percentage
General Stores 73 36.5
Supermarket 10 5.0
Bakery 69 34.5
Departmental Stores 28 14.0
Petty Shop 20 10.0
Total 200 100
INFERENCE:From the above table it has been interpreted
that out of 200 samples surveyed 36.5% are general stores,
5% are supermarket, 34.5% are Bakeries,14% are
Departmental Stores and 10% are Petty Shops.
LOCATION OF RETAIL OUTLETS
Location No of Retail Outlets Percentage
Rural 12 6
Semi-urban 55 27.5
Urban 133 66.5
Total 200 100
INFERENCE: Out of the surveyed samples, 6% of retail
outlets are located in rural location, 27.5% are located in
semi-urban location and the rest 66.5 are in urban location.
BRAND PREFERENCE OF CONSUMERS OVER BISCUITS
Particulars No of Retailers Percentage
Brand Preference 144 72
No Brand Preference 56 28
Total 200 100
INFERENCE:From the above table it is cleared that 72% of
consumers has brand preference on biscuit brands and 18%
has no brand preference. It is inferred from the opinion of
retailers.
Confidence Interval Test
The above data should be applied for the whole universe. For
this purpose, confidence interval and standard error have to
be calculated.
Where P = percentage of consumers having brand
preference, Q = percentage of consumers having no brand
preference, and N = Total number of samples surveyed.
P=0.72% Q=0.28 N=200
S.E = ? PQ / N or S.E = 0.72*0.28/200 = 0.032
95% confidence limit = P ±1.96 S.E or 0.72 ?
±(1.96*0.032) = 0.67 to 0.783
Hence it can be interpreted that @ 95% confidence level the
percentage of consumers having brand preference ranges
from 0.67 to 0.783.
QUANTITY SALES OF BISCUITS
Quantity in No of Percentage
packets Retailers
Below 50 19 9.5
50-100 40 20.0
100-200 47 23.5
200-300 49 24.5
300&above 45 22.5
Total 200 100
INFERENCE:From the above table out of 200 samples
surveyed, 9.5% are selling below 50 packets, 20.0% are
selling 50-100 packets, 23.5% are selling 100-200 packets,
24.5% are selling 200-300 packets and 22.5% are selling 300
& above
ATTRIBUTES INFLUENCING RETAILERS TOWARDS VARIOUS BRANDSAttributes Rank Total Points Position
QualityAvailabilityPriceNon-monetary
incentiveAdvertisementDemandProfit marginCredit facility
Packing
I II III IV V VI VII VIII IX
8 11 7 22 23 43 32 52 26 25 37 59 39 26 6 0 20 0 3 17 27 42 53 46 120 3 8 22 45 32 48 31 11
0 7 13 25 40 25 35 31 24129 42 12 8 2 3 3 1 031 99 29 17 6 4 5 6 326 12 88 26 12 20 8 4 40 1 3 4 6 5 10 29 142
200 830 V200 1186 IV200 689 VIII200 782 VII
200 788 VI200 1662 I200 1452 II200 1278 III200 333 IX
Retailing Trend & Retailers Perception: A Study on Biscuit IndustryG.Vani M.Ganesh Babu N.Panchanatham
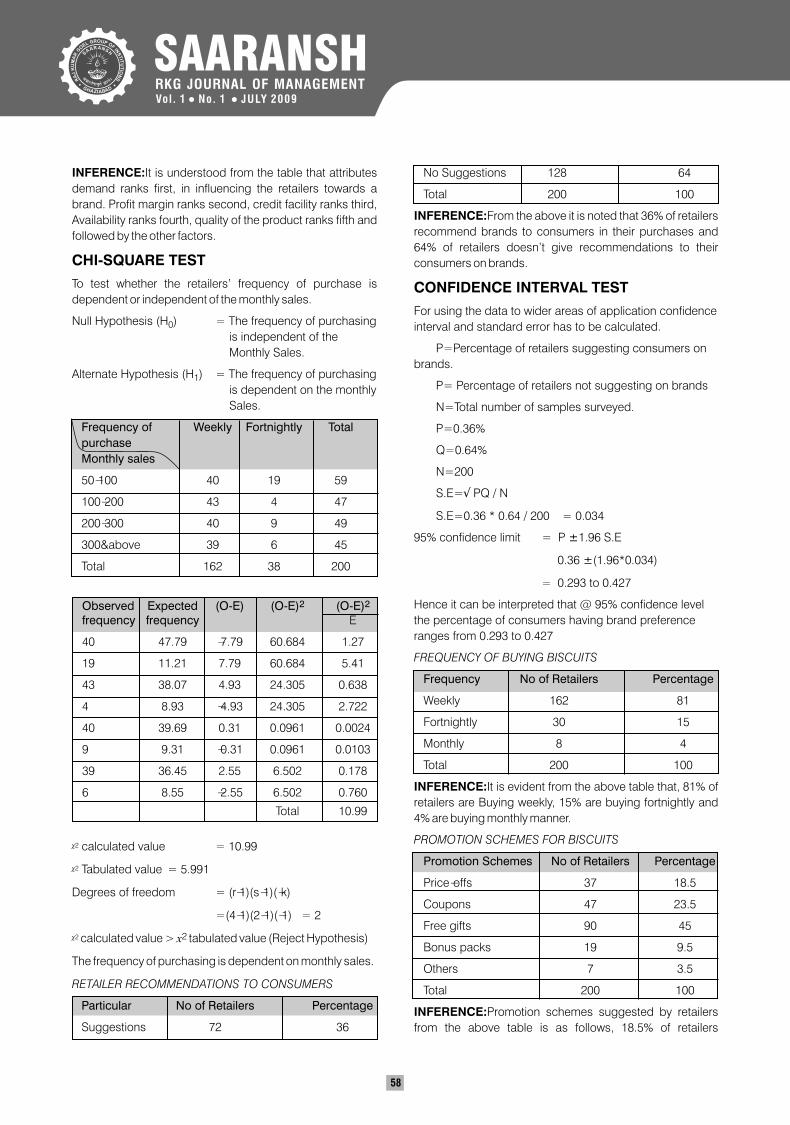
SAARANSHRKG JOURNAL OF MANAGEMENTVol . 1 No. 1 JULY 2009• •
58
INFERENCE:It is understood from the table that attributes
demand ranks first, in influencing the retailers towards a
brand. Profit margin ranks second, credit facility ranks third,
Availability ranks fourth, quality of the product ranks fifth and
followed by the other factors.
CHI-SQUARE TEST
To test whether the retailers’ frequency of purchase is
dependent or independent of the monthly sales.
Null Hypothesis (H ) = The frequency of purchasing 0
is independent of the
Monthly Sales.
Alternate Hypothesis (H ) = The frequency of purchasing 1
is dependent on the monthly
Sales.
Frequency of
purchase
Monthly sales
50-100 40 19 59
100-200 43 4 47
200-300 40 9 49
300&above 39 6 45
Total 162 38 200
c2 calculated value = 10.99
c2 Tabulated value = 5.991
Degrees of freedom = (r-1)(s-1)(-k)
=(4-1)(2-1)(-1) = 2
c2 2 calculated value > x tabulated value (Reject Hypothesis)
The frequency of purchasing is dependent on monthly sales.
RETAILER RECOMMENDATIONS TO CONSUMERS
Particular No of Retailers Percentage
Suggestions 72 36
Weekly Fortnightly Total
2 2Observed Expected (O-E) (O-E) (O-E)frequency frequency E
40 47.79 -7.79 60.684 1.27
19 11.21 7.79 60.684 5.41
43 38.07 4.93 24.305 0.638
4 8.93 -4.93 24.305 2.722
40 39.69 0.31 0.0961 0.0024
9 9.31 -0.31 0.0961 0.0103
39 36.45 2.55 6.502 0.178
6 8.55 -2.55 6.502 0.760
Total 10.99
No Suggestions 128 64
Total 200 100
INFERENCE:From the above it is noted that 36% of retailers
recommend brands to consumers in their purchases and
64% of retailers doesn’t give recommendations to their
consumers on brands.
CONFIDENCE INTERVAL TEST
For using the data to wider areas of application confidence
interval and standard error has to be calculated.
P=Percentage of retailers suggesting consumers on
brands.
P= Percentage of retailers not suggesting on brands
N=Total number of samples surveyed.
P=0.36%
Q=0.64%
N=200
S.E=Ö PQ / N
S.E=0.36 * 0.64 / 200 = 0.034
95% confidence limit = P ±1.96 S.E
0.36 ±(1.96*0.034)
= 0.293 to 0.427
Hence it can be interpreted that @ 95% confidence level
the percentage of consumers having brand preference
ranges from 0.293 to 0.427
FREQUENCY OF BUYING BISCUITS
Frequency No of Retailers Percentage
Weekly 162 81
Fortnightly 30 15
Monthly 8 4
Total 200 100
INFERENCE:It is evident from the above table that, 81% of
retailers are Buying weekly, 15% are buying fortnightly and
4% are buying monthly manner.
PROMOTION SCHEMES FOR BISCUITS
Promotion Schemes No of Retailers Percentage
Price-offs 37 18.5
Coupons 47 23.5
Free gifts 90 45
Bonus packs 19 9.5
Others 7 3.5
Total 200 100
INFERENCE:Promotion schemes suggested by retailers
from the above table is as follows, 18.5% of retailers
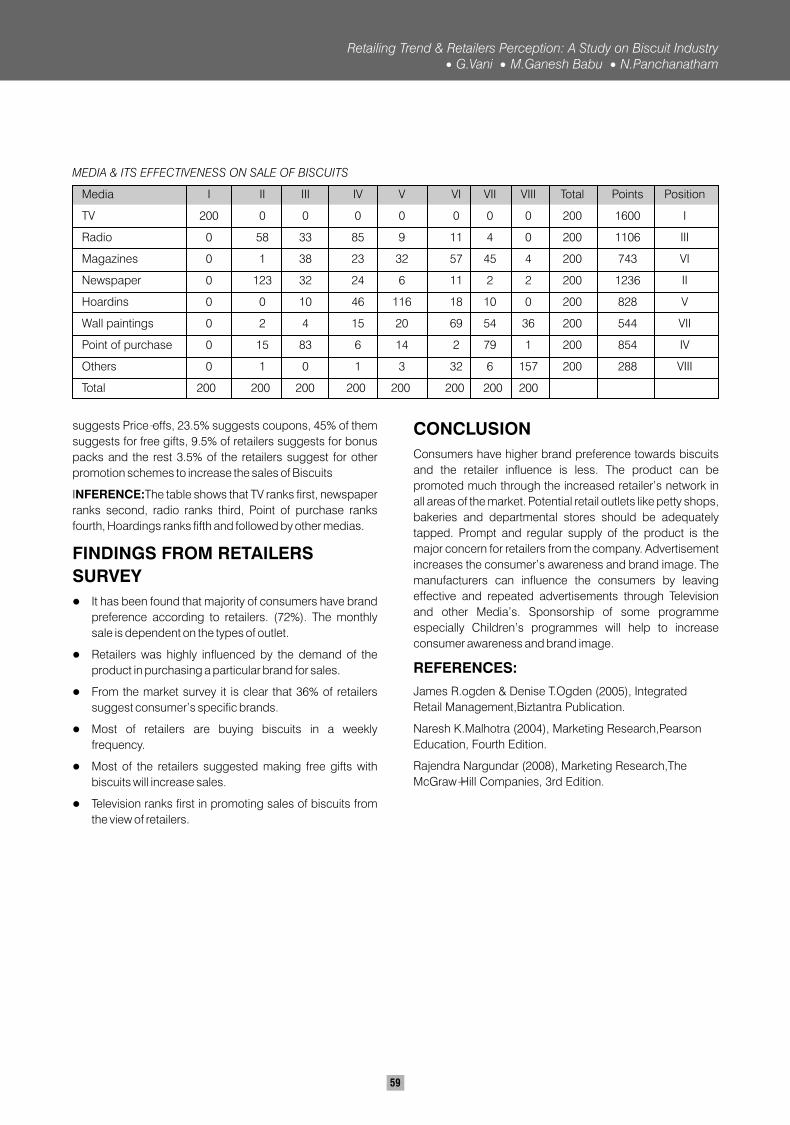
59
MEDIA & ITS EFFECTIVENESS ON SALE OF BISCUITS
Media I II III IV V VI VII VIII Total Points Position
TV 200 0 0 0 0 0 0 0 200 1600 I
Radio 0 58 33 85 9 11 4 0 200 1106 III
Magazines 0 1 38 23 32 57 45 4 200 743 VI
Newspaper 0 123 32 24 6 11 2 2 200 1236 II
Hoardins 0 0 10 46 116 18 10 0 200 828 V
Wall paintings 0 2 4 15 20 69 54 36 200 544 VII
Point of purchase 0 15 83 6 14 2 79 1 200 854 IV
Others 0 1 0 1 3 32 6 157 200 288 VIII
Total 200 200 200 200 200 200 200 200
suggests Price-offs, 23.5% suggests coupons, 45% of them
suggests for free gifts, 9.5% of retailers suggests for bonus
packs and the rest 3.5% of the retailers suggest for other
promotion schemes to increase the sales of Biscuits
INFERENCE:The table shows that TV ranks first, newspaper
ranks second, radio ranks third, Point of purchase ranks
fourth, Hoardings ranks fifth and followed by other medias.
FINDINGS FROM RETAILERS
SURVEY
It has been found that majority of consumers have brand
preference according to retailers. (72%). The monthly
sale is dependent on the types of outlet.
Retailers was highly influenced by the demand of the
product in purchasing a particular brand for sales.
From the market survey it is clear that 36% of retailers
suggest consumer’s specific brands.
Most of retailers are buying biscuits in a weekly
frequency.
Most of the retailers suggested making free gifts with
biscuits will increase sales.
Television ranks first in promoting sales of biscuits from
the view of retailers.
l
l
l
l
l
l
CONCLUSION
Consumers have higher brand preference towards biscuits
and the retailer influence is less. The product can be
promoted much through the increased retailer’s network in
all areas of the market. Potential retail outlets like petty shops,
bakeries and departmental stores should be adequately
tapped. Prompt and regular supply of the product is the
major concern for retailers from the company. Advertisement
increases the consumer’s awareness and brand image. The
manufacturers can influence the consumers by leaving
effective and repeated advertisements through Television
and other Media’s. Sponsorship of some programme
especially Children’s programmes will help to increase
consumer awareness and brand image.
REFERENCES:
James R.ogden & Denise T.Ogden , Integrated
Retail Management,Biztantra Publication.
Naresh K.Malhotra , Marketing Research,Pearson
Education, Fourth Edition.
Rajendra Nargundar , Marketing Research,The
McGraw-Hill Companies, 3rd Edition.
(2005)
(2004)
(2008)
Retailing Trend & Retailers Perception: A Study on Biscuit IndustryG.Vani M.Ganesh Babu N.Panchanatham
SAARANSHRKG JOURNAL OF MANAGEMENTVol . 1 No. 1 JULY 2009• •
60
DOES CADRE DIFFERENCE AND CERTAIN DEMOGRAPHIC FACTORS
INFLUENCE ETHICAL ORIENTATION: A STUDY AMONG BANK PERSONNEL
Anand R. Krishnan* M. M. Sulphey**
ABSTRACTOrganizational ethics is defined as ‘the generally accepted standards that guide behaviour in business and other organizational contexts’. It is the study and philosophy of human conduct, with an emphasis on determining what is right and wrong. There is increasing realization about the importance of ethics in business, and it is now opined that good ethics means good business. Due to the importance of organizational ethics, currently most organizations are giving the due emphasis on providing ethical training to their employees. This is all the more important in that case of banks as they have a strong bearing on the financial well being of the individual and the society. The present study analyses the relationship between certain demographic factors and cadre differentials in the ethical orientation of banking personnel. Results of the study suggest that demographic factors and cadre differentials have no bearing on the ethical orientation of banking personnel. KEYWORDS: Retail, Food Industry, Biscuit Industry
INTRODUCTIONAll over the world there is growing realization that ethics is important for any business and to achieve progress of any society. Ethics is of assistance generation of an efficient economy. An ethically responsible company is one which has developed a culture of caring for people and environment, a culture which flows downwards from the top managers and leaders. Ethics can be described as the methodical and systematic elaboration of norms and values that appeal to in the day to day activities of any organization. Though organizational ethics is one factor that is of immense importance, it is an overlooked and misunderstood concept in the corporate world. Many organisations have failed in realizing the importance of organizational ethics and its implementation. Some of the business leaders are of the opinion that personal moral development and character modulation of employees are needed for implementation of effective organizational ethics. It is often agreed that high ethical standards require both organizations and individuals to conform to sound moral principles. Organizational practices and polices tend to create pressures, opportunities and incentives that may sway employees to make unethical decisions. An individual’s personal values and moral philosophies influence in the decision making process that involves potential legal and ethical problems. There is no second opinion that good ethics means good business. Corporate leaders need to be aware of the facts that, if not for moral reasons, then for the simple business reason, good ethics will pay off in the long run. According to Greenberg (2005), these benefits take several forms including improved financial performance, reduced operating cost, enhanced corporate reputation and increased ability to attract and retain employees.
REVIEW OF LITERATUREExperts have attempted to define the term ‘ethics’ and it has
different meanings to different people. It is defined in The
American Heritage Dictionary of the English Language
(2005) as - A set of principles of right conduct, It is derived
from a theory or a system of moral values, It is study of the
general nature of morals and of the specific moral choices to
be made by a person; moral philosophy, It is a set of rules or
standards governing the conduct of a person or the
members of a profession. Shea (1988) defines ethics as the
principle of conduct governing an individual or a profession
and ‘standards of behavior’. Ethics, according to Ferrell
(2005) is ‘the study and philosophy of human conduct, with
an emphasis on the determination of right and wrong’. It is
often said that, ethics in the workplace refers to rules
governing the conduct of organizational members. Le Clair,
et al (1998) defines it as ‘generally accepted standards that
guide behaviour in business and other organizational
contexts. Thus it can be stated that most definitions of ethics
point to the direction of what is right or wrong, in specific
situations. Understanding the importance of organizational
ethics, most organizations are giving emphasis on giving
ethical training to their employees. Even experienced
managers are provided formal training about workplace
ethics to help them in identifying the legal and ethical issues.
Changing regulatory requirements and ethical concerns,
such as workplace privacy issues, make the ethical decision
making process very dynamic. Peterson, (2006) is of the
opinion that if a strong bond is established between values
and training, a manager will be in a better position to assist
*Probationary Officer with Federal Bank Ltd.**Professor, TKM Institute of Management, Kollam
61
employees, and provide ethical leadership. Ethical issues in financial organizations are having more importance because; they bear on our financial wellbeing. Ethical misconduct, whether it is by individuals acting alone or by financial institutions in general, has the potential to rob people of their life savings. Because so much of money is involved in financial dealings, there must be well developed and effective safeguards in place to ensure personal and organizational ethics. Further, strong emphasis must be placed on the integrity of finance professionals and on ethical leadership in our financial institutions. Some of the principles in finance ethics are similar to some other aspects of business, especially duties of fiduciaries and fairness in sales practices and securities markets. However, according to Boatright (2007), certain activities as insider trading and hostile take over raise unique issues that require special consideration. Banking has become an integral part of our existence. The “Banking Industry” is different from other industries and is a labour intensive, multi-purpose service industry. The bulk of its capital consists of borrowed fund. Their activities are rigidly watched and regulated by controls. Therefore human skills in management decide the efficiency of their productivity and profitability. According to Kern (2003) though high-tech mechanization and computerization in banks have increased the efficiency of the banking system, they have not guaranteed the elimination of frauds and evil practices. However, concealment of fraudulent actions by the culprit for a long time is next to impossible, due to mechanical and computerized means of detection. But still, there is always a risk of embezzlement by ingenious electronic means, which may not be easily traceable. This type of cyber crime calls for appropriate systems of surveillance over bank officials. There is a dire need for comprehensive and effective vigilance procedures, as also close electronic surveillance over balances in large or sensitive accounts, to begin with. E-banking, though much convenient, is not immune to security lapses arising out of cyber crimes such as electronic forgery, illegal transfer of funds from high value accounts, input and o u t p u t m a n i p u l a t i o n t h r o u g h h a c k i n g e t c .Systematic studies in ethics and ethical orientation have been reported among students . (Stanga and Turpen (1991), Pressely and Blevins (1984), Schaupp (1989), Kayanama (1996), Borkowski and Urgas, (1992); as well as in various professions like dentistry (Bebeau et.al., 1985, Shashidhar, 2005), professional counseling (Volker 1979), accounting (Shaub 1989) auditing (Finn et al. 1988), marketing (Sparks and Hunt 1998), etc.
Studies on ethical orientation of MBA students were conducted by various researchers. According to Stanga and Turpen (1991), most students could not behave in unethical ways. White and Dooley (1993), state that ‘practicality’ are more important than ‘ethicality’ for the students. Pressely and Blevins (1984) found that students believe that they must adopt a ‘winning is everything’ philosophy. On a comparison between students of business and other discipline, Lane and Schaupp (1989), established that business students have different ethical beliefs as compared to students of other disciplines. According to Kayanama (1996), undergraduates are more ethically sensitive than graduate students. Confirming this Borkowski and Urgas, (1992) states that undergraduates are more ‘justice’ oriented and graduate students are more ‘utilitarian’. In a study conducted by Shashidhar (2005) among Dentistry students, it was found that faculty and students perceived that the institution’s ethical culture was equally influenced by factors like Self-Centered, Consensual, and Universal Morality. Further,
certain other factors like academic experience and psychological distress were found to influence faculty perceptions of institutional ethics. Spark and Hunt (1998) explored the ethical sensitivity of marketing researchers and found out that, among other things, the sample of practitioners was more sensitive to research ethics issues than a sample of students in marketing. They concluded that “the greater ethical sensitivity exhibited by marketing practitioners can be attributed to their socialization into their marketing research profession, that is, by their learning the ethical norms of marketing research”. However, Goolsby and Hunt (1992) found that marketing practitioners compare favorably than other social groups in their level of cognitive moral development. They found out that marketers scoring high on cognitive moral development tend to be female, highly educated as well as high in social responsibility. Finn et al. (1988), in an investigation among auditors, found that discouraging unethical behavior by the top management will reduce the ethical problems that subordinates perceive. It was also established that ethical orientation is related to ethical judgments in high moral intensity situations. Shaub (1989) found a negative relationship between relativism and ethical sensitivity. This was further established by Spark and Hunt (1998) when they found a significant negative relationship between ethical sensitivity and formal training received by respondents. Cole et al. (2000) explored weather cognitive moral development moderates the relationship between the desirability of consequences to self versus others and ethics, and found no significant relationship. Brief et al. (1996) established that personal values had a little effect on ethical judgments. Values maintained in organizations and its impact on employee’s commitment was the area of study by Hunt et al (1989) wherein they established that organisations that have high ethical values will have employees who are extremely committed to the organizational welfare. A more or less similar result was obtained in a study conducted by Vitell and Paolillo (2003) when it found out that there existed a link between organizational commitment and decision maker’s perception that ethics should be a long term, top priority of the organization. McCoy (2003) found out that ethical leadership plays a vital role in influencing the behaviour of employees in the organization. Perceived organizational ethical culture is also indirectly related to ethical judgments, as ethical culture directly affects individual values and judgments. In a classical study conducted by Fraedrich and Ferrell (1992) it was established that only 15 per cent of the sample of business person’s maintained the same moral philosophy across both work and non work ethical decision making situations. A review of literature revealed that a number of studies have been undertaken linking ethics, ethical orientation, etc. with different variables. However, studies linking ethical orientation and cadre difference as well as demographic variables are scarce. The present study attempts to bridge this gap
METHODOLOGYObjectivesThe objectives of the study are to find out if there exists any difference in ethical orientation between:
Clerks and officers, Male and female employees, andThe employees based on certain other demographic characteristics like educational qualifications, number of promotions and income earned, in banking organizations.
l
l
l
Does Cadre Difference and Certain Demographic Factors Influence Ethical Orientation: A Study among Bank Personnel
Anand R. Krishnan M. M. Sulphey
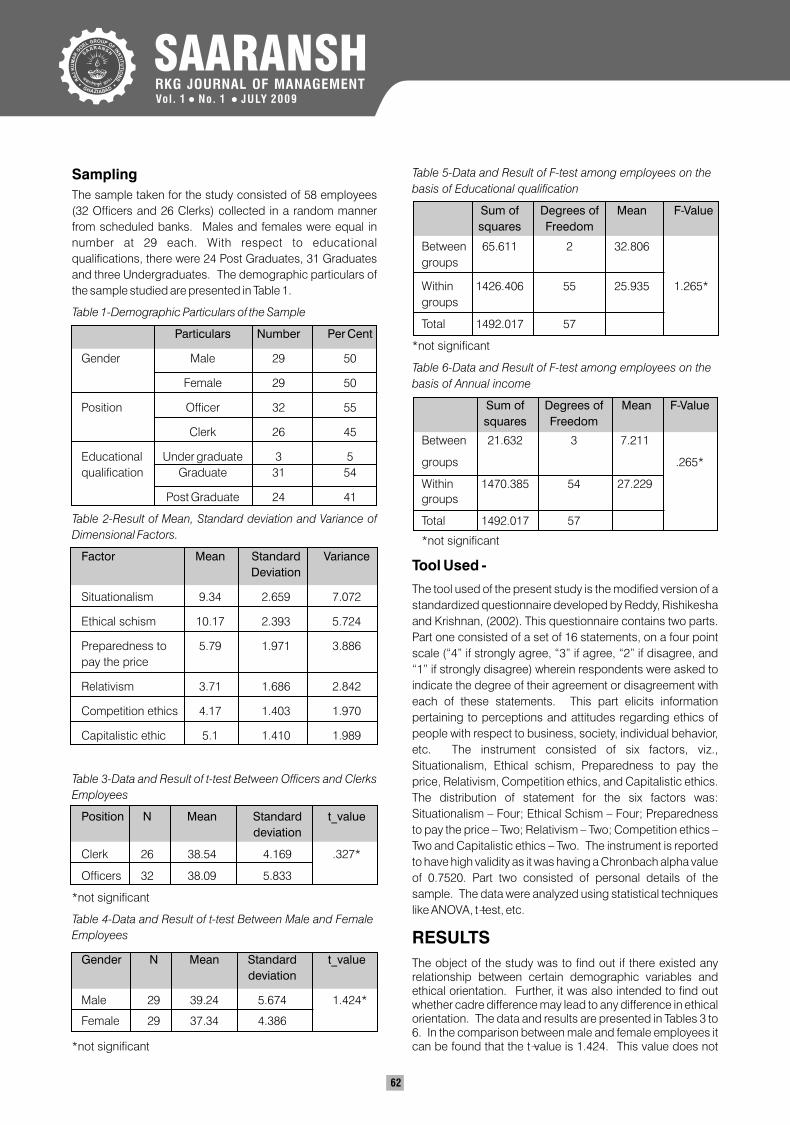
SAARANSHRKG JOURNAL OF MANAGEMENTVol . 1 No. 1 JULY 2009• •
62
Sampling
The sample taken for the study consisted of 58 employees
(32 Officers and 26 Clerks) collected in a random manner
from scheduled banks. Males and females were equal in
number at 29 each. With respect to educational
qualifications, there were 24 Post Graduates, 31 Graduates
and three Undergraduates. The demographic particulars of
the sample studied are presented in Table 1.
Table 1-Demographic Particulars of the Sample
Particulars Number Per Cent
Gender Male 29 50
Female 29 50
Position Officer 32 55
Clerk 26 45
Educational Under graduate 3 5
qualification Graduate 31 54
Post Graduate 24 41
Table 2-Result of Mean, Standard deviation and Variance of
Dimensional Factors.
Factor Mean Standard Variance
Situationalism 9.34 2.659 7.072
Ethical schism 10.17 2.393 5.724
Preparedness to 5.79 1.971 3.886
pay the price
Relativism 3.71 1.686 2.842
Competition ethics 4.17 1.403 1.970
Capitalistic ethic 5.1 1.410 1.989
Table 3-Data and Result of t-test Between Officers and Clerks
Employees
Position N Mean Standard t_value
deviation
Clerk 26 38.54 4.169 .327*
Officers 32 38.09 5.833
*not significant
Table 4-Data and Result of t-test Between Male and Female
Employees
Gender N Mean Standard t_value
deviation
Male 29 39.24 5.674 1.424*
Female 29 37.34 4.386
*not significant
Deviation
Table 5-Data and Result of F-test among employees on the
basis of Educational qualification
Sum of Degrees of Mean F-Value
squares Freedom
Between 65.611 2 32.806
groups
Within 1426.406 55 25.935 1.265*
groups
Total 1492.017 57
*not significant
Table 6-Data and Result of F-test among employees on the
basis of Annual income
Sum of Degrees of Mean F-Value
squares Freedom
Between 21.632 3 7.211
groups .265*
Within 1470.385 54 27.229
groups
Total 1492.017 57
*not significant
Tool Used -
The tool used of the present study is the modified version of a
standardized questionnaire developed by Reddy, Rishikesha
and Krishnan, (2002). This questionnaire contains two parts.
Part one consisted of a set of 16 statements, on a four point
scale (“4” if strongly agree, “3” if agree, “2” if disagree, and
“1” if strongly disagree) wherein respondents were asked to
indicate the degree of their agreement or disagreement with
each of these statements. This part elicits information
pertaining to perceptions and attitudes regarding ethics of
people with respect to business, society, individual behavior,
etc. The instrument consisted of six factors, viz.,
Situationalism, Ethical schism, Preparedness to pay the
price, Relativism, Competition ethics, and Capitalistic ethics.
The distribution of statement for the six factors was:
Situationalism – Four; Ethical Schism – Four; Preparedness
to pay the price – Two; Relativism – Two; Competition ethics –
Two and Capitalistic ethics – Two. The instrument is reported
to have high validity as it was having a Chronbach alpha value
of 0.7520. Part two consisted of personal details of the
sample. The data were analyzed using statistical techniques
like ANOVA, t-test, etc.
RESULTS
The object of the study was to find out if there existed any relationship between certain demographic variables and ethical orientation. Further, it was also intended to find out whether cadre difference may lead to any difference in ethical orientation. The data and results are presented in Tables 3 to 6. In the comparison between male and female employees it can be found that the t-value is 1.424. This value does not
63
reveal any significant difference between male and female employees with respect to ethical orientation. However, the mean of male respondents is 39.24 and that of the female respondents 37.34. The standard deviation for males is 5.674 and for females are 4.386. This indicates that the males have a slightly higher ethical orientation than the females. This is against the findings of Hunt (1992) who established a high scoring for females, as well as highly educated samples on cognitive moral development and social responsibility. The data and result of t-test between officers and clerks show the t-value to be 0.327, which is not significant. This shows that there is no significant difference between officers and clerk employees with respect to ethical orientation. The mean of clerks (38.54) and officers (38.09) shows only a minor variation, thereby establishing that cadre difference does not influence the ethical orientation of bank staff. Certain other demographic variables like qualification and annual income were also subjected to study. It is established that these variables also do not influence the ethical orientation of employees. The result of F-test among the employees to measure the ethical orientation on the basis of annual income is found to be 0.265, which is not significant. The F test for educational qualification (1.265) is also not significant, thereby showing that there exists no difference between employees in there ethical orientation based on their level of qualification.
CONCLUSION
The results of this study have a bearing on the banking industry and the economy in general. On the basis of the study it has been established that there is no difference in the ethical orientation between clerks and officers, males and females and between the employees on the basis of educational qualification, promotions received, and annual income earned. The result indeed is a matter of great importance as it proves that the demographic variables do not exert any influence on the ethical orientation of bank employees. Ethical orientation is an area which is highly significant in this era. The turmoil faced by the economy, both national and global, may be to a certain extent attributed to the ethical orientation of the members at the different levels of the various constituent industries and organisations. Further, the rising business wars and market demands originating from the changed socio-economic scenario need to be regulated and fashioned on the basis of ‘value based strategies’. For this, more studies in this area, involving a larger population and the personnel of the higher levels of management is to be undertaken.
REFERENCESBebeau, Muriel J, et. al.(1985), “Measuring Dental Students Ethical Sensitivity.” Journal of Dental Education, 49 (August) 225-235
Boatright Jhon.R, (2007), “Ethics and the Conduct of Business; Ethics in Finance; Pearson Education Pub”, p.374
Borkowski S C., et. al. (1992), “The Ethical Attitudes of Students as a Function of Age, Sex and Experience” Journal of Business Ethics, 11, p.961-979.
Cole, Dennis, et. al. (2000), “How do Managers make Teleogical Ethical Evaluations in Ethical Dilemmas? Testing part of Hunt-Vitell Model” Journal of Business Ethics 26 (August), P.259-269.
Finn, D. W, et. al. (1988), `Ethical Problems in Public Accounting: The view from the top', Journal of Business Ethics 7 (August), 605-615.
Fraedrich, Jhon P., et. al. (1992) “Cognitive Consistency of Marketing Managers in Ethical Situations.” Journal on Academy of Marketing Science, 20(Summer), p.245-252
Goolsby, Jerry R., et. al. (1992), “Cognitive moral development and marketing.” Journal of Marketing, 56 (January): 55-68.
Greenberg Jerald et. al. (2005), “Behavior in Organizations- Understanding and Managing Human Side of Work”, Pearson Prentice Hall pub; eighth edition, p.30-31.
Hunt Shelby D, et. al. (1989). “Corporate Ethical Values and Organizational Commitment in Marketing.” Journal of Marketing 53(July):79-90.
McCoy, et. al. (2003). “Decorator Kozlowski billed millions to firm” USA Today, December 16, 3B.
Kaynama S A, et. al.(1996) “The impact of a shift in Organizational Role on Ethical Perception: A comparative study, Journal of Business Ethics, 15,581-590
Kern D Charles, (2003), “Business Ethics and Professional Values”, Professional Values in Business, p.87-88.
Lane, M S and D Schaupp: 1989, “Ethics in Education: A comprehensive study” Journal of Business Ethics, 8,943-949
Leclair Debbie Thorne, et. al. (1998), “Integrity Management. Tampa”: University of Tampa press.
Peterson Robert A and Ferrell O C, 2006; “Business ethics- New challenges for business school and corporate leaders”, a Framework for Understanding Organizational Ethics, Prentice-hall of India Prvt Ltd., p.3-6
Pressley, M W. et. al. (1984), “Student Perception of Job Politics as Practiced by those Climbing the Corporate Career Ladder”. Journal of Business Ethics,7(4)
Reddy C Manohar, et. al.(2002), “Measuring the ethical orientation of MBA students: a scale development”, Vikalpa, February issue, p. 1-23.
Shashidhar Acharya, (2005): “The Ethical Climate in Academic Dentistry in India: Faculty and Student Perceptions”: Journal of Dental Edu. 69(6): 671-680 2005.
Shaub Michel K: (1989) “An Empirical Examination of the Determinants of Auditors” Ethical Sensitivity. PhD diss, Texas Tech University.
Sparks, Jhon R et. al. (1998), “Marketing researcher Ethical Sensitivity: Conceptualization, Measurement and Exploratory Investigation.” Journal of Marketing 62 (February): 105.
Stanga K G et. al. (1991), “Ethical Judgment in Selected Accounting Issues: an Empirical Study”, Journal of Business Ethics, 10, 739-747
Vitell, Scott J., et. al.(2003) “The Perceived Role of Ethics and Social Responsibility :a cross cultural study of marketing professionals.” working paper University of Mississippi
White, C S. et. al.(1993), “Ethical or Practical: an Empirical Study Student Choices in Stimulated Business Scenarios’, Journal of Business Ethics, 12, p.643-651
Does Cadre Difference and Certain Demographic Factors Influence Ethical Orientation: A Study among Bank Personnel
Anand R. Krishnan M. M. Sulphey
64
HUMAN RESOURCE DEVELOPMENT SCENARIO IN INDIAN INFORMATION
TECHNOLOGY COMPANIESManish Agarwal* Tapan Kumar Nayak**
ABSTRACTIn today’s scenario, competition in IT sector is on hype and the major challenge faced by these industries is how to manage the human resources. In order to engage the employees in actively working culture, HRD actions must be consistent with the enthusiasm through out. Since when the winds of change are blowing across the entire IT industry, the innovative policies and trends adopted by HR professionals may take the industry to new level. Taking five top management personnel and 25 marketing personnel from a sample of five IT organizations, the study shows that there is no significant difference in HRD climate among the sample IT organizations.Keynote: HCL Technologies, HP Ltd., HRD Climate, HR Professionals, IBM Ltd., IT Industry, Parotsystem, and TCS Ltd.
INTRODUCTION
In Information technology (IT), India has built up valuable
brand equity in the global markets. In IT Enabled Services
(ITES), India has emerged as the most preferred destination
for business process outsourcing (BPO), a key driver of
growth for the software industry and the services sector.
India's most prized resource in today's knowledge economy
is its readily available technical work force. Moreover, India
has the second largest English-speaking scientific
professionals in the world, second only to the U.S. Taking
into these in consideration, researchers suggested that good
human resource practices and policies are necessary to
influence the business growth and development of the
concerned industry. Employees are considered as the most
important and valuable resources and the Human Resource
Development (HRD) department is, thus, should be a
continuous process to ensure the development of employee
competencies, dynamism, motivation and effectiveness in a
systematic way. Therefore, HRD is concerned with the
development of employees on the one hand and optimum
utilization of these existing human resources on the other
hand. Rao (1985) defines HRD as a process by which the
employees of an organization are trained to - a. Acquire and
sharpen capabilities that are required to perform various
functions associated with their present or expected future
roles, b. Develop several capabilities as individuals and
discover and exploit their inner potentials for their own and/or
organizational development purposes, and c. Develop an
organizational culture in which supervisor-subordinate
relationships, teamwork and collaboration among subunits
are strong, and contribute to the professional well-being,
motivation and pride of employees (Saxena, 2006).
Employees are an integral part of the organization, & must be
motivated according to the needs of the organization. A
company that is interested in growth and profits must
establish relationships with employees. In order to improve
the employees’ participation, HRD activities must be
consistent with the development efforts of the organization;
only then the enthusiasm & creative potential of the
employees can be mobilized. The organizations today have
introduced a no. of policies & tools for the benefit of the
employees. Wipro has introduced schemes such as
“disbursement of 25 million shares of Rs.2 per share”& the
likewise. Since technology in the IT industry keeps on
changing, companies like IBM, HCL, Wipro and HP
emphasize on learning capabilities & desire for learning,
rather than the candidates’ knowledge on current
technologies.
LITERATURE REVIEW
Lorsch (1965) conceives an organization as a socio-
technical system in which behavior is influenced by a number
of interrelated variables, including the individual
predispositions of members, social structure, formal
organization and the system’s external environment.
Researchers have suggested that autonomy (Wallace, et al,
1996), supervisor support (Benson, 1996) and cohesiveness
(Buchanan, 1974) - organizational climate variables- relate
positively to organizational commitment. Further, Steers
(1977) found a significant relationship between the
autonomy and trust dimensions of organizational climate,
and organizational commitment. According to Loiu (1995),
trust is also associated with other organizational activities
such as organizational change and development
(Golembiewski, 1986) and organizational effectiveness
*Professor, Amity Business School, Amity University, Noida, UP, INDIA**Associate Professor, Institute of Management Studies, Ghaziabad, UP, INDIA
SAARANSHRKG JOURNAL OF MANAGEMENTVol . 1 No. 1 JULY 2009• •
65
(Culbert and Mc Donough, 1986). Fink (1992) observed a
positive relationship between organizational climate and
employee commitment to the organization. Lather and Balian
(2001) has proposed that satisfaction and happiness of
personnel heighten organizational effectiveness.
Organizations that alienate workers through their practices
will be less effective and efficient. Satisfied employees
usually work harder and better than frustrated ones (Gross
and Etzioni, 1985). However, finding the predictor variables of
job satisfaction has not been easy. In fact during 1980s, it
became apparent that, although one’s job situation is
important to one’s job satisfaction, people who exhibit
satisfaction at one time are likely to be happy with their jobs
several years later even if they changed occupation or
employer or both. Others apparently remain dissatisfied in
numerous work situations (Straw and Ross 1985). Saxena
(2006) incisively & insightfully analyzed IT industry trends &
suggested that organizations could plan their future better by
gearing up to meet the management challenges that IT will
pose in the coming years. An appropriate HRD strategy of
agreement & improvement in work practices is a pre-
requisite to achieve the objectives of modern business &
industry. An important function of HR departments is to keep
employees well informed of the company’s new issues in
addition to financial details pertaining to the health & well
being of employees, with a view to maintain competitive edge
& change with optimum accountability. Bandyopadhyay
(2001) emphasized on the new HR competencies required
for Indian IT industry. These competencies, when acquired,
enable HR professionals to have a new paradigm which
focuses less on what HR does & more on what HR delivers.
Four roles that professionals should play for achieving
organizational excellence are – (1) Strategic partner (2)
Administrative expert (3) Employee champion, & (4) Change
agent.
RESEARCH METHODOLOGY
An empirical study based on the descriptive research design
was undertaken with the help of a structured questionnaire to
study the HRD climate for marketing professionals in the IT
industry based on the responses of five top management
personnel and 25 marketing personnel from the sample of
five IT organizations. Sample organizations were IBM, HCL
Technologies, HP, TCS and Parotsystem. Four of the
organizations are located in Noida (UP) while one is in
Greater Noida (UP).
BRIEF ABOUT QUESTIONNAIRE
The 16 items HRD Climate survey developed by T.V Rao & F
Abraham was used in the research to survey the HRD Climate
in these five IT companies. This questionnaire comprised of
16 items on five-point scale to measure 12 dimensions:
Positive problem solving, recognition & reward (extrinsic &
intrinsic), growth & development (employees), innovation &
changes, experimentation, interpersonal openness & risk
taking, top management commitment to HRD,&
competence development, personnel policies, attitude &
objectivity, development climate, interpersonal helpfulness
& team spirit. Questionnaire assess OCTAPACE outline (i.e.,
extent to which openness, confrontation, trust, autonomy,
proactively, authenticity & collaboration are valued &
promoted in the organization), & implementation of HRD
mechanisms. It uses a five-point scale. It could be
administered to all employees & HRD Climate profile can be
drawn up. The scores range from 0 – 70 when scores on all
the 15 items are added to get a composite score. Scores
closer to 60 indicates an excellent climate (which is
rare).Scores above 50 indicate good HRD climate. Scores
below 50 indicates HRD climate having scope for
improvement. Higher scores on the dimension indicate
better perception of the climate.
DATA ANALYSIS AND
INTERPRETATION
Overall analysis of the HRD Climate in all the five IT
companies revealed the following insights:
1. IBM, it was found that the top management went out of its
way to ensure that the marketing personnel enjoyed their job
& that the seniors officers took active interest in the juniors.
Apart from this, rewards were for good work or any
contribution made by the marketing personnel. Open work
environment in the organization helped personnel to work
more efficiently & effectively.
2. Top management of HCL technologies believed that
marketing personnel are an extremely important resource &
have to be treated more humanly. In this regard,
psychological climate had been made very much conducive
for the overall development of the employees’ knowledge &
skills. Marketing personnel were encouraged to experiment
with new ideas & also tried out creative ideas. Delegation of
authority & job rotation was common practices in the
organization, so that employees could develop skills of
handling higher responsibilities.
3. In Hewelett Packward (HP) Ltd., the top management
believed that marketing personnel were an important
resource for any organization and they were making efforts to
identify and utilized the potential of the employees,
Managers and officers in the organization saw development
of marketing personnel as an important part of the job. Open
work culture in the organization helped marketing personnel
to express their feelings with their superiors.
Besides these strong aspects, some weak aspects were
also found in this organization. Top management seemed
less willing to invest considerable part of their time and other
resources to ensure development of marketing personnel
and also senior officers were not very keen to take active
interest in their juniors to help them learn their job.
4. TCS was the only organization where both strong and
Human Resource Development Scenario In Indian Information Technology CompaniesManish Agarwal Tapan Kumar Nayak
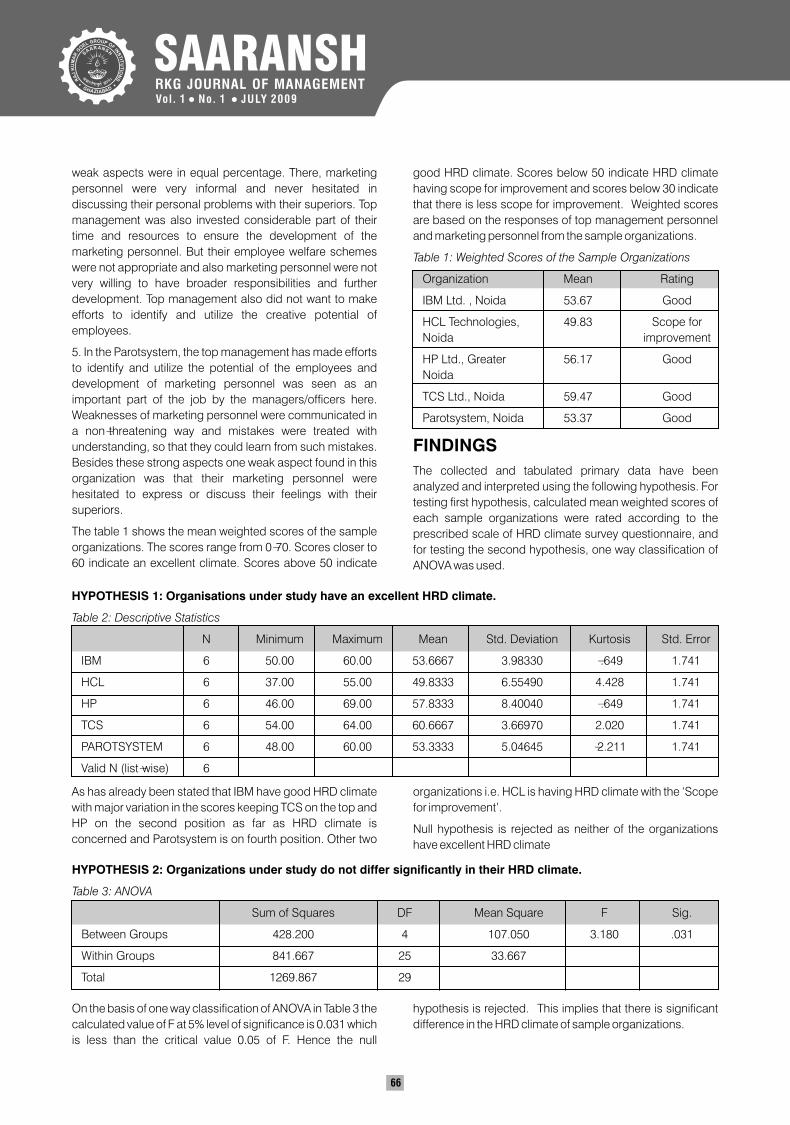
SAARANSHRKG JOURNAL OF MANAGEMENTVol . 1 No. 1 JULY 2009• •
66
weak aspects were in equal percentage. There, marketing
personnel were very informal and never hesitated in
discussing their personal problems with their superiors. Top
management was also invested considerable part of their
time and resources to ensure the development of the
marketing personnel. But their employee welfare schemes
were not appropriate and also marketing personnel were not
very willing to have broader responsibilities and further
development. Top management also did not want to make
efforts to identify and utilize the creative potential of
employees.
5. In the Parotsystem, the top management has made efforts
to identify and utilize the potential of the employees and
development of marketing personnel was seen as an
important part of the job by the managers/officers here.
Weaknesses of marketing personnel were communicated in
a non-threatening way and mistakes were treated with
understanding, so that they could learn from such mistakes.
Besides these strong aspects one weak aspect found in this
organization was that their marketing personnel were
hesitated to express or discuss their feelings with their
superiors.
The table 1 shows the mean weighted scores of the sample
organizations. The scores range from 0-70. Scores closer to
60 indicate an excellent climate. Scores above 50 indicate
good HRD climate. Scores below 50 indicate HRD climate
having scope for improvement and scores below 30 indicate
that there is less scope for improvement. Weighted scores
are based on the responses of top management personnel
and marketing personnel from the sample organizations.
Table 1: Weighted Scores of the Sample Organizations
Organization Mean Rating
IBM Ltd. , Noida 53.67 Good
HCL Technologies, 49.83 Scope for
Noida improvement
HP Ltd., Greater 56.17 Good
Noida
TCS Ltd., Noida 59.47 Good
Parotsystem, Noida 53.37 Good
FINDINGS
The collected and tabulated primary data have been
analyzed and interpreted using the following hypothesis. For
testing first hypothesis, calculated mean weighted scores of
each sample organizations were rated according to the
prescribed scale of HRD climate survey questionnaire, and
for testing the second hypothesis, one way classification of
ANOVA was used.
HYPOTHESIS 1: Organisations under study have an excellent HRD climate.
Table 2: Descriptive Statistics
N Minimum Maximum Mean Std. Deviation Kurtosis Std. Error
IBM 6 50.00 60.00 53.6667 3.98330 -.649 1.741
HCL 6 37.00 55.00 49.8333 6.55490 4.428 1.741
HP 6 46.00 69.00 57.8333 8.40040 -.649 1.741
TCS 6 54.00 64.00 60.6667 3.66970 2.020 1.741
PAROTSYSTEM 6 48.00 60.00 53.3333 5.04645 -2.211 1.741
Valid N (list-wise) 6
As has already been stated that IBM have good HRD climate
with major variation in the scores keeping TCS on the top and
HP on the second position as far as HRD climate is
concerned and Parotsystem is on fourth position. Other two
organizations i.e. HCL is having HRD climate with the ‘Scope
for improvement’.
Null hypothesis is rejected as neither of the organizations
have excellent HRD climate
HYPOTHESIS 2: Organizations under study do not differ significantly in their HRD climate.
Table 3: ANOVA
Sum of Squares DF Mean Square F Sig.
Between Groups 428.200 4 107.050 3.180 .031
Within Groups 841.667 25 33.667
Total 1269.867 29
On the basis of one way classification of ANOVA in Table 3 the
calculated value of F at 5% level of significance is 0.031 which
is less than the critical value 0.05 of F. Hence the null
hypothesis is rejected. This implies that there is significant
difference in the HRD climate of sample organizations.
67
RECOMMENDATIONS AND
SUGGESTIONSBased on the research study one can easily state that new age IT is bringing about sweeping changes in the HRD climate and culture in the Indian IT industry.
HRD climate in TCS and HP was found to be good. To make it better the top management may plan an integrated HRD system. A mechanism for rewarding good work is the major area of concern in TCS. In HCL, there is a lack of openness. It has been described that HRD is like a flower in bloom to be experienced. Subordinates are like blooming buds, managers should nurture and nourish them to take their full shape into flowers and spread the fragrance across the organization. In IBM top management should take active interest in the development of marketing personnel and should devote more time and resources for the same. In Parotsystem, HRD climate is not very conducive for the employees. Top management should take necessary steps for making the climate conducive for the employees especially for marketing personnel. Marketing personnel should be motivated enough to get involved in the business development matters. With all the limitations in the Parotystem, management might make attempts to introduce HRD mechanisms such as rewards, improved training methods, genuine promotion decisions,& excellent interaction among various HRD instruments. Every human resource is to be considered as a living being with emotions, personal needs & views, with certain limitations, & not like perfectly designed computerized machines, which can work without taking rest. Practice of meditation & yoga along with other HRD tools will surely lead to the healthy work culture & environment. As has been found that there are no specific training programs for marketing personnel in the sample organizations, it is recommended that the organizations have to recognize the marketing personnel’s training as a long term ongoing process if they want their marketing personnel to perform at their full potential.
To make marketing personnel more professional, especially in HCL, IBM & Parotsystem, following modern method & techniques may be given more emphasis for improving their functioning - Total Quality Management, Suggestions Schemes, Quality Circles, Re-engineering, and Management by Objectives (MBO).
Besides these, organizations should evolve better corrective mechanisms for ensuring higher degrees of professionalism on the following aspects - Ineffective supervision of subordinates, High level of stress among marketing professionals, Poor reward system, Reactive, less interactive & poorly structured performance appraisal system, Ineffective training & development plans for marketing personnel not ensuring lifelong learning, and Absence of proper communication system between top, middle & lower management.
Top management of organizations should emphasize on building the professional competence among the marketing personnel which is based on knowledge skills, techniques, high esteem, control over subordinates, code of ethics, spirit-de-corps & confidence building. For improving the organizational climate, following factors should be controlled
- Communication gap within the organizations, Biased appraisal system & promotion decisions, Ineffective reward system, & Bureaucratic style of working.
CONCLUSIONIt can be suggested that replication of this study on other randomly selected IT organizations & comparative analysis of IT organizations with other organizations can be made. Also further study can be done to identify the performance indicators of various categories of IT professionals with a view to evolve a performance appraisal system & the training policy/designs for marketing personnel.
REFERENCESBandhopadhyay (2001), ‘Impacting Organizational Performance, the New HR Competencies Required for Indian IT industry’, HRD News Letter, Vol.2, No. 4, pp. 15-20.
Benson, J (1996), ‘Dual Commitment: Contract workers in Australian Manufacturing Enterprises’, Working Paper 101, University of Melbourne, Melbourne.
Buchanan, B (1974), ‘Building Organizational Commitment: the Socialization of Work Managers in Work Organizations, Administrative Science Quarterly, Vol.19, pp.533-546.
Culbert, S A and McDonough J J (1986), ‘Organizational Trust Effectiveness: The Politics of Trust and Organizational Empowerment’, Public Administration Quarterly, Vol.18, pp.171-178.
Fink, S L (1992), High Commitment Workplaces, Quorum, New York.
Golembiewski, R T (1986), ‘OD Perspectives on High Performance: Some Good News and Some Bad News about Merit Pay’, Review of Public Personnel Administration, Vol. 7, pp.9-27.
Gross, E and Etzioni, A. (1985), Organization in Society, Prentice Hall Englewood Cliffs, New Jersey.
Lather and Balian (2001), ‘A Study of Job Satisfaction in Relation to Value System among Managers’, Delhi Business Review, Vol.2, No. 2 pp77-84.
Loiu, K T (1995), ‘Understanding Employee Commitment in the Public Organization: A Study of the Juvenile Detention Centre’, International Journal of Public Administration, Vol.18, pp.126-129.
Lorsch, W (1965), Product Innovation and Organization, The Macmillan Company, New York.
Rao, T V (1990), In excellence through HRD, Tata Mc-graw Hill Publishing Company Ltd. New Delhi.
Saxena , S (2006), ‘HRD in Indian IT Companies’ , Icfai Journal Of Management Research , Vol. 5 No.2, pp. 57-64
Steers, R M (1977), ‘Antecedents and Outcomes of Organizational Commitment’, Administrative Science Quarterly, Vol. 22, pp. 46-56.
Straw, B M and Ross, J (1985), ‘Stability in the Midst of Change: A dispositional Approach to Job Attitudes’, Journal of Applied Psychology, Vol.70, pp. 469-480.
Wallace J, Hunt J and Richards, C (1996), ‘The Relationship between Organizational Culture, Organizational Climate and Managerial values: A Proposed Model’, Paper presented at the ANZAM’96 Diversity and Change, University of Wollongong.
Human Resource Development Scenario In Indian Information Technology CompaniesManish Agarwal Tapan Kumar Nayak
SAARANSHRKG JOURNAL OF MANAGEMENTVol . 1 No. 1 JULY 2009• •
68
MERGERS AND ACQUISITIONS AS STRATEGIC DRIVERS FOR ECONOMIC
GROWTH: A REVIEWSheeba Kapil *
ABSTRACTThe M&A activity takes place in response to the economic changes, consequently changing the regulatory and business environment and the extent to which the M&A activities take place depends on whether there is an economic upturn- when the M&A activity peak, or economic slowdown- in which case also the consolidation and acquisitions take place, albeit in lesser degree that the former phase. This paper aims at exploring the literature seeking answer to the question: Are Mergers and Acquisitions a response to economic changes? and what is the effect of Economic slow down on M&A activities? The study is focused on the findings and results of the work done so far in the areas of mergers and acquisitions especially, the work done on M&A’s role in Economic growth and also the effect of the economic slow down on M&A activities is reviewed in this context. Key Words: Mergers and Acquisitions, national policies, Financial and economic determinants, value maximization, synergy, valuation, corporate governance
INTRODUCTION
With economic upturns and slowdowns, which in the past have been occurring alternatively, there are always reactions to the economic changes from various quarters. Governments respond to ensure that the economy does not get overheated or take measures to infuse it with growth drivers (increasing government expenditure, creating jobs, building infrastructure- transport, communication etc. to boost the economic activity)/announce financial stimulus packages when the slow down in economy seems to be leading to the recession. The economic changes induce the response in the form of revised/modified national policies and regulatory framework changing the legal, financial aspects of the business environment. The industry also responds to the economic and regulatory changes in various ways through consolidation, divesting, expansion, mergers and acquisitions, domestically or across the national borders.
Theoretically, Mergers and Acquisitions involve developing the strategy to achieve the vision and also to achieve the objective of value maximization for the shareholders of the corporation. Drivers to mergers and acquisition could be strategic or non-strategic. The process starts with defining the objective- potential synergic benefits, integration, financial motivation, pursuing innovations/discoveries in products and/or technology, seeking expansion, economy of scales, new markets, corporate re-structuring etc. Next come scouting and identifying the potential target firm, planning and screening, valuation of the target company and correct pricing. The actual merger or acquisitions where stakes are very high, involve extensive negotiations before the final deal is inked. Mergers and acquisitions entail complex financial and legal processes and procedures which are completed in equally complex regulatory environment. Merger financing and legal due diligence require services of professionals (Banks and Law firms) to take the deal through financial and legal regulatory labyrinths to the final destination.
Historically, M&A occurred as ‘Waves’ and there were five such waves in the 20th century. The first merger movement (1895-1904), at the beginning of the century consisted of the horizontal mergers mostly in the United States of America (USA). The period was characterized by large number of technological developments, innovations like advent of electricity and completion of the trans-continental Railways. These led to rapid economic growth due to better production technologies and availability of rail transport infrastructure. This wave ended with the economic recession that began in 1903. The second wave also began with the growth in the business activities in 1922 and ended with the economic slowdown –the great depression of 1929. Motivational factors during this period could be the mobility offered by the growth in transport and communication technology. Lambrecht (2004) in his paper states that these developments caused an increase in the scale of operations and hence encouraged mergers. The second wave consisted mainly of vertical mergers to ensure reliable supply chain.
The merger activities are supposed to have reached their peak during 1967 to 1969. The economy was booming. Most of the mergers during this period were the conglomerate mergers. The number of mergers however, declined as the economic activities slowed down from 1970 onwards ending with the 1973 oil crisis.
In 1988 and 1989, the M&A activities were in fact the take-overs (hostile) and leveraged buy-outs. The last and the fifth wave of M&A is considered by far the largest, taking place since the mid-nineties. This wave is the first with the international dimension and is motivated by the combined effect of the innovation and economic liberalization. Salleo (2008) in his analysis of the current wave of the M&A, states that the technological innovation has spurred the investment and corporate re-structuring during this period while the de-regulation has provided new opportunities. This led to
*Associate Professor, Indian Institute of Foreign Trade, New Delhi 110016
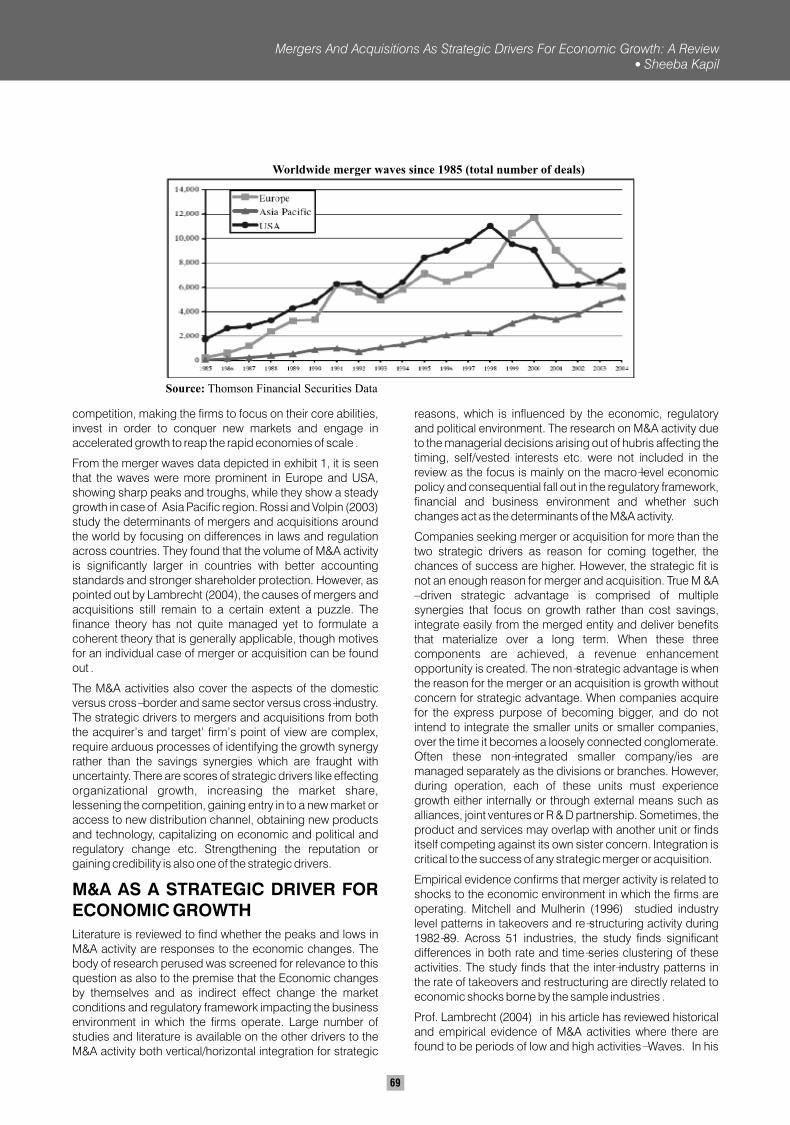
69
Worldwide merger waves since 1985 (total number of deals)
Source: Thomson Financial Securities Data
competition, making the firms to focus on their core abilities, invest in order to conquer new markets and engage in accelerated growth to reap the rapid economies of scale .
From the merger waves data depicted in exhibit 1, it is seen that the waves were more prominent in Europe and USA, showing sharp peaks and troughs, while they show a steady growth in case of Asia Pacific region. Rossi and Volpin (2003) study the determinants of mergers and acquisitions around the world by focusing on differences in laws and regulation across countries. They found that the volume of M&A activity is significantly larger in countries with better accounting standards and stronger shareholder protection. However, as pointed out by Lambrecht (2004), the causes of mergers and acquisitions still remain to a certain extent a puzzle. The finance theory has not quite managed yet to formulate a coherent theory that is generally applicable, though motives for an individual case of merger or acquisition can be found out .
The M&A activities also cover the aspects of the domestic versus cross- border and same sector versus cross-industry. The strategic drivers to mergers and acquisitions from both the acquirer’s and target’ firm’s point of view are complex, require arduous processes of identifying the growth synergy rather than the savings synergies which are fraught with uncertainty. There are scores of strategic drivers like effecting organizational growth, increasing the market share, lessening the competition, gaining entry in to a new market or access to new distribution channel, obtaining new products and technology, capitalizing on economic and political and regulatory change etc. Strengthening the reputation or gaining credibility is also one of the strategic drivers.
M&A AS A STRATEGIC DRIVER FOR ECONOMIC GROWTH
Literature is reviewed to find whether the peaks and lows in M&A activity are responses to the economic changes. The body of research perused was screened for relevance to this question as also to the premise that the Economic changes by themselves and as indirect effect change the market conditions and regulatory framework impacting the business environment in which the firms operate. Large number of studies and literature is available on the other drivers to the M&A activity both vertical/horizontal integration for strategic
reasons, which is influenced by the economic, regulatory and political environment. The research on M&A activity due to the managerial decisions arising out of hubris affecting the timing, self/vested interests etc. were not included in the review as the focus is mainly on the macro-level economic policy and consequential fall out in the regulatory framework, financial and business environment and whether such changes act as the determinants of the M&A activity.
Companies seeking merger or acquisition for more than the two strategic drivers as reason for coming together, the chances of success are higher. However, the strategic fit is not an enough reason for merger and acquisition. True M &A –driven strategic advantage is comprised of multiple synergies that focus on growth rather than cost savings, integrate easily from the merged entity and deliver benefits that materialize over a long term. When these three components are achieved, a revenue enhancement opportunity is created. The non-strategic advantage is when the reason for the merger or an acquisition is growth without concern for strategic advantage. When companies acquire for the express purpose of becoming bigger, and do not intend to integrate the smaller units or smaller companies, over the time it becomes a loosely connected conglomerate. Often these non-integrated smaller company/ies are managed separately as the divisions or branches. However, during operation, each of these units must experience growth either internally or through external means such as alliances, joint ventures or R & D partnership. Sometimes, the product and services may overlap with another unit or finds itself competing against its own sister concern. Integration is critical to the success of any strategic merger or acquisition.
Empirical evidence confirms that merger activity is related to shocks to the economic environment in which the firms are operating. Mitchell and Mulherin (1996) studied industry level patterns in takeovers and re-structuring activity during 1982-89. Across 51 industries, the study finds significant differences in both rate and time-series clustering of these activities. The study finds that the inter-industry patterns in the rate of takeovers and restructuring are directly related to economic shocks borne by the sample industries .
Prof. Lambrecht (2004) in his article has reviewed historical and empirical evidence of M&A activities where there are found to be periods of low and high activities- Waves. In his
Mergers And Acquisitions As Strategic Drivers For Economic Growth: A ReviewSheeba Kapil
SAARANSHRKG JOURNAL OF MANAGEMENTVol . 1 No. 1 JULY 2009• •
70
study, he has analyzed the implications of the economic changes for the M & A activity and has commented upon whether M&A is a response to economic change. He examines whether mergers take place at the efficient time when both the firms act in a non-cooperative way. While explaining the Merger Waves phenomenon, Prof Lambrecht has opined that the most plausible answer is that a change in the take-over activity is caused by a change in the economic environment within which the firms are operating. It is observed that the merger activities are pro-cyclical, meaning more mergers are observed during the economic booms than during the economic slow down.
In their study on M&A, Andrade et al (2001) conclude that mergers seem motivated by a strategic reaction to industry shocks and create value overall. The study however, has the limitation of covering only the firms in the US and the period only up to 1998, i.e. prior to the actual boom in the US stock market. Salleo (2008) in his analysis covering a period between 1990 and 2005 and the industrialized and largest emerging countries finds that the bidder firms exhibited slower growth and lower profitability and capital expenditure but had a larger (domestic) market share. The target firms also had lower sales growth, profitability and capital expenditure but had higher liquidity and lower leverage.
Miyajima,Hideaki (2007) examines the comparative features and economic role of the M&A activities in Japan stating that the Japanese economy is in the midst of a major mergers and acquisitions wave for the first time in the postwar period. Japan’s M&A activity, which has surged since the end of 1999, and takes a look at the factors that have contributed to the surge, and its various economic dimensions. The study places Japan’s M&As in an international context, and identifies the causes of the wave, and its structural characteristics. This paper emphasizes that the recent M&A wave in Japan not only shares commonalities with the global M&A wave, which has been triggered by technological innovations that have expanded growth opportunities, and deregulatory measures, but also has been characterized by factors unique to Japan including economic shocks such as excess plant capacity and reforms to the legal infrastructure for corporate consolidation. Unlike in the other four countries in this study, stock market conditions have had only a limited effect on the M&A wave in Japan.
Banal-Estanol et al (2006) propose a mechanism, which is consistent with a various stylized facts about mergers. Authors have constructed a model providing a non-financial explanation for the observable pattern of intense merger activity during economic booms and subdued M&A during recession. The authors state that although positive economic shocks produce expected gains at the time of merging, these mergers turn out to be less efficient in the long term- a finding that authors claim is broadly consistent with the empirical evidence. In their model the target in a potential merger commits to a takeover price. This enables the targets to screen the acquirers on the expected synergy gains. The study propounds that changes in the economic environment that often coincide with a boom induce mergers that would not have occurred otherwise. The reason being that- authors explain, in an economic boom merging becomes more profitable and merging with low-synergy types become more similar to merging with high-synergy types.
However, a report from the Boston Consulting Group (BCG) (2008) analyzed 408076 deals from 1981 through 2008, with special focus on more than 5100 divestitures, gives a compelling reason for pursuing the M&A when the economy is weak: ‘downturn deals have a higher chance of creating shareholder value and delivering greater returns.’ The ELTA, The Research Institute of Finnish Economy, in a study of the Finnish M&A activities against other countries tried to benchmark them. The report and the eclectic model presented therein suggest that there are macro-level, industry level and firm-level factors affecting M&A decisions.
Martynova and Renneboog (2004) studied the main characteristics of the M&A activity, to examine the reasons for recurring surges and downfalls in M&A activity as also whether the takeover activity fuelled by capital market developments. The authors studied the theoretical models and presented an explanation for the incidence of take-over waves. The study explains that the M&A –clustering hinges on the economic factors that motivate firms to restructure as a response to the changes in the business environment. Several empirical studies have been reviewed by Martynova and Reneboog, which have been carried out on the relationship between the cyclical pattern of takeover activity and business cycles of macroeconomic factors. Works of the earlier decades (60s, 70s and 80s) studying the takeover activity conclude that the changes in the economic growth and capital market conditions are positively related to the intensity of the takeover activity
Ang et al (2003) in their paper on ‘Direct Evidence on Market-driven Acquisitions Theory’ provide direct empirical evidence that stocks’ overvaluation is an important motive for firms to make acquisitions with their stocks, supporting the market driven acquisition theory (Shleifer and Vishny, 2002) .
Reed and Babool (2003) investigate the factors that explain outward and inward mergers and acquisitions activity for a country using variables that include exchange rate, interest rate and stock market prices. The study is carried out within the food, beverages and tobacco industry. This study shows that these three variables are quite important in explaining the variations in M&A activity by country. Exchange rate changes in particular have elastic impact on outward M&A activity, indicating that the price effects are important in determining outward investment flows. A 1% appreciation of a country’s currency will increase its outward M&A flows by almost 4%. The exchange rate change and the stock price changes have a price effect on M&A activity as also impact with reference to the economic growth factors.
Calderon et al (2004) in their World bank policy research
working paper studied the FDI composition as to whether the
FDI is in the form of acquiring the existing assets or investing
in new assets i.e. Greenfield FDI as a feed back and macro-
economic effects. The authors note that the FDI flows to
developing countries surged in 1990s, to become their
leading source of external funding. They studied the
composition of these FDI flows to see whether these due to
M&A activity indicating a boom as a onetime effect of
privatization or is it likely to be followed by a Greenfield
investment? The study addresses the two types of FDI flows
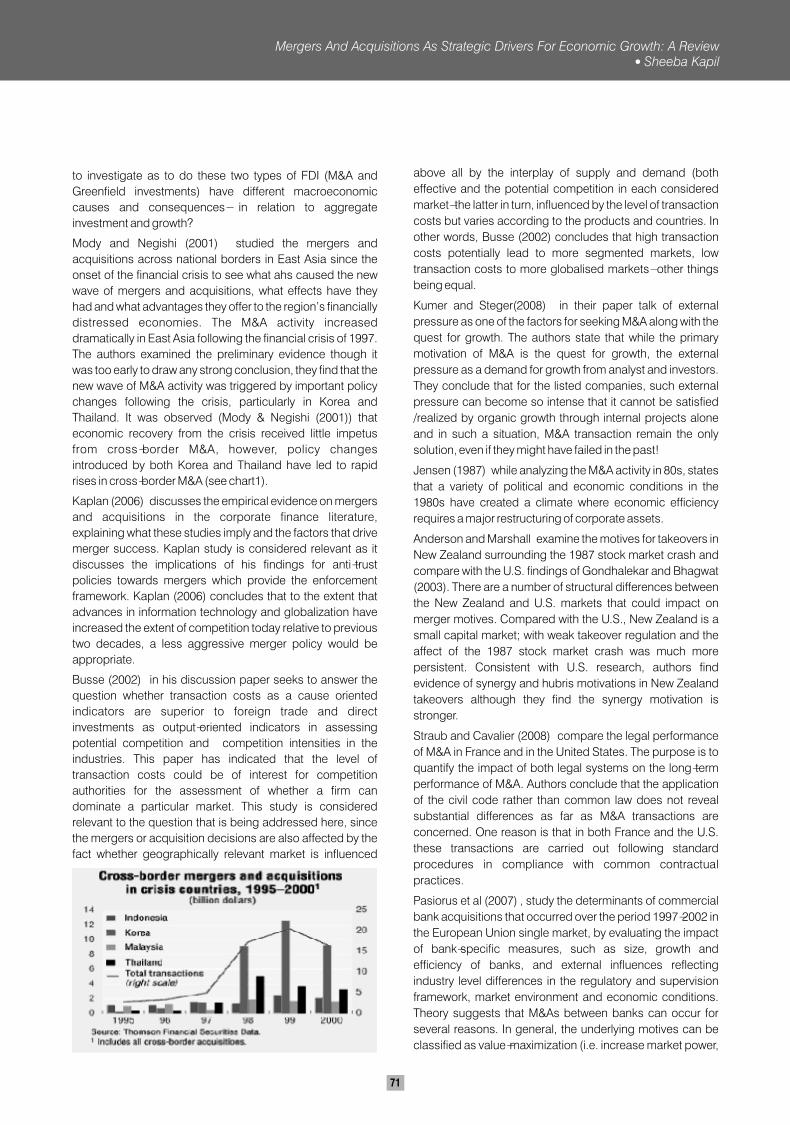
71
to investigate as to do these two types of FDI (M&A and
Greenfield investments) have different macroeconomic
causes and consequences- in relation to aggregate
investment and growth?
Mody and Negishi (2001) studied the mergers and
acquisitions across national borders in East Asia since the
onset of the financial crisis to see what ahs caused the new
wave of mergers and acquisitions, what effects have they
had and what advantages they offer to the region’s financially
distressed economies. The M&A activity increased
dramatically in East Asia following the financial crisis of 1997.
The authors examined the preliminary evidence though it
was too early to draw any strong conclusion, they find that the
new wave of M&A activity was triggered by important policy
changes following the crisis, particularly in Korea and
Thailand. It was observed (Mody & Negishi (2001)) that
economic recovery from the crisis received little impetus
from cross-border M&A, however, policy changes
introduced by both Korea and Thailand have led to rapid
rises in cross-border M&A (see chart1).
Kaplan (2006) discusses the empirical evidence on mergers
and acquisitions in the corporate finance literature,
explaining what these studies imply and the factors that drive
merger success. Kaplan study is considered relevant as it
discusses the implications of his findings for anti-trust
policies towards mergers which provide the enforcement
framework. Kaplan (2006) concludes that to the extent that
advances in information technology and globalization have
increased the extent of competition today relative to previous
two decades, a less aggressive merger policy would be
appropriate.
Busse (2002) in his discussion paper seeks to answer the
question whether transaction costs as a cause oriented
indicators are superior to foreign trade and direct
investments as output-oriented indicators in assessing
potential competition and competition intensities in the
industries. This paper has indicated that the level of
transaction costs could be of interest for competition
authorities for the assessment of whether a firm can
dominate a particular market. This study is considered
relevant to the question that is being addressed here, since
the mergers or acquisition decisions are also affected by the
fact whether geographically relevant market is influenced
above all by the interplay of supply and demand (both
effective and the potential competition in each considered
market- the latter in turn, influenced by the level of transaction
costs but varies according to the products and countries. In
other words, Busse (2002) concludes that high transaction
costs potentially lead to more segmented markets, low
transaction costs to more globalised markets- other things
being equal.
Kumer and Steger(2008) in their paper talk of external
pressure as one of the factors for seeking M&A along with the
quest for growth. The authors state that while the primary
motivation of M&A is the quest for growth, the external
pressure as a demand for growth from analyst and investors.
They conclude that for the listed companies, such external
pressure can become so intense that it cannot be satisfied
/realized by organic growth through internal projects alone
and in such a situation, M&A transaction remain the only
solution, even if they might have failed in the past!
Jensen (1987) while analyzing the M&A activity in 80s, states
that a variety of political and economic conditions in the
1980s have created a climate where economic efficiency
requires a major restructuring of corporate assets.
Anderson and Marshall examine the motives for takeovers in
New Zealand surrounding the 1987 stock market crash and
compare with the U.S. findings of Gondhalekar and Bhagwat
(2003). There are a number of structural differences between
the New Zealand and U.S. markets that could impact on
merger motives. Compared with the U.S., New Zealand is a
small capital market; with weak takeover regulation and the
affect of the 1987 stock market crash was much more
persistent. Consistent with U.S. research, authors find
evidence of synergy and hubris motivations in New Zealand
takeovers although they find the synergy motivation is
stronger.
Straub and Cavalier (2008) compare the legal performance
of M&A in France and in the United States. The purpose is to
quantify the impact of both legal systems on the long-term
performance of M&A. Authors conclude that the application
of the civil code rather than common law does not reveal
substantial differences as far as M&A transactions are
concerned. One reason is that in both France and the U.S.
these transactions are carried out following standard
procedures in compliance with common contractual
practices.
Pasiorus et al (2007) , study the determinants of commercial
bank acquisitions that occurred over the period 1997-2002 in
the European Union single market, by evaluating the impact
of bank-specific measures, such as size, growth and
efficiency of banks, and external influences reflecting
industry level differences in the regulatory and supervision
framework, market environment and economic conditions.
Theory suggests that M&As between banks can occur for
several reasons. In general, the underlying motives can be
classified as value-maximization (i.e. increase market power,
Mergers And Acquisitions As Strategic Drivers For Economic Growth: A ReviewSheeba Kapil
SAARANSHRKG JOURNAL OF MANAGEMENTVol . 1 No. 1 JULY 2009• •
72
replace inefficient management, achieve economies of scale
and scope, decrease risk through geographic and product
diversification) and non-value maximization ones (i.e.
managerial motives, hubris, etc.).
Evidence on the impact of external factors on M&As
decisions also comes mostly from studies that examine
industrial sectors, with the neoclassical and behavioural
approaches being the most commonly cited explanations.
Cunningham (2001) has presented a very important and
new angle of behavioral economics, which is emerging as an
important new disciplinary adjunct to legal analysis in a wide
range of fields. He presents ‘behavioral finance’ as to how
prices of stocks are formed–including a theoretical
framework, empirical evidence, and psychological
explanations. It integrates these materials into a model of
market and investor behavior that can be used as a lens
through which to analyze a wide variety of legal rules and
policies bearing on market regulation and corporate
governance. The work of Prof. Cunningham introduces and
proposes reforms in three critical areas of law and policy that
his model impacts: (1) the market regulatory environment in
which investors participate, including suitability and churning
rules and policies relating to day trading, margin trading, and
circuit breakers; (2) the legal duties of boards of directors in
making capital allocation decisions such as equity offerings,
dividend distributions and stock acquisitions; and (3) issues
in corporate and securities litigation, principally the reliance
requirement in securities fraud cases and the stock market
exception to the appraisal remedy in cash out mergers.
Managerial influence and hubris being one of the major
antecedents of the M&A activity, this work has imparted a
whole new perspective as the genesis of creating the policy
and regulatory business environment impacting the M&A
decisions.
Cummins and Rubio-Misas(2001) studied the effects of
deregulation and consolidation in financial services markets
by analyzing the Spanish insurance industry. The sample
period 1989-1998 spans the introduction of the European
Union’s Third Generation Insurance Directives, which
deregulated the EU insurance market. Deregulation has led
to dramatic changes in the Spanish insurance market; the
number of firms declined by 35 percent and average firm size
increased by 275 percent. Authors have analyzed the causes
and effects of consolidation using modern frontier efficiency
analysis to estimate cost, technical, and allocative efficiency,
as well as using Malmquist analysis to measure total factor
productivity change.
Hackbarth and Morellec (2006) using a sample of 1086
takeovers of publicly traded US firms between 1985 and
2002, developed a real options framework to analyze the
behavior of stock returns in mergers and acquisitions. In this
framework, the timing and terms of takeovers are
endogenous and result from value-maximizing decisions.
The decision to enter a takeover deal, expand operations, or
divest assets can be regarded as the problem of exercising a
real option. Following the determination of equilibrium
exercise strategies, the implications of the equilibrium for
stock returns are analyzed by the authors. Two important
contributions follow from this analysis. First, they provide a
complete characterization of the dynamics of firm-level betas
through the merger episode and show that beta changes
dramatically in the time period surrounding takeovers.
Evenett and Hijzen (2006) , Using publicly-available survey
data on these regimes, estimate the relative importance of
numerous potential legal, institutional, economic, and
political-economy determinants of the degree of national
conformity with four merger-related Recommended
Practices of the International Competition Network (ICN).
They find that the determinants of such conformity differ
markedly between the founding members of the ICN and
other members. Moreover, certain economic and political-
economy factors appear to play a more important role in
determining the degree of conformity than legal and
institutional factors; a finding that has implications for both
the speed and the ultimate extent of convergence in national
merger regimes that can be expected from this non-binding
or soft law initiative.
Mehta and Kakani (2006) probe into the various motivations
for mergers and acquisitions in the Indian Banking sector.
Given the increasing role of the economic power in the turf
war of nations, the paper looks at the significant role of the
state and the central bank in protecting customer’s interests
vis-à-vis creating players of international size. Reviewing the
mergers & acquisitions in the Indian Banking Sector both
from an opportunity and as imperative perspectives, the
authors also look at the large implications for the nation.
CONCLUSION
Martynova and Renneboog (2004), suggest that an
important area which has received less academic attention is
the decision process companies face to determine how to
reorganize (by means of takeovers, spin-offs,
recapitalizations, workouts, institutional buyouts or other
transfers of control). A joint analysis of these restructuring
constitutes a prominent area for future research. Another
challenge in the field of M&As is the cyclical rise and fall of
hostile takeover activity. While contested bids of the 1980s
received substantial attention from academic researchers,
those of the 1990s have been largely ignored.
The following issues remain to be addressed: What triggers
time and country clustering of hostile takeover activity? Why
were unfriendly acquisitions almost non-existent in
Continental Europe during the 1980s, and occurred in
unprecedented numbers during the 1990s? Do the patterns
of contested bids and their profitability vary across the
decades and countries? Do hostile tender offers bring about
more managerial discipline? In addition to the problems
mentioned above, there are a number of other issues that
have not yet been fully investigated in the literature. The
aspects of cross-border mergers and acquisitions warrant
73
comprehensive theoretical and empirical analysis.
Differences in corporate law, corporate governance
regulation, stock exchange regulation, accounting quality
may have a significant impact.
REFERENCES
Aguilera, Ruth V., et. al.. (2004), - ‘The Role of Human
Resource Management in Mergers and Acquisitions’, Int. J.
of Human Resource Management 15:8 December 2004
1355–1370
Ali-Yrkko, Jyrki (2002) – ‘Mergers and Acquisitions- Reasons
and Results’- Discussion Paper No. 792, ELTA, The
Research Institute of the Finnish Economy, Finland
Anderson, Hamish D,. et. al.. – ‘Takeover Motives in a Weak Regulatory Environment Surrounding a Market Shock’, Department of Finance, Banking and Property, Massey University, New Zealand.
Andrade, Gregor, et. al. (2001), ‘New Evidence and Perspectives on Mergers’, Journal of Economic Perspectives, 15-2, p.103-120.
Ang, James S., et. al. (2003)- Direct Evidence on Market-Driven Acquisitions Theory’, Florida State University.
Arikawa, Yasuhiro et. al. (Aug. 2007), - ‘Understinding the M&A Boom in Japan: What Drives Japanese M&A?’, Waseda University, Japan
Banal-Estanol, et. al. (2006), - ‘Merger Clusters During Economic Booms’, Discussion Paper SP II 2006- 17, Wissenschaftszentrum Berlin.
BCG Report – The return of the Strategist: Creating Value with M&A in Downturns’ excerpts reported in Market Wire- May2008- ‘Economic Slowdowns are Ideal Times For Mergers and Acquisitions, BCG finds’.
Brackman, et. al. (2006), -‘ Cross-Border Mergers and Acquisitions: The Facts a Guide for International Economics’ CESIFO WORKING PAPER NO. 1823, Oct. 2006.
Buch, C. et. al. (2004), ‘Cross-border bank mergers: What lures the rare animal?’, Journal of Banking & Finance, Vol. 28, No. 9, pp. 2077-2102.
Busse, Mathias (2002), - ‘ Competition Intensity, Potential Competition and the Transaction Cost Economics’, HWWA Discussion Paper 183 (ISSN 1616-4814), Hamburg Institute of International Economics.
Calderon, Cesar, et. al. (2004)- ‘Greenfield Foreign Direct Investment And Mergers and Acquisitions: Feedback and Macro-economic Effects’, WB Policy Research WP3192, Jan.2004.
COMPARATIVE ECONOMIC ANALYSIS OF LAWS: FRANCE vs USA’
Cummins, J. David et. al. (2001), - ‘Deregulation, Consolidation, and Efficiency: Evidence From the Spanish
Insurance Industry’, Department of Insurance and Risk
Management, The Wharton School University of
Pennsylvania.
Focarelli, D. et. al. (2001), ‘The patterns of cross-border bank
mergers and shareholdings in OECD countries’, Journal of
Banking and Finance, Vol. 25, No. 12, pp. 2305-2337.
Hackbarth, Dirk., et. al. (2006), - ‘Stock Returns In Mergers
and Acquisitions’.
Haleblian, Jerayr, et. al. (2009) – ‘Taking Stock of what we
know about Mergers and Acquisitions: A Review of Research
Agenda’, Forthcoming Journal of Management, 2009.
Indian Banking Sector – A Note on Opportunities &
Imperatives’, Working Paper 06-13, XLRI School of Business,
Jamshedpur and S. P. Jain Center of Management,
Singapore Campus 119579, Singapore
Jensen, Michael C. (1987), - ‘The Free Cash Flow Theory of
Takeovers: A Financial Perspective
Kaplan, Steven N. (2006) – ‘Mergers and Acquisitions: A
Financial Economics Perspective’, prepared for the Anti-trust
Modernization Commission Economist’s Round Table on
Mergers Enforcement on Jan. 19, 2006.
Kummer, C., et. al. (2008), - ‘Why Merger and Acquisition
(M&A) Waves Re-occur: The vicious Circle from Pressure to
Fainlure’, Strategic Management Review, 2(1), 2008 –Pg. 44-
63.
Lambrecht, Bart M., Professor of Finance, Lancaster
University Management School, - ‘Mergers and Acquisitions
as a response to the Economic Change’-Journal of financial
transformations’.
Makismovic, et. al. (2000), - ‘The Corporate Assets: Who
engages in Mergersand Assets sales and Are there
Efficiency Gains?’
Reed, Michael., et. al. (2003) – ‘Factors Affecting
International Mergers and Acquisitions’, University of
Kentucky, International Food and Agribusiness management
Review Vol.6 No. 4, 2003.
Rossi, Stefano et. al. (2003), - ‘Cross Country Determinants
of the Mergers and Acquisitions’, © Working Paper N
25/2003, London Business School, UK
Salleo, Carmello, Bank of Italy, ‘Mergers and Acquisitions:
Old Issue New evidence? (January 2008)
Straub, Thomas, (2008), - ‘MERGERS AND ACQUISITIONS
World Investment Report 2008- ‘Transnational Corporations
and the Infrastructure Challenge’, UNCTAD
Mergers And Acquisitions As Strategic Drivers For Economic Growth: A ReviewSheeba Kapil
SAARANSHRKG JOURNAL OF MANAGEMENTVol . 1 No. 1 JULY 2009• •
74
MARKETING STRATEGY FOR DREAM SHELTER FINANCING
Ashish K. Srivastava* H. M. Jha “Bidyarthi”** Devesh K. Sharma***
ABSTRACTService marketing today gives substantial coverage to financial services. Introduction of new banks, new financial institutions, new client segments, new instruments, new windows, new opportunities and novel practices have galvanized the Indian financial sector over the last decade. Financial services, being the chief vehicle of development, have been caught between the pincers of competition (both internal and external) and the politics of development flowing in from regulatory bodies. A huge market of housing finance has paved its way amidst it in India covering wide range of clientele segments. Marketing innovations have pierced vehemently into the designing of end number of home-loan schemes by an even number of financing institutions to cater to the shelter needs of diversified range of customers. Bombarding ways of arousing ‘dream home come true’ feelings constitute the other part of the game. This research work is based on the study of six financial institutions namely Housing Finance and Development Corporation, Citibank, Standard Chartered Bank, Hongkong and Sanghai Banking Corporation, Industrial Credit and Investment Corporation of India Bank & IDBI Bank in regard with their marketing strategies for housing finance schemes. It is found that a strong customer relationship is essential to strike, execute and successfully wind up a housing finance deal of an average large sum with substantially long recovery period. The paper observes a few novel trends in the marketing scenario of this service. The financial institutions diagnose the consolidation and management risk as one of the major problems in marketing of home-loan services. There are FIs which innovate home-loan customer segments whereas the rest invade into these segments. But almost all FIs identify market segment of their doubtful clientele and for whom they pursue ‘quit-mid-way’ policy. Thus a common marketing strategy of these FIs, as this paper concludes, seems to be resorting to shortening of CRM life cycle to overcome the problem of consolidation and management risk.Keyword: Financial Service, Financial Instruments, CRM
INTRODUCTION
Towards the end of 20th century began the liberalization of
trade, industry, commerce and finance. Financial service
sector was one clear phenomenon that took place since then
on the global scenario. Financing institutions inundated the
market with one of the fundamental need sector of mankind
that was never to fit into the financial objectives of these
institutions, and that is emergence of home-loan segment.
Housing finance in developing countries is a social good in
view of its backward and forward linkages with other sectors
of the economy. In India, growth of housing finance segment
has accelerated in recent years in response to the several
supporting policy measures taken and the supervisory
incentives instituted. Companies, both of national as well as
multinational origins, have joined this segment and have
come up with varied ranges of housing finance products.
These housing finance companies belong to public and
private sectors and have since entered into fierce
competition leading to innovation of new marketing
strategies. This paper, based on sample study of marketing
strategies adopted by six housing finance companies, tries
to identify this strategic trend and the related variables. A
strategy to invade into the actual clientele segments of
competitor companies by attempting to shorten their
Customer Relationship Management (CRM) life cycle seems
to being openly manifested and practiced by these
companies. The reducing interest rate regime is found to be
the obvious variable triggering this strategic practice
amongst the housing finance companies.
HOUSING FINANCE INSTITUTIONS
UNDER STUDY
Six housing financing institutions were picked for the present
study. Three of these FIs are of multinational origin while the
remaining three are of national origin. These are named as
follows-
Housing Finance and Development
Corporation -
The Housing Development Finance Corporation Limited
(HDFC) is India's premier housing finance company and
enjoys an impeccable track record in India as well as in
international markets. Since its inception in 1977, the
Corporation has maintained a consistent and healthy growth
in its operations to remain a market leader in mortgages. Its
outstanding loan portfolio covers well over a million dwelling
*Reader, Institute of Management, Pt. Ravishankar Shukla University, Raipur, Chattisgarh, INDIA email: [email protected]**Professor, Department of Business Administration and Research, Shri Sant Gajanan Maharaj College of Engineering, Shegaon ,Buldana, Maharashtra***Research Scholar
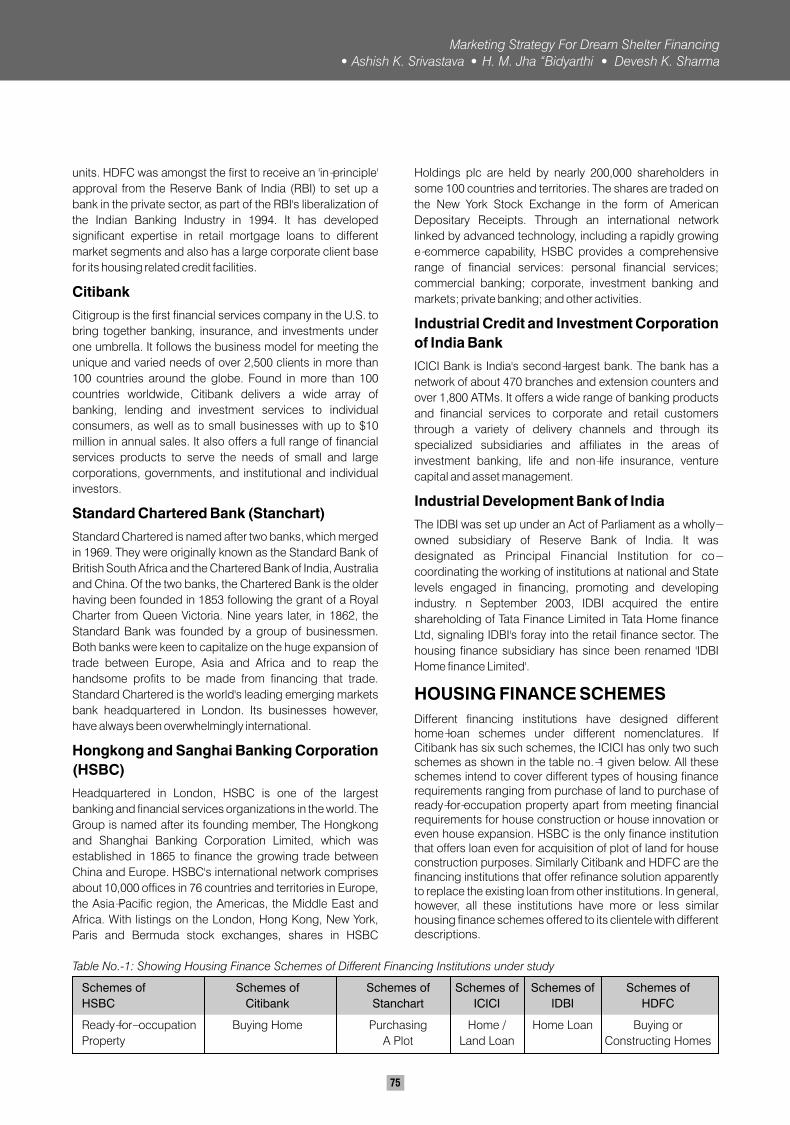
75
units. HDFC was amongst the first to receive an 'in-principle'
approval from the Reserve Bank of India (RBI) to set up a
bank in the private sector, as part of the RBI's liberalization of
the Indian Banking Industry in 1994. It has developed
significant expertise in retail mortgage loans to different
market segments and also has a large corporate client base
for its housing related credit facilities.
Citibank
Citigroup is the first financial services company in the U.S. to
bring together banking, insurance, and investments under
one umbrella. It follows the business model for meeting the
unique and varied needs of over 2,500 clients in more than
100 countries around the globe. Found in more than 100
countries worldwide, Citibank delivers a wide array of
banking, lending and investment services to individual
consumers, as well as to small businesses with up to $10
million in annual sales. It also offers a full range of financial
services products to serve the needs of small and large
corporations, governments, and institutional and individual
investors.
Standard Chartered Bank (Stanchart)
Standard Chartered is named after two banks, which merged
in 1969. They were originally known as the Standard Bank of
British South Africa and the Chartered Bank of India, Australia
and China. Of the two banks, the Chartered Bank is the older
having been founded in 1853 following the grant of a Royal
Charter from Queen Victoria. Nine years later, in 1862, the
Standard Bank was founded by a group of businessmen.
Both banks were keen to capitalize on the huge expansion of
trade between Europe, Asia and Africa and to reap the
handsome profits to be made from financing that trade.
Standard Chartered is the world's leading emerging markets
bank headquartered in London. Its businesses however,
have always been overwhelmingly international.
Hongkong and Sanghai Banking Corporation
(HSBC)
Headquartered in London, HSBC is one of the largest
banking and financial services organizations in the world. The
Group is named after its founding member, The Hongkong
and Shanghai Banking Corporation Limited, which was
established in 1865 to finance the growing trade between
China and Europe. HSBC's international network comprises
about 10,000 offices in 76 countries and territories in Europe,
the Asia-Pacific region, the Americas, the Middle East and
Africa. With listings on the London, Hong Kong, New York,
Paris and Bermuda stock exchanges, shares in HSBC
Holdings plc are held by nearly 200,000 shareholders in
some 100 countries and territories. The shares are traded on
the New York Stock Exchange in the form of American
Depositary Receipts. Through an international network
linked by advanced technology, including a rapidly growing
e-commerce capability, HSBC provides a comprehensive
range of financial services: personal financial services;
commercial banking; corporate, investment banking and
markets; private banking; and other activities.
Industrial Credit and Investment Corporation
of India Bank
ICICI Bank is India's second-largest bank. The bank has a
network of about 470 branches and extension counters and
over 1,800 ATMs. It offers a wide range of banking products
and financial services to corporate and retail customers
through a variety of delivery channels and through its
specialized subsidiaries and affiliates in the areas of
investment banking, life and non-life insurance, venture
capital and asset management.
Industrial Development Bank of India
The IDBI was set up under an Act of Parliament as a wholly-
owned subsidiary of Reserve Bank of India. It was
designated as Principal Financial Institution for co-
coordinating the working of institutions at national and State
levels engaged in financing, promoting and developing
industry. n September 2003, IDBI acquired the entire
shareholding of Tata Finance Limited in Tata Home finance
Ltd, signaling IDBI's foray into the retail finance sector. The
housing finance subsidiary has since been renamed 'IDBI
Home finance Limited'.
HOUSING FINANCE SCHEMES
Different financing institutions have designed different home-loan schemes under different nomenclatures. If Citibank has six such schemes, the ICICI has only two such schemes as shown in the table no.-1 given below. All these schemes intend to cover different types of housing finance requirements ranging from purchase of land to purchase of ready-for-occupation property apart from meeting financial requirements for house construction or house innovation or even house expansion. HSBC is the only finance institution that offers loan even for acquisition of plot of land for house construction purposes. Similarly Citibank and HDFC are the financing institutions that offer refinance solution apparently to replace the existing loan from other institutions. In general, however, all these institutions have more or less similar housing finance schemes offered to its clientele with different descriptions.
Table No.-1: Showing Housing Finance Schemes of Different Financing Institutions under study
Schemes of Schemes of Schemes of Schemes of Schemes of Schemes of
HSBC Citibank Stanchart ICICI IDBI HDFC
Ready-for- occupation Buying Home Purchasing Home / Home Loan Buying or
Property A Plot Land Loan Constructing Homes
Marketing Strategy For Dream Shelter Financing
Ashish K. Srivastava H. M. Jha “Bidyarthi Devesh K. Sharma
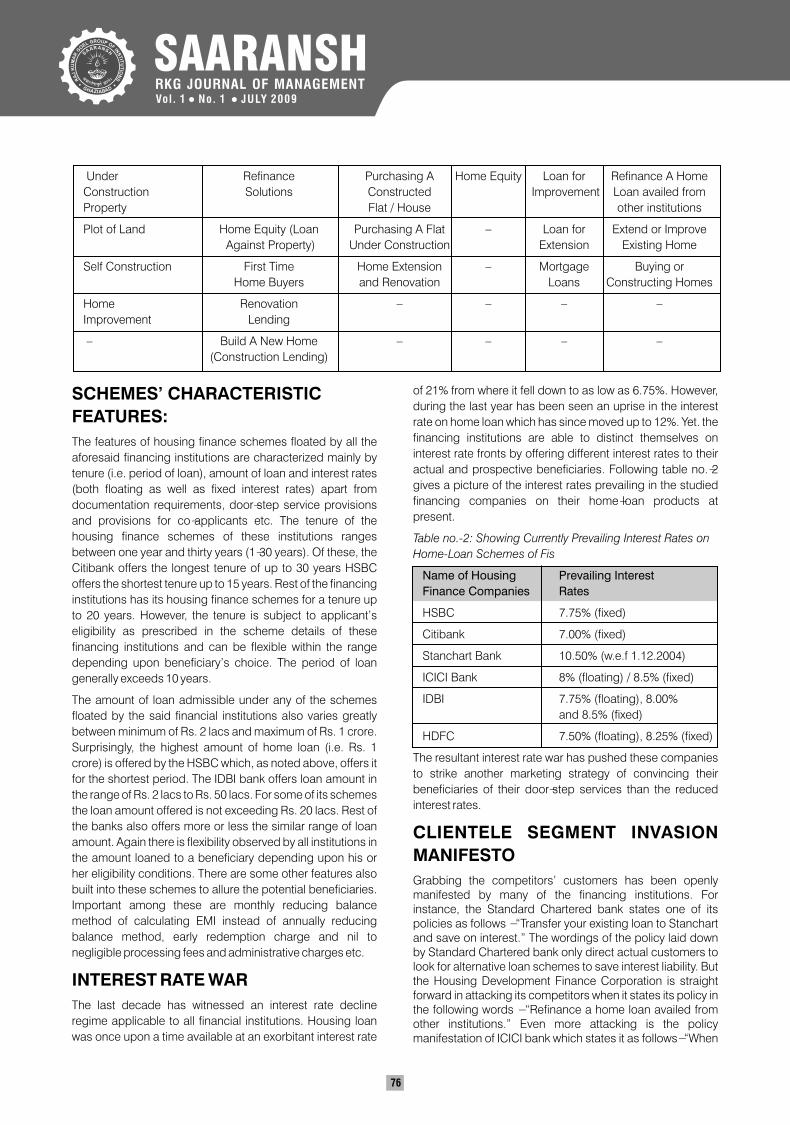
SAARANSHRKG JOURNAL OF MANAGEMENTVol . 1 No. 1 JULY 2009• •
76
Under Refinance Purchasing A Home Equity Loan for Refinance A Home
Construction Solutions Constructed Improvement Loan availed from
Property Flat / House other institutions
Plot of Land Home Equity (Loan Purchasing A Flat – Loan for Extend or Improve
Against Property) Under Construction Extension Existing Home
Self Construction First Time Home Extension – Mortgage Buying or
Home Buyers and Renovation Loans Constructing Homes
Home Renovation – – – –
Improvement Lending
– Build A New Home – – – –
(Construction Lending)
SCHEMES’ CHARACTERISTIC
FEATURES:
The features of housing finance schemes floated by all the
aforesaid financing institutions are characterized mainly by
tenure (i.e. period of loan), amount of loan and interest rates
(both floating as well as fixed interest rates) apart from
documentation requirements, door-step service provisions
and provisions for co-applicants etc. The tenure of the
housing finance schemes of these institutions ranges
between one year and thirty years (1-30 years). Of these, the
Citibank offers the longest tenure of up to 30 years HSBC
offers the shortest tenure up to 15 years. Rest of the financing
institutions has its housing finance schemes for a tenure up
to 20 years. However, the tenure is subject to applicant’s
eligibility as prescribed in the scheme details of these
financing institutions and can be flexible within the range
depending upon beneficiary’s choice. The period of loan
generally exceeds 10 years.
The amount of loan admissible under any of the schemes
floated by the said financial institutions also varies greatly
between minimum of Rs. 2 lacs and maximum of Rs. 1 crore.
Surprisingly, the highest amount of home loan (i.e. Rs. 1
crore) is offered by the HSBC which, as noted above, offers it
for the shortest period. The IDBI bank offers loan amount in
the range of Rs. 2 lacs to Rs. 50 lacs. For some of its schemes
the loan amount offered is not exceeding Rs. 20 lacs. Rest of
the banks also offers more or less the similar range of loan
amount. Again there is flexibility observed by all institutions in
the amount loaned to a beneficiary depending upon his or
her eligibility conditions. There are some other features also
built into these schemes to allure the potential beneficiaries.
Important among these are monthly reducing balance
method of calculating EMI instead of annually reducing
balance method, early redemption charge and nil to
negligible processing fees and administrative charges etc.
INTEREST RATE WAR
The last decade has witnessed an interest rate decline
regime applicable to all financial institutions. Housing loan
was once upon a time available at an exorbitant interest rate
of 21% from where it fell down to as low as 6.75%. However,
during the last year has been seen an uprise in the interest
rate on home loan which has since moved up to 12%. Yet. the
financing institutions are able to distinct themselves on
interest rate fronts by offering different interest rates to their
actual and prospective beneficiaries. Following table no.-2
gives a picture of the interest rates prevailing in the studied
financing companies on their home-loan products at
present.
Table no.-2: Showing Currently Prevailing Interest Rates on
Home-Loan Schemes of Fis
Name of Housing Prevailing Interest
Finance Companies Rates
HSBC 7.75% (fixed)
Citibank 7.00% (fixed)
Stanchart Bank 10.50% (w.e.f 1.12.2004)
ICICI Bank 8% (floating) / 8.5% (fixed)
IDBI 7.75% (floating), 8.00%
and 8.5% (fixed)
HDFC 7.50% (floating), 8.25% (fixed)
The resultant interest rate war has pushed these companies
to strike another marketing strategy of convincing their
beneficiaries of their door-step services than the reduced
interest rates.
CLIENTELE SEGMENT INVASION
MANIFESTO
Grabbing the competitors’ customers has been openly manifested by many of the financing institutions. For instance, the Standard Chartered bank states one of its policies as follows - “Transfer your existing loan to Stanchart and save on interest.” The wordings of the policy laid down by Standard Chartered bank only direct actual customers to look for alternative loan schemes to save interest liability. But the Housing Development Finance Corporation is straight forward in attacking its competitors when it states its policy in the following words - “Refinance a home loan availed from other institutions.” Even more attacking is the policy manifestation of ICICI bank which states it as follows- “When
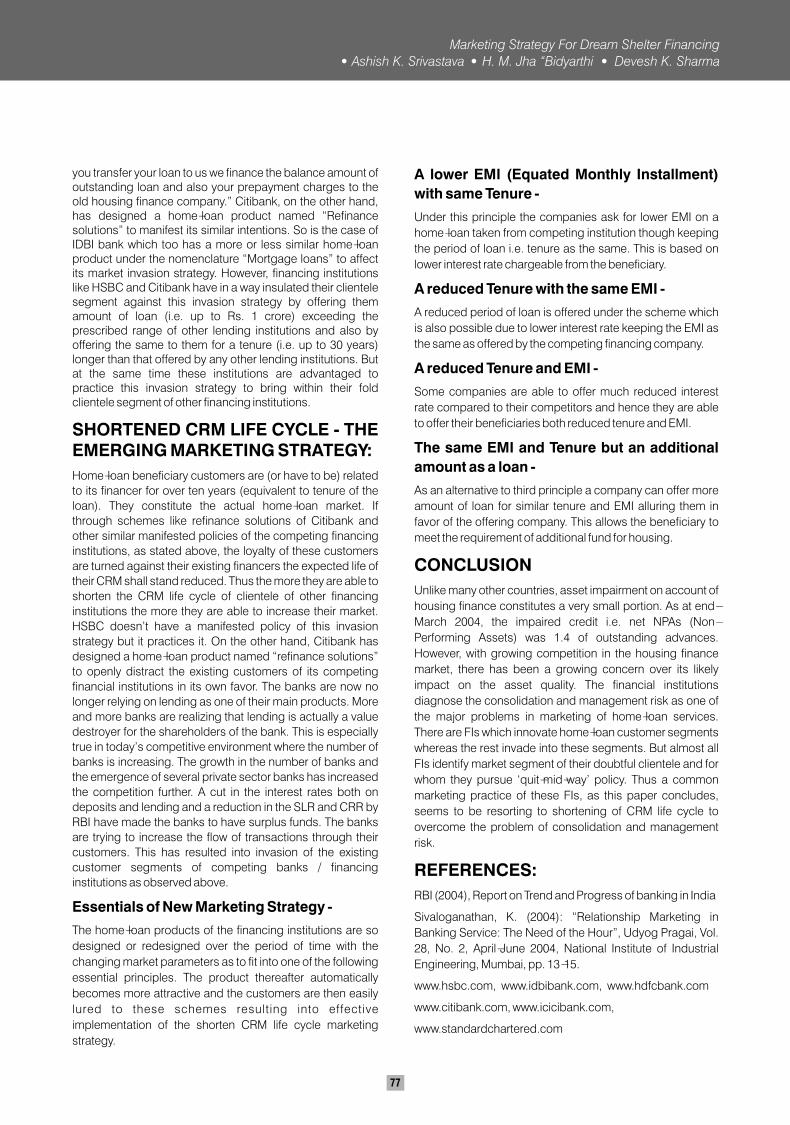
77
you transfer your loan to us we finance the balance amount of outstanding loan and also your prepayment charges to the old housing finance company.” Citibank, on the other hand, has designed a home-loan product named “Refinance solutions” to manifest its similar intentions. So is the case of IDBI bank which too has a more or less similar home-loan product under the nomenclature “Mortgage loans” to affect its market invasion strategy. However, financing institutions like HSBC and Citibank have in a way insulated their clientele segment against this invasion strategy by offering them amount of loan (i.e. up to Rs. 1 crore) exceeding the prescribed range of other lending institutions and also by offering the same to them for a tenure (i.e. up to 30 years) longer than that offered by any other lending institutions. But at the same time these institutions are advantaged to practice this invasion strategy to bring within their fold clientele segment of other financing institutions.
SHORTENED CRM LIFE CYCLE - THE EMERGING MARKETING STRATEGY:
Home-loan beneficiary customers are (or have to be) related
to its financer for over ten years (equivalent to tenure of the
loan). They constitute the actual home-loan market. If
through schemes like refinance solutions of Citibank and
other similar manifested policies of the competing financing
institutions, as stated above, the loyalty of these customers
are turned against their existing financers the expected life of
their CRM shall stand reduced. Thus the more they are able to
shorten the CRM life cycle of clientele of other financing
institutions the more they are able to increase their market.
HSBC doesn’t have a manifested policy of this invasion
strategy but it practices it. On the other hand, Citibank has
designed a home-loan product named “refinance solutions”
to openly distract the existing customers of its competing
financial institutions in its own favor. The banks are now no
longer relying on lending as one of their main products. More
and more banks are realizing that lending is actually a value
destroyer for the shareholders of the bank. This is especially
true in today’s competitive environment where the number of
banks is increasing. The growth in the number of banks and
the emergence of several private sector banks has increased
the competition further. A cut in the interest rates both on
deposits and lending and a reduction in the SLR and CRR by
RBI have made the banks to have surplus funds. The banks
are trying to increase the flow of transactions through their
customers. This has resulted into invasion of the existing
customer segments of competing banks / financing
institutions as observed above.
Essentials of New Marketing Strategy -
The home-loan products of the financing institutions are so
designed or redesigned over the period of time with the
changing market parameters as to fit into one of the following
essential principles. The product thereafter automatically
becomes more attractive and the customers are then easily
lured to these schemes resulting into effective
implementation of the shorten CRM life cycle marketing
strategy.
A lower EMI (Equated Monthly Installment)
with same Tenure -
Under this principle the companies ask for lower EMI on a
home-loan taken from competing institution though keeping
the period of loan i.e. tenure as the same. This is based on
lower interest rate chargeable from the beneficiary.
A reduced Tenure with the same EMI -
A reduced period of loan is offered under the scheme which
is also possible due to lower interest rate keeping the EMI as
the same as offered by the competing financing company.
A reduced Tenure and EMI -
Some companies are able to offer much reduced interest
rate compared to their competitors and hence they are able
to offer their beneficiaries both reduced tenure and EMI.
The same EMI and Tenure but an additional
amount as a loan -
As an alternative to third principle a company can offer more
amount of loan for similar tenure and EMI alluring them in
favor of the offering company. This allows the beneficiary to
meet the requirement of additional fund for housing.
CONCLUSION
Unlike many other countries, asset impairment on account of
housing finance constitutes a very small portion. As at end-
March 2004, the impaired credit i.e. net NPAs (Non-
Performing Assets) was 1.4 of outstanding advances.
However, with growing competition in the housing finance
market, there has been a growing concern over its likely
impact on the asset quality. The financial institutions
diagnose the consolidation and management risk as one of
the major problems in marketing of home-loan services.
There are FIs which innovate home-loan customer segments
whereas the rest invade into these segments. But almost all
FIs identify market segment of their doubtful clientele and for
whom they pursue ‘quit-mid-way’ policy. Thus a common
marketing practice of these FIs, as this paper concludes,
seems to be resorting to shortening of CRM life cycle to
overcome the problem of consolidation and management
risk.
REFERENCES:
RBI (2004), Report on Trend and Progress of banking in India
Sivaloganathan, K. (2004): “Relationship Marketing in
Banking Service: The Need of the Hour”, Udyog Pragai, Vol.
28, No. 2, April-June 2004, National Institute of Industrial
Engineering, Mumbai, pp. 13-15.
www.hsbc.com, www.idbibank.com, www.hdfcbank.com
www.citibank.com, www.icicibank.com,
www.standardchartered.com
Marketing Strategy For Dream Shelter Financing
Ashish K. Srivastava H. M. Jha “Bidyarthi Devesh K. Sharma
SAARANSHRKG JOURNAL OF MANAGEMENTVol . 1 No. 1 JULY 2009• •
78
INSIGHTS INTO THE RETENTION OF HUMAN CAPITAL IN INDIAN CORPORATES:
A POINT OF VIEW AND METHODG.L.Narayanappa*
N.Suhasini** T. Naresh Babu***
ABSTRACTEmployee retention is one of the identified hard core topics in India’s today’s corporate sector. Despite this majority of Indian
companies don’t have proper understanding of what retention truly, hence Indian industries confronting turbulent situations in
retaining high caliber employees at the outset the organization should understand the important factors affecting their retention
and to increase the retention rates of top performer. The retention process should begin even before an employee arrives into
the organization. An induction pack should be developed by the company that will provide a broad picture of the organization,
its people and its goals. This should reinforce the new employees’ belief that they have made the right decision. Hence the
retention of high caliber human capital has become a challenging task to the industry for ever.Keyword: Retention, Human Capital, Factors
RETENTION MANAGEMENT – A
BACK DROP
The term employee retention first popped up on the business
scene during late 1970’s. Till then, the fundamental nature of
the association between an employer and an employee had
been a statement of the status quo: “work for me perform
better and as long as financial conditions permit, I will
continue to give you work”. During 1950’s and even 1960’s, it
was not uncharacteristic for people who entered job market
to associate with the same employer for a long time,
sometimes, even for their entire life,. Anyone, who changed
jobs, would be seen as eccentric and out of the ordinary.
However, all that changed during the mid-1990, as it signaled
what has now become a common characteristic of the HR
arena: job hopping and low or no loyalty to the employer. The
trend is now widely prevalent across business life and so is
the “employee churn”. No surprise that today, retaining key
employees is a major strategic challenge facing the
companies and is critical to the latter’s long-term prosperity.
Austin (1998) stresses that the effort for employee retention
must come from the top. The effort to develop good retention
must be a primary goal of managers at all levels in the
organization, and it must be a consistent goal that is
developed and reinforced overtime. As such it can only occur
if supported at the highest levels in the organization.
Employee retention means many things to many people in
each organization. The concept is not confined to single
definition. Some views mentioned by J.LeslieMckeown are -
“Employee retention means stopping people from leaving
this organization.” Employee retention is all about “Keeping
good people.” Getting our compensation and benefits into
line with the market place. It’s got to do with our culture and
how we treat people.
According to The HR Priorities Survey from ORC Worldwide
http://www.orcworldwide.com/ ), an HR consulting and data
services firm, nearly 62 percent of respondents to their survey
opined that talent management will be the most pressing
strategic issue they face in year. The findings of the survey
also indicated that 33 percent of talent management
programs include workforce acquisition, assesment,
development, and retention as areas that will consume most
of the survey respondents' time this year 2007. Retention has
emerged as the focus of much time and attention in recent
years, particularly as part of talent management programs,
and so much is known about it that the HR practitioner who
tries to integrate it into a talent program may grow bewildered
by the huge volume of research about it (see Buenger, 2006;
Deloitte, 2005; Gallagher, Nadarajah, & Pinnuck, 2006;
Jenkins, 2006; Law, 2003; Maria-Luisa, 2004; Michaels,
Handfield-Jones, & Axelrod, 2001; Snow, 1976; Oakes,
2006; Rappaport, Bancroft, & Okum, 2003; Rothberg, 2007;
Rubin & Brown, 1975; Walsh, 1988; Walsh, 1989). Both
researchers and human resource (HR) practitioners agree
that the employment relationship is undergoing fundamental
changes that have implications for the attraction, motivation
and retention of talented employees (Horwitz, Heng, &
Quazi, 2003: Roehling, Cavanaugh, Moyhihan & Boswell,
2000; Turnley & Feldman, 2000). Over the past decades, the
economic environment organizations work in has changed
*Professor & Head, MBA Department, Kandula School of Management, Kadapa, E-mail: [email protected]**Assistant Professor, Kandula School Of Management, Kadapa ***Assistant Professor, Sri Sai College Of It & Management, Kadapa,
79
dramatically. Due to on-going evolutions towards
international competition, deregularization and globalization
of markets, organizations are required to be more flexible and
to increase their productivity. This has reduced the job
security of employees at all levels in the organization (King,
2000) but at the same time HR managers are pressed to
attract and retain talented employees who have
competencies that are critical for organizational survival
(Horwitz et al., 2003; Mitchell, Holtom & Lee, 2001; Roehling
et al., 2000; Steel, Griffeth & Hom, 2002). Retention
management has become a popular concept to examine the
portfolio of HR practices put into place by organizations in
order to reduce voluntary turnover rates (e.g. Cappelli, 2001;
Mitchell et al., 2001; Steel et al., 2002).
RETENTION MANAGEMENT – A GLOBAL
PERSPECTIVE
The first and foremost thing is Competitive salary, Employee
involvement, work-life balance Understanding that
employees are not slaves and they do have their lives and
they have the right to enjoy their lives too. People work to live
but not live to work. Training: Keeping the employee
competitive by mandatory training programs, seminars etc.
Semi-annual reviews: These reviews are not used in
determining how good or bad an employee is but in working
out a mutually agreed plan and goals for the employee to be
successful for the organization. This way the expectations are
very clear and employee will not be unhappy when the
bonuses and raises show up. Celebrations: Encouraging
Group lunches, birthday lunches etc is very much useful in
motivating the employees. These parties do not have to be
expensive. Sometimes these are counted more than just
giving them money or gift certificate. Recognition,
Acknowledging the performers – if someone does something
extra or special he/she should be acknowledged in public –
semi-annual performance awards. Making it very clear to the
employees that performance and ethics go hand-in-hand
and any exceptions will not be tolerated. Its message should
be clear – perform and get rewarded or neglect and get fired.
INDIAN PERSPECTIVE IN RETAINING
HUMAN CAPITAL
The following tools are followed in retaining any firm’s skilled
employees which is the important challenge any company is
facing now in the market: A performance-based
compensation plan should be designed to encourage the
employees to behave in ways that will result in attainment of
the goals of any company, while also meeting their
employees' personal objectives. Company goals usually
include growth, profitability, quality service, efficiency,
effectiveness, and image and reputation. A profit sharing
plan could be adopted for all employees to share in the profit
pool in proportion to their annual earnings relative to total
earnings of all employees. Coming up with ways to help the
employees save money and streamline their lives is
considered important in retaining employees. Money is not
always the primary motivator for most employees.
Recognizing its people frequently for their good work makes
to repeat the performance frequently. Look for key measures
to recognize employees, such as production, client retention
rate, etc. Come up with contests to recognize its employees,
Small, tangible rewards are also a good idea. Give
recognition certificates, plaques and prizes and other than
money, such as tickets for movie rental or sports events, or
gift certificates for merchandise or dinner. Giving something
tangible makes a more lasting impression. Praising their best
performers will raise the bar for the weaker people. The goal
is to encourage behaviors that build the business and
recognize their people for practicing those behaviors as
often as possible. Let employees know what's happening
with the company. Trust in its people must be shown and
make them to feel by sharing with them financial and other
company inside information Be flexible with work schedules,
and Encourage creativity and innovation by providing an
atmosphere where employees feel comfortable making
suggestions and trying out new ideas. The more an
organization can demonstrate to candidates and new
employees that it can help them achieve their original career
goals, the more effectively that organization can be in
recruiting and retaining those employees. Support
Employees will appreciate having adequate support. They
need someone readily available to help when they have
questions or encounter problems. Empowerment Engage
employees in decision-making; give them the authority to act
in the best interests of the company. Mentoring the
employees Mentoring involves 4 key ingredients namely,
humility, inclusion, generosity and freedom. Attracting and
retaining talent is not just a matter of higher salaries and more
perks. It involves shaping the whole organization, its vision,
values, strategy, leadership, rewards and recognition. Above
all, retaining employees is a matter of building loyalty. More
often than not, the ability to develop loyalty is linked to the
credibility of the top management. Building the right culture
is an important step in improving employee loyalty. It involves
understanding the existing values, clarifying business goals
and strategy, defining the desired culture and introducing
change management. Leaders, who believe in treating
employees fairly, build employee loyalty. Those who fire
employees indiscriminately erode loyalty. Using small teams
facilitates faster and entrepreneurial decision-making. It also
increases accountability and makes it easier to recognize
achievers. High achievers relish such a work environment.
EMPLOYEE RETENTION – ITS
C O G N I S A N C E I N I N D I A N
CORPORATE SECTOR
Bringing employees up to speed takes even more time and
when an organization is short-staffed, they often need to put
in extra time to get the work done. Employee retention is
commonly considered to mean the ability to maintain a
Insights Into The Retention of Human Capital In Indian Corporates: A Point Of View And Method
G.L.Narayanappa N.Suhasini T. Naresh Babu
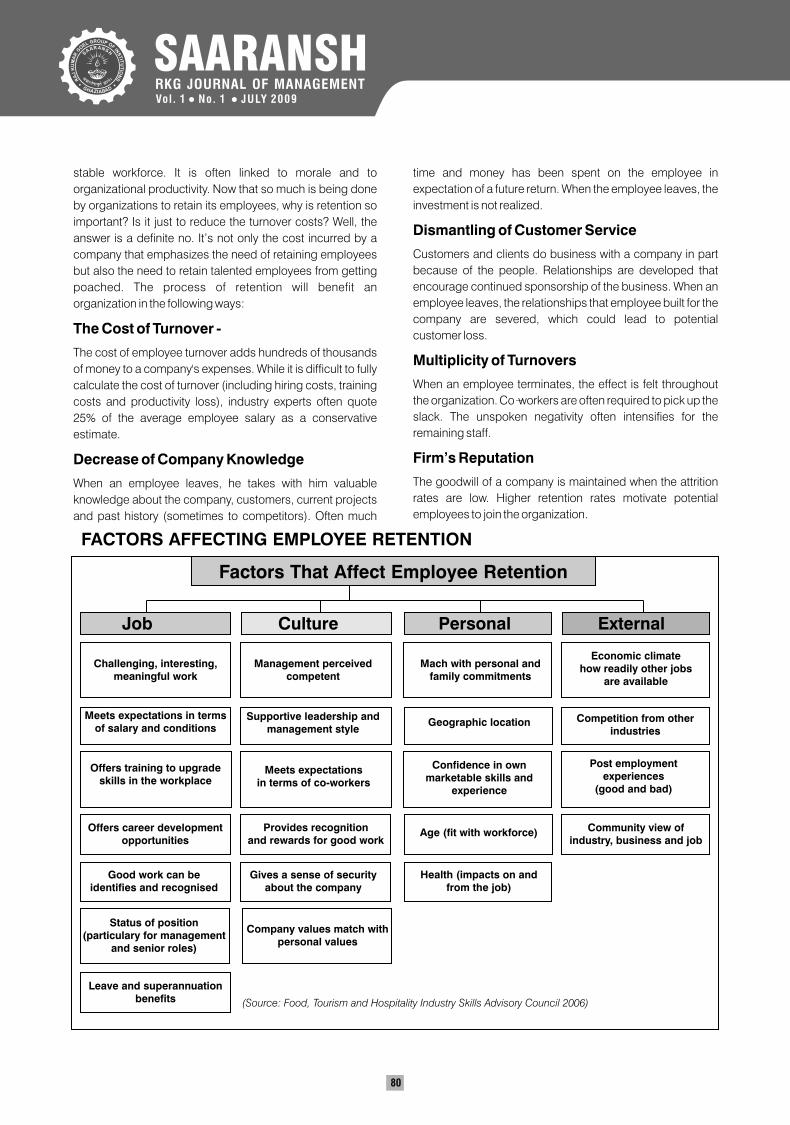
SAARANSHRKG JOURNAL OF MANAGEMENTVol . 1 No. 1 JULY 2009• •
80
stable workforce. It is often linked to morale and to
organizational productivity. Now that so much is being done
by organizations to retain its employees, why is retention so
important? Is it just to reduce the turnover costs? Well, the
answer is a definite no. It’s not only the cost incurred by a
company that emphasizes the need of retaining employees
but also the need to retain talented employees from getting
poached. The process of retention will benefit an
organization in the following ways:
The Cost of Turnover -
The cost of employee turnover adds hundreds of thousands
of money to a company's expenses. While it is difficult to fully
calculate the cost of turnover (including hiring costs, training
costs and productivity loss), industry experts often quote
25% of the average employee salary as a conservative
estimate.
Decrease of Company Knowledge
When an employee leaves, he takes with him valuable
knowledge about the company, customers, current projects
and past history (sometimes to competitors). Often much
time and money has been spent on the employee in
expectation of a future return. When the employee leaves, the
investment is not realized.
Dismantling of Customer Service
Customers and clients do business with a company in part
because of the people. Relationships are developed that
encourage continued sponsorship of the business. When an
employee leaves, the relationships that employee built for the
company are severed, which could lead to potential
customer loss.
Multiplicity of Turnovers
When an employee terminates, the effect is felt throughout
the organization. Co-workers are often required to pick up the
slack. The unspoken negativity often intensifies for the
remaining staff.
Firm’s Reputation
The goodwill of a company is maintained when the attrition
rates are low. Higher retention rates motivate potential
employees to join the organization.
FACTORS AFFECTING EMPLOYEE RETENTION
Job Culture Personal External
Challenging, interesting,meaningful work
Meets expectations in termsof salary and conditions
Offers training to upgradeskills in the workplace
Offers career developmentopportunities
Good work can beidentifies and recognised
Status of position(particulary for management
and senior roles)
Management perceived competent
Supportive leadership andmanagement style
Meets expectationsin terms of co-workers
Provides recognitionand rewards for good work
Gives a sense of securityabout the company
Company values match withpersonal values
Mach with personal andfamily commitments
Economic climatehow readily other jobs
are available
Competition from otherindustries
Geographic location
Confidence in ownmarketable skills and
experience
Age (fit with workforce)
Health (impacts on andfrom the job)
Post employmentexperiences
(good and bad)
Community view ofindustry, business and job
Leave and superannuationbenefits (Source: Food, Tourism and Hospitality Industry Skills Advisory Council 2006)
Factors That Affect Employee Retention
81
In view of the large costs associated with employee turnover,
even in a global economic downturn characterized by
downsizing and layoffs, HR managers still need to work out
HR practices that enable them to retain their talented
employees (Horwitz et al., 2003; Steel et al., 2002). These
practices are often bundled under the term “retention
management”. Retention management is defined as “the
ability to hold onto those employees you want to keep, for
longer than your competitors” (Johnson, 2000). In the
literature numerous factors are put forward as important in
affecting employee retention, varying from purely financial
inducements to so-called “new-age” benefits. These
inducements can be grouped into five major categories of
retention factors, namely (1) financial rewards, (2) career
development opportunities, (3) job content, (4) social
atmosphere, and (5) work-life balance (e.g. Horwich et al.,
2003; Roehling et al., 2000; Ulrich, 1998).
First, financial rewards, or the provision of an attractive
remuneration package, are one of the most widely discussed
retention factors, since they not only fulfill financial and
material needs. They also have a social meaning, with the
salary level providing an indication of the employee’s relative
position of power and status within the organization.
However, research shows that there is much interindividual
variability in the importance of financial rewards for employee
retention (Pfeffer, 1998; Woodruffe, 1999). For instance, a
study conducted by the “Institute for Employment Studies”
(Bevan, 1997) reveals that only ten percent of people who
had left their employer gave dissatisfaction with pay as the
main reason for leaving. Moreover, due to the trend towards
benchmarking, it is becoming increasingly difficult for
companies to set themselves apart from their competitors by
means of remuneration, which reduces the impact of
financial rewards on employee retention (Cappelli, 2001).
However, despite the fact that many studies show financial
rewards to be a poor motivating factor, it remains a tactic
used by many organizations to commit their employees to
the organization by means of remuneration packages.
Second, opportunities for career development are
considered as one of the most important factors affecting
employee retention. It is suggested that a company that
wants to strengthen its bond with its employees must invest in
the development of these employees (Hall & Moss, 1998;
Hsu, Jiang, Klein & Tang, 2003; Steel et al., 2002; Woodruffe,
1999). This does not, or not only, involve the creation of
opportunities for promotion within the company but also
opportunities for training and skill development that allow
employees to enhance their employability on the internal
and/or external labor market (Butler & Waldrop, 2001). Other
factors relating to career development are the provision of
mentoring or coaching to employees, the organization of
career management workshops and the set up of
competency management programs
The third category of retention factors relates to employees’
job content, more specifically the provision of challenging
and meaningful work. It builds on the assumption that people
do not just work for the money but also to create purpose and
satisfaction in their life (Mitchell et al., 2001; Pfeffer, 1998).
According to Woodruffe (1999) employees, in addition to a
strong need to deliver excellent results, also want to take on
difficult challenges that are relevant for the organization.
However, when their work mainly consists of the routine-
based performance of tasks, the likelihood of de-motivation
and turnover is relatively high. By thinking carefully about
which tasks to include in which jobs, companies can affect
their retention rates
Finally, facilitating a good work-life balance is the fifth
retention factor frequently cited in the literature (Anderson,
Coffey & Byerly, 2002). The conflict between work and career
on the one hand and private life on the other is currently
assuming large proportions in our society. There is an
increasing demand for more flexible forms of work, which
would positively affect the reduction of the work-family
conflict and employee satisfaction in general (Anderson et
al., 2002; Kossek & Ozeki, 1998). HR policies addressing
work-life balance are assumed to be important because the
current generation of employees attaches much importance
to quality of life, as a result of the ever increasing work
pressure (Cappelli, 2001; Mitchell et al., 2001). Research
suggests that policies aimed at improving the work-life
balance are successful if they are implemented in a
supportive context that truly allows employees to make
meaningful and useful choices (Anderson et al., 2002:
Kossek & Ozeki, 1998).
This review of factors affecting employee retention suggests
that HR managers should take into account these factors
when working our retention policies. However, most existing
studies on retention management have not addressed all
five types of retention factors, which makes it impossible to
assess their relative embedded ness in the retention
practices put in place by HR managers. Therefore in the first
part of our study we examine the relative attention HR
managers pay to each of these factors in working out their
retention policies. However, in order to improve our
understandings of the effectiveness of these retention
factors, it is important to relate them to employees’ views on
their importance and actual delivery by their employer.
WHY DO EMPLOYEES LEAVE AN
ORGANIZATION?
Most of us believe our employees leave us for money reasons. how many times have you said, “if only I could have paid her more ,she would have stayed.” The additional reasons may be: Employees expectations of the job, Absence of conducive workplace environment, Mismatch of job profile, Lack of opportunities for pursuing higher studies and career growth, Lack of recognition / appreciation, Lack of trust, Lack of empowerment and employee engagement, Lack of confidence in peers, seniors and the management, Stress and work-life imbalance, Odd working hours, More
Insights Into The Retention of Human Capital In Indian Corporates: A Point Of View And Method
G.L.Narayanappa N.Suhasini T. Naresh Babu
SAARANSHRKG JOURNAL OF MANAGEMENTVol . 1 No. 1 JULY 2009• •
82
lucrative job offers. The reasons are interrelated and diverse. The motives depend on each employee’s preferences and needs. The very reason for some employees to leave may be the cause for others to stay. As a result, it is important to understand employee’s needs and to address them. Some of the major factors responsible for employees quitting an organization are:
Attitude of Management
In most cases managers or senior executives influence the decision that leads to either employee’s resignation or retention. High retention is a by- product of good management.
Work culture and Environment
Many studies have revealed that employee’s prosperity to either remain or redesign depends on the organizations work culture.
Inherent Factors
Factors like utilization of employee’s skill sets and providing them challenging work also decides the rate of retention.
STRATEGIES FOR RETAINING HUMAN CAPITAL
The importance of retaining top organizational talent cannot be understated. With the massive baby boomer cohort just starting to approach retirement age, more and more jobs are going to become available in the near future. What this means for employees is that it is now easier than ever leave one's current position to find greener pastures elsewhere. A more attractive market for job seekers means that the switching costs of seeking new employment are no longer a significant factor in deciding whether or not to leave an organization. The days where a job seeker might spend six months to secure a new job will soon be over. The implications for employers should be clear. It is now more important than ever to retain the team members an organization currently has and to choose the right team members when hiring decisions are made. The following is a short list of useful tips to help increase levels of employee retention in your organization. Put them to work for you!
Picking the relevant people on the bus In his book, Good to Great, Jim Collins talks about the importance of having the right talent on the organizational bus. Hiring individuals who are truly fit to succeed in the position for hire will dramatically increase the chances of that employee being satisfied with his or her work and remaining with the company for an extended period of time.
Communication, systems and channelsCommunication has become so heavily stressed in the workplace that it almost seems cliche. However communication couldn't be more important in the effort to retain employees. Be sure that team members know their roles, job description, and responsibilities within the organization. Communicate any new company policies or initiatives to all employees to be sure that everyone is on the same page. Nobody wants to feel that they are being left out of the loop.
Invitation of employees into decision making
It is incredibly important to include team members in the decision making process, especially when decisions will effect an individual's department or work team. This can help to create a culture of employee involvement and will generate new ideas and perspectives that top management might never have thought of.
Participation of team members in sharing the knowledge on reciprocity
The highest percentage of information retention occurs when one shares that information with others. Having team members share what they have learned at a recent conference or training workshop will not only increase the amount of information they will retain, but also lets a team member know that he is a valuable member of the organization. Facilitating knowledge sharing through an employee mentoring program can be equally beneficial for the team member being mentored as well as the mentor.
Flimsy feedback loop
Do not wait for an annual performance evaluation to come due to give feedback on how an employee is performing. Most team members enjoy frequent feedback about how they are performing. Shortening the feedback loop will help to keep performance levels high and will reinforce positive behavior. Feedback does not necessarily need to be scheduled or highly structured; simply stopping by a team member's desk and letting them know they are doing a good job on a current project can do wonders for morale and help to increase retention.
Offer a lucrative compensation package
Any team member wants to feel that he or she is being paid appropriately and fairly for the work he or she does. Be sure to research what other companies and organizations are offering in terms of salary and benefits. It is also important to research what the regional and national compensation averages are for that particular position. You can be sure that if your compensation package is not competitive, team members will find this out and look for employers who are willing to offer more competitive compensation packages.
Reconcile work and personal life
Family is incredibly important to team members. When work begins to put a significant strain on one's family no amount of money will keep an employee around. Stress the importance of balancing work and one's personal life. Small gestures such as allowing a team member to take an extended lunch once a week to watch his son's baseball game will likely be repaid with loyalty and extended employment with an organization.
Opening of promotional ladder for growth and development
Offer opportunities for team members to acquire new skills and knowledge useful to the organization. If an employee appears to be bored or burned out in a current position offer to train this individual in another facet of the organization where he or she would be a good fit. Nobody wants to feel
83
stuck in their position will no possibility for advancement or new opportunities.
Timely recognition and appreciation of work hawlicks -
This can be one of the single greatest factors affecting employee retention. Everybody, in all levels of an organization, wants to know that their efforts are appreciated and recognized. This can be as simple or as extravagant as a supervisor may desire. Often time ashort e-mail or quickly stopping by a team member's desk and saying "thanks" can do wonder for morale. Other options might include a mention in the company newsletter for outstanding performance or gift certificates to a restaurant or movie theatre - the possibilities are endless.
Perfect assessment of team members expectations -
Nothing can be more frustrating or discouraging for an employee than the lack of a clear understanding of what is expected of him on the job. In a performance driven workplace a lack of clarity regarding job duties and expectations can cause fear and anxiety among employees who are unclear of what is expected of them. Even worse outright anger can occur when a team member receives a negative performance evaluation based on expectations and job duties that he or she was unaware of or unclear about.
The quality of monitoring and mentorship
It has been said so often that it is almost cliche, but people leave people, not their jobs. Supervisors play the largest role in a team member's development and ultimate success within an organization. All employees want to have supervisors who are respectful, courteous, and friendly - that is a given. But more importantly team members want supervisors who set clear performance expectations, deliver timely feedback on performance, live up to their word and promises, and provide an environment where the employee can grow and succeed. Failure by supervisors and management to provide this can cause an employee to start looking for greener pastures.
Fair and equitable treatment of all employees
One of the surest ways to create animosity and resentment in an organization is to allow favoritism and preferential treatment of individual team members. The so-called "good ole' boys club" can create a noxious organization culture and foster resentment among team members. This culture will only get worse and can create a devastating exodus of valued team members. Be sure to treat all employees equally and avoid favoritism at all costs.
CONCLUSIONS & SUGGESTIONS
On an overall evaluation and scientific scanning of the concept of retention management of high caliber employees in Indian organizations, it is noticed that, the concept of retention management has caught the attention of corporate sector in Indian industry as well as around the globe. The repercussions in the last decade due to the negligence of
employee retention in Indian corporates are more significant as these concept contributed in a great way to the loss of total productivity and visibility of india’s map in the world economy. Hence, there is an imminent need to give prime importance to this vital aspect of retention management and to put the turbulent corporate sector on more viable footing. This is possible with an objective assessment or an introspection of the concept of retention management so far and vision of the road ahead. Such a vision has to encompass not only the challenges of the industry but also the understanding of people with in the industry. Further it is identified that employee retention is a vital component of an effective organizational talent management strategy. Higher officials would be well trained to explore why people leave and why high potential workers stay. However, they will be able to use the results to build employment brands and establish and maintain, an organizational climate that corroborates retention.
REFERENCES:
Horwitz, F. M., et. al.(2003). Finders, keepers? Attracting,
motivating and retaining knowledge workers. Human
Resource Management Journal, 13(4), 23-44.
King, J. E. (2000). White-collar reactions to job insecurity and
the role of the psychological contract : Implications for
human resource management. Human Resource
Management, 39(1), 79-92.
Cappelli, P. (2001). A market-driven approach to retaining
talent. Harvard Business Review on finding and keeping the
best people (pp. 27-50). Boston : Harvard Business School
Press
Johnson M., (2000), Winning the people wars, talent and the
battle for human capital. London, UK: Copyright Licensing
Agency.
Pfeffer J., (1998), Six myths about pay, Harvard Business
Review, May-June, 38-57.
Bevan S., (1997), Quit stalling, People Management,
november, 32-35
Hall, D. T., et. al. (1998). The new protean career contract:
Helping organizations and employees adapt. Organisational
Dynamics, 26(3), 22-37.
Hsu, M. K., et. al. (2003). Perceived career incentives and
intent to leave. Information & Management, 40, 361-369.
Butler, T. en Waldroop, J. (2001). Job sculpting: The art of
retaining your best people. Harvard
Mitchell, T. R., et. al. (2001). How to keep your best
employees : Developing an effective retention policy.
Academy of Management Executive, 15(4), 96-109.
Anderson, S. E., et. al. (2002). Formal organizational
initiatives and formal workplace practices: Links to work-
family conflict and job-related outcomes. Journal of
Management, 28(6), 787-810.
Insights Into The Retention of Human Capital In Indian Corporates: A Point Of View And Method
G.L.Narayanappa N.Suhasini T. Naresh Babu
SAARANSHRKG JOURNAL OF MANAGEMENTVol . 1 No. 1 JULY 2009• •
84
CREATING AND SUSTAINING CORPORATE ADVANTAGE – THE HUMAN RESOURCES WAY
S. Husain Ashraf*
ABSTRACTEach organisation has its own functional area of excellence or chief resource area based on which the strategies are formulated in the other areas as well. In this paper it is intuitively reasoned as to how corporate advantage can be created in the area of Human Resources as this area would not only hold maximum value for any organisation in general but also be the one to hold critical importance and a present challenge before all executives dealing with all areas of corporate function viz. Marketing, Production, Operations, Maintenance, Information Technology, Finance, etc. To create a truly great corporate advantage, an organisation has to work on core competencies: restructuring of corporate port-folios, creating a learning organisation and a multitude of elements which formulate an organisation viz. speed, quality, size etc. The basic theme presented in this paper is that Human Resource (HR) is not a function but a ‘total business solution’. Consequently, the onus of using HR as a strategic tool lies not merely with the HR manager but with the management as a whole.Keywords: Portfolio, Strategy, Competitive Advantage, Core Competencies
INTRODUCTION
In the competitive and dynamic business environment of the
present era, it is essential for organisations to rise above the
normal and strive towards achieving excellence in the
various areas of management. Globalisation of Indian
economy is creating both opportunities and challenges for
the industry and trade. With economic reforms, Indian
industry is gradually becoming stronger and there is hope
and excitement for developing new and more profitable
international markets. At the same time in the wake of this
development, some of the internationally well established
and competitive companies which are entering into Indian
market are putting pressure on Indian companies to cut
costs, improve quality and modernise management
systems.To create a truly great corporate advantage, an
organisation has to work on core competencies:
restructuring of corporate port-folios, creating a learning
organisation and a multitude of elements which formulate an
organisation viz. speed, quality, size etc.Each organisation
has its own functional area of excellence or chief resource
area based on which the strategies are formulated in the
other areas as well. In this paper it is intuitively reasoned as to
how corporate advantage can be created in the area of
Human Resources as this area would not only hold
maximum value for any organisation in general but also be
the one to hold critical importance and a present challenge
before all executives dealing with all areas of corporate
function viz. Marketing, Production, Operations,
Maintenance, Information Technology, Finance, etc. The
basic theme presented in this paper is that Human Resource
(HR) is not a function but a ‘total business solution’.
Consequently, the onus of using HR as a strategic tool lies
not merely with the HR manager but with the management as
a whole. It implies that once the HR team comes out with a
solution, the management as a whole has an on-going
responsibility to own it up as its concern and communicate it
across the length and breadth of the organisation. However,
unfortunately, a major obstacle to such a transformation of
the HR function is the management itself. Corporate leaders
have been demanding that they need a strategic HR
function, but they often do not have an idea as to what it
entails. Many still judge the function by its effectiveness in
delivering administrative services and keeping the company
out of trouble with regulatory agencies. They are unreceptive
to radical ideas that enhance the strategic role of HR. Thus,
the HR manager typically spends half of his time selling the
concept to management who, in general, are indifferent to it.
CONCEPTUAL FRAMEWORK
Business success is the ultimate reason for the existence of
HR, or for that matter any organisational resource. Such
business success is often explained by the competitive edge
that an organisation has over the rest of its competitors.
Michael Porter chooses to call it ‘competitive advantage’. We
may also use the term ‘corporate advantage’. Such
corporate advantage in turn comes by leveraging certain
‘Core Competencies’ that each organisation has, be it in
technology, finance, marketing or human resource.
BACKGROUND
The issue of corporate advantage through HR has its roots in
the paradigm shift that took place in the HR view as detailed
below.
There are broadly three components in HR - Knowledge
generation processes (like identification of training
needs, designing and administering training
l
*Professor, Department of Commerce, Aligarh Muslim University, Aligarh
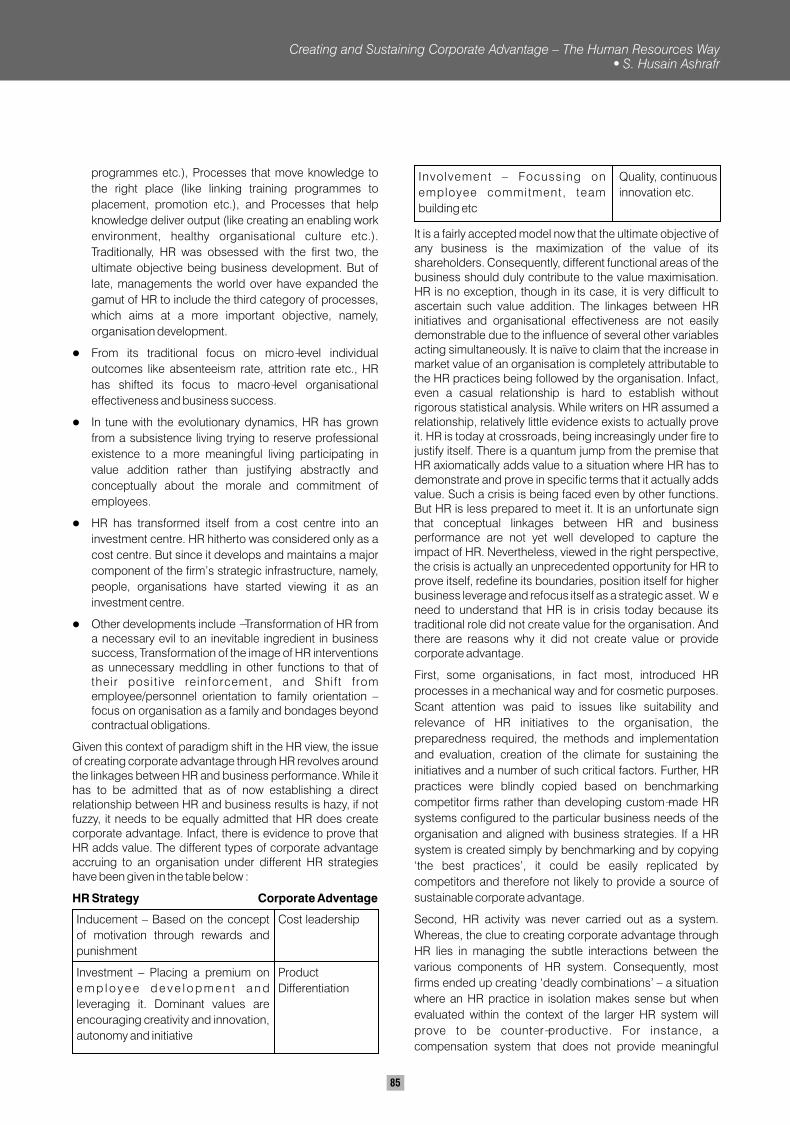
85
programmes etc.), Processes that move knowledge to
the right place (like linking training programmes to
placement, promotion etc.), and Processes that help
knowledge deliver output (like creating an enabling work
environment, healthy organisational culture etc.).
Traditionally, HR was obsessed with the first two, the
ultimate objective being business development. But of
late, managements the world over have expanded the
gamut of HR to include the third category of processes,
which aims at a more important objective, namely,
organisation development.
From its traditional focus on micro-level individual
outcomes like absenteeism rate, attrition rate etc., HR
has shifted its focus to macro-level organisational
effectiveness and business success.
In tune with the evolutionary dynamics, HR has grown
from a subsistence living trying to reserve professional
existence to a more meaningful living participating in
value addition rather than justifying abstractly and
conceptually about the morale and commitment of
employees.
HR has transformed itself from a cost centre into an
investment centre. HR hitherto was considered only as a
cost centre. But since it develops and maintains a major
component of the firm’s strategic infrastructure, namely,
people, organisations have started viewing it as an
investment centre.
Other developments include - Transformation of HR from a necessary evil to an inevitable ingredient in business success, Transformation of the image of HR interventions as unnecessary meddling in other functions to that of their posit ive reinforcement, and Shift from employee/personnel orientation to family orientation – focus on organisation as a family and bondages beyond contractual obligations.
Given this context of paradigm shift in the HR view, the issue of creating corporate advantage through HR revolves around the linkages between HR and business performance. While it has to be admitted that as of now establishing a direct relationship between HR and business results is hazy, if not fuzzy, it needs to be equally admitted that HR does create corporate advantage. Infact, there is evidence to prove that HR adds value. The different types of corporate advantage accruing to an organisation under different HR strategies have been given in the table below :
HR Strategy Corporate Adventage
l
l
l
l
It is a fairly accepted model now that the ultimate objective of any business is the maximization of the value of its shareholders. Consequently, different functional areas of the business should duly contribute to the value maximisation. HR is no exception, though in its case, it is very difficult to ascertain such value addition. The linkages between HR initiatives and organisational effectiveness are not easily demonstrable due to the influence of several other variables acting simultaneously. It is naïve to claim that the increase in market value of an organisation is completely attributable to the HR practices being followed by the organisation. Infact, even a casual relationship is hard to establish without rigorous statistical analysis. While writers on HR assumed a relationship, relatively little evidence exists to actually prove it. HR is today at crossroads, being increasingly under fire to justify itself. There is a quantum jump from the premise that HR axiomatically adds value to a situation where HR has to demonstrate and prove in specific terms that it actually adds value. Such a crisis is being faced even by other functions. But HR is less prepared to meet it. It is an unfortunate sign that conceptual linkages between HR and business performance are not yet well developed to capture the impact of HR. Nevertheless, viewed in the right perspective, the crisis is actually an unprecedented opportunity for HR to prove itself, redefine its boundaries, position itself for higher business leverage and refocus itself as a strategic asset. W e need to understand that HR is in crisis today because its traditional role did not create value for the organisation. And there are reasons why it did not create value or provide corporate advantage.
First, some organisations, in fact most, introduced HR
processes in a mechanical way and for cosmetic purposes.
Scant attention was paid to issues like suitability and
relevance of HR initiatives to the organisation, the
preparedness required, the methods and implementation
and evaluation, creation of the climate for sustaining the
initiatives and a number of such critical factors. Further, HR
practices were blindly copied based on benchmarking
competitor firms rather than developing custom-made HR
systems configured to the particular business needs of the
organisation and aligned with business strategies. If a HR
system is created simply by benchmarking and by copying
‘the best practices’, it could be easily replicated by
competitors and therefore not likely to provide a source of
sustainable corporate advantage.
Second, HR activity was never carried out as a system.
Whereas, the clue to creating corporate advantage through
HR lies in managing the subtle interactions between the
various components of HR system. Consequently, most
firms ended up creating ‘deadly combinations’ – a situation
where an HR practice in isolation makes sense but when
evaluated within the context of the larger HR system will
prove to be counter-productive. For instance, a
compensation system that does not provide meaningful
Inducement – Based on the concept
of motivation through rewards and
punishment
Investment – Placing a premium on
e m p l o y e e d e v e l o p m e n t a n d
leveraging it. Dominant values are
encouraging creativity and innovation,
autonomy and initiative
Cost leadership
Product
Differentiation
Quality, continuous
innovation etc.
Involvement – Focussing on
employee commitment, team
building etc
Creating and Sustaining Corporate Advantage – The Human Resources WayS. Husain Ashrafr
SAARANSHRKG JOURNAL OF MANAGEMENTVol . 1 No. 1 JULY 2009• •
86
distinction between high and low performers, one which is
not conducive for building teams etc.
Third, though the objectives of HR have come out evidently
over the years – growth and development of the employees
as ‘total’ persons – the means to achieve these objectives are
not yet very sound, scientific, comprehensive and foolproof.
Therefore, it is clear that for HR to create and sustain
corporate advantage, it needs :
A STRATEGIC PERSPECTIVE
A strategic perspective of HR involves that business priorities
drive the development of HR systems. The effort should be
towards creating distinctive HR practices, which help to
create unique competencies. HR systems will have impact in
the bottomline only when these are embedded in the
management infrastructure. Real value creation will occur
from HR only when it is aligned to business needs. Because,
in HR there is no ‘common solution’ or ‘the right answer’. An
inordinate focus on benchmarking and best practices will be
counter-productive as it diverts managerial effort from the
difficult and time-consuming job of developing an internally
coherent and strategically business-aligned HR system.
Secondly, every business has certain objectives in terms of
market share, profits, productivity, social responsibility etc.
The HR manager should share these business concerns at
large rather than cocooning himself to a smaller role. It
enables him to gear up his activities to the ever-changing
demands of business. For instance, the organisation may be
expanding into areas, which it may have never thought of.
Unless the HR manager shares this concern, he will never be
able to provide the enabling internal environment required for
business expansion. As long as he keeps himself aloof from
other business processes, he will be catering only to the
current organisational needs and not the future ones. It is
also doubtful if he will be able to cater to at least the current
needs in totality.
A SYSTEMS PERSPECTIVE
In contrast to the functional view of HR, a systems
perspective emphasis interrelationships and their synergic
value. Firms have to look for powerful connections where
individual HR practices act as mutually reinforcing elements
and are in harmony with each other to synergise the whole
system. Given the adoption of these two perspectives, we
shall look into some of the areas in which HR can create
corporate advantage.
Managing Change
One of the best sources of creating corporate advantage
through HR is its role in change management as a catalyst
and change agent. Because, the greatest competitive
challenge that organisations face today is adjusting to,
indeed embracing, continuous change. Now organisations
have to perceive change from a totally new perspective –
change which was an ‘event’ in the past is now a ‘process’.
They must be able to learn rapidly and continuously, innovate
ceaselessly and take on new strategic imperatives faster and
more comfortably than the competitors. As Tom Peters puts
it, managers must take chaos as given and learn to thrive on
it. Especially, trends like liberalisation and globalisation
demand that organisations increase their ability to manage
diversity, complexity and ambiguity. But such demands are
not likely to be met unless HR dons upon an activist role and
leads the change – change not per se – but proactive,
continuous and radical change. The way change is handled
makes the difference between the success and failure for the
organisation.
Managing Culture
In the increasingly complex business environment,
incremental adjustments and defensive manoeuvering are
insufficient. Organisations which will sustain themselves are
those that drive the basic facets of culture building uniformly
across the organisation; organisations that cultivate their
individual identities and have values and beliefs to pass
along and not just products. For instance, an organisation
might have introduced the most advanced technology
available in the market. But its ability to create corporate
advantage out of it will depend on - Employees’ willingness to
use the new technology, and The way it will change the
manner in which employees work and relate to one another.
Thus, all transformation is basically a people issue and,
therefore, has to be handled with care. Further, the issue of
culture also arises in the context of globalisation – how to
integrate the cross cultural differences into a uniform
organisational culture while respecting and accommodating
the diversities. One of the dilemmas facing the HR manager
is how to balance the seemingly contradictory phenomena of
culture and change. Culture is a sustained pattern of
behaviour where as change involves an unsettling pattern of
behaviour. The answer lies in transforming culture as a
vehicle of change – making responsiveness to change
intrinsic to culture. Rightly speaking, all change we talk about
is basically a change in culture. Infact, while culture is
basically an evolutionary change, each organisation today is
looking forward for a ‘Cultural Revolution’(if not in the Maoian
way).
LEARNING ORGANISATION
HR spends enormous amounts of time and money in
developmental programmes intended to develop
management and leadership skills when the evidence has
long been available that these programmes do not readily
translate into changed behaviour on the job. Even the most
motivated and skillful individuals coming out of the
programmes are too weak to overcome the system that
opposes the new patterns. Because the people who have
undergone training might have changed but the bulk of the
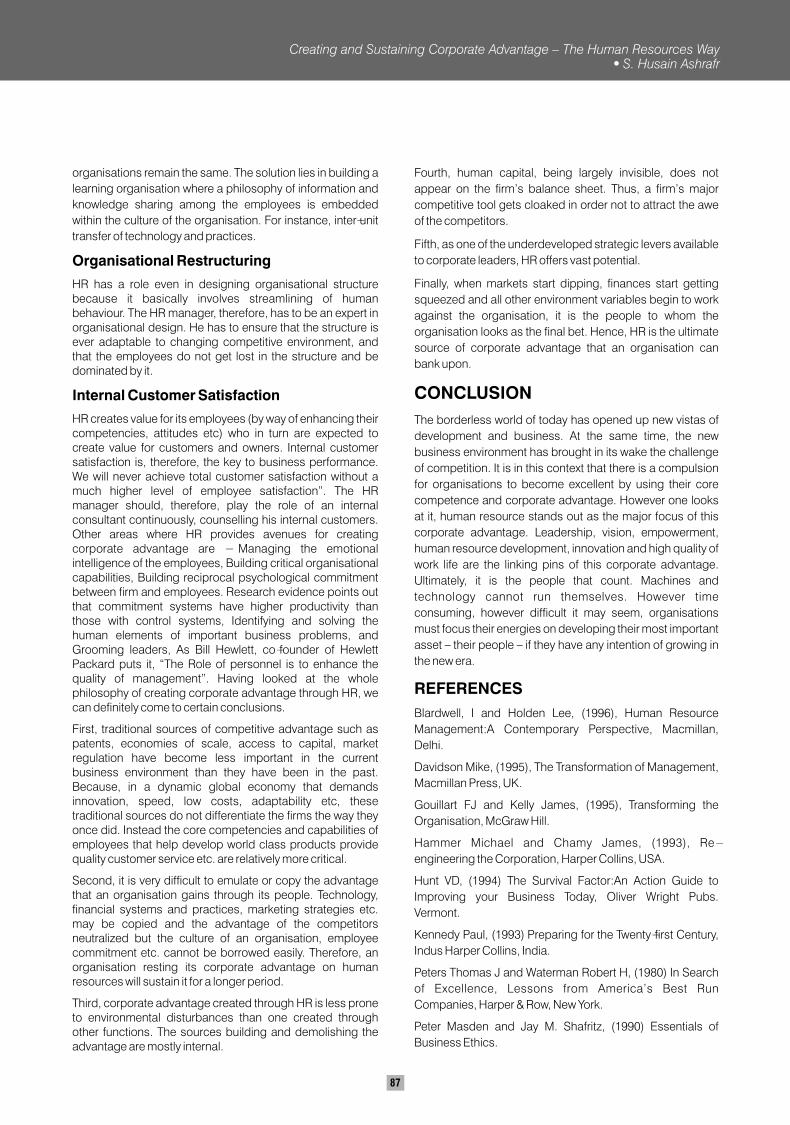
87
organisations remain the same. The solution lies in building a
learning organisation where a philosophy of information and
knowledge sharing among the employees is embedded
within the culture of the organisation. For instance, inter-unit
transfer of technology and practices.
Organisational Restructuring
HR has a role even in designing organisational structure because it basically involves streamlining of human behaviour. The HR manager, therefore, has to be an expert in organisational design. He has to ensure that the structure is ever adaptable to changing competitive environment, and that the employees do not get lost in the structure and be dominated by it.
Internal Customer Satisfaction
HR creates value for its employees (by way of enhancing their competencies, attitudes etc) who in turn are expected to create value for customers and owners. Internal customer satisfaction is, therefore, the key to business performance. We will never achieve total customer satisfaction without a much higher level of employee satisfaction”. The HR manager should, therefore, play the role of an internal consultant continuously, counselling his internal customers. Other areas where HR provides avenues for creating corporate advantage are - Managing the emotional intelligence of the employees, Building critical organisational capabilities, Building reciprocal psychological commitment between firm and employees. Research evidence points out that commitment systems have higher productivity than those with control systems, Identifying and solving the human elements of important business problems, and Grooming leaders, As Bill Hewlett, co-founder of Hewlett Packard puts it, “The Role of personnel is to enhance the quality of management”. Having looked at the whole philosophy of creating corporate advantage through HR, we can definitely come to certain conclusions.
First, traditional sources of competitive advantage such as patents, economies of scale, access to capital, market regulation have become less important in the current business environment than they have been in the past. Because, in a dynamic global economy that demands innovation, speed, low costs, adaptability etc, these traditional sources do not differentiate the firms the way they once did. Instead the core competencies and capabilities of employees that help develop world class products provide quality customer service etc. are relatively more critical.
Second, it is very difficult to emulate or copy the advantage that an organisation gains through its people. Technology, financial systems and practices, marketing strategies etc. may be copied and the advantage of the competitors neutralized but the culture of an organisation, employee commitment etc. cannot be borrowed easily. Therefore, an organisation resting its corporate advantage on human resources will sustain it for a longer period.
Third, corporate advantage created through HR is less prone to environmental disturbances than one created through other functions. The sources building and demolishing the advantage are mostly internal.
Fourth, human capital, being largely invisible, does not
appear on the firm’s balance sheet. Thus, a firm’s major
competitive tool gets cloaked in order not to attract the awe
of the competitors.
Fifth, as one of the underdeveloped strategic levers available
to corporate leaders, HR offers vast potential.
Finally, when markets start dipping, finances start getting
squeezed and all other environment variables begin to work
against the organisation, it is the people to whom the
organisation looks as the final bet. Hence, HR is the ultimate
source of corporate advantage that an organisation can
bank upon.
CONCLUSION
The borderless world of today has opened up new vistas of
development and business. At the same time, the new
business environment has brought in its wake the challenge
of competition. It is in this context that there is a compulsion
for organisations to become excellent by using their core
competence and corporate advantage. However one looks
at it, human resource stands out as the major focus of this
corporate advantage. Leadership, vision, empowerment,
human resource development, innovation and high quality of
work life are the linking pins of this corporate advantage.
Ultimately, it is the people that count. Machines and
technology cannot run themselves. However time
consuming, however difficult it may seem, organisations
must focus their energies on developing their most important
asset – their people – if they have any intention of growing in
the new era.
REFERENCES
Blardwell, I and Holden Lee, (1996), Human Resource
Management:A Contemporary Perspective, Macmillan,
Delhi.
Davidson Mike, (1995), The Transformation of Management,
Macmillan Press, UK.
Gouillart FJ and Kelly James, (1995), Transforming the
Organisation, McGraw Hill.
Hammer Michael and Chamy James, (1993), Re-
engineering the Corporation, Harper Collins, USA.
Hunt VD, (1994) The Survival Factor:An Action Guide to
Improving your Business Today, Oliver Wright Pubs.
Vermont.
Kennedy Paul, (1993) Preparing for the Twenty-first Century,
Indus Harper Collins, India.
Peters Thomas J and Waterman Robert H, (1980) In Search
of Excellence, Lessons from America’s Best Run
Companies, Harper & Row, New York.
Peter Masden and Jay M. Shafritz, (1990) Essentials of
Business Ethics.
Creating and Sustaining Corporate Advantage – The Human Resources WayS. Husain Ashrafr
SAARANSHRKG JOURNAL OF MANAGEMENTVol . 1 No. 1 JULY 2009• •
88
SUPPLY CHAIN MANAGEMENT – A CRITICAL REVIEW OF ITS IMPACT ON
COMPETITIVE POTENTIAL
ABSTRACTFor over a decade supply chain management has been the focus area for manufacturing industry worldwide as a means to gain competitive advantage in the globalized economic scenario. Subjects such as suppliers’ and customers’ management, integration, internal supply chain management; quality management, information management, logistics management and relationships management have been extensively discussed at various platforms world over. Concerns are frequently raised regarding gaps between theory and practices, effective implementation of practices and the success rate of such practices. Extensive literature is available on supply chain management in form of books, journals and conference proceedings. This research intends to explore the literature with an objective to assess the impact of implementing supply chain management practices on performance and competitive potential of manufacturing industry. It was concluded that though the companies taking initiative in implementing SCM practices face a number of hurdles at an initial phase, over a long term they are bound to benefit from effective implementation of such practicesKeywords: Supply chain management, competitive potential, literature review.
Vikram Sharma* G. D. Sardana**
INTRODUCTION
Supply Chain includes all those parties engaged in providing
a product or service to the customer. Supply chain
management (SCM) refers to effective integration and
management of all the processes and facilities used in
making goods or services available to the customer by
optimizing supply chain as a whole rather than adopting any
piece meal approach. It offers an opportunity to minimize
operations cost, improving quality and customer service level
and the market share. Many firms striving to improve their
competitive potential have adopted SCM practices
considering it to be the next source of opportunity to improve
operational efficiency. The manufacturing industry, in
particular has taken the lead. The industry has been
struggling to deal with difficult issues of achieving high
customer sa t is fac t ion wh i le main ta in ing cost
competitiveness. Hence, the need to improve supply chain
efficiency is being given high priority.
A debate can be perceived in literature regarding how supply
chain management is different from seemingly analogous
terms such as integrated logistic management, purchasing
and supply management and so on. Romano and Vinelli
(2001) explain that what differs such terms and practices, is
the scope of supply network. SCM has been developed into a
concept with broad span of concerns and an approach to
manage across company boundaries. In other words,
purchasing and supply as well as physical distribution relate
to only one part of supply network upstream and down
streams respectively. Logistic and material management
take a large part of supply network while SCM includes the
*Associate Professor, Krishna Institute of Engineering and Technology, Ghaziabad ** Professor Emeritus, Chairperson International Relations, Institute of Management Education, Ghaziabad
whole networks going beyond integrated logistics because it
aims to integrate all business processes, from user end to
original suppliers, which provide products, services and
information that adds value for the customers. The difference
between supply chain management and logistics
management can be further clarified from the definitions
given by “Council of supply chain management
professionals” (CSCMP) that was established in 1963.
According to this organization, SCM includes the planning
and management of all activities involved in sourcing and
procurement, conversion, and all logistics management
activities. Further, it also includes coordination and
collaboration with channel partners, which can be suppliers,
intermediaries, third party service providers, and customers,
thus integrating supply and demand management within
and across channel partners. CSCMP clarifies that logistics
management is that part of supply chain management which
plans, implements, and controls the efficient, effective
forward and reverse flow and storage of goods, services and
related information between the point of origin and the point
of consumption in order to meet customer requirements.
Delivering right product in right amount, at right time and at
right place are the essential objectives of supply chain
system (Beamon, 1998). According to Chopra and Meindl
(2006), the objective of supply chain is to maximize the
profitability, that is the difference between the revenue
generated from the customer and overall cost across the
supply chain. Handfield (2005), brings out that the reasons
why SCM has come to forefront for management’s attention
89
are the information revolution, emergence of new forms of
inter-organizational relationships and the customer demand
in the areas of product and service cost, quality, delivery,
technology and cycle time brought about by increased
global competition.
SCM and Quality
The quality revolution started from Japan in early 1950s.
Deming was the first quality guru who succeeded in
spreading quality control concept in Japan in a big way in
early 1950s. He introduced statistical quality control
techniques and stressed on pride of workmanship,
education and training. Juran defined quality as fitness for
use and introduced managerial dimensions of planning,
organization and controlling a process. He laid emphasis on
top management commitment to quality. Feignbaum
introduced total quality control, which laid the foundation of
contemporary TQM. He stressed on integrated efforts by
various groups in an organization to develop, maintain and
improve quality. Philip Crosby argued that quality is free. He
defined quality as conformance to requirements and
introduced the concept of zero defects. All the quality gurus
believe that management and system, rather than workers
are cause of poor quality. They strongly believe that
inspection is not the answer to quality improvement. It
requires long term commitment and organization wide
efforts.
Cristobal and Angel R. (2004) analyzed and classified quality
management practices in purchasing and assessed the
relationships of these practices with measurements of a firm
purchasing operational performance (POP), internal
customer satisfaction and business performance. A bi-
variate correlation analysis showed that six constructs
comprising the quality management strategy in purchasing
were highly correlated with each other thus providing
evidence for their mutual support and joint implementation. A
study by Sila, Roethlein and Ackerson (2004) conducted a
study, focused on passing on and interpreting quality goals
and objectives, alignment of quality goals and existence of
partnership within a connected automobile supply chain. The
researchers concluded that the main reason for success of
supply chain is the strength and the dominance of
manufacturer. Strong and frequent unidirectional
communication exist between manufacturer and supplier
and between manufacturer and distributor. These
connections are a crux of the supply chain. From this strong
relationship, the supply chain is able to remain successful
while communication weakens and disappears either ends
of the supply chain.
Kannan and Tan (2007) studied the impact of operational
quality management practices within a supply chain. Their
research tried to establish relationship between a firm’s
internal and external operational quality practices and
measures of product quality and customer service. It was
concluded that both internally and externally focused quality
management practices impact performance. Interestingly,
externally (supplier and customer focused) focused efforts
have greater impact on performance and seam to be
considered of higher importance by managers as well. Kuei,
Lin and Chow (2002) developed a framework on supply
chain quality and technology management. Through
empirical assessment, the authors found that IT enabled
operations are a major source of supply chain excellence.
The authors have emphasized the deployment process in
achieving the supply chain excellence and the fact that no
sustainable development can take place without involving
people who understand internal quality and technology in the
supply chain. Gunasekaran (2003) explored the question
that whether the TQM principles and techniques that have
been very successful in traditional organizations are equally
successful when applied to inter-organizational processes
and activities involved in supply chain management. The
author suggests that six major dimensions of SCM are
partnership, information technology, operational flexibility,
performance measurement, and management and demand
characterization. TQM enablers such as training and
education, cross-functional teams, communication,
teamwork, empowerment, job satisfaction and technological
support can impact any one or all the dimensions of the
supply chain. Kannan and Tan (2004) studied supplier
alliances and differences in attitude to suppliers and quality
management of adopters and non- adopters. Faced with
increasing pressure to improve responsiveness to rapidly
changing market needs, authors suggest that firms must
respond to challenges of how to improve supply reliability
and quality while simultaneously reducing the cost. Their
study presents results of a survey of supply chain
management professionals that examined attitude of
adopters and non-adopters of supplier’s alliances to supplier
and quality management. Results indicated significant
difference in attitudes existing between alliance adopters
and non-adopters and that the differences have direct and
significant impact on key managers of a buying firms
business performance.
Kim and Oh (2005) in their research focus on manufacturers
and suppliers who engage in strategic relationships for
quality improvement and new product development. They
found that depending on the balance power of bargaining
power in relationships, each partner’s resource commitment
to the activity such as quality improvement and new product
development might vary. These have implications for both
manufacturer and supplier profitability. The research
investigates, how variation in structure of decision-making
process (i.e. manufacturer dominated, supplier dominated
or balanced) affects the performance of each partner in
strategic collaborative relationships. The findings show that
supply chain partners can expect better performance from
their collaboration when both their perspectives are
accommodated equally. Levy, Bessant, Sang and Lamming
(1999) studied selection of suppliers in electronic and
Supply Chain Management – A Critical Review of Its Impact on Competitive PotentialVikram Sharma G. D. Sardana
SAARANSHRKG JOURNAL OF MANAGEMENTVol . 1 No. 1 JULY 2009• •
90
telecom industry. They studied quality based customer
supplier relationship from both customer and supplier view
points. The research concludes that scope exists to extend
organizational processes, tools and techniques of internal
total quality into the supply chain. Measurement of efficiency
of the relationship is crucial to the understanding whether the
relationship is really delivering competitive edge. An efficient,
joint, total quality relationship will need to be adaptive to
environmental changes. The key issue regarding extending a
total quality approach across organizational interface is
essentially one of integration. Mechanisms that facilitate
integration be they organizational or technological based are
of prime importance.
SCM AND FIRM’S PERFORMANCE
A number of studies have focused on SCM and its
performance measurement. While there are many ongoing
research efforts on various aspects and areas of SCM, so far
little attention has been paid to performance evaluation and
hence to measures and matrices of supply chains
(Gunasekaran, 2001). Saad and Patel (2006) also highlight
the lack of significant study of SCM practices and its
performance, in developing countries, in general and India, in
particular. To study the impact of SCM on performance, a
basic question that needs to be addressed is: What are the
important performance matrices for companies working in
supply chain environment? Tan (1999) considers that there is
a lack of consensus regarding a valid cross industry measure
of corporate performance. One approach can be the use of
financial performance indicators such as return on
investment (ROI) and return on assets (ROA). But most
economists disagree about the use of accounting data to
measure the firm’s performance as it ignores time value of
money (Tan, 1999).
Several researchers have studied the impact SCM has on
various measures of firm’s performance. A research by Voss,
Calantone and Keller (2005) examined the relationship
between employee performance and service, supply chain
and financial performance of US distribution centers. For this,
survey was carried out in 18 distribution centers across USA
and correlation was employed to test the proposition that
front line employee performance has a positive effect on
distribution center service, supply chain and financial
performance. The research shows how a firm orientation,
which facilitates high level of internal service, can have
significant effect on external service and supply chain
performance. People, their interaction, and the organization
in which they are a part, ultimately determine the success or
failure of service offerings and supply chain success. A
research by Speckman, Spear, Kamauff (2002) brings out the
fact that though effective implementation of supply chain
practices results in lower cost, higher ROI and a higher return
to stake holders, yet effective implementation of SC is not
easily accomplished. But another study by Cagliano, Caniato
and Spina (2006) tried to establish empirical relationship
between two supply chain integration dimensions-
integration of information flow and integration of physical
flow with two manufacturing improvement programs-lean
production and ERP systems. The data was drawn from 297
European manufacturing companies. Surprisingly, though
adoption of lean manufacturing model showed strong
influence on integration of information and physical flows, no
significant influence emerged from adoption of ERP.
Research by Burca, Fynes, and Marshall (2005), tried to find
out how small and medium enterprises are responding to
contemporary technologies such as ERP and internet to
enhance performance and found that though they each of
the SMEs have taken some steps to extend ERP, they have
taken a conscious approach to future. Researchers have
brought out the fact that failure in implementing SCM
software meant to improve firm’s value can cause losses,
embracement and disappointment for the firm. Hence
implementation of new SCM software demands a very
careful approach. Information technology can be exploited
to help supply chain members strengthen partnership. IT can
effectively reduce bullwhip effect (Yu, Yang, Chang, 2001). A
research by Koh, (2007) studied the SCM practices of Turkish
manufacturing SMEs and tried to establish relationships
between SCM practices, operational performance and
organizational performance. The research grouped the SCM
practices into two factors namely outsourcing and multi
suppliers and strategic collaboration and lean
manufacturing. Their research showed that both the factors
have significant impact on operational performance but not
on organizational performance.
Tan, Kannan, Hanfield and Ghosh (1999) examined linkages
between a firm’s competitive environment, TQM, supply
base management and customer relation practices and
firm’s performance. The study presents details of a survey
carried out to determine whether particular quality
management, supply base management, and customer
relation practices, can impact corporate performance. In
addition, it examines the impact, analyzing the competitive
environment has on performance. Regression model
identifies several factors that directly and positively impact
corporate performance. These include the extent to which
companies analyze the strategies of competitors, and
determine future customer requirements, and commitment
they have to evaluating performance through out the supply
chain. Lyman, Wisner and Tan (2002) conducted a research,
which stated that supply chain management has become a
significant strategic tool for firms striving to improve quality,
customer service and competitive success. They surveyed
senior managers in various industries to study the prevalent
supply chain management and supplier evaluation
practices. The study reduced these practices to a smaller set
of constructs and showed that many constructs were
correlated with firm’s performance and that some constructs
were found to adversely affect performance. The research
indicates that a truly integrated supply chain needs
91
commitment by all the members of the chain. Buyers may
have to over haul purchasing processes and integrate
suppliers engineering teams and product designers directly.
Also, since cost of changing partners can be huge, the
purchasing firms can become captive to its suppliers.
Purchasing firms need to worry about poor supplier
performance, possibility of suppliers passing trade secrets
to competitors or venturing out as competitors. Fynes and
Voss (2005) investigated the impact of supply chain
relationship dynamics on manufacturing performance. A
conceptual framework was developed incorporating various
dimensions of supply chain relationship dynamics and
manufacturing performance. Data was collected from
suppliers of electronic components in the Republic of
Ireland. Analysis of data showed that there was mixed
support for impact of relationship dynamics on
manufacturing performance. While cost and quality make
significant improvements with stronger relationships,
flexibility and delivery were not significantly affected.
Research by Sahay, Cavale and Mohan (2003) investigated
SCM practices in Indian industry and found that while some
companies are moving fast towards improving supply chain
efficiencies, most of them have still not realized its affect on
business performance. Sahay and Mohan (2006) studied the
impact of using third party logistics services on business
performance in India. The research points out that though
adoption of 3PL practices is at an early stage in India, their
use have a positive influence on business performance.
Jharkharia and Shankar (2006) explored the dissimilarities in
supply chain practices among different sectors of Indian
manufacturing industry. The research included four sectors
in Indian manufacturing industry: Automobile, engineering,
process and fast moving consumer goods industry. It was
observed that companies in automobile sector differed
significantly from those belonging to the rest of the three
sectors in adoption of SCM practices.
CHALLENGES IN IMPLEMENTING SCM
Some researchers have pointed out the difficulties faced in
implementing SCM practices. A research by Shepherd and
Gunter (2006) argues that despite considerable advances in
implementation of SCM practices, a number of important
problems have not yet received adequate attention. These
include implementation of performance measurement
systems for supply chains. Even a study in UK SMEs shows
that there is a lack of effective adaptation from tradition
adversarial relationships to modern collaborative supply
chains (Quayle, 2003). An empirical investigation into SCM
by Spekman, Kamauff (1998) indicates that though
managers are well aware of virtues of implementing SCM,
business has yet not fully operationalized the concept of
SCM. Research by Barrat (2004) reports that supply chain
collaborations are difficult to implement. There has been over
reliance on technology to implement it. Companies usually
fail to understand with whom to collaborate. Fundamentally,
there is a lack of trust between the supply chain partners. The
paper suggests that SCM approach based on customer
service and customer buying behavior is most appropriate
for facilitating supply chain collaborations. Hervani, Helms
and Sarkis (2005), report a number of concerns in applying
performance measurement tools and systems across the
supply chain. These include overcoming mistrust, lack of
understanding, lack of control, different goals and
objectives, different information systems, lack of
standardized performance measures, difficulty in linking
measures to customer value and deciding where to begin.
CONCLUSION
Extensive literature that is available on SCM and its impact on
performance was studied. From the research it can be
comprehended that implementation of SCM and integration
of various processes through out the value chain can be a
challenging task. It demands a cautious approach.
Emphasis should be laid on optimization of overall supply
chain rather than adopting a piecemeal approach. Some
research work indicate failure of SCM in bringing about any
major change in business performance, but it can be
attributed to superficial implementation of such practices.
Most researchers indicate significant positive impact of SCM
practices on operational performance and business
performance. Sahay (2003) has aptly pointed out that future
competition will not be among individual business but
between entire supply chains. Hence, effective
implementation of SCM practices is no more an option but a
necessity.
REFERENCES
Barrat, M. (2004), “Understanding the meaning of
collaboration in SC”, Supply Chain Management: An
International Journal, Vol. 9, No. 1, pp 30-42
Beamon, B.M. and Ware, T.M. (1998), “A process quality
model for the analysis, improvement and control of supply
chain systems”, Logistics Information Management, pp 105-
113.
Burca, S.D., Fynes, B. (2005) “Strategic technology
adoption: extending ERP across SC”, Journal of Enterprise
Information Management, Vol. 18, No. 4, pp 427-440
Caglaino, R. and Caniato, F. (2006), “The linkage between SC
integration and manufacturing improvement programmers”,
International Journal of Operations and Production
Management, Vol. 26, No. 3, pp 282-299
Chopra, S. and Meindl, P. (2006), “Supply chain
management strategy planning and operations”, Pearson
Education Asia, Delhi 110 092
Cristobal S. R. and Angel R. M., (2004) “Quality management
practices in purchasing functions”, International Journal of
Operations and Production Management, pp 666-681
Supply Chain Management – A Critical Review of Its Impact on Competitive PotentialVikram Sharma G. D. Sardana
SAARANSHRKG JOURNAL OF MANAGEMENTVol . 1 No. 1 JULY 2009• •
92
Fynes, B. Voss, C. and Burca, S. (2005), “Impact of supply
chain relationship dynamics on manufacturing performance”
International Journal of Operations and Production
Management, Vol. 25, No. 1, pp 6-19
Gunasekaran, A. (2003), “TQM in supply chain
management”, The TQM magazine, Vol. 15, No. 5, pp 361-
363
Gunasekaran, A., Patel, C. (2001); “Performance measures
and matrices in a supply chain environment”, International
Journal of Operations and Production Management, Vol. 21,
No. 1/2, pp 71-87
Hervani, A.A., Helms, M.M., and Sarkis, J. (2005),
“Performance measurement for green supply chain
management”, Benchmarking and International Journal, Vol.
12, No. 4, pp. 330-353
Jharkharia, S. and Shankar, R. (2006), “SCM some sectoral
dissimilarities in Indian manufacturing industry”, Supply
Chain Management-An International Journal, Vol. 11/4, pp
345-352
Kannan, V.R. and Tan K.C. (2004), “Suppliers alliance:
differences in attitudes towards suppliers and quality
management of adopters and non adopter” Supply Chain
Management: An International Journal, Vol. 9, No. 4, pp 279-
286
Kannan, V.R. and Tan, K.C. (2007), “Impact of operational
quality a supply chain view”, Supply Chain Management: An
International Journal, Vol. 12, No. 1, pp 14-19
Kim, B. and Oh, H. (2005), “The impact of decision making
sharing between supplier and manufacturer on their
collaboration performance” Supply Chain Management: An
International Journal, pp 223-236
Koh, S.C.L., Bayraktar E. (2007), “The impact of SCM
practices on performance of SMEs”, Industrial Management
and Data Systems, Vol. 107, No. 1, pp 103-124
Levy, P., Bessant, J., Sang, B. and Lamming, R. (1995),
“Developing integration through total quality supply chain
management”, Integrated Manufacturing Systems, Vol. 6,
No. 3, pp 4 -12
Lyman, S.B, Tan, K.C., and Wisner, J.D. (2002), “Supply chain
management, a strategic perspective” International Journal
of Operations and Production Management, Vol. 22, No. 6,
pp 614 - 631
Quayle, M. (2003), “Study of supply chain management
practices in UK industrial SMEs”, Supply Chain
Management: An International Journal, Vol. 8, No. 1, pp 79-
86
Saad, M. and Patel, B. (2006) “An investigation of supply
chain performance measurement in the Indian automotive
sector”, Benchmarking, An International Journal, Vol. 13,
No.1/2, pp 36-53
Sila, Roethlein, C. and Ackerson, S. (2004), “Quality
communications within a connected manufacturing supply
chain”, Supply Chain Management: An International Journal,
Vol. 9, No. 4, pp 323-330.
Romano, P. and Vinelli, A. (2001), “Quality management in a
supply chain perspective”, International Journal of
Operations and Production Management, Vol. 21, No. 4, pp
446-460
Sahay, B.S. (2003), “Supply chain collaboration the key to
value creation”, Work Study, Vol. 52, no. 2, pp76-83
Sahay, B.S., Cavale, V., Mohan, R. (2003), “The Indian supply
chain architecture”, Supply Chain Management: An
International Journal, Vol. 8, No. 2, pp 93-106
Spekman, R.E., Kaumauff J.W.(1998), “An empirical
investigation into supply chain management”, International
Journal of Physical Distribution and Logistics Management,
Vol. 28, No. 8, pp 630-650
Spekman, R.E. and Spears, J. (2002), “SC competency:
learning as a key component”, Supply Chain Management:
An international journal, Vol. 7, no. 1, pp 41-55
Tan, K.C., Kannan, V.R., Hanfield, R.B. and Ghosh, S. (1999),
“Supply chain management: An empirical study of its impact
on performance” International Journal of Operations and
Production Management, Vol. 19, No. 10, pp 1034-1052
Voss, M.D., Calantone, R.J. and Keller, S.B. (2005), “Internal
service quality: Determinants of distribution center
performance” International Journal of Physical Distribution
and Logistics Management, Vol. 35, No. 3, pp 161-176
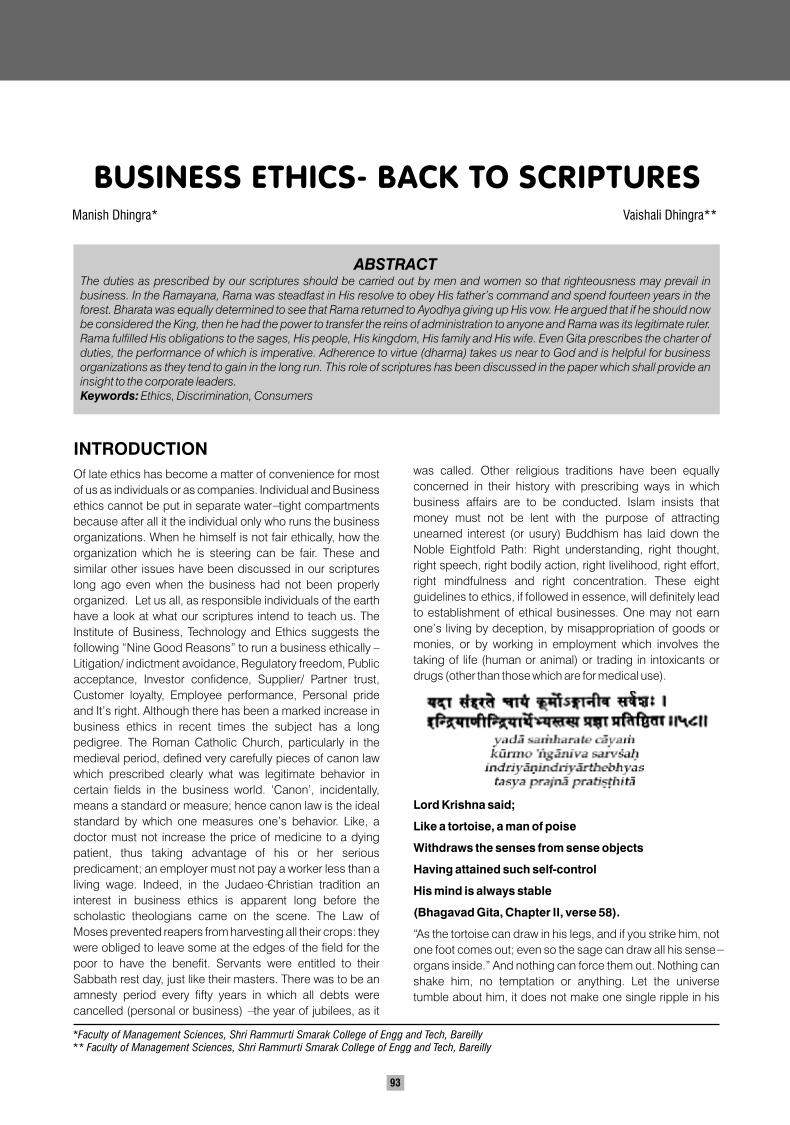
93
BUSINESS ETHICS- BACK TO SCRIPTURES
ABSTRACTThe duties as prescribed by our scriptures should be carried out by men and women so that righteousness may prevail in business. In the Ramayana, Rama was steadfast in His resolve to obey His father’s command and spend fourteen years in the forest. Bharata was equally determined to see that Rama returned to Ayodhya giving up His vow. He argued that if he should now be considered the King, then he had the power to transfer the reins of administration to anyone and Rama was its legitimate ruler. Rama fulfilled His obligations to the sages, His people, His kingdom, His family and His wife. Even Gita prescribes the charter of duties, the performance of which is imperative. Adherence to virtue (dharma) takes us near to God and is helpful for business organizations as they tend to gain in the long run. This role of scriptures has been discussed in the paper which shall provide an insight to the corporate leaders.Keywords: Ethics, Discrimination, Consumers
Manish Dhingra* Vaishali Dhingra**
INTRODUCTION
Of late ethics has become a matter of convenience for most
of us as individuals or as companies. Individual and Business
ethics cannot be put in separate water- tight compartments
because after all it the individual only who runs the business
organizations. When he himself is not fair ethically, how the
organization which he is steering can be fair. These and
similar other issues have been discussed in our scriptures
long ago even when the business had not been properly
organized. Let us all, as responsible individuals of the earth
have a look at what our scriptures intend to teach us. The
Institute of Business, Technology and Ethics suggests the
following “Nine Good Reasons” to run a business ethically –
Litigation/ indictment avoidance, Regulatory freedom, Public
acceptance, Investor confidence, Supplier/ Partner trust,
Customer loyalty, Employee performance, Personal pride
and It’s right. Although there has been a marked increase in
business ethics in recent times the subject has a long
pedigree. The Roman Catholic Church, particularly in the
medieval period, defined very carefully pieces of canon law
which prescribed clearly what was legitimate behavior in
certain fields in the business world. ‘Canon’, incidentally,
means a standard or measure; hence canon law is the ideal
standard by which one measures one’s behavior. Like, a
doctor must not increase the price of medicine to a dying
patient, thus taking advantage of his or her serious
predicament; an employer must not pay a worker less than a
living wage. Indeed, in the Judaeo-Christian tradition an
interest in business ethics is apparent long before the
scholastic theologians came on the scene. The Law of
Moses prevented reapers from harvesting all their crops: they
were obliged to leave some at the edges of the field for the
poor to have the benefit. Servants were entitled to their
Sabbath rest day, just like their masters. There was to be an
amnesty period every fifty years in which all debts were
cancelled (personal or business) - the year of jubilees, as it
*Faculty of Management Sciences, Shri Rammurti Smarak College of Engg and Tech, Bareilly ** Faculty of Management Sciences, Shri Rammurti Smarak College of Engg and Tech, Bareilly
was called. Other religious traditions have been equally
concerned in their history with prescribing ways in which
business affairs are to be conducted. Islam insists that
money must not be lent with the purpose of attracting
unearned interest (or usury) Buddhism has laid down the
Noble Eightfold Path: Right understanding, right thought,
right speech, right bodily action, right livelihood, right effort,
right mindfulness and right concentration. These eight
guidelines to ethics, if followed in essence, will definitely lead
to establishment of ethical businesses. One may not earn
one’s living by deception, by misappropriation of goods or
monies, or by working in employment which involves the
taking of life (human or animal) or trading in intoxicants or
drugs (other than those which are for medical use).
Lord Krishna said;
Like a tortoise, a man of poise
Withdraws the senses from sense objects
Having attained such self-control
His mind is always stable
(Bhagavad Gita, Chapter II, verse 58).
“As the tortoise can draw in his legs, and if you strike him, not
one foot comes out; even so the sage can draw all his sense-
organs inside.” And nothing can force them out. Nothing can
shake him, no temptation or anything. Let the universe
tumble about him, it does not make one single ripple in his
SAARANSHRKG JOURNAL OF MANAGEMENTVol . 1 No. 1 JULY 2009• •
94
conscience. From the Book of Exodus 23:8, 8 And thou shalt
take no gift; for a gift blindeth them that have sight, and
perverteth the words of the righteous. Bribery perverts
justice. From the book of Isaiah 1:21:23 The New Testament
gives a fair idea of the Christian perspective. Simon the
Sorcerer tried to buy the power that he perceived in the laying
on of hands by the Apostles and Simon Peter chastised him
in Acts 8:17-22. The essence of the offense was addressed
by Peter in verse 20, But Peter said unto him, Thy money
perish with thee, because thou hast thought that the gift of
God may be purchased with money. Felix, the governor of
Judea, had Paul (Saul) of Tarsus in prison and realized that
he was not guilty of any charges but he wanted Paul to pay
him a bribe to gain his freedom. It is described in Acts 24:24-
26. The desire for a bribe is contained in verse 26, He hoped
also that money should have been given him of Paul, that he
might loose him: wherefore he sent for him the oftener, and
communed with him.
TAXATION
According to Veda taxation is of two kinds: Vridhi and Kusida.
First, is the one under which normal rate of interest is charged
and the other is usurious. Manu has also laid down the same
principle. And from the perspective of Islam, it is clearly
mentioned in the Holy Quoran that Zakat ensures a universal
welfare system, perhaps the first in the world. Zakat is
generally translated as charity or poor- due. The
dispensation of zakat is regulated by different by different
rates (called shar’h) for different items whose details are
given in books of hadith and fiqh. It is said that a chain is as
strong as its weakest link, and we human beings have an
inborn tendency to find it. The differences in zakat among
four Sunni Imams are not as major as among the Sunni and
Shi’ia Imams. For example, in Fiqh Jaffariah, there is no zakat
on paper currency. So, for the followers of this Fiqh there is no
zakat on bank accounts. When General Zia- ul-Haq, the
Pakistani military ruler instituted compulsory zakat in
Pakistan, the Shi’ia Ulema revolted against it and refused to
abide by the government’s zakat ordinance. Ultimately, the
government excluded Shi’ahs from the yearly bank account
deductions. This led many Sunnis to declare themselves
Shi’ahs on their bank forms to avoid paying zakat on their
bank accounts. Thus, theology has also become a matter of
convenience for the people.
DISCRIMINATION
The term discrimination describes a large number of
wrongful acts in employment, housing, education, medical
care, and other important areas of public life. Although
discrimination in each of these areas takes different forms,
what they have in common is that a person is deprived of
some benefit or opportunity because of membership in
some group toward which there is substantial prejudice.
According to Professor Manuel G. Velasquezz, to
discriminate in employment is to make an adverse decision
mind. A good example here would that be of Ratan Tata, and
Narayanan Murthi who have whole heartedly devoted
themselves to the cause of industrial development of the
country. On the contrary there are a few CEOs who draw very
high salary from the company irrespective of the fact whether
it was performing profitably, be it a company like General
Motors headed by Rick Wagoner (previous CEO) or Chrysler
or a bank like City bank headed by Vikram Pandit. Lord
Krishna in Geeta told Arjuna, “Beware Arjuna, lust and anger
are the great enemies. These are to be controlled. These
cover the knowledge even of those (who are wise). This fire of
lust is unquenchable. Its location is in the sense- organs and
in the mind. The Self desires nothing.” “This Yoga I taught in
ancient times (to Vivaswan; Vivaswan taught it to Manu). ---
Thus it was that the knowledge descended from one thing to
another. But in time this great yoga was destroyed. That is why
I am telling it to you again today.” The implication is that God
descended in various incarnations on earth and this
message has been told to humankind in many forms but it is
yet to be imbibed.
Thakur Rabindranath Tagore’s Play ‘Muktadhara’ written in
1922 depicts the human attitudes towards work.
‘Muktadhara’ means free flowing stream of water. The play is
based on Muktadhara, a stream of water that gushes down
the kingdom of Uttarakut and further flows across another
state, Shivatarai. The king of Uttarakut is driven by the ulterior
motive of controlling the flow of water and hence the lives of
the people of Shivatarai. He orders his royal engineer Bibhuti
to construct a dam on Muktadhara. It was a very dangerous
task. The feat was accomplished by claiming the lives of
several people. Majority residents of Uttarakut are enjoying
their sense of power. Prince of Uttarakut, Abhijit, a
compassionate person resolves to destroy the dam and in
the process he sacrifices his life on the altar of humanity. The
professionals, engineers, doctors and management
graduates must be taught the essence of this great play so
that they may justify their professions. There are several
common issues which find a place in a number of scriptures.
They have been discussed below:
BRIBERY
Foreign Corrupt Practices Act (FCPA) in 1977 of United
States forbids American corporations to offer or make any
payment to a foreign official for the purpose of “influencing
such foreign official to do or omit to do any violation of the
lawful duty of such official.” In order to obtain or retain
business. (The Act also covers payments to political parties
and candidates for office in foreign countries.) This legal
prohibition accords with standard philosophical definitions of
bribery. According to Islamic perspective, it is a despicable
form of corruption and must be strongly discouraged. Both
giving and taking bribe are a part of corruption. “… the person
who gives a bribe and the person who takes a bribe, both will
burn in hell.” (Saying of Prophet) According to the Jewish
perspective, bribery makes sinners. Bribery also corrupts
95
Business Ethics- Back To ScripturesManish Dhingra Vaishali Dhingra
against employees on job applicants based on their
membership in a certain group. Determining whether
discrimination occurs in employment depends on 3 basic
facts: (1) whether the decision is a function of an employee’s
or job applicant’s membership in a certain group, rather than
individual merit; (2) whether the decision is based on
prejudice, false stereotypes, or the assumption that the
group is in some way inferior; and (3) whether the decision in
some way harms those it’s aimed at. Discrimination on the
basis of race, ethnicity, gender etc is generally considered
abhorrent in the teachings of all faiths. According to the
Jewish perspective: Treat fairly, Deuteronomy 14, 17. 14 Thou
shalt not oppress a hired servant that is poor and needy,
whether he be of thy brethren, or of thy strangers that are in
thy land within thy gates. 17 Thou shalt not pervert the justice
due to the stranger, or to the fatherless; nor take the widow’s
raiment to pledge. According to Islamic perspective all forms
of discrimination are considered unjust and opposed in
private business and public domain. “No Arab has
superiority over any non- Arab and no non- Arab has any
superiority over an Arab; no dark person has superiority over
a white person and no white person has a superiority over a
dark person. The criterion, for honor in the sight of God is
righteousness and honest living.” Saying of Prophet (Sallam
and Hanafy, 1988) “O mankind! We created you from a single
(pair) of male and female, and made you into nations and
tribes, that you may know each other…… (Quran 49:13) That
discrimination is wrong can be shown by a variety of
arguments. There are, first, straightforward utilitarian
arguments that cite the ways discrimination harms
individuals, business firms, and society as a whole. A second
kind of argument appeals to the Kantian notions of human
dignity and respect for persons. Arguments of a third kind are
based on various principles of justice. According to Utilitarian
arguments, which is favored by economists, productivity of a
business and hence the economy at large can enhance only
if the most capable and most qualified and experienced
person is chosen for the respective job. If a candidate is
evaluated and unfortunately gets selected on the basis of his
race, religion, caste or even sex, productivity is bound to
suffer. The Kantian notions are based on human dignity and
respect for persons. This type of discrimination involves a
racist or sexist attitude that denies equal treatment to
individuals.
RIGHTS OF EMPLOYEES,
CONSUMERS AND STAKEHOLDERS
According to the Christian perspective there are extensive
ethical and moral imperatives pertaining to the rights of
employees, customers and stakeholders. The stakeholders
are to be honored (Proverbs 3:27-28) 27 “Withhold not good
from them it is due, when it is in the power of thine hand to do
it. 28 Say not unto thy neighbour, Go, and come again, and
tomorrow I will give; when thou hast it by thee.” They are also
paid on time. (Proverbs 12:22) Proverb 22 “Lying lips are e
abomination to the Lord: but they that deal truly are his
delight.” The treatment of the customers is also addressed
by Philippians as well as in the Old Testament writing of
Proverbs 11:1, 3. A false balance is abomination to the Lord:
but a just weight is his delight. Quran also justifies lawful and
righteous business means. “God does command you to
render back your trusts to those whom they are due…”
(Quran 4:58) In Srimad Bhagwad Geeta also Lord Krishna
preaches the denouncement of ‘Asuri work culture’, which
involves egoism, delusion, personal desires, improper
performance etc. Srimad Bhagwad Geeta also teaches
about detachment. Had Ramlinga Raju, the founder and
promoter of Satyam Computers understood this, he would
have not suffered this shame.
It’s high time, especially the way events unfolded at Satyam
that the heads of companies all across the world must come
out of ‘Yayati syndrome’. Mahabharata unfolds an incident
that Yayati, in order to pursue materialistic and sensual
pleasures borrows a number of years of his son’s life. Our
CEOs, promoters of the companies have become so blind in
this rat race of intense competition that they tend to forget
that these pleasures will survive only for a very short period of
time and like ‘Yayati’ pleaded his son to take back his youth,
they’ll have to repent one day!
REFERENCES
Amartya Sen, “Does Business Ethics Make Economic
Sense:” Business Ethics Quarterly, 3 (1993), 45- 54
Chatterjee Abha and Hartmann P. Laura, Business Ethics
(New Delhi, Tata McGraw-Hill- 3rd edition)
George D. Chryssides, John H. Kaler - 1993 - Business &
Economics, 585
John R. Boatright, Ethics and Conduct of Business (Pearson
Education- fourth edition, 2007)
Manuel G. Valasquez, Business Ethics, 4th edition. (New
Delhi, Prentice Hall, 1998), 371
Srimad Bhagwad Geeta, Geeta Press, Gorakhpur.
The Hindu Speaks: Religious Values- 1999 (Chennai, Kasturi
and Sons), 212
Vivekananda, S. (1963). The Complete Works of Swami
Vivekananda (II volume, Mayawati Memorial Edition)
(Calcutta: Swapna Printing Works)
2005 Proceedings of the Midwest Business Economics
Association
SAARANSHRKG JOURNAL OF MANAGEMENTVol . 1 No. 1 JULY 2009• •
96
FUTURE TRADING IN INDIAN COMMODITY EXCHANGES
Swati* Kanchan Shukla**
ABSTRACTThe Government has implemented the policy of Liberalization in Indian commodities market. This move received mixed response from everyone. It is still being labeled with the same accusations which finally led to its closure during the last three decades. Commodity market does give investors a new option to diversify their investments but side by side made investors vulnerable to a new market which dose not so far had good credentials regarding efficiency in the market. This study is an attempt to study the future trading in commodity market. Key words - Commodities Market, Forward Contracts, Commodity Exchanges
INTRODUCTION
India has a long history of commodity futures trading,
extending over 125 years. As the country embarked on
economic liberalization policies and signed the GATT
agreement in the early nineties, the government realized the
need for futures trading to strengthen the competitiveness of
Indian agriculture and the commodity trade and industry.
Futures trading began to be permitted in several
commodities, and the ushering in of the 21 century saw the
emergence of new National Commodity Exchanges with
countrywide reach for trading in almost all primary
commodities and their products. A commodity futures
contract is essentially a financial instrument. Following the
absence of futures trading in commodities for nearly four
decades, the new generation of commodity producers,
processors, market functionaries, financial organizations,
broking agencies and investors at large are, unfortunately,
unaware at present of the economic utility, the operational
techniques and the financial advantages of such trading.
Commodity futures contracts and the commodity exchanges
organizing trading in contracts are regulated by the
Government of India under the Forward Contracts
(Regulation) Act, 1952 (FCRA or the Act), and the Rules
framed there under. The nodal agency for such regulation is
the Forward Markets Commission (FMC), under the overall
control of Government of India. The subject of “Stock
Exchanges and Futures Market” is listed in the Union list and
therefore the responsibility for regulation of forward contracts
devolved on Government of India. The Parliament passed
Forward Contracts (Regulation) Act, 1952 which presently
regulated forward contracts in commodities all over India.
The features of the Act are as follows:
The very preamble of the Act announces the intention of
the legislature to prohibit options in goods. According to,
Section 19, such agreements are prohibited. However
the proposal to regulate options in goods is under
l
*Research Scholar, Department of Commerce, Faculty of Commerce & Management Studies, M.G. Kashi Vidyapith, Varanasi, UP-221002 **Research Scholar, Institute of Management of Studies, M.G. Kashi Vidyapith, Varanasi, UP-221002
consideration of Government. The Act classifies
contracts/agreements into two broad categories, viz.,
ready delivery contract and forward contract. Ready
delivery contract are those where delivery of goods and
full payment of price therefore is made within a period of
eleven days. To ensure flexibility in the system the
proposal to extend the period to thirty days is pending
with the Government.
The Act defines forward contract as the contract for
delivery of goods which is not a ready delivery contract.
Forward contracts are implicitly classified into two broad
categories, viz., specific delivery contract and non-
specific delivery contract or standardized contract.
Though, de-facto, the focus of the regulation are
standardized contracts i.e., futures contracts, these are
not defined in the present Act however it is proposed to
introduce the definition of "futures contract" in the Act is
under the consideration of the government.
Specific delivery contracts (where the terms of the
contracts are specific to each contract - customized
contracts) in which, the buyer does not transfer the
contract by merely transferring document of title to the
goods and exchanging money difference between the
sale and purchase price, termed as Non-transferable
Specific Delivery Contract are normally outside the
purview of the Act, but there is an enabling provision
empowering the Government to regulate or prohibit such
contracts.
The Act also provides for either regulation of the other
forward contract in specified commodities or prohibition
of specified commodities. Such contracts in the
commodities which do not figure in regulated or
prohibited categories are outside the purview of the Act,
except when they are organized by the Exchanges.
l
l
l
97
lThe Act envisages three-tier regulation.(a) The Exchange
which organizes forward trading in regulated
commodities can prepare its own rules (articles of
association) and byelaws and regulate trading on a day-
to-day basis. The Forward Markets Commission
approves those rules and Byelaws and provides
regulatory oversight. It also acquires concurrent powers
of regulation either while approving the rules and byelaws
or by making such rules and byelaws under the
delegated powers. (b) The Central Government -
Department of Consumer Affairs, Ministry of Consumer
Affairs, Food and Public Distribution - is the ultimate
regulatory authority. Only those associations, which are
granted recognition by the Government, are allowed to
organize forward trading in regulated commodities.
Presently the recognition is commodity-specific. (c)
Government has original powers to suspend trading, call
for information, require the Exchanges to submit
periodical returns, nominate directors on the Boards of
the Exchanges, supersede Board of Directors of the
Exchange etc.
Policy of Liberalization:
Forward trading was banned in 1960's except for Pepper,
Turmeric, Castorseed and Linseed. Futures’ trading in
Castorseed and Linseed was suspended in 1977. Apparently
on the basis of the recommendations made by Khusro
Committee forward trading in Potato and Gur was allowed in
early 1980's and in Castorseed in 1985. After the process of
liberalization of the economy started in 1990, the
Government set up a Committee under the Chairmanship of
Prof. K. N. Kabra in 1993 to examine the role of futures trading
in the context of liberalization and globalization. The Kabra
Committee recommended allowing futures trading in 17
commodity groups. It also recommended strengthening of
Forward Markets Commission and amendments to Forward
Contracts (Regulation) Act, 1952. The major amendments
include allowing options in goods, increase in outer limit for
delivery and payment from 11 days to 30 days for the contract
to remain ready delivery contract and registration of brokers
with Forward Markets Commission. The Government
accepted most of these recommendations and futures
trading have been permitted in all recommended
commodities except Bullion and Basmati Rice. Additional
staff was provided to the FMC and the post of Chairman was
upgraded to the legal of Additional Secretary to the
Government of India. In para 44 of the National Agricultural
Policy announced by the Government in the year 1999 it was
stated that the Government will enlarge the coverage of
futures market to minimize the wide fluctuations in
commodity prices, as also for hedging their risk. It was
mentioned that an endeavor would be to cover all important
agricultural products under futures trading in the course of
time. An expert Committee on Agricultural Marketing headed
by Shri Shankerlal Guru recommended the linkage of spot
and forward markets, introduction of electronic warehouse
receipt system, inclusion of more and more commodities
under futures trading and promotion of national system of
warehouse receipt. The sub-group on forward and futures
markets formed under the chairmanship of Dr. Kalyan
Raipuria, Economic Adviser, and Department of Consumer
Affairs to examine the feasibility of implementing the
recommendations made by the Expert Committee chaired
by Shankerlal Guru recommended that the commodity
specific approach to the grant of recognition should be given
up. The Exchanges, which meet the criteria to be stipulated
by the Government, should be able to trade contracts in any
permitted commodity. Now the scope of futures and forward
trading is expected to cover all agricultural commodities. The
various National Commodity Exchanges like Multi
Commodity Exchange of India Ltd (MCX), National
Commodity & Derivative Exchange Limited (NCDEX),
National Multi Commodity Exchange of India ltd (NMCE) and
National Board of Trade (NBOT) facilitate on-line trading,
clearing and settlement operations for commodity futures
market across the country. Under these National Exchanges,
there are a dozen active Bourses for trading, more than 2,000
brokers operating in 6,000 terminals and 10,000 active
traders. All these are tracking the commodities prices round
the clock. In the very First year of its commencement,
Commodities Trading in India clocked an annual turnover of
Rs.1400 Billion. The MCX has setup centres in Ahmedabad,
Mumbai and Delhi for physical delivery of futures contracts in
commodities. It plans to spread this network to Kolkata and
Chennai. The NCDEX has recently launched in association
with International Petroleum Exchange, London (IPE), the
IPE Brent Crude Futures Contract, which is a landmark step
towards integrating Indian Energy Markets with global
Energy Markets. The MCX has tied up with Chicago Climate
Exchange to trade in Carbon and Sulphur Financial
Instruments for the global emissions marketplace.
Present Scenario
Commodities which are traded in the commodity future market during 2008 included a variety of agricultural commodities, bullion, crude oil, energy and metal product. New Agricultural commodities introduced for trading in 2008-09 were red areca nut, coriander seeds and garlic. The commodity futures market facilitates price discovery processed provide price risk management. Its effectiveness depends upon the wider participation of all the stakeholder categories. The daily average value of trade in the commodity exchanges improved from Rs.13,287.55 crore during2007-08 to Rs.17,042.07 crore in 2008-09. Agricultural commodities, bullion and energy products accounted for a large share of commodities traded. During the year 20008-09, value of trade in agricultural commodities was about 12% of total value f trade but in terms of volume of trade agricultural commodities accounted for 33.7% of total volume of trade. Bullion accounted for the maximum share of the commodity groups to the total value of the trade during 2008-09 (April-March) at 56.65% followed by the energy at 19.56%. Agricultural commodities and metals accounted for 11.95% and 11.79% respectively of the total value of trading during 2008-09 (April-March).
Future Trading In Indian Commodity Exchanges
Swati Kanchan Shukla
SAARANSHRKG JOURNAL OF MANAGEMENTVol . 1 No. 1 JULY 2009• •
Special emphasis was given by FMC to Board base the Market and to take the benefits of futures trading to all the stakeholders of the commodity market, especially framers. The initiatives taken in this regard, inter-alia, include : Promoting the participation of hedgers to counted – balance financial stakeholders with the commercial stakeholders for a balanced and liquid market and to strengthen the price discovery process; increasing the awareness level of farmers and other market participants to make them aware of the existence of as well as benefits from the futures market; working on various models of “aggregation” to enable small farmers to hedge on the commodity exchanges to manage their price risks; permitting NCDEX to accredited warehouses of producers / processors /similar participants widened the scope of physical delivery of bulk commodities.
Considering the concerns of the Government of India about the inflationary expectation in the economy, the FMC, as a measure of abundant caution, had suspended futures trading soya oil, rubber and potato w.e.f. May7, 2008. However, with the easing of inflationary pressure , the suspension was allowed to lapse on Nov.13,2008. Trading in these commodities resumed on Dec.04, 2008. The Government of India had appointed a committee under the chairmanship of Prof. Abhijit Sen, Member, Planning Commission to study the impact of futures trading, if any, on agricultural commodity prices. The committee was appointed on March 02, 2007 and submitted its report on April 29, 2008. The main findings and recommendations of the committee are; negative sentiments have been created by the decision to delist futures trade in some important agricultural commodities; the period during which the futures trading has been in operation is too short to discriminate adequately between the effect of opening of futures market, if any, and what might simply be the normal cyclical adjustments in prices; Indian data analyzed does not show any clear evidence of either reduce or increased volatility; the vibrant agricultural markets including derivatives market are the front line institutions to provide early signs of future prospects of the sector. The committee recommended for up gradation of regulation by passing of the proposed amendments to FC(R) Act 1952 and removal of infirmities in the spot market.
The “Study on Impact of Futures Trading in Wheat, Sugar, Pulses and Guar Seeds on Farmers was commissioned by the Forward Markets Commission and under taken by Indian Institute of Management, Bangalore. While the study was primarily intended to find out how futures trading is helping major stakeholders in the value chain of these commodities; it also dealt with the impact of futures trading on the prices of these commodities. The study did not find any visible link between futures trading and price movements and suggested that the main reason for price changes seemed to be changes in the fundamentals(mainly on the supply side) of these commodities, Price changes were also attributed to changes in the government policies.
The Government has issued the new guidelines to strengthen the growth of the commodities futures market. The Forward Market Commission (FMC), India’s commodity market regulator, has asked national level commodity exchanges to ensure that at least 10 percent of their stake is
owned by the government companies. Total stake by stake firms, bank and warehouses together should be at least 26%, while only the original promoter of exchange could hold up to 26%. According to Forward Market Commission the guidelines were aimed at better governance, transparency and investor confidence in the market.
Foreign investment in Commodity Exchanges
A composite ceiling for foreign investment of 49% was allowed with prior Government approval, subject to the condition that investment under the portfolio Investment Scheme will be limited to 23% and that under the FDI Scheme will be limited to 26%. Further, no foreign investor / entity including persons acting in concert will hold more than 5% of the equity in these companies.
Some of the existing Commodity Exchanges had foreign investment above the permitted level, as on the date of issue of the said Press Note and, consequently the Commodity Exchange(s) would be required to divest foreign equity, equal to the amount by which the cap was being exceeded, in accordance with Press Note 2 (2008). Commodity Exchanges were permitted to avail of transition/ complying/correction time for this purpose, up to 30.06.2009, vide Press Note 8 of 2008 dated 19 August, 2008.
The Government, on consideration and in order to facilitate the existing Commodity Exchanges to comply with the guidelines notified vide press note 2(2008) has now been decided to allow a further transition /complying/ correction time to the existing Commodity Exchange(s) beyond 30.06.2009. Accordingly, all such Commodity Exchanges are hereby advised to adhere to the conditions of Press Note 2(2008) by 30.9.2009.
All Commodity Exchanges shall furnish a compliance report informing the foreign investment in the Commodity Exchange as on 30.09.2009, along with details of equity structure to the department of Industrial Policy & Promotion, Department of Consumer Affairs, Foreign Investment Promotion Board, the Forward Market Commission and SEBI.
CHALLENGES BEFORE COMMODITY MARKET
Even though the commodity derivatives market has made good progress in the last few years, the real issues facing the future of the market have not been resolved. Agreed, the number of commodities allowed for derivative trading have increased, the volume and the value of business has zoomed, but the objectives of setting up commodity derivative exchanges may not be achieved and the growth rates witnessed may not be sustainable unless these real issues are sorted out as soon as possible. Some of the main unresolved issues are discussed below.
Commodity Options:
Trading in commodity options contracts has been banned
l
l
l
l
98
since 1952. The market for commodity derivatives cannot be called complete without the presence of this important derivative. Both futures and options are necessary for the healthy growth of the market. While futures contracts help a participant (say a farmer) to hedge against downside price movements, it does not allow him to reap the benefits of an increase in prices. No doubt there is an immediate need to bring about the necessary legal and regulatory changes to introduce commodity options trading in the country. The matter is said to be under the active consideration of the Government and the options trading may be introduced in the near future.
The Warehousing and Standardization:
For commodity derivatives market to work efficiently, it is necessary to have a sophisticated, cost-effective, reliable and convenient warehousing system in the country. Independent labs or quality testing centers should be set up in each region to certify the quality, grade and quantity of commodities so that they are appropriately standardized and there are no shocks waiting for the ultimate buyer who takes the physical delivery. Warehouses also need to be conveniently located. Central Warehousing Corporation of India is operating 500 Warehouses across the country with a storage capacity of 10.4 million tonnes. This is obviously not adequate for a vast country. To resolve the problem, a Gramin Bhandaran Yojana has been introduced to construct new and expand the existing rural godowns. Large scale privatization of state warehouses is also being examined.
Cash versus Physical Settlement:
It is probably due to the inefficiencies in the present warehousing system that only about 1% to 5% of the total commodity derivatives trade in the Country is settled in physical delivery. Therefore the warehousing problem obviously has to be handled on a war footing, as a good delivery system is the backbone of any commodity trade.
• The Regulator: As the market activity pick-up and the volumes rise, the market will definitely need a strong and independent regular; similar to the Securities and Exchange Board of India (SEBI) that regulates the securities markets. Unlike SEBI which is an independent body, the Forwards Markets Commission (FMC) is under the Department of Consumer Affairs (Ministry of Consumer Affairs, Food and Public Distribution) and depends on it for funds. It is imperative that the Government should grant more powers to the FMC to ensure an orderly development of the commodity markets. The SEBI and FMC also need to work closely with each other due to the inter-relationship between the two markets.
Suggestive Framework
Commodity exchanges in India are expected to contribute significantly in strengthening Indian economy to face the challenges of globalization. Indian markets are poised to witness further developments in the areas of electronic warehouse receipts (equivalent of dematerialized shares), which would facilitate seamless nationwide spot market for commodities. (i) Amendments to Essential Commodities Act
and implementation of Value-Added-tax would enable movement across states and more unified tax regime, which would facilitate easier trading in commodities. (ii) Options contracts in commodities are being considered and this would again boost the commodity risk management markets in the country. There may be increased interest from the international players in the Indian commodity markets once national exchanges become operational. (iii) Commodity derivatives as an industry is poised to take-off which may provide the numerous investors in this country with another opportunity to invest and diversify their portfolios. (iv) There is hope greater convergence of markets – equity, commodities, forex and debt – which could enhance the business opportunities for those have specialized in the above markets. Such integration would create specialized treasuries and fund houses that would offer a gamut of services to provide comprehensive risk management solutions to India’s corporate and trade community. India is one of the top producers of a large number of commodities, and also has a long history of trading in commodities and related derivatives. The commodities future market has seen ups and downs, but seems to have finally arrived now. The market has made enormous progress in terms of technology, transparency and the trading activity. Interestingly, this has happened only after the Government protection was removed from a number of commodities, and market forces were allowed to play their role so according to present scenario it can be said that commodity future market are expected to contribute significantly in strengthening the Indian economy to face the challenges of globalization. The Government of India has also demonstrated its commitment to review the Indian agriculture sector and commodity future market.
REFERENCES
Joseph Massey and Singh, Anjani (2003), Commodity
Future Market, MCX Research Group publication.
Ahuja Narendra L. (2006), Commodity Derivatives Market in
India: Development, Regulation and Future Prospects” Euro
Kleinman, George (2008), Trading Commodities and
Financial Futures: A Step by Step Guide to Mastering the
Market, FT press.
Khor, Martin (2005), The Commodities Crises and the Global
Trade in Agriculture: Problems and Prospects. “ B u s i n e s s
Standard” Retr ieved from http://www.business-
standard.comVerma, J.R. (2008), Derivatives and Risk
Management, New Delhi, Tata McGraw-Hill publishing
company Ltd.www.fmc.gov.in
GOI, (2008-09)Economic Survey
Kapur, Sudhir (2007), Why a fourth commodity exchange is
needed, Business India Group
Guidelines for foreign investment (Issued by the Ministry of
Commerce & Industry, Department of Industrial Policy &
Promotion, STA (FC Section), vide Press Note No.5(2009) )
dated 14.05.2009)
99
Future Trading In Indian Commodity Exchanges
Swati Kanchan Shukla
100
Management Accounting is the process of identifying, measuring, accumulating, analyzing, preparing, interpreting,
and communicating information that helps managers fulfill organizational objectives. It has become, today, an
integrated part of management, concerned with achieving the goals of business concerns.
The book deals, quite comprehensively with the latest tools and techniques used and current trends in management
accounting. various new issues and challenges, in this area, have emerged which have been duly covered in the
book. They have been discussed, with the help of examples and illustrations, quite clearly in a simple, concise, lucid
and logical manner. Emphasis has been laid in providing practical use of various information, keeping in mind the
business environment of India
There are 12 chapters in the book. They cover the nature and significance of management accounting, concepts,
elements, classification of costs and overheads and its allocation, preparation of cost sheet and determination of
tender price, marginal costing and budgetary control, standard costing and responsibility accounting, transfer
pricing and activity based costing and the last chapter provide a detailed information about cost management
system.
This book has been written for MBA students of Indian Universities and Management institutions, especially for the
students of Uttar Pradesh Technical University (UPTU), Lucknow. It would be quite useful to those who are appearing
in various professional examinations. It would also prove to be helpful for the researchers, academicians and
practicing managers, who want reliable and valid information to form future management policies.
Book Review
COST & MANAGEMENT ACCOUNTING
by Jagdish Prakash and Devesh Prakash
Prof. Arvind Singh
CMS - RKGIT
Ghaziabad
Publisher- Prayag Pustak Bhawan, Allahabad
Edition 1st 2009, Pages - 367, Price - 235
ISBN 81-86539-65-4
SAARANSHRKG JOURNAL OF MANAGEMENTVol . 1 No. 1 JULY 2009• •
Guidelines For Contributors
The author should follow the following instructions while preparing the manuscript.
The paper should be about 8000-10000 words in length. The author(s) should submit two copies of the
manuscript, typed in two space on A4 size bond paper allowing 1- inch margin on all sides, should be
submitted with a soft copy in CD in PC compatible MS-word document format. CD is not required if the
manuscript is e-mailed at [email protected] however, in this case two hard copies of manuscripts have to
be sent separately.
The author should provide confirmation that - The article is the original work of the author(s). It has not been
earlier published and has not been sent for publication elsewhere.
The paper should begin with an Abstract of not more than 100-150 words, which encapsulate the principle
topics covered by the paper. Abstracts should be informative, giving a clear indication of the nature and range
of results contained in the paper. Do not include any reference in your abstract.
Figures, charts, tables and diagrams - All figures, diagrams, charts and tables should be on separate papers
and numbered in a single sequence in the order in which they are referred to in the paper. Please mention their
number at appropriate places within the text.
References must be kept to a bare minimum. The references must be quoted in the text using American
psychological style of referencing. You must make sure that all references which appear in the text are given in
full. Where there is more than one reference to the same author for the same year, they should be listed as
2009a, 2009b etc. The references section should be a continuous alphabetical list. Do not divide the list into
different sections.
Books The order of information should be as in the following example:
Srivastava, Vinay K. (2007), Privatization of Public Enterprises in India, Allahabad, Kitab Mahal.
Journal papers and book chapters The order for reference to articles/chapters of books should be as in
these examples:
Srivastava, Vinay K. (2004), ‘Corporate Governance Practices’, Indian Journal of Accounting,Ujjain, IAA,Vol.
34, No. 2, Pp 74-77.
Rao, Nageshwar. (1992), Privatise public Enterprises in India, in Prakash. J. (ed), Privatization of Public
Enterprises in India, Mumbai, Himalya Publishing house, p 212.
All manuscripts received for publication in SAARANSH are acknowledged by the Chief Editor. This helps
authors know the status of their paper from time to time.
The Editors reserve the right to accept or refuse the paper for publication, and they are under no obligation to
assign reasons for their decision. Authors will receive a complimentary copy of the journal in which their articles
are published.
The works published in the Journal should not be reproduced or reprinted in any form, without the prior
permission from the editor.
l
l
l
l
l
l
l
l
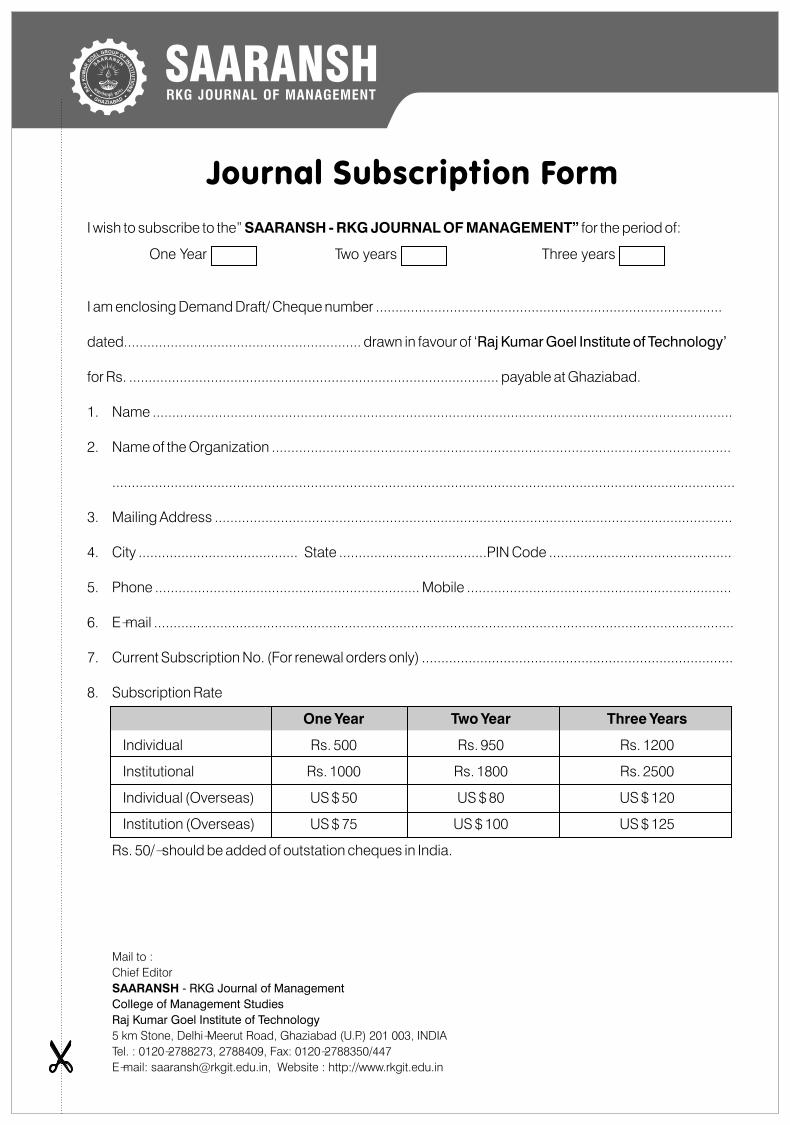
SAARANSHRKG JOURNAL OF MANAGEMENT
I wish to subscribe to the” SAARANSH - RKG JOURNAL OF MANAGEMENT” for the period of:
One Year Two years Three years
I am enclosing Demand Draft/ Cheque number .........................................................................................
dated............................................................. drawn in favour of ‘Raj Kumar Goel Institute of Technology’
for Rs. ............................................................................................... payable at Ghaziabad.
1. Name .....................................................................................................................................................
2. Name of the Organization ......................................................................................................................
................................................................................................................................................................
3. Mailing Address .....................................................................................................................................
4. City ......................................... State ......................................PIN Code ...............................................
5. Phone .................................................................... Mobile ....................................................................
6. E-mail .....................................................................................................................................................
7. Current Subscription No. (For renewal orders only) ................................................................................
8. Subscription Rate
One Year Two Year Three Years
Individual Rs. 500 Rs. 950 Rs. 1200
Institutional Rs. 1000 Rs. 1800 Rs. 2500
Individual (Overseas) US $ 50 US $ 80 US $ 120
Institution (Overseas) US $ 75 US $ 100 US $ 125
Rs. 50/- should be added of outstation cheques in India.
Journal Subscription Form
Mail to :
Chief Editor
SAARANSH - RKG Journal of Management
College of Management Studies
Raj Kumar Goel Institute of Technology
5 km Stone, Delhi-Meerut Road, Ghaziabad (U.P.) 201 003, INDIA
Tel. : 0120-2788273, 2788409, Fax: 0120-2788350/447
E-mail: [email protected], Website : http://www.rkgit.edu.in
Printed and Published by
College of Management Studies
RAJ KUMAR GOEL INSTITUTE OF TECHNOLOGY
RKG Group of Institutions was established by prominent visionary and educationist Late Sh. Raj Kumar Goel Ji in the year 2000 with its first college RKGIT Ghaziabad with the holistic objective of imparting quality education in the field of Engineering, Management, Pharmacy and Education. At present, the group has seven colleges
ØRaj Kumar Goel Institute of Technology, Ghaziabad
ØRaj Kumar Goel Engineering College, Pilakhuwa, Ghaziabad
ØRaj Kumar Goel Institute of Technology for Women, Ghaziabad
ØRKG Chandrakanta College of Management & Technology for Women, Garhmuketshwar, Ghaziabad
ØLala Mangat Ram Mahavidyalya, Ghaziabad
ØRaj Kumar Goel Junior High School, Pura Mahadev, Baghpat
ØRaj Kumar Goel Girls Degree College, Garh Mukteshwar
RAJ KUMAR GOEL GROUP OF INSTITUTIONS
5 Km Stone, Delhi-Meerut Road, Ghaziabad (UP) 201003, INDIATel: 0120-2788273, 2788409, Fax: 0120-2788350/447
E-mail: [email protected] Website: http://www.rkgit.edu.in
(Affiliated to Uttar Pradesh Technical University, Lucknow)
CMS was established as a premiere & dynamic At CMS emphasis is laid on the overall institution to impart futuristic management personality development of the students. To educa t ion to budd ing management ensure this regular Institute-Industry professionals. The founders had a vision in interactions are organized in the form of guest such quality standards of education as to make lectures, industrial visits etc. To supplement it a benchmark in management education. their academic pursuits, seminars, business Since its inception in 2003, we at CMS are Quiz. GDs, paper writing, presentations continuously striving to create a synergistic management games are organized & environment promoting strong linkages with maximum participation of students is ensured. industry, business & community at large which We have a well-qualified team of core faculty, has resulted in the best placements for our
having wide exposure, have embrasure in students. CMS boasts of state of the art
teaching and industry that aims at the holistic infrastructure, which is in complete harmony
development of MBA participants. The faculty with the stimulating academic environment
is always encouraged to indulge in research provided by its intellectual resource. The
activities so as to hone their skills & classrooms & tutorial rooms are spacious, well knowledge. The result of institute is in the top ventilated, well furnished and well lit. Classroom bracket since the beginning, we can very teaching is aided by modern techniques-to proudly boast of 100 % result of all our passing enable the faculty to deliver lectures in the most out batches. We aim at imparting such contemporary format. We have a well stocked, knowledge & skills to our aspiring managers modern air conditioned library that makes so as to create the right fit with the industry. We available to its students & faculty the latest & the want them to become a proud citizen of the best Books, Journals, Periodicals, Magazines next knowledge super power i.e. India and etc. to supplement the theoretical knowledge
imparted to the students in the classrooms. work towards its growth & development.
Raj Kumar Goel Institute of TechnologyCollege of Management of Studies
Related Documents


