RESEARCH ARTICLE Open Access A phenomics-based approach for the detection and interpretation of shared genetic influences on 29 biochemical indices in southern Chinese men Yanling Hu 1,2† , Aihua Tan 1,3† , Lei Yu 1† , Chenyang Hou 4† , Haofa Kuang 2† , Qunying Wu 5 , Jinghan Su 1 , Qingniao Zhou 5 , Yuanyuan Zhu 2 , Chenqi Zhang 2 , Wei Wei 2 , Lianfeng Li 4 , Weidong Li 2 , Yuanjie Huang 2 , Hongli Huang 2 , Xing Xie 2 , Tingxi Lu 4 , Haiying Zhang 1 , Xiaobo Yang 1 , Yong Gao 1 , Tianyu Li 1 , Yonghua Jiang 1* and Zengnan Mo 1* Abstract Background: Phenomics provides new technologies and platforms as a systematic phenome-genome approach. However, few studies have reported on the systematic mining of shared genetics among clinical biochemical indices based on phenomics methods, especially in China. This study aimed to apply phenomics to systematically explore shared genetics among 29 biochemical indices based on the Fangchenggang Area Male Health and Examination Survey cohort. Result: A total of 1999 subjects with 29 biochemical indices and 709,211 single nucleotide polymorphisms (SNPs) were subjected to phenomics analysis. Three bioinformatics methods, namely, Pearson’s test, Jaccard’s index, and linkage disequilibrium score regression, were used. The results showed that 29 biochemical indices were from a network. IgA, IgG, IgE, IgM, HCY, AFP and B12 were in the central community of 29 biochemical indices. Key genes and loci associated with metabolism traits were further identified, and shared genetics analysis showed that 29 SNPs (P < 10 - 4 ) were associated with three or more traits. After integrating the SNPs related to two or more traits with the GWAS catalogue, 31 SNPs were found to be associated with several diseases (P < 10 - 8 ). Using ALDH2 as an example to preliminarily explore its biological function, we also confirmed that the rs671 (ALDH2) polymorphism affected multiple traits of osteogenesis and adipogenesis differentiation in 3 T3-L1 preadipocytes. Conclusion: All these findings indicated a network of shared genetics and 29 biochemical indices, which will help fully understand the genetics participating in biochemical metabolism. Keywords: Phenomics, FAMHES cohort, Biochemical indices, Shared genetics, Lipid metabolism Background Complex traits are the product of various biological sig- nals and some intermediate traits may be affected either directly or indirectly by these signals [1]. A phenome is the sum of many phenotypic characteristics (phenomics traits) that signifies the expression of the whole genome, proteome and metabolome under a specific environmental influence [2, 3]. The study of phenomes (called phe- nomics) provides a suite of new technologies and plat- forms that have enabled a transition from focused phenotype-genotype studies to a systematic phenome- genome approach [4]. Many recent studies have found that, compared to considering only binary patients vs. healthy controls, mapping intermediate steps in disease processes, such as various disease-related clinical quantita- tive traits or gene expression, is more informative [5, 6]. © The Author(s). 2019 Open Access This article is distributed under the terms of the Creative Commons Attribution 4.0 International License (http://creativecommons.org/licenses/by/4.0/), which permits unrestricted use, distribution, and reproduction in any medium, provided you give appropriate credit to the original author(s) and the source, provide a link to the Creative Commons license, and indicate if changes were made. The Creative Commons Public Domain Dedication waiver (http://creativecommons.org/publicdomain/zero/1.0/) applies to the data made available in this article, unless otherwise stated. * Correspondence: [email protected]; [email protected] † Yanling Hu, Aihua Tan, Lei Yu, Chenyang Hou and Haofa Kuang contributed equally to this work. 1 Center for Genomic and Personalized Medicine, Guangxi Medical University, Nanning 530021, Guangxi, China Full list of author information is available at the end of the article Hu et al. BMC Genomics (2019) 20:983 https://doi.org/10.1186/s12864-019-6363-0

Welcome message from author
This document is posted to help you gain knowledge. Please leave a comment to let me know what you think about it! Share it to your friends and learn new things together.
Transcript

RESEARCH ARTICLE Open Access
A phenomics-based approach for thedetection and interpretation of sharedgenetic influences on 29 biochemicalindices in southern Chinese menYanling Hu1,2†, Aihua Tan1,3†, Lei Yu1†, Chenyang Hou4†, Haofa Kuang2†, Qunying Wu5, Jinghan Su1,Qingniao Zhou5, Yuanyuan Zhu2, Chenqi Zhang2, Wei Wei2, Lianfeng Li4, Weidong Li2, Yuanjie Huang2,Hongli Huang2, Xing Xie2, Tingxi Lu4, Haiying Zhang1, Xiaobo Yang1, Yong Gao1, Tianyu Li1,Yonghua Jiang1* and Zengnan Mo1*
Abstract
Background: Phenomics provides new technologies and platforms as a systematic phenome-genome approach.However, few studies have reported on the systematic mining of shared genetics among clinical biochemicalindices based on phenomics methods, especially in China. This study aimed to apply phenomics to systematicallyexplore shared genetics among 29 biochemical indices based on the Fangchenggang Area Male Health andExamination Survey cohort.
Result: A total of 1999 subjects with 29 biochemical indices and 709,211 single nucleotide polymorphisms (SNPs)were subjected to phenomics analysis. Three bioinformatics methods, namely, Pearson’s test, Jaccard’s index, andlinkage disequilibrium score regression, were used. The results showed that 29 biochemical indices were from anetwork. IgA, IgG, IgE, IgM, HCY, AFP and B12 were in the central community of 29 biochemical indices. Key genesand loci associated with metabolism traits were further identified, and shared genetics analysis showed that 29SNPs (P < 10− 4) were associated with three or more traits. After integrating the SNPs related to two or more traitswith the GWAS catalogue, 31 SNPs were found to be associated with several diseases (P < 10− 8). Using ALDH2 as anexample to preliminarily explore its biological function, we also confirmed that the rs671 (ALDH2) polymorphismaffected multiple traits of osteogenesis and adipogenesis differentiation in 3 T3-L1 preadipocytes.
Conclusion: All these findings indicated a network of shared genetics and 29 biochemical indices, which will helpfully understand the genetics participating in biochemical metabolism.
Keywords: Phenomics, FAMHES cohort, Biochemical indices, Shared genetics, Lipid metabolism
BackgroundComplex traits are the product of various biological sig-nals and some intermediate traits may be affected eitherdirectly or indirectly by these signals [1]. A phenome isthe sum of many phenotypic characteristics (phenomics
traits) that signifies the expression of the whole genome,proteome and metabolome under a specific environmentalinfluence [2, 3]. The study of phenomes (called phe-nomics) provides a suite of new technologies and plat-forms that have enabled a transition from focusedphenotype-genotype studies to a systematic phenome-genome approach [4]. Many recent studies have foundthat, compared to considering only binary patients vs.healthy controls, mapping intermediate steps in diseaseprocesses, such as various disease-related clinical quantita-tive traits or gene expression, is more informative [5, 6].
© The Author(s). 2019 Open Access This article is distributed under the terms of the Creative Commons Attribution 4.0International License (http://creativecommons.org/licenses/by/4.0/), which permits unrestricted use, distribution, andreproduction in any medium, provided you give appropriate credit to the original author(s) and the source, provide a link tothe Creative Commons license, and indicate if changes were made. The Creative Commons Public Domain Dedication waiver(http://creativecommons.org/publicdomain/zero/1.0/) applies to the data made available in this article, unless otherwise stated.
* Correspondence: [email protected]; [email protected]†Yanling Hu, Aihua Tan, Lei Yu, Chenyang Hou and Haofa Kuang contributedequally to this work.1Center for Genomic and Personalized Medicine, Guangxi Medical University,Nanning 530021, Guangxi, ChinaFull list of author information is available at the end of the article
Hu et al. BMC Genomics (2019) 20:983 https://doi.org/10.1186/s12864-019-6363-0

Pleiotropy, which is a DNA variant or mutation thatcan affect multiple traits, is a common phenomenon ingenetics [7]. For example, Joseph Pickrell and colleagues[8] performed genome-wide association studies (GWAS)of 42 traits or diseases to compare the genetic variantsassociated with multiple phenotypes and identified 341loci associated with multiple traits. Heid IM et al [9] per-formed a GWAS of fasting insulin, high-density lipopro-tein cholesterol (HDL-C) and triglyceride (TG) levels toidentify 53 loci associated with a limited capacity tostore fat in a healthy way, and this multi-trait approachcould increase the power to gain insights into an other-wise difficult-to-grasp phenotype. Furthermore, manystudies have found that diseases or clinically quantitativetraits can be interconnected. For example, increasing cir-culating fatty acids (Fas) could lead to the developmentof obesity-associated metabolic complications, such asinsulin resistance [10]. Goh et al [11] found that essen-tial human genes tended to encode hub proteins andwere widely expressed in multiple tissues. Many sharedgenetic variants are identified in linkage disequilibriumwith variants associated with other human traits or dis-eases, and these pleiotropic connections connect the hu-man traits together [8, 12]. Therefore, understanding thecomplex relationships among human traits and diseasesis important for learning about the molecular functionof hub genes.The Fangchenggang Area Male Health and Examin-
ation (FAMHES) cohort was initiated in 2009 in Fang-chenggang City, Guangxi, China. It is a comprehensivedemographic and health survey that focuses on investi-gating the interaction between the environment andgenetic factors on men’s health. In a previous study, wereported that biochemical indices are closely associatedwith disease. For example, higher complement 3 (C3)and complement 4 (C4) were associated with an increasein metabolic syndrome (MetS) [13]. Low serum osteocal-cin levels were a potential marker for MetS [14] and im-paired glucose tolerance [15]. Uric acid (UA) waspositively correlated with the prevalence of MetS [16].Additionally, a genome-wide assay indicated that genesor loci associated with lipid traits are related to bio-chemical indices. For example, alcohol consumption andthe ALDH2 rs671 polymorphism affected serum TGlevels [17]. Although the role of genetic factors and genepolymorphisms in biochemical indices has been re-ported, the network of biochemical indices themselves,biochemical indices and genetic types are still puzzling.With the rapid advances in bioinformatics techniques,clarifying the biochemical indices network with genetictypes becomes feasible.The aim of this study was to identify the shared gen-
etics responsible for 29 biochemical indices in theFAMHES cohort using a phenomics approach. Our
findings shed light on the relationships between these29 biochemical indices, including their shared geneticbasis and genetic risk loci.
ResultsGenetic and trait-based characteristics of 1999 samplesA total of 1999 subjects with 29 biochemical indices thatpassed the QC call rate of 95% were analysed, and a total of709,211 SNPs in these subjects were subjected to the subse-quent genetic analysis. The average GWAS inflation factorfor all 29 biochemical indices was 1.029 (range: 0.975–1.060), suggesting that the stratification correlation workedwell (Additional file 5: Table S1). The heatmaps based onthe Pearson correlation coefficient showed that 106 corre-lated pairs were found among these 29 traits (correlationcoefficient was over 0.3 or less than − 0.3 and the P valuewas less than 0.01) (Fig. 1). In addition, cluster analysis withthe hclust package in the R package classified these 29 bio-chemical indices into 2 groups, with one group includingblood urea nitrogen (BUN), cholesterol, glucose, testoster-one (TE), follicle-stimulating hormone (FSH), insulin, im-munoglobulin G (IgG), homocysteine (HCY), folate (FOL),alpha-fetoprotein (AFP), immunoglobulin A (IgA), low-density lipoprotein cholesterol (LDL-C), immunoglobulinM (IgM), C3, how-density lipoprotein cholesterol (HDL),TGs, and C-reactive protein (CRP). The other group in-cluded vitamin B12 (B12), ferritin (FRRR), uric acid, im-munoglobulin E (IgE), anti-streptococcus haemolysin “O”(ASO), creatinine, osteocalcin (OSTEOC), oestradiol, sexhormone binding globulin (SHBG), and alanine transamin-ase (ALT) (Additional file 1: Figure S1). Each group con-tained common lipid metabolism indices, suggesting thatthese traits were correlated with lipid metabolism.
Correlation analysis based on network medicineFor each trait, we used a linear mixed model estimatefixed value, adjusted with PC1 and PC2 of populationstratification and age, respectively, to perform a GWAS.A total of 86,556 SNPs (P value 1 × 10− 3) associated withall 29 biochemical indices were obtained and then anno-tated using the SNP function database with default pa-rameters and the south Asian population option [18]. Atotal of 12,521 genes were obtained, and protein-proteininteractions were determined using the BioGRID data-base [19]. A total of 5313 genes with known proteinswere obtained, and the interactional network was builtwith Cytoscape 3 [20]. The topological coefficient, clus-tering coefficient and degree distribution were importantindices to evaluate network nodes. Details of these threefactors for 5313 genes are shown in Additional file 2:Figure S2 (A, B, C, D).The Jaccard correlation matrix heatmaps showed that
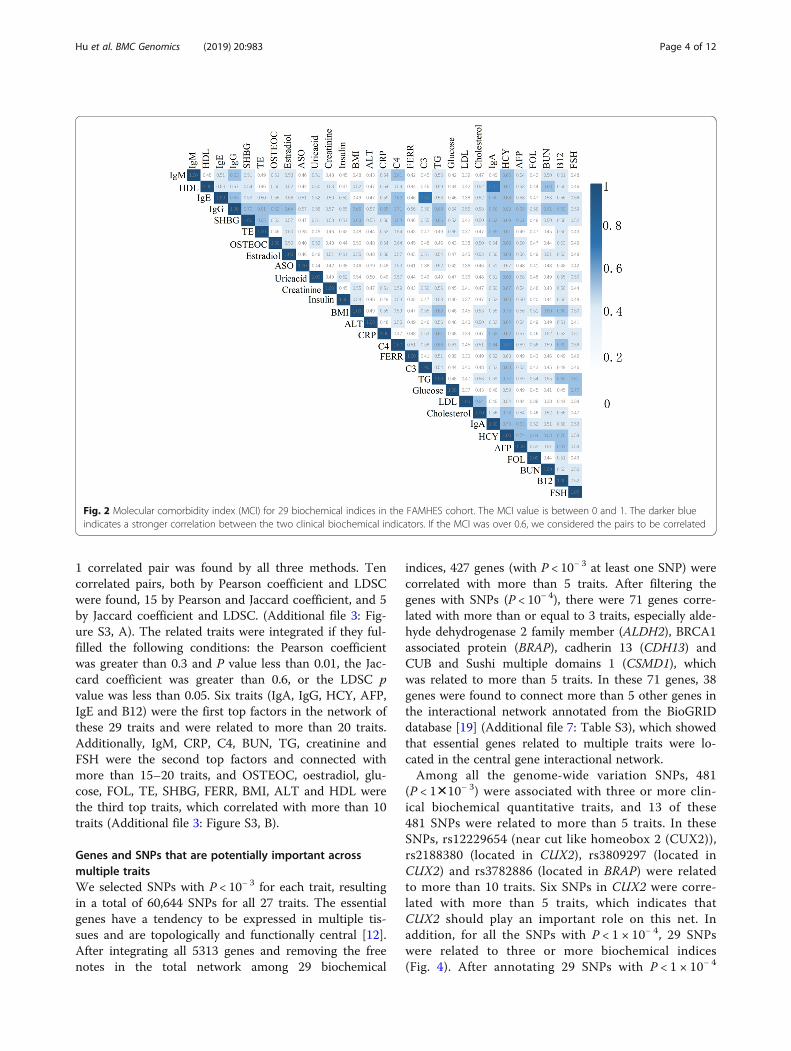
there were 63 correlated pairs among 435 pairwise com-binations among these 29 traits indices with an MCI
Hu et al. BMC Genomics (2019) 20:983 Page 2 of 12

over 0.6 (Fig. 2). In these pairs, HCY, IgG, SHBG, B12,IgA and C4 were closely related with more than sixother traits. However, because the information regardinggene/protein interactions in public databases is limited,interaction information for most of the genes/proteins inthis study could not be obtained, and the Jaccard indexwas computed based on a small number of genes/proteins.
Correlation analysis based on linkage disequilibriumscore regression (LDSC)Genetics can help to elucidate cause and effect. How-ever, single variants tend to have minor effects, andreverse causation involves an even smaller list of con-founding factors. Therefore, interrogating geneticoverlap via GWAS that focuses on genome-wide sig-nificant SNPs is predicted to be an effective means ofmining the correlation between different phenotypes.The GWAS effect size estimate for a given SNP willcapture information about SNPs near the linkage
disequilibrium [21]. The correlations based on GWASof the 29 quantitative clinical traits were estimatedusing cross-trait LDSC. The genetic correlation esti-mates for all 435 pairwise combinations among these29 traits. After removing the outlier values, 68 signifi-cantly correlated pairs (p < 0.05) were found (Fig. 3).The details for these 68 selected pairs of traits areshown in Additional file 6: Table S2.
Integration and interpretation of important pairsidentified by these three methodsTo identify the correlation pairs among these threemethods, we integrated the correlated traits fitting atleast one of the following: Pearson coefficient wasgreater than 0.3 or less than − 0.3 and P value less than0.01, Jaccard coefficient was greater than 0.6, or P valueof LDSC was less than 0.05. In total, 208 correlated pairsamong biochemical indices were found; among them106, 63, 68 correlated pairs were found by Pearson coef-ficient, Jaccard coefficient, and LDSC, respectively. Only
Fig. 1 The heatmaps based on the Pearson correlation for 29 biochemical indices in the FAMHES cohort. The coefficient in each cell ranges from− 1 to 1. A negative value denotes a negative correlation, a positive value denotes a positive correlation, 1 indicates a complete correlation, and 0indicates no correlation. The correlations between clinical quantitative traits shown in this matrix are shown in blue and red. Blue represents apositive correlation, and the darker the colour, the stronger the positive correlation. Red indicates a negative correlation, and the darker thecolour, the stronger the negative correlation. If the correlation coefficients were greater than 0.3 or less than − 0.3 and P value< 0.01, weconsidered the pairs to be correlated
Hu et al. BMC Genomics (2019) 20:983 Page 3 of 12
1 correlated pair was found by all three methods. Tencorrelated pairs, both by Pearson coefficient and LDSCwere found, 15 by Pearson and Jaccard coefficient, and 5by Jaccard coefficient and LDSC. (Additional file 3: Fig-ure S3, A). The related traits were integrated if they ful-filled the following conditions: the Pearson coefficientwas greater than 0.3 and P value less than 0.01, the Jac-card coefficient was greater than 0.6, or the LDSC pvalue was less than 0.05. Six traits (IgA, IgG, HCY, AFP,IgE and B12) were the first top factors in the network ofthese 29 traits and were related to more than 20 traits.Additionally, IgM, CRP, C4, BUN, TG, creatinine andFSH were the second top factors and connected withmore than 15–20 traits, and OSTEOC, oestradiol, glu-cose, FOL, TE, SHBG, FERR, BMI, ALT and HDL werethe third top traits, which correlated with more than 10traits (Additional file 3: Figure S3, B).
Genes and SNPs that are potentially important acrossmultiple traitsWe selected SNPs with P < 10− 3 for each trait, resultingin a total of 60,644 SNPs for all 27 traits. The essentialgenes have a tendency to be expressed in multiple tis-sues and are topologically and functionally central [12].After integrating all 5313 genes and removing the freenotes in the total network among 29 biochemical
indices, 427 genes (with P < 10− 3 at least one SNP) werecorrelated with more than 5 traits. After filtering thegenes with SNPs (P < 10− 4), there were 71 genes corre-lated with more than or equal to 3 traits, especially alde-hyde dehydrogenase 2 family member (ALDH2), BRCA1associated protein (BRAP), cadherin 13 (CDH13) andCUB and Sushi multiple domains 1 (CSMD1), whichwas related to more than 5 traits. In these 71 genes, 38genes were found to connect more than 5 other genes inthe interactional network annotated from the BioGRIDdatabase [19] (Additional file 7: Table S3), which showedthat essential genes related to multiple traits were lo-cated in the central gene interactional network.Among all the genome-wide variation SNPs, 481
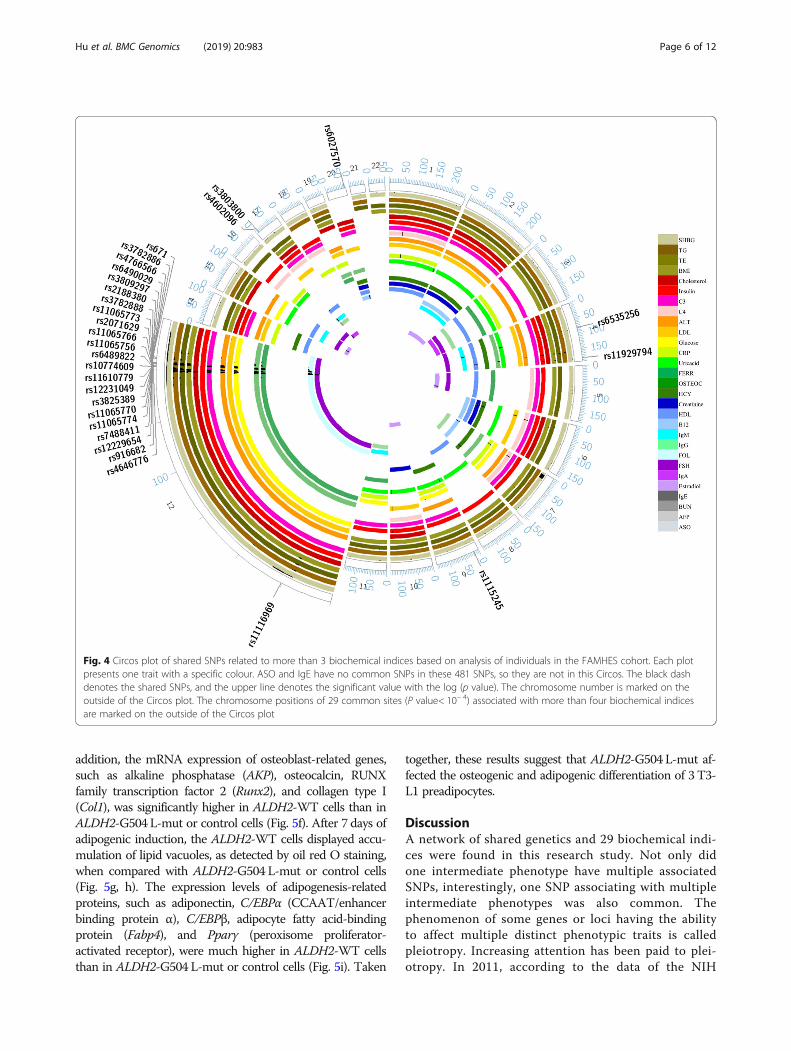
(P < 1✕10− 3) were associated with three or more clin-ical biochemical quantitative traits, and 13 of these481 SNPs were related to more than 5 traits. In theseSNPs, rs12229654 (near cut like homeobox 2 (CUX2)),rs2188380 (located in CUX2), rs3809297 (located inCUX2) and rs3782886 (located in BRAP) were relatedto more than 10 traits. Six SNPs in CUX2 were corre-lated with more than 5 traits, which indicates thatCUX2 should play an important role on this net. Inaddition, for all the SNPs with P < 1 × 10− 4, 29 SNPswere related to three or more biochemical indices(Fig. 4). After annotating 29 SNPs with P < 1 × 10− 4
Fig. 2 Molecular comorbidity index (MCI) for 29 biochemical indices in the FAMHES cohort. The MCI value is between 0 and 1. The darker blueindicates a stronger correlation between the two clinical biochemical indicators. If the MCI was over 0.6, we considered the pairs to be correlated
Hu et al. BMC Genomics (2019) 20:983 Page 4 of 12

using the HaploReg database [22], we found that al-most all these SNPs were related to enhancer histonebinding, promoter DNase binding and transcript bind-ing, which affected protein binding or the presence ofeQTLs (Additional file 8: Table S4).After integrating the SNPs associated with more than 2
traits(P < 1 × 10− 4) with the GWAS catalogue [23], wefound that 31 SNPs in 18 genes were in the GWAS cata-logue (Additional file 9: Table S5). Among those SNPs, fiveSNPs (rs579459, rs649129, rs507666, rs495828, andrs651007) in ABO were associated with more than 10quantitative traits and diseases. One SNP (rs671) in ALDH2was related to 21 traits, six SNPs (rs10519302, rs16964211,rs2305707, rs2414095, rs6493487 and rs727479) in or nearCYP19A1 were mainly associated with hormone measure-ments. This finding supports the idea that shared geneticsfor traits can produce correlations among these traits.
The rs671 polymorphism in ALDH2 affects osteogenic andadipogenic differentiation of 3 T3-L1 preadipocytesAn interaction between a SNP (rs671) in ALDH2 was re-lated to 13 traits found in this study. The relationship
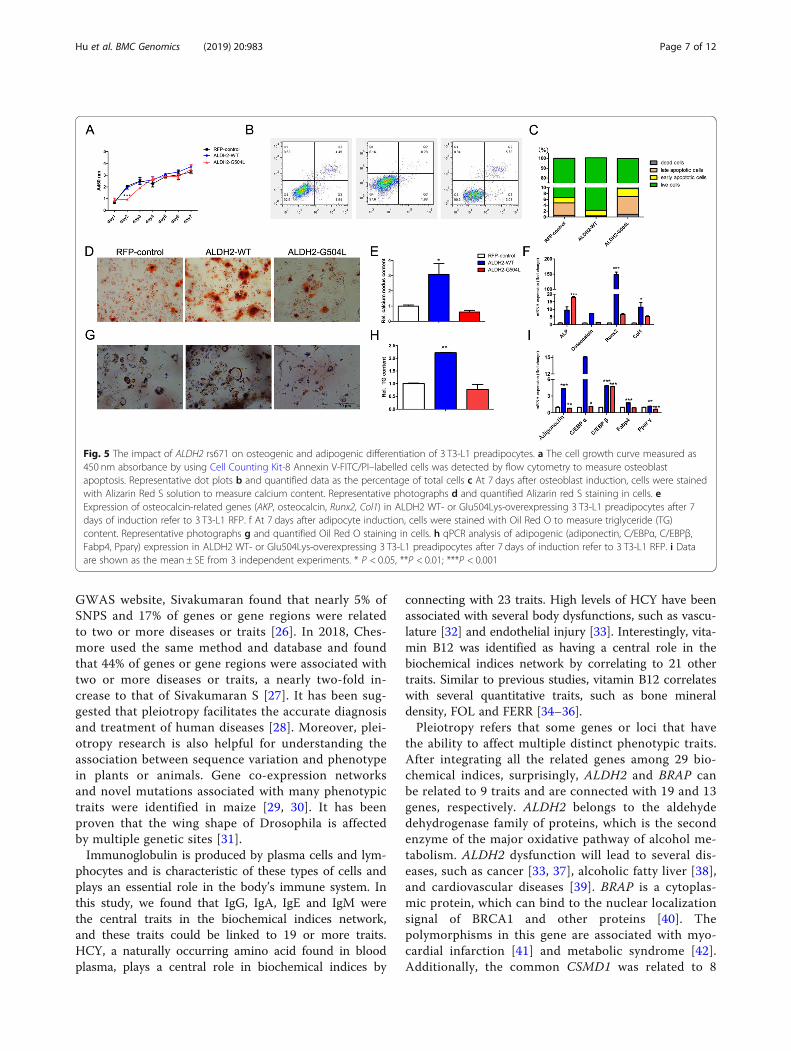
between rs671 and lipid metabolism or osteocalcin has beenfound in some studies [24, 25]; however, their functionneeds to be investigated. Rs671 is a nonsynonymous (ns)SNP (G504 L) in the ALDH2 gene, which is located onchromosome 12. To evaluate the effects of the rs671 poly-morphism on osteogenic and adipogenic differentiation of 3T3-L1 preadipocytes, a lentivirus vector was used to overex-press ALDH2-WT or ALDH2-G504 L-mut in 3T3-L1 prea-dipocytes (Additional file 4: Figure S4). The cell growthcurve of ALDH2-G504 L-mut showed no obvious changecompared with that of the control, but expression ofALDH2-WT induced a significant increase in cell prolifera-tion (Fig. 5a). The cell apoptosis results were consistent withthis finding; overexpression of ALDH2-WT resulted in a3.935-fold decrease in late apoptotic cells in comparison tothat of ALDH2-G504 L-mut or control cells (Fig. 5b, c). Wenext investigated the impact of the ALDH2 G504 L muta-tion on the osteogenic and adipogenic differentiation of 3T3-L1 preadipocytes. At 7 days after osteoblast induction,cells were subjected to Alizarin red S staining. ALDH2-WTcells showed more mineralized nodules than the controlcells or those expressing ALDH2-G504 L-mut (Fig. 5d, e). In
Fig. 3 Correlation analysis based on linkage disequilibrium score regression (LDSC) for 29 biochemical indices in the FAMHES cohort. The geneticcorrelation estimate (Rg) ranges between − 1 and 1. A negative value denotes a negative correlation, a positive value denotes a positivecorrelation, 1 indicates a complete correlation, and 0 indicates no correlation. The correlations between clinical biochemical indicators shown inthis matrix are represented by blue and red. Blue represents a positive correlation, and the darker the colour, the stronger the positive correlation.Red indicates a negative correlation, and the darker the colour, the stronger the negative correlation
Hu et al. BMC Genomics (2019) 20:983 Page 5 of 12
addition, the mRNA expression of osteoblast-related genes,such as alkaline phosphatase (AKP), osteocalcin, RUNXfamily transcription factor 2 (Runx2), and collagen type I(Col1), was significantly higher in ALDH2-WT cells than inALDH2-G504 L-mut or control cells (Fig. 5f). After 7 days ofadipogenic induction, the ALDH2-WT cells displayed accu-mulation of lipid vacuoles, as detected by oil red O staining,when compared with ALDH2-G504 L-mut or control cells(Fig. 5g, h). The expression levels of adipogenesis-relatedproteins, such as adiponectin, C/EBPα (CCAAT/enhancerbinding protein α), C/EBPβ, adipocyte fatty acid-bindingprotein (Fabp4), and Pparγ (peroxisome proliferator-activated receptor), were much higher in ALDH2-WT cellsthan in ALDH2-G504 L-mut or control cells (Fig. 5i). Taken
together, these results suggest that ALDH2-G504 L-mut af-fected the osteogenic and adipogenic differentiation of 3 T3-L1 preadipocytes.
DiscussionA network of shared genetics and 29 biochemical indi-ces were found in this research study. Not only didone intermediate phenotype have multiple associatedSNPs, interestingly, one SNP associating with multipleintermediate phenotypes was also common. Thephenomenon of some genes or loci having the abilityto affect multiple distinct phenotypic traits is calledpleiotropy. Increasing attention has been paid to plei-otropy. In 2011, according to the data of the NIH
Fig. 4 Circos plot of shared SNPs related to more than 3 biochemical indices based on analysis of individuals in the FAMHES cohort. Each plotpresents one trait with a specific colour. ASO and IgE have no common SNPs in these 481 SNPs, so they are not in this Circos. The black dashdenotes the shared SNPs, and the upper line denotes the significant value with the log (p value). The chromosome number is marked on theoutside of the Circos plot. The chromosome positions of 29 common sites (P value< 10− 4) associated with more than four biochemical indicesare marked on the outside of the Circos plot
Hu et al. BMC Genomics (2019) 20:983 Page 6 of 12
GWAS website, Sivakumaran found that nearly 5% ofSNPS and 17% of genes or gene regions were relatedto two or more diseases or traits [26]. In 2018, Ches-more used the same method and database and foundthat 44% of genes or gene regions were associated withtwo or more diseases or traits, a nearly two-fold in-crease to that of Sivakumaran S [27]. It has been sug-gested that pleiotropy facilitates the accurate diagnosisand treatment of human diseases [28]. Moreover, plei-otropy research is also helpful for understanding theassociation between sequence variation and phenotypein plants or animals. Gene co-expression networksand novel mutations associated with many phenotypictraits were identified in maize [29, 30]. It has beenproven that the wing shape of Drosophila is affectedby multiple genetic sites [31].Immunoglobulin is produced by plasma cells and lym-
phocytes and is characteristic of these types of cells andplays an essential role in the body’s immune system. Inthis study, we found that IgG, IgA, IgE and IgM werethe central traits in the biochemical indices network,and these traits could be linked to 19 or more traits.HCY, a naturally occurring amino acid found in bloodplasma, plays a central role in biochemical indices by
connecting with 23 traits. High levels of HCY have beenassociated with several body dysfunctions, such as vascu-lature [32] and endothelial injury [33]. Interestingly, vita-min B12 was identified as having a central role in thebiochemical indices network by correlating to 21 othertraits. Similar to previous studies, vitamin B12 correlateswith several quantitative traits, such as bone mineraldensity, FOL and FERR [34–36].Pleiotropy refers that some genes or loci that have
the ability to affect multiple distinct phenotypic traits.After integrating all the related genes among 29 bio-chemical indices, surprisingly, ALDH2 and BRAP canbe related to 9 traits and are connected with 19 and 13genes, respectively. ALDH2 belongs to the aldehydedehydrogenase family of proteins, which is the secondenzyme of the major oxidative pathway of alcohol me-tabolism. ALDH2 dysfunction will lead to several dis-eases, such as cancer [33, 37], alcoholic fatty liver [38],and cardiovascular diseases [39]. BRAP is a cytoplas-mic protein, which can bind to the nuclear localizationsignal of BRCA1 and other proteins [40]. Thepolymorphisms in this gene are associated with myo-cardial infarction [41] and metabolic syndrome [42].Additionally, the common CSMD1 was related to 8
Fig. 5 The impact of ALDH2 rs671 on osteogenic and adipogenic differentiation of 3 T3-L1 preadipocytes. a The cell growth curve measured as450 nm absorbance by using Cell Counting Kit-8 Annexin V-FITC/PI–labelled cells was detected by flow cytometry to measure osteoblastapoptosis. Representative dot plots b and quantified data as the percentage of total cells c At 7 days after osteoblast induction, cells were stainedwith Alizarin Red S solution to measure calcium content. Representative photographs d and quantified Alizarin red S staining in cells. eExpression of osteocalcin-related genes (AKP, osteocalcin, Runx2, Col1) in ALDH2 WT- or Glu504Lys-overexpressing 3 T3-L1 preadipocytes after 7days of induction refer to 3 T3-L1 RFP. f At 7 days after adipocyte induction, cells were stained with Oil Red O to measure triglyceride (TG)content. Representative photographs g and quantified Oil Red O staining in cells. h qPCR analysis of adipogenic (adiponectin, C/EBPα, C/EBPβ,Fabp4, Pparγ) expression in ALDH2 WT- or Glu504Lys-overexpressing 3 T3-L1 preadipocytes after 7 days of induction refer to 3 T3-L1 RFP. i Dataare shown as the mean ± SE from 3 independent experiments. * P < 0.05, **P < 0.01; ***P < 0.001
Hu et al. BMC Genomics (2019) 20:983 Page 7 of 12
traits. CSMD1 is a large (~ 390 kDa) membrane-boundcomplement inhibitor [43]. Mutations of this geneparticipate in complement activation and inflamma-tion in the central nervous system, which leads to Par-kinson’s disease [44]. These three genes may be hubgenes in biochemical indices networks.If the SNPs located in sites related to promoter DNase
binding, enhancer histone binding and transcript binding,the marginally significant SNPs play regulatory roles af-fecting protein binding or the presence of eQTL [45, 46].In this research, 29 SNPs (P < 10–4) were associated withthree or more traits and correlated with each other. Theseresults revealed that the shared regulatory genetics aremost likely to drive association signals and play importantroles in clinical biological function. This phenomenonmay provide important “scaffolding” to support a frame-work to explore the basic mechanism of biochemicalindices.Shared genetics are commonly used to build disease-
diseased relationship and mine the common disorder ofdiseases [47, 48]. An important general insight from thisstudy was that associated genes across traits tend togather in trait-specific network modules. We found that31 SNPs in 18 genes were associated with several traitsand diseases; five SNPs (rs579459, rs649129, rs507666,rs495828 and rs651007) of ABO were associated withcholesterol and LDL levels. Six SNPs (rs10519302,rs16964211, rs2305707, rs2414095, rs6493487, rs727479)of CYP19A1 were associated with oestradiol levels.Rs671 in ALDH2 was associated with glucose, OSTEOC,and SHBG levels. These findings suggest that sharedgenetics on traits can produce correlations between dif-ferent traits of disease. For example, the ABO gene lo-cated near 9q34.2 encodes glycosyltransferases related tothe first discovered ABO blood group system [49]. Theabnormal expression or polymorphism of this gene iscorrelated with several body dysfunctions, such as is-chaemic stroke [50], large artery atherosclerotic stroke[51] and pancreatic cancer [52]. The CYP19A1 gene, lo-cated on 15q21.2, encodes a key enzyme for oestrogenbiosynthesis. SNPs in CYP19A1 might affect aromataseactivity and influence oestradiol levels, thereby impact-ing human health. Previous research has reported corre-lations with SNPs of CYP19 and disease, such aspolycystic ovarian syndrome [53], coronary heart disease[54], and coronary artery disease (CAD). The ALDH2gene, located on 12q24.12, encodes aldehyde dehydro-genase, the second enzyme of the major oxidative path-way of alcohol metabolism. Rs671 is nonsynonymousmutation site on exon 12. The rs671 mutation was foundto be associated with several traits (BMI, osteocalcin,renal function-related traits [55], response to alcoholconsumption [56, 57], triglyceride [17], haematologicaland biochemical traits [58], intracranial aneurysm [59],
mean corpuscular haemoglobin [17]). Using ALDH2 asan example to preliminarily explore its biological func-tion, the in vitro function testing of rs671 played a rolein the proliferation and osteogenic and adipogenic differ-entiation of 3 T3-L1 preadipocytes.With the emergence of GWAS, a large number of loci
and disease-related information were elucidated. How-ever, due to its strict restriction on the P value of correl-ation analysis, a great deal of potential information waslost while significant loci were obtained. Some loci didnot achieve a P cut-off value but itself, but if these lociwere located in a short range or were involved in similarfunctions, these lower p value loci may also affect bio-logical function [60]. Furthermore, it was challenging toidentify common pathways and biological functionalitycore regulatory networks across loci. During more effi-cient analysis of these lower p value loci functions, morecomplex models emerged. Raychaudhuri designedGRAIL to set a lower threshold in considering related-ness for those genes in narrow regions. They systematic-ally examined 370 SNPs from 179 independent loci withP < 1 × 10− 3, and three gene regions in CD28, PRDM1and CD2/CD58 were identified that were closely relatedto rheumatoid arthritis [61]. To assess new asthma riskloci, Demenais interrogated the GWAS catalogue usingset P value thresholds from 5 × 10− 8 to 10− 3, and per-formed a meta-analysis on genetic variation and bloodindexes and environmental exposure histories [62]. Kos-tem performed a follow-up analysis of SNPs associatedwith disease by setting a lower cut-off value and thenanalysed the particular values of the tag SNP statistic,pairwise correlation, and the effect size of the candidateSNP [63].Because there are no mature methods of research on
the genetic relationship between traits at the level ofgenome-wide summary statistics, we set a lower thresh-old value for obtaining more SNPs for analysis, and thenanalysed the association of these candidate SNPs bythree different methods: Pearson correlation coefficient,LDSC or Jaccard correlation. As we show, even withthree different calculation methods, most of the top im-portant traits are similar. Of these, IgA, IgG, HCY, AFP,IgE and B12 were the first top factors in the network.Our research is an experimental attempt to assess thenetwork of shared genetics and 29 biochemical indices.
ConclusionWe investigated the correlations among 29 biochemicalindices through three biological information methods.First, we found that IgA, IgG, IgE, IgM, HCY, AFP andB12 were in the central community of 29 biochemicalindices. Second, the shared genetics analysis showed that29 SNPs (P < 10− 4) were associated with more than 3traits. Thirty-one SNPs were associated with several
Hu et al. BMC Genomics (2019) 20:983 Page 8 of 12
diseases (P < 10− 8) by integrating the SNPs related with2 or more traits with the GWAS catalogue. Third, usingALDH2 as an example to preliminarily explore its bio-logical function, we found that the rs671 (ALDH2) poly-morphism could affect the osteogenic and adipogenicdifferentiation of 3 T3-L1 preadipocytes. We clarifiedthat 29 biochemical indices were from a network andthat hub variations/genes played a vital role in biologicalprocesses. These findings highlight a network of sharedgenetics and 29 biochemical indices.
MethodsStudy samplesOur study included 2012 unrelated healthy Chinese menaged 20–69 years from the FAMHES [14, 15], which wasconducted among non-institutionalized Chinese men inGuangxi and was designed to investigate the effects ofenvironmental and genetic factors and their interactionwith the development of age-related chronic diseases.Men aged ≥18 years were requested to participate in thestudy upon large-scale physical examination at the Med-ical Center of Fangchenggang First People’s Hospitalfrom September 2009 to December 2009. The includedparticipants all self-reported that they were free ofhyperthyroidism, diabetes mellitus, stroke, coronaryheart disease, rheumatoid arthritis, impaired hepatic orrenal function, and tumours. Our study research proto-col was approved by the Guangxi Medical UniversityEthics Committee. All participants provided written in-formed consent prior to participation in this study.
Measurements of 29 biochemical indicesOvernight (≥8 h) fasting venous blood specimens were ob-tained between 7:00 am and 10:00 am, and serum sampleswere extracted and stored at − 80 °C. Triglyceride, choles-terol, HDL-C, LDL-C, glucose, ALT, BUN, uric acid andcreatinine were measured enzymatically on a Dimension-RxL Chemistry Analyzer (Dade Behring, Newark, DE) inthe Department of Clinical Laboratory Science at theFangchenggang First People’s Hospital. CRP, C3, C4, IgA,IgE, IgG, IgM, and ASO were measured with immunotur-bidimetric methods on a HITACHI 7600 BiochemistryAnalyzer (Hitachi Corp, Tokyo, Japan). Ferritin, folate andvitamin B12, TE, oestradiol, FSH, SHBG, insulin, AFP andOSTEOC were measured with the same batch of reagentsby electrochemiluminescence immunoassay and HCYassayed by enzyme cycle method using a COBAS 6000system E601 (Elecsys module) Immunoassay Analyzer(Roche Diagnostics, GmbH, Mannheim, Germany).
SNP genotyping and quality control (QC) analysisGenome-wide SNP genotyping was performed with anIllumina Omni 1M chip (Illumina, San Diego, USA).Among 2012 genotyped subjects, 1999 passed the QC
call rate of 95% and were included in the final data ana-lysis. A total of 709,211 SNPs in these subjects passedthe QC criteria as follows: the P value for the Hardy-Weinberg equilibrium (HWE) test was greater than 1 ×10− 3, the minor allele frequency (MAF) was greater than0.01, and the genotype call rate was greater than 95%.The inferred genotypes of SNPs in the genome that werenot directly genotyped were computed by the IMPUTEprogram [64] (e.g., SNPs catalogued in HapMap Phase IICHB population release #24). All genotypes with a pos-terior probability of > 90% based on IMPUTE softwareimputation were retained.
Jaccard coefficientPhenotypes are linked if they share alterations in genet-ics. The pathobiology of human diseases might beunderstood by creating molecular and phenotypic net-works [65, 66]. We used the SNP function [18] (https://snpinfo.niehs.nih.gov/) tool to identify the genes con-taining all of the SNPs for which the P value for theGWAS was less than 1 × 10− 3. The human interactomewas obtained by combining protein-protein interaction(PPI) information from the BioGRID database [19].We built correlations among 29 clinical phenomes
based on the common genes/proteins between twotraits. To minimize the bias in estimating the correlationbetween two given traits, we calculated the molecularcomorbidity index (MCI) by adapting the formula fromGrosdidier S [67] to further consider the different coeffi-cients of distance between the two diseases. The MCIwas defined as follows:
MCItrait1;trait2 ¼ ð proteinstrait1∩proteinstrait2ð Þ∪proteinstrait1→trait2
∪proteinstrait2→trait1Þ= proteinstrait1∪proteinstrait2ð Þ
Where proteinstrait1 and proteinstrait2 are the proteins re-lated to clinical traits 1 and 2, respectively. proteinstrait1→trait2 are those proteins related to trait 1 that interact withthe proteins associated with trait 2 (and vice versa protein-strait2→ trait1). The two operators ∩ and ∪ denote the inter-section and union between the two sets of elements(proteinstrait1 and proteinstrait2, respectively).
Correlation analysis by LDSCThe genetic correlations derived from the summarystatistics were evaluated by the GWAS effect size fora given SNP and integrated the effects of all SNPsthat were in linkage disequilibrium (LD) with thatSNP. The LDSC (which targets genetic correlation)uses variants across the whole genome and is a sym-metrical (i.e., nondirectional) analysis for the risk fac-tor and the outcomes [21]. In short, LDSC assumesthat, for polygenic traits, SNPs will also capture infor-mation about SNPs near the LD. This relationship
Hu et al. BMC Genomics (2019) 20:983 Page 9 of 12
between the LD and the associated signal can also beused to test the relationship between the two traitsfor all SNPs in the genome. To further elucidate thecorrelations of these 29 biochemical indices inFAMHES from the genetic architecture, we appliedLDSC to estimate the correlation of these 29 traits.
Osteogenic and adipogenic differentiation of 3 T3-L1preadipocytesFull-length ALDH2-WT and ALDH2-G504 L-mut cDNAwere cloned into the pTSBOE-CMV-MSC-3flag-EF1-tRFP-F2A-Puro lentivirus vector (Quanyang, Shanghai).The 3 T3-L1 preadipocytes were cultured in Dulbecco’smodified Eagle’s medium (DMEM) with 10% foetal bovineserum (FBS) at 37 °C in a humidified atmosphere with 5%CO2. The osteoblast-inducing medium used was α-MEM(α-minimum Eagle’s medium) containing 10% FBS (foetalbovine serum), 100 nM dexamethasone, 5mM β-phosphoglyceride and 5 μg/mL vitamin C. Theadipogenesis-inducing medium included A and Bmedium. The A medium was DMEM containing 10%FBS, 100 nM dexamethasone, 0.5 mM 3-isobutyl-1-meth-ylxanthine and 5 μg/mL insulin. The B medium wasDMEM containing 10% FBS and 5 μg/mL insulin. For adi-pocyte induction, cells were cultured for two cycles of Amedium for 2 days and then B medium for 1 day. Cell pro-liferation was measured by a CCK-8 assay according tothe manufacturer’s instructions (DOJINDO, Japan). Cellapoptosis was examined by Annexin V-APC/7-AADstaining followed by flow cytometry detection. For Oil RedO or Alizarin Red S staining, cells were fixed with 4%paraformaldehyde for 30min and stained with 4% Oil RedO solution or 0.4% Alizarin Red S. Lipid droplets and cal-cium nodules were quantified using ImageJ software. Cel-lular RNA was extracted using an RNA extraction kit(Promega, China). Reverse transcription was performedwith the Transcriptor Reverse Transcriptase Kit (Kangwei,China). Quantitative reverse transcriptase-PCR was per-formed using a Roche Light Cycler 480 and KANGWEIqPCR Kit (KANGWEI, China). Per-primer sequences arelisted in Additional file 10: Table S6.
Statistical analysisThe correlations among the 29 biochemical indiceswere computed by the CORR procedure using SAS9.0 and defined as the Pearson correlation coefficientbetween the rank variables. With the exception ofBUN, HCY, B12, FERR, OSTEOC, creatinine, uricacid, cholesterol, HDL, LDL, TE and C3, 17 traitswithout normal distribution were logarithmicallytransformed to normalize the distribution. The asso-ciation of the SNPs with 29 clinical quantitativetraits was evaluated using a linear regression ad-justed for population stratification factors (PC1 and
PC2) and age. Population stratification was evaluatedby a principal component approach with EIGEN-STRAT software [68].
Availability of data and materialsThe datasets generated and analysed during the currentstudy are available in the Genome variation Map (GVM)of National Genomics Data Center (NGDC) (AccessionNumber: GVM000052).
Supplementary informationSupplementary information accompanies this paper at https://doi.org/10.1186/s12864-019-6363-0.
Additional file 1: Fig. S1. The cluster dendrogram for the 29biochemical indices from the FAMHES cohort created with the hclust winR package. In this analysis, two main clusters were produced amongthese 29 traits. FERR (ferritin), CRP (C-reactive protein), C3 (complement3), C4 (complement 4), AFP (serum alpha-fetoprotein), TG (triglycerides),LDL (low density lipoprotein), ALT (alanine transaminase), BMI (body massindex), ASO (anti streptolysin) (anti-streptolysin “O”), IgG (immunoglobulinG), IgA (immunoglobulin A), IgM (immunoglobulin M), BUN (blood ureanitrogen), FSH (follicle-stimulating hormone), HDL (high-density lipopro-tein), TE (testosterone), SHBG (sex hormone binding globulin), IgE (im-munoglobulin E), B12 (vitamin B12), HCY (homocysteine).
Additional file 2: Fig. S2. Network characteristics of 5313 associatedgenes for 29 biochemical indices in individuals from the FAMHES cohortwere analysed by Cytoscape. (A) Topological coefficient, (B) degree, (C)clustering coefficient, and (D) closeness centrality.
Additional file 3: Fig. S3. The integration of correlated traits from threemethods. (A) Venn diagram of the integration of correlated traits fromthree methods. (B) The related traits were integrated if they fulfilled thefollowing conditions: the Pearson coefficient was greater than 0.3, the Pvalue was less than 0.01, the Jaccard coefficient was greater than 0.6, orthe LDSC p value was less than 0.05. Each testing method was denotedby a specific colour: green for Jaccard, and blue for LDSC.
Additional file 4: Fig. S4. A lentiviral vector was used to overexpressALDH2-WT or ALDH2-G504 L-mut in 3 T3-L1 preadipocytes. (A)Localization of the Glu504Lys substitution mutation in ALDH2. Ex: exon.(B) The plasmid used to express the ALDH2-Gluc504Lys mutant protein in3 T3-L1, ALDH2-WT was expressed using the same plasmid backbone. (C)Sequencing analysis of the ALDH2 gene exogenously expressed in 3 T3-L1 cells infected with ALDH2-WT (top) or ALDH2-G504 L-mut (bottom).(D) Expression of the transfected ALDH2 protein in 3 T3-L1 cells was indir-ectly assessed by the detection of RFP expression from the lentiviral vec-tor. An RFP signal was detected by fluorescence microscopy at 48 h afterinfection in both 3 T3-L1 cells infected with ALDH2-WT and ALDH2-G504L-mut. RFP control means 3 T3-L1 cells infected with plasmid backbone.
Additional file 5: Table S1. Information on the 27 clinical quantitativetraits from 1999 populations.
Additional file 6: Table S2. Genetic correlation estimates, standarderrors and P values for selected pairs of traits.
Additional file 7: Table S3. The information on essential genescorrelated with more than 3 traits.
Additional file 8: Table S4. Twenty-nine SNPs (P < 1 × 10− 4) related tomore than 3 traits were annotated in the HaploReg database.
Additional file 9: Table S5. The annotation of 31 (P < 1 × 10− 4) SNPswas associated with more than 1 trait.
Additional file 10: Table S6. The primer sequences of osteogenic andadipogenic differentiation in 3 T3-L1 cells.
AbbreviationsAFP: Alpha-fetoprotein; ALDH2: Aldehyde dehydrogenase 2 family member;ALT: Alanine transaminase; ASO: Anti-streptococcus haemolysin “O”;
Hu et al. BMC Genomics (2019) 20:983 Page 10 of 12

BUN: Blood urea nitrogen; C3: Complement 3; C4: Complement 4; CRP: C-Reactive protein; FAMHES: The Fangchenggang Area Male Health andExamination cohort; Fas: Fatty acids; FOL: Folate; FRRR: Ferritin; FSH: Follicle-stimulating hormone; GWAS: Genome-wide association studies;HCY: Homocysteine; HDL-C: High-density lipoprotein cholesterol;IgA: Immunoglobulin A; IgE: Immunoglobulin E; IgG: Immunoglobulin G;IgM: Immunoglobulin M; LDL-C: Low-density lipoprotein cholesterol;LDSC: Linkage disequilibrium score regression; MetS: Metabolic syndrome;OSTEOC: Osteocalcin; SNPs: Single nucleotide polymorphism;TE: Testosterone; TG: Triglyceride; UA: Uric acid
AcknowledgementsNot applicable.
Authors’ contributionsYH, YJ, ZM conceived and designed the experiments. AT, HZ, XY, YG, TL, ZMperformed the epidemiologic study. YJ performed the cell biologyexperiment. LYu, CH, HK, QWu, JS, QZ, YZ, CZ, WW, LL, WL, YH, HH, XX, andTL performed the bioinformatics analysis experiments. YH and YJ wrote themanuscript. All authors read and approved the final manuscript.
FundingThis work was supported by the National Natural Science Foundation ofChina (No. 81770759, 81472414, 81560608 and 81460388), the GuangxiNatural Science Foundation (No. 2015GXNSFBB139008), the Guangxi MedicalUniversity Training Program for Distinguished Young Scholars, the YouthScience Foundation of Guangxi Medical University (No. GXMUYSF201603)and the Guangxi Colleges and Universities Key Laboratory of BiologicalMolecular Medicine Research Foundation (No. GXBMR201603). The fundingbodies played no role in the design of the study and collection, analysis, andinterpretation of data and in writing the manuscript.
Availability of data and materialsAll data generated or analysed during this study are included in thispublished article [and its supplementary information files].
Ethics approval and consent to participateThe study was approved by the Ethical Committee of Guangxi MedicalUniversity.
Consent for publicationNot applicable.
Competing interestsThe authors declare that they have no competing interests.
Author details1Center for Genomic and Personalized Medicine, Guangxi Medical University,Nanning 530021, Guangxi, China. 2Life Sciences Institute, Guangxi MedicalUniversity, Nanning 530021, Guangxi, China. 3Department of chemotherapy,The Affiliated Tumor Hospital of Guangxi Medical University, Nanning530021, Guangxi, China. 4Department of Information and Management,Guangxi Medical University, Nanning 530021, Guangxi, China. 5Departmentof Biochemistry and Molecular Biology, School of Pre-Clinical Medicine,Guangxi Medical University, Nanning 530021, Guangxi, China.
Received: 7 July 2019 Accepted: 2 December 2019
References1. Falconer DS. MTF: Introduction to quantitative geneticsics (4th edn). Trends
Genet. 1996;2. https://doi.org/10.1016/0168-9525(96)81458-2.2. Oti M, Huynen MA, Brunner HG. Phenome connections. Trends Genet. 2008;
24(3):103–6.3. Houle D, Govindaraju DR, Omholt S. Phenomics: the next challenge. Nat Rev
Genet. 2010;11(12):855–66.4. Cai T, Zhang Y, Ho YL, Link N, Sun J, Huang J, Cai TA, Damrauer S, Ahuja Y,
Honerlaw J, et al. Association of Interleukin 6 receptor variant withcardiovascular disease effects of interleukin 6 receptor blocking therapy: aPhenome-wide association study. JAMA Cardiol. 2018;3(9):849–57.
5. Emilsson V, Thorleifsson G, Zhang B, Leonardson AS, Zink F, Zhu J, Carlson S,Helgason A, Walters GB, Gunnarsdottir S, et al. Genetics of gene expressionand its effect on disease. Nature. 2008;452(7186):423–8.
6. Korte A, Vilhjalmsson BJ, Segura V, Platt A, Long Q, Nordborg M. A mixed-model approach for genome-wide association studies of correlated traits instructured populations. Nat Genet. 2012;44(9):1066–71.
7. Visscher PM, Yang J. A plethora of pleiotropy across complex traits. NatGenet. 2016;48(7):707–8.
8. Pickrell JK, Berisa T, Liu JZ, Segurel L, Tung JY, Hinds DA. Detection andinterpretation of shared genetic influences on 42 human traits. Nat Genet.2016;48(7):709–17.
9. Heid IM, Winkler TW. A multitrait GWAS sheds light on insulin resistance.Nat Genet. 2016;49(1):7–8.
10. Schweiger M, Romauch M, Schreiber R, Grabner GF, Hutter S, Kotzbeck P,Benedikt P, Eichmann TO, Yamada S, Knittelfelder O, et al. Pharmacologicalinhibition of adipose triglyceride lipase corrects high-fat diet-induced insulinresistance and hepatosteatosis in mice. Nat Commun. 2017;8:14859.
11. Goh KI, Cusick ME, Valle D, Childs B, Vidal M, Barabasi AL. The humandisease network. Proc Natl Acad Sci U S A. 2007;104(21):8685–90.
12. Lauc G, Huffman JE, Pucic M, Zgaga L, Adamczyk B, Muzinic A, NovokmetM, Polasek O, Gornik O, Kristic J, et al. Loci associated with N-glycosylationof human immunoglobulin G show pleiotropy with autoimmune diseasesand haematological cancers. PLoS Genet. 2013;9(1):e1003225.
13. Liu Z, Tang Q, Wen J, Tang Y, Huang D, Huang Y, Xie J, Luo Y, Liang M, WuC, et al. Elevated serum complement factors 3 and 4 are stronginflammatory markers of the metabolic syndrome development: alongitudinal cohort study. Sci Rep. 2016;6:18713.
14. Tan A, Gao Y, Yang X, Zhang H, Qin X, Mo L, Peng T, Xia N, Mo Z. Low serumosteocalcin level is a potential marker for metabolic syndrome: results from aChinese male population survey. Metabolism. 2011;60(8):1186–92.
15. Liang Y, Tan A, Liang D, Yang X, Liao M, Gao Y, Jiang Y, Yao Z, Lin X, Lu Z,et al. Low osteocalcin level is a risk factor for impaired glucose metabolismin a Chinese male population. J Diabetes Investig. 2016;7(4):522–8.
16. Chen D, Zhang H, Gao Y, Lu Z, Yao Z, Jiang Y, Lin X, Wu C, Yang X, Tan A,et al. Cross-sectional and longitudinal associations between serum uric acidand metabolic syndrome: results from Fangchenggang area male healthand examination survey in China. Clin Chim Acta. 2015;446:226–30.
17. Tan A, Sun J, Xia N, Qin X, Hu Y, Zhang S, Tao S, Gao Y, Yang X, Zhang H, et al.A genome-wide association and gene-environment interaction study forserum triglycerides levels in a healthy Chinese male population. Hum MolGenet. 2012;21(7):1658–64.
18. Xu Z, Taylor JA. SNPinfo: integrating GWAS and candidate gene informationinto functional SNP selection for genetic association studies. Nucleic AcidsRes. 2009;37(Web Server issue):W600–5.
19. Chatr-Aryamontri A, Breitkreutz BJ, Oughtred R, Boucher L, Heinicke S, ChenD, Stark C, Breitkreutz A, Kolas N, O'Donnell L, et al. The BioGRID interactiondatabase: 2015 update. Nucleic Acids Res. 2015;43(Database issue):D470–8.
20. Lotia S, Montojo J, Dong Y, Bader GD, Pico AR. Cytoscape app store.Bioinformatics. 2013;29(10):1350–1.
21. Bulik-Sullivan B, Finucane HK, Anttila V, Gusev A, Day FR, Loh PR, ReproGen C,Psychiatric Genomics C, Genetic Consortium for Anorexia Nervosa of theWellcome Trust Case Control C, Duncan L, et al. An atlas of geneticcorrelations across human diseases and traits. Nat Genet. 2015;47(11):1236–41.
22. Ward LD, Kellis M. HaploReg: a resource for exploring chromatin states,conservation, and regulatory motif alterations within sets of geneticallylinked variants. Nucleic Acids Res. 2012;40(Database issue):D930–4.
23. Welter D, MacArthur J, Morales J, Burdett T, Hall P, Junkins H, Klemm A,Flicek P, Manolio T, Hindorff L, et al. The NHGRI GWAS catalog, a curatedresource of SNP-trait associations. Nucleic Acids Res. 2014;42(Databaseissue):D1001–6.
24. Imatoh T, Yengo L, Rocheleau G, Kamimura S, Maeda S, Miyazaki M, FroguelP. ALDH2 polymorphism rs671, but not ADH1B polymorphism rs1229984,increases risk for hypo-HDL-Cholesterolemia in a/a carriers compared to theG/G carriers. Lipids. 2018;53(8):797–807.
25. Hoshi H, Hao W, Fujita Y, Funayama A, Miyauchi Y, Hashimoto K, Miyamoto K,Iwasaki R, Sato Y, Kobayashi T, et al. Aldehyde-stress resulting from Aldh2mutation promotes osteoporosis due to impaired osteoblastogenesis. J BoneMiner Res. 2012;27(9):2015–23.
26. Sivakumaran S, Agakov F, Theodoratou E, Prendergast JG, Zgaga L, ManolioT, Rudan I, McKeigue P, Wilson JF, Campbell H. Abundant pleiotropy inhuman complex diseases and traits. Am J Hum Genet. 2011;89(5):607–18.
Hu et al. BMC Genomics (2019) 20:983 Page 11 of 12
27. Chesmore K, Bartlett J, Williams SM. The ubiquity of pleiotropy in humandisease. Hum Genet. 2018;137(1):39–44.
28. Solovieff N, Cotsapas C, Lee PH, Purcell SM, Smoller JW. Pleiotropy incomplex traits: challenges and strategies. Nat Rev Genet. 2013;14(7):483–95.
29. Z L, Y Q, JC S. Functionally, structurally, and evolutionarily distinct set of genes linkedto phenome wide variation in maize. bioRxiv preprint first posted online; 2019.
30. Schaefer RJ, Michno JM, Jeffers J, Hoekenga O, Dilkes B, Baxter I, Myers CL.Integrating Coexpression networks with GWAS to prioritize causal genes inmaize. Plant Cell. 2018;30(12):2922–42.
31. Pitchers W, Nye J, Marquez EJ, Kowalski A, Dworkin I, Houle D. Amultivariate genome-wide association study of wing shape in Drosophilamelanogaster. Genetics. 2019;211(4):1429–47.
32. Ganguly P, Alam SF. Role of homocysteine in the development ofcardiovascular disease. Nutr J. 2015;14:6.
33. Gao YH, Wu ZX, Xie LQ, Li CX, Mao YQ, Duan YT, Han B, Han SF, Yu Y,Lu HJ, et al. VHL deficiency augments anthracycline sensitivity of clearcell renal cell carcinomas by down-regulating ALDH2. Nat Commun.2017;8:15337.
34. Berenson AB, Rahman M. Effect of hormonal contraceptives on vitamin B12level and the association of the latter with bone mineral density.Contraception. 2012;86(5):481–7.
35. Bala KA, Dogan M, Kaba S, Mutluer T, Aslan O, Dogan SZ. Hormone disorder andvitamin deficiency in attention deficit hyperactivity disorder (ADHD) and autismspectrum disorders (ASDs). J Pediatr Endocrinol Metab. 2016;29(9):1077–82.
36. Mohan IK, Khan SA, Jacob R, Sushma Chander N, Hussain T, Alrokayan SA,Radha Rama Devi A, Naushad SM. Application of adaptive neuro-fuzzyinference systems (ANFIS) to delineate estradiol, glutathione andhomocysteine interactions. Clin Nutr ESPEN. 2017;20:41–6.
37. Wu C, Kraft P, Zhai K, Chang J, Wang Z, Li Y, Hu Z, He Z, Jia W, Abnet CC,et al. Genome-wide association analyses of esophageal squamous cellcarcinoma in Chinese identify multiple susceptibility loci and gene-environment interactions. Nat Genet. 2012;44(10):1090–7.
38. Zhong W, Zhang W, Li Q, Xie G, Sun Q, Sun X, Tan X, Sun X, Jia W, Zhou Z.Pharmacological activation of aldehyde dehydrogenase 2 by Alda-1 reversesalcohol-induced hepatic steatosis and cell death in mice. J Hepatol. 2015;62(6):1375–81.
39. Millwood IY, Walters RG, Mei XW, Guo Y, Yang L, Bian Z, Bennett DA, ChenY, Dong C, Hu R, et al. Conventional and genetic evidence on alcohol andvascular disease aetiology: a prospective study of 500 000 men and womenin China. Lancet. 2019;393(10183):1831–42.
40. Asada M, Ohmi K, Delia D, Enosawa S, Suzuki S, Yuo A, Suzuki H, Mizutani S.Brap2 functions as a cytoplasmic retention protein for p21 duringmonocyte differentiation. Mol Cell Biol. 2004;24(18):8236–43.
41. Ozaki K, Sato H, Inoue K, Tsunoda T, Sakata Y, Mizuno H, Lin TH, MiyamotoY, Aoki A, Onouchi Y, et al. SNPs in BRAP associated with risk of myocardialinfarction in Asian populations. Nat Genet. 2009;41(3):329–33.
42. Avery CL, He Q, North KE, Ambite JL, Boerwinkle E, Fornage M, Hindorff LA,Kooperberg C, Meigs JB, Pankow JS, et al. A phenomics-based strategyidentifies loci on APOC1, BRAP, and PLCG1 associated with metabolicsyndrome phenotype domains. PLoS Genet. 2011;7(10):e1002322.
43. Escudero-Esparza A, Kalchishkova N, Kurbasic E, Jiang WG, Blom AM.The novel complement inhibitor human CUB and sushi multipledomains 1 (CSMD1) protein promotes factor I-mediated degradation ofC4b and C3b and inhibits the membrane attack complex assembly.FASEB J. 2013;27(12):5083–93.
44. Patel M. Parkinson disease: CSMD1 gene mutations can lead to familialParkinson disease. Nat Rev Neurol. 2017;13(11):641.
45. Nicolae DL, Gamazon E, Zhang W, Duan S, Dolan ME, Cox NJ. Trait-associated SNPs are more likely to be eQTLs: annotation to enhancediscovery from GWAS. PLoS Genet. 2010;6(4):e1000888.
46. Mifsud B, Tavares-Cadete F, Young AN, Sugar R, Schoenfelder S, Ferreira L,Wingett SW, Andrews S, Grey W, Ewels PA, et al. Mapping long-rangepromoter contacts in human cells with high-resolution capture hi-C. NatGenet. 2015;47(6):598–606.
47. Brainstorm C, Anttila V, Bulik-Sullivan B, Finucane HK, Walters RK, Bras J,Duncan L, Escott-Price V, Falcone GJ, Gormley P, et al. Analysis of sharedheritability in common disorders of the brain. Science. 2018;360(6395).https://doi.org/10.1126/science.aap8757.
48. Zhao H, Yang Y, Lu Y, Mort M, Cooper DN, Zuo Z, Zhou Y. Quantitativemapping of genetic similarity in human heritable diseases by sharedmutations. Hum Mutat. 2018;39(2):292–301.
49. Yamamoto F, Clausen H, White T, Marken J, Hakomori S. Molecular geneticbasis of the histo-blood group ABO system. Nature. 1990;345(6272):229–33.
50. Ling X, Zheng Y, Tao J, Zheng Z, Chen L. Association study ofpolymorphisms in the ABO gene with ischemic stroke in the Chinesepopulation. BMC Neurol. 2016;16(1):146.
51. Zhang H, Zhang Z, Zhang J, Xu L, Ye Z, Hao Y, Cai B, Zhou S, Liu K, Sun L,et al. Fine-mapping of ABO gene identifies two novel SNPs associated withlarge artery atherosclerotic stroke in a Chinese Han population. MolNeurobiol. 2017;54(3):2107–13.
52. Nakao M, Matsuo K, Hosono S, Ogata S, Ito H, Watanabe M, Mizuno N, IidaS, Sato S, Yatabe Y, et al. ABO blood group alleles and the risk of pancreaticcancer in a Japanese population. Cancer Sci. 2011;102(5):1076–80.
53. Wang H, Li Q, Wang T, Yang G, Wang Y, Zhang X, Sang Q, Wang H, Zhao X,Xing Q, et al. A common polymorphism in the human aromatase genealters the risk for polycystic ovary syndrome and modifies aromatase activityin vitro. Mol Hum Reprod. 2011;17(6):386–91.
54. Wang B, Fu ZY, Ma YT, Huang D, Liu F, Dong CL, Wang T, Meng YJ. Identificationof a CYP19 gene single-nucleotide polymorphism associated with a reduced riskof coronary heart disease. Genet Test Mol Biomarkers. 2016;20(1):2–10.
55. Okada Y, Sim X, Go MJ, Wu JY, Gu D, Takeuchi F, Takahashi A, Maeda S,Tsunoda T, Chen P, et al. Meta-analysis identifies multiple loci associatedwith kidney function-related traits in east Asian populations. Nat Genet.2012;44(8):904–9.
56. Quillen EE, Chen XD, Almasy L, Yang F, He H, Li X, Wang XY, Liu TQ, Hao W,Deng HW, et al. ALDH2 is associated to alcohol dependence and is themajor genetic determinant of "daily maximum drinks" in a GWAS study ofan isolated rural Chinese sample. Am J Med Genet B Neuropsychiatr Genet.2014;165B(2):103–10.
57. Takeuchi F, Isono M, Nabika T, Katsuya T, Sugiyama T, Yamaguchi S,Kobayashi S, Ogihara T, Yamori Y, Fujioka A, et al. Confirmation of ALDH2 asa major locus of drinking behavior and of its variants regulating multiplemetabolic phenotypes in a Japanese population. Circ J. 2011;75(4):911–8.
58. Kamatani Y, Matsuda K, Okada Y, Kubo M, Hosono N, Daigo Y, Nakamura Y,Kamatani N. Genome-wide association study of hematological andbiochemical traits in a Japanese population. Nat Genet. 2010;42(3):210–5.
59. Low SK, Takahashi A, Cha PC, Zembutsu H, Kamatani N, Kubo M, NakamuraY. Genome-wide association study for intracranial aneurysm in the Japanesepopulation identifies three candidate susceptible loci and a functionalgenetic variant at EDNRA. Hum Mol Genet. 2012;21(9):2102–10.
60. Raychaudhuri S, Plenge RM, Rossin EJ, Ng AC, International Schizophrenia C,Purcell SM, Sklar P, Scolnick EM, Xavier RJ, Altshuler D, et al. Identifyingrelationships among genomic disease regions: predicting genes at pathogenicSNP associations and rare deletions. PLoS Genet. 2009;5(6):e1000534.
61. Raychaudhuri S, Thomson BP, Remmers EF, Eyre S, Hinks A, Guiducci C,Catanese JJ, Xie G, Stahl EA, Chen R, et al. Genetic variants at CD28, PRDM1and CD2/CD58 are associated with rheumatoid arthritis risk. Nat Genet.2009;41(12):1313–8.
62. Demenais F, Margaritte-Jeannin P, Barnes KC, Cookson WOC, Altmuller J,Ang W, Barr RG, Beaty TH, Becker AB, Beilby J, et al. Multiancestryassociation study identifies new asthma risk loci that colocalize withimmune-cell enhancer marks. Nat Genet. 2018;50(1):42–53.
63. Kostem E, Lozano JA, Eskin E. Increasing power of genome-wide associationstudies by collecting additional single-nucleotide polymorphisms. Genetics.2011;188(2):449–60.
64. Marchini J, Howie B, Myers S, McVean G, Donnelly P. A new multipointmethod for genome-wide association studies by imputation of genotypes.Nat Genet. 2007;39(7):906–13.
65. Barabasi AL, Gulbahce N, Loscalzo J. Network medicine: a network-basedapproach to human disease. Nat Rev Genet. 2011;12(1):56–68.
66. Faner R, Agusti A. Network analysis: a way forward for understanding COPDmultimorbidity. Eur Respir J. 2015;46(3):591–2.
67. Grosdidier S, Ferrer A, Faner R, Pinero J, Roca J, Cosio B, Agusti A, Gea J,Sanz F, Furlong LI. Network medicine analysis of COPD multimorbidities.Respir Res. 2014;15:111.
68. Price AL, Patterson NJ, Plenge RM, Weinblatt ME, Shadick NA, Reich D.Principal components analysis corrects for stratification in genome-wideassociation studies. Nat Genet. 2006;38(8):904–9.
Publisher’s NoteSpringer Nature remains neutral with regard to jurisdictional claims inpublished maps and institutional affiliations.
Hu et al. BMC Genomics (2019) 20:983 Page 12 of 12
Related Documents


![BMC Genomics 16 - QUTeprints.qut.edu.au/90950/1/s12864-015-2235-4.pdf · 2020-05-25 · splice sites at the exon usage level [3] or at the RNA se-quence level [4], but to our knowledge,](https://static.cupdf.com/doc/110x72/5f9a75ad95ef317b29222fbb/bmc-genomics-16-2020-05-25-splice-sites-at-the-exon-usage-level-3-or-at-the.jpg)


