1 RYANAIR REPORTS Q3 LOSS OF €35M IN LINE WITH GUIDANCE, TRAFFIC GROWS 6% TO 18M - FARES & UNIT COSTS FALL 9%, FULL YEAR PROFIT GUIDANCE OF €510M UNCHANGED Ryanair, Europe’s favourite low fares airline today (Feb 3) reported a Q3 Loss of €35m, in line with previous guidance. Traffic grew 6% to 18m passengers. Revenue per passenger declined 6%, as strong ancillary revenue growth offset a 9% fall in fares. Excluding fuel, sector length adjusted unit costs fell by 9%. Ryanair’s full year profit guidance remains unchanged at approx. €510m. Q3 Results (IFRS) Dec 31, 2012 Dec 31, 2013 % Change Passengers(m) 17.3m 18.3m + 6% Revenue(m) €969m €964m 0% Profit/(Loss) after Tax(m) €18.1m (€35.2m) Basic EPS(euro cent) 1.25 (2.50) “Ryanair’s Michael O’Leary, said: “Our Q3 loss of €35m is in line with previous guidance and is entirely due to a 9% fall in ave fares and weaker sterling. We responded to this weaker pricing environment last September with seat promotions and lower fares which stimulated traffic across all markets resulting in 6% growth in Q3, and a 1% rise in monthly load factors. Ancillary revenues grew by 13%, significantly faster than traffic growth due to strong customer uptake of reserved seating, priority boarding, and higher credit card fees. Excluding fuel, Q3 sector length adjusted unit costs fell 9% as Ryanair continues to deliver industry leading cost control. New Routes and Bases Our new routes and bases are performing well this winter, albeit at weaker yields, as high fare competitors cut capacity and restructure. In December we opened 4 new Italian bases in Rome (Fiumicino), Catania, Lamezia, and Palermo in response to concerns about Altalia and its high fare domestic routes. We announced 4 new bases for spring 2014 at Brussels (Zaventem) which opens February 28, Athens and Thessaloniki (April 1) and Lisbon (April 2). Advance bookings on these new routes are well ahead of expectations, with customers welcoming Ryanair’s lower fare alternative. We expect these new bases to provide substantial growth opportunities for Ryanair, particularly as we commence deliveries in September 2014 of our new 175 Boeing 737-800 NG aircraft order. Over the next 5 years, as Ryanair grows from 80m to over 110m customers p.a., we expect a substantial portion of this growth will be at primary airports, where high fare incumbents are financially weak and restructuring, and the remainder arising at secondary airports driven by attractive low cost growth incentives.

Welcome message from author
This document is posted to help you gain knowledge. Please leave a comment to let me know what you think about it! Share it to your friends and learn new things together.
Transcript

1
RYANAIR REPORTS Q3 LOSS OF €35M IN LINE WITH GUIDANCE, TRAFFIC GROWS 6% TO 18M - FARES & UNIT COSTS FALL 9%,
FULL YEAR PROFIT GUIDANCE OF €510M UNCHANGED Ryanair, Europe’s favourite low fares airline today (Feb 3) reported a Q3 Loss of €35m, in line with previous guidance. Traffic grew 6% to 18m passengers. Revenue per passenger declined 6%, as strong ancillary revenue growth offset a 9% fall in fares. Excluding fuel, sector length adjusted unit costs fell by 9%. Ryanair’s full year profit guidance remains unchanged at approx. €510m.
Q3 Results (IFRS) Dec 31, 2012 Dec 31, 2013 % Change
Passengers(m) 17.3m 18.3m + 6%
Revenue(m) €969m €964m 0%
Profit/(Loss) after Tax(m) €18.1m (€35.2m)
Basic EPS(euro cent) 1.25 (2.50)
“Ryanair’s Michael O’Leary, said: “Our Q3 loss of €35m is in line with previous guidance and is entirely due to a 9% fall in ave fares and weaker sterling. We responded to this weaker pricing environment last September with seat promotions and lower fares which stimulated traffic across all markets resulting in 6% growth in Q3, and a 1% rise in monthly load factors. Ancillary revenues grew by 13%, significantly faster than traffic growth due to strong customer uptake of reserved seating, priority boarding, and higher credit card fees. Excluding fuel, Q3 sector length adjusted unit costs fell 9% as Ryanair continues to deliver industry leading cost control.
New Routes and Bases Our new routes and bases are performing well this winter, albeit at weaker yields, as high fare competitors cut capacity and restructure. In December we opened 4 new Italian bases in Rome (Fiumicino), Catania, Lamezia, and Palermo in response to concerns about Altalia and its high fare domestic routes. We announced 4 new bases for spring 2014 at Brussels (Zaventem) which opens February 28, Athens and Thessaloniki (April 1) and Lisbon (April 2). Advance bookings on these new routes are well ahead of expectations, with customers welcoming Ryanair’s lower fare alternative. We expect these new bases to provide substantial growth opportunities for Ryanair, particularly as we commence deliveries in September 2014 of our new 175 Boeing 737-800 NG aircraft order. Over the next 5 years, as Ryanair grows from 80m to over 110m customers p.a., we expect a substantial portion of this growth will be at primary airports, where high fare incumbents are financially weak and restructuring, and the remainder arising at secondary airports driven by attractive low cost growth incentives.

2
Customer Service In Q3 Ryanair announced a series of initiatives to further improve our industry leading customer service. In addition to the lowest fares, the most on-time flights, and the youngest fleet, our customers are now enjoying, (i) a simpler easier to use website, (ii) a free small second carry-on bag, (iii) “quiet flights” in early morning and late evening, (iv) a 24 hour “grace period” to correct minor booking errors, (v) significantly reduced boarding card and airport bag fees, and (vi) a new service to cater for group and business travel across our extensive network.
Last weekend Ryanair returned to allocated seats on all flights. Ryanair customers can now select their preferred seats which reduces queues and eliminates stress at boarding gates. Allocated seating enables customers to choose their preferred seats, be it aisle or window, front or back, up to 30 days prior to departure. Those passengers who don’t wish to pay a small €5 fee will have a seat allocated to them, at no charge, during the 7 days prior to departure. The uptake of reserved and allocated seats has grown significantly in the last weeks of January, and it now appears that sales of reserved/allocated seats will exceed the revenue loss from cutting airport and bag fees. This should enable Ryanair to deliver strong growth in ancillary revenues in FY15 during which we hope these customer service improvements will deliver stronger forward bookings and load factors. Digital & Distribution Strategy Ryanair is also implementing a total overhaul of our website and digital strategy. This roll out started in November with a new, easier to use website, which reduced the booking process from 17 to 5 “clicks”. In December we launched the “My Ryanair” customer registration service which allows passengers to securely store their personal and payment details and saves them time when making or managing their bookings and/or checking in online. We are investing heavily in IT and web development, and expect to deliver a new improved website by the end of April which will be much more intuitive for our customers, allowing them to readily identify our lowest fares, our routes, our timetables, as well as enabling them to share our low fares with friends and family. We are also on target to roll out mobile boarding passes in April, a new business travel product by the end of May, and an industry leading mobile app (tailored for smart phones and tablets) by the end of June 2014. In addition to these digital improvements, Ryanair is working to broaden our distribution base. We are proud to be the first low fares airline to partner with Google’s European “Flight Search” function, which is currently available in the UK, France, Germany, Italy, Holland and Spain (with more countries to follow). This partnership will enable millions of European consumers to access our 1,600 low fare routes and book Ryanair’s lower fares every time they search for “cheap fares”, or “low cost flights” on the Google “Flight Search” engine. We believe that Google’s “Flight Search” engine will become the transparent price comparison site of choice for all passengers in Europe. We are in active negotiations with a number of GDS suppliers, and hope, subject to the successful conclusion of these discussions and IT integration issues, that Ryanair’s low fares and comprehensive route network will appear in one or more GDS channels by mid-year. The combination of Ryanair’s low fares, extensive route network at primary and secondary airports and No 1 or No 2

3
market share in most of Europe’s major travel markets, will enable Ryanair to deliver a significant business travel platform, and allow Europe’s largest businesses save both time and money by flying Ryanair.
Fuel Ryanair is 90% hedged for FY14 at a cost of $980 per tonne (approx. $98 p.bl), we have taken advantage of recent oil prices and dollar weakness to extend our hedge position to 90% for FY15 at $960 per tonne (approx. $96 per barrel), which together with the benefit of our euro/ dollar hedging programme will deliver fuel cost savings of approx. €80m in 2015. Balance Sheet Our balance sheet is one of the strongest in the airline industry. By the end of Q3 Ryanair had completed another €414m of share buybacks, and announced a systematic share buyback programme of €70m to be completed by the end of March bringing the total of buybacks for FY’14 to €484m, significantly ahead of our original €400m target. We remain committed to returning a further €500m to shareholders via a mix of special dividend and some limited share buybacks by the end of FY’15. This will bring the total funds returned to Ryanair shareholders since FY’08 to over €2.5 billion. Full Year Guidance. Market pricing remains soft but is no longer declining. We reacted quickly to last autumn’s weakness with a range of lower fares, seat promotions, and recently increased advertising and marketing spend. As a result forward bookings in Q4 and into FY’15 are running significantly ahead of last year, albeit at weaker yields. We expect our strategy of lowering fares and increasing forward bookings will enable us to better manage close in bookings and yields as we move into summer 2014. Thanks also to the earlier launch of new bases in Italy and Brussels (Zaventem), and rising load factors we expect FY’14 traffic to rise to 81.5m, slightly higher than previously guided. Advance bookings for Q1 FY’15 are significantly higher than this year’s comparable, even allowing for the impact of Easter. Based on current visibility, we expect Q4 yields to decline by approx. 8%, slightly better than the 10% decline previously guided. As full year traffic will be slightly stronger, and our focus on cost control delivers a 4% fall in Q4 (ex-fuel) unit costs, we are now confident that the full year net profit outturn will finish in the range of €500m to €520m as previously guided.
ENDS.
For further information Howard Millar Joe Carmody please contact: Ryanair Holdings plc Edelman www.ryanair.com Tel: 353-1-9451212 Tel: 353-1-6789333

4
Certain of the information included in this release is forward looking and is subject to important risks and uncertainties that could cause actual results to differ materially. It is not reasonably possible to itemise all of the many factors and specific events that could affect the outlook and results of an airline operating in the European economy. Among the factors that are subject to change and could significantly impact Ryanair’s expected results are the airline pricing environment, fuel costs, competition from new and existing carriers, market prices for the replacement aircraft, costs associated with environmental, safety and security measures, actions of the Irish, U.K., European Union (“EU”) and other governments and their respective regulatory agencies, weather related disruptions, fluctuations in currency exchange rates and interest rates, airport access and charges, labour relations, the economic environment of the airline industry, the general economic environment in Ireland, the UK and Continental Europe, the general willingness of passengers to travel and other economics, social and political factors.
Ryanair is Europe’s favourite low fares airline, operating more than 1,600 daily flights (over 500,000 per year) from 65 bases, across 1,600 low fare routes, connecting 186 destinations in 29 countries and operating a fleet of 300 new Boeing 737-800 aircraft. Ryanair has recently announced firm orders for a further 175 new Boeing aircraft, which will be delivered between 2014 and 2018. Ryanair currently has a team of more than 9,000 highly skilled professionals, will carry over 81.5 million passengers this year and has an outstanding 29-year safety record.
5
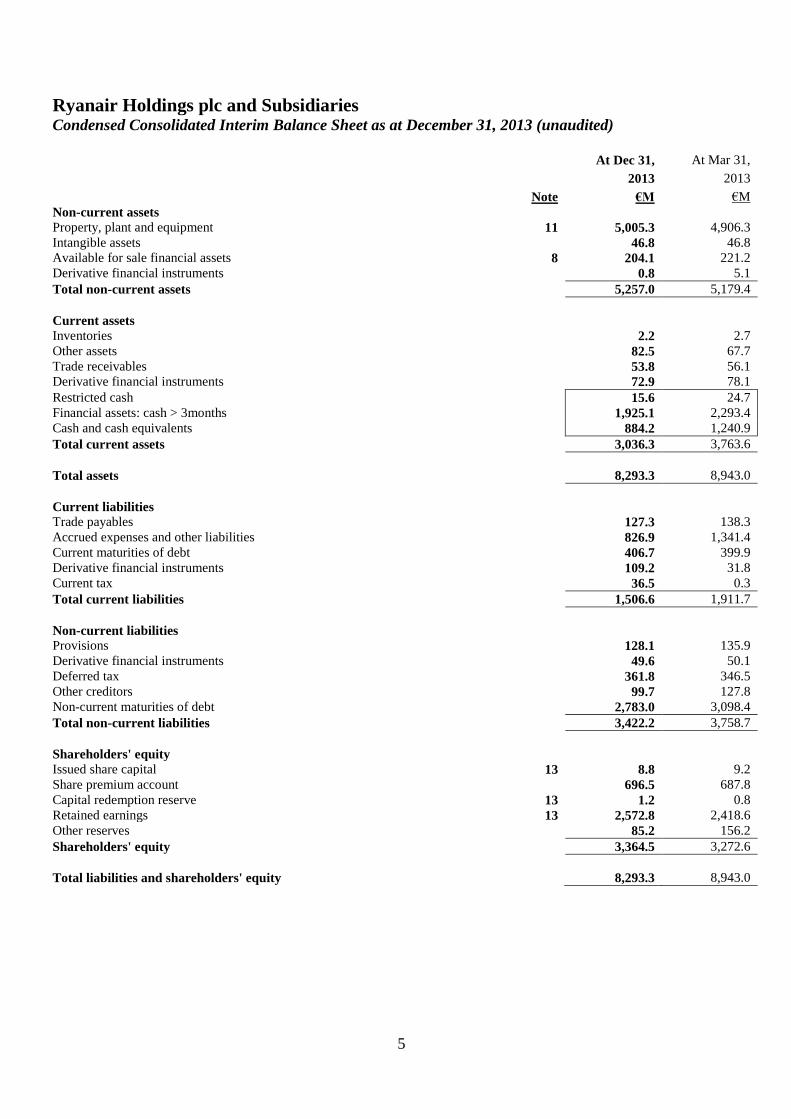
Ryanair Holdings plc and Subsidiaries
Condensed Consolidated Interim Balance Sheet as at December 31, 2013 (unaudited)
At Dec 31, At Mar 31,
2013 2013
Note €M €M
Non-current assets
Property, plant and equipment 11 5,005.3 4,906.3
Intangible assets 46.8 46.8
Available for sale financial assets 8 204.1 221.2
Derivative financial instruments 0.8 5.1
Total non-current assets 5,257.0 5,179.4
Current assets
Inventories 2.2 2.7
Other assets 82.5 67.7
Trade receivables 53.8 56.1
Derivative financial instruments 72.9 78.1
Restricted cash 15.6 24.7
Financial assets: cash > 3months 1,925.1 2,293.4
Cash and cash equivalents 884.2 1,240.9
Total current assets 3,036.3 3,763.6
Total assets 8,293.3 8,943.0
Current liabilities
Trade payables 127.3 138.3
Accrued expenses and other liabilities 826.9 1,341.4
Current maturities of debt 406.7 399.9
Derivative financial instruments 109.2 31.8
Current tax 36.5 0.3
Total current liabilities 1,506.6 1,911.7
Non-current liabilities
Provisions 128.1 135.9
Derivative financial instruments 49.6 50.1
Deferred tax 361.8 346.5
Other creditors 99.7 127.8
Non-current maturities of debt 2,783.0 3,098.4
Total non-current liabilities 3,422.2 3,758.7
Shareholders' equity
Issued share capital 13 8.8 9.2
Share premium account 696.5 687.8
Capital redemption reserve 13 1.2 0.8
Retained earnings 13 2,572.8 2,418.6
Other reserves 85.2 156.2
Shareholders' equity 3,364.5 3,272.6
Total liabilities and shareholders' equity 8,293.3 8,943.0

6
Ryanair Holdings plc and Subsidiaries Condensed Consolidated Interim Income Statement for the nine months ended
December 31, 2013 (unaudited)
Period
Period
Ended Ended
Dec 31, Dec 31,
2013 2012
Note €M €M
Operating revenues
Scheduled revenues 3,257.3 3,271.0
Ancillary revenues 961.9 803.9
Total operating revenues - continuing operations 4,219.2 4,074.9
Operating expenses
Staff costs 363.7 339.8
Depreciation 267.7 249.0
Fuel & oil 1,656.3 1,539.7
Maintenance, materials & repairs 82.8 86.3
Aircraft rentals 77.3 72.1
Route charges 427.8 390.0
Airport & handling charges 502.0 490.1
Marketing, distribution & other 147.4 160.6
Total operating expenses 3,525.0 3,327.6
Operating profit - continuing operations
694.2
747.3
Other income/(expenses)
Finance income 14.2 24.3
Finance expense (63.5) (76.8)
Foreign exchange (loss)/gain (1.3) 3.8
Total other expenses (50.6) (48.7)
Profit before tax 643.6 698.6
Tax on profit on ordinary activities 4 (76.9) (84.9)
Profit for the period – all attributable to equity holders of parent 566.7 613.7
Earnings per ordinary share (in € cent)
Basic 10 39.79 42.56
Diluted 10 39.67 42.45
Weighted average no. of ordinary shares (in Ms)
Basic 10 1,424.1 1,441.9
Diluted 10 1,428.7
1,445.8

7
Ryanair Holdings plc and Subsidiaries Condensed Consolidated Interim Income Statement for the quarter ended December 31, 2013
(unaudited)
Quarter
Quarter
Ended Ended
Dec 31, Dec 31,
2013 2012
Note €M €M
Operating revenues
Scheduled revenues 715.2 748.7
Ancillary revenues 249.2 220.1
Total operating revenues - continuing operations 964.4 968.8
Operating expenses
Staff costs 105.1 99.8
Depreciation 85.4 79.1
Fuel & oil 455.0 414.8
Maintenance, materials & repairs 28.9 28.6
Aircraft rentals 24.7 24.5
Route charges 109.3 104.8
Airport & handling charges 135.0 137.1
Marketing, distribution & other 44.0 45.5
Total operating expenses 987.4 934.2
Operating (loss)/profit - continuing operations
(23.0)
34.6
Other income/(expenses)
Finance income 2.4 4.8
Finance expense (20.8) (24.0)
Foreign exchange (loss)/gain (0.4) 3.9
Total other expenses (18.8) (15.3)
(Loss)/profit before tax (41.8) 19.3
Tax on (loss)/profit on ordinary activities 4 6.6 (1.2)
(Loss)/profit for the quarter – all attributable to equity holders of parent (35.2) 18.1
Earnings per ordinary share (in € cent)
Basic 10 (2.50) 1.25
Diluted 10 (2.50) 1.25
Weighted average no. of ordinary shares (in Ms)
Basic 10 1,407.3 1,444.0
Diluted 10 1,407.3
1,448.3

8
Ryanair Holdings plc and Subsidiaries
Condensed Consolidated Interim Statement of Comprehensive Income for the nine
months ended December 31, 2013 (unaudited)
Nine
months
Nine
months
Ended Ended
Dec 31,
2013
Dec 31,
2012
€M €M
Profit for the nine months 566.7 613.7
Other comprehensive income:
Items that may or will be reclassified to profit or loss in subsequent period:
Cash flow hedge reserve movements:
Net movement in cash flow hedge reserve (51.6) (180.6)
Available for sale financial asset:
Net (decrease)/increase in fair value of available for sale financial asset (17.1)
26.3
Other comprehensive expense for the nine months, net of income tax (68.7) (154.3)
Total comprehensive income for the nine months – all attributable to equity holders of
Parent
498.0 459.4
Ryanair Holdings plc and Subsidiaries
Condensed Consolidated Interim Statement of Comprehensive Income for the
quarter ended December 31, 2013 (unaudited)
Quarter
Quarter
Ended Ended
Dec 31,
2013
Dec 31,
2012
€M €M
(Loss)/profit for the quarter (35.2) 18.1
Other comprehensive income:
Items that may or will be reclassified to profit or loss in subsequent period:
Cash flow hedge reserve movements:
Net movement in cash flow hedge reserve 27.6 (78.8)
Available for sale financial asset:
Net (decrease)/increase in fair value of available for sale financial asset (37.9)
11.5
Other comprehensive expense for the quarter, net of income tax (10.3) (67.3)
Total comprehensive expense for the quarter – all attributable to equity holders of
Parent
(45.5) (49.2)

9
Ryanair Holdings plc and Subsidiaries Condensed Consolidated Interim Statement of Cash Flows for the nine months ended
December 31, 2013 (unaudited)
Nine
months
Nine
months
Ended Ended
Dec 31, Dec 31,
2013 2012
€M €M
Operating activities
Profit before tax 643.6 698.6
Adjustments to reconcile profit before tax to net cash provided by operating activities
Depreciation 267.7 249.0
Decrease in inventories 0.5 0.1
Decrease/(increase) in trade receivables 2.3 (7.8)
(Increase) in other current assets (15.3) (6.1)
(Decrease) in trade payables (11.0) (18.5)
(Decrease) in accrued expenses (516.5) (472.6)
(Decrease) in other creditors (28.1) (8.3)
(Decrease)/increase in provisions (9.2) 23.2
Increase in finance expense 2.2 1.3
Decrease in finance income 0.5 1.0
Retirement costs (1.4) 0.1
Share based payments 1.5 1.5
Income tax (paid)/refunded (14.4) 0.6
Net cash provided by operating activities 322.4 462.1
Investing activities
Capital expenditure (purchase of property, plant and equipment) (366.7) (257.4)
Decrease in restricted cash 9.1 6.7
Decrease/(increase) in financial assets: cash > 3months 368.3 (1,504.5)
Net cash from/(used in) investing activities 10.7 (1,755.2)
Financing activities
Net proceeds from shares issued 8.7 19.7
Dividend paid - (491.5)
Proceeds from long term borrowings
Repayments of long term borrowings -
(284.6)
237.1
(266.3)
Shares purchased under share buy-back programme 13 (413.9) (67.5)
Net cash used in financing activities (689.8) (568.5)
(Decrease) in cash and cash equivalents (356.7) (1,861.6)
Cash and cash equivalents at beginning of the period 1,240.9 2,708.3
Cash and cash equivalents at end of the period 884.2 846.7

10
Ryanair Holdings plc and Subsidiaries Condensed Consolidated Interim Statement of Changes in Shareholders’ Equity for the nine
months ended December 31, 2013 (unaudited)
Issued Share Capital
Ordinary Share Premium Retained Redemption Other
Shares Capital Account Earnings Reserve Hedging Reserves Total
M €M €M €M €M €M €M €M
Balance at March 31, 2012 1,455.6 9.3 666.4 2,400.1 0.7 138.6 91.6 3,306.7
Profit for the nine months - - - 613.7 - - - 613.7
Other comprehensive income
Net movements in cash flow reserve - - - - - (180.6) - (180.6)
Net change in fair value of available
for sale financial asset
-
-
-
-
-
-
26.3
26.3
Total other comprehensive
income/(expense)
-
-
-
-
-
(180.6)
26.3
(154.3)
Total comprehensive
income/(expense)
-
-
-
613.7
-
(180.6)
26.3
459.4
Transactions with owners of the
Company recognised directly in
equity
Issue of ordinary equity shares 6.1 - 19.8 - - - - 19.8
Repurchase of ordinary equity shares - - - (67.5) - - - (67.5)
Cancellation of repurchased ordinary
shares
(15.0)
(0.1)
-
-
0.1
-
-
-
Share-based payments - - - - - - 1.5 1.5
Dividend paid - - - (491.5) - - - (491.5)
Transfer of exercised and expired
share based awards
-
-
-
8.6
-
-
(8.6)
-
Balance at December 31, 2012 1,446.7 9.2 686.2 2,463.4 0.8 (42.0) 110.8 3,228.4
Loss for the three months - - - (44.4) - - - (44.4)
Other comprehensive income
Net actuarial losses from retirement
benefit plans
-
-
-
(1.1)
-
-
-
(1.1)
Net movements in cash flow reserve - - - - - 42.5 - 42.5
Net change in fair value of available
for sale financial asset
-
-
-
-
-
-
45.2
45.2
Total other comprehensive income - - - (1.1) - 42.5 45.2 86.6
Total comprehensive
income/(expense)
-
-
-
(45.5)
-
42.5
45.2
42.2
Transactions with owners of the
Company recognised directly in equity
Issue of ordinary equity shares 0.4 - 1.6 - - - - 1.6
Share-based payments - - - - - - 0.4 0.4
Dividend paid - - - - - - - -
Transfer of exercised and expired
share based awards
-
-
-
0.7
-
-
(0.7)
-
Balance at March 31, 2013 1,447.1 9.2 687.8 2,418.6 0.8 0.5 155.7 3,272.6
Other Reserves

11
Ryanair Holdings plc and Subsidiaries Condensed Consolidated Interim Statement of Changes in Shareholders’ Equity for the nine
months ended December 31, 2013 (unaudited) (cont.)
Issued Share Capital
Ordinary Share Premium Retained Redemption Other
Shares Capital Account Earnings Reserve Hedging Reserves Total
M €M €M €M €M €M €M €M
Balance at March 31, 2013 1,447.1 9.2 687.8 2,418.6 0.8 0.5 155.7 3,272.6
Profit for the nine months - - - 566.7 - - - 566.7
Other comprehensive income
Revaluation of retirement benefits
plan
-
-
-
(2.4)
-
-
-
(2.4)
Net movements into cash flow reserve - - - - - (51.6) - (51.6)
Net change in fair value of available
for sale financial asset
-
-
-
-
-
-
(17.1)
(17.1)
Total other comprehensive (expense) - - - (2.4) - (51.6) (17.1) (68.7)
Total comprehensive
income/(expense)
-
-
-
564.3
-
(51.6)
(17.1)
495.6
Transactions with owners of the
Company recognised directly in
equity
Issue of ordinary equity shares 2.8 - 8.7 - - - - 8.7
Repurchase of ordinary equity shares - - - (413.9) - - - (413.9)
Cancellation of repurchased ordinary
shares
(59.6)
(0.4)
-
-
0.4
-
-
-
Share-based payments - - - - - - 1.5 1.5
Transfer of exercised and expired
share based awards
-
-
-
3.8
-
-
(3.8)
-
Balance at December 31, 2013 1,390.3 8.8 696.5 2,572.8 1.2 (51.1) 136.3 3,364.5
Other Reserves

12
Ryanair Holdings plc and Subsidiaries
Operating and Financial Overview
Summary nine months ended December 31, 2013
Profit after tax decreased by 8% to €566.7m compared to €613.7m in the nine months ended December 31, 2012
primarily due to a 6% increase in total operating expenses and a 4% decrease in average fares, offset by strong
ancillary revenues and increased traffic. Total operating revenues increased by 4% to €4,219.2m, primarily due
to the 20% growth in ancillary revenues to €961.9m, significantly faster than the 3% increase in traffic, offset by a
4% reduction in average fare due to the summer heat wave, the weakening of sterling to the euro, the timing of
Easter, the June French ATC strike and a 9% fall in average fares in Quarter 3. Total revenue per passenger, as a
result, remained flat. Load Factor also remained the same at 84% compared to the period ended December 31,
2012.
Total operating expenses increased by 6% to €3,525.0m, due to increased fuel prices and the higher level of
activity. Fuel, which represents 47% of total operating costs compared to 46% in the comparative period, increased
by 8% to €1,656.3m due to the higher euro price per gallon paid and increased activity in the period. Unit costs
excluding fuel increased by 1% and including fuel they rose by 3%. Operating margin decreased by 2 points to
16% whilst operating profit decreased by 7% to €694.2m.
Net margin was down 2 points to 13%, compared to December 31, 2012.
Basic earnings per share for the period were 39.79 euro cent compared to basic earnings per share of 42.56 euro
cent at December 31, 2012.
Balance sheet
Gross cash decreased by €734.1m since March 31, 2013 to €2,824.9m and gross debt fell by €308.6m to
€3,189.7m. The Group generated cash from operating activities of €322.4m which funded net capital expenditure
of €366.7m, a €413.9m share buy-back programme and debt repayments. As a result the Group had net debt of
€364.8m at period end (March 31, 2013: net cash €60.7m).
Detailed Discussion and Analysis for the nine months ended December 31, 2013
Profit after tax decreased by 8% to €566.7m primarily due a 6% increase in total operating expenses and a 4%
decrease in average fares, offset by strong ancillary revenue growth and increased traffic. Total operating
revenues increased by 4% to €4,219.2m primarily due to a 20% increase in ancillary revenues and a 3% rise in
traffic offset by a 4% reduction in average fares. Fuel, which represents 47% of total operating costs compared to
46% in the comparative period, increased by 8% to €1,656.3m due to a higher euro price per gallon paid and
increased activity in the period. Unit costs excluding fuel increased by 1%, including fuel unit costs rose by 3%.
Operating margin, as a result of the above, decreased by 2 points to 16% whilst operating profit decreased by
7% to €694.2m.
Total operating revenues increased by 4% to €4,219.2m primarily due to strong ancillary revenues and a 3%
increase in traffic to 67.4m, offset by a 4% drop in average fares, due to the timing of Easter, the weakening of
sterling to the euro, the summer heat wave in Northern Europe, the adverse impact of the June French ATC strike
and a 9% fall in average fares in Quarter 3.

13
Total revenue per passenger remained flat as the strong growth in ancillary revenues and passenger numbers was
offset by the fall in average fares.
Scheduled passenger revenues were broadly in line with the previous year at €3,257.3m due to a 3% increase in
traffic, offset by the 4% fall in average fares, due to the timing of Easter, the weakening of sterling to the euro, the
summer heat wave, the June French ATC strike and a 9% fall in average fares in Quarter 3. Load factor remained
flat at 84%.
Ancillary revenues increased by 20% to €961.9m, significantly faster than the 3% increase in passenger numbers,
due to a combination of an improved product mix, the roll out of reserved seating across the network, and higher
administration and credit card fees.
Total operating expenses increased by 6% to €3,525.0m due to the 8% rise in fuel costs and increased costs
associated with the growth of the airline, partially offset by the weakening of sterling to the euro.
Staff costs increased by 7% to €363.7m primarily due to an 8% increase in hours and a 2% pay increase granted in
April 2013, partially offset by the weakening of sterling to the euro.
Depreciation and amortisation increased by 8% to €267.7m due to a combination of the increased level of
activity, the higher average number of ‘owned’ aircraft in the fleet this year (December 31, 2013: 246) compared
to the prior year (December 31, 2012: 241), and spare engines purchased in the period.
Fuel & oil costs increased by 8% to €1,656.3m due to higher euro fuel prices and the increased level of activity in
the period.
Maintenance costs decreased by 4% to €82.8m, primarily due to improved terms on lease extensions, offset by
costs arising from the increased level of activity. The prior year comparative included additional costs associated
with the return of leased aicraft.
Aircraft rental costs increased by 7% to €77.3m, due to the negative impact of currency movements and higher
financing costs.
Route charges rose by 10% to €427.8m due to the increased number of sectors flown and higher unit charges.
Airport & handling charges increased by 2% to €502.0m, due to the 3% increase in sectors flown, increased
charges in Spain, a quadrupling of Italian ATC charges during the summer, offset by the mix of new routes and
bases launched and the weakening of sterling to the euro.
Marketing, distribution & other costs, which include ancillary costs, decreased by 8% to €147.4m, due to
reduced marketing spend per passenger, lower ancillary revenue costs, and the reductions achieved in credit card
processing fees.
Operating margin decreased by 2 points to 16% due to the reasons outlined above and operating profits have
decreased by 7% to €694.2m.
Finance income decreased by 42% to €14.2m due to lower interest rates and gross cash balances, partially offset
by increased dividend income in the period.

14
Finance expense decreased by 17% to €63.5m primarily due to lower interest rates and gross debt compared to the
nine months ended December 31, 2012.
Balance sheet
Gross cash decreased by €734.1m since March 31, 2013 to €2,824.9m and gross debt fell by €308.6m to
€3,189.7m. The Group generated cash from operating activities of €322.4m which funded net capital expenditure
of €366.7m, a €413.9m share buy-back programme and debt repayments. As a result the Group had net debt of
€364.8m at period end (March 31, 2013: net cash €60.7m).
Shareholders’ equity increased by €91.9m in the period to €3,364.5m primarily due the net profit after tax of
€566.7m, offset by a €413.9m share buy-back and the impact of IFRS accounting treatment for derivatives.
Detailed Discussion and Analysis for the quarter ended December 31, 2013
The Group had a Loss after tax of €35.2m compared to a profit after tax of €18.1m in the comparative period, a
decline of €53.3m, primarily due to a 9% decrease in average fares and a 6% increase in total operating expenses,
offset by strong ancillary revenues and increased traffic. Total operating revenues were broadly in line with the
comparative period at €964.4m primarily due to a 9% decrease in average fares, offset by a 13% rise in ancillary
revenues and a 6% increase in passenger numbers. Average fares decreased by 9% compared to the quarter ended
December 31, 2013 due to weaker market conditions and the weakening of sterling to the euro. Fuel, which
represents 46% of total operating costs in the quarter, compared to 44% in the comparative period, increased by
10% to €455.0m due to a higher euro price per gallon paid and increased activity in the period. Unit costs
excluding fuel fell by 3% however, including fuel unit costs remained flat. As a result of the above, there was an
operating loss of €23.0m compared to an operating profit of €34.6m in the comparative quarter.
Total operating revenues were broadly in line with the comparative period at €964.4m primarily due to a 9%
decrease in average fares, offset by strong ancillary revenues and a 6% increase in passenger numbers to 18.3m.
Total revenue per passenger fell by 6%, primarily due to the lower average fares.
Scheduled passenger revenues decreased by 4% to €715.2m primarily due to a 9% decrease in average fares
(partly due to the weakening of sterling to the euro) offset by the 6% increase in passenger numbers. Load factor
increased by 1 point to 82%.
Ancillary revenues increased by 13% to €249.2m, faster than the 6% increase in passenger numbers, due to a
combination of an improved product mix, the roll out of reserved seating across the network and higher
administration and credit card fees.
Total operating expenses increased by 6% to €987.4m due to the 10% rise in fuel costs and increased costs
associated with the growth of the airline, partially offset by the weakening of sterling to the euro.
Staff costs increased by 5% to €105.1m due to the increased level of activity and the impact of a 2% pay increase
granted in April 2013, offset by the weakening of sterling to the euro.

15
Depreciation and amortisation increased by 8% to €85.4m due to a combination of, the increased level of
activity, the spare engines purchased in the period and the higher average number of ‘owned’ aircraft in the fleet
this quarter (December 31, 2013: 246) compared to the prior year (December 31, 2012: 241).
Fuel & oil costs increased by 10% to €455.0m due to higher euro fuel prices and the increased activity in the
quarter.
Maintenance costs increased by 1% to €28.9m, primarily due to costs arising from the increased level of activity
offset by improved terms on lease extensions.
Aircraft rental costs increased by 1% to €24.7m, reflecting the negative impact of adverse currency movements
and higher financing costs.
Route charges rose by 4% to €109.3m due to the increased number of sectors flown and higher unit charges.
Airport & handling charges decreased by 1% to €135.0m, due to the increase in sectors flown, offset by the mix
of routes and bases operated and the weakening of sterling to the euro.
Marketing, distribution & other costs, which include ancillary costs, decreased by 3% to €44.0m, primarily due
to a reduction in marketing spend per passenger, lower ancillary revenue costs and credit card processing fees.
Due to the reasons outlined above operating losses are €23.0m compared to an operating profit of €34.6m in the
comparative quarter.
Finance income decreased by 50% to €2.4m due to lower interest rates and gross cash this quarter compared to
the quarter ended December 31, 2012.
Finance expense decreased by 13% to €20.8m primarily due to lower interest rates and gross debt this quarter
compared to the quarter ended December 31, 2012.

16
Ryanair Holdings plc
Interim Management Report
Introduction
This financial report for the nine months ended December 31, 2013 meets the reporting requirements pursuant to
the Transparency (Directive 2004/109/EC) Regulations 2007 and Transparency Rules of the Republic of Ireland’s
Financial Regulator and the Disclosure and Transparency Rules of the United Kingdom’s Financial Services
Authority.
This interim management report includes the following:
Principal risks and uncertainties relating to the remaining three months of the year;
Related party transactions; and
Post balance sheet events.
Results of operations for the nine month period ended December 31, 2013 compared to the nine month period
ended December 31, 2012, including important events that occurred during the nine months, are set forth above in
the Operating and Financial Overview.
Principal risks and uncertainties
Among the factors that are subject to change and could significantly impact Ryanair’s expected results for the
remainder of the year are the airline pricing environment, fuel costs, competition from new and existing carriers,
costs associated with environmental, safety and security measures, actions of the Irish, UK, European Union (“EU”)
and other governments and their respective regulatory agencies, fluctuations in currency exchange rates and interest
rates, airport access and charges, labour relations, the economic environment of the airline industry, the general
economic environment in Ireland, the UK, and Continental Europe, the general willingness of passengers to travel,
other economic, social and political factors and flight interruptions caused by volcanic ash emissions or other
atmospheric disruptions.
Board of directors
Details of the members of our Board of Directors are set forth on pages 102 and 103 of our 2013 annual report.
Related party transactions
Please see note 14.
Post balance sheet events
Please see note 15.
17
Ryanair Holdings plc Notes forming Part of the Condensed Consolidated
Interim Financial Statements
1. Basis of preparation and significant accounting policies
Ryanair Holdings plc (the “Company”) is a company domiciled in Ireland. The unaudited condensed
consolidated interim financial statements of the Company for the nine months ended December 31, 2013
comprise the Company and its subsidiaries (together referred to as the “Group”).
These unaudited condensed consolidated interim financial statements (“the interim financial statements”),
which should be read in conjunction with our 2013 Annual Report for the year ended March 31, 2013, have
been prepared in accordance with International Accounting Standard No. 34 “Interim Financial Reporting” as
adopted by the EU (“IAS 34”). They do not include all of the information required for full annual financial
statements, and should be read in conjunction with the most recent published consolidated financial statements
of the Group. The consolidated financial statements of the Group as at and for the year ended March 31, 2013,
are available at www.ryanair.com.
The comparative figures included for the year ended March 31, 2013 do not constitute statutory financial
statements of the Group within the meaning of Regulation 40 of the European Communities (Companies,
Group Accounts) Regulations, 1992. The consolidated financial statements of the Group for the year ended
March 31, 2013, together with the independent auditor’s report thereon, have been filed with the Irish
Registrar of Companies following the Company’s Annual General Meeting and are also available on the
Company’s Website. The auditor’s report on those financial statements was unqualified.
The Audit Committee, upon delegation of authority by the Board of Directors, approved the interim financial
statements for the nine months ended December 31, 2013 on January 31, 2014.
Except as stated otherwise below, this period’s financial information has been prepared in accordance with the
accounting policies set out in the Group’s most recent published consolidated financial statements, which were
prepared in accordance with IFRS as adopted by the EU and in compliance with IFRS as issued by the
International Accounting Standards Board.
The following new and amended standards, that have been issued by the International Accounting Standards
Board (IASB), and have been adopted by the E.U., and that are effective for the first time for the financial
year beginning on or after January 1, 2013, have been applied by the Group for the first time in the unaudited
condensed consolidated half year financial statements;
Amendments to IFRS 7, “Disclosures on offsetting financial assets and financial liabilities”
IFRS 10, “Consolidated financial statements”.
IFRS 11, “Joint arrangements”.
IFRS 12, “Disclosure of interests in other entities”.
IFRS 13, “Fair Value Measurement”.
IAS 1 (amendment 2011) “Presentation of Items of financial statements”.
IAS 19 (amendment 2011) “Employee benefits”.
“Improvements to IFRSs”. 2009-2011 Cycle.

18
IAS 27 (amended 2011), “Separate financial statements”.
IAS 28 (amended 2011), “Associates and joint ventures”.
The adoption of these new or amended standards did not have a material impact on our financial position or
results from operations in the nine months to December 31, 2013.
The following new or revised IFRS standards and IFRIC interpretations will be adopted for purposes of the
preparation of future financial statements, where applicable. We do not anticipate that the adoption of these
new or revised standards and interpretations will have a material impact on our financial position or results
from operations.
IAS 32 (amendment) “Financial instruments: Presentation-offsetting financial assets and
financial liabilities” (effective for fiscal periods beginning on or after January 1, 2014).
IAS 36 (amendment) “Recoverable Amount Disclosures for Non-Financial Assets” (effective
for fiscal periods beginning on or after January 1, 2014).
IAS 39 (amendment) “Novation of Derivatives and Continuation of Hedge Accounting”
(effective for fiscal periods beginning on or after January 1, 2014).
IFRIC 21 “Levies” (effective for fiscal periods beginning on or after January 1, 2014).
IFRS 9 “Financial Instruments” (2009, as amended in 2011) (effective date to be determined).
2. Estimates
The preparation of financial statements requires management to make judgements, estimates and assumptions that
affect the application of accounting policies and the reported amounts of assets and liabilities, income and expense.
Actual results may differ from these estimates.
In preparing these consolidated financial statements, the significant judgements made by management in applying
the Group’s accounting policies and the key sources of estimation uncertainty were the same as those that applied
in the most recent published consolidated financial statements.
3. Seasonality of operations
The Group’s results of operations have varied significantly from quarter to quarter, and management expects these
variations to continue. Among the factors causing these variations are the airline industry’s sensitivity to general
economic conditions and the seasonal nature of air travel. Accordingly the first half-year typically results in higher
revenues and results.
4. Income tax expense
The Group’s consolidated effective tax rate in respect of operations for the nine months ended December 31, 2013
was 11.9% (December 31, 2012: 12.2%). The tax charge for the nine months ended December 31, 2013 of
€76.9m (December 31, 2012: €84.9) comprises a deferred tax charge relating to the temporary differences for
property, plant and equipment recognised in the income statement.

19
5. Share based payments
The terms and conditions of the share option programme are disclosed in the most recent, published, consolidated
financial statements. The charge of €1.5m is the fair value of various share options granted in prior periods, which
are being recognised within the income statement in accordance with employee services rendered.
6. Contingencies
The Group is engaged in litigation arising in the ordinary course of its business. The Group does not believe that
any such litigation will individually or in aggregate have a material adverse effect on the financial condition of the
Group. Should the Group be unsuccessful in these litigation actions, management believes the possible liabilities
then arising cannot be determined but are not expected to materially adversely affect the Group’s results of
operations or financial position.
7. Capital commitments
At December 31, 2013 Ryanair had an operating fleet of 298 (2012: 305) Boeing 737-800NG aircraft. Following
shareholder approval at an EGM on June 18, 2013, the Group has agreed to purchase 175 new Boeing 737 800NG
aircraft between fiscal 2015 and 2019.
8. Available for sale financial assets (Aer Lingus)
The movement on the available for sale financial asset from €221.2m at March 31, 2013 to €204.1m at December
31, 2013 is comprised of a loss of €17.1m, recognised through other comprehensive income, reflecting the
decrease in the Aer Lingus share price from €1.39 per share at March 31, 2013 to €1.28 per share at December 31,
2013.
9. Analysis of operating segment
The Company is managed as a single business unit that provides low fares airline-related activities, including
scheduled services, car hire, internet income and related sales to third parties. The Company operates a single fleet
of aircraft that is deployed through a single route scheduling system.
The Company determines and presents operating segments based on the information that internally is provided to
the CEO, who is the Company’s Chief Operating Decision Maker (CODM). When making resource allocation
decisions the CODM evaluates route revenue and yield data, however resource allocation decisions are made
based on the entire route network and the deployment of the entire aircraft fleet, which are uniform in type. The
objective in making resource allocation decisions is to maximise consolidated financial results, rather than
individual routes within the network.
The CODM assesses the performance of the business based on the consolidated profit/(loss) after tax of the
Company for the period.
All segment revenue is derived wholly from external customers and as the Company has a single reportable
segment, intersegment revenue is zero.

20
The Company’s major revenue-generating asset comprises its aircraft fleet, which is flexibly employed across the
Company’s integrated route network and is directly attributable to its reportable segment operations. In addition,
as the Company is managed as a single business unit, all other assets and liabilities have been allocated to the
Company’s single reportable segment.
Reportable segment information is presented as follows:
Nine
Months
Nine
months
Ended Ended
Dec 31, Dec 31,
2013 2012
€M
€'M
External revenues 4,219.2 4,074.9
Reportable segment profit after income tax 566.7 613.7
At Dec 31,
2013
€M
At Mar 31,
2013
€M
Reportable segment assets (excludes the available for sale financial asset) 8,089.2 8,721.8
10. Earnings per share
Nine
months
Nine
Months
Quarter
Quarter
Ended Ended Ended Ended
Dec-31 Dec-31 Dec-31 Dec-31
2013 2012 2013 2012
Basic earnings/(losses) per ordinary share euro cent 39.79 42.56 (2.50) 1.25
Diluted earnings/(losses) per ordinary share euro cent 39.67 42.45 (2.50) 1.25
Weighted average number of ordinary shares (in M’s) - basic 1,424.1 1,441.9 1,407.3 1,444.0
Weighted average number of ordinary shares (in M’s) - diluted 1,428.7 1,445.8 1,407.3 1,448.3
Diluted earnings per share takes account solely of the potential future exercises of share options granted under the
Company’s share option schemes and the weighted average number of shares includes weighted average share
options assumed to be converted of 4.6m (2012: 4.3m).
11. Property, plant and equipment
Acquisitions
Capital expenditure in the nine months amounted to €366.7m and is primarily aircraft pre delivery payments and
the cost of spare engines purchased during the period.

21
12. Financial instruments and financial risk management
Financial risk factors
We are exposed to various financial risks arising in the normal course of business. Our financial risk
exposures are predominantly related to commodity price, foreign exchange and interest rate risks. The
Company uses financial instruments to manage exposures arising from these risks.
The quarters financial statements do not include all financial risk management information and disclosures
required in the annual financial statements, and should be read in conjunction with the 2013 Annual Report.
There have been no changes in our risk management policies since year-end.
Fair value hierarchy
Financial instruments measured at fair value in the balance sheet are categorised by the type of valuation
method used. The different valuation levels are defined as follows:
Level 1: quoted prices (unadjusted) in active markets for identical assets or liabilities that the Group can
access at the measurement date.
Level 2: inputs other than quoted prices included within Level 1 that are observable for that asset or
liability, either directly or indirectly.
Level 3: unobservable inputs for the asset or liability.
Fair value estimation
Fair value is the amount at which a financial instrument could be exchanged in an arm’s length transaction
between informed and willing parties, other than as part of a forced liquidation sale. The following methods
and assumptions were used to estimate the fair value of each material class of the Company’s financial
instruments:
Financial instruments measured at fair value
Available for sale: The fair value of available-for-sale financial assets is their quoted market bid price at
the balance sheet date. (Level 1)
Derivatives – interest rate swaps: Discounted cash-flow analyses have been used to determine the fair
value, taking into account current market inputs and rates. (Level 2)
Derivatives – currency forwards, aircraft fuel contracts and carbon swaps: A comparison of the
contracted rate to the market rate for contracts providing a similar risk profile at December 31, 2013 has been
used to establish fair value. (Level 2)
Financial instruments disclosed at fair value
Fixed-rate long-term debt: The repayments which Ryanair is committed to make have been discounted at
the relevant market rates of interest applicable (including credit spreads) at December 31, 2013 to arrive at a
fair value representing the amount payable to a third party to assume the obligations.
There were no significant changes in the business or economic circumstances during the nine months to
December 31, 2013 that affect the fair value of our financial assets and financial liabilities.
The Group policy is to recognise any transfers between levels of the fair value hierarchy as of the end of the
reporting period during which the transfer occurred. During the nine months to December 31, 2013, there were
no reclassifications of financial assets and no transfers between levels of the fair value hierarchy used in
measuring the fair value of financial instruments.

22
12. Financial instruments and financial risk management (continued)
The fair value of financial assets and financial liabilities, together with the carrying amounts in the condensed
consolidated financial statement of financial position, are as follows:
Carrying
amount
Fair
value
At December 31, 2013 €M €M
Non-current financial assets
Available-for-sale financial assets ................................................................................ 204.1 204.1
Jet fuel derivative contracts .......................................................................................... 0.8 0.8
204.9 204.9
Current financial assets
Derivative financial instruments:-
- Jet fuel derivative contracts ........................................................................................ 72.9 72.9
72.9 72.9
Trade receivables .......................................................................................................... 53.8 53.8
Cash and cash equivalents ............................................................................................ 884.2 884.2
Financial asset: cash > 3 months .................................................................................. 1,925.1 1,925.1
Restricted cash .............................................................................................................. 15.6 15.6
Other assets ................................................................................................................... 2.2 2.2
2,953.8 2,953.8
Total financial assets at December 31, 2013 ................................................................ 3,158.7 3,158.7
Carrying
amount
Fair
value
At December 31, 2013 €M €M
Non-current financial liabilities
Derivative financial instruments:-
- Interest rate swaps ...................................................................................................... 42.0 42.0
- U.S. dollar currency forward contracts ....................................................................... 7.6 7.6
49.6 49.6
Long-term debt ............................................................................................................. 2,783.0 2,823.0
2,832.6 2,872.6
Current financial liabilities
Derivative financial instruments:-
- Interest rate swaps ...................................................................................................... 32.9 32.9
- U.S. dollar currency forward contracts ....................................................................... 76.3 76.3
109.2 109.2
Long-term debt ............................................................................................................. 406.7 406.7
Trade payables .............................................................................................................. 127.3 127.3
Accrued expenses ......................................................................................................... 362.8 362.8
1,006.0 1,006.0
Total financial liabilities at December 31, 2013 ........................................................... 3,838.6 3,878.6

23
13. Share buy-back
In the nine months ended December 31, 2013 the Company bought back 59.6m ordinary shares at a total cost of
€413.9m. This is equivalent to approximately 4.2% of the Company’s issued share capital at March 31, 2013. All
ordinary shares repurchased were cancelled. Accordingly, share capital decreased by 59.6m ordinary shares with a
nominal value of €0.4m and the capital redemption reserve increased by a corresponding €0.4m. The capital
redemption reserve is required to be created under Irish law to preserve permanent capital in the Parent Company.
In December 2013, the Company announced that it had entered into an irrevocable arrangement with its broker,
Citigroup Global Markets Limited, to commence a share buyback programme to repurchase ordinary shares to a
maximum value of €70.1m during the period December 20, 2013 to March 31, 2014.
On June 20, 2013 the Company detailed plans to return up to €1.0 billion to shareholders over the next two years
(subject to shareholder approval). At December 31, 2013 €413.9m has been completed and a further €66.8m will
be completed prior to March 31, 2014, and up to a further €519.3m in either special dividends or share buybacks
in the fiscal year to March 31, 2015.
14. Related party transactions
We have related party relationships with our subsidiaries, directors and senior key management personnel. All
transactions with subsidiaries eliminate on consolidation and are not disclosed.
There were no related party transactions in the nine months ended December 31, 2013 that materially affected the
financial position or the performance of the Company during that period and there were no changes in the related
party transactions described in the 2013 Annual Report that could have a material effect on the financial position
or performance of the Company in the same period.
15. Post balance sheet events
During January 2014, the Company repurchased 4.5m ordinary shares at a total cost of €29.6m. All ordinary
shares repurchased are cancelled.

24
Ryanair Holdings plc
Responsibility Statement
Statement of the directors in respect of the interim financial report
Each of the directors, whose names and functions are listed in our 2013 Annual Report, confirm that, to the
best of each person’s knowledge and belief:
1) The unaudited condensed consolidated interim financial statements for the nine months ended
December 31, 2013, comprising the condensed consolidated interim balance sheet, the condensed
consolidated interim income statement, the condensed consolidated interim statement of
comprehensive income, the condensed consolidated interim statement of cash flows and the
condensed consolidated interim statement of changes in shareholders’ equity and the related notes
thereto, have been prepared in accordance with IAS 34 as adopted by the European Union, being
the international accounting standard applicable.
2) The interim management report includes a fair review of the information required by:
(i) Regulation 8(2) of the Transparency (Directive 2004/109/EC) Regulations 2007, being an
indication of important events that have occurred during the nine months ended December 31,
2013 and their impact on the condensed consolidated interim financial statements; and a
description of the principal risks and uncertainties for the three months ending March 31,
2014; and
(ii) Regulation 8(3) of the Transparency (Directive 2004/109/EC) Regulations 2007, being related
party transactions that have taken place in the nine months ended December 31, 2013 and that
have materially affected the financial position or performance of the Company during that
period; and any changes in the related party transactions described in the 2013 Annual Report
that could do so.
On behalf of the Board
David Bonderman Michael O’Leary
Chairman Chief Executive
January 31, 2014
Related Documents

![Porters 5 [Ryanair]](https://static.cupdf.com/doc/110x72/55cf8548550346484b8c553e/porters-5-ryanair.jpg)