1 RUNNING HEAD: False Positive Poisson 1 2 3 Poisson Regressions: A little fishy 4 Ryan, William H. 1 5 Evers, Ellen R. K. 1 6 Moore, Don A. 1 7 1 University of California, Berkeley.Haas School of Business. 8 Corresponding author: 9 William Ryan ([email protected]) 10 Haas School of Business 11 545 Student Services Building, 12 #1900 Berkeley, CA 94720-1900 13 Office F501 14 15

Welcome message from author
This document is posted to help you gain knowledge. Please leave a comment to let me know what you think about it! Share it to your friends and learn new things together.
Transcript
1
RUNNING HEAD: False Positive Poisson 1
2
3
Poisson Regressions: A little fishy 4
Ryan, William H.1 5
Evers, Ellen R. K.1 6
Moore, Don A.1 7
1 University of California, Berkeley.Haas School of Business. 8
Corresponding author: 9
William Ryan ([email protected]) 10
Haas School of Business 11
545 Student Services Building, 12
#1900 Berkeley, CA 94720-1900 13
Office F501 14
15
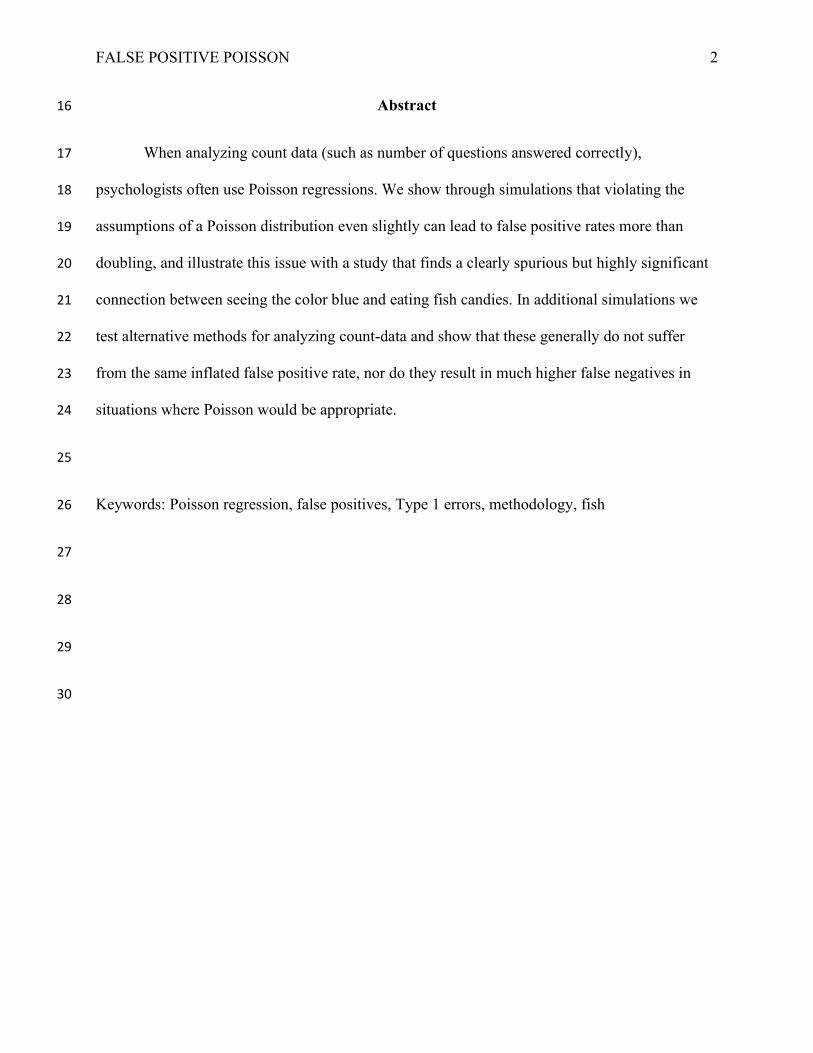
FALSE POSITIVE POISSON 2
Abstract 16
When analyzing count data (such as number of questions answered correctly), 17
psychologists often use Poisson regressions. We show through simulations that violating the 18
assumptions of a Poisson distribution even slightly can lead to false positive rates more than 19
doubling, and illustrate this issue with a study that finds a clearly spurious but highly significant 20
connection between seeing the color blue and eating fish candies. In additional simulations we 21
test alternative methods for analyzing count-data and show that these generally do not suffer 22
from the same inflated false positive rate, nor do they result in much higher false negatives in 23
situations where Poisson would be appropriate. 24
25
Keywords: Poisson regression, false positives, Type 1 errors, methodology, fish 26
27
28
29
30
FALSE POSITIVE POISSON 3
Researchers often analyze count data, such as number of multiple-choice questions 31
answered correctly, the number of different uses of a brick, or the number of pins stuck into a 32
Voodoo doll. Because these data are integers censored at 0, researchers will sometimes use 33
Poisson regressions to examine differences between groups. Poisson regressions test for 34
differences in count data; however, they rely on strong assumptions about the underlying 35
distribution. In particular, Poisson regressions assume that the variance of the distribution is 36
equal to its mean. When the variance is higher than the mean (referred to as data being 37
overdispersed), the risk of false positives increases. We find a) that data in many papers 38
employing Poisson regressions violate these assumptions, and b) that even relatively small 39
violations of Poisson’s assumptions can dramatically inflate false positives rates. We 40
demonstrate this issue first in a preregistered study showing that using Poisson regression gives 41
the improbable result that blue shirts prime people to eat more Swedish Fish. We then report a 42
simulation study that shows that under the null, Poisson regressions result in significant p-values 43
more often than the 5% of the time which it should. Additionally, we demonstrate that 44
alternatives to Poisson not only don’t lead to significantly more Type I errors when there is no 45
true difference, they also don’t lead to significantly more false negatives when the groups 46
actually differ. 47
While there are papers in specialized journals discussing the risks of using Poisson 48
regressions when its assumptions are not met (e.g., Cox, West, & Aiken 2009), it appears that 49
many authors and editors are not aware of these dangers. We find evidence that incorrect use of 50
Poisson is widespread. A review of the Journal of Personality and Social Psychology found 18 51
papers using Poisson regression to analyze count data in the past 10 years; of these 18 papers, 9 52
appear to have used it incorrectly; using Poisson on data in which the variance is not equal to the 53
FALSE POSITIVE POISSON 4
mean1. Review of two additional top Psychology journals and a top Marketing journal found 54
instances of incorrect use of Poisson in all of them. Based on the simulations presented later, data 55
with overdispersion equivalent to that found in several of these papers can be expected to lead to 56
false positive rates of up to 60%. While the absolute number of papers using Poisson is not large, 57
we nevertheless believe it is important to correct the published literature and do what we can to 58
prevent future publication of false positive results. In addition, based on our findings, we also 59
hope that this paper prevents authors of meta-analyses from unquestioningly including results 60
from Poisson regressions, since, as we will see, these results should be questioned and can 61
dramatically affect meta-analytical estimates. We worry that Poisson analyses may be selected, 62
at least sometimes, precisely because they make the result appear more impressive or statistically 63
significant. In addition, unlike other, more familiar, forms of p-hacking such as conducting 64
multiple tests, pre-registration does not prevent inflated rates of false positives when Poisson 65
regressions are used with overdispersed data. 66
It is also important to remember that we were only able to review a few of the hundreds 67
of journals in Psychology, and there’s little reason to believe that those journals are exceptional 68
in their use of Poisson. Further, the rate of Poisson use should most appropriately be compared to 69
the number of papers that were analyzing count data and thus could have used Poisson, not to the 70
total number of papers published. While it is difficult to determine the exact number of papers 71
using count data, we conducted a conservative test of the proportion of count data papers which 72
1 To carry out this search we searched for all instances of the string “Poisson” in the relevant journal’s archives from 2008-2018 (journals were reviewed in November-December 2018). We additionally reviewed the Journal of Experimental Psychology: General, the Journal of Personality and Social Psychology, and the Journal of Consumer Research. These journals were selected because they are among the most read and cited journals in Psychology and Marketing respectively. Articles published here are widely read and cited, making incorrect use of Poisson here particularly impactful. Papers were included if at least one of their analyses used Poisson regression, and another method of analysis was not used as well for the same result. Papers which e.g. reported both Poisson and Negative Binomial regressions on the same data are therefore excluded from our search.
FALSE POSITIVE POISSON 5
may be using Poisson by looking within a specific literature, papers using the voodoo doll task.2 73
Researchers use the voodoo doll task to assess aggression by measuring the number of pins a 74
participant sticks into a doll representing another person, resulting in count data. The paper that 75
introduced this task explicitly recommended against using Poisson regressions (DeWall et al. 76
2013). Despite this, of 26 papers featuring the voodoo doll task, one fifth of them used only 77
Poisson regressions. Of those which shared sufficient data to evaluate means and variances, we 78
could find only one in which Poisson may have been appropriate – in the others its use likely 79
inflated the risk of false positives. In short, within the literature employing studies using count 80
data as dependent variable, a substantial proportion of papers appears to rely on Poisson 81
distributions to analyze this data, even in many cases where it may yield increased false 82
positives. Future work should employ alternative methods of analysis. 83
It may not be surprising that so many are unaware of the weaknesses of Poisson. Many 84
analytic approaches are robust to violations of their assumptions. We are used to safely treating 85
Likert scales as continuous data, not running Levene’s test for ANOVAs, or using linear 86
regression on integer data. Poisson regression is a stark exception. Authors, editors, and 87
reviewers either do not realize the limitations of Poisson or they do not realize how dangerous it 88
is to violate its assumptions. This paper aims to raise awareness of this issue by giving a clear 89
and memorable demonstration of Poisson’s vulnerabilities and offering useful alternatives. Next, 90
we discuss the distributions involved in more detail. We begin by explaining why linear 91
regression may seem inappropriate for count data, and then explain the assumptions of Poisson 92
2 The voodoo doll task papers were reviewed in April-June 2019. The voodoo doll task was selected because it is one of the subfields in which count data is most widely used. We analyzed all papers citing the paper introducing the voodoo doll task which also used the task, and then coded them for if they used Poisson regressions alone to analyze their data or not.
FALSE POSITIVE POISSON 6
regressions, Negative Binomial regressions, and permutation tests. Readers who are not 93
interested in a review of these distributions can proceed directly to the “Experiment” section of 94
the paper. 95
Analyses for count data and their assumptions 96
Many scholars in behavioral science analyze their experimental data using linear 97
regressions3. Linear regression assumes continuous dependent variables which can hold values 98
below zero. To see how these assumptions might be violated with count data, imagine that we 99
are predicting the number of croissants eaten per day. A linear regression assumes that the values 100
are drawn from a continuous and symmetrical distribution around a mean, meaning that this 101
model might predict that someone eats 1.87 croissants, or even somehow consumes a negative 102
number of croissants. Further, linear regression assumes homoskedacity -- that the error term is 103
similar across values of the independent variable, an assumption which count data frequently 104
(though not always) violates. In short, count data exhibits characteristics that clearly violate 105
assumptions of linear regressions and based on this it may appear that using a linear regression to 106
analyze count data may be inappropriate. However, even though Poisson regressions do not 107
assume the same characteristics of the underlying data as linear regressions, Poisson regressions 108
bring a new set of assumptions to the table, assumptions that, as we will see, are often violated. 109
Thus, to decide which test to use on count data, we need to explore the assumptions of different 110
tests and investigate the consequences of violating these assumptions. 111
112
3 Linear, negative binomial, and Poisson regression are all versions of the generalized linear model. Readers interested in more detail on how these regressions relate to one another can refer to Gardner, Mulvey & Shaw 1995.
FALSE POSITIVE POISSON 7
Poisson Regressions 113
Poisson regression is a form of the generalized linear model which accommodates non-114
normal distributions of the dependent variable, and instead assumes that the dependent variable 115
has a Poisson distribution. This distribution expresses the probability that a given number of 116
events will occur in a fixed interval, assuming that these events occur at a known constant rate on 117
average and that each event is independent of the others. For example, Poisson might model the 118
number of fish you catch in the Seine after fishing for a given period of time, provided the rate at 119
which you catch fish is constant over time. Constant rate processes like these naturally have 120
identical means and variances, so the distribution has a single parameter, , which is equal to 121
both its mean and variance. This rigidness can cause problems when Poisson distributions are fit 122
to data which didn’t actually come from a Poisson process, where mean and variance are often 123
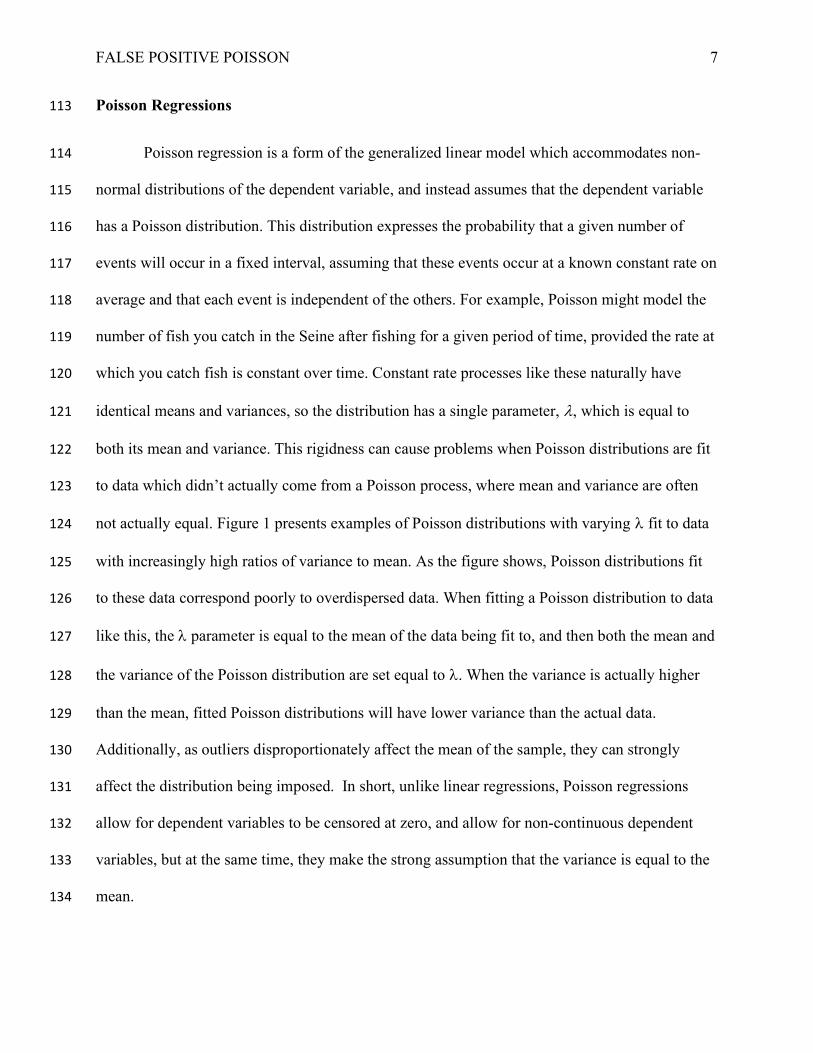
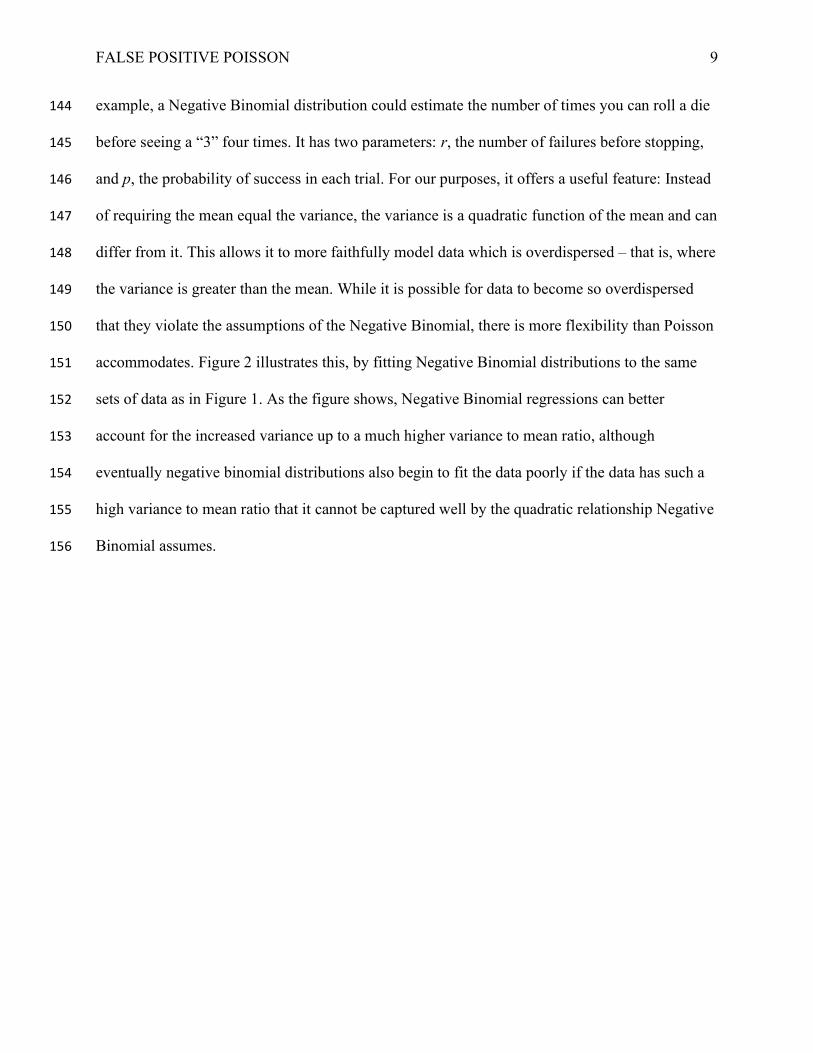
not actually equal. Figure 1 presents examples of Poisson distributions with varying fit to data 124
with increasingly high ratios of variance to mean. As the figure shows, Poisson distributions fit 125
to these data correspond poorly to overdispersed data. When fitting a Poisson distribution to data 126
like this, the parameter is equal to the mean of the data being fit to, and then both the mean and 127
the variance of the Poisson distribution are set equal to . When the variance is actually higher 128
than the mean, fitted Poisson distributions will have lower variance than the actual data. 129
Additionally, as outliers disproportionately affect the mean of the sample, they can strongly 130
affect the distribution being imposed. In short, unlike linear regressions, Poisson regressions 131
allow for dependent variables to be censored at zero, and allow for non-continuous dependent 132
variables, but at the same time, they make the strong assumption that the variance is equal to the 133
mean. 134
FALSE POSITIVE POISSON 8
135
Figure 1. Illustrates actual data with increasing variance to mean ratios (bars), as well as the 136
Poisson distribution fit to that data (black dots). 137
Negative Binomial regression 138
Like Poisson regression, Negative Binomial regression is another form of the generalized 139
linear model that accommodates non-normal distributions of the dependent variable, but it 140
assumes that the dependent variable takes a different form (for further discussion, see Cox, West, 141
& Aiken, 2009). The Negative Binomial distribution represents the number of successes in a 142
sequence of identical, independent Bernoulli trials before a given number of failures occur. For 143
FALSE POSITIVE POISSON 9
example, a Negative Binomial distribution could estimate the number of times you can roll a die 144
before seeing a “3” four times. It has two parameters: r, the number of failures before stopping, 145
and p, the probability of success in each trial. For our purposes, it offers a useful feature: Instead 146
of requiring the mean equal the variance, the variance is a quadratic function of the mean and can 147
differ from it. This allows it to more faithfully model data which is overdispersed – that is, where 148
the variance is greater than the mean. While it is possible for data to become so overdispersed 149
that they violate the assumptions of the Negative Binomial, there is more flexibility than Poisson 150
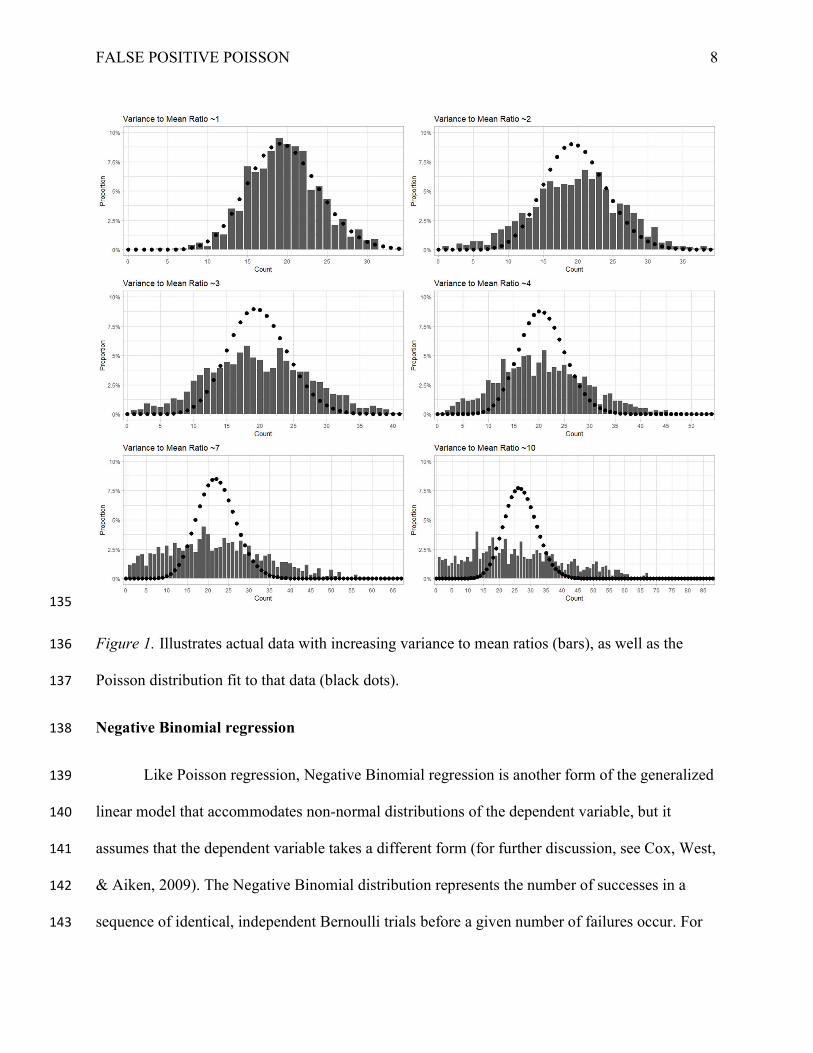
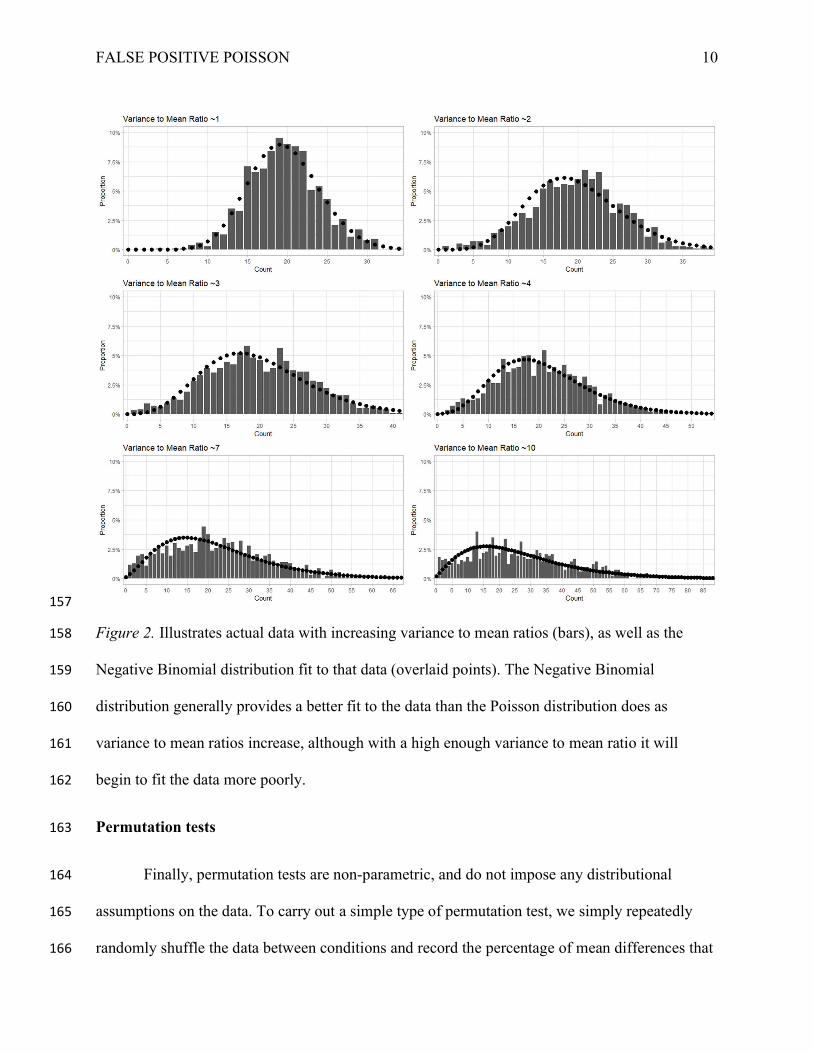
accommodates. Figure 2 illustrates this, by fitting Negative Binomial distributions to the same 151
sets of data as in Figure 1. As the figure shows, Negative Binomial regressions can better 152
account for the increased variance up to a much higher variance to mean ratio, although 153
eventually negative binomial distributions also begin to fit the data poorly if the data has such a 154
high variance to mean ratio that it cannot be captured well by the quadratic relationship Negative 155
Binomial assumes. 156
FALSE POSITIVE POISSON 10
157
Figure 2. Illustrates actual data with increasing variance to mean ratios (bars), as well as the 158
Negative Binomial distribution fit to that data (overlaid points). The Negative Binomial 159
distribution generally provides a better fit to the data than the Poisson distribution does as 160
variance to mean ratios increase, although with a high enough variance to mean ratio it will 161
begin to fit the data more poorly. 162
Permutation tests 163
Finally, permutation tests are non-parametric, and do not impose any distributional 164
assumptions on the data. To carry out a simple type of permutation test, we simply repeatedly 165
randomly shuffle the data between conditions and record the percentage of mean differences that 166
FALSE POSITIVE POISSON 11
are found which are greater than the one actually observed. This percentage is essentially a p-167
value – it tells you how frequently a value equal or greater to your observed mean difference 168
would be found if the null hypothesis was true. Because this makes no distributional assumptions 169
about the data, only about the randomization process, permutation tests are often more robust 170
than regressions when the exact distribution of the data is not known. 171
In short, when handling count data, different analyses are available, all with specific 172
assumptions about the distribution of the underlying data, that are likely to be violated to some 173
degree. To decide which analysis to use, we need to know the consequences of violating the 174
specific assumptions of these analyses. Frequently Poisson regressions are used, since there are 175
some ways count data corresponds well to its assumptions -- data can be censored at 0, and can 176
be non-continuous. However, if the ways that count data do not meet its assumptions – e.g. that 177
data should have a variance equal to the mean – counteracts these benefits, then scholars are 178
erroneously turning to an analysis tool that may make their conclusions less rather than more 179
reliable. This is what we investigate in our experiment and simulations. 180
Our experimental analysis and simulations focus on the above three regressions: linear, 181
Poisson, and Negative Binomial, as well as permutation tests, but additional options exist. For 182
example, quasi-Poisson regressions adjust statistical results to accommodate overdispersion. A 183
zero-inflated model can accommodate a large number of zero responses. We discuss these 184
alternate models, as well as formal statistical tests for overdispersion which can help you 185
determine which model to use, in the Appendix. 186
Experiment 187
To demonstrate how the improper use of Poisson regression can lead to misleading 188
results, we set out to test the highly implausible theory that seeing a blue shirt might prime 189
FALSE POSITIVE POISSON 12
thoughts of water, thereby affecting their consumption of Swedish Fish gummy candies. We pre-190
registered opposing hypotheses that the color of the experimenter’s shirt would either increase or 191
decrease Swedish fish consumption (the preregistration can be found at 192
http://aspredicted.org/blind.php?x=di2sg4). Materials, data, preregistrations, and all code for 193
experimental analysis, simulations, and tutorials can be found on our OSF page: 194
https://osf.io/kcgjb/?view_only=9282cabbc9044bdbbf101cd87e4a6f6e 195
Method 196
We approached participants on the plaza of a large university in the western United States 197
(N = 99, 51 females, 46 males, Mage = 21.6)4 and asked them to complete a survey for an 198
unrelated study. After completing the survey, participants chose how many Swedish Fish they 199
would like as compensation for their participation, and learned the experimenter would give 200
them whatever number they requested. Our experimental manipulation varied the color of the 201
experimenter’s shirt, which was either black or blue. Our randomization procedure had 202
experimenters switch shirts every 15 minutes. The sample size was based on the requirements of 203
the unrelated study, but we believe it reflects common sample sizes in Psychology. 204
Results 205
A Poisson regression revealed that participants in the blue shirt conditions ate 206
significantly more Swedish fish (M = 3.2, SD = 3.1) than participants in the black shirt condition 207
(M = 2.4, SD = 2.7, p = .016). Unlike the Poisson regression, alternative methods of analysis do 208
not reveal a significant difference (p > .17 for ANOVA and Negative Binomial regression). 209
4 Due to experimenter error, for 4 participants data on condition or fish taken was not recorded, and were necessarily excluded from analysis. For 2 additional participants where condition and fish taken was recorded, age was not, and these participants were not excluded.
FALSE POSITIVE POISSON 13
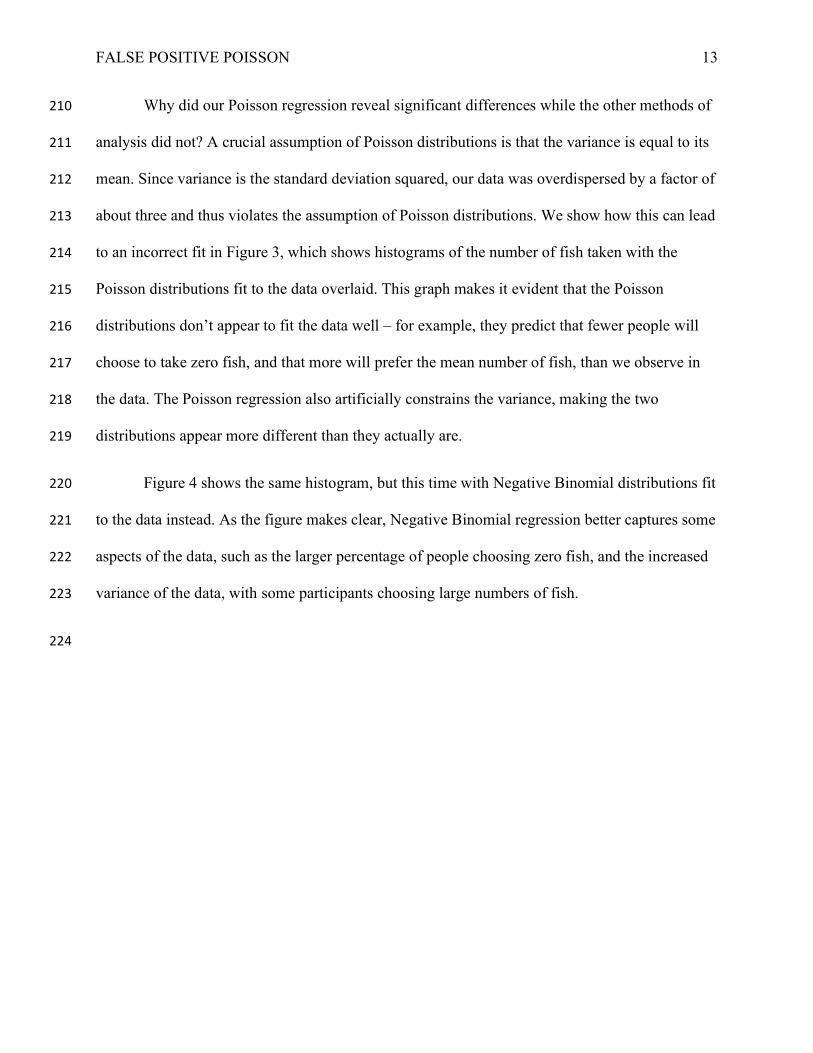
Why did our Poisson regression reveal significant differences while the other methods of 210
analysis did not? A crucial assumption of Poisson distributions is that the variance is equal to its 211
mean. Since variance is the standard deviation squared, our data was overdispersed by a factor of 212
about three and thus violates the assumption of Poisson distributions. We show how this can lead 213
to an incorrect fit in Figure 3, which shows histograms of the number of fish taken with the 214
Poisson distributions fit to the data overlaid. This graph makes it evident that the Poisson 215
distributions don’t appear to fit the data well – for example, they predict that fewer people will 216
choose to take zero fish, and that more will prefer the mean number of fish, than we observe in 217
the data. The Poisson regression also artificially constrains the variance, making the two 218
distributions appear more different than they actually are. 219
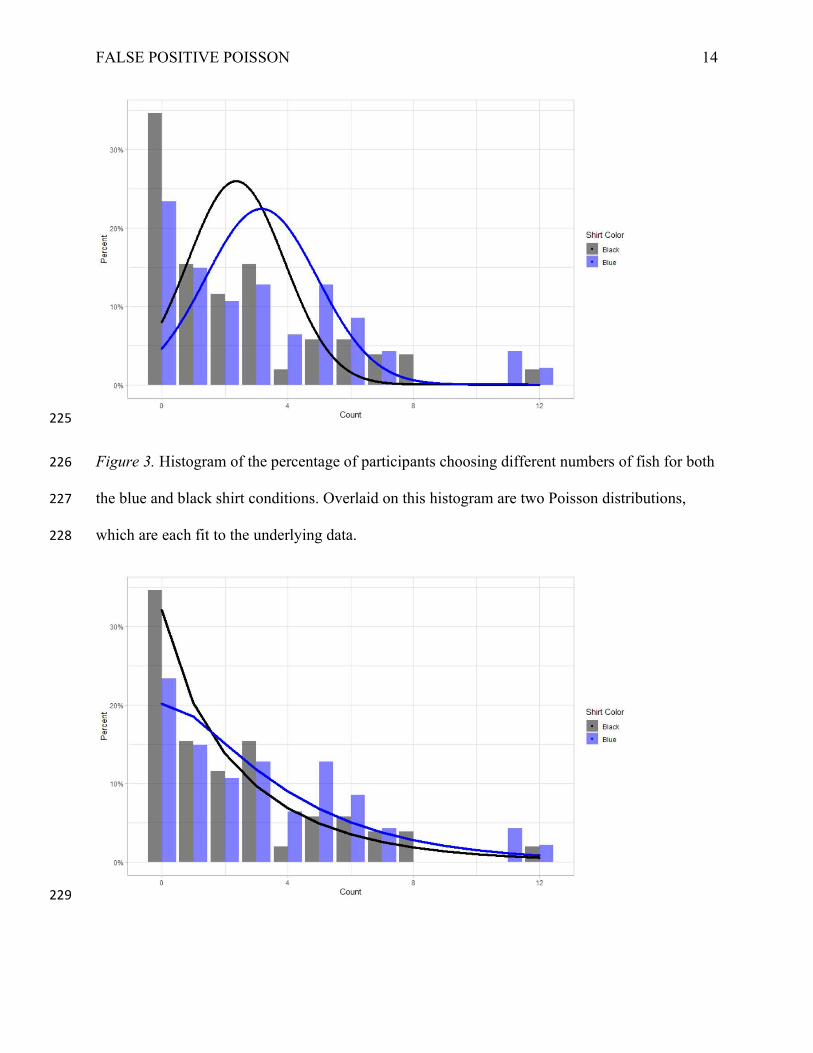
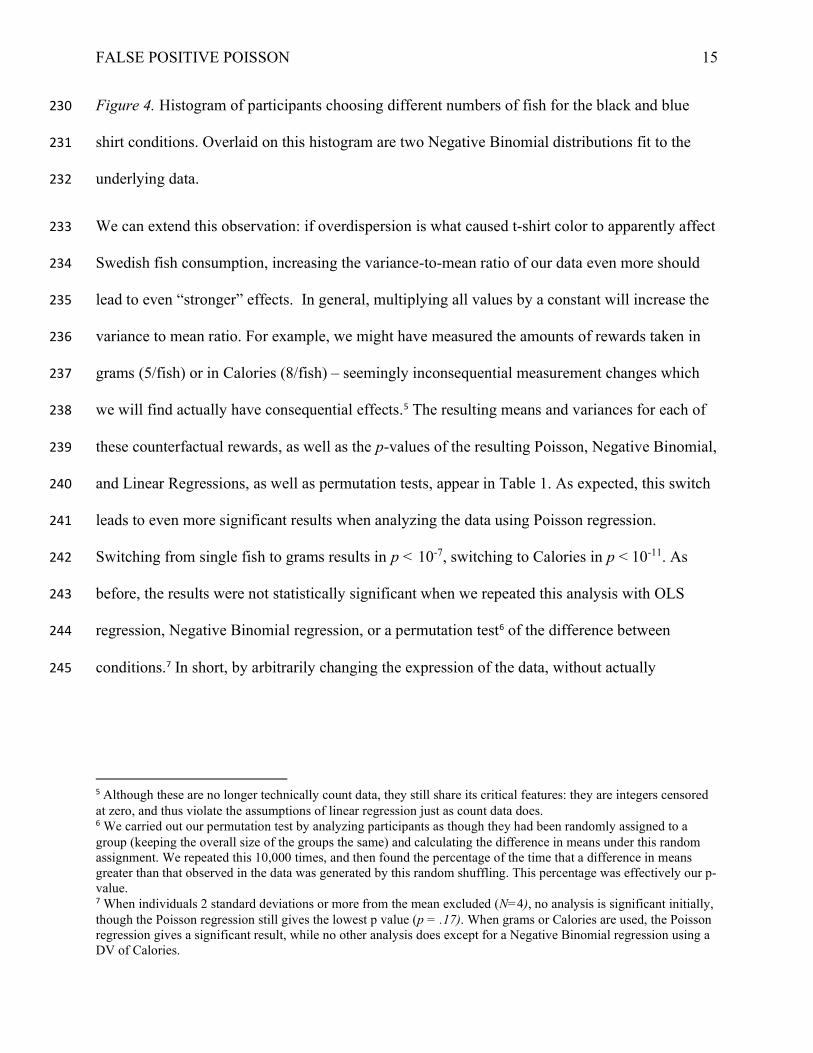
Figure 4 shows the same histogram, but this time with Negative Binomial distributions fit 220
to the data instead. As the figure makes clear, Negative Binomial regression better captures some 221
aspects of the data, such as the larger percentage of people choosing zero fish, and the increased 222
variance of the data, with some participants choosing large numbers of fish. 223
224
FALSE POSITIVE POISSON 14
225
Figure 3. Histogram of the percentage of participants choosing different numbers of fish for both 226
the blue and black shirt conditions. Overlaid on this histogram are two Poisson distributions, 227
which are each fit to the underlying data. 228
229
FALSE POSITIVE POISSON 15
Figure 4. Histogram of participants choosing different numbers of fish for the black and blue 230
shirt conditions. Overlaid on this histogram are two Negative Binomial distributions fit to the 231
underlying data. 232
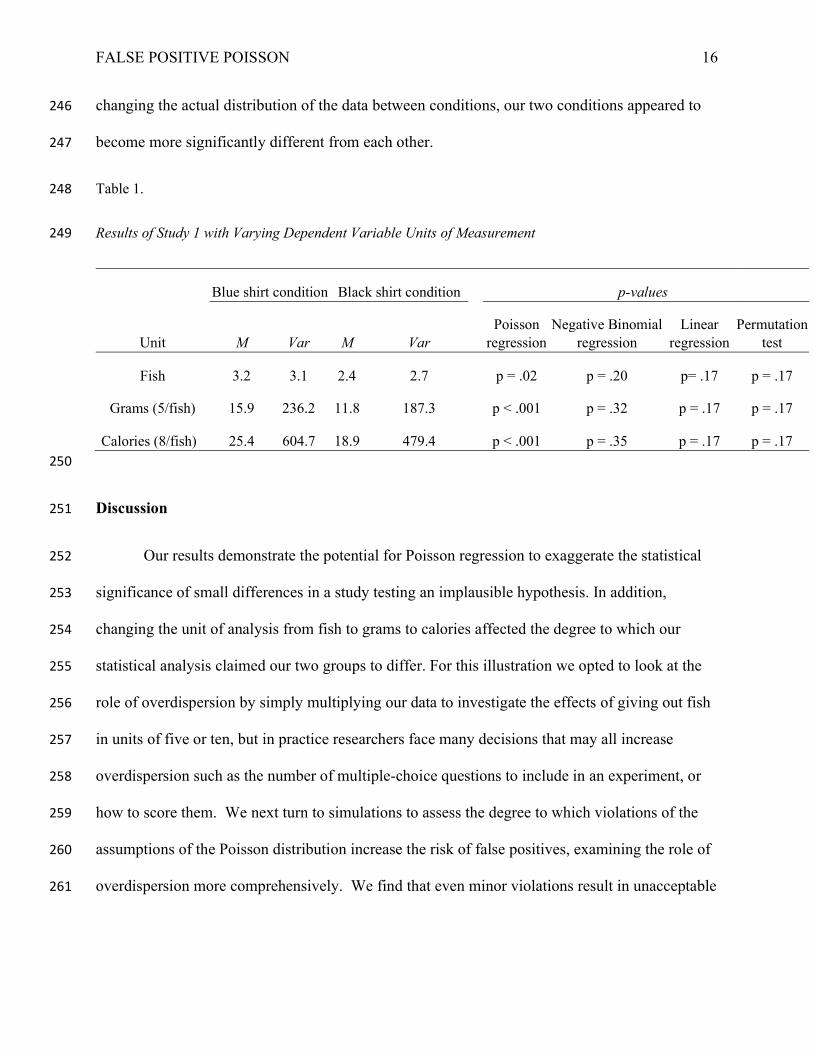
We can extend this observation: if overdispersion is what caused t-shirt color to apparently affect 233
Swedish fish consumption, increasing the variance-to-mean ratio of our data even more should 234
lead to even “stronger” effects. In general, multiplying all values by a constant will increase the 235
variance to mean ratio. For example, we might have measured the amounts of rewards taken in 236
grams (5/fish) or in Calories (8/fish) – seemingly inconsequential measurement changes which 237
we will find actually have consequential effects.5 The resulting means and variances for each of 238
these counterfactual rewards, as well as the p-values of the resulting Poisson, Negative Binomial, 239
and Linear Regressions, as well as permutation tests, appear in Table 1. As expected, this switch 240
leads to even more significant results when analyzing the data using Poisson regression. 241
Switching from single fish to grams results in p < 10-7, switching to Calories in p < 10-11. As 242
before, the results were not statistically significant when we repeated this analysis with OLS 243
regression, Negative Binomial regression, or a permutation test6 of the difference between 244
conditions.7 In short, by arbitrarily changing the expression of the data, without actually 245
5 Although these are no longer technically count data, they still share its critical features: they are integers censored at zero, and thus violate the assumptions of linear regression just as count data does. 6 We carried out our permutation test by analyzing participants as though they had been randomly assigned to a group (keeping the overall size of the groups the same) and calculating the difference in means under this random assignment. We repeated this 10,000 times, and then found the percentage of the time that a difference in means greater than that observed in the data was generated by this random shuffling. This percentage was effectively our p-value. 7 When individuals 2 standard deviations or more from the mean excluded (N=4), no analysis is significant initially, though the Poisson regression still gives the lowest p value (p = .17). When grams or Calories are used, the Poisson regression gives a significant result, while no other analysis does except for a Negative Binomial regression using a DV of Calories.
FALSE POSITIVE POISSON 16
changing the actual distribution of the data between conditions, our two conditions appeared to 246
become more significantly different from each other. 247
Table 1. 248
Results of Study 1 with Varying Dependent Variable Units of Measurement 249
Unit
Blue shirt condition Black shirt condition p-values
M Var M Var Poisson
regression Negative Binomial
regression Linear
regression Permutation
test
Fish 3.2 3.1 2.4 2.7 p = .02 p = .20 p= .17 p = .17
Grams (5/fish) 15.9 236.2 11.8 187.3 p < .001 p = .32 p = .17 p = .17
Calories (8/fish) 25.4 604.7 18.9 479.4 p < .001 p = .35 p = .17 p = .17 250
Discussion 251
Our results demonstrate the potential for Poisson regression to exaggerate the statistical 252
significance of small differences in a study testing an implausible hypothesis. In addition, 253
changing the unit of analysis from fish to grams to calories affected the degree to which our 254
statistical analysis claimed our two groups to differ. For this illustration we opted to look at the 255
role of overdispersion by simply multiplying our data to investigate the effects of giving out fish 256
in units of five or ten, but in practice researchers face many decisions that may all increase 257
overdispersion such as the number of multiple-choice questions to include in an experiment, or 258
how to score them. We next turn to simulations to assess the degree to which violations of the 259
assumptions of the Poisson distribution increase the risk of false positives, examining the role of 260
overdispersion more comprehensively. We find that even minor violations result in unacceptable 261
FALSE POSITIVE POISSON 17
increases in false positives. Further, we show that alternatives such as negative binomial or linear 262
regression yield fewer false positives. 263
Simulated Data 264
We generated count data randomly drawn from a Poisson distribution. We then modified 265
the simulated data in ways that result in data which violates the assumptions of Poisson (e.g., 266
making each answer count for three points instead of one, or increasing the range of a response 267
scale from seven to 100), and show that it increases the false positive rate. These simulations 268
employ a method known as permutation testing. Essentially, we randomly sample two groups of 269
data points from a Poisson distribution, and then transform the data to give ever-greater 270
violations of Poisson’s assumptions. We then use Poisson regressions to test whether the two 271
groups are statistically different from each other. We repeat this process many times, and then 272
record the percentage of the time that the Poisson regression returns a p-value less than .05, 273
indicating statistical significance. 274
Type I Error Simulations 275
Our permutation tests examining false positive rates sample both groups of data points 276
from an identical distribution.8 Since in this case there is no real difference in the underlying 277
distribution of the two groups, Poisson regressions should result in p-values < .05 in only 5% of 278
the simulations (a 5% false positive rate). 279
Besides a Poisson regression, we also used a Negative Binomial, a non-parametric 280
permutation test, and a linear regression9 on the same data so we can compare the false positive 281
8 For all the graphs shown here a Poisson distribution with a =1 was used, but testing with ranging from 1-10 shows no difference in results 9 This is equivalent to a t-test in this case
FALSE POSITIVE POISSON 18
rates. We repeated this process 10,000 times for each distribution, to determine how frequently 282
each test returned a p-value below .05. Because the datasets were all drawn from the same 283
underlying distribution, we should expect any properly functioning statistical test to reject the 284
null hypothesis (i.e., find a p-value <.05) only 5% of the time. Results of these simulations are 285
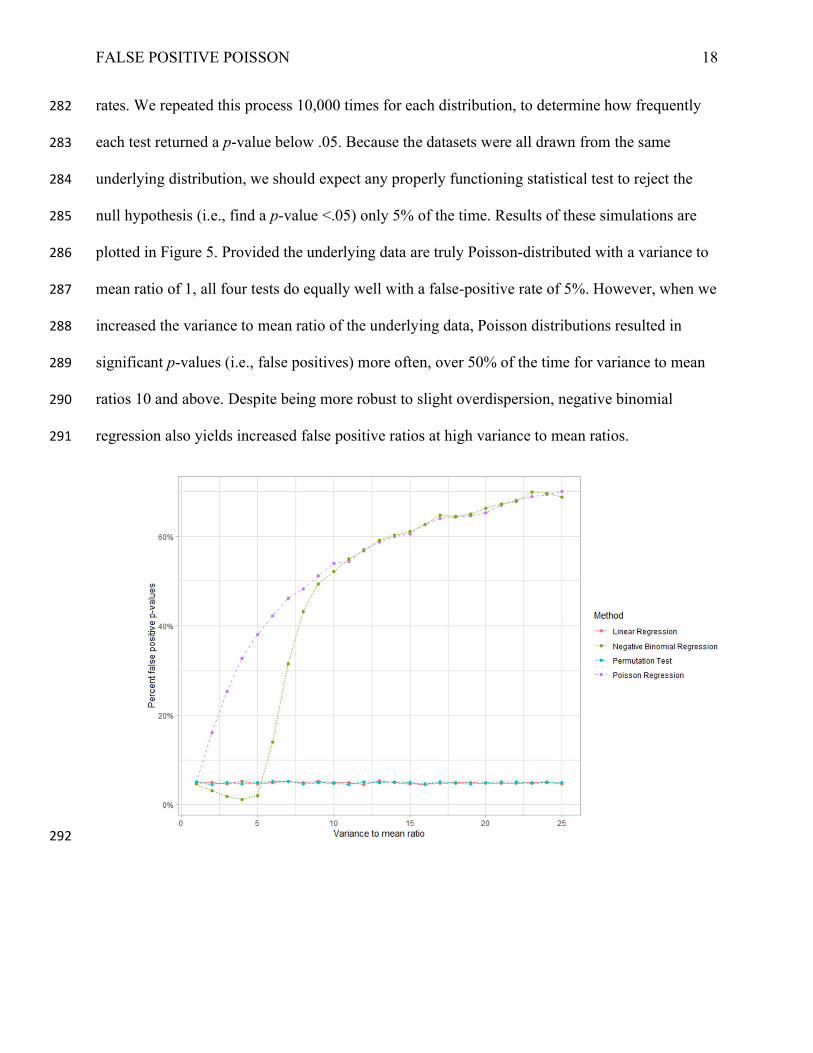
plotted in Figure 5. Provided the underlying data are truly Poisson-distributed with a variance to 286
mean ratio of 1, all four tests do equally well with a false-positive rate of 5%. However, when we 287
increased the variance to mean ratio of the underlying data, Poisson distributions resulted in 288
significant p-values (i.e., false positives) more often, over 50% of the time for variance to mean 289
ratios 10 and above. Despite being more robust to slight overdispersion, negative binomial 290
regression also yields increased false positive ratios at high variance to mean ratios. 291
292
FALSE POSITIVE POISSON 19
Figure 5. Simulation results plotting the proportion of significant results when in reality there is 293
no difference between the two groups, using a simulated sample size of 100 per cell. 294
Count data may be overdispersed naturally. However, there are also many ways that the 295
choices made in research design and analysis affect variance to mean ratios. For example, 296
changing the units data is measured in as in the Swedish Fish study, adding additional easy 297
questions which everyone will get correct, changing the number of options on a response scale, 298
and more can all change the variance to mean ratio. The wide variety of data and task design 299
choices which can lead to violations of the assumptions of Poisson make it critical to always be 300
aware of the danger of overdispersion. 301
Type II Error Simulations 302
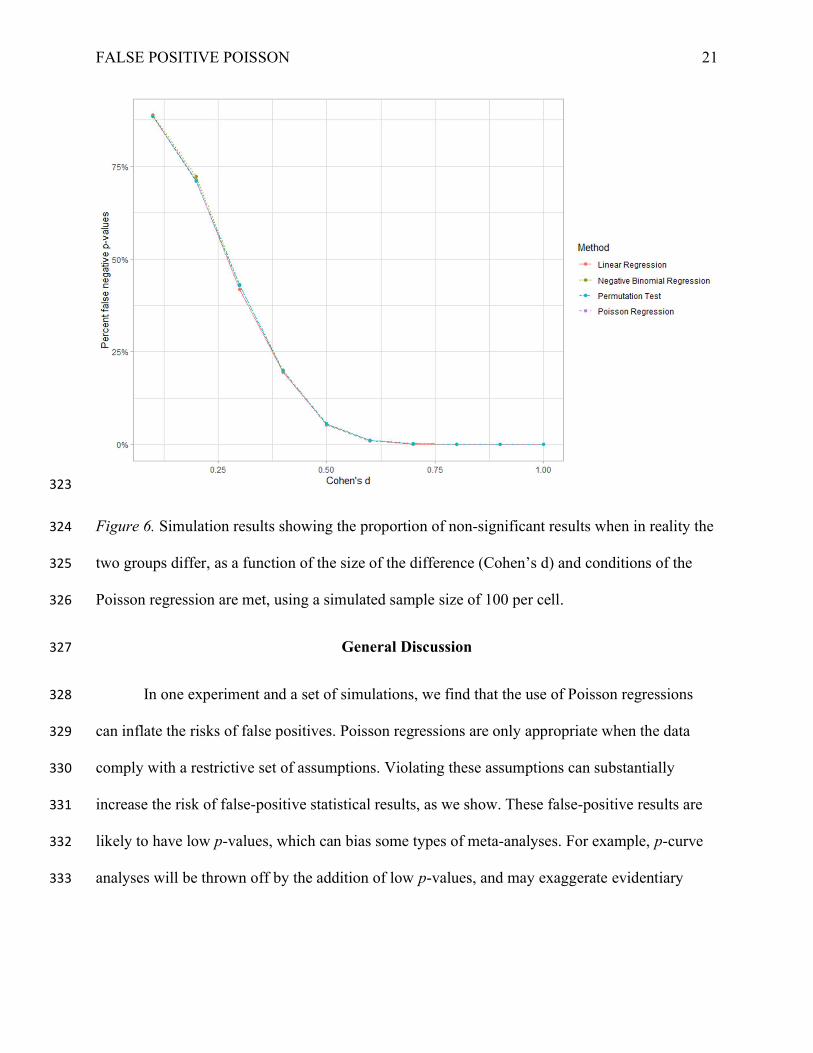
We address the risk of false negatives in our next set of simulations. We again ran a 303
permutation simulation, but in this case we simulated data from two Poisson distributions that 304
are different (varying the degree of difference plotted on the x-axis in Figure 6), using 1,000 305
iterations. When the assumptions of the Poisson are met, Poisson regressions have a rate of Type 306
II errors that is functionally identical to the three alternative methods. We show additional 307
simulations with varying sample sizes in the online experiment code, but results remain similar. 308
In other words, while Poisson regressions (compared to alternative methods) may increase the 309
risk of false positives, not using Poisson regressions does not appear to increase the chance of 310
getting false negatives. 311
Because the violation of Poisson assumptions increases the likelihood that Poisson 312
analyses will find significant differences, Negative Binomial regressions, permutation tests, and 313
t-tests will lead to higher rates of false negatives when Poisson’s assumptions are violated. 314
FALSE POSITIVE POISSON 20
However, while Poisson regressions do give fewer false negatives when the assumptions are 315
violated, this is because they are generating more false positives in general. For an extreme 316
example of why more false positives means fewer false negatives, consider a hypothetical 317
statistical test which assumed that 100% of relationships were significant. This test would never 318
generate false negatives, but it would be at the cost of a 100% false positive rate when in reality 319
there are no differences. Given the harmful consequences of false positives (Pashler & Harris, 320
2012), we don’t believe this is a valid reason to use Poisson distributions when the data violate 321
the assumptions. 322
FALSE POSITIVE POISSON 21
323
Figure 6. Simulation results showing the proportion of non-significant results when in reality the 324
two groups differ, as a function of the size of the difference (Cohen’s d) and conditions of the 325
Poisson regression are met, using a simulated sample size of 100 per cell. 326
General Discussion 327
In one experiment and a set of simulations, we find that the use of Poisson regressions 328
can inflate the risks of false positives. Poisson regressions are only appropriate when the data 329
comply with a restrictive set of assumptions. Violating these assumptions can substantially 330
increase the risk of false-positive statistical results, as we show. These false-positive results are 331
likely to have low p-values, which can bias some types of meta-analyses. For example, p-curve 332
analyses will be thrown off by the addition of low p-values, and may exaggerate evidentiary 333
FALSE POSITIVE POISSON 22
strength (Simonsohn, Nelson, & Simmons, 2014). Other meta-analyses may be skewed by 334
inflated effect size estimates (Vosgerau, Simonsohn, Nelson & Simmons, 2019). 335
Taken as a whole, our results suggest that Poisson results are often fishy. Unless the 336
assumptions of Poisson regression are fully satisfied, it should be avoided. Fortunately, linear 337
regressions and permutation tests offer good alternatives to Poisson regression. Negative 338
Binomial regressions are more broadly useful than Poisson regressions but can also yield false 339
positives when variance to mean ratios become very high. In particular, linear regressions are 340
robust to violations of their assumptions, and permutation tests are robust by virtue of not 341
making assumptions about the distribution of the data to begin with. Appendix I provides 342
additional data on distributions, tests for determining if data are overdispersed, carrying out 343
alternative analyses, and links to further resources for using alternative methods. Tutorial code 344
carrying out these analyses can be found at the paper’s OSF page: 345
https://osf.io/kcgjb/?view_only=9282cabbc9044bdbbf101cd87e4a6f6e. A simple initial test for 346
overdispersion is to compare the mean of the data with its variance (the standard deviation 347
squared) – if the variance is greater than the mean, overdispersion may render Poisson 348
inappropriate.10 When interpreting papers presenting Poisson analyses of count data, there is no 349
simple heuristic to adjust their results, and it is likely better to omit papers using Poisson from 350
meta-analyses lest they skew results. 351
352
10 Even if this ratio is only slightly positive, this should be cause for concern and the use of either an alternative to Poisson or the tests for overdispersion given in the Appendix code
FALSE POSITIVE POISSON 23
Author contributions 353
WH Ryan and ERK Evers designed the experimental study and gathered data. WH Ryan analyzed the 354
experimental data and designed and carried out the simulation study, with input from ERK Evers and DA 355
Moore. WH Ryan and ERK Evers drafted the manuscript, and DA Moore provided critical revisions. All 356
authors approved final version of the manuscript for submission. 357
Acknowledgements: 358
Thanks to Stephen Baum and Ekaterina Goncharova for their assistance collecting data for the 359
study, as well as Amelia Dev, Andrew Zheng, Winnie Yan, Mitchell Wong, and Maya Shen for 360
their assistance conducting the literature reviews. Additional thanks to Stephen Antonoplis, 361
Kristin Donnelly, Yoel Inbar, Alex Park, and Sydney Scott (in alphabetical order) for reviewing 362
an early version of this manuscript, and to Kristin Donnelly for suggesting the hypothesis for the 363
illustrative study. Thanks also to anonymous reviewers for their useful comments. 364
365
366
367
FALSE POSITIVE POISSON 24
References 368
Coxe, S., West, S. G., & Aiken, L. S. (2009). The Analysis of Count Data: A Gentle Introduction 369
to Poisson Regression and Its Alternatives. Journal of Personality Assessment, 91(2), 121–370
136. https://doi.org/10.1080/00223890802634175 371
Dewall, C., Finkel, E., Lambert, N., Slotter, E., Bodenhausen, G., Pond, R., Renzetti, C., & 372
Fincham, F. (2013). The voodoo doll task: introducing and validating a novel method for 373
studying aggressive inclinations. Aggressive Behavior, 39(6), 419-439. 374
https://doi.org/10.1002/ab.21496 375
Gardner, W., Mulvey, E. P., & Shaw, E. C. (1995). Regression analyses of counts and rates: 376
Poisson, overdispersed Poisson, and negative binomial models. Psychological Bulletin, 377
118(3), 392-404. http://dx.doi.org/10.1037/0033-2909.118.3.392 378
Hellevik, O. (2009). Linear versus logistic regression when the dependent variable is a 379
dichotomy. Quality & Quantity, 43(1), 59–74. https://doi.org/10.1007/s11135-007-9077-3 380
Pashler, H., & Harris, C. R. (2012). Is the Replicability Crisis Overblown? Three Arguments 381
Examined. Perspectives on Psychological Science, 7(6), 531–536. 382
https://doi.org/10.1177/1745691612463401 383
Simmons, J. P., Nelson, L. D., & Simonsohn, U. (2011). False-Positive Psychology. 384
Psychological Science, 22(11), 1359–1366. https://doi.org/10.1177/0956797611417632 385
FALSE POSITIVE POISSON 25
Simonsohn, U., Nelson, L. D., & Simmons, J. P. (2014). P-Curve: A Key to the File Drawer. 386
Journal of Experimental Psychology: General, 143(2), 534–547. 387
Vosgerau, J., Simonsohn, U., Nelson, L. D., & Simmons, J. P. (2019). 99% impossible: A valid, 388
or falsifiable, internal meta-analysis. Journal of Experimental Psychology: General, 148(9), 389
1628–1639. https://doi.org/10.1037/xge0000663 390
391
392
FALSE POSITIVE POISSON 26
Online Appendix I: Additional information on regressions and statistical tests 393
This appendix provides additional information on alternative regressions for count data, methods 394
for testing for overdispersion, a discussion of how to choose between methods, and references to 395
further resources. Example R code which runs the analyses and tests discussed here can be found 396
in the Code > Appendix Tutorial Code section of this paper’s OSF page: 397
https://osf.io/kcgjb/?view_only=9282cabbc9044bdbbf101cd87e4a6f6e. 398
Quasi-Poisson Regression 399
Unlike Negative Binomial regressions, which use a different statistical distribution which 400
may better fit the data, a quasi-Poisson regression still assumes the Poisson distribution, but 401
adjusts the inferential statistics arising from it to help account for overdispersion. This 402
adjustment adds a scale parameter which allows variance to be a linear function of the mean, 403
meaning that the two do not have to be equal, unlike in the Poisson regression, where the ratio is 404
assumed to be 1 to 1. Standard errors and test statistics are then corrected based on this 405
parameter. 406
Zero-inflated models 407
Poisson regressions tend to assume that a very small percentage of all values are zeroes. 408
However, in practice it is often the case that there will be more zero values in the data than you 409
expect. For example, in our experiment looking at the number of Swedish Fish chosen by 410
participants, a significant number of participants were not interested in receiving any Swedish 411
Fish at all. In order to account for this, we model the data generating process in two stages: first, 412
a new first step which determines if a value will be zero or not, and then a step in which we 413
determine what each value is conditional on it not being zero. This correction is often 414
FALSE POSITIVE POISSON 27
accomplished by first using a logistic regression to predict if values will be zero, and then using a 415
Poisson regression to predict the values of non-zero values. However, this is really a more 416
general procedure -- the same logic can apply to other regression models. For example, it would 417
be possible to use some other regression to determine if a value is zero or not, such as probit, or a 418
different regression for determining values conditional on them not being zero, such as a 419
Negative Binomial regression. This may be necessary if zero-inflation isn’t the only way that the 420
data violated the assumptions of a Poisson regression – for example, even after accounting for 421
the larger number of zeroes in the data, the data could still be overdispersed nonetheless. One 422
implementation of zero-inflated models can be found in the R package pscl (Jackman 2020). 423
Tests of Overdispersion 424
There are a number of ways to test if the assumptions of the Poisson distribution hold. 425
The R code attached to this article demonstrates a number of different tests of over- and under-426
dispersion which can be carried out. A simple initial heuristic test is to compare the mean and 427
variance of the data to one another and do a simple comparison. If the variance is higher than the 428
mean, overdispersion is likely, and may be damaging. Another simple method is to fit a Poisson 429
model to the data, and check if residual deviance is greater than residual degrees of freedom. A 430
common rule of thumb is that if the ratio of residual deviance divided by residual degrees of 431
freedom is greater than two, overdispersion may be present. If this is the case, this may indicate 432
overdispersion, although this test can be misleading. However, there are also more formal 433
statistical tests which can be carried out which will provide a more robust test. 434
One option is using a parametric, regression-based test for overdispersion (Cameron & 435
Trivedi 1990, see also Cameron & Trivedi 2001, Cameron & Trivedi 2005). What this 436
essentially does is test the hypothesis that the assumption that mean is equal to variance holds in 437
FALSE POSITIVE POISSON 28
the data against an alternative hypothesis that the variance is actually better described by a 438
function which allows variance to vary from the mean. If the null hypothesis (that mean is equal 439
to variance) is rejected, this signals that there may be under or overdisperson. It can also use an 440
OLS regression to estimate the degree of under- or overdispersion. This is implemented in the 441
aer package in R through the function dispersiontest (Kleiber & Zeileis 2008). 442
Another option is examining the residuals of a fitted Poisson regression model, and from 443
these determining if over- or under-dispersion is present using a non-parametric test. One 444
implementation comes from the DHARMa package in R, using the simulateResiduals and 445
testDispersion functions as demonstrated in the attached R code (Hartig 2016). 446
Deciding which model to use 447
It is not possible to give a complete guide to when to use each type of regression. If you 448
know there is some overdispersion, an OLS regression or non-parametric permutation test may 449
be sufficient, and probably always makes sense as a robustness check. However, if you want to 450
have something which may more closely follow the distribution, then you should probably 451
switch to using quasi-Poisson or Negative Binomial. Which of those two to use is tricky to 452
determine, but there are reasons to choose either. It is not always obvious which of the two 453
methods – Negative Binomial or quasi-Poisson – will provide the best fit to the data. Because 454
quasi-Poisson is technically an adjustment to inferential statistics, not a distribution of its own, it 455
is difficult to compare it with Negative Binomial using likelihood-based measures of model fit, 456
and it is probably best to examine both fits relative to your data. For a useful discussion of how 457
the different weighting parameters in Negative Binomial and Quasi-Poisson models can be more 458
(or less) appropriate for data as well as an example, see Ver Hoef and Boveng (2007). 459
FALSE POSITIVE POISSON 29
Online Appendix II: Distributions of variance to mean ratios in practice 460
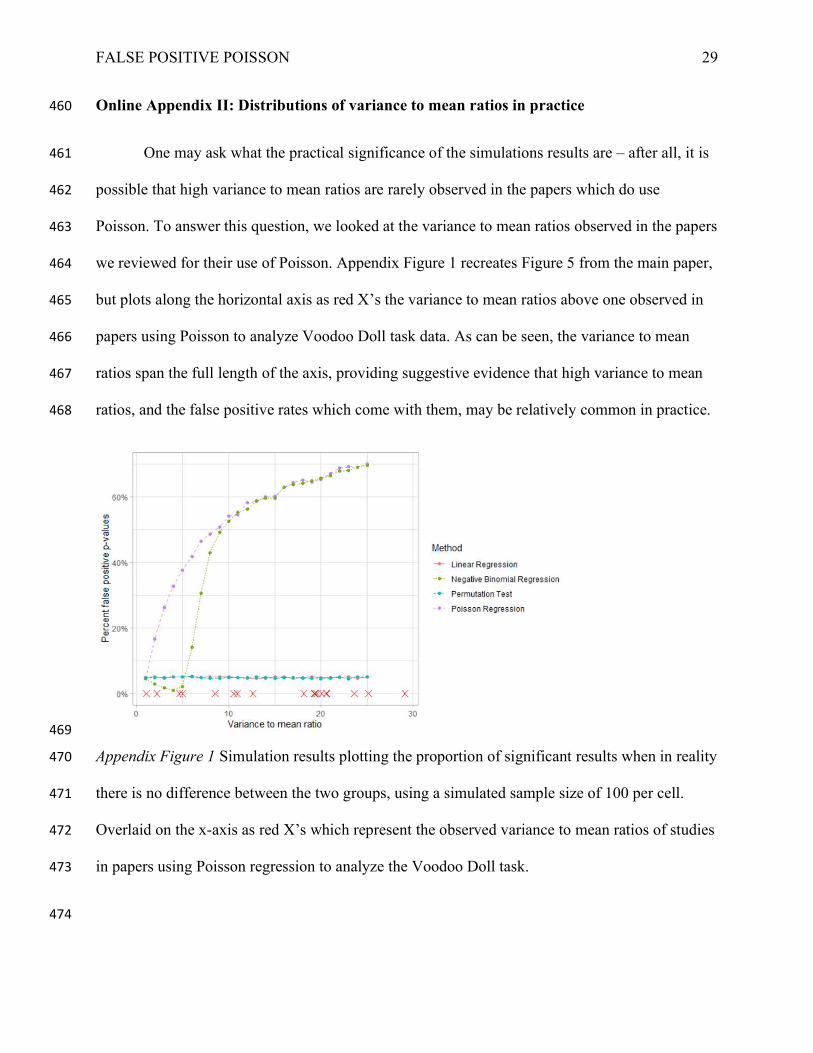
One may ask what the practical significance of the simulations results are – after all, it is 461
possible that high variance to mean ratios are rarely observed in the papers which do use 462
Poisson. To answer this question, we looked at the variance to mean ratios observed in the papers 463
we reviewed for their use of Poisson. Appendix Figure 1 recreates Figure 5 from the main paper, 464
but plots along the horizontal axis as red X’s the variance to mean ratios above one observed in 465
papers using Poisson to analyze Voodoo Doll task data. As can be seen, the variance to mean 466
ratios span the full length of the axis, providing suggestive evidence that high variance to mean 467
ratios, and the false positive rates which come with them, may be relatively common in practice. 468
469
Appendix Figure 1 Simulation results plotting the proportion of significant results when in reality 470
there is no difference between the two groups, using a simulated sample size of 100 per cell. 471
Overlaid on the x-axis as red X’s which represent the observed variance to mean ratios of studies 472
in papers using Poisson regression to analyze the Voodoo Doll task. 473
474
FALSE POSITIVE POISSON 30
475
Appendix References 476
Cameron, A. C., & Trivedi, P. K. (1990). Regression-based tests for overdispersion in the 477
Poisson model. Journal of Econometrics, 46(3), 347–364. https://doi.org/10.1016/0304-478
4076(90)90014-k 479
Cameron, A. C., & Trivedi, P. K. (2001). Essentials of Count Data Regression. In A Companion 480
to Theoretical Econometrics (pp. 331–348). Blackwell Publishing Ltd. 481
https://doi.org/10.1002/9780470996249.ch16 482
Cameron, A. and Trivedi, P. (2005). Microeconometrics, Cambridge University Press. 483
Hartig, F. (2016). DHARMa: residual diagnostics for hierarchical (multi-level/mixed) regression 484
models. R Package version 0.4.1. https://CRAN.R-project.org/package=DHARMa 485
Jackman, S. (2020). pscl: Political Science Computational Laboratory. R package version 1.5.5. 486
https://cran.r-project.org/package=pscl 487
Kleiber, C & Zeileis, A. (2008). Applied Econometrics with R. Springer-Verlag, New York. 488
ISBN 978-0-387-77316-2, https://CRAN.R-project.org/package=AER. 489
Ver Hoef, J. M., & Boveng, P. L. (2007). Quasi-Poisson vs. Negative Binomial Regression: How 490
Should we Model Overdispersed Count Data? Ecology, 88(11), 2766–2772. 491
https://doi.org/10.1890/07-0043.1 492
493
Related Documents