Sohrab Siddiqui Date: 04/18/2015 Run-Off-Road (ROR) Crashes: A Description of Conventional and Contemporary Countermeasures

Welcome message from author
This document is posted to help you gain knowledge. Please leave a comment to let me know what you think about it! Share it to your friends and learn new things together.
Transcript
Page | 1
Sohrab Siddiqui
Date: 04/18/2015
Run-Off-Road (ROR) Crashes: A Description of Conventional and Contemporary
Countermeasures
Page | 1
Contents Introduction ................................................................................................................................................. 1
Rural and Urban ROR Crashes ................................................................................................................. 6
Critical Reasons for ROR Crashes .......................................................................................................... 10
Critical Reasons Attributed to Drivers: ................................................................................................... 11
Driver Alcohol Presence ..................................................................................................................... 13
Critical Reasons Attributed to Vehicles .................................................................................................. 15
Critical Reasons Attributed to Environment ........................................................................................... 15
Critical Reasons for ROR Crashes involving Large Trucks ................................................................... 15
Crash-Associated Factors in Single-Vehicle ROR Crashes .................................................................... 17
Conventional Countermeasures for reducing ROR Crashes ................................................................ 21
Strategies to Keep Vehicles from Encroaching on the Roadside ............................................................ 24
Shoulder Rumble Strips: ..................................................................................................................... 24
Edgeline Rumble Strips for Roads with Narrow or Unpaved Shoulders: ........................................... 25
Midlane Rumble Strips: ...................................................................................................................... 25
Enhanced Delineation of Sharp Curves: ............................................................................................. 25
Improved Highway Geometry for Horizontal Curves: ....................................................................... 25
Enhanced Pavement Markings at Appropriate Locations ................................................................... 25
Skid-Resistant Pavements: .................................................................................................................. 26
Shoulder Treatments: .......................................................................................................................... 26
Minimize the Likelihood of Crashing into an Object or Overturning if the Vehicle Travels Off the
Shoulder .................................................................................................................................................. 28
Design Safer Slopes and Ditches to Prevent Rollovers: ..................................................................... 28
Remove/Relocate Objects in Hazardous Locations: ........................................................................... 28
Delineation of Roadside Objects: ....................................................................................................... 29
Reduce the Severity of the Crash ............................................................................................................ 29
Improve Design of Roadside Hardware or Application of Barrier and Attenuation Systems: ........... 29
Contemporary Countermeasures for reducing ROR Crashes ............................................................. 30
Effects of ABS and ESC on ROR Crashes ............................................................................................. 30
Effects of LDWS on ROR Crashes ......................................................................................................... 32
Conclusion / Discussion ............................................................................................................................ 33
Areas of Future Research ........................................................................................................................ 34
References .................................................................................................................................................. 34
Page | 1
Executive Summary A vehicle sometimes leaves the travel lane and encroaches onto the shoulder, median, roadside, parking
lane, gore, or a separator and hits one or more natural or artificial objects. This type of crash is called a run-
off-road (ROR) or Roadway Departure (RwD) crash. If this crash involves a single vehicle hitting objects
on the roadside or medians, it is called a single vehicle ROR (SVROR) crash. SVROR crashes result in
large proportion of fatalities and serious injuries in the United States. Around 70% of all fatal single vehicle
crashes are ROR crashes. Furthermore single vehicle ROR crashes accounts for more than 40% of total
fatalities in the United States.
Each year roadside crashes in the United States cost society an estimated $110 billion, killing approximately
15,000 people and injuring another 1,000,000. Besides the United States, ROR crashes are gaining attention
of other countries. According to World Health Organization (WHO, 2013), 1.24 million people die annually
due to road accident and this number is expected to rise by 67% in the year 2020. Of this 1.2 million
fatalities, single-vehicle ROR crashes constitute more than 35 percent.
This report has thoroughly investigated the problems associated with ROR crashes, their relative
importance, the critical reasons associated with pre-crash events, and contributing factors to the crashes.
Furthermore, a thorough review of the conventional and contemporary countermeasures are presented. A
comprehensive review of literature on run-off-road crashes was done in order to identify the reasons behind
ROR crashes and ways to mitigate the risks associated with ROR crashes. References are provided in the
last part of the report for the reader who is interested to know more about this issue.
The following are some highlights from this study:
Single vehicle ROR crashes constituted 40.6% of the fatal crashes, 20% of the injury crashes and
11.2% of the Property Damage Only (PDO) in the United States in the year 2012.
Of the fatal SVROR crashes, 37% occurred off roadway, 2% on shoulder and 4% on median.
The first harmful event for 25% of fatal SVROR crashes were trees and shrubberies followed by
rollover (19%) and embankment (10%). The most harmful event for more than 40% of fatal
SVROR crashes were rollovers followed by shrubberies/ trees (29%) and utility poles (8%).
Around 80% of fatal SVROR crashes occur on rural roadways of which 90% occur on two-lane
highways. In Montana which is mostly a rural states, 60% percent of all fatal crashes are SVROR
crashes. In rural counties of Montana, more than 65% percent of all fatal crashes are SVROR
crashes.
Of the critical reasons for pre-crash events in fatal and non-fatal ROR crashes, 95.1% is attributed
to drivers, 1% to vehicles and 1.1% to roadway and environment. This shows the importance of
finding countermeasures to minimize driver errors.
The most prominent driver errors include, internal distraction (15%), overcompensation (14.3%),
poor directional control (12.6%), too fast of the curve (11%) and driver sleeping (10.3%). Alcohol
use increases the overcompensation problem to 23.4% and directional control problem to 21.7%.
Brake failure (32.7%) and tire failure (25.6%) are the two common vehicle –attributed errors. Slick
road conditions contributed to more than 60% of environment-attributed errors for SVROR crashes.
Sleeping and heart-attack problems were the critical reason for almost 50% of truck-related
SVROR crashes.
Among the crash-associated factors (see the difference between critical reasons and factors in the
report) for SVROR crashes, driver inattention, driver fatigue and driver in a hurry carried an odds-
ratio of more than 3 (meaning that the odds of being involved in a crash is almost 3 times higher if
a factor is present than if the factor is not present).
Page | 1
Of the tried and proven conventional countermeasures for reducing ROR crashes, the most famous
are: shoulder rumble strips, improved horizontal curves, skid-resistant pavements, shoulder
treatments, safer sideslopes and ditches, improved roadside hardware and wider clearzones. Some
experimental countermeasures like edgeline rumble strips, midlane rumble strips, enhanced
pavement markings and enhanced delineation of sharp curves and roadside objects are also
described in this report.
Of the contemporary countermeasures, anti-lock braking system (ABS), electronic stability control
(ESC) and lane departure warning system (LDWS) together with their benefits are presented in this
report.
In the last part of the report, a conclusion / discussion of the topics described within the report and areas of
future research that needs to be expanded further in order to better understand ROR crashes and their
countermeasures are provided. The reader is persuaded to refer to the references in the final part of the
report if he/she wants to know more about ROR crashes.
Page | 1
List of Tables Table 1. Crashes by crash type, relation to roadway, and crash severity…………………………………….2
Table 2. Crashes by First Harmful Event, Manner of Collision, and Crash Severity………………………4
Table 3. Single Vehicle, Run-Off-the-Road Fatal and Total Crashes in Montana…………………………7
Table 4. Single Vehicle, Rural Run-Off-the-Road Fatal and Total Rural Crashes in Montana……………8
Table 5. Critical Reasons Coded for the Single-Vehicle ROR and “Other” Crash Events…………………11
Table 6. Critical Reasons for the Single-Vehicle ROR and “Other” Crash Events Attributed to Drivers…12
Table 7. Critical Reasons for the Single-Vehicle ROR Crash Events Attributed to Drivers with Versus
without the Presence of Alcohol in the Driver……………………………………………………………..14
Table 8. Critical Reasons for the Single-Vehicle ROR and “Other” Crash Events Attributed to Vehicles…15
Table 9. Critical Reasons for the Single-Vehicle ROR and “Other” Crash Events Attributed to
Environment……………………………………………………………………………………………….15
Table 10. Critical Reasons for the Large-Truck Single-Vehicle ROR and “Other” Crash Events…………16
Table 11. Crash-Associated Factors in Single-Vehicle ROR Crashes……………………………………18
Table 12. Logistic Regression Coefficients and Odds Ratios……………………………………………...21
Table 13. Benefits of using ABS and ESC in reducing ROR crashes………………………………………31
Page | 1
List of Figures Figure 1. Single-Vehicle ROR Crashes as a Percentage of All Fatal Crashes……………………………...1
Figure 2. Distribution of Fatal ROR Crashes…………………………………………………………….....2
Figure 3. Fatal Single Vehicle Crashes……………………………………………………………………..3
Figure 4. Fatal Multiple Vehicles Crashes………………………………………………………………….3
Figure 5. Distribution of Single-Vehicle ROR Fatalities for Two-Lane, Undivided, Noninterchange,
Nonjunction Roads by First Harmful Event………………………………………………………………5
Figure 6. Distribution of Single-Vehicle ROR Fatalities for Two-Lane, Undivided, Noninterchange,
Nonjunction Roads by Most Harmful Event………………………………………………………………..5
Figure 7. Distribution of Single-Vehicle ROR Fatalities on Two-Lane, Undivided, Noninterchange,
Nonjunction Roads by Highway Type……………………………………………………………………...6
Figure 8. Fatalities for Rural and Urban SVROR Crashes…………………………………………………7
Figure 9. Single-Vehicle ROR Crashes in Montana………………………………………………………..8
Figure 10. Single-Vehicle ROR Rural Crashes in Montana………………………………………………..8
Figure 11. Comparison of Statewide and Rural Fatal SVROR in Montana………………………………..9
Figure 12. SVROR Crash Percentages for States…………………………………………………………..9
Figure 13. ROR Crash Percentages for Montana Counties……………………………………………….11
Figure 14. Critical Reasons for SVROR Crashes and "Other" Crashes Comparison……………………..11
Figure 15. Driver-Related Error Categories for ROR and "Other" Crashes………………………………12
Figure 16. Top 5 Critical Reasons attributed to Drivers for SVROR Crashes……………………………13
Figure 17. Comparison of Driver-Related Error Categories for drivers with and without the presence of
Alcohol…………………………………………………………………………………………………….14
Figure 18. Comparison of Major Critical Reasons for the Passenger Vehicle and Large-Truck Single-
Vehicle ROR Crash Events………………………………………………………………………………..17
Figure 19. FHWA RwD Team strategies to mitigate most common roadway departure fatal and serious
injury crashes……………………………………………………………………………………………...23
Figure 20. Before and After Data for Selected Single-Vehicle ROR Crashes on the New York Thruway
(Source: New York State Police…………………………………………………………………………..24
Figure 21. Accident Modification Factor for Paved Shoulder Width (Relative to 6-Foot Paved Shoulder)
on Two-Lane Rural Highways…………………………………………………………………………….27
Figure 22. Accident Modification Factor for Shoulder Type on Two-Lane Rural Highways…………….27
Figure 23. Percent Reduction in Related Accident Types (i.e., ROR+ head-on+ sideswipe)…………….29
Figure 24. Lane Drift Warning System Functional Blocks…………………………………………….…32
Figure 25. Citroen Designed LDWS………………………………………………………………………32
Page | 1
Introduction American Association of State Highway and Transportation Officials (AASHTO) has embraced a vision of
“Towards Zero Deaths” and a goal of cutting fatalities in half by 2030. According to Federal Highway
Administration (FHWA, 2013), in order to accomplish this goal we need to reduce approximately 1,000
fatalities per year. Although many types of crashes contribute to the current fatality rates in the US, Run-
off-Road (ROR) crashes continue to account for more than 40% of the fatalities and fatal crashes.
According to FHWA, a roadway departure (RwD) crash or ROR crash is defined as a non-intersection crash
which occurs after a vehicle leaves the traveled way, crossing the center line of undivided highways, or
crossing an edge line (longitudinal pavement marking located at the edge of the traveled lane and the
shoulder) of the roadway.
Single vehicle ROR crashes which occurs as a result of a vehicle travelling off the roadway and hitting a
natural or artificial object has more fatalities involved than multiple vehicle ROR crashes. Multiple vehicle
ROR crash occurs when a vehicle encroaching on the median where the highway is separated or on the
opposite side when the vehicle crosses the opposing lanes of a nondivided highway hits a parked vehicle or
a vehicle on the opposing direction.
An estimated societal cost of $110 billion has been imposed each year due to roadside crashes (McGinnis
et al. 2001). These losses are equivalent to $1,600 per year for an average family of 4 persons. The
importance of the roadside safety problem has been recognized by different organizations, and efforts have
been made to reduce the types of errors most likely to cause roadside crashes.
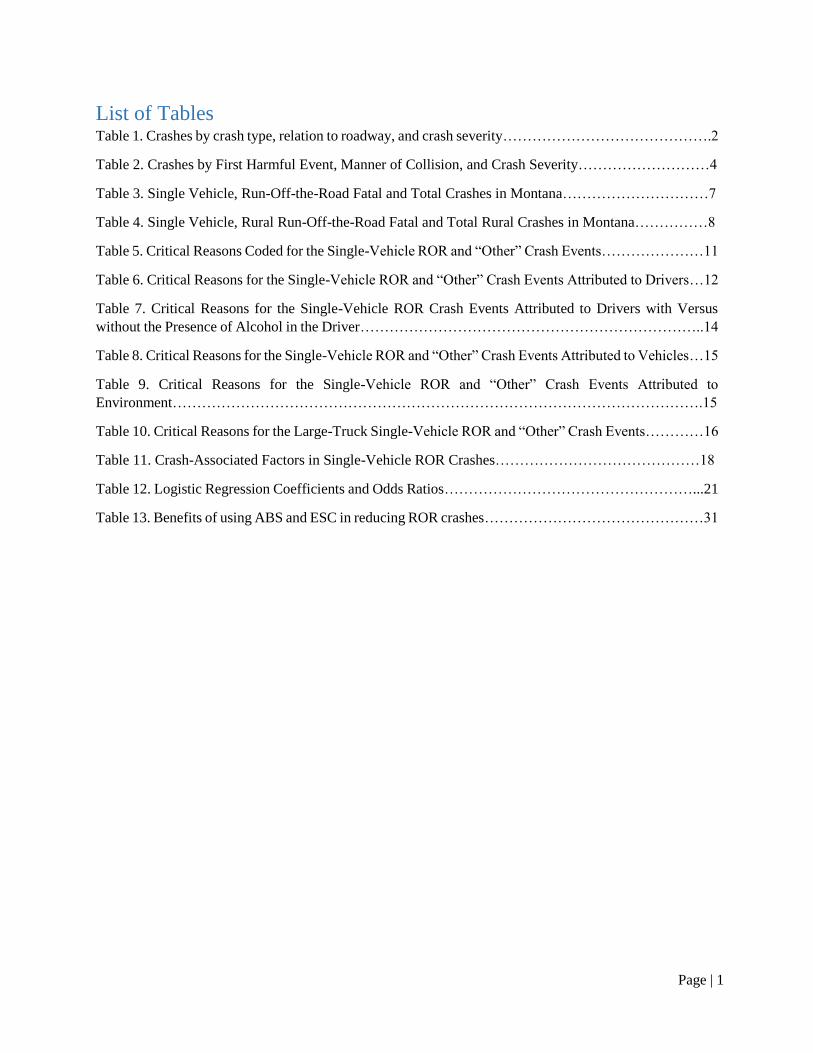
NHTSA traffic safety facts reports provide the estimates for different types of crashes and fatalities resulted
from these crashes in the United States. The 1999 statistics from the Fatality Analysis Reporting System
(FARS) show that nearly 39 percent of the 37,043 fatal crashes were single-vehicle ROR crashes on various
road types. (See Figure 1)
Comparison of the statistics from 1999 and 2012 showed a slight increase in the number of single vehicle
ROR crashes. Based upon a compilation of motor vehicle crash data from the FARS and the General
Estimates System (GES), 30,800 fatal crashes, 1,634,000 injury crashes, and 3,950,000 property-damage-
only (PDO) crashes occurred on the U.S. highway system in 2012, totaling 5,614,800 crashes (see Table
1). It shows that of the 30,800 fatal crashes, 10,972 (35.6 percent) were single vehicle crashes that occurred
Sideswipe2%
Angle20%
SV ROR39%
Rear End5%
Head On14%
Other20%
Figure 1. Single-Vehicle ROR Crashes as a Percentage of All Fatal Crashes
Page | 2
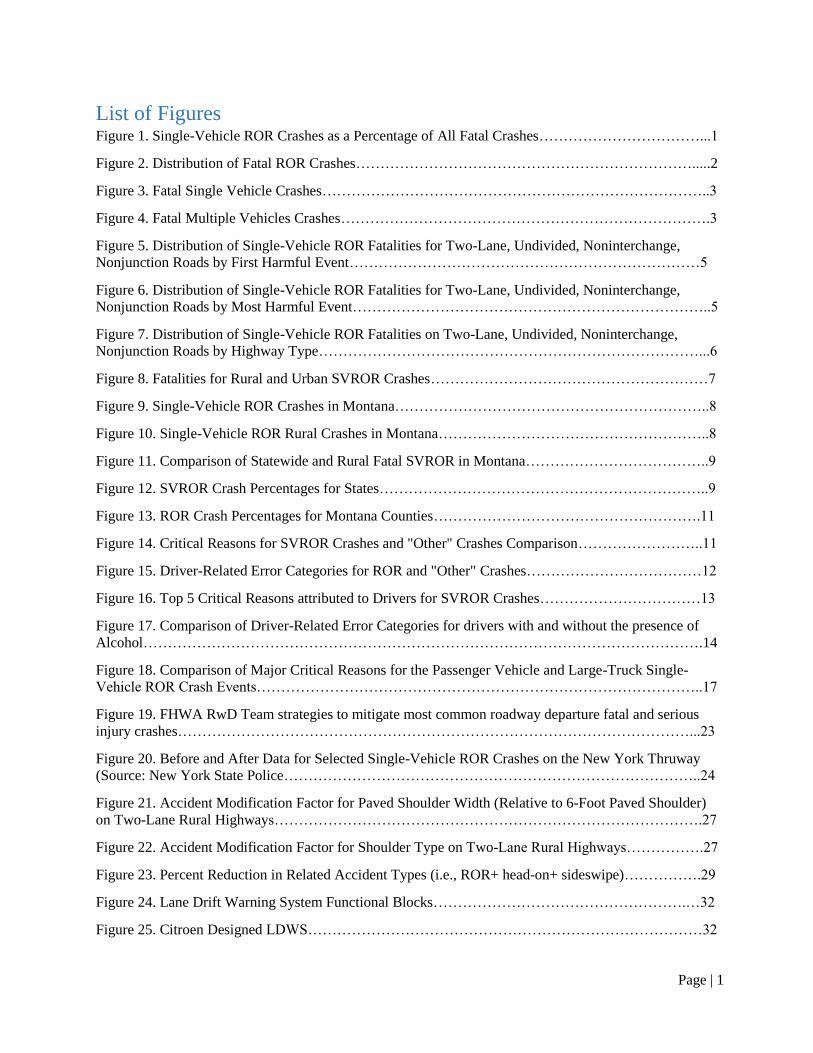
off the roadway. An additional 474 fatal crashes (1.5 percent) occurred on the shoulder, and 1,071 (3.5
percent) occurred on the median. Thus, of the 30,800 fatal crashes, 12,517 crashes (40.6 percent) occurred
off the roadway, on the shoulder, or within the median. Of the injury crashes, 20 percent (327,000) were
single-vehicle crashes that occurred off the roadway, on the shoulder, or within the median. Of the property-
damage-only crashes, 11.2 percent (629,000) were single-vehicle crashes that occurred off the roadway, on
the shoulder, or within the median.
Figure 2 shows the distribution of fatal ROR crashes. As can be seen, ROR crashes contributes to 43 percent
of the total fatalities. Of this 43 percent, 41% is for the single vehicle ROR crashes (SVROR) and 2% for
multiple vehicle ROR crashes.
Table 1. Crashes by crash type, relation to roadway, and crash severity
Crash Types
Relation to Roadway
On
Roadway
Off
Roadway Shoulder Median Other/Unknown Total
Fatal Crashes
Single Vehicle 5890 10972 474 1071 298 18705
Multiple Vehicles 11515 284 115 156 25 12095
Total 17405 11256 589 1227 323 30800
Injury Crashes
Single Vehicle 162,000 278,000 7,000 42,000 37,000 525,000
Multiple Vehicles 1,097,000 5,000 1,000 4,000 2,000 1,109,000
Total 1,259,000 283,000 8,000 46,000 39,000 1,634,000
Property Damage Only Crashes
Single Vehicle 323,000 541,000 8,000 80,000 249,000 1,202,000
Multiple Vehicles 2,729,000 9,000 2,000 5,000 3,000 2,748,000
Total 3,052,000 550,000 10,000 85,000 253,000 3,950,000
All Crashes
Single Vehicle 490,890 829,972 15,474 123,071 286,298 1,745,705
Multiple Vehicles 3,837,515 14,284 3,115 9,156 5,025 3,869,095
Total 4,328,405 844,256 18,589 132,227 292,323 5,614,800
(Source: NHTSA Traffic Safety Facts 2012)
On Roadway56%
Off Roadway37%
Shoulder2%
Median4%
Other/Unknown1%
Figure 2. Distribution of Fatal ROR Crashes
Page | 3
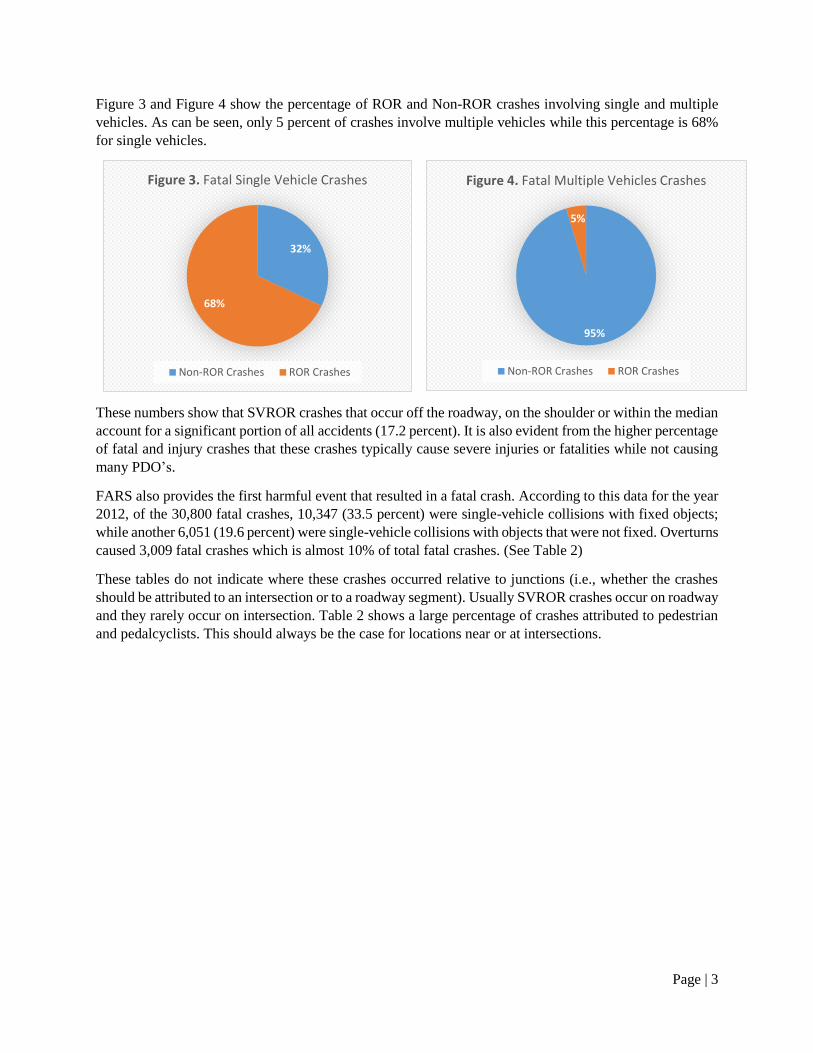
Figure 3 and Figure 4 show the percentage of ROR and Non-ROR crashes involving single and multiple
vehicles. As can be seen, only 5 percent of crashes involve multiple vehicles while this percentage is 68%
for single vehicles.
These numbers show that SVROR crashes that occur off the roadway, on the shoulder or within the median
account for a significant portion of all accidents (17.2 percent). It is also evident from the higher percentage
of fatal and injury crashes that these crashes typically cause severe injuries or fatalities while not causing
many PDO’s.
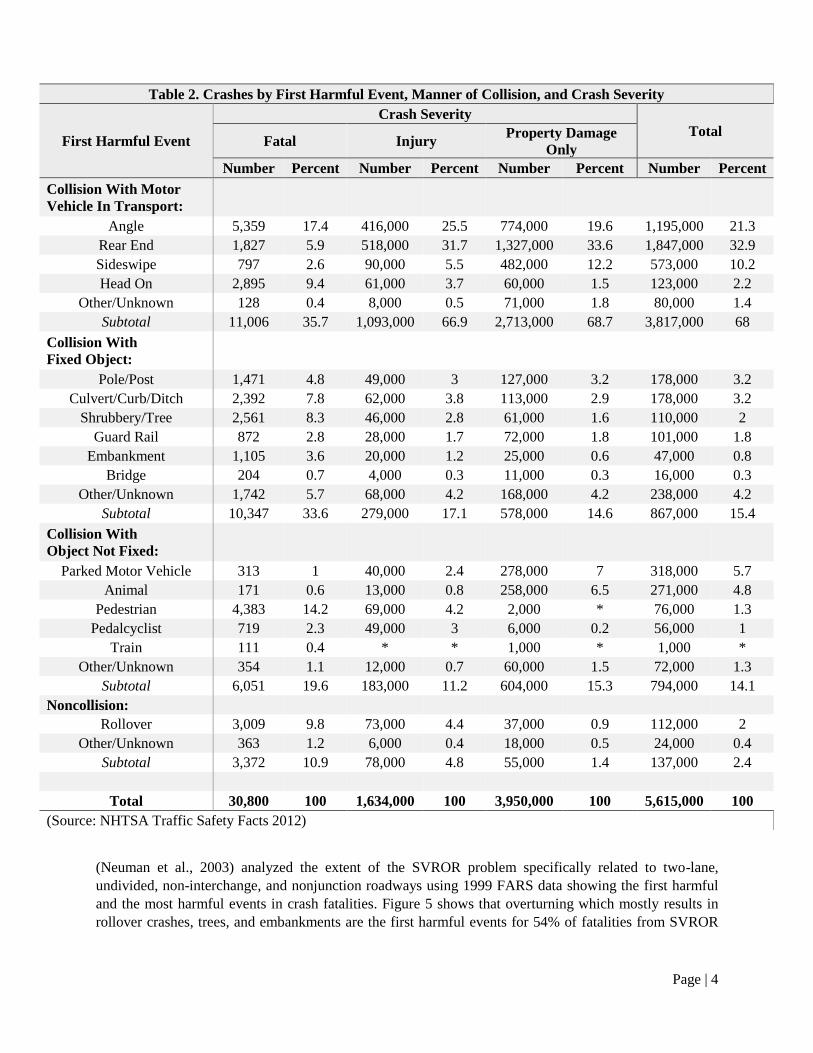
FARS also provides the first harmful event that resulted in a fatal crash. According to this data for the year
2012, of the 30,800 fatal crashes, 10,347 (33.5 percent) were single-vehicle collisions with fixed objects;
while another 6,051 (19.6 percent) were single-vehicle collisions with objects that were not fixed. Overturns
caused 3,009 fatal crashes which is almost 10% of total fatal crashes. (See Table 2)
These tables do not indicate where these crashes occurred relative to junctions (i.e., whether the crashes
should be attributed to an intersection or to a roadway segment). Usually SVROR crashes occur on roadway
and they rarely occur on intersection. Table 2 shows a large percentage of crashes attributed to pedestrian
and pedalcyclists. This should always be the case for locations near or at intersections.
32%
68%
Figure 3. Fatal Single Vehicle Crashes
Non-ROR Crashes ROR Crashes
95%
5%
Figure 4. Fatal Multiple Vehicles Crashes
Non-ROR Crashes ROR Crashes
Page | 4
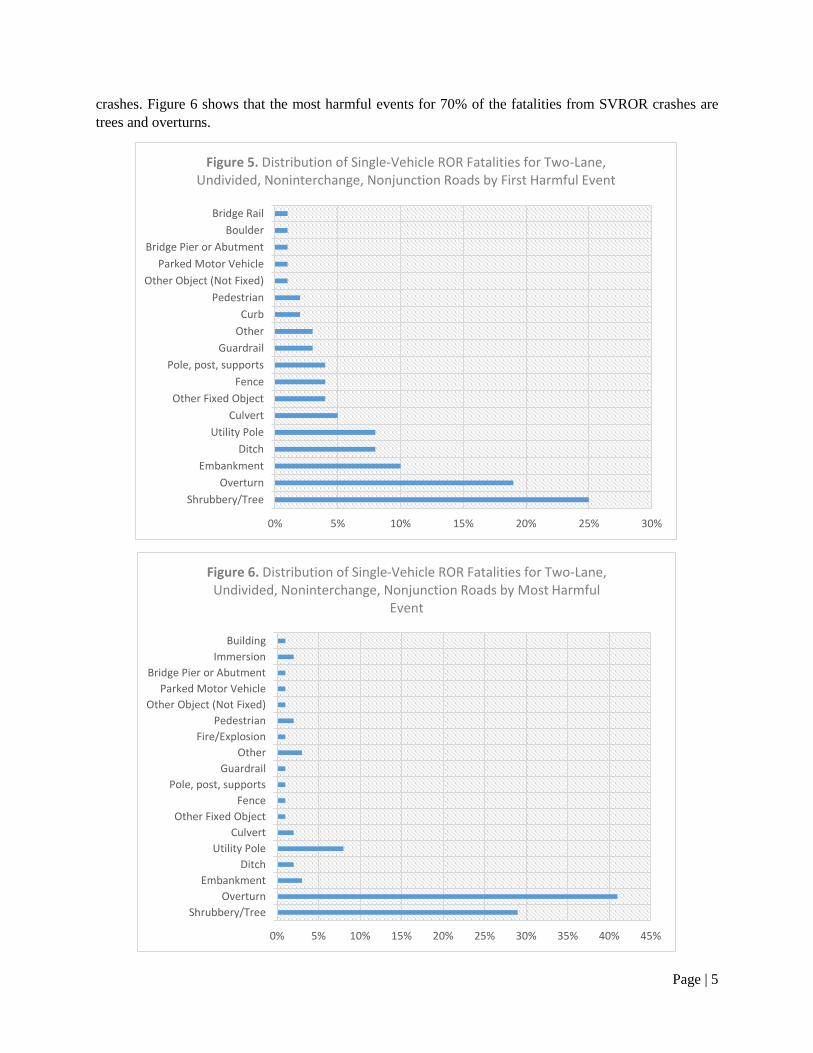
(Neuman et al., 2003) analyzed the extent of the SVROR problem specifically related to two-lane,
undivided, non-interchange, and nonjunction roadways using 1999 FARS data showing the first harmful
and the most harmful events in crash fatalities. Figure 5 shows that overturning which mostly results in
rollover crashes, trees, and embankments are the first harmful events for 54% of fatalities from SVROR
Table 2. Crashes by First Harmful Event, Manner of Collision, and Crash Severity
First Harmful Event
Crash Severity
Total Fatal Injury
Property Damage
Only
Number Percent Number Percent Number Percent Number Percent
Collision With Motor
Vehicle In Transport:
Angle 5,359 17.4 416,000 25.5 774,000 19.6 1,195,000 21.3
Rear End 1,827 5.9 518,000 31.7 1,327,000 33.6 1,847,000 32.9
Sideswipe 797 2.6 90,000 5.5 482,000 12.2 573,000 10.2
Head On 2,895 9.4 61,000 3.7 60,000 1.5 123,000 2.2
Other/Unknown 128 0.4 8,000 0.5 71,000 1.8 80,000 1.4
Subtotal 11,006 35.7 1,093,000 66.9 2,713,000 68.7 3,817,000 68
Collision With
Fixed Object:
Pole/Post 1,471 4.8 49,000 3 127,000 3.2 178,000 3.2
Culvert/Curb/Ditch 2,392 7.8 62,000 3.8 113,000 2.9 178,000 3.2
Shrubbery/Tree 2,561 8.3 46,000 2.8 61,000 1.6 110,000 2
Guard Rail 872 2.8 28,000 1.7 72,000 1.8 101,000 1.8
Embankment 1,105 3.6 20,000 1.2 25,000 0.6 47,000 0.8
Bridge 204 0.7 4,000 0.3 11,000 0.3 16,000 0.3
Other/Unknown 1,742 5.7 68,000 4.2 168,000 4.2 238,000 4.2
Subtotal 10,347 33.6 279,000 17.1 578,000 14.6 867,000 15.4
Collision With
Object Not Fixed:
Parked Motor Vehicle 313 1 40,000 2.4 278,000 7 318,000 5.7
Animal 171 0.6 13,000 0.8 258,000 6.5 271,000 4.8
Pedestrian 4,383 14.2 69,000 4.2 2,000 * 76,000 1.3
Pedalcyclist 719 2.3 49,000 3 6,000 0.2 56,000 1
Train 111 0.4 * * 1,000 * 1,000 *
Other/Unknown 354 1.1 12,000 0.7 60,000 1.5 72,000 1.3
Subtotal 6,051 19.6 183,000 11.2 604,000 15.3 794,000 14.1
Noncollision:
Rollover 3,009 9.8 73,000 4.4 37,000 0.9 112,000 2
Other/Unknown 363 1.2 6,000 0.4 18,000 0.5 24,000 0.4
Subtotal 3,372 10.9 78,000 4.8 55,000 1.4 137,000 2.4
Total 30,800 100 1,634,000 100 3,950,000 100 5,615,000 100
(Source: NHTSA Traffic Safety Facts 2012)
Page | 5
crashes. Figure 6 shows that the most harmful events for 70% of the fatalities from SVROR crashes are
trees and overturns.
0% 5% 10% 15% 20% 25% 30%
Shrubbery/Tree
Overturn
Embankment
Ditch
Utility Pole
Culvert
Other Fixed Object
Fence
Pole, post, supports
Guardrail
Other
Curb
Pedestrian
Other Object (Not Fixed)
Parked Motor Vehicle
Bridge Pier or Abutment
Boulder
Bridge Rail
Figure 5. Distribution of Single-Vehicle ROR Fatalities for Two-Lane, Undivided, Noninterchange, Nonjunction Roads by First Harmful Event
0% 5% 10% 15% 20% 25% 30% 35% 40% 45%
Shrubbery/Tree
Overturn
Embankment
Ditch
Utility Pole
Culvert
Other Fixed Object
Fence
Pole, post, supports
Guardrail
Other
Fire/Explosion
Pedestrian
Other Object (Not Fixed)
Parked Motor Vehicle
Bridge Pier or Abutment
Immersion
Building
Figure 6. Distribution of Single-Vehicle ROR Fatalities for Two-Lane, Undivided, Noninterchange, Nonjunction Roads by Most Harmful
Event
Page | 6
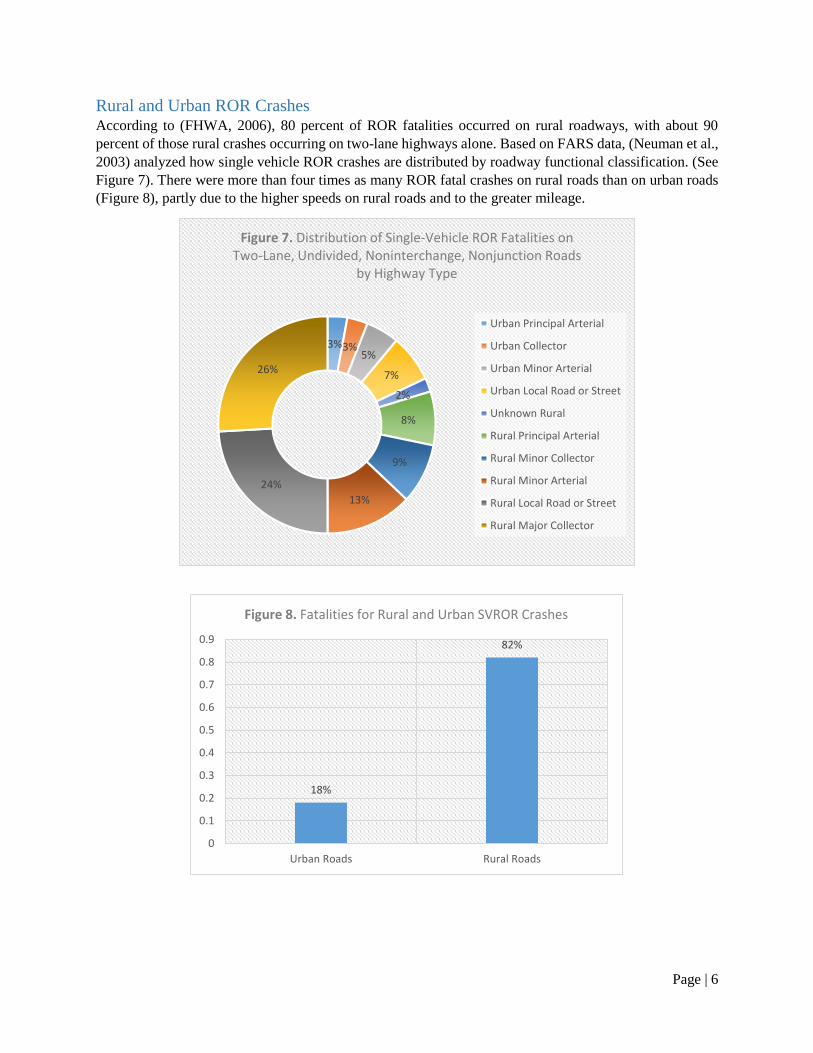
Rural and Urban ROR Crashes According to (FHWA, 2006), 80 percent of ROR fatalities occurred on rural roadways, with about 90
percent of those rural crashes occurring on two-lane highways alone. Based on FARS data, (Neuman et al.,
2003) analyzed how single vehicle ROR crashes are distributed by roadway functional classification. (See
Figure 7). There were more than four times as many ROR fatal crashes on rural roads than on urban roads
(Figure 8), partly due to the higher speeds on rural roads and to the greater mileage.
3%3%5%
7%
2%
8%
9%
13%
24%
26%
Figure 7. Distribution of Single-Vehicle ROR Fatalities on Two-Lane, Undivided, Noninterchange, Nonjunction Roads
by Highway Type
Urban Principal Arterial
Urban Collector
Urban Minor Arterial
Urban Local Road or Street
Unknown Rural
Rural Principal Arterial
Rural Minor Collector
Rural Minor Arterial
Rural Local Road or Street
Rural Major Collector
18%
82%
0
0.1
0.2
0.3
0.4
0.5
0.6
0.7
0.8
0.9
Urban Roads Rural Roads
Figure 8. Fatalities for Rural and Urban SVROR Crashes
Page | 7
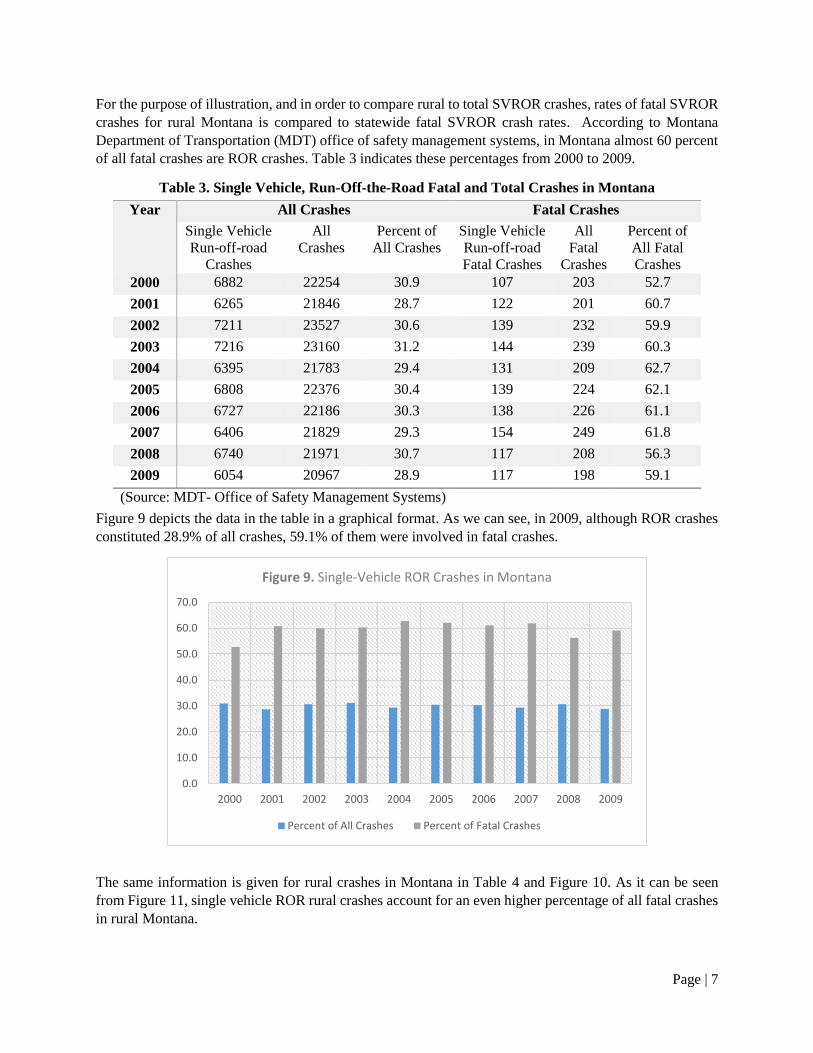
For the purpose of illustration, and in order to compare rural to total SVROR crashes, rates of fatal SVROR
crashes for rural Montana is compared to statewide fatal SVROR crash rates. According to Montana
Department of Transportation (MDT) office of safety management systems, in Montana almost 60 percent
of all fatal crashes are ROR crashes. Table 3 indicates these percentages from 2000 to 2009.
Table 3. Single Vehicle, Run-Off-the-Road Fatal and Total Crashes in Montana
Year All Crashes Fatal Crashes
Single Vehicle
Run-off-road
Crashes
All
Crashes
Percent of
All Crashes
Single Vehicle
Run-off-road
Fatal Crashes
All
Fatal
Crashes
Percent of
All Fatal
Crashes
2000 6882 22254 30.9 107 203 52.7
2001 6265 21846 28.7 122 201 60.7
2002 7211 23527 30.6 139 232 59.9
2003 7216 23160 31.2 144 239 60.3
2004 6395 21783 29.4 131 209 62.7
2005 6808 22376 30.4 139 224 62.1
2006 6727 22186 30.3 138 226 61.1
2007 6406 21829 29.3 154 249 61.8
2008 6740 21971 30.7 117 208 56.3
2009 6054 20967 28.9 117 198 59.1
(Source: MDT- Office of Safety Management Systems)
Figure 9 depicts the data in the table in a graphical format. As we can see, in 2009, although ROR crashes
constituted 28.9% of all crashes, 59.1% of them were involved in fatal crashes.
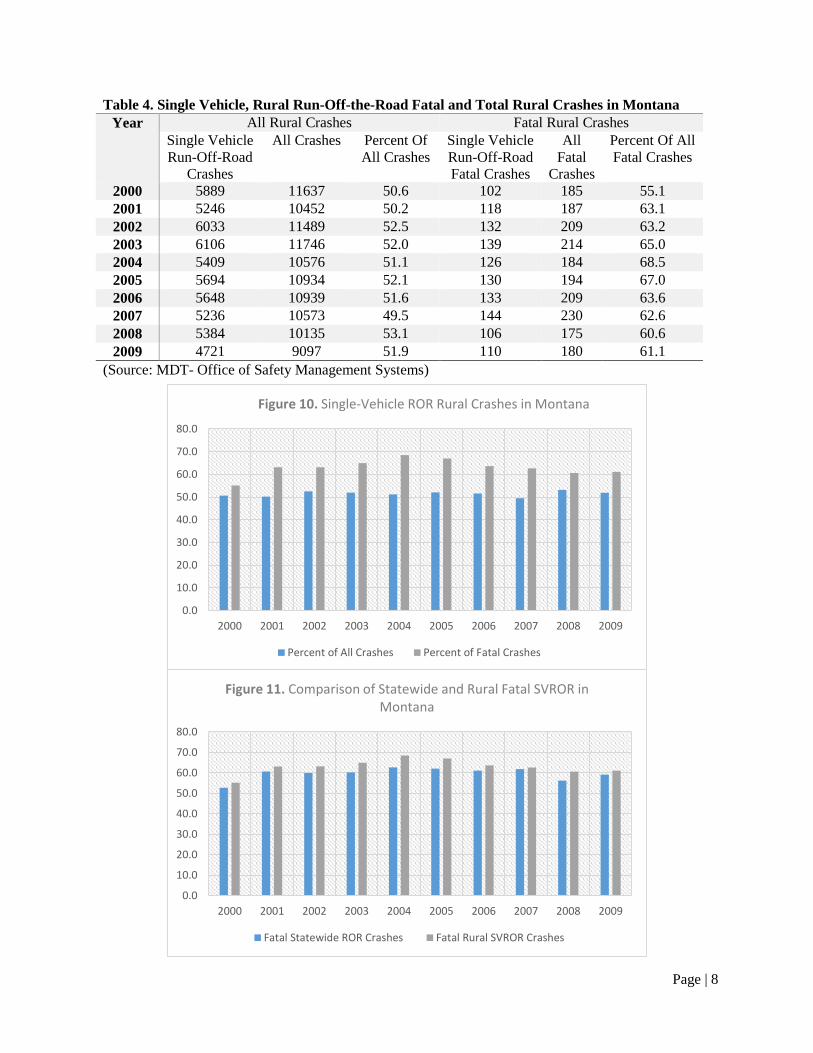
The same information is given for rural crashes in Montana in Table 4 and Figure 10. As it can be seen
from Figure 11, single vehicle ROR rural crashes account for an even higher percentage of all fatal crashes
in rural Montana.
0.0
10.0
20.0
30.0
40.0
50.0
60.0
70.0
2000 2001 2002 2003 2004 2005 2006 2007 2008 2009
Figure 9. Single-Vehicle ROR Crashes in Montana
Percent of All Crashes Percent of Fatal Crashes
Page | 8
Table 4. Single Vehicle, Rural Run-Off-the-Road Fatal and Total Rural Crashes in Montana
Year All Rural Crashes Fatal Rural Crashes
Single Vehicle
Run-Off-Road
Crashes
All Crashes Percent Of
All Crashes
Single Vehicle
Run-Off-Road
Fatal Crashes
All
Fatal
Crashes
Percent Of All
Fatal Crashes
2000 5889 11637 50.6 102 185 55.1
2001 5246 10452 50.2 118 187 63.1
2002 6033 11489 52.5 132 209 63.2
2003 6106 11746 52.0 139 214 65.0
2004 5409 10576 51.1 126 184 68.5
2005 5694 10934 52.1 130 194 67.0
2006 5648 10939 51.6 133 209 63.6
2007 5236 10573 49.5 144 230 62.6
2008 5384 10135 53.1 106 175 60.6
2009 4721 9097 51.9 110 180 61.1
(Source: MDT- Office of Safety Management Systems)
0.0
10.0
20.0
30.0
40.0
50.0
60.0
70.0
80.0
2000 2001 2002 2003 2004 2005 2006 2007 2008 2009
Figure 10. Single-Vehicle ROR Rural Crashes in Montana
Percent of All Crashes Percent of Fatal Crashes
0.0
10.0
20.0
30.0
40.0
50.0
60.0
70.0
80.0
2000 2001 2002 2003 2004 2005 2006 2007 2008 2009
Figure 11. Comparison of Statewide and Rural Fatal SVROR in Montana
Fatal Statewide ROR Crashes Fatal Rural SVROR Crashes
Page | 9
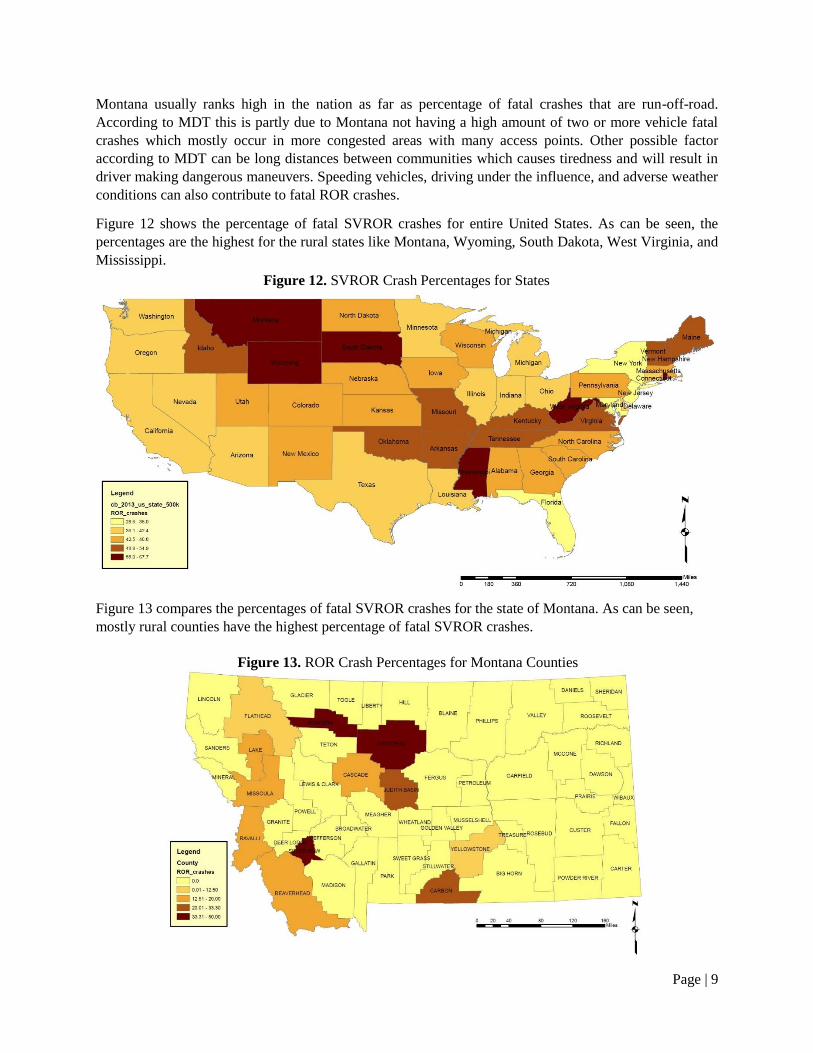
Montana usually ranks high in the nation as far as percentage of fatal crashes that are run-off-road.
According to MDT this is partly due to Montana not having a high amount of two or more vehicle fatal
crashes which mostly occur in more congested areas with many access points. Other possible factor
according to MDT can be long distances between communities which causes tiredness and will result in
driver making dangerous maneuvers. Speeding vehicles, driving under the influence, and adverse weather
conditions can also contribute to fatal ROR crashes.
Figure 12 shows the percentage of fatal SVROR crashes for entire United States. As can be seen, the
percentages are the highest for the rural states like Montana, Wyoming, South Dakota, West Virginia, and
Mississippi.
Figure 13 compares the percentages of fatal SVROR crashes for the state of Montana. As can be seen,
mostly rural counties have the highest percentage of fatal SVROR crashes.
Figure 12. SVROR Crash Percentages for States
Figure 13. ROR Crash Percentages for Montana Counties
Page | 10
Critical Reasons for ROR Crashes Many studies have identified the array of reasons for fatal and injurious ROR crashes. Many of these studies
are published in transportation safety journals like Accident Analysis and Prevention, Human Factors,
Transportation Research Part F, technical reports by FHWA and NHTSA, and technical reports by private
agencies like American Automobile Association, Foundation for Traffic Safety (AAA-FTS) and Crash
Avoidance Metrics Partnership (CAMP).
Data from National Motor Vehicle Crash Causation Survey (NMVCCS) is used in this study. While most
researchers have concentrated mainly on the factors which lead up to a crash, data from (NMVCCS) helps
to understand the entire crash envelope which comprises of a series of events which lead to crash
(NMVCCS, 2015). These events were captured by NHTSA’s National Center for Statistics and Analysis
(NCSA) from 2005 to 2007. The purpose of this survey was to collect on-scene information about the events
and associated factors leading up to crashes involving light vehicles. This survey contains four data
elements: (i) movement prior to critical pre-crash event (i.e., the movement of the vehicle immediately
before the occurrence of the critical event); (ii) critical pre-crash event (i.e., the circumstances that caused
the crash inevitable); (iii) critical reason for the critical pre-crash event (i.e., the immediate reason for the
critical event, which is often the last failure in the causal chain of events leading up to the crash); and (iv)
the crash-associated factors (i.e., the factors that are likely to add to the probability of crash occurrence).
NMVCCS data was used by (Liu and Ye, 2011) to identify the critical pre-crash event, the critical reasons
underlying the critical pre-crash event and associated factors present in the pre-crash phase of the single-
vehicle ROR crash. In order to better understand these chain of events and NMVCCS data, the following
example is provided to illustrate a SVROR crash and the manner it was coded in NMVCCS.
Case description: A crash involving a 2004 Subaru Forester (a compact SUV) occurred on the late weekday
afternoon on a dry roadway with a posted speed limit of 40 mph (64 km/h). The Subaru driver was an 82-
year-old man. He had some pre-existing physical or mental health condition and reported taking
drugs/medications in the past 24 hours. The driver tried to avoid a non-contact truck approached from the
opposite direction by steering right and the vehicle ran off the edge of the road on the right side. The vehicle
was equipped with ABS but not with ESC.
NMVCCS coding
Critical pre-crash event – “this vehicle ran off the edge of the road on the right side”
Critical reason for the critical event – “poor directional control (e.g., failing to control vehicle with
skill ordinarily expected)”
Crash-associated factors: pre-existing physical or mental health conditions; taking
drugs/medications in the 24 hours; attempted an avoidance maneuver by steering right; age; gender
…
This study by (Liu and Ye, 2011) is not limited to fatal crashes but consists of both fatal and non-fatal
crashes from NMVCCS database and thoroughly investigates driver-, vehicle-, and environment-related
factors, with a focus on driver-related factor due to physical and mental conditions, as well as driver’s
activities prior to the crash.
The term “other” in this report is generally referred to on-road crashes in which after the crash the vehicles
remained on the road. The critical pre-crash event for “other” crashes can include “vehicle loss of control
due to blow out/flat tire, poor road condition and other cause,” “vehicle turning at or passing through
Page | 11
intersection,” “pedestrian, pedal-cyclist, or other non-motorist in or approaching roadway,” and “animal in
or approaching roadway.”
According to statistics for critical reasons for SVROR crashes and “other” crashes (Table 5 and Figure 14)
64.4 percent (434,412) of the estimated 674,002 single-vehicle crashes were ROR crashes. From the critical
reasons for SVROR crashes, those attributed to drivers were dominating with 95.1%.
Critical Reasons Attributed to Drivers: Of the 95.1% of critical reasons that are attributed to drivers, the most frequently occurring errors are driver
performance errors (27.7%), followed by driver decision errors (25.4%), critical non-performance errors
(22.5%), and recognition errors (19.8%). In contrast for “Other” crashes, driver decision errors (59.7%) and
performance errors (26.3%) are the most frequently occurring errors. (See Figure 15). Table 6 and shows
the critical reasons involved in each of the four categories with the weighted frequency and percentages.
Table 5. Critical Reasons Coded for the Single-Vehicle ROR and “Other” Crash Events
Critical Reasons
Attributed to
ROR “Other”
Weighted
Frequency
Weighted
Percent
Weighted
Frequency
Weighted
Percent
Driver 413,070 95.10% 201,408 84.10%
Vehicle 4,456 1.00% 20,631 8.60%
Environment (roadway
and weather conditions) 4,950 1.10% 16,385 6.80%
Unknown reason for the
critical event 11,937 2.70% 1,087 0.50%
Critical reason not
coded to the vehicle 0 0.00% 80 0.00%
Total 434,412 Col 100%
239,590 Col 100%
Row 64.4% Row 35.6%
(Source: Liu and Ye, 2011)
0%
10%
20%
30%
40%
50%
60%
70%
80%
90%
100%
Driver Vehicle Environment
Figure 14. Critical Reasons for SVROR Crashes and "Other" Crashes Comparison
SVROR Crashes "Other" Crashes
Page | 12
Table 6. Critical Reasons for the Single-Vehicle ROR and “Other” Crash Events Attributed to Drivers
Critical Reasons ROR “Other”
Weighted
Frequency
Weighted
Percent
Weighted
Frequency
Weighted
Percent
Critical Non-
Performance
Errors
Sleeping/actually asleep 42,586 10.30% 886 0.40%
Heart attack/other physical impairment 29,226 7.10% 1,646 0.80%
Other/unknown critical nonperformance 20,961 5.10% 311 0.20%
Subtotal 92,773 22.50% 2,843 1.40%
Recognition
Errors
Internal distraction 62,048 15.00% 10,561 5.20%
External distraction 11,324 2.70% 591 0.30%
Inattention 5,644 1.40% 2,262 1.10%
Inadequate surveillance 1,651 0.40% 8,303 4.10%
Other/unknown recognition error 1,313 0.30% 545 0.30%
Subtotal 81,980 19.80% 22,262 11.00%
Decision
Errors
Too fast for curve 45,429 11.00% 39,813 19.80%
Too fast for conditions 27,983 6.80% 55,092 27.40%
Incorrect evasion 13,529 3.30% 8,626 4.30%
Aggressive driving 6,894 1.70% 4,813 2.40%
Too fast to be able to respond 5,314 1.30% 5,819 2.90%
Inadequate evasion 2,173 0.50% 2,450 1.20%
Other/unknown decision error 1,432 0.40% 1,644 0.80%
Illegal maneuver 203 0.10% 1,074 0.50%
Misjudgment of gap 915 0.20% 42 0.00%
Following too closely 334 0.10% 700 0.40%
Subtotal 104,206 25.40% 120,073 59.70%
Performance
Errors
Overcompensation 59,155 14.30% 31,410 15.60%
Poor directional control 51,991 12.60% 19,004 9.40%
Other/unknown performance error 2,088 0.50% 1,193 0.60%
Panic/freezing 1,149 0.30% 1,346 0.70%
Subtotal 114,383 27.70% 52,953 26.30%
Other/Unknown Driver Errors 19,726 4.80% 3,276 1.60%
Total 413,070 100% 201,408 100%
(Source: Liu and Ye, 2011)
22.5%
19.8%
25.4%
27.7%
1.4%
11.0%
59.7%
26.3%
0% 10% 20% 30% 40% 50% 60% 70% 80% 90%
Critical Non-Performance Errors
Recognition Errors
Decision Errors
Performance Errors
Figure 15. Driver-Related Error Categories for ROR and "Other" Crashes
ROR "Other"
Page | 13
As can be seen from the table above, the most frequently occurring critical reasons for non-performance
error category are attributed to driver being asleep during driving (10.3%) and heart attacks (7.1%). For
the recognition error category which means that the driver failed to correctly recognize the pre-crash
situation, internal distraction (15%) and external distraction (2.7%) are the most frequently occurring
critical reasons.
Among performance errors, “overcompensation” (14.3%) and “poor directional control” (12.6%) were the
top two critical reasons for SVROR crashes. Too fast for curves (11%), “too fast for conditions” (6.8%),
and “incorrect evasion” (3.3%) were the top three critical reasons for SVROR crashes among driver
decision errors.
Figure 16 shows the top 5 critical reasons attributed to drivers for SVROR Crashes. These results are
consistent with 2009 NHTSA report on fatal ROR crashes (Liu and Subramanian, 2009).
Driver Alcohol Presence
According to (Spainhour and Mishra, 2007) and (Liu and Subramanian, 2009), drivers with high levels of
blood-alcohol-content are more prone to ROR crashes than sober drivers. Driver alcohol presence is
described as an associated factor in SVROR crashes later in the paper. This section shows the result of
using alcohol on critical reasons attributed to drivers for SVROR crashes.
Table 7 compares the critical reasons for SVROR crashes attributed to drivers with and without the presence
of alcohol. As can be seen, with the presence of alcohol, the overcompensation problem has increased from
12.6% to 23.4%. Poor directional control has also increased from 11.2% to 21.7% with the presence of
alcohol.
Figure 17 compares four error categories for SVROR crashes attributed to drivers. As can be seen
performance errors have increased considerably from 24.4% to 46.9% with the presence of alcohol.
0% 2% 4% 6% 8% 10% 12% 14% 16%
Sleeping/actually asleep
Too fast for curve
Poor directional control
Overcompensation
Internal distraction
Figure 16. Top 5 Critical Reasons attributed to Drivers for SVROR Crashes
Page | 14
Table 7. Critical Reasons for the Single-Vehicle ROR Crash Events Attributed to Drivers With Versus
Without the Presence of Alcohol in the Driver
Critical Reasons
Alcohol Present Alcohol Not Present
Weighted
Frequency
Weighted
Percent
Weighted
Frequency
Weighted
Percent
Critical Non-
Performance
Errors
Sleeping/actually asleep 3,220 4.20% 37,795 12.20%
Heart attack/other physical impairment 794 1.00% 27,650 9.00%
Other/unknown critical nonperformance 8,377 11.00% 11,890 3.90%
Subtotal 12,391 16.20% 77,335 25.10%
Recognition
Errors
Internal distraction 10,578 13.90% 44,979 14.60%
External distraction 961 1.30% 10,070 3.30%
Inattention 0 0% 5,082 1.70%
Inadequate surveillance 0 0% 1,651 0.50%
Other/unknown recognition error 1,038 1.40% 275 0.10%
Subtotal 12,577 16.60% 62,057 20.20%
Decision
Errors
Too fast for curve 6,447 8.50% 36,331 11.80%
Too fast for conditions 5,436 7.10% 22,314 7.20%
Incorrect evasion 0 0% 13,529 4.40%
Aggressive driving 767 1.00% 6,127 2.00%
Too fast to be able to respond 718 0.90% 4,268 1.40%
Inadequate evasion 0 0% 2,009 0.70%
Other/unknown decision error 0 0% 1,432 0.50%
Illegal maneuver 0 0% 203 0.10%
Misjudgment of gap 0 0% 915 0.30%
Following too closely 0 0% 334 0.10%
Subtotal 13,368 17.50% 87,462 28.50%
Performance
Errors
Overcompensation 17,864 23.40% 39,057 12.60%
Poor directional control 16,564 21.70% 34,657 11.20%
Other/unknown performance error 1,391 1.80% 698 0.20%
Panic/freezing 0 0% 1,149 0.40%
Subtotal 35,819 46.90% 75,561 24.40%
Other/Unknown Driver Errors 2,129 2.80% 6,518 2.10%
Total 76,283 100% 308,932 100%
(Source: Liu and Ye, 2011)
0%
5%
10%15%
20%
25%
30%
35%
40%
45%50%
Critical Non-Performance
Errors
Recognition Errors Decision Errors PerformanceErrors
Figure 17. Comparison of Driver-Related Error Categories for drivers with and without the presence of Alcohol
Alcohol Present Alcohol Not Present
Page | 15
Critical Reasons Attributed to Vehicles Table 8 shows the critical reasons for SVROR crashes attributed to vehicles. In ROR crashes, the most
frequently occurring critical reason attributed to vehicles was “brakes failed/degraded” (32.7%), followed
by “tires failed or degradation/wheel failed” (25.6%), “steering/suspension/transmission/engine failed”
(19.1%), and “other vehicle failure/deficiency” (18.8%). For “Other” single vehicle crashes “tires failed or
degradation/wheel failed” was the most frequently occurring vehicle-related critical reason with a
percentage of 71.7%.
Table 8. Critical Reasons for the Single-Vehicle ROR and “Other” Crash Events Attributed to
Vehicles
Critical Reasons
ROR “Other”
Weighted
Frequency
Weighted
Percent
Weighted
Frequency
Weighted
Percent
Tires failed or degradation/wheel failed 1,142 25.60% 14,790 71.70%
Steering/suspension/transmission/engine failed 850 19.10% 3,272 15.80%
Brakes failed/degraded 1,457 32.70% 2,155 10.50%
Other vehicle failure/deficiency 839 18.80% 413 2.00%
Unknown vehicle failure 167 3.80% 0 0.00%
Total 4,456 100% 20,631 100%
(Source: Liu and Ye, 2011)
Critical Reasons Attributed to Environment Table 9 shows the critical reasons for SVROR crashes attributed to environment (roadway and weather
conditions). Among the ROR crashes in which the critical reason was attributed to environment, about 96.5
percent were related to roadway conditions (slick roads, 64.3%; other highway-related conditions, 32.2%)
while only 3.5 percent to the weather (predominantly rain or snow.)
For “other” single vehicle crashes, 84.2% percent were related to roadway conditions and 15.8 percent to
weather conditions.
Table 9. Critical Reasons for the Single-Vehicle ROR and “Other” Crash Events Attributed to
Environment
Critical Reasons
ROR “Other”
Weighted
Frequency
Weighted
Percent
Weighted
Frequency
Weighted
Percent
Roadway
Slick roads (ice, loose debris, etc.) 3,183 64.30% 11,942 72.90%
Other highway-related
(sign/signal/road design/view
obstructions, etc.) conditions
1,592 32.20% 1,843 11.30%
Subtotal 4,775 96.50% 13,785 84.20%
Weather
Rain/snow 174 18.80% 413 2.00%
Other weather-related
(fog/glare/wind, etc.) condition 0 0.00% 1,565 9.50%
Subtotal 174 3.50% 2,600 15.80%
Total 4,950 100% 16,385 100%
(Source: Liu and Ye, 2011)
Critical Reasons for ROR Crashes involving Large Trucks Based on Large-Truck Crash Causation Study (LTCCS), a large truck is defined as a truck with a gross
weight rating of over 10,000 pounds. For the purpose of investigating the critical reasons for large truck
SVROR crashes, the data from LTCCS is used. Likewise NMVCCS, LTCCS collected the driver-, vehicle-
Page | 16
, and environment-related on-scene information from April 2001 to December 2003. The LTCCS collected
data on approximately 1,000 variables for each crash (FMCSA, 2006), (Starnes, 2006). Table 10 shows the
statistics of the critical reasons for large truck SVROR crashes and “other” crashes. As shown, only 37.2
percent of all single-vehicle ROR crashes involves large trucks.
Table 10. Critical Reasons for the Large-Truck Single-Vehicle ROR and “Other” Crash Events
Critical Reasons
ROR “Other”
Weighted
Frequency
Weighted
Percent
Weighted
Frequency
Weighted
Percent
Driver-Related
Too Fast for curve/turn 782 5.50% 7,719 32.30%
Sleeping /actually asleep 4,696 33.10% 180 0.80%
Too fast for conditions to be able to respond... 964 6.80% 1,494 6.20%
Inattention (i.e., daydreaming) 963 6.80% 1,290 5.40%
Heart attack or other physical impairment of the
ability... 2,114 14.90% 127 0.50%
Overcompensation 479 3.40% 1,117 4.70%
Poor directional control e.g., failing to control vehicle... 570 4.00% 943 3.90%
Inadequate surveillance (e.g., failed to look, looked
but...) 0 0.00% 1,376 5.80%
Internal distraction 125 0.90% 1,160 4.80%
Aggressive driving behavior 0 0.00% 814 3.40%
Other decision error 295 2.10% 190 0.80%
External distraction 272 1.90% 69 0.30%
Illegal maneuver 0 0.00% 157 0.70%
Following too closely to respond to unexpected actions 144 1.00% 0 0.00%
Other critical non-performance 138 1.00% 0 0.00%
Misjudgment of gap or other's speed 0 0.00% 62 0.30%
Type of driver error unknown 1,248 8.80% 69 0.30%
Unknown recognition error 396 2.80% 659 2.70%
Unknown critical non-performance 489 3.40% 0 0.00%
Vehicle-Related
Cargo shifted 280 2.00% 2,223 9.30%
Tires/wheels failed 0 0.00% 387 1.60%
Brakes failed 94 0.70% 230 1.00%
Steering failed 0 0.00% 69 0.30%
Degraded braking capability 0 0.00% 758 3.20%
Suspension failed 0 0.00% 791 3.30%
Environment (roadway and weather conditions)
Road design – other 0 0.00% 356 1.50%
Slick roads (low friction road surface due to ice...) 125 0.90% 115 0.50%
Wind gust 0 0.00% 127 0.50%
Road design - roadway geometry (e.g., ramp curvature) 2 0.00% 0 0.00%
Unknown reason for critical event 23 0.20% 0 0.00%
Critical event not coded to this vehicle 0 0.00% 1,447 6.10%
Total 14,198 Col. 100%
23,928 Col. 100%
Row 37.20% Row 62.80%
(Source: Liu and Ye, 2011)
Page | 17
Figure 18 shows the comparison between the major critical reasons for passenger vehicle and large truck
SVROR crashes. As depicted, sleeping and physical impairment cause the majority of truck SVROR
crashes. These high rates are probably due to the fact that drivers of large trucks usually drive long-distances
on highways.
Crash-Associated Factors in Single-Vehicle ROR Crashes The NMVCCS data provides information about driver-, vehicle-, and environment-related factor present in
a pre-crash phase. In this section, the factors of interest include, driver inattention, driver alcohol presence,
driver fatigue status, driver’s gender, driver’s work-related stress or pressure, driver’s pre-existing physical
and/or mental health conditions, driver’s familiarity with the roadway, and whether the driver was in a
hurry.
To study the effect of each of crash-associated factors, (Liu and Ye, 2011) categorized single vehicle crashes
into two groups: the crashes in which the factor was present and those in which it was not present. Wald
chi square was used to study if the difference between them is statistically significant. Most authors refer
to statistically significant as P < 0.05 and statistically highly significant as P < 0.001 (less than one in a
thousand chance of being wrong).
Table 11 describes each of the above mentioned factors in details, studying their significance in the
occurrence of SVROR crashes.
0% 5% 10% 15% 20% 25% 30% 35% 40% 45% 50%
Sleeping /actually asleep
Heart attack or other physical impairment of the ability...
Internal distraction
Overcompensation
Poor directional control e.g., failing to control vehicle...
Too Fast for curve/turn
Inattention (i.e., daydreaming)
External distraction
Figure 18. Comparison of Major Critical Reasons for the Passenger Vehicle and Large-Truck Single-Vehicle ROR Crash Events
Large Trucks Passenger Vehicles
Page | 18
Table 11. Crash-Associated Factors in Single-Vehicle ROR Crashes
The NMVCCS data assesses a driver to be inattentive if he
or she was pre-occupied with concerns or the nature of
these concerns such as personal problems, family problems,
financial problems, preceding arguments, and future events
(e.g., vacation and wedding).
As can be seen, among the SV crashes that inattention was
the factor, 85.4% were SVROR crashes, while this
percentage when SV crash did not involve any inattention
was 57.1%.
Difference between these two percentages was statistically
significant at the 90 percent confidence level (𝜒2=4.23, p-
value=0.0622). So we can say that inattentive driving is
significantly associated with SVROR crashes.
NMVCCS data includes the information about “police
reported alcohol presence” that records the presence of
alcohol for the driver as reported by police in the police
accident report (PAR).
As can be seen, among the SV crashes that alcohol-
presence was the factor, 83.6% were SVROR crashes,
while this percentage when SV crash did not involve any
alcohol-presence was 60.9%.
Difference between these two percentages was statistically
highly significant at the 90 percent confidence level (𝜒2=
19.26, p-value= 0.0009). So we can say that driver alcohol-
presence is significantly associated with SVROR crashes.
Based on NMVCCS data fatigue is based on driver's current
and preceding sleep schedules, current and preceding work
schedules, and a variety of other fatigue-related factors
including recreational and non-work activities.
As can be seen, among the SV crashes that fatigue was the
factor, 83.9% were SVROR crashes, while this percentage
when SV crash did not involve any alcohol-presence was
55.5%.
Difference between these two percentages was statistically
significant at the 90 percent confidence level (𝜒2= 9.39, p-
value= 0.0098). So we can say that driver fatigue is
significantly associated with SVROR crashes.
Dri
ver
Inat
tenti
on
85.457.1
14.642.9
0
20
40
60
80
100
Inattention (Total: 68,725) No Inattention Factors(Total: 242,111)
Single-Vehicle Crashes by Driver Inattention
ROR Other
83.660.9
16.439.1
0
20
40
60
80
100
Driver Alcohol Present(Total: 94,202)
No Driver Alcohol Present(Total: 529,985)
Single-Vehicle Crashes by Driver Alcohol Presence
ROR Other
83.9
55.5
16.1
44.5
0
20
40
60
80
100
Driver Fatigued (Total:115,196)
Driver Not Fatigued(Total: 372,208)
Single-Vehicle Crashes by Driver Fatigue Status
ROR Other
Dri
ver
Alc
ohol
Pre
sence
F
atig
ue
Page | 19
As can be seen, among the SV crashes that pre-existing
physical and mental health problem was the factor, 75.6 %
were SVROR crashes, while this percentage when SV crash
did not involve any pre-existing health problem was 58.7%.
Difference between these two percentages was statistically
highly significant at the 90 percent confidence level (𝜒2=
25.3, p-value= 0.0003). So we can say that pre-existing
physical and mental health problem is significantly
associated with SVROR crashes.
As depicted, among the SV crashes with male drivers,
68.1% were SVROR crashes, while this percentage when
SV crash involving female was 61.1%.
Difference between these two percentages was statistically
highly significant at the 90 percent confidence level (𝜒2=
5.17, p-value= 0.0421). So we can say that male drivers are
more prone to SVROR crashes than female drivers.
Driver’s self-reported driving frequency shows the
familiarity with the roadway in NMVCCS data. If driver
has used the highway on a daily or weekly basis or have
used it several times a month, it is defined as driver is
familiar with the roadway. If the driver has rarely used or
used the roadway for the first time, then it is reported as
driver’s unfamiliarity with the roadway.
As can be seen, among the SV crashes that driver’s
unfamiliarity with the roadway was the factor, 63.9 % were
SVROR crashes, while this percentage when SV crash did
not involve any unfamiliarity problem was 54.1%.
Difference between these two percentages was statistically
significant at the 90 percent confidence level (𝜒2= 15.5, p-
value= 0.002). So we can say that driver’s unfamiliarity
with the roadway is significantly associated with SVROR
crashes.
75.658.7
24.441.3
0
20
40
60
80
100
Driver Had Pre-existingPhysical or Mental Health
Conditions (Total:152,729)
Driver Did NOT Have Pre-existing Health Conditions
(Total: 360,240)
Single-Vehicle Crashes by Driver’s Pre-Existing Physical or Mental Health
Conditions
ROR Other
68.1 61.1
31.9 38.9
0
20
40
60
80
100
Male Drivers (Total:372,464)
Female Drivers (Total:289,872)
Single-Vehicle Crashes by Driver’s Gender
ROR Other
63.9 54.1
36.1 45.9
0
20
40
60
80
100
Driver Was Familiar Withthe Roadway (Total:
404,627)
Driver Was Not FamiliarWith the Roadway (Total:
108,220)
Single-Vehicle Crashes by Driver’s Familiarity with the Roadway
ROR Other
Pre
-Exis
tin
g P
hy
sica
l or
Men
tal
Hea
lth
Co
nd
itio
ns
Gen
der
F
amil
iari
ty w
ith
Ro
adw
ay
Page | 20
Work-related stress or pressure was reported in NMVCCS
if the driver had been in this state in the days leading up to
the crash.
As can be seen, among the SV crashes that work-related
stress or pressure was the factor, 86.4 % were SVROR
crashes, while this percentage when SV crash did not
involve any unfamiliarity problem was 59.5%.
Difference between these two percentages was statistically
significant at the 90 percent confidence level (𝜒2= 3.23, p-
value= 0.0973). So we can say that driver’s work-related
stress or pressure is significantly associated with SVROR
crashes.
As depicted, among the SV crashes in which the road
surface was dry, 70.6% were SVROR crashes, while this
percentage when SV crash occurred on a wet roadway
surface with water or ice or snow was 47.3%.
Difference between these two percentages was statistically
highly significant at the 90 percent confidence level (𝜒2=
58.19, p-value < 0.0001. So we can say SVROR crashes
are more likely to occur on dry roadway surfaces than wet
roadway surfaces.
One possible reason for this can be that while driving on
wet roadways drivers usually exercise more cautions.
NMVCCS data has recorded the information about being in
a hurry as, late for start of work shift, late for start of school
classes, late for business appointment, work related
delivery schedule, late for social appointment,
pursuing/fleeing, and normal driving pattern.
As can be seen, among the SV crashes that being in a hurry
was the factor, 82.9 % were SVROR crashes, while this
percentage when being in a hurry was not the problem was
59.9%.
Difference between these two percentages was statistically
significant at the 90 percent confidence level (𝜒2= 16.69,
p-value= 0.0015). So we can say hurrying while driving is
significantly associated with SVROR crashes.
86.459.5
13.640.5
0
20
40
60
80
100
Driver Was Feeling SomeWork-Related Stress orPressure (Total: 36,887)
Driver Was Not FeelingAny Work-Related Stress
or Pressure (Total:470,902)
Single-Vehicle Crashes by Driver’s Work-Related Stress or Pressure
ROR Other
70.647.3
29.452.7
0
20
40
60
80
100
The Roadway SurfaceWas Dry (Total: 493,547)
The Roadway SurfaceWas Wet With Water or
Ice or Snow (Total:178,365)
Single-Vehicle Crashes by Roadway Surface Conditions
ROR Other
82.959.9
17.140.1
0
20
40
60
80
100
Driver Was In a Hurry(Total: 39,693)
Driver Was Not In a Hurry(Total: 477,581)
Single-Vehicle Crashes Based on Whether the Driver Was in a Hurry
ROR Other
Wo
rk-R
elat
ed S
tres
s or
Pre
ssu
re
Road
way
Surf
ace
Condit
ions
In a
Hurr
y
Page | 21
To assess the relative influence of each of the above contributors (Liu and Ye, 2011) performed a logistic
regression which predicts the probability of occurrence of an event as a consequence of certain factors. The
end results were the odds-ratio which can tell us about the risk a certain factor carry in contributing to the
occurrence of ROR crashes and a coefficient corresponding to that odds-ratio which tell us about the
importance of each factor in the occurrence of ROR crashes (See Table 12).
Table 12. Logistic Regression Coefficients and Odds Ratios
Variable Coefficient Odds
Ratio p-value
Driver Inattention 1.2967 3.66 <.0001
Driver Was Fatigued 1.2463 3.48 <.0001
Driver Was In a Hurry 1.1630 3.2 <.0001
The Roadway Surface Was Dry 0.9928 2.7 <.0001
Driver Alcohol Present 0.9215 2.51 0.0218
Driver Was Familiar with the Roadway 0.7265 2.07 0.0032
Driver Had Pre-Existing Physical/Mental Health Conditions 0.5924 1.81 0.0031
Driver Was Male 0.2787 1.32 0.0217
Driver Was Feeling Work-Related Stress or Pressure 0.2252 1.25 0.5457
(Source: Liu and Ye, 2011)
As shown in the table, the three most influential factors to the occurrence of SVROR crashes are “driver
inattention”, “fatigue” and “being in a hurry”. The odds of being involved in a SVROR crash for an
inattentive driver is 3.66 times higher than an attentive driver and it is statistically highly significant. For
driver feeling work-related stress, although the odds of being involved in a SVROR crash is 1.25 but it is
not statistically significant in 90 percent confidence interval.
Other studies by (Lord et al., 2011), (Liu and Subramanian, 2009), (Neuman et al., 2003), (Davis et al.,
2006), (Najm et al., 2002), (Liu and Jianqiang, 2011), (Wood et al., 2006), (Shanmugaratnam, 2008), (Ball
et al., 2009), (Romoser and Fisher, 2009) and (Hallmark et al., 2009) provide more specific details on the
roadway/environment, driver and other factors related to ROR crashes.
Conventional Countermeasures for reducing ROR Crashes In order to significantly reduce the number of crashes, American Association of State Highway and
Transportation Officials Strategic Highway Safety Plan (AASHTO-SHSP) has identified 22 goals. Goal 15
is Keeping Vehicles on the Roadway, and Goal 16 is Minimizing the Consequences of Leaving the Road.
The common solution to both of these goals is keeping the vehicle in the proper lane. Although this would
not eliminate the collisions between vehicles and pedestrian, bicyclists and trains, it would reduce the
fatalities and injuries caused by ROR crashes. Solutions proposed by AASHTO is to move away from
independent activities toward more coordinated efforts which can reduce the fatality and injuries rates in a
national scale.
FHWA Roadway Departure Team which is also responsible to provide important information for
transportation practitioners, decision makers, and others to assist them in preventing and reducing the
severity of roadway departure (RwD) crashes or ROR crashes have published Roadway Departure Strategic
Plan that is an approach toward “Zero ROR fatalities” and “serious injuries”.
Page | 22
In this study, a more comprehensive review of the methods of both agencies together with independent
studies by some researchers to reduce fatalities and serious injuries occurred as a result of ROR crashes are
presented.
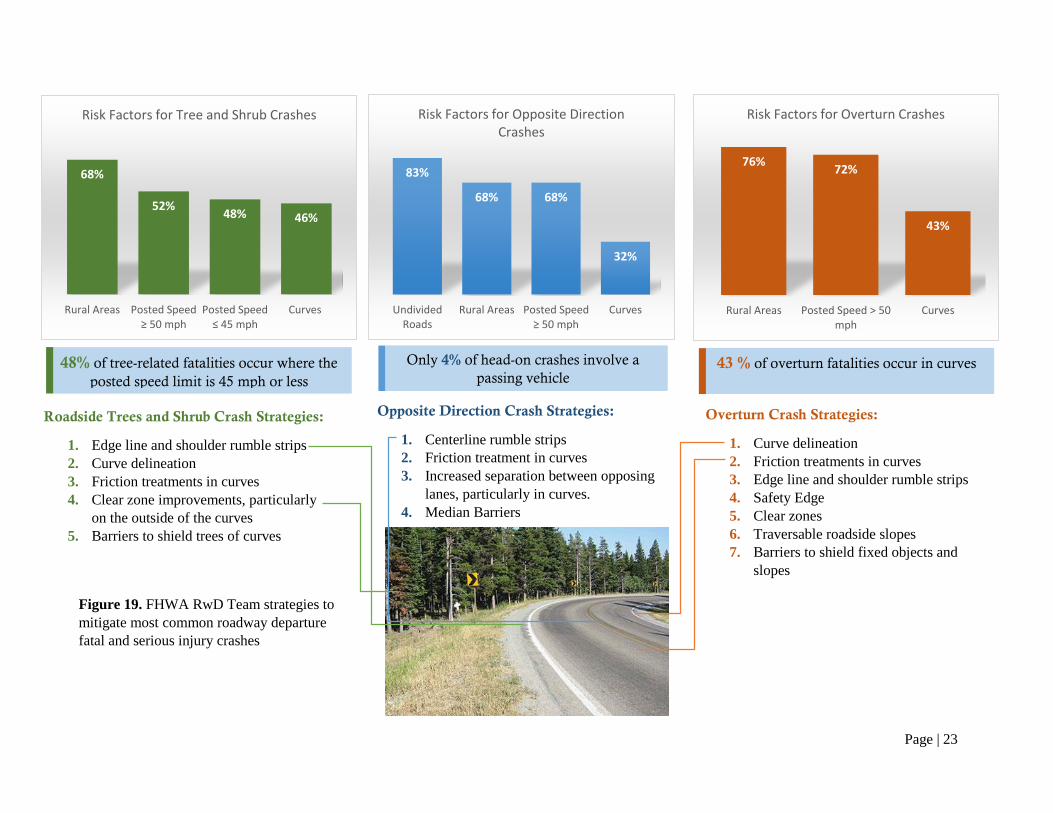
FHWA RwD Team have published some recommended strategies and actions to reduce the number of ROR
crashes. To start with some, FHWA RwD Team strategies to mitigate most common roadway departure
fatal and serious injury crashes are shown in Figure 19.
As a response to AASHTO-SHSP, National Cooperative Highway Research Program (NCHRP) has also
published a report named Report 500, Volume 6: “Guide for Addressing Run-Off-Road Collisions”. This
report contains a comprehensive approach to minimize ROR crashes and its fatalities and injuries. The main
objective of this report is firstly to develop strategies to keep the vehicle in the travel lane and prevent them
from encroaching to the outside edges of the lanes. Factors that can cause driver errors include avoiding a
vehicle, object, or animal in the travel lane; inattentive driving due to distraction, fatigue, sleep, or drugs;
the effects of weather on pavement conditions; and traveling too fast through a curve or down a grade;
travel lanes that are too narrow, substandard curves, and unforgiving shoulders and roadsides. Strategies
are developed to deal with these problems.
The second objective is that if for any reason the vehicle travels on to the roadside, strategies should be
developed to minimize the likelihood of crashing or overturning. The probability of a crash occurring
depends on many factors like presence and location of fixed objects, shoulder edge drop-off, sideslopes,
ditches, trees and soil properties. Strategies directed at reducing the number and density of possibly
hazardous roadside features that would contribute to the likelihood of an ROR crash are provided.
The third objective is that given that the crash occurs, strategies needs to be developed to reduce the severity
of these crashes. These strategies may include making roadside hardware more forgiving or modifying
sideslopes to prevent rollovers) and by changes in the vehicle (e.g., better restraint systems or improved
side protection) or by increased occupant use of available restraints. So the three objectives of this NCHRP
Report are as follows:
• Keep vehicles from encroaching on the roadside
• Minimize the likelihood of crashing or overturning if the vehicle travels off the shoulder
• Reduce the severity of the crash
According to NCHRP 500 volume 6, strategies developed have been classified into three types which
include:
• Tried (T): These are strategies that have been implemented in a number of locations and may even
be accepted as standards, but for which there have not been found valid evaluations. While applying
these strategies, caution needs to be taken.
• Experimental (E): Strategies that have been suggested and may have been tried by some agencies
in one or two locations. These strategies need to be applied after careful testing and evaluations.
• Proven (P): These are strategies that properly designed evaluations have been conducted on them
and it is now proven that they are effective. They can be applied with great confidence.
In this paper the strategies are also divided into three parts based on the objectives of the NCHRP Report
and various other sources are used to include strategies that are not mentioned in this NCHRP Report.
Page | 23
83%
68% 68%
32%
UndividedRoads
Rural Areas Posted Speed ≥ 50 mph
Curves
Risk Factors for Opposite Direction Crashes
68%
52%48% 46%
Rural Areas Posted Speed ≥ 50 mph
Posted Speed ≤ 45 mph
Curves
Risk Factors for Tree and Shrub Crashes
76%72%
43%
Rural Areas Posted Speed > 50mph
Curves
Risk Factors for Overturn Crashes
Opposite Direction Crash Strategies:
1. Centerline rumble strips
2. Friction treatment in curves
3. Increased separation between opposing
lanes, particularly in curves.
4. Median Barriers
Roadside Trees and Shrub Crash Strategies:
1. Edge line and shoulder rumble strips
2. Curve delineation
3. Friction treatments in curves
4. Clear zone improvements, particularly
on the outside of the curves
5. Barriers to shield trees of curves
Overturn Crash Strategies:
1. Curve delineation
2. Friction treatments in curves
3. Edge line and shoulder rumble strips
4. Safety Edge
5. Clear zones
6. Traversable roadside slopes
7. Barriers to shield fixed objects and
slopes
Only 4% of head-on crashes involve a
passing vehicle 48% of tree-related fatalities occur where the
posted speed limit is 45 mph or less
43 % of overturn fatalities occur in curves
Figure 19. FHWA RwD Team strategies to
mitigate most common roadway departure
fatal and serious injury crashes
Page | 24
Strategies to Keep Vehicles from Encroaching on the Roadside
Shoulder Rumble Strips:
Shoulder Rumble Strips are generally about 0.5 inches deep, spaced about 7 inches apart, and cut in groups
of four or five. They can provide a sudden rumbling sound and can cause the vehicle to vibrate, and can
alert an inattentive, drowsy, or sleeping driver of encroachment on the shoulder and possibly onto the
roadside. They are generally less expensive and can be applied anytime during the construction or
maintenance of the project. Details regarding current practice with rumble strips can be found on the Federal
Highway Administration’s “Rumble Strip Community of Practice” Website provided in the Reference
section.
On freeways shoulder rumble strips are proven to be very effective to warn drivers of encroaching to the
roadside. According to FHWA, several studies have estimated that rumble strips can reduce the rate of ROR
crashes by 20 to 50 percent. Although they have been applied to many nonfreeways their effectiveness is
not documented and further evaluation is needed.
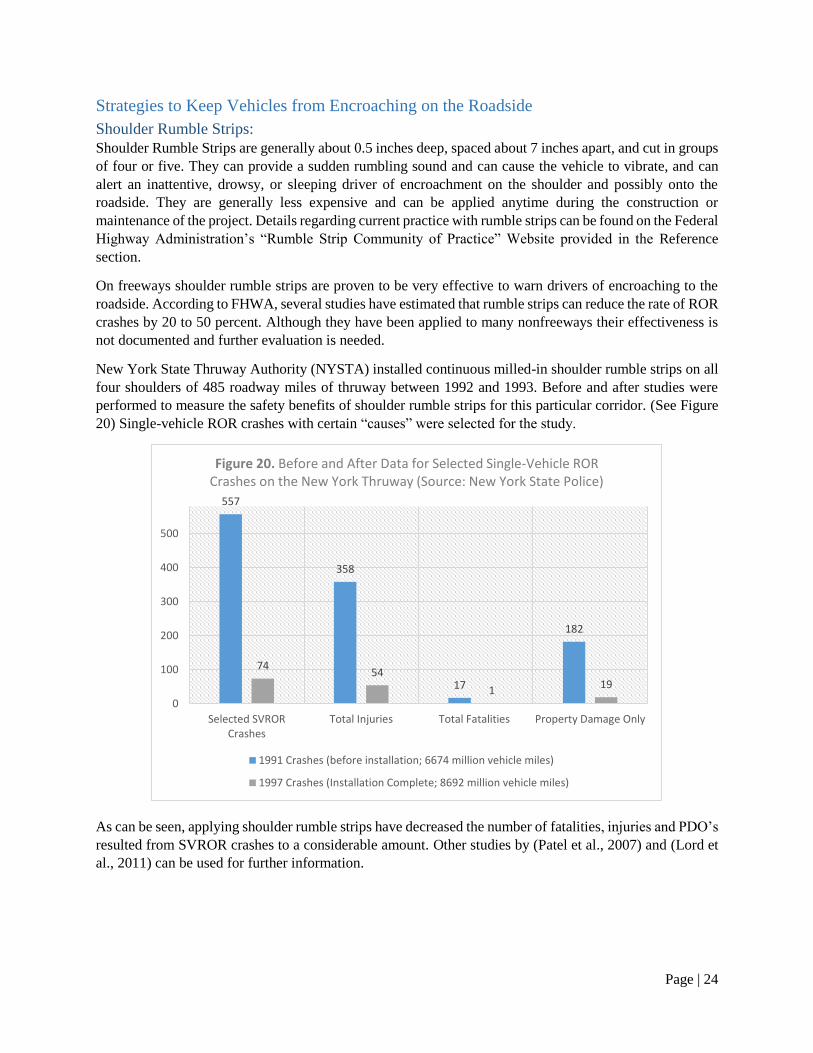
New York State Thruway Authority (NYSTA) installed continuous milled-in shoulder rumble strips on all
four shoulders of 485 roadway miles of thruway between 1992 and 1993. Before and after studies were
performed to measure the safety benefits of shoulder rumble strips for this particular corridor. (See Figure
20) Single-vehicle ROR crashes with certain “causes” were selected for the study.
As can be seen, applying shoulder rumble strips have decreased the number of fatalities, injuries and PDO’s
resulted from SVROR crashes to a considerable amount. Other studies by (Patel et al., 2007) and (Lord et
al., 2011) can be used for further information.
557
358
17
182
7454
119
0
100
200
300
400
500
Selected SVRORCrashes
Total Injuries Total Fatalities Property Damage Only
Figure 20. Before and After Data for Selected Single-Vehicle ROR Crashes on the New York Thruway (Source: New York State Police)
1991 Crashes (before installation; 6674 million vehicle miles)
1997 Crashes (Installation Complete; 8692 million vehicle miles)
Page | 25
Edgeline Rumble Strips for Roads with Narrow or Unpaved Shoulders:
Edgeline rumble strips are used when shoulders are narrow and unpaved. Although used by some agencies
in some locations, this strategy is still in its experimental phase requiring many tests and evaluations before
using.
Midlane Rumble Strips:
This treatment is also in its experimental phase and should be pilot tested and evaluated before widespread
use. They are similar to shoulder rumble strips 0.5 inch deep, spaced about 4 inches apart, and cut in groups
of four or five. There is fear among some designers and safety engineers that the strip in the center of the
lane may cause distraction to the driver. It is better if they are considered at locations with both an ROR
and a head-on crash problem.
Enhanced Delineation of Sharp Curves:
Sharper curves result in more shoulder encroachments and crashes and flattening of the curve may be too
costly. One way to consider both safety and budgetary constraints is to delineate sharp curves with enhanced
markings. This can be done by improved shoulder delineation (adding more chevrons or high-intensity
chevrons, large arrow signs, or delineators on guardrails); improved curve warning signs (warning signs
with flashing beacons); or innovative on pavement markings (warning arrows on the pavement prior to the
curve).
According to many studies, well-placed shoulder delineators are proven to reduce ROR crashes. On the
other hand on-pavement treatments have been evaluated in terms of speed reduction but not crash reduction.
This is a categorized as a tried strategy. In a very well-designed early study of post-mounted delineators on
rural two-lane curves (Foody and Taylor, 1966) found that they reduce ROR crashes by 15 percent. Many
other studies also have documented the benefits of enhanced delineation of sharp curves.
Improved Highway Geometry for Horizontal Curves:
According to (Glennon et al., 1985), both ROR and head-on crashes are 1.5 to 4 times more likely to occur
on curves than on tangents. In a study done by (Zegeer et al. 1992) it was found that flattening curves on
two-lane rural roadways from 30 degrees to 5 degree would result in total curve crash reductions of up to
80 percent. So this strategy is proven to reduce ROR crashes. This strategy is among the higher-cost
alternatives of those considered.
Enhanced Pavement Markings at Appropriate Locations
Pavement marking should be enhanced at locations where they drivers might leave the roadway. This may
be done through higher contrast or wider markings or raised pavement markers (RPMs). The main purpose
behind this strategy is to make the drivers use the information to stay in their lanes and not merely to
maintain or increase their speed. They are considered to be in the “tried” category of strategies. This is
because some studies have raised questions about the effectiveness of this measure.
In a study by (Pendleton, 1996) and a research conducted by Bellomo-McGee, Inc., for NCHRP indicate a
lack of significant effect or even a possible increase in crashes on some locations. This may be because
drivers tend to drive faster when presented with a clearer delineation.
But in another study of six rural two-lane roads (over 126 miles) with RPMs in northern New Jersey, it was
found that there was a statistically significant reduction in various nighttime crashes including total, injury,
property damage, overturn, head-on, fixed object, and between intersection crashes. (State of New Jersey,
1986).
Page | 26
Skid-Resistant Pavements:
A vehicle will skid during braking and maneuvering when frictional demand exceeds the friction force that
can be developed at the tire-road interface. The probability of this occurring on a wet pavement is much
higher than a dry pavement. According to a study by (Hall et al., 2009), even as little as 0.002 inches of
water on the pavement can reduce the coefficient of friction by 20 to 30 percent.
There has been a large amount of research funded by the FHWA, AASHTO, and pavement associations
concerning designing better pavements—durable and cost-effective pavements. An important parameter in
all this work is to design skid-resistant pavement with good drainage capability.
Although there is only limited research on such site-specific programs, the results of research on the general
effectiveness of decreasing skidding has placed this strategy in proven category.
New York State Department of Transportation (NYDOT), implemented a statewide program that identified
sites with low pavement skid resistance and treated them with overlays or microsurfacing. Between 1995
and 1997, 36 sites were treated and resulting in a reduction of more than 800 wet crashes per year. This was
a reduction of 50 percent in wet-road accidents and 20 percent for total accidents. Reduction of ROR crashes
are also perceived to have decreased by the same amount proportion as total crashes.
Shoulder Treatments:
If a shoulder area can allow the vehicle to safely recover from a dangerous maneuver that caused the vehicle
to leave the lane and enter the shoulder, it can prevent a ROR crash. It can further increase the safety if the
shoulder area is paved and wide enough to fit a vehicle. Shoulder treatments that promote safe recovery
include shoulder widening, shoulder paving, and the reduction of pavement edgedrops.
Although widening or paving a shoulder is a self-evident alternative, treating an edgedrop in locations
where it is very obvious can increase safety. Edgedrops may result from repaving, where material is added
to the lane but not to the adjacent shoulder, or from weather or vehicle-caused “erosion” of unpaved
shoulders. According to (Humphreys and Parham, 1994), the best treatment to an edgedrop is to make it
level with the pavement surface. Since this may be costly and sometimes difficult, they came up with an
excellent alternative for both paved and unpaved shoulders. They proposed adding a 45-degree fillet at the
lane/pavement edge that would allow the vehicle to safely return to the roadway. Based on the current
researches, shoulder paving and widening are considered proven strategies, while edgedrop treatments are
considered experimental.
In FHWA’s effort related to determining accident modification factors for use with the Interactive Highway
Safety Design Model (IHSDM), (Harwood et al., 2000), studied the effects of shoulder widening on
reducing the number of ROR crashes. As can be seen from Figure 21 for an ADT of less than 400 veh/day,
the effect of shoulder widening is minimal. But as the ADT increases, the benefits of widening the shoulder
also increases and will stay constant after an ADT of more than 2000 veh/day.
Same source has documented the benefits of using paved or unpaved shoulder. Figure 22 shows the benefits
of using paved shoulder. As can be seen, AMF is lower in paved shoulder than gravel, composite or turf
shoulders. Much less is known about the effectiveness of edgedrop treatments, as it is difficult to identify
the crashes that were caused as a result of overcorrection. (Humphreys and Parham, 1994) concluded that
a 45-degree-angle asphalt fillet at the lane edge would eliminate this type of crash, even in cases where the
shoulder is unpaved and suffers from erosion damage.
Page | 27
0.98
1
1.02
1.04
1.06
1.08
1.1
1.12
1.14
1.16
0 2 4 6 8 10
AM
F
Shoulder Width (ft)
Figure 22. Accident Modification Factor for Shoulder Type on Two-Lane Rural Highways (Source: Harwood et al., 2000)
Paved Gravel Composite Turf
Figure 21. Accident Modification Factor for Paved Shoulder Width (Relative to 6-Foot
Paved Shoulder) on Two-Lane Rural Highways (Source: Harwood et al., 2000)
Page | 28
Minimize the Likelihood of Crashing into an Object or Overturning if the Vehicle
Travels Off the Shoulder
Design Safer Slopes and Ditches to Prevent Rollovers:
As shown in the first part of the report, the most harmful event in a SVROR is overturn or rollover.
Decreasing the number of rollover crashes can contribute significantly to the safety of a roadway. The
roadside design features most likely to affect rollover include the sideslopes (particularly fill slopes), ditch
design, the nature of the soil on the slope, and the design of roadside hardware that might lead to rollovers
(e.g., poorly designed guardrail ends).
Flattening the sideslopes is a proven strategy to decrease the number of ROR crashes. According to
FHWA’s Model Inventory of Roadway Elements (MIRE, 2010) roadside rating the best roadside with a
rating of 1 has sideslopes flatter than 1:4.
Additional rollover (and other ROR) crash reduction could come from improved designs of roadside
ditches. Although AASHTO Roadside Design Guide includes preferred foreslopes and backslopes for basic
ditch configurations, they are only applied to interstates or major highways and are rarely applied to other
low profile roadways.
(Zegeer et al., 1987) examined the effects of sideslope on both rollover crashes and total single-vehicle
crashes. They used field-measured crash, sideslope, cross section, and traffic data from approximately 1,800
miles on rural two-lane roads in three states. They found that rollover rates were significantly higher on
slopes of 1:4 or steeper as compared with slopes of 1:5 or flatter.
So based on the current research evidence, the set of strategies related to rollover (and ROR crash) reduction
through changes in the “vertical” component of the sideslopes and changing the foreslopes and backslopes
of ditches would be considered “proven” strategies.
Remove/Relocate Objects in Hazardous Locations:
Although a considerable amount of rollover crashes could be reduced by improving sideslopes and ditches
which are part of the clear zone- the recovery area provided to vehicles that leave the roadway, additional
fatalities and injuries can be reduced by modifying the width of the clear zone. The wider the clear zone,
the more likely that a vehicle can recover from a dangerous maneuver. Usually the width of a clear zone is
established by natural objects (trees, rock outcrops, embankments, etc.), or by roadside hardware (guardrails
etc.).
According to the Roadside Design Guide, a “safe clear zone width” on higher-speed roads is approximately
30 feet but there is no single width that defines maximum safety. Width of the clear zone usually depends
on design speed of the roadway, design ADT, the prevailing sideslope, and curvature.
A study for the Texas DOT by (Fambro et al., 1995) used a benefit-cost analysis to establish guidelines for
clear zone on suburban high-speed roadways with curb and gutter. The baseline minimum clear zone width
used in the calculation was approximately 10 feet. It was found that it is not cost-beneficial to purchase 5
feet or less of additional right-of-way since the cost of relocating the objects would be higher than cost of
purchasing the land. It was also found that if a roadway has less roadside hazards, it is not cost beneficial
to purchase additional clear zone.
(Zegeer et al., 1987) also estimated the effects of clear zone widening on two-lane rural roads. If the existing
recovery area measured from the edgeline is less than 10 to 15 feet, Figure 23 shows the percent reduction
in ROR, head-on and sideswipe crashes due to widening the clear zone.
Page | 29
As indicated, and increase of 20 feet has three times more benefits in reducing related crashes than an
increase of 5 feet.
So based on the current research concerning crash-related effectiveness, strategies widening the clear zone
are considered to have proven effectiveness.
Delineation of Roadside Objects:
The main purpose of delineating roadside objects is that they become more visible to drivers at night.
Pennsylvania Department of Transportation (PennDOT) has an experimental program targeting delineation
to potentially hazardous objects on road segments with high run-off-road utility pole- and tree-related crash
frequencies. This program is proving effective when it is not feasible to remove or relocate an object
because of budget constraints or the object is on private property. PennDOT marks the tree or utility pole
with a round of reflective tape. One round is used on each tree and each utility pole. Two rounds are used
for poles at intersections.
Since no evaluation has yet been documented on the effectiveness of this practice, this strategy is considered
as experimental.
Reduce the Severity of the Crash
Improve Design of Roadside Hardware or Application of Barrier and Attenuation Systems:
Although the concept of forgiving roadside requires us to place all the roadside fixed objects outside the
clear zone, so objects need to be placed near the traveled way. These objects include hardware or objects
related to traffic guidance or control (signs, some lighting supports, etc.); protection of more hazardous
objects or situations (guardrails or median barriers); roadway design requirements (culverts); and traditional
right-of-way uses (utility poles, mail boxes).
0%
5%
10%
15%
20%
25%
30%
35%
40%
45%
50%
5 10 15 20Pe
rce
nt
Re
du
ctio
n in
Re
late
d A
ccid
en
t Ty
pe
s (i
.e.,
R
OR
+he
ad-o
n+s
ide
swip
e)
Amount of Increased Roadside Recovery Distance (feet)
Figure 23. Percent Reduction in Related Accident Types (i.e., ROR+head-on+sideswipe)
Page | 30
If relocating the objects farther from traffic flow or hazardous locations is impossible, shielding or replacing
“harder” objects with less hazardous breakaway devices (use of breakaway luminaire supports, or use of
crash cushions in front of hazardous immovable objects) can be a good option.
Based upon current crash-related research, the relocation of “hard” objects farther from the roadway or their
replacement with more forgiving designs (e.g., breakaway designs) are considered “proven” strategies to
reduce roadside harm.
Contemporary Countermeasures for reducing ROR Crashes During the recent two decades, several intelligent vehicle technologies have emerged that can provide
instantaneous on the road information to the motorist and can result in timely decisions by the driver.
NHTSA has recognized that technologies such as electronic stability control (ESC) and Anti-lock Braking
System (ABS) can potentially reduce a great number of these fatal crashes. Emerging technologies like lane
departure warning systems (LDWS) can also have great impacts in crash avoidance.
A detailed description of the functions and guidelines for using these technologies is beyond the scope of
this paper. Instead, this paper looks into the major benefits of using these systems in terms of preventing
fatal and major injury crashes.
In the first part of this section, an introduction and the potential benefits of using ESC and ABS in reducing
ROR crashes is discussed. The second section includes information about how LDWS systems function
and what are their benefits in reducing ROR crashes. The reader is persuaded to refer to the references
provided in the report for more information.
Effects of ABS and ESC on ROR Crashes ABS is a four-wheel system that modulates the brake pressure during an emergency stop, hence preventing
wheel lock-up. Preventing the wheel from an entire lock-up, ABS helps the driver to maintain steering
control and to stop in the shortest possible distance. On the other hand ESC which is an evolution of ABS
system, uses a technology that maintains vehicle control that is lost due to oversteering or skidding.
According to many studies by (Hertz and Johnson, 1998) and (Kahane and Dang, 2009) ABS-supplied
vehicles have zero or even negative impacts in reducing the number of fatal ROR crashes. But according
to (National Automotive Sampling System-General Estimates System (NASS-GES), 1995-2007) ABS has
been quite effective in reducing non-fatal crashes. It has reduced the overall crash involvement of passenger
cars by 6% and light trucks by 8%.
In order to show the effects of ESC and ABS system, the NMVCCS data which also contains information
about the availability and use of equipment on-board the vehicles, both original equipment (OEM) and
after-market. Table 13 shows the benefits of using ABS and ESC in reducing ROR crashes. Three cases are
considered.
ABS Versus “Neither ABS nor ESC”
“ABS Only” Versus “Both ABS and ESC”
“Both ABS and ESC” Versus “Neither ABS Nor ESC”
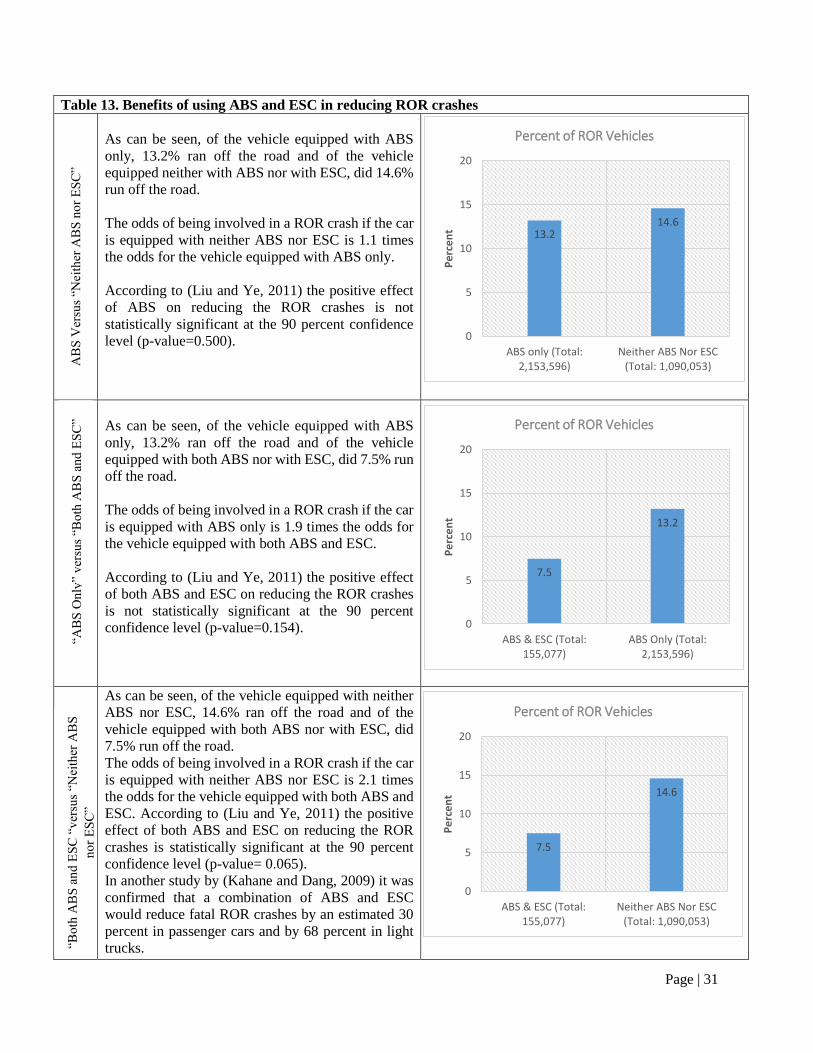
Page | 31
Table 13. Benefits of using ABS and ESC in reducing ROR crashes
As can be seen, of the vehicle equipped with ABS
only, 13.2% ran off the road and of the vehicle
equipped neither with ABS nor with ESC, did 14.6%
run off the road.
The odds of being involved in a ROR crash if the car
is equipped with neither ABS nor ESC is 1.1 times
the odds for the vehicle equipped with ABS only.
According to (Liu and Ye, 2011) the positive effect
of ABS on reducing the ROR crashes is not
statistically significant at the 90 percent confidence
level (p-value=0.500).
As can be seen, of the vehicle equipped with ABS
only, 13.2% ran off the road and of the vehicle
equipped with both ABS nor with ESC, did 7.5% run
off the road.
The odds of being involved in a ROR crash if the car
is equipped with ABS only is 1.9 times the odds for
the vehicle equipped with both ABS and ESC.
According to (Liu and Ye, 2011) the positive effect
of both ABS and ESC on reducing the ROR crashes
is not statistically significant at the 90 percent
confidence level (p-value=0.154).
As can be seen, of the vehicle equipped with neither
ABS nor ESC, 14.6% ran off the road and of the
vehicle equipped with both ABS nor with ESC, did
7.5% run off the road.
The odds of being involved in a ROR crash if the car
is equipped with neither ABS nor ESC is 2.1 times
the odds for the vehicle equipped with both ABS and
ESC. According to (Liu and Ye, 2011) the positive
effect of both ABS and ESC on reducing the ROR
crashes is statistically significant at the 90 percent
confidence level (p-value= 0.065).
In another study by (Kahane and Dang, 2009) it was
confirmed that a combination of ABS and ESC
would reduce fatal ROR crashes by an estimated 30
percent in passenger cars and by 68 percent in light
trucks.
13.214.6
0
5
10
15
20
ABS only (Total:2,153,596)
Neither ABS Nor ESC(Total: 1,090,053)
Pe
rce
nt
Percent of ROR Vehicles
7.5
13.2
0
5
10
15
20
ABS & ESC (Total:155,077)
ABS Only (Total:2,153,596)
Pe
rce
nt
Percent of ROR Vehicles
7.5
14.6
0
5
10
15
20
ABS & ESC (Total:155,077)
Neither ABS Nor ESC(Total: 1,090,053)
Pe
rce
nt
Percent of ROR Vehicles
AB
S V
ersu
s “N
eit
her
AB
S n
or
ES
C”
“AB
S O
nly
” v
ersu
s “B
oth
AB
S a
nd
ES
C”
“Bo
th A
BS
an
d E
SC
“v
ersu
s “N
eith
er A
BS
no
r E
SC
”
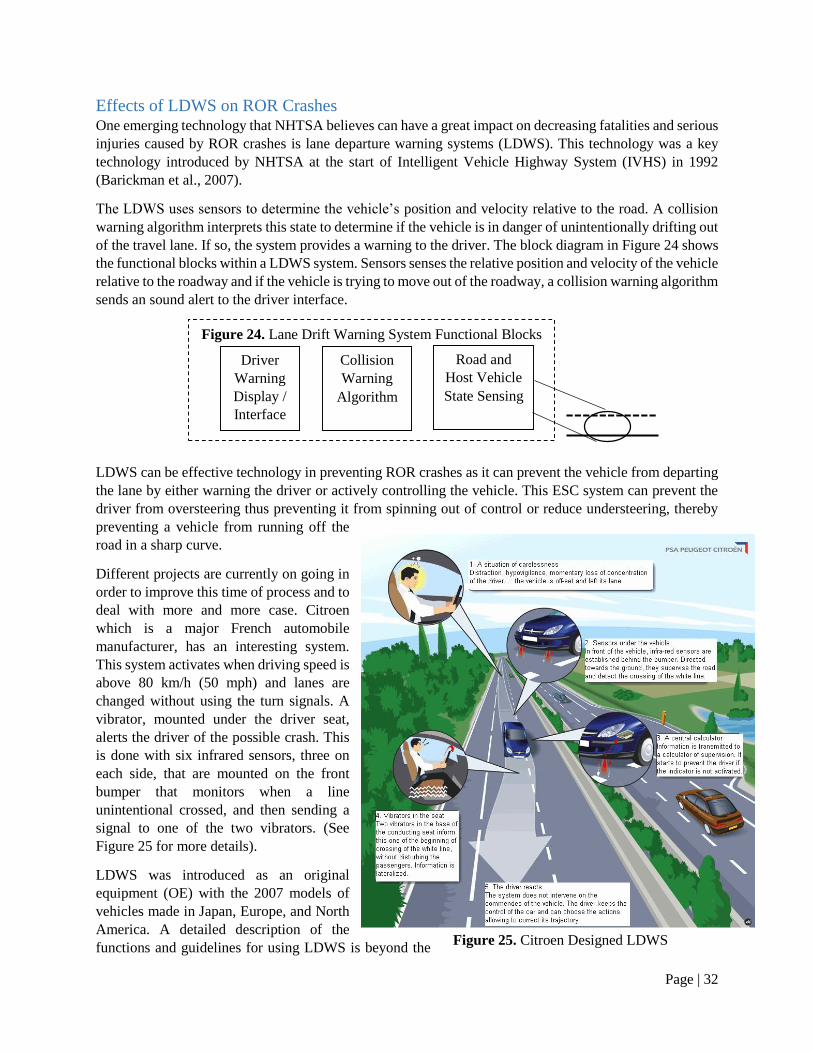
Page | 32
Effects of LDWS on ROR Crashes One emerging technology that NHTSA believes can have a great impact on decreasing fatalities and serious
injuries caused by ROR crashes is lane departure warning systems (LDWS). This technology was a key
technology introduced by NHTSA at the start of Intelligent Vehicle Highway System (IVHS) in 1992
(Barickman et al., 2007).
The LDWS uses sensors to determine the vehicle’s position and velocity relative to the road. A collision
warning algorithm interprets this state to determine if the vehicle is in danger of unintentionally drifting out
of the travel lane. If so, the system provides a warning to the driver. The block diagram in Figure 24 shows
the functional blocks within a LDWS system. Sensors senses the relative position and velocity of the vehicle
relative to the roadway and if the vehicle is trying to move out of the roadway, a collision warning algorithm
sends an sound alert to the driver interface.
LDWS can be effective technology in preventing ROR crashes as it can prevent the vehicle from departing
the lane by either warning the driver or actively controlling the vehicle. This ESC system can prevent the
driver from oversteering thus preventing it from spinning out of control or reduce understeering, thereby
preventing a vehicle from running off the
road in a sharp curve.
Different projects are currently on going in
order to improve this time of process and to
deal with more and more case. Citroen
which is a major French automobile
manufacturer, has an interesting system.
This system activates when driving speed is
above 80 km/h (50 mph) and lanes are
changed without using the turn signals. A
vibrator, mounted under the driver seat,
alerts the driver of the possible crash. This
is done with six infrared sensors, three on
each side, that are mounted on the front
bumper that monitors when a line
unintentional crossed, and then sending a
signal to one of the two vibrators. (See
Figure 25 for more details).
LDWS was introduced as an original
equipment (OE) with the 2007 models of
vehicles made in Japan, Europe, and North
America. A detailed description of the
functions and guidelines for using LDWS is beyond the
Figure 24. Lane Drift Warning System Functional Blocks
Driver
Warning
Display /
Interface
Collision
Warning
Algorithm
Road and
Host Vehicle
State Sensing
Figure 25. Citroen Designed LDWS http://www.citroen.co.uk/about-
citroen/technology/lane-departure-
warning-system
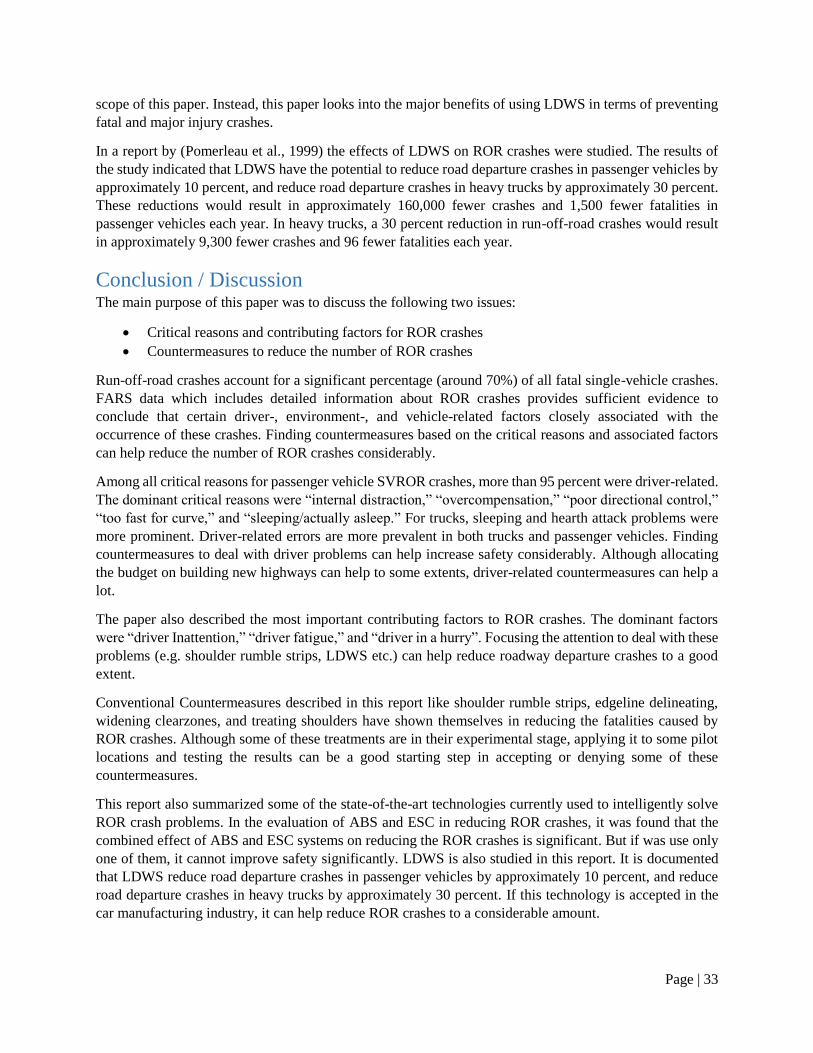
Page | 33
scope of this paper. Instead, this paper looks into the major benefits of using LDWS in terms of preventing
fatal and major injury crashes.
In a report by (Pomerleau et al., 1999) the effects of LDWS on ROR crashes were studied. The results of
the study indicated that LDWS have the potential to reduce road departure crashes in passenger vehicles by
approximately 10 percent, and reduce road departure crashes in heavy trucks by approximately 30 percent.
These reductions would result in approximately 160,000 fewer crashes and 1,500 fewer fatalities in
passenger vehicles each year. In heavy trucks, a 30 percent reduction in run-off-road crashes would result
in approximately 9,300 fewer crashes and 96 fewer fatalities each year.
Conclusion / Discussion The main purpose of this paper was to discuss the following two issues:
Critical reasons and contributing factors for ROR crashes
Countermeasures to reduce the number of ROR crashes
Run-off-road crashes account for a significant percentage (around 70%) of all fatal single-vehicle crashes.
FARS data which includes detailed information about ROR crashes provides sufficient evidence to
conclude that certain driver-, environment-, and vehicle-related factors closely associated with the
occurrence of these crashes. Finding countermeasures based on the critical reasons and associated factors
can help reduce the number of ROR crashes considerably.
Among all critical reasons for passenger vehicle SVROR crashes, more than 95 percent were driver-related.
The dominant critical reasons were “internal distraction,” “overcompensation,” “poor directional control,”
“too fast for curve,” and “sleeping/actually asleep.” For trucks, sleeping and hearth attack problems were
more prominent. Driver-related errors are more prevalent in both trucks and passenger vehicles. Finding
countermeasures to deal with driver problems can help increase safety considerably. Although allocating
the budget on building new highways can help to some extents, driver-related countermeasures can help a
lot.
The paper also described the most important contributing factors to ROR crashes. The dominant factors
were “driver Inattention,” “driver fatigue,” and “driver in a hurry”. Focusing the attention to deal with these
problems (e.g. shoulder rumble strips, LDWS etc.) can help reduce roadway departure crashes to a good
extent.
Conventional Countermeasures described in this report like shoulder rumble strips, edgeline delineating,
widening clearzones, and treating shoulders have shown themselves in reducing the fatalities caused by
ROR crashes. Although some of these treatments are in their experimental stage, applying it to some pilot
locations and testing the results can be a good starting step in accepting or denying some of these
countermeasures.
This report also summarized some of the state-of-the-art technologies currently used to intelligently solve
ROR crash problems. In the evaluation of ABS and ESC in reducing ROR crashes, it was found that the
combined effect of ABS and ESC systems on reducing the ROR crashes is significant. But if was use only
one of them, it cannot improve safety significantly. LDWS is also studied in this report. It is documented
that LDWS reduce road departure crashes in passenger vehicles by approximately 10 percent, and reduce
road departure crashes in heavy trucks by approximately 30 percent. If this technology is accepted in the
car manufacturing industry, it can help reduce ROR crashes to a considerable amount.
Page | 34
Areas of Future Research As discussed in this document, many factors associated with roadway departure crashes are human-related
(e.g., Liu and Ye, 2011). In many cases, a driver commits an error, and the end result that governs the type
and severity of the crash is related to where the error is committed, whether it is on a curve or a tangent
section, or at a location with a high pavement edge drop-off. With this in mind, future research can examine
countermeasures that would help reduce the likelihood for these errors to occur and those that would
minimize the severity when the driver leaves the traveled-way. This may include conventional or new
advanced technologies.
Fatigue is also one of the largest sources to ROR crashes. Further development of drowsiness detection
systems can have significant impact in reducing fatalities and serious injuries occurred by ROR crashes due
to fatigue. The potential benefit of applying these systems in trucks and buses is unimaginable.
References AASHTO (2002). Roadside Design Guide. American Association of State Highway and Transportation
Officials, Washington, DC.
AASHTO-SHSP, http://safety.transportation.org/
Ball, K., Owsley, C., Sloane, E., Roenker, D., and Bruni, J. “Visual attention problems as a predictor of
vehicle crashes in older drivers,” Investigative Ophthalmology & Visual Science, 34, 3110-3123.
Citroen Designed LDWS. http://www.citroen.co.uk/about-citroen/technology/lane-departure-warning-
system
Critical Reasons for Crashes Investigated in the National Motor Vehicle Crash Causation Survey 2015.
Report No. DOT HS 812 115. National Highway Transportation Safety Agency, Washington, D.C.
Davis, G.A., S. Davuluri, and J. Pei (2006). Speed as a Risk Factor in Serious Run-off-Road Crashes:
Bayesian Case-Control Analysis with Case Speed Uncertainty. Journal of Transportation and Statistics,
Vol. 9, No. 1. Research and Innovative Technology Administration, U.S. Department of Transportation,
Washington, DC. P. 17-28.
F Barickman, R Jones, L Smith, Lane departure warning system research and test development, in
Proceedings of the 20th International Conference on the Enhanced Safety of Vehicles, (Lyon, 18–21 Jun
2007), pp. 1–8
Fambro, D. B., R. L. Nowlin, S. P. Warren, K. A. Lienau, J. M. Mounce, R. P. Bligh, K. K. Mak, and H.
E. Ross. Geometric Design Guidelines for Suburban High-Speed Curb and Gutter Roadways. Texas
Transportation Institute, Texas A&M University, College Station, Texas. 1995. -008. 1987.
FHWA (2006). Safety Compass: Highway Safety Solutions for Saving Lives. A Publication of the
Federal Highway Administration Safety Program, December 2006 - Volume 1, Issue 1.Accessed from:
http://safety.fhwa.dot.gov/newsletter/safetycompass/2006/dec06_v1/ .Accessed on Aug 23, 2011.
FHWA Roadway Departure (RwD) Strategic Plan, March 2013
FHWA, Office of Safety, NY State Thruway Selected Crash Experience,
http://safety.fhwa.dot.gov/roadway_dept/pavement/rumble_strips/effectiveness/state_ny/ny_crash.cfm
Page | 35
FMCSA. (2006, March). Report to Congress on the Large Truck Crash Causation Study. Washington,
DC: Federal Motor Carrier Safety Administration. March 2006.
Foody, T. J., and W. C. Taylor. Curve Delineation and Accidents. Ohio Department of Highways, Bureau
of Traffic. Columbus, Ohio. 1966.
Glennon, J. C., T. R. Newman, and J. E. Leisch. Safety and Operational Considerations for Design of
Rural Highway Curves, FHWA/RD-86/035. FHWA, U.S. Department of Transportation. 1985.
Hall, J.W., K.L. Smith, L. Titus-Glover, J.C. Wambold, T.J. Yager, and Z. Rado, Guide for Pavement
Friction, NCHRP Web-Only Document 108, Transportation Research Board of the National Academies,
Washington D.C., 2009.
Hallmark, S.L., Hsu, Y.Y., Maze, T., McDonald, T., and Fitzsimmons, E. (2009). Investigating factors
contributing to large truck lane departure crashes using the federal motor carrier safety administration’s
large truck crash causation study (LTCCS) database. Center for Transportation Research and Education,
Iowa State University, Ames, IA.
Harwood, D. W., F. M. Council, E. Hauer, W. E. Hughes, and A. Vogt. Prediction of the Expected Safety
Performance of Rural Two-Lane Highways, FHWA-RD-99-207, Federal Highway Administration. 2000.
Hertz, E., Hilton, J. and Johnson, D.M. (1998, August). Analysis of the Crash Experiences of Vehicles
Equipped with Antilock Braking Systems: An Update. DOT HS 808 758. Washington, DC: National
Highway Traffic Safety Administration.
Humphreys, J. B., and J. A. Parham. The Elimination or Mitigation of Hazards Associated with Pavement
Edge Drop-Offs During Roadway Resurfacing. AAA Foundation for Traffic Safety, Washington, D.C.
1994.
Kahane, C. J., & Dang, J. N. (2009, August). The Long-Term Effect of ABS in Passenger Cars and LTVs.
DOT HS 811 182. Washington, DC: National Highway Traffic Safety Administration.
Liu C. and T. G. Ye (2011). Run-Off-Road Crashes: An On-Scene Perspective. Report No. DOT HS 811
500. National Highway Transportation Safety Agency, Washington, D.C.
Liu, C., & Subramanian, R. (2009, November). Factors Related to Fatal Single-Vehicle Run-Off-Road
Crashes. DOT HS 811 232. Washington, DC: National Highway Traffic Safety Administration.
Lord, Dominique, Brewer, M.A., Fitzpatrick, Kay, Geedipally, S.R., Peng, Yichuan. Analysis of roadway
departure crashes on two-lane rural roads in Texas, Report, September 2011
McGinnis, R. G., M. J. Davis, and E. A. Hathaway, 2001. Longitudinal Analysis of Fatal Run-off-road
Crashes, 1975 to 1997, in Transportation Research Record of the National Academies: Journal of the
Transportation Research Board, vol. 1746, no. 1, pp.47-58.
Model Inventory of Roadway Elements (MIRE), Federal Highway Administration, U.S. Department of
Transportation. 2010
Najm, W., J. Koopmann, L. Boyle, and D. Smith. 2002. Development of Test Scenarios for Off-Roadway
Crash Countermeasures Based on Crash Statistics. DOT-HS-809-505. Washington, DC: National
Highway Traffic Safety Center.
Page | 36
National Highway Traffic Safety Administration (NHTSA), Traffic Safety Facts 2012: A Compilation of
Motor Vehicle Crash Data from the Fatality Analysis Reporting System and the General Estimates
System, Report HS 812 032. U.S. Department of Transportation, 2013.
National Highway Traffic Safety Administration (NHTSA), Traffic Safety Facts 1999: A Compilation of
Motor Vehicle Crash Data from the Fatality Analysis Reporting System and the General Estimates
System, Report HS 809 100. U.S. Department of Transportation, 2000.
Neuman, T. R., R. Pfefer, K. L. Slack, K. K. Hardy, F. Council, H. McGee, L. Prothe, and K. Eccles,
NCHRP Report 500: Guidance for Implementation of the AASHTO Strategic Highway Safety Plan.
Volume 6: A Guide for Addressing Run-Off-Road Collisions, Transportation Research Board,
Washington D.C., 2003.
Patel, R.B., F.M. Council, and M.S. Griffith (2007). Estimating Safety Benefits of Shoulder Rumble
Strips on Two-Lane Rural Highways in Minnesota: Empirical Bayes Observational Before-and-After
Study. TRB 86th Annual Meeting Compendium of Papers, Washington, DC.
Pendleton, O. Evaluation of Accident Analysis Methodology. Federal Highway Administration,
Washington, D.C. FHWA RD-96-039. 1996.
Pomerleau, Dean, et al. (1999 December). Run-Off-Road Collision Avoidance Using IVHS
Countermeasures. DOT HS 809 170. Washington, DC: National Highway Traffic Safety Administration.
Romoser, M. and Fisher, D. (2009). “Effects of cognitive and physical decline on older drivers’ side-to-
side scanning for hazards while executing turns,” Proceedings of the fifth international driving
symposium on human factors in driving assessment, training, and vehicle design, Big Sky, MT, 61-68.
Rumble Strip Community of Practice http://safety.fhwa.dot.gov/programs/rumble.htm.
Shanmugaratnam, S. (2008). Predicting simulated driving performance under high and low workload
environments using cognitive, visual, and psychomotor tasks. Unpublished master’s thesis, University of
West Florida, Pensacola, FL.
Spainhour, L. K., & Mishra, A. (2007). Analysis of Fatal Run-off-the-Road Crashes Involving
Overcorrection. TRB 87th Annual Meeting, Paper No. 08-0661. Washington, DC: Transportation
Research Board.
Starnes, M. (2006, August). Large-Truck Crash Causation Study – An Initial Overview. DOT HS 810
646. Washington, DC: National Highway Traffic Safety Administration.
State Highway Traffic Safety Office, Montana Traffic Safety Problem Identification, 2009 Data, Montana
Department of Transportation (MDT), 2011.
State of New Jersey. Annual Safety Report. Fiscal Year 1986.
WHO.2013. Facts Sheet 358. http://www.who.int/mediacentre/factsheets/fs358/en/
Wood, J., Chaparro, A., Hickson, L., Thyer, N., Carter, P., Hancock, J., and Hoe, A. (2006). The effect of
auditory and visual distracters on the useful field of view: Implications on the useful field of view:
Implications for the driving task. Investigative Ophthalmology & Visual Science, 47, 4646-4650.
Zegeer, C. V., J. Hummer, D. Reinfurt, L. Herf, W. Hunter. Safety Effects of Cross-Section Design for
Two-Lane Roads—Volumes I and II. Federal Highway Administration, Washington, D.C. FHWA-RD-87

Page | 37
Zegeer, C. V., J. R. Stewart, F. M. Council, D. W. Reinfurt, and E. Hamilton. “Safety Effects of
Geometric Improvements on Horizontal Curves,” Transportation Research Record 1356. Transportation
Research Board of the National Academies. 1992.
Related Documents