PhD. Thesis ROLL ON-ROLL OFF TERMINALS AND TRUCK FREIGHT. IMPROVING COMPETITIVENESS IN A MOTORWAYS OF THE SEA CONTEXT Pau Morales Fusco PhD Directors: Dr. Germán de Melo Rodriguez Dr. Sergi Saurí Marchán PhD Program in Nautical Science and Engineering Facultat de Nàutica de Barcelona (FNB) Universitat Politècnica de Catalunya (UPC) Barcelona, June 2016

Welcome message from author
This document is posted to help you gain knowledge. Please leave a comment to let me know what you think about it! Share it to your friends and learn new things together.
Transcript
PhD. Thesis
ROLL ON-ROLL OFF TERMINALS AND TRUCK
FREIGHT.
IMPROVING COMPETITIVENESS IN A MOTORWAYS
OF THE SEA CONTEXT
Pau Morales Fusco
PhD Directors:
Dr. Germán de Melo Rodriguez
Dr. Sergi Saurí Marchán
PhD Program in Nautical Science and Engineering
Facultat de Nàutica de Barcelona (FNB)
Universitat Politècnica de Catalunya (UPC)
Barcelona, June 2016

ROLL ON-ROLL OFF TERMINALS AND TRUCK
FREIGHT.
IMPROVING COMPETITIVENESS IN A MOTORWAYS
OF THE SEA CONTEXT
Autor:
Pau Morales-Fusco
Directors de tesi:
Dr. Germán de Melo Rodriguez
Dr. Sergi Saurí Marchán
Memòria presentada per optar al títol de
Doctor
en el programa de Ciència i Enginyeria Nàutiques
Facultat de Nàutica de Barcelona (FNB)
Universitat Politècnica de Catalunya (UPC)
Barcelona, Juny de 2016

To Alba and Gael
and my birth, hazel and Valencian families

Abstract
P. Morales-Fusco (2016) i
ROLL ON – ROLL OFF TERMINALS AND TRUCK FREIGHT.
IMPROVING COMPETITIVENESS IN A MOTORWAYS OF
THE SEA CONTEXT
Abstract
In recent years transport policy at an European Level has been focused on reducing the share of
road transportation and promote alternative transportation means in order to reduce road
congestion and carbon footprint.
One of the solutions proposed has been promoting Short Sea Shipping (SSS) transportation
combined with land transportation to become a door-to-door alternative to the monomodal road
alternative. The maritime centered option would hit to birds with a stone: reduce congestion in
the most urbanized areas of the European Union and partly replacing heavy polluting truck
haulage for an environmentally friendlier option.
The European Commission launched many polices and initiatives to make the modal shift happen,
the crown jewel being the launch of multiple initiatives promoting the establishment of a system
of Motorways of the Seas. Those are links between ports with higher standards in terms of travel
time, costs and flexibility, which can compete one-on-one with road haulage among the countries
in the Union.
Despite different efforts from the public administration to kick off MoS lines and ensure their
competitiveness, the expected momentum is still yet to come.
In the light of this, this thesis aims at providing tools to assess the competitiveness of existing and
MoS line to-be, to quantify the room for improvement available and the effects that some changes
at an operational and strategical level might have on the success of any specific line.
Particularly, the thesis presented aims at three specific objectives: (1) to identify the strategic
potential of SSS in all its forms, considering the characteristics of the demand (goods to be moved)
and the role of RoRo and MoS shipping in the global picture; (2) to identify the most sensible
procedures in RoRo terminals operation to be addressed to improve their performance and
perception from the end user, and; (3) To understand the costs of the supply chain, and the cost
structure of RoRo shipping lines, and their sensitiveness in front of market changes, pricing and
public funding policies.
To approach each issue different qualitative, analytical and simulating models are used depending
on the concerned problem. The strategic assessment makes use interviews to identify the main
requirements that a transporter might face when dealing with SSS.
The role of the terminal is assessed by means of two separate models: from one side an analytical
model is used to assess the relationship between capacity and quality by means of quantifying the
service time the ship spends in a port and calculate the probability of delays. On the other side,
RoRo terminals and truck freight. Improving competitiveness in a MoS context
ii P. Morales-Fusco (2016)
the resilience of the port is assessed with an arborescence interlinking its current vulnerabilities,
their causes and effects and their probability to happen.
Finally, and regarding the business models, first a cost and time model is constructed for each of
them and tested against variations on some of the variables and from there, a tool to calculate the
optimal deployment of the shipping line to ensure the maximum shift (or profit) is provided. In
that case, the model is complemented with the adaptation of a transportation discrete choice
model.
Overall, the tools should be helpful to assess the potential of a shipping line from its planning
level to its final operational deployment.
Keywords: Short sea shipping; Motorways of the Sea; Roll on – Roll off; quality assessment;
terminal capacity; resiliency, freight modal choice model; cost model.
Contents
P. Morales-Fusco (2016) iii
Table of Contents
1. INTRODUCTION, OBJECTIVES AND DOCUMENT LAY OUT ................................................ 1
1.1 BACKGROUND AND OBJECTIVES ........................................................................................ 1
1.2 RESEARCH SCOPE OF THE THESIS ....................................................................................... 4
1.3 MAIN CONTRIBUTIONS OF THE THESIS ................................................................................ 6
1.4 PUBLICATIONS FROM THIS THESIS ..................................................................................... 7
1.5 OUTLINE OF THE THESIS .................................................................................................. 8
2. SHORT SEA SHIPPING AND MOTORWAYS OF THE SEA. CONCEPTS DEFINITION ............. 11
2.1 SHORT SEA SHIPPING CONCEPT ...................................................................................... 11
2.1.1 SSS DEPENDING ON TRAFFIC SOURCE ...................................................................................... 12
2.1.2 SSS DEPENDING ON THE FREIGHT BEING SHIPPED ...................................................................... 13
2.2 MOTORWAYS OF THE SEA ............................................................................................. 15
2.2.1 MOS CONCEPT EVOLUTION ................................................................................................... 15
2.2.2 MOS DEFINITION USED ......................................................................................................... 17
2.2.3 STUDIES ON MOS SPONSORED BY THE EU................................................................................ 18
2.3 SSS AND MOS IN THE LITERATURE .................................................................................. 19
2.3.1 OFFER AND DEMAND CHARACTERIZATION ................................................................................ 21
2.3.2 EFFECTS OF POLICY MEASURES OVER SSS AND MOS .................................................................. 21
2.3.3 FEASIBILITY STUDIES ON MOS SERVICES ................................................................................... 22
2.3.4 OTHER RESEARCH TOPICS ...................................................................................................... 23
2.3.5 EXHAUSTIVE LITERATURE REVIEW............................................................................................ 23
3. STRATEGIC ASSESSMENT ON THE SSS POTENTIAL FOR THE SUPPLY CHAIN .................... 25
3.1 INTRODUCTION .......................................................................................................... 25
3.2 SSS VS ROAD, DRIVERS BEHIND THE MODAL CHOICE ............................................................ 26
3.3 DATA GATHERING ....................................................................................................... 27
3.3.1 METHODOLOGY OVERVIEW ................................................................................................... 27
3.3.2 OPEN INTERVIEWS ............................................................................................................... 28
3.3.3 CLOSED QUESTIONNAIRES ..................................................................................................... 29
3.4 DESCRIPTIVE CHARACTERISTICS OF THE SUPPLY CHAIN .......................................................... 29
3.4.1 FACTORS DEFINITION ............................................................................................................ 29
3.4.2 CONCENTRATION OF CARGOES AND VOLUMES .......................................................................... 31
3.4.3 PRODUCT VALUE AND LIFE ..................................................................................................... 31
3.4.4 VARIABILITY OVER TIME ........................................................................................................ 32
RoRo terminals and truck freight. Improving competitiveness in a MoS context
iv P. Morales-Fusco (2016)
3.5 BASIC SUPPLY CHAIN STANDARDS ................................................................................... 32
3.5.1 PUSH-AGAINST-STOCK .......................................................................................................... 33
3.5.2 CONTINUOUS SUPPLY/JUST-IN-TIME ....................................................................................... 34
3.5.3 PUSH-PULL ......................................................................................................................... 34
3.5.4 FULL LOAD PULL................................................................................................................... 35
3.5.5 PULL LTL (LESS-THAN-LOAD) ................................................................................................. 35
3.6 SSS POTENTIAL .......................................................................................................... 35
3.6.1 SSS POTENTIAL ACCORDING TO THE BSCS ............................................................................... 35
3.6.2 SSS POTENTIAL ACCORDING TO COMMODITY ............................................................................ 39
3.7 OVERVIEW AND CONCLUSIONS ....................................................................................... 40
4. QUALITY AND CAPACITY IN ROPAX TERMINALS ........................................................... 43
4.1 INTRODUCTION AND CHAPTER OVERVIEW ......................................................................... 43
4.2 PROCESSES IN A ROPAX TERMINAL ................................................................................. 44
4.3 QUALITY, CAPACITY, CONGESTION AND PERFORMANCE INDICATORS, OVERVIEW OF THE EXISTING
LITERATURE .......................................................................................................................... 46
4.3.1 INDICATORS TO ASSESS CONGESTION ....................................................................................... 46
4.3.2 THE ARRIVAL PATTERN .......................................................................................................... 47
4.4 METHODOLOGY OVERVIEW ........................................................................................... 48
4.5 OPTIMAL SERVICE TIME ESTIMATION ............................................................................... 49
4.5.1 VESSEL OPERATION TIME ....................................................................................................... 49
4.5.2 STEVEDORING TIME .............................................................................................................. 50
4.5.3 FULL TRUCKS AND PASSENGER VEHICLES TIMES ......................................................................... 51
4.5.4 SEMI-TRAILER (PLATFORM) TIMES ........................................................................................... 52
4.5.5 CAR-CARGO TIMES ............................................................................................................... 55
4.6 WAITING PROBABILITY ................................................................................................. 55
4.6.1 WAITING TIME WITH SCHEDULED ARRIVALS .............................................................................. 57
4.6.2 WAITING TIME WITH RANDOM ARRIVALS ................................................................................. 60
4.7 CASE STUDY .............................................................................................................. 62
4.8 ASSESSING THE RELIABILITY OF THE TERMINAL’S SERVICE ...................................................... 64
4.9 SUMMARY AND MAIN CONCLUSIONS ............................................................................... 66
5. RESILIENCY AT ROPAX TERMINALS .............................................................................. 67
5.1 INTRODUCTION AND CHAPTER OVERVIEW ......................................................................... 67
5.2 RISKS, DISRUPTIONS, VULNERABILITIES AND RESILIENCE, OVERVIEW OF THE EXISTING LITERATURE ... 68
5.3 RISKS, CAUSES AND DERIVED IMPACTS, A TAXONOMY .......................................................... 71
5.3.1 DISRUPTIONS IN A ROPAX TERMINAL ...................................................................................... 71
5.3.2 RELATIONSHIP BETWEEN DISRUPTIONS AND THEIR CAUSES AND CONSEQUENCES............................. 73
Contents
P. Morales-Fusco (2016) v
5.4 DISRUPTIONS (IMPACTS) ASSESSMENT ............................................................................. 79
5.5 IMPROVING THE RESILIENCE .......................................................................................... 82
5.5.1 CONTINGENCY VS PREVENTIVE MEASURES ................................................................................ 82
5.5.2 EFECTIVENESS OF IMPLEMENTED MEASURES ............................................................................. 83
5.6 CHAPTER OVERVIEW AND CONCLUSIONS ........................................................................... 84
6. COST STRUCTURE OF FREIGHT DISTRIBUTION STRATEGIES INTEGRATING A ROPAX-MOS LINK .................................................................................................................................. 87
6.1 INTRODUCTION AND OBJECTIVES .................................................................................... 87
6.2 BUSINESS MODELS ...................................................................................................... 89
6.3 COST MODEL ............................................................................................................. 90
6.3.1 MAIN ASSUMPTIONS ............................................................................................................ 90
6.3.2 COST COMPONENTS ............................................................................................................. 91
6.3.3 FIXED COST ......................................................................................................................... 92
6.3.4 LABOR COST ....................................................................................................................... 93
6.3.5 VARIABLE COST ................................................................................................................... 93
6.3.6 SHIPPING COST ................................................................................................................... 94
6.4 TRANSPORTATION TIME MODEL ..................................................................................... 97
6.5 APPLIED CASE AND SENSITIVE ANALYSIS ............................................................................ 98
6.5.1 CASE DESCRIPTION ............................................................................................................... 98
6.5.2 SENSITIVE ANALYSIS............................................................................................................ 100
6.6 CHAPTER SUMMARY AND CONCLUSIONS ......................................................................... 106
7. MODE CHOICE MODEL AND SHIPPING LINE STRATEGIES............................................. 109
7.1 INTRODUCTION AND CHAPTER OVERVIEW ....................................................................... 109
7.2 DISCRETE CHOICE MODELS AND SHIPPING LINES PRICING, AN INTRODUCTION ........................... 110
7.2.1 PRICING IN SHIPPING LINES .................................................................................................. 110
7.3 METHODOLOGY LAY OUT ............................................................................................ 116
7.3.1 SCENARIOS CONSIDERED ..................................................................................................... 116
7.3.2 UTILITY CONCEPT AND LOGIT MODEL .................................................................................... 117
7.3.3 DEMAND CONSIDERATIONS ................................................................................................. 119
7.3.4 FREIGHT PRICE CONSIDERATIONS .......................................................................................... 120
7.4 DEMAND DATABASE .................................................................................................. 122
7.4.1 DATA SOURCES .................................................................................................................. 122
7.4.2 UTILITY MAXIMIZATION PROBLEM ......................................................................................... 124
7.5 MODEL SET-UP. FUNCTIONS DEFINITION ........................................................................ 127
7.5.1 STARTING POINT ................................................................................................................ 127
7.5.2 CALIBRATION OF THE UTILITY FUNCTION. SCENARIOS CONSIDERED ............................................. 128
7.5.3 DEMAND DISTRIBUTION. FUNCTION FIT ................................................................................. 131
RoRo terminals and truck freight. Improving competitiveness in a MoS context
vi P. Morales-Fusco (2016)
7.6 RESULTS AND DISCUSSION ........................................................................................... 133
7.6.1 OBTAINED RESULTS AND DISCUSSION .................................................................................... 133
7.6.2 SENSITIVENESS ASSESSMENT ................................................................................................ 136
7.6.3 DEMAND PROFILE (DISTRIBUTION OF THE DIFFERENT BUSINESS ALTERNATIVES OVER THE HINTERLAND OF
THE PORT...................................................................................................................................... 140
7.6.4 BONUS POLICY MEASURES TO PROMOTE MODAL SHIFT ............................................................. 143
7.7 CHAPTER SUMMARY AND CONCLUSIONS ......................................................................... 146
8. CONCLUSIONS AND FURTHER RESEARCH ................................................................... 149
8.1 OVERVIEW OF THE WORK DONE ................................................................................... 149
8.2 MAIN FINDINGS AND CONCLUSIONS .............................................................................. 151
8.3 FUTURE RESEARCH .................................................................................................... 153
APPENDIX A - ABBREVIATIONS ......................................................................................... 155
APPENDIX B – VULNERABILITY TREES IN ROPAX TERMINALS ............................................. 157
REFERENCES .................................................................................................................... 165
Contents
P. Morales-Fusco (2016) vii
List of figures
FIGURE 1-1 FREIGHT TRANSPORT (MODAL SHIFT) EU-28 PERFORMANCE BY MODE.(EUROPEAN COMMISSION,
2014) ..................................................................................................................................... 2
FIGURE 1-2 STRUCTURE OF THE LOGICAL RELATIONSHIP BETWEEN THE DIFFERENT STOCKHOLDERS INVOLVED AND
CHAPTER WHERE EACH RELATIONSHIP IS ASSESSED. .......................................................................... 9
FIGURE 2-1 EU SSS TRAFFIC ACCORDING TO THE TYPE OF CARGO/SHIP. SOURCE: EUROSTAT (EUROSTAT, 2015)
............................................................................................................................................. 13
FIGURE 2-2 MOTORWAYS OF THE SEA CORRIDORS REGIONS AS DEFINED BY THE EUROPEAN COMMISSION. .... 16
FIGURE 2-3 FUNDING OF MOS PROJECTS FROM THE TEN-T PROGRAMME. DATASOURCE: (INEA, 2016) ..... 18
FIGURE 2-4 STUDIES AND MIXED PROJECTS FUNDED BY THE TEN-T PROGRAMME ACCORDING TO THEIR MAIN
FOCUS (OWN PRODUCTION WITH DATA FROM INEA, 2016) ........................................................... 19
FIGURE 2-5 SSS AND MOS REFERENCES FOUND IN THE LITERATURE (THOMSON REUTERS AND SCOPUS
DATABASES) AND LINK WITH RORO OR ROPAX MENTIONS. ............................................................. 20
FIGURE 3-1 STRUCTURE OF THE STRATEGIC ASSESSMENT FOR INTRODUCING SSS TO THE SUPPLY CHAIN ........ 28
FIGURE 3-2 CHARACTERISTICS OF THE TRANSPORTATION CHAIN AFFECTING SSS’S COMPETITIVENESS ............ 30
FIGURE 3-3 MAJOR TYPES OF TRANSPORTATION CHAINS ACCORDING TO VARIABILITY OF SHIPMENTS, CARGO
VALUE, AND DEGREE OF VOLUME CONCENTRATION ........................................................................ 33
FIGURE 3-4 CLASSIFICATION OF COMPANIES OF THE SURVEY AND THEIR POTENTIAL TO USE SSS ACCORDING TO
COMMODITY ........................................................................................................................... 40
FIGURE 4-1 PURE RORO DIVISION IN 3 SUBSYSTEMS. ............................................................................ 44
FIGURE 4-2 MAIN PROCESSES OCCURRING IN A ROPAX TERMINAL ........................................................... 45
FIGURE 4-3 MAIN STEPS TO TAKE TO CALCULATE THE SERVICE TIME AND ASSESS THE LOS OF THE TERMINAL ... 48
FIGURE 4-4 KINDS OF CARGO TO BE TRANSPORTED (AND STEVEDORED) IN A ROPAX VESSEL ......................... 51
FIGURE 4-5 YARD CONFIGURATIONS IN A ROPAX TERMINAL ................................................................... 53
FIGURE 4-6 PHYSICAL PARAMETERS CONSIDERED FOR SIMULATING A ROPAX TERMINAL .............................. 54
FIGURE 4-7 YARD TIME IN A B CONFIGURATION WITH 8 EARS OF PARKING SLOTS AND 50% OF CARGO LOADED
AND 50% UNLOADED ............................................................................................................... 54
FIGURE 4-8 TWO SUCCESSIVE SHIPS IN A TERMINAL AS SCHEDULED (UPPER FIGURE) AND WHEN THE SERVICE
TIME OF THE FIRST SHIP EXCEEDS ITS SCHEDULED SERVICE TIME BY MORE THAN BI, AND HENCE THE SHIP
WAITS. ................................................................................................................................... 57
FIGURE 4-9 NUMBER OF SHIPS SERVED DURING A T PERIOD WITH SCHEDULED EQUI-SPACED ARRIVALS .......... 59
FIGURE 4-10 RELATIONSHIP BETWEEN WAITING PROBABILITY, NUMBER OF ARRIVALS AND THE VARIABILITY IN
ARRIVAL TIMES AND SERVICE TIME .............................................................................................. 59
FIGURE 4-11 WAITING PROBABILITY GIVEN AN AVERAGE SPACING BI AND WITH AN RANDOM ARRIVAL PROCESS
............................................................................................................................................. 60
FIGURE 4-12 NUMBER OF SHIPS SERVED DURING A T PERIOD WITH UNSCHEDULED RANDOM ARRIVALS .......... 61
FIGURE 4-13 RELATIONSHIP BETWEEN WAITING PROBABILITY, NUMBER OF ARRIVALS AND THE VARIABILITY IN
ARRIVAL TIMES AND SERVICE TIME, WITH INTERARRIVAL TIMES FOLLOWING A NEGATIVE EXPONENTIAL PDF
............................................................................................................................................. 61
RoRo terminals and truck freight. Improving competitiveness in a MoS context
viii P. Morales-Fusco (2016)
FIGURE 4-14 RELATIONSHIP BETWEEN WAITING PROBABILITY, NUMBER OF ARRIVALS AND THE VARIABILITY IN
ARRIVAL TIMES AND SERVICE TIME FOR THE CASE STUDY ................................................................. 63
FIGURE 4-15 SHIPS SERVED FOR A GIVEN AVERAGE SPACING AND SHIPS THAT MIGHT BE SERVED WITHOUT
CHANGING THEIR SCHEDULED ARRIVALS FOR THE CASE STUDY .......................................................... 64
FIGURE 4-16 RELATIONSHIP BETWEEN NUMBER OF ARRIVALS AND WAITING PROBABILITY AND INDICATORS TO
QUANTIFY THE INFLUENCE OF VARYING THE NUMBER OF ARRIVALS, THE SERVICE TIME OR THE VARIABILITY
IN THE SPACING BETWEEN SHIPS ................................................................................................. 65
FIGURE 4-17 POSSIBLE GRADATION SYSTEMS TO USE WHEN ASSESSING THE LEVEL OF SERVICE FROM A ROPAX
TERMINAL ............................................................................................................................... 65
FIGURE 5-1 CHAPTER OVERVIEW ........................................................................................................ 68
FIGURE 5-2 DIFFERENT SCOPE BETWEEN RISK AND VULNERABILITY AND DIAGRAM OF A DISRUPTIONS-TREE WITH
THE CAUSES LEADING TO IT AND THE CONSEQUENCES EMERGING FROM IT IF IT HAPPENS (EINARSSON AND
RAUSAND, 1998) .................................................................................................................... 69
FIGURE 5-3 VULNERABILITY ASSESSMENT AS A COMBINATION OF SEVERITY AND PROBABILITY (SHEFFI AND RICE,
2005) ................................................................................................................................... 70
FIGURE 5-4 RELATIONSHIP TREE (EXHAUSTIVE) SHOWING ALL THE FEASIBLE CAUSES AND CONSEQUENCES
DERIVED FROM THE VEHICLE CONGESTION AT THE GATES OF A TERMINAL ........................................... 74
FIGURE 5-5 EXAMPLE OF THE PROCESS TO BUILD THE RELATIONSHIP TREES, FROM INDEPENDENT SETS TO
INTERRELATED, HARMONIZED AND SIMPLIFIED ONES ...................................................................... 75
FIGURE 5-6 SIMPLIFIED TREE WITH THE CAUSES AND CONSEQUENCES ASSOCIATED TO VEHICLE CONGESTION AT
THE GATES OF A TERMINAL ........................................................................................................ 76
FIGURE 5-7 SKETCH OF THE FEASIBLE LINKS BETWEEN CAUSES/DISRUPTIONS/CONSEQUENCES AND THE
PROBABILITIES TO BE ASSIGNED TO ESTIMATE P(Q2). ...................................................................... 80
FIGURE 5-8 IMPACTS ON THE PROCESSES OF TERMINAL FRAMEWORK FOR A ROPAX TERMINAL (SEE TABLE 5-4
FOR A COMPLETE LIST OF THE CONSEQUENCES AND THEIR CORRESPONDING CODING). ......................... 81
FIGURE 5-9 WHOLE RELATIONSHIP TREE FOR THE FINAL CONSEQUENCE Q10 (DELAY IN THE SHIP’S ETD) (SEE
ANNEXES 1 AND 2 FOR A COMPLETE LISTING OF THE CODES FOR EACH CAUSE/CONSEQUENCE IDENTIFIED)
............................................................................................................................................. 82
FIGURE 5-10 ESTIMATED EFFECTS ON THE CONSEQUENCES FRAMEWORK FROM THE INTRODUCTION OF NEW
TRACEABILITY SOFTWARE IN A ROPAX TERMINAL AND AN IMPROVEMENT OF ITS LAND GATES
PERFORMANCE ........................................................................................................................ 84
FIGURE 6-1 DIFFERENT TRANSPORTATION STRATEGIES CONSIDERED COMBINING ROAD AND MOS ................ 90
FIGURE 6-2 RELATIONSHIP BETWEEN CAPACITY (IN LINEAR METERS) AND GT FOR RORO AND ROPAX SHIPS ... 96
FIGURE 6-3 RELATIONSHIP BETWEEN CAPACITY (IN LINEAR METERS) AND DWT FOR RORO AND ROPAX SHIPS 96
FIGURE 6-4 DISTANCE REFERENCES USED IN THE DESCRIBED SENSIBILITY ANALYSIS .................................... 100
FIGURE 6-5 VARIATIONS IN COST PER UNIT SHIPPED DEPENDING ON THE DISTANCE BETWEEN PORTS, LAB ..... 100
FIGURE 6-6 COMPETITIVENESS OF THE SSS STRATEGIES WHEN COMPARED WITH ROAD (ONE DRIVER AT A TIME)
TAKING INTO ACCOUNT VARIATIONS BETWEEN ROAD AND SEA DISTANCE AND CONSIDERING THAT THE
FREQUENCY IS OPTIMAL FOR EACH SSS CONNECTION ................................................................... 101
FIGURE 6-7 SENSIBILITY OF COST OVER VARIATION ON LOCAL DISTANCE, Δ, WITHOUT VARIATION ON TOTAL LAND
DISTANCE LIJ, FOR THE BARCELONA-CIVITAVECCHIA CASE .............................................................. 102
FIGURE 6-8 SENSIBILITY OF COST OVER VARIATION ON LOCAL DISTANCE, Δ, WITH EQUIVALENT VARIATION ON THE
LAND DISTANCE, LIJ FOR THE BARCELONA-CIVITAVECCHIA CASE ...................................................... 102
Contents
P. Morales-Fusco (2016) ix
FIGURE 6-9 AVERAGE TOTAL TRANSPORTATION TIME PER SHIPMENT IN TERMS OF DISTANCE BETWEEN PORTS,
LAB, AND FREQUENCY GIVEN A FREQUENCY OF THREE SHIP CALLS PER WEEK AND PORT ....................... 103
FIGURE 6-10 COST SHARES PER SHIPMENT IN THE SCENARIO BEING CONSIDERED ...................................... 104
FIGURE 6-11 COST SHARES (IN %) PER SHIPMENT IN THE SCENARIO BEING CONSIDERED ............................ 105
FIGURE 6-12 POOL OF SEMITRAILERS AND TRIPS PER YEAR NEEDED TO PROVIDE THE COST LEVELS CALCULATED IN
THE CASE STUDIO ................................................................................................................... 105
FIGURE 7-1 TOTAL VOLUME (TONNES) OF ROAD AND MOS TRAFFIC BETWEEN SPAIN AND ITALY (BOTH
DIRECTIONS) BY PROVINCE FOR 2012 AND SHARE OF ROAD TRANSPORTATION OVER THE TOTAL (DATA
EXTRACTED FROM SOLSONA (2015)) ........................................................................................ 123
FIGURE 7-2 ROUTES WITH RORO VESSELS AND A FREQUENCY OVER 3 SAILINGS PER WEEK BETWEEN SPAIN AND
ITALY IN 2012 (MODIFIED FROM GOOGLE EARTH) ....................................................................... 123
FIGURE 7-3 TRAFFIC USING A MOS LINK ACCORDING TO SPANISH PROVINCE OF ORIGIN/DESTINATION (IN RED)
AND SHARE ACCORDING TO THE SPANISH PORT USED FOR THE CONNECTION .................................... 126
FIGURE 7-4 TRAFFIC USING A MOS LINK ACCORDING TO ITALIAN PROVINCE OF ORIGIN/DESTINATION (IN RED)
AND SHARE ACCORDING TO THE ITALIAN PORT BEING USED FOR THE CONNECTION ............................ 126
FIGURE 7-5 RELATIVE IMPORTANCE OF THE MOS BARCELONA-CIVITAVECCHIA CONNECTION OVER THE TOTAL
MOS TRAFFIC PER SPANISH PROVINCE OF ORIGIN/DESTINATION (IN GREEN SHADES) AND SPLIT BETWEEN
ACCOMPANIED AND UNACCOMPANIED TRAFFIC. .......................................................................... 127
FIGURE 7-6 RELATIVE SHARE OF THE MOS CONNECTION BETWEEN BARCELONA-CIVITAVECCHIA OVER THE TOTAL
MOS TRAFFIC PER ITALIAN PROVINCE OF ORIGIN/DESTINATION (IN GREEN SHADES) AND SPLIT BETWEEN
ACCOMPANIED AND UNACCOMPANIED TRAFFIC. .......................................................................... 128
FIGURE 7-7 HISTOGRAMS WITH THE DEMAND DISTRIBUTION FOR THE CIVITAVECCHIA-BARCELONA LINE
REGARDING LOCAL (AVERAGE) AND ROAD DISTANCES OF THE NODES .............................................. 131
FIGURE 7-8 FIT OF ROAD DISTANCE (LIJ) AND AVERAGE LOCAL DISTANCE (Δ) TO A NORMAL DISTRIBUTION .... 132
FIGURE 7-9 PROFIT ACHIEVABLE BY THE SHIPPING COMPANY GIVEN ANY TARIFF COMBINATION. SEVERAL SHIP
SIZES DEPICTED, CONSIDERING THAT JUST 75% OF THE TOTAL CAPACITY IS BEING USED. ..................... 134
FIGURE 7-10 SENSIBILITY IN THE DEMAND FOR THE MARITIME LINK WHEN THE COST OF FUEL IS INCREASES
(HOMOGENEOUS INCREASES AMONG ALL FUELS CONSIDERED) ....................................................... 139
FIGURE 7-11 DEMAND DISTRIBUTION (ABSOLUTE NUMBERS) DEPENDING ON ROAD, DISTANCE TO THE PORT AND
BUSINESS ALTERNATIVE BEING USED. ......................................................................................... 141
FIGURE 7-12 DEMAND DISTRIBUTION (ABSOLUTE NUMBERS) DEPENDING ON ROAD, DISTANCE TO THE PORT AND
BUSINESS ALTERNATIVE BEING USED (RED CROSS CORRESPONDS TO MAXIMUM DEMAND). ................. 142
FIGURE 7-13 NUMBER OF ITUS TRANSPORTED BY SEA (ABSOLUTE NUMBER) AND % OF THEM BEING
ACCOMPANIED (FULL TRUCKS) WHEN VARYING THE AVERAGE DISTANCE TO THE PORT AND AVERAGE
DISTANCE BETWEEN ORIGIN AND DESTINATION. .......................................................................... 142
FIGURE 7-14 FLOW DIAGRAM OF PROFIT / UTILITY / DEMAND / TARIFF RELATIONSHIP AND INFLUENCE OF THE
DIFFERENT BONUS POLICIES DISCUSSED ...................................................................................... 143
FIGURE 7-15 DEMAND VARIATIONS FROM DIRECTLY FUNDING THE MARITIME COMPANY VS FUNDING THE
FREIGHT TRANSPORTER AND PROFIT EVOLUTION FOR THE SHIPPING COMPANY. ................................ 144
FIGURE 7-16 DEMAND VARIATIONS FROM DIRECTLY FUNDING THE MARITIME COMPANY VS FUNDING THE
FREIGHT TRANSPORTER AND TARIFFS CHARGED BY THE SHIPPING COMPANY. .................................... 145
RoRo terminals and truck freight. Improving competitiveness in a MoS context
x P. Morales-Fusco (2016)
Contents
P. Morales-Fusco (2016) xi
List of tables
TABLE 1-1 ISSUES ANALYZED IN THE THESIS ............................................................................................ 4
TABLE 3-1 DESCRIPTIVE CHARACTERISTICS OF A PRODUCTION SYSTEM AND ITS ASSOCIATED TRANSPORTATION
CHAIN .................................................................................................................................... 30
TABLE 3-2 SUPPLY CHAIN STANDARDIZATION IN BIG GROUPS REGARDING THE WEIGHT OF CARGOES
CONCENTRATION, PRODUCT VALUE AND DEMAND VARIABILITY ........................................................ 36
TABLE 3-3 SSS POTENTIAL FOR EACH SUPPLY CHAIN STRATEGY ................................................................ 37
TABLE 4-1 VESSEL OPERATION TIMES FOR SOME SELECTED SPANISH TERMINALS ........................................ 50
TABLE 4-2 CASE STUDY PARTIAL TIMES VALUES ..................................................................................... 63
TABLE 5-1 OVERVIEW OF THE SURVEY MADE TO THE STAFF OF THE ROPAX TERMINAL ................................. 72
TABLE 5-2 MAIN IMPACTS (OR DISRUPTIVE EVENTS) IDENTIFIED .............................................................. 73
TABLE 5-3 CAUSES LEADING TO THE APPEARANCE OF DISRUPTIONS IN A ROPAX TERMINAL (SHORTLISTED) ..... 77
TABLE 5-4 FEASIBLE FINAL CONSEQUENCES IN THE EVENT OF ANY DISRUPTIONS IN THE PROCESSES OF A ROPAX
TERMINAL AND THEIR CODING .................................................................................................... 78
TABLE 5-5 SUMMARY OF SIMPLIFIED AND HARMONIZED RELATIONSHIP-TREES BETWEEN IMPACTS (DISRUPTIONS
OR RISKS), CAUSES AND THEIR FINAL CONSEQUENCES ..................................................................... 78
TABLE 5-6 LINES OF ACTION CONCERNING PREVENTIVE MEASURES .......................................................... 83
TABLE 5-7 LINES OF ACTION CONCERNING CORRECTIVE MEASURES .......................................................... 83
TABLE 6-1 COEFICIENTS FIT OF GT AND DWT FUNCTIONS REGARDING L FOR RORO SHIPS ........................... 95
TABLE 6-2 COEFICIENTS FIT OF GT AND DWT FUNCTIONS REGARDING L (LINEAR METERS) AND P (PASSENGER
CAPACITY) FOR ROPAX SHIPS ..................................................................................................... 97
TABLE 6-3 FIXED, KILOMETRIC, LABOR AND ALLOWANCE COSTS ............................................................... 99
TABLE 6-4 PARAMETERS DEFINING THE REPRESENTATIVE SHIPPING LINE ................................................... 99
TABLE 7-1 SOURCE FOR THE VARIABLE VALUES FOR EACH O-D PAIRING AND SEA CONNECTION ................... 124
TABLE 7-2 MULTIMODAL LOGIT ESTIMATED VALUES FOR THE ROAD VS CIVITAVECCHIA-BARCELONA MOS CASE,
INCLUDING LOCAL DISTANCE .................................................................................................... 129
TABLE 7-3 MULTIMODAL LOGIT ESTIMATED VALUES FOR THE ROAD VS CIVITAVECCHIA-BARCELONA MOS CASE,
EXCLUDING LOCAL DISTANCE .................................................................................................... 130
TABLE 7-4 MULTIMODAL LOGIT ESTIMATED VALUES FOR THE ROAD VS MOS FOR THE ITALY-SPAIN CASE (ALL SEA
CONNECTIONS CONSIDERED) .................................................................................................... 130
TABLE 7-5 GOODNESS-OF-FIT TESTS OF THE DEMAND DISTRIBUTION OVER THE LOCAL AND THE ROAD DISTANCES
........................................................................................................................................... 132
TABLE 7-6 OPTIMAL VALUES FOR DIFFERENT SHIP CAPACITIES ............................................................... 135
TABLE 7-7 OPTIMAL VALUES FOR 6 SHIPS PER WEEK AND FIXING THE PRICING RATIO BETWEEN ACCOMPANIED
AND UNACCOMPANIED CARGOES .............................................................................................. 135
TABLE 7-8 ELASTICITIES OF DEMAND/PROFIT AND SHIP CHARACTERISTICS FOR THE UNCONSTRAINED CASE TO
VARIATIONS ON THE UTILITY FUNCTION PARAMETERS ................................................................... 137
TABLE 7-9 ELASTICITIES OF DEMAND/PROFIT AND SHIP CHARACTERISTICS FOR THE FIXED TARIFFS RATIO CASE, TO
VARIATIONS ON THE UTILITY FUNCTION PARAMETERS ................................................................... 137
RoRo terminals and truck freight. Improving competitiveness in a MoS context
xii P. Morales-Fusco (2016)
TABLE 7-10 ELASTICITIES OF DEMAND/PROFIT AND SHIP CHARACTERISTICS WITH FIXED TARIFFS TO VARIATIONS
ON THE UTILITY FUNCTION PARAMETERS .................................................................................... 138
TABLE 7-11 ELASTICITIES OF DEMAND/PROFIT AND SHIP CHARACTERISTICS FOR THE UNCONSTRAINED CASE.TO
DIFFERENT PARAMETERS USED IN THE MODEL FOR THE BARCELONA-CIVITAVECCHIA CASE .................. 138
TABLE 7-12 ELASTICITIES OF DEMAND/PROFIT AND SHIP CHARACTERISTICS FOR THE FIXED TARIFFS RATIO
CASE.TO DIFFERENT PARAMETERS USED IN THE MODEL FOR THE BARCELONA-CIVITAVECCHIA CASE ...... 138
TABLE 7-13 ELASTICITIES OF DEMAND/PROFIT AND SHIP CHARACTERISTICS FOR THE UNCONSTRAINED CASE.TO
DIFFERENT PARAMETERS USED IN THE MODEL FOR THE BARCELONA-CIVITAVECCHIA CASE .................. 138
1 – Introduction and objectives
PhD. Thesis 1
1. Introduction, objectives and document lay out
Chapter 1
Introduction, objectives and document lay out
1.1 Background and objectives
In the current globalized context of production and consumption, sea transportation plays a major
role. In terms of weight, maritime transport accounts for 80 per cent of the volume of global trade.
Nevertheless, despite the need of multimodal transport systems to assure the physical continuity
of freight movements, shipping is the backbone of worldwide trade (UNCTAD, 2013).
Taking into account the European geography, its history and the globalization process, the
European Union is still dependent on the maritime transport, which is essential for the European
economy to compete globally. Nearly 75% of its external trade (Union’s imports and exports) and
37% of the internal trade (but down from 43% in 1990) goes by sea; on the whole, nearly 1.65
billion tons of freight are exported and imported by sea each year in the EU-27 (European
Commission, 2013).
The shipping and related services are an important contributor to the European economy and to
the quality of life of EU citizens, providing jobs and being essential for EU competitiveness. It is
estimated that the shipping industry directly contributed 56 billion € to GDP, employed 590.000
people and generated tax revenues of 6 billion € in 2012. In addition, the shipping industry
indirectly supported an estimated 59 billion € contribution to GDP and 1.1 million jobs through
its EU supply chain (Oxford Economics, 2014).
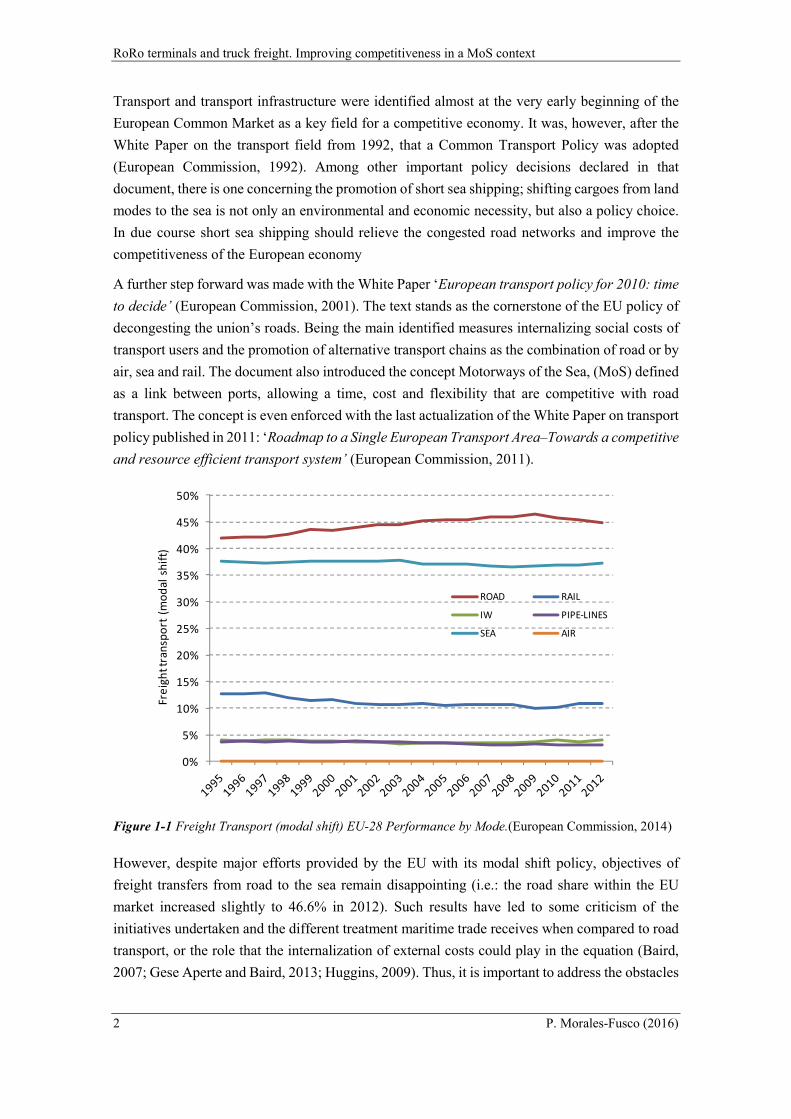
Although there has been a significant increase in the volume of freight transported within the EU,
most of the additional freight traffic travels by road, despite policy initiatives and funding
programmes to encourage modal shift away from road. Road traffic has a modal share of nearly
45% and congestion is a major concern on the roads (Figure 1-1). There is an imbalance between
modes, which is increasing annually as demand for both freight and passenger transport services
increase.
RoRo terminals and truck freight. Improving competitiveness in a MoS context
2 P. Morales-Fusco (2016)
Transport and transport infrastructure were identified almost at the very early beginning of the
European Common Market as a key field for a competitive economy. It was, however, after the
White Paper on the transport field from 1992, that a Common Transport Policy was adopted
(European Commission, 1992). Among other important policy decisions declared in that
document, there is one concerning the promotion of short sea shipping; shifting cargoes from land
modes to the sea is not only an environmental and economic necessity, but also a policy choice.
In due course short sea shipping should relieve the congested road networks and improve the
competitiveness of the European economy
A further step forward was made with the White Paper ‘European transport policy for 2010: time
to decide’ (European Commission, 2001). The text stands as the cornerstone of the EU policy of
decongesting the union’s roads. Being the main identified measures internalizing social costs of
transport users and the promotion of alternative transport chains as the combination of road or by
air, sea and rail. The document also introduced the concept Motorways of the Sea, (MoS) defined
as a link between ports, allowing a time, cost and flexibility that are competitive with road
transport. The concept is even enforced with the last actualization of the White Paper on transport
policy published in 2011: ‘Roadmap to a Single European Transport Area–Towards a competitive
and resource efficient transport system’ (European Commission, 2011).
Figure 1-1 Freight Transport (modal shift) EU-28 Performance by Mode.(European Commission, 2014)
However, despite major efforts provided by the EU with its modal shift policy, objectives of
freight transfers from road to the sea remain disappointing (i.e.: the road share within the EU
market increased slightly to 46.6% in 2012). Such results have led to some criticism of the
initiatives undertaken and the different treatment maritime trade receives when compared to road
transport, or the role that the internalization of external costs could play in the equation (Baird,
2007; Gese Aperte and Baird, 2013; Huggins, 2009). Thus, it is important to address the obstacles
0%
5%
10%
15%
20%
25%
30%
35%
40%
45%
50%
Fre
igh
t tra
nsp
ort
(m
od
al s
hif
t)
ROAD RAIL
IW PIPE-LINES
SEA AIR
1 – Introduction and objectives
PhD. Thesis 3
hampering the development and competitiveness of SSS lines from both a cost and environmental
together with their perception from the end users, the transporters.
Despite its limited success, the EU has launched multiple initiatives aiming to facilitate the modal
shift to SSS chains. The mid-term review on the EU Strategy in Transportation Police (European
Commission, 2006) classified the policies implemented by the EU to support SSS as focused on:
i) eliminating administrative barriers or duplicate border controls (e.g. Directive 2010/65 /EU,
Blue Belt initiative); ii) creation of an integrated monitoring technologies to ensure convergence
between sea and land platform; iii) development of electronic interfaces e-Freight, e-Maritime, e-
Customs, etc. iv) improved monitoring (tracking) of freight cargoes; v) strengthen the subsidy
program with projects like the TEN-T / MoS, Marco Polo (at present, 'Connecting Europe
Facility' - CEF), the Regional Policy or other financial instruments; vi) improve the connectivity
of the islands and long-distance intra-Community traffic of passengers; vii) and secure better port
services in terms of fair competition, financial transparency, non-discrimination and cost-
efficiency.
The conclusions of a recent study by the DG Move (2015) observed how the initiative and
measures adopted until now had a diluted impact on the drivers behind modal shift. For instance,
the e-initiatives would translate in a reduction of a 2% of the costs of multimodal chains with a
maritime leg, and just a 0.4% reduction for the maritime part. Therefore, the end user could only
visualize a 0.4% reduction, in the most advantageous case, whenever the reduction in cost was
fully transferred to the freight tariff. Such reduction is not likely to switch the transport behavior.
Considering the overall picture, this thesis aims at providing tools to policy makers, terminal
operators and shipping lines to assess – and eventually improve – the competitiveness of SSS
lines. More specifically, the work is confined to Motorways of the Sea operated by Roll on / roll
off (RoRo) vessels since it has been observed that RoRo shipping is the most likely candidate to
draw trucks from the road in the short term, since both services are comparable in terms of cost,
time and quality (DG Move, 2015). The results of the research herewith presented corroborate
that assumption and provide further understanding of the competitiveness and level of service of
RoRo/MoS lines, the specificities of this kind of multimodal chains, the potential factors behind
their success, their vulnerabilities and strengths.
More specifically, the particular objectives of the thesis are:
To identify the most sensible procedures in RoRo terminals operation to be addressed to
improve their performance and perception from the end user.
To identify the strategic potential of SSS in all its forms, considering the characteristics
of the demand (goods to be moved) and the role of RoRo and MoS shipping in the global
picture.
To understand the costs of the supply chain, and the cost structure of RoRo shipping lines,
and their sensitiveness in front of market changes, pricing and public funding policies.
RoRo terminals and truck freight. Improving competitiveness in a MoS context
4 P. Morales-Fusco (2016)
1.2 Research scope of the thesis
The existing literature on freight modal choice determinants (outlined in section 2.3 and further
elaborated in section 3.2) considers transit time, cost and perceived quality as the three main
determinants from the offer point of view that influence the choice of transportation made by the
responsible of the shipment. The weight of each variable –driver– on the final choice of
transportation will vary depending on multiple factors related to the cargo, the shipper, the
location, and a long etcetera.
This research does not pay special attention on the numerical weight given to the determinant
variables when the transportation choice is made (calibration of the modal choice model),
although a demand model is calibrated at the end of the research when necessary (chapter 7).
Instead, the corpus of the thesis (chapters 4 to 6) focuses on how to improve the performance of
some of the variables –drivers- considered. Finally, as a means to understand the market
approached by RoRo services, chapter 3 delves with the requirements of the potential demand
and the adequacy of RoRo services to fulfil them.
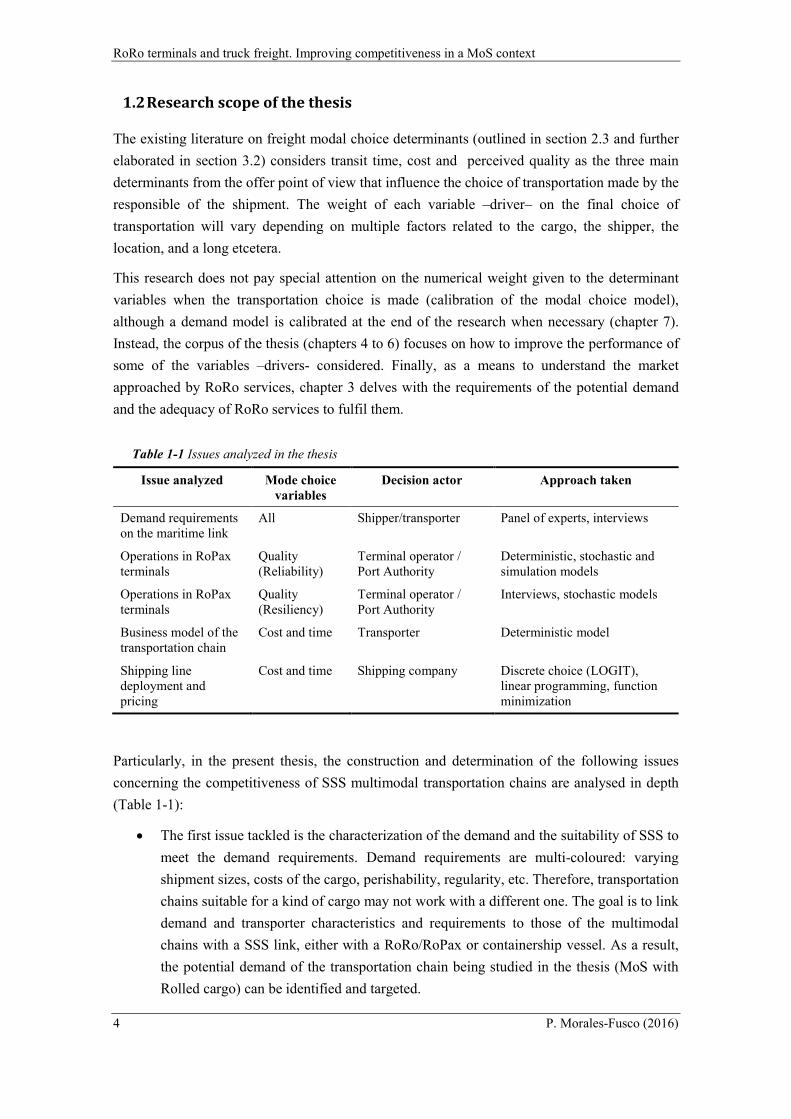
Table 1-1 Issues analyzed in the thesis
Issue analyzed Mode choice variables
Decision actor Approach taken
Demand requirements on the maritime link
All Shipper/transporter Panel of experts, interviews
Operations in RoPax terminals
Quality (Reliability)
Terminal operator / Port Authority
Deterministic, stochastic and simulation models
Operations in RoPax terminals
Quality (Resiliency)
Terminal operator / Port Authority
Interviews, stochastic models
Business model of the transportation chain
Cost and time Transporter Deterministic model
Shipping line deployment and pricing
Cost and time Shipping company Discrete choice (LOGIT), linear programming, function minimization
Particularly, in the present thesis, the construction and determination of the following issues
concerning the competitiveness of SSS multimodal transportation chains are analysed in depth
(Table 1-1):
The first issue tackled is the characterization of the demand and the suitability of SSS to
meet the demand requirements. Demand requirements are multi-coloured: varying
shipment sizes, costs of the cargo, perishability, regularity, etc. Therefore, transportation
chains suitable for a kind of cargo may not work with a different one. The goal is to link
demand and transporter characteristics and requirements to those of the multimodal
chains with a SSS link, either with a RoRo/RoPax or containership vessel. As a result,
the potential demand of the transportation chain being studied in the thesis (MoS with
Rolled cargo) can be identified and targeted.
1 – Introduction and objectives
PhD. Thesis 5
The second and third issues deal with what is, namely, the weakest link in any multimodal
transportation chain (Kapros and Panou, 2007), the operations at the port terminal. Two
chains of successive processes overlap: physical and administrative ones. The focus is
placed on the physical processes, from the arrival of the cargo at the port to the departure
of ship and cargo from the terminal premises. Several processes take place in-between,
being necessary to characterize them before proceeding to assess their overall
performance. The analysis provides an overview of the processes to, afterwards check
and quantify their performance from two distinct points of view:
a. In terms of reliability of the system, accounted as the delays to be expected
(waiting probability) considering the capacity of the terminal and its usage-
intensity. That is, to provide a framework to assess capacity confronted with
quality of service as a trade-off between congestion and number of ship stopovers
that should satisfy both the terminal operator, the shipping line and the end-users
of the terminal.
b. In terms of resiliency of the system, as a secondary qualitative attribute to be
considered. That is, to produce a risk assessment of the terminal to assess the
feasible disruptions that may affect the normal operation of the terminal and
quantify their probability and the severity of the affectations produced. Since
multiple operations happen at the terminal that are dependant ones on the others,
the assessment was built upon a causality tree relating causes, risks and
consequences, prior assessing the overall robustness of the terminal operations.
The less frequent and/or critical effects on the normal performance the better.
Finally, the fourth and fifth issues come closer to the discrete choice analysis for freight
transportation. Discrete choice models are frequently used in transportation demand
studies with different transport alternatives, but far more common when passengers are
transported instead of freight cargo. In such models, a utility value that transforms the
mode choice drivers into comparable units is calculated per each option available –
allowing certain error in the measurements/appreciation-, and a probability of preferring
one option over the others is estimated. A calibrated model allows discussing the effect
of variations on the variables (drivers) on the modal choice and the competitiveness of
new/improved services (MoS/RoRo lines). More specifically, the produced research
focuses in:
a. The cost and time structures of door-to-door transportation chains considering
the different business models available for the road transporter and the possibility
to use a maritime link.
b. The effects of freight pricing in the maritime link to its success and the
construction of a simple discrete choice model to point at the right determination
of the offer (ship size, price and frequency) to increase the chances of the modal
shift towards the multimodal transportation chain.
RoRo terminals and truck freight. Improving competitiveness in a MoS context
6 P. Morales-Fusco (2016)
c. A sensitive assessment of the drivers behind modal choice when a road/RoRo
link is considered.
1.3 Main contributions of the thesis
The contributions of this thesis are particular for each approach taken. Consequently, the thesis is
structured in three separated blocks: strategic assessment on the targeted demand, terminal
performance considerations, and a cost and time structure of the transporters business model taken
together with a framework to study the pricing and feasibility of future MoS lines. Therefore, the
main contributions lay on each of the three blocks separately, although aiming to a common
objective. That is, quantifying how the MoS/RoRo line under study is performing and how much
room it has left for improvement, i.e. what potential it does have.
Considering this, the main contributions of the thesis, according to the different approaches
considered, are:
1) Regarding the strategic assessment:
A list of the defining characteristics of the demand and the potentiality of using SSS
services to serve it regarding their values. The results were corroborated with a set of
interviews with producers and 3PL from different sectors.
A framework for a quick strategic assessment of the most adequate type of SSS given
a commodity regarding its characteristics. Later on, the feasibility of such
transportation chain should be checked at an operational level in terms of cost and
time. The analysis can help shipping companies to identify potential customers and
new shipping lines as well as help policy makers to find out where to orientate their
policies promoting SSS (in any kind) to ensure the maximum impact possible.
2) Regarding terminal performance:
A complete benchmarking of the time requirements to perform the main physical
operations in a RoPax or RoRo terminal regarding the ship’s operative providing a
lower bound on the total time required per ship call at a port. Values and tools to
calculate them are given for several cargo formats and yard distributions. The
benchmark combines stochastic observations, simulation and deterministic calculus.
Complementing the previous bullet point, a methodology to estimate expected delays
vs berth usage for RoRo terminals. The model takes into account the arrival pattern
(random or scheduled) and the service time provided by the terminal and its variation.
The methodology is transferable to any terminal working on a tight schedule with
short stevedoring processes. From there, the methodology allows identifying the
terminal’s unused capacity, what might be its cause, and concluding whether
investments are necessary or not.
1 – Introduction and objectives
PhD. Thesis 7
A detailed diagram on the operational processes of the terminal, to build a framework
to identify the main vulnerabilities that might affect the processes occurring in a
RoPax or RoRo terminal and what could be their final consequences. The work allows
identifying what could be the consequences of any disruption on the normal
performance of the terminal, in terms of severity and frequency and provides a tool
to assess the effect of any countering measures.
3) Regarding the cost and time model to the shipper / transporter / shipping company:
For MoS lines operated with RoRo/RoPax vessels, an assessment of the different
business models available to the truck operator together with their cost and time
structure and a sensitive analysis on the main parameters considered.
An assessment of the available pricing strategies for the shipping company and the
right sizing of its fleet to ensure either the maximum benefit or the maximum shift
from road to MoS lines together with some recommendations to the operators and
policy makers to ensure the competitiveness of a given line.
A practical application of the previous bullet points considering traffic between Spain
and Italy, providing an update on the value of time from what has been observed in
previous studies from other authors together with the intercept value for using MoS
in either the accompanied or the unaccompanied form (mode shift cost). The
assessment is provided calibrating a discrete mode choice model considering time,
cost and quality variables.
Demand elasticity to variation on the parameters for a specific case (Barcelona-
Civitavecchia connection) discriminating accompanied from unaccompanied cargo.
1.4 Publications from this thesis
The results and main contributions of this thesis have been published or accepted for publication
in international journals and international conferences related to port, maritime and transportation
sciences. That is:
Papers published in international SCI and SSCI journals:
Morales, P., S. Saurí and B. Spuch (2010). Quality Indicators and Capacity
Calculation for RoRo Terminals. Transportation Planning and Technology, vol.
33(8), pp. 695-717.
Saurí, S., P. Morales-Fusco, M. Toledano and E. Martín (2012) Empirical Anlaysis
of Resiliency of Terminal Operations for Roll-On-Roll-Off Vessels. Transportation
Research Record, 2273, pp. 96-105.
RoRo terminals and truck freight. Improving competitiveness in a MoS context
8 P. Morales-Fusco (2016)
Morales-Fusco, P., S. Saurí, S. and A. Lago (2012). Potential freight distribution
improvements using motorways of the sea. Journal of Transport Geography 24, pp.1-
11.
Morales-Fusco, P., S. Saurí and G. de Melo (2013). Short Sea Shipping in Supply
Chains. A strategic assessment. Transportation Reviews, 33(4), pp. 476-496.
Papers on press:
Morales-Fusco, P., S. Saurí. Finding the right RoPax vessel size and freight price.
Policy implications for promoting MoS.
Papers on preparation stages:
Morales-Fusco, P. The drivers behind SSS and MoS competitiveness, a literature
review.
1.5 Outline of the thesis
Once the main objectives and contributions of the thesis are introduced, the reminder part of this
thesis is structured according to Figure 2-1.
Previously, chapter 2 discusses the concepts of SSS and Motorways of the Sea and their evolution
over time. Additionally, a quick overview of EU funded initiatives and scientific research on
topics related with Motorways of the Sea is given. However, the existing literature is examined
and discussed in more detail in each chapter -whenever it concerns the topic addressed- together
with a discussion on any further literature related with the methodology used in that specific part
of the research.
Chapters 3 to 7 introduce the bulk of the research done as implicitly stated in Figure 2-1.
Firstly, chapter 3 studies the existing freight distribution strategies based on the requirements of
the industry, the demand and the product transported. It also provides a framework to identify the
potential users of RoRo and containership lines.
Chapter 4, in turn, first describes the operations of RoRo terminals to right afterwards introduce
an analytical model to calculate capacity of a RoPax terminal by estimating the average service
time of the ships served and afterwards establishes the relationship between congestion and grade
of usage (capacity).
Chapter 5 provides a complete taxonomy of the disruptions affecting the operational processes in
a RoPax terminal and discusses the methodology to quantify and grade them in order to assess
the vulnerabilities of the terminal and, ultimately, its resilience. The values given are for an
existing terminal in Barcelona.
1 – Introduction and objectives
PhD. Thesis 9
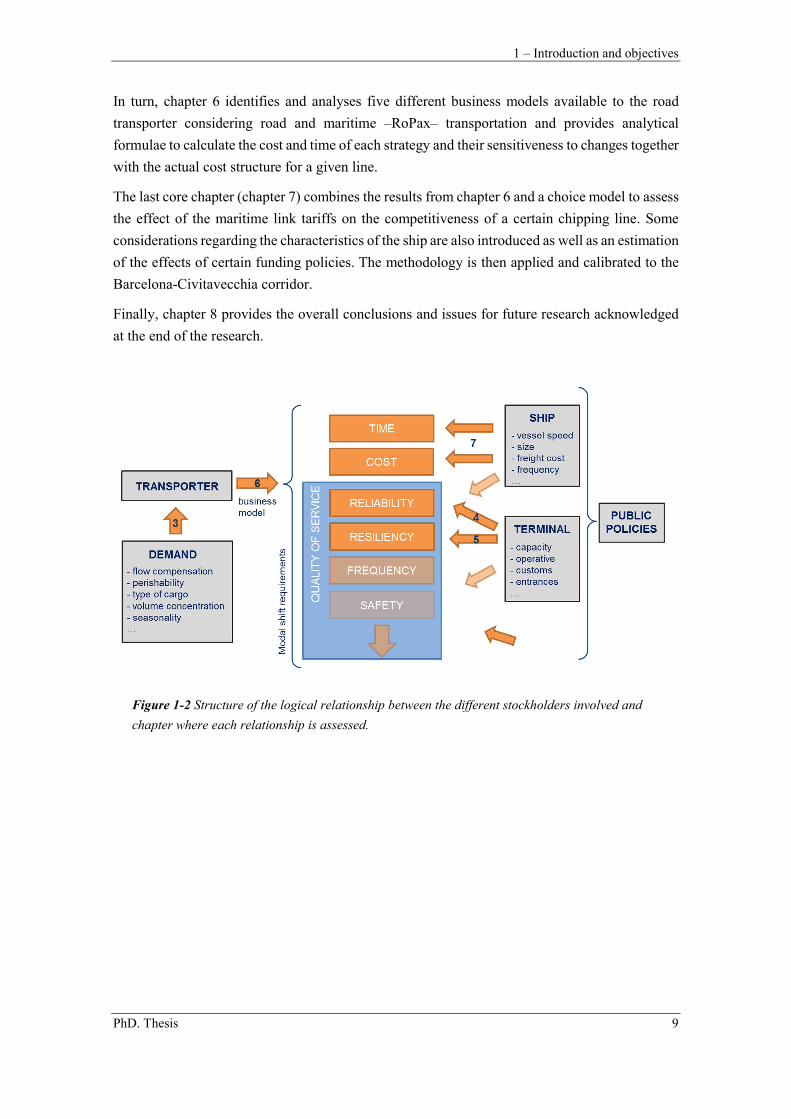
In turn, chapter 6 identifies and analyses five different business models available to the road
transporter considering road and maritime –RoPax– transportation and provides analytical
formulae to calculate the cost and time of each strategy and their sensitiveness to changes together
with the actual cost structure for a given line.
The last core chapter (chapter 7) combines the results from chapter 6 and a choice model to assess
the effect of the maritime link tariffs on the competitiveness of a certain chipping line. Some
considerations regarding the characteristics of the ship are also introduced as well as an estimation
of the effects of certain funding policies. The methodology is then applied and calibrated to the
Barcelona-Civitavecchia corridor.
Finally, chapter 8 provides the overall conclusions and issues for future research acknowledged
at the end of the research.
Figure 1-2 Structure of the logical relationship between the different stockholders involved and
chapter where each relationship is assessed.
RoRo terminals and truck freight. Improving competitiveness in a MoS context
10 P. Morales-Fusco (2016)
2 – Short Sea Shipping and Motorways of the Sea. Concepts definition and review
PhD. Thesis 11
2. Short Sea Shipping and Motorways of the Sea. Concepts definition
Chapter 2
Short Sea Shipping and Motorways of the Sea.
Concepts definition and review
2.1 Short Sea Shipping concept
There are multiple definitions of Short Sea Shipping (SSS) depending on the context where the
concept appears, and the kind of vessel and cargo considered (Paixão Casaca and Marlow, 2002).
In fact SSS can be translated into ‘coasting trade’, ‘regional shipping’ and there is even some
confusion of the term with more specific concepts such as ‘marine highway’ or even ‘motorway
of the sea’ (Puckett et al., 2011).
In fact, maritime trade between neighbouring countries can be traced back to the beginnings of
trade history. However, the concept was revamped in opposition to road transportation around
1980 after the merge of several European transport associations into the actual ECSA (European
Community Shipowners Association) and the forging of the term by the European Comission in
the White Paper on Transport Policy from 1992 (European Commission, 1992).
As a consequence SSS –its concept– is tightly bounded with the European policy in transportation
and, more specially, freight transportation by sea. The official definition of the concept being
given from the start as:
“(…) movement of cargo and passengers by sea between ports situated in
geographical Europe or between those ports and ports situated in non-
European countries having a coastline on the enclosed seas bordering
Europe.”
(Commission of the European Communities, 1999)
RoRo terminals and truck freight. Improving competitiveness in a MoS context
12 P. Morales-Fusco (2016)
Further clarification on the concept was also provided in further documents by the EU:
“Short sea shipping includes domestic and international maritime transport,
including feeder services, along the coast and to and from the islands, rivers
and lakes. The concept of short sea shipping also extends to maritime
transport between the Member States of the Union and Norway and Iceland
and other States on the Baltic Sea, the Black Sea and the Mediterranean”
(European Commission, 2001).
With this definition, Short Sea Shipping includes practically any kind of maritime traffic with
non-transoceanic origin and destination to any European port and vice versa. Just domestic traffic
would be excluded.
Despite this Europe-centred definition, the term SSS has been reused in many other maritime
regions in the world with some coastal trading intensity between neighbouring countries or even
for domestic traffic in larger ones. That is the case, for instance, of Australia (Bendall and Brooks,
2011), the Japanese Sea (Jae Wook Lee and Kang, 2004), the Yellow Sea in China (J W Lee and
Lee, 2007), South America (Moura et al., 2008) or even the Great Lakes region (Higginson et al.,
2007), where the American term of ‘coastwise shipping’ is largely preferred. Therefore SSS is,
in fact and despite the official definition, understood as the sea movement between ports sharing
a common sea coastline or located in the same sea.
At this stage the concept has a board definition, encompassing many different kinds of traffic,
freight shape, ship and demand characteristics. Therefore, in order to explore, quantify and grade
the drivers behind modal shift, a narrower definition/approach will be necessary before
proceeding to the study.
2.1.1 SSS depending on traffic source
Namely, three main kinds of freight movements (or traffic sources) can be considered, all labelled
as Short Sea Shipping, with different degrees of sensitiveness to modal shift:
Captive traffic
Whenever no alternative mean of transportation exists, namely traffic connections from/to
islands, within big land masses separated with a big water body (e.g. south and north of the
Mediterranean basin) or when the land connections represent big detours (e.g. East and West
Baltic Sea or certain traffics between mainland Europe and Great Britain). Due to its location
(beyond the sea) road transport is not seen as a potential alternative because it is too costly in
terms of time and money, compared to short sea shipping.
2 – Short Sea Shipping and Motorways of the Sea. Concepts definition and review
PhD. Thesis 13
Deep Sea Shipping feeder traffic
SSS lines distributing and/or collecting freight for DSS services. These lines are essential for
maritime services using hub-and-spoke strategies based on transhipment. They typically focus on
container SSS traffic, but there are also SSS services for other specialized traffics (oil, bulk, cars,
etc.) needing feeder services from hub ports. Examples of this kind of traffic are found in the
biggest EU ports such as Rotterdam, Hamburg or Antwerp, but also in smaller ports (Algeciras,
Valencia, Marsaxlokk or Gioia Tauro for containers or Fos-Marseille, Sines for oil and bulk, etc.).
Domestic traffic
Domestic traffic competes with other modes. Understood as freight with origin and destination
within European countries. It may be the situation between Spain and Italy or across the Adriatic
Sea because the road alternative is not good enough. This is the kind of traffic where shift from
road to sea is more likely to happen.
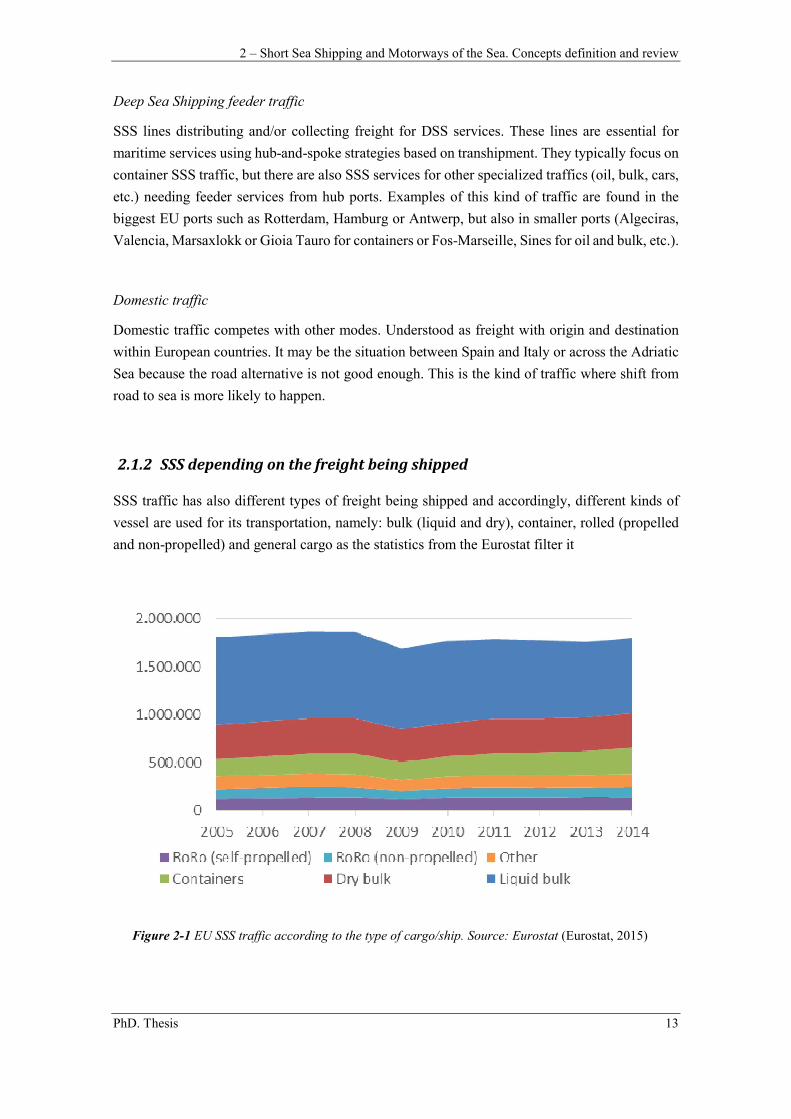
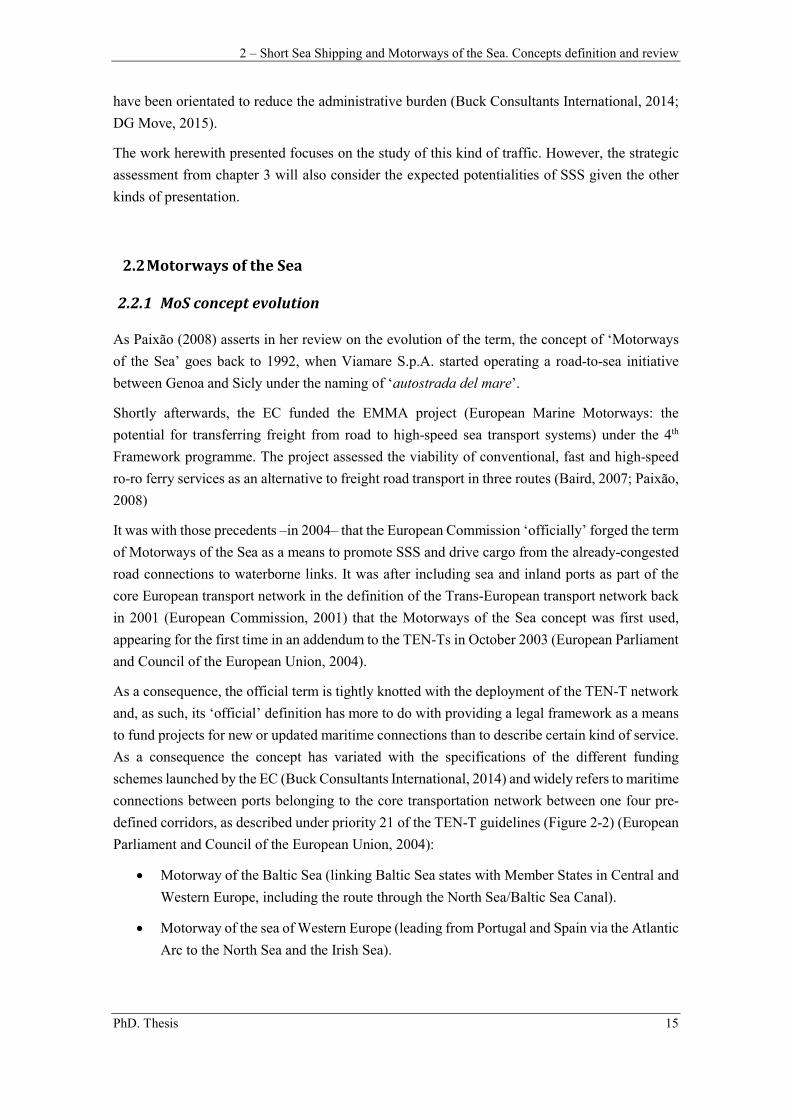
2.1.2 SSS depending on the freight being shipped
SSS traffic has also different types of freight being shipped and accordingly, different kinds of
vessel are used for its transportation, namely: bulk (liquid and dry), container, rolled (propelled
and non-propelled) and general cargo as the statistics from the Eurostat filter it
Figure 2-1 EU SSS traffic according to the type of cargo/ship. Source: Eurostat (Eurostat, 2015)
RoRo terminals and truck freight. Improving competitiveness in a MoS context
14 P. Morales-Fusco (2016)
Bulk cargo
It occupies an important share of the maritime European traffic. In fact, liquid and dry bulk
accounted for two thirds of the total SSS freight cargo in Europe (46% and 20% respectively).
This type of cargo is shipped in large quantities and can be easily stowed in a single hold with
little risk of cargo damage. It usually requires the use of specialized ships operating under
irregular services (tramp) and conventionally, this kind of cargo has a single origin, destination
and client. Economically it is characterized by important economies of scale. Therefore, is a kind
of traffic that does not compete with other means of transportation: despite a small loss of market
share of SSS liquid bulk, the evolution of road and SSS transportation follow similar trajectories.
Secondly, the competitiveness of SSS for long distances denotes that bulk cargo is a captive traffic
for this sector (DG Move, 2015).
Containerships
Traffic follows its own dynamic quite different from that of road transportation, since it is more
associated to international flows, gateway ports and containership companies operating at the
international level. The main hubs provide feeder services to many ports that are also fed by rail
or/and road. When port container handling is efficient, SSS usually can offer competitive transport
costs from the origin or to the final destination, in particular for longer distances and where the
road system is deficient (in terms of network or congestion). This competitiveness can explain
why the evolution of the container shortsea sector shows increases of 32% in 2012 (compared to
2005), parallel to total international container trade increase (Eurostat, 2015).
In such context, as containership size is growing, carriers have to come together in alliances to
fill these vessels, thus a change in the nature of demand is expected. Demand for bigger ports and
higher capacity terminals due to consolidated volumes and greater peak volumes (and less
frequency of vessels) is to be expected. This involves the need for an extended feeder services
connecting transhipment hubs with smaller spoke ports. Thus, container SSS services in the North
Europe range are expected to increase in a short/medium term because of this incoming scenario.
RoRo sector (including RoPax)
This is the most sensitive to market changes, since the mode directly competes with road
transportation. The cost of switching from SSS to road transportation (modal back shift) is
negligible and the flexibility that road transportation offers is currently not comparable to SSS,
which still has severe integration difficulties. So many trials of SSS have not succeeded.
In fact, until 2012, its evolution was almost flat (year-on-year variations below 1% for the 2005-
2012 period) while EU road transportation increased in around a 30% (Eurostat, 2015). Short Sea
Shipping in RoRo ships is characterized by its bureaucratic burden and time consuming
administrative procedures at ports and cross-borders, which do not help its competitiveness and
constitutes a wall to its development. In fact many EU policies towards the promotion of SSS
2 – Short Sea Shipping and Motorways of the Sea. Concepts definition and review
PhD. Thesis 15
have been orientated to reduce the administrative burden (Buck Consultants International, 2014;
DG Move, 2015).
The work herewith presented focuses on the study of this kind of traffic. However, the strategic
assessment from chapter 3 will also consider the expected potentialities of SSS given the other
kinds of presentation.
2.2 Motorways of the Sea
2.2.1 MoS concept evolution
As Paixão (2008) asserts in her review on the evolution of the term, the concept of ‘Motorways
of the Sea’ goes back to 1992, when Viamare S.p.A. started operating a road-to-sea initiative
between Genoa and Sicly under the naming of ‘autostrada del mare’.
Shortly afterwards, the EC funded the EMMA project (European Marine Motorways: the
potential for transferring freight from road to high-speed sea transport systems) under the 4th
Framework programme. The project assessed the viability of conventional, fast and high-speed
ro-ro ferry services as an alternative to freight road transport in three routes (Baird, 2007; Paixão,
2008)
It was with those precedents –in 2004– that the European Commission ‘officially’ forged the term
of Motorways of the Sea as a means to promote SSS and drive cargo from the already-congested
road connections to waterborne links. It was after including sea and inland ports as part of the
core European transport network in the definition of the Trans-European transport network back
in 2001 (European Commission, 2001) that the Motorways of the Sea concept was first used,
appearing for the first time in an addendum to the TEN-Ts in October 2003 (European Parliament
and Council of the European Union, 2004).
As a consequence, the official term is tightly knotted with the deployment of the TEN-T network
and, as such, its ‘official’ definition has more to do with providing a legal framework as a means
to fund projects for new or updated maritime connections than to describe certain kind of service.
As a consequence the concept has variated with the specifications of the different funding
schemes launched by the EC (Buck Consultants International, 2014) and widely refers to maritime
connections between ports belonging to the core transportation network between one four pre-
defined corridors, as described under priority 21 of the TEN-T guidelines (Figure 2-2) (European
Parliament and Council of the European Union, 2004):
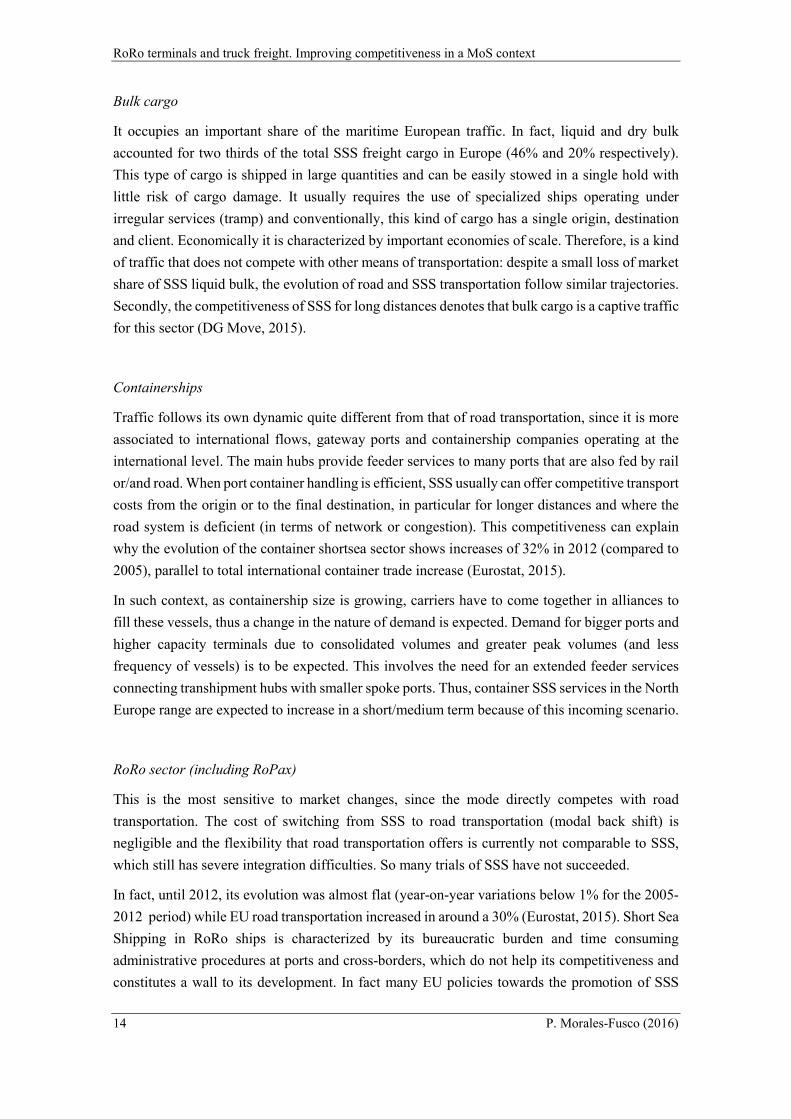
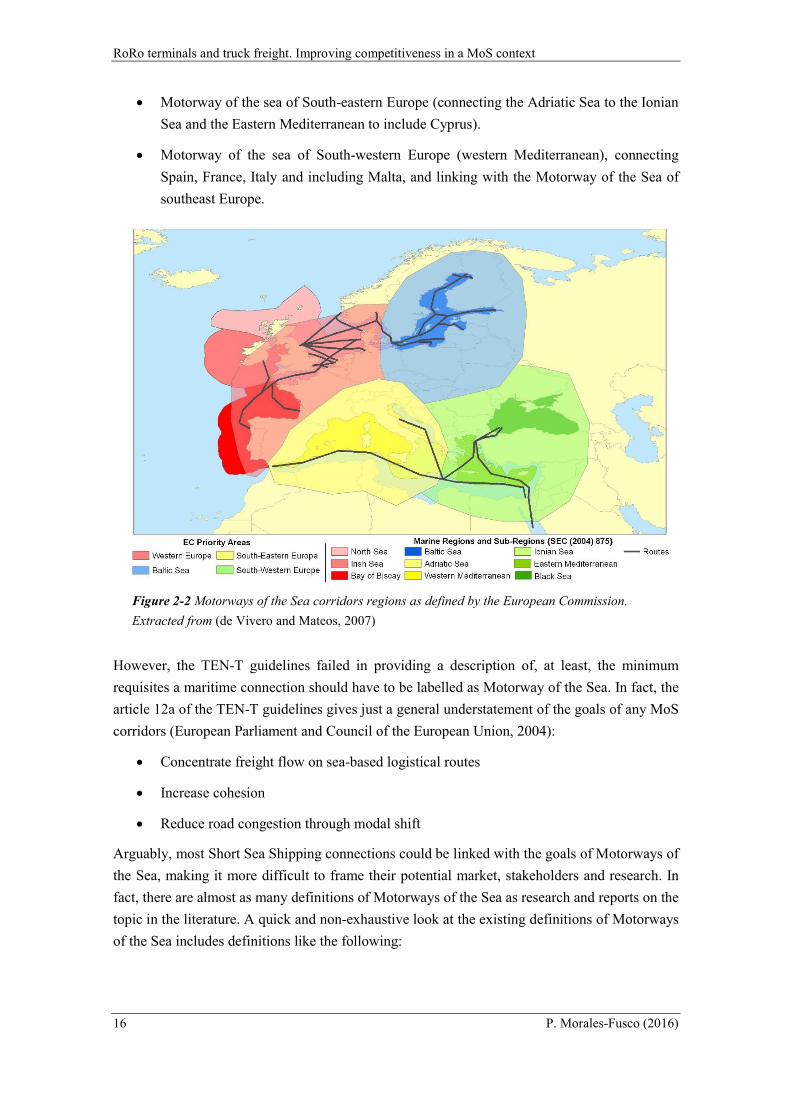
Motorway of the Baltic Sea (linking Baltic Sea states with Member States in Central and
Western Europe, including the route through the North Sea/Baltic Sea Canal).
Motorway of the sea of Western Europe (leading from Portugal and Spain via the Atlantic
Arc to the North Sea and the Irish Sea).
RoRo terminals and truck freight. Improving competitiveness in a MoS context
16 P. Morales-Fusco (2016)
Motorway of the sea of South-eastern Europe (connecting the Adriatic Sea to the Ionian
Sea and the Eastern Mediterranean to include Cyprus).
Motorway of the sea of South-western Europe (western Mediterranean), connecting
Spain, France, Italy and including Malta, and linking with the Motorway of the Sea of
southeast Europe.
Figure 2-2 Motorways of the Sea corridors regions as defined by the European Commission.
Extracted from (de Vivero and Mateos, 2007)
However, the TEN-T guidelines failed in providing a description of, at least, the minimum
requisites a maritime connection should have to be labelled as Motorway of the Sea. In fact, the
article 12a of the TEN-T guidelines gives just a general understatement of the goals of any MoS
corridors (European Parliament and Council of the European Union, 2004):
Concentrate freight flow on sea-based logistical routes
Increase cohesion
Reduce road congestion through modal shift
Arguably, most Short Sea Shipping connections could be linked with the goals of Motorways of
the Sea, making it more difficult to frame their potential market, stakeholders and research. In
fact, there are almost as many definitions of Motorways of the Sea as research and reports on the
topic in the literature. A quick and non-exhaustive look at the existing definitions of Motorways
of the Sea includes definitions like the following:

2 – Short Sea Shipping and Motorways of the Sea. Concepts definition and review
PhD. Thesis 17
“Sea-connections (…) regular and high-quality alternatives to road
transport”
(Zhaomin Zhang, 2006).
“Links between ports with higher requirements in terms of time, cost,
flexibility, reliability and resilience”
(Marzano et al., 2009)
High frequency, regular, door-to-door intermodal services where the main
haulage is done by SSS and last mile connectivity by road transport. These
services would link ports and markets located in at least 2 European
Member States.
(Baindur and Viegas, 2012b)
Additionally, and besides neither the ‘official’ nor the alternative definitions do not state the kind
of ship of cargo considered, there is a common understanding that MoS services are RoRo or
RoPax. A glimpse on the existing literature addressing MoS services shows how RoRo or ferry-
like ships are prevalent (section 2.3). As Paixao and Marlow (2008) pointed out, this might be
caused by historical reasons, due to the flexibility of RoRo ships or due to geographical reasons
being ferry (and RoRo) services common in the Baltic and North Seas when the concept was first
introduced (Paixão, 2008).
2.2.2 MoS definition used
For clarification purposes, an easy and quantifiable definition of Motorways of the Sea has been
used from this chapter onwards. The definition used in the reports by Observatorio Estadístico
del Transporte Marítimo de Corta Distancia en España (SPC-SPAIN, 2014) is being used
through the thesis. That is:
Motorways of the Sea are SSS regular lines with a minimum of three
departures per week and connecting a maximum of three different ports
operating in any of the corridors defined by the TEN-T guidelines.
Additionally, in the remaining of the text MoS is implicitly linked with rolled cargo ship (RoRo
and RoPax) services unless stated differently. Such an approach is consistent with: i) the goal of
the research (to provide a framework to ease the shift from mono-modal road freight transport to
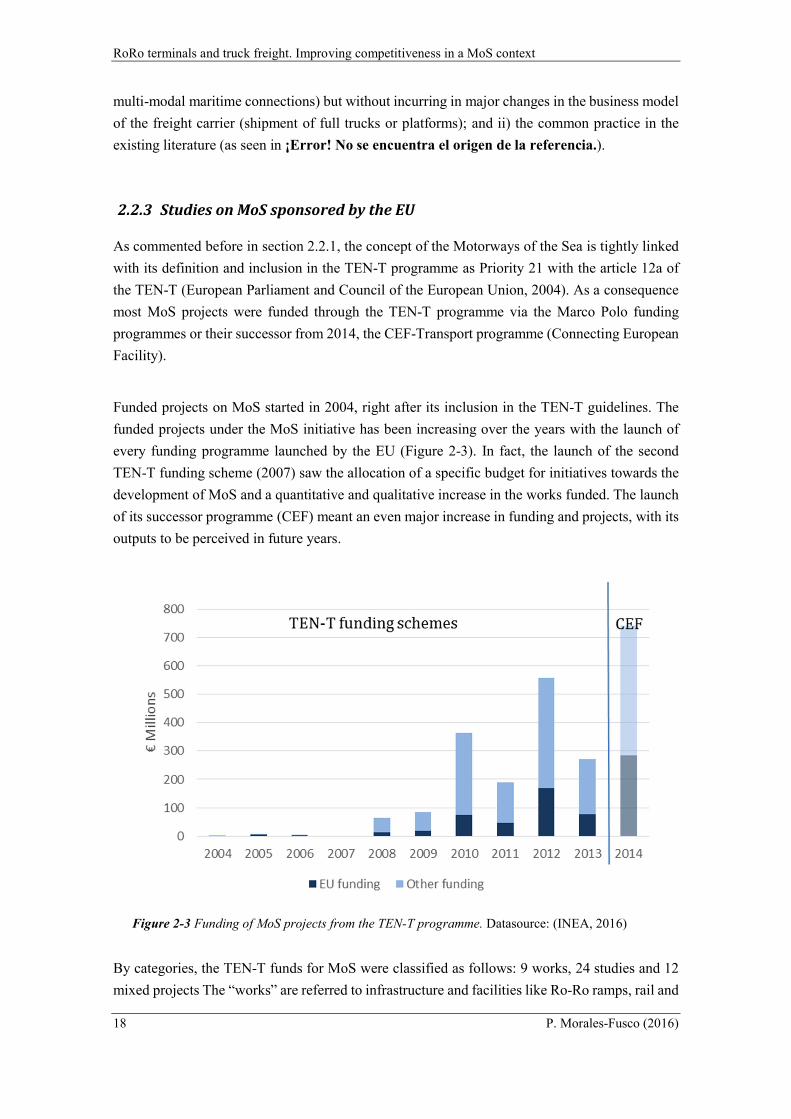
RoRo terminals and truck freight. Improving competitiveness in a MoS context
18 P. Morales-Fusco (2016)
multi-modal maritime connections) but without incurring in major changes in the business model
of the freight carrier (shipment of full trucks or platforms); and ii) the common practice in the
existing literature (as seen in ¡Error! No se encuentra el origen de la referencia.).
2.2.3 Studies on MoS sponsored by the EU
As commented before in section 2.2.1, the concept of the Motorways of the Sea is tightly linked
with its definition and inclusion in the TEN-T programme as Priority 21 with the article 12a of
the TEN-T (European Parliament and Council of the European Union, 2004). As a consequence
most MoS projects were funded through the TEN-T programme via the Marco Polo funding
programmes or their successor from 2014, the CEF-Transport programme (Connecting European
Facility).
Funded projects on MoS started in 2004, right after its inclusion in the TEN-T guidelines. The
funded projects under the MoS initiative has been increasing over the years with the launch of
every funding programme launched by the EU (Figure 2-3). In fact, the launch of the second
TEN-T funding scheme (2007) saw the allocation of a specific budget for initiatives towards the
development of MoS and a quantitative and qualitative increase in the works funded. The launch
of its successor programme (CEF) meant an even major increase in funding and projects, with its
outputs to be perceived in future years.
Figure 2-3 Funding of MoS projects from the TEN-T programme. Datasource: (INEA, 2016)
By categories, the TEN-T funds for MoS were classified as follows: 9 works, 24 studies and 12
mixed projects The “works” are referred to infrastructure and facilities like Ro-Ro ramps, rail and
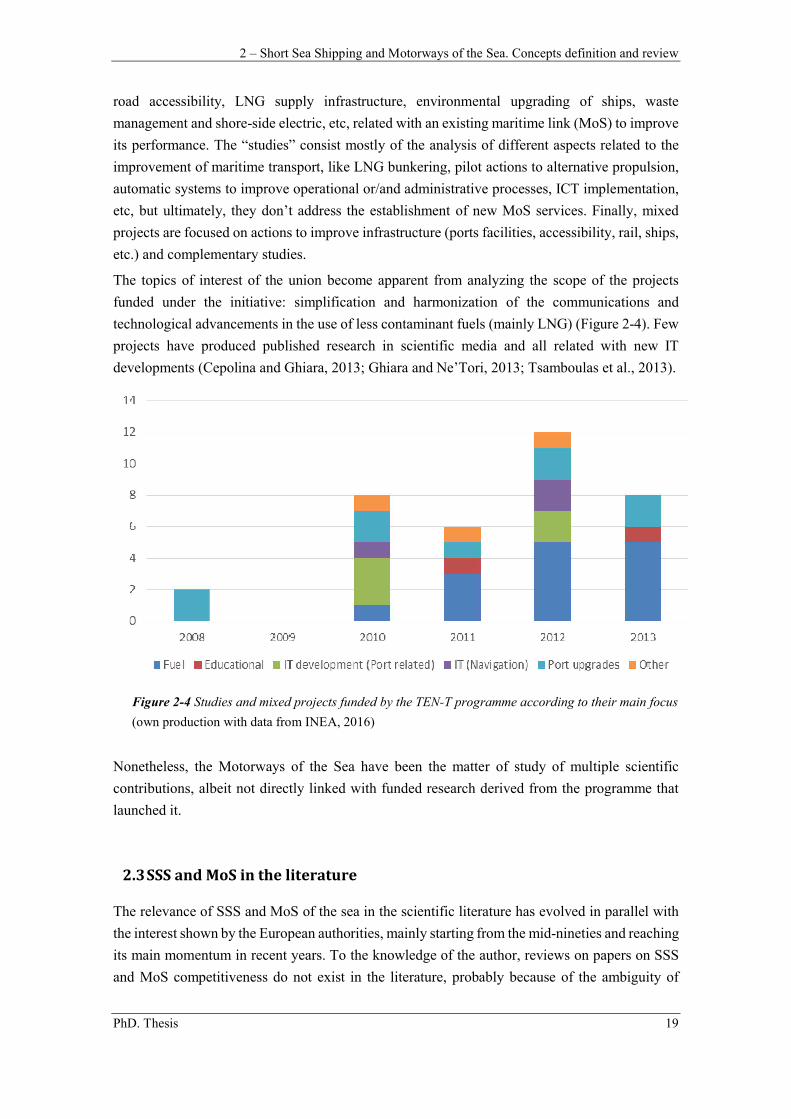
2 – Short Sea Shipping and Motorways of the Sea. Concepts definition and review
PhD. Thesis 19
road accessibility, LNG supply infrastructure, environmental upgrading of ships, waste
management and shore-side electric, etc, related with an existing maritime link (MoS) to improve
its performance. The “studies” consist mostly of the analysis of different aspects related to the
improvement of maritime transport, like LNG bunkering, pilot actions to alternative propulsion,
automatic systems to improve operational or/and administrative processes, ICT implementation,
etc, but ultimately, they don’t address the establishment of new MoS services. Finally, mixed
projects are focused on actions to improve infrastructure (ports facilities, accessibility, rail, ships,
etc.) and complementary studies.
The topics of interest of the union become apparent from analyzing the scope of the projects
funded under the initiative: simplification and harmonization of the communications and
technological advancements in the use of less contaminant fuels (mainly LNG) (Figure 2-4). Few
projects have produced published research in scientific media and all related with new IT
developments (Cepolina and Ghiara, 2013; Ghiara and Ne’Tori, 2013; Tsamboulas et al., 2013).
Figure 2-4 Studies and mixed projects funded by the TEN-T programme according to their main focus
(own production with data from INEA, 2016)
Nonetheless, the Motorways of the Sea have been the matter of study of multiple scientific
contributions, albeit not directly linked with funded research derived from the programme that
launched it.
2.3 SSS and MoS in the literature
The relevance of SSS and MoS of the sea in the scientific literature has evolved in parallel with
the interest shown by the European authorities, mainly starting from the mid-nineties and reaching
its main momentum in recent years. To the knowledge of the author, reviews on papers on SSS
and MoS competitiveness do not exist in the literature, probably because of the ambiguity of
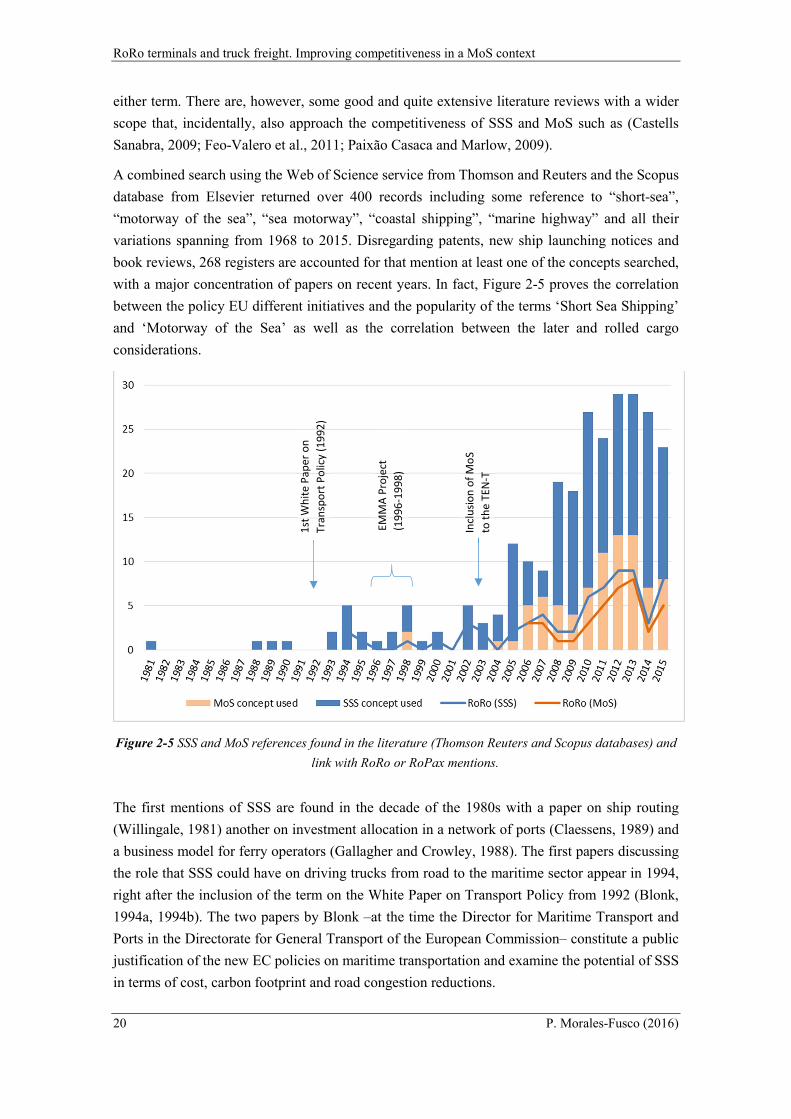
RoRo terminals and truck freight. Improving competitiveness in a MoS context
20 P. Morales-Fusco (2016)
either term. There are, however, some good and quite extensive literature reviews with a wider
scope that, incidentally, also approach the competitiveness of SSS and MoS such as (Castells
Sanabra, 2009; Feo-Valero et al., 2011; Paixão Casaca and Marlow, 2009).
A combined search using the Web of Science service from Thomson and Reuters and the Scopus
database from Elsevier returned over 400 records including some reference to “short-sea”,
“motorway of the sea”, “sea motorway”, “coastal shipping”, “marine highway” and all their
variations spanning from 1968 to 2015. Disregarding patents, new ship launching notices and
book reviews, 268 registers are accounted for that mention at least one of the concepts searched,
with a major concentration of papers on recent years. In fact, Figure 2-5 proves the correlation
between the policy EU different initiatives and the popularity of the terms ‘Short Sea Shipping’
and ‘Motorway of the Sea’ as well as the correlation between the later and rolled cargo
considerations.
Figure 2-5 SSS and MoS references found in the literature (Thomson Reuters and Scopus databases) and
link with RoRo or RoPax mentions.
The first mentions of SSS are found in the decade of the 1980s with a paper on ship routing
(Willingale, 1981) another on investment allocation in a network of ports (Claessens, 1989) and
a business model for ferry operators (Gallagher and Crowley, 1988). The first papers discussing
the role that SSS could have on driving trucks from road to the maritime sector appear in 1994,
right after the inclusion of the term on the White Paper on Transport Policy from 1992 (Blonk,
1994a, 1994b). The two papers by Blonk –at the time the Director for Maritime Transport and
Ports in the Directorate for General Transport of the European Commission– constitute a public
justification of the new EC policies on maritime transportation and examine the potential of SSS
in terms of cost, carbon footprint and road congestion reductions.
1st
Wh
ite
Pap
er o
n
Tran
spo
rt P
olic
y (1
99
2)
EMM
A P
roje
ct
(19
96
-19
98
)
Incl
usi
on
of
Mo
S
to t
he
TEN
-T
(20
03
)
2 – Short Sea Shipping and Motorways of the Sea. Concepts definition and review
PhD. Thesis 21
As the terms became popular, their appearance on the literature became more incidental (mentions
of the term in papers with topics further away from its idiosyncrasy like seafarers health
conditions (Wadsworth et al., 2008) or the berth allocation problem (Pang and Liu, 2014).
Once the list of 268 references is shortlisted to the papers with SSS or MoS as (one of) their
central(s) topic(s), the existing literature can be roughly divided in three: i) research on the drivers
behind modal choice (and their quantification, usually for a specific corridor); ii) discussion over
the policies affecting the development of MoS and SSS; and iii) feasibility studies for a specific
corridor or even a complete network of MoS services.
2.3.1 Offer and demand characterization
There are many studies that provide formulations to, comparatively, assess how different
variables (cost, time, emissions) rate in different transport alternatives by providing models to
quantify them for all or part of the supply chain (Martinez-Lopez et al., 2015; Marzano et al.,
2009; Rodriguez Nuevo et al., 2010; Saurí and Spuch, 2010).
Regarding the demand characterization and its requirements, there are several papers dealing with
the identification of the parameters or thresholds that a maritime service must offer to be
competitive against road in mid-length distances (Cullinane and Toy, 2000; Grosso et al.,
Vaggelas, 2010; Paixão, 2008). Other papers try to quantify the effect the drivers have on the
choice of a certain transport option by building demand models and/or assessing their elasticity
for a specific market like the Spanish (Arencibia et al., 2015; Feo et al., 2011), Italian (Bergantino
and Bolis, 2004; Russo and Chilà, 2007), American (Puckett et al., 2011) or Australian (Brooks
et al., 2012), among others.
The later studies not only set the parameters for the mode choice models but also consider,
although superficially, the role of the different stakeholders (transporters, shippers, forwarders)
involved in the decision making process. Some authors focus their research in that aspect,
specifically López-Navarro et al. (2011) or Garcia-Menendez et al. (2009).
Chapter 3 and 7 of this thesis provide further insights on the drivers behind modal choice and
their quantification, respectively, producing and expanded literature review on both topics.
2.3.2 Effects of policy measures over SSS and MoS
Several series of papers study the effect of transport policies and regulations on the
competitiveness of SSS. For instance, the qualitative studies from Baird (2007) and Styhre (2009)
discuss the unequal treatment of maritime transport when compared with its competitors in terms
of infrastructure financing. The road is seen as the most funded transportation mean. In the same
line of thought, Douet and Cappuccilli (2011) are extremely critic with the ambiguity of the
RoRo terminals and truck freight. Improving competitiveness in a MoS context
22 P. Morales-Fusco (2016)
European policies and the lack of a common policy with an equivalent treatment of all means of
transportation and countries.
The current policies favoring SSS are also analyzed in a series of papers by Baindur and Viegas
(2012a, 2011, 2012b). They not also described and quantified the effect of the current policies
and identified technical and regulatory barriers to the competitiveness of the SSS but also
whenever specific measures or projects were successful. As a result, they built a microsimulation
model that not only assigns the demand to the network, but also studies the cross-relationship
between demand, offer and transport regulation. Juste and Ghiara, (2015) also used a simplified
method to assess the effects of transport policies, generically speaking, whereas Tsamboulas et
al., (2010) from studying previous SSS successful (and unsuccessful) line deployments, assert
how harmonization of ports, standardization and achieved port productivity are intrinsic to their
continuity.
Additionally, and beyond the set-up papers by Blonk (1994a, 1994b) or the critical contribution
by Douet and Cappuccilli (2011), there are several other contributions specifically aimed at
discussing the European policies and the necessary future steps needed, with a special focus on
Motorways of the Sea (Gese Aperte and Baird, 2013; Paixão Casaca, 2014).
Besides these, some research focuses on the effects of specific policies -already implemented or
in discussion- that could have an effect on the competitiveness of SSS. For instance, regarding
the implementation of a possible European Ecobonus (subsiding the transporter that opts for using
a RoPax service (Tsamboulas, et al., 2015; Usabiaga Santamaria, 2010), the effects from the
deployment of the ECA (Emission Control Area) enforced by the Annex VI of the 1997 MARPOL
protocol either in the North Sea (Brynolf et al., 2014; Holmgren et al., 2014) or in the
Mediterranean (Usabiaga Santamaria et al., 2012).
Beyond the European context there are also the works by Brooks (Bendall and Brooks, 2011;
Brooks, 2014) or Moura (Moura et al., 2008) that assess the regulations supporting SSS in North
America and Australia, and Brazil, respectively.
2.3.3 Feasibility studies on MoS services
Regarding the feasibility of MoS corridors, there is a proliferation of papers on the Western
Mediterranean corridors from Italy to Greece and Cyprus (Beškovnik, 2013; Bukljaš et al., 2007;
Luttenberger et al., 2013; Tsamboulas et al., 2015) or the North of Europe (Ng, 2009; Paulauskas
and Bentzen, 2008) or even for South East Asia (Arof, 2015).
Some other studies assess the feasibility of MoS services for niche sectors. For instance,
Crescimanno et al. (2011) conclude that cargo concentration (geographically) and sectorial
specialization can be beneficial and justify the implementation of certain MoS connections,
especially in peripheral territories like Sicily. Other authors assess similar problematics, like
Pérez-Mesa et al. (2010) with the perishable horticulture products from southern Spain.
2 – Short Sea Shipping and Motorways of the Sea. Concepts definition and review
PhD. Thesis 23
Additionally, Tsamboulas and Moraiti (2013) propose a decision support tool to assess the
feasibility of any new MoS line based in the fulfilment of three conditions: i) a concentration
demand threshold, ii) positive socioeconomic evaluation of the national economy and available
infrastructures by the public authorities involved and iii) the financial viability of the line by its
maritime operator.
Complementarily, there are papers aiming to produce the optimal network at a planning level. For
instance, Martínez-López et al. (2015) generate a networks of services aimed to maximize the
number of cases in which maritime links outperform road transportation in time and costs. Pérez-
Mesa et al. (2012) also use an assignation model to size the SSS network between South Spain
and the Netherlands based in different values in the FVOT (Freight Value of Time) used.
Similarly, Tsamboulas et al. (2013) build a 4-steps model (demand generation, O/D pairing and
network definition and assignment) similar to the common practice in urban transportation
models. The same problem, although simplified, is solved in Chang et al. (2007) by means of
linear programming model.
2.3.4 Other research topics
Besides drivers, feasibility and policy considerations, a fair amount of papers also examine the
green label given to SSS services. Some consider the advancements of new fuels or ship design
on the carbon footprint and the compliance with international emission regulations (Bengtsson et
al., 2014; Borlenghi et al., 2008). However, Hjelle in a series of articles discuss the suitability of
the ‘green label’ given to SSS when considering maritime-multimodal supply chains operated
with RoRo or RoPax ships (Hjelle, 2010, 2014; Hjelle and Fridell, 2010). In fact, this would be
the case of certain RoPax connections, but mainly in lines orientated to passage where high speed
vessels are used to please the requirements of this part of the ‘cargo’ (López-Navarro, 2014).
Finally, and given that they study feasibility, drivers and policies altogether, the overview on the
existing literature could not be finished without commenting the series of articles by Paixão and
Marlow at the University of Cardiff (Paixão Casaca and Marlow, 2002, 2005, 2009) where
strengths, weaknesses and barriers to the development and success of the SSS in Europe are
analyzed.
2.3.5 Exhaustive literature review
As observed, literature review on Motorways of the Sea is broad in the number of research done
and the number of topics that can be linked to it from policy, to technology development. The
focus of this thesis is also broad in concept, since although revolving on the production of decision
support tools (DST) to assess the feasibility of MoS and ways to improve their competitiveness,
multiple approaches are taken. The study considers all, terminal operations and capacity, cost
structure, pricing and drivers behind modal shift. Therefore, the frame of the papers examined
RoRo terminals and truck freight. Improving competitiveness in a MoS context
24 P. Morales-Fusco (2016)
surpasses at some points the frame of MoS and SSS liner services to also include reference papers
related to supply chain assessment, discrete choice and risk assessment and/or some of the papers
found in the literature could be used multiple times with different purposes.
Given the autoconclusive nature of the structure of this thesis, with a different topic addressed per
chapter, it became more convenient to provide more detailed literature reviews spread over the
remaining body of the text, from chapters 3 to 7. Each chapter introduces and discusses the
contributions found in the literature as soon as the topic they address is tackled, mentioning
sources already discussed in previous chapters if necessary.
More specifically, chapter 3 discusses the drivers behind modal choice, especially if SSS (in any
of its kinds) is involved, and the requirements of the demand may have on the way the supply
chain is structured. Chapter 4, studies the capacity and quality of the port terminal, therefore it
discusses indicators to rate the terminal’s performance and ways to assess the relationship
between capacity and quality. Chapter 5 studies the resiliency of RoPax terminals, introducing
previous research done in the topic regarding port terminals and RoPax liners and also providing
and insight on how to assess the risks and vulnerabilities of a port and a supply chain. Chapter 6
provides a quick overview over the modal choice considerations from Chapter 3 and provides
some insights behind the business models available for the transporter to carry the cargo using a
MoS. Finally, chapter 7 discusses the effect of the tariffs on the modal choice, and calibrates a
discrete choice model, therefore, it previously addresses how modal choice models have been
used in the past regarding MoS and the existing pricing systems in the maritime sector.
3 – Strategic assessment on the SSS potential for the supply chain
PhD. Thesis 25
3. Strategic assessment on the SSS potential for the supply
chain
Chapter 3
Strategic assessment on the SSS potential for
the supply chain
3.1 Introduction
Regarding the strategic assessment, the research is original in its approach. As stated in the
literature review, the feasibility of implementing Short Sea Shipping services between two
specific ports has usually been approached on the operative level, in terms of time and cost for a
specific origin–destination pair. The research now introduced, on the other hand, starts by
describing freight distribution strategies based on the requirements of the industry, the demand
and the freight to determinate what will be the most convenient SSS strategy to be considered by
the transporter/shipper of the cargo.
The ultimate objective of this chapter is then, to establish the groundwork for studying the
feasibility of incorporating SSS, either in its RoRo, container form, into a company’s supply
transportation chain, regardless of any specific singularities of that particular company. Therefore,
the goal is to assess which freight distribution strategies are more likely to benefit from
considering SSS from the beginning. Because of its scope, this is the only chapter that takes the
wider definition of SSS into account, considering all its flavours. The following chapters only
focus on SSS in its RoRo/RoPax version integrated in a MoS route.
The research provided is complemented with chapters 6 (and 7), since the strategies of business
models used to structure the cost of the door-to-door transport chains are first introduced in this
chapter and are later used (in fact, quantified) in later chapters of the thesis. In fact, this chapter
was firstly conceived as an introduction to the contents of chapter 6.

RoRo terminals and truck freight. Improving competitiveness in a MoS context
26 P. Morales-Fusco (2016)
3.2 SSS vs road, drivers behind the modal choice
Much research has been done in the topic of mode choice behaviour and prediction. Several
discrete and aggregated models of either revealed or stated preference (RP and SP, respectivelly)
have been developed during the years, to determinate the relationship between certain parameters
or attributes and the final choice of the end-user of a specific route or transport medium. The
works by Hensher (Hensher, 1994; Puckett et al., 2011) are a good starting point to get a general
overview on the topic. The papers by Cullinane and Toy (2000) and Grosso et al. (2010)
complement the overview with a comprehensive analysis of the different SP methods as well as
the attributes considered in the freight mode/route choice applied to a RoRo versus SSS case. A
further and detailed assessment on discrete and aggregate modal choice models is provided in
chapter 7, before constructing and calibrating our own model.
What is important in modal choice/assignment models is to determinate what parameters and
aspects are necessary to account for in order to define the choice, in this case of a specific supply
chain (Bowersox et al., 2002; Simchi-Levi et al., 2008). Usually, the supply chain choice, whoever
does it, will depend on both quantitative and subjective, qualitative parameters. Some studies
point out that subjective parameters, like perceived quality, tip the scale towards one or another
intermodal chain (Danielis et al., 2005; Lu, 2003; Murphy et al., 1997). However, it is usually
considered that the most determinant characteristics are the kind of product and the transporter’s
business structure (Danielis et al., 2005; Nam, 1997) together with a pinch of force of habit and
reluctance to changes (Danielis and Marcucci, 2007; Jang et al., 2010). Finally, there are few
studies that give a predominant role to the overall chain cost (Cullinane and Toy, 2000).
Among the qualitative aspects considered, the shippers value especially the safety of the cargo
together with the reliability, usually understood as fulfilment of the expected travel time
(Chlomoudis et al., 2007; Wardman, 2001). Chapter 5 deepens on the literature relative to
resiliency evaluation that could be applied to RoRo terminals used in MoS lines. Other authors
add quality and even resilience and adaptability to the equation (cf. Paixão Casaca and Marlow,
2002; Henesey, 2006). However, the role each qualitative aspect has on the final strategy varies
considerably depending on the source consulted (Jang et al., 2010). The definition of each
qualitative aspect can vary as well as the degree of concretion assigned to it. In that sense, Paixão
Casaca and Marlow (2005) managed to identify more than sixty parameters to assess the shipper
satisfaction in the freight transportation topic.
When taking a look at the quantitative assessments, values are more frequently found in EU
funded studies than research papers. Some projects developed with that goal to determine cost
and time structure for competing door-to-door freight movements that include the SSS are:
RECORDIT (Black et al., 2003), the study tried to quantify the cost of using transport chains
alternative to the road in the European context; a study by the Inha University (South Korea)
(Chang et al., 2007), that builds an analytical modal to calculate the most optimal, cost-wise, SSS
network in South Korea or Tenekecioglu’s thesis (Tenekecioglu, 2005) where, total costs of only-
road transport chains were compared to their counterparts using SSS, concluding that the latter
were socially more acceptable.
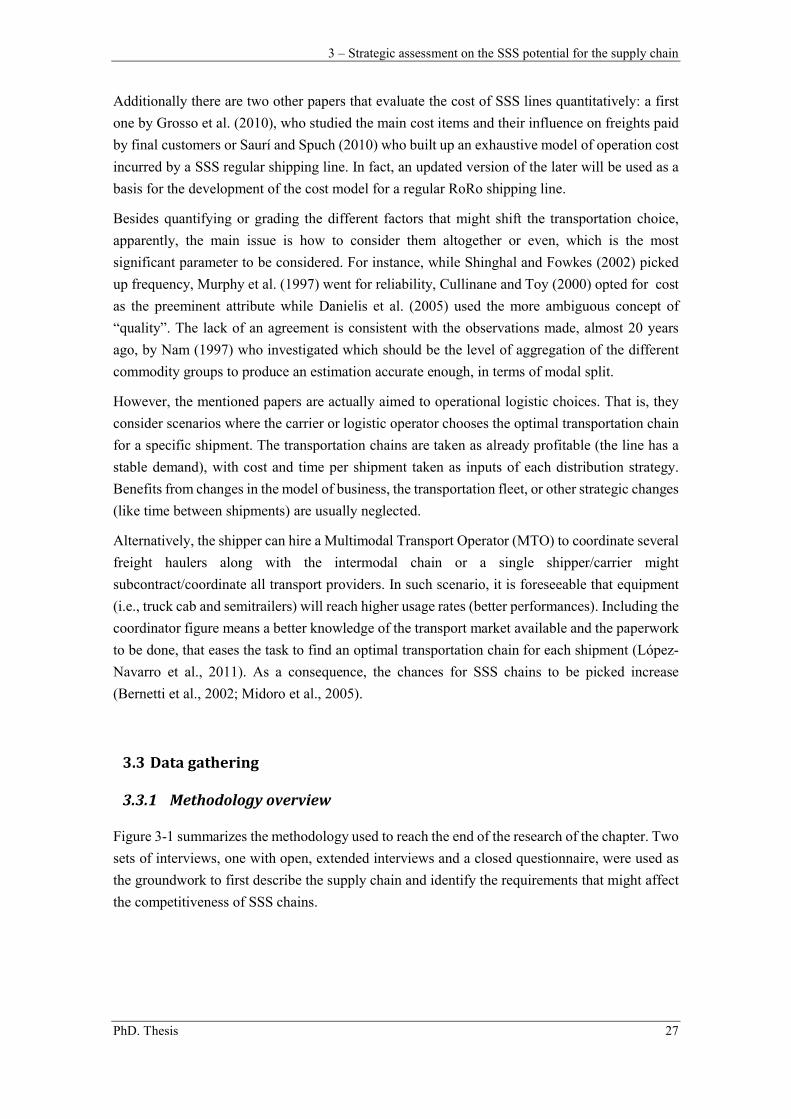
3 – Strategic assessment on the SSS potential for the supply chain
PhD. Thesis 27
Additionally there are two other papers that evaluate the cost of SSS lines quantitatively: a first
one by Grosso et al. (2010), who studied the main cost items and their influence on freights paid
by final customers or Saurí and Spuch (2010) who built up an exhaustive model of operation cost
incurred by a SSS regular shipping line. In fact, an updated version of the later will be used as a
basis for the development of the cost model for a regular RoRo shipping line.
Besides quantifying or grading the different factors that might shift the transportation choice,
apparently, the main issue is how to consider them altogether or even, which is the most
significant parameter to be considered. For instance, while Shinghal and Fowkes (2002) picked
up frequency, Murphy et al. (1997) went for reliability, Cullinane and Toy (2000) opted for cost
as the preeminent attribute while Danielis et al. (2005) used the more ambiguous concept of
“quality”. The lack of an agreement is consistent with the observations made, almost 20 years
ago, by Nam (1997) who investigated which should be the level of aggregation of the different
commodity groups to produce an estimation accurate enough, in terms of modal split.
However, the mentioned papers are actually aimed to operational logistic choices. That is, they
consider scenarios where the carrier or logistic operator chooses the optimal transportation chain
for a specific shipment. The transportation chains are taken as already profitable (the line has a
stable demand), with cost and time per shipment taken as inputs of each distribution strategy.
Benefits from changes in the model of business, the transportation fleet, or other strategic changes
(like time between shipments) are usually neglected.
Alternatively, the shipper can hire a Multimodal Transport Operator (MTO) to coordinate several
freight haulers along with the intermodal chain or a single shipper/carrier might
subcontract/coordinate all transport providers. In such scenario, it is foreseeable that equipment
(i.e., truck cab and semitrailers) will reach higher usage rates (better performances). Including the
coordinator figure means a better knowledge of the transport market available and the paperwork
to be done, that eases the task to find an optimal transportation chain for each shipment (López-
Navarro et al., 2011). As a consequence, the chances for SSS chains to be picked increase
(Bernetti et al., 2002; Midoro et al., 2005).
3.3 Data gathering
3.3.1 Methodology overview
Figure 3-1 summarizes the methodology used to reach the end of the research of the chapter. Two
sets of interviews, one with open, extended interviews and a closed questionnaire, were used as
the groundwork to first describe the supply chain and identify the requirements that might affect
the competitiveness of SSS chains.
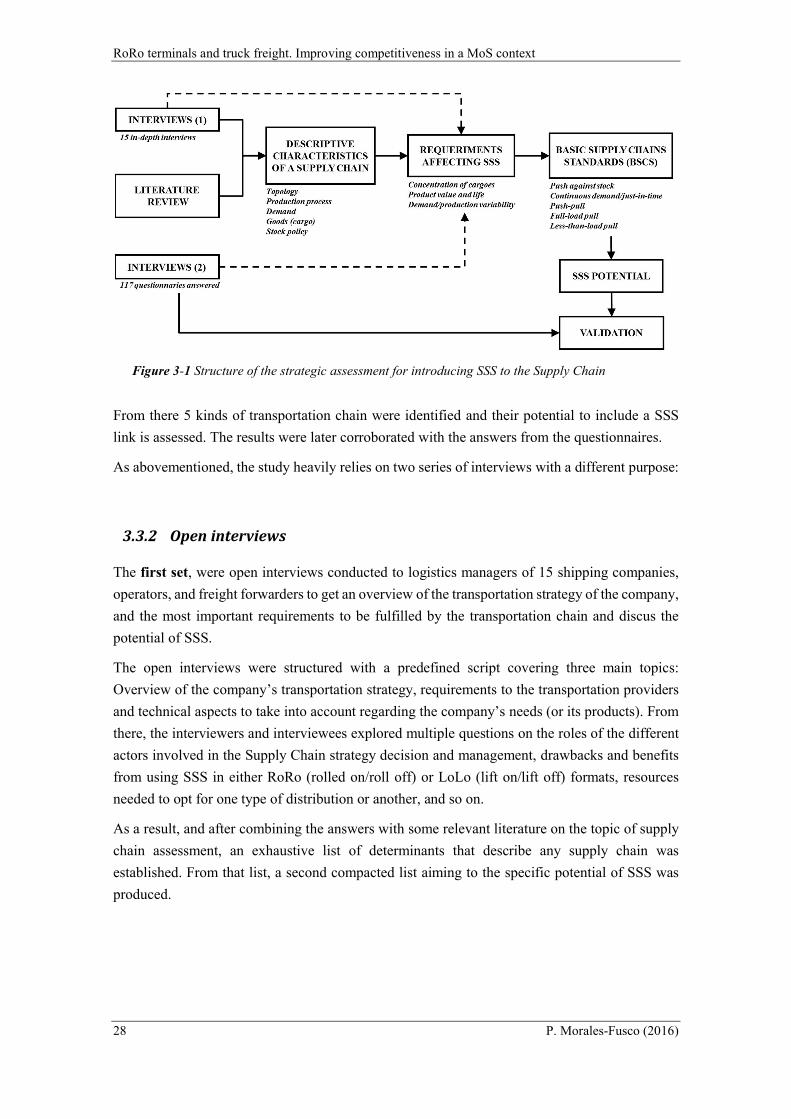
RoRo terminals and truck freight. Improving competitiveness in a MoS context
28 P. Morales-Fusco (2016)
Figure 3-1 Structure of the strategic assessment for introducing SSS to the Supply Chain
From there 5 kinds of transportation chain were identified and their potential to include a SSS
link is assessed. The results were later corroborated with the answers from the questionnaires.
As abovementioned, the study heavily relies on two series of interviews with a different purpose:
3.3.2 Open interviews
The first set, were open interviews conducted to logistics managers of 15 shipping companies,
operators, and freight forwarders to get an overview of the transportation strategy of the company,
and the most important requirements to be fulfilled by the transportation chain and discus the
potential of SSS.
The open interviews were structured with a predefined script covering three main topics:
Overview of the company’s transportation strategy, requirements to the transportation providers
and technical aspects to take into account regarding the company’s needs (or its products). From
there, the interviewers and interviewees explored multiple questions on the roles of the different
actors involved in the Supply Chain strategy decision and management, drawbacks and benefits
from using SSS in either RoRo (rolled on/roll off) or LoLo (lift on/lift off) formats, resources
needed to opt for one type of distribution or another, and so on.
As a result, and after combining the answers with some relevant literature on the topic of supply
chain assessment, an exhaustive list of determinants that describe any supply chain was
established. From that list, a second compacted list aiming to the specific potential of SSS was
produced.
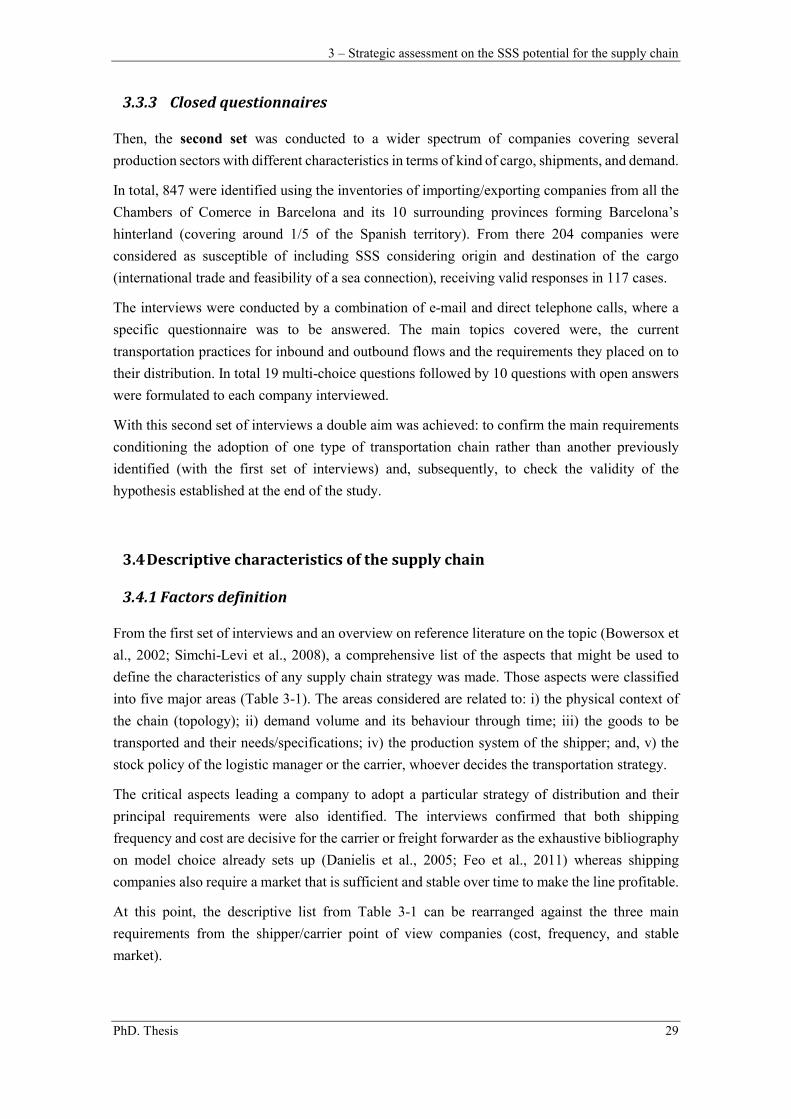
3 – Strategic assessment on the SSS potential for the supply chain
PhD. Thesis 29
3.3.3 Closed questionnaires
Then, the second set was conducted to a wider spectrum of companies covering several
production sectors with different characteristics in terms of kind of cargo, shipments, and demand.
In total, 847 were identified using the inventories of importing/exporting companies from all the
Chambers of Comerce in Barcelona and its 10 surrounding provinces forming Barcelona’s
hinterland (covering around 1/5 of the Spanish territory). From there 204 companies were
considered as susceptible of including SSS considering origin and destination of the cargo
(international trade and feasibility of a sea connection), receiving valid responses in 117 cases.
The interviews were conducted by a combination of e-mail and direct telephone calls, where a
specific questionnaire was to be answered. The main topics covered were, the current
transportation practices for inbound and outbound flows and the requirements they placed on to
their distribution. In total 19 multi-choice questions followed by 10 questions with open answers
were formulated to each company interviewed.
With this second set of interviews a double aim was achieved: to confirm the main requirements
conditioning the adoption of one type of transportation chain rather than another previously
identified (with the first set of interviews) and, subsequently, to check the validity of the
hypothesis established at the end of the study.
3.4 Descriptive characteristics of the supply chain
3.4.1 Factors definition
From the first set of interviews and an overview on reference literature on the topic (Bowersox et
al., 2002; Simchi-Levi et al., 2008), a comprehensive list of the aspects that might be used to
define the characteristics of any supply chain strategy was made. Those aspects were classified
into five major areas (Table 3-1). The areas considered are related to: i) the physical context of
the chain (topology); ii) demand volume and its behaviour through time; iii) the goods to be
transported and their needs/specifications; iv) the production system of the shipper; and, v) the
stock policy of the logistic manager or the carrier, whoever decides the transportation strategy.
The critical aspects leading a company to adopt a particular strategy of distribution and their
principal requirements were also identified. The interviews confirmed that both shipping
frequency and cost are decisive for the carrier or freight forwarder as the exhaustive bibliography
on model choice already sets up (Danielis et al., 2005; Feo et al., 2011) whereas shipping
companies also require a market that is sufficient and stable over time to make the line profitable.
At this point, the descriptive list from Table 3-1 can be rearranged against the three main
requirements from the shipper/carrier point of view companies (cost, frequency, and stable
market).
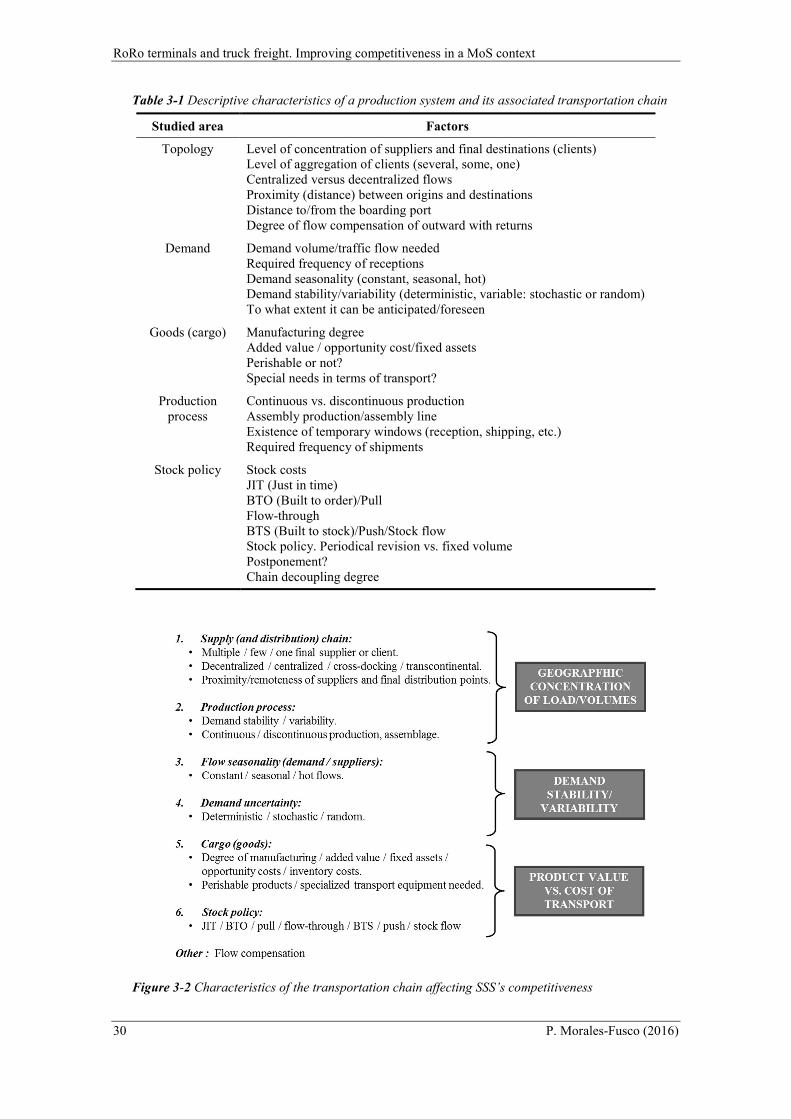
RoRo terminals and truck freight. Improving competitiveness in a MoS context
30 P. Morales-Fusco (2016)
Table 3-1 Descriptive characteristics of a production system and its associated transportation chain
Studied area Factors
Topology Level of concentration of suppliers and final destinations (clients) Level of aggregation of clients (several, some, one) Centralized versus decentralized flows Proximity (distance) between origins and destinations Distance to/from the boarding port Degree of flow compensation of outward with returns
Demand Demand volume/traffic flow needed Required frequency of receptions Demand seasonality (constant, seasonal, hot) Demand stability/variability (deterministic, variable: stochastic or random) To what extent it can be anticipated/foreseen
Goods (cargo) Manufacturing degree Added value / opportunity cost/fixed assets Perishable or not? Special needs in terms of transport?
Production process
Continuous vs. discontinuous production Assembly production/assembly line Existence of temporary windows (reception, shipping, etc.) Required frequency of shipments
Stock policy Stock costs JIT (Just in time) BTO (Built to order)/Pull Flow-through BTS (Built to stock)/Push/Stock flow Stock policy. Periodical revision vs. fixed volume Postponement? Chain decoupling degree
Figure 3-2 Characteristics of the transportation chain affecting SSS’s competitiveness
3 – Strategic assessment on the SSS potential for the supply chain
PhD. Thesis 31
Figure 3-2 introduces the three sets of characteristics, depending on: i) the volume of shipped
cargo (and frequency of shipments); ii) the value of the product (and cost); and/or, iii) the stability
of the demand. The adoption of these three sets is justified below.
3.4.2 Concentration of cargoes and volumes
All aspects relating to volume and the degree of concentration of the cargo (either in volume
and/or in time) are grouped together. Concentration eases the apparition of full load (FL)
transportation units, allowing for cheaper transportation. Since ships are bigger than truck trailers,
the potential demand has to be bigger to benefit from a lower unitary cost and therefore, it takes
longer to reunite enough cargo to take advantage of their economies of scale.
The critical volume that makes SSS viable and the optimal frequency of shipments by road are
essential to have a competitive transportation cost and service time. Large volumes benefit SSS:
A relevant volume of traffic between two specific areas of origin and destination could justify the
development of a new SSS line specializing in covering all specific requirements of demand and
the goods carrier.
In the latter case (large volumes sharing the same origin and destination), road haulage can also
be beneficial when the output frequency is low and/or spot (on demand) and the available SSS-
RoRo lines, if any, do not cover much of the journey or do not have a competitive price or time.
Road transportation by truck allows a better fit in terms of time and does not require such an
enormous and constant-over-time demand as SSS does.
3.4.3 Product value and life
Cargo value limits the amount of time that can be spent waiting for a possible consolidation at the
origin because its opportunity cost (fixed assets) is especially relevant. Perishable products are in
a similar situation. Both facts directly affect the stock policy and the kind of flow prevailing in
the Supply Chain (more value usually corresponds to a tighter flow, and thus higher transportation
costs). Additionally, a certain frequency has to be met and, at the same time, reliability (in terms
of time) becomes particularly important since transportation has a smaller weight in the total cost
paid by consumers for the final product.
In short, higher value of the product (or expiration) favours short lead times and flow-through and
thus the relative weight of transportation costs loses relevance in favour of time and safety.
Incidentally, the Freight Value of Time (FVOT) considered in any mode choice model to be used
as has been observed in real cases such the ones discussed in Feo et al. (2011) or Russo and
Musolino (2013).
RoRo terminals and truck freight. Improving competitiveness in a MoS context
32 P. Morales-Fusco (2016)
3.4.4 Variability over time
This group merges both, seasonality and uncertainty issues. The shipper or the carrier/freight
forwarder (for chains that run across land only) and/or the shipping companies (in the case of
chains that include SSS) may be able to assume or internalize this fluctuations if they are able to
compensate it with other fluctuating flows or trips were delivery time is not an issue. In any case,
the variability of the volume (or number of transportation units required) in each shipment
(output) is relevant to the dimensions of the transportation fleet deployed as well as the extra
space necessary to cover potential demand peaks. Having to hire extra space, or contract a larger
fleet produces larger costs per cargo unit shipped. Additionally, in moments with low demand or
production, a reduction in the service quality can be expected since it will take longer to reach the
critical mass that justifies an expedition (i.e. the frequency would be affected).
Variability should benefit the competitiveness of SSS since the aggregation of flows implies a
reduction in global variability (Simchi-Levi et al., 2008), improving the performance of the
equipment used for transportation (vessels). It may even lead to a more efficient use of tractor
units/platforms if shippers share pools of tractor units, if they belong to the shipping company, or
if shipments are managed by freight forwarders. A lower global variability also implies a more
efficient use of transportation equipment. This affirmation holds true for transporters that manage
large pools of transport units, being one of the main benefits of mergers in the sector.
Additionally, when the transporting units is the commodity being considered (in the case of
vehicles and truckloads), SSS-RoRo benefits cargo shippers as it is able to absorb the fluctuations
in the outflow of the production company without incurring extra costs for the owner of the cargo.
This happens, for instance, in the competitiveness achieved in the distribution chain of the
automobile company SEAT which has agreed to an annual average load on the lines for
Barcelona’s port but is able to decide the quantity of vehicles which are to be carried in each
vessel departure, telling the shipper five to six hours in advance. In the case of chartering trucks
or trains, the load to be carried has to be known in advance to avoid hiring an excess of
transportation capacity. Furthermore, since the goods are the transportation unit itself, the
problem of empty returns (as would happen in the case of road shipments by truck) is avoided.
Likewise, the use of vessels allows a better treatment of demand peaks, since having a bigger
capacity allows the competitiveness of the Supply Chain to be maintained, in terms of time, by
means of a system of priorities. Depending on the value of the transported goods, the shipper
might be willing to pay more in order to be guaranteed certain resilience in the accomplishment
of the sea link times.
3.5 Basic supply chain standards
What has been named as Basic Supply Chain Standards (BSCS) are the 8 basic distinct supply
chains that would be necessary to fit the characteristics from the demand, considering the relative
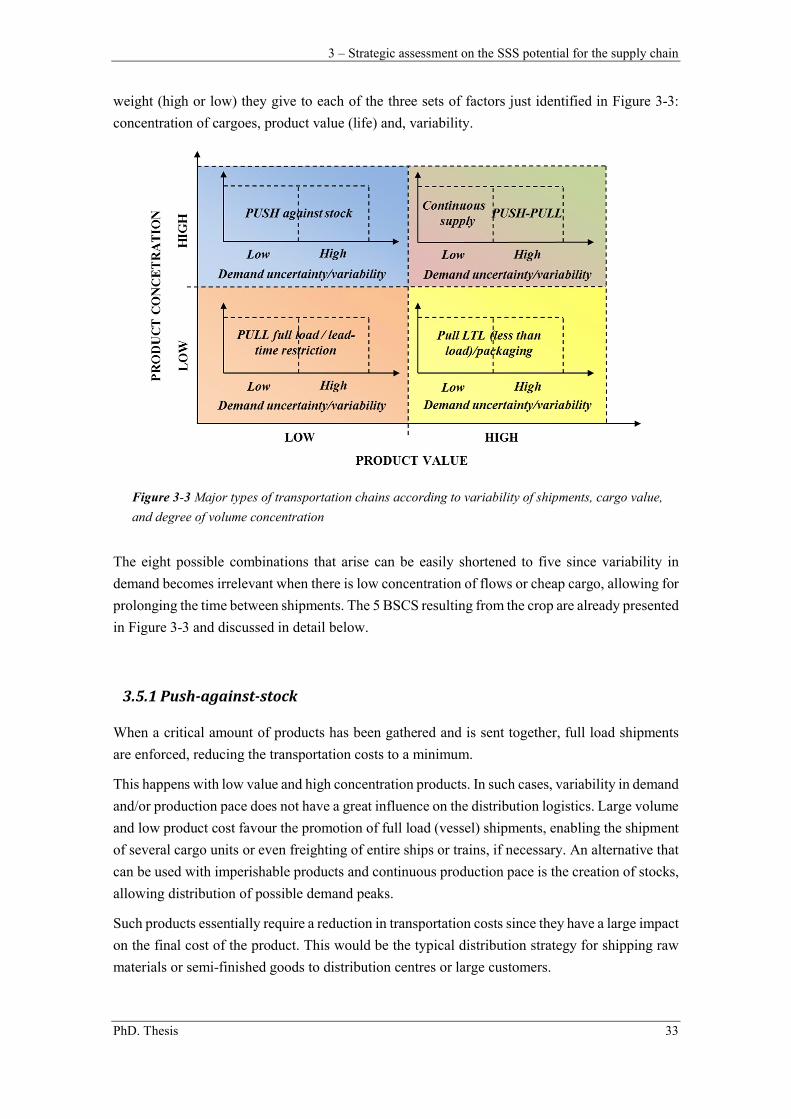
3 – Strategic assessment on the SSS potential for the supply chain
PhD. Thesis 33
weight (high or low) they give to each of the three sets of factors just identified in Figure 3-3:
concentration of cargoes, product value (life) and, variability.
Figure 3-3 Major types of transportation chains according to variability of shipments, cargo value,
and degree of volume concentration
The eight possible combinations that arise can be easily shortened to five since variability in
demand becomes irrelevant when there is low concentration of flows or cheap cargo, allowing for
prolonging the time between shipments. The 5 BSCS resulting from the crop are already presented
in Figure 3-3 and discussed in detail below.
3.5.1 Push-against-stock
When a critical amount of products has been gathered and is sent together, full load shipments
are enforced, reducing the transportation costs to a minimum.
This happens with low value and high concentration products. In such cases, variability in demand
and/or production pace does not have a great influence on the distribution logistics. Large volume
and low product cost favour the promotion of full load (vessel) shipments, enabling the shipment
of several cargo units or even freighting of entire ships or trains, if necessary. An alternative that
can be used with imperishable products and continuous production pace is the creation of stocks,
allowing distribution of possible demand peaks.
Such products essentially require a reduction in transportation costs since they have a large impact
on the final cost of the product. This would be the typical distribution strategy for shipping raw
materials or semi-finished goods to distribution centres or large customers.
RoRo terminals and truck freight. Improving competitiveness in a MoS context
34 P. Morales-Fusco (2016)
3.5.2 Continuous supply/just-in-time
This type of Supply Chain is advisable for cargoes with high added value, a high degree of
concentration of goods (large producers or cargo from multiple producers), and stable
demand/flow of goods. In such a scenario, reducing time and the degree of compliance (reliability
and resilience) take priority over reducing costs.
Expensive cargoes require lower idle times and stocks. However, the stability in flows allows
periodical shipments at full load even with the allocation of transportation equipment in
exclusivity due to the degree of cargo concentration.
This type of chain is used for shipping products from the consumer goods industry (textiles,
supermarkets) or high added value components with a sufficient concentration of production.
3.5.3 Push-pull
Chains of this kind play with the concept of postponement. Starting with a minimum of basic
(rather simple) products, the specialization/completion of the final product according to the
specific requirements of the client/charger can be left until the last stages of the production process
or even during the transportation of the goods. The customization of the final product can take
place in port areas, regional distributional centres, or even on board the ship. The moment when
the chain changes from push (production feeding regional depots or centres of goods
specialization) to pull (the final product, tailor-made, is sent in the shortest time possible) is
crucial for the global competitiveness of the distributional logistics of the product, reduction of
stocks, and achievement of competitive timing.
Push-pull is proposed for variable demands (or productions) with high product concentration and
high value of cargo. Instability may be due to issues of uncertainty in demand (rendering it
difficult to forecast transportation needs at the operational level) or seasonality (rendering it
difficult to retain regular transportation services).
The flow concentration generally allows fully loaded shipments, although the number of
transportation units per shipment may vary, making the sizing of the required fleet difficult, as
the demand cannot be distributed through stock due to the high opportunity costs. Therefore, there
is a tendency to count on operators that move large volumes of cargo from different shippers in
order for them to absorb the variability in flows as well as the risk it entails by compensating for
peaks and by making use of return voyages.
This type of chain is typical in the automotive and expensive consumer goods sectors whenever
the cargo to be transported accepts postponement. Additionally, the small carrier that serves as
spot demand or that chooses the transportation route at an operational level (without any possible
strategic planning) can be considered as another industrial sector using this kind of chain. In this
case, its features will become a product for this type of chain, due to the high value of the goods
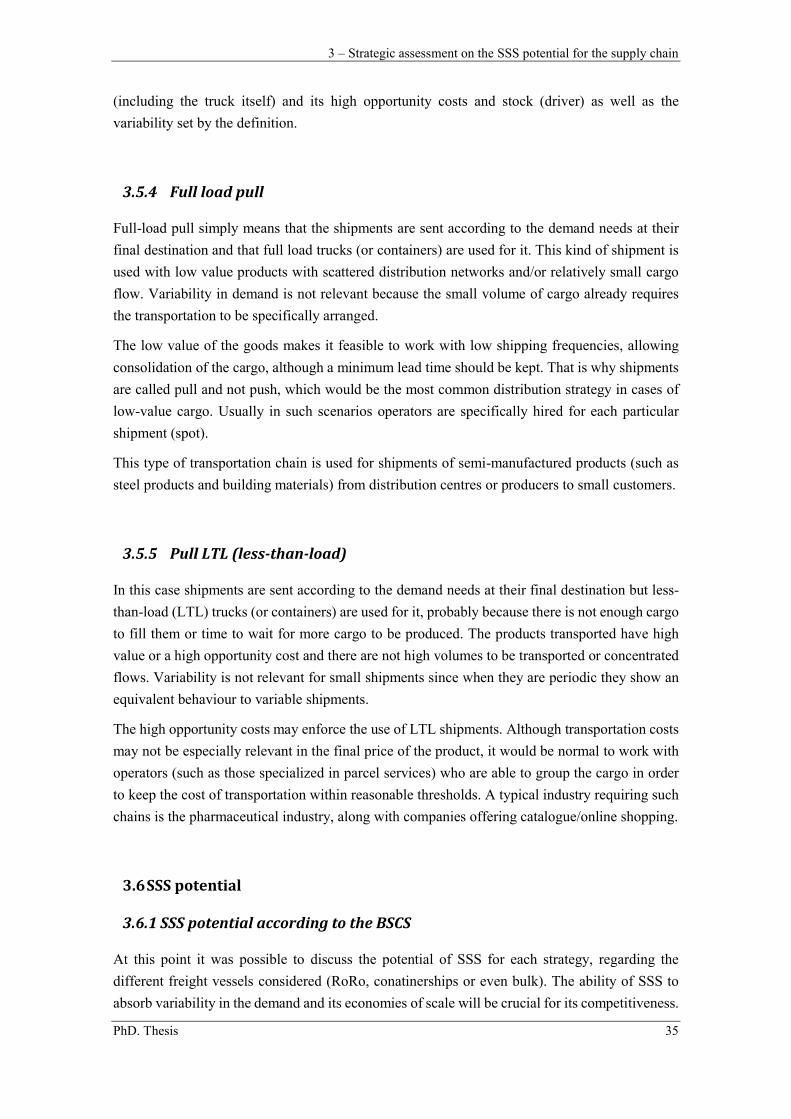
3 – Strategic assessment on the SSS potential for the supply chain
PhD. Thesis 35
(including the truck itself) and its high opportunity costs and stock (driver) as well as the
variability set by the definition.
3.5.4 Full load pull
Full-load pull simply means that the shipments are sent according to the demand needs at their
final destination and that full load trucks (or containers) are used for it. This kind of shipment is
used with low value products with scattered distribution networks and/or relatively small cargo
flow. Variability in demand is not relevant because the small volume of cargo already requires
the transportation to be specifically arranged.
The low value of the goods makes it feasible to work with low shipping frequencies, allowing
consolidation of the cargo, although a minimum lead time should be kept. That is why shipments
are called pull and not push, which would be the most common distribution strategy in cases of
low-value cargo. Usually in such scenarios operators are specifically hired for each particular
shipment (spot).
This type of transportation chain is used for shipments of semi-manufactured products (such as
steel products and building materials) from distribution centres or producers to small customers.
3.5.5 Pull LTL (less-than-load)
In this case shipments are sent according to the demand needs at their final destination but less-
than-load (LTL) trucks (or containers) are used for it, probably because there is not enough cargo
to fill them or time to wait for more cargo to be produced. The products transported have high
value or a high opportunity cost and there are not high volumes to be transported or concentrated
flows. Variability is not relevant for small shipments since when they are periodic they show an
equivalent behaviour to variable shipments.
The high opportunity costs may enforce the use of LTL shipments. Although transportation costs
may not be especially relevant in the final price of the product, it would be normal to work with
operators (such as those specialized in parcel services) who are able to group the cargo in order
to keep the cost of transportation within reasonable thresholds. A typical industry requiring such
chains is the pharmaceutical industry, along with companies offering catalogue/online shopping.
3.6 SSS potential
3.6.1 SSS potential according to the BSCS
At this point it was possible to discuss the potential of SSS for each strategy, regarding the
different freight vessels considered (RoRo, conatinerships or even bulk). The ability of SSS to
absorb variability in the demand and its economies of scale will be crucial for its competitiveness.
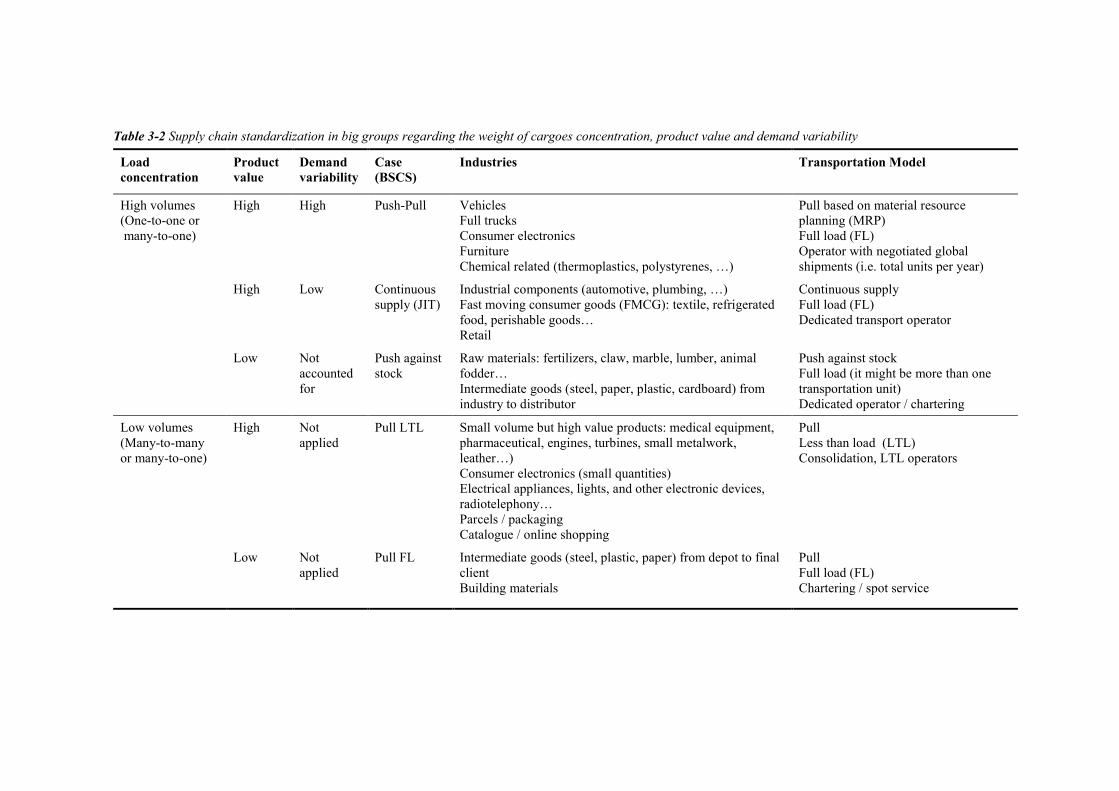
Table 3-2 Supply chain standardization in big groups regarding the weight of cargoes concentration, product value and demand variability
Load concentration
Product value
Demand variability
Case (BSCS)
Industries Transportation Model
High volumes (One-to-one or many-to-one)
High High Push-Pull Vehicles Full trucks Consumer electronics Furniture Chemical related (thermoplastics, polystyrenes, …)
Pull based on material resource planning (MRP) Full load (FL) Operator with negotiated global shipments (i.e. total units per year)
High Low Continuous supply (JIT)
Industrial components (automotive, plumbing, …) Fast moving consumer goods (FMCG): textile, refrigerated food, perishable goods… Retail
Continuous supply Full load (FL) Dedicated transport operator
Low Not accounted for
Push against stock
Raw materials: fertilizers, claw, marble, lumber, animal fodder… Intermediate goods (steel, paper, plastic, cardboard) from industry to distributor
Push against stock Full load (it might be more than one transportation unit) Dedicated operator / chartering
Low volumes (Many-to-many or many-to-one)
High Not applied
Pull LTL Small volume but high value products: medical equipment, pharmaceutical, engines, turbines, small metalwork, leather…) Consumer electronics (small quantities) Electrical appliances, lights, and other electronic devices, radiotelephony… Parcels / packaging Catalogue / online shopping
Pull Less than load (LTL) Consolidation, LTL operators
Low Not applied
Pull FL Intermediate goods (steel, plastic, paper) from depot to final client Building materials
Pull Full load (FL) Chartering / spot service
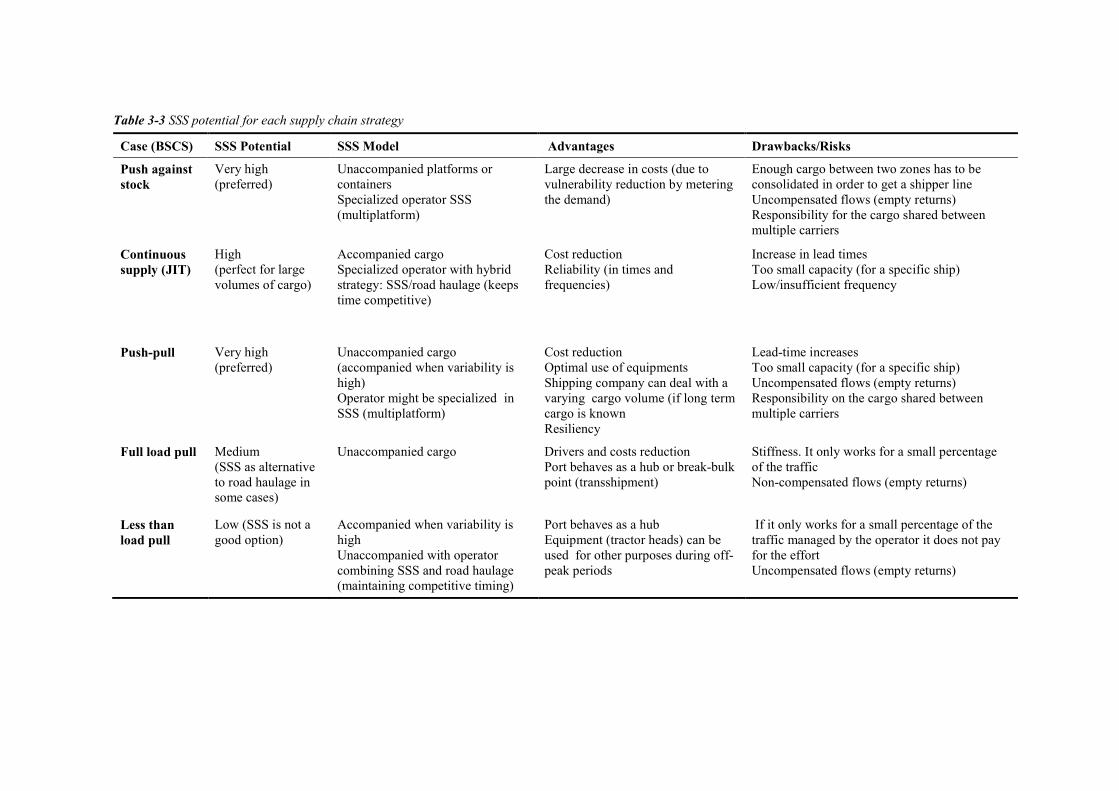
Table 3-3 SSS potential for each supply chain strategy
Case (BSCS) SSS Potential SSS Model Advantages Drawbacks/Risks
Push against stock
Very high (preferred)
Unaccompanied platforms or containers Specialized operator SSS (multiplatform)
Large decrease in costs (due to vulnerability reduction by metering the demand)
Enough cargo between two zones has to be consolidated in order to get a shipper line Uncompensated flows (empty returns) Responsibility for the cargo shared between multiple carriers
Continuous supply (JIT)
High (perfect for large volumes of cargo)
Accompanied cargo Specialized operator with hybrid strategy: SSS/road haulage (keeps time competitive)
Cost reduction Reliability (in times and frequencies)
Increase in lead times Too small capacity (for a specific ship) Low/insufficient frequency
Push-pull Very high (preferred)
Unaccompanied cargo (accompanied when variability is high) Operator might be specialized in SSS (multiplatform)
Cost reduction Optimal use of equipments Shipping company can deal with a varying cargo volume (if long term cargo is known Resiliency
Lead-time increases Too small capacity (for a specific ship) Uncompensated flows (empty returns) Responsibility on the cargo shared between multiple carriers
Full load pull Medium (SSS as alternative to road haulage in some cases)
Unaccompanied cargo Drivers and costs reduction Port behaves as a hub or break-bulk point (transshipment)
Stiffness. It only works for a small percentage of the traffic Non-compensated flows (empty returns)
Less than load pull
Low (SSS is not a good option)
Accompanied when variability is high Unaccompanied with operator combining SSS and road haulage (maintaining competitive timing)
Port behaves as a hub Equipment (tractor heads) can be used for other purposes during off-peak periods
If it only works for a small percentage of the traffic managed by the operator it does not pay for the effort Uncompensated flows (empty returns)
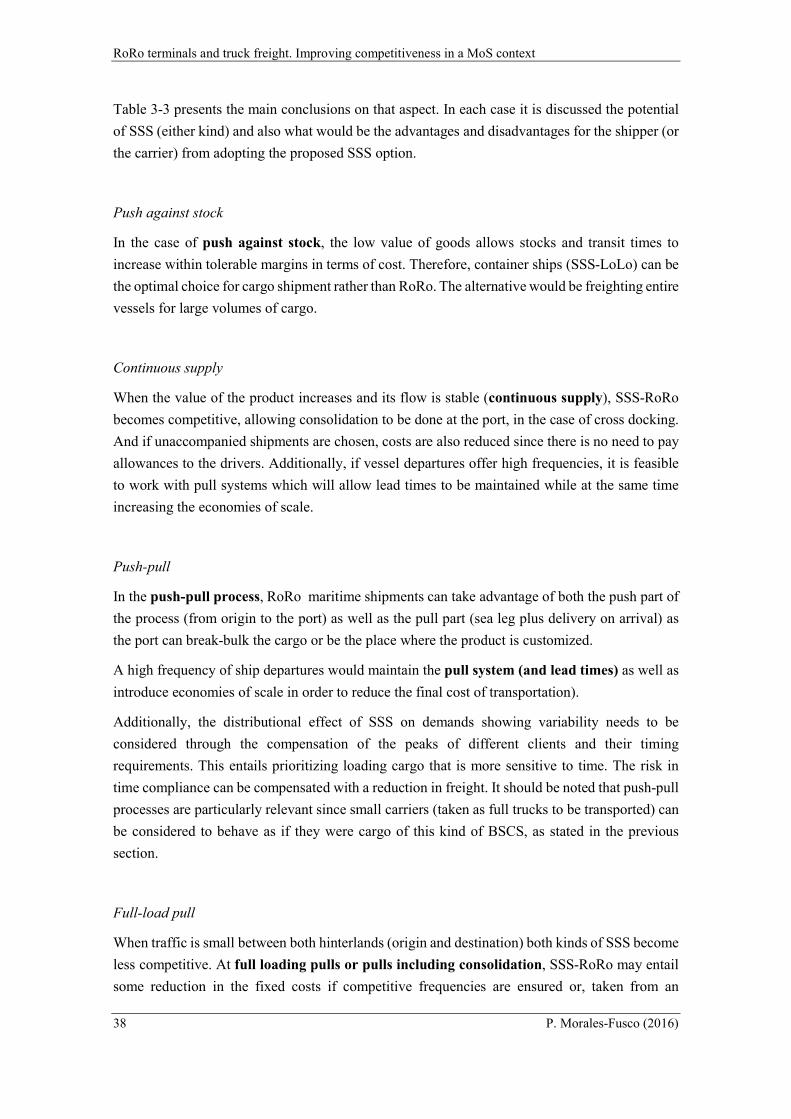
RoRo terminals and truck freight. Improving competitiveness in a MoS context
38 P. Morales-Fusco (2016)
Table 3-3 presents the main conclusions on that aspect. In each case it is discussed the potential
of SSS (either kind) and also what would be the advantages and disadvantages for the shipper (or
the carrier) from adopting the proposed SSS option.
Push against stock
In the case of push against stock, the low value of goods allows stocks and transit times to
increase within tolerable margins in terms of cost. Therefore, container ships (SSS-LoLo) can be
the optimal choice for cargo shipment rather than RoRo. The alternative would be freighting entire
vessels for large volumes of cargo.
Continuous supply
When the value of the product increases and its flow is stable (continuous supply), SSS-RoRo
becomes competitive, allowing consolidation to be done at the port, in the case of cross docking.
And if unaccompanied shipments are chosen, costs are also reduced since there is no need to pay
allowances to the drivers. Additionally, if vessel departures offer high frequencies, it is feasible
to work with pull systems which will allow lead times to be maintained while at the same time
increasing the economies of scale.
Push-pull
In the push-pull process, RoRo maritime shipments can take advantage of both the push part of
the process (from origin to the port) as well as the pull part (sea leg plus delivery on arrival) as
the port can break-bulk the cargo or be the place where the product is customized.
A high frequency of ship departures would maintain the pull system (and lead times) as well as
introduce economies of scale in order to reduce the final cost of transportation).
Additionally, the distributional effect of SSS on demands showing variability needs to be
considered through the compensation of the peaks of different clients and their timing
requirements. This entails prioritizing loading cargo that is more sensitive to time. The risk in
time compliance can be compensated with a reduction in freight. It should be noted that push-pull
processes are particularly relevant since small carriers (taken as full trucks to be transported) can
be considered to behave as if they were cargo of this kind of BSCS, as stated in the previous
section.
Full-load pull
When traffic is small between both hinterlands (origin and destination) both kinds of SSS become
less competitive. At full loading pulls or pulls including consolidation, SSS-RoRo may entail
some reduction in the fixed costs if competitive frequencies are ensured or, taken from an
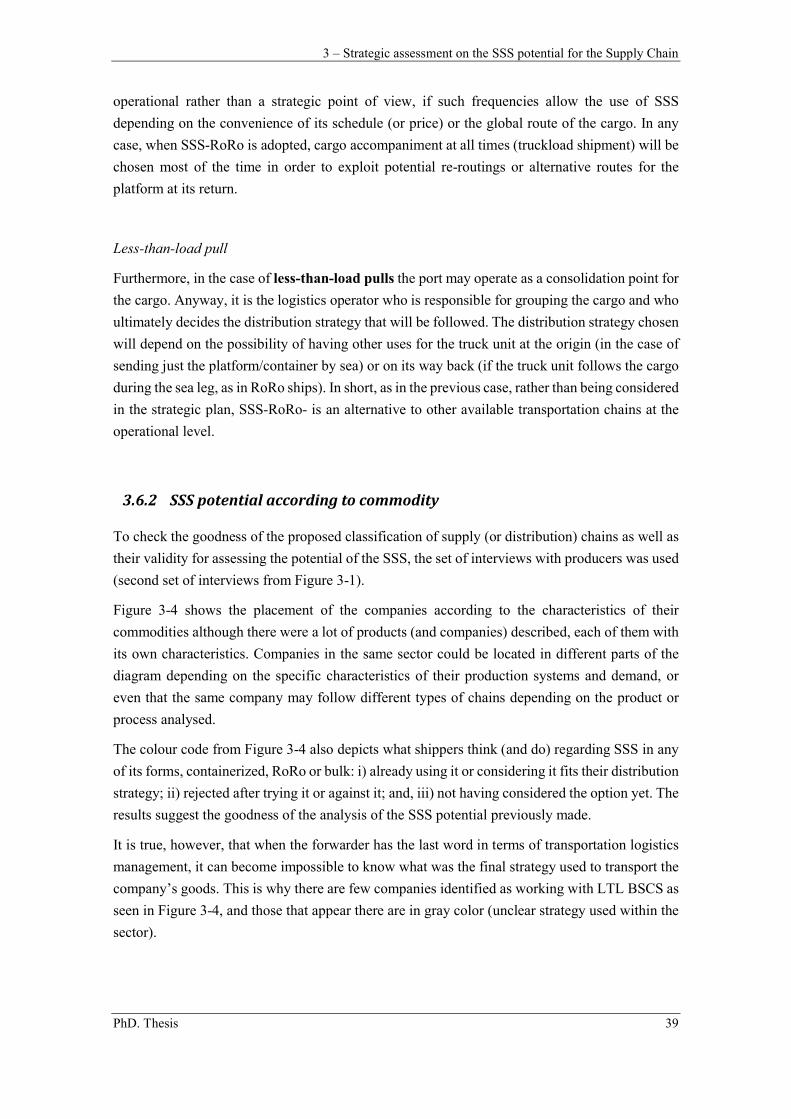
3 – Strategic assessment on the SSS potential for the Supply Chain
PhD. Thesis 39
operational rather than a strategic point of view, if such frequencies allow the use of SSS
depending on the convenience of its schedule (or price) or the global route of the cargo. In any
case, when SSS-RoRo is adopted, cargo accompaniment at all times (truckload shipment) will be
chosen most of the time in order to exploit potential re-routings or alternative routes for the
platform at its return.
Less-than-load pull
Furthermore, in the case of less-than-load pulls the port may operate as a consolidation point for
the cargo. Anyway, it is the logistics operator who is responsible for grouping the cargo and who
ultimately decides the distribution strategy that will be followed. The distribution strategy chosen
will depend on the possibility of having other uses for the truck unit at the origin (in the case of
sending just the platform/container by sea) or on its way back (if the truck unit follows the cargo
during the sea leg, as in RoRo ships). In short, as in the previous case, rather than being considered
in the strategic plan, SSS-RoRo- is an alternative to other available transportation chains at the
operational level.
3.6.2 SSS potential according to commodity
To check the goodness of the proposed classification of supply (or distribution) chains as well as
their validity for assessing the potential of the SSS, the set of interviews with producers was used
(second set of interviews from Figure 3-1).
Figure 3-4 shows the placement of the companies according to the characteristics of their
commodities although there were a lot of products (and companies) described, each of them with
its own characteristics. Companies in the same sector could be located in different parts of the
diagram depending on the specific characteristics of their production systems and demand, or
even that the same company may follow different types of chains depending on the product or
process analysed.
The colour code from Figure 3-4 also depicts what shippers think (and do) regarding SSS in any
of its forms, containerized, RoRo or bulk: i) already using it or considering it fits their distribution
strategy; ii) rejected after trying it or against it; and, iii) not having considered the option yet. The
results suggest the goodness of the analysis of the SSS potential previously made.
It is true, however, that when the forwarder has the last word in terms of transportation logistics
management, it can become impossible to know what was the final strategy used to transport the
company’s goods. This is why there are few companies identified as working with LTL BSCS as
seen in Figure 3-4, and those that appear there are in gray color (unclear strategy used within the
sector).
RoRo terminals and truck freight. Improving competitiveness in a MoS context
40 P. Morales-Fusco (2016)
Figure 3-4 Classification of companies of the survey and their potential to use SSS according to
commodity
3.7 Overview and conclusions
This chapter discusses the potential of SSS, either with container or RoRo ships, based on the
specific characteristics of demand, the production companies, and the products (goods
transported). The approach taken is strategic, regarding the requirements of the SC and not
considering the physical constraints of locations of origin and destination of the cargo moved.
The requirements have been reorganized in three main sets depending on the effect they have on:
i) the value of the product (and therefore time of transport); ii) the variability of shippings; and,
finally, iii) their size (allowing for economies of scale or not). Varying the relative weight (high
or low) allows defining five basic and distinct supply chain standards (BSCS): i) Push against
stock; ii) Continuous supply-JIT; iii) Push-Pull; iv) Full-load pull; and, v) Less-than-load pull.
Push against stock and push-pull seem to be the candidates that would benefit the most from the
inclusion of MoS in the shape of RoRo/RoPax vessels, as was later corroborated with data from
the interviews done.
3 – Strategic assessment on the SSS potential for the Supply Chain
PhD. Thesis 41
To summarize, the main conclusions at the end of this chapter are:
There are two strategic opportunities from using SSS: Greater economies of scale
than in road-haulage chains and more capacity to absorb demand variability
derived either from its seasonality or from the uncertainty in its behaviour. The
risk associated with demand variability can be moved from the carrier to the
shipping company, which, in turn, can reduce this risk by adding different
customers with different associated variability. Then, when there is high
concentration of supply chains, the shippers benefit from the economies of scale
in SSS and, if there is high variability or uncertainty in demand, the potential of
SSS becomes even higher.
Chains including SSS-RoRo are potentially competitive when there is a high
concentration of cargo and high or average opportunity costs related to the cargo. High
concentration and low costs are also likely to benefit from SSS but in the shape of
containerships as long as larger transit times are not a problem.
The analysis provided allows any Supply Chain organizers to assess if SSS might be
suitable for their needs at the strategic level –later on, the feasibility of each SSS Supply
Chain should be checked in the operational level in terms of cost and time-. Additionally,
the analysis can help shipping companies to identify potential customers and new
shipping lines as well as help policy makers to find out where to orientate their policies
promoting SSS (in any kind) to ensure the maximum impact possible.
Further research and discussion should be done on the relationship between the different
actors involved in the distribution logistics and how this may affect the way the distribution
decisions are made (and who makes them). The effect of possessing a pool of trucks have
been proved detrimental for SSS (at least in its containerized form) (Garcia-Menendez et al.,
2009) but some studies point that there is no bias towards one mean of transportation or other
depending on how decides the transportation policy, the owner or the forwarder (Bergantino
and Bolis, 2004). Further research should include scenarios where owners are shippers at the
same time or carriers are also operators, or any other combination.

RoRo terminals and truck freight. Improving competitiveness in a MoS context
42 P. Morales-Fusco (2016)
4 – Quality and Capacity in RoPax terminals
PhD. Thesis 43
4. Quality and Capacity in RoPax terminals
Chapter 4
Quality and Capacity in RoPax terminals
4.1 Introduction and chapter overview
Besides cost and time, qualitative aspects should also be considered when grading the
competitiveness of SSS services. From an operational point of view, these factors will mainly
depend on the performance of the terminal, a poor service will usually happen from lack of
development or specialization of the operations or whenever the terminal usage approaches its
nominal capacity.
It has been already settled in previous chapters that quality is one of the determinants to ensure
the competitiveness of SSS, especially when considering MoS links that compete to road haulage.
RoRo traffic has been increasing over the years and as result the number of dedicated terminals
too. However, port land is a limited resource, and an increase in the insensitivity of use of the
terminals can be expected as a result, likely resulting in congestion and a reduction of quality.
Capacity in general terms can be defined as a value representing the highest arrival flow the
terminal can handle while assuring a minimum level of quality of service, previously defined.
However, the final value will depend as well on the terminal’s features, the productivity of its
equipment, the demand patterns and some external factors (like weather conditions). In
conclusion, quality can be severely affected by the capacity restrictions of the terminal. Both
concepts, capacity and quality/level of service (LoS) should be studied together.
This is not the problem discussed here, since RoRo ships are usually accessed by the stern and
not laterally as containerships would. This chapter provides the study of the relationship between
number of arrivals and probability of an issue (congestion) to happen in a RoRo or RoPax
terminal. The amount of cargo to be loaded/unloaded is considered. Finally, the delays later
perceived by the end user of interest here in this case, the shipper of the cargo, are estimated.
The chapter will first introduce an overview of the physical processes taking place in a RoRo
terminal and to be considered when assessing its capacity. Afterwards, some thoughts on how to
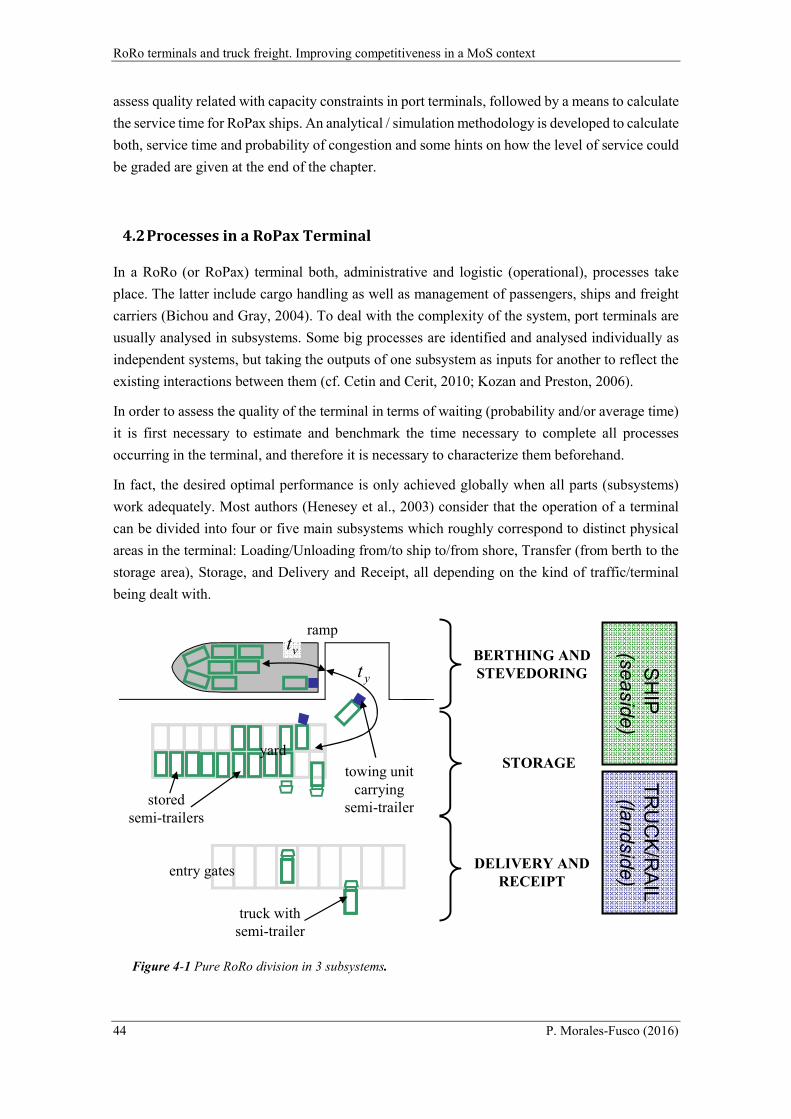
RoRo terminals and truck freight. Improving competitiveness in a MoS context
44 P. Morales-Fusco (2016)
assess quality related with capacity constraints in port terminals, followed by a means to calculate
the service time for RoPax ships. An analytical / simulation methodology is developed to calculate
both, service time and probability of congestion and some hints on how the level of service could
be graded are given at the end of the chapter.
4.2 Processes in a RoPax Terminal
In a RoRo (or RoPax) terminal both, administrative and logistic (operational), processes take
place. The latter include cargo handling as well as management of passengers, ships and freight
carriers (Bichou and Gray, 2004). To deal with the complexity of the system, port terminals are
usually analysed in subsystems. Some big processes are identified and analysed individually as
independent systems, but taking the outputs of one subsystem as inputs for another to reflect the
existing interactions between them (cf. Cetin and Cerit, 2010; Kozan and Preston, 2006).
In order to assess the quality of the terminal in terms of waiting (probability and/or average time)
it is first necessary to estimate and benchmark the time necessary to complete all processes
occurring in the terminal, and therefore it is necessary to characterize them beforehand.
In fact, the desired optimal performance is only achieved globally when all parts (subsystems)
work adequately. Most authors (Henesey et al., 2003) consider that the operation of a terminal
can be divided into four or five main subsystems which roughly correspond to distinct physical
areas in the terminal: Loading/Unloading from/to ship to/from shore, Transfer (from berth to the
storage area), Storage, and Delivery and Receipt, all depending on the kind of traffic/terminal
being dealt with.
Figure 4-1 Pure RoRo division in 3 subsystems.
DELIVERY AND RECEIPT
BERTHING AND STEVEDORING
STORAGE
entry gates
yard
ramp
truck withsemi-trailer
towing unit carrying
semi-trailerstored
semi-trailers
ytvt
SH
IP
(seaside)
TR
UC
K/R
AIL
(landside)
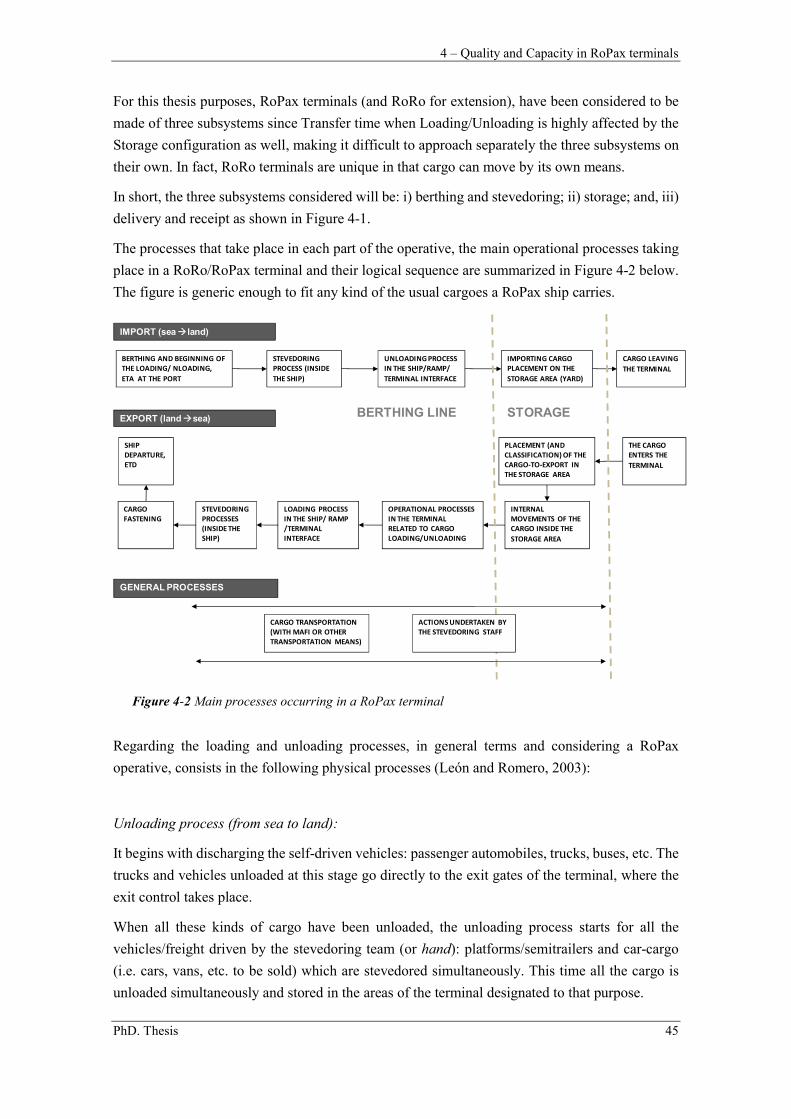
4 – Quality and Capacity in RoPax terminals
PhD. Thesis 45
For this thesis purposes, RoPax terminals (and RoRo for extension), have been considered to be
made of three subsystems since Transfer time when Loading/Unloading is highly affected by the
Storage configuration as well, making it difficult to approach separately the three subsystems on
their own. In fact, RoRo terminals are unique in that cargo can move by its own means.
In short, the three subsystems considered will be: i) berthing and stevedoring; ii) storage; and, iii)
delivery and receipt as shown in Figure 4-1.
The processes that take place in each part of the operative, the main operational processes taking
place in a RoRo/RoPax terminal and their logical sequence are summarized in Figure 4-2 below.
The figure is generic enough to fit any kind of the usual cargoes a RoPax ship carries.
Figure 4-2 Main processes occurring in a RoPax terminal
Regarding the loading and unloading processes, in general terms and considering a RoPax
operative, consists in the following physical processes (León and Romero, 2003):
Unloading process (from sea to land):
It begins with discharging the self-driven vehicles: passenger automobiles, trucks, buses, etc. The
trucks and vehicles unloaded at this stage go directly to the exit gates of the terminal, where the
exit control takes place.
When all these kinds of cargo have been unloaded, the unloading process starts for all the
vehicles/freight driven by the stevedoring team (or hand): platforms/semitrailers and car-cargo
(i.e. cars, vans, etc. to be sold) which are stevedored simultaneously. This time all the cargo is
unloaded simultaneously and stored in the areas of the terminal designated to that purpose.
IMPORT (sea land)
EXPORT (landsea)
SHIP DEPARTURE, ETD
CARGO FASTENING
THE CARGO ENTERS THE
TERMINAL
INTERNAL MOVEMENTS OF THE CARGO INSIDE THE
STORAGE AREA
PLACEMENT (AND CLASSIFICATION) OF THE CARGO-TO-EXPORT IN THE STORAGE AREA
OPERATIONAL PROCESSES IN THE TERMINAL RELATED TO CARGO LOADING/UNLOADING
LOADING PROCESS IN THE SHIP/ RAMP /TERMINAL INTERFACE
STEVEDORING PROCESSES (INSIDE THE SHIP)
BERTHING AND BEGINNING OF THE LOADING/ NLOADING,
ETA AT THE PORT
STEVEDORING PROCESS (INSIDE
THE SHIP)
UNLOADING PROCESS IN THE SHIP/RAMP/
TERMINAL INTERFACE
IMPORTING CARGO PLACEMENT ON THE
STORAGE AREA (YARD)
CARGO LEAVING
THE TERMINAL
BERTHING LINE STORAGE
CARGO TRANSPORTATION (WITH MAFI OR OTHER TRANSPORTATION MEANS)
ACTIONS UNDERTAKEN BY THE STEVEDORING STAFF
GENERAL PROCESSES
RoRo terminals and truck freight. Improving competitiveness in a MoS context
46 P. Morales-Fusco (2016)
Loading process (from land to sea):
Once the cargo arrives to the terminal, it is parked in the yard, waiting to be loaded on board. The
passengers on board may access through fingers or by means of the stern access gate. Stevedoring
is carried out according to the “Stevedoring Plan” which includes a “Cargo manifest” and a
“Cargo Plan”, both planned according to the cargo and the final destination of the cargo, whereas
there were hazardous materials, and the remaining ship calls.
Platforms and semitrailers are usually loaded first and simultaneously with the automobiles.
Immediately after the vehicles driven by their own drivers are loaded: passenger vehicles, trucks,
buses, etc. While waiting to be loaded, trucks and passenger vehicles are stored temporally in the
yard of the terminal: Trucks are organized in rows while cars are parked in blocks.
Besides the physical flows, there is a second circulation level corresponding to the information
flow. Additionally, in each level, it is possible to distinguish among the different transport
systems, cargo/stevedoring units, type of cargo and traffic (Henesey and Törnquist, 2002) and
depending on the direction of circulation: sea to land (import) from land to sea (export). In RoPax
terminals three main cargo types can be found: full trucks, platforms without tractor capacity and
automobiles. This three kinds of cargo are combined with a fourth one: passengers and their
private vehicles. Each kind of cargo has its own processes chain.
4.3 Quality, capacity, congestion and performance indicators, overview of
the existing literature
An approach to the role of quality in the competitiveness of SSS and MoS, regarding drivers
behind the mode shift from road to sea, has already been discussed in the literature review from
the previous chapter (chapter 3). In that context, reliability is important especially when dealing
with regular services, i.e. with a set schedule (Batley, 2007), which would be the case for MoS
lines. The literature does not seem to agree on whether SSS is reliable or not, since according to
some, reliability is an advantage of the MoS (Tenekecioglu, 2005) despite being seen as a
weakness when comparing SSS with road haulage (Feo et al., 2011; Medda and Trujillo, 2010).
The literature here provided, complements the literature from the previous chapter towards how
studies to quantify the reliability in maritime terminals, and more specifically on the relationship
between capacity, congestion and performance and the means to measure them before entering
into the approach taken to consider them in this chapter.
4.3.1 Indicators to assess congestion
The typical congestion indicators found thorough the specialized literature of maritime terminals
are in the form of waiting time over service time (W/S), berth occupancy rate and total turnaround
time - and its two components, service (berthing) time and waiting time-, among others. In all
4 – Quality and Capacity in RoPax terminals
PhD. Thesis 47
cases considering both, average values and their probability distribution function (pdf) (Dragović
et al., 2005; Henesey and Törnquist, 2002; Huynh and Walton, 2005).
Waiting time over service time ratio (W/S) is in fact a performance indicator found in a broad
range of papers, from Fourgeaud (2000) to the UNCTAD (2006) indicators. It expresses the idea
that ships with less cargo to discharge cannot afford waiting as long as ships which may have
several times more cargo. This approach, although, omitted by most of the literature could also
be easily applied to the “other” users of the terminal, the truckers and include, implicitly, the value
of time for the cargo owner or transporter, since congestion at the land access is a common issue
also (Parola and Sciomachen, 2009). W/S as indicator, however, can be misleading since its value
increases as the turnaround time for a ship in port decreases, due to, for instance, a better
performance of the terminal operative.
Berth occupancy rate, in turn, is commonly used as a means to express the degree of congestion
a specific terminal is facing. Usually, a maximum waiting probability is given, from which the
maximum berth occupancy can be obtained by means of either simulation or simplified queuing
problems (Bassan, 2007).. However, those numbers depend as well on the terminal typology
whether bulk, container (the most studied kind) or RoRo, the arrivals traffic pattern, the number
of berthing points and the service time as well as the maximum waiting time allowed (Agerschou,
2004; Fourgeaud, 2000) and, therefore, cannot define quality without help of any other indicators.
Average dwelling (or turnaround) time spent at the terminal is an indicator easier for the terminal
customers to understand, especially if it is considered that internalizes possible unexpected
unplanned delays. At the same time it can be decomposed in service plus waiting time, being the
first term related to the terminal’s performance while waiting depends on service time (in both,
average value and pdf) as well as the occupancy the terminal faces. In that sense Ballis (2004),
following the conclusions drawn by the project IQ by the European Commission (Mathonnet,
2000) lists waiting time as one of the main indicators to value intermodal terminals. However,
due to arrivals pattern for RoRo terminals probability of having to wait will be chosen as a more
easy to obtain value as it will be stated in the methodology section of this chapter.
4.3.2 The arrival pattern
Waiting time and therefore, turnaround time, are critically affected by the arrivals pattern as well
as unexpected events that might arise due to a lacking terminal operation. The later issue will be
studied, in fact in the following chapter whereas the arrival pattern has been widely studied in the
literature, although for bulk and containerships. Most models for ports consider ship arrivals with
the shape of pdf’s from the Erlang family (Aspereren et al. 2005; Fourgeaud, 2000). and usually
being considered Poisson arrival processes (Erlang 1) (Dragovic et al. 2006; Productivity
Comission, 1998), and thus, completely random, they are even used to simulate arrivals planned
beforehand like in the research from Dragovic et al. (2006) or the Commonwealth of Australia
(Productivity Comission, 1998). Finally, some other authors use series of recorded values in their
simulations of terminals operations like Dai, et al. (2008) or Murty et al. (2005).
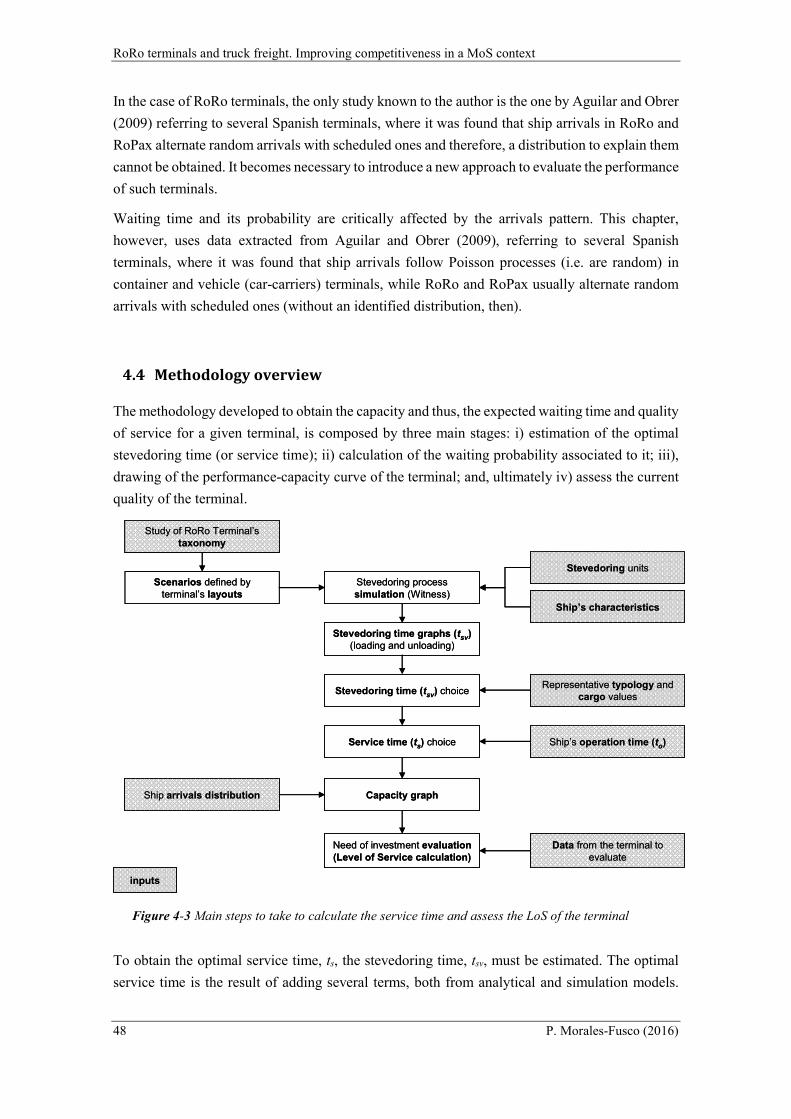
RoRo terminals and truck freight. Improving competitiveness in a MoS context
48 P. Morales-Fusco (2016)
In the case of RoRo terminals, the only study known to the author is the one by Aguilar and Obrer
(2009) referring to several Spanish terminals, where it was found that ship arrivals in RoRo and
RoPax alternate random arrivals with scheduled ones and therefore, a distribution to explain them
cannot be obtained. It becomes necessary to introduce a new approach to evaluate the performance
of such terminals.
Waiting time and its probability are critically affected by the arrivals pattern. This chapter,
however, uses data extracted from Aguilar and Obrer (2009), referring to several Spanish
terminals, where it was found that ship arrivals follow Poisson processes (i.e. are random) in
container and vehicle (car-carriers) terminals, while RoRo and RoPax usually alternate random
arrivals with scheduled ones (without an identified distribution, then).
4.4 Methodology overview
The methodology developed to obtain the capacity and thus, the expected waiting time and quality
of service for a given terminal, is composed by three main stages: i) estimation of the optimal
stevedoring time (or service time); ii) calculation of the waiting probability associated to it; iii),
drawing of the performance-capacity curve of the terminal; and, ultimately iv) assess the current
quality of the terminal.
Figure 4-3 Main steps to take to calculate the service time and assess the LoS of the terminal
To obtain the optimal service time, ts, the stevedoring time, tsv, must be estimated. The optimal
service time is the result of adding several terms, both from analytical and simulation models.
Study of RoRo Terminal’s taxonomy
Scenarios defined by terminal’s layouts
Stevedoring process simulation (Witness)
Stevedoring time graphs (tsv)(loading and unloading)
Stevedoring time (tsv) choice
Ship’s operation time (to)
Need of investment evaluation(Level of Service calculation)
Ship arrivals distribution
Data from the terminal to evaluate
Stevedoring units
Ship’s characteristics
Representative typology and cargo values
Service time (ts) choice
Capacity graph
inputs
4 – Quality and Capacity in RoPax terminals
PhD. Thesis 49
Special emphasis has to be put when studying the semi-trailers stevedoring process since they are
the most time-consuming units to stevedore.
Considering that terminals behave as a typical queuing problem where ships are the arriving
customers and the mooring points available at a time are the servers, either the average waiting
time, tw or the probability to have to wait can be calculated depending on the behaviour of the
ship arrivals. Figure 4-3 provides the main steps followed to calculate the service time, first, and
the Level of Service of the terminal.
4.5 Optimal service time estimation
Service time (ts) is defined as the amount of time the ship occupies the berth. It includes
(un)berthing, (un)loading, and other operations the ship does in each scale in port such as ramp
lowering and berth approaching manoeuvres. Service time has been split in operation time (to)
and stevedoring time (tsv), being the first of them the time to undertake all the operations but
(un)loading the ship and the second the time to approach the berth, berthing and mooring plus the
time to lower the ramps.
s o svt t t (4-1)
4.5.1 Vessel operation time
Vessel operation time includes all the time a berth is used by a specific ship but the time spent in
stevedoring. That is, twice the time the ship spends to enter the harbour from its waiting
(anchoring) point, taken as the time from the moment in which the harbour pilot reaches the ship
until the moment it is properly moored plus the time spent in lowering the ramps.
The time spent from the entrance of the ship in harbor to its anchoring point can be easily obtained
from data from the harbor pilot, since this time can be assumed to last from the moment the pilot
enters the ship until the moment the ship is moored. Additionally it can be obtained after the
maximum velocity specifications set by the correspondent port authority and the distance to be
travelled in port, from the point of access to the mooring point.
To that time it should be added the time to lower/upload the vessel ramps. Ships usually have a
rising/lowering hydraulic system common for all the ramps in ship, which can only handle one
ramp at a time. In consequence, there will be a factor proportional to the number of ramps as well.
In the case of Barcelona and other Spanish ports RoRo terminals to has been estimated with (4-
2). The formula considers current regulations on ship speed inside port, the number of ramps to
be opened, R, the distance to be travelled (in nautical miles) from the port entry to the final
mooring dock, d, plus a constant to account for mooring and deceleration and berth approximation
and departure maneuverers.
RoRo terminals and truck freight. Improving competitiveness in a MoS context
50 P. Morales-Fusco (2016)
20· 6· 20ot d R (4-2)
Table 4-1 provides the distances and the resulting calculus of vessel operation time for several
Spanish RoRo terminals.
Table 4-1 Vessel operation times for some selected Spanish terminals
Barcelona (Port Nou)
Valencia (RoRo terminal)
Cádiz (Marqués de Comillas)
Vigo (Bouzas)
d (nautical miles) 3 1,2 0,75 0,15
to (min) 80 + 3R 43 + 3R 36 + 3R 24 + 3R
4.5.2 Stevedoring time
Stevedoring time stands as the larger parameter in the service time calculation. In order to estimate
it, Camarero and Polo (2005) proposed a linear relationship between the ship capacity (its lane
meters) and the time needed to load and unload once in the RoRo terminal, depending on the type
of cargo. Initially such an approach seams adequate for self-driven cargo (i.e. trucks and passenger
vehicles) but highly simplifying for cargo carried around by stevedoring teams, since it considers
neither the increase in distance due to a bigger amount of cargo nor the influence of the different
possible terminal layouts.
There are more specific tools (López Piñeiro et al., 2005) to estimate the total amount of time
necessary to (un)load a ship depending on its size, distribution and cargo (volume and
composition), but those only take into account the “ship part” in the stevedoring process and are
specifically constructed for a single ship configuration.
Since stevedoring operations are mainly sequential, stevedoring time is calculated by adding the
stevedoring times for each of the 4 cargoes types that can be transported in RoPax vessels: full
trucks (tt), semi-trailers (i.e. trucks lacking their tractor unit) (tst), passenger vehicles (tp) and
vehicles as freight cargo referred to as car-cargo from now onwards (tcc) as expressed in (4-3).
Figure 4-4 reflects such sequence.
max( , )t p st st cc ccsv y v y vt t t t t t t (4-3)
Self-loading units, passenger vehicles and trucks, are considered to be linear with the capacity of
the ramps of the vessel and happen sequentially. However, units driven by the stevedoring crew,
semi-trailers and car-cargo are considered to be stevedored at the same time. Therefore, the
maximum of both values is taken (4-3). Potential disruptions between the car-cargo and semi-
trailers stevedoring process have been neglected since both kinds of cargo are usually stocked
separately in the yard and at different decks within the ship. Therefore, both stevedoring times
are calculated separately and then the higher of the two is to taken.

4 – Quality and Capacity in RoPax terminals
PhD. Thesis 51
Figure 4-4 Kinds of cargo to be transported (and stevedored) in a RoPax vessel
Car-cargo and semi-trailers times are expressed in (4-3) as an addition of two different terms: ship
or vessel time (tv) and yard time (ty) being the amount of time necessary to move the cargo from
within the ship to the ramp and from the ramp to the yard, respectively. This approach is taken to
allow to consider the different ship’s physical characteristics and separate them from the effect of
the yard configuration. The fact that the tug units work simultaneously will not affect the final
number obtained: adding the time to load all semitrailers and dividing it by the number of towing
units will equal the (un)loading time.
4.5.3 Full trucks and passenger vehicles times
The time to load and unload self-stevedoring units (trucks and passenger vehicles) can be assumed
to follow a linear distribution if there is not to be affectation, because of yard congestion, to the
ramp operative, since it is a uniform process. Equations (4-4) and (4-5) provide a deterministic
way to calculate them.
taf
tut
u
tlt
l
t tnnt
11 (4-4)
plp
l
pup
u
p nnt
11 (4-5)
Where μ stands for the number of vehicles (p) and trucks (t) that can be either loaded (l) or
unloaded (u) in a time unit and n stands as the number of units (ITU) to be either loaded or
unloaded (depending on the subscript) of each kind.
The μ values are highly dependent on the amount of ship ramps, their distribution within the ship
and on the terminal’s facilities, (e.g. a set of lanes built in an upper level allowing accessing the
RoRo terminals and truck freight. Improving competitiveness in a MoS context
52 P. Morales-Fusco (2016)
ship at two different decks at the same time and/or (un)loading at two different stories of the
terminal).
The field observations made for this study in Barcelona’s port terminal provided values of 60-90
trucks/hour when loading and around 120-150 trucks per hour when unloading, whereas
passenger vehicles ranged from 120 and 180 veh/hour. The values are of the same order of
magnitude than the ones given by Camarero and Polo (2005): (100 trucks/hour).
Additionally, ttaf, is understood as the stevedoring overtime due to an inadequate capacity at the
terminal’s gates combined with a lack of capacity in the terminal’s vials. Considering, again, a
uniform and deterministic behaviour, the value can be easily calculated given the flow capacity
of the gates of the terminal μg and the capacity of the circulating lanes within the terminal, L, as
pointed in (4-6):
tut
u
tu
g
taf nLnt
11 (4-6)
4.5.4 Semi-trailer (platform) times
Semi-trailers and car-cargo usually are stevedored simultaneously. Differently from self-driven
cargo, where the main limitation where the number of units to load, for unaccompanied cargo, the
number of stevedoring units –hands- will also be a performance limiter, together with the average
distance from yard to ship, the ship and yard configurations, the number of ramps and, ultimately
possible congestion problems.
For simplifying purposes, congestion between both flows (semi-trailers and car-cargo) will be
neglected. In fact, theses kind of cargoes usually are stocked separately both, inside (different
decks) and outside the ship and use different hands for their stowage. Therefore, assuming that
the affectation between car-cargo and semi-trailers is minimal, both times can be calculated
separately and then keep the maximum value of the two as the limiting one.
The semi-trailers ship time (tvst) and its variability have to be calculated for each kind of ship
berthing at the terminal. RoRo and RoPax ships from MoS lines are usually the same; therefore
this time value can be obtained for the few vessels working with the studied terminal doing some
field work.
The time every single tug unit spends inside the ship, tvm, has been assumed to follow a normal
pdf, to be able to approximate the overall tvst as a sum of normal distributions, resulting in the
normal distribution from (4-7).
2
2)(
,)(
m
stl
stu
mv
m
stl
stu
mvst
v
n
nn
n
nntNt
(4-7)
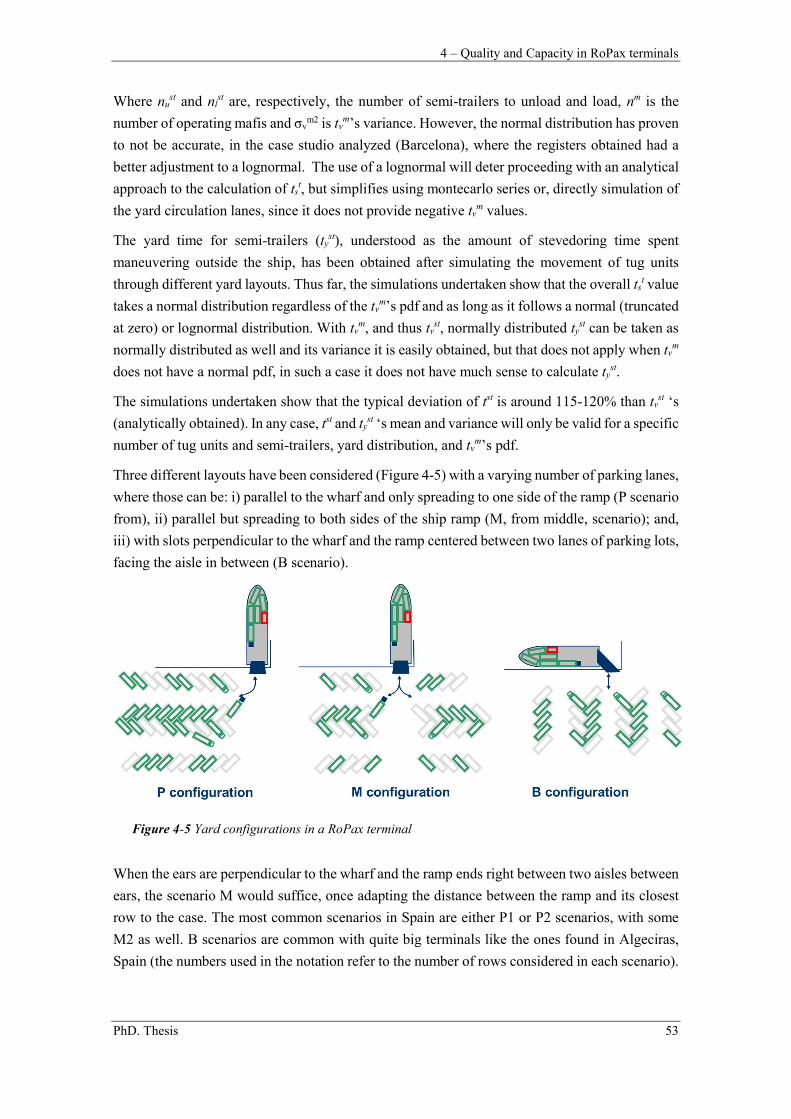
4 – Quality and Capacity in RoPax terminals
PhD. Thesis 53
Where nust and nl
st are, respectively, the number of semi-trailers to unload and load, nm is the
number of operating mafis and σvm2 is tv
m’s variance. However, the normal distribution has proven
to not be accurate, in the case studio analyzed (Barcelona), where the registers obtained had a
better adjustment to a lognormal. The use of a lognormal will deter proceeding with an analytical
approach to the calculation of tst, but simplifies using montecarlo series or, directly simulation of
the yard circulation lanes, since it does not provide negative tvm values.
The yard time for semi-trailers (tyst), understood as the amount of stevedoring time spent
maneuvering outside the ship, has been obtained after simulating the movement of tug units
through different yard layouts. Thus far, the simulations undertaken show that the overall tst value
takes a normal distribution regardless of the tvm’s pdf and as long as it follows a normal (truncated
at zero) or lognormal distribution. With tvm, and thus tv
st, normally distributed tyst can be taken as
normally distributed as well and its variance it is easily obtained, but that does not apply when tvm
does not have a normal pdf, in such a case it does not have much sense to calculate tyst.
The simulations undertaken show that the typical deviation of tst is around 115-120% than tvst ‘s
(analytically obtained). In any case, tst and tyst ‘s mean and variance will only be valid for a specific
number of tug units and semi-trailers, yard distribution, and tvm’s pdf.
Three different layouts have been considered (Figure 4-5) with a varying number of parking lanes,
where those can be: i) parallel to the wharf and only spreading to one side of the ramp (P scenario
from), ii) parallel but spreading to both sides of the ship ramp (M, from middle, scenario); and,
iii) with slots perpendicular to the wharf and the ramp centered between two lanes of parking lots,
facing the aisle in between (B scenario).
Figure 4-5 Yard configurations in a RoPax terminal
When the ears are perpendicular to the wharf and the ramp ends right between two aisles between
ears, the scenario M would suffice, once adapting the distance between the ramp and its closest
row to the case. The most common scenarios in Spain are either P1 or P2 scenarios, with some
M2 as well. B scenarios are common with quite big terminals like the ones found in Algeciras,
Spain (the numbers used in the notation refer to the number of rows considered in each scenario).
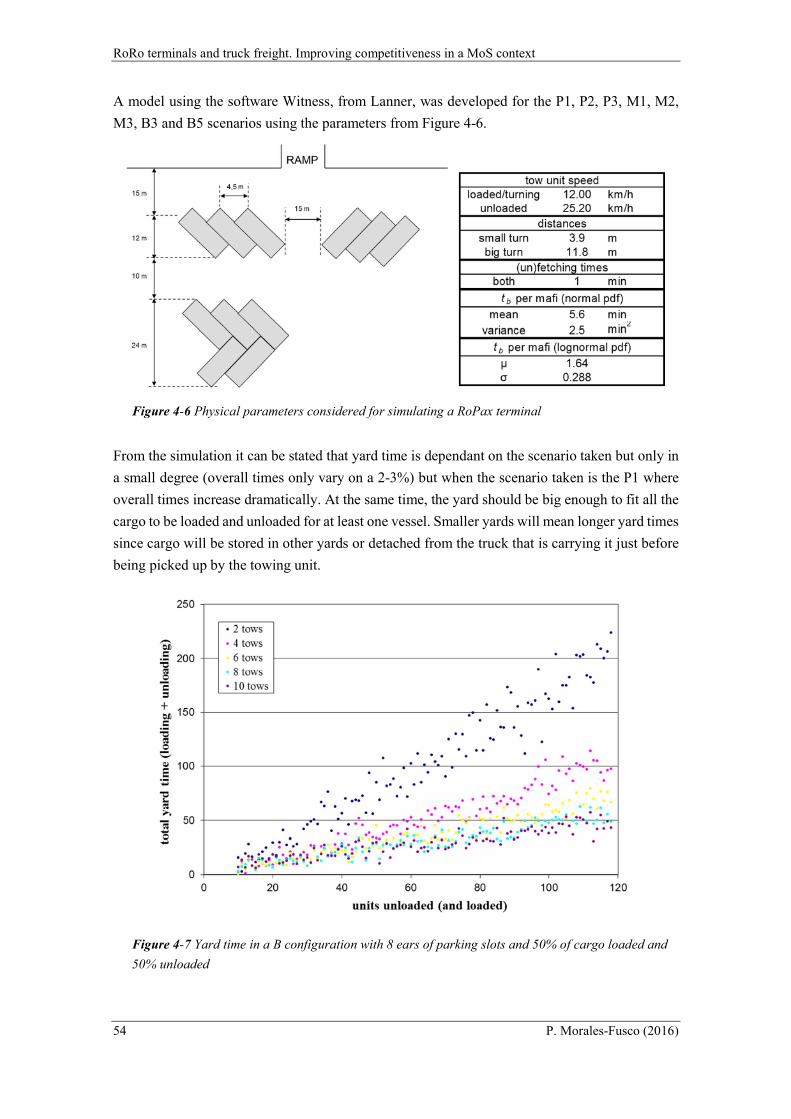
RoRo terminals and truck freight. Improving competitiveness in a MoS context
54 P. Morales-Fusco (2016)
A model using the software Witness, from Lanner, was developed for the P1, P2, P3, M1, M2,
M3, B3 and B5 scenarios using the parameters from Figure 4-6.
Figure 4-6 Physical parameters considered for simulating a RoPax terminal
From the simulation it can be stated that yard time is dependant on the scenario taken but only in
a small degree (overall times only vary on a 2-3%) but when the scenario taken is the P1 where
overall times increase dramatically. At the same time, the yard should be big enough to fit all the
cargo to be loaded and unloaded for at least one vessel. Smaller yards will mean longer yard times
since cargo will be stored in other yards or detached from the truck that is carrying it just before
being picked up by the towing unit.
Figure 4-7 Yard time in a B configuration with 8 ears of parking slots and 50% of cargo loaded and
50% unloaded
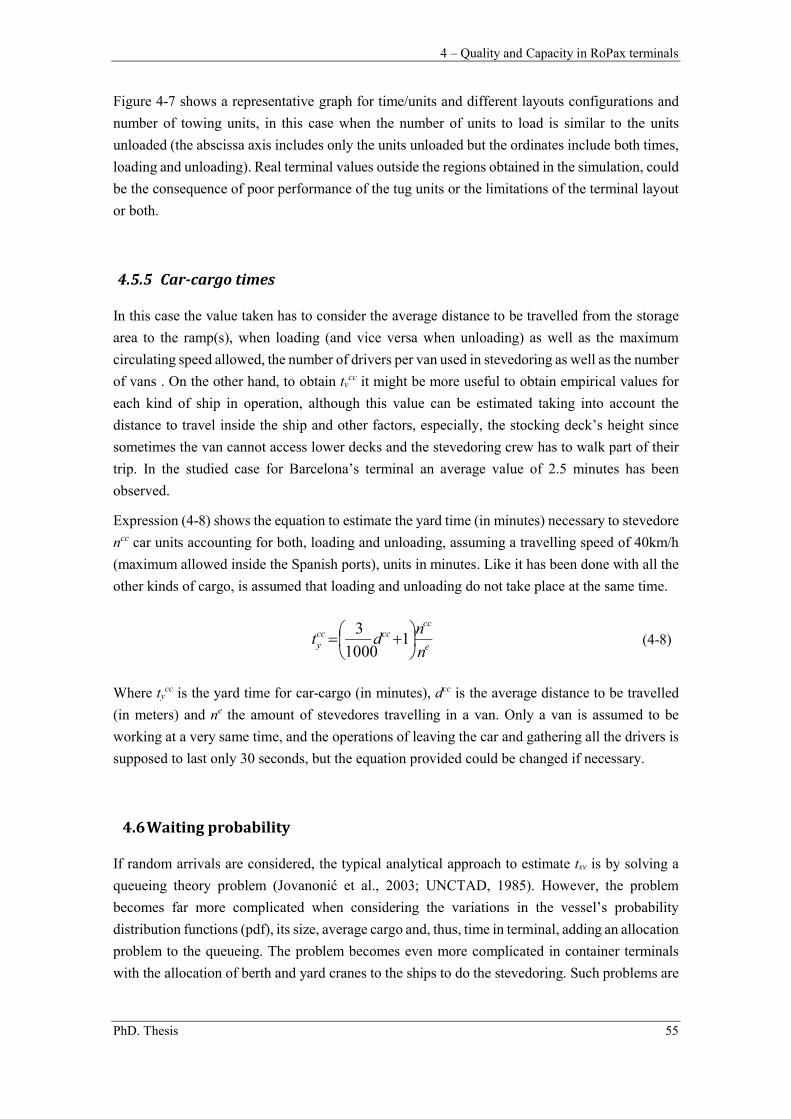
4 – Quality and Capacity in RoPax terminals
PhD. Thesis 55
Figure 4-7 shows a representative graph for time/units and different layouts configurations and
number of towing units, in this case when the number of units to load is similar to the units
unloaded (the abscissa axis includes only the units unloaded but the ordinates include both times,
loading and unloading). Real terminal values outside the regions obtained in the simulation, could
be the consequence of poor performance of the tug units or the limitations of the terminal layout
or both.
4.5.5 Car-cargo times
In this case the value taken has to consider the average distance to be travelled from the storage
area to the ramp(s), when loading (and vice versa when unloading) as well as the maximum
circulating speed allowed, the number of drivers per van used in stevedoring as well as the number
of vans . On the other hand, to obtain tvcc it might be more useful to obtain empirical values for
each kind of ship in operation, although this value can be estimated taking into account the
distance to travel inside the ship and other factors, especially, the stocking deck’s height since
sometimes the van cannot access lower decks and the stevedoring crew has to walk part of their
trip. In the studied case for Barcelona’s terminal an average value of 2.5 minutes has been
observed.
Expression (4-8) shows the equation to estimate the yard time (in minutes) necessary to stevedore
ncc car units accounting for both, loading and unloading, assuming a travelling speed of 40km/h
(maximum allowed inside the Spanish ports), units in minutes. Like it has been done with all the
other kinds of cargo, is assumed that loading and unloading do not take place at the same time.
e
cccccc
yn
ndt
1
1000
3 (4-8)
Where tycc is the yard time for car-cargo (in minutes), dcc is the average distance to be travelled
(in meters) and ne the amount of stevedores travelling in a van. Only a van is assumed to be
working at a very same time, and the operations of leaving the car and gathering all the drivers is
supposed to last only 30 seconds, but the equation provided could be changed if necessary.
4.6 Waiting probability
If random arrivals are considered, the typical analytical approach to estimate tsv is by solving a
queueing theory problem (Jovanonić et al., 2003; UNCTAD, 1985). However, the problem
becomes far more complicated when considering the variations in the vessel’s probability
distribution functions (pdf), its size, average cargo and, thus, time in terminal, adding an allocation
problem to the queueing. The problem becomes even more complicated in container terminals
with the allocation of berth and yard cranes to the ships to do the stevedoring. Such problems are
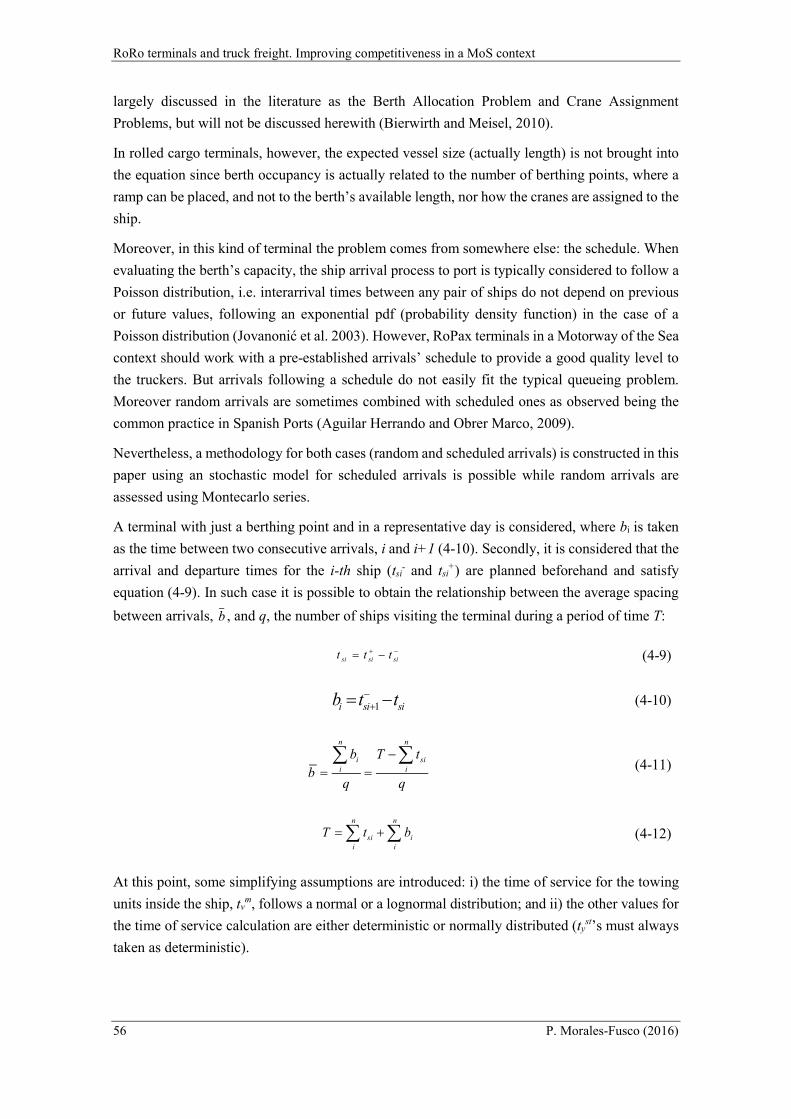
RoRo terminals and truck freight. Improving competitiveness in a MoS context
56 P. Morales-Fusco (2016)
largely discussed in the literature as the Berth Allocation Problem and Crane Assignment
Problems, but will not be discussed herewith (Bierwirth and Meisel, 2010).
In rolled cargo terminals, however, the expected vessel size (actually length) is not brought into
the equation since berth occupancy is actually related to the number of berthing points, where a
ramp can be placed, and not to the berth’s available length, nor how the cranes are assigned to the
ship.
Moreover, in this kind of terminal the problem comes from somewhere else: the schedule. When
evaluating the berth’s capacity, the ship arrival process to port is typically considered to follow a
Poisson distribution, i.e. interarrival times between any pair of ships do not depend on previous
or future values, following an exponential pdf (probability density function) in the case of a
Poisson distribution (Jovanonić et al. 2003). However, RoPax terminals in a Motorway of the Sea
context should work with a pre-established arrivals’ schedule to provide a good quality level to
the truckers. But arrivals following a schedule do not easily fit the typical queueing problem.
Moreover random arrivals are sometimes combined with scheduled ones as observed being the
common practice in Spanish Ports (Aguilar Herrando and Obrer Marco, 2009).
Nevertheless, a methodology for both cases (random and scheduled arrivals) is constructed in this
paper using an stochastic model for scheduled arrivals is possible while random arrivals are
assessed using Montecarlo series.
A terminal with just a berthing point and in a representative day is considered, where bi is taken
as the time between two consecutive arrivals, i and i+1 (4-10). Secondly, it is considered that the
arrival and departure times for the i-th ship (tsi- and tsi
+) are planned beforehand and satisfy
equation (4-9). In such case it is possible to obtain the relationship between the average spacing
between arrivals, b , and q, the number of ships visiting the terminal during a period of time T:
sisisi ttt (4-9)
1i si sib t t (4-10)
n n
i sii i
b T t
bq q
(4-11)
n n
si ii i
T t b (4-12)
At this point, some simplifying assumptions are introduced: i) the time of service for the towing
units inside the ship, tvm, follows a normal or a lognormal distribution; and ii) the other values for
the time of service calculation are either deterministic or normally distributed (tyst’s must always
taken as deterministic).
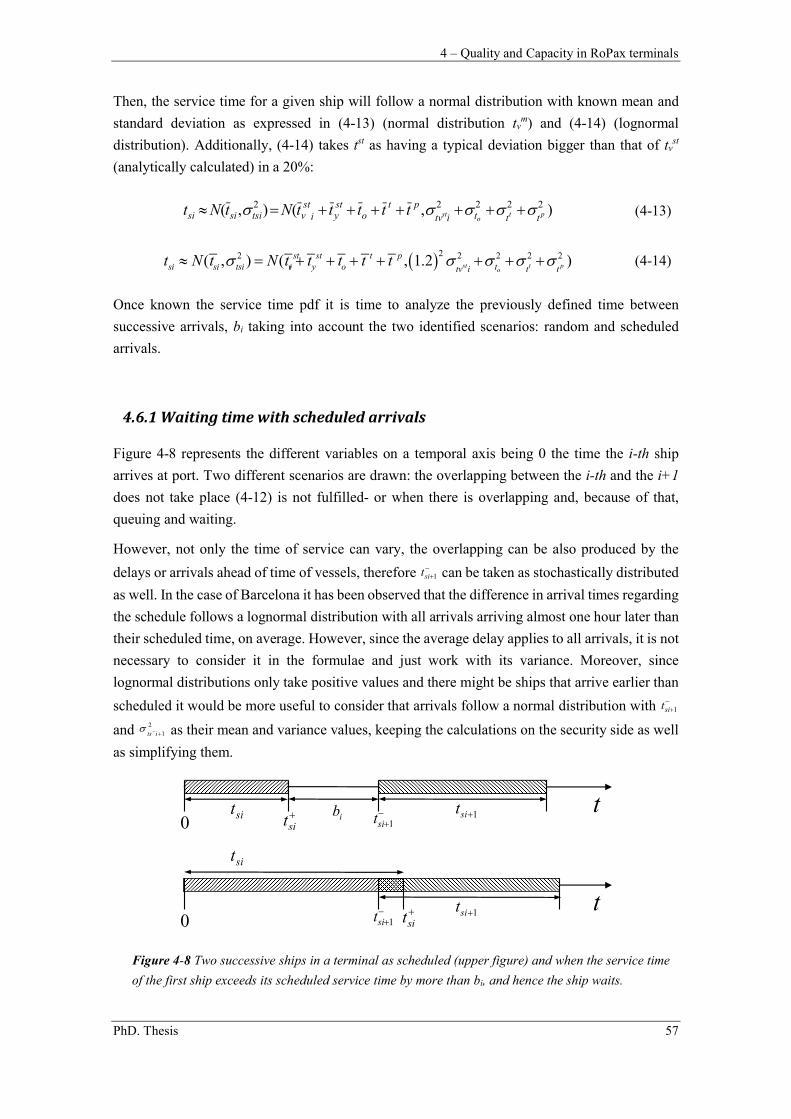
4 – Quality and Capacity in RoPax terminals
PhD. Thesis 57
Then, the service time for a given ship will follow a normal distribution with known mean and
standard deviation as expressed in (4-13) (normal distribution tvm) and (4-14) (lognormal
distribution). Additionally, (4-14) takes tst as having a typical deviation bigger than that of tvst
(analytically calculated) in a 20%:
),(),( 22222pt
ost tttitv
pto
styi
stvtsisisi tttttNtNt (4-13)
22 2 2 2 2( , ) ( , 1.2 )st t p
o
st st t psi si tsi vi y o ttv i t t
t N t N t t t t t (4-14)
Once known the service time pdf it is time to analyze the previously defined time between
successive arrivals, bi taking into account the two identified scenarios: random and scheduled
arrivals.
4.6.1 Waiting time with scheduled arrivals
Figure 4-8 represents the different variables on a temporal axis being 0 the time the i-th ship
arrives at port. Two different scenarios are drawn: the overlapping between the i-th and the i+1
does not take place (4-12) is not fulfilled- or when there is overlapping and, because of that,
queuing and waiting.
However, not only the time of service can vary, the overlapping can be also produced by the
delays or arrivals ahead of time of vessels, therefore 1sit can be taken as stochastically distributed
as well. In the case of Barcelona it has been observed that the difference in arrival times regarding
the schedule follows a lognormal distribution with all arrivals arriving almost one hour later than
their scheduled time, on average. However, since the average delay applies to all arrivals, it is not
necessary to consider it in the formulae and just work with its variance. Moreover, since
lognormal distributions only take positive values and there might be ships that arrive earlier than
scheduled it would be more useful to consider that arrivals follow a normal distribution with 1sit
and 2
1its as their mean and variance values, keeping the calculations on the security side as well
as simplifying them.
Figure 4-8 Two successive ships in a terminal as scheduled (upper figure) and when the service time
of the first ship exceeds its scheduled service time by more than bi, and hence the ship waits.
ib t1sit
sit0sit 1sit
t1sit
sit0
sit
1sit
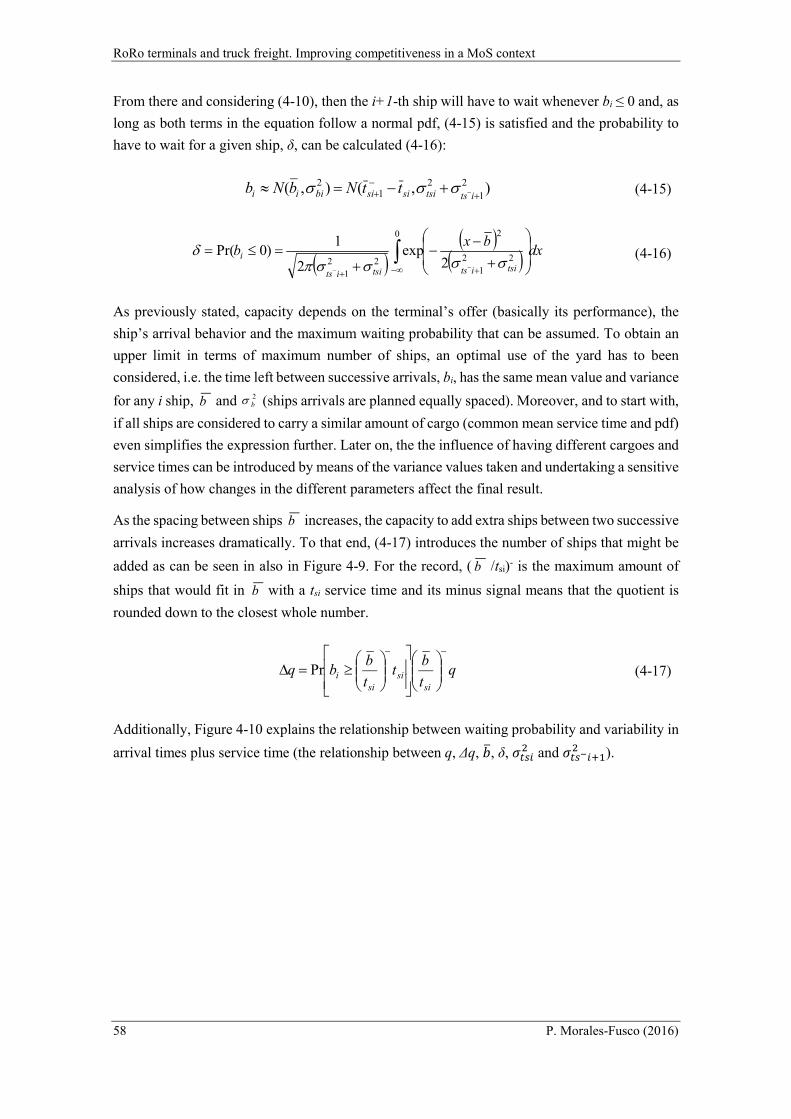
RoRo terminals and truck freight. Improving competitiveness in a MoS context
58 P. Morales-Fusco (2016)
From there and considering (4-10), then the i+1-th ship will have to wait whenever bi ≤ 0 and, as
long as both terms in the equation follow a normal pdf, (4-15) is satisfied and the probability to
have to wait for a given ship, δ, can be calculated (4-16):
),(),( 2
1
21
2
itstsisisibiii ttNbNb (4-15)
dxbx
btsiitstsiits
i
0
22
1
2
22
12
exp2
1)0Pr(
(4-16)
As previously stated, capacity depends on the terminal’s offer (basically its performance), the
ship’s arrival behavior and the maximum waiting probability that can be assumed. To obtain an
upper limit in terms of maximum number of ships, an optimal use of the yard has to been
considered, i.e. the time left between successive arrivals, bi, has the same mean value and variance
for any i ship, b and 2b (ships arrivals are planned equally spaced). Moreover, and to start with,
if all ships are considered to carry a similar amount of cargo (common mean service time and pdf)
even simplifies the expression further. Later on, the the influence of having different cargoes and
service times can be introduced by means of the variance values taken and undertaking a sensitive
analysis of how changes in the different parameters affect the final result.
As the spacing between ships b increases, the capacity to add extra ships between two successive
arrivals increases dramatically. To that end, (4-17) introduces the number of ships that might be
added as can be seen in also in Figure 4-9. For the record, ( b /tsi)- is the maximum amount of
ships that would fit in b with a tsi service time and its minus signal means that the quotient is
rounded down to the closest whole number.
qt
bt
t
bbq
sisi
sii
Pr (4-17)
Additionally, Figure 4-10 explains the relationship between waiting probability and variability in
arrival times plus service time (the relationship between q, Δq, ��, ẟ, ����� and �������
� ).
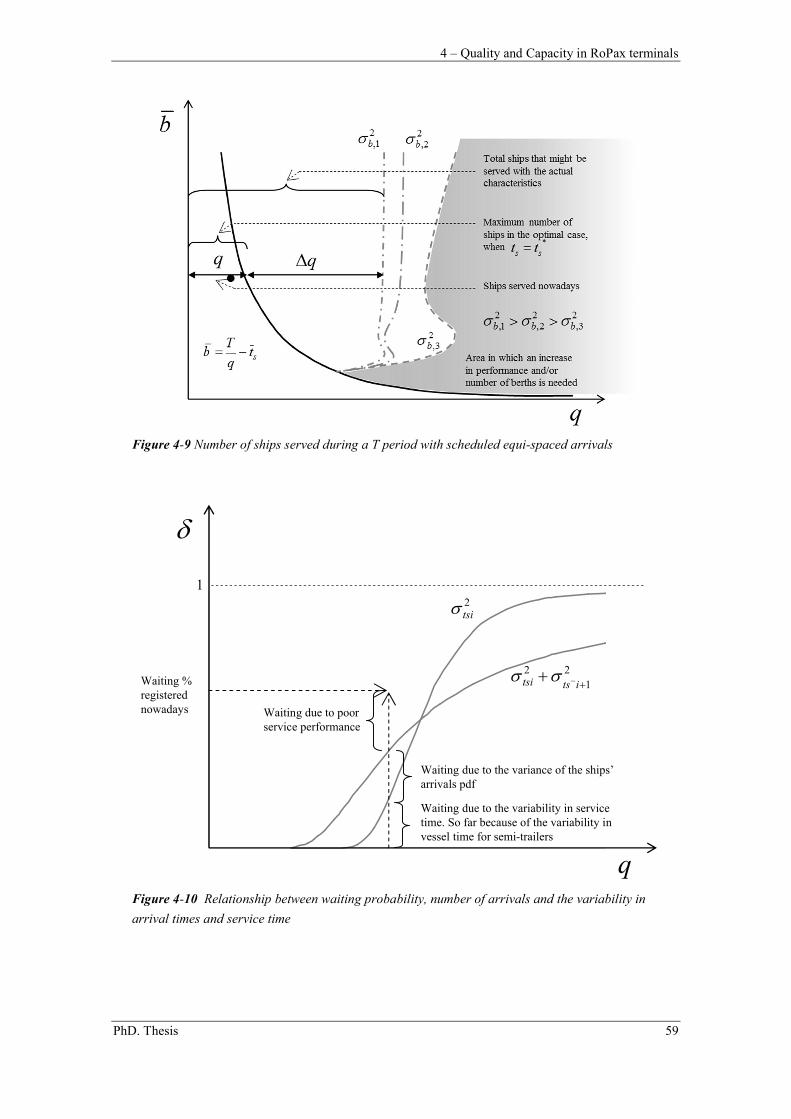
4 – Quality and Capacity in RoPax terminals
PhD. Thesis 59
Figure 4-9 Number of ships served during a T period with scheduled equi-spaced arrivals
Figure 4-10 Relationship between waiting probability, number of arrivals and the variability in
arrival times and service time
q
2tsi
1
Waiting due to poorservice performance
Waiting %registerednowadays
2
1
2
itstsi
Waiting due to the variance of the ships’ arrivals pdf
Waiting due to the variability in service time. So far because of the variability in vessel time for semi-trailers
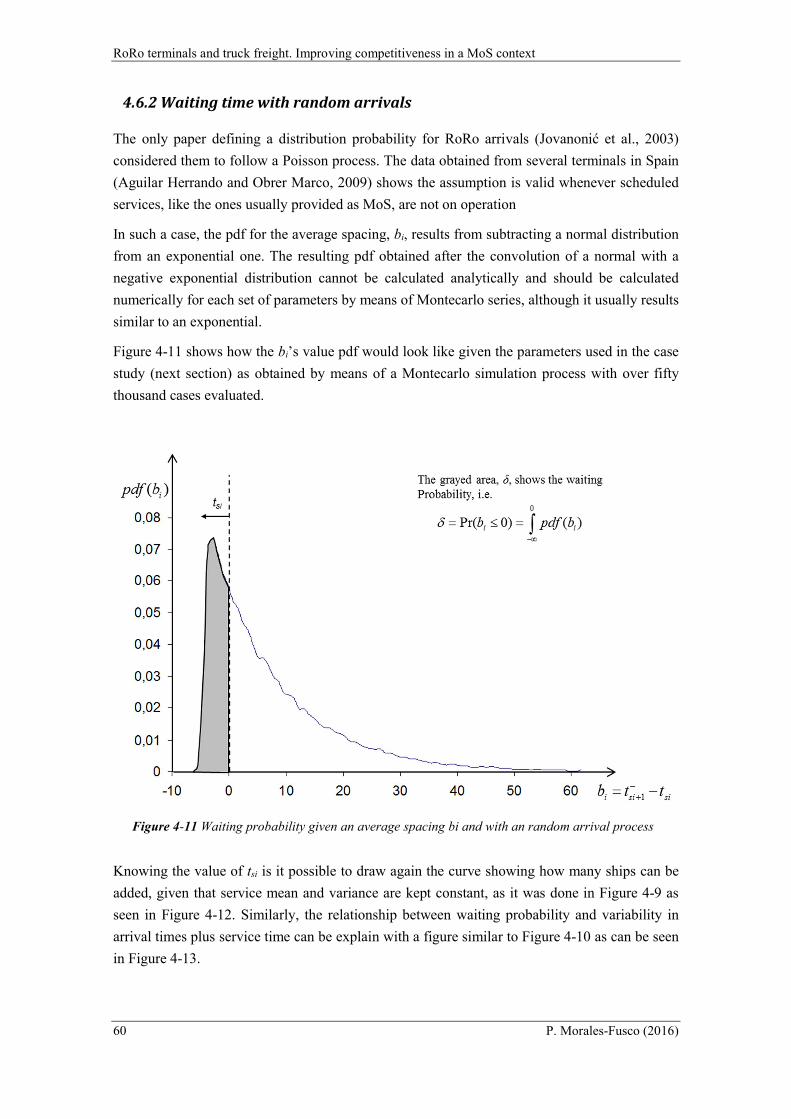
RoRo terminals and truck freight. Improving competitiveness in a MoS context
60 P. Morales-Fusco (2016)
4.6.2 Waiting time with random arrivals
The only paper defining a distribution probability for RoRo arrivals (Jovanonić et al., 2003)
considered them to follow a Poisson process. The data obtained from several terminals in Spain
(Aguilar Herrando and Obrer Marco, 2009) shows the assumption is valid whenever scheduled
services, like the ones usually provided as MoS, are not on operation
In such a case, the pdf for the average spacing, bi, results from subtracting a normal distribution
from an exponential one. The resulting pdf obtained after the convolution of a normal with a
negative exponential distribution cannot be calculated analytically and should be calculated
numerically for each set of parameters by means of Montecarlo series, although it usually results
similar to an exponential.
Figure 4-11 shows how the bi’s value pdf would look like given the parameters used in the case
study (next section) as obtained by means of a Montecarlo simulation process with over fifty
thousand cases evaluated.
Figure 4-11 Waiting probability given an average spacing bi and with an random arrival process
Knowing the value of tsi is it possible to draw again the curve showing how many ships can be
added, given that service mean and variance are kept constant, as it was done in Figure 4-9 as
seen in Figure 4-12. Similarly, the relationship between waiting probability and variability in
arrival times plus service time can be explain with a figure similar to Figure 4-10 as can be seen
in Figure 4-13.
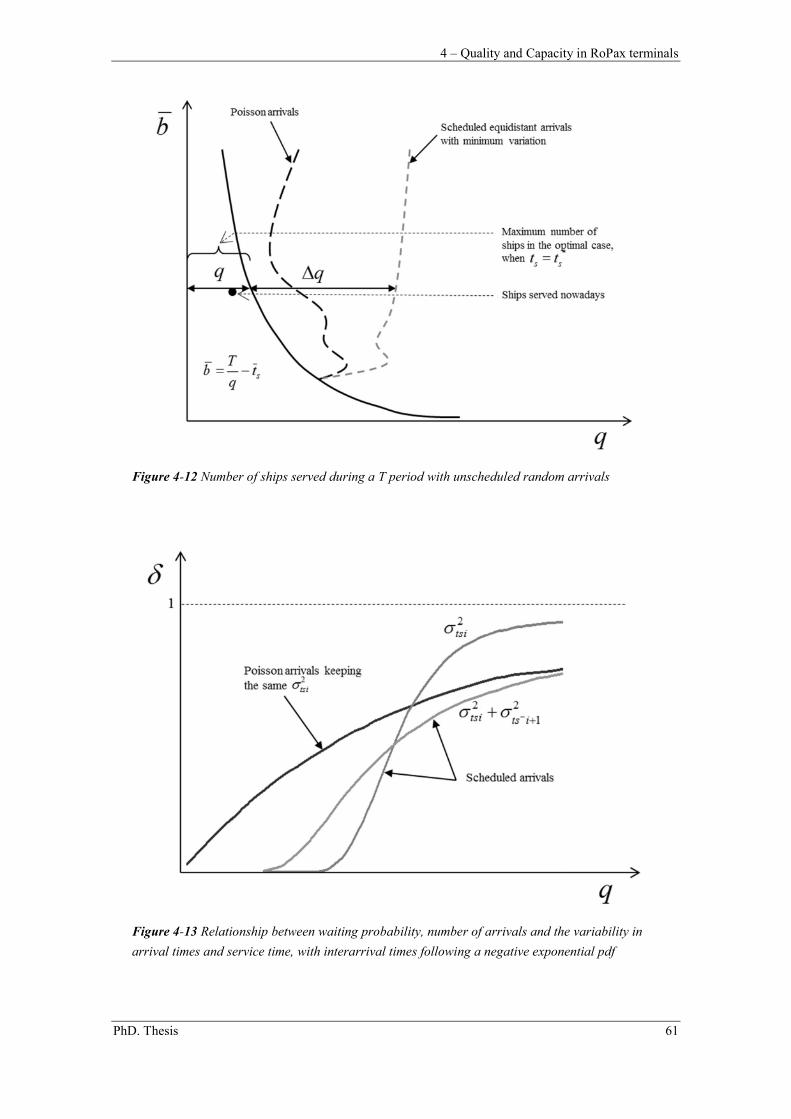
4 – Quality and Capacity in RoPax terminals
PhD. Thesis 61
Figure 4-12 Number of ships served during a T period with unscheduled random arrivals
Figure 4-13 Relationship between waiting probability, number of arrivals and the variability in
arrival times and service time, with interarrival times following a negative exponential pdf
RoRo terminals and truck freight. Improving competitiveness in a MoS context
62 P. Morales-Fusco (2016)
4.7 Case study
The methodology proposed is now applied to the data provided by a shipping company with two
independent ramps operating in a RoPax terminal from Barcelona, Spain. Both ramps and yard
systems are independent from one another and therefore it is possible to analytically study
independently one of the systems in terms of foreseeable waiting time when ships following a
schedule and with maximum cargo arrive at the terminal. To achieve this goal some assumptions
are considered.
The cargo consists of trucks and semi-trailers only, being the second kind the most time
consuming to stevedore in terms of units/per time unit.
Cargo unloaded equals cargo loaded, since this implies the maximum number of
movements given a certain yard capacity and through simulation, little difference in yard
times has been observed.
Two different scenarios are considered: a more “usual” case for the studied terminal with
40 semi-trailers and 80 trucks to be unloaded and the same quantity to be loaded and an
“eextremal” case where all cargo is composed by semi-trailers (160 plus 160 in total).
to and tt are taken deterministic and thus no variance was considered.
8 tug units and 2 ramps functioning at a time.
The semi-trailers time follows a normal distribution with its mean obtained through a
mixture of analytical (tvst) and simulation values (ty
st) and its variance through analytical
values only.
The typical ship has two ramps (R=2) and the distance to travel from the port’s entry to
the mooring point, d, equals 3.1 nautical miles.
The standard ship arrival deviation is 30 minutes.
μlt = 80 trucks/hour, μu
t = 140 trucks/hour, μg = 100 trucks/hour and there is room for 19
trucks in the terminal’s internal lanes.
Given the assumptions, and from combining (4-1) and (4-3), the expression to estimate the time
of service is reduced to (4-18), once the parameters for cargos not being transported are omitted.
stv
sty
tos ttttt (4-18)
In (4-18), the terms of operation and truck times (first two terms of the summation) are obtained
straightforward after applying (4-2), (4-4) and (4-6) to the terminal’s and cargo characteristics.
Furthermore, tvst is obtained as stated in (4-7) (the mean value) while ty
st comes from a figure
similar to those shown in Figure 4-7, but this time for a M2 distribution, since it is the one
observed in Barcelona’s terminal.
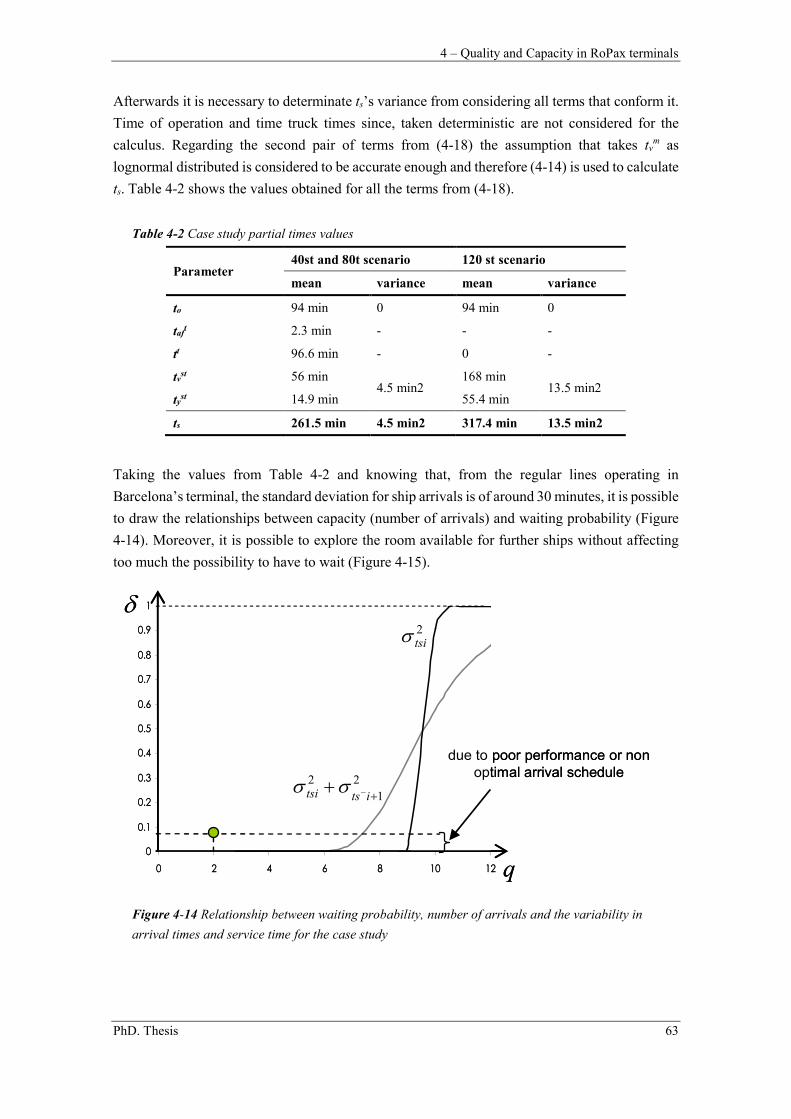
4 – Quality and Capacity in RoPax terminals
PhD. Thesis 63
Afterwards it is necessary to determinate ts’s variance from considering all terms that conform it.
Time of operation and time truck times since, taken deterministic are not considered for the
calculus. Regarding the second pair of terms from (4-18) the assumption that takes tvm as
lognormal distributed is considered to be accurate enough and therefore (4-14) is used to calculate
ts. Table 4-2 shows the values obtained for all the terms from (4-18).
Table 4-2 Case study partial times values
Parameter 40st and 80t scenario 120 st scenario
mean variance mean variance
to 94 min 0 94 min 0
taft 2.3 min - - -
tt 96.6 min - 0 -
tvst 56 min
4.5 min2 168 min
13.5 min2 ty
st 14.9 min 55.4 min
ts 261.5 min 4.5 min2 317.4 min 13.5 min2
Taking the values from Table 4-2 and knowing that, from the regular lines operating in
Barcelona’s terminal, the standard deviation for ship arrivals is of around 30 minutes, it is possible
to draw the relationships between capacity (number of arrivals) and waiting probability (Figure
4-14). Moreover, it is possible to explore the room available for further ships without affecting
too much the possibility to have to wait (Figure 4-15).
Figure 4-14 Relationship between waiting probability, number of arrivals and the variability in
arrival times and service time for the case study
0
0.1
0.2
0.3
0.4
0.5
0.6
0.7
0.8
0.9
1
0 2 4 6 8 10 12 q
due to poor performance or non optimal arrival schedule
2tsi
2
1
2
itstsi
0
0.1
0.2
0.3
0.4
0.5
0.6
0.7
0.8
0.9
1
0 2 4 6 8 10 12 q
due to poor performance or non optimal arrival schedule
2tsi
2
1
2
itstsi
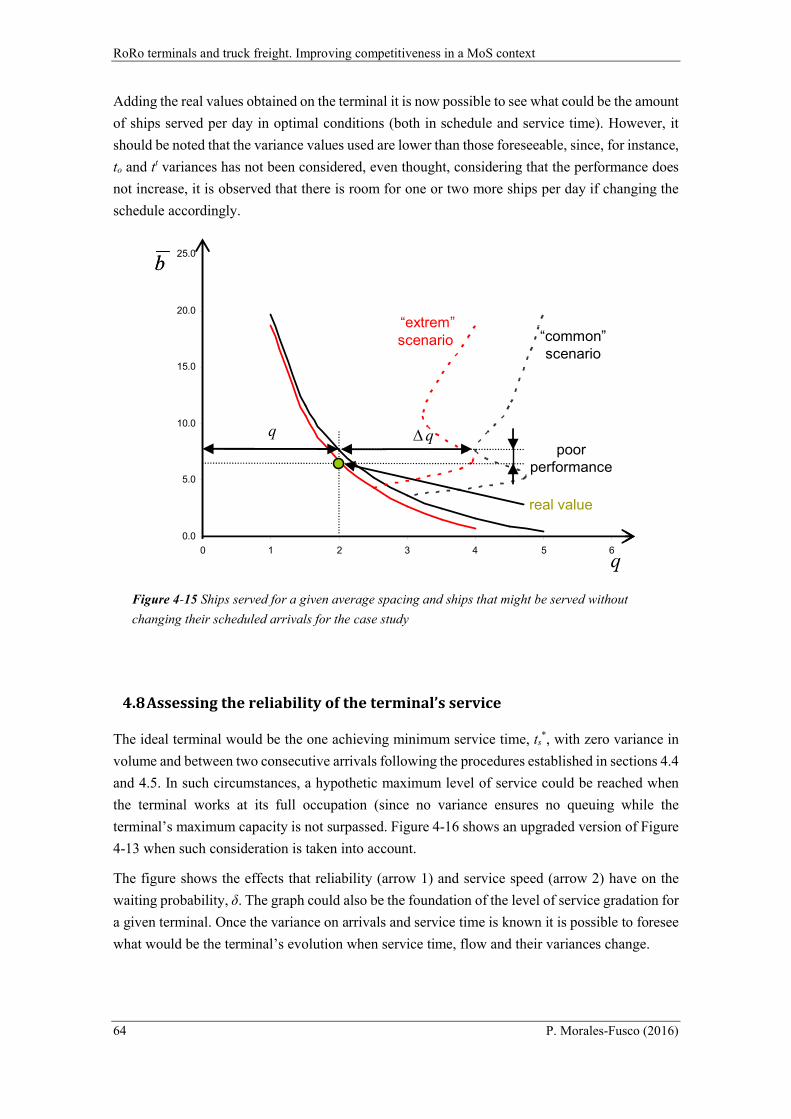
RoRo terminals and truck freight. Improving competitiveness in a MoS context
64 P. Morales-Fusco (2016)
Adding the real values obtained on the terminal it is now possible to see what could be the amount
of ships served per day in optimal conditions (both in schedule and service time). However, it
should be noted that the variance values used are lower than those foreseeable, since, for instance,
to and tt variances has not been considered, even thought, considering that the performance does
not increase, it is observed that there is room for one or two more ships per day if changing the
schedule accordingly.
Figure 4-15 Ships served for a given average spacing and ships that might be served without
changing their scheduled arrivals for the case study
4.8 Assessing the reliability of the terminal’s service
The ideal terminal would be the one achieving minimum service time, ts*, with zero variance in
volume and between two consecutive arrivals following the procedures established in sections 4.4
and 4.5. In such circumstances, a hypothetic maximum level of service could be reached when
the terminal works at its full occupation (since no variance ensures no queuing while the
terminal’s maximum capacity is not surpassed. Figure 4-16 shows an upgraded version of Figure
4-13 when such consideration is taken into account.
The figure shows the effects that reliability (arrow 1) and service speed (arrow 2) have on the
waiting probability, δ. The graph could also be the foundation of the level of service gradation for
a given terminal. Once the variance on arrivals and service time is known it is possible to foresee
what would be the terminal’s evolution when service time, flow and their variances change.
0.0
5.0
10.0
15.0
20.0
25.0
0 1 2 3 4 5 6
“common”scenario
“extrem”scenario
q
b
real value
poorperformance
0.0
5.0
10.0
15.0
20.0
25.0
0 1 2 3 4 5 6
“common”scenario
“extrem”scenario
q
b
real value
poorperformance
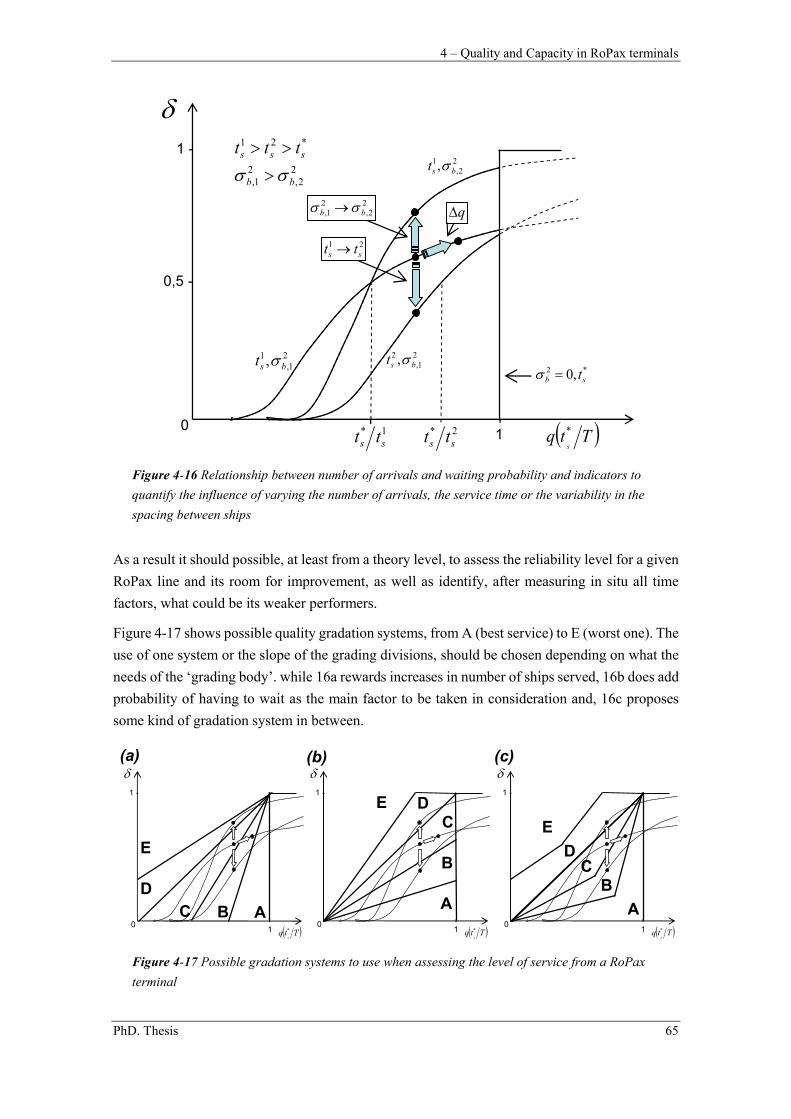
4 – Quality and Capacity in RoPax terminals
PhD. Thesis 65
Figure 4-16 Relationship between number of arrivals and waiting probability and indicators to
quantify the influence of varying the number of arrivals, the service time or the variability in the
spacing between ships
As a result it should possible, at least from a theory level, to assess the reliability level for a given
RoPax line and its room for improvement, as well as identify, after measuring in situ all time
factors, what could be its weaker performers.
Figure 4-17 shows possible quality gradation systems, from A (best service) to E (worst one). The
use of one system or the slope of the grading divisions, should be chosen depending on what the
needs of the ‘grading body’. while 16a rewards increases in number of ships served, 16b does add
probability of having to wait as the main factor to be taken in consideration and, 16c proposes
some kind of gradation system in between.
Figure 4-17 Possible gradation systems to use when assessing the level of service from a RoPax
terminal
Ttqs
*
1 -
1
--
1*ss tt
q
*21sss ttt
22,
1, bst 22,
21, bb
21,
1, bst
22,
21, bb
21,
2 , bst *2 ,0 sb t
21ss tt
0,5 -
0 2*ss tt
Ttqs
*
1 -
1
-
0ABC
D
Ttqs
*
1 -
1
-
0
A
B
CD
E
E
Ttqs
*
1 -
1
-
0
A
BC
D
E
(a) (b) (c)
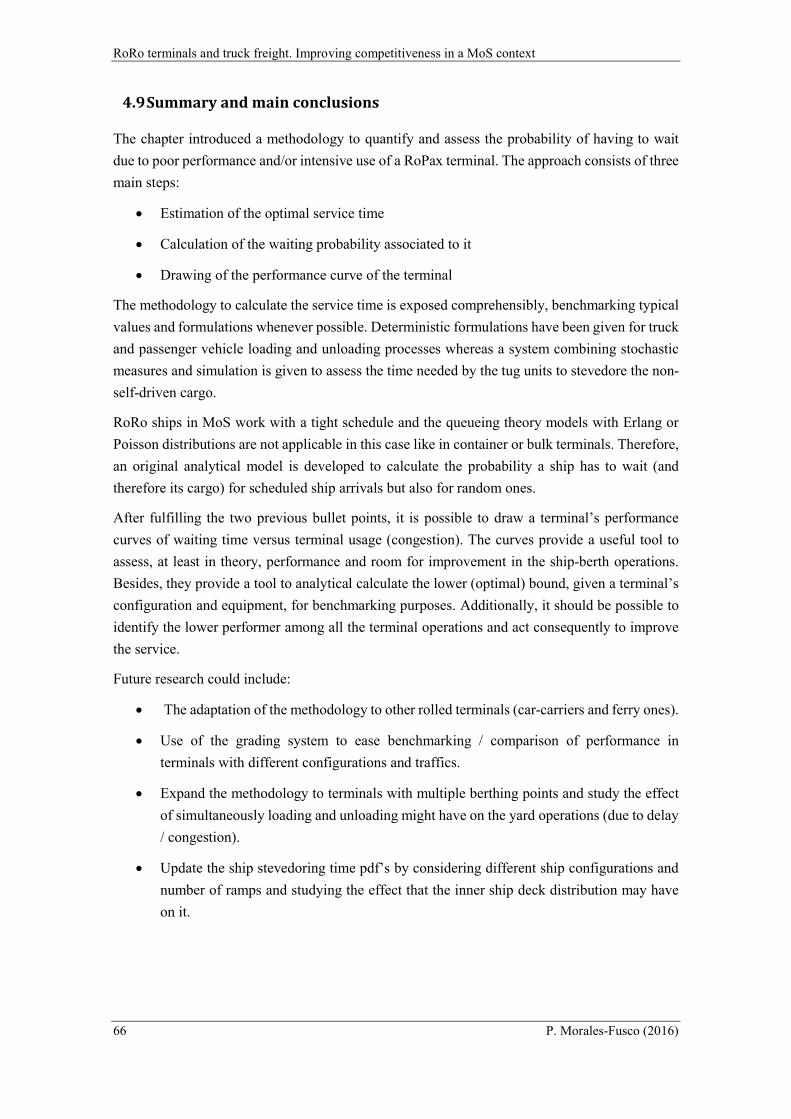
RoRo terminals and truck freight. Improving competitiveness in a MoS context
66 P. Morales-Fusco (2016)
4.9 Summary and main conclusions
The chapter introduced a methodology to quantify and assess the probability of having to wait
due to poor performance and/or intensive use of a RoPax terminal. The approach consists of three
main steps:
Estimation of the optimal service time
Calculation of the waiting probability associated to it
Drawing of the performance curve of the terminal
The methodology to calculate the service time is exposed comprehensibly, benchmarking typical
values and formulations whenever possible. Deterministic formulations have been given for truck
and passenger vehicle loading and unloading processes whereas a system combining stochastic
measures and simulation is given to assess the time needed by the tug units to stevedore the non-
self-driven cargo.
RoRo ships in MoS work with a tight schedule and the queueing theory models with Erlang or
Poisson distributions are not applicable in this case like in container or bulk terminals. Therefore,
an original analytical model is developed to calculate the probability a ship has to wait (and
therefore its cargo) for scheduled ship arrivals but also for random ones.
After fulfilling the two previous bullet points, it is possible to draw a terminal’s performance
curves of waiting time versus terminal usage (congestion). The curves provide a useful tool to
assess, at least in theory, performance and room for improvement in the ship-berth operations.
Besides, they provide a tool to analytical calculate the lower (optimal) bound, given a terminal’s
configuration and equipment, for benchmarking purposes. Additionally, it should be possible to
identify the lower performer among all the terminal operations and act consequently to improve
the service.
Future research could include:
The adaptation of the methodology to other rolled terminals (car-carriers and ferry ones).
Use of the grading system to ease benchmarking / comparison of performance in
terminals with different configurations and traffics.
Expand the methodology to terminals with multiple berthing points and study the effect
of simultaneously loading and unloading might have on the yard operations (due to delay
/ congestion).
Update the ship stevedoring time pdf’s by considering different ship configurations and
number of ramps and studying the effect that the inner ship deck distribution may have
on it.
5 – Resiliency at RoPax terminals
PhD. Thesis 67
5. Resiliency at RoPax terminals
Chapter 5
Resiliency at RoPax terminals
5.1 Introduction and chapter overview
As seen in the previous chapters, especially in section 3.2, the decisive aspects that make a
transportation chain with a maritime link operated by RoPax vessels competitive are both
quantitative (time, frequency or cost) and qualitative/subjective. Among the qualitative aspects
considered, the shippers especially value the safety of the cargo together and the reliability
(Paixão Casaca and Marlow, 2002), usually understood as fulfilment of the expected travel time
(Batley, 2007; Henesey, 2006)), and already addressed, from the point of view of the terminal, in
chapter 4. Some authors, like Henesey, even differentiated resilience or adaptability from quality,
considering that they are all key attributes for the success of any transportation chain.
Following the path started in the previous chapter, where a qualitative aspect of a terminal: its
reliability -in terms of waiting probability-, was conducted, this chapter introduces the evaluation
of qualitative aspect: resilience. Besides reliant, resilient terminals are required; that is, port
terminals need to be able to respond quickly to any disruptions that might appear and return to a
smooth operational state in the minimum amount of time.
In this case, the resilience of a RoPax terminal by using risk assessment techniques as a means to
provide tools to improve the quality and therefore, the competitiveness of rolled cargo lines and,
in consequence, help in the transport shift from road to sea.
This chapter discusses the concept of resilience applied to a port terminal and identifies the main
risks to its normal, physical operation. The structure of the chapter is made of (Figure 5-1): a short
literature review on risk assessment when applied to supply chains and terminals is provided to
complement the state of the art already provided in previous chapters. Afterwards a complete
taxonomy of the disruptions or disruptions affecting the operational processes in a RoPax terminal
is introduced, together with a methodology allowing to quantify their relative importance and to
discriminate what are the bigger risks that should be confronted first.
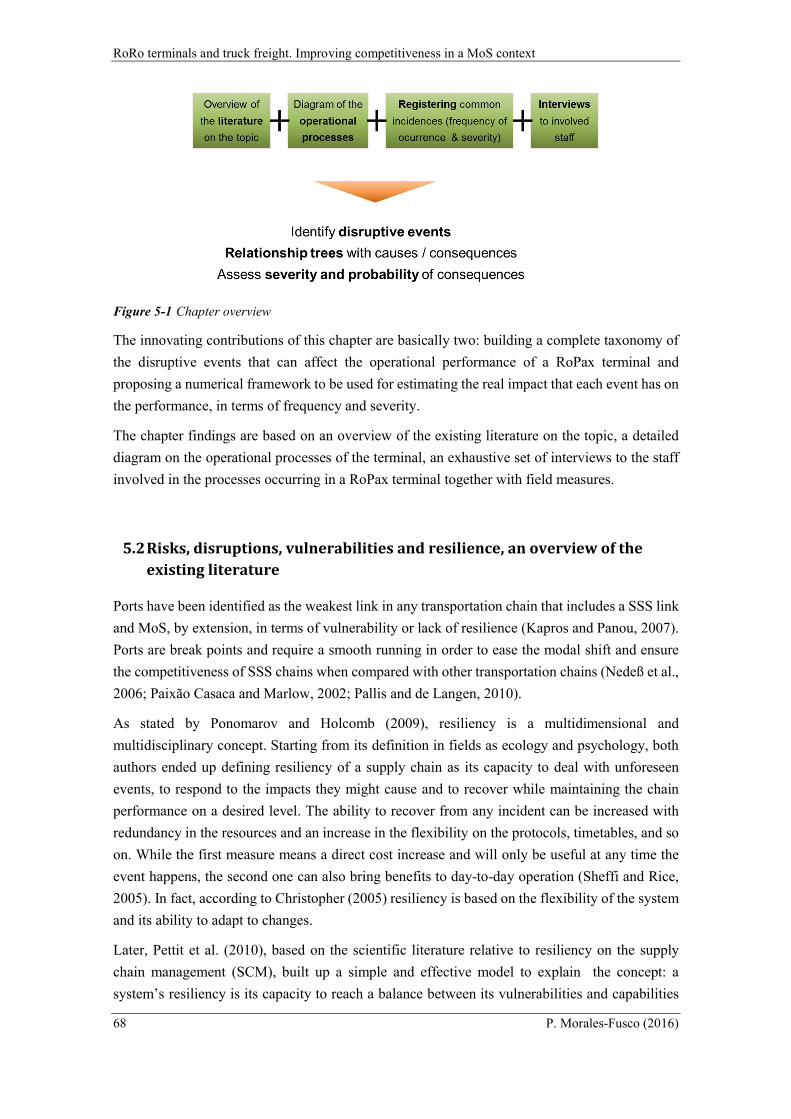
RoRo terminals and truck freight. Improving competitiveness in a MoS context
68 P. Morales-Fusco (2016)
Figure 5-1 Chapter overview
The innovating contributions of this chapter are basically two: building a complete taxonomy of
the disruptive events that can affect the operational performance of a RoPax terminal and
proposing a numerical framework to be used for estimating the real impact that each event has on
the performance, in terms of frequency and severity.
The chapter findings are based on an overview of the existing literature on the topic, a detailed
diagram on the operational processes of the terminal, an exhaustive set of interviews to the staff
involved in the processes occurring in a RoPax terminal together with field measures.
5.2 Risks, disruptions, vulnerabilities and resilience, an overview of the
existing literature
Ports have been identified as the weakest link in any transportation chain that includes a SSS link
and MoS, by extension, in terms of vulnerability or lack of resilience (Kapros and Panou, 2007).
Ports are break points and require a smooth running in order to ease the modal shift and ensure
the competitiveness of SSS chains when compared with other transportation chains (Nedeß et al.,
2006; Paixão Casaca and Marlow, 2002; Pallis and de Langen, 2010).
As stated by Ponomarov and Holcomb (2009), resiliency is a multidimensional and
multidisciplinary concept. Starting from its definition in fields as ecology and psychology, both
authors ended up defining resiliency of a supply chain as its capacity to deal with unforeseen
events, to respond to the impacts they might cause and to recover while maintaining the chain
performance on a desired level. The ability to recover from any incident can be increased with
redundancy in the resources and an increase in the flexibility on the protocols, timetables, and so
on. While the first measure means a direct cost increase and will only be useful at any time the
event happens, the second one can also bring benefits to day-to-day operation (Sheffi and Rice,
2005). In fact, according to Christopher (2005) resiliency is based on the flexibility of the system
and its ability to adapt to changes.
Later, Pettit et al. (2010), based on the scientific literature relative to resiliency on the supply
chain management (SCM), built up a simple and effective model to explain the concept: a
system’s resiliency is its capacity to reach a balance between its vulnerabilities and capabilities
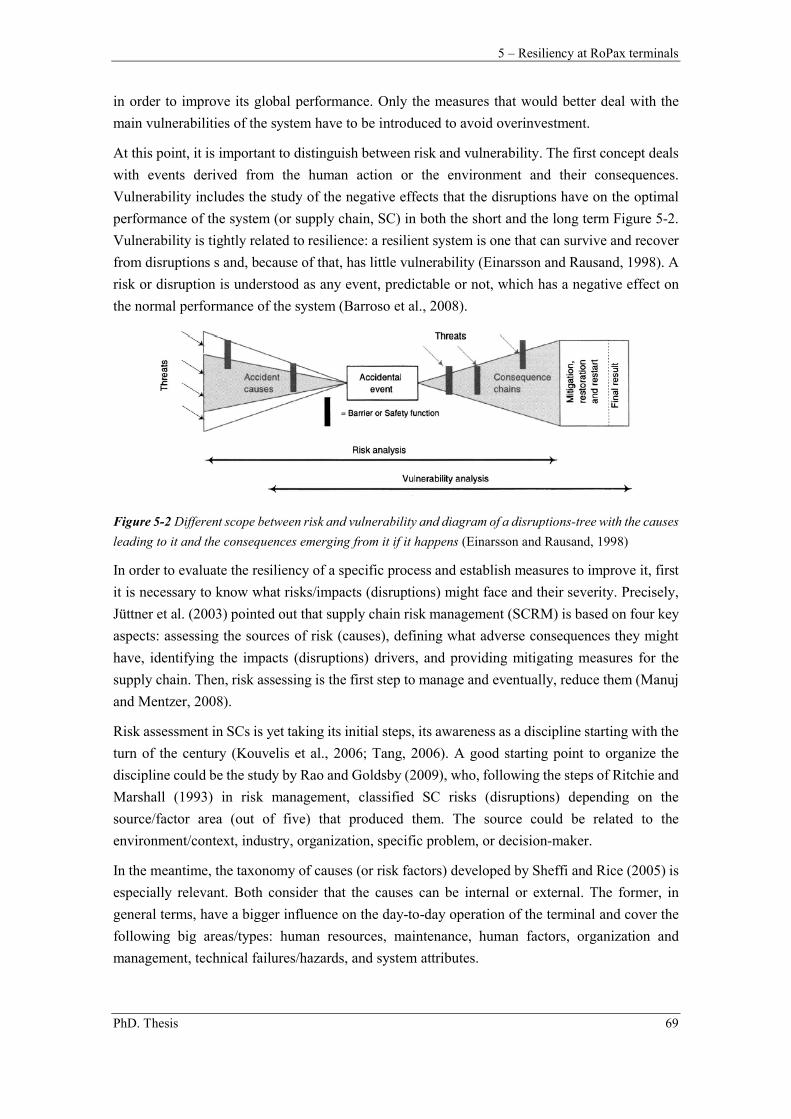
5 – Resiliency at RoPax terminals
PhD. Thesis 69
in order to improve its global performance. Only the measures that would better deal with the
main vulnerabilities of the system have to be introduced to avoid overinvestment.
At this point, it is important to distinguish between risk and vulnerability. The first concept deals
with events derived from the human action or the environment and their consequences.
Vulnerability includes the study of the negative effects that the disruptions have on the optimal
performance of the system (or supply chain, SC) in both the short and the long term Figure 5-2.
Vulnerability is tightly related to resilience: a resilient system is one that can survive and recover
from disruptions s and, because of that, has little vulnerability (Einarsson and Rausand, 1998). A
risk or disruption is understood as any event, predictable or not, which has a negative effect on
the normal performance of the system (Barroso et al., 2008).
Figure 5-2 Different scope between risk and vulnerability and diagram of a disruptions-tree with the causes
leading to it and the consequences emerging from it if it happens (Einarsson and Rausand, 1998)
In order to evaluate the resiliency of a specific process and establish measures to improve it, first
it is necessary to know what risks/impacts (disruptions) might face and their severity. Precisely,
Jüttner et al. (2003) pointed out that supply chain risk management (SCRM) is based on four key
aspects: assessing the sources of risk (causes), defining what adverse consequences they might
have, identifying the impacts (disruptions) drivers, and providing mitigating measures for the
supply chain. Then, risk assessing is the first step to manage and eventually, reduce them (Manuj
and Mentzer, 2008).
Risk assessment in SCs is yet taking its initial steps, its awareness as a discipline starting with the
turn of the century (Kouvelis et al., 2006; Tang, 2006). A good starting point to organize the
discipline could be the study by Rao and Goldsby (2009), who, following the steps of Ritchie and
Marshall (1993) in risk management, classified SC risks (disruptions) depending on the
source/factor area (out of five) that produced them. The source could be related to the
environment/context, industry, organization, specific problem, or decision-maker.
In the meantime, the taxonomy of causes (or risk factors) developed by Sheffi and Rice (2005) is
especially relevant. Both consider that the causes can be internal or external. The former, in
general terms, have a bigger influence on the day-to-day operation of the terminal and cover the
following big areas/types: human resources, maintenance, human factors, organization and
management, technical failures/hazards, and system attributes.
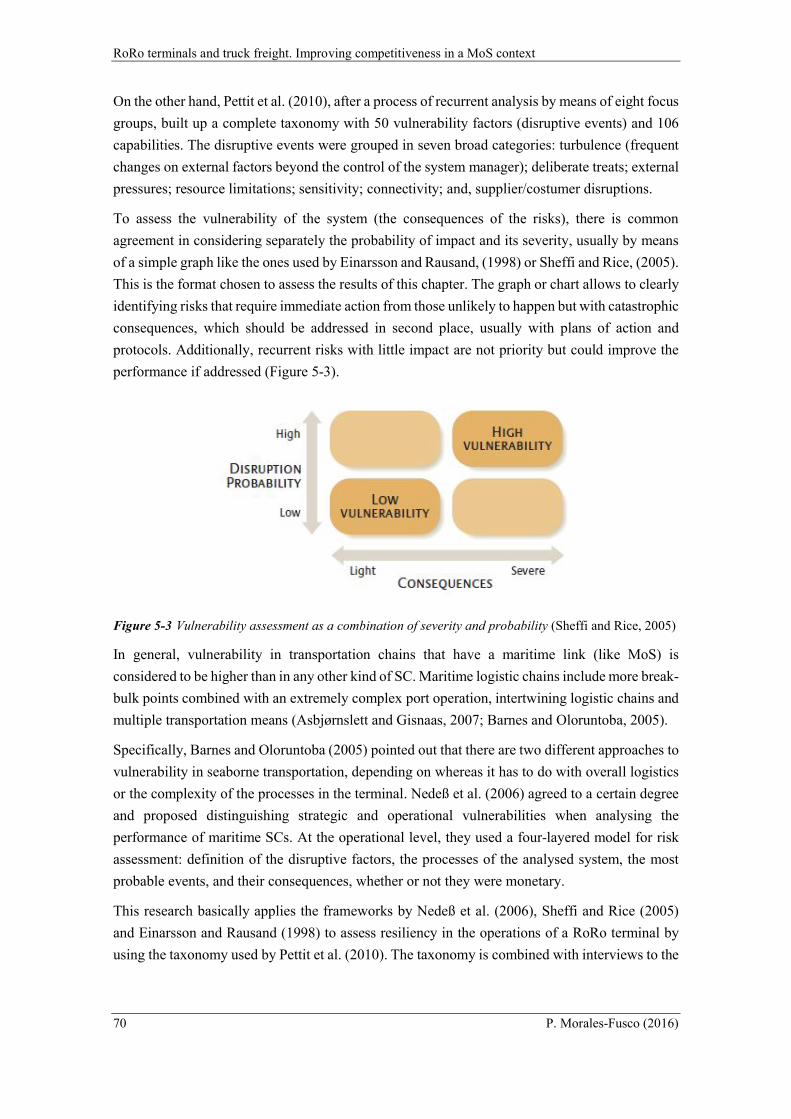
RoRo terminals and truck freight. Improving competitiveness in a MoS context
70 P. Morales-Fusco (2016)
On the other hand, Pettit et al. (2010), after a process of recurrent analysis by means of eight focus
groups, built up a complete taxonomy with 50 vulnerability factors (disruptive events) and 106
capabilities. The disruptive events were grouped in seven broad categories: turbulence (frequent
changes on external factors beyond the control of the system manager); deliberate treats; external
pressures; resource limitations; sensitivity; connectivity; and, supplier/costumer disruptions.
To assess the vulnerability of the system (the consequences of the risks), there is common
agreement in considering separately the probability of impact and its severity, usually by means
of a simple graph like the ones used by Einarsson and Rausand, (1998) or Sheffi and Rice, (2005).
This is the format chosen to assess the results of this chapter. The graph or chart allows to clearly
identifying risks that require immediate action from those unlikely to happen but with catastrophic
consequences, which should be addressed in second place, usually with plans of action and
protocols. Additionally, recurrent risks with little impact are not priority but could improve the
performance if addressed (Figure 5-3).
Figure 5-3 Vulnerability assessment as a combination of severity and probability (Sheffi and Rice, 2005)
In general, vulnerability in transportation chains that have a maritime link (like MoS) is
considered to be higher than in any other kind of SC. Maritime logistic chains include more break-
bulk points combined with an extremely complex port operation, intertwining logistic chains and
multiple transportation means (Asbjørnslett and Gisnaas, 2007; Barnes and Oloruntoba, 2005).
Specifically, Barnes and Oloruntoba (2005) pointed out that there are two different approaches to
vulnerability in seaborne transportation, depending on whereas it has to do with overall logistics
or the complexity of the processes in the terminal. Nedeß et al. (2006) agreed to a certain degree
and proposed distinguishing strategic and operational vulnerabilities when analysing the
performance of maritime SCs. At the operational level, they used a four-layered model for risk
assessment: definition of the disruptive factors, the processes of the analysed system, the most
probable events, and their consequences, whether or not they were monetary.
This research basically applies the frameworks by Nedeß et al. (2006), Sheffi and Rice (2005)
and Einarsson and Rausand (1998) to assess resiliency in the operations of a RoRo terminal by
using the taxonomy used by Pettit et al. (2010). The taxonomy is combined with interviews to the
5 – Resiliency at RoPax terminals
PhD. Thesis 71
different staff involved in the ship stevedoring process: stevedoring hands, ship staff, drivers and,
eventually, shippers and port authority’s staff.
5.3 Risks, causes and derived impacts, a taxonomy
Nedeß et al. (2006) points out, the first step before identifying the disruptive events that might
affect the resiliency of a system and, therefore, its normal performance, is to be familiar with the
processes that take place in it.
Section 4.2 already introduced the main operational (physical) processes occurring in the
terminal. The knowledge of the main processes occurring at the terminal enables to construct the
taxonomy of the main risks/disruptive events that challenge its resiliency.
This section provides a systematic approach to identify the disruptions affecting the normal
operation of the processes in the terminal, what may cause them and the final effects for them to
occur, on the normal operation of the terminal.
5.3.1 Disruptions in a RoPax terminal
The concept of disruption or disturbance (or risk or impact or threat) used is directly taken from
the definition of Barroso et al. (2008): A disruption is any event, predictable or not, which has a
negative effect on the normal performance of the system. As established in the frameworks by
Einarsson and Rausand (1998) and Sheffi and Rice (2005), this kind of events happen because of
certain threats/feasible disruptions factors and cause certain consequences that may affect the
normal performance to a higher or lesser degree, depending on the event and the capabilities of
the terminal (its resiliency).
Sources used and list of disruptions
The main sources used to identify the main disrutpions or impacts that can affect the average
performance of a RoPax terminal were three:
An overview of the literature describing the logistic processes in RoPax terminals. The
analysis was completed with the inclusion of the incidents most frequently referred to in
the port container terminals, which is more exhaustive.
A detailed analysis of the processes introduced in Figure 4-2, section 4.2, identifying
which agents might affected the desirable performance of the process and to what degree.
40 people were interviewed in total: 5 captains, 5 first deck officer, 10 deck officers, 5
consignees, 5 operations chief and managers, and 10 terminal’s customers from the
RoPax terminals at Port of Barcelona, Port of Valencia, and Port of Algeciras. Among
other questions, interviewees were asked about the frequency of the disruptive events
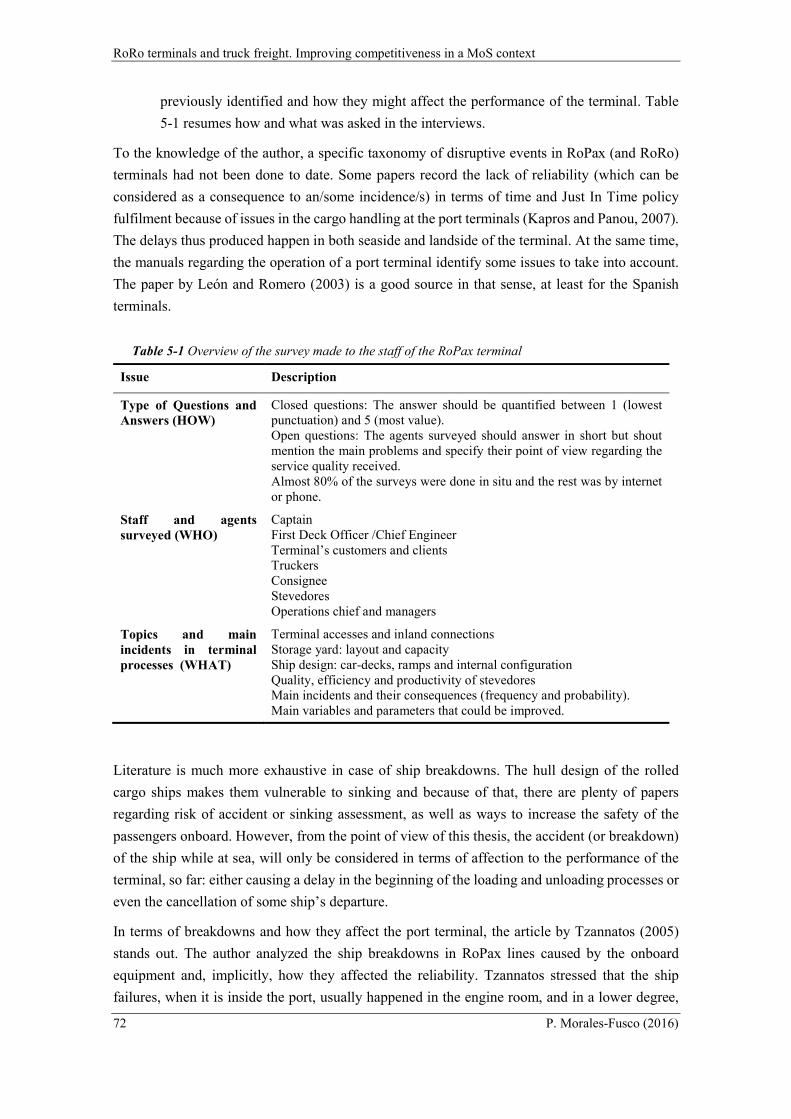
RoRo terminals and truck freight. Improving competitiveness in a MoS context
72 P. Morales-Fusco (2016)
previously identified and how they might affect the performance of the terminal. Table
5-1 resumes how and what was asked in the interviews.
To the knowledge of the author, a specific taxonomy of disruptive events in RoPax (and RoRo)
terminals had not been done to date. Some papers record the lack of reliability (which can be
considered as a consequence to an/some incidence/s) in terms of time and Just In Time policy
fulfilment because of issues in the cargo handling at the port terminals (Kapros and Panou, 2007).
The delays thus produced happen in both seaside and landside of the terminal. At the same time,
the manuals regarding the operation of a port terminal identify some issues to take into account.
The paper by León and Romero (2003) is a good source in that sense, at least for the Spanish
terminals.
Table 5-1 Overview of the survey made to the staff of the RoPax terminal
Issue Description
Type of Questions and Answers (HOW)
Closed questions: The answer should be quantified between 1 (lowest punctuation) and 5 (most value). Open questions: The agents surveyed should answer in short but shout mention the main problems and specify their point of view regarding the service quality received. Almost 80% of the surveys were done in situ and the rest was by internet or phone.
Staff and agents surveyed (WHO)
Captain First Deck Officer /Chief Engineer Terminal’s customers and clients Truckers Consignee Stevedores Operations chief and managers
Topics and main incidents in terminal processes (WHAT)
Terminal accesses and inland connections Storage yard: layout and capacity Ship design: car-decks, ramps and internal configuration Quality, efficiency and productivity of stevedores Main incidents and their consequences (frequency and probability). Main variables and parameters that could be improved.
Literature is much more exhaustive in case of ship breakdowns. The hull design of the rolled
cargo ships makes them vulnerable to sinking and because of that, there are plenty of papers
regarding risk of accident or sinking assessment, as well as ways to increase the safety of the
passengers onboard. However, from the point of view of this thesis, the accident (or breakdown)
of the ship while at sea, will only be considered in terms of affection to the performance of the
terminal, so far: either causing a delay in the beginning of the loading and unloading processes or
even the cancellation of some ship’s departure.
In terms of breakdowns and how they affect the port terminal, the article by Tzannatos (2005)
stands out. The author analyzed the ship breakdowns in RoPax lines caused by the onboard
equipment and, implicitly, how they affected the reliability. Tzannatos stressed that the ship
failures, when it is inside the port, usually happened in the engine room, and in a lower degree,
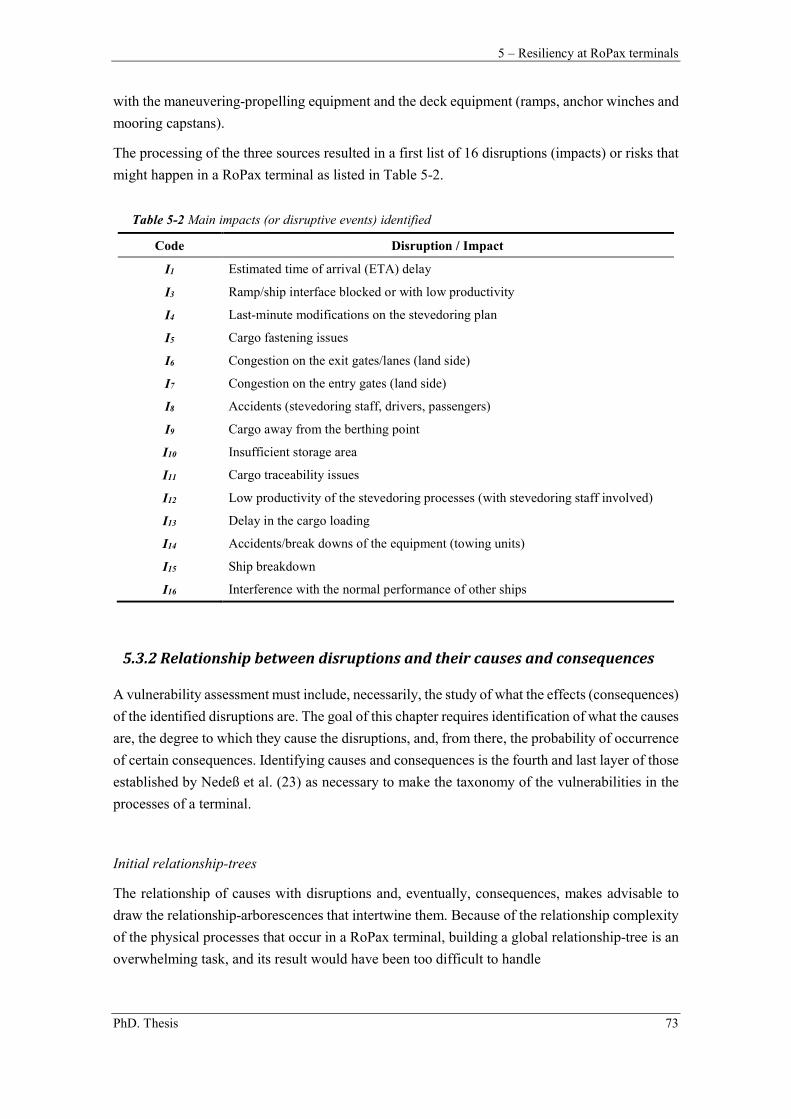
5 – Resiliency at RoPax terminals
PhD. Thesis 73
with the maneuvering-propelling equipment and the deck equipment (ramps, anchor winches and
mooring capstans).
The processing of the three sources resulted in a first list of 16 disruptions (impacts) or risks that
might happen in a RoPax terminal as listed in Table 5-2.
Table 5-2 Main impacts (or disruptive events) identified
Code Disruption / Impact
I1 Estimated time of arrival (ETA) delay
I3 Ramp/ship interface blocked or with low productivity
I4 Last-minute modifications on the stevedoring plan
I5 Cargo fastening issues
I6 Congestion on the exit gates/lanes (land side)
I7 Congestion on the entry gates (land side)
I8 Accidents (stevedoring staff, drivers, passengers)
I9 Cargo away from the berthing point
I10 Insufficient storage area
I11 Cargo traceability issues
I12 Low productivity of the stevedoring processes (with stevedoring staff involved)
I13 Delay in the cargo loading
I14 Accidents/break downs of the equipment (towing units)
I15 Ship breakdown
I16 Interference with the normal performance of other ships
5.3.2 Relationship between disruptions and their causes and consequences
A vulnerability assessment must include, necessarily, the study of what the effects (consequences)
of the identified disruptions are. The goal of this chapter requires identification of what the causes
are, the degree to which they cause the disruptions, and, from there, the probability of occurrence
of certain consequences. Identifying causes and consequences is the fourth and last layer of those
established by Nedeß et al. (23) as necessary to make the taxonomy of the vulnerabilities in the
processes of a terminal.
Initial relationship-trees
The relationship of causes with disruptions and, eventually, consequences, makes advisable to
draw the relationship-arborescences that intertwine them. Because of the relationship complexity
of the physical processes that occur in a RoPax terminal, building a global relationship-tree is an
overwhelming task, and its result would have been too difficult to handle
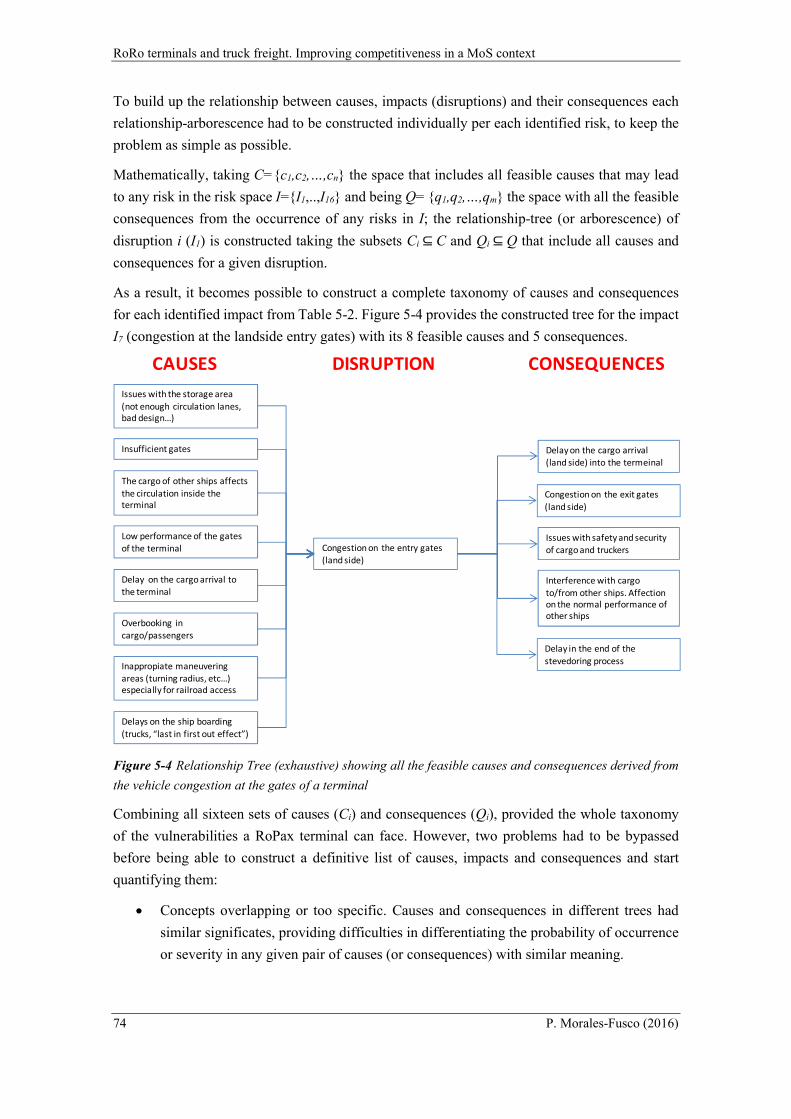
RoRo terminals and truck freight. Improving competitiveness in a MoS context
74 P. Morales-Fusco (2016)
To build up the relationship between causes, impacts (disruptions) and their consequences each
relationship-arborescence had to be constructed individually per each identified risk, to keep the
problem as simple as possible.
Mathematically, taking C={c1,c2,…,cn} the space that includes all feasible causes that may lead
to any risk in the risk space I={I1,..,I16} and being Q= {q1,q2,…,qm} the space with all the feasible
consequences from the occurrence of any risks in I; the relationship-tree (or arborescence) of
disruption i (I1) is constructed taking the subsets Ci ⊆ C and Qi ⊆ Q that include all causes and
consequences for a given disruption.
As a result, it becomes possible to construct a complete taxonomy of causes and consequences
for each identified impact from Table 5-2. Figure 5-4 provides the constructed tree for the impact
I7 (congestion at the landside entry gates) with its 8 feasible causes and 5 consequences.
Figure 5-4 Relationship Tree (exhaustive) showing all the feasible causes and consequences derived from
the vehicle congestion at the gates of a terminal
Combining all sixteen sets of causes (Ci) and consequences (Qi), provided the whole taxonomy
of the vulnerabilities a RoPax terminal can face. However, two problems had to be bypassed
before being able to construct a definitive list of causes, impacts and consequences and start
quantifying them:
Concepts overlapping or too specific. Causes and consequences in different trees had
similar significates, providing difficulties in differentiating the probability of occurrence
or severity in any given pair of causes (or consequences) with similar meaning.
Issues with the storage area
(not enough circulation lanes, bad design…)
Insufficient gates
Low performance of the gatesof the terminal
The cargo of other ships affects
the circulation inside theterminal
Congestion on the entry gates(land side)
Delay on the cargo arrival(land side) into the termeinal
Issues with safety and securityof cargo and truckers
CAUSES DISRUPTION CONSEQUENCES
Interference with cargo
to/from other ships. Affectionon the normal performance of other ships
Congestion on the exit gates
(land side)
Delay on the cargo arrival tothe terminal
Overbooking in cargo/passengers
Inappropiate maneuveringareas (turning radius, etc…) especially for railroad access
Delay in the end of the
stevedoring process
Delays on the ship boarding
(trucks, “last in first out effect”)
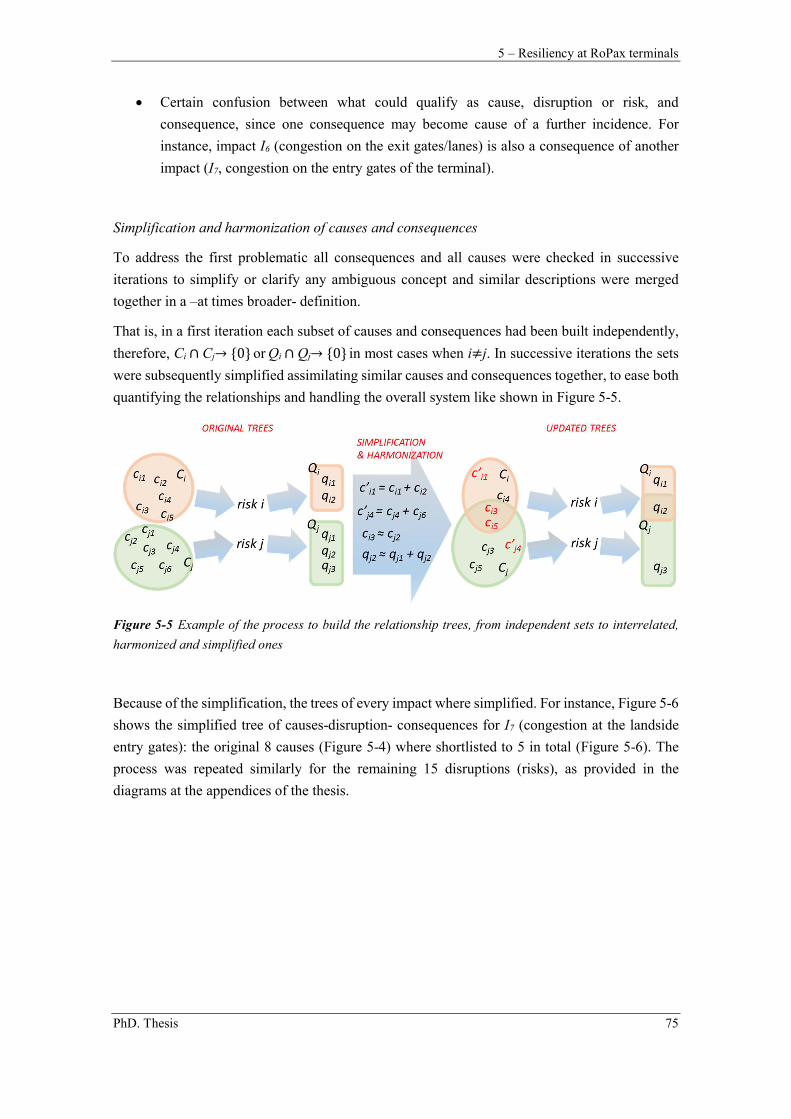
5 – Resiliency at RoPax terminals
PhD. Thesis 75
Certain confusion between what could qualify as cause, disruption or risk, and
consequence, since one consequence may become cause of a further incidence. For
instance, impact I6 (congestion on the exit gates/lanes) is also a consequence of another
impact (I7, congestion on the entry gates of the terminal).
Simplification and harmonization of causes and consequences
To address the first problematic all consequences and all causes were checked in successive
iterations to simplify or clarify any ambiguous concept and similar descriptions were merged
together in a –at times broader- definition.
That is, in a first iteration each subset of causes and consequences had been built independently,
therefore, Ci ∩ Cj→ {0} or Qi ∩ Qj→ {0} in most cases when i≠j. In successive iterations the sets
were subsequently simplified assimilating similar causes and consequences together, to ease both
quantifying the relationships and handling the overall system like shown in Figure 5-5.
Figure 5-5 Example of the process to build the relationship trees, from independent sets to interrelated,
harmonized and simplified ones
Because of the simplification, the trees of every impact where simplified. For instance, Figure 5-6
shows the simplified tree of causes-disruption- consequences for I7 (congestion at the landside
entry gates): the original 8 causes (Figure 5-4) where shortlisted to 5 in total (Figure 5-6). The
process was repeated similarly for the remaining 15 disruptions (risks), as provided in the
diagrams at the appendices of the thesis.
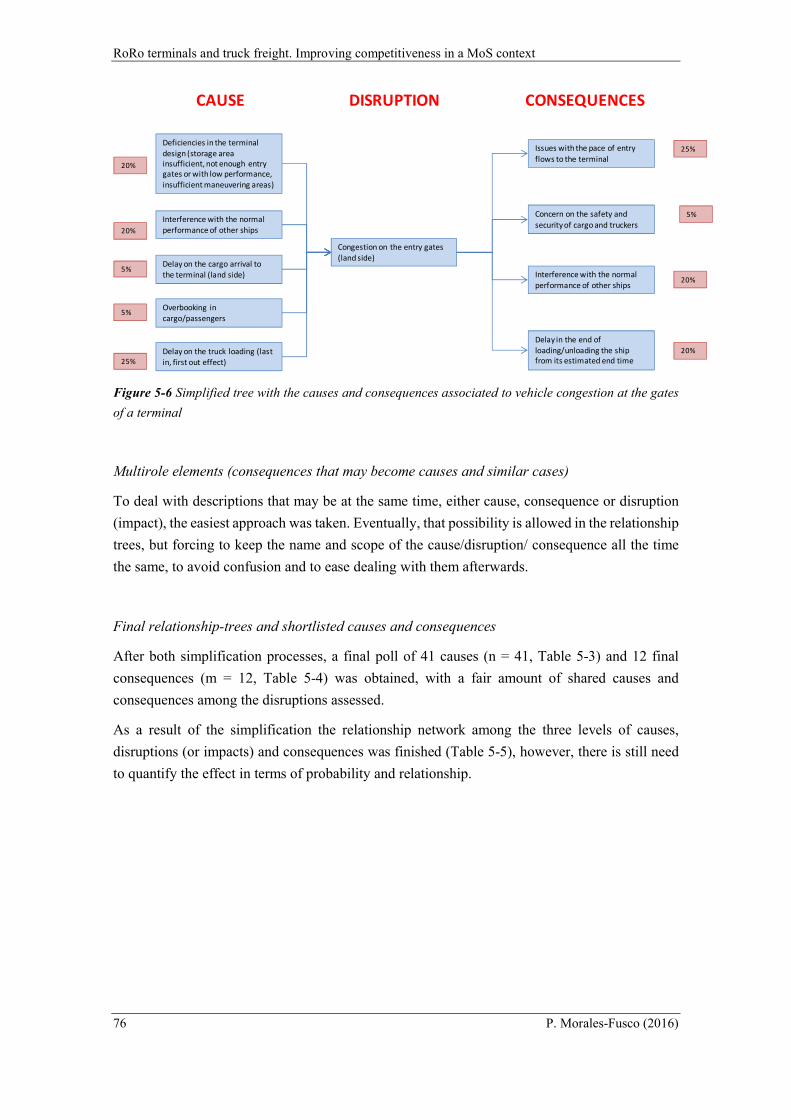
RoRo terminals and truck freight. Improving competitiveness in a MoS context
76 P. Morales-Fusco (2016)
Figure 5-6 Simplified tree with the causes and consequences associated to vehicle congestion at the gates
of a terminal
Multirole elements (consequences that may become causes and similar cases)
To deal with descriptions that may be at the same time, either cause, consequence or disruption
(impact), the easiest approach was taken. Eventually, that possibility is allowed in the relationship
trees, but forcing to keep the name and scope of the cause/disruption/ consequence all the time
the same, to avoid confusion and to ease dealing with them afterwards.
Final relationship-trees and shortlisted causes and consequences
After both simplification processes, a final poll of 41 causes (n = 41, Table 5-3) and 12 final
consequences (m = 12, Table 5-4) was obtained, with a fair amount of shared causes and
consequences among the disruptions assessed.
As a result of the simplification the relationship network among the three levels of causes,
disruptions (or impacts) and consequences was finished (Table 5-5), however, there is still need
to quantify the effect in terms of probability and relationship.
Congestion on the entry gates(land side)
Issues with the pace of entry
flows to the terminal
Concern on the safety and
security of cargo and truckers
CAUSE DISRUPTION CONSEQUENCES
Interference with the normal performance of other ships
Delay on the cargo arrival to the terminal (land side)
Overbooking in cargo/passengers
Delay on the truck loading (last in, first out effect)
Deficiencies in the terminal design (storage area insufficient, not enough entry gates or with low performance, insufficient maneuvering areas)
Interference with the normal performance of other ships
Delay in the end of loading/unloading the ship from its estimated end time
20%
20%
5%
5%
25%
25%
5%
20%
20%
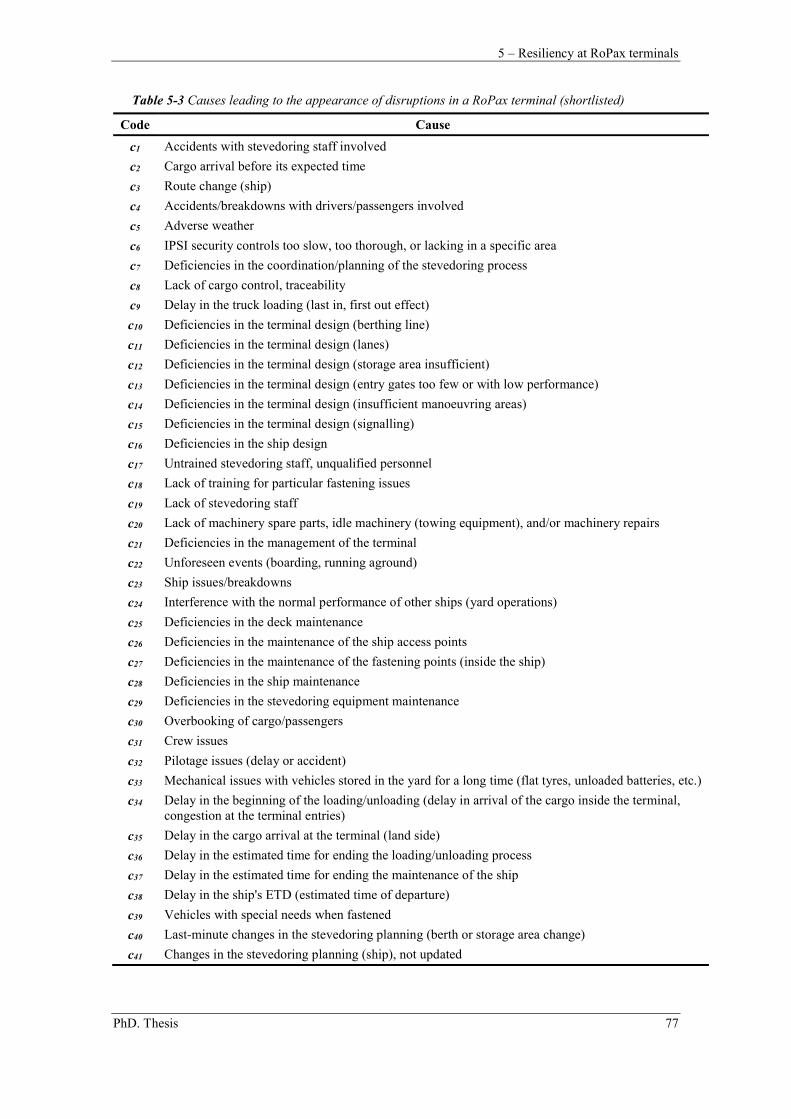
5 – Resiliency at RoPax terminals
PhD. Thesis 77
Table 5-3 Causes leading to the appearance of disruptions in a RoPax terminal (shortlisted)
Code Cause
c1 Accidents with stevedoring staff involved
c2 Cargo arrival before its expected time
c3 Route change (ship)
c4 Accidents/breakdowns with drivers/passengers involved
c5 Adverse weather
c6 IPSI security controls too slow, too thorough, or lacking in a specific area
c7 Deficiencies in the coordination/planning of the stevedoring process
c8 Lack of cargo control, traceability
c9 Delay in the truck loading (last in, first out effect)
c10 Deficiencies in the terminal design (berthing line)
c11 Deficiencies in the terminal design (lanes)
c12 Deficiencies in the terminal design (storage area insufficient)
c13 Deficiencies in the terminal design (entry gates too few or with low performance)
c14 Deficiencies in the terminal design (insufficient manoeuvring areas)
c15 Deficiencies in the terminal design (signalling)
c16 Deficiencies in the ship design
c17 Untrained stevedoring staff, unqualified personnel
c18 Lack of training for particular fastening issues
c19 Lack of stevedoring staff
c20 Lack of machinery spare parts, idle machinery (towing equipment), and/or machinery repairs
c21 Deficiencies in the management of the terminal
c22 Unforeseen events (boarding, running aground)
c23 Ship issues/breakdowns
c24 Interference with the normal performance of other ships (yard operations)
c25 Deficiencies in the deck maintenance
c26 Deficiencies in the maintenance of the ship access points
c27 Deficiencies in the maintenance of the fastening points (inside the ship)
c28 Deficiencies in the ship maintenance
c29 Deficiencies in the stevedoring equipment maintenance
c30 Overbooking of cargo/passengers
c31 Crew issues
c32 Pilotage issues (delay or accident)
c33 Mechanical issues with vehicles stored in the yard for a long time (flat tyres, unloaded batteries, etc.)
c34 Delay in the beginning of the loading/unloading (delay in arrival of the cargo inside the terminal, congestion at the terminal entries)
c35 Delay in the cargo arrival at the terminal (land side)
c36 Delay in the estimated time for ending the loading/unloading process
c37 Delay in the estimated time for ending the maintenance of the ship
c38 Delay in the ship's ETD (estimated time of departure)
c39 Vehicles with special needs when fastened
c40 Last-minute changes in the stevedoring planning (berth or storage area change)
c41 Changes in the stevedoring planning (ship), not updated
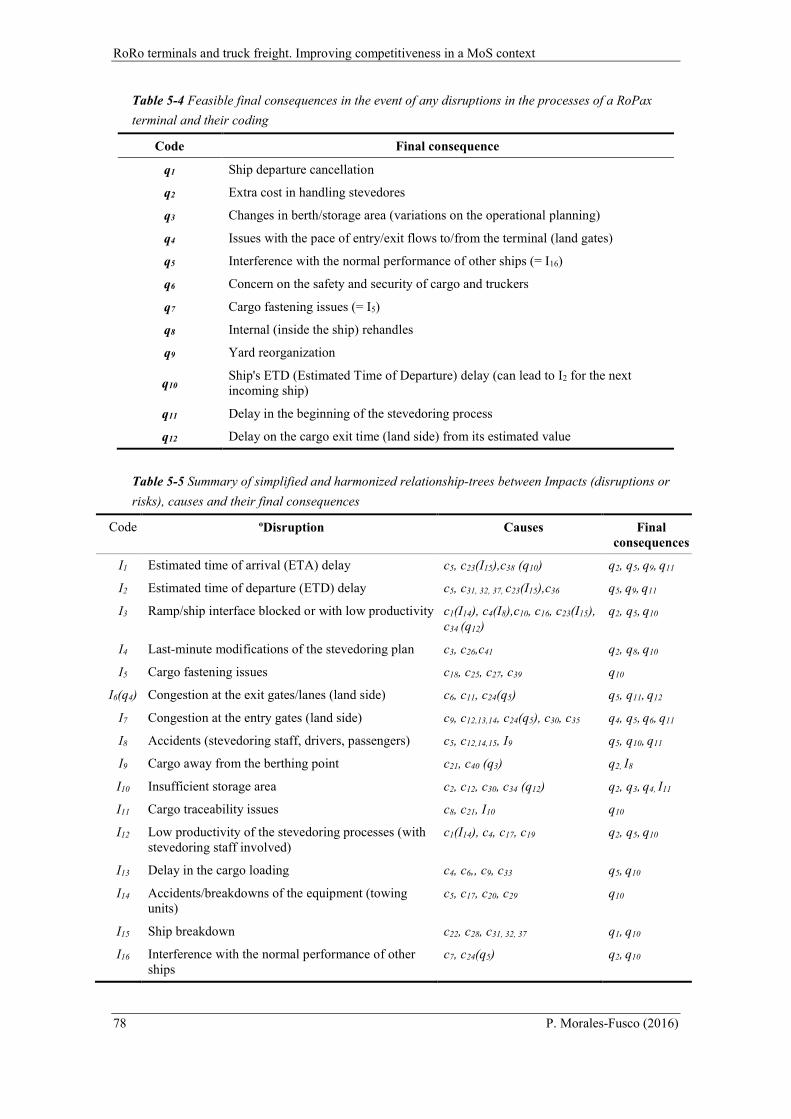
RoRo terminals and truck freight. Improving competitiveness in a MoS context
78 P. Morales-Fusco (2016)
Table 5-4 Feasible final consequences in the event of any disruptions in the processes of a RoPax
terminal and their coding
Code Final consequence
q1 Ship departure cancellation
q2 Extra cost in handling stevedores
q3 Changes in berth/storage area (variations on the operational planning)
q4 Issues with the pace of entry/exit flows to/from the terminal (land gates)
q5 Interference with the normal performance of other ships (= I16)
q6 Concern on the safety and security of cargo and truckers
q7 Cargo fastening issues (= I5)
q8 Internal (inside the ship) rehandles
q9 Yard reorganization
q10 Ship's ETD (Estimated Time of Departure) delay (can lead to I2 for the next incoming ship)
q11 Delay in the beginning of the stevedoring process
q12 Delay on the cargo exit time (land side) from its estimated value
Table 5-5 Summary of simplified and harmonized relationship-trees between Impacts (disruptions or
risks), causes and their final consequences
Code ºDisruption Causes Final consequences
I1 Estimated time of arrival (ETA) delay c5, c23(I15),c38 (q10) q2, q5, q9, q11
I2 Estimated time of departure (ETD) delay c5, c31, 32, 37, c23(I15),c36 q5, q9, q11
I3 Ramp/ship interface blocked or with low productivity c1(I14), c4(I8),c10, c16, c23(I15), c34 (q12)
q2, q5, q10
I4 Last-minute modifications of the stevedoring plan c3, c26,c41 q2, q8, q10
I5 Cargo fastening issues c18, c25, c27, c39 q10
I6(q4) Congestion at the exit gates/lanes (land side) c6, c11, c24(q5) q5, q11, q12
I7 Congestion at the entry gates (land side) c9, c12,13,14, c24(q5), c30, c35 q4, q5, q6, q11
I8 Accidents (stevedoring staff, drivers, passengers) c5, c12,14,15, I9 q5, q10, q11
I9 Cargo away from the berthing point c21, c40 (q3) q2, I8
I10 Insufficient storage area c2, c12, c30, c34 (q12) q2, q3, q4, I11
I11 Cargo traceability issues c8, c21, I10 q10
I12 Low productivity of the stevedoring processes (with stevedoring staff involved)
c1(I14), c4, c17, c19 q2, q5, q10
I13 Delay in the cargo loading c4, c6,, c9, c33 q5, q10
I14 Accidents/breakdowns of the equipment (towing units)
c5, c17, c20, c29 q10
I15 Ship breakdown c22, c28, c31, 32, 37 q1, q10
I16 Interference with the normal performance of other ships
c7, c24(q5) q2, q10
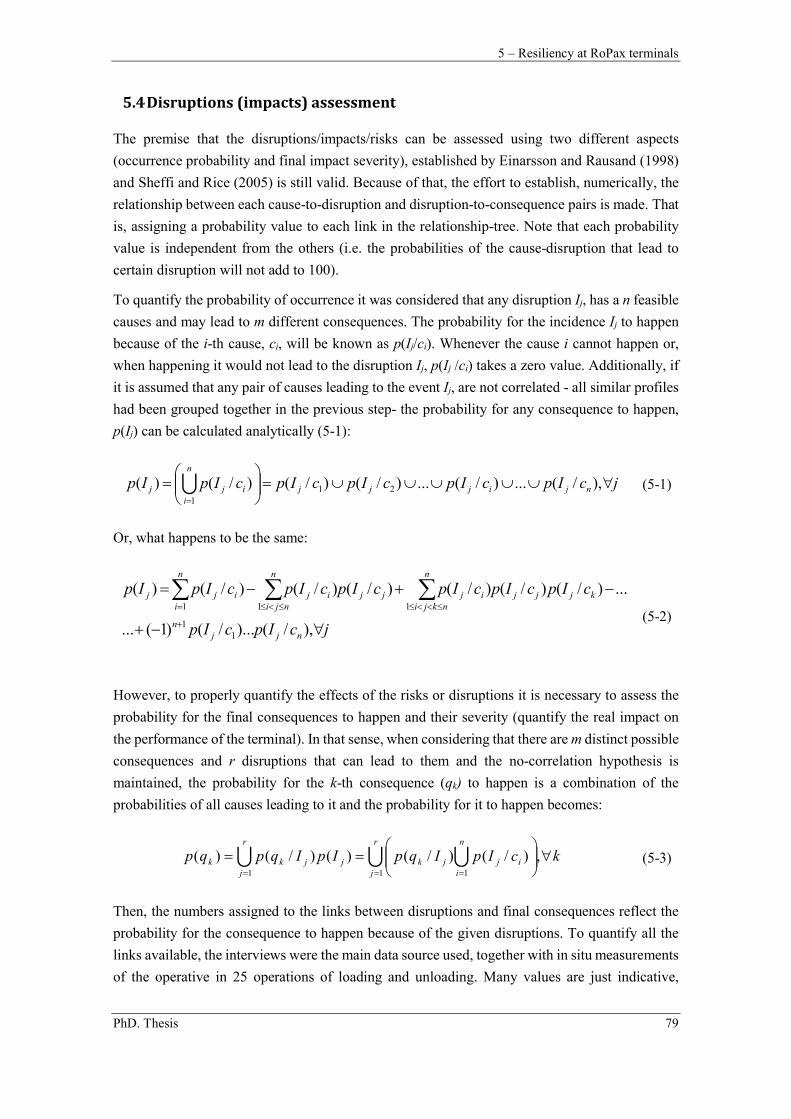
5 – Resiliency at RoPax terminals
PhD. Thesis 79
5.4 Disruptions (impacts) assessment
The premise that the disruptions/impacts/risks can be assessed using two different aspects
(occurrence probability and final impact severity), established by Einarsson and Rausand (1998)
and Sheffi and Rice (2005) is still valid. Because of that, the effort to establish, numerically, the
relationship between each cause-to-disruption and disruption-to-consequence pairs is made. That
is, assigning a probability value to each link in the relationship-tree. Note that each probability
value is independent from the others (i.e. the probabilities of the cause-disruption that lead to
certain disruption will not add to 100).
To quantify the probability of occurrence it was considered that any disruption Ij, has a n feasible
causes and may lead to m different consequences. The probability for the incidence Ij to happen
because of the i-th cause, ci, will be known as p(Ij/ci). Whenever the cause i cannot happen or,
when happening it would not lead to the disruption Ij, p(Ij /ci) takes a zero value. Additionally, if
it is assumed that any pair of causes leading to the event Ij, are not correlated - all similar profiles
had been grouped together in the previous step- the probability for any consequence to happen,
p(Ij) can be calculated analytically (5-1):
jcIpcIpcIpcIpcIpIp njijjj
n
i
ijj
),/(...)/(...)/()/()/()( 21
1
(5-1)
Or, what happens to be the same:
jcIpcIp
cIpcIpcIpcIpcIpcIpIp
njjn
kjjj
n
nkjiijjj
n
njiij
n
iijj
),/().../()1(...
...)/()/()/()/()/()/()(
11
111
(5-2)
However, to properly quantify the effects of the risks or disruptions it is necessary to assess the
probability for the final consequences to happen and their severity (quantify the real impact on
the performance of the terminal). In that sense, when considering that there are m distinct possible
consequences and r disruptions that can lead to them and the no-correlation hypothesis is
maintained, the probability for the k-th consequence (qk) to happen is a combination of the
probabilities of all causes leading to it and the probability for it to happen becomes:
kcIpIqpIpIqpqpr
j
n
iijjk
r
jjjkk
,)/()/()()/()(1 11
(5-3)
Then, the numbers assigned to the links between disruptions and final consequences reflect the
probability for the consequence to happen because of the given disruptions. To quantify all the
links available, the interviews were the main data source used, together with in situ measurements
of the operative in 25 operations of loading and unloading. Many values are just indicative,
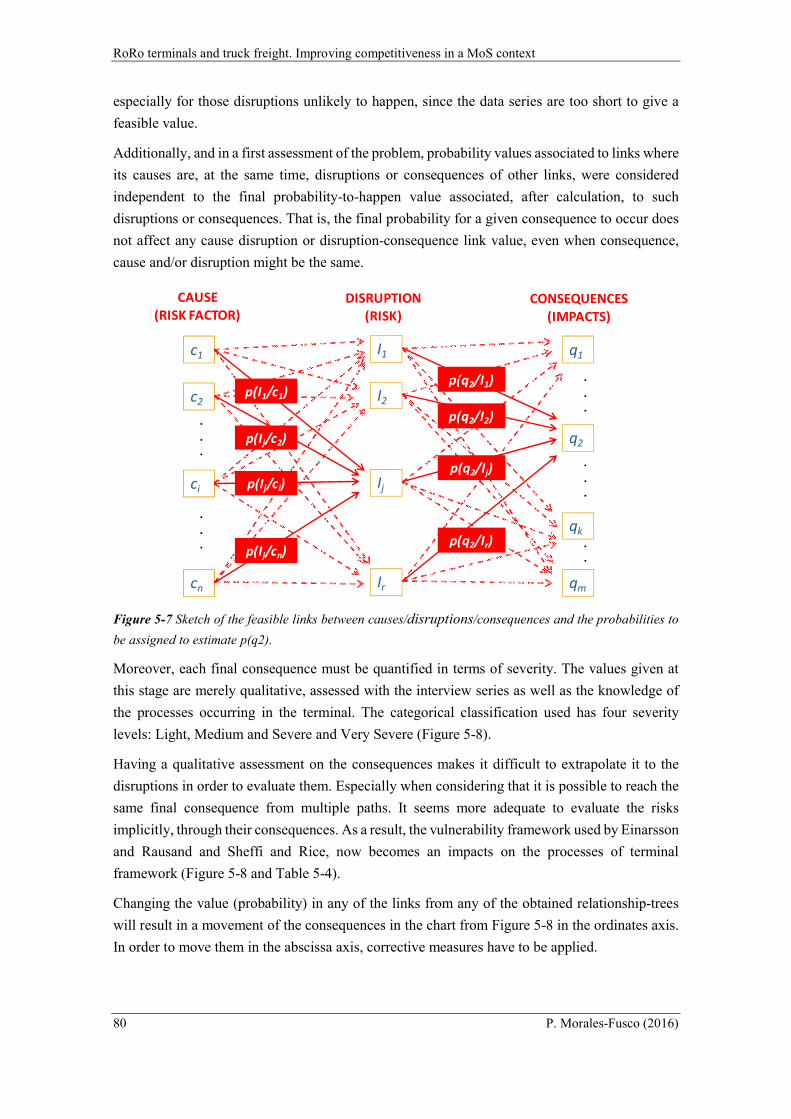
RoRo terminals and truck freight. Improving competitiveness in a MoS context
80 P. Morales-Fusco (2016)
especially for those disruptions unlikely to happen, since the data series are too short to give a
feasible value.
Additionally, and in a first assessment of the problem, probability values associated to links where
its causes are, at the same time, disruptions or consequences of other links, were considered
independent to the final probability-to-happen value associated, after calculation, to such
disruptions or consequences. That is, the final probability for a given consequence to occur does
not affect any cause disruption or disruption-consequence link value, even when consequence,
cause and/or disruption might be the same.
Figure 5-7 Sketch of the feasible links between causes/disruptions/consequences and the probabilities to
be assigned to estimate p(q2).
Moreover, each final consequence must be quantified in terms of severity. The values given at
this stage are merely qualitative, assessed with the interview series as well as the knowledge of
the processes occurring in the terminal. The categorical classification used has four severity
levels: Light, Medium and Severe and Very Severe (Figure 5-8).
Having a qualitative assessment on the consequences makes it difficult to extrapolate it to the
disruptions in order to evaluate them. Especially when considering that it is possible to reach the
same final consequence from multiple paths. It seems more adequate to evaluate the risks
implicitly, through their consequences. As a result, the vulnerability framework used by Einarsson
and Rausand and Sheffi and Rice, now becomes an impacts on the processes of terminal
framework (Figure 5-8 and Table 5-4).
Changing the value (probability) in any of the links from any of the obtained relationship-trees
will result in a movement of the consequences in the chart from Figure 5-8 in the ordinates axis.
In order to move them in the abscissa axis, corrective measures have to be applied.
I1c1
CAUSE (RISK FACTOR)
DISRUPTION (RISK)
CONSEQUENCES (IMPACTS)
q1
c2
ci
cn
I2
Ij
Ir
q2
qk
qm
p(q2/I1)
p(Ij/cn)
p(Ij/ci)
p(I1/c1)
p(Ij/c2)
p(q2/I2)
p(q2/Ij)
p(q2/Ir)
. .
.
. .
..
. .
. .
.
. .
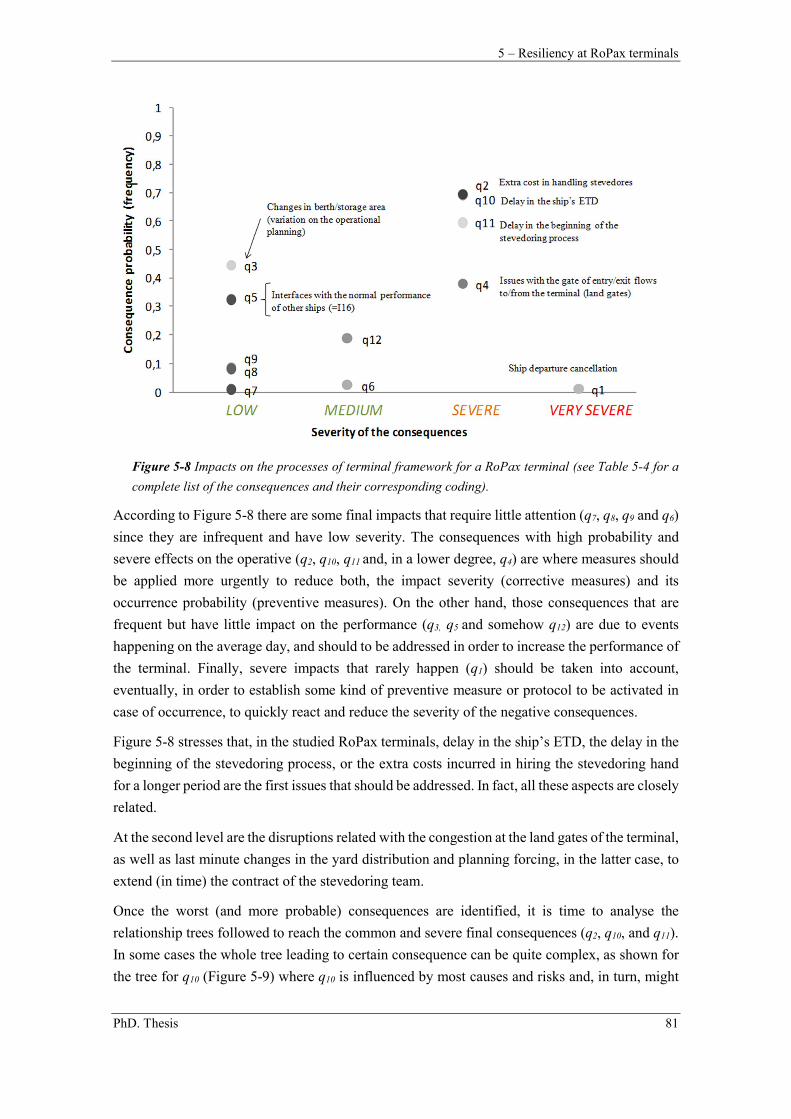
5 – Resiliency at RoPax terminals
PhD. Thesis 81
Figure 5-8 Impacts on the processes of terminal framework for a RoPax terminal (see Table 5-4 for a
complete list of the consequences and their corresponding coding).
According to Figure 5-8 there are some final impacts that require little attention (q7, q8, q9 and q6)
since they are infrequent and have low severity. The consequences with high probability and
severe effects on the operative (q2, q10, q11 and, in a lower degree, q4) are where measures should
be applied more urgently to reduce both, the impact severity (corrective measures) and its
occurrence probability (preventive measures). On the other hand, those consequences that are
frequent but have little impact on the performance (q3, q5 and somehow q12) are due to events
happening on the average day, and should to be addressed in order to increase the performance of
the terminal. Finally, severe impacts that rarely happen (q1) should be taken into account,
eventually, in order to establish some kind of preventive measure or protocol to be activated in
case of occurrence, to quickly react and reduce the severity of the negative consequences.
Figure 5-8 stresses that, in the studied RoPax terminals, delay in the ship’s ETD, the delay in the
beginning of the stevedoring process, or the extra costs incurred in hiring the stevedoring hand
for a longer period are the first issues that should be addressed. In fact, all these aspects are closely
related.
At the second level are the disruptions related with the congestion at the land gates of the terminal,
as well as last minute changes in the yard distribution and planning forcing, in the latter case, to
extend (in time) the contract of the stevedoring team.
Once the worst (and more probable) consequences are identified, it is time to analyse the
relationship trees followed to reach the common and severe final consequences (q2, q10, and q11).
In some cases the whole tree leading to certain consequence can be quite complex, as shown for
the tree for q10 (Figure 5-9) where q10 is influenced by most causes and risks and, in turn, might
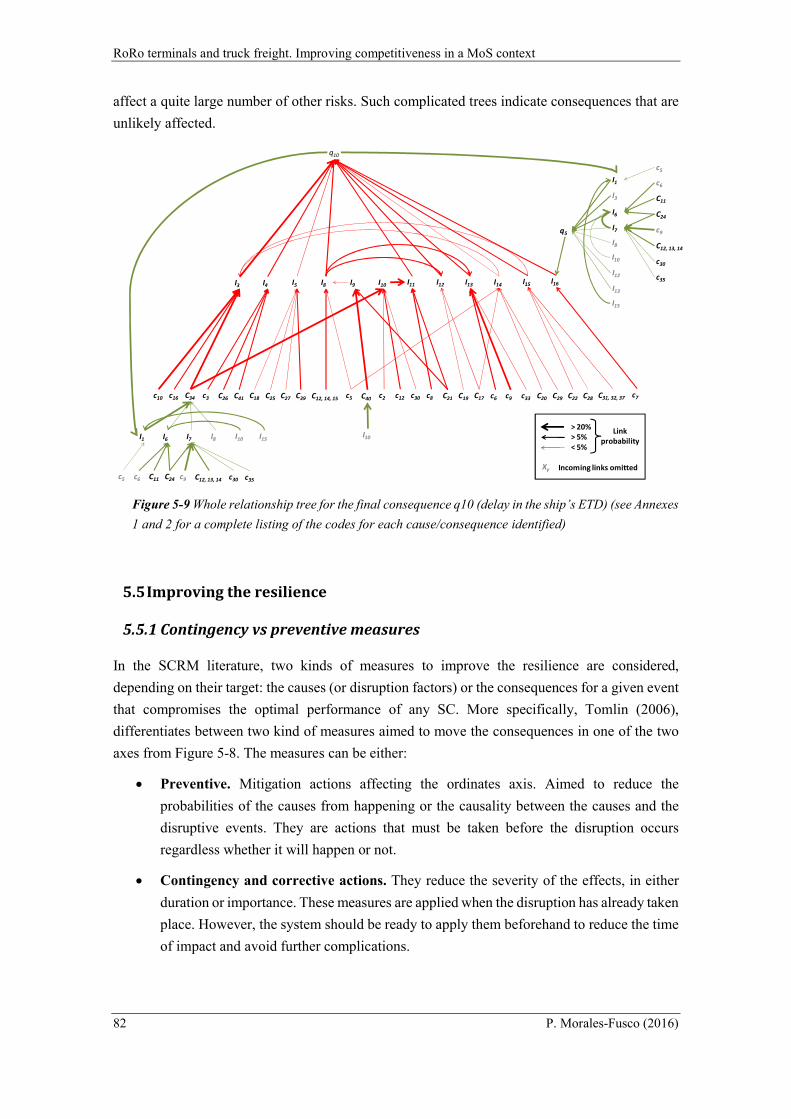
RoRo terminals and truck freight. Improving competitiveness in a MoS context
82 P. Morales-Fusco (2016)
affect a quite large number of other risks. Such complicated trees indicate consequences that are
unlikely affected.
Figure 5-9 Whole relationship tree for the final consequence q10 (delay in the ship’s ETD) (see Annexes
1 and 2 for a complete listing of the codes for each cause/consequence identified)
5.5 Improving the resilience
5.5.1 Contingency vs preventive measures
In the SCRM literature, two kinds of measures to improve the resilience are considered,
depending on their target: the causes (or disruption factors) or the consequences for a given event
that compromises the optimal performance of any SC. More specifically, Tomlin (2006),
differentiates between two kind of measures aimed to move the consequences in one of the two
axes from Figure 5-8. The measures can be either:
Preventive. Mitigation actions affecting the ordinates axis. Aimed to reduce the
probabilities of the causes from happening or the causality between the causes and the
disruptive events. They are actions that must be taken before the disruption occurs
regardless whether it will happen or not.
Contingency and corrective actions. They reduce the severity of the effects, in either
duration or importance. These measures are applied when the disruption has already taken
place. However, the system should be ready to apply them beforehand to reduce the time
of impact and avoid further complications.
c5
q10
I4 I5 I8 I11 I12 I13 I14 I15 I16
c6 c7c8 c9C12, 14, 15 C17c3 C18 C19 C20C21 C22C25C26 C27 C28C29 C31, 32, 37C39C41
I3
c10 c16
I9 I10
C40 c2 c12 c30 c33
q5
I6
I7
C11
C24
C12, 13, 14
C34
c35
I1
I3
c6
c9
c30
I8
I12
I13
I6 I7I1 I8
C11 C24 C12, 13, 14 c35c6 c9 c30
I10
I10
I10
c5
I15
c5
I15
> 20%> 5%< 5%
Link probability
Xy Incoming links omitted
5 – Resiliency at RoPax terminals
PhD. Thesis 83
Translated into the consequences framework of Figure 5-8, it can be considered that preventive
measures are aimed at reducing the probability of occurrence of the disruption (ordinates axis)
while contingency measures are aimed at reducing the severity level (abscissa). However, some
preventive measures might reduce the severity of the final consequences, becoming both
preventive and mitigation measures.
Using the taxonomy of the causes, disruptions and consequences, a first approach to the families
of measures available can be hinted at, as shown in Table 5-6, although it is not fully developed.
Table 5-6 Lines of action concerning preventive measures
Preventive (mitigation) measures
Agreements between terminals
Management improvement and cargo traceability (investment in technology)
Stevedores trainment
Quality control and management
Investment in equipments (overcapacity and better performance)
Investment in infrastructure (overcapacity)
However, it should be taken into account that these measures may produce new disruptive events
or increase the probability or severity of some other consequences.
Almost every single disruptive event leads to a delay in the stevedoring process. This can be
reduced by contracting extra stevedoring units, which is one of the most used corrective actions
available to the shipping company. Once again, and considering the taxonomy in causes,
disruption events and final consequences, it is possible to suggest the following main lines of
corrective actions (Table 5-7):
Table 5-7 Lines of action concerning corrective measures
Corrective (contingency) measures
Contracting extra stevedoring units
Ecconomical compensation (to customers)
Repairs express (breakdowns)
Temporary equipment rental
Express training (terminal/ship/stevedoring staff)
5.5.2 Efectiveness of implemented measures
The consequences framework allows identifying directly the effects of introducing any measure
to improve the resilience of the system (in this case the RoPax terminal). However, it is necessary
to quantify the effect of the measure on the values in the relationship-trees (for preventive
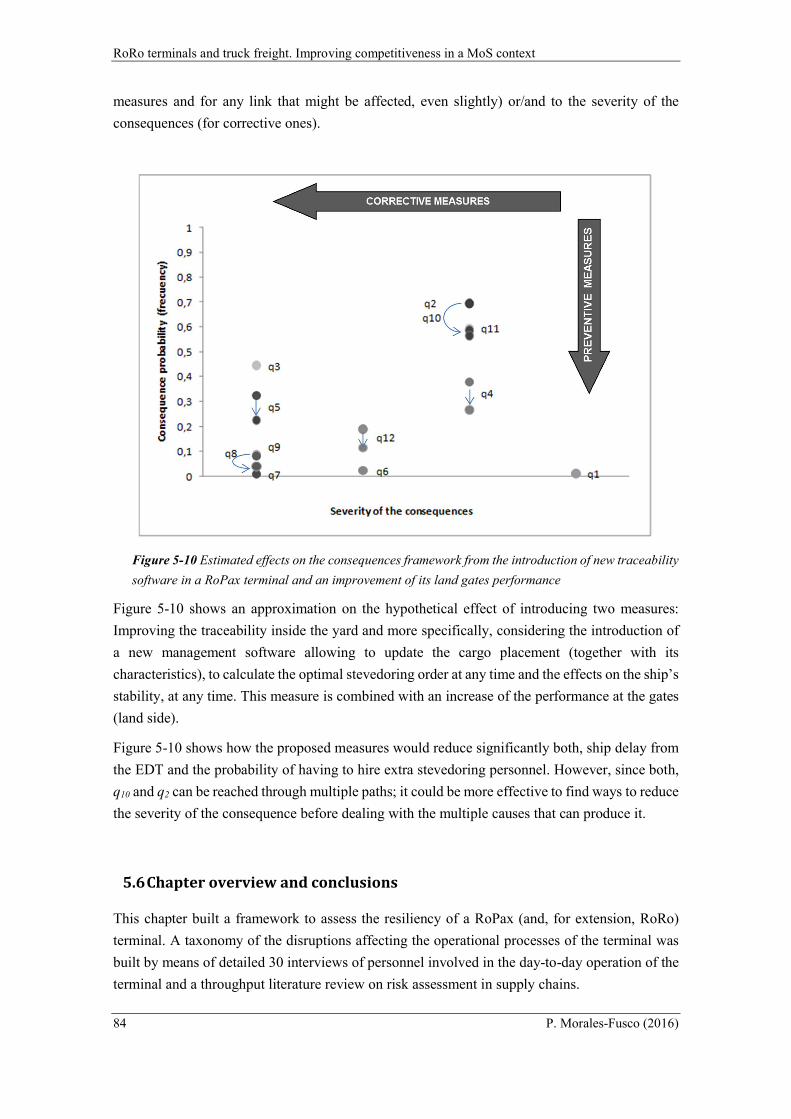
RoRo terminals and truck freight. Improving competitiveness in a MoS context
84 P. Morales-Fusco (2016)
measures and for any link that might be affected, even slightly) or/and to the severity of the
consequences (for corrective ones).
Figure 5-10 Estimated effects on the consequences framework from the introduction of new traceability
software in a RoPax terminal and an improvement of its land gates performance
Figure 5-10 shows an approximation on the hypothetical effect of introducing two measures:
Improving the traceability inside the yard and more specifically, considering the introduction of
a new management software allowing to update the cargo placement (together with its
characteristics), to calculate the optimal stevedoring order at any time and the effects on the ship’s
stability, at any time. This measure is combined with an increase of the performance at the gates
(land side).
Figure 5-10 shows how the proposed measures would reduce significantly both, ship delay from
the EDT and the probability of having to hire extra stevedoring personnel. However, since both,
q10 and q2 can be reached through multiple paths; it could be more effective to find ways to reduce
the severity of the consequence before dealing with the multiple causes that can produce it.
5.6 Chapter overview and conclusions
This chapter built a framework to assess the resiliency of a RoPax (and, for extension, RoRo)
terminal. A taxonomy of the disruptions affecting the operational processes of the terminal was
built by means of detailed 30 interviews of personnel involved in the day-to-day operation of the
terminal and a throughput literature review on risk assessment in supply chains.
5 – Resiliency at RoPax terminals
PhD. Thesis 85
As a result 16 trees of causes-disruptions -consequences were built, with interrelation between
them and the possibility to assess the probability of occurrence and severity of each final
consequence.
The main findings at the end of the chapter are:
A complete taxonomy of the disruptions or impacts in a RoPax terminal has been
developed. In addition, a framework to evaluate their consequences on the terminal
performance, in terms of severity and frequency, has been built.
Delay in the ship departure, delay in the beginning of the stevedoring process, and extra
costs incurred after hiring the stevedoring hand for a longer time period (when the
stevedoring process takes longer than expected) are the most common disruptions a
RoRo/RoPax terminal can face.
Assigning a ‘single’ number to each relationship might be oversimplifying since the
‘intensity’ of the disruption is never assessed, for instance lack of storage area can have
small or high final consequences depending on how much extra area is needed. This is
somehow addressed already by using the set of values in the disruption-consequences
links, since in the interviews and terminal records, ‘more intense’ disruptions will be
accounted for with more probability. However, this thesis would benefit from a further
research on how to work with fuzzy or probability values instead of ‘single values’ and
their effect on the consequences framework and relationship trees provided in this chapter
as well as a larger set of terminal records conducted specifically to quantify the
disruptions.

RoRo terminals and truck freight. Improving competitiveness in a MoS context
86 P. Morales-Fusco (2016)
6 – Cost structure of freight distribution strategies integrating a RoPax-MoS link
PhD. Thesis 87
6. Cost structure of freight distribution strategies integrating a RoPax-MoS link
Chapter 6
Cost structure of freight distribution
strategies integrating a RoPax-MoS link
The last research included (this chapter and the next one) continues with the task to analyse the
transportation chain integrating motorways of the sea as a whole and compare it with its only-
road counterpart.
The chapter analyses how the strategy taken by the cargo carrier when using motorways of the
sea (understood as regular roll on/roll off short sea shipping lines) affects the competitiveness of
the shipping line. Five different strategies are analysed and grouped into three main types: road
door-to-door transportation, road and sea transportation combined with a driver always
accompanying the cargo and road and sea transportation where the cargo travels unaccompanied.
The analysis provides formulae to calculate the economical and temporal cost differences from
using a sea link in distribution and assesses the risk and investments necessary to maximize the
profit for each strategy. The chapter ends identifying the critical points affecting the
competitiveness of short sea shipping roll on/roll off lines and proposes policies that could help
in its development and success.
6.1 Introduction and objectives
As it has been already established in the literature review, multimodal transportation integrating
a SSS (MoS) link has been widely studied as an alternative to road door-to-door transportation.
The main approaches being to assess the determinants behind transportation choice, mainly from
an operational point of view focused on a specific corridor either in research papers (d Este, 1992;
RoRo terminals and truck freight. Improving competitiveness in a MoS context
88 P. Morales-Fusco (2016)
Marzano et al., 2009; Perakis and Denisis, 2008) or projects (Baird, 2007; Buck Consultants
International, 2014; Castells Sanabra, 2009).
Further research has been done on who is the responsible of planning the transportation of goods,
and how the maturity of the market might affect the final choice. Interesting research in that field
has been done by Feo-Valero and García-Menéndez. (Feo et al., 2011; Garcia-Menendez et al.,
2009) by using the INCOTERMs code as a dummy variable in the development of its LOGIT
discrete choice. As a result, they realized that Freight Forwarders are less likely to use SSS
because they usually possess their own fleet of trucks -which must be paid off for- and no RoRo
alternative was considered at the time, but the use of containerized cargo. In fact, when
considering the RoRo alternative, Bergantino and Bolis (2004) had already stated it was indeed
more attractive to Freight Forwarders, since it would be more easy to them to organize a
multimodal international transportation chain.
The previous chapters concluded that multiple determinants affect the choice of a specific
transportation chain: value of cargo, volume sent, perishability or the decision maker, can all be
significant. The factors or determinants that apparently all shippers or forwarders are going to
take into account are 3: cost, time and quality, being the later more of a threshold than a continuous
variable to consider (Bergantino and Bolis, 2004). A more detailed list of the variables identified
in the past (and used) in the construction of discrete choice models on the topic can be found in
Feo-Valero et al. (2011). In fact the whole collection of papers participated by Feo-Valero and
García-Menéndez (Arencibia et al., 2015; Espino et al., 2007; Feo et al., 2011; Garcia-Menendez
et al., 2009) on the determinants behind the choice of MoS in the Spanish case provides a great
overview on the topic and in fact it will be approached again at Chapter 7, with the construction
of a discrete choice model.
This chapter, in fact, after having analysed more qualitative and reliability factors will focus on a
means to calculate cost and time of the multiple alternatives that the transporter of the cargo has
available (its business models) to be able to, finally approach the determinants behind mode
choice. The goals of this chapter are mainly two:
To assess the costs associated with each possible business model of road carriers using
an SSS link operated by RoPax ships. The costs are analyzed from the point of view of
the carrier (trucker) and, to some degree, the logistics provider. The formulae used is an
update of previous research developed by Saurí and Spuch (2010).
To identify the vulnerabilities of SSS regarding the cost components and the policy
implications derived from the cost structure.
The chapter provides an overview on the business models considered, develops a cost model for
the different transport combinations and finally assesses the results obtained after applying it to
the Spanish context.
6 – Cost structure of freight distribution strategies integrating a RoPax-MoS link
PhD. Thesis 89
6.2 Business models
Transporters using RoRo, and specially RoPax, alternatives can either travel with the cargo in the
maritime link or leave it unaccompanied (only the semi-trailer travels inside the ship). The former
is competitive only when the maritime link is used to give the truck driver enough time to rest, so
the ports have to be a certain distance from one another (Ng, 2009; Peeters et al., 1995). The later,
on the other hand, should be more competitive cost wise but more difficult to operate since it
needs the coordination of two different truck services at both ends of the transportation chain and
until recently and, therefore, was usually neglected although the benefits form the cooperation in
planning are apparent (López-Navarro, 2013a, 2013b).
Companies moving a small volume of products or with flows specially spread geographically
tend to leave route/chain details to the transporter/carrier as long as some basic requirements are
fulfilled. In such a scenario, lacking a wider planning scope, the carrier chooses the best option
expressly and usually ends up accompanying the cargo, whether it travels by road (only), rail
combined with road or SSS. The final choice will depend on quantitative (temporal length,
frequency or overall cost) and some more-difficult-to-quantify, threshold variables that cannot be
surpassed in terms of –mainly- quality (damages to the cargo, reliability, minimum frequency,
paperwork involved) (Bergantino and Bolis, 2004; d Este, 1992).
In general terms, then, and considering only RoPax vessels and road transportation, there are 3
main kinds of feasible distribution chains, each of them with some possible variations:
S1 - Only road (cargo travels accompanied all the way).
S2 - Road combined with accompanied SSS (the truck driver travels with the cargo in the
maritime leg)
S3 - Road combined with unaccompanied SSS (the truck head and driver do not travel
with the cargo in the maritime leg of the chain and there is a second driver, and head, in
the destination port).
Two alternative options are considered for the first scenario, S1: driving with a single driver
during the whole trip (S1-A) or combining several drivers, usually two (S1-B), for the same trip
and a tractor unit. In any case, the current European legislation in terms of driving times is
considered. S1-B can consider either that both drivers travel in the truck cab for the whole trip or
that the first driver alights at the terminus of its maximum driving distance for a day and leaves it
to the second driver to continue with the route. For the purposes of this chapter calculations S1-
B considers that both drivers are inside the cab all the time.
When the cargo travels unaccompanied on the maritime link (S3), it is necessary to have someone
to pick it up at the destination port. Different scenarios can be formulated depending on how the
logistics of the land/truck route is organized and on whether the truck tractor unit can have other
uses or whether it is used exclusively in the route, i.e. travelling back and forth only between the
port and the origin (or final) destination. Each sub-strategy will entail different final overall times
(the time it takes the cargo to reach the final destination) since the semitrailer will have to wait
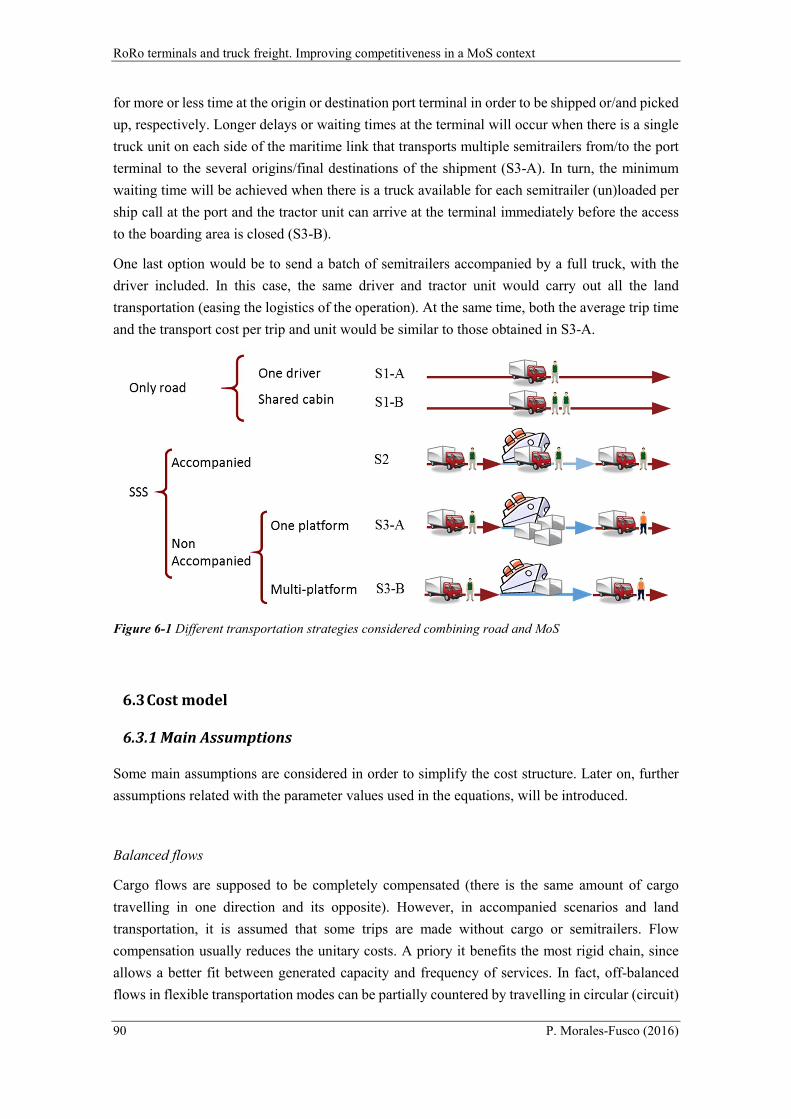
RoRo terminals and truck freight. Improving competitiveness in a MoS context
90 P. Morales-Fusco (2016)
for more or less time at the origin or destination port terminal in order to be shipped or/and picked
up, respectively. Longer delays or waiting times at the terminal will occur when there is a single
truck unit on each side of the maritime link that transports multiple semitrailers from/to the port
terminal to the several origins/final destinations of the shipment (S3-A). In turn, the minimum
waiting time will be achieved when there is a truck available for each semitrailer (un)loaded per
ship call at the port and the tractor unit can arrive at the terminal immediately before the access
to the boarding area is closed (S3-B).
One last option would be to send a batch of semitrailers accompanied by a full truck, with the
driver included. In this case, the same driver and tractor unit would carry out all the land
transportation (easing the logistics of the operation). At the same time, both the average trip time
and the transport cost per trip and unit would be similar to those obtained in S3-A.
Figure 6-1 Different transportation strategies considered combining road and MoS
6.3 Cost model
6.3.1 Main Assumptions
Some main assumptions are considered in order to simplify the cost structure. Later on, further
assumptions related with the parameter values used in the equations, will be introduced.
Balanced flows
Cargo flows are supposed to be completely compensated (there is the same amount of cargo
travelling in one direction and its opposite). However, in accompanied scenarios and land
transportation, it is assumed that some trips are made without cargo or semitrailers. Flow
compensation usually reduces the unitary costs. A priory it benefits the most rigid chain, since
allows a better fit between generated capacity and frequency of services. In fact, off-balanced
flows in flexible transportation modes can be partially countered by travelling in circular (circuit)
6 – Cost structure of freight distribution strategies integrating a RoPax-MoS link
PhD. Thesis 91
routes instead of one way-and-return trips. On the other hand, since liner shipping deals with more
than one shipper, the variability in flows can be compensated by combining the transportation
needs of several shippers, as MTOs would do in the same situation.
Symmetrical land legs
In SSS scenarios (i.e. S2, S3-A and S3-B) both land legs are considered to have exactly the same
characteristics in terms of distance travelled, driving speed, cost, etc. The measure has been
introduced to simplify the formulae used. Not applying the hypothesis would slightly affect the
performance of each transportation mode. Some cases with non-symmetrical land legs were
analysed and the only significant change that was found was the differences in truck fleet size
between the two ports considered in the S3A scenario.
Fractional number of semitrailers
In order to simplify the sensitivity analysis and to avoid singularities from appearing in the
generated graphics, semitrailers in the S3A scenario are taken as real numbers, allowing to adjust
the amount of semitrailers necessary for a maximum performance. In practice, since each ship
might transport a non-integer quantity of semitrailers, it must be considered that the costs and
times resulting from applying the model are the lower limits to the performance that might be
achieved in a real case.
Legislation
To set some parameter values (travelling speed, working hours per driver and day, required rest
times, etc) the European and Spanish legislations have been used (most restrictive whenever both
legislations overlap).
6.3.2 Cost components
The cost per unit shipped (one-way), Ctrip, is defined after five independent items:
trip F P V FRC C C C C (6-1)
Where:
CF – The fixed cost from the ownership of tractor units and semitrailers per unit shipped. Annual
fixed costs times total shipments per year.
CP – Labour (including subsistence allowance), which will depend on the length (time) of the trip.
CV –The costs related to the total distance travelled.
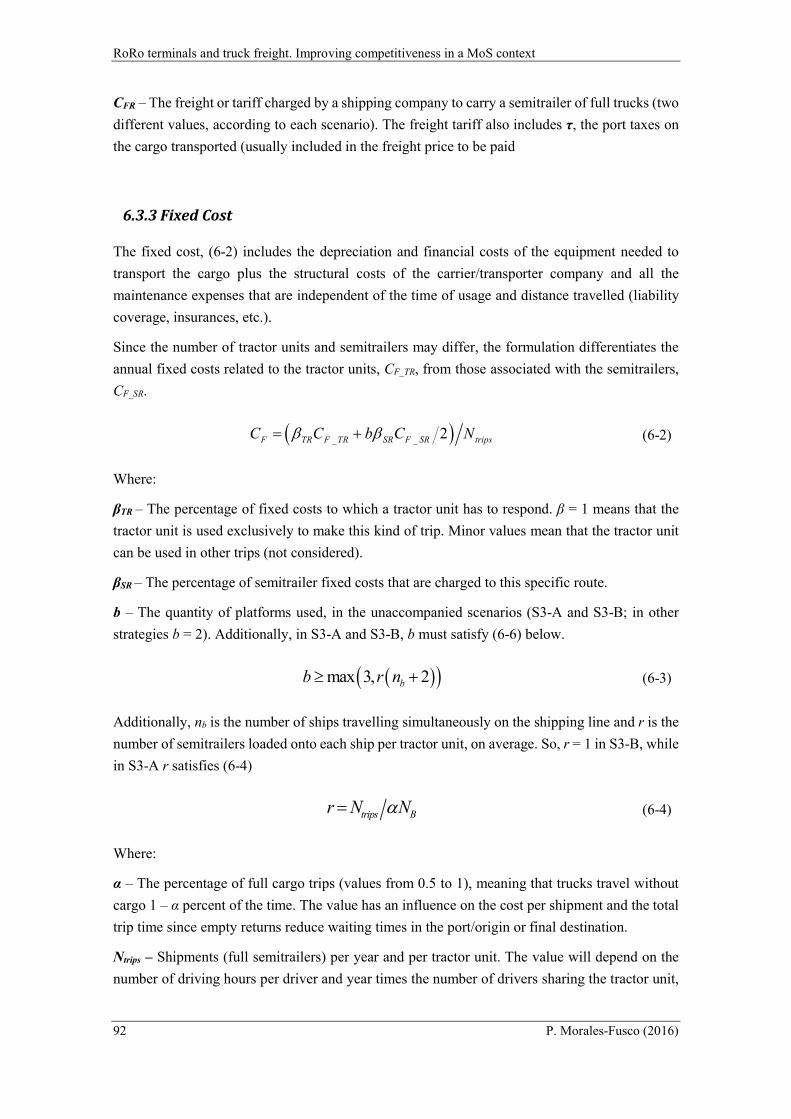
RoRo terminals and truck freight. Improving competitiveness in a MoS context
92 P. Morales-Fusco (2016)
CFR – The freight or tariff charged by a shipping company to carry a semitrailer of full trucks (two
different values, according to each scenario). The freight tariff also includes τ, the port taxes on
the cargo transported (usually included in the freight price to be paid
6.3.3 Fixed Cost
The fixed cost, (6-2) includes the depreciation and financial costs of the equipment needed to
transport the cargo plus the structural costs of the carrier/transporter company and all the
maintenance expenses that are independent of the time of usage and distance travelled (liability
coverage, insurances, etc.).
Since the number of tractor units and semitrailers may differ, the formulation differentiates the
annual fixed costs related to the tractor units, CF_TR, from those associated with the semitrailers,
CF_SR.
_ _ 2F TR F TR SR F SR tripsC C b C N (6-2)
Where:
βTR – The percentage of fixed costs to which a tractor unit has to respond. β = 1 means that the
tractor unit is used exclusively to make this kind of trip. Minor values mean that the tractor unit
can be used in other trips (not considered).
βSR – The percentage of semitrailer fixed costs that are charged to this specific route.
b – The quantity of platforms used, in the unaccompanied scenarios (S3-A and S3-B; in other
strategies b = 2). Additionally, in S3-A and S3-B, b must satisfy (6-6) below.
max 3, 2bb r n (6-3)
Additionally, nb is the number of ships travelling simultaneously on the shipping line and r is the
number of semitrailers loaded onto each ship per tractor unit, on average. So, r = 1 in S3-B, while
in S3-A r satisfies (6-4)
trips Br N N (6-4)
Where:
α – The percentage of full cargo trips (values from 0.5 to 1), meaning that trucks travel without
cargo 1 – α percent of the time. The value has an influence on the cost per shipment and the total
trip time since empty returns reduce waiting times in the port/origin or final destination.
Ntrips – Shipments (full semitrailers) per year and per tractor unit. The value will depend on the
number of driving hours per driver and year times the number of drivers sharing the tractor unit,
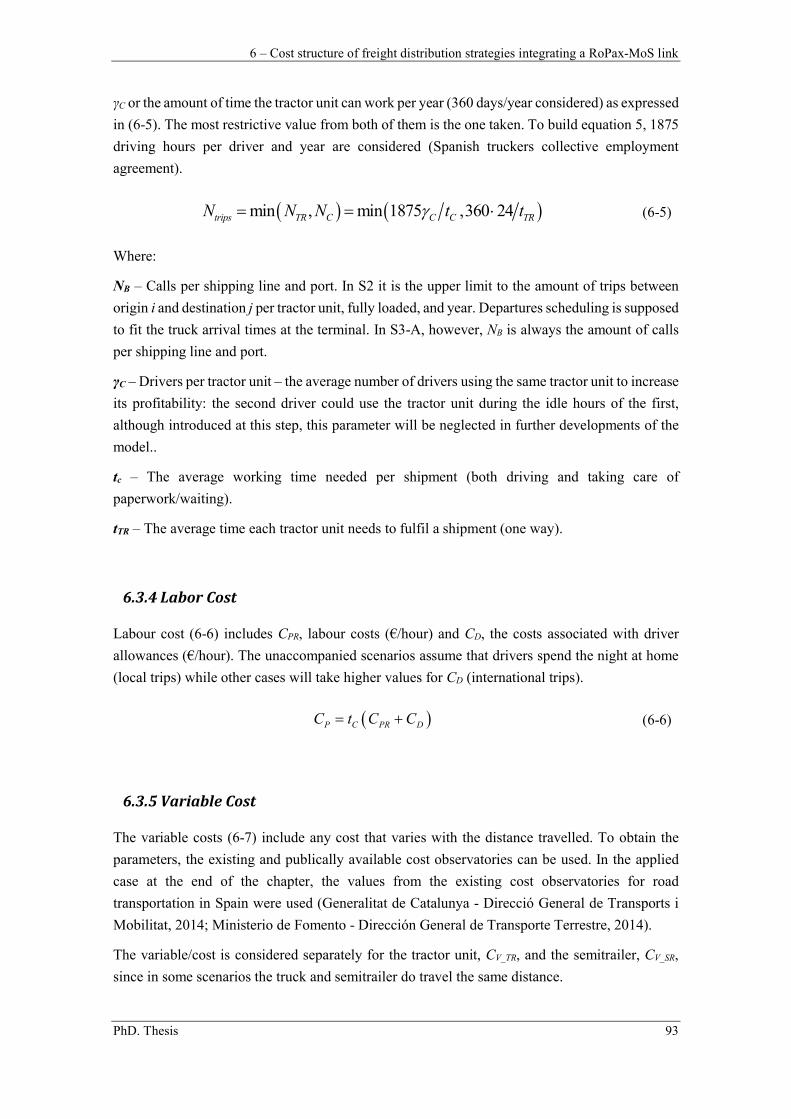
6 – Cost structure of freight distribution strategies integrating a RoPax-MoS link
PhD. Thesis 93
γC or the amount of time the tractor unit can work per year (360 days/year considered) as expressed
in (6-5). The most restrictive value from both of them is the one taken. To build equation 5, 1875
driving hours per driver and year are considered (Spanish truckers collective employment
agreement).
min , min 1875 ,360 24trips TR C C C TRN N N t t (6-5)
Where:
NB – Calls per shipping line and port. In S2 it is the upper limit to the amount of trips between
origin i and destination j per tractor unit, fully loaded, and year. Departures scheduling is supposed
to fit the truck arrival times at the terminal. In S3-A, however, NB is always the amount of calls
per shipping line and port.
γC – Drivers per tractor unit – the average number of drivers using the same tractor unit to increase
its profitability: the second driver could use the tractor unit during the idle hours of the first,
although introduced at this step, this parameter will be neglected in further developments of the
model..
tc – The average working time needed per shipment (both driving and taking care of
paperwork/waiting).
tTR – The average time each tractor unit needs to fulfil a shipment (one way).
6.3.4 Labor Cost
Labour cost (6-6) includes CPR, labour costs (€/hour) and CD, the costs associated with driver
allowances (€/hour). The unaccompanied scenarios assume that drivers spend the night at home
(local trips) while other cases will take higher values for CD (international trips).
(6-6)
6.3.5 Variable Cost
The variable costs (6-7) include any cost that varies with the distance travelled. To obtain the
parameters, the existing and publically available cost observatories can be used. In the applied
case at the end of the chapter, the values from the existing cost observatories for road
transportation in Spain were used (Generalitat de Catalunya - Direcció General de Transports i
Mobilitat, 2014; Ministerio de Fomento - Dirección General de Transporte Terrestre, 2014).
The variable/cost is considered separately for the tractor unit, CV_TR, and the semitrailer, CV_SR,
since in some scenarios the truck and semitrailer do travel the same distance.
P C PR DC t C C
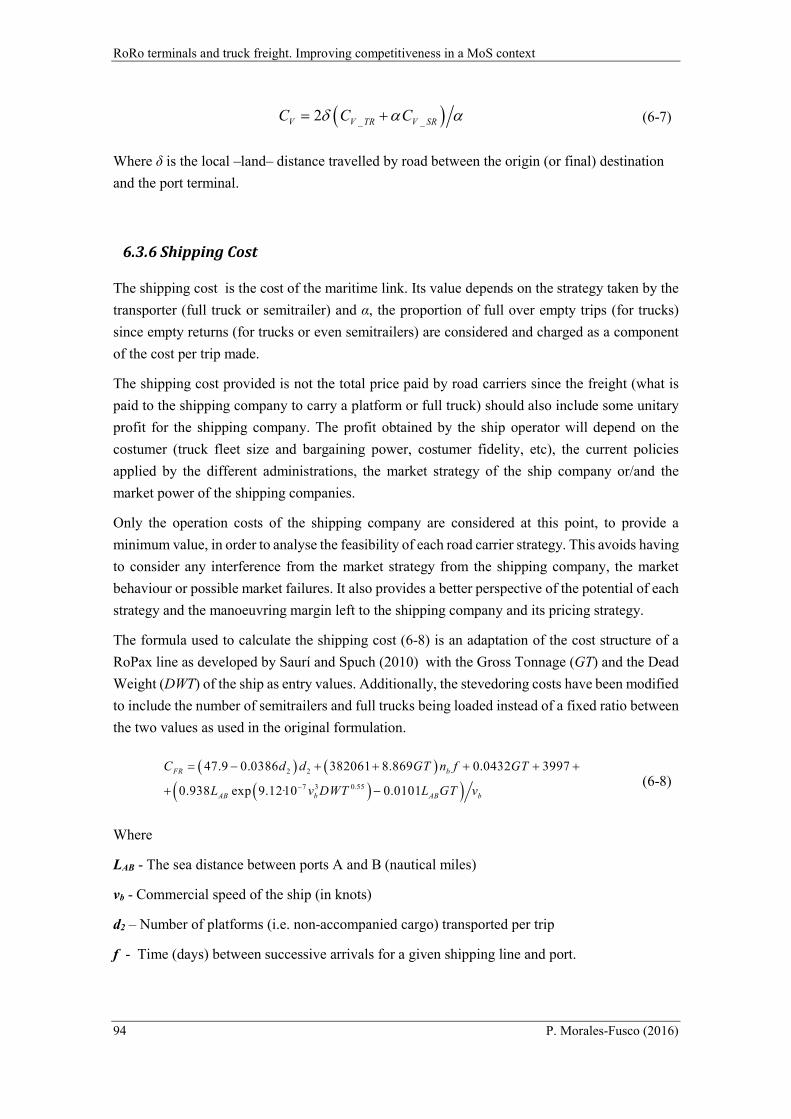
RoRo terminals and truck freight. Improving competitiveness in a MoS context
94 P. Morales-Fusco (2016)
_ _2V V TR V SRC C C (6-7)
Where δ is the local –land– distance travelled by road between the origin (or final) destination
and the port terminal.
6.3.6 Shipping Cost
The shipping cost is the cost of the maritime link. Its value depends on the strategy taken by the
transporter (full truck or semitrailer) and α, the proportion of full over empty trips (for trucks)
since empty returns (for trucks or even semitrailers) are considered and charged as a component
of the cost per trip made.
The shipping cost provided is not the total price paid by road carriers since the freight (what is
paid to the shipping company to carry a platform or full truck) should also include some unitary
profit for the shipping company. The profit obtained by the ship operator will depend on the
costumer (truck fleet size and bargaining power, costumer fidelity, etc), the current policies
applied by the different administrations, the market strategy of the ship company or/and the
market power of the shipping companies.
Only the operation costs of the shipping company are considered at this point, to provide a
minimum value, in order to analyse the feasibility of each road carrier strategy. This avoids having
to consider any interference from the market strategy from the shipping company, the market
behaviour or possible market failures. It also provides a better perspective of the potential of each
strategy and the manoeuvring margin left to the shipping company and its pricing strategy.
The formula used to calculate the shipping cost (6-8) is an adaptation of the cost structure of a
RoPax line as developed by Saurí and Spuch (2010) with the Gross Tonnage (GT) and the Dead
Weight (DWT) of the ship as entry values. Additionally, the stevedoring costs have been modified
to include the number of semitrailers and full trucks being loaded instead of a fixed ratio between
the two values as used in the original formulation.
2 2
7 3 0.55
47.9 0.0386 382061 8.869 0.0432 3997
0.938 exp 9.12·10 0.0101
FR b
AB b AB b
C d d GT n f GT
L v DWT L GT v
(6-8)
Where
LAB - The sea distance between ports A and B (nautical miles)
vb - Commercial speed of the ship (in knots)
d2 – Number of platforms (i.e. non-accompanied cargo) transported per trip
f - Time (days) between successive arrivals for a given shipping line and port.

6 – Cost structure of freight distribution strategies integrating a RoPax-MoS link
PhD. Thesis 95
RoPax and RoRo ships have different characteristics in terms of capacity (measured in linear
meters, L), since the former can combine trucks, semitrailers, rolled cargo and passengers, making
it difficult to estimate the cost of each unit transported. Therefore, at a first stage it was convenient
to consider RoRo ships to avoid the interference of passage in the calculation of the cost (and
benefits) per ITU.
Using the relationship between capacity (in linear meters), GT and DWT for both, RoRo and
RoPax ships (6-9)(6-10) it is possible to, after substituting the term GT in all the formulae
developed by Saurí and Spuch, adapt their equations to obtain a new formula to calculate the
freight cost per shipped unit of cargo. The relationship in (6-9) and (6-10) comes from using a
database of the ships operating in the 50 most used regular shipping lines over the world in 2010,
disregarding lines with a large passenger capacity (more oriented to ferry service), understood as
those lines where passenger capacity, P, is over one fifth of the linear capacity, L, in meters.
Although the R squared coefficient is quite good, the fit obtained is far from perfect as seen in
Table 6-1, but good enough considering the variability in ships considered.
3 25926 2.336 1.244 10GT L L (R=0.73) (6-9)
3 28289 2.846 1.807 10D W T L L (R=0.65) (6-10)
Table 6-1 Coeficients fit of GT and DWT functions regarding L for RoRo ships
GT DWT
Estimate Std. Error Pr(>|t|) Estimate Std. Error Pr(>|t|)
Intercept 5.926e+03 2.679e+03 0.0281* 8.289e+03 2.220e+03 0.000249***
L 2.336e+00 2.482e+00 0.3479 -2.846e+00 2.057e+00 0.1681
L2 1.244e-03 5.491e-04 0.0246* 1.807e-03 4.551e-04 0.000102***
Significance codes: 0 ‘***’ 0.001 ‘**’ 0.01 ‘*’ 0.05 ‘.’ 0.1 ‘ ‘ 1
Figure 6-2 shows how the correlation between capacity (in linear meters) and GT in RoRo ships
is bigger than in RoPax ships, since the later may include a high variability in cargo capacity
depending on the percentage of space used to carry passengers.
Additionally, Figure 6-3 shows how usually pure RoRo ships are capable of carrying much more
weight (DWT) than RoPax ships with a similar capacity (in linear meters) that might be because
a fairly large amount of the capacity in RoPax ships may be destined to carry passenger cars
instead of full loaded trucks. This will, therefore, increase the bunkering costs associated to RoRo
ships when compared with RoPax ships with a similar capacity (in linear meters) since the energy
consumed is calculated using the DWT value (Saurí and Spuch, 2010).
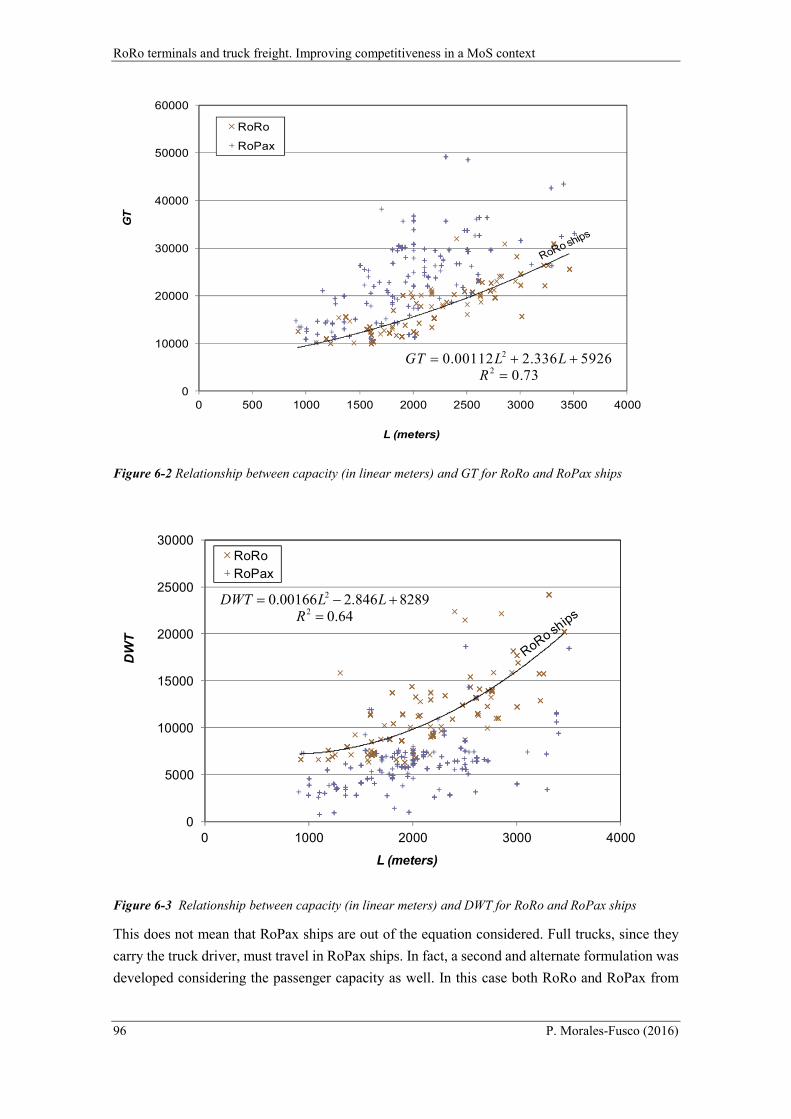
RoRo terminals and truck freight. Improving competitiveness in a MoS context
96 P. Morales-Fusco (2016)
Figure 6-2 Relationship between capacity (in linear meters) and GT for RoRo and RoPax ships
Figure 6-3 Relationship between capacity (in linear meters) and DWT for RoRo and RoPax ships
This does not mean that RoPax ships are out of the equation considered. Full trucks, since they
carry the truck driver, must travel in RoPax ships. In fact, a second and alternate formulation was
developed considering the passenger capacity as well. In this case both RoRo and RoPax from
0
10000
20000
30000
40000
50000
60000
0 500 1000 1500 2000 2500 3000 3500 4000
GT
L (meters)
RoRo
RoPax
2
20.00112 2.336 5926
0.73GT L L
R
0
5000
10000
15000
20000
25000
30000
0 1000 2000 3000 4000
DW
T
L (meters)
RoRo
RoPax
2
20.00166 2.846 8289
0.64DWT L L
R
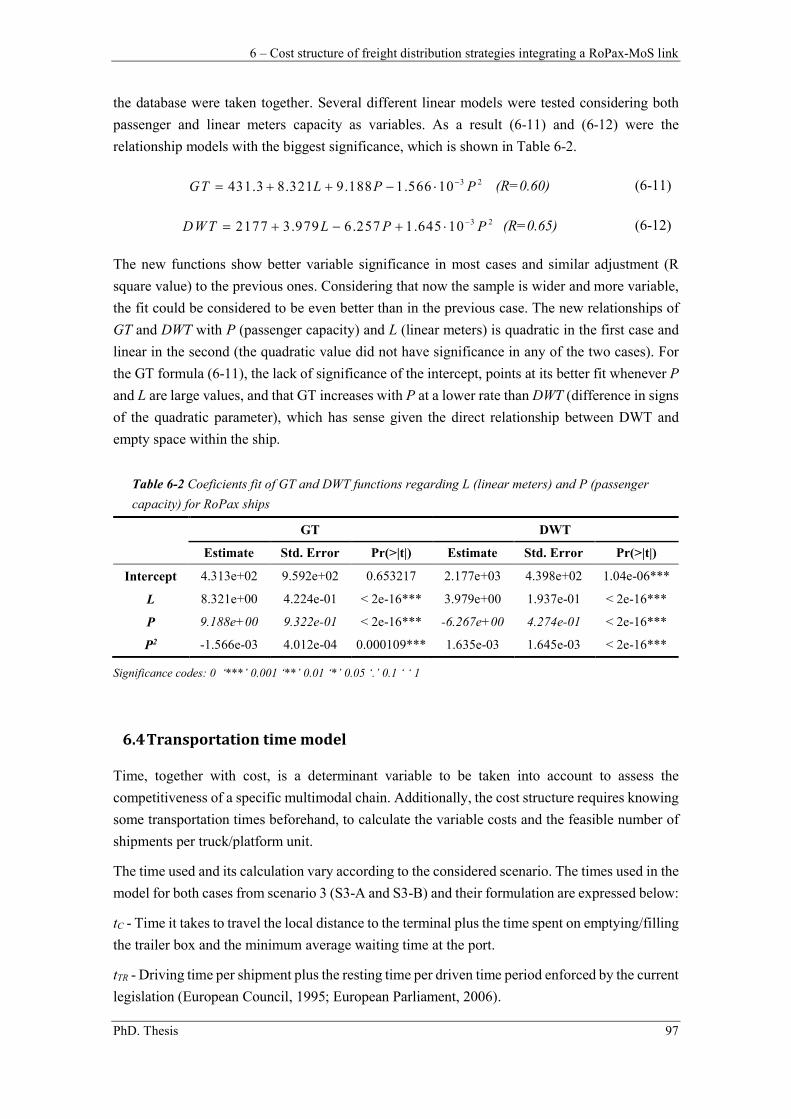
6 – Cost structure of freight distribution strategies integrating a RoPax-MoS link
PhD. Thesis 97
the database were taken together. Several different linear models were tested considering both
passenger and linear meters capacity as variables. As a result (6-11) and (6-12) were the
relationship models with the biggest significance, which is shown in Table 6-2.
3 2431.3 8.321 9.188 1.566 10GT L P P (R=0.60) (6-11)
3 22177 3.979 6.257 1.645 10DWT L P P (R=0.65) (6-12)
The new functions show better variable significance in most cases and similar adjustment (R
square value) to the previous ones. Considering that now the sample is wider and more variable,
the fit could be considered to be even better than in the previous case. The new relationships of
GT and DWT with P (passenger capacity) and L (linear meters) is quadratic in the first case and
linear in the second (the quadratic value did not have significance in any of the two cases). For
the GT formula (6-11), the lack of significance of the intercept, points at its better fit whenever P
and L are large values, and that GT increases with P at a lower rate than DWT (difference in signs
of the quadratic parameter), which has sense given the direct relationship between DWT and
empty space within the ship.
Table 6-2 Coeficients fit of GT and DWT functions regarding L (linear meters) and P (passenger
capacity) for RoPax ships
GT DWT
Estimate Std. Error Pr(>|t|) Estimate Std. Error Pr(>|t|)
Intercept 4.313e+02 9.592e+02 0.653217 2.177e+03 4.398e+02 1.04e-06***
L 8.321e+00 4.224e-01 < 2e-16*** 3.979e+00 1.937e-01 < 2e-16***
P 9.188e+00 9.322e-01 < 2e-16*** -6.267e+00 4.274e-01 < 2e-16***
P2 -1.566e-03 4.012e-04 0.000109*** 1.635e-03 1.645e-03 < 2e-16***
Significance codes: 0 ‘***’ 0.001 ‘**’ 0.01 ‘*’ 0.05 ‘.’ 0.1 ‘ ‘ 1
6.4 Transportation time model
Time, together with cost, is a determinant variable to be taken into account to assess the
competitiveness of a specific multimodal chain. Additionally, the cost structure requires knowing
some transportation times beforehand, to calculate the variable costs and the feasible number of
shipments per truck/platform unit.
The time used and its calculation vary according to the considered scenario. The times used in the
model for both cases from scenario 3 (S3-A and S3-B) and their formulation are expressed below:
tC - Time it takes to travel the local distance to the terminal plus the time spent on emptying/filling
the trailer box and the minimum average waiting time at the port.
tTR - Driving time per shipment plus the resting time per driven time period enforced by the current
legislation (European Council, 1995; European Parliament, 2006).
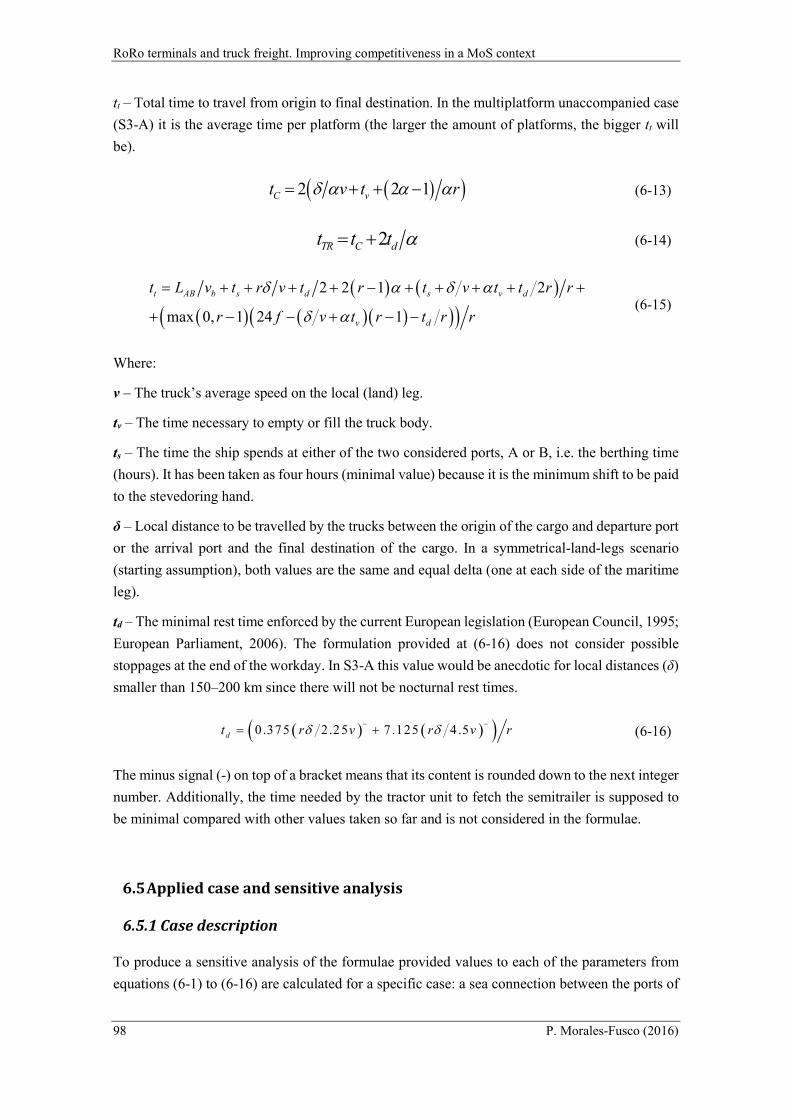
RoRo terminals and truck freight. Improving competitiveness in a MoS context
98 P. Morales-Fusco (2016)
tt – Total time to travel from origin to final destination. In the multiplatform unaccompanied case
(S3-A) it is the average time per platform (the larger the amount of platforms, the bigger tt will
be).
2 2 1C vt v t r (6-13)
2TR C dt t t (6-14)
2 2 1 2
max 0, 1 24 1
t AB b s d s v d
v d
t L v t r v t r t v t t r r
r f v t r t r r
(6-15)
Where:
v – The truck’s average speed on the local (land) leg.
tv – The time necessary to empty or fill the truck body.
ts – The time the ship spends at either of the two considered ports, A or B, i.e. the berthing time
(hours). It has been taken as four hours (minimal value) because it is the minimum shift to be paid
to the stevedoring hand.
δ – Local distance to be travelled by the trucks between the origin of the cargo and departure port
or the arrival port and the final destination of the cargo. In a symmetrical-land-legs scenario
(starting assumption), both values are the same and equal delta (one at each side of the maritime
leg).
td – The minimal rest time enforced by the current European legislation (European Council, 1995;
European Parliament, 2006). The formulation provided at (6-16) does not consider possible
stoppages at the end of the workday. In S3-A this value would be anecdotic for local distances (δ)
smaller than 150–200 km since there will not be nocturnal rest times.
0.375 2.25 7.125 4.5dt r v r v r
(6-16)
The minus signal (-) on top of a bracket means that its content is rounded down to the next integer
number. Additionally, the time needed by the tractor unit to fetch the semitrailer is supposed to
be minimal compared with other values taken so far and is not considered in the formulae.
6.5 Applied case and sensitive analysis
6.5.1 Case description
To produce a sensitive analysis of the formulae provided values to each of the parameters from
equations (6-1) to (6-16) are calculated for a specific case: a sea connection between the ports of
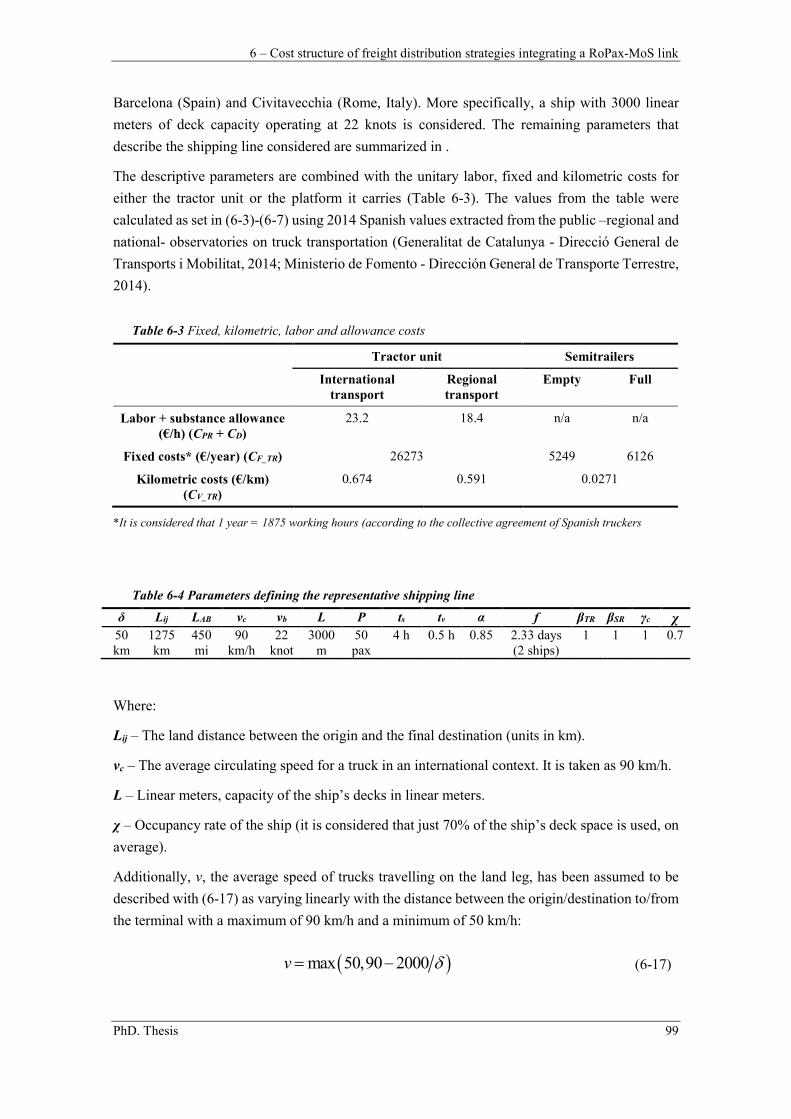
6 – Cost structure of freight distribution strategies integrating a RoPax-MoS link
PhD. Thesis 99
Barcelona (Spain) and Civitavecchia (Rome, Italy). More specifically, a ship with 3000 linear
meters of deck capacity operating at 22 knots is considered. The remaining parameters that
describe the shipping line considered are summarized in .
The descriptive parameters are combined with the unitary labor, fixed and kilometric costs for
either the tractor unit or the platform it carries (Table 6-3). The values from the table were
calculated as set in (6-3)-(6-7) using 2014 Spanish values extracted from the public –regional and
national- observatories on truck transportation (Generalitat de Catalunya - Direcció General de
Transports i Mobilitat, 2014; Ministerio de Fomento - Dirección General de Transporte Terrestre,
2014).
Table 6-3 Fixed, kilometric, labor and allowance costs
Tractor unit Semitrailers
International transport
Regional transport
Empty Full
Labor + substance allowance (€/h) (CPR + CD)
23.2 18.4 n/a n/a
Fixed costs* (€/year) (CF_TR) 26273 5249 6126
Kilometric costs (€/km) (CV_TR)
0.674 0.591 0.0271
*It is considered that 1 year = 1875 working hours (according to the collective agreement of Spanish truckers
Table 6-4 Parameters defining the representative shipping line
δ Lij LAB vc vb L P ts tv α f βTR βSR γc χ
50 km
1275 km
450 mi
90 km/h
22 knot
3000 m
50 pax
4 h 0.5 h 0.85 2.33 days (2 ships)
1 1 1 0.7
Where:
Lij – The land distance between the origin and the final destination (units in km).
vc – The average circulating speed for a truck in an international context. It is taken as 90 km/h.
L – Linear meters, capacity of the ship’s decks in linear meters.
χ – Occupancy rate of the ship (it is considered that just 70% of the ship’s deck space is used, on
average).
Additionally, v, the average speed of trucks travelling on the land leg, has been assumed to be
described with (6-17) as varying linearly with the distance between the origin/destination to/from
the terminal with a maximum of 90 km/h and a minimum of 50 km/h:
max 50,90 2000v (6-17)
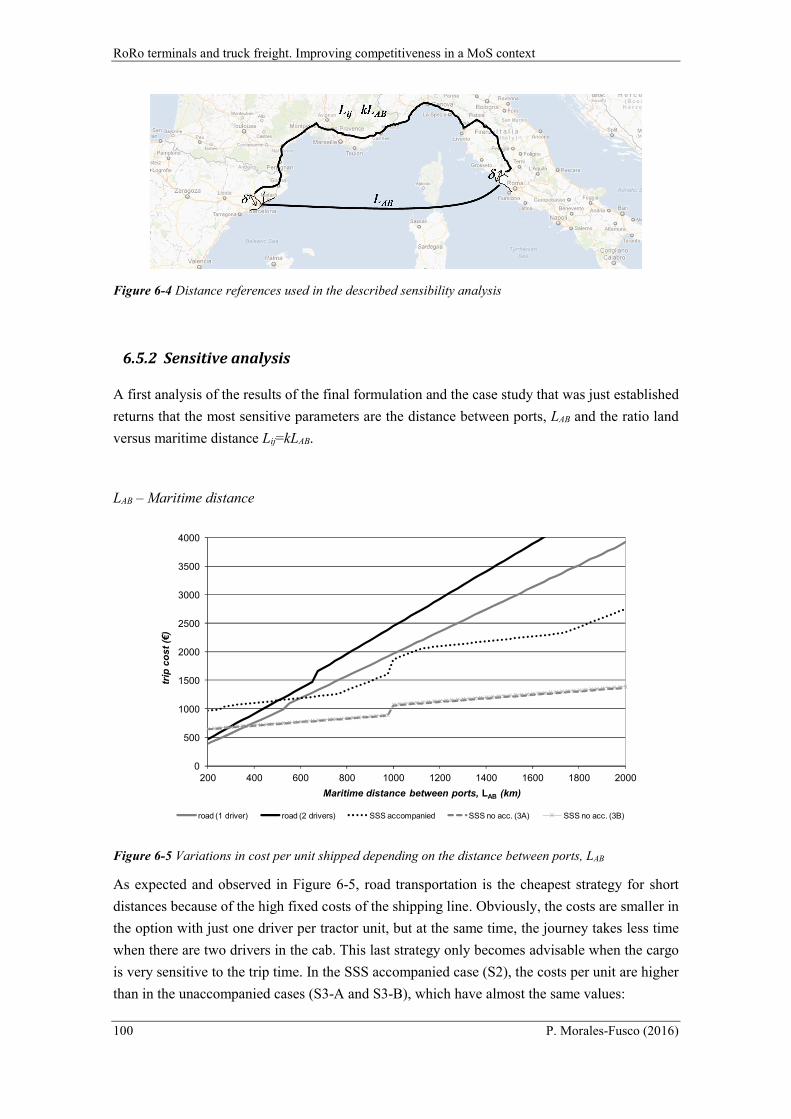
RoRo terminals and truck freight. Improving competitiveness in a MoS context
100 P. Morales-Fusco (2016)
Figure 6-4 Distance references used in the described sensibility analysis
6.5.2 Sensitive analysis
A first analysis of the results of the final formulation and the case study that was just established
returns that the most sensitive parameters are the distance between ports, LAB and the ratio land
versus maritime distance Lij=kLAB.
LAB – Maritime distance
Figure 6-5 Variations in cost per unit shipped depending on the distance between ports, LAB
As expected and observed in Figure 6-5, road transportation is the cheapest strategy for short
distances because of the high fixed costs of the shipping line. Obviously, the costs are smaller in
the option with just one driver per tractor unit, but at the same time, the journey takes less time
when there are two drivers in the cab. This last strategy only becomes advisable when the cargo
is very sensitive to the trip time. In the SSS accompanied case (S2), the costs per unit are higher
than in the unaccompanied cases (S3-A and S3-B), which have almost the same values:
0
500
1000
1500
2000
2500
3000
3500
4000
200 400 600 800 1000 1200 1400 1600 1800 2000
trip
co
st
(€)
Maritime distance between ports, LAB (km)
road (1 driver) road (2 drivers) SSS accompanied SSS no acc. (3A) SSS no acc. (3B)
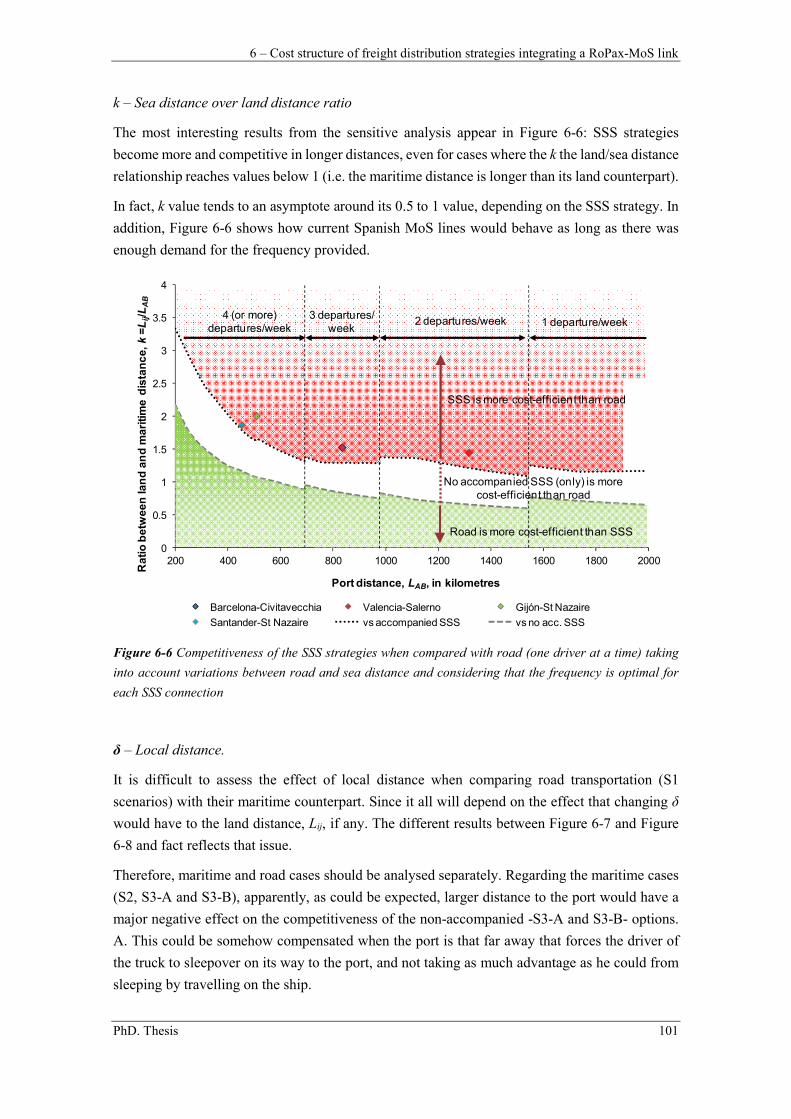
6 – Cost structure of freight distribution strategies integrating a RoPax-MoS link
PhD. Thesis 101
k – Sea distance over land distance ratio
The most interesting results from the sensitive analysis appear in Figure 6-6: SSS strategies
become more and competitive in longer distances, even for cases where the k the land/sea distance
relationship reaches values below 1 (i.e. the maritime distance is longer than its land counterpart).
In fact, k value tends to an asymptote around its 0.5 to 1 value, depending on the SSS strategy. In
addition, Figure 6-6 shows how current Spanish MoS lines would behave as long as there was
enough demand for the frequency provided.
Figure 6-6 Competitiveness of the SSS strategies when compared with road (one driver at a time) taking
into account variations between road and sea distance and considering that the frequency is optimal for
each SSS connection
δ – Local distance.
It is difficult to assess the effect of local distance when comparing road transportation (S1
scenarios) with their maritime counterpart. Since it all will depend on the effect that changing δ
would have to the land distance, Lij, if any. The different results between Figure 6-7 and Figure
6-8 and fact reflects that issue.
Therefore, maritime and road cases should be analysed separately. Regarding the maritime cases
(S2, S3-A and S3-B), apparently, as could be expected, larger distance to the port would have a
major negative effect on the competitiveness of the non-accompanied -S3-A and S3-B- options.
A. This could be somehow compensated when the port is that far away that forces the driver of
the truck to sleepover on its way to the port, and not taking as much advantage as he could from
sleeping by travelling on the ship.
0
0.5
1
1.5
2
2.5
3
3.5
4
200 400 600 800 1000 1200 1400 1600 1800 2000
Ra
tio
betw
ee
n la
nd
an
d m
ari
tim
e d
ista
nc
e,
k=
Lij/L
AB
Port distance, LAB, in kilometres
Barcelona-Civitavecchia Valencia-Salerno Gijón-St Nazaire
Santander-St Nazaire vs accompanied SSS vs no acc. SSS
SSS is more cost-efficient than road
Road is more cost-efficient than SSS
4 (or more) departures/week
3 departures/ week
1 departure/week
No accompanied SSS (only) is morecost-efficient than road
2 departures/week
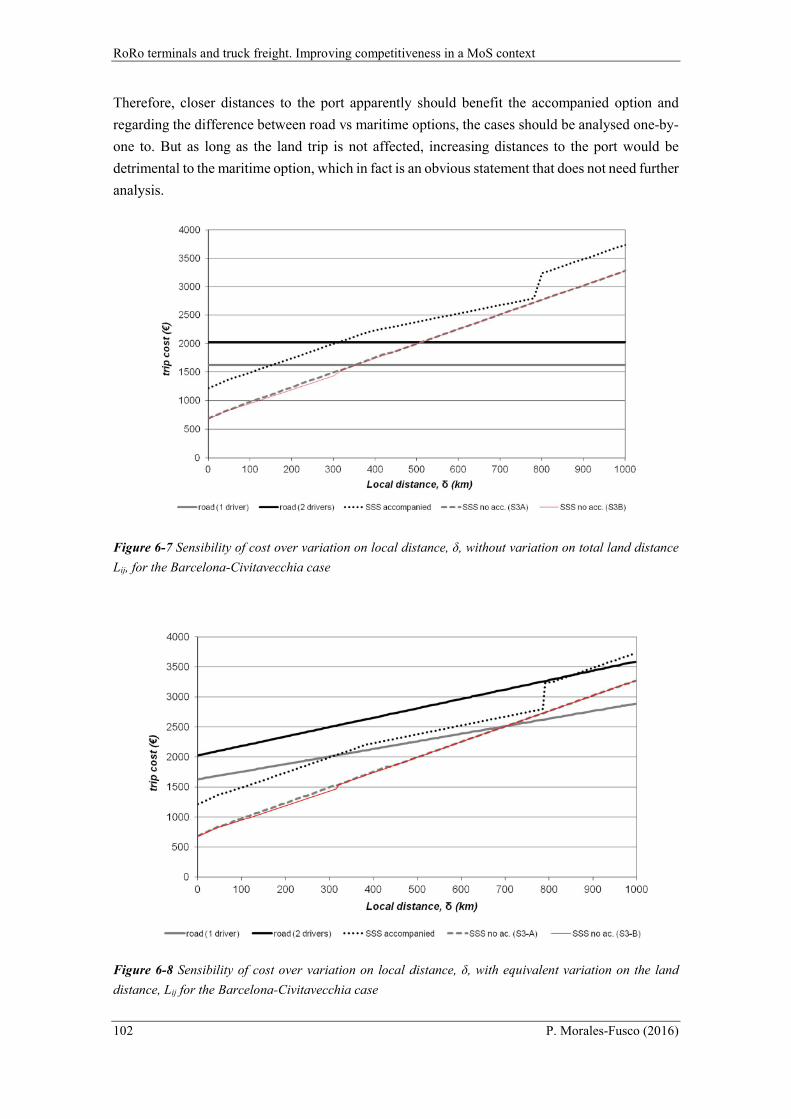
RoRo terminals and truck freight. Improving competitiveness in a MoS context
102 P. Morales-Fusco (2016)
Therefore, closer distances to the port apparently should benefit the accompanied option and
regarding the difference between road vs maritime options, the cases should be analysed one-by-
one to. But as long as the land trip is not affected, increasing distances to the port would be
detrimental to the maritime option, which in fact is an obvious statement that does not need further
analysis.
Figure 6-7 Sensibility of cost over variation on local distance, δ, without variation on total land distance
Lij, for the Barcelona-Civitavecchia case
Figure 6-8 Sensibility of cost over variation on local distance, δ, with equivalent variation on the land
distance, Lij for the Barcelona-Civitavecchia case
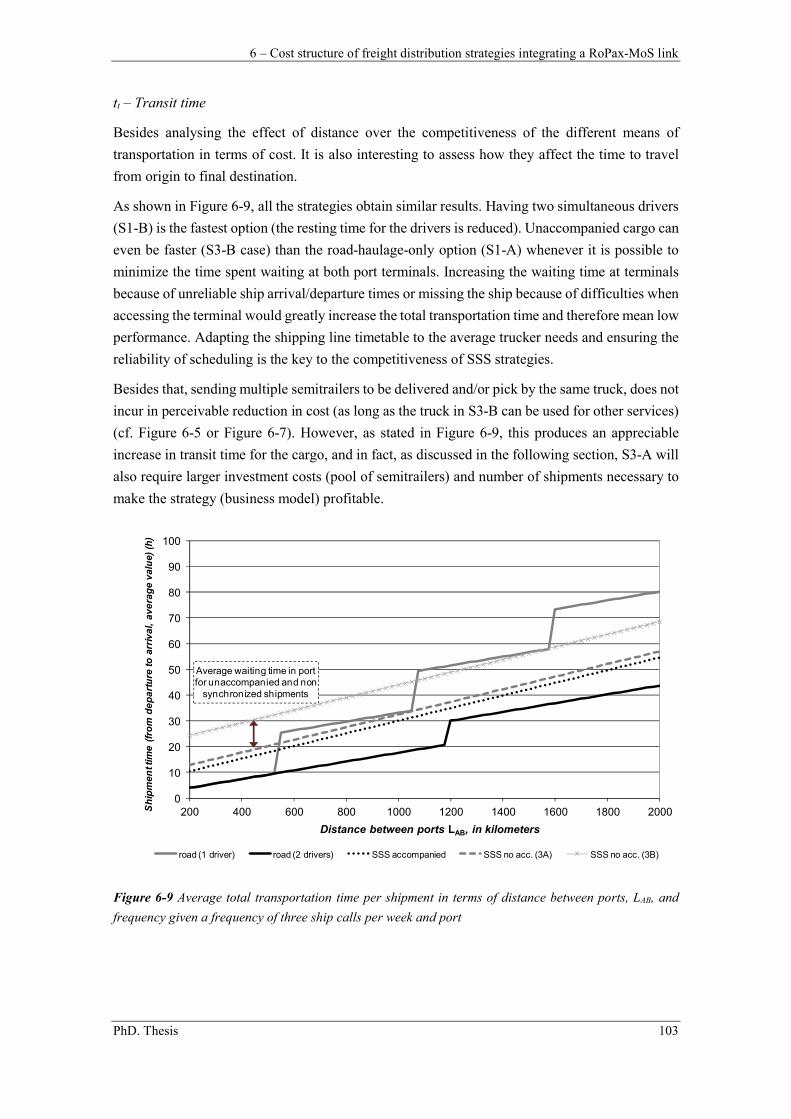
6 – Cost structure of freight distribution strategies integrating a RoPax-MoS link
PhD. Thesis 103
tt – Transit time
Besides analysing the effect of distance over the competitiveness of the different means of
transportation in terms of cost. It is also interesting to assess how they affect the time to travel
from origin to final destination.
As shown in Figure 6-9, all the strategies obtain similar results. Having two simultaneous drivers
(S1-B) is the fastest option (the resting time for the drivers is reduced). Unaccompanied cargo can
even be faster (S3-B case) than the road-haulage-only option (S1-A) whenever it is possible to
minimize the time spent waiting at both port terminals. Increasing the waiting time at terminals
because of unreliable ship arrival/departure times or missing the ship because of difficulties when
accessing the terminal would greatly increase the total transportation time and therefore mean low
performance. Adapting the shipping line timetable to the average trucker needs and ensuring the
reliability of scheduling is the key to the competitiveness of SSS strategies.
Besides that, sending multiple semitrailers to be delivered and/or pick by the same truck, does not
incur in perceivable reduction in cost (as long as the truck in S3-B can be used for other services)
(cf. Figure 6-5 or Figure 6-7). However, as stated in Figure 6-9, this produces an appreciable
increase in transit time for the cargo, and in fact, as discussed in the following section, S3-A will
also require larger investment costs (pool of semitrailers) and number of shipments necessary to
make the strategy (business model) profitable.
Figure 6-9 Average total transportation time per shipment in terms of distance between ports, LAB, and
frequency given a frequency of three ship calls per week and port
0
10
20
30
40
50
60
70
80
90
100
200 400 600 800 1000 1200 1400 1600 1800 2000Sh
ipm
en
t tim
e (
fro
m d
ep
art
ure
to
arr
iva
l, a
ve
rag
e v
alu
e)
(h)
Distance between ports LAB, in kilometers
road (1 driver) road (2 drivers) SSS accompanied SSS no acc. (3A) SSS no acc. (3B)
Average waiting time in port for unaccompanied and non
synchronized shipments
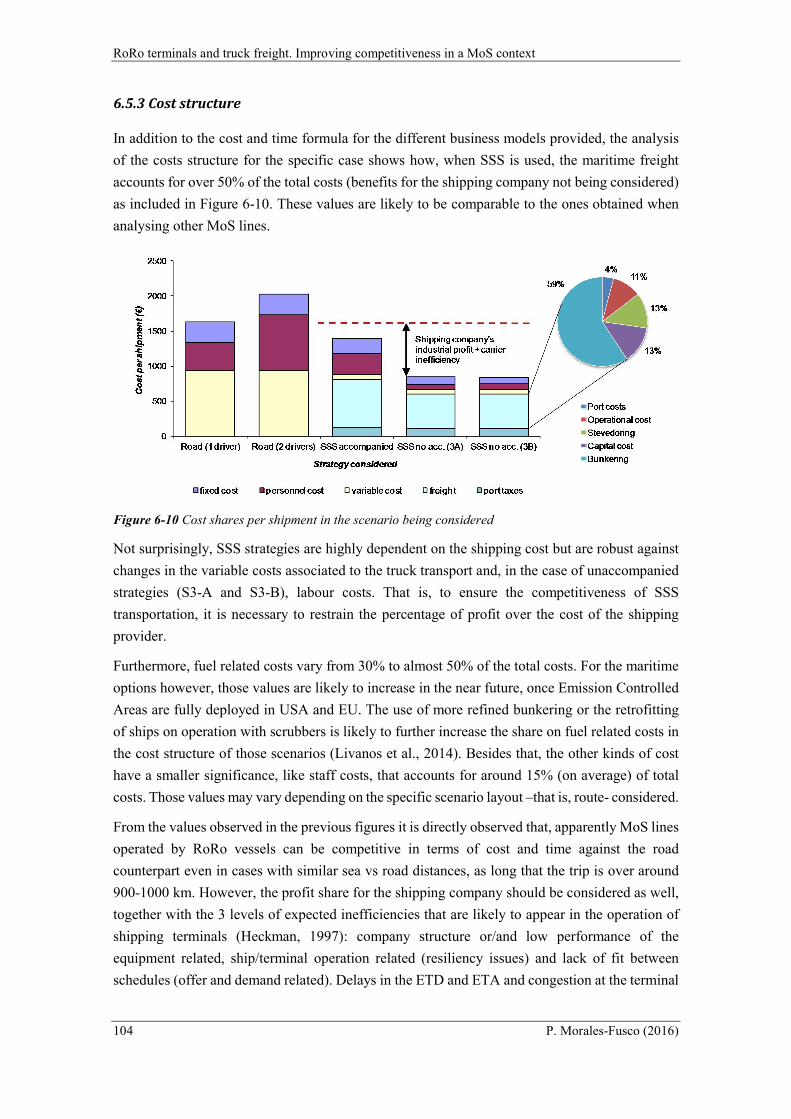
RoRo terminals and truck freight. Improving competitiveness in a MoS context
104 P. Morales-Fusco (2016)
6.5.3 Cost structure
In addition to the cost and time formula for the different business models provided, the analysis
of the costs structure for the specific case shows how, when SSS is used, the maritime freight
accounts for over 50% of the total costs (benefits for the shipping company not being considered)
as included in Figure 6-10. These values are likely to be comparable to the ones obtained when
analysing other MoS lines.
Figure 6-10 Cost shares per shipment in the scenario being considered
Not surprisingly, SSS strategies are highly dependent on the shipping cost but are robust against
changes in the variable costs associated to the truck transport and, in the case of unaccompanied
strategies (S3-A and S3-B), labour costs. That is, to ensure the competitiveness of SSS
transportation, it is necessary to restrain the percentage of profit over the cost of the shipping
provider.
Furthermore, fuel related costs vary from 30% to almost 50% of the total costs. For the maritime
options however, those values are likely to increase in the near future, once Emission Controlled
Areas are fully deployed in USA and EU. The use of more refined bunkering or the retrofitting
of ships on operation with scrubbers is likely to further increase the share on fuel related costs in
the cost structure of those scenarios (Livanos et al., 2014). Besides that, the other kinds of cost
have a smaller significance, like staff costs, that accounts for around 15% (on average) of total
costs. Those values may vary depending on the specific scenario layout –that is, route- considered.
From the values observed in the previous figures it is directly observed that, apparently MoS lines
operated by RoRo vessels can be competitive in terms of cost and time against the road
counterpart even in cases with similar sea vs road distances, as long that the trip is over around
900-1000 km. However, the profit share for the shipping company should be considered as well,
together with the 3 levels of expected inefficiencies that are likely to appear in the operation of
shipping terminals (Heckman, 1997): company structure or/and low performance of the
equipment related, ship/terminal operation related (resiliency issues) and lack of fit between
schedules (offer and demand related). Delays in the ETD and ETA and congestion at the terminal
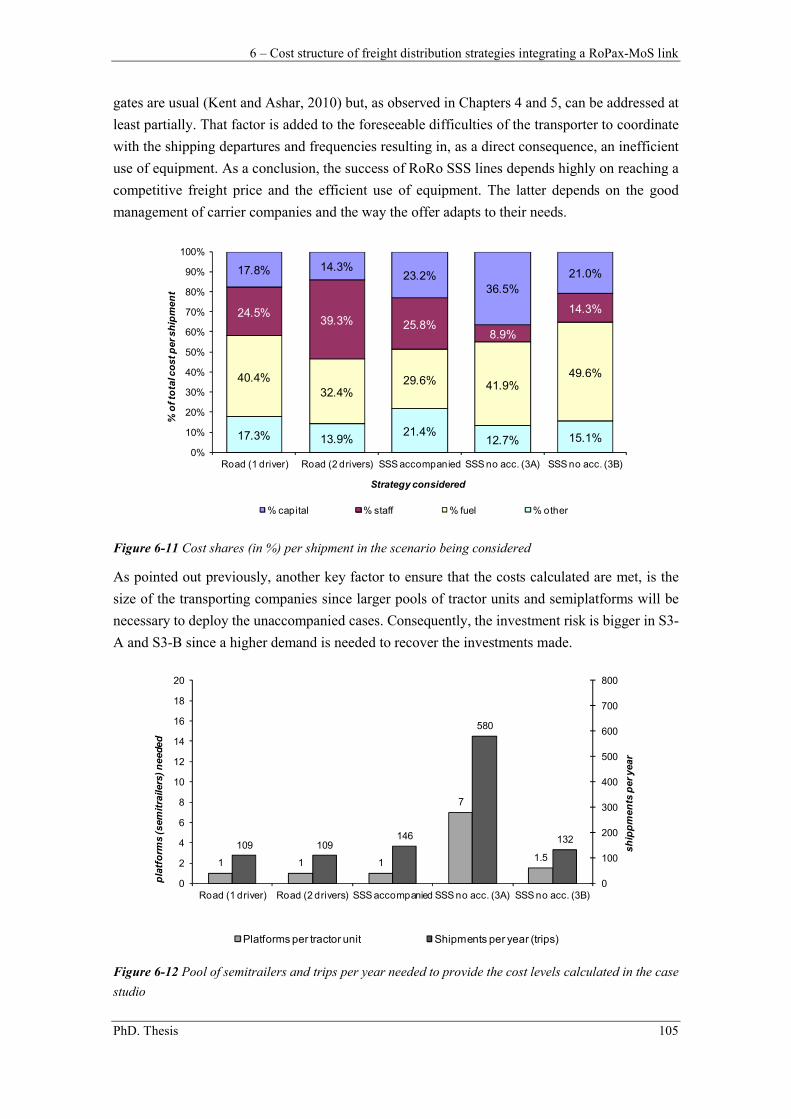
6 – Cost structure of freight distribution strategies integrating a RoPax-MoS link
PhD. Thesis 105
gates are usual (Kent and Ashar, 2010) but, as observed in Chapters 4 and 5, can be addressed at
least partially. That factor is added to the foreseeable difficulties of the transporter to coordinate
with the shipping departures and frequencies resulting in, as a direct consequence, an inefficient
use of equipment. As a conclusion, the success of RoRo SSS lines depends highly on reaching a
competitive freight price and the efficient use of equipment. The latter depends on the good
management of carrier companies and the way the offer adapts to their needs.
Figure 6-11 Cost shares (in %) per shipment in the scenario being considered
As pointed out previously, another key factor to ensure that the costs calculated are met, is the
size of the transporting companies since larger pools of tractor units and semiplatforms will be
necessary to deploy the unaccompanied cases. Consequently, the investment risk is bigger in S3-
A and S3-B since a higher demand is needed to recover the investments made.
Figure 6-12 Pool of semitrailers and trips per year needed to provide the cost levels calculated in the case
studio
17.3% 13.9%21.4%
12.7% 15.1%
40.4%
32.4%29.6% 41.9%
49.6%
24.5%39.3% 25.8%
8.9%
14.3%
17.8% 14.3%23.2%
36.5%
21.0%
0%
10%
20%
30%
40%
50%
60%
70%
80%
90%
100%
Road (1 driver) Road (2 drivers) SSS accompanied SSS no acc. (3A) SSS no acc. (3B)
% o
f to
tal c
os
t p
er s
hip
me
nt
Strategy considered
% capital % staff % fuel % other
1 1 1
7
1.5109 109
146
580
132
0
100
200
300
400
500
600
700
800
0
2
4
6
8
10
12
14
16
18
20
Road (1 driver) Road (2 drivers) SSS accompanied SSS no acc. (3A) SSS no acc. (3B)
sh
ipp
men
ts p
er year
pla
tfo
rms (sem
itra
ilers
) n
eeded
Platforms per tractor unit Shipments per year (trips)
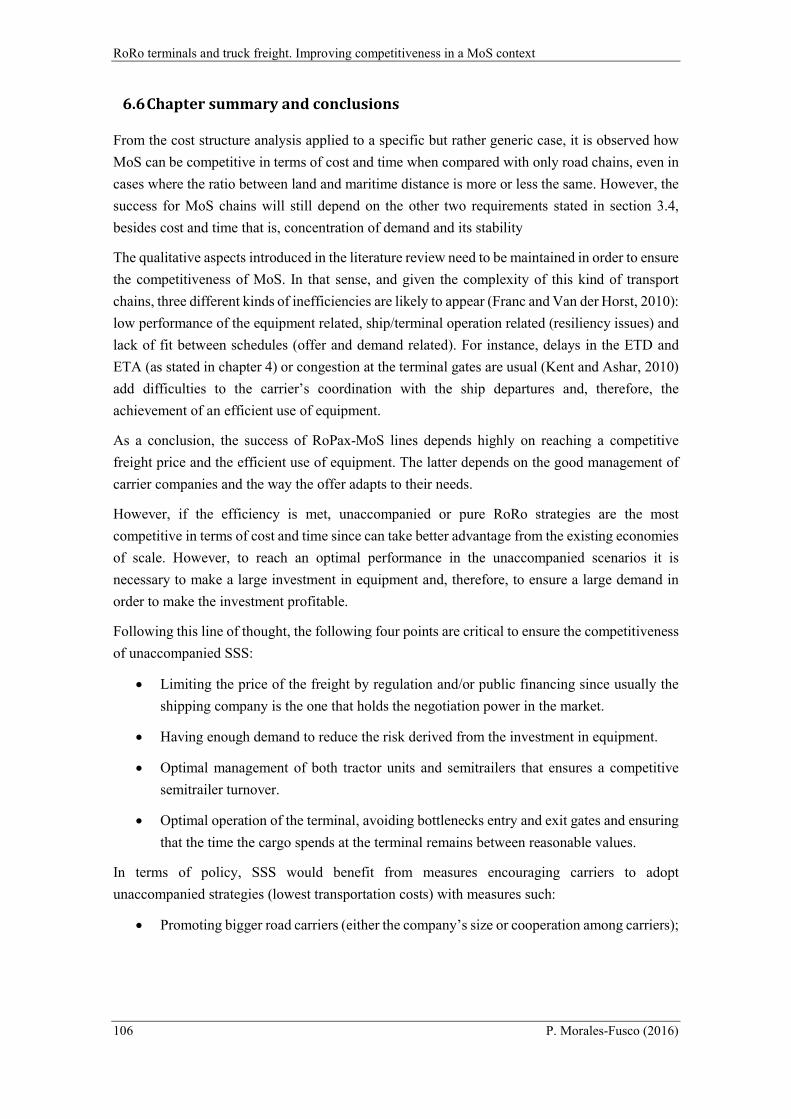
RoRo terminals and truck freight. Improving competitiveness in a MoS context
106 P. Morales-Fusco (2016)
6.6 Chapter summary and conclusions
From the cost structure analysis applied to a specific but rather generic case, it is observed how
MoS can be competitive in terms of cost and time when compared with only road chains, even in
cases where the ratio between land and maritime distance is more or less the same. However, the
success for MoS chains will still depend on the other two requirements stated in section 3.4,
besides cost and time that is, concentration of demand and its stability
The qualitative aspects introduced in the literature review need to be maintained in order to ensure
the competitiveness of MoS. In that sense, and given the complexity of this kind of transport
chains, three different kinds of inefficiencies are likely to appear (Franc and Van der Horst, 2010):
low performance of the equipment related, ship/terminal operation related (resiliency issues) and
lack of fit between schedules (offer and demand related). For instance, delays in the ETD and
ETA (as stated in chapter 4) or congestion at the terminal gates are usual (Kent and Ashar, 2010)
add difficulties to the carrier’s coordination with the ship departures and, therefore, the
achievement of an efficient use of equipment.
As a conclusion, the success of RoPax-MoS lines depends highly on reaching a competitive
freight price and the efficient use of equipment. The latter depends on the good management of
carrier companies and the way the offer adapts to their needs.
However, if the efficiency is met, unaccompanied or pure RoRo strategies are the most
competitive in terms of cost and time since can take better advantage from the existing economies
of scale. However, to reach an optimal performance in the unaccompanied scenarios it is
necessary to make a large investment in equipment and, therefore, to ensure a large demand in
order to make the investment profitable.
Following this line of thought, the following four points are critical to ensure the competitiveness
of unaccompanied SSS:
Limiting the price of the freight by regulation and/or public financing since usually the
shipping company is the one that holds the negotiation power in the market.
Having enough demand to reduce the risk derived from the investment in equipment.
Optimal management of both tractor units and semitrailers that ensures a competitive
semitrailer turnover.
Optimal operation of the terminal, avoiding bottlenecks entry and exit gates and ensuring
that the time the cargo spends at the terminal remains between reasonable values.
In terms of policy, SSS would benefit from measures encouraging carriers to adopt
unaccompanied strategies (lowest transportation costs) with measures such:
Promoting bigger road carriers (either the company’s size or cooperation among carriers);
6 – Cost structure of freight distribution strategies integrating a RoPax-MoS link
PhD. Thesis 107
Easing the international cooperation among carriers from different port hinterlands and
even having one carrier managing the entire supply chain, both the road and the maritime
transportation, as long as it is not a monopoly.
In short, to make the most of e SSS option it is necessary to promote policies to coordinate and
consolidate the cargoes, to adapt the offer to the needs, temporally and in terms of frequency, and
to control the freight price of the maritime link. Moreover, measures facilitating cooperation
between carriers are necessary.

RoRo terminals and truck freight. Improving competitiveness in a MoS context
108 P. Morales-Fusco (2016)
7 – Mode choice model and shipping line strategies
PhD. Thesis 109
7. Mode choice model and shipping line strategies
Chapter 7
Mode choice model and shipping line
strategies
7.1 Introduction and chapter overview
In previous chapters, some of the main determinants for the competitiveness of MoS have been
addressed and discussed. The characteristics of the potential market, the most adequate business
models to the transporter in terms of cost and time, and means to assess the reliability and
resilience of the maritime link considering the operations taking place at the port terminal, in
order to increase its perceived quality of the MoS have all been considered in the previous
chapters.
This chapter includes two actors still left out the equation: the shipping companies and their
pricing strategy, and public administration by providing incentives for modal shift. That is, this
chapter analyses what might be the most appropriate pricing strategy for a regular shipping line
operating with RoRo or RoPax ships taking into account the demand’s elasticity to tariff, the
ship’s cost structure and the requirements and cost implications of each cargo format transported.
In that sense, two optimal pricing strategies are being considered: fares for a given shipping line
already on operation and fares for a line in its planning stage where, the optimal size of the vessel
can be determined as well. The research considers the role that a shipping company and its ship
deployment and pricing strategy has in the equation, in a quasi-monopolistic state. It is checked
whereas to what extent the pricing policy helps in the maximization of the modal shift or it is
detrimental for it.
The text starts with the discussion of actual research on modal choice models and utility function
determination beyond what was included in the state of the art at the beginning of the thesis. The
gathered knowledge is then applied to determinate the variables and parameters that should be
used to later assess the elasticity of freight prices charged by the shipping company to the vessel’s
RoRo terminals and truck freight. Improving competitiveness in a MoS context
110 P. Morales-Fusco (2016)
final users (the shippers or transporters of the cargo), discriminating by kind of cargo: full truck
versus semitrailer. Afterwards the cost structure of the shipping line is introduced and discussed
prior to, by means of an optimization programming, obtain the most beneficial tariffs to the
shipping company. As a result, different pricing strategies for the shipping line are developed and
the characteristics of the optimal shipping line for each of them is found, that maximizes profit of
the shipping company. Afterwards, the chapter provides a sensitive analysis of the discrete modal
choice to, finally, assess a subsiding policy based in bonus per unit transported and its
effectiveness in promoting modal shift and the likely effect it would have in the profitability of
the shipping line.
7.2 Discrete choice models and shipping lines pricing, an introduction
Pricing in MoS lines differs from ocean shipping in the demand’s elasticity. The traditional overall
low elasticity of the later contrasts with the elasticity of MoS, where SSS competes directly with
road transportation and where the cost of backshift from SSS to road is negligible for the
transporter especially (DG Move, 2015). This is especially true for the accompanied case where
a substantial difference in the necessary pool of transport units does not exist as exposed in chapter
6 (López-Navarro, 2013b; Woxenius, 2012).
The state of the art hereby provided, gives a quick overview on pricing strategies and policy for
maritime shipping lines first, it later introduces the use of discrete choice models for freight
transportation and the sources of data available to model them and finally, summarizes the
existing papers dealing with choice models applied to SSS, and more concretely MoS freight
transportation expanding the glimpse given to the topic in the introductory chapters.
7.2.1 Pricing in shipping lines
When referring to pricing strategies related to the maritime world, literature reviews are mainly
focused on port pricing strategies (although outdated, the project IMPRINT-EUROPE analyses
an extensive compendium of papers about the topic (Meersman et al., 2002)). Shipping line
pricing, however, is not a usual topic. Certainly, there are works that try to determinate the
relationship between freight rates charged and economic determinants, that is, they do not
establish a tariff strategy, and rather give a descriptive way to predict tariffs behavior in the future
(Alizadeh and Talley, 2011).
From a theoretical perspective, tariffs should equal short-run marginal costs; however, this is only
true in a perfectly free economy or in an efficient socialist economy. This is the pricing system
the EC advocates for in all transport services (European Commission, 2001, once all external
costs of transport are accounted for.
In fact, regarding the Economics theory there are three kinds of price discrimination (Tirole,
1988):
7 – Mode choice model and shipping line strategies
PhD. Thesis 111
First order: Where the service supplier, the shipping company, is able to keep all the profit
that its service provides since it has a perfect knowledge of its customers and their needs
(tariffs are on ‘what the customer can bear’ basis).
Second order: Some input related to the consumer preferences is known (for instance the
distance to travel or the value of the cargo transported per volume unit).
Third order: Where the service provider knows the consumer preferences in a generic
form (e.g. statistical characteristics) and not the individual details of each of them.
Pricing on liner shipping used to be dominated by the conference system. However, such
agreements do not longer apply to traffic within Europe since its prohibition as consequence of
the repeal of Council Regulation 4056/86 and within the United States of America (USA) since
the passage of the Ocean Shipping Refrom Act (OSRA) which has made such agreements
anecdotic, at most (Acciaro, 2011; Fusillo, 2006). Nowadays, the most usual pricing system in
liner shipping is what is commonly referred to as service contracts where fares are agreed between
shipper and shipping company after some negotiation (M R Brooks, 2000; Marlow and Nair,
2008). Although carriers may publish their tariffs, rarely those are the ones applied in practice
with exception maybe of the occasional shipper (Acciaro, 2011).
The traditional forms of price discrimination since the conference system are by shipment, shipper
and commodity (Jansson and Shneerson, 1987). The final fares come from the negotiation game
within shipper and carrier. Shipping companies aim for a ‘what the traffic can bear’ charging
system, taking advantage of the low elasticity of ocean transportation to freight rates, which in
turn is counterbalanced by the fluctuations in demand leading to seasonal variations in tariffs in
order to smooth demand over the year (or week) or applying discounts to bulk customers, serving
small ones only if some capacity is left. As Acciaro (2011) points out, this has two justifications:
bulk customers tend to stabilize the demand and their order usually arrives before the occasional
small shippers and those might be more difficult to be accommodated.
However, as pointed out before, MoS lines behave differently. The cost of switching from RoRo
or RoPax shipping (the most common kind of ship used for MoS connections) to road
transportation (modal backshift) is negligible and the flexibility that road transportation offers is
currently not comparable to the usual shipping lines (DG Move, 2015). The MoS market is likely
to behave as the bulk system pointed by Acciaro (2011) but, given the characteristics of what is
being offered, with a more prevalent role of the small costumers taking place.
Assessing the negotiation game between provider and consumer of the service (transporter or
shipper) is out of the scope –and knowledge- developed in this thesis and will not be approached.
Instead, all costumers –independently of their negotiation power– must pay the same rate. The
only pricing discrimination considered is between kind of cargo (full truck, with driver included,
versus trailer). Further research could consider cost and mode choice models that discriminate per
customer size, seasonality or even priority status (some cargo may pay less but have the chance
to miss one shipment to leave room for more urgent or “premium” cargo). Considering a
homogenous pricing system (this case), makes possible to examine the effect of price over

RoRo terminals and truck freight. Improving competitiveness in a MoS context
112 P. Morales-Fusco (2016)
transportation choice, taking the current demand as a whole and avoiding discussing over the
prevalent heterogeneity within the demand and their different negotiation power.
7.2.2 Introducing disaggregate choice models
Demand choice models are key for transportation planning in all its levels, from operational to
strategic and therefore have been widely studied in the literature providing multiple classifications
and the development of multiple sub-problems and approaches to solve the question.
Historically, the topic has been further developed in the case of passenger transportation. There
have been, however, and especially in recent years, some developments in freight modelling, from
microsimulation, network modelling and game theory to recreate the roles and behaviour of the
multiple agents involved. The topic was considered interesting enough to be the focus of the
conference that the Transportation Research Board held on 2006 (Hancock, 2008). Among other
interesting discussions, it is curious to see that the link between sea and land models in a
Motorways of the Sea context was identified as one issue to be solved (Tavasszy and Inro, 2006).
There exist several classifications of freight transportation models. For instance, the toolkit
developed by the United States NCHRP (National Cooperative Highway Research Program,
2008) identified 5 different groups of models (or classes) depending on the importance and
approach given to six distinct model components. The model components considered were: O-D
direct factoring, trip generation, trip distribution, mode split, traffic assignment and economic or
land use modelling. Some time later, Chow et al. (2010) expanded the NCHRP classification by
adding 2 more classes (F-G) to fill gaps found in the previous classifications. In any case, the
models that can cover the approach taken in this chapter would lay between class C and class D
group models (between Truck Models and Four-Step Commodity models).
Other model classification efforts worth mentioning are the previous work by Regan and Garrido,
(2001), which, from examining the methodologies found in the literature to that date proposed
alternative model classifications. According to one of the classifications identified, demand
models can be either commodity movement or vehicle movement based. That is, either predictive
models to assess the volume of the demand or models to assign-the-demand to the network. The
latter (assignment) is the topic of interest for this research, O-D pairing is not the topic addressed
but the ‘route’ chosen by the commodities being moved. The aim is not quantifying the potential
demand but, given a demand, know its distribution among the different options available.
An even previous classification which has been successfully used in later works is the one
established by Winston (1983) that differentiated between disaggregate and aggregate transport
choice models. Discrete (disaggregate) or qualitative choice models are commonly used to assess
the behaviour of individuals when faced with two or more alternatives. The main difference with
aggregate choice models is that the former statically relate the choice made by each individual
with its characteristics and the offer available to him or her. That is, the attributes taken as the
model variables and the attributes of all the alternatives available to the chooser. These models
are useful to forecast future choices from changes in the variables considered, however are more
7 – Mode choice model and shipping line strategies
PhD. Thesis 113
difficult to calibrate and need of a larger database and understanding of the individuals being
observed.
Disaggregate models in turn, and still following Winston’s classification, are classified between
inventory and behavioural, although both, in fact, reflect the behaviour of the choice-maker as
some other authors already pointed out before (Feo-Valero et al., 2011; Regan and Garrido, 2001).
Inventory models consider transport as part of the producing process whereas behavioural models
address modal choice from the perspective of a consumer, as stated by Feo-Valero et al. (2011),
they are undoubtedly suited to model transport passenger demand but could arguably fall short if
used for freight transportation.
When the transported cargo are individual carriers competing with road transportation with easy
transferability between modes (reflecting the easiness for modal shift existing in RoPax MoS lines
as discussed in section 2.1.2 and corresponding to the Pull-Push case as discussed in chapter 3
and summarized with Table 3-3 and Figure 3-3) the decision making is closer to behavioural than
inventory based. This would be the case applied in the cost formulations from chapter 6 and the
choice model discussed in this chapter.
7.2.3 Data sources for disaggregate models
Regarding the source of the data needed in disaggregate models, a database regarding the
behaviour, either actual or potential or the individuals is necessary in order to build and calibrate
the model. Data can be obtained either from using revealed preference (RP) or stated preferences
(SP) methodologies (Feo et al., 2011).
RP observes the current behaviour of the transporter, which can be combined with the existing
offer to establish the link between one and the other, whereas in SP the final user (or consumer)
is asked on hypothetical choices made exposed by the researcher. In the field of freight
transportation RP is not always easily obtained, given the confidentiality, especially on pricing
terms of transportation services, whereas given the complexity of the situation considered, SP
methodologies are complex to build, and the hypothetical circumstances considered may never
occur (Espino et al., 2007).
In the case of transportation chains, the current tendency is to move towards a combination of
both methods for instance by using adaptive state preference (ASP) analysis, which is an
interactive technique that asks the respondent to rate several hypothetical alternatives arising from
an existing situation, usually coming from a revealed preference situation. This is the case of some
of the assignation / behaviour models found in the literature that are related to transportation
choices with a RoRo or SSS option (Arencibia et al., 2015; Bergantino and Bolis, 2004; Feo et
al., 2011).
RoRo terminals and truck freight. Improving competitiveness in a MoS context
114 P. Morales-Fusco (2016)
7.2.4 Choice models applied to road vs SSS cases, attributes considered
The contributions from the existing literature specifically dealing with modal choice applied to
maritime transportation competing with road transportation are few and most of them are already
included in Feo-Valero et al. (2011), a bibliographical assessment of Freight Value of Time
(FVOT) considerations in freight transportation discrete choice models.
Most references on the topic are in fact, participated by Feo and spanning from 2003 to 2015. The
series of papers and proceedings covered a topic very similar to the starting point of this chapter
up to building the Logit disaggregate choice model (Arencibia et al., 2015; Espino et al., 2007;
Feo et al., 2011; Feo et al., 2003; Feo-Valero et al., 2011; Garcia-Menendez et al., 2009; García-
Menéndez et al., 2004). In the series of papers, the authors discussed the best model approach to
identify the attributes behind mode shifts from road to MoS lines, and provided weighted values
for the parameters of several Logit models to assess the shipper’s choice processes and the
potential of new MoS lines in the West Mediterranean.
In their first approach, Feo’s team analysed four industry sectors and using a series of interviews
to cargo owners, built a set of RP observations. After applying a conditional Logit model to them,
they concluded that cost, transit time and frequency were the most relevant attributes to account
for, while quality related attributes such probability of delay and damages also played a role in
some of the sectors considered (Feo et al., 2003; García-Menéndez et al., 2004).
After the first approach, the research takes a step forward and aims at building an ASP database
from interviewing freight forwarders. The reason being that the average company in the studied
industrial sectors were not big enough to own a logistics department of their own and, therefore,
forwarding was usually subcontracted (Espino et al., 2007). Besides the new approach to obtain
the database, the other main contribution from the research team are new FVOT observed
depending on the origin (Spanish province) of the cargo.
The next paper in the set (Garcia-Menendez et al., 2009), recovered the first RP database but
keeping only full load truck shipments. In that case it detected some bias towards road when the
cargo had higher value and when the decision maker was a freight forwarder, stating that this
could be a result of many of them possessing a fleet of lorries. Besides the attributes of cost, time
and reliability that appeared in the first papers, other attributes were found to be significant. Larger
road distances play in favour of SSS, there is predisposition towards road based transportation
(probably from the lack of knowledge of the sector or the burden from the port administrative
procedures) and the size of the shipment benefits road since a “lorry’s larger cargo capacity is an
advantage” (sic) towards a container counterpart. This would not be the case for RoRo/RoPax
shipments (considered in this chapter), where the ITU transported (a truck unit) would have the
same size in both cases.
After the three previous papers (and some conference proceedings) the authors produced a
comprehensive assessment of the existing literature in terms of Freight Value of Time (FVOT)
(Feo-Valero et al., 2011). Besides some aspects present in the previous papers and the calibration
of a new Logit model, the paper provides a good overview of the different approaches, the
7 – Mode choice model and shipping line strategies
PhD. Thesis 115
diversity of attributes considered, methodologies applied and, of special importance at this point,
a benchmark of values of time in freight transportation.
The last paper included in the set, (Arencibia et al., 2015), moved forward in the application of
the ASP using four basic attributes (time, cost, frequency and punctuality) and played an
equilibrium game with the interviewees. Afterwards, different mixed logit models were
considered and the randomness and correlation of the different existing errors in the attribute
perception were discussed. The study provided is solid, complete and determined that given the
actual level of service of the connections between Spain and Northern Europe, the most significant
driver behind modal shift is the cost and the best policies to move trucks from road to sea would
be by internalizing the external costs of the transport chain.
Additionally to that series of papers, two additional contributions specifically consider SSS
compared with road using disaggregate modal choice methodologies.
The first study, by Bergantino and Bolis (2004) was in fact the first reference to introduce RoRo
as an alternative by itself competing with road. It used an ASP database to which it applied a
Tobit model instead of the typical Logit, considering four variables: cost, time, frequency and
reliability. Variables reliability and frequency were found to have a threshold after which they did
not affect the competitiveness of the RoRo option whereas cost and time were considered all along
(hence, the Tobit model). Besides that, and although other authors stated it otherwise (Garcia-
Menendez et al., 2009), no bias towards road was found (a dummy variable was used to check it).
The lack of bias could be caused by the good knowledge of the maritime mode of the sample of
companies consulted and the small size of the sample (7 companies), as already pointed out by
the authors of the paper.
The other relevant reference, by Russo and Chilà (2007) also considered the feasibility of a high
speed RoRo line (peak speed of 38 knots), in this case addressing two time-sensitive industrial
sectors (perishables and industrial manufactured commodities). After applying a multinomial
Logit to the existing demand (no disaggregate database used), a simple cost model was built to
assess the best speed to be deployed. The authors concluded that there was room for high speed
RoRo connections due to the reduction in transit time. However, the model used some unlikely
assumptions, like full cargoes, non-empty returns, an unlikely bunker consumption progression
with vessel speed, and other considerations like the effect the strait of Messina (crossed by ship)
and the high cost to cross it, which may have effects on the findings of the paper.
Since the approach and scope of the research participated by Feo (Arencibia et al., 2015; Espino
et al., 2007; Feo et al., 2011, 2003; Feo-Valero et al., 2011; Garcia-Menendez et al., 2009; García-
Menéndez et al., 2004) is the most complete and the closest to the practical case studied in this
chapter, its findings will be used as a starting point to build up a disaggregate model of our own.
More specifically, the VOT values and the other parameters listed in the multinomial Logit from
Garcia-Menendez et al. (2009) will help calibrating the multinomial function to be used in this
study.
RoRo terminals and truck freight. Improving competitiveness in a MoS context
116 P. Morales-Fusco (2016)
7.3 Methodology lay out
The goal is to define pricing schemes in a regular shipping line operated with RoRo ships where
the only competition envisaged is the alternative road route. Since it is considered that drivers
might travel aboard the ships, the line (and the vessels) is in fact RoPax. In order to assess the
scheme a freight disaggregate choice model is built, a multinomial Logit model. To test the
validity of the model, real import/export operations between Spain and Italy (most mature
network of MoS in Spain) combined with parameter and variable values found in the literature
will be used.
7.3.1 Scenarios considered
Following the assessment of business models from chapters 3 and 6, two kinds of cargo are
considered for the sea link: full trucks and platforms (without tractor unit). Both kinds of cargo
have different needs in terms of space in the ship’s decks (measured in linear meters, L), passenger
resting facilities (measured in passenger capacity, P) and different stevedoring costs as well.
Therefore, their freight cost (pricing) should be calculated accordingly and independently for each
type of cargo considered.
Moreover, the characteristics –GT and DWT– of the most appropriate ship given a certain number
of cargo, will vary depending the number of units of each kind of cargo (together with its
operational and fixed costs, besides the stevedoring ones) as provided in Table 6-2 and equations
(6-11) and (6-12).
The other two kinds of cargo that can easily be found in a RoPax ship with these characteristics,
already introduced, discussed and described in chapter 4 (see Figure 4-4) will be left out of the
equation and their associated costs or service times (calculated in 4.5.3 and 4.5.5) will not
considered thus far. That is, cars as cargo (to be sold) and passengers with or without their mean
of transportation (cars) will not be accounted for, by now.
In general terms, then, and considering that only MoS and road transportation are competing, as
justified in section 7.2, there would be only 3 transport strategies available -with their variations-
as discussed in chapter 6 (Figure 6-1 and successive):
Only road (cargo travels accompanied all the way).
Road combined with accompanied SSS (the full truck plus its driver travel with the cargo
in the maritime leg).
Road combined with unaccompanied SSS (the truck head and tractor unit do not travel
with the cargo in the maritime leg of the chain and there is a second driver, and tractor
unit, in the destination port).
Full trucks that travel accompanied in the maritime leg have need of a bigger space in the cargo
decks, need passenger cabins, have larger operating costs but lower stevedoring times and costs
7 – Mode choice model and shipping line strategies
PhD. Thesis 117
and a smaller door-to-door transport time. Truck platforms, on the other hand, have a smaller need
of space per unit, do not require passenger cabins (ships with smaller GT) but increase the
stevedoring times and costs and result in a less efficient use of the ship at the stopovers (the
stevedoring time, and thus the time in port is increased). However, platforms increase the ITU
capacity of the ship, allowing to carry more cargo and there is less need of accommodation for
drivers on board.
7.3.2 Utility concept and Logit Model
Utility concept
Disaggregate behavioral models assume that each ITU (or bunch of commodities) has all the
information available regarding all the transportation options in order to choose the one that will
maximize its needs (utility).
Given K alternatives available to move certain unit u, a grade can be assigned to each available
option. The user, u, then would choose the one with the highest score (utility). In other words, the
alternative that better suits his/her requirements. However, the utility is not a direct and observable
value, therefore, the user might not have accurate values for all the parameters evaluated or his/her
interpretation of reality can be biased. Additionally, the model-builder can also wrongly identify,
overestimate or underestimate the requirements of the end-user or merge users with different
needs and sensibilities in the model. Therefore, the estimated utility value should be written as a
sum of two different components (7-1):
,uk uk uk u ukU V x x (7-1)
A base utility component, Vuk, which is a function of two sets of quantifiable attributes:
o xuk, a vector with alternative specific attributes whose value can differ
depending on the characteristics of the end-user, u, and alternative, k.
Cost or time for instance, would fall under this group if an heterogenic
set of potential users is considered, for instance.
o xu, a vector containing costumer specific attributes, that reflect its
perception on the existing alternatives, derived from the characteristics
of the individual but that is independent on the alternative used. For
instance cargo characteristics (i.e. sell-by date, value, special transport
needs) or production process being considered, as listed in Table 3-1
from chapter 3.
An unobserved error component, εuk. Used to explain the inconsistencies between the
utility values obtained Vuk, and the final choice made by each individual. Such errors can
be attributed to research deficiencies or the impact of all the unobserved variables which
have an impact on the utility of choosing a specific alternative. Error distributions not
RoRo terminals and truck freight. Improving competitiveness in a MoS context
118 P. Morales-Fusco (2016)
attributable to the heterogeneity of the sample and the respondents should be addressed
for a more accurate and reliable model.
Thus, the estimated utility of a given alternative is expressed as the sum of two components, one
deterministic and another being either random or stochastic. Therefore, there is a chance the u
costumer does not take the apparently best option available and chooses a different alternative or
that his assessment of the drivers influencing his transportation choice differs the one from the
average costumer.
In any case, the probability of the costumer to choose a specific alternative k is expressed as:
1 1 1,..., , ,...,uk uk uk u uk uk uk uk uk uKp P U U U U U U U U (7-2)
And, if considering F-uk a multivariate distribution of K-1 error terms (all errors for the customer
u, excluding εuk) it can be expressed as:
1 1 ,...,uk uk uk u uk u uk uK uk uK ukp F V V V V (7-3)
Error distribution – Logit model
Depending on the considerations regarding the distribution of the errors and their difference,
several multivariate choice models have been defined in the literature (Probit, Logit, etc). In this
case, a multivariate Logit model has been chosen, mainly because the resulting probability
function is easier to handle and its use is widespread in the existing literature on the topic (Feo-
Valero et al., 2011).
The Multinomial Logit Model (multinomial logistic probability model or MLM henceforth)
assumes that each measurement error is equally and independently distributed among the
alternatives considered and that its pdf follows a Gumbel distribution. In such case, the probability
that the transporter u choses the k alternative is expressed as:
1
0,1uk
uk
V
uk KV
k
ep
e
(7-4)
Whenever several transporters have identical characteristics -which will be the case in the applied
case in here, since the database used only discriminates at province level- it can be assumed that
they distribute among the different alternatives in a percentage that corresponds to the probability
of taking each of the modes.
In such case, the error part of the utility will not only account to the error made by the end-user
when grading the utilities of each alternative but also for their heterogeneity. More detailed studies
(probably with a smaller sample) should be able to reduce the heterogeneity-error by including
7 – Mode choice model and shipping line strategies
PhD. Thesis 119
more variables when building the utility function. In any case, given du users with identical base
utility Vuk , duk of them that will opt for the alternative k as expressed in (7-5).
1
uk
uk
V
uk u KV
k
ed d
e
(7-5)
Further development on the scope and particularities of the different utility-function-based
disaggregate models as well as the steps taken from (7-2) and (7-3) to (7-4) can be found in
Croissant (2003) among other references.
7.3.3 Demand considerations
The role that the local distance (distance to the ports of call of the MoS being assessed and referred
to as δ) and the total road distance (Lij) play on the competitiveness of a supply chain with a MoS
leg is relevant for the calculation of the cost and time associated to each business strategy as
discussed extensively in the previous chapter (from Figure 6-5 to Figure 6-9) and the literature
(Feo et al., 2011; Medda and Trujillo, 2010). Therefore, it is deemed necessary to characterize the
demand considering both terms and assess the influence of the road distance and the distance to
the port in the mode choice decision making.
Assuming that the demand can be expressed in geographical terms as a function either
deterministic or stochastic depending on the distance parameters, δ and Lij, and given that the
physical parameters to describe the utility of each alternative are also distance dependent, it should
be possible to integrate (7-5) to calculate the total demand of each alternative (business model).
If, additionally, it is considered that the total demand from the hinterland of the two considered
ports can be expressed by means of a distribution function, then the total demand for a given
alternative can be expressed as:
�� = � � � ��
����
= � � � ���, ����
����
�� ��, ���� (7-6)
Where:
d – distribution function of the total demand, expressed in terms of the distance parameters, δ and
Lij
dk – distribution function of the demand opting for a specific transportation alternative k, also
expressed in terms of the distance parameters.
D – absolute demand (both hinterlands combined).
pk – probability to choose the k alternative given a specific set of distances.
RoRo terminals and truck freight. Improving competitiveness in a MoS context
120 P. Morales-Fusco (2016)
In (7-6) the use of ‘u’ from previous equations is dropped to ease the formulation. In fact, it is no
longer relevant since all demand from a given pair of δ and Lij is supposed to have the same
characteristics.
pk could be estimated by means of a discrete choice model as seen in (7-5) whereas current
shipment values (from statistical observatories or other sources) and/or future demand forecasts
of traffic between the hinterlands of both ports can be used to define d, if available. Combining
both it should be possible to estimate the overall demand for each means of transportation given
a specific configuration.
Section 7.5 will deal with the application of such model to a specific case, traffic between Spain
and Italy using the MoS between Barcelona and Civitavecchia. To do so, a multinomial Logit
model will be laid out and calibrated in order to quantify d, and assess the parameters and variables
to be used in the Logit assignation model.
7.3.4 Freight price considerations
In order to find the optimal ship’s size for a specific shipping line together with the tariffs to be
charged to maximize the profit margin for the shipping company it is necessary to know the
demand behavior beforehand. That is, how many potential customers there are, D, where are they,
d(δ, Lij) and the influence of the different attributes related with each available transport
alternative to the final choice, pk(Vuk).
Ideally the knowledge of the cost (and time) structure of the transport chain should be used in
order to discriminate between alternatives. In terms of price setting, the goal of the shipping
company would be to attract the cargo that would incur in its maximum benefit (considering that
the demand is known in a third order level (Tirole, 1988) for price discrimination). Considering
that the costs for the shipping company are known, as well as the costs of the different strategies
available to the transporter, it would be possible to set up a profit function, Π, that once
maximized, would ensure that the shipping company gets the maximum profit possible.
Additionally, demand volumes could vary depending on the time of the year (seasonality or even
day of the week), having a possible effect on the price structure and competitiveness of the
maritime link. This justifies the introduction of the usage factor (χ parameter), already used to
build the cost functions from section 6.5, to represent the average occupancy of the ship and
express that is virtually impossible to ensure full occupation of the maritime link all year long.
The objective function to be maximized, Π, would consider the incomes generated by each loaded
unit minus the ship’s operation costs derived from them plus the costs associated to the size of
the ship necessary to fit that volume of cargo. The problem then, would be that of finding the
tariffs, τk, for each cargo format k available with � ∈ (2, �), to maximize Π (7-7).
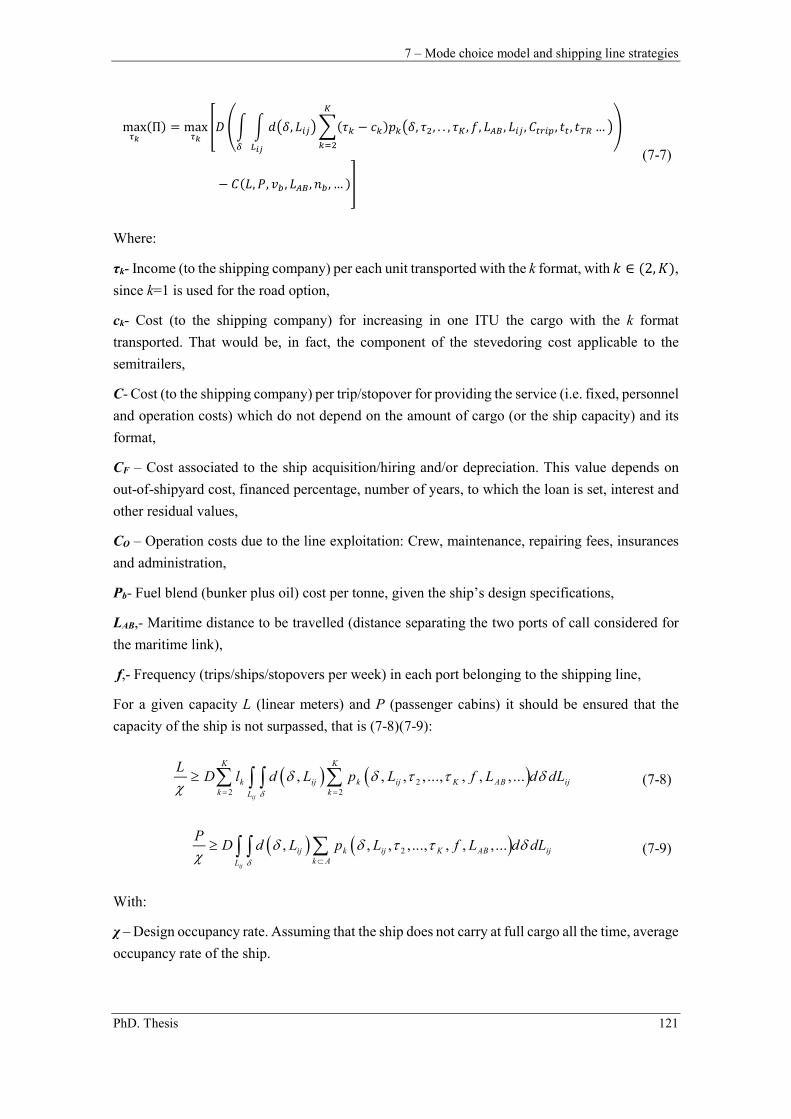
7 – Mode choice model and shipping line strategies
PhD. Thesis 121
max��
(Π) = max��
�� �� � ���, ���� �(�� − ��)����, ��, . . , ��, �, ���, ���, �����, ��, ��� … �
�
�������
�
− �(�, �, ��, ���, ��, … )�
(7-7)
Where:
τk- Income (to the shipping company) per each unit transported with the k format, with � ∈ (2, �),
since k=1 is used for the road option,
ck- Cost (to the shipping company) for increasing in one ITU the cargo with the k format
transported. That would be, in fact, the component of the stevedoring cost applicable to the
semitrailers,
C- Cost (to the shipping company) per trip/stopover for providing the service (i.e. fixed, personnel
and operation costs) which do not depend on the amount of cargo (or the ship capacity) and its
format,
CF – Cost associated to the ship acquisition/hiring and/or depreciation. This value depends on
out-of-shipyard cost, financed percentage, number of years, to which the loan is set, interest and
other residual values,
CO – Operation costs due to the line exploitation: Crew, maintenance, repairing fees, insurances
and administration,
Pb- Fuel blend (bunker plus oil) cost per tonne, given the ship’s design specifications,
LAB,- Maritime distance to be travelled (distance separating the two ports of call considered for
the maritime link),
f,- Frequency (trips/ships/stopovers per week) in each port belonging to the shipping line,
For a given capacity L (linear meters) and P (passenger cabins) it should be ensured that the
capacity of the ship is not surpassed, that is (7-8)(7-9):
22 2
, , , , ..., , , , ...ij
K K
k ij k ij K AB ijk kL
LD l d L p L f L d dL
(7-8)
2, , , , ..., , , , ...ij
ij k ij K AB ijk AL
PD d L p L f L d dL
(7-9)
With:
χ – Design occupancy rate. Assuming that the ship does not carry at full cargo all the time, average
occupancy rate of the ship.
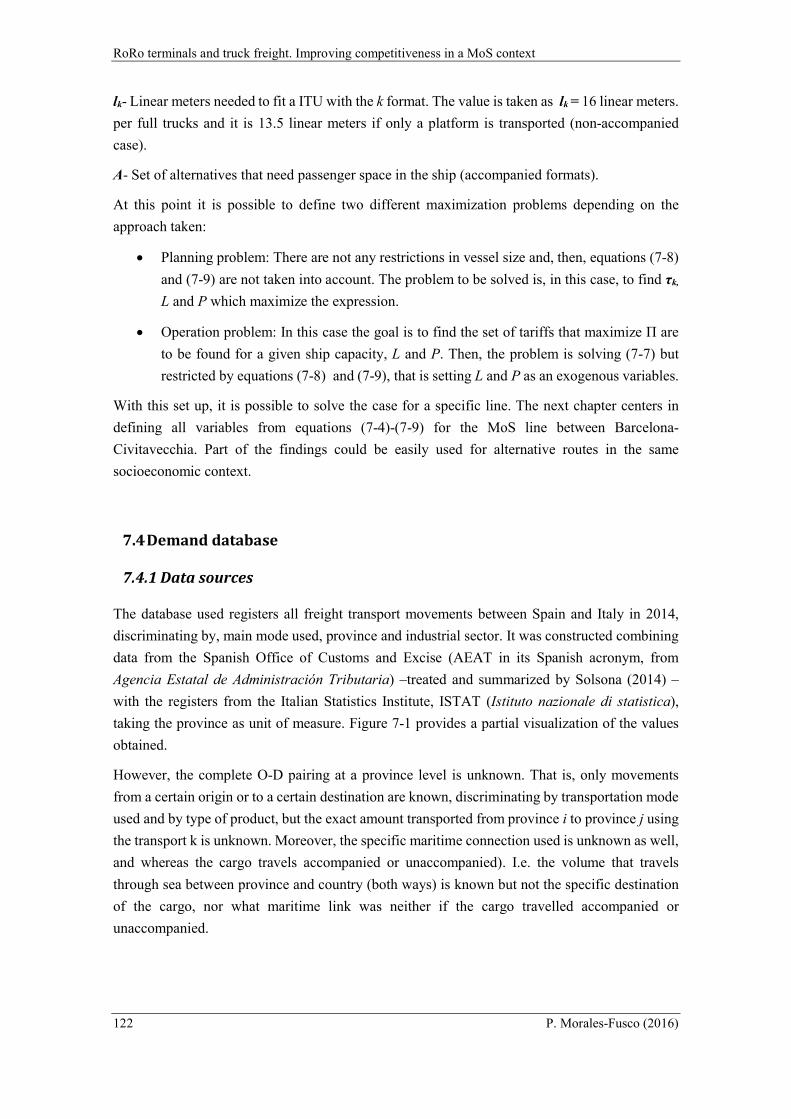
RoRo terminals and truck freight. Improving competitiveness in a MoS context
122 P. Morales-Fusco (2016)
lk- Linear meters needed to fit a ITU with the k format. The value is taken as lk = 16 linear meters.
per full trucks and it is 13.5 linear meters if only a platform is transported (non-accompanied
case).
A- Set of alternatives that need passenger space in the ship (accompanied formats).
At this point it is possible to define two different maximization problems depending on the
approach taken:
Planning problem: There are not any restrictions in vessel size and, then, equations (7-8)
and (7-9) are not taken into account. The problem to be solved is, in this case, to find τk,
L and P which maximize the expression.
Operation problem: In this case the goal is to find the set of tariffs that maximize Π are
to be found for a given ship capacity, L and P. Then, the problem is solving (7-7) but
restricted by equations (7-8) and (7-9), that is setting L and P as an exogenous variables.
With this set up, it is possible to solve the case for a specific line. The next chapter centers in
defining all variables from equations (7-4)-(7-9) for the MoS line between Barcelona-
Civitavecchia. Part of the findings could be easily used for alternative routes in the same
socioeconomic context.
7.4 Demand database
7.4.1 Data sources
The database used registers all freight transport movements between Spain and Italy in 2014,
discriminating by, main mode used, province and industrial sector. It was constructed combining
data from the Spanish Office of Customs and Excise (AEAT in its Spanish acronym, from
Agencia Estatal de Administración Tributaria) –treated and summarized by Solsona (2014) –
with the registers from the Italian Statistics Institute, ISTAT (Istituto nazionale di statistica),
taking the province as unit of measure. Figure 7-1 provides a partial visualization of the values
obtained.
However, the complete O-D pairing at a province level is unknown. That is, only movements
from a certain origin or to a certain destination are known, discriminating by transportation mode
used and by type of product, but the exact amount transported from province i to province j using
the transport k is unknown. Moreover, the specific maritime connection used is unknown as well,
and whereas the cargo travels accompanied or unaccompanied). I.e. the volume that travels
through sea between province and country (both ways) is known but not the specific destination
of the cargo, nor what maritime link was neither if the cargo travelled accompanied or
unaccompanied.
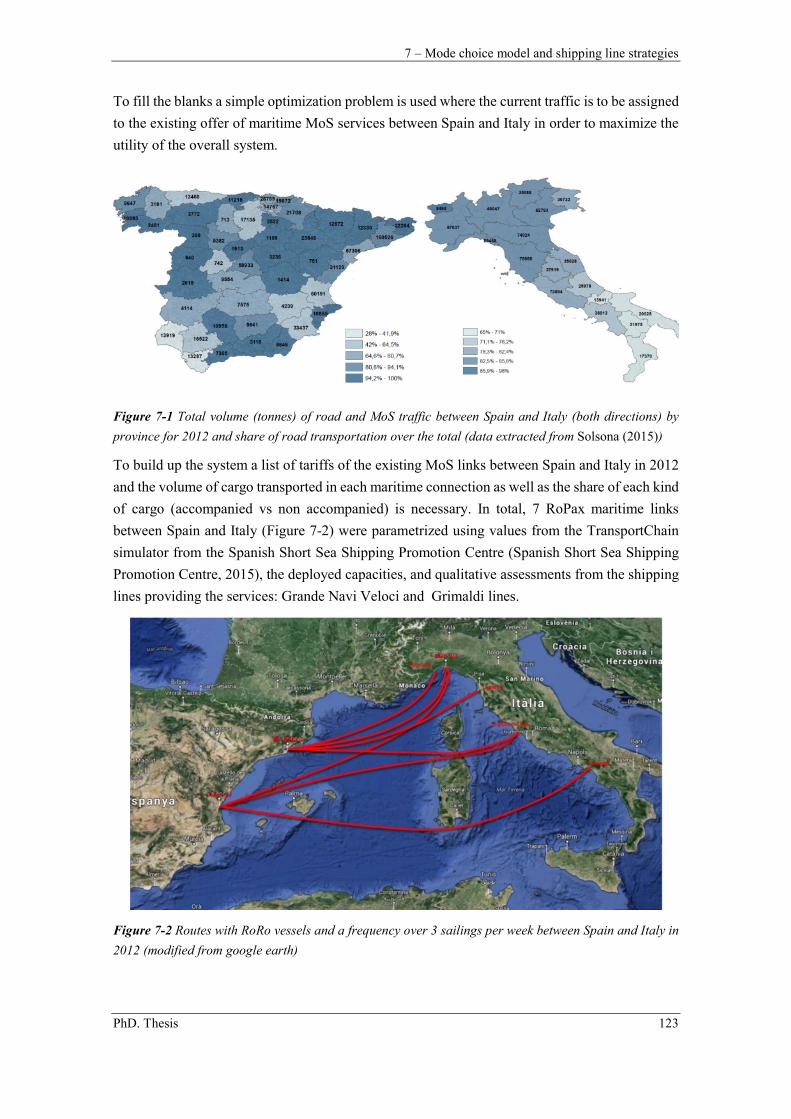
7 – Mode choice model and shipping line strategies
PhD. Thesis 123
To fill the blanks a simple optimization problem is used where the current traffic is to be assigned
to the existing offer of maritime MoS services between Spain and Italy in order to maximize the
utility of the overall system.
Figure 7-1 Total volume (tonnes) of road and MoS traffic between Spain and Italy (both directions) by
province for 2012 and share of road transportation over the total (data extracted from Solsona (2015))
To build up the system a list of tariffs of the existing MoS links between Spain and Italy in 2012
and the volume of cargo transported in each maritime connection as well as the share of each kind
of cargo (accompanied vs non accompanied) is necessary. In total, 7 RoPax maritime links
between Spain and Italy (Figure 7-2) were parametrized using values from the TransportChain
simulator from the Spanish Short Sea Shipping Promotion Centre (Spanish Short Sea Shipping
Promotion Centre, 2015), the deployed capacities, and qualitative assessments from the shipping
lines providing the services: Grande Navi Veloci and Grimaldi lines.
Figure 7-2 Routes with RoRo vessels and a frequency over 3 sailings per week between Spain and Italy in
2012 (modified from google earth)
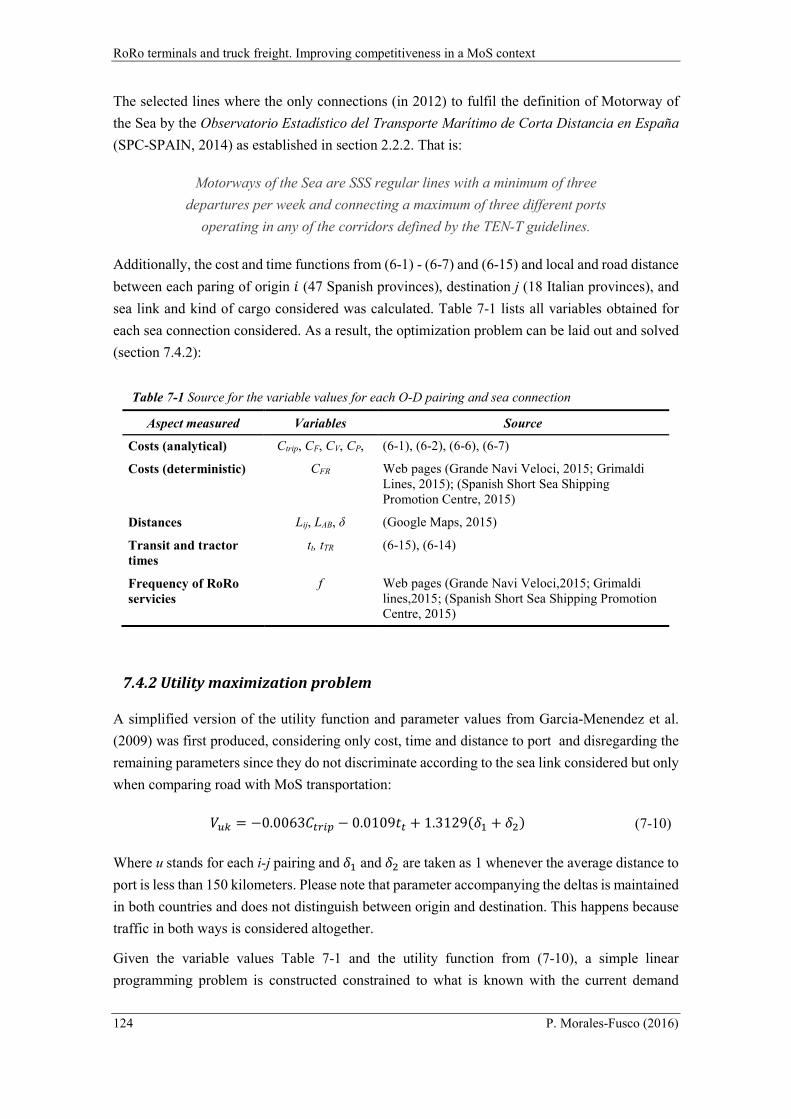
RoRo terminals and truck freight. Improving competitiveness in a MoS context
124 P. Morales-Fusco (2016)
The selected lines where the only connections (in 2012) to fulfil the definition of Motorway of
the Sea by the Observatorio Estadístico del Transporte Marítimo de Corta Distancia en España
(SPC-SPAIN, 2014) as established in section 2.2.2. That is:
Motorways of the Sea are SSS regular lines with a minimum of three
departures per week and connecting a maximum of three different ports
operating in any of the corridors defined by the TEN-T guidelines.
Additionally, the cost and time functions from (6-1) - (6-7) and (6-15) and local and road distance
between each paring of origin � (47 Spanish provinces), destination j (18 Italian provinces), and
sea link and kind of cargo considered was calculated. Table 7-1 lists all variables obtained for
each sea connection considered. As a result, the optimization problem can be laid out and solved
(section 7.4.2):
Table 7-1 Source for the variable values for each O-D pairing and sea connection
Aspect measured Variables Source
Costs (analytical) Ctrip, CF, CV, CP, (6-1), (6-2), (6-6), (6-7)
Costs (deterministic) CFR Web pages (Grande Navi Veloci, 2015; Grimaldi Lines, 2015); (Spanish Short Sea Shipping Promotion Centre, 2015)
Distances Lij, LAB, δ (Google Maps, 2015)
Transit and tractor times
tt, tTR (6-15), (6-14)
Frequency of RoRo servicies
f Web pages (Grande Navi Veloci,2015; Grimaldi lines,2015; (Spanish Short Sea Shipping Promotion Centre, 2015)
7.4.2 Utility maximization problem
A simplified version of the utility function and parameter values from Garcia-Menendez et al.
(2009) was first produced, considering only cost, time and distance to port and disregarding the
remaining parameters since they do not discriminate according to the sea link considered but only
when comparing road with MoS transportation:
��� = −0.0063����� − 0.0109�� + 1.3129(�� + ��) (7-10)
Where u stands for each i-j pairing and �� and �� are taken as 1 whenever the average distance to
port is less than 150 kilometers. Please note that parameter accompanying the deltas is maintained
in both countries and does not distinguish between origin and destination. This happens because
traffic in both ways is considered altogether.
Given the variable values Table 7-1 and the utility function from (7-10), a simple linear
programming problem is constructed constrained to what is known with the current demand
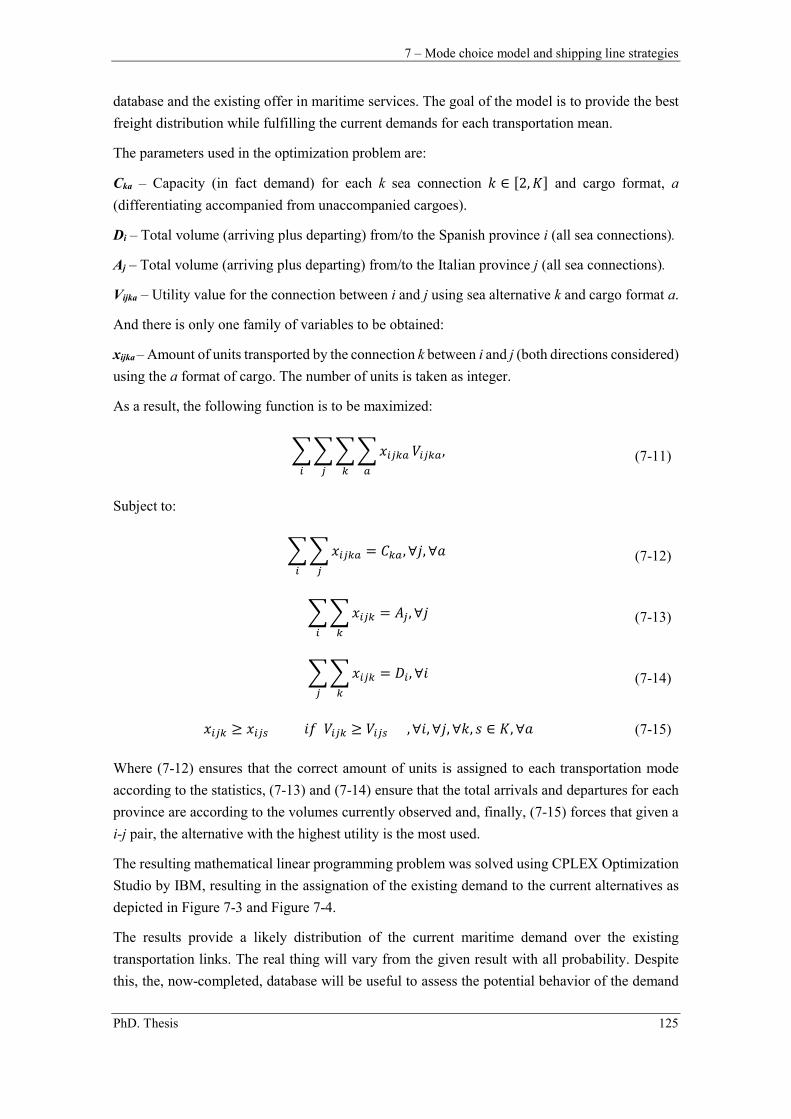
7 – Mode choice model and shipping line strategies
PhD. Thesis 125
database and the existing offer in maritime services. The goal of the model is to provide the best
freight distribution while fulfilling the current demands for each transportation mean.
The parameters used in the optimization problem are:
Cka – Capacity (in fact demand) for each k sea connection � ∈ [2, �] and cargo format, a
(differentiating accompanied from unaccompanied cargoes).
Di – Total volume (arriving plus departing) from/to the Spanish province i (all sea connections).
Aj – Total volume (arriving plus departing) from/to the Italian province j (all sea connections).
Vijka – Utility value for the connection between i and j using sea alternative k and cargo format a.
And there is only one family of variables to be obtained:
xijka – Amount of units transported by the connection k between i and j (both directions considered)
using the a format of cargo. The number of units is taken as integer.
As a result, the following function is to be maximized:
� � � � �����
�
�����,
���
(7-11)
Subject to:
� � ����� = ���, ∀�, ∀�
��
(7-12)
� � ���� = ��, ∀�
��
(7-13)
� � ���� = ��, ∀�
��
(7-14)
���� ≥ ���� �� ���� ≥ ���� , ∀�, ∀�, ∀�, � ∈ �, ∀� (7-15)
Where (7-12) ensures that the correct amount of units is assigned to each transportation mode
according to the statistics, (7-13) and (7-14) ensure that the total arrivals and departures for each
province are according to the volumes currently observed and, finally, (7-15) forces that given a
i-j pair, the alternative with the highest utility is the most used.
The resulting mathematical linear programming problem was solved using CPLEX Optimization
Studio by IBM, resulting in the assignation of the existing demand to the current alternatives as
depicted in Figure 7-3 and Figure 7-4.
The results provide a likely distribution of the current maritime demand over the existing
transportation links. The real thing will vary from the given result with all probability. Despite
this, the, now-completed, database will be useful to assess the potential behavior of the demand
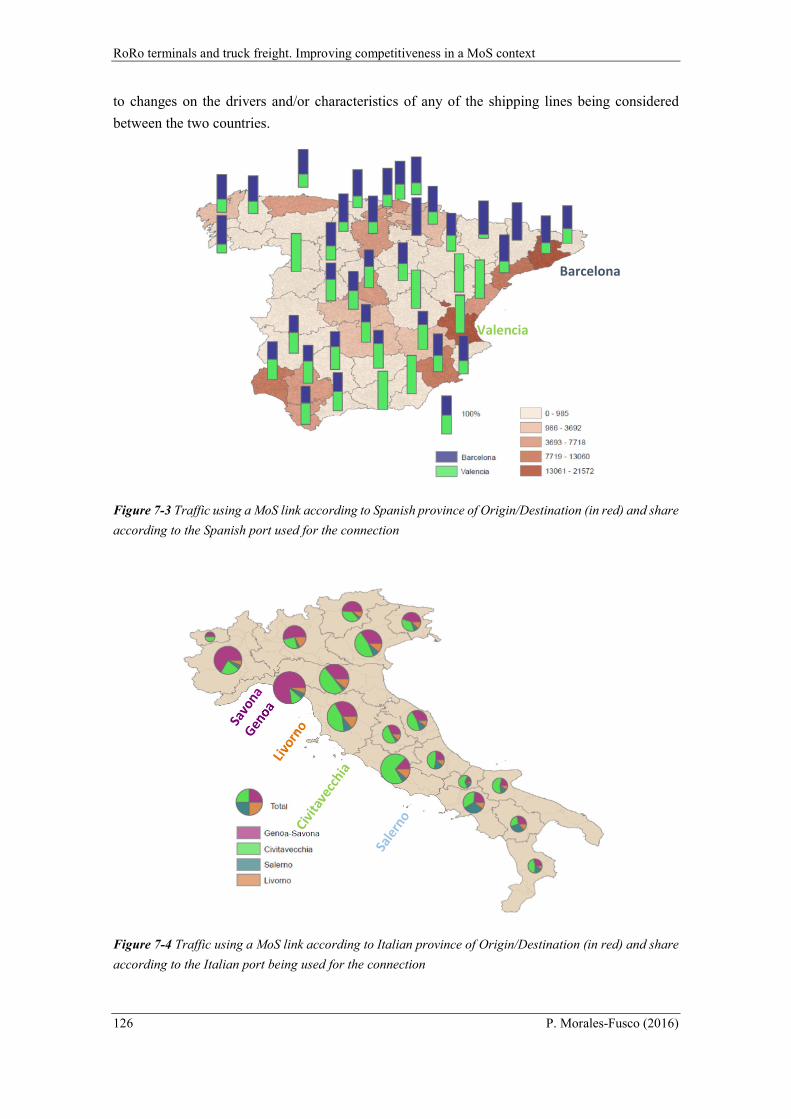
RoRo terminals and truck freight. Improving competitiveness in a MoS context
126 P. Morales-Fusco (2016)
to changes on the drivers and/or characteristics of any of the shipping lines being considered
between the two countries.
Figure 7-3 Traffic using a MoS link according to Spanish province of Origin/Destination (in red) and share
according to the Spanish port used for the connection
Figure 7-4 Traffic using a MoS link according to Italian province of Origin/Destination (in red) and share
according to the Italian port being used for the connection
Valencia
Barcelona
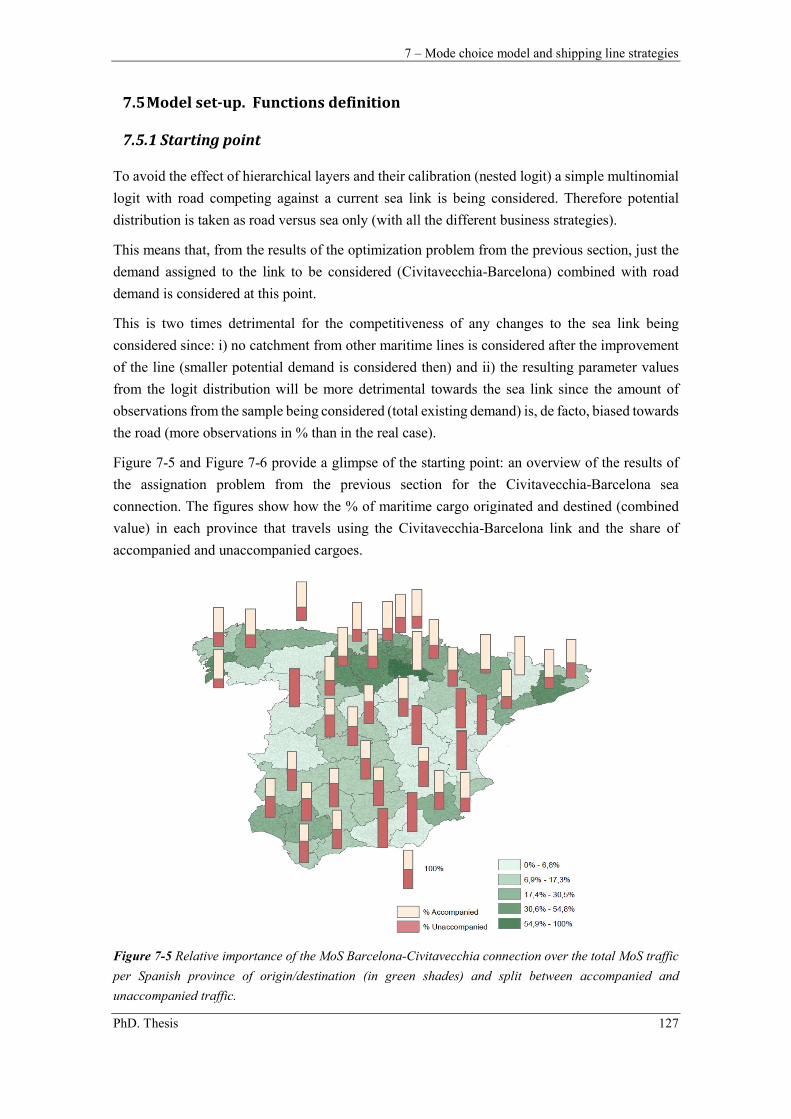
7 – Mode choice model and shipping line strategies
PhD. Thesis 127
7.5 Model set-up. Functions definition
7.5.1 Starting point
To avoid the effect of hierarchical layers and their calibration (nested logit) a simple multinomial
logit with road competing against a current sea link is being considered. Therefore potential
distribution is taken as road versus sea only (with all the different business strategies).
This means that, from the results of the optimization problem from the previous section, just the
demand assigned to the link to be considered (Civitavecchia-Barcelona) combined with road
demand is considered at this point.
This is two times detrimental for the competitiveness of any changes to the sea link being
considered since: i) no catchment from other maritime lines is considered after the improvement
of the line (smaller potential demand is considered then) and ii) the resulting parameter values
from the logit distribution will be more detrimental towards the sea link since the amount of
observations from the sample being considered (total existing demand) is, de facto, biased towards
the road (more observations in % than in the real case).
Figure 7-5 and Figure 7-6 provide a glimpse of the starting point: an overview of the results of
the assignation problem from the previous section for the Civitavecchia-Barcelona sea
connection. The figures show how the % of maritime cargo originated and destined (combined
value) in each province that travels using the Civitavecchia-Barcelona link and the share of
accompanied and unaccompanied cargoes.
Figure 7-5 Relative importance of the MoS Barcelona-Civitavecchia connection over the total MoS traffic
per Spanish province of origin/destination (in green shades) and split between accompanied and
unaccompanied traffic.
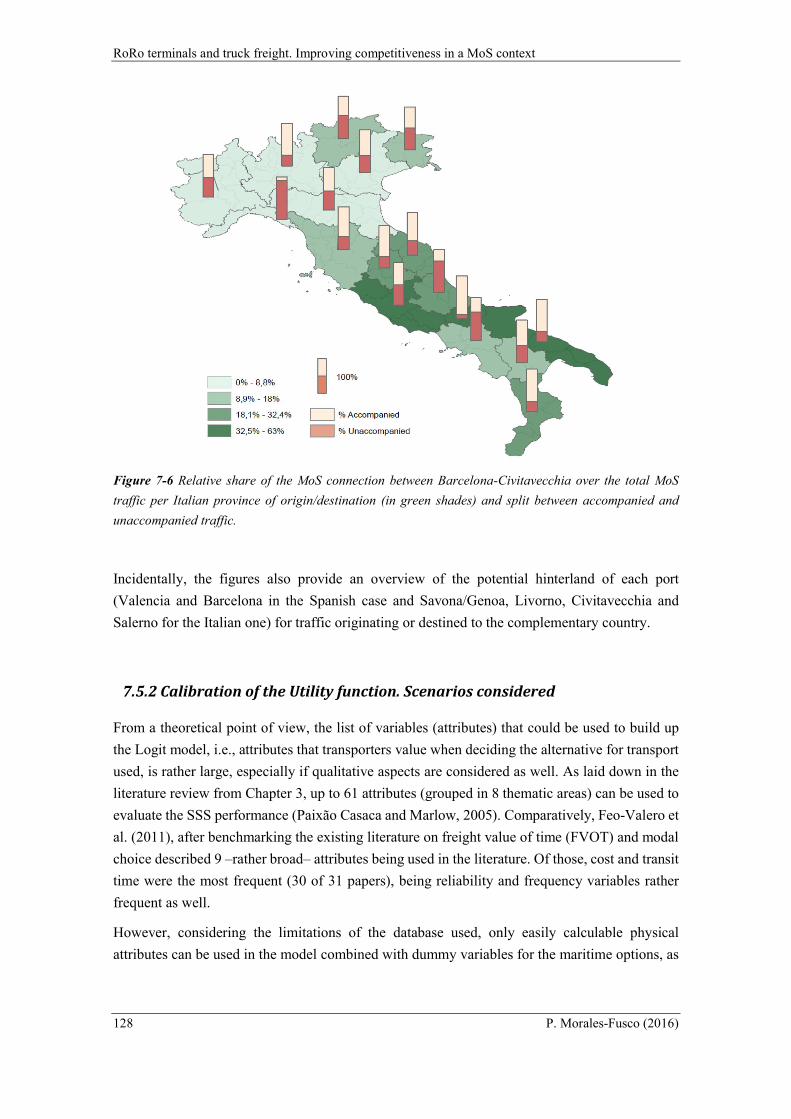
RoRo terminals and truck freight. Improving competitiveness in a MoS context
128 P. Morales-Fusco (2016)
Figure 7-6 Relative share of the MoS connection between Barcelona-Civitavecchia over the total MoS
traffic per Italian province of origin/destination (in green shades) and split between accompanied and
unaccompanied traffic.
Incidentally, the figures also provide an overview of the potential hinterland of each port
(Valencia and Barcelona in the Spanish case and Savona/Genoa, Livorno, Civitavecchia and
Salerno for the Italian one) for traffic originating or destined to the complementary country.
7.5.2 Calibration of the Utility function. Scenarios considered
From a theoretical point of view, the list of variables (attributes) that could be used to build up
the Logit model, i.e., attributes that transporters value when deciding the alternative for transport
used, is rather large, especially if qualitative aspects are considered as well. As laid down in the
literature review from Chapter 3, up to 61 attributes (grouped in 8 thematic areas) can be used to
evaluate the SSS performance (Paixão Casaca and Marlow, 2005). Comparatively, Feo-Valero et
al. (2011), after benchmarking the existing literature on freight value of time (FVOT) and modal
choice described 9 –rather broad– attributes being used in the literature. Of those, cost and transit
time were the most frequent (30 of 31 papers), being reliability and frequency variables rather
frequent as well.
However, considering the limitations of the database used, only easily calculable physical
attributes can be used in the model combined with dummy variables for the maritime options, as
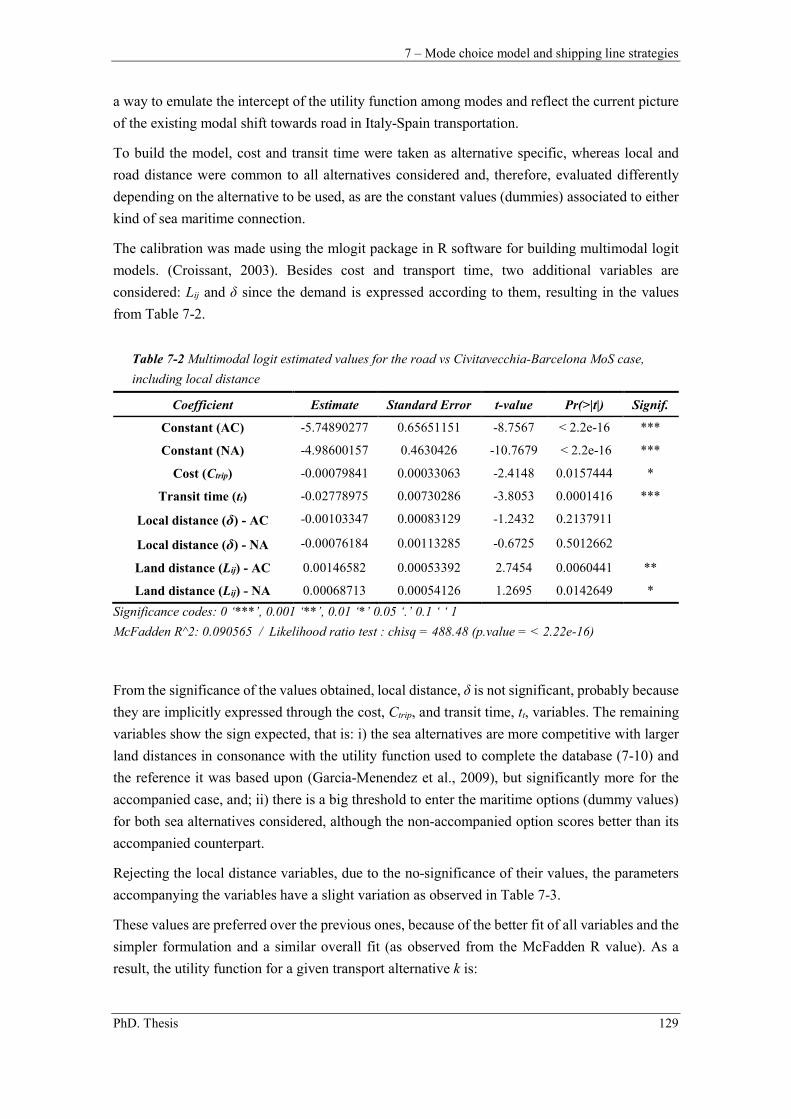
7 – Mode choice model and shipping line strategies
PhD. Thesis 129
a way to emulate the intercept of the utility function among modes and reflect the current picture
of the existing modal shift towards road in Italy-Spain transportation.
To build the model, cost and transit time were taken as alternative specific, whereas local and
road distance were common to all alternatives considered and, therefore, evaluated differently
depending on the alternative to be used, as are the constant values (dummies) associated to either
kind of sea maritime connection.
The calibration was made using the mlogit package in R software for building multimodal logit
models. (Croissant, 2003). Besides cost and transport time, two additional variables are
considered: Lij and δ since the demand is expressed according to them, resulting in the values
from Table 7-2.
Table 7-2 Multimodal logit estimated values for the road vs Civitavecchia-Barcelona MoS case,
including local distance
Coefficient Estimate Standard Error t-value Pr(>|t|) Signif.
Constant (AC) -5.74890277 0.65651151 -8.7567 < 2.2e-16 ***
Constant (NA) -4.98600157 0.4630426 -10.7679 < 2.2e-16 ***
Cost (Ctrip) -0.00079841 0.00033063 -2.4148 0.0157444 *
Transit time (tt) -0.02778975 0.00730286 -3.8053 0.0001416 ***
Local distance (δ) - AC -0.00103347 0.00083129 -1.2432 0.2137911
Local distance (δ) - NA -0.00076184 0.00113285 -0.6725 0.5012662
Land distance (Lij) - AC 0.00146582 0.00053392 2.7454 0.0060441 **
Land distance (Lij) - NA 0.00068713 0.00054126 1.2695 0.0142649 *
Significance codes: 0 ‘***’, 0.001 ‘**’, 0.01 ‘*’ 0.05 ‘.’ 0.1 ‘ ‘ 1
McFadden R^2: 0.090565 / Likelihood ratio test : chisq = 488.48 (p.value = < 2.22e-16)
From the significance of the values obtained, local distance, δ is not significant, probably because
they are implicitly expressed through the cost, Ctrip, and transit time, tt, variables. The remaining
variables show the sign expected, that is: i) the sea alternatives are more competitive with larger
land distances in consonance with the utility function used to complete the database (7-10) and
the reference it was based upon (Garcia-Menendez et al., 2009), but significantly more for the
accompanied case, and; ii) there is a big threshold to enter the maritime options (dummy values)
for both sea alternatives considered, although the non-accompanied option scores better than its
accompanied counterpart.
Rejecting the local distance variables, due to the no-significance of their values, the parameters
accompanying the variables have a slight variation as observed in Table 7-3.
These values are preferred over the previous ones, because of the better fit of all variables and the
simpler formulation and a similar overall fit (as observed from the McFadden R value). As a
result, the utility function for a given transport alternative k is:
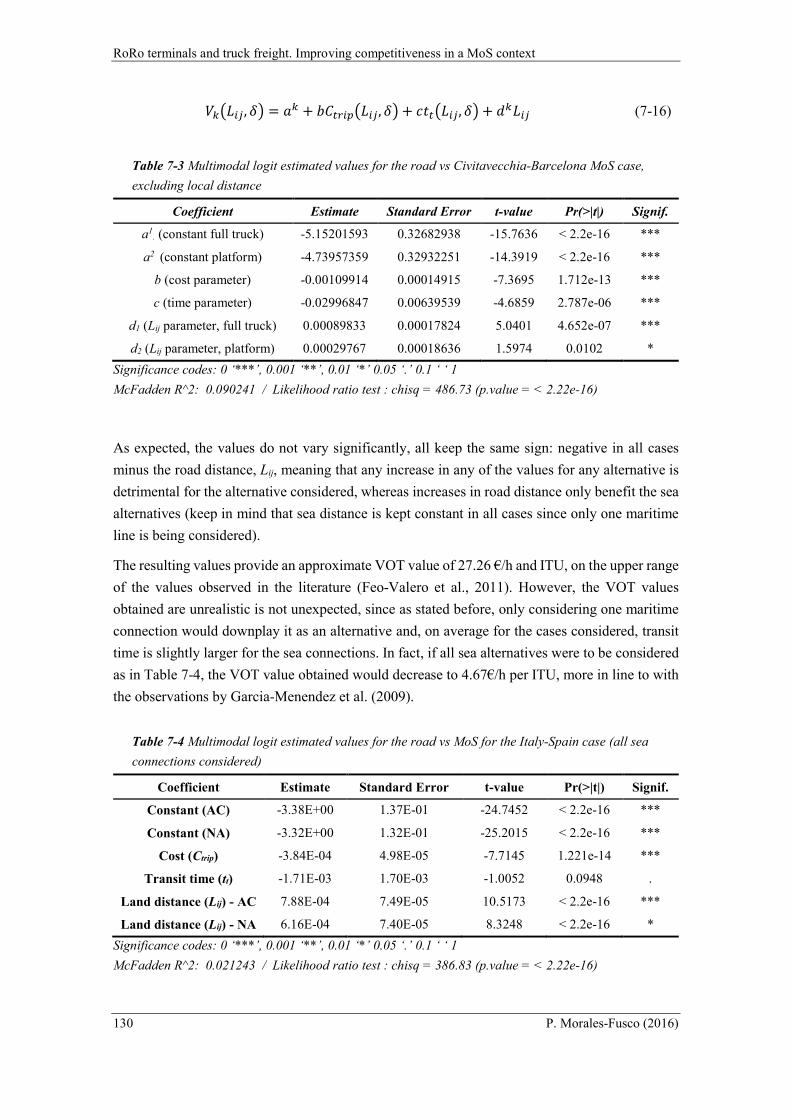
RoRo terminals and truck freight. Improving competitiveness in a MoS context
130 P. Morales-Fusco (2016)
������, �� = �� + ����������, �� + �������, �� + ����� (7-16)
Table 7-3 Multimodal logit estimated values for the road vs Civitavecchia-Barcelona MoS case,
excluding local distance
Coefficient Estimate Standard Error t-value Pr(>|t|) Signif.
a1. (constant full truck) -5.15201593 0.32682938 -15.7636 < 2.2e-16 ***
a2 (constant platform) -4.73957359 0.32932251 -14.3919 < 2.2e-16 ***
b (cost parameter) -0.00109914 0.00014915 -7.3695 1.712e-13 ***
c (time parameter) -0.02996847 0.00639539 -4.6859 2.787e-06 ***
d1 (Lij parameter, full truck) 0.00089833 0.00017824 5.0401 4.652e-07 ***
d2 (Lij parameter, platform) 0.00029767 0.00018636 1.5974 0.0102 *
Significance codes: 0 ‘***’, 0.001 ‘**’, 0.01 ‘*’ 0.05 ‘.’ 0.1 ‘ ‘ 1
McFadden R^2: 0.090241 / Likelihood ratio test : chisq = 486.73 (p.value = < 2.22e-16)
As expected, the values do not vary significantly, all keep the same sign: negative in all cases
minus the road distance, Lij, meaning that any increase in any of the values for any alternative is
detrimental for the alternative considered, whereas increases in road distance only benefit the sea
alternatives (keep in mind that sea distance is kept constant in all cases since only one maritime
line is being considered).
The resulting values provide an approximate VOT value of 27.26 €/h and ITU, on the upper range
of the values observed in the literature (Feo-Valero et al., 2011). However, the VOT values
obtained are unrealistic is not unexpected, since as stated before, only considering one maritime
connection would downplay it as an alternative and, on average for the cases considered, transit
time is slightly larger for the sea connections. In fact, if all sea alternatives were to be considered
as in Table 7-4, the VOT value obtained would decrease to 4.67€/h per ITU, more in line to with
the observations by Garcia-Menendez et al. (2009).
Table 7-4 Multimodal logit estimated values for the road vs MoS for the Italy-Spain case (all sea
connections considered)
Coefficient Estimate Standard Error t-value Pr(>|t|) Signif.
Constant (AC) -3.38E+00 1.37E-01 -24.7452 < 2.2e-16 ***
Constant (NA) -3.32E+00 1.32E-01 -25.2015 < 2.2e-16 ***
Cost (Ctrip) -3.84E-04 4.98E-05 -7.7145 1.221e-14 ***
Transit time (tt) -1.71E-03 1.70E-03 -1.0052 0.0948 .
Land distance (Lij) - AC 7.88E-04 7.49E-05 10.5173 < 2.2e-16 ***
Land distance (Lij) - NA 6.16E-04 7.40E-05 8.3248 < 2.2e-16 *
Significance codes: 0 ‘***’, 0.001 ‘**’, 0.01 ‘*’ 0.05 ‘.’ 0.1 ‘ ‘ 1
McFadden R^2: 0.021243 / Likelihood ratio test : chisq = 386.83 (p.value = < 2.22e-16)
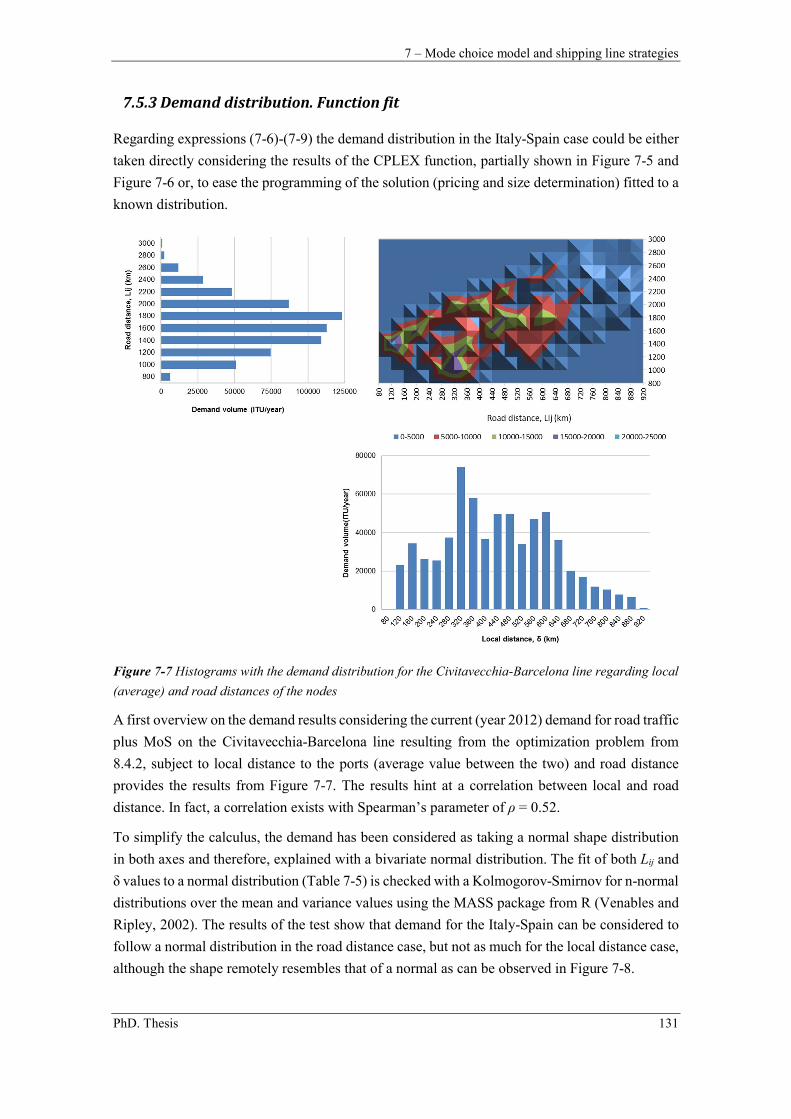
7 – Mode choice model and shipping line strategies
PhD. Thesis 131
7.5.3 Demand distribution. Function fit
Regarding expressions (7-6)-(7-9) the demand distribution in the Italy-Spain case could be either
taken directly considering the results of the CPLEX function, partially shown in Figure 7-5 and
Figure 7-6 or, to ease the programming of the solution (pricing and size determination) fitted to a
known distribution.
Figure 7-7 Histograms with the demand distribution for the Civitavecchia-Barcelona line regarding local
(average) and road distances of the nodes
A first overview on the demand results considering the current (year 2012) demand for road traffic
plus MoS on the Civitavecchia-Barcelona line resulting from the optimization problem from
8.4.2, subject to local distance to the ports (average value between the two) and road distance
provides the results from Figure 7-7. The results hint at a correlation between local and road
distance. In fact, a correlation exists with Spearman’s parameter of ρ = 0.52.
To simplify the calculus, the demand has been considered as taking a normal shape distribution
in both axes and therefore, explained with a bivariate normal distribution. The fit of both Lij and
δ values to a normal distribution (Table 7-5) is checked with a Kolmogorov-Smirnov for n-normal
distributions over the mean and variance values using the MASS package from R (Venables and
Ripley, 2002). The results of the test show that demand for the Italy-Spain can be considered to
follow a normal distribution in the road distance case, but not as much for the local distance case,
although the shape remotely resembles that of a normal as can be observed in Figure 7-8.
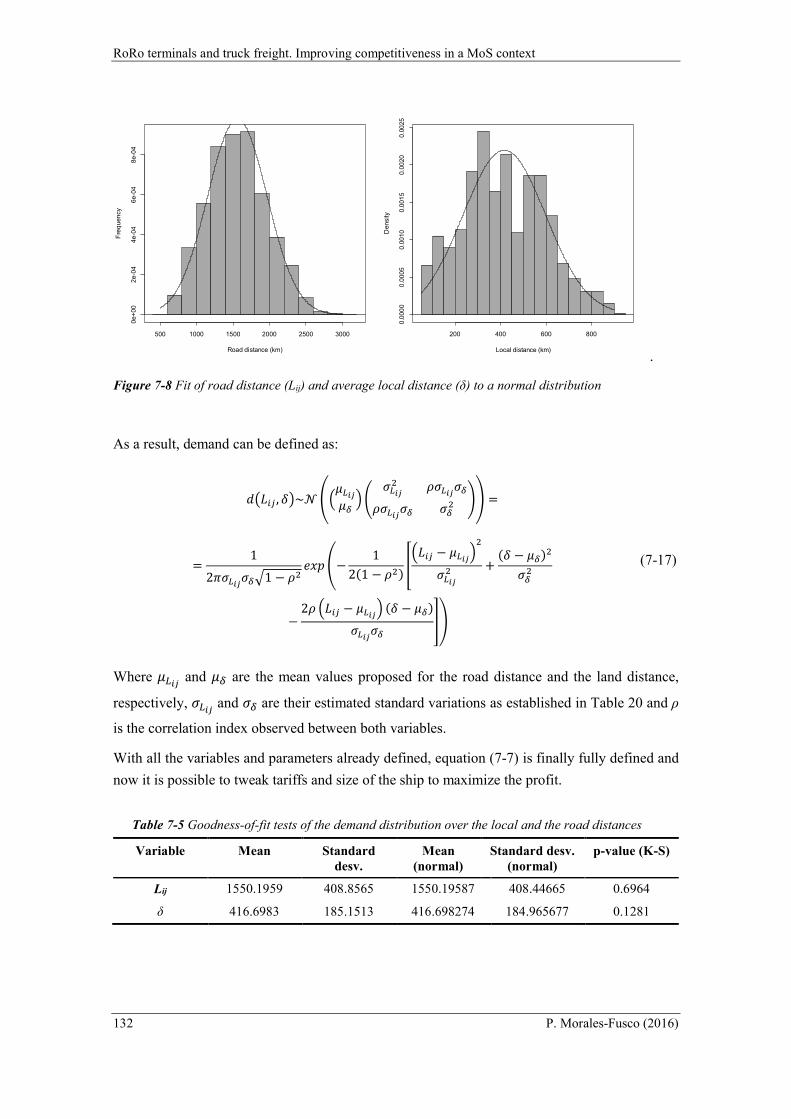
RoRo terminals and truck freight. Improving competitiveness in a MoS context
132 P. Morales-Fusco (2016)
.
Figure 7-8 Fit of road distance (Lij) and average local distance (δ) to a normal distribution
As a result, demand can be defined as:
�����, ��~� ������
��� �
����
� �������
������� ��
� �� =
=1
2��������1 − ��
��� �−1
2(1 − ��)����� − ����
��
����
� +(� − ��)�
���
−2� ���� − ����
� (� − ��)
������
��
(7-17)
Where ���� and �� are the mean values proposed for the road distance and the land distance,
respectively, ���� and �� are their estimated standard variations as established in Table 20 and ρ
is the correlation index observed between both variables.
With all the variables and parameters already defined, equation (7-7) is finally fully defined and
now it is possible to tweak tariffs and size of the ship to maximize the profit.
Table 7-5 Goodness-of-fit tests of the demand distribution over the local and the road distances
Variable Mean Standard desv.
Mean (normal)
Standard desv. (normal)
p-value (K-S)
Lij 1550.1959 408.8565 1550.19587 408.44665 0.6964
δ 416.6983 185.1513 416.698274 184.965677 0.1281
Road distance (km)
Fre
qu
en
cy
500 1000 1500 2000 2500 3000
0e
+0
02
e-0
44
e-0
46
e-0
48
e-0
4
Local distance (km)
Densi
ty
200 400 600 800
0.0
00
00.0
005
0.0
010
0.0
01
50.0
020
0.0
025
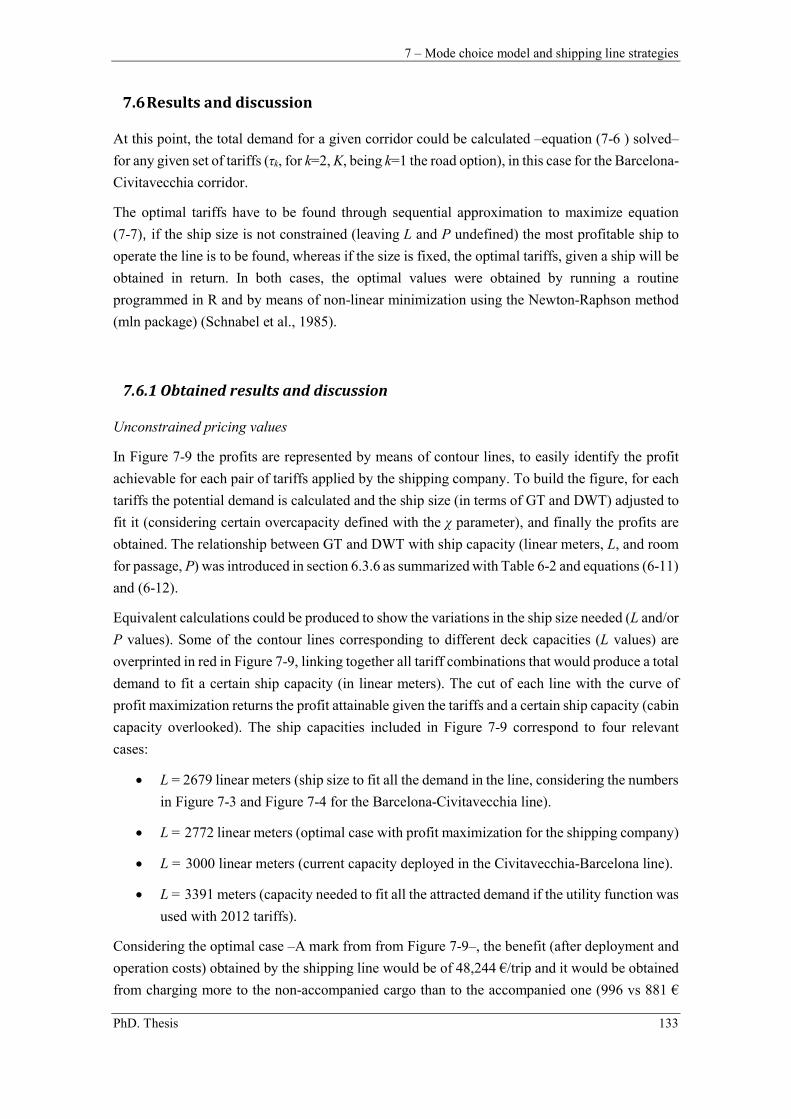
7 – Mode choice model and shipping line strategies
PhD. Thesis 133
7.6 Results and discussion
At this point, the total demand for a given corridor could be calculated –equation (7-6 ) solved–
for any given set of tariffs (τk, for k=2, K, being k=1 the road option), in this case for the Barcelona-
Civitavecchia corridor.
The optimal tariffs have to be found through sequential approximation to maximize equation
(7-7), if the ship size is not constrained (leaving L and P undefined) the most profitable ship to
operate the line is to be found, whereas if the size is fixed, the optimal tariffs, given a ship will be
obtained in return. In both cases, the optimal values were obtained by running a routine
programmed in R and by means of non-linear minimization using the Newton-Raphson method
(mln package) (Schnabel et al., 1985).
7.6.1 Obtained results and discussion
Unconstrained pricing values
In Figure 7-9 the profits are represented by means of contour lines, to easily identify the profit
achievable for each pair of tariffs applied by the shipping company. To build the figure, for each
tariffs the potential demand is calculated and the ship size (in terms of GT and DWT) adjusted to
fit it (considering certain overcapacity defined with the χ parameter), and finally the profits are
obtained. The relationship between GT and DWT with ship capacity (linear meters, L, and room
for passage, P) was introduced in section 6.3.6 as summarized with Table 6-2 and equations (6-11)
and (6-12).
Equivalent calculations could be produced to show the variations in the ship size needed (L and/or
P values). Some of the contour lines corresponding to different deck capacities (L values) are
overprinted in red in Figure 7-9, linking together all tariff combinations that would produce a total
demand to fit a certain ship capacity (in linear meters). The cut of each line with the curve of
profit maximization returns the profit attainable given the tariffs and a certain ship capacity (cabin
capacity overlooked). The ship capacities included in Figure 7-9 correspond to four relevant
cases:
L = 2679 linear meters (ship size to fit all the demand in the line, considering the numbers
in Figure 7-3 and Figure 7-4 for the Barcelona-Civitavecchia line).
L = 2772 linear meters (optimal case with profit maximization for the shipping company)
L = 3000 linear meters (current capacity deployed in the Civitavecchia-Barcelona line).
L = 3391 meters (capacity needed to fit all the attracted demand if the utility function was
used with 2012 tariffs).
Considering the optimal case –A mark from from Figure 7-9–, the benefit (after deployment and
operation costs) obtained by the shipping line would be of 48,244 €/trip and it would be obtained
from charging more to the non-accompanied cargo than to the accompanied one (996 vs 881 €
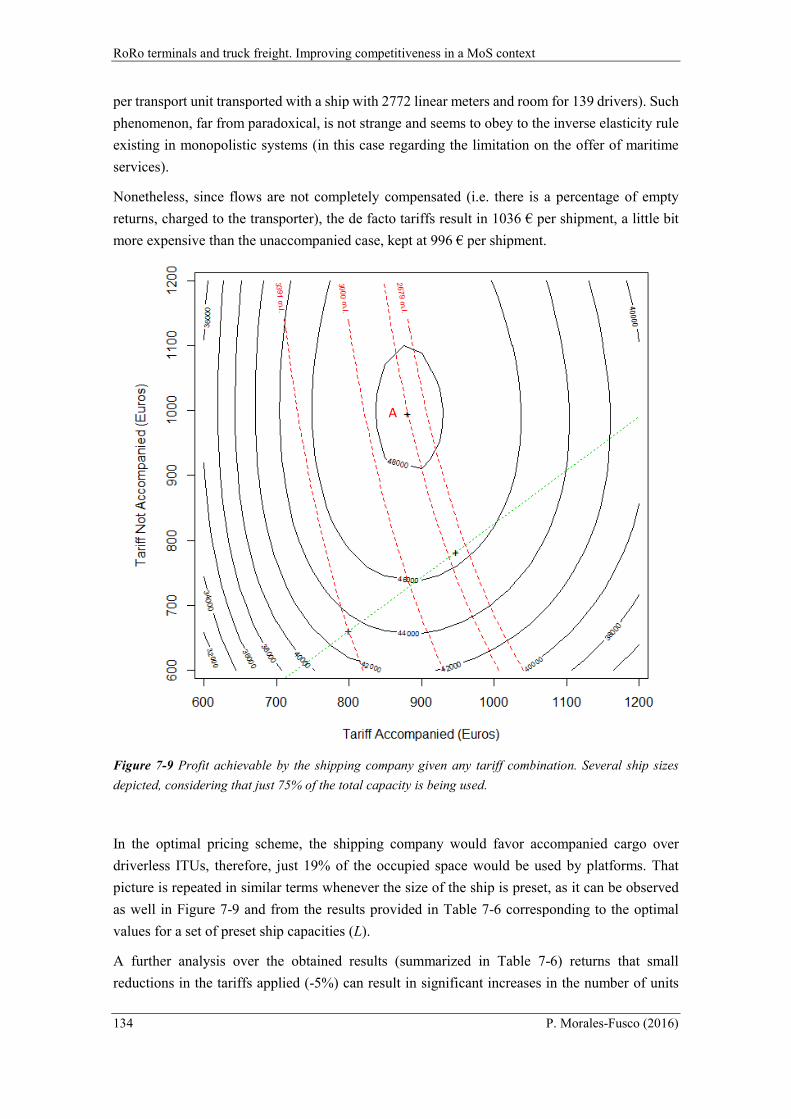
RoRo terminals and truck freight. Improving competitiveness in a MoS context
134 P. Morales-Fusco (2016)
per transport unit transported with a ship with 2772 linear meters and room for 139 drivers). Such
phenomenon, far from paradoxical, is not strange and seems to obey to the inverse elasticity rule
existing in monopolistic systems (in this case regarding the limitation on the offer of maritime
services).
Nonetheless, since flows are not completely compensated (i.e. there is a percentage of empty
returns, charged to the transporter), the de facto tariffs result in 1036 € per shipment, a little bit
more expensive than the unaccompanied case, kept at 996 € per shipment.
Figure 7-9 Profit achievable by the shipping company given any tariff combination. Several ship sizes
depicted, considering that just 75% of the total capacity is being used.
In the optimal pricing scheme, the shipping company would favor accompanied cargo over
driverless ITUs, therefore, just 19% of the occupied space would be used by platforms. That
picture is repeated in similar terms whenever the size of the ship is preset, as it can be observed
as well in Figure 7-9 and from the results provided in Table 7-6 corresponding to the optimal
values for a set of preset ship capacities (L).
A further analysis over the obtained results (summarized in Table 7-6) returns that small
reductions in the tariffs applied (-5%) can result in significant increases in the number of units
A
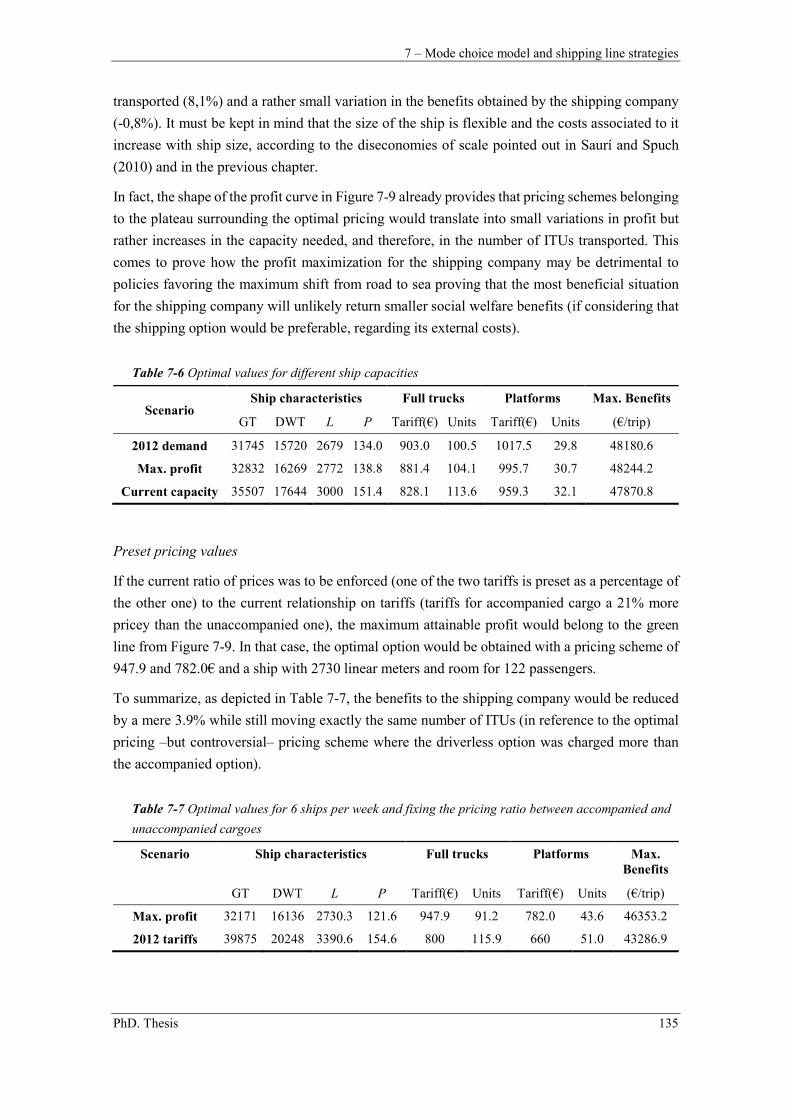
7 – Mode choice model and shipping line strategies
PhD. Thesis 135
transported (8,1%) and a rather small variation in the benefits obtained by the shipping company
(-0,8%). It must be kept in mind that the size of the ship is flexible and the costs associated to it
increase with ship size, according to the diseconomies of scale pointed out in Saurí and Spuch
(2010) and in the previous chapter.
In fact, the shape of the profit curve in Figure 7-9 already provides that pricing schemes belonging
to the plateau surrounding the optimal pricing would translate into small variations in profit but
rather increases in the capacity needed, and therefore, in the number of ITUs transported. This
comes to prove how the profit maximization for the shipping company may be detrimental to
policies favoring the maximum shift from road to sea proving that the most beneficial situation
for the shipping company will unlikely return smaller social welfare benefits (if considering that
the shipping option would be preferable, regarding its external costs).
Table 7-6 Optimal values for different ship capacities
Scenario Ship characteristics Full trucks Platforms Max. Benefits
GT DWT L P Tariff(€) Units Tariff(€) Units (€/trip)
2012 demand 31745 15720 2679 134.0 903.0 100.5 1017.5 29.8 48180.6
Max. profit 32832 16269 2772 138.8 881.4 104.1 995.7 30.7 48244.2
Current capacity 35507 17644 3000 151.4 828.1 113.6 959.3 32.1 47870.8
Preset pricing values
If the current ratio of prices was to be enforced (one of the two tariffs is preset as a percentage of
the other one) to the current relationship on tariffs (tariffs for accompanied cargo a 21% more
pricey than the unaccompanied one), the maximum attainable profit would belong to the green
line from Figure 7-9. In that case, the optimal option would be obtained with a pricing scheme of
947.9 and 782.0€ and a ship with 2730 linear meters and room for 122 passengers.
To summarize, as depicted in Table 7-7, the benefits to the shipping company would be reduced
by a mere 3.9% while still moving exactly the same number of ITUs (in reference to the optimal
pricing –but controversial– pricing scheme where the driverless option was charged more than
the accompanied option).
Table 7-7 Optimal values for 6 ships per week and fixing the pricing ratio between accompanied and
unaccompanied cargoes
Scenario Ship characteristics Full trucks Platforms Max. Benefits
GT DWT L P Tariff(€) Units Tariff(€) Units (€/trip)
Max. profit 32171 16136 2730.3 121.6 947.9 91.2 782.0 43.6 46353.2
2012 tariffs 39875 20248 3390.6 154.6 800 115.9 660 51.0 43286.9
RoRo terminals and truck freight. Improving competitiveness in a MoS context
136 P. Morales-Fusco (2016)
Overcharging the non-accompanied option
The optimal values (from the shipping company perspective) may seem controversial at a first
glance, In fact, the values clearly contradict the common pricing policy of charging the running
marginal cost to the end user (as discussed in 7.2.1), since the marginal cost is smaller for the
unaccompanied cargo according to the freight cost functions used (6-8), (6-11), (6-12). Moreover,
the principal strength of the unaccompanied business model is the reduction in personnel costs
during the maritime leg of the journey and the optimal pricing scheme seems to jeopardize it.
However, the phenomenon can be explained given the monopolistic situation of the maritime
offer (just one line, and a pricing scheme is considered) and given that the unaccompanied cargo
shows less elasticity to price (cost) variations than accompanied cargoes, considering the value
given to the cost parameter from the utility function used (Table 7-3). Such findings are in line
with the more difficult access to unaccompanied strategies, since those require a larger initial
investment and are more complicated logistically (both sides of the maritime link need to be
coordinated) (López-Navarro, 2013). Therefore, for unaccompanied demand, the cost to change
back from MoS to only road transportation will then be bigger than for the accompanied case.
An optimal solution of the case would be by approaching the scenarios as a problem belonging to
the Ramsey-Boiteux Problem family. The Ramsey–Boiteux pricing or the inverse elasticity rule,
applies in monopolistic environments with different sets of costumers and elasticities. According
to the Ramsey rule, the optimum tariffs are inversely proportional to elasticity (Ramsey, 1927;
Robinson, 1969).
7.6.2 Sensitiveness assessment
Besides studying the relationships between pricing scheme / ITUs transported / ship capacity and
profit for the shipping company, the construction of the model allows checking its sensibility to
variations to its multiple parameters. Some of the observations observed are commented through
this section, keeping in mind the limitations of the logit model used.
Elasticity of the demand, optimal tariff and ship description variables have been checked
considering the utility parameters (as seen in Table 7-3) and some other parameters of the
calculation such combustible, speeds allowed and average distances and considering three
different scenarios:
No variable constraints, so ship size and tariffs will vary along with the changes in the
parameter (the optimal point would correspond to the highest position in the contour
curves from Figure 7-9
Tariff ratio fixed. I.e., the tariff for the unaccompanied case is set in base of the tariff to
the accompanied option (equivalent to moving along the green line from Figure 7-9).
Fixed tariffs (only ship variables can vary freely).
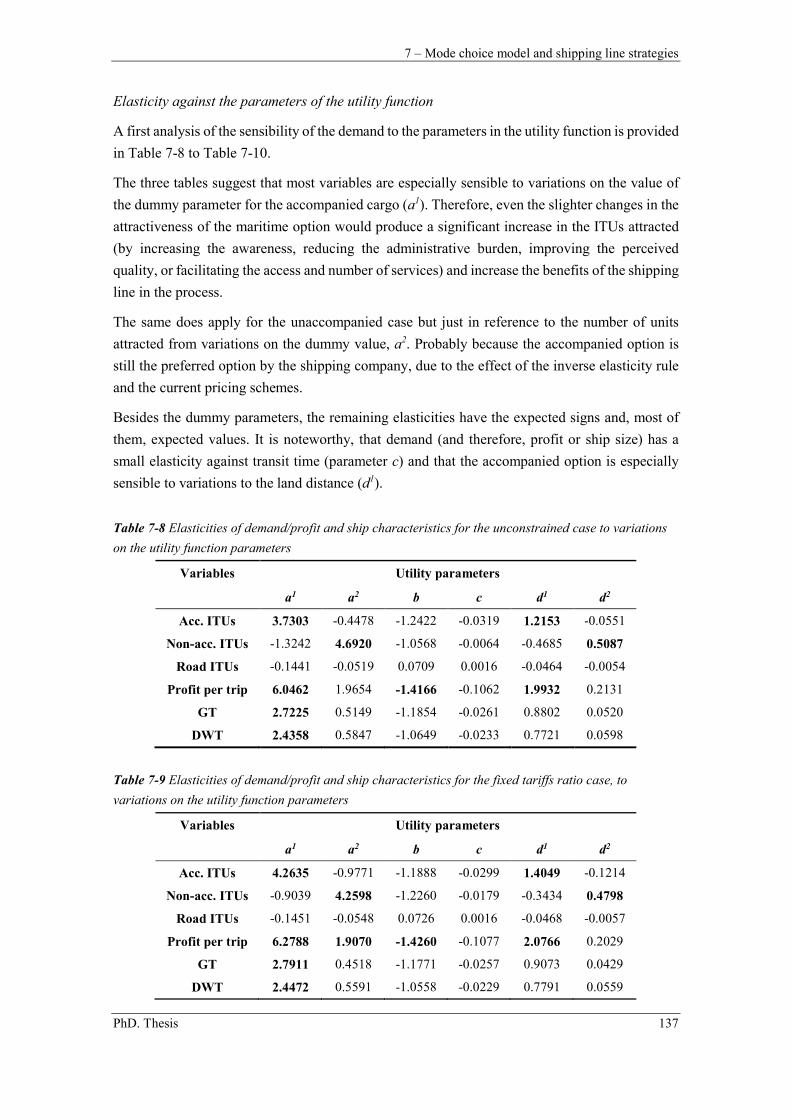
7 – Mode choice model and shipping line strategies
PhD. Thesis 137
Elasticity against the parameters of the utility function
A first analysis of the sensibility of the demand to the parameters in the utility function is provided
in Table 7-8 to Table 7-10.
The three tables suggest that most variables are especially sensible to variations on the value of
the dummy parameter for the accompanied cargo (a1). Therefore, even the slighter changes in the
attractiveness of the maritime option would produce a significant increase in the ITUs attracted
(by increasing the awareness, reducing the administrative burden, improving the perceived
quality, or facilitating the access and number of services) and increase the benefits of the shipping
line in the process.
The same does apply for the unaccompanied case but just in reference to the number of units
attracted from variations on the dummy value, a2. Probably because the accompanied option is
still the preferred option by the shipping company, due to the effect of the inverse elasticity rule
and the current pricing schemes.
Besides the dummy parameters, the remaining elasticities have the expected signs and, most of
them, expected values. It is noteworthy, that demand (and therefore, profit or ship size) has a
small elasticity against transit time (parameter c) and that the accompanied option is especially
sensible to variations to the land distance (d1).
Table 7-8 Elasticities of demand/profit and ship characteristics for the unconstrained case to variations
on the utility function parameters
Variables Utility parameters
a1 a2 b c d1 d2
Acc. ITUs 3.7303 -0.4478 -1.2422 -0.0319 1.2153 -0.0551
Non-acc. ITUs -1.3242 4.6920 -1.0568 -0.0064 -0.4685 0.5087
Road ITUs -0.1441 -0.0519 0.0709 0.0016 -0.0464 -0.0054
Profit per trip 6.0462 1.9654 -1.4166 -0.1062 1.9932 0.2131
GT 2.7225 0.5149 -1.1854 -0.0261 0.8802 0.0520
DWT 2.4358 0.5847 -1.0649 -0.0233 0.7721 0.0598
Table 7-9 Elasticities of demand/profit and ship characteristics for the fixed tariffs ratio case, to
variations on the utility function parameters
Variables Utility parameters
a1 a2 b c d1 d2
Acc. ITUs 4.2635 -0.9771 -1.1888 -0.0299 1.4049 -0.1214
Non-acc. ITUs -0.9039 4.2598 -1.2260 -0.0179 -0.3434 0.4798
Road ITUs -0.1451 -0.0548 0.0726 0.0016 -0.0468 -0.0057
Profit per trip 6.2788 1.9070 -1.4260 -0.1077 2.0766 0.2029
GT 2.7911 0.4518 -1.1771 -0.0257 0.9073 0.0429
DWT 2.4472 0.5591 -1.0558 -0.0229 0.7791 0.0559
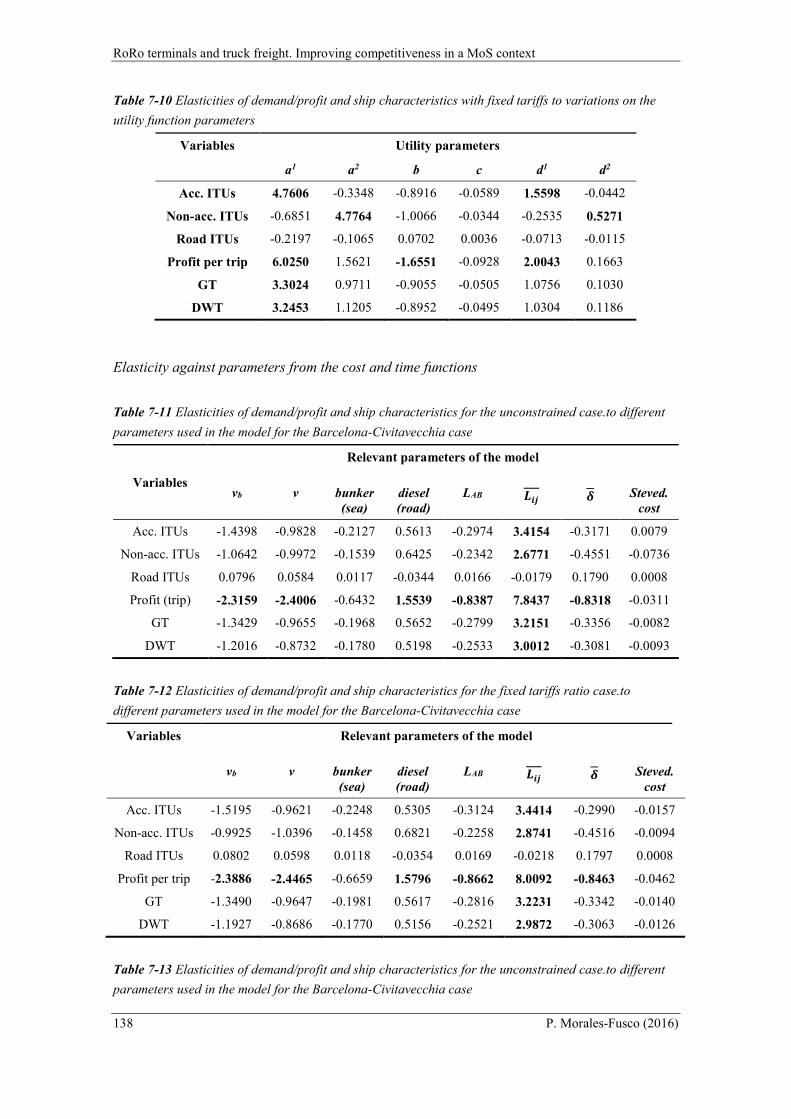
RoRo terminals and truck freight. Improving competitiveness in a MoS context
138 P. Morales-Fusco (2016)
Table 7-10 Elasticities of demand/profit and ship characteristics with fixed tariffs to variations on the
utility function parameters
Variables Utility parameters
a1 a2 b c d1 d2
Acc. ITUs 4.7606 -0.3348 -0.8916 -0.0589 1.5598 -0.0442
Non-acc. ITUs -0.6851 4.7764 -1.0066 -0.0344 -0.2535 0.5271
Road ITUs -0.2197 -0.1065 0.0702 0.0036 -0.0713 -0.0115
Profit per trip 6.0250 1.5621 -1.6551 -0.0928 2.0043 0.1663
GT 3.3024 0.9711 -0.9055 -0.0505 1.0756 0.1030
DWT 3.2453 1.1205 -0.8952 -0.0495 1.0304 0.1186
Elasticity against parameters from the cost and time functions
Table 7-11 Elasticities of demand/profit and ship characteristics for the unconstrained case.to different
parameters used in the model for the Barcelona-Civitavecchia case
Variables
Relevant parameters of the model
vb v bunker (sea)
diesel (road)
LAB ��� � Steved. cost
Acc. ITUs -1.4398 -0.9828 -0.2127 0.5613 -0.2974 3.4154 -0.3171 0.0079
Non-acc. ITUs -1.0642 -0.9972 -0.1539 0.6425 -0.2342 2.6771 -0.4551 -0.0736
Road ITUs 0.0796 0.0584 0.0117 -0.0344 0.0166 -0.0179 0.1790 0.0008
Profit (trip) -2.3159 -2.4006 -0.6432 1.5539 -0.8387 7.8437 -0.8318 -0.0311
GT -1.3429 -0.9655 -0.1968 0.5652 -0.2799 3.2151 -0.3356 -0.0082
DWT -1.2016 -0.8732 -0.1780 0.5198 -0.2533 3.0012 -0.3081 -0.0093
Table 7-12 Elasticities of demand/profit and ship characteristics for the fixed tariffs ratio case.to
different parameters used in the model for the Barcelona-Civitavecchia case
Variables Relevant parameters of the model
vb v bunker (sea)
diesel (road)
LAB ��� � Steved. cost
Acc. ITUs -1.5195 -0.9621 -0.2248 0.5305 -0.3124 3.4414 -0.2990 -0.0157
Non-acc. ITUs -0.9925 -1.0396 -0.1458 0.6821 -0.2258 2.8741 -0.4516 -0.0094
Road ITUs 0.0802 0.0598 0.0118 -0.0354 0.0169 -0.0218 0.1797 0.0008
Profit per trip -2.3886 -2.4465 -0.6659 1.5796 -0.8662 8.0092 -0.8463 -0.0462
GT -1.3490 -0.9647 -0.1981 0.5617 -0.2816 3.2231 -0.3342 -0.0140
DWT -1.1927 -0.8686 -0.1770 0.5156 -0.2521 2.9872 -0.3063 -0.0126
Table 7-13 Elasticities of demand/profit and ship characteristics for the unconstrained case.to different
parameters used in the model for the Barcelona-Civitavecchia case
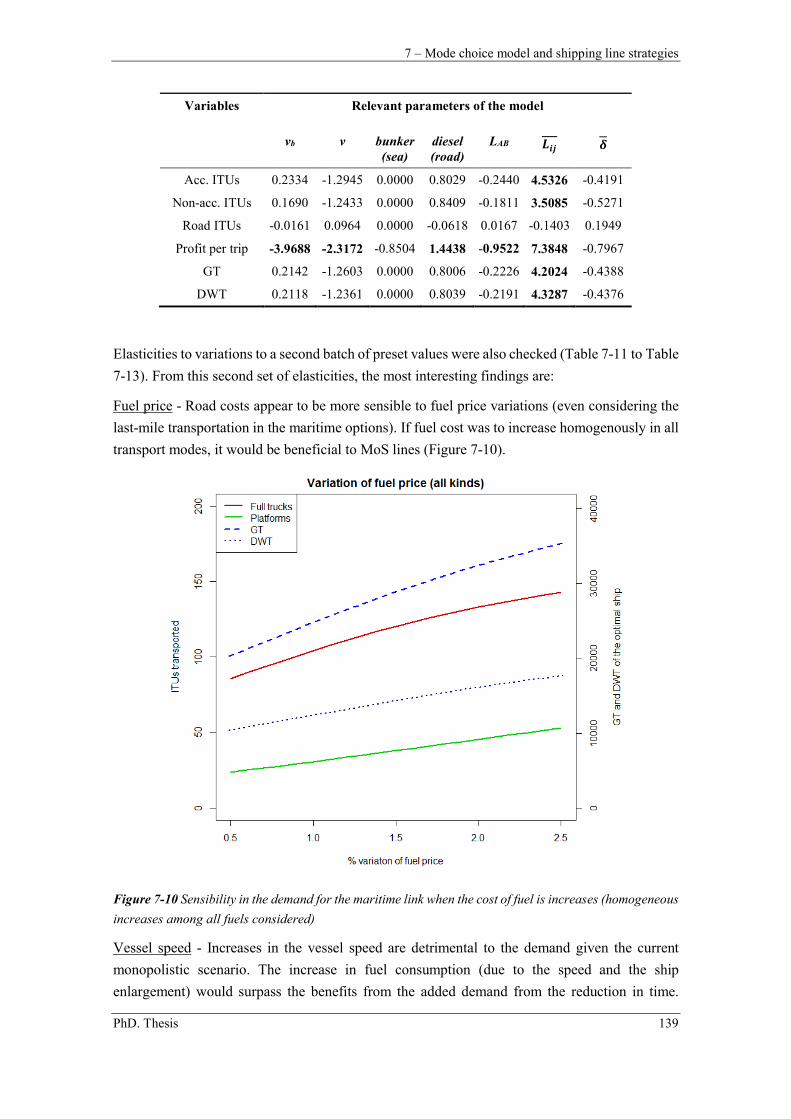
7 – Mode choice model and shipping line strategies
PhD. Thesis 139
Variables Relevant parameters of the model
vb v bunker (sea)
diesel (road)
LAB ��� �
Acc. ITUs 0.2334 -1.2945 0.0000 0.8029 -0.2440 4.5326 -0.4191
Non-acc. ITUs 0.1690 -1.2433 0.0000 0.8409 -0.1811 3.5085 -0.5271
Road ITUs -0.0161 0.0964 0.0000 -0.0618 0.0167 -0.1403 0.1949
Profit per trip -3.9688 -2.3172 -0.8504 1.4438 -0.9522 7.3848 -0.7967
GT 0.2142 -1.2603 0.0000 0.8006 -0.2226 4.2024 -0.4388
DWT 0.2118 -1.2361 0.0000 0.8039 -0.2191 4.3287 -0.4376
Elasticities to variations to a second batch of preset values were also checked (Table 7-11 to Table
7-13). From this second set of elasticities, the most interesting findings are:
Fuel price - Road costs appear to be more sensible to fuel price variations (even considering the
last-mile transportation in the maritime options). If fuel cost was to increase homogenously in all
transport modes, it would be beneficial to MoS lines (Figure 7-10).
Figure 7-10 Sensibility in the demand for the maritime link when the cost of fuel is increases (homogeneous
increases among all fuels considered)
Vessel speed - Increases in the vessel speed are detrimental to the demand given the current
monopolistic scenario. The increase in fuel consumption (due to the speed and the ship
enlargement) would surpass the benefits from the added demand from the reduction in time.
RoRo terminals and truck freight. Improving competitiveness in a MoS context
140 P. Morales-Fusco (2016)
Therefore, the shipping company would most likely increase tariffs; reduce demand and the
operational costs and fix costs related with ship size. However, if tariffs where to be fixed (Table
7-12), demand would increase slightly at expenses of a major reduction in the profits harvested.
Road speed limit - Variations on the speed limit allowed at roads are detrimental to the MoS
demand as could be expected.
Overall distance travelled - Variations on the average road distance to be travelled have a bigger
influence on the demand (and profits) than equivalent variations, in this case of positive sign, for
the sea distance. However, this could be partially explained given the nature of the utility function
(the utility for the maritime modes is highly dependent on the road distance between origin and
final destination of the cargo).
Stevedoring costs - Against what could be the popular belief, small elasticity values were obtained
against variations on the stevedoring costs. Such variations would certainly affect the share of
non-accompanied cargo over accompanied one but far from significantly. As a result from
increases in the stevedoring cost, the profits for the shipping company would be slightly reduced.
7.6.3 Demand profile (distribution of the different business alternatives over
the hinterland of the port
The three variables from the utility function used to calculate the demand of each business
alternative are highly depending on the distance, either directly (in the utility function) or
implicitly, through the cost and transit time calculations.
Table 7-11 to Table 7-13 already pointed out at high elasticities of the demand when varying the
average distance between the port and its hinterland and, especially when varying the road
distance separating origin and destination without changing the sea distance, that is, increasing k
(k=Lij/LAB) and the time and cost of the road alternative. Figure 6-6 in the previous chapter, already
provided values regarding cost of each alternative compared to variations of k for preset local
(hinterland) and sea distances.
Given those considerations and taking the demand distribution hypothesis from section 7.3, the
effect of distance to the demand has been analyzed in two ways:
How the demand for each alternative is distributed according to δ and Lij values (Figure
7-11 and Figure 7-12)
The effects from variations on the mean distances (local and road) on the demand and the
optimal size of the ship (Figure 7-13).
Figure 7-11 gives a first impression on how the demand for each alternative is distributed (in
absolute numbers) when the tariff ratio is preset (similar values are obtained for the unrestricted
case), reflecting the bivariate normal distribution used to describe it. The distribution of the
demand opting for the road alternative almost overlaps with the distribution of the total demand.
In fact, road accounts for most of the demand being considered: for this particular case (optimal
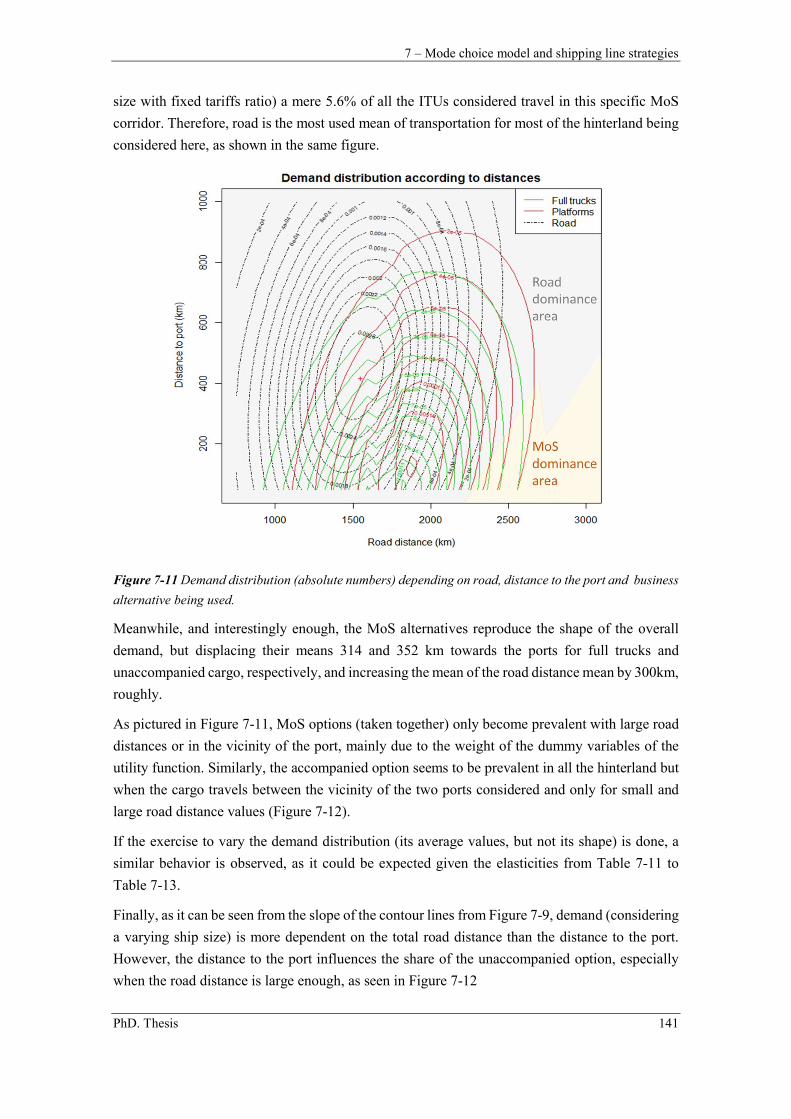
7 – Mode choice model and shipping line strategies
PhD. Thesis 141
size with fixed tariffs ratio) a mere 5.6% of all the ITUs considered travel in this specific MoS
corridor. Therefore, road is the most used mean of transportation for most of the hinterland being
considered here, as shown in the same figure.
Figure 7-11 Demand distribution (absolute numbers) depending on road, distance to the port and business
alternative being used.
Meanwhile, and interestingly enough, the MoS alternatives reproduce the shape of the overall
demand, but displacing their means 314 and 352 km towards the ports for full trucks and
unaccompanied cargo, respectively, and increasing the mean of the road distance mean by 300km,
roughly.
As pictured in Figure 7-11, MoS options (taken together) only become prevalent with large road
distances or in the vicinity of the port, mainly due to the weight of the dummy variables of the
utility function. Similarly, the accompanied option seems to be prevalent in all the hinterland but
when the cargo travels between the vicinity of the two ports considered and only for small and
large road distance values (Figure 7-12).
If the exercise to vary the demand distribution (its average values, but not its shape) is done, a
similar behavior is observed, as it could be expected given the elasticities from Table 7-11 to
Table 7-13.
Finally, as it can be seen from the slope of the contour lines from Figure 7-9, demand (considering
a varying ship size) is more dependent on the total road distance than the distance to the port.
However, the distance to the port influences the share of the unaccompanied option, especially
when the road distance is large enough, as seen in Figure 7-12
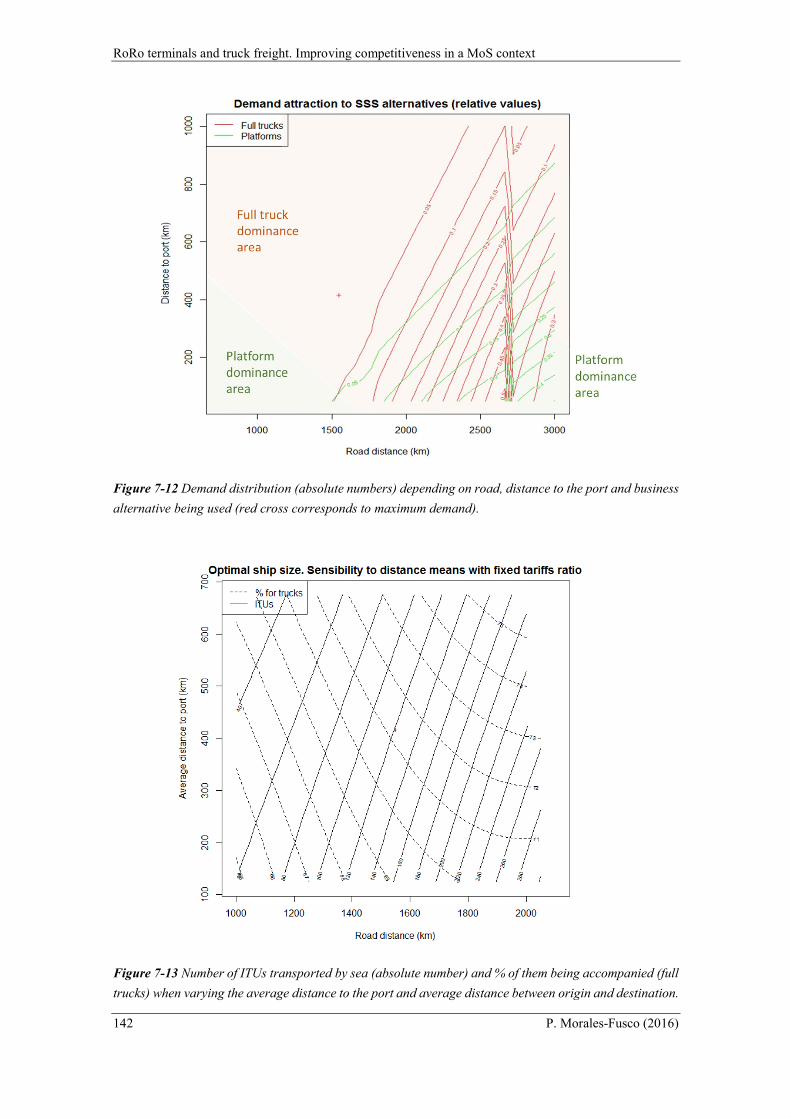
RoRo terminals and truck freight. Improving competitiveness in a MoS context
142 P. Morales-Fusco (2016)
Figure 7-12 Demand distribution (absolute numbers) depending on road, distance to the port and business
alternative being used (red cross corresponds to maximum demand).
Figure 7-13 Number of ITUs transported by sea (absolute number) and % of them being accompanied (full
trucks) when varying the average distance to the port and average distance between origin and destination.
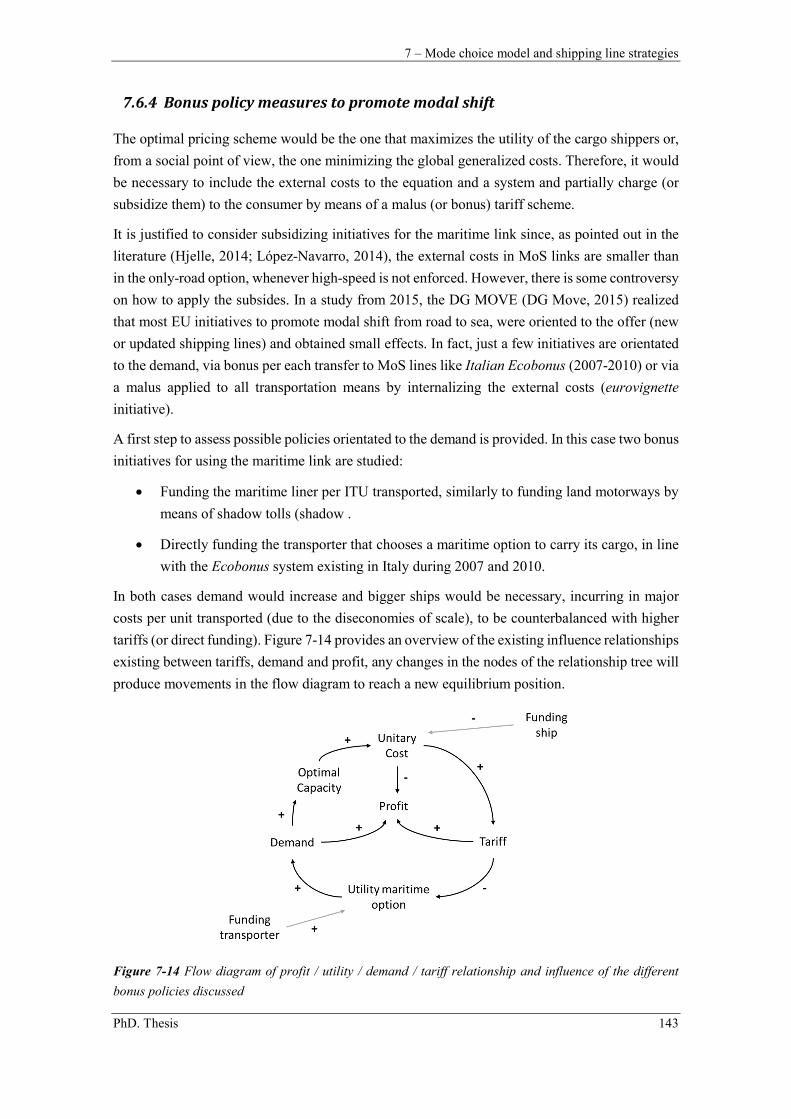
7 – Mode choice model and shipping line strategies
PhD. Thesis 143
7.6.4 Bonus policy measures to promote modal shift
The optimal pricing scheme would be the one that maximizes the utility of the cargo shippers or,
from a social point of view, the one minimizing the global generalized costs. Therefore, it would
be necessary to include the external costs to the equation and a system and partially charge (or
subsidize them) to the consumer by means of a malus (or bonus) tariff scheme.
It is justified to consider subsidizing initiatives for the maritime link since, as pointed out in the
literature (Hjelle, 2014; López-Navarro, 2014), the external costs in MoS links are smaller than
in the only-road option, whenever high-speed is not enforced. However, there is some controversy
on how to apply the subsides. In a study from 2015, the DG MOVE (DG Move, 2015) realized
that most EU initiatives to promote modal shift from road to sea, were oriented to the offer (new
or updated shipping lines) and obtained small effects. In fact, just a few initiatives are orientated
to the demand, via bonus per each transfer to MoS lines like Italian Ecobonus (2007-2010) or via
a malus applied to all transportation means by internalizing the external costs (eurovignette
initiative).
A first step to assess possible policies orientated to the demand is provided. In this case two bonus
initiatives for using the maritime link are studied:
Funding the maritime liner per ITU transported, similarly to funding land motorways by
means of shadow tolls (shadow .
Directly funding the transporter that chooses a maritime option to carry its cargo, in line
with the Ecobonus system existing in Italy during 2007 and 2010.
In both cases demand would increase and bigger ships would be necessary, incurring in major
costs per unit transported (due to the diseconomies of scale), to be counterbalanced with higher
tariffs (or direct funding). Figure 7-14 provides an overview of the existing influence relationships
existing between tariffs, demand and profit, any changes in the nodes of the relationship tree will
produce movements in the flow diagram to reach a new equilibrium position.
Figure 7-14 Flow diagram of profit / utility / demand / tariff relationship and influence of the different
bonus policies discussed
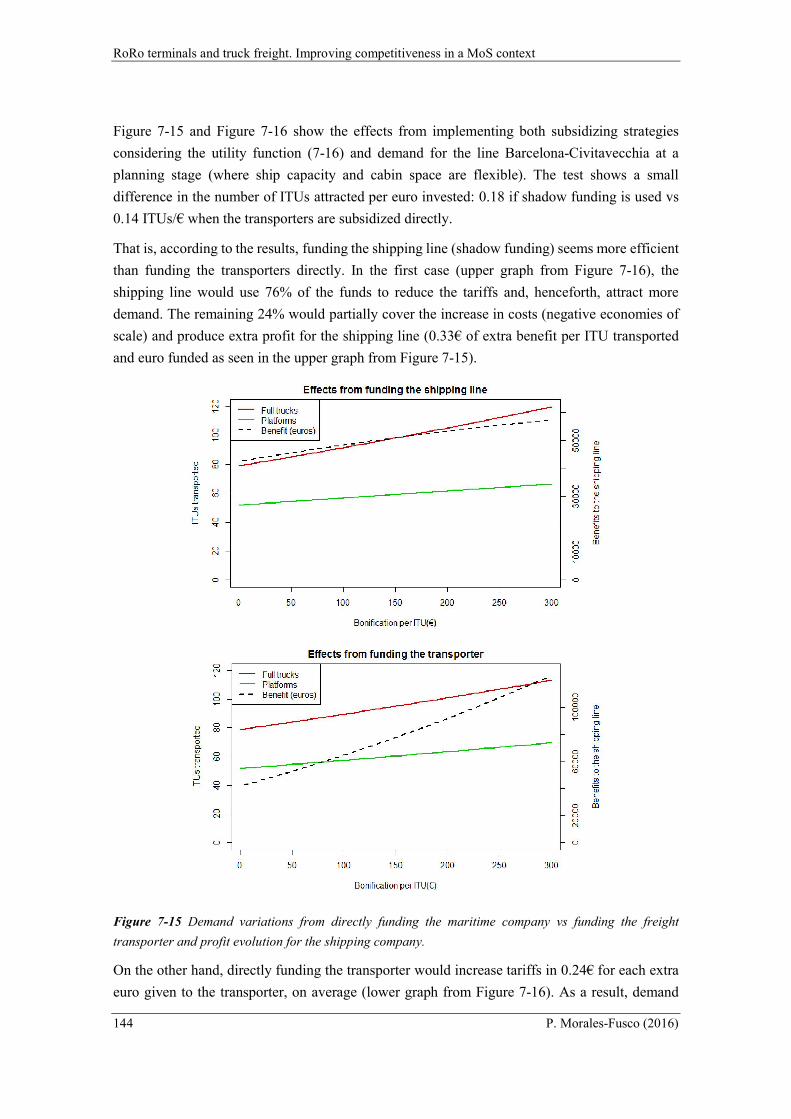
RoRo terminals and truck freight. Improving competitiveness in a MoS context
144 P. Morales-Fusco (2016)
Figure 7-15 and Figure 7-16 show the effects from implementing both subsidizing strategies
considering the utility function (7-16) and demand for the line Barcelona-Civitavecchia at a
planning stage (where ship capacity and cabin space are flexible). The test shows a small
difference in the number of ITUs attracted per euro invested: 0.18 if shadow funding is used vs
0.14 ITUs/€ when the transporters are subsidized directly.
That is, according to the results, funding the shipping line (shadow funding) seems more efficient
than funding the transporters directly. In the first case (upper graph from Figure 7-16), the
shipping line would use 76% of the funds to reduce the tariffs and, henceforth, attract more
demand. The remaining 24% would partially cover the increase in costs (negative economies of
scale) and produce extra profit for the shipping line (0.33€ of extra benefit per ITU transported
and euro funded as seen in the upper graph from Figure 7-15).
Figure 7-15 Demand variations from directly funding the maritime company vs funding the freight
transporter and profit evolution for the shipping company.
On the other hand, directly funding the transporter would increase tariffs in 0.24€ for each extra
euro given to the transporter, on average (lower graph from Figure 7-16). As a result, demand
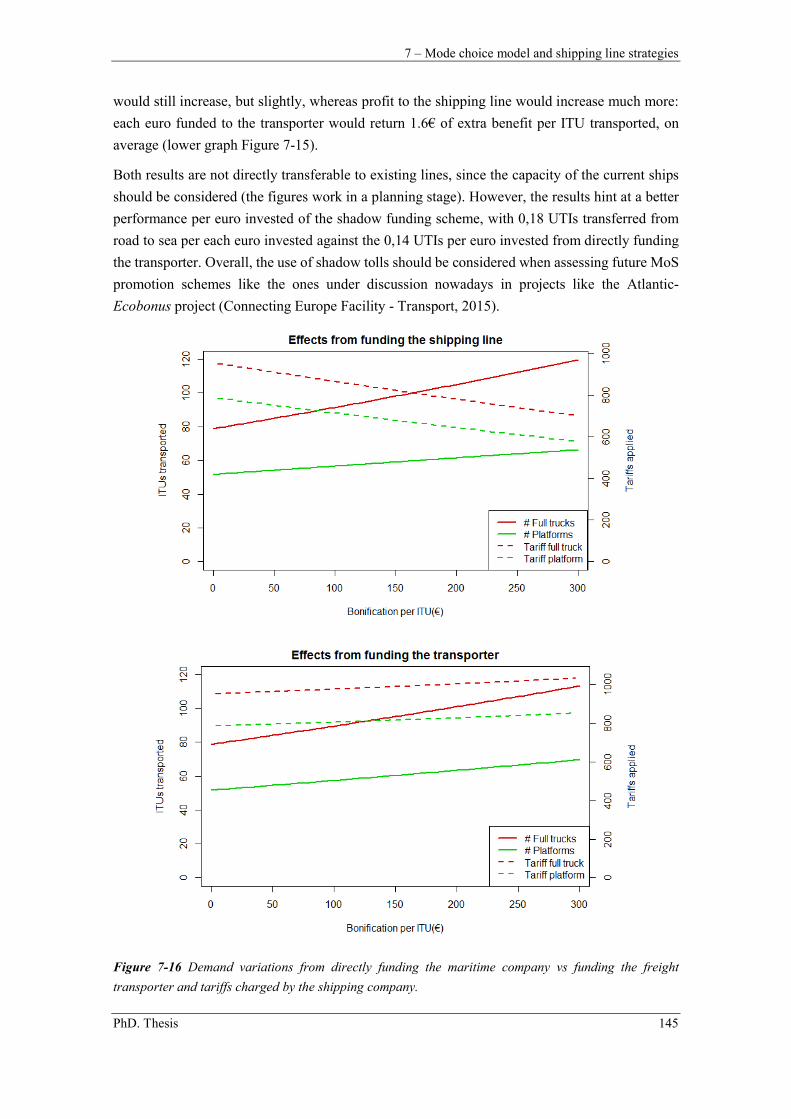
7 – Mode choice model and shipping line strategies
PhD. Thesis 145
would still increase, but slightly, whereas profit to the shipping line would increase much more:
each euro funded to the transporter would return 1.6€ of extra benefit per ITU transported, on
average (lower graph Figure 7-15).
Both results are not directly transferable to existing lines, since the capacity of the current ships
should be considered (the figures work in a planning stage). However, the results hint at a better
performance per euro invested of the shadow funding scheme, with 0,18 UTIs transferred from
road to sea per each euro invested against the 0,14 UTIs per euro invested from directly funding
the transporter. Overall, the use of shadow tolls should be considered when assessing future MoS
promotion schemes like the ones under discussion nowadays in projects like the Atlantic-
Ecobonus project (Connecting Europe Facility - Transport, 2015).
Figure 7-16 Demand variations from directly funding the maritime company vs funding the freight
transporter and tariffs charged by the shipping company.
RoRo terminals and truck freight. Improving competitiveness in a MoS context
146 P. Morales-Fusco (2016)
7.7 Chapter summary and conclusions
This chapter conveys what might be the most appropriate pricing strategy for a regular RoPax
shipping line taking into account the demand’s elasticity to tariff, the ship’s cost structure and the
requirements and cost implications of each cargo format transported. In that sense, tariffs have
been calculated using two different strategies: fares for a given shipping line already on operation
and fares for a line in its planning stage where, the optimal size of the vessel can be determined
as well.
A discrete choice logit function has been built and calibrated, based in physical quantifiable
variables for the Barcelona-Civitavecchia scenario using the cost model from the previous chapter
for three transportation alternatives: road haulage and transport chains with a MoS link with
accompanied and non-accompanied cargoes. A routine in R has been built to calculate the optimal
price scheme for the maritime link by means of a non-linear minimization using the Newton-
Raphson method. The results obtained suggested that:
In a monopolistic scenario, the unaccompanied cargo shows smaller elasticities to tariff
variations due to the inverse elasticity rule, allowing the shipping company to overprice
the alternative.
Motorways of the sea in their current form are competitive against road both in time and
cost, but underrepresented given the actual offer. Therefore, the calibration of the utility
functions return high parameter values for dummy variables in the maritime option,
meaning a lack of awareness of the potentiality of this kind of chain, an overoptimistic
calculation of costs and times for the maritime option and/or that some variable was
overlooked. However, given the high elasticity of the demand towards variations in the
intercept value means that small improvements in any of those aspects should produce
major mode shifts towards the maritime option.
The shipping line increases its profit from using smaller ships and larger tariffs due to the
diseconomies of scale in RoPax ships already identified in the literature (Saurí and Spuch,
2010). In such scenario it should be beneficial to increase the number of ships on
operation (and frequency) over increasing their size.
Modal choice is more dependent on the road distance between origin and destination than
to distance to the port, although short distances to the port are assumedly more
competitive for the maritime unaccompanied alternative.
Demand shows little elasticity over variations in the stevedoring costs. The reductions in
unaccompanied demand derived from increases in the stevedoring costs would be small
and partially compensated by small increases in the number of full trucks using the
maritime option.
The maritime link is more competitive against variations in the fuel price than road
transportation. Equivalent increases in fuel price for all road transportation (including the
7 – Mode choice model and shipping line strategies
PhD. Thesis 147
road leg of the maritime options) and the bunker used for the maritime leg, increase the
competitiveness of the Motorway of the Sea option.
Direct funding to the liner shipping company per unit transported (shadow funding) is
slightly more efficient than directly funding the transporter, in terms of attainable modal
shift per euro invested. And, in fact, the shipping company obtains larger profit if indirect
funding –via the transporters– than when direct funding is being used. Therefore, shadow
toll methodologies are seemingly more effective than direct funding if bonus policies are
to be implemented. That option should be studied thoroughly if bonus policies orientated
to demand are to be implemented, given the limited success of initiatives directly
orientated to the offer (DG Move, 2015).
Further research should encompass the effects of variations on the effects of policies over the
most sensitive parameters from the cost and time formulas, or use the model to foresee their effect
on the competitiveness of the MoS options. The framework provided could be the source to:
Assess the effects of different policies over the most sensitive parameters from the cost
and time formulas, or use the model to foresee their effect on the competitiveness of the
MoS options. In that sense, it allows studying pricing options to minimize (or at least
reduce) the generalized costs. It would be of special interest to consider the effects from
partially internalizing the external costs through programs such the eurovignette and
compare the results with the ecobonus implementation
Differentiate demands (with their potential value and distribution in terms of distance to
shipping port) in terms of their time and cost requirements although the pricing system
does not discriminate in those terms. It discriminates in terms of cargo format (being
possible to consider added quality terms). Establish a pricing system which can consider
new “product” and “price” categories depending on the quality of service provided to the
cargo inside the ship, like power points for refrigerated containers. To add such new
categories, it has to be known the increase in costs that it means per both, unit in that
category and the average cargo unit transported.
Solve the maximization benefit problem in a non-monopolistic case, where different
shipping lines compete among them and with the transportation road for the demand.
Develop and solve the Ramsey pricing problem presented, after including the social
welfare as the parameter to be maximized (include external costs to the model). The
approach could be taken either from an analytical point of view or using non-linear
minimization approximations, following the methodology developed in this chapter.
On completion of the two previous bullet points, produce recursive algorithms to propose
the most optimal deployment of new shipping services or increased frequencies in current
ones and assess their effect on the existing shipping services. The approach could be taken
either individually (a new competing shipping line), considering cooperation between
shipping lines (maximization of the overall benefits) or even considering the most
convenient deployment in terms of social welfare (total costs being accounted for)
RoRo terminals and truck freight. Improving competitiveness in a MoS context
148 P. Morales-Fusco (2016)
.
8 – Conclusions and further research
PhD. Thesis 149
8. Conclusions and further research
Chapter 8
Conclusions and further research
8.1 Overview of the work done
Generally speaking, the approach taken revolves around the drivers behind the modal choice and
ways to quantify and, ultimately, improve them, to enhance the competitiveness of the maritime
multimodal transport chains. The work starts with an overview on Short Sea Shipping and rapidly
shifts the focus towards the Motorways of the Sea initiative and rolled cargo ships and their
potentialities in terms of quality perceived, cost and time when compared with their major
antagonist, road transportation.
The logic behind the thesis structure is to develop encapsulated analyses of different concepts
related with the competitiveness of the maritime link. Different techniques and backgrounds are
used to build a logical discourse along the way. Therefore, each chapter follows a standalone
structure with its introduction, literature review, methodology, results and final conclusions.
Nonetheless each chapter can be easily transferable into a scientific paper, providing that some of
the findings from previous chapters should be taken into account as well.
In a first stage, it has been necessary to develop an understanding of SSS, its customers and the
drivers that make they favour a transport alternative over another. The issue has been tackled
identifying and classifying the requirements of the demand by searching thorough supply chain
literature and by interviewing the different stakeholders involved in the supply chain but cargo-
owners and freight forwarders. The obtained know-how has been used to characterize the different
kinds of SSS on offer to finally build tables matching requirements and maritime modes
characteristics, in order to identify the most suitable option for each kind of cargo. After this
introductory stage, the research has concentrated in the drivers behind choosing a rolled cargo
option when it competes against the road option.
In the second stage, the focus shifts to quality aspects of the supply chain by studying what it has
been considered, for some, the weakest link in any multimodal transportation chain: port
RoRo terminals and truck freight. Improving competitiveness in a MoS context
150 P. Morales-Fusco (2016)
operations. Port operations are analyzed both quantitatively and qualitatively. As a consequence,
two different methodologies were built separately to assess the performance of port operations.
The first methodology, described in chapter 4, consisted in building a formulation mixing
analytical, empirical and simulated data to calculate the minimum time of operation a ship would
spend in a terminal and, from there and given an intensity of use of the facility, to be able to
predict, stochastically, the probability of a given ship to have to wait. That is, a method was built
that allowed quantifying the effect of the intensity of terminal use over the offered quality of its
end users. To summarize, the proposed approach consists in three main steps: (i) estimation of
the optimal service time, (ii) calculation of the waiting probability associated to it, (iii) and,
ultimately, drawing of the performance curve of the terminal
The second methodology to assess the terminals performance was done by building a risk
assessment framework of the physical operations taken part in the terminal and their interrelation.
First of all, the operations were sorted and the potential risks that could jeopardize their normal
performance were identified, using common sense and the opinion of workers in two terminals
from the port of Barcelona. Since operations in the terminals and the risks are interrelated,
relationships between risks, causes and consequences were built resulting in 16 trees of causes-
disruption-consequences were obtained, a grading of the importance of the consequences was
made and the probability of each link to happen was weighted. As a result, a simple framework
allowing to quantify the severity and probability of each risk affecting the normal operation of
the terminal was obtained, as well as a way to quantify the effect of possible palliating measures,
providing, as a result, an alternative way to assess the quality of the operations in a terminal.
The final stage of the demand revolved around the construction of a demand choice model to
weight the importance of some of the drivers behind the demand choice. The first block (chapter
6) explored the different alternatives available to the demand (considering that the cargo travels
in truck platforms) and analytically constructed a cost and time model for each alternative as well
as a cost model for the shipping line allowing to do a first assessment on the competitiveness of
the different options when constrained by the geographical characteristics of the demand and the
maritime links available.
The second block of this final stage, picked up where the previous one ended. This time a discrete
choice model was constructed to characterize the behaviour of the demand in order to properly
assess the elasticity of the demand to variations on the parameters of the previously constructed
cost and time models. The model was applied to a specific case (a maritime connection between
Italy and Spain) were the lack of exhaustive data forced the researcher to construct the database
considering a maximization of the utility problem. Once the discrete choice model was calibrated
using the database, it was possible to construct a routine in R to determinate the optimal
characteristics of the maritime link (ship size and tariffs) to maximize, in this case, the profit to
the shipping company by using the Newton-Raphson iterative method. Finally, it was possible to
assess the effect of several policies to promote SSS using the model.
To summarize, the research done provides several frameworks and models to assess some of the
drivers behind the modal choice when a RoRo, or rather RoPax, maritime link is involved.
8 – Conclusions and further research
PhD. Thesis 151
8.2 Main findings and conclusions
The contributions of this thesis are particular for each approach taken although some may overlap.
Considering the strategic assessment, it can be concluded that:
SSS makes a better use of the existing economies of scale since it can absorb the risk
associated to the demand variability as long as it is able to compensate the different flows.
Transporters would benefit as well of a reduction on their fixed costs from using SSS as
also observed in the conclusions from chapter 6.
Motorways of the Sea with rolled cargo are potentially more competitive when full trucks
are used and especially with cargo with high opportunity costs (retail, automobile,
components or fruit farmer industries). High concentration and low costs are also likely
to benefit from SSS but in the shape of containerships as long as larger transit times are
not a problem.
Push against stock and push-pull seem to be the supply chains that would benefit the most
from the inclusion of Motorways of the Sea in the shape of RoRo/RoPax vessels, since
time and frequency are essential for the competitiveness of the supply chain.
The series of charts produced can be a useful tool to assess the most suitable maritime
option for each kind of product. Additionally, the insights produced can help shipping
companies to better target their potential customers.
In terms of terminal performance, it is found out that:
Given the scheduled nature of RoPax-Motorway of the Sea services, the use of queueing
theory to estimate the average waiting time for ships and their time at port are of no use,
but an analytical model can be used to estimate the probability of having to wait instead.
A deterministic formulation is provided to calculate a lower bound for the service time a
RoPax ship will spend at a terminal and to calculate the minimum probability a ship has
to wait given a terminal’s capacity.
A framework to assess the trade-off between the quality of service provided to the
shipping companies and the intensity of use of the terminal is constructed, and some
reference values are given.
A complete topology of the major events that could disrupt the normal operation of any
of the operations taking part in a RoPax terminal and their interrelation with the most
common causes and consequences and their severity is constructed, providing a better
understanding on the butterfly effect any specific event can cause on the normal operation
of the terminal and a means to quantify it.
From the risk assessment made to two terminals in Barcelona it is observed that delay in
ship departure is the most possible final effect of any impact that could affect the normal
operation of tje RoPax terminal. Additionally, delays on the beginning of the stevedoring
RoRo terminals and truck freight. Improving competitiveness in a MoS context
152 P. Morales-Fusco (2016)
process and extra costs due to a prolonged stevedoring time are the most important
problems a RoPax terminal usually faces in terms of severity and frequency.
Some measures to improve the resiliency (therefore, quality) of a RoPax terminal are
provided together with a framework to assess their performance.
Additionally, regarding the cost structure of the different transportation strategies alternatives
available to the transporter it is found that:
The competitiveness of the maritime options are mostly dependant on the price charged
by the shipping company but not only, a sufficient pool of equipment (and an efficient
use of it) and coordination at both ends of the maritime connection (for the
unaccompanied case), are also necessary.
If the efficiency is met, unaccompanied or pure RoRo strategies are the most competitive
in terms of cost and time since they can potentially take better advantage from the existing
economies of scale as long as the demand is enough and stable in time.
Motorways of the sea in their current form are theoretically competitive against road both
in time and cost, but underrepresented given the actual offer. The intercept values of the
utility formula of the demand model prove that either some drawbacks attributable to the
maritime option were overlooked, their cost and times overestimated or the end-users are
unaware of the potentialities of the maritime option or all of them combined. But since
the elasticity of the demand to the variation of those values is high, just a small
improvement in perception should prove highly profitable towards the mode shift.
In a monopolistic scenario, the unaccompanied cargo shows smaller elasticities to tariff
variations due to the inverse elasticity rule, allowing the shipping company to overprice
the alternative and reducing the competitiveness of that specific business model for the
transporter.
Demand shows little elasticity over variations in the stevedoring costs. The reductions in
unaccompanied demand derived from increases in the stevedoring costs would be small
and partially compensated by small increases in the number of full trucks using the
maritime option.
The maritime link is more competitive against variations in the fuel price than road
transportation. Equivalent increases in fuel price for all road transportation (including the
road leg of the maritime options) and the bunker used for the maritime leg, increase the
competitiveness of the Motorway of the Sea option.
Given the quick scalability of costs with increases in size returns that the shipping line
benefits from providing less capacity at a higher price than using big vessels. Likely, it
can be more competitive to add ships instead of making over increasing their size.
Direct funding to the liner shipping company per unit transported is slightly more efficient
for modal shift than funding to the transporter for using a MoS connection. And, in fact,
8 – Conclusions and further research
PhD. Thesis 153
the shipping company obtains larger profit if indirect funding –via the transporters– than
when direct funding is being used. Therefore, shadow toll methodologies are seemingly
more effective than direct funding if bonus policies are to be implemented.
In terms of policy it is found that:
In order to increase the attractiveness of unaccompanied cargoes –less favoured by the
shipping company– measures to ease the cooperation among carriers at both ends of the
shipping line would be beneficial for their competitiveness.
Funding initiatives to promote the modal shift are more effective if directed to fund the
shipping company subject to the number of units transported (shadow funding) than when
directly aimed to the demand, since the latter primarily benefits the shipping company
that increases the tariffs charged accordingly.
In short, the current promotion policies for modal shift to Motorways of the Sea (and
Short Sea Shipping) would reach larger paybacks if, instead of orienting them to the offer
(by funding the set up of new shipping lines), they were oriented to the demand by:
o Improve the perception of the maritime mode (reduction of the intercept
values of the utility function).
o Facilitate the coordination of carriers at both sides of the maritime links
and the return of empty platforms.
o Subedit the reception of public funding to the demand attracted (shadow
toll system) to promote the reduction and control of the pricing schemes
implemented.
8.3 Future research
After revising the literature and provided the conclusions of some of the lines of research
conducted, some room for further research has been found in the following topics, with no aim to
provide an exhaustive list:
Further research should be done regarding the different behaviour of the demand
regarding who does choose the transportation alternative (freight forwarder, cargo owner,
shipper). Some interesting research has been done by using INCOTERMS codes in the
demand models by Feo-Valero (Feo-Valero et al., 2011; Garcia-Menendez et al., 2009)
but further factors like the effect of owning the equipment used or alliances between the
different stakeholders involved could be added into the equation.
Cause-effect relationships in the risk assessment of terminals may be oversimplifying.
The research done would benefit from developing some kind of grading system by the
use of fuzzy or stochastic intensity values to characterize the links in the arborescence
defining each operation of the terminal.
RoRo terminals and truck freight. Improving competitiveness in a MoS context
154 P. Morales-Fusco (2016)
Regarding the modal choice utility model, a model considering all existing lines at once
is in order, where the elasticities from variations in one of the maritime links could be
assessed. Probably by using a nested logit model instead of a simple multinomial one.
One of the main issues with such approach would be the lack of reliable data for its
calibration. This approach could arguably overcome the limitations of the current take
due to the Ramsey Pricing phenomenon for monopolistic systems.
The cost and time models developed and calibration of the utility function for the demand
would prove useful in further research regarding policies to promote mode shift towards
the maritime alternatives. There is also room to consider generalized costs and define
pricing/funding/size of the deployed vessels to reduce the overall costs.
The role of the variability of demand and different pricing systems according to priorities
to board a specific ship could be computed at least in a theoretical level, especially
considering that overcapacity in the shipping line is highly detrimental due to the
scalability in costs with ship size.
Finally, recursive optimization algorithms could be developed to assess the most optimal
deployment of new shipping services or reinforcement of existing ones, and assess their
effect on the existing shipping services. The approach could be taken either individually
(a new competing shipping line), considering cooperation between shipping lines
(maximization of the overall benefits) or even considering the most convenient
deployment in terms of social welfare (total costs being accounted for).
Appendix A
PhD. Thesis 155
Appendix A - Abbreviations
NB: This section is designed to clarify common abbreviations and acronyms used in the shipping
business that are relevant for the contents of the PhD Proposal. Not all abbreviations in the text
might be included below.
3PL: Third Part Logistics
DSS: Deep Sea Shipping
DWT: Dead-Weight Ton(s)
EC: European Commission
ECA: Emission Control Area
ETA: Estimated Time of Arrival
ETD: Estimated Time of Departure
EU: European Union
FF: Freight Forwarder
FL: Full load
FVOT: Freight Value of Time
GDP: Gross Domestic Product
GT: Gross Tonnage
IMO: International Maritime Organization
ISPS: International Ship and Port Facilities Security
ITU: Intermodal Transport Unit
JIT: Just in Time
LTL: Less than Load
MARPOL: International Convention for the Prevention of Pollution from Ships
MLM: Multinomial Logit Model (multinomial logistic probability model)
MoS: Motorway of the Sea
MTO: Multimodal Transport Operator (a.k.a. freight forwarder)
pdf: Probability distribution function
RoPax: Roll on – Roll off ship with capabilities to carry passengers.
RoRo: Roll on – Roll off
RP: Revealed Preference (model)
SC: Supply Chain
SCM: Supply Chain Management
SECA: Sulphur Emission Control Area
SITC: Standard International Trade Code
SP: Stated Preference (model)
RoRo terminals and truck freight. Improving competitiveness in a MoS context
156 P. Morales-Fusco (2016)
SOLAS: International Convention for the Safety of Life at Sea
SSS: Short Sea Shipping or Coastal Shipping
TEN-T: Trans-European Transport Network
TEU: Twenty-foot Equivalent Unit
UNCTAD: United Nations Conference on Trade and Development
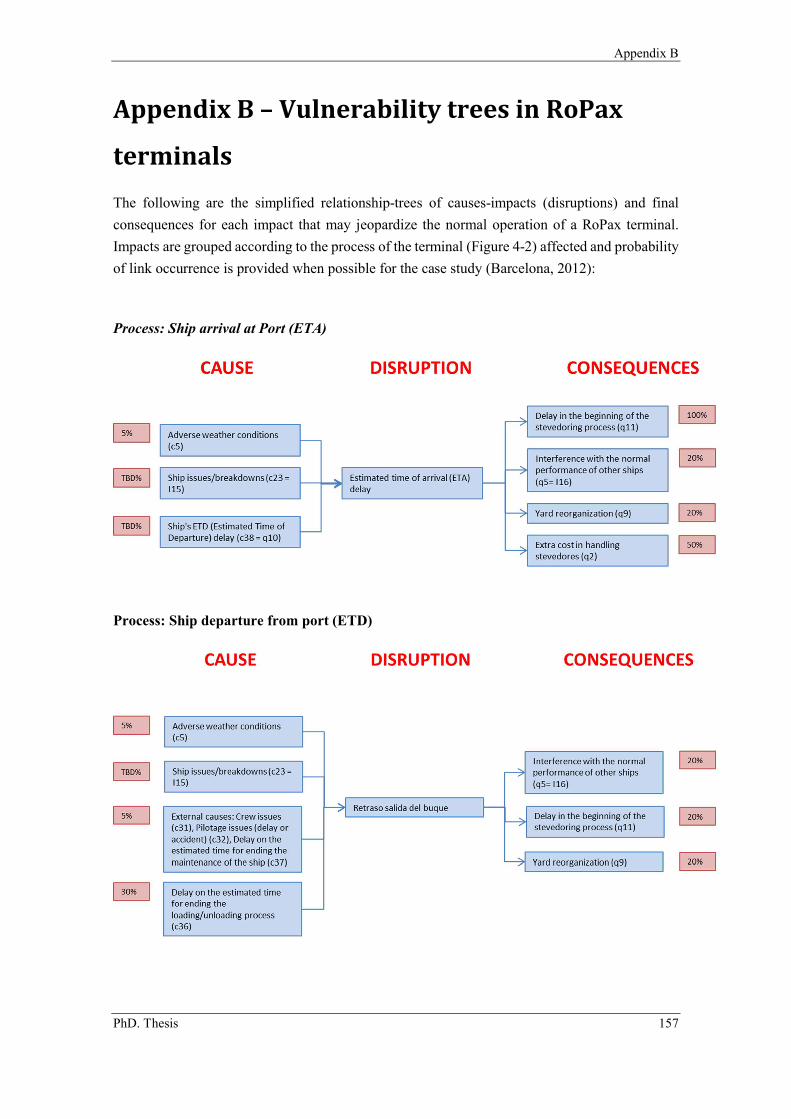
Appendix B
PhD. Thesis 157
Appendix B – Vulnerability trees in RoPax
terminals
The following are the simplified relationship-trees of causes-impacts (disruptions) and final
consequences for each impact that may jeopardize the normal operation of a RoPax terminal.
Impacts are grouped according to the process of the terminal (Figure 4-2) affected and probability
of link occurrence is provided when possible for the case study (Barcelona, 2012):
Process: Ship arrival at Port (ETA)
Process: Ship departure from port (ETD)
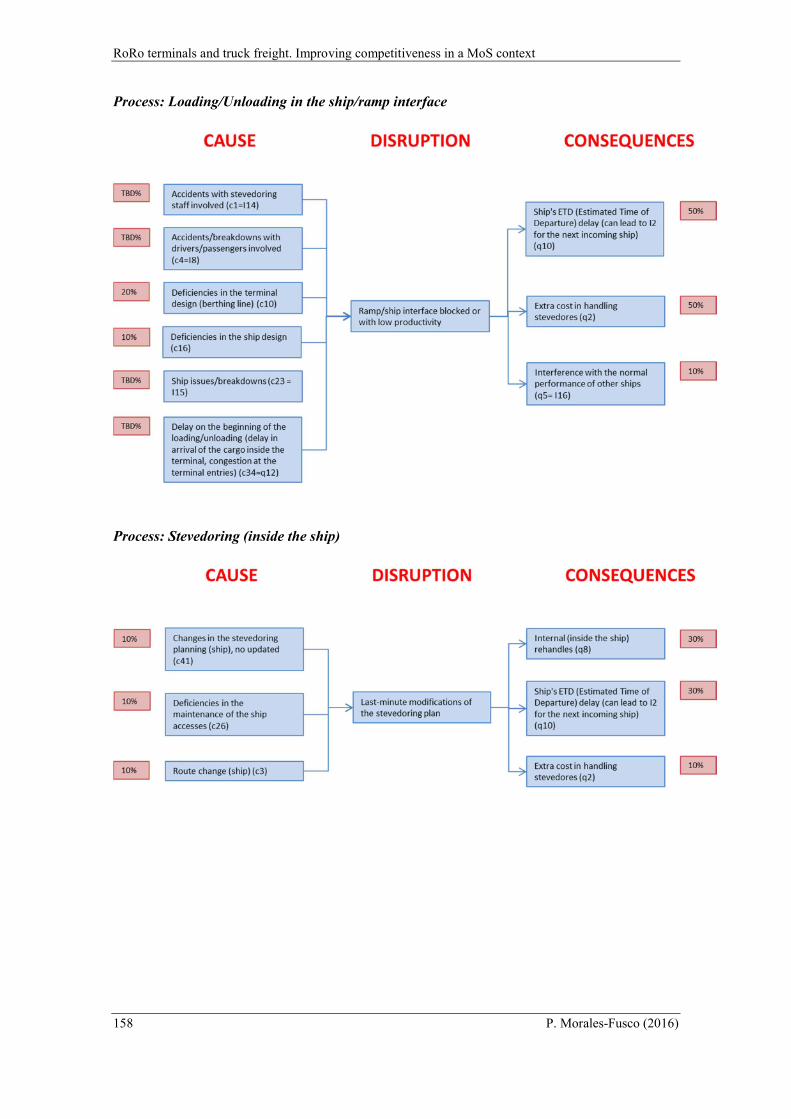
RoRo terminals and truck freight. Improving competitiveness in a MoS context
158 P. Morales-Fusco (2016)
Process: Loading/Unloading in the ship/ramp interface
Process: Stevedoring (inside the ship)
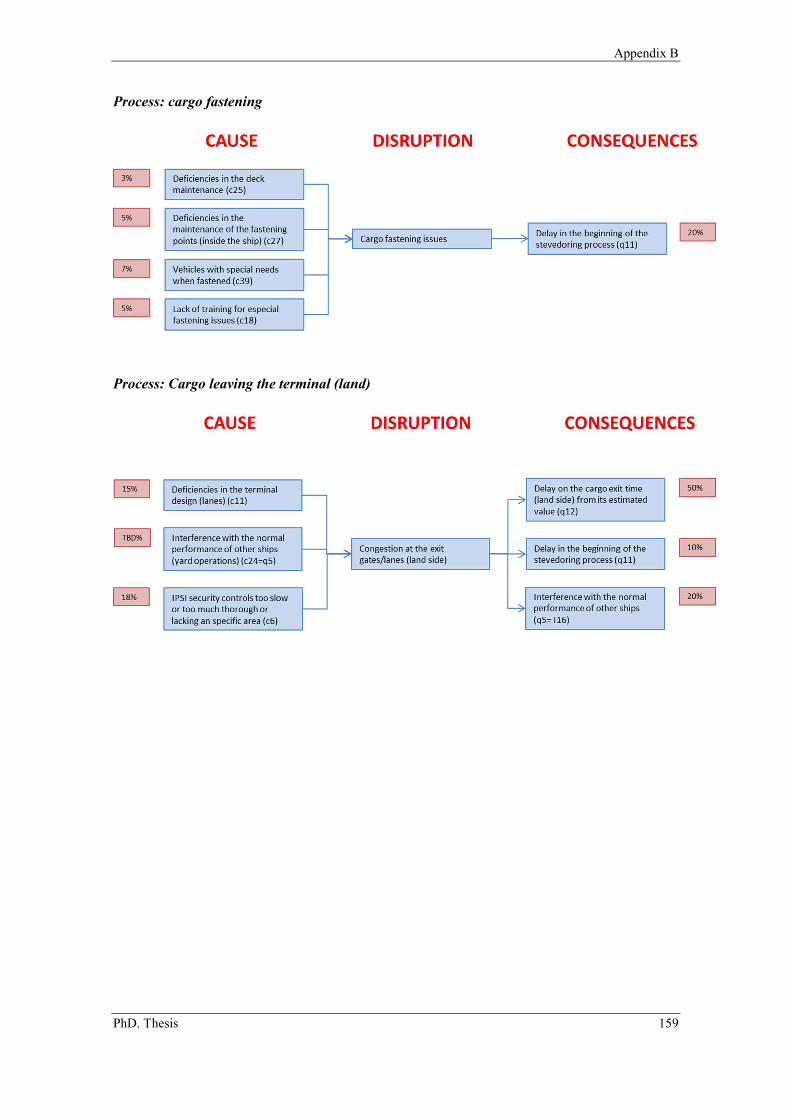
Appendix B
PhD. Thesis 159
Process: cargo fastening
Process: Cargo leaving the terminal (land)
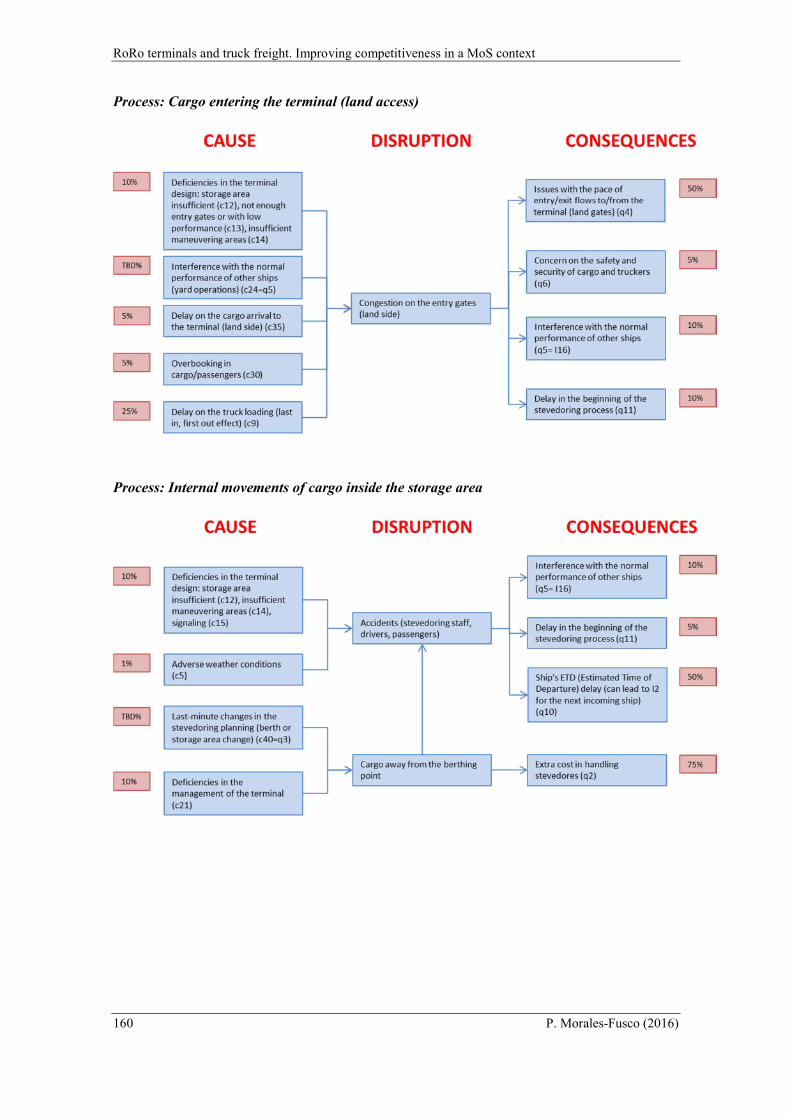
RoRo terminals and truck freight. Improving competitiveness in a MoS context
160 P. Morales-Fusco (2016)
Process: Cargo entering the terminal (land access)
Process: Internal movements of cargo inside the storage area
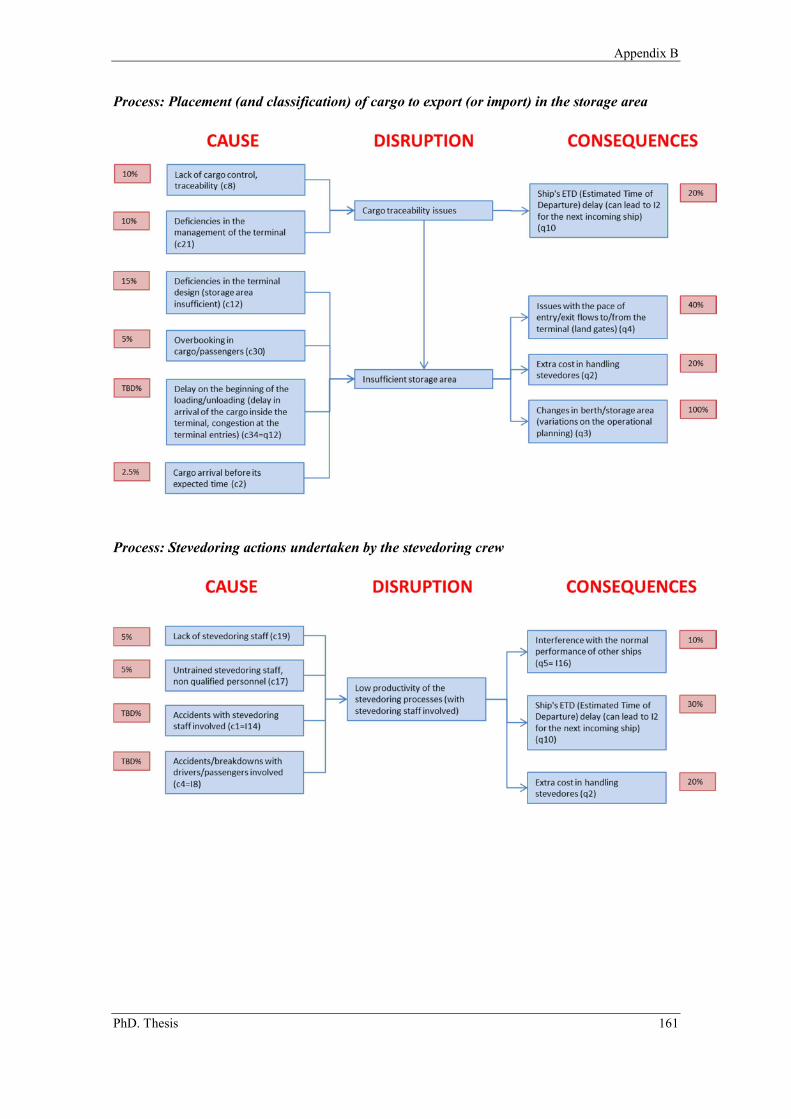
Appendix B
PhD. Thesis 161
Process: Placement (and classification) of cargo to export (or import) in the storage area
Process: Stevedoring actions undertaken by the stevedoring crew
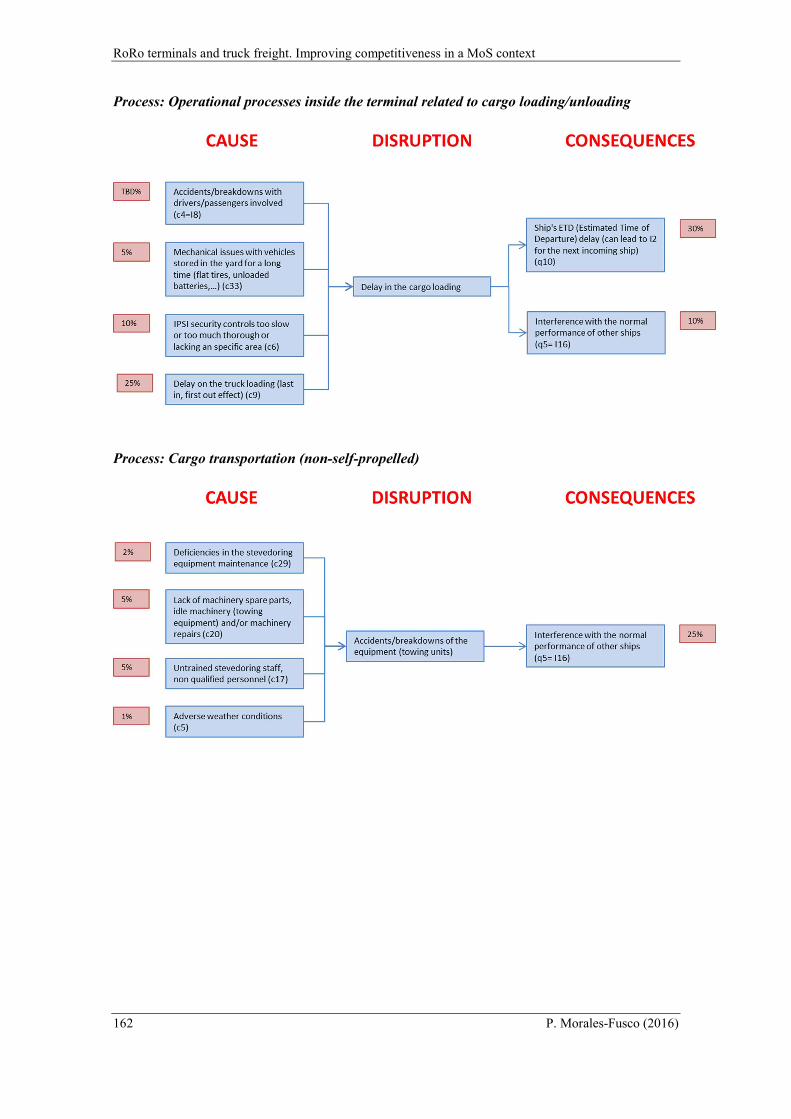
RoRo terminals and truck freight. Improving competitiveness in a MoS context
162 P. Morales-Fusco (2016)
Process: Operational processes inside the terminal related to cargo loading/unloading
Process: Cargo transportation (non-self-propelled)
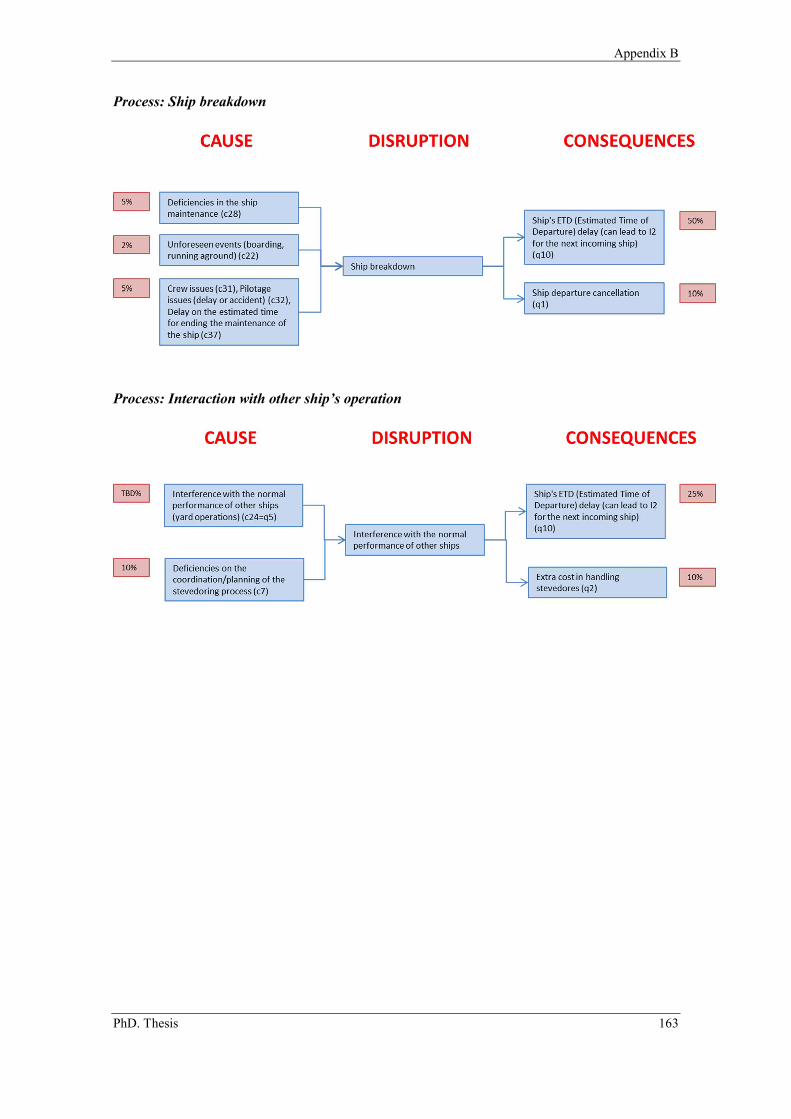
Appendix B
PhD. Thesis 163
Process: Ship breakdown
Process: Interaction with other ship’s operation

RoRo terminals and truck freight. Improving competitiveness in a MoS context
164 P. Morales-Fusco (2016)
Appendix B
PhD. Thesis 165
References
Acciaro, M. (2011). Service differentiation in liner shipping: advance booking and express services. International Journal of Shipping and Transport Logistics, 3, 365–383. http://doi.org/10.1504/IJSTL.2011.041133
Agerschou, H. (2004). Facilities requirements. In Planning and design of ports and marine terminals (2nd ed., pp. 5–20). London: Thomas Telford.
Aguilar Herrando, J., & Obrer Marco, R. (2009). Consideraciones sobre la oferta y la demanda del servicio de atraque, en relación con la capacidad de las terminales de contenedores [Considerations on the offer and demand of the berthing relationship with the capacity container terminals]. In X Jornadas Españolas de Costas y Puertos, 27-28 May (pp. 769–778). Santander, Spain.
Alizadeh, A. H., & Talley, W. K. (2011). Microeconomic determinants of dry bulk shipping freight rates and contract times. Transportation, 38, 561–579. http://doi.org/10.1007/s11116-010-9308-7
Arencibia, A. I., Feo-Valero, M., García-Menéndez, L., & Román, C. (2015). Modelling mode choice for freight transport using advanced choice experiments. Transportation Research Part A: Policy and Practice, 75, 252–267. http://doi.org/10.1016/j.tra.2015.03.027
Arof, A. M. (2015). Determinants for a feasible short sea shipping: Lessons from europe for ASEAN. Asian Social Science, 11(15), 229–238. http://doi.org/10.5539/ass.v11n15p229
Asbjørnslett, B. E., & Gisnaas, H. (2007). Coping with risk in maritime logistics. In T. Aven & J. E. Vinnem (Eds.), Risk, Reliability and Societal Safety, Vols 1-3. Proceedings of The 6th International Research Seminar on Supply Chain Risk Management, ISCRIM and SMI (pp. 2669–2675). London: Taylor & Francis.
Aspereren, E., Dekker, R., Polman, M., & Arons, H. de S. (2005). Arrival processes in port modeling: insights from a case study. In A. Bruzzone, M. Brandolini, C. Frydman, & Y. Merkuryev (Eds.), Proceedings of the 7th International Workshop on Harbour, Maritime & Multimodel Logistics Modelling (HMS 2005), 20-22 October (pp. 7–16). Marseille, France.
Baindur, D., & Viegas, J. (2012a). Estimating impact of transport policies on motorways of the sea projects in the Atlantic corridor - a case study of searoad services. Transportation Letters-The International Journal of Transportation Research, 4(3), 167–180. http://doi.org/10.3328/TL.2012.04.03.167-180
Baindur, D., & Viegas, J. M. (2011). An agent based model concept for assessing modal share in inter-regional freight transport markets. Journal of Transport Geography, 19(6), 1093–1105. http://doi.org/10.1016/j.jtrangeo.2011.05.006
Baindur, D., & Viegas, J. M. (2012b). Success factors for developing viable motorways of the sea projects in Europe. Logistics Research, 4(3-4), 137–145. http://doi.org/10.1007/s12159-012-0069-x
Roll on-roll off terminals and truck freight. Improving competitiveness in a Motorways of the Sea context
166 P. Morales-Fusco (2016)
Baird, A. J. (2007). The economics of motorways of the sea. Maritime Policy & Management: The Flagship Journal of International Shipping and Port Research, 34(4), 287–310. http://doi.org/10.1080/03088830701538976
Ballis, A. (2004). Introducing level-of-service standards for intermodal freight terminals. Transportation Research Record, 1873, 79–88. http://doi.org/10.3141/1873-10
Barnes, P., & Oloruntoba, R. (2005). Assurance of security in maritime supply chains: Conceptual issues of vulnerability and crisis management. Global Security Risks and International Competitiveness, 11(4), 519–540. http://doi.org/DOI: 10.1016/j.intman.2005.09.008
Barroso, A. P., Machado, V. H., & Machado, V. C. (2008). A Supply Chain Disturbances Classification. In Ieem: 2008 International Conference on Industrial Engineering and Engineering Management, Vols 1-3. 8-11 December (pp. 1870–1874). Singapore.
Bassan, S. (2007). Evaluating Seaport Operation and Capacity Analysis—Preliminary Methodology. Maritime Policy & Management, 34(1), 3–19. http://doi.org/10.1080/03088830601102725
Batley, R. (2007). Marginal valuations of travel time and scheduling, and the reliability premium. Transportation Research Part E: Logistics and Transportation Review, 43(4), 387–408. http://doi.org/DOI: 10.1016/j.tre.2006.06.004
Bendall, H. B., & Brooks, M. R. (2011). Short sea shipping: lessons for or from Australia. International Journal of Shipping and Transport Logistics, 3(4, SI), 384–405. http://doi.org/http://dx.doi.org/10.1504/IJSTL.2011.041134
Bengtsson, S. K., Fridell, E., & Andersson, K. E. (2014). Fuels for short sea shipping: A comparative assessment with focus on environmental impact. Proceedings of the Institution of Mechanical Engineers Part M-Journal of Engineering for the Maritime Environment, 228(1), 44–54. http://doi.org/10.1177/1475090213480349
Bergantino, A. S., & Bolis, S. (2004). An Analysis of Maritime Ro-Ro Freight Transport Service Attributes through Adaptive Stated Preference: an Application to a Sample of Freight Forwarders. European Transport, 25-26, 33–51.
Bernetti, G., Dall’Acqua, M., & Longo, G. (2002). Road Transport vs Ro-Ro: A modellistic approach to freight modal choice. In European Transport Conference 2002 Proceedings. September 9-11. Cambridge, UK: Association for European Transport (AET).
Beškovnik, B. (2013). Possibilities for Motorways of the Sea development in the eastern part of the Adriatic Sea. Polish Maritime Research, 20(1), 87–93. http://doi.org/10.2478/pomr-2013-0010
Bichou, K., & Gray, R. (2004). A Logistics and Supply Chain Management Approach to Port Performance Measurement. Maritime Policy & Management, 31(1), 47–67. http://doi.org/10.1080/0308883032000174454
Bierwirth, C., & Meisel, F. (2010). A survey of berth allocation and quay crane scheduling problems in container terminals. European Journal of Operational Research, 202(3), 615–627. http://doi.org/10.1016/j.ejor.2009.05.031
Appendix B
PhD. Thesis 167
Black, I., Seaton, R., Ricci, A., & Enei, R. (2003). Real cost reduction of door-to-door intermodal transport (Recordit). Final Report: Actions to Promote Intermodal Transport. Retrieved from http://www.transport-research.info/Upload/Documents/200607/20060727_155159_96220_RECORDIT_Final_Report.pdf
Blonk, W. A. (1994a). Developments in EU maritime transport policy. Marine Policy, 18(6), 476–482. http://doi.org/10.1016/0308-597X(94)90069-8
Blonk, W. A. (1994b). Short Sea Shipping and inland waterways as part of a sustainable transportation system. Marine Pollution Bulletin, 29(6-12), 389–392. http://doi.org/10.1016/0025-326X(94)90659-9
Borlenghi, M., Figari, M., Carvalho, I. S., Guedes Soares, C., & Soares, C. G. (2008). Modelling and assessment of Ferries’ environmental impact: A case study. In P. Soares, CG and Kolev (Ed.), Maritime Industry, Ocean Engineering and Coastal Resources - Proceedings of the 12th International Congress of the International Maritime Association of the Mediterranean, IMAM 2007 (Vol. 1–2, pp. 1135–1143). London, England: Taylor & Francis Limited.
Bowersox, D., Closs, D., & Cooper, M. B. (2002). Supply Chain Logistics Management. (B. Gordon, Ed.). New York: McGraw-Hill/Irwin.
Brooks, M. R. (2000). Sea change in liner shipping. Regulation and managerial decision-making in a global industry. Amsterdam: Pergamon Press.
Brooks, M. R. (2014). The Changing Regulation of Coastal Shipping in Australia. Ocean Development and International Law, 45(1), 67–83. http://doi.org/10.1080/00908320.2014.867191
Brooks, M. R., Puckett, S. M., Hensher, D. A., & Sammons, A. (2012). Understanding mode choice decisions: A study of Australian freight shippers. Maritime Economics and Logistics, 14(3), 274–299. http://doi.org/10.1057/mel.2012.8
Brynolf, S., Magnusson, M., Fridell, E., & Andersson, K. (2014). Compliance possibilities for the future ECA regulations through the use of abatement technologies or change of fuels. Transportation Research Part D: Transport and Environment, 28, 6–18. http://doi.org/10.1016/j.trd.2013.12.001
Buck Consultants International. (2014). Improving the concept of “Motorways of the Sea.” Brussels: European Comission. Retrieved from http://www.europarl.europa.eu/studies
Bukljaš, M., Jolić, N., & Jolić, A. (2007). Management and prospects of the Croatian short sea shipping development. Promet - Traffic - Traffico, 19(2), 95–102.
Camarero, A., & Polo, G. (2005). RO/RO ships for Short Sea Shipping. Bulletin of the Permanent International Association of Navigation Congresses. International Maritime Organization/Organisation Maritime International.
Castells Sanabra, M. (2009). Short Sea Shipping efficiency analysis considering high-speed craft as an alternative to road transport in SW Europe. Universitat Politècnica de
Roll on-roll off terminals and truck freight. Improving competitiveness in a Motorways of the Sea context
168 P. Morales-Fusco (2016)
Catalunya - BarcelonaTech, Barcelona, Spain. Retrieved from http://www.tesisenxarxa.net/tdx-1014109-122538/
Cepolina, S., & Ghiara, H. (2013). New trends in port strategies. Emerging role for ICT infrastructures. Research in Transportation Business & Management, 8, 195–205. http://doi.org/10.1016/j.rtbm.2013.07.001
Cetin, C. K., & Cerit, A. G. (2010). Organizational effectiveness at seaports: a systems approach. Maritime Policy & Management: The Flagship Journal of International Shipping and Port Research, 37(3), 195. http://doi.org/10.1080/03088831003700611
Chang, Y.-T., Lee, P. T.-W., Kim, H.-J., Shin, S., & Kim, M. (2007). Short Sea Shipping Study: A report on successful SSS models that can improve ports’ efficiency and security while reducing congestion, fuel costs, and pollution. Singapore: Inha University.
Chlomoudis, C. I., Pantouvakis, A., Dimas, A., & Tziva, L. (2010). Service quality and satisfaction in business-to-business service setting. Evidences from the port industry. In IAME Proceedings, July 2010. Lisbon, Portugal.
Chow, J. Y. J., Yang, C. H., & Regan, A. C. (2010). State-of-the art of freight forecast modeling: Lessons learned and the road ahead. Transportation, 37(6), 1011–1030. http://doi.org/10.1007/s11116-010-9281-1
Christopher, M. (2005). Managing risk in the supply chain. In M. Chrisopher (Ed.), Logistics & supply chain management (Vol. 3rd, pp. 231–258). Harlow, Great Britain: Prentice-Hall.
Claessens, E. M. (1989). Port and jetty location for small-scale inter-island short-sea shipping: The warehouse approach. Maritime Policy and Management, 16(2), 109–121. http://doi.org/10.1080/03088838900000036
Commission of the European Communities. (1999). The development of short sea shipping in Europe. A dynamic alternative in sustainable transport chain. A second two yearly progress report. (Vol. COM (99) 0). Luxembourg: Office for Official Publications of the European Communities.
Crescimanno, M., Galati, A., Siggia, D., Vrontis, D., Weber, Y., & Hans Ruediger Kaufmann, E. T. (2011). The role of Sicily in the maritime traffic of agri-food products in the Mediterranean basin. In E. Vrontis, D and Weber, Y and Kaufmann, HR and Tarba, S and Tsoukatos (Ed.), 4th Annual conference of the euromed academy of business: Business research challenges in a turbulent era (pp. 471–484). Marseille, France: Euromed Management.
Croissant, Y. (2003). Estimation of multinomial logit models in R: The mlogit Packages An introductory example. Data Management.
Cullinane, K., & Toy, N. (2000). Identifying influential attributes in freight route/mode choice decisions: a content analysis. Transportation Research Part E: Logistics and Transportation Review, 36(1), 41–53. http://doi.org/DOI: 10.1016/S1366-5545(99)00016-2
d Este, G. M. (1992). Carrier selection in a RO/RO ferry trade Part 2. Conceptual framework for the decision process. Maritime Policy & Management: The Flagship Journal of
Appendix B
PhD. Thesis 169
International Shipping and Port Research, 19(2), 127–138. http://doi.org/10.1080/03088839200000020
Dai, J., Lin, W., Moorthy, R., & Teo, C. (2008). Berth Allocation Planning Optimization in Container Terminal. In C. S. Tang, C. Teo, & K.-K. Wei (Eds.), Supply Chain Analysis. A Handbook on the Interaction of Information, System and Optimization (pp. 69–104). Springer US. http://doi.org/10.1007/978-0-387-75240-2_4
Danielis, R., & Marcucci, E. (2007). Attribute cut-offs in freight service selection. Transportation Research Part E: Logistics and Transportation Review, 43(5), 506–515. http://doi.org/DOI: 10.1016/j.tre.2005.10.002
Danielis, R., Marcucci, E., & Rotaris, L. (2005). Logistics managers’ stated preferences for freight service attributes. Transportation Research Part E: Logistics and Transportation Review, 41(3), 201–215. http://doi.org/DOI: 10.1016/j.tre.2004.04.003
De Vivero, J. L. S., & Mateos, J. C. R. (2007). Atlas of the European Seas and Oceans. Marine jurisdictions, sea uses and governance. Barcelona: Ediciones del Serbal.
DG Move. (2015). Analysis of recent trends in EU shipping and analysis and policy support to improve the competitiveness of Short Sea Shipping in the EU. European Comission.
Douet, M., & Cappuccilli, J. F. (2011). A review of Short Sea Shipping policy in the European Union. Journal of Transport Geography, 19(4), 968–976. http://doi.org/10.1016/j.jtrangeo.2011.03.001
Dragović, B., Park, N. K., & Radmilovic, Z. (2006). Ship-Berth Link Performance Evaluation: Simulation and Analytical Approaches. Maritime Policy & Management. Taylor & Francis Limited. http://doi.org/10.1080/03088830600783277
Dragović, B., Park, N. K., Radmilović, Z., & Maraš, V. (2005). Simulation Modelling of Ship-Berth Link With Priority Service. Maritime Economics & Logistics, 7(4), 316–335. http://doi.org/10.1057/palgrave.mel.9100141
Einarsson, S., & Rausand, M. (1998). An Approach to Vulnerability Analysis of Complex Industrial Systems. Risk Analysis. Springer Netherlands. http://doi.org/10.1023/B:RIAN.0000005928.84074.e4
Espino, R., Feo-Valero, M., & García-Menéndez, L. (2007). Factores determinantes de la demanda de transporte de mercancías en la autopista del mar de europa suroccidental: un análisis con preferencias declaradas de la elección modal de los operadores logísticos españoles. In XIII Congreso Chileno de Ingeniería de Transporte (pp. 1–13). Santiago, Chile, Chile.
European Commission. COM(92) 494 White Paper: The future development of the common transport policy (1992). Brussels: European Commission.
European Commission. COM(2001) 370 Final - White Paper: European transport policy for 2010: time to decide (2001). Luxemburg: European Commission.
Roll on-roll off terminals and truck freight. Improving competitiveness in a Motorways of the Sea context
170 P. Morales-Fusco (2016)
European Commission. COM(2006) 314 Final – Keep Europe Moving – Sustainable Mobility for Our Continent Mid-term Review of the European Commission’s 2001 Transport White Paper (2006). Brussels: European Commission.
European Commission. COM(2011) 144 Final - White Paper: Roadmap to a Single European Transport Area–Towards a competitive and resource efficient transport system, Office for Official Publications of the European Commission 1–31 (2011). Brussels: European Commission. http://doi.org/10.2832/30955
European Commission. COM(2013) 295 Ports: an engine for growth (2013). Brussels: European Commission.
European Commission. (2014). EU Transport in Figures -Statistical Pocketbook 2014.
European Council. Regulation (EEC) No 3821/95 on recording equipment in road transport (1995). Brussels: European Council.
European Parliament. Regulation (EC) No 561/2006 on the harmonisation of certain social legislation relating to road transport (2006). European Council.
European Parliament, & Council of the European Union. Decision 884/2004/EC on Community guidelines for the development of the trans-European transport network, L 167 Official Journal of the European Union 1–38 (2004). Brussels.
Eurostat. (2015). Maritime ports freight and passenger statistics. Retrieved April 14, 2015, from http://ec.europa.eu/eurostat/statistics-explained/index.php/Maritime_ports_freight_and_passenger_statistics
Feo, M., Espino, R., & García, L. (2011). An stated preference analysis of Spanish freight forwarders modal choice on the south-west Europe Motorway of the Sea. Transport Policy, 18(1), 60–67. http://doi.org/10.1016/j.tranpol.2010.05.009
Feo, M., García, L., Martínez-Zarzoso, I., & Pérez, E. (2003). Determinants of modal choice for freight transport: consequences for the developmentof short-sea shipping between Spain and Europe. In J. Olivella Puig, V. García Carcellé, & E. García Domingo (Eds.), Maritime Transport II: Maritime transport & Maritime history [Second International Conference on Maritime Transport and Maritime History]. Barcelona: Departament de Ciència i Enginyeria Nàutiques, Universitat Politècnica de Catalunya ; Museu Marítim.
Feo-Valero, M., García-Menéndez, L., & Garrido-Hidalgo, R. (2011). Valuing Freight Transport Time using Transport Demand Modelling: A Bibliographical Review. Transport Reviews, 31(5), 625–651. http://doi.org/10.1080/01441647.2011.564330
Fourgeaud, P. (2000). Measuring Port Performance. The World Bank.
Franc, P., & Van der Horst, M. (2010). Understanding hinterland service integration by shipping lines and terminal operators: a theoretical and empirical analysis. Special Issue on Comparative North American and European Gateway Logistics, 18(4), 557–566. http://doi.org/10.1016/j.jtrangeo.2010.03.004
Fusillo, M. (2006). Some notes on structure and stability in liner shipping. Maritime Policy & Management, 33(5), 463–475. http://doi.org/10.1080/03088830601020653

Appendix B
PhD. Thesis 171
Gallagher, M., & Crowley, J. A. (1988). Strategic flexibility in shipping: an examination of a sector of the short‐sea ferry market. Transport Reviews, 8(4), 317–329. http://doi.org/10.1080/01441648808716696
Garcia-Menendez, L., Feo-Valero, M., García-Menéndez, L., & Feo-Valero, M. (2009). European Common Transport Policy and Short-Sea Shipping: Empirical Evidence Based on Modal Choice Models. Transport Reviews, 29(2), 239–259. http://doi.org/10.1080/01441640802357192
García-Menéndez, L., Martínez-Zarzoso, I., & Pinero De Miguel, D. (2004). Determinants of mode choice between road and shipping for freight transport: Evidence for four Spanish exporting sectors. Journal of Transport Economics and Policy, 38(3), 447–466. Retrieved from http://www.jstor.org/stable/20173066
Generalitat de Catalunya - Direcció General de Transports i Mobilitat. (2014). Observatori de costos del transport discrecional de viatgers a Catalunya. Butlletí de Transports, 69 - abril.
Gese Aperte, X., & Baird, A. (2013). Motorways of the sea policy in Europe. Maritime Policy & Management, 40(1), 10–26. http://doi.org/10.1080/03088839.2012.705028
Ghiara, H., & Ne’Tori, G. S. (2013). ICTs as a mighty resource for cutting edge cities: case study – Genoa and its port. In WIT Transactions on Ecology and the Environment (Vol. 179 VOLUME, pp. 1013–1020). WITPress. http://doi.org/10.2495/SC130862
Google Maps. (2015). Google Maps. Retrieved August 1, 2015, from http://maps.google.com
Grande Navi Veloci. (2015). Services and tariffs. Retrieved May 20, 2015, from http://www.gnv.it/es
Grimaldi Lines. (2015). Services and tariffs. Retrieved May 20, 2015, from http://www.grimaldi-lines.com/
Grosso, M., Lynce, A.-R. A.-R., Silla, A., & Vaggelas, G. K. (2010). Short Sea Shipping, intermodality and parameters influencing pricing policies: The Mediterranean case. NETNOMICS: Economic Research and Electronic Networking, 11(1), 47–67. http://doi.org/10.1007/s11066-009-9039-0
Hancock, K. L. (2008). Freight Demand Modeling Tools for Public-Sector Decision Making Summary of A Conference. (N. Salomon & J. J. Weeks, Eds.)Transportation Research Board Conference Proceedings 40. Washington D.C.: TRB Publications Office.
Heckman, T. M. (1997). Harmonoise: Final Technical Report, (February), 1–42.
Henesey, L. (2006). Multi Agent Systems for Container Terminal Management. Blekinge Institute of Technology, Karlshamn, Sweden.
Henesey, L., & Törnquist, J. (2002). Enemy at the gates: introduction of multi-agents in a terminal information community. In Maritime Engineeering & Ports III (pp. 23–32). Ashurst (United Kingdom): WIT Press.
Henesey, L., Wernstedt, F., & Davidsson, P. (2003). Market-Driven Control in Container Terminal Management. In Proceedings of the 2nd International Conference on Computer
Roll on-roll off terminals and truck freight. Improving competitiveness in a Motorways of the Sea context
172 P. Morales-Fusco (2016)
Applications and Information Technology in the Maritime Industry (COMPIT) (pp. 377–386). Wedel, Germany.
Hensher, D. A. (1994). Stated Preference Analysis of Travel Choices - the State of Practice. Transportation, 21(2), 107–133. http://doi.org/10.1007/BF01098788
Higginson, J. K., Dumitrascu, T., & Fleet, C. (2007). Great lakes short sea shipping and the domestic cargo-carrying fleet. Transportation Journal, 46(1), 38–50. Retrieved from http://www.jstor.org/stable/20713662
Hjelle, H. M. (2010). Short Sea Shipping’s Green Label at Risk. Transport Reviews, 30(5), 617–640. http://doi.org/10.1080/01441640903289849
Hjelle, H. M. (2014). Atmospheric Emissions of Short Sea Shipping Compared to Road Transport Through the Peaks and Troughs of Short-Term Market Cycles. Transport Reviews, 34(3), 379–395. http://doi.org/10.1080/01441647.2014.905649
Hjelle, H. M., & Fridell, E. (2010). When is Short Sea Shipping enviromentally competitive? In IAME Proceedings. July. Lisbon, Portugal.
Holmgren, J., Nikopoulou, Z., Ramstedt, L., & Woxenius, J. (2014). Modelling modal choice effects of regulation on low-sulphur marine fuels in Northern Europe. Transportation Research Part D: Transport and Environment, 28(2014), 62–73. http://doi.org/10.1016/j.trd.2013.12.009
Huggins, D. (2009). Panorama of Transport, 2009 edition. (E.-T. S. Unit, Ed.). Luxembourg: Office for Official Publications of the European Communities. http://doi.org/10.2785/28475
Huynh, N. N., & Walton, C. M. (2005). Methodologies for Reducing Truck Turn Time at Marine Container Terminals. University of Texas, Austin; Southwest Region University Transportation Center.
INEA. (2016). CEF Transport - Motorways of the Sea. Retrieved March 1, 2016, from https://ec.europa.eu/inea/en/connecting-europe-facility/cef-transport/cef-transport-motorways-sea#2015 CALL
Jang, H.-M., Marlow, P. B., & Kim, S. Y. (2010). Customer loyalty and logistics service performance in maritime transport: a literature review and conceptual model. In IAME Proceedings, July. Lisbon, Portugal.
Jansson, J. O., & Shneerson, D. (1987). Liner shipping economics. Springer Netherlands. http://doi.org/10.1007/978-94-009-3147-3
Jovanonić, S., Olivella, J., & Radmilović, Z. (2003). Ro-Ro Ship Turnaround Time in Port. In J. Olivella, V. García Carcellé, & E. García Domingo (Eds.), 2nd International Conference Maritime Transport (Vol. Barcelona, pp. 151–164). Barcelona.
Juste, N., & Ghiara, H. (2015). ICT Policies in Mediterranean motorways of the sea. International Journal of Transport Economics, 42(2), 191–209. http://doi.org/10.1400/234301
Appendix B
PhD. Thesis 173
Jüttner, U., Peck, H., & Christopher, M. (2003). Supply chain risk management: outlining an agenda for future research. International Journal of Logistics: Research & Applications, 6(4), 197–210. http://doi.org/10.1080/13675560310001627016
Kapros, S., & Panou, C. (2007). Chapter 10 Coastal Shipping and Intermodality in Greece: The Weak Link. Maritime Transport: The Greek Paradigm, 21, 323–342. http://doi.org/DOI: 10.1016/S0739-8859(07)21010-8
Kent, P. E., & Ashar, A. (2010). Port performance indicators for concession contracts and regulation: the Colombian case. In IAME Proceedings, July. Lisbon, Portugal.
Kouvelis, P., Chambers, C., & Wang, H. (2006). Supply Chain Management Research and Production and Operations Management: Review, Trends, and Opportunities. Production and Operations Management, 15(3), 449–469. http://doi.org/- 10.1111/j.1937-5956.2006.tb00257.x
Kozan, E., & Preston, P. (2006). Mathematical modelling of container transfers and storage locations at seaport terminals. OR Spectrum, 28(4), 519–537. http://doi.org/10.1007/s00291-006-0048-1
Lee, J. W., & Kang, S.-H. (2004). The strategies and development plans on short sea shipping system for EU/USA. Korean Journal of Logistics, 12(1).
Lee, J. W., & Lee, S.-H. (2007). An overview of yellow sea transportation system. In 9th International Conference on Fast Sea Transportation, FAST 2007 (pp. 1–17). Dept. of Naval Architecture and Ocean Engineering, Inha University, South Korea.
León, A., & Romero, R. (2003). Logística del transporte marítimo (Vol. 1). Barcelona (Spain): Logis Book.
Livanos, G. A., Theotokatos, G., & Pagonis, D.-N. (2014). Techno-economic investigation of alternative propulsion plants for Ferries and RoRo ships. Energy Conversion and Management, 79, 640–651. http://doi.org/10.1016/j.enconman.2013.12.050
López Piñeiro, A., Pérez Arribas, F., Díaz Cuadra, J. C., Martín Almendro, C., & González Sánchez, V. (2005). Simulación del flujo de personas y vehículos en buques de pasaje. El proyecto SIFBUP. Ingeniería Naval (Madrid), 74(829), 93–104.
López-Navarro, M. Á. (2013a). The Effect of Shared Planning by Road Transport Firms and Shipping Companies on Performance in the Intermodal Transport Chain: the Case of Ro-Ro Short Sea Shipping. European Journal of Transport and Infrastructure Research, 13(1), 39–55.
López-Navarro, M. Á. (2013b). Unaccompanied transport as a strategy for international road hauliers in Ro-Ro short sea shipping. Maritime Economics and Logistics, 15(3), 374–394. http://doi.org/10.1057/mel.2013.10
López-Navarro, M. Á. (2014). Environmental Factors and Intermodal Freight Transportation: Analysis of the Decision Bases in the Case of Spanish Motorways of the Sea. Sustainability, 6(3), 1544–1566. http://doi.org/10.3390/su6031544
Roll on-roll off terminals and truck freight. Improving competitiveness in a Motorways of the Sea context
174 P. Morales-Fusco (2016)
López-Navarro, M. Á., Moliner-Tena, M. A., & Rodriguez-Artola, R. M. (2011). Long-term orientation of international road transport firms in their relationship with shipping companies: The case of short sea shipping. Transportation Journal, 50(4), 346–369. http://doi.org/10.5325/transportationj.50.4.0346
Lu, C.-S. (2003). The impact of carrier service attributes on shipper–carrier partnering relationships: a shipper’s perspective. Transportation Research Part E: Logistics and Transportation Review, 39(5), 399–415. http://doi.org/DOI: 10.1016/S1366-5545(03)00015-2
Manuj, I., & Mentzer, J. T. (2008). Global supply chain risk management. Journal of Business Logistics, 29(1), 133–155. http://doi.org/10.1108/09600030810866986
Marlow, P., & Nair, R. (2008). Service contracts-An instrument of international logistics supply chain: Under United States and European Union regulatory frameworks. Marine Policy, 32(3), 489–496. http://doi.org/10.1016/j.marpol.2007.09.009
Martínez-López, A., Caamaño Sobrino, P., & Castro Santos, L. (2015). Definition of optimal fleets for Sea Motorways: the case of France and Spain on the Atlantic coast. International Journal of Shipping and Transport Logistics, 7(1), 89–113. http://doi.org/10.1504/IJSTL.2015.065898
Martinez-Lopez, A., Kronbak, J., Jiang, L., Martínez-López, A., Kronbak, J., & Jiang, L. (2015). Cost and time models for road haulage and intermodal transport using Short Sea Shipping in the North Sea Region. International Journal of Shipping and Transport Logistics, 7(4), 494–520. http://doi.org/10.1504/IJSTL.2015.069692
Marzano, V., Aponte, D., Simonelli, F., & Papola, A. (2009). Methodology for Appraisal of Competitiveness of RoRo Services: Case of Italy-Spain Intermodal Corridor. In 88th TRB annual Meeting. Washington D.C.
Mathonnet, C. (2000). Le project IQ « Intermodal Quality » une Nouvelle Approche de la Qualité pour les Terminaux Intermodaux. Transports, 400, 108–116.
McKinnon, A. C. (2007). Decoupling of Road Freight Transport and Economic Growth Trends in the UK: An Exploratory Analysis. Transport Reviews, 27(1), 37–64. http://doi.org/10.1080/01441640600825952
Medda, F., & Trujillo, L. (2010). Short-sea shipping: an analysis of its determinants. Maritime Policy & Management, 37(3), 285–303. http://doi.org/10.1080/03088831003700678
Meersman, H., Van de Voorde, E., & Vanelslander, T. (2002). Port pricing issues. Considerations on Economic Principles, Competition and Wishful Thinking. IMPRINT-EUROPE Implementing Reform in Transport. University of Antwerp.
Midoro, R., Musso, E., & Parola, F. (2005). Maritime liner shipping and the stevedoring industry: market structure and competition strategies. Maritime Policy & Management, 32(2), 89–106. http://doi.org/10.1080/03088830500083521
Ministerio de Fomento - Dirección General de Transporte Terrestre. (2014). Observatorio de costes del transporte de mercancías por carretera - Octubre 2014.
Appendix B
PhD. Thesis 175
Moura, D. A., Botter, R. C., & Medina, A. C. (2008). Diagnosis of Brazilian short-sea shipping and its main obstacles. In P. Soares, CG and Kolev (Ed.), Maritime industry, ocean engineering and coastal resources (Vol. 1–2, pp. 583–592). London, England: Taylor & Francis Limited.
Murphy, P. R., Daley, J. M., & Hall, P. K. (1997). Carrier selection: Do shippers and carriers agree, or not? Transportation Research Part E: Logistics and Transportation Review, 33(1), 67–72. http://doi.org/10.1016/S1366-5545(96)00003-8
Murty, K. G., Liu, J., Wan, Y.-W., & Linn, R. (2005). A decision support system for operations in a container terminal. Decision Support Systems, 39(3), 309–332. Retrieved from http://dx.doi.org/10.1016/j.dss.2003.11.002
Nam, K.-C. (1997). A study on the estimation and aggregation of disaggregate models of mode choice for freight transport. Transportation Research Part E: Logistics and Transportation Review, 33(3), 223–231. http://doi.org/DOI: 10.1016/S1366-5545(97)00011-2
National Cooperative Highway Research Program. (2008). Report 606: Forecasting Statewide Freight Toolkits. Washington D.C.
Nedeß, C., Friedewald, A., Wagner, L., & and Neumann, L. (2006). Risk management in maritime transportation networks. In W. Kersten & T. Blecker (Eds.), Managing Risks in Supply Chains: How to Build Reliable Collaboration in Logistics (pp. 239–252). Berlin (Germany): Erich Schmidt Verlag.
Ng, A. K. Y. (2009). Competitiveness of short sea shipping and the role of port: the case of North Europe. Maritime Policy & Management, 36(4), 337–352. http://doi.org/10.1080/03088830903056983
Oxford Economics. (2014). The economic value of the EU shipping industry. A report for the European Community Shipowners’ Associations. ECSA.
Paixão, A. C. (2008). Motorway of the sea port requirements: the viewpoint of port authorities. International Journal of Logistics Research and Applications, 11(4), 279–294. http://doi.org/10.1080/13675560801912254
Paixão Casaca, A. C. (2014). European short sea shipping policy issues. In J. Xu (Ed.), Contemporary Marine and Maritime Policy (pp. 229–270). Hauppauge, NY, United States of America: Nova Science Publishers, Inc.
Paixão Casaca, A. C., & Marlow, P. B. (2005). The competitiveness of short sea shipping in multimodal logistics supply chains: Service attributes. Maritime Policy and Management, 32(4), 363–382. http://doi.org/10.1080/03088830500301469
Paixão Casaca, A. C., & Marlow, P. B. (2009). Logistics strategies for short sea shipping operating as part of multimodal transport chains. Maritime Policy & Management, 36(1), 1–19. http://doi.org/10.1080/03088830802652254
Paixão Casaca, A., & Marlow, P. B. (2002). Strengths and weaknesses of short sea shipping. Marine Policy, 26(3), 167–178. http://doi.org/10.1016/S0308-597X(01)00047-1
Roll on-roll off terminals and truck freight. Improving competitiveness in a Motorways of the Sea context
176 P. Morales-Fusco (2016)
Pallis, A. A., & de Langen, P. W. (2010). Seaports and the structural implications of the economic crisis. The Port and Maritime Industries in the Post-2008 World: Challenges and Opportunities, 27(1), 10–18. http://doi.org/DOI: 10.1016/j.retrec.2009.12.003
Pang, K.-W., & Liu, J. (2014). An integrated model for ship routing with transshipment and berth allocation. IIE Transactions, 46(12), 1357–1370. http://doi.org/10.1080/0740817X.2014.889334
Parola, F., & Sciomachen, A. (2009). Modal split evaluation of a maritime container terminal. Maritime Economics & Logistics, 11(1), 77–97. http://doi.org/10.1057/mel.2008.22
Paulauskas, V., & Bentzen, K. (2008). Sea motorways as a part of the logistics chain. Transport, 23(3), 202–207. http://doi.org/10.3846/1648-4142.2008.23.202-207
Peeters, C., Verbeke, A., Declercq, E., & Wijnolst, N. (1995). Chapter I. Identification and analysis of existing intra-European traffic for each relevant category of goods and transport corridor. In Analysis of the competitive position of short sea shipping. Development of policy measures. The corridor study. (pp. 1–62). Delft, The Netherlands: Delft University Press.
Perakis, A. N., & Denisis, A. (2008). A survey of short sea shipping and its prospects in the USA. Maritime Policy & Management, 35(6), 591–614. http://doi.org/10.1080/03088830802469501
Pérez-Mesa, J. C., Céspedes-Lorente, J. J., & Andújar, J. A. S. (2010). Feasibility Study for a Motorway of the Sea (MoS) between Spain and France: Application to the Transportation of Perishable Cargo. Transport Reviews, 30(4), 451–471. http://doi.org/10.1080/01441640903083705
Pérez-Mesa, J. C., Galdeano-Gómez, E., & Salinas Andújar, J. A. (2012). Logistics network and externalities for short sea transport: An analysis of horticultural exports from southeast Spain. Transport Policy, 24, 188–198. http://doi.org/10.1016/j.tranpol.2012.08.010
Pettit, T. J., Fiksel, J., & Croxton, K. L. (2010). Ensuring Supply Chain Resilience: Development of a Conceptual Framework. Journal of Business Logistics, 31(1), 1–21. http://doi.org/10.1002/j.2158-1592.2010.tb00125.x
Ponomarov, S. Y., & Holcomb, M. C. (2009). Understanding the concept of supply chain resilience. International Journal of Logistics Management, 20(1), 124–143. http://doi.org/10.1108/09574090910954873 ER
Productivity Comission, C. of A. (1998). International Benchmarking of the Australian Waterfront. Canberra, Australia: AusInfo.
Puckett, S. M., Hensher, D. A., Brooks, M. R., & Trifts, V. (2011). Preferences for alternative short sea shipping opportunities. Transportation Research Part E: Logistics and Transportation Review, 47(2), 182–189. http://doi.org/10.1016/j.tre.2010.10.002
Ramsey, F. P. (1927). A contribution to the theory of taxation. The Economic Journal, 37(145), 47–61.
Appendix B
PhD. Thesis 177
Rao, S., & Goldsby, T. J. (2009). Supply chain risks: a review and typology. International Journal of Logistics Management, 20(1), 97–123. http://doi.org/10.1108/09574090910954864 ER
Regan, a. C., & Garrido, R. a. (2001). Modeling Freight Demand and Shipper Behavior: State of the Art, Future Directions. Travel Behaviour research–The Leading Edge.
Ritchie, B., & Marshall, D. (1993). Business Risk Management (Vol. 1st). London: Chapman & Hall.
Robinson, J. (1969). The Economics of Imperfect Competition (2nd ed.). Palgrave Macmillan.
Rodriguez Nuevo, M., de Oses, F. X., & Castells, M. L. A. (2010). Proposal of a Costs Simulator, for Traffics between Spain and the Black Sea. In Advances in maritime and naval science engineering (pp. 34–38). Zographou (Athens), Greece: World Scientific and Engineering Academia and Society.
Runko Luttenberger, L., Ancic, I., & Sestan, A. (2013). The Viability of Short-Sea Shipping in Croatia. Brodogradnja, 64(4), 472–481.
Russo, F., & Chilà, G. (2007). the High Speed Potentiality in the Motorway of the Sea : a Modal Choice Model. In 11th World Conference on Transport Research. Berkeley, CA, USA, CA, USA.
Russo, F., & Musolino, G. (2013). Estimating demand variables of maritime container transport: An aggregate procedure for the Mediterranean area. Research in Transportation Economics, 42(1), 38–49. http://doi.org/10.1016/j.retrec.2012.11.008
Saurí, S., & Spuch, B. (2010). Economies of scale of ro-pax vessels in regular shipping lines. In IAME Proceedings, July. Lisbon, Portugal.
Sheffi, Y., & Rice, J. B. (2005). A supply chain view of the resilient enterprise. Mit Sloan Management Review, 47(1), 41–48.
Shinghal, N., & Fowkes, T. (2002). Freight mode choice and adaptive stated preferences. Transportation Research Part E: Logistics and Transportation Review, 38(5), 367–378. http://doi.org/DOI: 10.1016/S1366-5545(02)00012-1
Simchi-Levi, D., Kaminsky, P., & Simchi-Levi, E. (2008). Designing and Managing the Supply Chain . New York: McGraw-Hill/Irwin.
Solsona, M. (2015). Impacte econòmic de la implantació de l’Eurovinyeta sobre el transport per carretera als estats perifèrics de la Unió Europea [Economic Impact from implanting the eurovignette on road transportation at peripherial EU state members]. Universitat Politecnica de Catalunya.
Spanish Short Sea Shipping Promotion Centre. (2015). Transportchain simulator. Retrieved November 1, 2015, from http://simulador.shortsea.es/.
SPC-SPAIN. (2014). Observatorio Estadístico del Transporte Marítimo de Corta Distancia en España. Madrid (Spain). Retrieved from http://www.shortsea.es/images/PDF/observatorioestadisticoju2014.pdf
Roll on-roll off terminals and truck freight. Improving competitiveness in a Motorways of the Sea context
178 P. Morales-Fusco (2016)
Styhre, L. (2009). Strategies for capacity utilisation in short sea shipping. Maritime Economics & Logistics, 11(4), 418–437. http://doi.org/http://dx.doi.org/10.1057/mel.2009.11
Tang, C. S. (2006). Perspectives in supply chain risk management. International Journal of Production Economics, 103(2), 451–488. http://doi.org/10.1016/j.ijpe.2005.12.006
Tavasszy, L., & Inro, T. N. O. (2006). Freight Modelling. In K. L. Hancock (Ed.), Freight Demand Modeling. Tools for Public-Sector Decision Making. Transportation Research Board Conference Proceedings 40 (pp. 47–55). Washingtion DC: Transportation Research Board of the National Academies.
Tenekecioglu, G. (2005). Increasing intermodal transportation in Europe through realizing the value of short sea shipping. Massachusets Institute of Technology, Cambridge.
Tirole, J. (1988). Price Discrimination. In The Theory of Industrial Organization (pp. 133–168). Massachussets Institute of Technology.
Tomlin, B. (2006). On the Value of Mitigation and Contingency Strategies for Managing Supply Chain Disruption Risks. Management Science, 52(5), 639–657. http://doi.org/10.1287/mnsc.1060.0515
Tsamboulas, D., Chiappetta, A., Moraiti, P., & Karousos, I. (2015). Could Subsidies for Maritime Freight Transportation Achieve Social and Environmental Benefits? Transportation Research Record: Journal of the Transportation Research Board, 2479(2479), 78–85. http://doi.org/10.3141/2479-10
Tsamboulas, D., Lekka, A. M., & Rentziou, A. (2013). Development of a Motorways of the Sea Multicountry Transportation Network Methodology and Application in the Adriatic Sea. Transportation Research Record, (2330), 9–15. http://doi.org/10.3141/2330-02
Tsamboulas, D., & Moraiti, P. (2013). Decision Support Tool for Motorways of the Sea Intermodal Corridor. Transportation Research Record: Journal of the Transportation Research Board, (2330), 1–8. http://doi.org/10.3141/2330-01
Tsamboulas, D., Moraiti, P., & Vlahogianni, E. (2010). Assessing the Effect of Infrastructure and Service Attributes on the “ Motorways of the Sea ” Realization. In Transportation Research Record (Vol. 2166, pp. 90–98). http://doi.org/10.3141/2166-11
Tzannatos, E. S. (2005). Technical reliability of the Greek coastal passenger fleet. Marine Policy, 29(1), 85–92. http://doi.org/DOI: 10.1016/j.marpol.2004.04.001
UNCTAD. (1985). Port Development: A Handbok for Planners in Developing Countries. Geneva, Switzerland: United Nations Conference on Trade and Development.
UNCTAD. (2006). Review of Maritime Transport, 2006. Review of Maritime Transport. Geneva, Switzerland: United Nations Conference on Trade and Development; United Nations Publications.
UNCTAD. (2013). Recent developments and trends in international martime transport affecting trade of developing countries. Geneva, Switzerland: United Nations Conference on Trade and Development; United Nations Publications.
Appendix B
PhD. Thesis 179
Usabiaga Santamaria, J. J. (2010). A European Ecobono. Addressing the need of a joint solution for the European Transport System. In C. Panait, C and Barsan, E and Bulucea, A and Mastorakis, N and Long (Ed.), Advances in maritime and naval science engineering (pp. 172–177). Athens, Greece: World Scientific and Engineering Acad. and Soc.
Usabiaga Santamaria, J. J., de Oses, X. F., & Castells Sanabra, M. (2012). Assessment for future ECA adoption in the Mediterranean area (Short Sea Shipping vs Road Transport). In O. Cokorilo (Ed.), Procidings of Itnernational Concference on Traffic and Transport Engineering (ICTTE) (pp. 383–390). Belgrade, Serbia: Scientific Research Centre.
Venables, W. N., & Ripley, B. D. (2002). Modern applied statistics with S (4th ed.). Springer.
Wadsworth, E. J. K., Allen, P. H., McNamara, R. L., & Smith, A. P. (2008). Fatigue and health in a seafaring population. Occupational Medicine (Oxford, England), 58(3), 198–204. http://doi.org/10.1093/occmed/kqn008
Wardman, M. (2001). A review of British evidence on time and service quality valuations. Advances in the Valuation of Travel Time Savings, 37(2-3), 107–128. http://doi.org/DOI: 10.1016/S1366-5545(00)00012-0
Willingale, M. C. (1981). The port-routeing behaviour of short-sea ship operators; theory and practice. Maritime Policy and Management, 8(2), 109–120. http://doi.org/10.1080/03088838100000032
Winston, C. (1983). The demand for freight transportation: models and applications. Transportation Research Part A: General, 17(6), 419–427. http://doi.org/10.1016/0191-2607(83)90162-0
Woxenius, J. (2012). Flexibility vs. specialisation in ro-ro shipping in the South Baltic Sea. TRANSPORT, 27(3), 250–262. http://doi.org/10.3846/16484142.2012.719544
Zhaomin Zhang, N. (2006). Motorways of the Sea, Modernising European short sea shipping links. Brussels: European Communities.

Roll on-roll off terminals and truck freight. Improving competitiveness in a Motorways of the Sea context
180 P. Morales-Fusco (2016)
Related Documents