Robust Recognition of Emotion from Speech Mohammed E. Hoque Mohammed Yeasin Max M. Louwerse {mhoque, myeasin, mlouwerse}@memphis.edu Institute for Intelligent Systems University of Memphis

Robust Recognition of Emotion from Speech Mohammed E. Hoque Mohammed Yeasin Max M. Louwerse {mhoque, myeasin, mlouwerse}@memphis.edu Institute for Intelligent.
Dec 24, 2015
Welcome message from author
This document is posted to help you gain knowledge. Please leave a comment to let me know what you think about it! Share it to your friends and learn new things together.
Transcript
Robust Recognition of Emotion from Speech
Mohammed E. HoqueMohammed YeasinMax M. Louwerse
{mhoque, myeasin, mlouwerse}@memphis.eduInstitute for Intelligent Systems
University of Memphis
Presentation Overview
MotivationMethodsDatabaseResultsConclusion
Motivations
Animated agents to recognize emotion in e-Learning environment.
Agents need to be sensitive and adaptive to learners’ emotion.
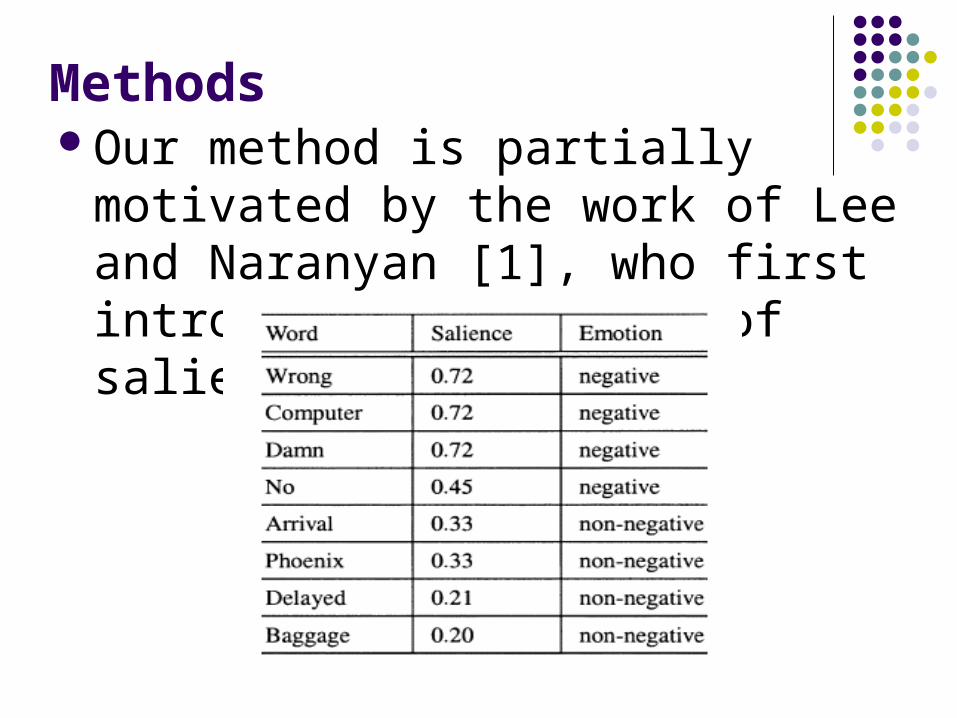
MethodsOur method is partially motivated by the
work of Lee and Naranyan [1], who first introduced the notion of salient words.
Shortcomings of Lee and Narayan’s work
Lee et al. argued that there is one-to-one correspondence between a word and a positive or negative emotion.
This is NOT true for every case.

Examples
Confusion Flow
Delight Normal
Figure 1: Pictorial depiction of the word “okay” uttered with different intonations to express different emotions.
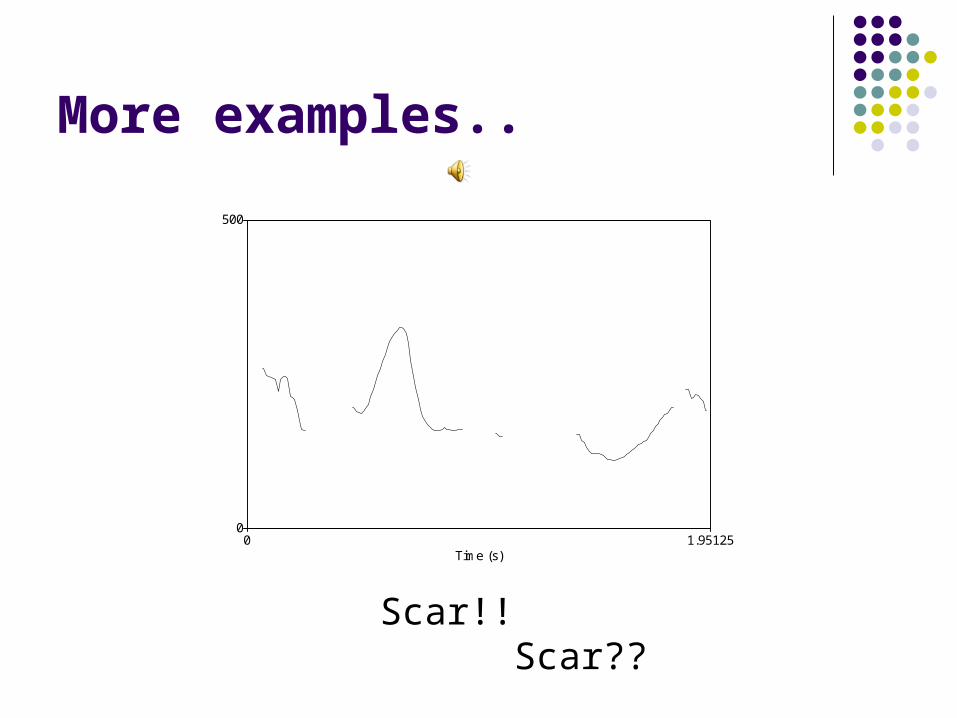
More examples..
Time (s)0 1.95125
0
500
Scar!! Scar??
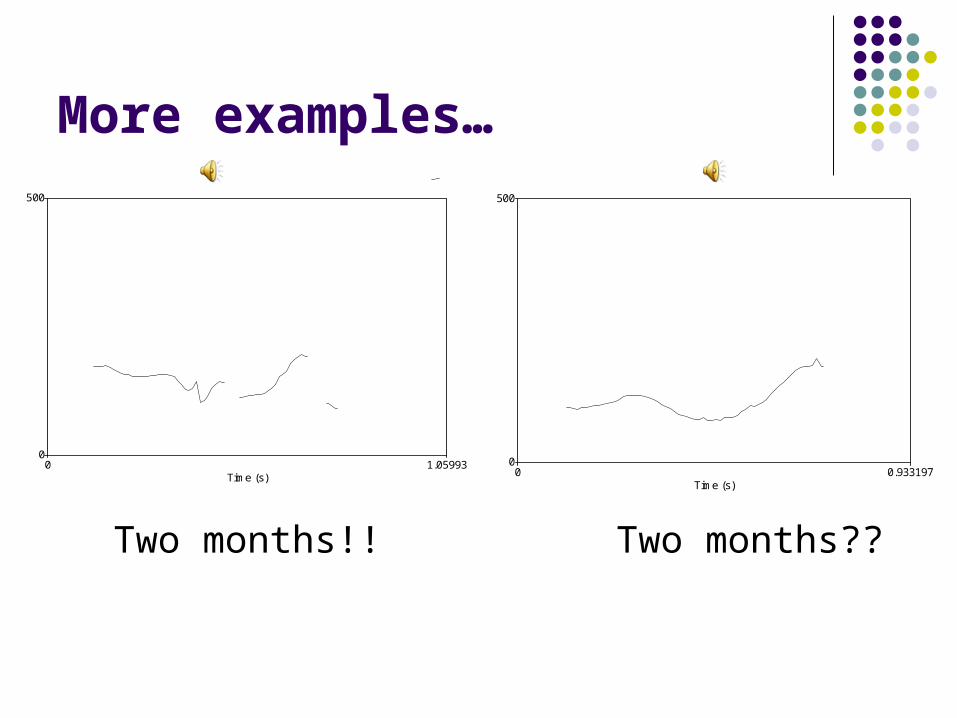
More examples…
Time (s)0 1.05993
0
500
Time (s)0 0.933197
0
500
Two months!! Two months??
Our Hypothesis
Lexical information extracted from combined prosodic and acoustic features that correspond to intonation pattern of “salient words” will yield robust recognition of emotion from speech.
It also provides a framework for signal level analysis of speech for emotion.
Creation of Database
Details on the Database
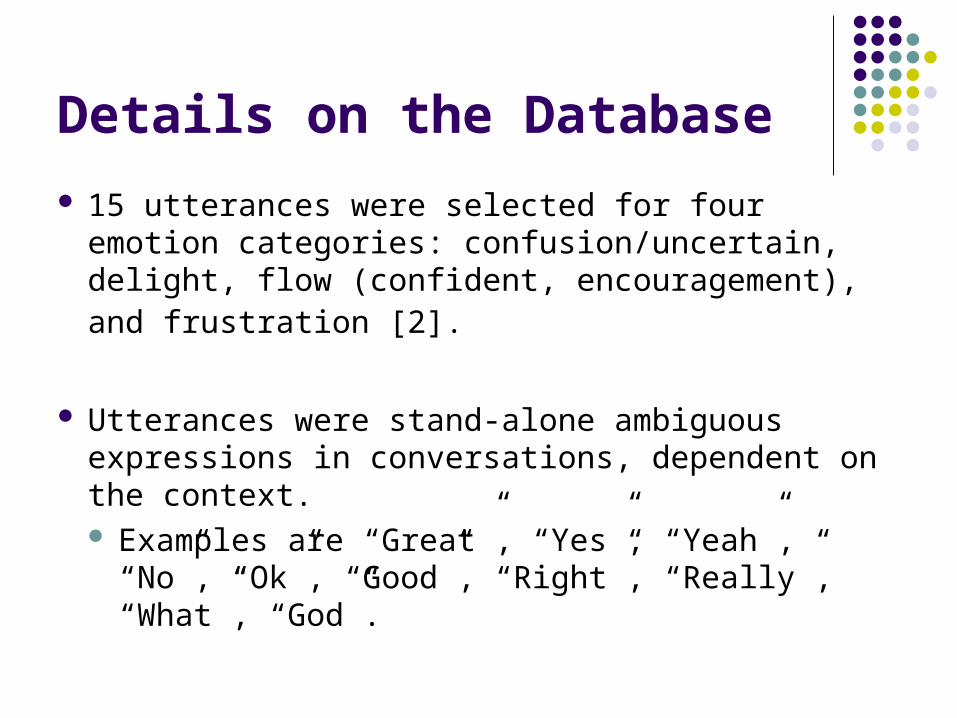
15 utterances were selected for four emotion categories: confusion/uncertain, delight, flow (confident, encouragement), and frustration [2].
Utterances were stand-alone ambiguous expressions in conversations, dependent on the context. Examples are “Great”, “Yes”, “Yeah”, “No”, “Ok”,
“Good”, “Right”, “Really”, “What”, “God”.
Three graduate students listened to the audio clips.
They successfully distinguished between the positive and negative emotions 65% of the time.
No specific instructions were given as to what intonation patterns to listen to.
Details on the Database…
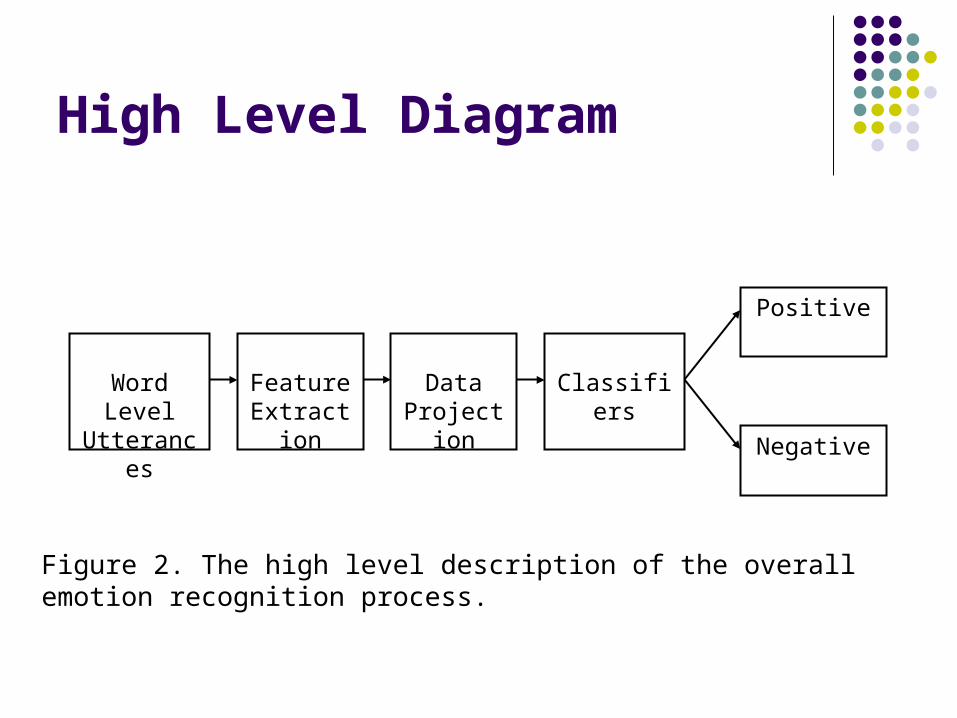
High Level Diagram
Feature Extraction
Word Level Utterances
Classifiers
Positive
Data Projection
Negative
Figure 2. The high level description of the overall emotion recognition process.

Hierarchical Classifiers
Emotion
NegativePositive
Confusion FrustrationDelight Flow
Figure 3. The design of the hierarchical binary classifiers.
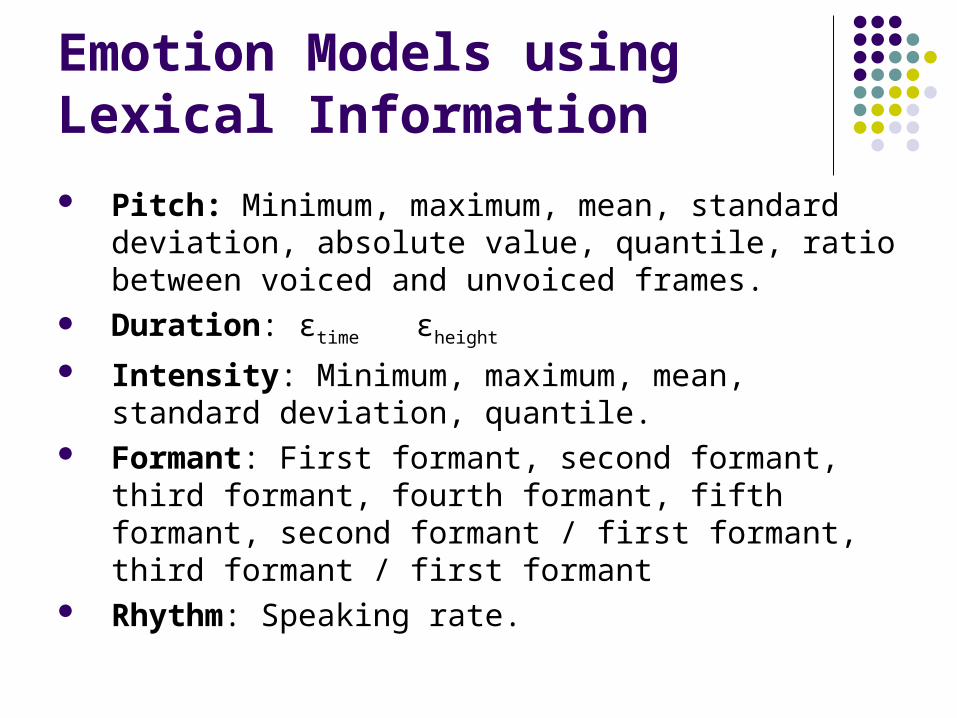
Emotion Models using Lexical Information
Pitch: Minimum, maximum, mean, standard deviation, absolute value, quantile, ratio between voiced and unvoiced frames.
Duration: εtime εheight Intensity: Minimum, maximum, mean, standard
deviation, quantile. Formant: First formant, second formant, third formant,
fourth formant, fifth formant, second formant / first formant, third formant / first formant
Rhythm: Speaking rate.
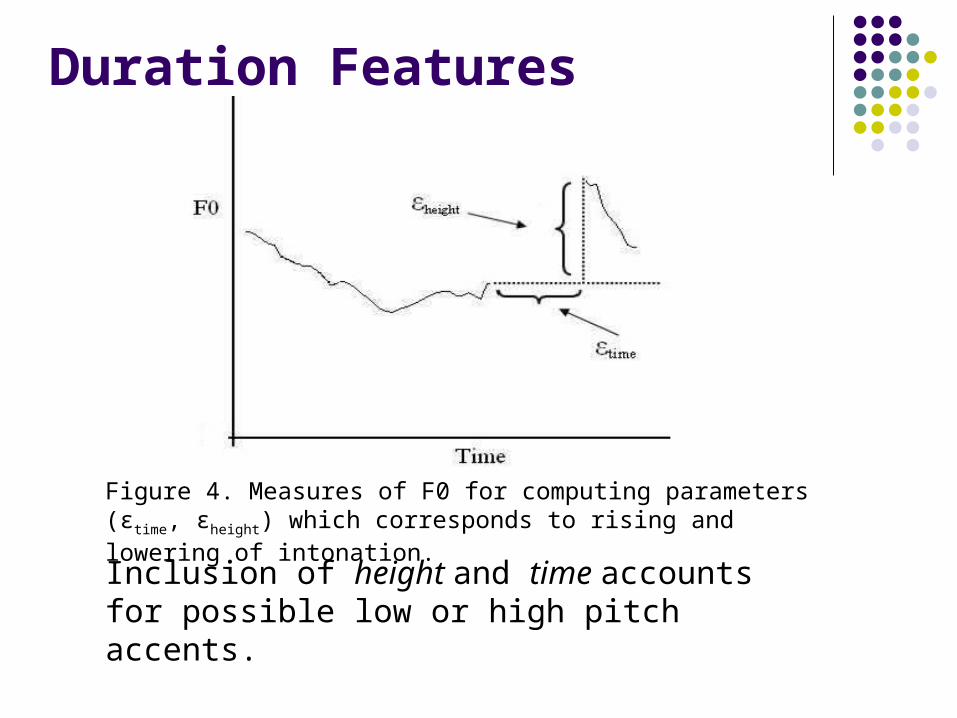
Duration Features
Figure 4. Measures of F0 for computing parameters (εtime, εheight) which corresponds to rising and lowering of intonation.
Inclusion of height and time accounts for possible low or high pitch accents.

Types of Classifiers
Rules Trees Meta Functions Bayes
Part RandomForrest AdaBoostM1 Logistic Naïve Bayes
NNge J48 Bagging Multi-layer Perceptron
Naïve Bayes Simple
Ridor Logistic Model Tree
Classification via Regression
RBF Network Naïve Bayes Updateable
- - LogitBoost Simple Logistics -
- - Multi Class Classifier
SMO -
- - Ordinal Class Classifier
- -
- - Threshold Selector
- -
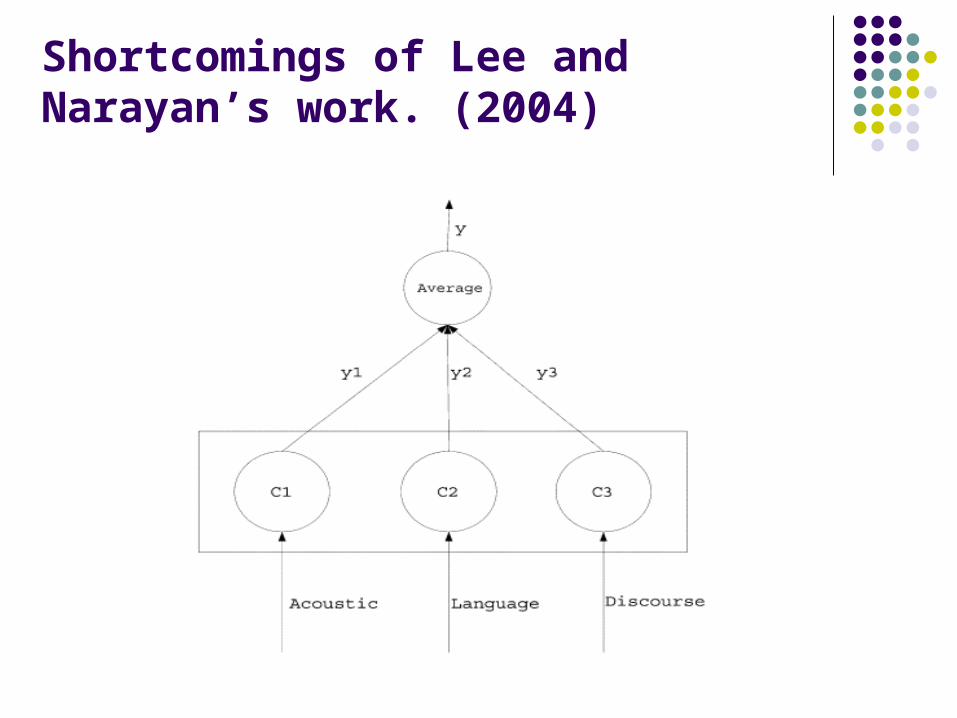
Shortcomings of Lee and Narayan’s work. (2004)
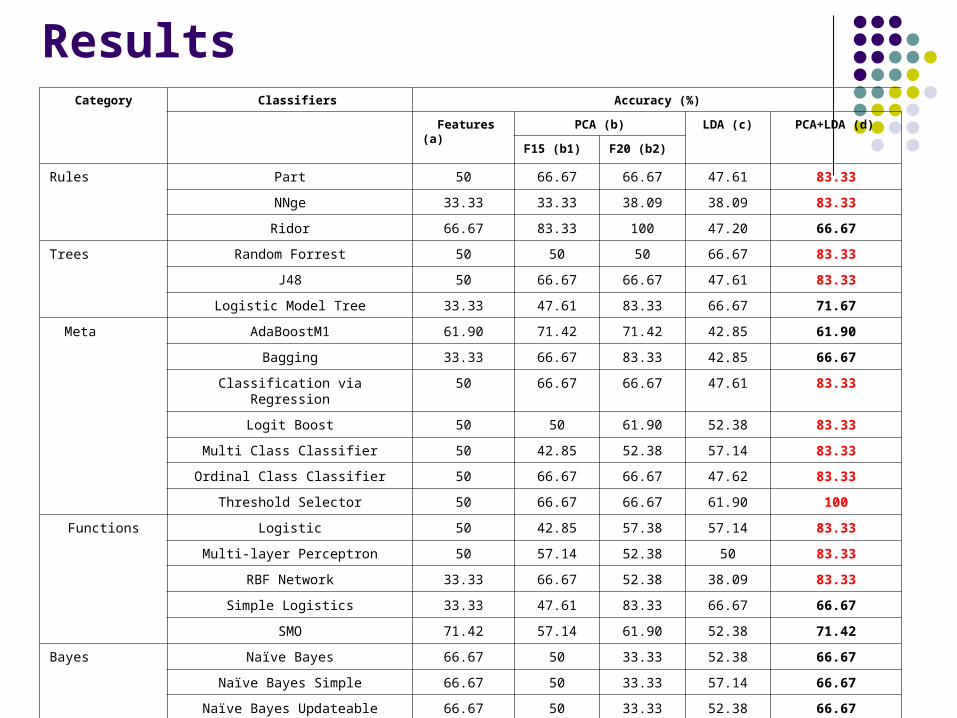
ResultsCategory Classifiers Accuracy (%)
Features (a) PCA (b) LDA (c) PCA+LDA (d)
F15 (b1) F20 (b2)
Rules Part 50 66.67 66.67 47.61 83.33
NNge 33.33 33.33 38.09 38.09 83.33
Ridor 66.67 83.33 100 47.20 66.67
Trees Random Forrest 50 50 50 66.67 83.33
J48 50 66.67 66.67 47.61 83.33
Logistic Model Tree 33.33 47.61 83.33 66.67 71.67
Meta AdaBoostM1 61.90 71.42 71.42 42.85 61.90
Bagging 33.33 66.67 83.33 42.85 66.67
Classification via Regression 50 66.67 66.67 47.61 83.33
Logit Boost 50 50 61.90 52.38 83.33
Multi Class Classifier 50 42.85 52.38 57.14 83.33
Ordinal Class Classifier 50 66.67 66.67 47.62 83.33
Threshold Selector 50 66.67 66.67 61.90 100
Functions Logistic 50 42.85 57.38 57.14 83.33
Multi-layer Perceptron 50 57.14 52.38 50 83.33
RBF Network 33.33 66.67 52.38 38.09 83.33
Simple Logistics 33.33 47.61 83.33 66.67 66.67
SMO 71.42 57.14 61.90 52.38 71.42
Bayes Naïve Bayes 66.67 50 33.33 52.38 66.67
Naïve Bayes Simple 66.67 50 33.33 57.14 66.67
Naïve Bayes Updateable 66.67 50 33.33 52.38 66.67

Summary of Results
Models Average Accuracy
Base Features 50.79 %
PCA (15) 57.1 %
PCA (20) 61 %
LDA 52.01 %
PCA (15) + LDA 83.33 %

21 CLASSIFIERS ON POSITIVE AND NEGATIVE EMOTIONS.
Category Classifiers Accuracy (%)
Delight + Flow Confusion + Frustration
Rules Part 72.72 100
NNge 80 100
Ridor 66.67 100
Trees RandomForrest 63.63 66.67
J48 72.72 100
LMT 72.72 100
Meta AdaBoostM1 54.44 100
Bagging 63.64 66.67
Classification via Regression 72.72 100
LogitBoost 63.64 100
Multi Class Classifier 72.72 100
Ordinal Class Classifier 72.72 100
Threshold Selector 83.33 100
Functions Logistic 72.72 100
Multi-layer Perceptron 66.67 100
RBF Network 66.67 100
Simple Logistics 72.72 100
SMO 72.72 100
Bayes Naïve Bayes 72.72 100
Naïve Bayes Simple 72.72 100
Native Bayes Updateable 72.72 100
Limitations and Future work
Algorithm Feature Selection Discourse Information Future efforts will include fusion of video and
audio data in a signal level framework. Database
Clipping arbitrary words from a conversation may be ineffective at various cases.
May need to look words in a sequence.

Acknowledgments
This research was partially supported by grant NSF-IIS-0416128 awarded to the third author. Any opinions, findings, and conclusions or recommendations expressed in this material are those of the authors and do not necessarily reflect the views of the funding institution.
Questions?
Related Documents