RIVM report 601501020/2004 Guidance for deriving Dutch Environmental Risk Limits from EU-Risk Assessment Reports of existing substances M.P.M. Janssen, T.P. Traas, J-P. Rila and P.L.A. van Vlaardingen This investigation has been performed by order and for the account of the Directorate- General for Environmental Protection, Directorate for Chemicals, Waste and Radiation, within the framework of project 601501, ‘Setting Integrated Environmental Quality Standards’. RIVM, P.O. Box 1, 3720 BA Bilthoven, telephone: 31 - 30 - 274 91 11; telefax: 31 - 30 - 274 29 71

Welcome message from author
This document is posted to help you gain knowledge. Please leave a comment to let me know what you think about it! Share it to your friends and learn new things together.
Transcript
RIVM report 601501020/2004
Guidance for deriving Dutch EnvironmentalRisk Limits from EU-Risk Assessment Reportsof existing substances
M.P.M. Janssen, T.P. Traas, J-P. Rila and P.L.A.van Vlaardingen
This investigation has been performed by order and for the account of the Directorate-General for Environmental Protection, Directorate for Chemicals, Waste and Radiation,within the framework of project 601501, ‘Setting Integrated Environmental QualityStandards’.
RIVM, P.O. Box 1, 3720 BA Bilthoven, telephone: 31 - 30 - 274 91 11; telefax: 31 - 30 - 274 29 71

RIVM report 601501020 page 2 of 35
Abstract
In this report the methodology is given for deriving Dutch environmental risk limits forsubstances for which EU risk assessment reports (EU-RARs) are available in the context ofthe Council regulation (EEC) no 793/93 on the evaluation and control of the risks of existingsubstances
Presented here are the minimum requirements for reporting the derivation of risk limits, alongwith an overview of proposed environmental risk limits based on EU-RAR results. Thisreport also documents the differences between the European ‘predicted no effectconcentrations’ (PNECs) and the Dutch environmental risk limits (MPCs), indicating howPNECs can be used to calculate these environmental risk limits.
RIVM report 601501020 page 3 of 35
PrefaceThis report is part of the project ‘Setting Integrated Environmental Quality Standards’(RIVM-project 601501). We want to acknowledge drs E.M. Maas (Ministry of Housing,Spatial Planning and the Environment), who is involved in the RIVM-project 601501 inwhich the work was performed.
The results as presented in this report have been discussed by the members of the ‘SettingIntegrated Environmental Quality Standards Advisory Group’ (OZBG-eco), who areacknowledged for their contribution. The advisory group provides a non-binding scientificcomment on the final draft of a report in order to advise the steering committee of the projectSetting Integrated Environmental Quality Standards (INS) on the scientific merits of thereport.
RIVM report 601501020 page 4 of 35
ContentsSamenvatting 5
Summary 6
1 Introduction 7
2 Background, comparison and methods proposed 9
2.1 Using EU-risk assessment reports 9
2.2 Comparison of the EU method and the INS method 9
2.3 Main differences summarised 152.3.1 Negligible concentration (NC) and Serious Risk Concentration (SRCECO) 152.3.2 Compartments 162.3.3 Intercompartmental harmonisation 162.3.4 Application of extrapolation factors 16
2.4 Methods proposed for deriving MPCs and NCs from PNECs 172.4.1 Estimation of the Kp and Kcompartment-water 172.4.2 PNECwater 192.4.3 PNECsoil 202.4.4 PNECsediment 212.4.5 Multiplication factors summarised 22
3 Reporting ERLs for EU-RAR compounds 24
4 Summary of MPCs for EU-RAR compounds 25
References 26
Appendix 1: Mailing list 28
Appendix 2: An example: Derivation of ERLs for nonylphenol 29
RIVM report 601501020 page 5 of 35
SamenvattingIn 1993 is in de Europese Unie de bestaande stoffen verordening (793/93) van krachtgeworden, waarin een samenhangend kader wordt gegeven voor de risico-evaluatie enbeheersing van bestaande chemische stoffen. De beginselen voor de beoordeling van derisico’s voor mens en milieu zijn vervolgens vastgesteld met Verordening (EG) nr. 1488/94en resulteerde in het zogenaamde Technical Guidance Document (TGD). Dit documentondersteunt tevens Richtlijn 93/67/EEG die betrekking heeft op nieuwe stoffen en Richtlijn98/8/EG die betrekking heeft op het op de markt brengen van biociden.
De resultaten van de risico-evaluaties voor bestaande (prioritaire) stoffen wordengepubliceerd in ‘risk assessment reports’ (EU-RARs). In de milieuparagraaf van deze zgn.rapporten worden milieurisico-grenzen afgeleid, die ‘predicted no effect concentrations’(PNEC) worden genoemd. Deze PNECs worden vergeleken met zogenaamde ‘PredictedEnvironmental Concentrations’ (PECs). Indien nodig kunnen er daarna maatregelen wordenvoorgesteld om de emissies van de betreffende stof te beperken.
De PNECs worden afgeleid aan de hand van een uitgebreid document, het zogenaamdeTechnical Guidance Document, op een manier die vergelijkbaar is met de afleiding van het inNederland gebruikte Maximum Toelaatbaar Risiconiveau (MTR). De Stuurgroep IntegraleNormstelling heeft hierop aangegeven PNEC-waarden te beschouwen als voldoende weten-schappelijke basis voor de onderbouwing van Nederlandse milieurisicogrenzen.
In dit rapport worden de verschillen tussen de afleiding van de Europese PNEC en hetNederlandse MTR op een rij gezet en worden voorstellen gedaan om deze verschillen teoverbruggen. Daarna wordt de wijze waarop de PNEC waarden worden vertaald inNederlandse milieurisicogrenzen nader belicht. De minimale eisen voor de verslagleggingworden gegeven en besloten wordt met een overzicht van reeds eerder voorgesteldemilieurisicogrenzen op basis van EU-RARs.
RIVM report 601501020 page 6 of 35
SummaryIn 1993 the Council of the European Communities adopted Council Regulation (EEC) 793/93or the Existing Substances Regulation (ESR), thereby introducing a comprehensiveframework for the evaluation and control of ‘existing’ chemical substances. The principlesfor the assessment of risks to man and the environment of existing substances were laid downin Commission Regulation (EC) No 1488/94 and resulted in the so-called TechnicalGuidance Document (TGD). This document also support Commission Directive 93/67/EECon risk assessment for new notified substances and Directive 98/8/EC of the EuropeanParliament and of the Council concerning the placing of biocidal products on the market.
The risk assessment results for existing substances are published in European Union RiskAssessment Reports (EU-RAR). The derivation of environmental risk limits forenvironmental compartments, called ‘predicted no effect concentrations’ (PNEC), takes placewithin the environmental section of a RAR. These PNEC values are compared with so-calledPredicted Environmental Concentrations (PECs) and, if necessary, measures to reduceemissions are also proposed. The derivation of a PNEC is comparable to that of the maximumpermissible concentration (MPC), the environmental risk limit used as an advisory valuewithin the Dutch national framework for setting environmental quality standards. TheSteering Committee (INS) has indicated that it considers PNECs as being sufficientlyscientifically based for deriving Dutch environmental risk limits.
Presented here are the minimum requirements for reporting, along with an overview ofproposed environmental risk limits based on EU-RAR results. This report also documents thedifferences between the European PNECs and the Dutch MPCs, indicating how PNECs canbe used to calculate environmental risk limits.
RIVM report 601501020 page 7 of 35
1 Introduction
In 1993 the Council of the European Communities adopted Council Regulation (EEC) 793/93or the Existing Substances Regulation (ESR), thereby introducing a comprehensiveframework for the evaluation and control of ‘existing’ chemical substances. This is a legalinstrument that was proposed by the European Commission upon approval of the FourthCommunity Action Program on the Environment (1987-1992) by the Council. Several otherdirectives and regulations adopted the same methodology for evaluating the risks ofchemicals:• Commission directive 93/67/EEC on risk assessment for new notified substances,• Commission regulation (EC) no 1488/94 on risk assessment for existing substances and• Directive 98/8/EC of the European parliament and of the council concerning the placing
of biocidal products on the market.
The Commission, in consultation with member states drew up four priority lists forsubstances that are to be evaluated for both human and environmental risks. For prioritycompounds, this process will result in a European Union Risk Assessment Report (RAR). Inthe environmental section of a RAR, environmental risk limits are derived for environmentalcompartments, which are called ‘predicted no effect concentrations’ (PNECs). The PNEC foreach environmental compartment is compared with the predicted environmentalconcentration (PEC) in the same compartment in order to estimate the risk of a certaincompound. The risk is considered to be unacceptable when the PEC-PNEC ratio is higherthan 1.The Dutch environmental risk limits (ERLs) of a certain compound are used as advisoryvalues within the Dutch national framework of setting environmental quality standards(EQS). The environmental quality standards indicate when risks of a certain compound areconsidered negligible, when adverse effects may appear and at which concentration functionsor species will be seriously affected. The functions and relations of ERLs and EQSs areshown below (Table 1). Although the purpose of the PNECs and the ERLs is different, themethods of estimation and the values estimated are roughly comparable.At present the Ministry of Housing, Spatial Planning and the Environment (VROM) has thepolicy to consider PNEC values as sufficient scientific basis for deriving ERLs. When arequest for deriving ERLs for a substance is formulated, PNECs from an existing RAR forthat substance will be used preferentially.
The results from the EU-RARs can not be transferred directly into the INS framework. Somebasic principles of the approaches differ, which leads to values calculated in one, but not inthe other approach and vice versa. Differences of a more detailed nature may hinder a directimplementation of the PNEC values estimated in the EU-Risk Assessment Reports in theDutch INS framework.

RIVM report 601501020 page 8 of 35
This report documents the differences between the methodology to derive PNECs and ERLs,and how PNECs can be used to calculate ERLs. Minimum requirements how to use PNECsfor national risk limits are presented, and finally, an overview is given of current ERLsderived from EU risk assessments.
Table 1. Environmental Risk Limits (ERLs) and the related Environmental Quality StandardsEQSs) that are set by the Dutch government for the protection of ecosystems (see Traas,2001).
NC Negligible Concentration MPC Maximum Permissible Concentration SRCeco Serious Risk Concentration for the ecosystem
Description ERL EQSThe NC represents a concentrationcausing negligible effects to ecosystems.The NC is derived from the MPC bydividing it by 100. This factor is applied totake into account possible combinedeffects.
NC(for air, water, soil,groundwater and
sediment)
Target Value(for air, water, soil,groundwater and
sediment)
The MPC is a concentration of asubstance in air, water, soil or sedimentthat should protect all species inecosystems from adverse effects of thatsubstance. A cut-off value is set at thefifth percentile if a species sensitivitydistribution of NOECs is used. This is theHazardous Concentration for 5% of the
species, the NOECHC5 .
MPC(for air, water, soil,groundwater and
sediment)
MPC(for air, water, and
sediment)
The SRCeco is a concentration of asubstance in the soil, sediment orgroundwater at which functions in thesecompartments will be seriously affectedor are threatened to be negativelyaffected. This is assumed to occur when50% of the species and/or 50% of themicrobial and enzymatic processes arepossibly affected.
SRCECO
(for water, soil,groundwater and
sediment)
Intervention Value(for soil, sediment and
groundwater) aftercomparison with
SRCHUM
RIVM report 601501020 page 9 of 35
2 Background, comparison and methods proposed
EU PNECs are derived as part of a risk assessment. If appropriate, risk reduction measuresmay follow the risk assessment when risks have been identified. In the latter case, PNECsmay play a further role when risks to the environment have been identified and, if needed, asubsequent risk reduction strategy is implemented. Environmental Risk Limits (ERLs) in theNetherlands are used in environmental policy as effects thresholds (effect oriented) and alsofor an emission reduction (source-oriented) strategy (Sijm et al., 2002). The main differencesbetween the two policy frameworks are elaborated below.
• The PNECs in the EU risk assessments do not have a formal status as environmental risklimits, but are part of a total risk assessment and subsequent risk management strategy.
• It may be desirable to give PNECs from EU-RARs a clear (legal) status withinenvironmental regulations in the member states.
• Stricter limits than enforced by the EU only seem sensible if necessary (risk reduction)action can be taken without interference from other member states. Possible problems areemission sources, in other EU countries, which can not be reduced using nationallegislation, legal problems on market admission etc.
2.1 Using EU-risk assessment reports
In compliance with the current viewpoint of the ministry of VROM, the PNEC values will beregarded as equivalent to MPC values (Steering Committee INS, 2003a).Only finalized EU-RARs will be used as a source for MPC values. To derive an MPC whilethe EU-RAR is not yet finalised is not preferable since new data (e.g. toxicity studies) may beadded to the data set that may alter the PNEC and therefore also the outcome of the MPCderivation. When a final version of the draft EU-RAR is published and ERLs are requestedby the ministry, MPCs based on the EU-RAR will be presented in a concise report.
2.2 Comparison of the EU method and the INS method
Although the methods described in the TGD (ECB, 2003) and in the INS guidance (Traas,2001) are similar on various important points, there are also differences. Some of thesedifferences originate from a different point of view; others depend on another definition orcomposition of the compartments for which the risk limits are estimated. Also differences indata selection and different extrapolation procedures may lead to different values for theMPC values derived through the INS method and the PNECs for the same compound. Thedifferences are summarised below. A few important differences considering the wholeframework are summarised in section 2.3. Methods to solve differences in approach areproposed in section 2.4.
RIVM report 601501020 page 10 of 35
The guidance documents reflect the practice at a certain moment. The risk assessmentpractice may gradually change during time until a new guidance update is released. Examplesare the incorporation of the species sensitivity distribution in the TGD and averaging similardata using the geometric mean instead of the arithmetic mean. One should also keep in mindthat both Traas (2001) and the TGD (ECB, 2003) are guidance documents and not recipebooks. As stated in the TGD (ECB, 2003) about the assessment factors for the terrestrialenvironment in section 3.6.2.2: ‘In summary, the assessment factors proposed in Table ‘z’must be regarded as indicative.’ Thus, specific cases may deviate from the guidance given inthe documents.
1. Environmental quality standards derived. The TGD (ECB, 2003) presents a singletype of quality standard: The PNEC for water, sewage treatment plants (STPs), soil andsediment. In the Dutch INS approach, three different types of risk limits are derived. TheMPC is considered equivalent to the EU-RAR PNEC. Apart from the MPC, the NC isdefined as MPC/100 and the SRCECO is defined as a trigger for soil or sedimentremediation.
2. Compartments. In the TGD 5 compartments are distinguished for the inlandenvironment: the aquatic and the terrestrial ecosystem, sediment, STPs and theatmosphere. Top predators are considered separately. Beside these compartments, themarine ecosystem is distinguished, which is separated in a saltwater and a sediment part.In the INS method estimations are made for water, sediment, soil, air and top predators.Fresh- and saltwater toxicity data are taken together in the INS approach if notstatistically significant different (Traas, 2001; sections 3.3.3.1.1 and 6.1.2). At present,applications for the atmospheric environment are limited to specific volatile compounds.
3. Freshwater versus saltwater. In the TGD saltwater and freshwater risk assessment aretreated differently. Due to the higher biodiversity of saltwater ecosystems, additionalprecaution is warranted. In risk assessment for salt water, more strict assessment factorsare used than for freshwater. In the context of INS, fresh- and saltwater are only treateddifferently when statistical analysis shows a difference between species sensitivities.
4. Harmonisation. Environmental risk limits are harmonised between the compartments inthe Dutch approach. This means that intercompartmental transfer may not lead toexceeding a risk limit in one compartment due to intercompartmental exchange. This isnot the case in the TGD approach. Risk limits are estimated for the compartmentsseparately, and harmonization is not included explicitly. In general, the theory ofequilibrium partitioning between compartments is used in INS. In practice risk limits forsoil and sediment are often derived from results of the aquatic compartment due to lack ofdata.
RIVM report 601501020 page 11 of 35
5. Data quality and relevance. See TGD (ECB, 2003) section 3.2. Criteria for accepting orrejecting the available data can be different between EU-RARs and INS, due to differentexpert interpretation of available guidelines.
6. Lumping data for (soil) processes and organisms. In the TGD the importance of soilmicroorganisms is recognised, but they are not mentioned in the suite of soil tests that areneeded in generating toxicity data (ECB, 2003 section 3.6.2.). In the section on PNECcalculation using assessment factors, microorganisms are mentioned as taxonomic group,but endpoints needed are not defined, which suggests that they are taken together withdata from other taxonomic groups. Data on microbial mediated processes in soil andsingle species tests are mentioned explicitly in the section on SSD methods. Here thesetwo types of tests are considered separately due to fundamental differences between thetests. The TGD does not indicate how these differences should be evaluated, but statesthat ‘The results should be compared and evaluated on a case by case basis in deciding ona final PNEC for the soil compartment’ (ECB, 2003; section 3.6.2.3.). In the INSprocedure the data for microbial processes and species are taken separately (if available)and for each an MPC is estimated. The lowest value is taken.
7. Experimental endpoints used. In the Dutch approach population related endpoints(biomass, reproduction, lethality, growth rate) are used to estimate environmental risklimits. The TGD allows endpoints such as photosynthesis and behaviour besidesendpoints directly related to populations. However, in such cases expert judgement mustbe used whether such data can be interpreted for use in the assessment (TGD section3.2.1.2; interpretation of data). For sediment, sediment avoidance and burrowing activityare considered to be the most relevant endpoints besides reproduction, growth andemergence (TGD, sections 3.5.4 and 4.3.2.4.) (ECB, 2003).
8. Base set of toxicity data. For the aquatic compartment the TGD prescribes a minimum ofthree short-term toxicity tests: the base set. The test organisms should represent at leastthree trophic levels: algae, Daphnia and fish. In that case a factor of thousand is appliedto the lowest L(E)C50. Lower assessment factors can be applied if more data are present.When the base set is not complete no ERL is derived. Exceptions: if acute toxicity can notbe tested because of hydrophobicity (log Kow >3). For such substances it is recommendedto carry out a qualitative risk assessment in order to decide if long term tests are required.A long-term toxicity test is required if the PEClocal/regional is 1/100th of the water solubility(TGD section 5.6; TGD section 3.3.1.1).A base set is not requested for the sediment and terrestrial compartments, as standardisedtests are hardly available. The TGD (ECB, 2003) states that standardised methods existfor the soil compartment, but toxicity tests with terrestrial organisms are not yet includedin the base set.’INS does not request a baseset. Traas (2001) indicates that, when the base set isincomplete and the TGD tables with assessment factors can not be applied, the modifiedEPA method is used.

RIVM report 601501020 page 12 of 35
9. Trophic levels versus taxonomic groups. The TGD requests representatives fromdifferent trophic levels and prescribes using algae, Daphnia and a fish for deriving thePNEC for the aquatic ecosystem. For the terrestrial compartment the focus is on trophiclevels as well, whereas for the sediment data from species representing different livingand feeding conditions are requested (ECB, 2003).The INS method focuses on representatives from different taxonomic groups. Thedescription used in INS is less stringent than that in the TGD, as it does not preferrepresentatives of specific taxonomic groups.
10. The use of assessment factors. In the EU, the TGD assessment factors are used. In theTGD (ECB, 2003), the possibility is given to use statistical extrapolation under specificconditions (see 9). In the INS method the EU/TGD assessment factors were introduced in1999. Before 1999, modified EPA assessment factors were used in INS. Somemodifications have been applied to the original TGD schemes:• In INS, if 4 or more NOECs from at least 4 taxonomic groups are present, statistical
extrapolation is used to derive the MPC. If fewer data are available, the sameassessment factors as in the TGD are used. If fewer data than the base set areavailable, other assessment factors are used, but never less strict than those of theTGD are. See INS Guidance for details (Traas, 2001).
• For terrestrial and sediment data in INS, a comparison with the MPC derived withequilibrium partitioning is made in all cases of preliminary risk assessment (usingassessment factors).
11. Statistical extrapolation. Within the INS framework the method of Aldenberg andJaworska (2000) is preferred for deriving ERLs when NOECs for four or more taxonomicgroups are available (Traas, 2001). The TGD proposes to use statistical extrapolation onlyif 10 or more (and preferably more than 15) chronic toxicity data from at least eighttaxonomic groups are present (ECB, 2003). Thus, in practice most PNECs are derivedusing assessment factors, as will be MPCs estimated using these PNECs.
AVGaqua average of all log-transformed aquatic NOECs [-]STDaqua standard deviation of all log-transformed aquatic NOECs [-]ks extrapolation constant, dependent on sample size and conf. level [-]AFstat assessment factor for statistical extrapolation, between 1 and 5 [-]PNECstat PNEC for aquatic organisms with statistical method [mg.L-1]
Another difference between the EU and INS is the use of an additional safety factor inthe EU (AFstat) to reduce the calculated PNEC by a factor between 1 and 5. More detailcan be found in the TGD.
stat
STD k - AVG
stat AF= PNEC
aquasaqua ⋅10

RIVM report 601501020 page 13 of 35
12. Averaging similar data. If more than one data are available for one species and the sametoxicological endpoint, the data can be averaged. When more than one L(E)C50 or NOECis present and when the differences can not be attributed to differences in test conditionsthe both EU/TGD and the INS method request for the geometric mean (Traas, 2001section 6.2.1; Beek and Oudendijk, 2001).
Within the European Commission (Water Framework Directive) there is still some debateon application of the geometric mean on long term NOECs from one species with thesame endpoint. The calculation of a mean value when several (long term) NOECs for onespecies and one endpoint are present is not clearly described in the TGD when assessmentfactors are used in the estimation of the PNEC (ECB, 2003, section 3.3.1.1). However, notapplying this technique would be inconsistent with the procedure followed for both shortterm tests applied in calculation of PNEC using assessment factors (section 3.3.1.1) andNOECs and L(E)C50s used for calculation of PNEC using statistical extrapolationtechniques (section 3.3.1.2.). In these cases a geometric mean is calculated. It is expectedthat the geometric mean will be applied to the first category as well in the future.
13. Intermittent release. Intermittent release is not relevant for derivation of MPCs, whichreflect long term effects. Therefore, this item is not included in the Dutch INS approach(Traas, 2001 section 6.2.1). Intermittent release is included in the EU/TGD (section 3.3.2)to take into account short term effects of such releases. In such cases a PNECwater, intermittent
is estimated from short-term L(E)C50 data.
14. Use of field data. Field data or model ecosystems can be included in the derivation of thePNECwater. The TGD indicates that there are no internationally accepted guidelines forfield studies. However, criteria for field data are given in Appendix III. The assessmentfactor to be applied on field data should be reviewed on a case by case basis (ECB, 2003,section 3.3.1.1; table 16). Field data can be used in INS as well, such as bioconcentrationfactors (BCFs) determined from field data. At present, the guidelines do not indicatewhether field data, or data from toxicity tests should be preferred in estimating the ERLs.
15. Secondary poisoning. When a chemical fulfils several criteria, e.g. indication of abioaccumulation potential, secondary poisoning has to be addressed (ECB, 2003). Thesecriteria are that the substance:• has a log Kow ≥ 3,• is highly (ab)sorptive, or,• belongs to a class of substances known to have a potential to accumulate in living
organisms, or,• there are indications from structural features,• and there is no mitigating property such as hydrolysis (half life less than 12 hours)
(see ECB (2003), section 3.8),• when substances have a log Kow >5, an additional safety factor may be used for
sediment PNECs. When a sediment PNEC is derived with equilibrium partitioning

RIVM report 601501020 page 14 of 35
theory, an additional factor of 10 is used in the EU to protect benthic organismsagainst risks due to sediment ingestion. In INS, this aspect should be covered byadditional bioaccumulation studies.
In the Dutch INS method, the same criteria are adopted. In the EU, risks for fish-eatingor worm-eating birds and mammals are calculated, based on predicted environmentalconcentrations. In INS, the calculations are inverted to calculate environmental risklimits that do not lead to toxicity for birds and mammals.
16. Composition standard water. The composition of standard water differs between theTGD and the INS approach. For the Dutch standard water a distinction is made between‘dissolved’ and ‘total’, for which a standard amount of 30 mg.L-1 dw suspended matter isassumed, consisting of 11,8% organic carbon and 40% clay. For the recalculation oforganic matter to organic carbon content a factor of 1.7 is used (Traas, 2001).The EU ‘standard water’ consists of 15 mg/l suspended matter with an organic carboncontent of 10% (Table 5 TGD part II, 2003). No standard is reported for clay content.Both the EU-RARs and INS report the PNEC and the MPCwater as dissolved. The ‘total’concentrations may be mentioned as well (TGD, 2003, see section 2.3.8.1), but arealways calculated when INS ERLs are derived from the PNEC.
17. Composition standard soil and standard sediment. The PNECsoil and the PNECsediment,as reported in EU RAR reports, are based on a different organic carbon content in the soilor sediment than the ERLs in the Netherlands. The organic carbon content of standardsoil in the EU is 2%, whereas in INS it is 5.9%. The organic carbon content of sedimentin the EU is 5%, which is almost equal to the INS standard of 5.9%. Recalculation to theDutch INS standard can be done for organic compounds where sorption is predominantlybased on organic carbon content. For metals, a recalculation to Dutch standard soil is onlypossible if the same standards are used (Dutch reference lines are mentioned in an annexto the TGD).
18. Wet weight or dry weight soil/sediment. In EU-RARs, ERLs for soil and sediment areoften estimated for fresh (wet) weight. In the INS reports published soil and sedimentconcentrations are based on dry weight. Recalculation of soil or sediment wet weight todry weight is possible using the percentages and density of solids, water and air given inthe TGD (ECB, 2003) section 2.3.4.
19. Kp sediment. If no toxicity data are present for sediment, the EU-PNEC is estimatedfrom the PNEC for water using the Kp for suspended matter and the bulk density forsuspended matter (1150 kg.m-3). A trigger value of log Kow or log Koc of ≥ 3 isrecommended as trigger value for sediment effect assessment in the TGD to avoidextensive testing (ECB, 2003; section 3.5.2). The PNEC is based on properties of recentlydeposited sediment, i.e. recent sedimentation of suspended matter. Monitoring is also

RIVM report 601501020 page 15 of 35
based on suspended matter concentrations. In the INS approach, the MPC for sediment isbased on partitioning to sediment, normalised on carbon and/or clay content.
20. The added risk approach. The added risk approach is well described in Traas (2001)section 6.4. The procedure is developed to take natural background levels of metals ororganic substances into account. The implication for risk assessment is, that naturalbackground levels have a negligible influence on the toxicity of the total (background +added amount) toxicity. Therefore, the ERL is composed of two parts: MPC =Background + maximum permissible addition. The added risk approach is also introducedin the TGD.
2.3 Main differences summarised
Most differences between the INS method and the method described in the TGD (2003) areof minor importance. They lead only to small differences or can be solved quite easily byrecalculation of PNEC values. Chapter 2.4 gives guidance on how to deal with PNEC valuesfrom EU-RARs technically.In this chapter some of the main differences between both methods are summarised. Thesedifferences can not be solved technically. The Steering Committee INS (2003b) decided toestimate Dutch environmental quality standards according to the TGD and also made somedecisions on how to handle these differences.
2.3.1 Negligible concentration (NC) and Serious Risk Concentration(SRCECO)
The negligible concentration (NC) represents a value causing negligible effects toecosystems. The NC is derived from the MPC by dividing it by 100. This assessment factortakes into account combination toxicity (VROM, 1989a,b). There is no equivalent to the NCin the EU-RAR.
The SRCECO is not included in the EU-RAR procedure since there is no EU equivalent. InINS, SRCECO values are based on the geometric mean of all approved chronic data if at leastfour chronic data from at least four taxonomic groups are available. If fewer data areavailable, a comparison is made between acute and chronic data. The geometric mean ofacute (LC50) data divided by 10 is compared to the geometric mean of all chronic data. Thelowest value determines the SRCECO. Derivation of the SRCECO will have to be judged on acase by case basis for each RAR. In the estimation of the SRCECO for PCOC (see Table 6) are-evaluation of the individual data was carried out.The Steering Committee INS (2003b) decided in 2003 to maintain both the NC and theSRCECO by using the data provided in the EU-RAR. In the case of the SRCECO this may leadto an underestimation. It is not clear if the EU-RARs always provide all data available. If not,it will probably focus on the lowest values.
RIVM report 601501020 page 16 of 35
2.3.2 Compartments
At present, MPCs are estimated for water, soil and sediment within the INS framework, ifpossible. The values for the various compartments are harmonised. In EU-RARs a PNEC forwater is often provided. However, PNECs for soil and sediment may be lacking, due to a lackof data or because generating these PNECs is not relevant (e.g. log Kow < 3). In such cases, itshould be decided if additional data will be gathered in order to generate values for thesecompartments within the INS framework.It is recommended to follow the estimations carried out in the EU-RAR. If there is a need forquality standards for compartments for which PNECs are lacking, they may be estimated byequilibrium partitioning method or by gathering new data.
2.3.3 Intercompartmental harmonisation
Compounds are initially emitted into one or more compartments. Harmonisation of ERLs isundertaken within the INS framework because substances in the environment distribute overthe different environmental compartments due to intercompartmental exchange processes.This harmonisation is carried out generically, comprising four compartments: soil, sediment,water and air. These compartments are not linked to a specific geographical region.Explanation of this procedure is given in Traas (2001), chapter 6.6.In the EU-RARs, PNECs are estimated for the different compartments independently andthese are not harmonised. This difference regarding intercompartmental harmonisation maylead to different values for a specific compartment between INS and the EU-RAR. TheSteering Committee INS (2003b) decided in 2003 not to harmonise among the compartmentsany more.
2.3.4 Application of extrapolation factors
Within the TGD (ECB, 2003) data for 10 different species from eight taxonomic groupsshould be available before the statistical method (SSD) can be applied. As for mostcompounds less data are present, extrapolation factors are often applied. In practice this maylead to lower values than the ones estimated within the INS approach where the statisticalmethod is already applied, where at least chronic data for four different taxonomic groups arerequired. The Steering Committee INS (2003b) decided to estimate Dutch environmentalquality standards according to the TGD. In order to get some insight in the sensitivity of thequality standards for extra data the Steering Committee INS (2003b) recommended toincorporate statements in the Dutch report concerning this sensitivity, e.g. by applying anSSD on less than eight taxonomic groups.

RIVM report 601501020 page 17 of 35
2.4 Methods proposed for deriving MPCs and NCs fromPNECs
Data collection and screening within the INS framework is described extensively in chapter 3of Traas (2001). For the compounds for which a European PNECs has been derived,collection and screening of the literature on toxicity and physico-chemical data, have takenplace as part of the PNEC derivation in the EU-RAR. Therefore, no additional data searchwill be performed for the derivation of MPCs based on finalised EU-RARs.
In the previous sections, differences between the EU method as described in the TGD (ECB,2003) and the INS method (Traas, 2001) have been summarised. Here methods will bepresented to recalculate the values presented in EU-RARs to Dutch values taking intoaccount characteristics of Dutch standard water, soil and sediment, and enabling apresentation on a dry weight basis.The methods comprise:• Recalculation of PNECwater-dissolved to PNECwater total,• Recalculation of PNECsoil and PNECsediment from PNECwater dissolved using Kp,• Recalculation of PNECsoil and PNECsediment based on wet weight to values in dry weight,• Recalculation of PNECsoil using different organic carbon content for Dutch standard soil
and EU standard soil.
2.4.1 Estimation of the Kp and Kcompartment-water
For most compounds presented in EU-RARs, enough aquatic ecotoxicity data are present toderive a PNECwater, but data for sediment are scarce. In such cases PNECsediment may beestimated from the PNECwater by means of the equilibrium partition method. For PNECsoil asimilar approach is often followed.
For the estimation of the Predicted No Effect Concentration in a compartment (PNECcomp)through the equilibrium partition method, the parameter Kcomp-water is used. This Kcomp-water canbe estimated from the solid water partition coefficient, Kp, of the compartment. The Kps ofthe various compartments can be calculated with the formula:
Kp=Foc*Koc (formula 23 in TGD part II),
in which:Kp = the solid water partition coefficient [L.kg-1]Foc = the fraction organic carbon [kg.kg-1], andKoc = the partition coefficient organic carbon – water [L.kg-1].
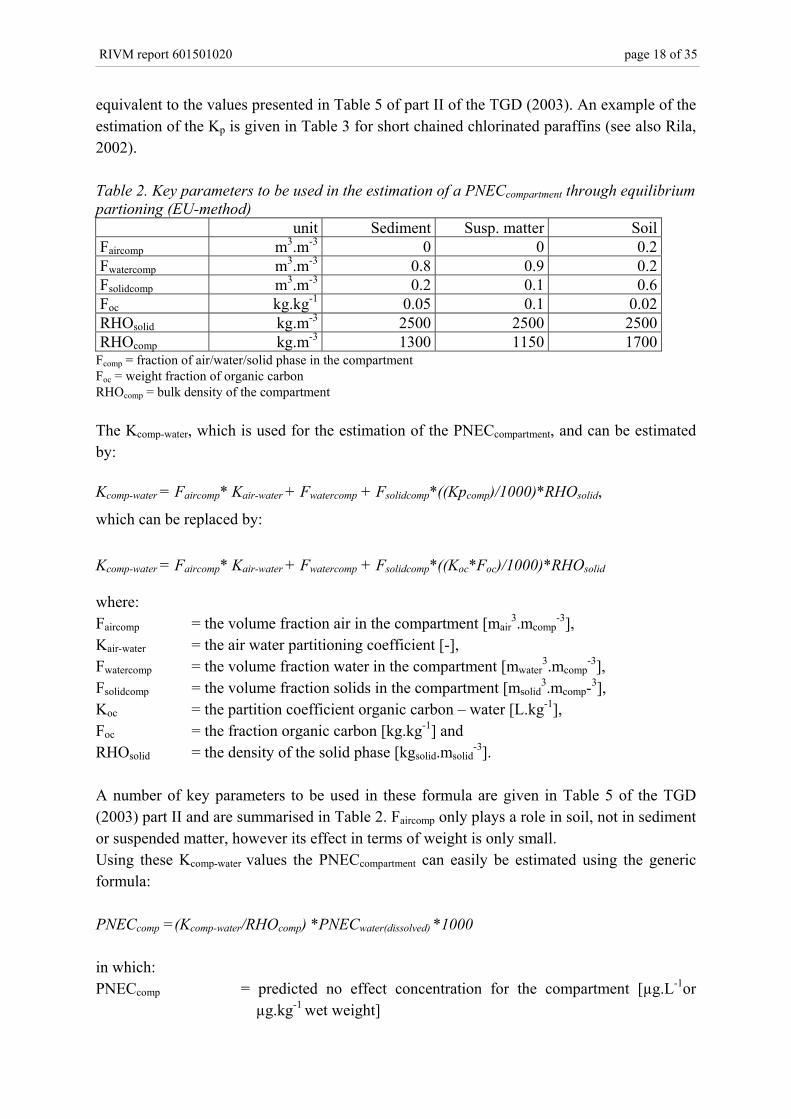
The fraction organic carbon (Foc’s) of the various compartments are presented in Table 2, aswell as the fractions of air, water and solids in these compartments. These values are
RIVM report 601501020 page 18 of 35
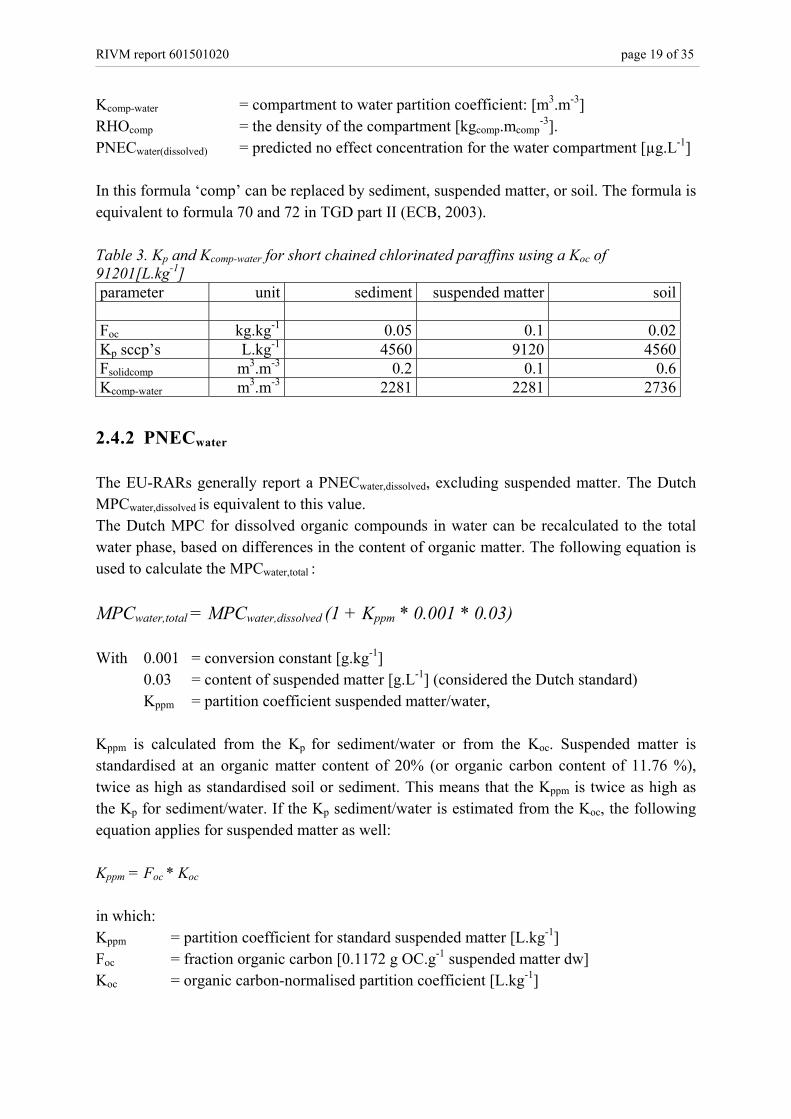
equivalent to the values presented in Table 5 of part II of the TGD (2003). An example of theestimation of the Kp is given in Table 3 for short chained chlorinated paraffins (see also Rila,2002).
Table 2. Key parameters to be used in the estimation of a PNECcompartment through equilibriumpartioning (EU-method)
unit Sediment Susp. matter SoilFaircomp m3.m-3 0 0 0.2Fwatercomp m3.m-3 0.8 0.9 0.2Fsolidcomp m3.m-3 0.2 0.1 0.6Foc kg.kg-1 0.05 0.1 0.02RHOsolid kg.m-3 2500 2500 2500RHOcomp kg.m-3 1300 1150 1700
Fcomp = fraction of air/water/solid phase in the compartmentFoc = weight fraction of organic carbonRHOcomp = bulk density of the compartment
The Kcomp-water, which is used for the estimation of the PNECcompartment, and can be estimatedby:
Kcomp-water = Faircomp* Kair-water + Fwatercomp + Fsolidcomp*((Kpcomp)/1000)*RHOsolid,
which can be replaced by:
Kcomp-water = Faircomp* Kair-water + Fwatercomp + Fsolidcomp*((Koc*Foc)/1000)*RHOsolid
where:Faircomp = the volume fraction air in the compartment [mair
3.mcomp-3],
Kair-water = the air water partitioning coefficient [-],Fwatercomp = the volume fraction water in the compartment [mwater
3.mcomp-3],
Fsolidcomp = the volume fraction solids in the compartment [msolid3.mcomp-3],
Koc = the partition coefficient organic carbon – water [L.kg-1],Foc = the fraction organic carbon [kg.kg-1] andRHOsolid = the density of the solid phase [kgsolid.msolid
-3].
A number of key parameters to be used in these formula are given in Table 5 of the TGD(2003) part II and are summarised in Table 2. Faircomp only plays a role in soil, not in sedimentor suspended matter, however its effect in terms of weight is only small.Using these Kcomp-water values the PNECcompartment can easily be estimated using the genericformula:
PNECcomp =(Kcomp-water/RHOcomp) *PNECwater(dissolved) *1000
in which:PNECcomp = predicted no effect concentration for the compartment [µg.L-1or
µg.kg-1 wet weight]
RIVM report 601501020 page 19 of 35
Kcomp-water = compartment to water partition coefficient: [m3.m-3]RHOcomp = the density of the compartment [kgcomp.mcomp
-3].PNECwater(dissolved) = predicted no effect concentration for the water compartment [µg.L-1]
In this formula ‘comp’ can be replaced by sediment, suspended matter, or soil. The formula isequivalent to formula 70 and 72 in TGD part II (ECB, 2003).
Table 3. Kp and Kcomp-water for short chained chlorinated paraffins using a Koc of91201[L.kg-1]parameter unit sediment suspended matter soil
Foc kg.kg-1 0.05 0.1 0.02Kp sccp’s L.kg-1 4560 9120 4560Fsolidcomp m3.m-3 0.2 0.1 0.6Kcomp-water m3.m-3 2281 2281 2736
2.4.2 PNECwater
The EU-RARs generally report a PNECwater,dissolved, excluding suspended matter. The DutchMPCwater,dissolved is equivalent to this value.The Dutch MPC for dissolved organic compounds in water can be recalculated to the totalwater phase, based on differences in the content of organic matter. The following equation isused to calculate the MPCwater,total :
MPCwater,total = MPCwater,dissolved (1 + Kppm * 0.001 * 0.03)
With 0.001 = conversion constant [g.kg-1]0.03 = content of suspended matter [g.L-1] (considered the Dutch standard)Kppm = partition coefficient suspended matter/water,
Kppm is calculated from the Kp for sediment/water or from the Koc. Suspended matter isstandardised at an organic matter content of 20% (or organic carbon content of 11.76 %),twice as high as standardised soil or sediment. This means that the Kppm is twice as high asthe Kp for sediment/water. If the Kp sediment/water is estimated from the Koc, the followingequation applies for suspended matter as well:
Kppm = Foc * Koc
in which:Kppm = partition coefficient for standard suspended matter [L.kg-1]Foc = fraction organic carbon [0.1172 g OC.g-1 suspended matter dw]Koc = organic carbon-normalised partition coefficient [L.kg-1]

RIVM report 601501020 page 20 of 35
Only studies in which the humic matter content or organic carbon content is reported areaccepted. Organic carbon content [g OC.g-1 dw] can be derived from the organic mattercontent [g OM/ g dw] by dividing the organic matter content by 1.7 [g OM.g-1 OC].1
Foc = Fom/1.7
See further Traas (2001), section 3.3.2.
The partition coefficient between organic carbon in the soil/sediment and water (Koc) is usedto derive an MPC for soil/sediment when no data on terrestrial or sediment-dwellingorganisms are available. By applying equilibrium partitioning, the Koc is used to harmonisethe MPCs between the different compartments. See also Traas (2001), section 6.5. When aKoc is used, preference will be given to the Koc values reported in the EU-RAR.
2.4.3 PNECsoil
When no terrestrial toxicity data are available the PNECsoil is calculated using equilibriumpartitioning theory. Within the EU framework the following equation is used:
soil
waterwatersoilsoil
1000RHOPNECKPNEC ⋅⋅
= −
in which:PNECsoil predicted no effect concentration for the soil compartment [µg.kg-1 wet weight]Ksoil-water soil to water partition coefficient: [m3.m-3]PNECwater predicted no effect concentration for the water compartment [µg.L-1]1000 conversion factor from liters to m3 [L.m-3]RHOsoil bulk density of wet soil: 1700 [kg.m-3 wet weight]
The PNECs presented in EU-RARs are often expressed in wet weight. These values can berecalculated to dry weight using the fractions and densities presented in Tables 2 and 4.According to the TGD ‘wet’ standard EU soil contains 60% solids v/v (density 2500 kg.m-3),20% water v/v (density 1000 kg.m-3) and 20% air by volume, i.e. 88% solids by weight. Thisresults in a multiplication factor of 1.13 to achieve the PNECsoil on a dry weight basis.
Dutch standard soil and standard sediment contain 10% organic matter (OM) and 25% lutum(Traas, 2001). Accordingly, the organic carbon content is 5.9%. The European standard soilis defined in the TGD (ECB, 2003) and contains 2% organic carbon (ECB, 2003, Table 5).Therefore, a different amount of substance bound to soil can be expected. Normalisation of
1 Recently a factor of 2 was proposed (Smedes, 1999). However this change has not yet beenimplemented.
RIVM report 601501020 page 21 of 35
the PNECs for standard EU soil (Foc = 0.02) to standard NL soil (Foc = 0.059) can be achievedby multiplying the result by a factor of 2.9 (= 0.059/0.02). An example is given in chapter 4(see also Janus and Posthumus, 2002, section 2.2).The Dutch MPCsoil can be calculated from an EU PNECsoil by:
MPCsoil [mg.kg-1 dw] = PNECsoil * 1.13 * 2.9 [mg.kg-1 ww]
2.4.4 PNECsediment
Analogous to the PNECsoil, the PNECsediment is calculated using equilibrium partitioningtheory, when no terrestrial toxicity data are available. Within the EU framework thefollowing equation is used:
susp
waterwatersuspsediment
1000RHOPNECK
PNEC⋅⋅
= −
in which:PNECsediment predicted no effect concentration for the sediment compartment [µg.kg-1wet
weight]Ksusp-water suspended matter to water partition coefficient: [m3.m-3]PNECwater predicted no effect concentration for the water compartment [µg.L-1]1000 conversion factor from liters to m3 [L.m-3]RHOsusp bulk density of suspended matter: 1150 [kg.m-3 wet weight]
Results in the EU-RAR documents for sediment are given on a wet weight basis. Accordingto the TGD ‘wet’ sediment consists of 90% v/v water (density 1 kg.L-1) and 10% v/v solidparticles (density 2.5 kg.L-1), which results in a ‘wet’ density of (0.9 × 1) + (0.1 × 2.5) = 1.15kg.L-1. The dry weight is consequently 0.25 kg (per liter wet sediment) and the ratio wet:dryis 1.15/0.25 = 4.6. Therefore, EU-RAR sediment PNECs can be recalculated to dry sediment:PNECsediment dry = PNECsediment wet * 4.6. A summary of the conversion factors for soils andsediments is given in Table 4.The factor of 4.6 is also mentioned in Lijzen and Rikken (2003) who made a comparison ofEUSES 2.0 and EUSES 1.0. They indicated that calculating the PNECsed on the basis of theequilibrium partitioning theory is changed: Ksusp-water and RHOsusp is used instead of Ksed-water
and RHOsed. Because of this change also the conversion factor for suspended matterconcentrations (PNECsediment) from wetwt to drywt should be changed based on suspendedmatter (instead of sediment): CONVsusp=(RHOsusp)/(Fsolidsusp·RHOsolid)= 4.6. The TGD doesnot mention this modification explicitly. This change has been approved by the EUSES 2.0Working Group (Lijzen and Rikken, 2003)
The European standard sediment and the Dutch standard sediment, as well as the suspendedmatter, differ slightly in the fraction organic carbon. To correct for this difference a factor of

RIVM report 601501020 page 22 of 35
1.18 should be applied to the EU standards. The conversion for the difference in organiccarbon concentration of the various compartments is summarised in Table 5.The formula for recalculating PNECsediment to MPCsediment is:
MPCsediment [mg.kg-1 dw] = PNECsediment * 4.6 * 1.18 [mg.kg-1 ww]
2.4.5 Multiplication factors summarised
The ratios for the conversion from wet to dry are summarised in Table 4. The multiplicationfactors for soil, suspended matter, and sediment based on the characteristics in the Tables 2and 4 are 1.1, 4.6 and 2.6, respectively. However, as the TGD assumes recently settledsediment as being most relevant for risk assessment, the factor estimated for suspendedmatter should be applied to sediment as well.
PNECcomp,dry = PNECcomp,wet * multiplication factor compartment (see Table 4).
Table 4. Multiplication factors for recalculating wet weight to dry weight concentrations forthe various compartments.compartment Fwater Fsolid Fair bulk
densitySolids ratio PNECdry/
PNEC wetm3.m-3 m3.m-3 m3.m-3 kg.m-3 kg.m-3
suspended matter 0.9 0.1 0 1150 250 4.6sediment 2 4.6soil 0.2 0.6 0.2 1700 1500 1.13density water/solid/airphase[kg.m-3]
1000 2500 1.3
2 according to the specifications for sediment the dry/wet ratio for sediment would be 2.6. As thePNECsediment is estimated using suspended matter parameters, conversion from wet to dry will bebased on suspended matter parameters as well (see text). Thus a factor of 4.6 should be applied to thePNECsediment.
IMPORTANT NOTICE:In the previous TGD Ksed-water and RHOsed were used instead of Ksusp-water and RHOsusp.Therefore, the estimation in old EU-RARs is still based on sediment parameters (e.g. in thecase of acetonitrile, benzene C10-13 alkyl derivates, cumene, SCCPs, nonylphenol, andMBTE). As the Ksed-water and the Ksusp-water are similar (see Table 3), and the RHOsusp 10%lower than the RHOsed, the PNECsediment based on the current TGD (ECB, 2003) will beslightly higher than the one estimated using the previous TGD. It should be noted thatresults in the EU-RAR documents for sediment are given on a wet weight basis.For compounds for which a PNECsediment is estimated using the previous TGD, it isrecommended to use sediment characteristics instead of suspended matter characteristicsfor converting the PNECsediment ww to PNECsediment dw. In these cases a factor of 2.6should be used instead of a factor of 4.6 for converting wet weight to dry weight!

RIVM report 601501020 page 23 of 35
The ratios for the conversion from EU standard soil to Dutch standard soil considering thedifferences in organic matter are summarised in Table 5.
Table 5. Multiplication factors for recalculating of EU sediment/soil to Dutch standardsediment/soil considering the differences in organic carbon content (Foc). Organic mattercontent (Fom) and clay content are provided in addition.compartment EU EU NL NL NL Ratio NL oc/ EU oc
Foc Fom Foc Fom clay EU → NLsediment 0.05 - 0.059 0.1 0.25 1.18soil 0.02 0.034 0.059 0.1 0.25 2.9suspended matter 0.1 - 0.118 0.2 0.4 1.18
EU data from ECB (2003) part II, Table5, Dutch data from Traas (2001) section 4.4.2 and 4.4.3 and annex 10
Using suspended matter parameters in estimating the PNECsediment
In the previous TGD the PNECsediment was estimated using the parameters of sediment,whereas in the present TGD (ECB, 2003) the parameters of suspended matter are used inestimating the PNECsediment. This has resulted in discussions about the validity to usesuspended matter parameters (e.g. Crane, 2003) and resulted in confusion among the peopleapplying the TGD. As the Kp differs by a factor of 2, how much difference in PNECvaluescan be expected?
For estimation of the PNECsediment the Ksusp-water is being used (see section 2.4.4). As shown inTable 3 this value is similar to the Ksediment-water. These two parameters are similar, because theeffect of a difference in Kp is counteracted by a difference in Fsolidcomp (see the formula forKcomp-water in section 2.4.1 and Table 3).As the Ksed-water and the Ksusp-water are similar (see Table 3), and the RHOsusp is 10% lower thanthe RHOsed, the PNECsediment based on the current TGD (ECB, 2003) will be slightly higherthan the one estimated using the previous TGD (see section 2.4.4).
For estimation of the PNECsediment in dry weight using the suspended matter parametersinstead of sediment parameters leads to a difference of a factor of about two, because thefraction solids in sediment is twice as high. Therefore, PNECsediment based on the presentTGD (ECB, 2003) will be a factor of two less stringent than the PNECsediment based on theprevious TGD.
RIVM report 601501020 page 24 of 35
3 Reporting ERLs for EU-RAR compounds
Generally, ERLs derived for the Ministry of Housing, Spatial Planning and the Environment(VROM) follow the procedure as described in Traas (2001). These ERLs are reported inextensive reports focussing on data collection and evaluation, the chemical characteristics ofthe compounds, the ecotoxicology data used for deriving the ERls and the expected effects.ERLs derived according to the protocol presented in this report will be presented to theMinistry of VROM in brief reports without details on data collection, evaluation andintegration. These details have already been mentioned in the EU-RARs of the substancesconsidered.
Standard items that will be reported in each ERL derivation based on an EU-RAR evaluationare:• a short overview of the methods used (see e.g. Rila, 2002),• a short summary of the physico-chemical properties of the compound as described in the
RAR,• the acute or chronic data set used for final evaluation and derivation of PNEC in the
RAR,• the PNEC value derived in the RAR and the MPC based on the PNEC,• other risk limits derived from data in the RAR such as NC and, if possible, the SRCECO,• if the SRCECO is derived, possible additional datasets (i.e., acute toxicity data) as reported
in the RAR are listed,• a recalculation of risk limits to other compartments (e.g. soil or sediment) based on
equilibrium partitioning.
In many cases additional information about the EU-priority substance is available. In somecases, it may be useful to provide background information on a substance. The goal of this isto make users of the ERLs aware of possible problems or pitfalls associated with the specificsubstance.
In appendix 2, an example of ERL derivation based on EU PNECs is given for nonylphenol.
RIVM report 601501020 page 25 of 35
4 Summary of MPCs for EU-RAR compounds
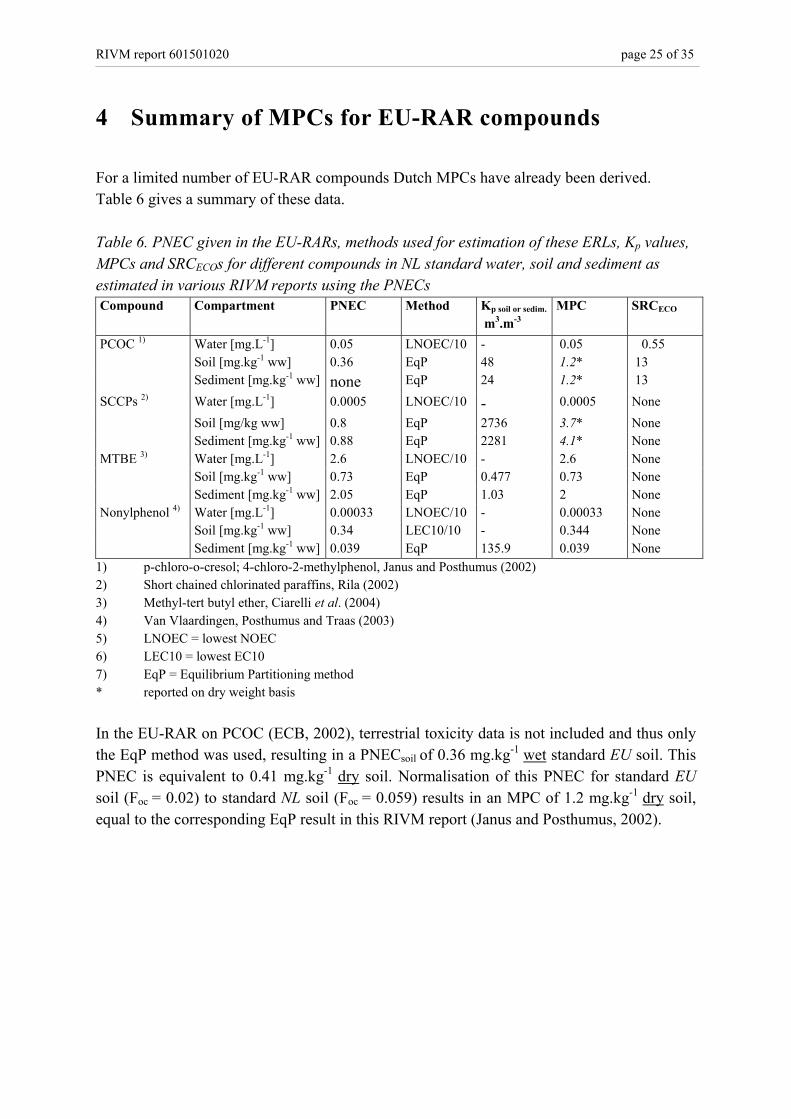
For a limited number of EU-RAR compounds Dutch MPCs have already been derived.Table 6 gives a summary of these data.
Table 6. PNEC given in the EU-RARs, methods used for estimation of these ERLs, Kp values,MPCs and SRCECOs for different compounds in NL standard water, soil and sediment asestimated in various RIVM reports using the PNECsCompound Compartment PNEC Method Kp soil or sedim.
m3.m-3MPC SRCECO
PCOC 1) Water [mg.L-1] 0.05 LNOEC/10 - 0.05 0.55Soil [mg.kg-1 ww] 0.36 EqP 48 1.2* 13Sediment [mg.kg-1 ww] none EqP 24 1.2* 13
SCCPs 2) Water [mg.L-1] 0.0005 LNOEC/10 - 0.0005 NoneSoil [mg/kg ww] 0.8 EqP 2736 3.7* NoneSediment [mg.kg-1 ww] 0.88 EqP 2281 4.1* None
MTBE 3) Water [mg.L-1] 2.6 LNOEC/10 - 2.6 NoneSoil [mg.kg-1 ww] 0.73 EqP 0.477 0.73 NoneSediment [mg.kg-1 ww] 2.05 EqP 1.03 2 None
Nonylphenol 4) Water [mg.L-1] 0.00033 LNOEC/10 - 0.00033 NoneSoil [mg.kg-1 ww] 0.34 LEC10/10 - 0.344 NoneSediment [mg.kg-1 ww] 0.039 EqP 135.9 0.039 None
1) p-chloro-o-cresol; 4-chloro-2-methylphenol, Janus and Posthumus (2002)2) Short chained chlorinated paraffins, Rila (2002)3) Methyl-tert butyl ether, Ciarelli et al. (2004)4) Van Vlaardingen, Posthumus and Traas (2003)5) LNOEC = lowest NOEC6) LEC10 = lowest EC107) EqP = Equilibrium Partitioning method* reported on dry weight basis
In the EU-RAR on PCOC (ECB, 2002), terrestrial toxicity data is not included and thus onlythe EqP method was used, resulting in a PNECsoil of 0.36 mg.kg-1 wet standard EU soil. ThisPNEC is equivalent to 0.41 mg.kg-1 dry soil. Normalisation of this PNEC for standard EUsoil (Foc = 0.02) to standard NL soil (Foc = 0.059) results in an MPC of 1.2 mg.kg-1 dry soil,equal to the corresponding EqP result in this RIVM report (Janus and Posthumus, 2002).

RIVM report 601501020 page 26 of 35
ReferencesAldenberg, T and Jaworska, J (2000). Uncertainty of the hazardous concentration and
fraction affected for normal species sensitivity distributions. Ecotox. Environ. Saf. 25:48-63.
Beek, MA and Oudendijk, M. (2001). Milieukwaliteitsnormen (MTR) voor prioriteitsstoffenvolgens de EU-methodiek zoals voorgesteld in de Kaderrichtlijn Water. RIZAWerkdocument 2000.099X.
Ciarelli, S, Posthumus, R, Vos, JH, Fleuren RHLJ and Traas, TP (2004). Environmental RiskLimits for several volatile compounds for water, soil and sediment. 1. Ecotoxicologicalevalutation. Report 601501016, RIVM Bilthoven, The Netherlands.
Crane, M (2003). Proposed development of sediment quality guidelines under the Europeanwater framework Directive: A critique. Toxicol. Letters 142: 195-206.
ECB (1999). European Union Risk Assessment Report: Alkanes, C10-13, Chloro-, CAS-No.85535-84-8, EINECS-No. 287-476-5, Risk Assessment. 1st Priority List, Volume 4.
ECB (2002). Risk-Assessment Report Vol.11, 2002 for: 4-chloro-o-cresol (pcoc), CAS-No.1570-64-5, EINECS-No. 216-381-3. Publication: EUR 19757 EN. Danish EnvironmentalProtection Agency.
ECB (2003). Technical Guidance Documents in support of the Commission Directive93/67/EEC on Risk Assessment for New Notified Substances and the CommissionRegulation (ec) 1488/94 on Risk Assessment for Existing Substances. Ispra, Italy.
Janus, JA, and Posthumus, R (2002). Environmental Risk Limits for 2-propanol,formaldehyde and 4-chloromethylphenols- updated proposals. Report 601501015, RIVMBilthoven, The Netherlands.
Kalf, DF, Van den Hoop, MAGT, Rila, JP and Posthuma, C (2003). Environmental RiskLimits for Ethylene Diamine Tetra Acetic acid (EDTA) CAS No. 64-02-8, EINECS No.200-573-9. Report 601501010, RIVM Bilthoven, The Netherlands.
Lijzen, J and Rikken, M (eds). (2003) Comparison of EUSES 2.0 with EUSES 1.0. EUSES2.0 specifications approved by the EUSES 2.0 Working Group. RIVM/CSR-report08982A00
Rila (2002). Afleiding van PNEC’s voor de kort-ketenige chloorparaffines (m = 10-13) voorde Nederlandse situatie. CAS No. 85535-84-4, EINECS No. 287-476-5. RIVMBriefrapport, december 2002.
Smedes, F (1999). Van organisch stof naar elementair koolstof. RIKZ/IT werkdocument nr.99.633x, RIKZ, Den Haag.
Sijm, DTHM, Van Wezel, AP, and Crommentuijn, T (2002). Environmental risk limits in theNetherlands. In: Species Sensitivity Distributions in ecotoxicology. (Eds: Posthuma, L,Suter, GW and Traas, TP). Lewis Publishers, Boca Raton, FL, USA.
Steering Committee INS (2003a) Minutes Steering Committee INS 20-05-2003.Steering Committee INS (2003b) Minutes Steering Committee INS 06-11-2003.

RIVM report 601501020 page 27 of 35
Traas, TP (ed.) (2001). Guidance document on deriving environmental risk limits. Report601501012, RIVM Bilthoven, The Netherlands.
Van Vlaardingen, PLA, Posthumus R and Traas TP (2003). Environmental Risk Limits foralkylphenols and alkylphenol ethoxylates. Report 601501019, RIVM Bilthoven, TheNetherlands
VROM (1989a). Ministry of Housing, Spatial Planning and Environmental Protection.National Environmental Policy Plan. To choose or lose. Second Chamber, session 1988-1989, 21137, no. 1-2.
VROM (1989b). Ministry of Housing, Spatial Planning and Environmental Protection.Premises for risk management. Risk limits in the context of environmental policy.Second Chamber, session 1988-1989, 21137, no 5.
RIVM report 601501020 page 28 of 35
Appendix 1: Mailing list1. Ing. M. Adams (DGM-SAS)2. plv. DG Milieubeheer3. Hoofd afdeling stoffen, DGM-SAS4-11 Stuurgroep INS12-36. OZBG-eco37. prof. dr. R. Laane (RIKZ)38. dr. G.J. Zwolsman (RIZA)39. ing. G. Broseliske (RIZA)40. drs. G. Niebeek (RIZA)41. ing. G. B.J. Rijs (RIZA)42. ing. D.F. Kalf (RIZA)43. Depot Nederlandse Publicaties en Nederlandse Bibliografie44. Directie RIVM45. Sectordirecteur Stoffen en Risico’s46. Hoofd Stoffen Expertise Centrum47. Hoofd Laboratorium voor Ecotoxicologische Risico’s48. dr. D. van de Meent (RIVM/LER)49. drs. T. Aldenberg (RIVM/LER)50. drs. J.A. Janus (RIVM/SEC)51. drs. R. Luttik (RIVM/SEC)52. ir. R.J. Luit (RIVM/SEC)53. drs. M.H.M.M. Montforts (RIVM/SEC)54. R. Posthumus (RIVM/SEC)55. drs. M.G.J. Rikken (RIVM/SEC)56. dr. D. Sijm (RIVM/SEC)57. dr. W. Slooff (RIVM/SEC)58. dr. E.J. Verbruggen (RIVM/SEC)59. drs. T. Vermeire (RIVM/SEC)60. dr. M.P.M. Janssen (RIVM/SEC)61. drs. T.P. Traas (RIVM/SEC)62. drs. J.P. Rila (RIVM/SEC)63. ing. P. van Vlaardingen (RIVM/SEC)64. SBC/afd. Communicatie65. Bureau Rapportenregistratie66. Bibliotheek RIVM67-71. Bureau Rapportenbeheer72-90 Reserve-exemplaren
RIVM report 601501020 page 29 of 35
Appendix 2: An example: Derivation of ERLs fornonylphenol
A2 NonylphenolThe general name nonylphenol designates a group of isomeric compounds that may vary inthe position of the nonyl chain on the phenol ring and the degree of branching of the nonylgroup. The isomer that is predominantly produced commercially is 4-nonylphenol, in whichthe degree of branching varies and is usually undefined. Nonylphenol is defined as straightchain (unbranched) nonylphenol only by Chemical Abstract Service (CAS). However,straight chain nonylphenol is produced only in minor quantities in commercial mixtures. Forthis reason nonylphenol as used in the EU-RAR covers all isomers that are not 4-nonylphenol. Hence, the EU-RAR addresses the potential risks of all nonylphenols, with 4-nonylphenol named explicitly, and with nonylphenol used as general name for all otherisomers.
A2.1 IntroductionIn 1993 the Council of the European Communities adopted Council Regulation (EEC) 793/93or the Existing Substances Regulation (ESR), thereby introducing a comprehensiveframework for the evaluation and control of ‘existing’ chemical substances. This is a legalinstrument that was proposed by European Commission upon approval of the FourthCommunity Action Programme on the Environment (1987-1992) by the Council.The Commission, in consultation with member states draws up priority lists for substancesthat are to be evaluated for both human and environmental risks. For a given prioritizedcompound, this process will result in a European Union Risk Assessment Report (RAR) atstep 3 of the regulation. In the environmental section of a RAR, environmental risk limits arederived for each environmental compartment, which are called 'predicted no effectconcentrations' (PNEC). A PNEC is comparable to the maximum permissible concentration(MPC), which is the environmental risk limit (ERL) used as an advisory value within theDutch national framework of setting environmental quality standards (EQS). At present theMinistry of Housing, Spatial Planning and the Environment (VROM) has the policy to takeover PNEC values from a RAR for an existing substance when these PNECs have alreadybeen or are being derived at the time the Ministry seeks advice (that is, requests for an MPCto be derived) for that substance.
At present, a preliminary draft version of an EU RAR for p-tert –butylphenol, a finalizeddraft version of a targeted (environmental) EU RAR for 4-tert-octylphenol (EnvironmentAgency of England and Wales, 2002) and a final EU RAR for 4-nonylphenol (branched) andnonylphenol exist (ECB, 2002). In compliance with the present viewpoint of the ministry of
RIVM report 601501020 page 30 of 35
VROM, the PNEC values of nonylphenol will be taken over as MPC values. The RARs forbutylphenol and octylphenol are draft versions from which no data may be used forpublication until the final report is issued. For that reason we will not present data of thosecompounds in the present report. To derive an MPC while a PNEC is underway is notpreferable either since new data (e.g. toxicity studies) may be added to the data set that mayalter the outcome of the ERL derivation. When a finalized version of the two current draftEU-RARs is issued, RIVM will present the MPCs based on the EU-RAR in a concise report.
The EU RAR for will be used as the sole source for physical and chemical data, toxicity dataand MPCs that will be presented in this report.
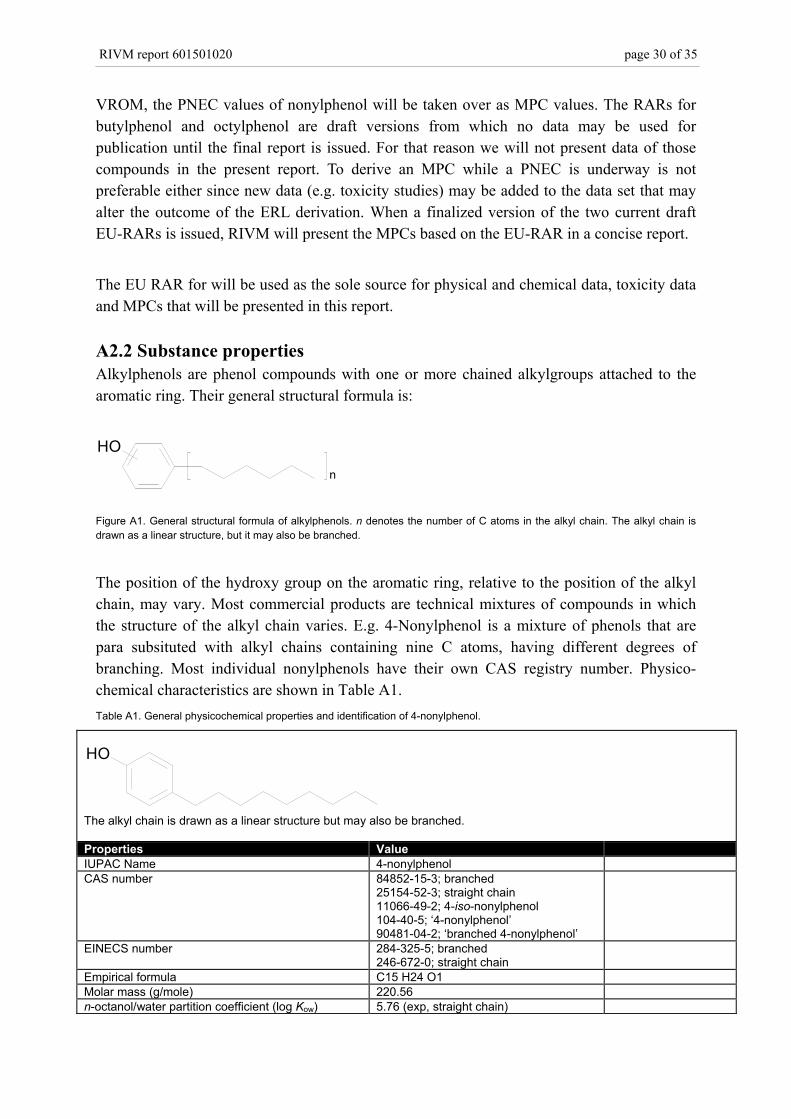
A2.2 Substance propertiesAlkylphenols are phenol compounds with one or more chained alkylgroups attached to thearomatic ring. Their general structural formula is:
n
OH
Figure A1. General structural formula of alkylphenols. n denotes the number of C atoms in the alkyl chain. The alkyl chain isdrawn as a linear structure, but it may also be branched.
The position of the hydroxy group on the aromatic ring, relative to the position of the alkylchain, may vary. Most commercial products are technical mixtures of compounds in whichthe structure of the alkyl chain varies. E.g. 4-Nonylphenol is a mixture of phenols that arepara subsituted with alkyl chains containing nine C atoms, having different degrees ofbranching. Most individual nonylphenols have their own CAS registry number. Physico-chemical characteristics are shown in Table A1.Table A1. General physicochemical properties and identification of 4-nonylphenol.
OH
The alkyl chain is drawn as a linear structure but may also be branched.
Properties ValueIUPAC Name 4-nonylphenolCAS number 84852-15-3; branched
25154-52-3; straight chain11066-49-2; 4-iso-nonylphenol104-40-5; ‘4-nonylphenol’90481-04-2; ‘branched 4-nonylphenol’
EINECS number 284-325-5; branched246-672-0; straight chain
Empirical formula C15 H24 O1Molar mass (g/mole) 220.56n-octanol/water partition coefficient (log Kow) 5.76 (exp, straight chain)
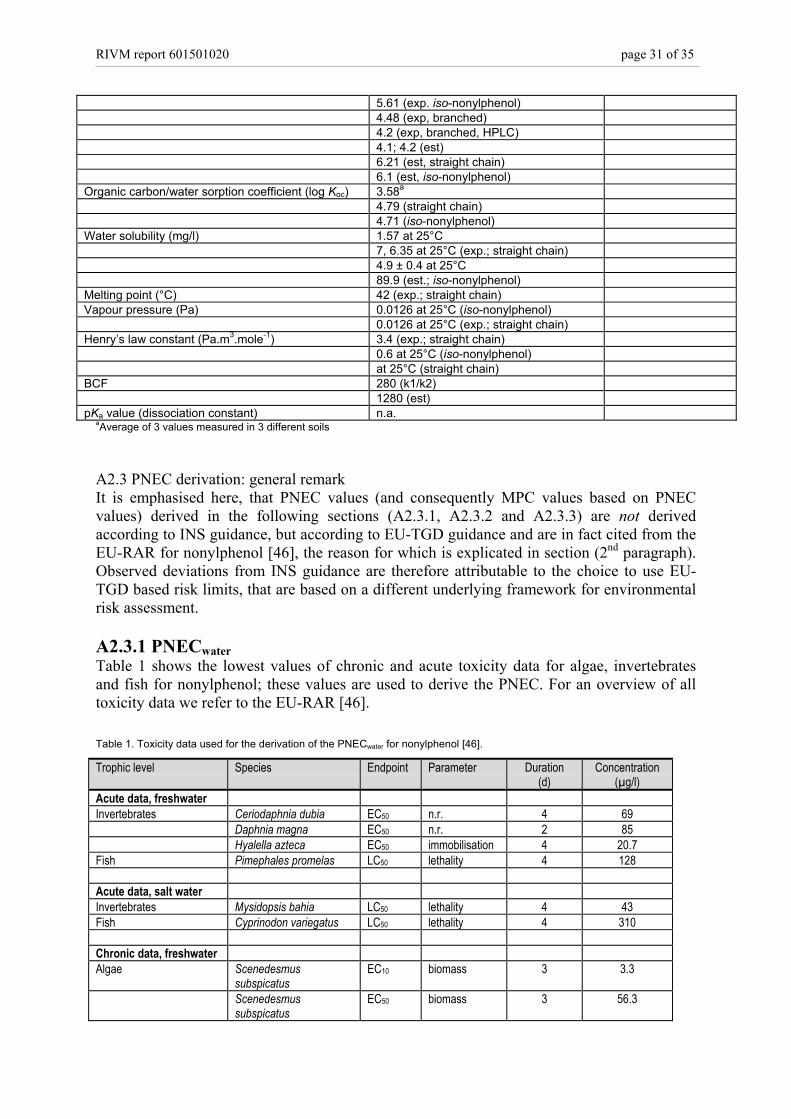
RIVM report 601501020 page 31 of 35
5.61 (exp. iso-nonylphenol)4.48 (exp, branched)4.2 (exp, branched, HPLC)4.1; 4.2 (est)6.21 (est, straight chain)6.1 (est, iso-nonylphenol)
Organic carbon/water sorption coefficient (log Koc) 3.58a
4.79 (straight chain)4.71 (iso-nonylphenol)
Water solubility (mg/l) 1.57 at 25°C7, 6.35 at 25°C (exp.; straight chain)4.9 ± 0.4 at 25°C89.9 (est.; iso-nonylphenol)
Melting point (°C) 42 (exp.; straight chain)Vapour pressure (Pa) 0.0126 at 25°C (iso-nonylphenol)
0.0126 at 25°C (exp.; straight chain)Henry’s law constant (Pa.m3.mole-1) 3.4 (exp.; straight chain)
0.6 at 25°C (iso-nonylphenol)at 25°C (straight chain)
BCF 280 (k1/k2)1280 (est)
pKa value (dissociation constant) n.a.aAverage of 3 values measured in 3 different soils
A2.3 PNEC derivation: general remarkIt is emphasised here, that PNEC values (and consequently MPC values based on PNECvalues) derived in the following sections (A2.3.1, A2.3.2 and A2.3.3) are not derivedaccording to INS guidance, but according to EU-TGD guidance and are in fact cited from theEU-RAR for nonylphenol [46], the reason for which is explicated in section (2nd paragraph).Observed deviations from INS guidance are therefore attributable to the choice to use EU-TGD based risk limits, that are based on a different underlying framework for environmentalrisk assessment.
A2.3.1 PNECwaterTable 1 shows the lowest values of chronic and acute toxicity data for algae, invertebratesand fish for nonylphenol; these values are used to derive the PNEC. For an overview of alltoxicity data we refer to the EU-RAR [46].
Table 1. Toxicity data used for the derivation of the PNECwater for nonylphenol [46].
Trophic level Species Endpoint Parameter Duration(d)
Concentration(µg/l)
Acute data, freshwaterInvertebrates Ceriodaphnia dubia EC50 n.r. 4 69
Daphnia magna EC50 n.r. 2 85Hyalella azteca EC50 immobilisation 4 20.7
Fish Pimephales promelas LC50 lethality 4 128
Acute data, salt waterInvertebrates Mysidopsis bahia LC50 lethality 4 43Fish Cyprinodon variegatus LC50 lethality 4 310
Chronic data, freshwaterAlgae Scenedesmus
subspicatusEC10 biomass 3 3.3
Scenedesmussubspicatus
EC50 biomass 3 56.3
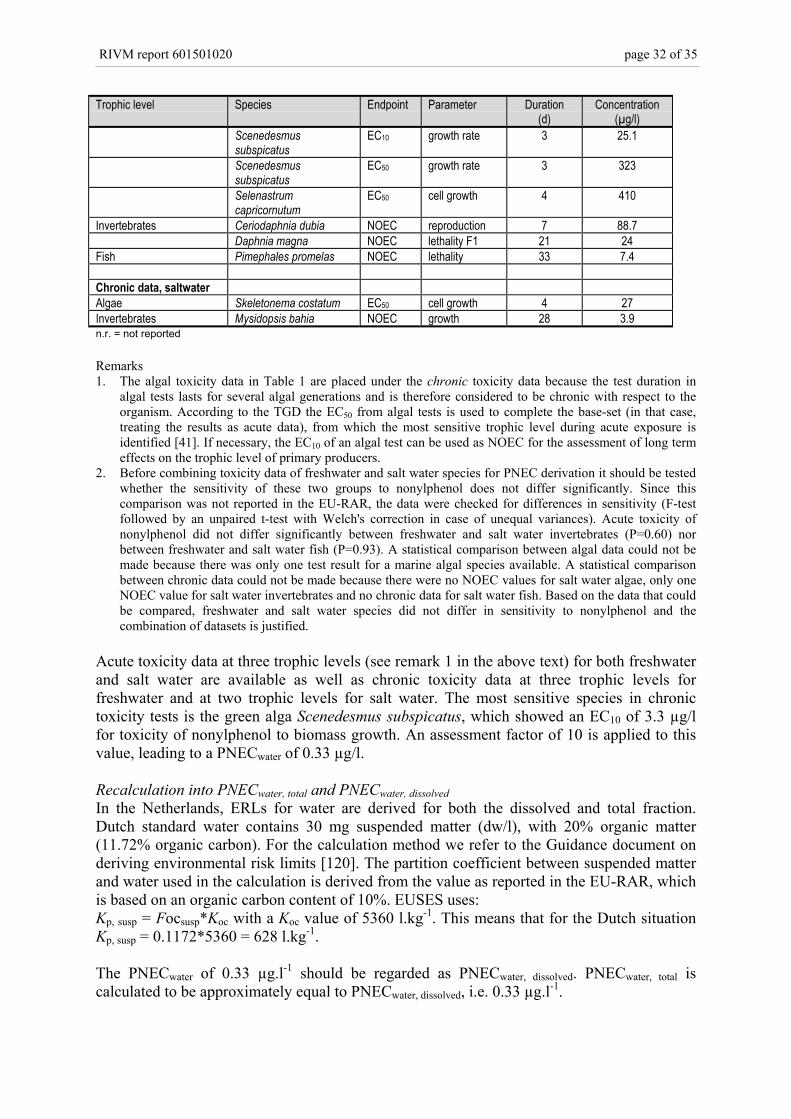
RIVM report 601501020 page 32 of 35
Trophic level Species Endpoint Parameter Duration(d)
Concentration(µg/l)
Scenedesmussubspicatus
EC10 growth rate 3 25.1
Scenedesmussubspicatus
EC50 growth rate 3 323
Selenastrumcapricornutum
EC50 cell growth 4 410
Invertebrates Ceriodaphnia dubia NOEC reproduction 7 88.7Daphnia magna NOEC lethality F1 21 24
Fish Pimephales promelas NOEC lethality 33 7.4
Chronic data, saltwaterAlgae Skeletonema costatum EC50 cell growth 4 27Invertebrates Mysidopsis bahia NOEC growth 28 3.9n.r. = not reported
Remarks1. The algal toxicity data in Table 1 are placed under the chronic toxicity data because the test duration in
algal tests lasts for several algal generations and is therefore considered to be chronic with respect to theorganism. According to the TGD the EC50 from algal tests is used to complete the base-set (in that case,treating the results as acute data), from which the most sensitive trophic level during acute exposure isidentified [41]. If necessary, the EC10 of an algal test can be used as NOEC for the assessment of long termeffects on the trophic level of primary producers.
2. Before combining toxicity data of freshwater and salt water species for PNEC derivation it should be testedwhether the sensitivity of these two groups to nonylphenol does not differ significantly. Since thiscomparison was not reported in the EU-RAR, the data were checked for differences in sensitivity (F-testfollowed by an unpaired t-test with Welch's correction in case of unequal variances). Acute toxicity ofnonylphenol did not differ significantly between freshwater and salt water invertebrates (P=0.60) norbetween freshwater and salt water fish (P=0.93). A statistical comparison between algal data could not bemade because there was only one test result for a marine algal species available. A statistical comparisonbetween chronic data could not be made because there were no NOEC values for salt water algae, only oneNOEC value for salt water invertebrates and no chronic data for salt water fish. Based on the data that couldbe compared, freshwater and salt water species did not differ in sensitivity to nonylphenol and thecombination of datasets is justified.
Acute toxicity data at three trophic levels (see remark 1 in the above text) for both freshwaterand salt water are available as well as chronic toxicity data at three trophic levels forfreshwater and at two trophic levels for salt water. The most sensitive species in chronictoxicity tests is the green alga Scenedesmus subspicatus, which showed an EC10 of 3.3 µg/lfor toxicity of nonylphenol to biomass growth. An assessment factor of 10 is applied to thisvalue, leading to a PNECwater of 0.33 µg/l.
Recalculation into PNECwater, total and PNECwater, dissolvedIn the Netherlands, ERLs for water are derived for both the dissolved and total fraction.Dutch standard water contains 30 mg suspended matter (dw/l), with 20% organic matter(11.72% organic carbon). For the calculation method we refer to the Guidance document onderiving environmental risk limits [120]. The partition coefficient between suspended matterand water used in the calculation is derived from the value as reported in the EU-RAR, whichis based on an organic carbon content of 10%. EUSES uses:Kp, susp = Focsusp*Koc with a Koc value of 5360 l.kg-1. This means that for the Dutch situationKp, susp = 0.1172*5360 = 628 l.kg-1.
The PNECwater of 0.33 µg.l-1 should be regarded as PNECwater, dissolved. PNECwater, total iscalculated to be approximately equal to PNECwater, dissolved, i.e. 0.33 µg.l-1.
RIVM report 601501020 page 33 of 35
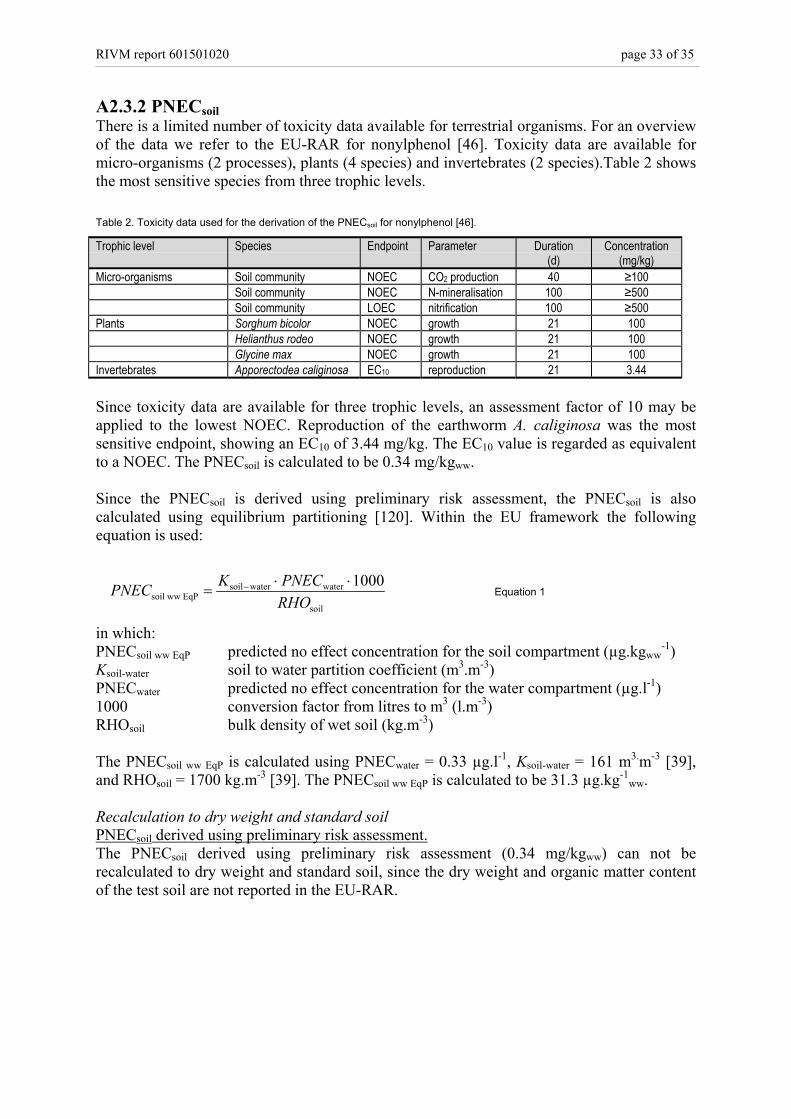
A2.3.2 PNECsoilThere is a limited number of toxicity data available for terrestrial organisms. For an overviewof the data we refer to the EU-RAR for nonylphenol [46]. Toxicity data are available formicro-organisms (2 processes), plants (4 species) and invertebrates (2 species).Table 2 showsthe most sensitive species from three trophic levels.
Table 2. Toxicity data used for the derivation of the PNECsoil for nonylphenol [46].
Trophic level Species Endpoint Parameter Duration(d)
Concentration(mg/kg)
Micro-organisms Soil community NOEC CO2 production 40 ≥100Soil community NOEC N-mineralisation 100 ≥500Soil community LOEC nitrification 100 ≥500
Plants Sorghum bicolor NOEC growth 21 100Helianthus rodeo NOEC growth 21 100Glycine max NOEC growth 21 100
Invertebrates Apporectodea caliginosa EC10 reproduction 21 3.44
Since toxicity data are available for three trophic levels, an assessment factor of 10 may beapplied to the lowest NOEC. Reproduction of the earthworm A. caliginosa was the mostsensitive endpoint, showing an EC10 of 3.44 mg/kg. The EC10 value is regarded as equivalentto a NOEC. The PNECsoil is calculated to be 0.34 mg/kgww.
Since the PNECsoil is derived using preliminary risk assessment, the PNECsoil is alsocalculated using equilibrium partitioning [120]. Within the EU framework the followingequation is used:
soil
waterwatersoilEqP wwsoil
1000RHOPNECKPNEC ⋅⋅
= − Equation 1
in which:PNECsoil ww EqP predicted no effect concentration for the soil compartment (µg.kgww
-1)Ksoil-water soil to water partition coefficient (m3.m-3)PNECwater predicted no effect concentration for the water compartment (µg.l-1)1000 conversion factor from litres to m3 (l.m-3)RHOsoil bulk density of wet soil (kg.m-3)
The PNECsoil ww EqP is calculated using PNECwater = 0.33 µg.l-1, Ksoil-water = 161 m3.m-3 [39],and RHOsoil = 1700 kg.m-3 [39]. The PNECsoil ww EqP is calculated to be 31.3 µg.kg-1
ww.
Recalculation to dry weight and standard soilPNECsoil derived using preliminary risk assessment.The PNECsoil derived using preliminary risk assessment (0.34 mg/kgww) can not berecalculated to dry weight and standard soil, since the dry weight and organic matter contentof the test soil are not reported in the EU-RAR.
RIVM report 601501020 page 34 of 35
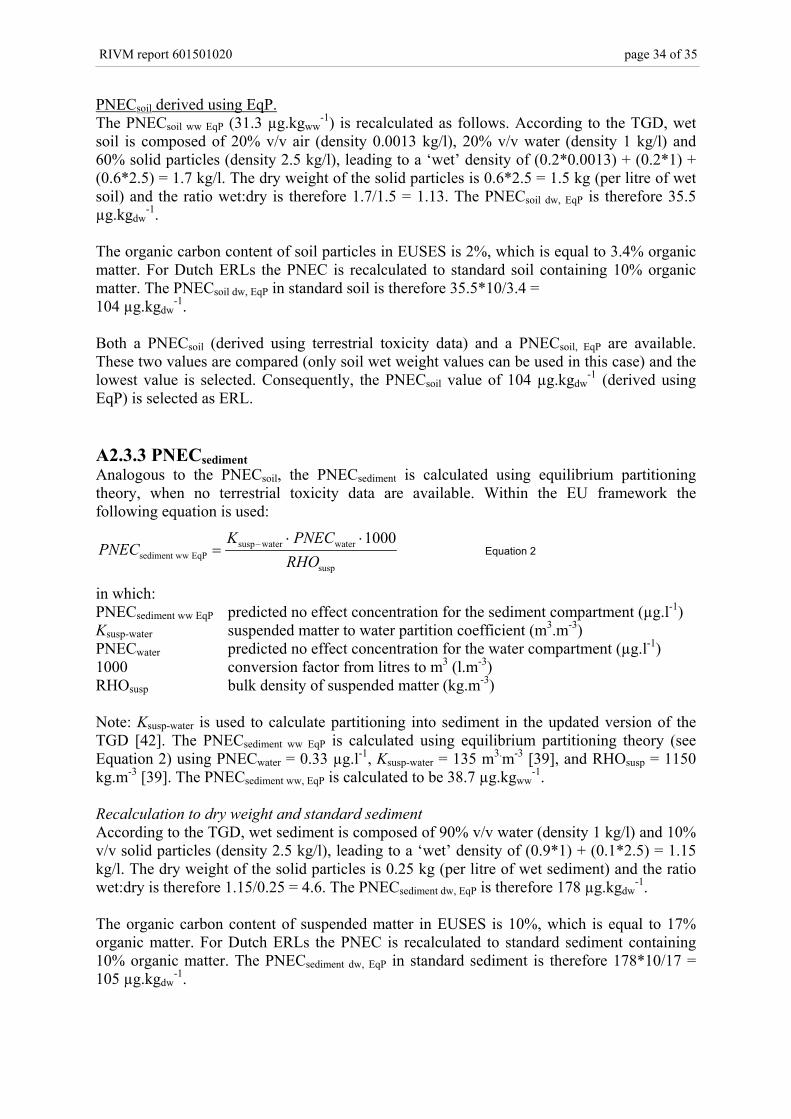
PNECsoil derived using EqP.The PNECsoil ww EqP (31.3 µg.kgww
-1) is recalculated as follows. According to the TGD, wetsoil is composed of 20% v/v air (density 0.0013 kg/l), 20% v/v water (density 1 kg/l) and60% solid particles (density 2.5 kg/l), leading to a ‘wet’ density of (0.2*0.0013) + (0.2*1) +(0.6*2.5) = 1.7 kg/l. The dry weight of the solid particles is 0.6*2.5 = 1.5 kg (per litre of wetsoil) and the ratio wet:dry is therefore 1.7/1.5 = 1.13. The PNECsoil dw, EqP is therefore 35.5µg.kgdw
-1.
The organic carbon content of soil particles in EUSES is 2%, which is equal to 3.4% organicmatter. For Dutch ERLs the PNEC is recalculated to standard soil containing 10% organicmatter. The PNECsoil dw, EqP in standard soil is therefore 35.5*10/3.4 =104 µg.kgdw
-1.
Both a PNECsoil (derived using terrestrial toxicity data) and a PNECsoil, EqP are available.These two values are compared (only soil wet weight values can be used in this case) and thelowest value is selected. Consequently, the PNECsoil value of 104 µg.kgdw
-1 (derived usingEqP) is selected as ERL.
A2.3.3 PNECsedimentAnalogous to the PNECsoil, the PNECsediment is calculated using equilibrium partitioningtheory, when no terrestrial toxicity data are available. Within the EU framework thefollowing equation is used:
susp
waterwatersuspEqPwwsediment
1000RHOPNECK
PNEC⋅⋅
= −Equation 2
in which:PNECsediment ww EqP predicted no effect concentration for the sediment compartment (µg.l-1)Ksusp-water suspended matter to water partition coefficient (m3.m-3)PNECwater predicted no effect concentration for the water compartment (µg.l-1)1000 conversion factor from litres to m3 (l.m-3)RHOsusp bulk density of suspended matter (kg.m-3)
Note: Ksusp-water is used to calculate partitioning into sediment in the updated version of theTGD [42]. The PNECsediment ww EqP is calculated using equilibrium partitioning theory (seeEquation 2) using PNECwater = 0.33 µg.l-1, Ksusp-water = 135 m3.m-3 [39], and RHOsusp = 1150kg.m-3 [39]. The PNECsediment ww, EqP is calculated to be 38.7 µg.kgww
-1.
Recalculation to dry weight and standard sedimentAccording to the TGD, wet sediment is composed of 90% v/v water (density 1 kg/l) and 10%v/v solid particles (density 2.5 kg/l), leading to a ‘wet’ density of (0.9*1) + (0.1*2.5) = 1.15kg/l. The dry weight of the solid particles is 0.25 kg (per litre of wet sediment) and the ratiowet:dry is therefore 1.15/0.25 = 4.6. The PNECsediment dw, EqP is therefore 178 µg.kgdw
-1.
The organic carbon content of suspended matter in EUSES is 10%, which is equal to 17%organic matter. For Dutch ERLs the PNEC is recalculated to standard sediment containing10% organic matter. The PNECsediment dw, EqP in standard sediment is therefore 178*10/17 =105 µg.kgdw
-1.
RIVM report 601501020 page 35 of 35
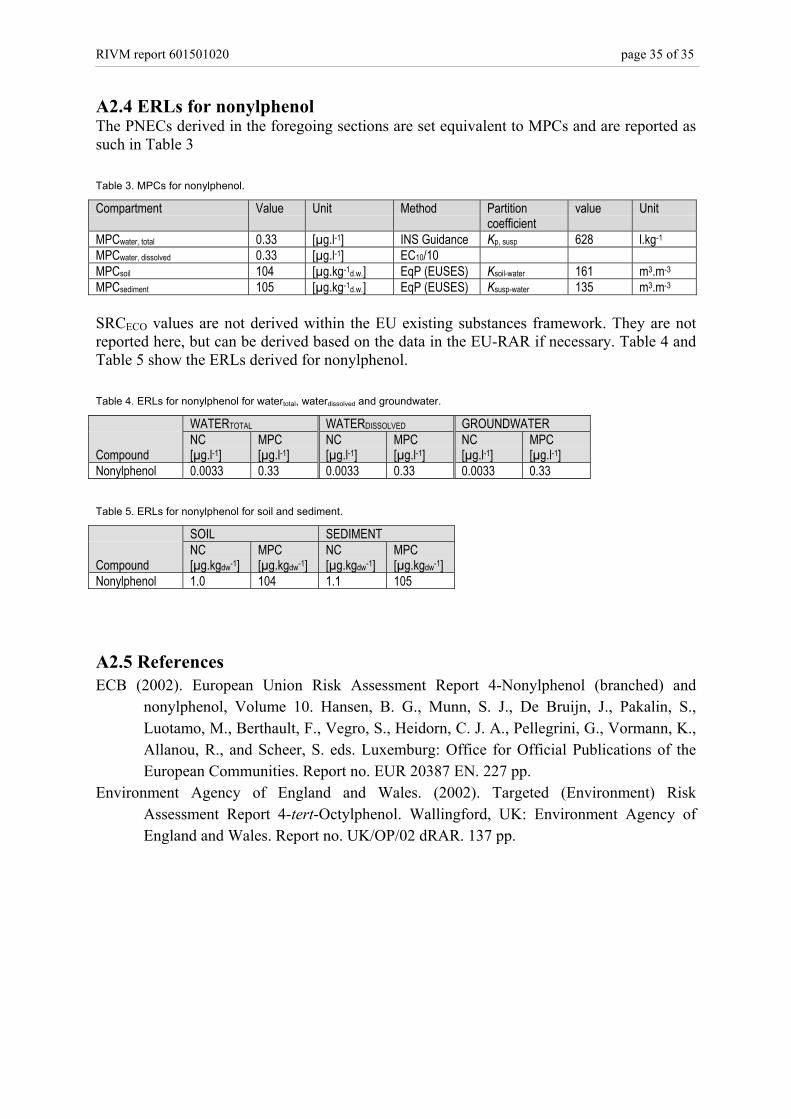
A2.4 ERLs for nonylphenolThe PNECs derived in the foregoing sections are set equivalent to MPCs and are reported assuch in Table 3
Table 3. MPCs for nonylphenol.
Compartment Value Unit Method Partitioncoefficient
value Unit
MPCwater, total 0.33 [µg.l-1] INS Guidance Kp, susp 628 l.kg-1
MPCwater, dissolved 0.33 [µg.l-1] EC10/10MPCsoil 104 [µg.kg-1d.w.] EqP (EUSES) Ksoil-water 161 m3.m-3
MPCsediment 105 [µg.kg-1d.w.] EqP (EUSES) Ksusp-water 135 m3.m-3
SRCECO values are not derived within the EU existing substances framework. They are notreported here, but can be derived based on the data in the EU-RAR if necessary. Table 4 andTable 5 show the ERLs derived for nonylphenol.
Table 4. ERLs for nonylphenol for watertotal, waterdissolved and groundwater.
WATERTOTAL WATERDISSOLVED GROUNDWATER
CompoundNC[µg.l-1]
MPC[µg.l-1]
NC[µg.l-1]
MPC[µg.l-1]
NC[µg.l-1]
MPC[µg.l-1]
Nonylphenol 0.0033 0.33 0.0033 0.33 0.0033 0.33
Table 5. ERLs for nonylphenol for soil and sediment.
SOIL SEDIMENT
CompoundNC[µg.kgdw-1]
MPC[µg.kgdw-1]
NC[µg.kgdw-1]
MPC[µg.kgdw-1]
Nonylphenol 1.0 104 1.1 105
A2.5 ReferencesECB (2002). European Union Risk Assessment Report 4-Nonylphenol (branched) and
nonylphenol, Volume 10. Hansen, B. G., Munn, S. J., De Bruijn, J., Pakalin, S.,Luotamo, M., Berthault, F., Vegro, S., Heidorn, C. J. A., Pellegrini, G., Vormann, K.,Allanou, R., and Scheer, S. eds. Luxemburg: Office for Official Publications of theEuropean Communities. Report no. EUR 20387 EN. 227 pp.
Environment Agency of England and Wales. (2002). Targeted (Environment) RiskAssessment Report 4-tert-Octylphenol. Wallingford, UK: Environment Agency ofEngland and Wales. Report no. UK/OP/02 dRAR. 137 pp.
Related Documents