CCE Status Report 2008 1 Austria National Focal Centre Umweltbundesamt GmbH (Federal Environment Agency, Austria) Erik Obersteiner Expert Centre for Datamanagement & Reporting Christian Nagl Department of Air Quality Control Spittelauer Lände 5 1090 Vienna tel: +43-1-31 304-3690 fax: +43-1-31 304-3700 [email protected] http://www.umweltbundesamt.at Collaborating institutions Austrian Federal Office and Research Centre for Forests Franz Mutsch Department of Forest Ecology Klemens Schadauer Department of Forest Inventory Seckendorff-Gudent-Weg 8 1131 Vienna tel: +43-1-87 838-0 http://bfw.ac.at Status In response to the call for data of November 2007 a new dataset of critical loads and dynamic modelling is provided. Three different approaches for the calculation of critical loads are applied. Critical Loads of acidity (CLmaxN&S) and dynamic modelling output are calculated using the VSD model and soil data from 496 soil monitoring sites. The calculation of Critical Loads of nutrient nitrogen (CLnutN) is also done using the mass balance approach, but is based on the Corine Landcover 2000 dataset and other maps instead of soil monitoring sites. This is possible because of the reduced data requirements of the CLnutN calculation and it allows the production of CLnutN maps. At least, the Empirical Critical Loads dataset (CLempN) is also based on the Corine Landcover 2000 dataset. Every record of the inputs/CLdata- and the EmpNload-tables has a unique link to the ecords-table with information describing the location (one-to-one relation). Due to restrictions of the data structure, overlapping areas of the three approaches do not point to a common location record, so summing up ecosystem areas is meaningful only within one of the three approaches.

Welcome message from author
This document is posted to help you gain knowledge. Please leave a comment to let me know what you think about it! Share it to your friends and learn new things together.
Transcript

CCE Status Report 2008
1
Austria
National Focal Centre
Umweltbundesamt GmbH (Federal Environment Agency, Austria) Erik Obersteiner
Expert Centre for Datamanagement & Reporting Christian Nagl
Department of Air Quality Control Spittelauer Lände 5 1090 Vienna tel: +43-1-31 304-3690 fax: +43-1-31 304-3700 [email protected] http://www.umweltbundesamt.at
Collaborating institutions
Austrian Federal Office and Research Centre for Forests Franz Mutsch Department of Forest Ecology Klemens Schadauer
Department of Forest Inventory Seckendorff-Gudent-Weg 8 1131 Vienna tel: +43-1-87 838-0 http://bfw.ac.at
Status
In response to the call for data of November 2007 a new dataset of critical loads and dynamic modelling is provided. Three different approaches for the calculation of critical loads are applied. Critical Loads of acidity (CLmaxN&S) and dynamic modelling output are calculated using the VSD model and soil data from 496 soil monitoring sites. The calculation of Critical Loads of nutrient nitrogen (CLnutN) is also done using the mass balance approach, but is based on the Corine Landcover 2000 dataset and other maps instead of soil monitoring sites. This is possible because of the reduced data requirements of the CLnutN calculation and it allows the production of CLnutN maps. At least, the Empirical Critical Loads dataset (CLempN) is also based on the Corine Landcover 2000 dataset.
Every record of the inputs/CLdata- and the EmpNload-tables has a unique link to the ecords-table with information describing the location (one-to-one relation). Due to restrictions of the data structure, overlapping areas of the three approaches do not point to a common location record, so summing up ecosystem areas is meaningful only within one of the three approaches.

CCE Status Report 2008
2
Critical loads of acidity
Data Sources
Soils: Soil information is based on the Austrian Forest Soil Inventory from the Austrian Federal Office and Research Centre for Forests (Forstliche Bundesversuchsanstalt 1992). About 500 sample plots were investigated in an 8.7 x 8.7 km grid between 1987 and 1990. Most of the soil input parameters to calculate critical loads and target loads were taken from this dataset. The data are part of the Soil Information System BORIS, maintained at the Federal Environment Agency.
Nutrient uptake: Information on biomass uptake is derived from data of the Austrian Forest Inventory, sampled by the Austrian Federal Office and Research Centre for Forests - BFW (Schieler et al. 2001). Mean harvesting rates for the years from 1986 to 1996 were aggregated on EMEP grid cell basis. Grid cells with too few sample points were combined with neighbouring cells. Base cation and nitrogen contents were taken from Jacobsen et al. 2002. No nutrient uptake takes place at unmanaged protection forests.
Ecosystem: Four forest ecosystem types have been investigated according to EUNIS classification: G1 (Fagus sylvatica, Quercus robur), G3 (Picea abies, Pinus sylvestris, Larix decidua), G4 and G3.1B, which is used to indicate unmanaged protection forests. The ecosystem area was identified by dividing the known ecosystem area per grid cell (from forest inventory) by the number of soil inventory points located in this ecosystem type.
Depositions: New sulphur and nitrogen deposition time series provided by the CCE 2008 ('Review of the 1999 Gothenburg Protocol', Executive Body for the Convention [2007], ECE/EB.AIR/WG.5/2007/7); Base cation depositions: van Loon et al. 2005
Calculation Method
The calculations and assumptions are generally in accordance with the Mapping Manual (ICP M&M (2004) and the CCE Status Reports. A detailed description of the parameters and the data and methods used for their derivation is given in table AT-1.
The Access version of VSD was used for critical loads calculation and dynamic modelling. For the cation exchange the Gapon model was used, the exchange constants were calibrated. Theta was set to be 0.3, CNmin and CNmax were set to be 10 resp. 40. Oliver constants for the organic acid dissociation model were set to be 4.5, 0, 0.
Base cations were lumped together in the Ca column for weathering and uptake. Due to the lack of spatial distributed information on organic acids, default values for all records were used.
Calcareous soils occur at 30% of the sample points representing about 40% of the ecosystem area.

CCE Status Report 2008
3
Table AT-1. Data description, methods and sources for the CL of acidity calculation
Variable Explanation and Unit Description
CLmaxS Maximum critical load of sulphur (eq ha-1 a-1) calculated by VSD
CLminN Minimum critical load of nitrogen (eq ha-1 a-1) calculated by VSD
CLmaxN Maximum critical load of nitrogen (eq ha-1 a-1) calculated by VSD
nANCcrit The quantity –ANCle(crit) (eq ha-1 a-1) calculated by VSD
crittype Chemical criterion used used: molar Al/Bc (1)
critvalue Critical value for the chemical criterion used: 1
thick Thickness of the soil (m) mostly 0.5 m, sometimes less, depending on soil inventory data
bulkdens Average bulk density of the soil (g cm-3) Mapping Manual 6.4.1.3 eq. 6.27
Cadep Total deposition of calcium (eq ha-1 a-1) total depositions for forest ecosystems (van Loon et al. 2005)
Mgdep Total deposition of magnesium (eq ha-1 a-1) total depositions for forest ecosystems (van Loon et al. 2005)
Kdep Total deposition of potassium (eq ha-1 a-1) total depositions for forest ecosystems (van Loon et al. 2005)
Nadep Total deposition of sodium (eq ha-1 a-1) total depositions for forest ecosystems (van Loon et al. 2005)
Cldep Total deposition of chloride (eq ha-1 a-1) Nadep * 1.166 (Nadep from van Loon et al. 2005)
Bcwe Weathering of base cations (eq ha-1 a-1) Mapping Manual 5.3.2.3, eq. 5.39; Table 5-14 (WRc = 20 for calcareous soils; factor 0.8 for Na reduction)
Bcupt Net growth uptake of base cations (eq ha-1 a-1) [average yearly yield rate * base cation content], data from Austrian forest inventory, base cation contents from Jacobsen et al. 2002 (no uptake from unmanaged protection forests)
Qle Amount of water percolating through the root zone (mm a-1)
Hydrological Atlas of Austria-v.2
lgKAlox Equilibrium constant for the Al-H relationship (log10) [9.8602 - 1.6755 * log(OM) for 1.25 < OM < 100; 9.7 for OM < 1.25]; SAEFL 2005 ( OM = Organic Matter [%])
expAl Exponent for the Al-H relationship used: 3 (gibbsite equilibrium)
pCO2fac Partial CO2-pressure in soil solution as multiple of the at-mospheric CO2 pressure (-)
[log10pco2 = -2.38 + 0.031 * Temp (°C)]; atmospheric CO2 pressure = 0.00037 atm; equation recommended by CCE
cOrgacids Total concentration of organic acids (m*DOC) (eq m-3) used: 0,01 (recommended by Max Posch)
Nimacc Acceptable amount of nitrogen immobilised in the soil (eq ha-1 a-1)
decreasing from 5 kg N in the highlands (< 5° C mean Temp) to 1 kg N in the lowlands (> 8° C mean Temp); see German NFC Report in Posch et al. 2001, p.142, Table DE-7
Nupt Net growth uptake of nitrogen (eq ha-1 a-1) [average yearly yield rate * N content], data from Austrian forest inven-tory, N contents from Jacobsen et al. 2002
fde Denitrification fraction (0≤fde<1) (–) from 0.1 (dry) to 0.7 (wet) according to soil moisture class; information from soil inventory
CEC Cation exchange capacity (meq kg-1) information from soil inventory; calibrated to pH 6.5 (Mapping Manual 6.4.1.3 eq. 6.29)
bsat Base saturation (–) information from soil inventory
yearbsat Year in which the base saturation was determined year of soil inventory (1987-1990)
lgKAlBc Exchange constant for Al vs. Bc (log10) calibrated by VSD; initial value 0
lgKHBc Exchange constant for H vs. Bc (log10) calibrated by VSD; initial value 3
Cpool Initial amount of carbon in the topsoil (g m-2) [thick * bulkdens * Corg(%) * 10 000]; for mineral topsoil (0-10 cm) + organic layer; information from soil inventory
CNrat C/N ratio in the topsoil Cpool / Npool
yearCN Year in which the CNratio and Cpool were determined year of soil inventory (1987-1990)
Measured On-site measurements included? all sites: ICP-Forests (1)
EUNIScode EUNIScode of ecosystem information from soil inventory: G1, G3, G4, G3.1B (unmanaged protec-tion forests)
Protection Type of nature protection (SAC, SPA...) status unknown at all sites (-1)
EcoArea Area of the ecosystem within the EMEP grid cell (km2) calculated from Austrian forest inventory data (virtual area)

CCE Status Report 2008
4
Critical loads of nutrient nitrogen
Data Sources and Calculation Method
The calculation of CLnutN is based on about 18 000 forest patches of the Austrian Corine Landcover dataset. Generally data sources and calculation method are comparable to the CL of acidity method, although some changes were necessary due to the different spatial approach and the data availability.
Denitrifikation: The denitrification fraction is based on the soil type units of the soil map 1:1 000 000 of the Hydrological Atlas of Austria as no better spatial distributed information on soil moisture in forests is available. The assignment of fde-values to soil types is based on an analysis of soil moisture classes within soil types of the Austrian forest soil inventory dataset.
Table AT-2. Assignment of fde-values to soil type units
Soil type unit fde Rendzina, Lithosol, orthic Luvisol 0.3 Chernosem, Cambisol, gleyic Luvisol, Regosol, Podzol, Solonetz 0.4 Fluvisol, Planosol 0.5 Histosol 0.7
Leaching: As the acceptable leaching does not depend on the precipitation surplus and the critical nitrogen concentration but on the altitude (see Swiss NFC Report in Posch et al. 2001), the cNacc is back-calculated from the acceptable leaching and Q leading to very high (at low Q values) and very low (at high Q values) acceptable nitrogen concentrations.
Ecosystem: EUNIS type G3.1B, which is used to indicate unmanaged protection forests, cannot be identified within the Corine Landcover dataset. On the other hand, the area per EMEP grid cell is known from the forest inventory. As protection forests are mostly located at higher altitudes, G3-patches (coniferous forests) were successively added to the G3.1 area, moving downwards from the highest parts of the EMEP grid cell , until the area of protection forest reported in the Austrian Forest Inventory was reached.
A description of the parameters and the data and methods used for their derivation is given in table AT-3.
Table AT-3. Data description, methods and sources for the CLnutN calculation
Variable Explanation and Unit Description CLnutN Critical load of nutrient nitrogen (eq ha-1 a-1) Mapping Manual 5.3.1.1, eq. 5.5 cNacc Acceptable (critical) N concentration (meq m-3) back-calculated from Nleacc and Qle Nleacc Acceptable nitrogen leaching (eq ha-1 a-1) decreasing from 4 kg N in the lowlands (500 m a.s.l.) to 2 kg N at 2000 m
a.s.l. (see Swiss NFC Report in Posch et al. 2001) Qle Amount of water percolating through the root zone (mm a-1) Hydrological Atlas of Austria-v.2 Nimacc Acceptable amount of nitrogen immobilised in the soil
(eq ha-1 a-1) decreasing from 5 kg N in the highlands (< 5° C mean Temp) to 1 kg N in the lowlands (> 8° C mean Temp); see German NFC Report in Posch et al. 2001, p.142, Table DE-7
Nupt Net growth uptake of nitrogen (eq ha-1 a-1) [average yearly yield rate * N content], data from Austrian forest inventory, N contents from Jacobsen et al. 2002
fde Denitrification fraction (0≤fde<1) (-) from 0.1 (dry) to 0.7 (wet) according to the soil type of the soil map 1:1 Mio. of the Hydrological Atlas of Austria-V.2
Measured On-site measurements included? all sites: no measurements (0) EUNIS code EUNIS code of ecosystem Corine Landcover 2000; G1, G3, G4, G3.1B (unmanaged protection forests
- information from Austrian forest inventory) Protection Type of nature protection (SAC, SPA, ...) status unknown at all sites (-1) EcoArea Area of the ecosystem within the EMEP grid cell (km2) Corine Landcover 2000 patch size
CCE Status Report 2008
5
Empirical Critical Loads
Data Sources and Calculation Method
The Austrian Corine Landcover 2000 dataset is the main data source for this study. Additionally, the Austrian mire conservation database is used to update the small-scale CLC2000 data with mire, bog and fen habitats.
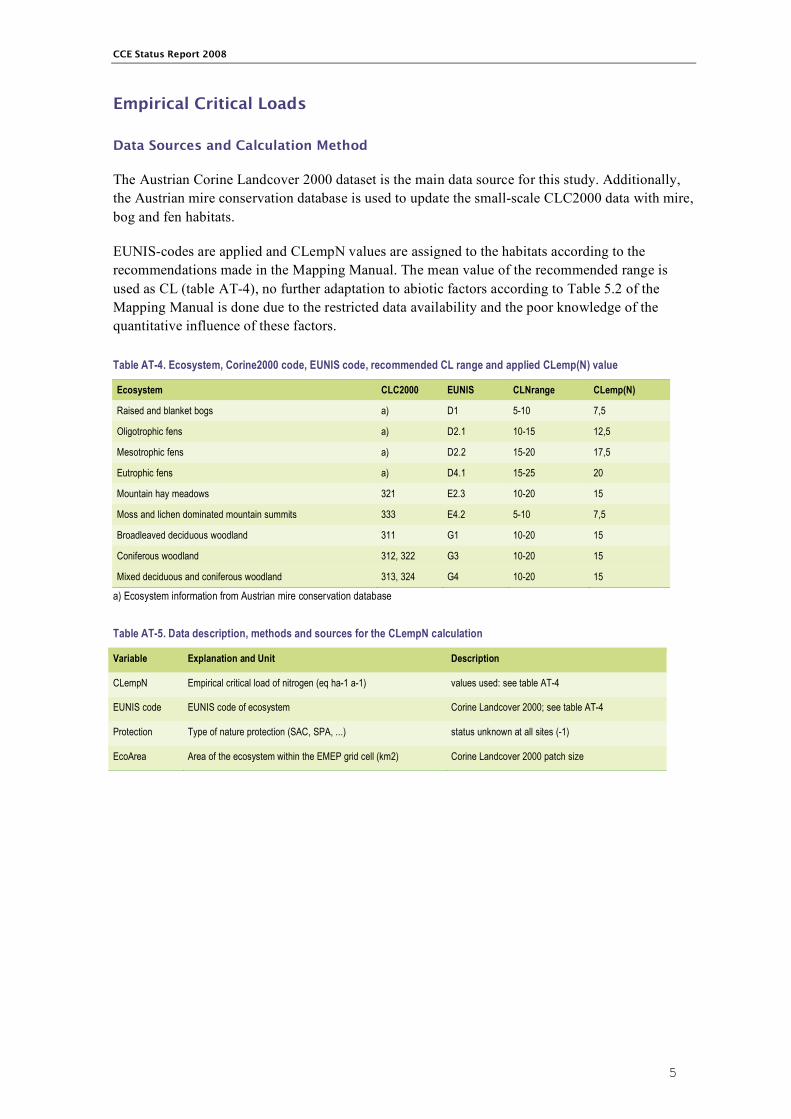
EUNIS-codes are applied and CLempN values are assigned to the habitats according to the recommendations made in the Mapping Manual. The mean value of the recommended range is used as CL (table AT-4), no further adaptation to abiotic factors according to Table 5.2 of the Mapping Manual is done due to the restricted data availability and the poor knowledge of the quantitative influence of these factors.
Table AT-4. Ecosystem, Corine2000 code, EUNIS code, recommended CL range and applied CLemp(N) value
Ecosystem CLC2000 EUNIS CLNrange CLemp(N)
Raised and blanket bogs a) D1 5-10 7,5
Oligotrophic fens a) D2.1 10-15 12,5
Mesotrophic fens a) D2.2 15-20 17,5
Eutrophic fens a) D4.1 15-25 20
Mountain hay meadows 321 E2.3 10-20 15
Moss and lichen dominated mountain summits 333 E4.2 5-10 7,5
Broadleaved deciduous woodland 311 G1 10-20 15
Coniferous woodland 312, 322 G3 10-20 15
Mixed deciduous and coniferous woodland 313, 324 G4 10-20 15
a) Ecosystem information from Austrian mire conservation database
Table AT-5. Data description, methods and sources for the CLempN calculation
Variable Explanation and Unit Description
CLempN Empirical critical load of nitrogen (eq ha-1 a-1) values used: see table AT-4
EUNIS code EUNIS code of ecosystem Corine Landcover 2000; see table AT-4
Protection Type of nature protection (SAC, SPA, ...) status unknown at all sites (-1)
EcoArea Area of the ecosystem within the EMEP grid cell (km2) Corine Landcover 2000 patch size

CCE Status Report 2008
6
References BMLFUW - Bundesministerium für Land- und Forstwirtschaft, Umwelt und Wasserwirtschaft [Eds.] (2003):
Hydrologischer Atlas Österreichs. 2. Lieferung, BMLFUW, Wien Bobbink, R., M. Ashmore, Braun, S., Flückiger, W., Van den Wyngaert, I. (2002): Empirical nitrogen critical loads for
natural and semi-natural ecosystems: 2002 update. Environmental Documentation 164, Swiss Agency for the Environment, Forests and Landscape.
CLC 2000 - Corine Land Cover, © EEA, Copenhagen, 2006 de Vries, W. et al. (2006): Developments in deriving critical limits and model-ing critical loads of nitrogen for terrestrial
ecosystems in Europe. Draft final Report, Alterra-CCE Collaborative Report 1382, Alterra, Wageningen and CCE, Bilthoven
Forstliche Bundesversuchsanstalt [eds.] (1992): Österreichische Waldboden-Zustandsinventur. Ergebnisse, Mitteilungen der Forstlichen Bundesversuchsanstalt, Wien
ICP M&M (2004): Manual on Methodologies and Criteria for Modelling and Mapping Critical Loads & Levels and Air Pollution Effects, Risks and Trends - Revision 2004. online-version: http://www.icpmapping.org
Jacobsen, C.; Rademacher, P.; Meesenburg, H.; Meiwes, KJ. (2002): Gehalte chemischer Elemente in Baumkompartimenten. Niedersächsische forstliche Versuchsanstalt Göttingen, im Auftrag des BMVEL, Bonn
Lexer, M.J., Hönninger, K., Scheifinger, H., Matulla, Ch., Groll, N., Kromp-Kolb, H., Schadauer, K., Starlinger, F., Englisch, M. 2001: The sensitivity of the Austrian forests to scenarios of climatic change. - Monographien, Umweltbundesamt Wien, 132: 1-132.
Posch, M.; De Smet, P.A.M.;Hettelingh, J-P.; Downing, R.J. [eds.] (2001): Modelling and mapping of critical thresholds in Europe. CCE Status Report 2001. Report 259101010/2001, Coordination Center for Effects, RIVM, Bilthoven, The Netherlands
Posch, M.; Hettelingh, J-P.; Slootweg, J.; Downing, R.J. [eds.] (2003): Modelling and Mapping of Critical Thresholds in Europe: CCE Status Report 2003. Report 259101013/2003, Coordination Center for Ef-fects, RIVM, Bilthoven, The Netherlands
Posch, M.; Slootweg, J.; Hettelingh, j-P. (2005): European Critical Loads and Dynamic Modelling. CCE Status Report 2005, Report No. 259101016/2005, Coordination Center for Ef-fects, RIVM, Bilthoven, The Netherlands
Schieler, K.; Schadauer, K. (2001): The Austrian Forest Inventory 1992-96. online-publication http://fbva.forvie.ac.at/700/1891.html, Austrian Federal Office and Research Centre for Forests, Vienna
Steiner, G.M.; 1992: Österreichischer Moorschutzkatalog. Bundesministerium f. Umwelt, Jugend u. Familie, Grüne Reihe 1, Wien
van Loon, M.; Tarrason, L.; Posch, M. (2005): Modelling Base Cations in Europe. EMEP/MSC-W & CCE Note x/2005 - Draft 1.2.2005

CCE Status Report 2008
7
Belgium
Flanders
National Focal Centre/Contacts
Stijn Overloop Flemish Environment Agency (VMM) Van Benedenlaan 34 B-2800 Mechelen
Tel: +32-15-451471 Fax: +32-15-433280 E-mail: [email protected] www.vmm.be
Interdisciplinary Team/Contacts
Jeroen Staelens, Johan Neirynck Research Institute for Nature and Forest (INBO) Gaverstraat 4, B-9500 Geraardsbergen E-mail: [email protected]; [email protected] www.inbo.be
Hans Vereecken, Martin Hermy Laboratory for Forest, Nature and Landscape Research, K.U. Leuven Vital Decosterstraat 102, B-3000 Leuven
Jan Meykens, Maarten Geypens Soil Service of Belgium Willem de Croylaan 48, B-3001 Leuven-Heverlee
Wallonia
National Focal Centre/Contacts
M. Loutsch, A. Fourmeaux Ministry of Walloon Region, DGRNE Avenue Prince de Liège 15 B-5100 Namur
tel : +32 -81-325784 fax : +32-81-325784 email: [email protected]

CCE Status Report 2008
8
Interdisciplinary Team/Contacts
V. Vanderheyden, J-F. Kreit SITEREM S.A. Cour de la Taillette, 4, B-1348 Louvain-la-Neuve email: [email protected]
S. Eloy Scientific Institute for Public Services (ISSEP) Rue du Chera, 200, B-4000 Liège email: [email protected]
C. Demuth Belgian Interregional Cell for the Environment(CELINE) Avenue des Arts, 10-11, B-1210 Bruxelles email: [email protected]
University of Liège: J. Remacle, B. Bosman, M. Carnol
Dep. Plant Biology Sart Tilman B22 email : [email protected]
J.P. Thomé, Y. Marneffe, F. Masset Zoology Institute email: [email protected]
E. Everbecq, J. Smitz Environmental center, Sart Tilman B5 email: [email protected]
Catholic University of Louvain: B. Delvaux, V. Brahy Dept. of Soil Science email: [email protected]
P. Giot Dept. of waters and forests email: [email protected]
Critical load and dynamic modelling data sources and methods
Flanders
Critical loads of acidity and nutrient nitrogen for ecosystems in Flanders were calculated using the Simple Mass Balance (SMB) model as described in the Mapping Manual (UBA 2004). Compared to the results presented in the CCE Status Report 2003 (Posch et al. 2003), critical loads for forests were updated and the first dynamic modelling results were produced using the VSD model (Staelens et al. 2006). For grassland and heather (Meykens et al. 2001), no updates were made compared to Posch et al. (2003) and hence, data sources and methods for these ecosystems are not repeated here.

CCE Status Report 2008
9
Critical loads for forests Critical loads of acidity and of nutrient nitrogen were calculated for 1438 forest locations in Flanders. Table BE-1 summarizes the methods and data sources used. The critical loads of acidity were not corrected for the seasalt derived sulphur deposition.
Table BE-1. Crititical loads and dynamic modelling data sources and methods for forests in Flanders
Parameter Term Unit Description
Critical loads of acidity CLmax(S) eq ha-1 a-1 UBA (2004) Eq. 5.22
CLmin(N) eq ha-1 a-1 UBA (2004) Eq. 5.25
CLmax(N) eq ha-1 a-1 UBA (2004) Eq. 5.26
Critical load of nutrient N CLnut(N) eq ha-1 a-1 UBA (2004) Eq. 5.5
Critical leaching of acid neutralising capacity ANCle,crit eq ha-1 a-1 Critical molar ratio of Al:Bc = 1
Acceptable N leaching Nle,acc eq ha-1 a-1 100 eq ha-1 a-1
Thickness of the root zone z m 0.5 m
Average bulk density of the soil bulkdens g cm-1 Data of 83 Level I and II forest plots
Bc, Na+ and Cl- deposition Bcdep, Nadep, Cldep
eq ha-1 a-1 Based on throughfall data of five Level II forest plots (2000-2004) corrected for canopy exchange
Weathering of base cations Bcw eq ha-1 a-1 Soil type - texture approximation
Net growth uptake of Bc and N Bcu, Nu eq ha-1 a-1 Tree species specific growth and nutrient content data from Belgian and Dutch literature
Precipitation surplus Qle mm a-1 Based on interpolated rainfall data and species specific interception and evapotranspiration
Exponent for Al-H relationship expAl - 3 (i.e. assumed gibbsite equilibrium)
Equilibrium constant for the Al-H relationship (log10)
log(KAlox) (eq m-3)1-expAl 8.5 for mineral soils 7.5 for organic soils
Partial CO2 pressure in soil solution pCO2 - 15 times the atmospheric CO2 pressure
Total concentration of organic acids m·DOC eq m-3 0.09 (based on a mean measured [DOC] of 1.35 mol C m-3 and m value in de Vries et al. (2001))
Dissociation constant organic acids K1 mol L-1 Oliver model, UBA (2004) Eq. 5.47
Acceptable N immobilisation in soil Ni,acc eq ha-1 a-1 Method of Van Hinsberg and de Vries (2003)
Denitrification fraction fde - Based on soil type and drainage status
Cation exchange capacity (at pH 6.5) CEC meq kg-1 Data of Level I and II forest plots, standardized at pH 6.5 by UBA (2004) Eq. 6.28 and 6.29
Base saturation (at pH 6.5) Bsat - Exchangeable base cation data of Level I and II forest plots (as a fraction of the CEC at pH 6.5)
Exchange constant for Al vs. Bc (log10) lg(kAlBc) (mol L-1)1/6 Calibrated by the VSD model
Exchange constant for Al vs. H (log10) lg(kHlBc) (mol L-1)-1/2 Calibrated by the VSD model
Actual amount of C in top soil (0-20 cm) Cpool g m-2 Data of Level I and II forest plots
C/N ratio in topsoil (0-20 cm) CNrat - Data of Level I and II forest plots
Nitrogen and S deposition Ndep, Sdep eq ha-1 a-1 Time series from Schöpp et al. (2003) for the EMEP 50 x 50 km grid as provided by the CCE
Cation exchange model - - Gapon exchange model
Maximum and mininum C/N ratio in topsoil CNmax CNmin -
40 12
Soil moisture content theta m3 m-3 0.12 (VSD is unsensitive to this parameter)
CCE Status Report 2008
10
The following changes were made compared to the former critical load calculations: • Including the dissocation of organic acids and bicarbonate leaching in the SMB model. • Mineral weathering estimated based on both the clay and sand soil content. • Including atmospheric deposition of Na+ and Cl-. • Updated (lower) atmospheric deposition of K+, Ca2+ and Mg2+ based on recent throughfall
measurements (2000-2004) that were corrected for canopy exchange. • Precipitation surplus calculated based on data from more weather stations and on actual
evapotranspiration values per tree species. • Long-term acceptable nitrogen immobilisation calculated by accepting a change of 0.2% of N
in the organic matter pool in the upper soil layer (0-20 cm) during a period of 100 years (cf. Van Hinsberg and de Vries 2003). When no data on carbon soil pool were available, the median value of a representative subset of forest soils was used.
Dynamic modelling for forests
Dynamic modelling has been executed for 83 non-calcareous Level I and II forest plots in forests using the Microsoft Office Access version of the Very Simple Dynamic (VSD) model. According to the critical load calculations, these 83 plots can be considered as a representative subset of the larger critical load database (n = 1438) for Flanders. The plots were chosen because of the availibility of recent soil data needed for dynamic modelling (CEC, base saturation, C pool and C/N ratio).
Table BE-1 describes the main data sources used in this first attempt to the dynamic modelling of forest soil acidification and recovery for the Flemish region. Soil solution concentrations measured in five Level II plots were used to determine an empirical relationship between aluminum- and proton concentrations. However, when the derived parameters expAl and pKAlox were used to calculate target loads, the criterion Al:Bc = 1 could never be reached before 2100, and therefore a gibbsite equilibrium was assumed. Critical loads of acidity were much less sensitive to the assumed relationship between pAl and pH than target loads of acidity.
Calibration of initial C:N ratio and exchange constants are based on the EMEP nitrogen and sulphur deposition time series provided by the CCE, as recommended, even though the EMEP sulphur depositions were on average 40% higher during the period 1990-2004 than a regional emission-based deposition model (OPS). For reasons of consistency, the same - relatively low - base cation depositions as for the critical load calculations were used for dynamic modelling throughout the entire simulation period (1880-2100). However, the past higher sulphur depositions onto forest vegetation likely were accompanied by higher calcium depositions than at present. Consequently, more reliable results might be accompliced if EMEP deposition time series would also be available for base cations, and when a time dependent base cation deposition could be taken into account in the Access version of the VSD model.
Wallonia
Maps have been produced for coniferous, deciduous and mixed forests.
Mapping procedure Wallonia
Digitized maps with a total of 1900 ecosystems were overlaid by a 5 x 5 km2 grid to produce the resulting maps. In Wallonia, the critical value given for a grid cell represents the average of the critical values weighted by their respective ecosystem area (coniferous, deciduous or mixed forests).

CCE Status Report 2008
11
Calculation methods & results Wallonia
A. Forest Soils
Calculation methods Critical loads for forest soils were calculated according to the method as described in UBA (1996) and Manual for Dynamic Modelling of Soil Response to Atmospheric Deposition (2003):
CLmax(S) = BCwe + BCdep – BCu – ANCle(crit) CLmax(N) = Ni + Nu + CLmax(S) CLnut(N) = Ni + Nu + Nle + Nde ANCle(crit) = -Qle ([Al3+] + [H+] - [RCOO-])
Where :
[Al3+] = 0.2 eq/m3 [H+] = concentration of [H+] at the pH critique (table BE-4). [RCOO-]= 0.044 molc/molC x DOCmeasured (table BE-4)
The equilibrium K = [Al3+]/[H+]3 criterion: The Al3+ concentration was estimated by 1) experimen-tal speciation of soil solutions to measure rapidly reacting aluminium, Alqr (Clarke et al.,1992); 2) calculation of Al3+ concentration from Alqr using the SPECIES speciation software. The K values established for 10 representative Walloon forest soils (table BE-2) were more relevant than the gibbsite equilibrium constant recommended in the manual (UBA, 1996). The difference between the estimated Al3+ concentrations and concentration that causes damage to root system (0.2 eq Al3+/m3 ; de Vries et al., 1994) gives the remaining capacity of the soil to neutralise the acidity.
The Tables BE-2 and BE-3 summarise the values given to some of the parameters.
Table BE-2 : Aluminium equilibrium and weathering rates calculated for Walloon soils.
Sites Soil types K BCwe (eq ha-1 yr-1) Bande (1-2) Podzol 140 610 Chimay (1) Cambisol 414 1443 Eupen (1) Cambisol 2438 2057 Eupen (2) Cambisol 25 852 Hotton (1) Cambisol 2736 4366 Louvain-la-Neuve (1) Luvisol 656 638 Meix-dvt-Virton (1) Cambisol 2329 467 Ruette (1) Cambisol 5335 3531 Transinne (1) Cambisol 3525 560 Willerzie (2) Cambisol 2553 596 (1) deciduous or (2) coniferous forest
Table BE-3. Constants used in critical loads calculations in Wallonia
Parameter Value Ni 5.6 kg N ha-1 yr-1 coniferous forest 7.7 kg N ha-1 yr-1 deciduous forest 6.65 kg N ha-1 yr-1 mixed forest Nle (acc) 4 mg N L-1 for coniferous forest 6.5 mg N L-1 for deciduous forest 5.25 mg N L-1 for mixed forest Nde Fraction of (Ndep – Ni – Nu)
CCE Status Report 2008
12
Soils : In Wallonia, 47 soil types were distinguished according to the soil associations map of the Walloon territory, established by Maréchal and Tavernier (1970). Each ecosystem is characterised by a soil type and a forest type.
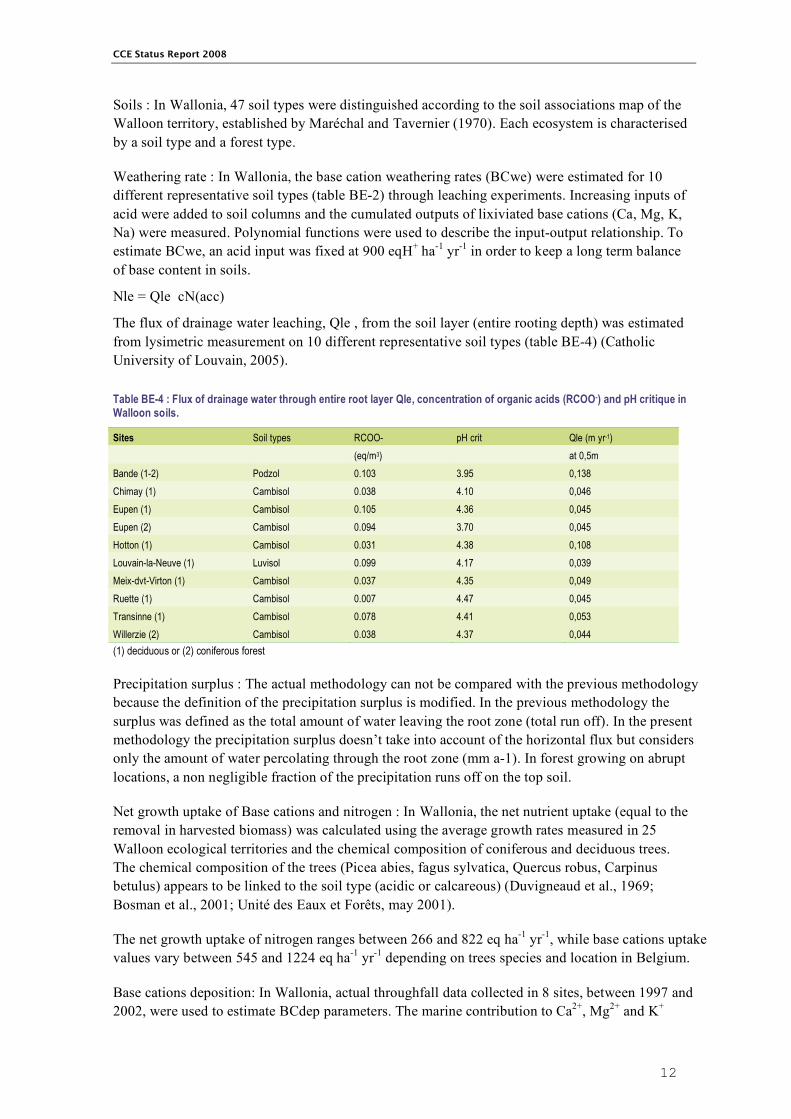
Weathering rate : In Wallonia, the base cation weathering rates (BCwe) were estimated for 10 different representative soil types (table BE-2) through leaching experiments. Increasing inputs of acid were added to soil columns and the cumulated outputs of lixiviated base cations (Ca, Mg, K, Na) were measured. Polynomial functions were used to describe the input-output relationship. To estimate BCwe, an acid input was fixed at 900 eqH+ ha-1 yr-1 in order to keep a long term balance of base content in soils.
Nle = Qle cN(acc)
The flux of drainage water leaching, Qle , from the soil layer (entire rooting depth) was estimated from lysimetric measurement on 10 different representative soil types (table BE-4) (Catholic University of Louvain, 2005).
Table BE-4 : Flux of drainage water through entire root layer Qle, concentration of organic acids (RCOO-) and pH critique in Walloon soils.
Sites Soil types RCOO- pH crit Qle (m yr-1) (eq/m3) at 0,5m Bande (1-2) Podzol 0.103 3.95 0,138 Chimay (1) Cambisol 0.038 4.10 0,046 Eupen (1) Cambisol 0.105 4.36 0,045 Eupen (2) Cambisol 0.094 3.70 0,045 Hotton (1) Cambisol 0.031 4.38 0,108 Louvain-la-Neuve (1) Luvisol 0.099 4.17 0,039 Meix-dvt-Virton (1) Cambisol 0.037 4.35 0,049 Ruette (1) Cambisol 0.007 4.47 0,045 Transinne (1) Cambisol 0.078 4.41 0,053 Willerzie (2) Cambisol 0.038 4.37 0,044 (1) deciduous or (2) coniferous forest
Precipitation surplus : The actual methodology can not be compared with the previous methodology because the definition of the precipitation surplus is modified. In the previous methodology the surplus was defined as the total amount of water leaving the root zone (total run off). In the present methodology the precipitation surplus doesn’t take into account of the horizontal flux but considers only the amount of water percolating through the root zone (mm a-1). In forest growing on abrupt locations, a non negligible fraction of the precipitation runs off on the top soil.
Net growth uptake of Base cations and nitrogen : In Wallonia, the net nutrient uptake (equal to the removal in harvested biomass) was calculated using the average growth rates measured in 25 Walloon ecological territories and the chemical composition of coniferous and deciduous trees. The chemical composition of the trees (Picea abies, fagus sylvatica, Quercus robus, Carpinus betulus) appears to be linked to the soil type (acidic or calcareous) (Duvigneaud et al., 1969; Bosman et al., 2001; Unité des Eaux et Forêts, may 2001).
The net growth uptake of nitrogen ranges between 266 and 822 eq ha-1 yr-1, while base cations uptake values vary between 545 and 1224 eq ha-1 yr-1 depending on trees species and location in Belgium.
Base cations deposition: In Wallonia, actual throughfall data collected in 8 sites, between 1997 and 2002, were used to estimate BCdep parameters. The marine contribution to Ca2+, Mg2+ and K+

CCE Status Report 2008
13
depositions was estimated using sodium deposition according to the method described in UBA (1996). The BCdep data of the 8 sites was extrapolated to all Walloon ecosystems as a function of the location and the tree species.
Results
In Wallonia, The highest CL values were found in calcareous soils under deciduous or coniferous forests. The measured release rate of base cations from soil weathering processes is high in these areas, and thus provides a high long-term buffering capacity against soil acidification. More sensitive forest ecosystems are met on sandy-loamy or loamy gravelly soils. The lowest CLnut values were found in Ardennes. In this zone, Picea abies L.Karts. frequently show magnesium deficiency symptoms, which have been exacerbated by atmospheric pollution (Weissen et al, 1990).
Table BE-1. Crititical loads and dynamic modelling data sources and methods for forests in Flanders
Parameter Term Unit Description Critical loads of acidity CLmax(S) eq ha-1 a-1 UBA (2004) Eq. 5.22 CLmin(N) eq ha-1 a-1 UBA (2004) Eq. 5.25 CLmax(N) eq ha-1 a-1 UBA (2004) Eq. 5.26 Critical load of nutrient N CLnut(N) eq ha-1 a-1 UBA (2004) Eq. 5.5 Critical leaching of acid neutralising capacity ANCle,crit eq ha-1 a-1 Critical molar ratio of Al:Bc = 1 Acceptable N leaching Nle,acc eq ha-1 a-1 100 eq ha-1 a-1 Thickness of the root zone z m 0.5 m Average bulk density of the soil bulkdens g cm-1 Data of 83 Level I and II forest plots Bc, Na+ and Cl- deposition Bcdep, Nadep,
Cldep eq ha-1 a-1 Based on throughfall data of five Level II forest plots (2000-
2004) corrected for canopy exchange Weathering of base cations Bcw eq ha-1 a-1 Soil type - texture approximation Net growth uptake of Bc and N Bcu, Nu eq ha-1 a-1 Tree species specific growth and nutrient content data from
Belgian and Dutch literature Precipitation surplus Qle mm a-1 Based on interpolated rainfall data and species specific inter-
ception and evapotranspiration Exponent for Al-H relationship expAl - 3 (i.e. assumed gibbsite equilibrium) Equilibrium constant for the Al-H relationship (log10)
log(KAlox) (eq m-3)1-expAl 8.5 for mineral soils 7.5 for organic soils
Partial CO2 pressure in soil solution pCO2 - 15 times the atmospheric CO2 pressure Total concentration of organic acids m·DOC eq m-3 0.09 (based on a mean measured [DOC] of 1.35 mol C m-3 and
m value in de Vries et al. (2001)) Dissociation constant organic acids K1 mol L-1 Oliver model, UBA (2004) Eq. 5.47 Acceptable N immobilisation in soil Ni,acc eq ha-1 a-1 Method of Van Hinsberg and de Vries (2003) Denitrification fraction fde - Based on soil type and drainage status Cation exchange capacity (at pH 6.5) CEC meq kg-1 Data of Level I and II forest plots, standardized at pH 6.5 by
UBA (2004) Eq. 6.28 and 6.29 Base saturation (at pH 6.5) Bsat - Exchangeable base cation data of Level I and II forest plots (as
a fraction of the CEC at pH 6.5) Exchange constant for Al vs. Bc (log10) lg(kAlBc) (mol L-1)1/6 Calibrated by the VSD model Exchange constant for Al vs. H (log10) lg(kHlBc) (mol L-1)-1/2 Calibrated by the VSD model Actual amount of C in top soil (0-20 cm) Cpool g m-2 Data of Level I and II forest plots C/N ratio in topsoil (0-20 cm) CNrat - Data of Level I and II forest plots Nitrogen and S deposition Ndep, Sdep eq ha-1 a-1 Time series from Schöpp et al. (2003) for the EMEP 50 x 50 km
grid as provided by the CCE Cation exchange model - - Gapon exchange model Maximum and mininum C/N ratio in topsoil CNmax CNmin -
40 12
Soil moisture content theta m3 m-3 0.12 (VSD is unsensitive to this parameter)

CCE Status Report 2008
14
References Bosman B., Remacle J. & Carnol M.(2001) Element removal in harvested tree biomass: scenarios for critical loads in
Wallonia, south Belgium. Water, Air and Soil Pollution, in press. De Vries W., Reinds G.J., Posch M., and Kämära J. (1994) Simulation of soil response to acidic deposition scenarios in
Europe. Water, Air and Soil Pollution 78 : p215-246. de Vries W. (1994). Soil response to acid deposition at a different regional scale: field and laboratory data, critical loads
and model predictions. Ph.D dissertation, Univ. Wageningen, The Netherlands. 487pp. de Vries W. (1990). Methodologies for the assessment and mapping of critical acid loads and of the impact of abatement
strategies on forest soils in the Netherlands and in Europe. Winand Staring Centre Rep., Wageningen, The Netherlands, 91pp.
Dupriez, Sneyers (1979). Les nouvelles cartes pluviométriques de la Belgique. Rapport a/103. Institut Météorologique de Belgique, Uccle, Bruxelles.
Duvigneaud P., Kestemont et Ambroes P. (1969) Productivité primaire des forêts tempérées d’essences feuillues caducifoliées en Europe occidentale. Unescco. 1971, Productivité des écosystèmes forestiers, Actes du Colloque de Bruxelles, 1969 (écologie et conservation). p. 259-270.
Eloy S. (2000) Modeling, Mapping, and Managing critical loads for forest ecosystems using a geographic information system : approach of Wallonia, Belgium, to study of long-range transboundary air pollution effects on ecosystems in Europe. Environmental Toxicology and Chemistry, Vol. 19, 4(2), p.1161-1166.
Fevrier (1996) Charges critiques d'acidité pour les eaux de surface dans le massif des Ardennes. DEA Physique et chimie de la Terre, ULP STRASBOURG, 38 pp.
Maréchal R., Tavernier R. (1970). Association des sols, pédologie 1/500 000. Atlas de Belgique, Bruxelles, Belgium. UBA (1996) Manual on Methodologies and Criteria for Mapping Critical Levels/Loads and geographical areas where
they are exceeded. UN/ECE Convention on Long-range Transboundary Air Pollution. Federal Environmental Agency (Umweltbundesamt), Texte 71/96, Berlin
Unité des Eaux et Forêts (mai 2001), Exportation de minéraliomasse par l’exploitation forestière. Université Catholique de Louvain, Belgique.
SITEREM (2001) Estimation des charges critiques et des excès en polluants acidifiants pour les ecosystèmes forestiers et aquatiques wallons.
Editor : Siterem s.a, Autors : Vanderheyden V. and Kreit J-F, Co-Autors : Bosman B., Brahy V., Carnol M., Delvaux B., Demuth C., Eloy S., Everbecq E., Halleux I., Jonard M., Marneffe Y., Masset F., Remacle J., Thome J.P. Published for Ministère de la Région wallonne, DGRNE, Belgique.
SITEREM (2006) Analyse spatio-temporelle du dépassement des charges critiques en polluants acidifiants en région wallonne. Analyse selon le type d’écosystème et mise en relation avec les quantités émises de substances acidifiantes.
Editor : Siterem s.a, Autors : Vanderheyden V with collaboration of ISSEP and CELINE. Published for Ministère de la Région wallonne, DGRNE, Belgique.
Weissen F., Hambuckers A., Van Praag H.J., & Remacle,J.(1990). A decennial control of N-cycle in the Belgian Ardenne forest ecosystems. Plant and Soil 128: p.59-66.
de Vries W, Reinds GJ, van der Salm C, Draaijers GPJ, Bleeker A, Erisman JW, Auée J, Gundersen P, Kristensen HL, van Dobben H, de Zwart D, Derome J, Voogd JCH, Vel EM. 2001. Intensive monitoring of forest ecosystems in Europe. Technical Report 2001. Forest Intensive Monitoring Coordinating Institute, Brussels, Geneva.
Meykens J, Vereecken H, Geypens M, Hermy M (2001) Berekening van kritische lasten voor graslanden en heidegebieden. Rapport Bodemkundige Dienst van België en Labo Bos, Natuur en Landschap, KUL, 72 pp.
Posch M, Hettelingh J-P, Slootweg J, Downing RJ (eds.). 2003. Modelling and mapping of critical tresholds in Europe. CCE status report 2003.
Schöpp W, Posch M, Mylona S, Johansson M. 2003. Long-term development of acid deposition (1880-2030) in sensitive freshwater regions in Europe. Hydrology and Earth System Sciences 7, 436-446.
Staelens J, Neirynck J, Genouw G, Roskams P. 2006. Dynamische modellering van streeflasten voor bossen in Vlaanderen. Studie uitgevoerd in opdracht van de Vlaamse Milieumaatschappij, MIRA, MIRA/2006/03. Rapport INBO.R.2006.12. Instituut voor Natuur- en Bosonderzoek, Brussel.
UBA 2004. Mapping manual 2004. Manual on methodologies and criteria for modelling and mapping critical loads & levels and air pollution effects, risks and trends. www.icpmapping.org
Van Hinsberg A, de Vries W. 2003. National contribution for the Netherlands. In: Posch M, Hettelingh J-P, Slootweg J, Downing RJ (eds.). Modelling and mapping of critical tresholds in Europe. CCE status report 2003, pp. 93-97.

CCE Status Report 2008
15
Bulgaria
National Focal Centre
Borislava Borisova Executive Environmental Agency
Tzar Boris III Str., 136 BG - 1618 Sofia tel: +359 2 940 64 18, +359 2 955 90 11 fax: +359 2 966 90 15 e-mail: [email protected]
Collaborating institutions
Prof. Dr. Nadka Ignatova Scientific responsible Department of Plant Pathology and Chemistry University of Forestry
Kliment Ochridsky Str. 10 1756 SOFIA tel: +359 2 91907 (351) (N I) fax: +359 2 862 28 30 e-mail: [email protected]
Prof. Dr. Kitka Jorova Assoc. Prof. Dr. Emilia Velizarova Ass. Prof. Radoslav Milchev Ass. Prof. Sonya Damyanova Ass. Prof. Radka Fikova Assoc. Prof. Dr Maria Broshtilova Yavor Yordanov
Modelled critical loads
Data sources This report presents recent results of the team-work of the Bulgarian experts of Executive Envi-ronmental Agency and the Bulgarian scientific team as parts of the ICP Modelling and Mapping on the dynamic assessment of exceedances of critical loads for acidifying pollutants in Europe.
The report is entirely based on the “Calculation and mapping of critical loads for sulphur, nitrogen, acidity and heavy metal for forest ecosystems in Bulgaria”, Report 998/22.12.2006, Ministry of Environment, Sofia, 96 pp. included in the list of references.
Current critical loads data for acidification and eutrophication are described as well justifying methods and data applied.
Critical loads of acidifying sulphur and nitrogen are calculated for main forest tree species using the Steady State Mass Balance method in accordance with the latest recommendations provided in the last version of the Mapping Manual (UBA, 2004).

CCE Status Report 2008
16
The database involve maximum critical loads of sulphur (Manual, equation 5.22), maximum critical loads of nitrogen (Manual, equation 5.26), minimum critical loads of nitrogen (Manual, equation 5.25), nutrient nitrogen (Manual, equation 5.5) and all related data.
Critical loads have been calculated for all major tree species using soil data base of the content of the organic mater (%), the clay content for the fraction 0,01 mm in the soil (%), soil bulk density, cation exchange capacity CEC, Base saturation, C / N ratio and the pH of the soil. in grid cells of 16 km / 16 km (Ignatova et al., 2001).
Runoff of water under root zone has been measured in grid cells of 10 / 10 km for the entire country (Kehayov, 1986).
Figure BG-1. CL max S for broadleaved (left) and coniferous (right) forests in Bulgaria.
A network of pened collectors for atmospheric deposition by precipitation have been used for base cations, sulphur and nitrogen depositions.
Nitrogen and base cations net uptake rates are obtained by multiplying the element contents of the stems (Na, Ca, K, Mg and N) with annual harvesting rates (Ignatova et al., 1997). Data on biomass removal for forests have been derived from the State Forests Agency. The content of base cations and nitrogen in the biomass has been taken from the literature for different harvested parts of the plants ( stem and bark of forest trees) (Jorova, 1992; Ignatova, 2001; De Vries and Bakker, 1998; De Vries et all., 2001)
In the absence of more specific data on the production of basic cations through mineral weathering for most of study regions, weathering rates have been calculated according to the dominant parent material obtained from the lithology map of Bulgaria and the texture class taken from the FAO soil map for Europe, according to the clay contents of the Bulgarian forest soils (UBA, 1996).
Chemical criterion used is a molar ratio [Al] / [Bc] = 1 (Manual, equation 5.31). Identifiers of the site for critical loads calculation of acidifying nitrogen and sulphur, and the integers in the submission of the empirical critical loads of nitrogen are not identical because of different number of sites under consideration in two submissions but they correlate each to other by the EMEP grid cells indices and geographical coordinates.
Values for each parameter and the resulting critical loads are stored for each forest type (coni-ferous and deciduous forests) in separate records for each EMEP 50 / 50 km2 grid cell when the forest is a mixture of both tree types, in accordance with the area fractions of the tree species.
CCE Status Report 2008
17
National maps Soil type information - soil map of Bulgaria (M 1 :1 000 000), FAO classification; Geological map of Bulgaria 1 : 500 000 Vegetation map of Bulgaria 1 : 500 000 Mean annual temperature map 1: 500 000 Mean annual precipitation map 1: 500 000
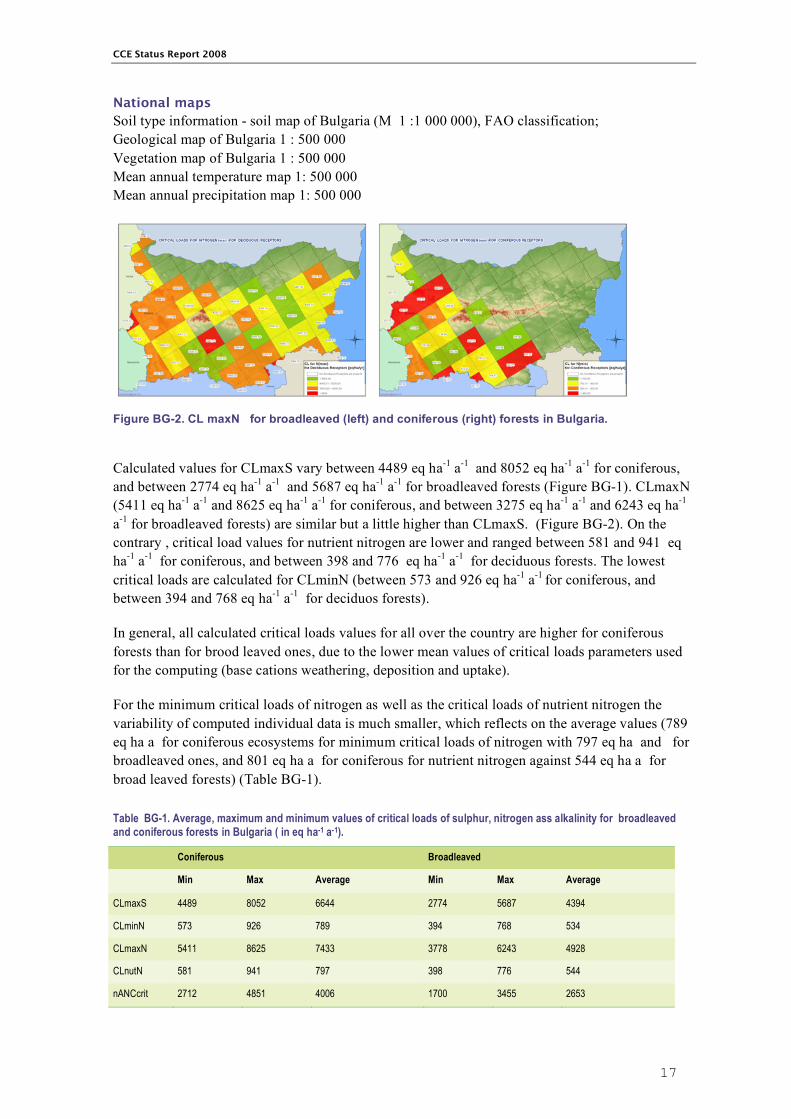
Figure BG-2. CL maxN for broadleaved (left) and coniferous (right) forests in Bulgaria.
Calculated values for CLmaxS vary between 4489 eq ha-1 a-1 and 8052 eq ha-1 a-1 for coniferous, and between 2774 eq ha-1 a-1 and 5687 eq ha-1 a-1 for broadleaved forests (Figure BG-1). CLmaxN (5411 eq ha-1 a-1 and 8625 eq ha-1 a-1 for coniferous, and between 3275 eq ha-1 a-1 and 6243 eq ha-1 a-1 for broadleaved forests) are similar but a little higher than CLmaxS. (Figure BG-2). On the contrary , critical load values for nutrient nitrogen are lower and ranged between 581 and 941 eq ha-1 a-1 for coniferous, and between 398 and 776 eq ha-1 a-1 for deciduous forests. The lowest critical loads are calculated for CLminN (between 573 and 926 eq ha-1 a-1 for coniferous, and between 394 and 768 eq ha-1 a-1 for deciduos forests).
In general, all calculated critical loads values for all over the country are higher for coniferous forests than for brood leaved ones, due to the lower mean values of critical loads parameters used for the computing (base cations weathering, deposition and uptake).
For the minimum critical loads of nitrogen as well as the critical loads of nutrient nitrogen the variability of computed individual data is much smaller, which reflects on the average values (789 eq ha a for coniferous ecosystems for minimum critical loads of nitrogen with 797 eq ha and for broadleaved ones, and 801 eq ha a for coniferous for nutrient nitrogen against 544 eq ha a for broad leaved forests) (Table BG-1).
Table BG-1. Average, maximum and minimum values of critical loads of sulphur, nitrogen ass alkalinity for broadleaved and coniferous forests in Bulgaria ( in eq ha-1 a-1).
Coniferous Broadleaved
Min Max Average Min Max Average
CLmaxS 4489 8052 6644 2774 5687 4394
CLminN 573 926 789 394 768 534
CLmaxN 5411 8625 7433 3778 6243 4928
CLnutN 581 941 797 398 776 544
nANCcrit 2712 4851 4006 1700 3455 2653

CCE Status Report 2008
18
Critical loads of maximum nitrogen and sulphur for 2007 - Bulgaria (Figure BG-3).
Data in the current report is based on the proposal of the working group in 2007 (France and England) for the use of permanently open collectors for collecting dry and wet depositions during the whole year, which approaches the real deposition on a unit of ground surface in the forest ecosystems.
Figure BG-3. CL maxN (left) and CL maxS (right) for forest receptors in Bulgaria – 2007 year.
References Bobbink R, Ashmore M, Braun S, Fluckiger W, Van den Wyngaert IJJ (2003) Empirical nitrogen critical loads for
natural and semi-natural ecosystems: 2002 update. In: Achermann and Bobbink (2003), op. cit., pp 43-170. Davies CE, Moss D (2002) EUNIS habitat classification, Final Report. CEH Monks Wood, United Kingdom.
http://eunis.eea.eu.int/index.jsp EUNIS biodiversity database. http://eunis.eea.europa.eu/ Hall J, Davies C, Moss D (2003) Harmonisation of ecosystem definitions using the EUNIS habitat classification. In:
Achermann and Bobbink (2003), op. cit., pp 171-195. Ignatova N, Jorova K, Fikova R, Milchev R, Broshtilova M, Velizarova E., (2007) Calculation and mapping of critical
loads for sulphur, nitrogen, acidity and heavy metal for forest ecosystems in Bulgaria. Report 998/22.12.2006. Ministry of Environment, Sofia, 96 pp.
Ignatova N., Myashkov I (2004) Using CORINE Land Cover classification to assess and map the sensitivity of forest ecosystems in Bulgaria. Proc. of workshop on CORINE Land Cover (B. Mohaupt-Jahr, M. Keil and R. Kiefl Eds.), 20-21 January, Berlin, 2004.
Ignatova N, Jorova K, Fikova R (2000) Effect of receptors at the catchment on critical loads values of acid deposition. Proc. of 75 years LTU conf. p. 321-330 (in Bulgarian)
Ignatova N, Jorova K, Grozeva M, Kechajov T, Stanev I (2001) Calculation and mapping of critical thresholds in Europe. Bulgaria. Status Report 2001, Coordination Centre for Effects nr. 259101009 (M. Posch, P.A.M. de Smet, J.-P. Hettelingh and R. J. Downing Eds.).
Kehayov,T., 1986.Undergrowth waters in Bulgaria, mapping in 1 : 2 000 000, Vol.V, 304-307, S. RIVM, Bilthoven, the Netherlands, pp 114-120 UBA (2004) Manual on methodologies and criteria for modelling and mapping critical loads & levels and air pollution
effects, risks and trends. Umweltbundesamt Texte 52/04, Berlin. www.icpmapping.org UBA (1996) Manual on Methodologies and Criteria for Mapping critical Levels/Loads and geographical areas where
they are exceeded. UBA (2004) Manual on methodologies and criteria for modelling and mapping critical loads & levels and air pollution
effects, risks and trends. Umweltbundesamt Texte 52/04, Berlin www.icpmapping.org UNECE (1996) Convention on Long-range Transboundary Air Pollution. Umweltbundesamt, Texte 71/96. Berlin

CCE Status Report 2008
19
Canada
National Focal Centre
Thomas A. Clair Environment Canada PO Box 6227, 17 Waterfowl Lane Sackville, New Brunswick, E4L 1G6
tel: + 1 506 364 5070 fax: + 1 506 364 5062 [email protected]
Tzar Boris III Str., 136 BG - 1618 Sofia tel: +359 2 940 64 18, +359 2 955 90 11 fax: +359 2 966 90 15 e-mail: [email protected]
Collaborating institutions
Julian Aherne Environmental and Resource Studies Trent University 1600 West Bank Drive Peterborough, Ontario, K9J 7B8
tel: +1 705 748 1011 fax: +1 705 748 1569
Bernard J. Cosby Department of Environmental Sciences University of Virginia Clark Hall, 291 McCormick Rd PO Box 400123, Charlottesville, VA 22904-4123 United States of America
tel: +1 434 924 7787 fax: +1 434 982 2300

CCE Status Report 2008
20
COORDINATION CENTRE OF EFFECTS 2007/2008 DATA CALL
Critical Loads of N and S and Dynamic Modelling Data
This file contains brief information regarding the second Canadian NFC submission of critical loads data to the CCE in response to the 2007/2008 data call. The submission provides terrestrial (forest) critical loads data for approximately 138,415 records covering all provinces in Canada (below 60ºN) and dynamic modelling data for 496 lakes in eastern Canada. The ecosystems represent a total area of 1,655,444.25 km2 (approximately 17 % of the total area of Canada). NOTE: The lake data have been previously described in the 2005 CCE status report and 2007 CCE progress report.
Data have been provided within a Microsoft Access database (template supplied by the CCE) containing six tables: ecords, CLdata, inputs, EmpNload, scenvars and h20inputs.
1. ecords TABLE
SiteID: Forest ecosystems are numbered from 1 to 138,415 and lakes lake ecosystems from 200,001 to 200,500.
Longitude, Latitude, EMEP50-i and EMEP50-j: no explanation needed!
Ecosystem area, protection and EUNIScode: The data submission includes forest ecosystem (EUNIS code G) and surface waters (EUNIS code C). National and provincial park areas were overlaid to generate protection class 9.
2. CLdata TABLE
Critical loads data have only been supplied for CLmaxS (estimated following the NEG-ECP protocol, 2001). Where data are available nANCcrit was estimated as CLmaxS minus base cation weathering and base cation deposition.
3. inputs TABLE
NOTE: Total soil weathering is specified entirely as calcium weathering, harvesting removals have been ignored and nitrogen processes were assumed to be negligible. As such, the following variables have been set to zero: Mgwe, Kwe, Nawe, Caupt, Mgupt, Kupt, Nimacc, Nupt, Nde and cOrganics.
No data have been submitted for cNacc, CEC, bsat, yearbsat, Cpool, CNrat and yearCN.
crittype and critvalue: set to 7 and 10 respectively following the NEG-ECP protocol.
thick and bulkdens: CLmaxS was estimated using a maximum depth for forest soils of 0.5 m. Bulk density were estimated from the Soil Landscape of Canada v2.1 map (URL: sis2.agr.gc.ca/cansis/nsdb/slc/v2.1)
deposition (Ca, Mg, K, Na and Cl): Average total wet and dry deposition for the period 1994 to 1998 supplied by Environment Canada at a grid resolution of 35 km by 35 km.

CCE Status Report 2008
21
Qle: estimated as precipitation minus modelled evapotranspiration (original data supplied by M. Posch, CCE)
lgKAlox and expAl: set to 9 and 3 respectively following the NEG-ECP protocol.
4. EmpNload TABLE
No data have been submitted.
Note: The Canadian NFC hope to submit data under this category in the future.
5. scenvars TABLE
No data have been submitted.
Note: The Canadian NFC hope to submit data under this category in the future.
6. h2oinputs TABLE
Data for 496 surface waters. See response to the 2006/2007 data call for further details.
REFERENCES NEG-ECP 2001. Critical Load of Sulphur and Nitrogen Assessment and Mapping Protocol for Upland Forests. New
England Governors and eastern Canadian Premiers Environment Task Group, Acid Rain Action Plan, Halifax, Canada.
Monday, March 10, 2008
Ian Dennis ([email protected])
CCE Status Report 2008
22
Germany
National Focal Centre
OEKO-DATA Hans-Dieter Nagel Hegermuehlenstr. 58 D – 15344 Strausberg
tel.: +49 3341 3901920 fax: +49 3341 3901926 email: [email protected]
Collaborating institutions
Institute of Navigation, Universität Stuttgart Thomas Gauger Breitscheidstr. 2 D – 70174 Stuttgart
tel.: +49 711 68584177 fax: +49 711 68582599 email: [email protected]
Data sources
Critical Loads of Nitrogen and Sulphur, and Dynamic Modelling Data
The German NFC provides an update of the national critical load data of sulphur and nitrogen, and results of the dynamic model application (VSD model). Critical loads are calculated completely using the VSD model based on methods described in the Mapping Manual (UBA 2004) and following the instructions of the CCE for data submission (CCE 2007). The German critical load database consists of 97,729 records.
In comparison with previews data submissions (2005, 2007) some changes can be observed concerning the critical loads of sulphur (Fig. DE-1) and the critical loads of nutrient nitrogen (Fig. DE-2).
Compared to the 2007 data critical loads of sulphur, CLmax(S), have a wider range of values and show less overall ecosystem sensitivity. While identical input parameters were used the outcome of the application of the VSD model in 2008 show critical loads below 1 keq ha-1 a-1 for about 30 % of ecosystem receptors, whereas the figures of the 2007 calculation showed critical loads below 1 keq ha-1 a-1for about 60 % of ecosystem receptors. The regional distribution of critical loads of sulphur is shown in Figure DE-3.
Only very small changes between 2007 and 2008 data can be observed as critical loads of nutrient nitrogen, CLnut(N), are concerned. Between 2005 and 2007 significantly greater changes, due to applying the suggested update of critical concentrations in soil solution (CCE 2007a), have occurred. Therefore a national approach was derived using the vegetation period for assignment of

CCE Status Report 2008
23
different concentration values in Northern and Western Europe (CCE 2007b). A box plot of submitted data is given in Figure DE-2, showing the empirical critical load values, CLemp(N), the VSD computed critical load data, CLnut(N), as calculated in 2005 using the original critical N concentrations given by the Mapping Manual of 2004, the suggested (national modified) update of the 2007 call for data (CLnut(N) 2007) and the results of CLnut(N) 2008. The regional distribution of critical loads of nutrient nitrogen is shown in Figure DE-4.
The dynamic model VSD was successful implemented. Results for the given scenarios “Current Legislation” (CLE) and “Maximum Feasible Reduction” (MFR) are shown in Figure DE-5 and Figure DE-6. As one of the most sensitive indicators the pH value was selected and the distribution trend over time is presented in the box plots.
0
20
40
60
80
100
120
CLmax(S) 2005 CLmax(S) 2007 CLmax(S) 2008
kg/h
a*a
Figure DE-1: Comparison of submitted national data sets for critical loads of sulphur.
0
5
10
15
20
25
30
35
40
CLemp(N) CLnut(N)
2005
CLnut(N)
2007
CLnut(N)
2008
kg/ha*a
Figure DE-2: Comparison of submitted national data sets for critical loads of nutrient nitrogen.

CCE Status Report 2008
24
Figure DE-3: Critical loads of sulphur, CLmax(S).
Figure DE-4: Critical loads of nutrient nitrogen, CLnut(N).

CCE Status Report 2008
25
pH
CLE2100
CLE2050
CLE2040
CLE2030
CLE2020
20102000
19901980
10
9
8
7
6
5
4
3
2
5%
25%
95%
75%
50%
Fre
qu
en
cy
of
plo
tsw
ith
a v
alu
e
be
low
dia
gra
mva
lue
Figure DE-5: Trend of the distribution of pH values in Germany following the “current legislation” deposition scenario.
pH
MFR2100
MFR2050
MFR2040
MFR2030
MFR2020
20102000
19901980
10
9
8
7
6
5
4
3
2
5%
25%
95%
75%
50%
Fre
qu
en
cy
of
plo
tsw
ith
a v
alu
e
be
low
dia
gra
mva
lue
Figure DE-6: Trend of the distribution of pH values in Germany following the “maximal feasible reduc-tion” deposition scenario.
Empirical Critical Loads of Nitrogen
In addition to the calculation of critical loads with the VSD model, empirical critical loads of nitrogen were calculated for the complete national dataset, consisting of 102,560 records, in accordance to the methods described in the Chapter 5.2 of the Mapping Manual (UBA 2004) and following the recommendations of the workshop “Empirical Critical Loads for Nitrogen” (Achermann and Bobbink 2003). A regional distribution of this dataset is shown in Figure DE-7.

CCE Status Report 2008
26
Critical load ranges given in Table 5.1 of the Mapping Manual were specified by applying the BERN model (Schlutow and Kraft 2006). A typical plant community with a unique empirical critical load value could be defined for each EUNIS code (see CCE 2007c). Empirical critical loads of nitrogen for terrestrial ecosystems in Germany range between 5 and 38 kg N ha-1 a-1 with a mean of 15 kg N ha-1 a-1.
As additional information the protection status of all grid cells with empirical critical loads of nitrogen was checked. The European Habitats Directive (FFH) applies at nearly 28 percent (28,806) of mapped grids, 10,532 of them are also Special Protection Areas (SPA) for which the Birds Directive applies. About 5 percent of the grid cells are SPA areas only.
Figure DE-7: Empirical critical loads of nitrogen, CLemp(N).
References Achermann B. & R. Bobbink (eds. 2003): Empirical critical loads for nitrogen: Expert workshop, Berne, 11-13
November 2002. Environmental Documentation 164, Swiss Agency for the Environment, Forests and Landscape. CCE (2007) Instructions for Submitting Critical Loads of N and S and Dynamic Modelling Data, Coordination Centre
for Effects, Bilthoven, November 2007 CCE (2007a) Progress Report 2007 Coordination Centre for Effects, Appendix B, Table 4, p. 196
Bilthoven, Netherlands, Report No. 500090001/2007, ISBN No. 978-90-6960-175-5 CCE (2007b) Progress Report 2007 Coordination Centre for Effects, National report of Germany, p. 134
Bilthoven, Netherlands, Report No. 500090001/2007, ISBN No. 978-90-6960-175-5 CCE (2007c) Progress Report 2007 Coordination Centre for Effects, National report of Germany, p. 137
Bilthoven, Netherlands, Report No. 500090001/2007, ISBN No. 978-90-6960-175-5 Schlutow A. & Kraft P. (2006): Bioindication of Ecosystems Regeneration Ability Thresholds,
EOLSS: UNESCO-Encyclopaedia of Life Support Systems, Volume E4-20-01, 26 p. UBA (2004) Manual on methodologies and criteria for modelling and mapping critical loads and levels and air pollution
effects, risks and trends. Umweltbundesamt Texte 52/04, Berlin www.icpmapping.org (updated version of 2007)

CCE Status Report 2008
27
Finland
National Focal Centre
Maria Holmberg, Stefan Fronzek and Martin Forsius Finnish Environment InstituteResearch Programme for Global Change P.O.Box 140, FI-02700 Helsinki
www.environment.fi/syke [email protected] Tel + 358 400 148 559 Fax + 358 20490 390
Collaborating institutions
Maija Salemaa Finnish Forest Research Institute Vantaa Research Unit P.O.Box 18, FI-010301 Vantaa
Critical loads of acidity and nutrient nitrogen
Introduction
In response to the call for data issued in November 2007, Finland submitted mass balance critical loads of acidification and nutrient nitrogen and empirical critical loads of nutrient nitrogen. The methods and data for mass balance critical loads of acidification and nutrient nitrogen have re-mained the same since 2001, while empirical critical loads of nitrogen are now submitted for the first time. Also information on Natura 2000 protection areas is reported with this submission.
Methods and data sources
Critical loads of acidification
Critical loads of acidification and nutrient nitrogen are calculated in Finland using mass balance methods (Johansson 1999; Johansson ym. 2001, Holmberg and Forsius 2004, UBA 2004). The mass balance method accounts for soil mineral weathering and the uptake of base cations by vege-tation as well as leaching of sulphur, nitrogen and base cations. For lake acidification, the protec-tion criterion is related to the acid neutralizing capacity of leaching soil water ([ANC]limit of 20 µeq L-1). For forest soils, the protection criterion is related to the concentrations of aluminium and base cations in soil solution (molar Al:BC ratio of 1.0). Critical loads of acidification are deter-mined for lakes and forest soils (spruce-, pine- and deciduous forests).
Critical loads of mass balance nutrient nitrogen
Nutrient nitrogen critical loads are calculated only for forest soils. The mass balance model accounts for nitrogen uptake by vegetation, immobilisation, denitrification and leaching of nitrogen. The protection criterion for forest soil nutrient nitrogen is related to the concentration of

CCE Status Report 2008
28
nitrogen in soil solution (0.3 mg N L-1). Elevated concentrations of nitrogen in forest soil solution is considered to alter the nutrient balance of vegetation and thereby influence vegetation health and species distribution. Mass balance critical loads of nutrient nitrogen are 2 – 5 kg N ha-1yr-1 for coniferous and 2 – 7 N ha-1yr-1 for deciduous forest soils.
Land cover classes
The harmonized land cover map for the bodies under the LRTAP convention (Cinderby et al. 2007) represents 96 % of FI territory in 20 classes of land use. For the submission of empirical critical loads of nitrogen the land cover information was aggregated to approximately 10x10km2 resolution.
Critical loads of mass balance acidification and nutrient nitrogen for Finland have been reported for soils in three types of forest ecosystems (spruce, pine, deciduous). A satellite image based land use data set has been used to estimate total forest area in each EMEP50 grid cell. Data from the seventh national forest inventory, collected by the Finnish Forest Research Institute 1977-1984 have been used to assign total forest area (240 400 km2) to spruce, pine and deciduous tree species (Johansson 1999, Johansson et al 2001). The total forested area in the Finnish massbalance CL submissions, 240 400 km2, is close to the sum of the EUNIS classes G1, G3, G4 (deciduous, coniferous and mixed woodland 253 500 km2). In the Finnish massbalance CL submissions, the total area of spruce and pine forests amounts to 215 000 km2, compared to 129 600 km2 in class G3 in the harmonized land cover map. The area of deciduous woodland is 25 500 km2 in the Finnish massbalance CL database while class G1 covers only 8 700 km2 in the land cover map. The land use classes D1 (raised and blanket bogs) and F2 (artic, alpine and subalpine scrub) together cover 35 000 km2 in Finland.
Figure FI-1. Distribution of land use classes in 10x10km2resolution. a) D1 Raised and blanket bogs b) F2 Arctic, alpine and subalpine scrub; c) G1 Broadleaved deciduous woodland; d) G3 Coniferous woodland; e) G4 Mixed deciduous and coniferous woodland.
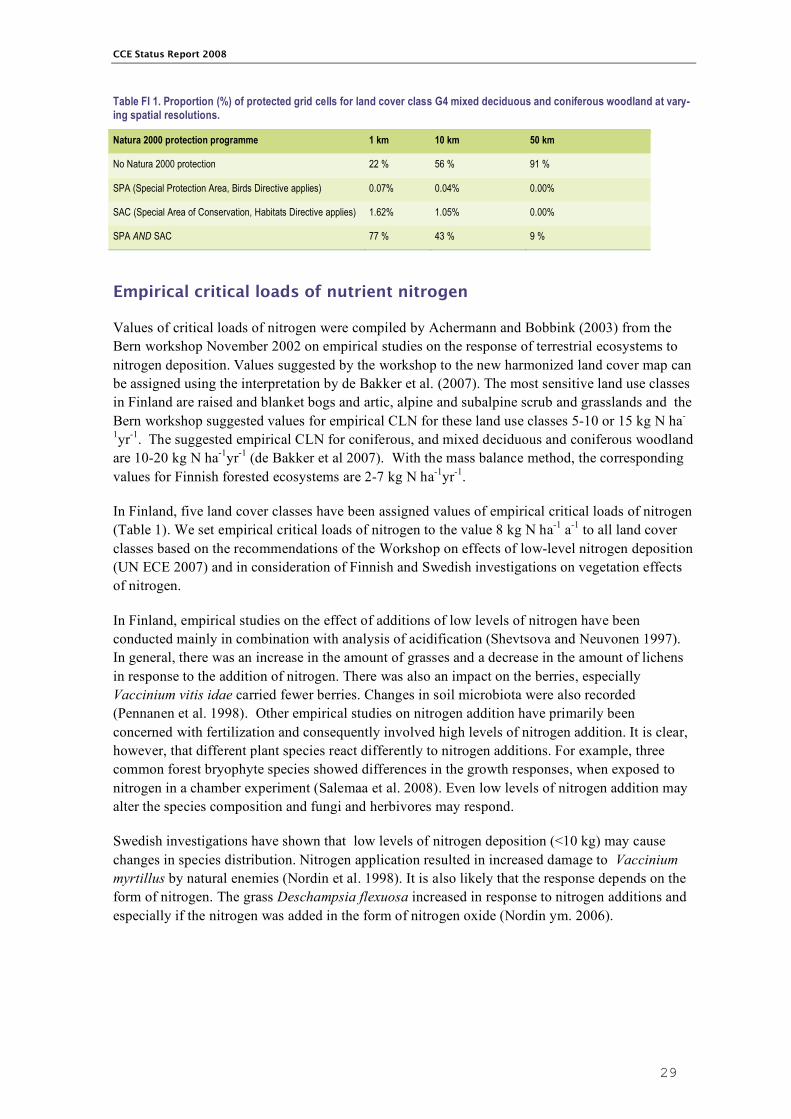
Natura 2000 areas The areas protected under the Natura 2000 programme were determined at different spatial resolutions. The results were submitted at approximately 10x10 km2 resolution. For comparison the proportion (%) of protected grid cells for two alternative resolutions 1 x 1 km2 and 50 x 50 km2 were determined for the land cover class G4 mixed deciduous and coniferous woodland (Table FI 1). Although some information on small protection areas is lost with the 10 km grid cell length, this resolution was considered to be sufficiently detailed for the purpose of the critical loads data base.
CCE Status Report 2008
29
Table FI 1. Proportion (%) of protected grid cells for land cover class G4 mixed deciduous and coniferous woodland at vary-ing spatial resolutions.
Natura 2000 protection programme 1 km 10 km 50 km
No Natura 2000 protection 22 % 56 % 91 %
SPA (Special Protection Area, Birds Directive applies) 0.07% 0.04% 0.00%
SAC (Special Area of Conservation, Habitats Directive applies) 1.62% 1.05% 0.00%
SPA AND SAC 77 % 43 % 9 %
Empirical critical loads of nutrient nitrogen
Values of critical loads of nitrogen were compiled by Achermann and Bobbink (2003) from the Bern workshop November 2002 on empirical studies on the response of terrestrial ecosystems to nitrogen deposition. Values suggested by the workshop to the new harmonized land cover map can be assigned using the interpretation by de Bakker et al. (2007). The most sensitive land use classes in Finland are raised and blanket bogs and artic, alpine and subalpine scrub and grasslands and the Bern workshop suggested values for empirical CLN for these land use classes 5-10 or 15 kg N ha-
1yr-1. The suggested empirical CLN for coniferous, and mixed deciduous and coniferous woodland are 10-20 kg N ha-1yr-1 (de Bakker et al 2007). With the mass balance method, the corresponding values for Finnish forested ecosystems are 2-7 kg N ha-1yr-1.
In Finland, five land cover classes have been assigned values of empirical critical loads of nitrogen (Table 1). We set empirical critical loads of nitrogen to the value 8 kg N ha-1 a-1 to all land cover classes based on the recommendations of the Workshop on effects of low-level nitrogen deposition (UN ECE 2007) and in consideration of Finnish and Swedish investigations on vegetation effects of nitrogen.
In Finland, empirical studies on the effect of additions of low levels of nitrogen have been conducted mainly in combination with analysis of acidification (Shevtsova and Neuvonen 1997). In general, there was an increase in the amount of grasses and a decrease in the amount of lichens in response to the addition of nitrogen. There was also an impact on the berries, especially Vaccinium vitis idae carried fewer berries. Changes in soil microbiota were also recorded (Pennanen et al. 1998). Other empirical studies on nitrogen addition have primarily been concerned with fertilization and consequently involved high levels of nitrogen addition. It is clear, however, that different plant species react differently to nitrogen additions. For example, three common forest bryophyte species showed differences in the growth responses, when exposed to nitrogen in a chamber experiment (Salemaa et al. 2008). Even low levels of nitrogen addition may alter the species composition and fungi and herbivores may respond.
Swedish investigations have shown that low levels of nitrogen deposition (<10 kg) may cause changes in species distribution. Nitrogen application resulted in increased damage to Vaccinium myrtillus by natural enemies (Nordin et al. 1998). It is also likely that the response depends on the form of nitrogen. The grass Deschampsia flexuosa increased in response to nitrogen additions and especially if the nitrogen was added in the form of nitrogen oxide (Nordin ym. 2006).

CCE Status Report 2008
30
Table FI 2. Overview of values of empirical critical load of nitrogen CLNemp used for land cover classes in Finland, mini-mum and maximum values (Achermann and Bobbink 2003) and area of each land use class of LRTAP harmonized Land Use Map (Cinderby et al. 2007).
EUNIS class Area (km2) CLNemp kgN/ha-1/yr-1
FI Mapping Value kgN/ha-1/yr-1
D1 Raised and blanket bogs 26 000 5-10 8
F2 Arctic, alpine and subalpine scrub 9 000 5-15 8
G1 Broadleaved deciduous woodland 8 700 10-20 8
G3 Coniferous woodland 129 600 10-20 8
G4 Mixed deciduous and coniferous woodland 115 300 10-20 8
References Achermann, B., Bobbink, R., 2003. Empirical critical loads for nitrogen. Proceedings from the expert workshop Bern
Switzerland Nov 11-13 2002. Environmental Documentation no 164 air. Swiss agency for the Environment, Forest and Landscape.
de Bakker, N., Tamis, W., van't Zelfde, M., Slootweg, J., 2007. Application of the harmonized Land Cover Map. Teoksessa : Slootweg, J., Posch, M., Hettelingh, J.-P. (toim.) Critical Loads of Nitrogen and Dynamic Modelling. CCE Progress report 2007. MNP Report 500090001/2007. s. 71-88.
Cinderby, S., Emberson, L., Owen, A., Ashmore, M., 2007. LRTAP Land Cover Map of Europe. Teoksessa : Slootweg, J., Posch, M., Hettelingh, J.-P. (toim.) Critical Loads of Nitrogen and Dynamic Modelling. CCE Progress report 2007. MNP Report 500090001/2007. s. 59-70.
Holmberg, M., Forsius, M, 2004. Critical loads, Finland. Teoksessa : Hettelingh, J.-P., Slootweg, J. and Posch, M. Critical Loads and Dynamic Modelling Results. CCE Progress Report 2004. RIVM 259101014/2004.
Johansson, M., 1999. Integrated models for the assessment of air pollution control requirements. Väitöskirja, TKK. Monographs of the Boreal Environment Research 13, 73 ss.
Johansson, M., Forsius, M., Holmberg, M., Kämäri, J., Mannio, J., Syri, S., Vuorenmaa, J. 2001. Critical loads, Finland. In: Posch, M., de Smet, P.A.M, Hettelingh, J.-P. and Downing, R.J. Modelling and Mapping of critical thresholds in Europe. CCE Status Report 2001. RIVM 259101010.
Nordin, A., Näsholm, T., Ericson, L., 1998. Effects of simulated N deposition on understory vegetation of a boreal coniferous forest. Functional Ecology 12:691-699.
Nordin, A., Strengbom, J., Ericson, L., 2006. Responses to ammonium and nitrate additions by boreal plants and their natural enemies. Environmental Pollution 141:167-174.
Pennanen, T. Fritze, H., Vanhala, P., Kiikkilä, O., Neuvonen S., Bååth, E. 1998. Structure of a microbial community in soil after prolonged addition of low levels of simulated acid rain. Appl. Env. Microbiology 64:2173-2180.
Salemaa, M., Mäkipää, R., Oksanen, J. 2008. Differences in the growth response of three bryophyte species to nitrogen. Environmental Pollution 152:82-91.
Shevtsova, A., Neuvonen, S. 1997. Responses of ground vegetation to prolonged simulated acid rain in sub-arctic pine-birch forest. New Phytol. 136:613-625.
UBA (2004) Manual on methodologies and criteria for modelling and mapping critical loads and levels and air pollution effects, risks and trends. Umweltbundesamt Texte 52/04, Berlin www.icpmapping.org
UN ECE 2007. Recent results and updating of scientific and technical knowledge – Workshop on effects of low-level nitrogen deposition. Stockholm March 2007.
CCE Status Report 2008
31
France
National Focal Centre
Dr Anne Probst — Dr Sophie Leguédois ÉcoLab (UMR 5245 CNRS/UPS/INPT) Campus ENSAT-INP Av. de l'Agrobiopole Auzeville-Tolosane BP 32607 F-31 326 Castanet-Tolosan cedex
Email: [email protected] Email: [email protected]
Collaborating institutions
Dr Laurence Galsomiès — Dr Christian Elichegaray ADEME Centre de Paris - Vanves Dép. Surveillance de la Qualité de l'Air 27, rue Louis Vicat F-75 737 Paris cedex 15
Dr Jean-Paul Party Sol-Conseil 251 rte La Wantzenau - Robertsau F-67 000 Strasbourg
Dr. Étienne Dambrine INRA-Centre de Nancy Biogéochimie des Écosystèmes Forestiers F-54 280 Champenoux
Dr Erwin Ulrich — Dr Luc Croisé Office National des Forêts Direction Technique Dép. Recherche et Développement RÉNÉCOFOR Boulevard de Constance F-77 300 Fontainebleau
Dr Louis-Michel Nageleisen Ministère de l'Agriculture et de la Pêche Dép. de la Santé des Forêts Cenre INRA de Nancy F-54 280 Champenoux
Dr Anne-Christine Le Gall Direction des Risques Chroniques Unité MECO INERIS BP N°2 F-60 550 Verneuil-en-Halatte
Mr Marc Rico Ministère de l'Écologie, de l’Énergie, du Développement Durable et de l'Aménagement du Territoire Direction de la Pollution et de la Prévention des Risques 20, avenue de Ségur F-75 007 Paris
Modelled critical loads and dynamic modelling data
The objectives of this call for data were to submit updated critical loads and to provide time series of modelled chemical variables for different deposition scenarios, i.e. dynamic modelling results. In 2005, the French National Focal Centre (NFC) provided updated critical load values for nitrogen (acid and nutrient) and sulphur as well as dynamic modelling results (Probst et al., 2005). In 2007, the French NFC: (1) tested the updated critical concentrations for the calculation of
CCE Status Report 2008
32
critical loads of nutrient nitrogen proposed by the Coordination Centre for Effects (CCE) and, (2) sent data for dynamic modelling (Probst and Leguédois, 2007). In comparison with 2005, the only major change was the removal of costal ecosystems (EUNIS code B1.4) from the dynamic modelling database as, for those ecosystems, the empirical critical loads were more consistent with observations (Probst et al., 2005).
For the 2008 call, the main differences concerned the structure of the database used for submission and the application of more conservative rules for the calibration of the dynamic model. To convert the 2007 data into the 2008 database structure we used the append queries provided by the CCE with VSD-Access version.
With the new calibration rules we had to change the values of the weathering rates (Cawe, Mgwe, Kwe and Nawe) and the base saturation (bsat) for calcareous soils in order to enable the dynamic model to calibrate. For these highly weatherable soils (weathering rates for base cations > 2,500 eq.ha-1.a-1), we had to increase the base saturation values to 0.9 and 0.99 for sites with weathering rates at 2,500 and 7,500 eq.ha-1.a-1 respectively. These adjustments were not sufficient for all the calcareous sites, so we also decreased the weathering rate down to 2,500 eq.ha-1.a-1. As we had no detailed information about the new calibration rules it was difficult to follow strict guideline for these number changes.
The 2008 results for dynamic modelling were significantly different from the 2007 results (Wilcoxon rank test performed on all the modelled variables cAl, cBc, pH, ANC, bsat, CNrat and cN, n = 244,290 and p < 3 %). Because of the way VSD-Access is built, it was not possible to assess the specific effect, on one side, of the value changes for base saturation and weathering rates, and, on the other side, of the modification of the deposition scenarios. However these changes shouldn’t affect the target loads results as the concerned soils have a high buffering capacity.
Calculation method
The data were computed following the method used in 2005 by the French NFC (Probst et al., 2005) which is in accordance with the Mapping Manual (UBA, 2004). For steady state critical loads, the Simple Mass Balance (SMB) model (Sverdrup and de Vries, 1994) was applied on the soil top-layer (0−20 cm). VSD (Posch et al., 2003) was used for dynamic modelling. For soils with high buffering capacity, the results obtained with VSD show significant differences with more complex models (Probst et al., 2003; Probst et al., 2005). However VSD allows better consistency for impact assessment at large scale like across the European territory (Probst et al., 2005).

CCE Status Report 2008
33
Data sources
Table FR-1: Sources for the parameters used in the critical load and dynamic modelling.
Variable Explanation Unit Data sources or settings crittype, critvalue Chemical criterion used for critical loads
for acidity and corresponding critical value - See Table FR-3.
CNacc Aceptable (critical) N concentration meq.m-3 Derived from the acceptable nitrogen leaching (0 for plain deciduous forest; 50 for plain coniferous forest; 100 for mountain forest ecosystems — Party and Thomas, 2000) and the amount of water percolating through the root zone.
Cadep, Mgdep, Kdep, Nadep
Total deposition of base cations eq.ha-1.a-1 RENECOFOR network measurements (ICP forest level I) extrapolated at the national scale (Ulrich et al., 1998; Croisé et al., 2002)
Cawe, Mgwe, Kwe, Nawe
Weathering rate of base cations eq.ha-1.a-1 PROFILE simulations (Party, 1999)
Caupt, Mgupt, Kupt, Naupt
Net growth uptake of base cations eq.ha-1.a-1 Calculated from base cation concentrations in vegetation (Party, 1999) and net uptake of biomass by harvesting (national survey, see IFN, 2002)
Nupt Net growth uptake of nitrogen eq.ha-1.a-1 Calculated from nitrogen concentration in vegetation (Party and Thomas, 2000) and net uptake of biomass by harvesting (national survey, IFN, 2002)
fde Denitrification fraction eq.ha-1.a-1 Adapted from the Mapping Manual data (UBA, 2004) for French soil conditions (see Table FR-2)
All soil parameters
From RENECOFOR network (ICP forest level I) data (Brêthes et al., 1997) and CCE network data (Badeau and Peiffer, 2001). See Table FR-4.
Table FR-2: Setting of the values for the denitrification fraction (adapted from UBA, 2004).
Soil type fde
Non hydromorphic soil 0.05 to 0.2 Hydromorphic silt or sandy soil 0.3 Hydromorphic clay 0.4 Peat soil and marshes 0.5
Table FR-3: Values for the chemical criterion and the critical limit used in the calculation of the critical loads for acidity.
Soil and bedrock type Chemical criterion crittype critvalue Soft calcareous sediments Molar [Al]/[BC] 1 1,2 Hard calcareous sediments Molar [Al]/[BC] 1 1,2
Soft acid sediments Sands pH 4 4,6
Sandy silex formations pH 4 4,6 Others Molar [Al]/[BC] 1 1,2 Hard acid sediments
Schists pH 4 4,6 Sandstones pH 4 4,6
Others Molar [Al]/[BC] 1 1,2 Metamorphic rocks
Acid granite pH 4 4,6 Others Molar [Al]/[BC] 1 1,2 Volcanic rocks Molar [Al]/[BC] 1 1,2
Table FR-4: Value of the soil parameters (from Brêthes et al., 1997).
Variable Explanation Units Min Max Median bulkdens Bulk density g.cm-3 0.732 1.400 0.915 cOrgacids Total concentration of organic acids eq.m-3 0 0.02436 3.48 × 10⁻⁵
CEC Cation exchange capacity meq.kg-1 15 380 140 bsat Base saturation - 0.12 0.99 0.90 Cpool Amount of carbon in the topsoil g.m-2 3920 13 800 9 878 CNrat C/N ratio on the topsoil g.g-1 12 28 15
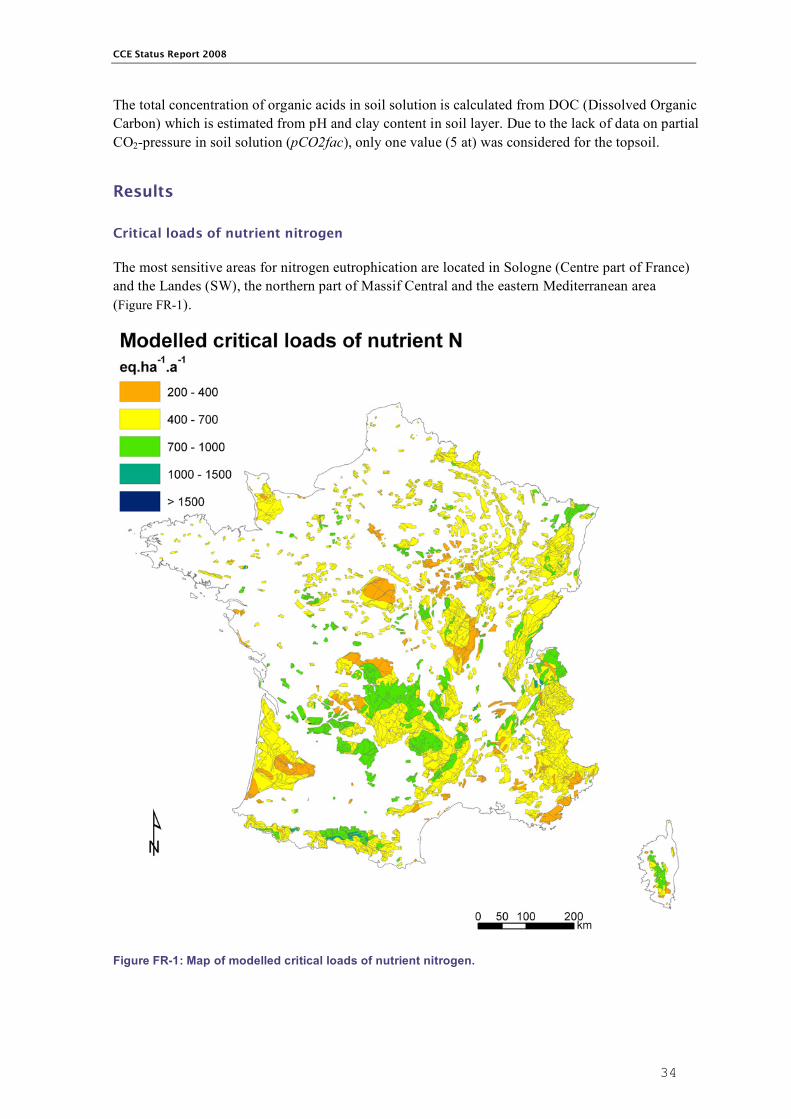
CCE Status Report 2008
34
The total concentration of organic acids in soil solution is calculated from DOC (Dissolved Organic Carbon) which is estimated from pH and clay content in soil layer. Due to the lack of data on partial CO2-pressure in soil solution (pCO2fac), only one value (5 at) was considered for the topsoil.
Results
Critical loads of nutrient nitrogen
The most sensitive areas for nitrogen eutrophication are located in Sologne (Centre part of France) and the Landes (SW), the northern part of Massif Central and the eastern Mediterranean area (Figure FR-1).
Figure FR-1: Map of modelled critical loads of nutrient nitrogen.
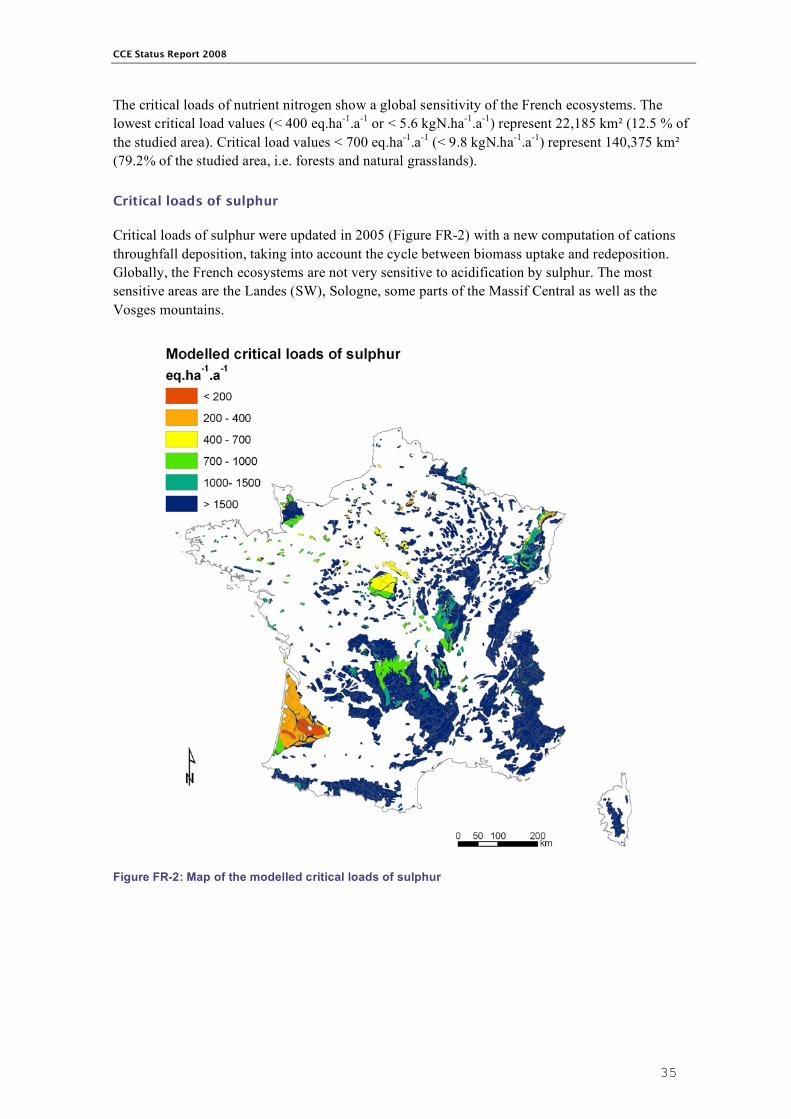
CCE Status Report 2008
35
The critical loads of nutrient nitrogen show a global sensitivity of the French ecosystems. The lowest critical load values (< 400 eq.ha-1.a-1 or < 5.6 kgN.ha-1.a-1) represent 22,185 km² (12.5 % of the studied area). Critical load values < 700 eq.ha-1.a-1 (< 9.8 kgN.ha-1.a-1) represent 140,375 km² (79.2% of the studied area, i.e. forests and natural grasslands).
Critical loads of sulphur
Critical loads of sulphur were updated in 2005 (Figure FR-2) with a new computation of cations throughfall deposition, taking into account the cycle between biomass uptake and redeposition. Globally, the French ecosystems are not very sensitive to acidification by sulphur. The most sensitive areas are the Landes (SW), Sologne, some parts of the Massif Central as well as the Vosges mountains.
Figure FR-2: Map of the modelled critical loads of sulphur

CCE Status Report 2008
36
Empirical critical loads of nutrient nitrogen
Method
The determination of empirical critical loads of nitrogen for French ecosystems was based on the method described in chapter 5.2 of the Mapping Manual (UBA, 2004). The values given in table 5.1 of the Mapping Manual (UBA, 2004) were adapted to the French terrestrial ecosystems (Party et al., 2001). The adaptation was based on: (1) the information available on the potential vegetation and the land use for each ecosystem and, (2) the adaptation rules given in table 5.2 of UBA (2004) using temperature, frost period and base cation availability estimated by expert judgement. The subsequent empirical critical loads are given in Table FR-5.
Table FR-5: Empirical critical loads, in eq.ha-1.a-1, derived for the French ecosystems (adapted from Party et al., 2001). K: calcareous ecosystem; A: acidic ecosystem;Out Cors.: outside Corsica; Per.+Bord.: Perigord and Bordeaux regions;SW+Nantes: South-West and Nantes regions.
Potential vegetation Land use Coastal dune Grassland Upland meadow Forest Coastal dunes and heathlands 1786 Swamps, bogs and wet heathlands 1786 714 714 Quercus robur dominated woodlands 1214 714 Quercus-Carpinus or Ulmus woodlands with Quercus petraea 1214 1214 500 857 Quercus petraea and Q. pubescens woodlands 1429 1429 1214
Per. + Bord.: 1214 Quercus petraea, Q. robur or pubescens and Q. pyrenaica woodlands
1214 SW + Nantes: 714
Mixed Fagus-Quercus and Fagus woodlands 1214 1214 500 1071 K: 1789 Corsica: 1071 Quercus pubescens woodlands A: 714
Out Cors.: 1429
K: 1789 K: 1789 Corsica: 1071 Quercus ilex woodlands A: 714 A: 714
Out Cors.: 1429 Corsica: 1071 Quercus suber woodlands 714 Out Cors.: 1429
Pinus halepensis and P. nigra laricio corsicana Mediterranean woodlands
857 1071
Pinus pinaster woodlands 714 500 Abies and mixed Abies-Fagus woodlands 714 714 857 Picea woodlands 714 714 Pinus sylvestris woodlands 714 500 Pinus uncinata and P. cembra woodlands 500 500 Larix woodlands 714 714 Alpine and subalpine grasslands 500
Data Sources
The French ecosystem classification and map was updated in 2003 for calculation and mapping of the critical loads of acidity and nutrient nitrogen (Probst et al., 2003 ; Moncoulon et al., 2004). The map of potential vegetation was synthesised for the French territory by Party (1999) from various vegetation maps (Dupias and Rey, 1985; Houzard, 1986; Ozenda and Lucas, 1987). Land use was derived from the map of forested and grassland areas in de Monza (1989) as well as the Digital Elevation Model GTOPO30 (USGS, 1996).

CCE Status Report 2008
37
Results
The most sensitive areas to nitrogen deposition are located in the Landes (SW), the eastern part of the Paris basin, the eastern part of the Massif Central as well as in the Alps (Figure FR-3). Empirical critical loads of nitrogen are higher than critical loads for nutrient nitrogen determined with the Steady State Mass Balance (SMB) model (see Figure FR-1 as well as Party and Thomas, 2000). Consequently, the sensitivity of the ecosystems is lower when derived from the empirical method. Comparatively to the SMB model, most of the ecosystems shifted to a higher critical load class with the empirical method (+ 1 class for 49 % of the ecosystems and + 2 classes for 35 % of the ecosystems).
Figure FR-3: Map of the empirical critical loads of nutrient nitrogen.
CCE Status Report 2008
38
References Badeau V., Peiffer M. (2001) Base des données écologiques des placettes françaises du Réseau Européen de suivi des
dommages forestiers (réseau 16 × 1 km). Premier inventaire : juillet 1993 – Octobre 1994 Deuxième inventaire : mai à août 1999. Département Santé des Forêts Antenne Spécialisée. 17p.
Brêthes A., Ulrich E. (1998) RENECOFOR : Caractéristiques pédologiques des 102 peuplements du réseau. Office National des Forêts, Département des Recherches Techniques, 573 p.
Croisé L., Ulrich E., Duplat P., Jaquet O. (2005) Two independant methods for mapping bulk deposition in France. Atmospheric Environment, 39:3923−3941.
Dupias G. et Rey P. (1985) Document pour un zonage des régions phyto-écologiques. CNRS, Centre d’écologie des ressources renouvelables. Toulouse. 39 p. + maps.
Houzard G. 1989. Les forêts primitives de France. In de Monza J.-P. (éd.), Le grand atlas de la France rurale. INRA et SCEES, pp. 348−349.
Inventaire Forestier National (2002) Synthèse par département. http://www.ifn.fr/pages/index-fr.html. Moncoulon D., Probst A., Party J.-P. (2004) Critical loads of acidity : importance of weathering, atmospheric deposition
and vegetation uptake for ecosystem sensitivity determination. C.R. Geoscience, 336 :1417−1426. Monza (de) J.-P. (ed.). Le grand atlas de la France rurale. INRA et SCEES. Ozenda P. and Lucas M.J.(1987) Esquisse d’une carte de la végétation potentielle de la France à 1/1 500 000.
Documents de Cartographie Ecologique, XXX :49–80. Party J.-P., 1999: Acidification des sols et des eaux de surface des écosystèmes forestiers français : facteurs, mécanismes
et tendances. Taux d’altération sur petits bassins versants silicatés. Application au calcul des charges critiques d’acidité. Thèse de Doctorat, Université Louis Pasteur de Strasbourg. 233 p.
Party J.-P., Probst A., Thomas A.-L., Dambrine É. (2001) Critical loads for nutrient nitrogen: calculations and mapping by empirical method for France [in French]. Pollution Atmosphérique. 172:531–544.
Party J.-P. and Thomas A.-L. (2000) Cartographie de la végétation et charges critiques azotées pour la France. Rapport ADEME définitif (marché n°99 62 020).
Posch M., Reinds G.J. (2003) VSD — User manual of the Very Simple Dynamic soil acidification model. Coordination Centre for Effects, National Institute for Public Health and the Environment (RIVM), Bilthoven, The Netherlands.
Probst A., Moncoulon D., Party J.-.P. (2003) French National Focal Center report. In M. Posch, J.P. Hettelingh, J. Slootweg, R.J. Downing (eds), Modelling and Mapping of Critical Treshold in Europe, Status Report 2003, Coordination Center for Effects, RIVM, Bilthoven, pp. 73−80.
Probst A., Moncoulon D., Party J.-.P. (2005) French National Focal Center report. In M. Posch, , J. Slootweg, J.P. Hettelingh (eds), European Critical Loads and Dynamic MOdelling, Status Report 2005, Coordination Center for Effects, RIVM, Bilthoven, pp. 109−115.
Probst A., Leguédois S. (2007) France. In M. Posch, , J. Slootweg, J.P. Hettelingh (eds), European Critical Loads and Dynamic MOdelling, CCE Status Report 2007, Coordination Center for Effects, RIVM, Bilthoven, pp. 139−143.
Sverdrup H, de Vries W. (1994). Calculating critical loads for acidity with the simple mass balance method. Water, Air & Soil Pollution, 72:143–162.
UBA (2004) Manual on methodologies and criteria for modelling and mapping critical loads & levels and air pollution effects, risks and trends. Umweltbundesamt Texte 52/04, Berlin. www.icpmapping.org
Ulrich E., Lanier M., Combes D. (1998) RENECOFOR — Dépôts atmosphériques, concentrations dans les brouillards et dans les solutions de sol (sous-réseau CATAENAT). Rapport scientifique sur les années 1993 à 1996. Office National des Forêts, Département des Recherches Techniques, ISBN 2-84207-134-4, 135p.
USGS (1996) http://edc.usgs.gov/products/elevation/ gtopo30/gtopo30.html

CCE Status Report 2008
39
Ireland
National Focal Centre
Michael McGettigan Environmental Protection Agency
McCumiskey House Richview, Clonskeagh Road Dublin 14 tel: + 353 1 268 0100 fax: + 353 1 268 0900 [email protected]
Collaborating institutions
Julian Aherne Environmental and Resource Studies
Trent University, 1600 West Bank Drive Peterborough, Ontario, K9J 7B8 Canada tel: +1 705 748 1011 fax: +1 705 748 1569 [email protected]
COORDINATION CENTRE OF EFFECTS 2007/2008 DATA CALL
Critical Loads of N and S and Dynamic Modelling Data
IRELAND 2008
This file contains information regarding the Irish critical loads data submitted to the CCE 2008. The submission includes updated critical loads data in response to an error in the previous (March 2005) data submission and NEW dynamic modelling data. In 2005, the mass balance approach for nutrient nitrogen was applied to all ecosystems in error; it should have only been applied to coniferous ecosystems, and an empirical critical load set for the remaining eco–systems. This submission includes the correct CLnutN data and other updates as required (NOTE: the CL data is identical to that submitted under 2007 voluntary data call). Dynamic model simulations under historic and multiple future scenarios have been carried out using the VSD model. All data have been submitted using the Microsoft Access template provided by the CCE. The following five tables have been submitted: ecords, CLdata, inputs, EmpNload and scenvars.
Critical load mapping is carried out on a 1 by 1 km grid, therefore all data records refer to 1 km2 grids. The database contains one table: critical loads and dynamic model input data. A description of the submitted data follows below.

CCE Status Report 2008
40
ECORDS TABLE (30984 records)
1. Site Id: Unique ID used across all tables (simple umeric sequence)
2-5. Longitude, Latitude, EMEP50-i and EMEP50-j: no explanation needed!
6. Ecosystem area
Four ecosystems were selected for mapping, coniferous forests, deciduous forests, natural grasslands, and moors and heathlands. The CORINE land cover map for Ireland was used to define the distribution of the mapped terrestrial ecosystems. A database is held which gives the percentage of each ecosystem in every 1 km2 (range 0.01-100%). The selected ecosystems were derived from the following CORINE classes: • Coniferous - 3.1.2 Coniferous forest; [9195 records], EUNIS code: G3 • Deciduous - 3.1.1 Broad-leaved forest, EUNIS code: G1 • 3.1.3 Mixed forest, EUNIS code: G4 • 3.2.4 Transitional woodland scrub; [8047 records], EUNIS code: G5 • Grasslands - 3.2.1 Natural grasslands; [6895 records], EUNIS code: E1/E3 • Heathland - 3.2.2 Moors and heathlands; [6848 records], EUNIS code: F4 Total number of records is 30984 representing an area of approximately 8936 km2.
7. Protection
NOTE: this has been set to zero BUT i is anticipated that this will be updated to reflect the true protection status.
8. EUNIScode EUNIS G3: CORINE 3.1.2 Coniferous forest EUNIS G1: CORINE 3.1.1 Broad-leaved forest EUNIS G4: CORINE 3.1.3 Mixed forest EUNIS G5: CORINE 3.2.4 Transitional woodland scrub EUNIS E1/E3: CORINE 3.2.1 Natural grasslands EUNIS F4: CORINE 3.2.2 Moors and heathlands
This classification was simplified to four codes representing coniferous (G3), mixed deciduous (G4), grassland (E3) and heathland (F4) for the current submission
CLDATA TABLE (30984 records)
2-5. Critical loads
Maximum critical load of sulphur, CLmax(S) Minimum critical load of nitrogen, CLmin(N) Maximum critical load of acidifying nitrogen, CLmax(N) Critical load of nutrient nitrogen, CLnut(N)
Critical loads were estimated using the VSD-MDB tool (2005), which includes the current critical load methodology as present in the mapping manual (see www.icpmapping.org). This ensured consistency between critical and target loads. Critical loads for sulphur have not change since the

CCE Status Report 2008
41
2003 submission; however, the critical loads for nitrogen have changed in line with recommendations in the mapping manual and update methodologies. A mass balance approach for nutrient nitrogen has been applied to coniferous forests only [EUNIS code: G3], all other ecosystem records have NULL values as empirical critical loads have been set [see EmpNload database].
6. Critical leaching of alkalinity, nANCcrit
This was calculated as described in CCE STATUS 1, July 1991, page 35. ALle(crit)=Q.[Al]crit and Hle(crit)=Q.[H]crit, where Q is precipitation surplus (m3/ha/yr) and [H]crit and [Al]crit are critical hydrogen and aluminium concentration (molc/m3). A pH of 4.2, was selected as the H+ concentration limit and used to estimate the Al critical limit via the gibbsite relationship. The H+ critical limit of pH = 4.2 was selected based on work by Ulrich (1987) which states that at pH lower than 4.2 AL3+ is in solution.
7-9. lgKAlBc, lgKAlBc and CNrat0
All enteries were estimated using the VSD model.
INPUTS TABLE (30984 records)
2. Acceptable nitrogen concentration, cNacc
The acceptable nitrogen concentration was set to 0.0143 eq/m3 or 14.3 meq/m3 for coniferous forests. All other ecosystem records have NULL values as empirical critical loads have been set [see EmpNload database].
3-4. Chemical criterion (crittype) and critical value (critvalue)
Soil solution pH was selected as the chemical criterion, with a critical value of 4.2 for all ecosystems (see 11 above).
5. Soil thickness, thick
All soil variables were derived from the modal profile of the principal soil for each of the soil associations on the general soil map of Ireland (44 associations). Soil thickness was estimated as the sum of O/A/E/B horizons for each model profile.
6. bulk density, bulkdens
Average bulk density was estimated from percent organic carbon in each horizon and weighted by horizon for each profile.
7-10. Base cation deposition, Cadep, Mgdep, Kdep, Nadep
Base cation deposition was calculated from interpolated (kriging) point source bulk concentration measurements (approx. 20 points) and interpolated (kriging) rainfall volumes (approx. 600 points). A filter factor of 2 was used to scale from bulk deposition to total deposition to forest and 1.5 for total deposition to heathlands. NOTE only anthropogenic deposition used. All deposition was

CCE Status Report 2008
42
assigned to Cadep which is the component of base cation deposition (magnesium and sodium are predominantly of marine origin)
11. Total chloride deposition, Cldep
This was set to zero as only non-marine deposition was submitted (it is assumed that all chloride is marine origin).
12-15. Weathering of base cations, Cawe, Mgwe, Kwe, Nawe
Base cation weathering was calculated using the Skokloster classification ranges for mineral soils, the mid-value of each of the five classes was used to define soil weathering, except for the final (non-sensitive) class which was set at 4000 eq/ha/yr. Organic soils were allocated to the lowest Skokloster class. A default of 20% of the total weathering was allocated to sodium weathering (Nawe) and the remainder was assigned to Cawe.
16-18. Base cation uptake, Caupt, Mgupt, Kupt
All base cation uptake (Bc) was assigned to Caupt. Uptake for coniferous forests was estimated from the following:
min(BCavail, Bcu)
where BCavail is the available base cation flux estimate according to:
BCavail = (BCw + BCdep - BCleaching), BCleaching was set equal to 0.02 eq/m3.
BCu was calculated using a yield class of 16 m3/ha/yr, a wood density of 390 kg/m3 and stem concentrations of ca=0.056, mg=0.021 and k=0.0665 % [390 eq/ha/yr]. It was assumed that all coniferous trees were sitka spruce, the yield class is the average yield class for sitka spruce for Ireland (COFORD, 1996) and the stem concentrations are for sitka spruce in Wales (Emmett and Reynolds, 1996).
For deciduous forests, natural grasslands and moors and healthlands an uptake of 45 eq/ha/yr was selected to account for uptake by grazing.
19. Runoff, Qle
Runoff or precipitation surplus was estimated as the difference between rainfall and evapotranspiration plus surface runoff. Rainfall and evapotranspiration are GIS layers interpolated from long-term measurements. Surface runoff was estimated from soil type.
20-21. Equilibrium constant for Al-H relationship (lgKAlox) and exponent (expAl)
Both parameters are based on the 'classic' gibbsite (Kgibb) equilibrium relationship, as such the exponent was set to 3. The spatial distribution of Kgibb was defined by reclassifying the general soil map of Ireland into three classes: Kgibb 9.5 m6/eq2 for organic soils; Kgibb 100 m6/eq2 for peaty podzols and peaty gleys; and Kgibb 300 m6/eq2 for the remaining soils. These represent log10 values of 6.5, 7.523 and 8, respectively.

CCE Status Report 2008
43
22. Partial CO2 pressure, pCO2fac
For consistency with previous critical load methodologies pCO2fac was set to a null value of 1, which essentially 'switches off' the process in the VSD model. This is a simplification; however, in soils with pH lower than 5.0 (the soils of interest in relation to critical/target loads) the process is negligible. As such, this exclusion has very minor implications for critical/target load estimates.
23. Total concentration of organic acids, cOrgacids
Organic acids have previously not been included in Irish critical load calculations and due to limited data were excluded from the current submission. Organic acids were set to a low value, which essentially switches off the process in the VSD model.
24. Nitrogen immobilisation, Nimm
Following recommendations in the mapping manual (www.icpmapping.org) this was set to a default value of 71 eq/ha/yr for all ecosystems.
25. Nitrogen uptake, Nupt
For coniferous ecosystems the same method as above (26-28) was used (actually the BC uptake was used to scale the N uptake where Nu was estimated using a yield class of 16 m3/ha/yr, a wood density of 390 kg/m3 and stem concentrations of N=0.05 % [310 eq/ha/yr]).
For deciduous forests, natural grasslands and moors and healthlands an N uptake of 71 eq/ha/yr was selected to account for uptake by grazing.
26. Denitrification fraction, Fde
Following the method of Reinds et al. (2002) Fde was assigned to each soil type on the general soil map of Ireland based on drainage class.
Drainage (Fde): excessive (0), good (0.1), moderate (0.2), imperfect (0.4), poor (0.7) and very poor (0.8).
27. Nitrogen denitrified, Nde
Null. Not required as Fde was submitted.
28-30. Cation exchange capacity (CEC), base saturation (Bsat) and year for base satu-ration (yearbsat)
These variables were derived from the modal profile of the principal soil for each of the soil associations on the general soil map of Ireland (44 associations). For each soil association, the variables (per horizon) were weighted by depth and bulk density to produce one average per profile. The handbook that accompanies the general soil map of Ireland (and describes the physico-chemical properties of the principal soil types) was published in 1980. This was taken to be the default year for all base saturation measurements.

CCE Status Report 2008
44
31-33.Carbon pool (Cpool) and C/N ratio (CNrat) in the topsoil and year for C/N ratio (yearCN)
These variables were derived from the modal profile of the principal soil for each of the soil associations on the general soil map of Ireland (44 associations). For each soil association, the variables (per horizon) were weighted by depth and bulk density to produce one average per O and/or A horizons only. The measurement was set to match the base saturation measurement year.
34. Measured
Status unknown.
EMPNLOAD TABLE (30984 records)
2. Empirical critical load of nitrogen
The critical load for nutrient nitrogen (CLnutN) was set to 857 eq/ha/yr for coniferous and deciduous forest ecosystems (EUNIS code G3, G1, G4 and G5) and 1071 eq/ha/yr for grasslands, and moors and heathlands (EUNIS code E1, E3 and F4). These values represent the mid-points of the 'recommended' empirical critical load ranges (Achermann and Bobbink, 2003), protecting against changed species composition for forest ecosystems (10-15 kg N/ha/yr) and increased N mineralisation, nitrification and leaching for grassland ecosystems (10-2 kg N/ha/yr).
SCENVARS TABLE (30984 records) All parameters and scenarios were simulated using the VSD-MDB tool.
References Achermann, B. and Bobbink, R., 2003. Empirical Critical Loads for Nitrogen Environmental, Documentation No. 164,
SAEFL, Berne, Switzerland, 327 pp. COFORD, 1994. Pathway to progress - a programme for forest research and development. National Council for Forest
Research and Development, University College Dublin, 132pp. Emmett, B., and Reynolds, B., 1996. Nitrogen critical loads for spruce plantations in Wales: is there too much nitrogen?
Forestry, Vol. 69, No. 3, 205-214 pp. Ulrich, B., 1987. Stability, Elasticity, and the Resilience of Terrestrial Ecosystems with Respect of Matter balance.
Ecological Studies, Vol. 61, Springer-Verlag Berlin-Heidelberg.
Monday, March 10, 2007: Julian Aherne ([email protected])
CCE Status Report 2008
45
Italy
National Focal Centre
Mara Angeloni Ministry for the Environment Via Cristoforo Colombo I- 00147 Rome
tel: + 39-6-5722 8113 [email protected]
Collaborating institutions
Patrizia Bonanni, Roberto Daffinà, Valerio Silli
APAT (National Agency for the Environmental Protection and Technical Services) Via Vitaliano Brancati, 48 00144 Rome - ITALY
Tel: +39-6-5007 2800 (Patrizia Bonanni) +39-6-5007 2959 (Roberto Daffinà) +39-6-5007 2858 (Valerio Silli)
[email protected] [email protected] [email protected]
The critical loads database were processed according to the SMB methodology, suggested by CCE and described in the Mapping Manual 2004 (CCE, 2004). The most relevant differences from the suggested methodology are mentioned in the following explanation
Receptors: the classification of land use proposed by CORINE Land Cover 2000 has been applied to the mapped receptors. They were defined geometrically by CORINE database, while vegetation characteristics were assessed by an intersection with the Map of the real vegetation provided by the Ministry for the Environment. The resulted data were reclassified into the EUNIS Habitat system (15 habitats of first level and 26 habitats of second level classification), as shown below.
Meteorology: the information regarding temperature and precipitation (yearly mean of about one decade of measurements) were updated by data provided by Climate Research Unit of the University of East Anglia.
Soil parameters: all the information regarding soil parameters were derived from the european database, EU Soils (European Soil Portal).
All maps have been processed by Geographic Information System (GIS) software.

CCE Status Report 2008
46
Data sources
EUNIS Ecosystems distribution
G1.6
G1.7
G1.1
G1.8
0
10.000
20.000
30.000
40.000
50.000
60.000
70.000
A B C E1 E2 E4 F2 F3 F5 G1 G2 G3 G4
EUNIS - Ecosystem
Eco
Are
a (
Km
2)
EUNIS Habitat Classifcation
Level 1 2 3
Habitat
A A4 A4.5 Shallow sublittoral sediments dominated by angio-sperms
B1 B1.4 Coastal stable dune grassland B B3 B3.3 Rock cliffs, ledges and shores, with halophytic
angiosperms C1 C1.2 Permanent mesotrophic lakes, ponds and pools C C3 C3.2 Water-fringing reedbeds and tall helophytes other
than canes E2 E2.3 Mountain hay meadows
E1.2 Perennial calcareous grassland and basic steppes E1.3 Mediterranean xeric grassland E1.5 Mediterraneo-montane grassland
E1
E1.8 Mediterranean dry acid and neutral closed grass-land
E4.3 Acid alpine and subalpine grassland
E
E4 E4.4 Calciphilous alpine and subalpine grassland
F2 F2.3 Subalpine and oroboreal bush communities F3.1 Temperate thickets and scrub F3 F3.2 Mediterraneo-montane broadleaved deciduous
thickets F5 F5.2 Maquis
F
F7 F7.4 Hedgehog-heaths G1.1 Riparian [Salix], [Alnus] and [Betula] woodland G1.5 Broadleaved swamp woodland on acid peat G1.6 [Fagus] woodland G1.7 Thermophilous deciduous woodland
G1
G1.8 Acidophilous [Quercus]-dominated woodland G2 G2.1 Mediterranean evergreen [Quercus] woodland
G3.1 [Abies] and [Picea] woodland G3.2 Alpine [Larix] - [Pinus cembra] woodland G3.4 [Pinus sylvestris] woodland south of the taiga G3.5 [Pinus nigra] woodland
G3
G3.7 Lowland to montane mediterranean [Pinus] woodland (excluding [Pinus nigra])
G
G4 G4.6 Mixed [Abies] - [Picea] - [Fagus] woodland
0
200
400
600
800
1000
1200
A B C E F G
EUNIS Ecosystem
Average (
eq
*h
a-1
*yr
-1)
Cadep Mgdep KdepNadep Cldep
Base cation deposition (Ca, Mg, K, Na) has been corrected for marine contribution and for canopy inter-ception. The latter according to
!"#
$+
<=
250BC if ,BC250
250BC if , BC*2BC
wetwet
wetwet
dep
Data source: Italian Network for the assessment of atmospheric deposition and ENEL monitoring stations (1987-1999)
Map of mean yearly precipitation in Italy 1955-2000
Average deposition Ca, Mg, K, Na and Cl
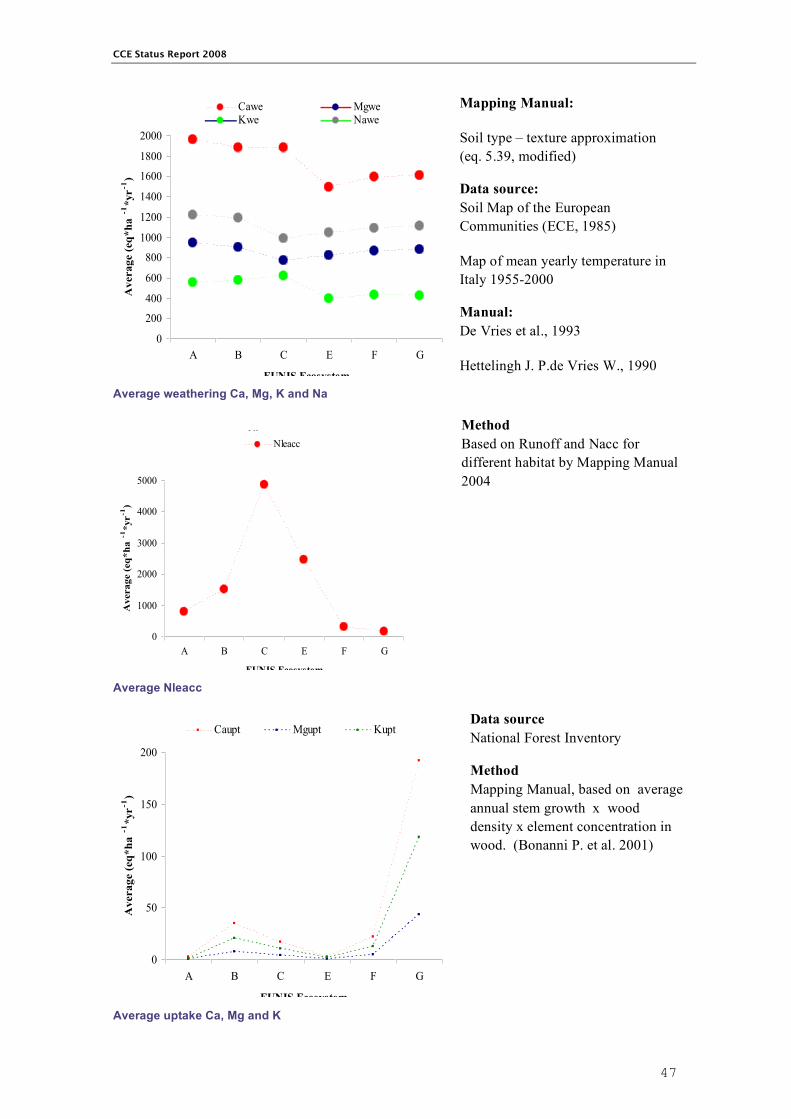
CCE Status Report 2008
47
0
200
400
600
800
1000
1200
1400
1600
1800
2000
A B C E F G
EUNIS Ecosystem
Average (
eq
*h
a-1
*yr
-1)
Cawe Mgwe
Kwe Nawe
Mapping Manual:
Soil type – texture approximation (eq. 5.39, modified)
Data source: Soil Map of the European Communities (ECE, 1985)
Map of mean yearly temperature in Italy 1955-2000
Manual: De Vries et al., 1993
Hettelingh J. P.de Vries W., 1990
Average weathering Ca, Mg, K and Na
Nleacc
0
1000
2000
3000
4000
5000
A B C E F G
EUNIS Ecosystem
Average (
eq
*h
a-1
*yr
-1)
Nleacc
Method Based on Runoff and Nacc for different habitat by Mapping Manual 2004
Average Nleacc
0
50
100
150
200
A B C E F G
EUNIS Ecosystem
Average (
eq
*h
a-1
*yr
-1)
Caupt Mgupt Kupt
Data source National Forest Inventory
Method Mapping Manual, based on average annual stem growth x wood density x element concentration in wood. (Bonanni P. et al. 2001)
Average uptake Ca, Mg and K

CCE Status Report 2008
48
Qle
0
500
1000
1500
A B C E F G
EUNIS Ecosystem
Average (
mm
*a
-1)
Qle
Qle,zb = P m – 0.8 * Pm-2 + (e (0.063*Tm) *
Em,pot)–2)-1/2
with Qle,zb = mean yearly water flux (in m yr-1) Pm = mean yearly precipitation (in m yr-1) Tm = mean yearly temperature (in °C) Empot = mean yearly potential evapotraspiration (in m yr-1)
Data source: Map of mean yearly temperature in Italy 1955-2000 Map of mean yearly precipitation in Italy 1955-2000 Mapping Manual 2004
Average Qle
pCO2
0
10
20
30
40
A B C E F G
EUNIS Ecosystem
Average (
atm
.press
.)
pCO2
Method: Mapping Manual 2004 eq 5.44 FOEFL, 1994
Data source: Map of mean yearly temperature in Italy 1955-2000 Log10PCO2 = –2.38 + 0.031·T
Average pCO2
Nimacc
0
20
40
60
80
A B C E F G
EUNIS Ecosystem
Aver
age
(eq*ha
-1*yr-1
)
Nimacc
Nimacc=Ni+Nfire+Nvol-Nfix
with: Ni= immobilised N in soil organic matter Nfire = N losses in fire Nvol = N losses via NH3 volatilisation Nfix = N fixed by biological fixation
Data source: Forest fires statistics (ISTAT 1978 – 2000) Manual UBA , 1996
Average Nimacc

CCE Status Report 2008
49
Nupt
0
100
200
300
400
500
600
A B C E F G
EUNIS Ecosystem
Average (
eq
*h
a-1
*yr
-1)
Nupt
Data source: National Forest Inventory
Mapping Manual: Based on average annual stem growth x wood density x element concentration in wood. (Bonanni P. et al. 2001)
Average Nupt
CEC
0
20
40
60
80
100
120
140
160
180
200
A B C E F G
EUNIS Ecosystem
Average (
meq
*k
g-1
)
CEC
CEC= (0.44* pH+3.0) clay + (5.1 pH –5.9) Corg
(Eq. 5.2 M&M Manual)
Data source: European Soil Database EUSOILS Manual for Dynamic Modelling of Soil Response to Atmospheric Deposition
Average CEC
Cpool
0
2000
4000
6000
8000
10000
12000
A B C E F G
EUNIS Ecosystem
Average (
g*m
-2)
Cpool
Cpool = 106*rho* soil thickness * Corg/100
Data source: European Soil Database EUSOILS Manual for Dynamic Modelling of Soil Response to Atmospheric Deposition
Average Cpool

CCE Status Report 2008
50
Average lgKAlBc and lgKHBc
Critical Load of Acidity (eq*ha-1*yr-1) Critical Load of Nutrient Nitrogen (eq*ha-1*yr-1)
0,00
1,00
2,00
3,00
4,00
A B C E F G
EUNIS Ecosystem
Av
era
ge
lgKAlBc lgKHBc
Method: Average value weighted by ecosystem area Manual for Dynamic Modelling of Soil Response to Atmospheric Deposition

CCE Status Report 2008
51
References Bonanni P ., Brini S., Buffoni A., Stella G., Vialetto G., 2001. Acidificazione ed eutrofizzazione da deposizioni
atmosferiche: le mappe nazionali dei carichi critici. ANPA 14/2001 Bonanni P., Buffoni A., Daffinà R., Silli V., Cirillo M.C., 2005. Sensibilità alle deposizioni atmosferiche: i carichi critici
di acidità e di eutrofizzazione. APAT Miscellanea/2005 CCE (eds), 2004. Mapping Manual Revision 2004. Modelling and Mapping Critical Loads & Levels and Air Pollution
Effects, Risks and Trends. FOEFL (eds). 1994. Critical Loads of Acidity for Forest Soils and Alpine Lakes - Steady State Mass Balance Method.
Environmental Series No. 234, Federal Office of Environment, Forests and Landscape, Bern, 68 pp. De Vries W,Posch M,Reinds GJ,Kämäri J (1993). Critical loads and their exceedance on forest soils in Europe.Report
58,DLO Winand Staring Centre,Wageningen,The Netherlands, 116 pp. Downing R.J., Hettelingh J.-P., de Smet P.A.M. (eds.), 1993. Calculation and Mapping of Critical Loads in Europe: CCE
Status Report 1993. National Institute of Public Health and Environment. Rep. N° 259101003. Bilthoven, Netherlands
Hettelingh J.-P., Downing R.J., de Smet P.A.M. (eds.), 1991. Mapping Critical Loads for Europe. CCE Technical Report N. 1, RIVM Report N. 259101001. National Institute of Public Health and Environmental Protection (RIVM), Bilthoven, The Netherlands.
Posch M., Hettelingh j.p., Slootweg J. (eds.), 2003. Manual for Dynamic Modelling of Soil Response to Atmospheric Deposition.CCE Technical Report N.259101012/2003, RIVM
Reinds GJ,Posch M,De Vries W (2001). A semi-empirical dynamic soil acidification model for use in spatially explicit integrated assessment models for Europe.Alterra Report 084,Alterra Green World Research,Wageningen, The Netherlands, 55 pp.
UBA, 1996. Manual on Methodologies and Criteria for Mapping Critical Levels/Loads and geographical areas where they are exceeded. UN/ECE Convention on Long-range Transboundary Air Pollution. Federal Environmental Agency, Texte UmweltBundesAmt 71/96, Berlin.
Van der Salm C. , Kohlenberg L., de Vries W. 1998. Assessment of weathering rates in Dutch loess and river-clay soils at pH 3.5, using laboratory experiments. Geoderma n.85, 1998, pp.41–62.
CCE Status Report 2008
52
Netherlands
National Focal Centre/Contact
Arjen van Hinsberg Netherlands Environmental Assessment Agency PO Box 303 3720 AH Bilthoven, The Netherlands
Tel: +31 30 2743062 Fax: +31 30 2744479 E-mail: [email protected]
Collaborating institutions/Contact
Gert Jan Reinds Janet Mol Alterra, Wageningen UR P.O. Box 47 6700 AA Wageningen
Tel: +31-317 474697 Fax: + 31- 317 419000 E-mail: [email protected]
National Critical Load Maps
The Dutch data set on critical loads of acidity and nutrient nitrogen contains critical loads for protection of: • Forests (soils) against root damage due to elevated Al/Bc ratios and soil quality by requiring no
depletion of the soils’ Aluminium pool. • Plant species composition in terrestrial ecosystems (both forests and other semi-natural
vegetations) against eutrophication and acidification. • Plant species composition in small heathland lakes against eutrophication.
The methods to calculate these critical loads are described in a report the evaluation of the Dutch acid rain abatement strategies (Albers et al., 2001) and in various CCE reports since 2001. Critical acid loads for the protection of forest soils were calculated with SMB. Critical loads for the protection of heathland lakes were calculated with the dynamic model, AquAcid (Albers et al., 2001). The critical loads for the protection of terrestrial vegetations were calculated with a steady-state version of SMART2-MOVE/NTM (De Vries et al., 2007).
In 2008, both the critical loads for plant species composition in terrestrial ecosystems and the critical loads for forest soils were updated by using new H-Al equilibrium constants (see below). Critical loads for small heathland lakes remained unchanged. In response to the call for data, also empirical critical loads were mapped and dynamic scenario analyses were carried out with VSD and the dynamic version of SMART2-MOVE/NTM..

CCE Status Report 2008
53
Used data
Critical load and dynamic simulations were carried out for a number of different ecosystems (Table NL-1). VSD/SMB was applied for forest soils only, whereas SMART2 was used to compute critical loads and analyze scenarios for various semi-natural vegetations including forest understorey vegetations. Calculations were carried out for individual 250×250 m grid cells. The models were parameterized for different combinations of soil and vegetations types. For each individual 250x250 m grid cell the present combination of vegetation type and soil type was specified, by using an overlay of the 1:50,000 soil map and vegetation map. Soil types were differentiated into 16 major groups, including two non-calcareous sandy soils and one calcareous sandy soil, three loess soils, four non-calcareous clay soils, one calcareous clay soil and five peat soils (Van der Salm, 1999). All these soil types were further sub- divided into five hydrological classes, depending on the seasonal fluctuations of the groundwater table. With respect to vegetation types, we distinguished three groups of forests (deciduous forests, pine forests and spruce forests), and grassland and heath land (Van Hinsberg and Kros, 2001).Table NL-2 provides an overview of the various input parameters used in the different models. Parameterization of processes included in both SMB and SMART2 was kept as uniform as possible. Detailed information on model parameters can be found in the status report of 2003 (Van Hinsberg and de Vries, 2003), while an overview of the SMART2 model, along with its parameterization, is provided in Kros (1998).
Updated critical loads
The H-Al equilibrium constants in VSD and SMART2 were calibrated by comparing modelled pH change in the period 1950 -1990 with observed changes (Kros and Mol Dijkstra, 2001). This was done by selecting those constants and associated exponents from the range of values given in Dutch literature (Kros et al., 1995; Van der Salm and De Vries, 2001), which provide a close fit between modelled and measured pH values and the changes therein between 1950 and 1990.
Empirical critical loads
Ranges of empirical critical loads (Achermann and Bobbink, 2003) were assigned to the different nature targets types. Critical loads computed with SMART2-MOVE/NTM or AquAcid were used to assign one value to each target type, when calculated critical loads were inside the range of empirical critical loads. When calculated critical loads were outside of the empirical ranges, the nearest limit was used to set the empirical critical load. No critical loads were set for those nature target types for which no empirical ranges are available (i.e. fluvial, riparian or swamp woodlands and reedlands).
Dynamic modelling
Based on the software and data provided by CCE, 15 scenarios of combined N and S deposition were derived for the Netherlands. For forests, the VSD model was applied to evaluate these sce-narios, for plant species composition the dynamic version of SMART2-MOVE/NTM was used.
Both models were calibrated on spatial patterns of base saturation, Cpools and C/N ratio’s; for each grid cell the model was calibrated such that is reproduces the measurements in the year of observation. For the calibration, an improved map of ‘observed’ base saturation was constructed as described in the CCE Progress Report of 2007 (Slootweg et al., 2007).

CCE Status Report 2008
54
Table NL-1 Area of receptors
Eunis codes Short description Area (km2)
A2 Coastal low-mid salt marshes 68
B1 Coastal habitats (dunes) 272
C3 Inland surface water bodies 2
D1 Raised and blanket bogs (in combination with F4.11: wet heaths)
76
D2+D4 Valley mires, poor fens, transition mires or base rich fens
121
E1 Dry grasslands 390
E2 Mesic grasslands 306
E3 Seasonally wet and wet grasslands 241
F4 Temperate shrub heathland 359
G1+G3 Woodlands 2729
Table NL-2 Inputs for critical loads and dynamic modelling
Variable SMB SMART2 (Steady State)
CNACC Not used Derived from N availability
CRITTYPE Combined Al/Bc – no Al depletion Combined pH-N availability
CRITVALUE Forest type dependent Nature target dependent
THICK 0.4 m 0.4 m
BULKDENS Soil group dependent Soil group dependent
BCDEP Interpolated for 1×1 km cells Interpolated for 1×1 km cells
BCWE Soil group dependent Soil group dependent
BCUPT Function of growth and nutrient contents (for combina-tions of forest/soil types)
Modeled from growth and BC availability
QLE Derived from a hydrological model Derived from a hydrological model
LGKALOX Soil group dependent Soil group dependent
EXPAL Soil group dependent Soil group dependent
LHKHBC Calibrated using observed base saturation Calibrated using observed base saturation
LGKALBC Calibrated using observed base saturation Calibrated using observed base saturation
PCO2FAC Separate values for sand, clay and peat soils Separate values for sand, clay and peat soils
NIMACC Soil group dependent Soil group dependent
NUPT Function of growth and nutrient contents (for combina-tions of forest/soil types)
Modeled from growth, N demand and N availability
FDE Soil group dependent Soil group dependent
CEC Soil group dependent Soil group dependent
BSAT Spatial patterns based on regression with environmental factors
Spatial patterns based on regression with environmental factors
YEARBSAT 1995 1995
CPOOL Soil group dependent Soil group dependent
CNRAT0 Soil group dependent Soil group dependent
YEARCN 1995 1995

CCE Status Report 2008
55
References Achermann, B. & Bobbink, R. 2003. Empirical critical loads for nitrogen: expert workshop Berne 11-13 November
2002., Environemntal Documentation Vol. 164, Swiss Agency for the Environment, Forest and Landscape, 327 pp. Albers, R., Beck, J., Bleeker, A., Van Bree, L., Van Dam, J., Van der Eerden, L., Freijer, J., Van Hinsberg, A., Marra,
M., Van der Salm, C., Tonneijck, A., De Vries, W., Wesselink, L. & Woretelboer, F. 2001. Evaluatie van de verzuringsdoelstellingen: de onderbouwing, 725501001, Rijksinstituut voor volksgezondheid en milieu, Bilthoven, 200 pp.
De Vries, W., Kros, J., Reinds, G.J., W., W., van Dobben, H., Bobbink, R., Emmett, B., Smart, S., Evans, C., Schlutow, A., Kraft, P., Belyazid , S., Sverdrup, H., van Hinsberg, A., M., P. & Hettelingh, J.P. 2007. Developments in modelling critical nitrogen loads for terrestrial ecosystems in Europe., Alterra Report 1382, Wageningen, The Netherlands, 206 pp.
Kros, J., Reinds, G.J., De Vries, W., Latour, J.B. & Bollen, M.J.S. 1995. Modelling the response of terrestrial ecosystems to acidification and desiccation scenarios, Water, Air, & Soil Pollution 85 (3), 1101-1106.
Kros J. 1998. Verbetering, verfijning en toepassing van het model SMART2 - De modellering van de effecten van verzuring, vermesting en verdroging voor bossen en natuurterreinen ten behoeve van de Milieubalans. SC-DLO MBP Report 3, Wageningen, The Netherlands
Kros, J. & Mol Dijkstra, J.P. 2001. Historische pH en stikstofbeschikbaarheden in bossen en natuurterreinen, 217, Alterra, Research Instituut voor de Groene Ruimte, Wageningen (Netherlands), 29 pp.
Slootweg, J., Posch, M. & Hetteling, J.-P. 2007. Critical loads of nitrogen and dynamic modelling: CCE Progress Report 2007. Vol. 2008 Bilthoven.
Van der Salm C. 1999. Weathering in forest soils. PhD Thesis, University of Amsterdam, Amsterdam. Van der Salm, C. & De Vries, W. 2001. A review of the calculation procedure for critical acid loads for terrestrial
ecosystems, Sci. Tot. Environ. 271 (1-3), 11-25. Van Hinsberg A, Kros J. 2001. Dynamic modelling and the calculation of critical loads for biodiversity. In: Posch et al.
(eds): Modelling and Mapping of Critical Thresholds in Europe, CCE Status Report 2001, pp. 73-80. Van Hinsberg A, De Vries W. 2003. Netherlands. In: Posch et al. (eds) Modelling and mapping of critical thresholds in
Europe: CCE Status Report 2003. RIVM Report 259101013, Bilthoven, The Netherlands, pp. 93-97
CCE Status Report 2008
56
Norway
National Focal Centre
Thorjørn Larssen Norwegian Institute for Water Research (NIVA) Gaustadallén 21 0349 Oslo Norway
tel: +47 22185100 fax: +47 22185200 email: [email protected]
Collaborating institutions
IVL Swedish Environmental Institute P.O.Box 5302 SE-40014 Gothenburg Sweden
Norwegian Institute for Nature Research (NINA) Tungasletta 2 7485 Trondheim Norway
Norwegian Institute for Air Research (NILU) P.O. Box 100 2007 Kjeller Norway
Bernard J. Cosby Department of Environmental Sciences University of Virginia Charlottesville, VA 22932-4123 USA
Dynamic modelling
Modelling of aquatic ecosystems (lakes) have been carried out for the entire country using the MAGIC model (Cosby et al., 1985; Cosby et al., 2001). The model was calibrated to observational data from 990 of the 1007 statistically selected lakes in the 1995 National lake survey (Skjelkvåle et al., 1996). (17 lakes of the total 1007 lakes in the survey were disregarded due to very high phosphorus concentrations (and ANC) from local pollution, extremely high sea salt concentrations or inconsistencies in the catchment characteristics data available.) The model was calibrated to observed water chemistry for each of the lakes and to soil base saturation from nearest available (or most relevant) sample. In the automatic calibration routine of MAGIC the following switches were set: BC optimizer (weathering calibration): on, SO4 adsorption optimizer: off, soil pH opti-mizer: on, N dynamics optimizer: off (this means that nitrogen uptake in the catchment was as-sumed proportional (with a constant proportion) to the input at all times).
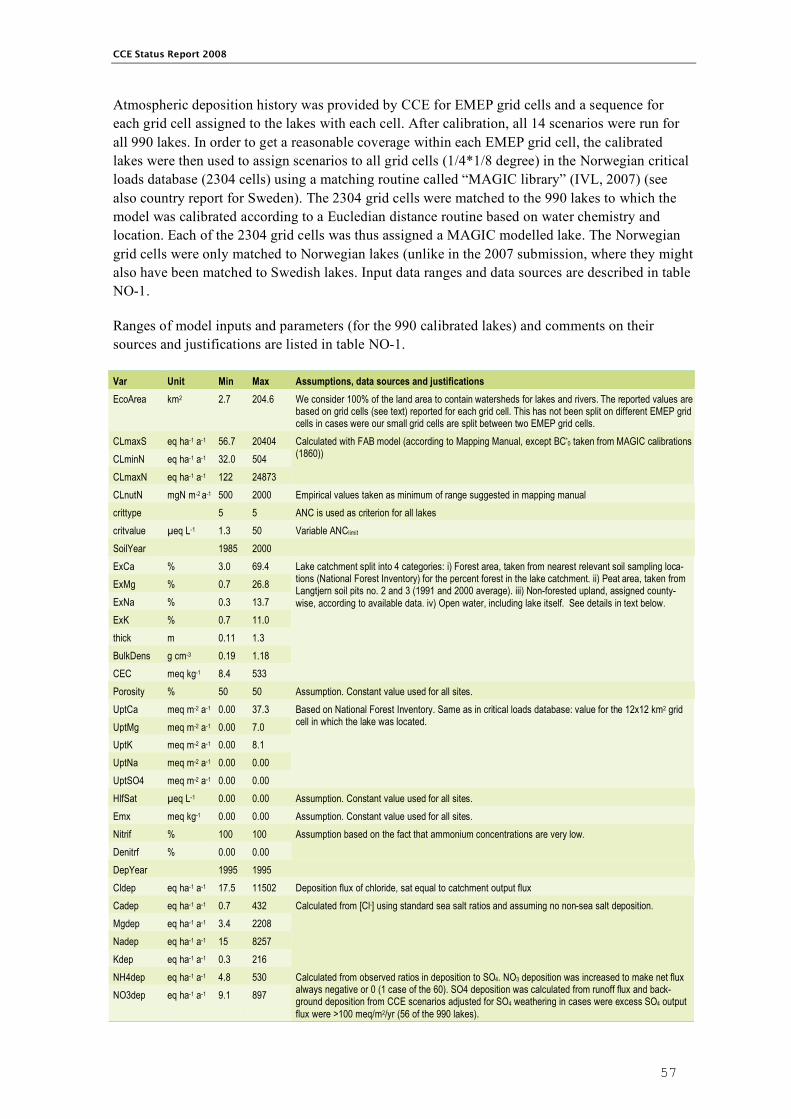
CCE Status Report 2008
57
Atmospheric deposition history was provided by CCE for EMEP grid cells and a sequence for each grid cell assigned to the lakes with each cell. After calibration, all 14 scenarios were run for all 990 lakes. In order to get a reasonable coverage within each EMEP grid cell, the calibrated lakes were then used to assign scenarios to all grid cells (1/4*1/8 degree) in the Norwegian critical loads database (2304 cells) using a matching routine called “MAGIC library” (IVL, 2007) (see also country report for Sweden). The 2304 grid cells were matched to the 990 lakes to which the model was calibrated according to a Eucledian distance routine based on water chemistry and location. Each of the 2304 grid cells was thus assigned a MAGIC modelled lake. The Norwegian grid cells were only matched to Norwegian lakes (unlike in the 2007 submission, where they might also have been matched to Swedish lakes. Input data ranges and data sources are described in table NO-1.
Ranges of model inputs and parameters (for the 990 calibrated lakes) and comments on their sources and justifications are listed in table NO-1. Var Unit Min Max Assumptions, data sources and justifications EcoArea km2 2.7 204.6 We consider 100% of the land area to contain watersheds for lakes and rivers. The reported values are
based on grid cells (see text) reported for each grid cell. This has not been split on different EMEP grid cells in cases were our small grid cells are split between two EMEP grid cells.
CLmaxS eq ha-1 a-1 56.7 20404 CLminN eq ha-1 a-1 32.0 504 CLmaxN eq ha-1 a-1 122 24873
Calculated with FAB model (according to Mapping Manual, except BC*0 taken from MAGIC calibrations (1860))
CLnutN mgN m-2 a-1 500 2000 Empirical values taken as minimum of range suggested in mapping manual crittype 5 5 ANC is used as criterion for all lakes critvalue µeq L-1 1.3 50 Variable ANClimit SoilYear 1985 2000 ExCa % 3.0 69.4 ExMg % 0.7 26.8 ExNa % 0.3 13.7 ExK % 0.7 11.0 thick m 0.11 1.3 BulkDens g cm-3 0.19 1.18 CEC meq kg-1 8.4 533
Lake catchment split into 4 categories: i) Forest area, taken from nearest relevant soil sampling loca-tions (National Forest Inventory) for the percent forest in the lake catchment. ii) Peat area, taken from Langtjern soil pits no. 2 and 3 (1991 and 2000 average). iii) Non-forested upland, assigned county-wise, according to available data. iv) Open water, including lake itself. See details in text below.
Porosity % 50 50 Assumption. Constant value used for all sites. UptCa meq m-2 a-1 0.00 37.3 UptMg meq m-2 a-1 0.00 7.0 UptK meq m-2 a-1 0.00 8.1 UptNa meq m-2 a-1 0.00 0.00 UptSO4 meq m-2 a-1 0.00 0.00
Based on National Forest Inventory. Same as in critical loads database: value for the 12x12 km2 grid cell in which the lake was located.
HlfSat µeq L-1 0.00 0.00 Assumption. Constant value used for all sites. Emx meq kg-1 0.00 0.00 Assumption. Constant value used for all sites. Nitrif % 100 100 Denitrf % 0.00 0.00
Assumption based on the fact that ammonium concentrations are very low.
DepYear 1995 1995 Cldep eq ha-1 a-1 17.5 11502 Deposition flux of chloride, sat equal to catchment output flux Cadep eq ha-1 a-1 0.7 432 Mgdep eq ha-1 a-1 3.4 2208 Nadep eq ha-1 a-1 15 8257 Kdep eq ha-1 a-1 0.3 216
Calculated from [Cl-] using standard sea salt ratios and assuming no non-sea salt deposition.
NH4dep eq ha-1 a-1 4.8 530 NO3dep eq ha-1 a-1 9.1 897
Calculated from observed ratios in deposition to SO4. NO3 deposition was increased to make net flux always negative or 0 (1 case of the 60). SO4 deposition was calculated from runoff flux and back-ground deposition from CCE scenarios adjusted for SO4 weathering in cases were excess SO4 output flux were >100 meq/m2/yr (56 of the 990 lakes).

CCE Status Report 2008
58
Var Unit Min Max Assumptions, data sources and justifications LakeYear 1995 1995 Calake µmol L-1 2.0 1801 Mglake µmol L-1 0.7 821 Nalake µmol L-1 3.5 905 Klake µmol L-1 0.5 81.8 NH4lake µmol L-1 0.0 11.6 SO4lake µmol L-1 4.2 583 Cllake µmol L-1 5.6 832 NO3lake µmol L-1 0.07 97.1 DOC µmol L-1 8.3 1208
1995 National lake survey.
RelArea % 0.24 78.1 Data for each catchment RelForArea % 0.0 95.7 Data for each catchment RetTime yr 0.5 20 Assumption. 3 classes, by lake size. Qs m 0.16 5.2 Runoff taken from digital 30-year normal (1961-1990) runoff database. expAllake 3.00 3.00 Assumption. Constant value used for all sites. pCO2 % 0.06 0.06 Assumption. Constant value used for all sites. Cased m a-1 0.00 0.00 Mgsed m a-1 0.00 0.00 Nased m a-1 0.00 0.00 Ksed m a-1 0.00 0.00 SO4sed m a-1 0.00 0.00 Clsed m a-1 0.00 0.00 NH4sed m a-1 0.00 0.00 NO3sed m a-1 0.00 0.00
Assumption. Constant value used for all sites.
UptNH4lake % 0.00 0.00 Assumption. Constant value used for all sites. UptNO3lake % 0.00 0.00 Assumption. Constant value used for all sites.
Soil data calculations and assignments
Forest soil data available from the national forest inventory on a grid cell basis. Of the 990 lakes, 342 were located in a grid cell were forest data were available (and hence forest present). Additional 221 lakes had forest in their catchments; for these lakes soils data were taken from nearest neighbor with data. 427 of the lakes had no forest in the catchments.
Mountain/upland/heath soils: Assigned from data available from different research projects. Data sources used: • Vest-Adger and Rogaland: About 30 sites in heathlands sampled in 1998 by NIJOS using the
same protocol as for the national surveys of forest soils. Grid based site selection. In addition one site (Stavsvatn) in Telemark. Reference: (Wright et al., 1999)
• Yndesdal, Hordaland/Sogn og fjordane. Catchment weighted average of data from about 8 soil samples collected in 2003. Reference: (Bjerknes et al., 2004)
• Dalelva, Finnmark. Soil data from national monitoring sampled in 1990 with original data in the SFT 1991 annual report. Aggregated data used here are from the MAGIC calibration to Dalelva. Reference: (Wright and Traaen, 1992)
• Storgama, Vikedal, Gaular, Naustal, Sogndal, Risdalsheia. Soil data from national monitoring sampled in 1980s and with original data reported in SFTs annual reports. RAIN data from NIVA, in ARRR. Aggregated data used here are from the MAGIC calibrations. Reference: (Wright et al., 1990)
• Vosso, Hordaland. Catchment weighted averages from about 6 soil samples collected in 2000. Reference: (Kroglund et al., 2002)
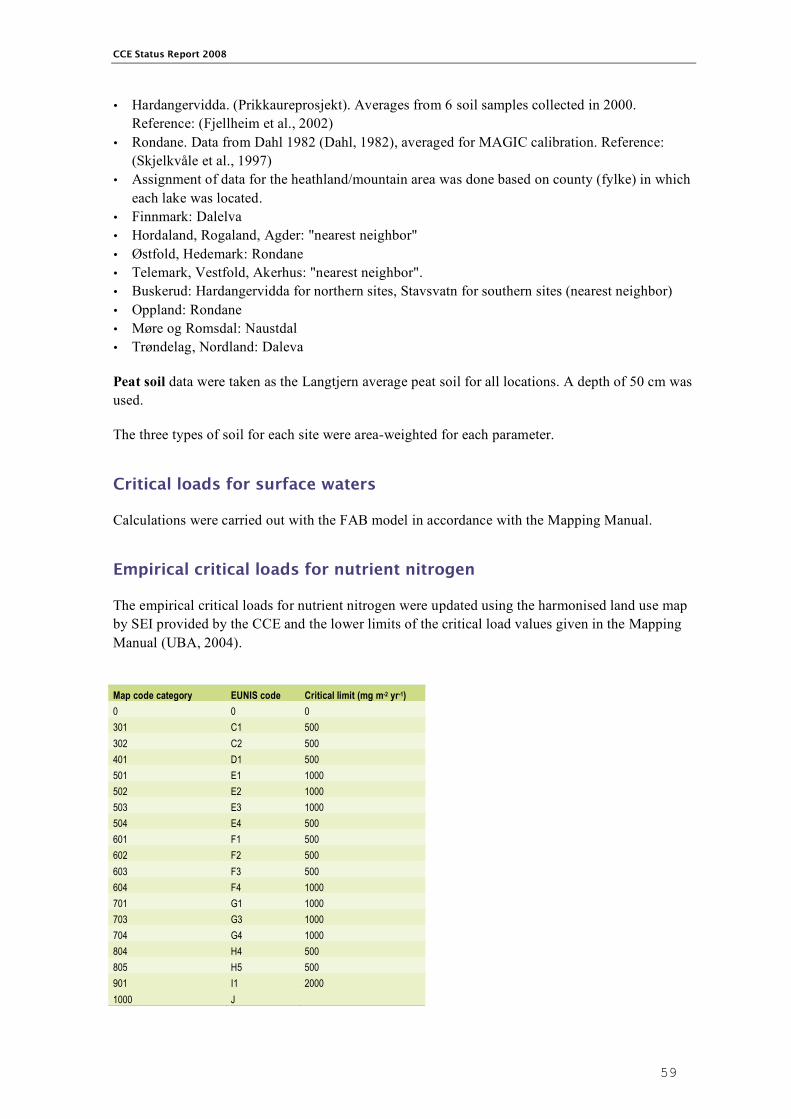
CCE Status Report 2008
59
• Hardangervidda. (Prikkaureprosjekt). Averages from 6 soil samples collected in 2000. Reference: (Fjellheim et al., 2002)
• Rondane. Data from Dahl 1982 (Dahl, 1982), averaged for MAGIC calibration. Reference: (Skjelkvåle et al., 1997)
• Assignment of data for the heathland/mountain area was done based on county (fylke) in which each lake was located.
• Finnmark: Dalelva • Hordaland, Rogaland, Agder: "nearest neighbor" • Østfold, Hedemark: Rondane • Telemark, Vestfold, Akerhus: "nearest neighbor". • Buskerud: Hardangervidda for northern sites, Stavsvatn for southern sites (nearest neighbor) • Oppland: Rondane • Møre og Romsdal: Naustdal • Trøndelag, Nordland: Daleva
Peat soil data were taken as the Langtjern average peat soil for all locations. A depth of 50 cm was used.
The three types of soil for each site were area-weighted for each parameter.
Critical loads for surface waters
Calculations were carried out with the FAB model in accordance with the Mapping Manual.
Empirical critical loads for nutrient nitrogen
The empirical critical loads for nutrient nitrogen were updated using the harmonised land use map by SEI provided by the CCE and the lower limits of the critical load values given in the Mapping Manual (UBA, 2004).
Map code category EUNIS code Critical limit (mg m-2 yr-1) 0 0 0 301 C1 500 302 C2 500 401 D1 500 501 E1 1000 502 E2 1000 503 E3 1000 504 E4 500 601 F1 500 602 F2 500 603 F3 500 604 F4 1000 701 G1 1000 703 G3 1000 704 G4 1000 804 H4 500 805 H5 500 901 I1 2000 1000 J

CCE Status Report 2008
60
References Bjerknes V, Wright RF, Larssen T, Håvardstun J. Kalkingsplan for Yndesdal-Frøysetvassdraget basert på
tålegrenseberegninger og prognoser for reduksjoner av surt nedfall. 4882-2004. Norsk institutt for vannforskning (NIVA), Oslo. 2004, 52.
Cosby BJ, Wright RF, Hornberger GM, Galloway JN. Modelling the effects of acid deposition: estimation of long term water quality responses in a small forested catchment. Water Resources Research 1985; 21: 1591-1601.
Cosby BJ, Ferrier RC, Jenkins A, Wright RF. Modelling the effects of acid deposition: refinements, adjustments and inclusion of nitrogen dynamics in the MAGIC model. Hydrology and Earth System Sciences 2001; 5: 499-518.
Dahl E. Acidification of soils in the Rondane Mountains, south Norway, due to acid precipitation. 1988:1. Økoforsk, Ås, Norway. 1982, 53.
Fjellheim A, Tysse Å, Bjerknes V, Wright RF. Finprikkauren på Hardangervidda. DN-utredning 2002-1. Direktoratet for naturforvaltning, Trondheim. 2002, 58.
IVL. Description of the MAGIC library (In Swedish) http://www.ivl.se/affar/grundl_miljos/proj/magic/bibliotek.asp. In: 2007.
Kroglund F, Wright RF, Burchart C. Acidification and Atlantic salmon: critical limits for Norwegian rivers. 111. Norwegian Institute for Water Research, Oslo. 2002, 1-61.
Skjelkvåle BL, Wright RF, Tjomsland T. Vannkjemi, forsuringsstatus og tålegrenser i nasjonalparker; Femundsmarka og Rondane. 88. NIVA, Oslo. 1997, 1-41.
Skjelkvåle BL, Henriksen A, Faafeng B, Fjeld E, Traaen TS, Lien L, Lydersen E, Buan AK. Regional innsjøundersøkelse 1995. En vannkjemisk undersøkelse av 1500 norske innsjøer. 677/96. Statens forurensningstilsyn, Oslo, Norway. 1996, 73.
UBA. Manual on Methologies and Criteria for Modelling and Mapping Critical Loads and Levels and Air Pollution Effects, Risks and Trends. 52/04. Umwelt Bundes Amt, Berlin. 2004, 240 pp.
Wright RF, Traaen TS. Dalelva, Finnmark, northernmost Norway: prediction of future acidification using the MAGIC model. 2728. Norwegian Institute for Water Research, Oslo. 1992, 17.
Wright RF, Mulder J, Esser JM. Soils in mountain and upland regions of southwestern Norway: nitrogen leaching and critical loads. 103. Norwegian Institute for Water Research, Oslo. 1999, 45.
Wright RF, Stuanes AO, Reuss JO, Flaten MB. Critical Loads for Soils in Norway. Preliminary Assessment based on Data from 9 Calibrated Catchments. 11. Norwegian Institute for Water Research, Oslo. 1990, 1-56.

CCE Status Report 2008
61
POLAND
National Focal Centre
Wojciech A. Mill, Adrian Schlama, Tomasz Pecka Institute of Environmental Protection Section of Integrated Modelling Grunwaldzka Str. 7B/2 PL-41-106 Siemianowice Śl.
tel/fax: +48 32 2281482 [email protected]
Collaborating institutions
State Inspectorate of Environmental Protection, Department of Monitoring Contractor: Ryszard Twarowski, Jan Błachuta Institute of Meteorology and Water Management the Wrocław Branch Parkowa Str. 30 PL-51-616 Wrocław
tel: +48 71 3281446
Forest Research Institute the operator of the II-level Forest Monitoring System funded by the Chief Inspectorate of Environment Protection Braci Leśnej Str. 3 Sękocin Stary 05-090 Raszyn
Modelled critical loads and dynamic data
Introduction
In response to the current CCE call for data the Polish NFC is submitting critical loads calculations results and dynamic modelling outputs for six distinct terrestrial habitats (Table PL-1). The spatial resolution applied is determined by 1 km2 grid squares which contains 1 ha or more of the habitat.
Table PL-1: Ecosystems subject to critical load calculations and dynamic modelling
Area Percentage of Ecosystem EUNIS code km2
No of grid cells receptor area
Broad-leaved forest G1 16056 30153 17.8 Coniferous forest G3 48398 88151 53.6 Mixed forest G4 23107 42992 25.6 Natural grasslands E 577 1145 0.6 Moors and heath land F 78 128 0.1 Mire, bog and fen habitats D 2114 3956 2.3 Total 90330 166524 100.0

CCE Status Report 2008
62
Methods and data sources
Critical loads were calculated using the VSD model and dynamic modelling was performed by use of the VSD/ACCESS model version supplied by the CCE. In general the input parameters were estimated in accordance with the Mapping Manual procedures. A detailed description of the input data and calculation methods used is given in Table PL-2. The main source of soil data was the II-level Forest Monitoring System operated by the Forest Research Institute within the National Monitoring of Environment funded by the Chief Inspectorate of Environment Protection. Data from 148 forest monitoring sites were regionalized to fit to a grid system determined by a 1 km2 size grid cell.
Table PL-2:Data description, methods and sources
Critical loads parameter
Method or value used Data source
CLmax(S) [eq ha-1a-1] Calculated by VSD
CLmin(N) [eq ha-1a-1] Calculated by VSD
CLmax(N) [eq ha-1a-1] Calculated by VSD CLnut(N) [[eq ha-1a-1] Calculated by VSD nANCcrit [eq ha-1a-1] Calculated by VSD lgKAlBc Calculated by VSD lgKHBc Calculated by VSD CNrat0 Calculated by VSD cNacc [meq m-3] Revised values from Mapping manual Table 5.7 crittype 2 critvalue [Al]=0.2 [eq m-3] thick 0.5 [m] bulkdens [g cm-3] II-level Forest Monitoring System operated by the
Forest Research Institute (Wawrzoniak et al., 2005) BCdep [eq ha-1a-1] The bulk deposition values of base cations were estimated from the
reported wet deposition data multiplied by dry deposition factors derived from throughfall data provided by the integrated monitoring surveys
Data for 2006 from monitoring network operated by the Institute of Meteorology and Water Management – Wroclaw Branch under the authority of Main Inspec-torate of Environment Protection
BCu [eq ha-1a-1] New data on stem and branches harvesting for the period 1985-1998 from the Central Statistical Office – Section Forestry database were used.
The mean element contents for stems and branches were taken from the Mapping Manual (UBA, 2004).
BCw [eq ha-1a-1] Soil type – texture approximation according to Mapping Manual (UBA, 2004).
Soil types identified from the Soil Geographical Database of Europe
Qle [mm/a] Actual evapotranspiration was calculated by the method of Federer (1982) based on the Monteith (1964) equation. Interception was computed according to (deVries at al., 2003)
Historical time series of meteorological data acquired from Climate Change Unit of the University of East Anglia (New,et al., 2002)
lgKAlox [m6/eq2] 300 [m6/eq2] for mineral soils Mapping Manual (UBA, 2004). expAl 3 Mapping Manual (UBA, 2004). pCO2fac 15 Mapping Manual (UBA, 2004). cOrgacids [eq m-3] Based on DOC values estimated form soil properties and vegetation types II-level Forest Monitoring System operated by the
Forest Research Institute (Wawrzoniak et al., 2005) Nimacc [eq ha-1a-1] A temperature dependent long-term immobilization factor was applied,
ranging from 71 to 356 [eq ha-1a-1] CCE Status Report’2001 (Posch et al., 2001)
Nu [eq ha-1a-1] New data on stem and branches harvesting for the period 1985-1998 from the Central Statistical Office – Section Forestry database were used.
The mean element contents for stems and branches from the Mapping Manual (UBA, 2004).
fde Depending on soil clay content, values from 0.1 to 0.8 were applied CCE Status Report’2001(Posch et al., 2001) Nde [eq ha-1a-1] Ignored CEC [meq kg-1] II-level Forest Monitoring System operated by the
Forest Research Institute (Wawrzoniak et al., 2005) bsat II-level Forest Monitoring System operated by the
Forest Research Institute (Wawrzoniak et al., 2005) yearbsat 2004 Cpool [g m-2] CNrat II-level Forest Monitoring System operated by the
Forest Research Institute (Wawrzoniak et al., 2005) yearCN 2004

CCE Status Report 2008
63
Critical load maps
The resulting critical load maps for CLmaxS and CLnutN are shown in Figures PL-1.
55°00’’
54°00’’
53°00’’
52°00’’
51°00’’
50°00’’
15°00’’ 16°00’’ 17°00’’ 18°00’’ 19°00’’ 20°00’’ 21°00’’ 22°00’’ 23°00’’ 24°00’’49°00’’
0 25
Kilometers
50
Maximum critical loads of sulphur
Critical loads of nutrient nitrogen
2008
2008
0 25
Kilometers
50
55°00’’
54°00’’
53°00’’
52°00’’
51°00’’
50°00’’
15°00’’ 16°00’’ 17°00’’ 18°00’’ 19°00’’ 20°00’’ 21°00’’ 22°00’’ 23°00’’ 24°00’’49°00’’
Figure PL-1. Critical loads.Institute of Environmental ProtectionDepartment of Environmental Policy - Section of Integrated ModellingGrunwaldzka Str. 7b/2, 41-106 Siemianowice Sl., Poland
0 - 200 (0.0%)
200 - 400 (5.1%)
400 - 700 (24.3%)
700 - 1000 (21.1%)
1000 - 1500 (33.1%)
eq/ha/year
> 1500 (16.5%)
0 - 200 (2.1%)
200 - 400 (18.5%)
400 - 700 (65.9%)
700 - 1000 (12.8%)
1000 - 1500 (0.7%)
eq/ha/year
> 1500 (0.0%)

CCE Status Report 2008
64
Empirical critical loads of nutrient nitrogen
Empirical critical loads of nutrient nitrogen were slightly modified against those submitted in 2007 following the recently updated content of Table 5.1. of the Mapping Manual and with regard to the adaptation rules summarized in Table 5.2. of this manual.
Figure PL-2 presents the spatial distribution of empirical critical loads values of nutrient nitrogen.
55°00’’
54°00’’
53°00’’
52°00’’
51°00’’
50°00’’
15°00’’ 16°00’’ 17°00’’ 18°00’’ 19°00’’ 20°00’’ 21°00’’ 22°00’’ 23°00’’ 24°00’’49°00’’
0 25
Kilometers
50
Empirical critical loads of nitrogen 2008
Figure PL-2. Critical loads.Institute of Environmental ProtectionDepartment of Environmental Policy - Section of Integrated ModellingGrunwaldzka Str. 7b/2, 41-106 Siemianowice Sl., Poland
10 - 11 (57.8%)
11 - 12 (13.5%)
12 - 13 (5.9%)
13 - 14 (5.4%)
14 - 15 (3.6%)
kg N/ha/year
15 - 16 (2.7%)
> 16 (11.1%)
Data measured
Atmospheric depositions of Ca, Mg, K, Na and Cl are all measured by the Institute of Meteorology and Water Management the Wroclaw Branch within the State Monitoring of Environment.
Soil bulk density, CEC, base saturation and C:N ratio are measured by the Forest Research Institute within the II-level Forest Monitoring Net functioning under the ICP Forests.
Acknowledgements
The Polish Ministry of Environment and the National Fund for Environment Protection and Water Management provided formal foundation and financial support to this study what is gratefully acknowledged. The help of the CCE staff in deriving some of input data and the implementation of the VSD model is particularly appreciated.
CCE Status Report 2008
65
References de Vries W., M. Posch, G. J. Reinds, J. Kämäri (1993), Critical loads and their exceedances on forest soils in Europe.
Report 58, The Winand Staring Centre for Integrated Land, Soil and Water Reasearch, Wageningen, the Netherlands Federer, C A (1982), Transpirational supply and demand: Plant, soil and atmospheric effects evaluated by simulation.
Water Resources Research 18 (2): 355-362 Monteith, J L (1964), Evaporation and environment. In the state and movement of water in living organisms. Symp. Soc.
Exp. Biol., 19, 205-233 New, M., Lister, D., Hulme, M. and Makin, I., (2002) A high-resolution data set of surface climate over global land
areas. Climate Research 21:1-25 Posch M., J-P. Hettelingh, P.A.M.de Smet, R.Downing,(2001) Calculation and Mapping of Critical Thresholds in
Europe: CCE Status Report No.6, RIVM Report No.259101009, Bilthoven, The Netherlands UBA (2004), Manual on Methodologies and Criteria for Modelling and mapping critical Loads and Levels and Air
Pollution Effects, Risks and Trends, Umweltbundesamt, Berlin Wawrzoniak J, Małachowska J, Wójcik J and Liwińska A, (2005) Stan uszkodzenia lasów w Polsce w 2004 r. na
podstawie badań monitoringowych, Biblioteka Monitoringu Środowiska PIOŚ, Warszawa

CCE Status Report 2008
66
Romania
National Focal Centre
Felicia IOANA Ministry of Environment and Sustainable Development - General Directorate of Impact Assessment, Pollution Control and Air Protection 12 Libertăţii Blvd. 5 Bucharest, 70005 ROMANIA
Phone/Fax: +40 21 316 04 21 [email protected] www.mmediu.ro
Collaborating institutions
National Research and Development Institute for Soil Science, Agro chemistry and Envi-ronmental Protection Bucharest, Romania
Forest Research and Management Institute of Romania National Research and Development Institute for Environmental Protection - ICIM Bucharest, Romania
National Meteorological Administration Bucharest, Romania
Data sources
Calculation methods for critical loads of acidity and nutrient nitrogen
The first national critical load dataset of Romania was computed using the steady-state mass balance approach. About 42 % of the area of Romania is covered by forests for which critical loads of acidity and nutrient nitrogen are calculated in accordance to the methods described in the Mapping Manual (UBA 2004, updated version 2007). The critical load database of Romania consists of 97 964 records, a detailed description of the data and the methods for derivation is given in Table RO-1.
Critical loads of acidity, CLmax
(S): The highest critical loads of acidity [CLmax(S)] with values up to 10 keq ha-1 a-1 are observed in the riverside tree galleries along Dunarea, Siret, Mures and their tributaries. High weathering rates of alluvial wet clay soils in addition to low sensitivity of the tree species of grey oak-ash-poplar forests result in very high CLmax(S). In the Romanian Land situated north of Danube and south of the Southern Carpathians and Dobrogea the less sensitive mixed oak forests on soils (rendzina, chromic luvisols) with high weathering rates of base cations and relatively high deposition rates of base cations coming with the south wind result in high critical loads of acidity with values from 3 to 10 keq ha-1 a-1. Medium high critical loads (about 1.5 – 3 keq ha-1 a-1) are located in the lower (colline) mountains of Carpatii Meridionali (Southern Carpathians) and in Transylvania region. Here sensitive dystric cambisol soils combined with less sensitive beech and mixed beech forests cause a medium critical load. The higher mountains of Carpatii Meridionali, Carpatii Orientali

CCE Status Report 2008
67
(Eastern Carpathians) and in Transylvania region with dystric cambisol soils are combined with more sensitive spruce forests (critical loads from 0,5 to 1,5 keq ha-1 a-1). The lowest critical loads (<0,5 keq ha-1 a-1) have to be allocated to the lowlands of Transylvania and Moldova regions because of relatively low deposition rates of base cations behind the mountain barrier against the south wind. The regional distribution of critical loads of acidity is shown in Figure RO-1.
Critical loads of nutrient nitrogen, CLnut
(N): The highest critical loads of nutrient nitrogen (>25 kg N ha-1 a-1) can be observed on rich loess soils with very high acceptable leaching rates caused by high precipitation at the lower west and south of Carpatii Meridionali.
Similar to the critical loads of acidity the lower (colline) mountains of Carpatii Meridionali and in the Transylvania region also have high critical loads of nutrient nitrogen (about 20-25 kg N ha-1 a-1). A high uptake by harvesting of the oak and beech trees on rich stagno-luvisols is accompanied by a relatively high denitrification rate. Medium high critical loads (15- 20 kg ha-1 a-1) are located in Moldova region and in the lowlands between the Carpathian Mountains and Transylvania. Eutric regosols and gleyic luvisols could cause a medium growth rate, high denitrification and a medium leaching rate. The lowest critical loads values (7,5 - 15 kg ha-1 a-1) are observed in the mountains of Carpatii Meridionali, Carpatii Orientali and Transylvania region with poor dystric cambisol soils and low uptakes, but high immobilisation rates caused by low temperature in the high mountains. The regional distribution of critical loads of nutrient nitrogen is shown in Figure RO-2.
Table RO-1: National critical load database and calculation methods / approaches
Parameter Term Unit Description CLmaxS eq ha-1 a-1 Manual, equation 5.22 CLminN eq ha-1 a-1 Manual, equation 5.25
Critical load of acidity
CLmaxN eq ha-1 a-1 Manual, equation 5.26 Critical load of nutrient nitrogen
CLnutN eq ha-1 a-1 Manual, equation 5.5
Manual; the minimum value of the following approaches using different chemical criteria was taken for the calculation (see crittype in the call for data):
Acid neutralisation capacity lea-ching
nANC(crit) eq ha-1 a-1
1 [Al]:[Bc] 2 [Al] 4 pH 6 [Bc]:[H]
equation 5.31 Derived from Alle(crit) in equation 5.32-5.34 by Alle/Qle
equation 5.35 equation 5.36
Acceptable nitrogen leaching Nle(acc) eq ha-1 a-1 Manual, equation 5.6; see Table 6 of the CCE instructions for [N]crit values Thickness of soil layer thick m Actually rooted zone Bulk density of the soil bulkdens g cm-3 Romanian general soil map (FAO classes),
ICPA – Romanian Institute for Soil science BC deposition Cadep eq ha-1 a-1 EMEP Deposition Data Weathering of base cations Cawe eq ha-1 a-1 Manual, equation 5.39, Manual, table 5.12-5.14 Uptake of base cations by vegeta-tion
Caupt eq ha-1 a-1 Manual, equation 5.8 (without branches) Manual, table 5.8 for element contents, Jacobson et al 2002
Amount of water percolating through the root zone
Qle mm a-1 Hydrological Data from the National Meteorological Administration (INMH)
Nitrogen immobilisation Nimm eq ha-1 a-1 Vegetation period dependent, coniferous forest 2-5 kg ha-1 a-1, all other vegetation types 1-4 kg ha-1 a-1
Nitrogen uptake by vegetation Nupt eq ha-1 a-1 Manual, equation 5.8 (without branch) Manual, table 5.8 for element contents, Jacobson et al 2002
Denitrification factor fde - Depending on pore volume for pF>4.2, influence of (ground) water on the hori-zons and nutrient availability according to Manual Table 5.9
Exchange constant for Al vs. Bc lgKAlBc Gapon, based on Manual, Table 6.4 Exchange constant for Al vs. H lgKAlH Gapon, based on Manual, Table 6.4 EUNIS code EUNIScode Forest Inventory Data from Forest Research and Management Institute (ICAS)
and Schlutow (2004)

CCE Status Report 2008
68
Figure RO-1. Critical loads of acidity, CLmax(S) in Romania, receptor forest ecosystems.
Figure RO-2: Critical loads of nutrient nitrogen, CLnut(N) in Romania, receptor forest ecosystems.

CCE Status Report 2008
69
References UBA (2004) Manual on methodologies and criteria for modelling and mapping critical loads and levels and air pollution
effects, risks and trends. Umweltbundesamt Texte 52/04, Berlin www.icpmapping.org (updated version of 2007) Schlutow A (2004), CORINE Land Cover application for assessment and mapping of critical loads in Germany,
Proceedings of the CORINE workshop, Berlin, 21.01.2004 National Research and Development Institute for Soil Science, Agro chemistry and Environmental Protection Bucharest,
Romania), A. O. of Land and Water Use Section) (1999a): Soil Map of Romania 1: 200 000; National Research and Development Institute for Environmental Protection of Romania - ICIM Bucharest - Air Quality
Control- Department - Land use map (CORINE) and national deposition data set; N.Donita, V. Gancz, C. Bandiu, Joita Apostol, I.A. Biris, Cristina Marcu (2007)- Forest Research and Management
Institute of Romania; Map of the forest ecosystems types - digital map, reference scale 1:100.000. N. GEAMBASU-Forest Research and Management Institute of Romania – ICAS Bucharest: Data set concerning the soil
analysis for the Level I ICP Forests plots established in Romania; C. IACOBAN -Forest Research and Management Institute of Romania – ICAS Câmpulung Moldovenesc: Deposition
data set for the Level II ICP Forests plots established in Romania (period 2002 – 2005); National Meteorological Administration, Bucharest, Romania - Department of Climatology. Precipitation map (period
1961-1990)

CCE Status Report 2008
70
Slovenia
National Focal Centre
Felicia IOANA Ministry of Environment and Sustainable Development - General Directorate of Impact Assessment, Pollution Control and Air Protection 12 Libertăţii Blvd. 5 Bucharest, 70005 ROMANIA
Phone/Fax: +40 21 316 04 21 [email protected] www.mmediu.ro
Collaborating institutions
Primoz Simoncic, Milan Kobal, Mihej Urbancic, Lado Kutnar, Slovenian Forestry Institute Vecna pot 2 1000 Ljubljana
Franc Batic, Klemen Eler, University of Ljubljana, Biotechnical faculty Jamnikarjeva 101 1000 Ljubljana
Report of the 2007 call for data:
Critical Loads and Dynamic Modelling of Sulfur and Nitrogen Depositions
This investigation was performed by order and for the account of the Directorate for International Affairs of the Dutch Ministry of Housing, Spatial Planning and the Environment, of the Coordination Centre for Effects at the Netherlands Environmental Assessment Agency and of the Slovenian Ministry of Environment and Spatial Planning.
Acknowledgements
Many thanks to people from CCE: Jean-Paul Hettelingh, Max Posch and Jaap Slootweg for all their support, valuable comments and technical help and to the project “Developing expertise, data and models for establishing a Slovenian NFC for the support of European effect-based air

CCE Status Report 2008
71
pollution abatement policies”, case number: 901 7.06.1 068, founded by the Ministry of VROM and the Ministry of housing, spatial planning and the environment.
Introduction
The current report on critical loads and dynamic modelling of air pollutants under the LRTAP convention is the first attempt of Slovenian project team (SFI & BF) in cooperation with CCE (J. Slootweg, M. Posch) to evaluate forest ecosystems of Slovenia for their susceptibility to atmospheric depositions of nitrogen and sulfur, to derive maps of possible exceedances and to compute the target loads for different deposition scenarios. This early attempt inevitably has some flaws due to lack of high precision data (particularly soil data) which makes the final results less accurate. Some refinement in weathering rates, uptake quantities, and especially in depositions of base cations and pollutants is necessary in the future.
Modelling was done exclusively on forest ecosystems of Slovenia. Due to high percentage of forests in Slovenia the area being included in the modelling is high and reaches 54.2% of the national territory. The % of forest area is smaller (cca. 6%) due to older version of forest community map. We are planning to include the semi-natural grasslands in the modeling process in the future due to their high ecological value.
Receptor definition
Receptor is the fundamental unit which all the calculations and estimations regarding critical loads are made on. It is a patch of forest with its distinct plant community composition and soil and other environmental properties. Receptor responds presumably homogeneously to environmental factors e.g. air pollutants. Spatial data of Slovenian forest inventory was used to define receptors. Forest patches (plus Pinus mugo alpine shrublands) were classified into 34 EUNIS habitat categories (figure SI-1, table SI-1). Overlaying forest community map with the EMEP 50×50 km grid and discarding polygons smaller than 1 ha resulted in altogether 12691 receptors.
Table SI-1: EUNIS forest habitat types identified in Slovenia which all receptors were ascribed to. Additionally, some envi-ronmental characteristics (ordinal scale: 1 small value, 5 high value) of EUNIS categories are shown.
EUNIS code Habitat type description Temperature class
Soil moisture class
Base cation availability
class
N and P limitation
Management intensity
F2.42 Outer Alpine Pinus mugo scrub 1 3 3 3 1
F2.47 Pelago dinaride Pinus mugo scrub 1 3 3 3 1
G1.1112 Eastern European poplar-willow forests 3 4 2 1 1
G1.1211 Alpine grey alder galleries 3 4 3 3 3
G1.2111 Sedge ash-alder woods 3 5 3 3 3
G1.6334 Southeastern Alpine bittercress beech forests 2 3 3 3 3
G1.6351 Sub-Pannonic beech forests 4 3 2 2 4
G1.676 Pre-Alpine hop-hornbeam beech forests 4 2 3 4 3
G1.6C1 Illyrian woodrush-beech forests 3 3 2 2 4
G1.6C21 Illyrian collinar neutrophile beech forests 3 3 5 4 5
G1.6C22 Illyrian montane fir-beech forests 3 3 5 4 5
G1.6C223 Illyrian high montane fir-beech forests 2 3 2 2 4
G1.6C31 Illyrian coastal beech forests 4 2 4 4 3

CCE Status Report 2008
72
G1.6C4 Illyrian subalpine beech forests 1 3 3 3 1
G1.7431 Illyrian hop-hornbeam mixed oak woods 4 1 3 3 2
G1.7432 Illyrian black pea sessile oak woods 3 3 4 4 3
G1.7C14 Illyrian hop-hornbeam woods 4 1 3 3 2
G1.A1A1 Illyrian sessile oak-hornbeam forests 3 4 4 4 4
G1.A1A2 Illyrian pedunculate oak-hornbeam forests 4 5 3 3 5
G1.A463 Illyrian ravine forests 3 4 3 3 2
G3.11221 Illyrian neutrophile spruce fir forests 2 4 3 3 5
G3.124 Dinaric calcareous block fir forests 2 3 3 3 2
G3.1322 Illyrian acidophile fir forests 3 3 2 2 4
G3.135 Bazzania fir forests 2 4 2 2 4
G3.1B21 Adenostyles glabra subalpine spruce forests 2 3 3 3 2
G3.1C2 Calciphile montane inner Alpine spruce forests 2 3 2 4 2
G3.1F3 Peri-Alpine bazzania spruce forests 2 4 1 3 4
G3.1F42 Illyrio-Alpine montane beech spruce forests 3 3 2 3 3
G3.1F51 Illyro-Dinaric cold station spruce forests 1 3 3 3 2
G3.425 Eastern Alpine acidophilous Scots pine woods 3 3 2 2 3
G3.441 Alpine spring heath Scots pine forests 3 2 3 3 2
G3.4C52 Dinaric dolomite Scots pine forests 4 2 3 3 2
G3.5215 Illyrian sub-Mediterranean Pinus nigra forests 5 1 3 3 2
G3.E Nemoral bog conifer woodland 1 5 1 5 1
Figure SI-1: EUNIS forest habitat types and their distribution in Slovenia.
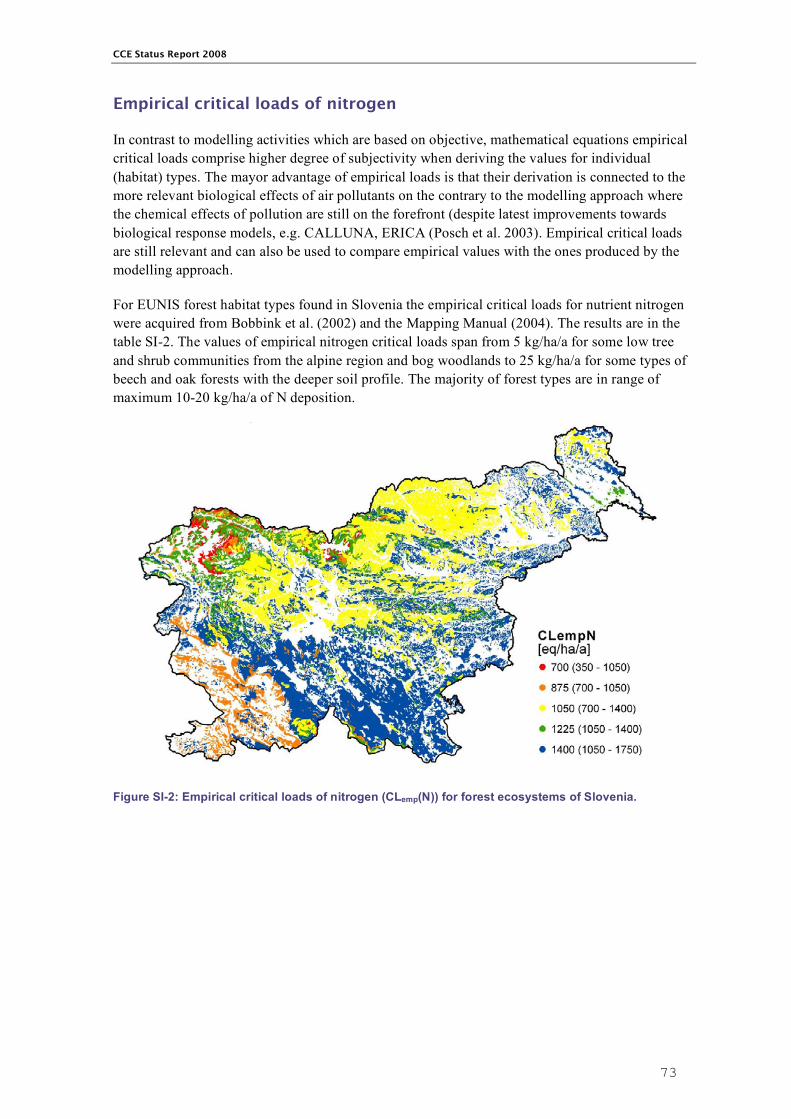
CCE Status Report 2008
73
Empirical critical loads of nitrogen
In contrast to modelling activities which are based on objective, mathematical equations empirical critical loads comprise higher degree of subjectivity when deriving the values for individual (habitat) types. The mayor advantage of empirical loads is that their derivation is connected to the more relevant biological effects of air pollutants on the contrary to the modelling approach where the chemical effects of pollution are still on the forefront (despite latest improvements towards biological response models, e.g. CALLUNA, ERICA (Posch et al. 2003). Empirical critical loads are still relevant and can also be used to compare empirical values with the ones produced by the modelling approach.
For EUNIS forest habitat types found in Slovenia the empirical critical loads for nutrient nitrogen were acquired from Bobbink et al. (2002) and the Mapping Manual (2004). The results are in the table SI-2. The values of empirical nitrogen critical loads span from 5 kg/ha/a for some low tree and shrub communities from the alpine region and bog woodlands to 25 kg/ha/a for some types of beech and oak forests with the deeper soil profile. The majority of forest types are in range of maximum 10-20 kg/ha/a of N deposition.
Figure SI-2: Empirical critical loads of nitrogen (CLemp(N)) for forest ecosystems of Slovenia.

CCE Status Report 2008
74
Table SI-2: Empirical critical loads of nutrient nitrogen for each EUNIS forest habitat type found in Slovenia.
EUNIS code Habitat type description Critical load eq N/ha/a
Critical load kg N/ha/a
F2.42 Outer Alpine Pinus mugo scrub 350 - 1000 5 - 15
F2.47 Pelago dinaride Pinus mugo scrub 350 - 1000 5 - 15
G1.1112 Eastern European poplar-willow forests 700 - 1000 10 - 15
G1.1211 Alpine grey alder galleries 700 - 1000 10 - 15
G1.2111 Sedge ash-alder woods 1000 - 1400 15 - 20
G1.6334 Southeastern Alpine bittercress beech forests 1000 - 1400 15 - 20
G1.6351 Sub-Pannonic beech forests 700 - 1400 10 - 20
G1.676 Pre-Alpine hop-hornbeam beech forests 1000 - 1400 15 - 20
G1.6C1 Illyrian woodrush-beech forests 700 - 1500 10 - 20
G1.6C21 Illyrian collinar neutrophile beech forests 1000 - 1800 15 - 25
G1.6C22 Illyrian montane fir-beech forests 1000 - 1800 15 - 25
G1.6C223 Illyrian high montane fir-beech forests 1000 - 1400 15 - 20
G1.6C31 Illyrian coastal beech forests 1000 - 1800 15 - 25
G1.6C4 Illyrian subalpine beech forests 700 - 1000 10 - 15
G1.7431 Illyrian hop-hornbeam mixed oak woods 700 - 1000 10 - 15
G1.7432 Illyrian black pea sessile oak woods 1000 - 1400 15 - 20
G1.7C14 Illyrian hop-hornbeam woods 700 - 1000 10 - 15
G1.A1A1 Illyrian sessile oak-hornbeam forests 1000 - 1800 15 - 25
G1.A1A2 Illyrian pedunculate oak-hornbeam forests 1000 - 1800 15 - 25
G1.A463 Illyrian ravine forests 1000 - 1400 15 - 20
G3.11221 Illyrian neutrophile spruce fir forests 700 - 1400 10 - 20
G3.124 Dinaric calcareous block fir forests 700 - 1000 10 - 15
G3.1322 Illyrian acidophile fir forests 700 - 1400 10 - 20
G3.135 Bazzania fir forests 700 - 1400 10 - 20
G3.1B21 Adenostyles glabra subalpine spruce forests 700 - 1000 10 - 15
G3.1C2 Calciphile montane inner Alpine spruce forests 350 - 1000 5 - 15
G3.1F3 Peri-Alpine bazzania spruce forests 700 - 1400 10 - 20
G3.1F42 Illyrio-Alpine montane beech spruce forests 700 - 1000 10 - 15
G3.1F51 Illyro-Dinaric cold station spruce forests 1000 - 1400 15 - 20
G3.425 Eastern Alpine acidophilous Scots pine woods 700 - 1400 10 - 20
G3.441 Alpine spring heath Scots pine forests 700 – 1000 10 - 15
G3.4C52 Dinaric dolomite Scots pine forests 700 – 1000 10 - 15
G3.5215 Illyrian sub-Mediterranean Pinus nigra forests 700 - 1000 10 - 15
G3.E Nemoral bog conifer woodland 350 - 1000 5 - 15
CCE Status Report 2008
75
Modelled critical loads and dynamic modelling
Input data for critical loads and dynamic modelling
Critical load calculation and dynamic modelling of air pollutants effects demand various information on climate, soil factors, base cation and air pollutant deposition, weathering rates, and nutrient uptake by plants. The majority of data need spatial denotation.
Since forest soils are the primary target of modeling critical loads (and not the forest biotic community as it should be), each receptor needs to be precisely characterized regarding its soil characteristics. Soil databases were the primary source of information. Since the existent databases in Slovenia were not established to be used for such detailed analyses it was not possible to use original, raw data. A total of 886 soil profiles were averaged to the level of 26 main soil types, present in forest ecosystems of Slovenia. These soil types were attributed to adequate EUNIS classes. Soil data included information on soil depth, bulk density, cation exchange capacity, base saturation, C:N ratio of the topsoil, soil carbon pool, soil texture, soil N and P availability (ordinal scale) and drainage class.
Additional data included: • mean annual temperature map of Slovenia 1×1 km raster grid • mean annual precipitation map of Slovenia 1×1 km raster grid • geological map of Slovenia 1:100.000 • digital terrain model of Slovenia 12,5×12,5 m raster grid • data on average annual forest growth and harvesting rates for all forest types (data provided by
Slovenia Forest Service, Forest inventory) • vegetation data of forest types (EUNIS classes), with the emphasis on tree species composition
of forest communities 1:100.000 • base cation deposition data was acquired from the modeling work of Van Loon et al. (2005).
The values for each EMEP 50×50 km grid cell were provided by the CCE • N and S deposition time series were provided by the CCE and were included in the 2007 call
for data database.
Critical loads calculation The steady state simple mass balance model (SMB) was used to calculate critical loads of acidify-ing S and N compounds and eutrophying N compounds. Three critical loads connected with soil acidification were computed: maximum critical load of sulfur (CLmax(S)), maximum critical load of nitrogen (CLmax(N)) and minimum critical load of nitrogen (CLmin(N)). For individual receptor the latter three CL’s define the critical load function, which delimitates “safe” deposition from the deposition which leads to the exceedances of a certain chemical criterion (e.g. Al/BC ratio).
SMB model regarding soil acidification is based on the following equations (Mapping Manual, 2004): CLmin(N) = Nu + Ni CLmax(N) = CLmin(N) + CLmax(S) CLmax(S) = CL(A) + BCdep - Bcu CL(A) = BCw – ANCle, crit
where:
Nu : net growth uptake of nitrogen (eq/ha/a) Ni : nitrogen immobilization into the soil (eq/ha/a)

CCE Status Report 2008
76
BCdep: deposition of base cations (eq/ha/a) Bcu: uptake of base cations (except from Na+) by vegetation (eq/ha/a) BCw: base cations weathering rate (eq/ha/a) ANCle, crit - defined according to one of the chemical criteria, e.g. Al/BC ratio =1, which yields: ANCle, crit = 1.5×Bcle / (Bc/Al)crit where: Bcle = Bcdep – Bcw – Bcu Regarding eutrophication effect of nitrogen deposits the following equations are needed: CLnut (N) = Nu + Ni + Nle(acc) / (1 – fde) Nle(acc) = Q×[N]acc
where:
Nle(acc) = leaching of nitrogen at critical load (eq/ha/a) [N]acc = concentration of nitrogen in the soil solution at critical load (eq/m3)
Dynamic modelling For dynamic modelling Very Simple Dynamic model (VSD) (Posch et al. 2005) was used. VSD is the simplest extension of the SMB model with the time-dependent mass balances, cation exchange and C:N ratio dependent N immobilization as a group of parameters which make the model dynamic. The purpose of dynamic modelling approach is to define target loads of air pollutants and to determine the response of an ecosystem or more precisely soil solution to the variation in atmospheric deposition of (acidifying) compounds. The Access version of the VSD model was used. The model was calibrated on spatial data of base saturation, soil carbon pools and C:N ratio. Temporal calibration was performed by setting the appropriate year of soil data measurements (set to 1995). The model was run in Gapon ”mode” (i.e. Gapon echange equations were used). Parameters needed to run the model and their methods of derivation/acquisition are described in table SI-3.
Table SI-3: Parameters needed to run the VSD model, their description and methods and sources of their calculation / ac-quisition.
PARAMETER Description Data source / computation method
EmpSiteID ID of the site
Lon Geographic longitude
Lat Geographic latitude
I50 EMEP50 horizontal coordinate
J50 EMEP50 vertical coordinate
EcoArea Receptor area Based on forest vegetation maps of Slovenia
CLmaxS Max critical load of sulfur Computed by VSD
CLminN Max critical load of nitrogen Computed by VSD
CLmaxN Min critical load of nitrogen Computed by VSD
CLnutN Critical load of nutrient nitrogen Computed by VSD
nANCcrit Critical leaching of base cations Computed by VSD
cNacc Acceptable concentration of nitrogen in the soil solution
Computed from the max acceptable quantity of nitrogen leaching from the soil profile (Nleacc in eq/ha/a) and Qle (see below), for Nleacc
Crittype Chemical criterion Used : molar Al/Bc ratio
Critvalue Chemical criterion value Used : Al/Bc = 1
Thick Soil thickness (m) Based on the soil databases of Slovenia, averaged for the soil type
Bulkdens Soil bulk density (g/cm3) Based on the soil databases of Slovenia; computed from soil organic carbon and soil clay content. Mapping manual 6.4.1.3., Eq. 6.27
Cadep Total deposition of calcium (eq/ha/a) EMEP deposition database
Mgdep Total deposition of magnesium (eq/ha/a) EMEP deposition database

CCE Status Report 2008
77
PARAMETER Description Data source / computation method
Kdep Total deposition of potassium (eq/ha/a) EMEP deposition database
Nadep Total deposition of sodium (eq/ha/a) EMEP deposition database
Cldep Total deposition of chloride (eq/ha/a) EMEP deposition database
Cawe Weathering rate of calcium (eq/ha/a) O,3×BCw, where BCw is the cumulative weathering rate for base cations. For BCw see mapping manual 5.3.2.3, Eq. 5.39 amd Table 5-14 (for calcareous soils WRc=20 was used)
Mgwe Weathering rate of magnesium (eq/ha/a) 0.3×BCw
Kwe Weathering rate of potassium (eq/ha/a) 0.2×BCw
Nawe Weathering rate of sodium (eq/ha/a) 0.2×BCw
Caupt Net uptake of calcium (eq/ha/a) Average yearly yield rate × wood calcium content. Only dominant tree species of the forest type was considered. Data on average yearly yield rate are based on Slovenian forest inventory of the last ten years.
Mgupt Net uptake of magnesium (eq/ha/a) Average yearly yield rate × wood magnesium content. For details see Caupt.
Kupt Net uptake of potassium (eq/ha/a) Average yearly yield rate × wood potassium content. For details see Caupt.
Qle Amount of water percolating through the root zone (mm/a)
Mapping manual 5.5.2.1.3., Eq. 5.91a and b. Annual mean temperature and an-nual mean precipitation data based on Meterological database of Slovenia
lgKAlox Equilibrium constant for the Al-H relationship (log10)
Used: 8 (gibbsite equilibrium)
expel Exponent for the Al-H relationship (-) Used: 3 (gibbsite equilibrium)
pCO2fac Partial of CO2 pressure in soil solution as multiple of the atmospheric CO2 pressure (-)
Ratio between soil CO2 pressure and atmospheric CO2 pressure (370 ppm). The former one being estimated on the basis of mean annual (soil) temperature (Map-ping Manual Eq. 5.44)
cOrgacids Total concentration of organic acids (eq/m3) Used: 0.01
Nimacc Acceptable amount of nitrogen imobilised in the soil (eq/ha/a)
Based on German NFC (see Posch et al., 2001: 142, table DE-7)
Nupt Net nitrogen uptake by plants (eq/ha/a) Average yearly yield rate × wood nitrogen content. Only dominant tree species of the forest type was considered. Data on average yearly yield rate are based on Slovenian forest inventory of the last few years.
Fde Denitrification fraction (between 0 and 1) Value set by soil science expert on the basis soil drainage characteristics and clay content , value span from 0.8 for wet, clay rich soil (gleysol) to 0.1 for dry soil (ranker, leptosol)
CEC Cation exchange capacity (meq/kg) Based on the soil databases of Slovenia, averaged for the soil type
Bsat Base saturation (-) Based on the soil databases of Slovenia, averaged for the soil type
Yearbsat Year of base saturation determination Based on the soil databases of Slovenia
lgKAlBc Exchange constant for Al vs. Bc (log 10) Parameter calibrated by VSD, starting value 0
lgKHBc Exchange constant for H vs. Bc (log 10) Parameter calibrated by VSD, starting value 3
Cpool Soil carbon content (g/m2) Computed from soil thickness, soil bulk density and soil carbon content. The latter one was averaged for the whole soil layer; data based on the soil inventories of Slovenia, averaged for the soil type
CNrat C:N ratio in the soil Based on the soil databases of Slovenia, averaged for the soil type
yearCN Year of C:N ratio determination Based on the soil databases of Slovenia
DMstatus Static / dynamic model switch Both modes used in the modeling process
EUNIScode EUNIS code EUNIS forest habitat types identified in Slovenia
CC Country code SI

CCE Status Report 2008
78
Results of the modelling
Critical loads of acidity
Calculated CLmax(S) values vary between 450 and 15850 eq/ha/a (7.2 and 253 kg/ha/a). 50% of receptors (quartile range) are in range between 2310 and 7330 eq/ha/a. The upper values are extremely high and some other toxic effects of such high sulfur depositions might appear before soil acidification takes place. Huge differences in variability of CLmax(S) among EUNIS habitat types and within these categories are seen. Some of the habitats show very different critical loads, e.g. the receptors of certain beech and oak forests from the submediterranean region have some of the highest and lowest CL’s computed. Taking into consideration only the quartile range the following habitat types appeared the most susceptible: Sub-Pannonic beech forests, Illyrian acidophilous fir forests and Bazzania fir forests, all of them thriving on acid soils. For more details see table SI-4.
Maximum critical load of acidifying nitrogen - CLmax(N) (load permitted at no sulfur deposition) shows very similar spatial pattern as it is the case with CLmax(S). This similarity is the consequence of the critical load function which links both acidifying pollutants (the larger critical load of sulfur, the smaller critical load of nitrogen). The values of CLmax(N) span from 1060 to 33060 eq/ha/a (or 14.8 to 465 kg/ha/a), quartile range is between 3470 and 9020 eq/ha/a (48.5 and 126 kg/ha/a). For more details see table SI-4. Computed critical loads of nitrogen as an acidifying pollutant far ex-ceed the critical loads of nitrogen as an eutrophicating factor in all the receptors studied (CLmin(N) < CLnut(N) < CLmax(N)). In that respect Ndep can only be as high as CLnut(N).
Minimum critical load of nitrogen (CLmin(N)) is the load of acidifying N where Ndep = Ni + Nu. Decreasing critical load value below this level would in a longer term lead to impoverishment of the ecosystem and decrease in organic matter production i.e. forest growth. The interval of values of CLmin(N) is much narrower comparing to the CLmax(N) interval and spans between 180 and 950 eq/ha/a (2.5 and 13.3 kg/ha/a). For more details see table SI-4.
Figure SI-2: Maximum critical loads of sulfur (CLmax(S)) for forest ecosystems of Slovenia.

CCE Status Report 2008
79
Figure SI-3: Maximum critical loads of nitrogen (CLmax(N)) for forest ecosystems of Slovenia.
Figure SI-4: Minimum critical loads of nitrogen (CLmin(N)) for forest ecosystems of Slovenia.
Critical loads of nutrient nitrogen
Apart from acidification effects nitrogen compounds also cause eutrophication of (forest) ecosystems. The results of CLnut(N) modelling differ considerably from critical loads of acidifying N. There is no clear west-east gradient in CLnut(N), which shows that quite different soil and environmental parame-ters influence the critical loads of eutrophication. The values of CLnut(N) vary between 500 and 2300 eq/ha/a (7.0 and 32.3 kg/ha/a) with 50% of receptors in range between 845 and 950 eq/ha/a (11.8 and

CCE Status Report 2008
80
13.3 kg/ha/a). The variability of CL’s between receptors of particular habitat type is considerably lower than variability of CL’s of acidity. The EUNIS habitat types most susceptible to eutrophication are the following: Pinus mugo scrubs of the alpine and dinaric region, Dinaric dolomite Scots pine forests, Illyrian sub-Mediterranean Pinus nigra forests, Eastern Alpine acidophilous Scots pine woods and Alpine spring heath Scots pine forests. These forest types are located in different regions of Slo-venia; their main similarity is the shallowness of the soil profile. The results of CL modelling are well congruent with empirically derived critical loads.
Figure SI-5: Critical loads of nutrient nitrogen (CLnut(N)) for forest ecosystems of Slovenia.
Critical load exceedances
On the basis of deposition data provided within the CCE call for data 2008, the difference between deposition of S, N, and A (acidity) and critical loads can be calculated. The difference is known as the exceedance (in eq/ha/a). Regarding static models of soil chemistry, knowing the deposition exceedances are really the subject that matters and not the CL’s themselves. Due to the time-dependence of atmospheric deposition of pollutants, exceedances are theoretically speaking only valid for a given moment in time. Consequently the time, for which the exceedances have been calculated, has to be reported. We calculated the exceedances for the deposition data of year 2000.
The simplest case is to compute the exceedance of critical load of nutrient nitrogen, where Ex(Ndep) = Ndep – CLnut(N). The result is shown in figure SI-6. The exceedances of year 2000 nitrogen deposition appeared in altogether 266 receptors covering less than 1.5% of the area under modelling or less than 0.7 % of national territory. The exceedance was observed in 26 different EUNIS habitat types but most often in two of them: in Eastern Alpine acidophilous Scots pine woods and in Dinaric dolomite Scots pine forests. If taking into consideration deposition from the year 2000 the plant communities of Scots pine forests appear to be the most affected from current nitrogen depositions. Lot of these forests can be found in the vicinity of the capital city Ljubljana, where the largest intensity of traffic in the country is observed, but it is also the area of intensive agricultural production.

CCE Status Report 2008
81
Figure SI-6: Exceedances of critical load of nutrient nitrogen calculated from the year 2000 deposition data.
Since there is no unique critical load of N or S (numerous pairs of combinations of CL’s for N and S pollutants lying on the CL function lead to the same critical leaching of acid neutralizing capacity (ANC)) there are also no unique exceedances of acidifying S and N. One of the pollutants needs to be fixed and then so called conditional critical load for another pollutant can be defined. It is also possible to calculate exceedance of critical load of acidity CL(A) or to calculate exceedance functions (exceedance isolines). For this report we calculated three different conditional acidity exceedances: exceedance of S deposition over critical load of sulfur at current (year 2000) N deposition (CL(S|Ndep), exceedance of N deposition over critical load of nitrogen at current (year 2000) S deposition (CL(N|Sdep)) and exceedance of S deposition over critical load of sulfur at critical load of nutrient nitrogen (CL(S|CLnut(N))). The latter has also been termed exceedance of minimum critical load of sulfur (CLmin(S)) (UBA, 2004). These exceedances show similar spatial pattern which is largely the effect of low resolution of deposition data (EMEP grid cell size). This indicates the urgent need to refine the deposition data in Slovenia with some additional measurements. The majority of exceedances of 2000 deposition in Slovenia appeared in EMEP 78,45 grid cell, where two main Slovenian thermal power stations are located. The western part of the country appears safe as far as soil acidification is concerned, which is supposedly a consequence of predominant calcareous rocks and absence of very large SO2 pollutant.
Forest ecosystems of Slovenia do not appear very sensitive to soil acidification of sulfur and nitrogen atmospheric deposition. In comparison with the northern countries of Europe maximal critical loads of acidity are high and consequently the exceedances are present in only a small fraction of the forest ecosystems. This is largely the effect of predominance of calcareous rocks in Slovenia (44% of the area). Weathering of base cation rich limestone is an efficient neutralizer of soil acidifying compounds. In that respect modelling of critical loads for acidity is not really important for limestone and dolomite rich areas. However the west-east gradient in the susceptibility to acidification is apparent which follows the geological map (western part – eutric, calcareous soils, eastern part – district, silicate soils).

CCE Status Report 2008
82
A. B.
C.
Figure SI-7: Exceedances of conditional critical loads of acidity calculated from the year 2000 deposi-tion data. A.) Exceedance of CL(S|Ndep); B.) Exceedance of CL(S|Nnut); C.) Exceedance of CL(N|Sdep).
Dynamic modeling results
Dynamic modelling was carried out on all of the 12692 receptors which were also subjected to calculating critical loads. Target loads were computed except in cases where CL’s were not exceeded in 2010 and where chemical criterion was less than specified limit (in our case [Al]:[Bc]=1). Dynamic modelling data were calculated for target years 2020, 2030, 2040, 2050 and 2100; each year for 14 different deposition scenarios, provided by the CCE. The results are summarized in table SI-4.
Table SI-4: Summary of dynamic modelling for forest ecosystems of Slovenia. The number of receptors and the percentage of modelled area where the chemical criterion is not met are shown for each target year. Only the results for moderate, low and high deposition scenarios are shown.
Moderate deposition scenario High deposition scenario Low deposition scenario Target year
No. of receptors % of modelled area No. of receptors % of modelled area No. of receptors % of modelled area
2020 311 1,61 903 4,70 20 0,03
2030 72 0,20 701 3,36 5 0,01
2040 36 0,09 528 2,79 4 0,01
2050 28 0,07 466 2,35 2 0,00
2100 14 0,03 313 1,14 0 0,00

CCE Status Report 2008
83
Table SI-4: Minimum, maximum, median and 1st and 3rd quartiles of critical loads for individual EUNIS habitat categories.
EUNIS code F2.42 F2.47 G1.111 G1.121 G1.211 G1.633 G1.635 G1.676 G1.6C1 G1.6C2 G1.6C3 G1.6C4 G1.743 G1.7C1 G1.A1A G1.A46 G3.112 G3.124 G3.132 G3.135 G3.1B2 G3.1C2 G3.1F3 G3.1F4 G3.1F5 G3.425 G3.441 G3.4C5 G3.521 G3.E
Area 16224 225 621 35 5036 57005 130 64709 192825 447987 28664 20 69860 2897 96763 699 42042 2911 927 21802 7426 809 10276 732 1457 21979 2977 2063 462 53
% Area 1.5% 0.0% 0.1% 0.0% 0.5% 5.2% 0.0% 5.9% 17.5% 40.7% 2.6% 0.0% 6.4% 0.3% 8.8% 0.1% 3.8% 0.3% 0.1% 2.0% 0.7% 0.1% 0.9% 0.1% 0.1% 2.0% 0.3% 0.2% 0.0% 0.0%
No. of receptors 250 6 33 1 148 476 1 1111 1757 4620 263 1 733 53 1685 25 566 49 37 254 64 15 94 26 20 270 50 66 15 2
CL max (S) (eq/ha/a)
Minimum 3289.2 9008.0 728.6 7475.5 1108.4 1938.2 1511.3 1230.2 516.4 611.5 1912.8 8247.3 1407.8 1890.5 454.8 3159.1 1102.2 7285.4 1589.8 1204.0 3387.7 3439.7 1559.7 3374.9 6541.9 1809.0 7336.6 3428.4 7579.8 3983.4
Q25 8092.1 9102.8 2101.9 7475.5 2175.4 6590.7 1511.3 6250.8 1667.8 2348.2 3676.9 8247.3 3512.4 7466.7 1708.9 6289.0 2075.0 7598.1 1702.9 2149.0 6385.3 7608.6 2327.9 7120.7 8155.4 3062.5 7492.8 7071.6 8423.5 3983.4
Median 8666.6 9131.8 4353.3 7475.5 2313.2 7208.2 1511.4 7065.5 2321.5 5933.1 7408.6 8247.3 6709.1 7668.5 2685.3 6581.2 2951.7 7772.0 2223.5 2389.6 7602.5 7928.5 2520.5 7356.7 10512.2 3576.4 8061.7 7870.8 8462.7 4107.7
Q75 8971.4 9145.8 6874.7 7475.5 3969.5 7489.1 1511.4 7699.9 4243.9 7323.6 7875.2 8247.3 7330.5 7804.3 6501.9 8281.1 4994.6 8057.4 2389.5 3326.5 7942.6 7958.0 4772.2 7667.1 13752.7 4749.6 8264.7 8867.8 8536.1 4231.9
Maximum 13751.1 9145.8 7935.3 7475.5 7911.1 11186.9 1511.4 13056.7 12324.5 13449.0 13635.0 8247.3 13201.5 8123.7 15853.9 13455.6 13059.9 13579.4 2543.2 10794.8 12857.3 8044.5 8138.5 12417.8 13871.2 13413.4 8536.6 13677.3 8753.7 4231.9
CL min (N) (eq/ha/a)
Minimum 189.3 309.4 335.0 550.0 335.0 507.5 543.7 387.8 537.3 496.8 387.8 583.7 535.4 449.0 683.0 507.5 388.6 388.6 432.5 388.6 534.9 461.0 388.6 495.4 460.6 239.2 252.0 180.0 195.3 397.5
Q25 385.5 325.8 335.0 550.0 335.0 655.5 543.7 449.0 539.6 534.8 387.8 583.7 535.4 449.0 701.0 507.5 424.6 448.3 531.6 424.6 657.9 674.6 545.2 529.9 583.1 239.2 316.9 216.0 252.0 397.5
Median 397.5 326.4 335.0 550.0 335.0 722.8 543.7 485.0 546.3 534.8 420.8 583.7 535.4 495.8 701.0 643.0 450.5 465.5 535.2 438.0 674.6 674.6 603.6 552.2 605.6 239.2 323.0 216.0 287.8 397.5
Q75 397.5 397.5 371.0 550.0 335.0 792.2 543.7 521.0 589.9 571.5 459.8 583.7 571.0 522.7 701.0 656.9 482.7 531.6 603.6 460.6 674.6 674.6 665.9 674.6 671.9 275.2 413.3 244.1 323.0 397.5
Maximum 404.8 397.5 478.0 550.0 335.0 793.5 543.7 735.0 825.6 793.5 745.8 583.7 708.2 664.0 950.2 793.5 674.6 674.6 674.6 674.6 674.6 674.6 674.6 674.6 674.9 389.5 466.0 252.0 330.4 397.5
CL max (N) (eq/ha/a)
Minimum 3686.7 10406.4 1063.6 8856.1 1443.4 2799.7 2238.1 1815.9 1185.3 1155.3 2316.5 9747.3 2133.2 2373.2 1166.7 4456.4 1649.4 8483.5 2231.9 1813.4 4879.1 4974.3 2426.9 4804.7 8313.0 2354.8 8437.0 4222.6 8709.8 7704.7
Q25 9345.6 10458.8 2436.9 8856.1 2747.6 8172.6 2238.1 7492.9 2683.1 3490.5 4984.6 9747.3 4964.0 8748.5 2975.1 7752.0 3041.5 8901.3 2425.0 3141.2 8315.5 9071.9 3539.1 8448.1 9638.9 4191.9 8662.2 8076.1 9613.8 7704.7
Median 10027.1 10478.7 5261.4 8856.1 2905.2 8769.2 2238.1 8545.8 3526.1 7283.8 8788.2 9747.3 8098.1 9042.3 4350.7 8030.1 4115.8 9096.1 3321.4 3410.4 9131.7 9485.9 4035.3 8694.7 13482.1 4725.3 9302.4 9121.2 9704.3 9825.0
Q75 10369.0 10488.5 8486.7 8856.1 6894.5 9073.6 2238.1 9151.7 6046.4 8982.2 9284.3 9747.3 8798.6 9222.0 9670.9 9851.1 6707.0 9627.3 3590.5 4572.0 9504.2 9516.9 6774.6 9193.6 17793.1 7241.9 9675.7 11056.6 9740.6 11945.3
Maximum 17557.6 10539.9 9152.0 8856.1 23868.5 14492.3 2238.1 16805.9 23846.5 30151.5 17518.9 9747.3 28401.4 9640.6 27255.0 17595.6 30396.5 17577.9 4040.9 13954.2 16733.7 9613.0 26052.1 16017.9 17989.2 33058.8 9880.1 17267.5 10049.3 11945.3
CL nut (N) (eq/ha/a)
Minimum 499.8 537.7 635.2 808.4 637.0 828.5 865.7 705.2 845.5 765.9 661.8 811.5 825.3 751.1 1003.1 838.3 709.4 718.6 738.7 719.8 829.6 761.9 738.5 789.4 742.7 553.9 551.5 503.9 497.8 775.8
Q25 588.9 545.0 650.4 808.4 680.8 939.4 865.7 785.7 908.8 875.8 729.9 811.5 873.6 785.3 1076.9 877.6 766.1 741.5 798.9 775.1 889.9 888.7 841.1 819.9 815.3 612.9 591.1 529.4 532.3 775.8
Median 603.0 552.8 669.1 808.4 687.1 984.2 865.7 804.9 921.1 903.0 747.3 811.5 890.2 796.4 1094.0 914.5 785.9 764.2 835.6 786.1 897.7 898.9 885.7 849.8 870.3 627.7 620.1 542.9 566.4 905.1
Q75 619.0 599.2 687.4 808.4 952.5 1012.9 865.7 827.0 944.9 922.6 776.6 811.5 915.5 812.5 1212.1 958.9 810.1 810.4 872.5 803.3 917.9 904.9 919.2 883.0 916.3 661.6 654.6 557.7 587.6 1034.3
Maximum 655.1 621.7 752.6 808.4 1925.9 1078.9 865.7 985.2 2132.4 2122.8 1003.9 811.5 1972.2 942.1 2304.9 1050.5 1904.5 928.8 928.2 1019.4 938.1 932.3 1417.8 909.4 946.0 1760.7 717.0 719.4 613.3 1034.3
nANCcrit (eq/ha/a)
Minimum 2485.9 5874.5 506.9 4687.8 756.1 1354.8 996.8 855.1 381.6 432.0 1413.0 5496.1 969.9 1509.0 319.6 2066.6 766.0 4483.3 1131.9 851.6 2450.9 2502.9 1132.9 2314.5 4416.2 1210.2 4547.6 2217.2 4759.5 2895.3
Q25 5190.2 5910.1 1461.4 4687.8 1313.7 4207.8 996.8 3755.3 1107.3 1497.4 2548.3 5496.1 2390.1 4788.0 1081.6 3941.4 1385.6 4733.0 1241.9 1437.3 4227.6 4871.9 1626.0 4554.2 5414.8 1956.2 4671.3 4252.9 5452.5 2895.3
Median 5570.9 6055.0 2725.9 4687.8 1619.8 4618.9 996.8 4406.0 1485.1 3566.7 4788.9 5496.1 4120.7 4986.7 1695.7 4178.8 1961.7 5005.3 1560.3 1600.0 4863.7 5187.3 1795.1 4623.9 6700.6 2342.5 5071.3 4751.7 5484.4 2944.1
Q75 5864.5 6068.7 4371.3 4687.8 2478.5 4887.9 996.8 4891.1 2730.8 4595.6 5150.4 5496.1 4635.7 5091.2 3924.5 4883.7 3261.0 5221.4 1669.1 2304.9 5186.1 5219.3 3182.5 4926.7 8516.3 3006.3 5233.1 5300.6 5549.9 2992.9
Maximum 8415.4 6068.7 5174.3 4687.8 5148.8 6746.6 996.8 7716.0 7182.1 8369.9 8473.2 5496.1 8000.6 5438.4 9229.4 8377.2 7875.8 8340.3 1809.1 6338.4 7850.6 5305.6 5258.5 7623.9 8628.8 7966.9 5447.3 8062.0 5758.6 2992.9

CCE Status Report 2008
84
Literature Bobbink, R., M. Ashmore, S. Braun, W. Flückiger, and I. J. J. Van den Wyngaert (2002) Empirical nitrogen critical
loads for natural and semi-natural ecosystems: 2002 update. In: Empirical critical loads for nitrogen, Expert Workshop, Berne, 11-11-2002 Achermann, B., and R. Bobbink editors. (ur.). Berne, Swiss Agency for the Environment, Forests and Landscape (SAEFL): 43-170
Mapping Manual. UBA. (2004) Manual on methodologies and criteria for modelling and mapping critical loads & levels and air pollution effects, risks and trends. UNECE Convention on Long-range Transboundary Air Pollution, Federal Environmental Agency (Umweltbundesamt), Berlin.
Posch M, De Smet PAM, Hettelingh J-P, Downing RJ (eds) (2001) Modelling and mapping of critical thresholds in Europe. CCE Status Report 2001. Report 259101010/2001, Coordination Centre for Effects, RIVM, Bilthoven, The Netherlands
Posch M, Hettelingh J-P, Slootweg J (eds) (2003) Manual for dynamic modelling of soil response to atmospheric deposition. RIVM Report 259101012, Bilthoven, The Netherlands, 69 pp.
Posch M, Slootweg J, Hettelingh J-P (eds) (2005) European Critical Loads and Dynamic Modelling. CCE Status Report 2005, Report No. 259101016/2005, Coordination Centre for Effects, RIVM, Bilthoven, The Netherlands, 171 pp.
Slootweg J, Posch M, Hettelingh J-P (eds) (2007) Critical Loads of Nitrogen and Dynamic Modelling. CCE Progress Report 2007, Report No. 500090001/2007, Coordination Centre for Effects, RIVM, Bilthoven, The Netherlands, 201 pp.
Van Loon M, Tarrason L, Posch M (2005) Modelling Base Cations in Europe. EMEP/MSC-W & CCE, 58 pp.
CCE Status Report 2008
85
Sweden
National Focal Centre
Titus Kyrklund Swedish Environmental Protection Agency SE-106 48 Stockholm Phone. +46 8 698 1146 email: [email protected]
Collaborating institutions
IVL Swedish Environmental Research Institute P.O. Box 5302, SE-400 14 Göteborg Phone: +46 31 725 6200 Email: [email protected]
Filip Moldan, Cecilia Akselsson, Sofie Hellsten, Malin Klarqvist, Veronika Kronnäs och Sa-lim Belyazid SLU, Swedish University of Agricultural Sciences Jens Fölster P.O. Box 7050, SE-750 07 Uppsala Phone: +46 18 67 31 26 Email: [email protected]
Annika Nordin Inst för skoglig genetik och växtfys. 901 83 Umeå Phone: +46 90 786 8537 Email: [email protected]
Introduction
In response to the call for data November 2007, the following datasets have been produced (Table SE-1): • Critical loads of S and N for lakes and soils • Dynamic modelling results for lakes and soils • Empirical critical loads of nitrogen • A document describing the sources and methods used to produce the data (this document).
Table SE-1. Datasets produced for the call.
Number of sites Model
Critical loads for lakes 1974 FAB, MAGIC library
Dynamic modelling for lakes 1974 MAGIC, MAGIC library
Critical loads for soils 15920 PROFILE
Dynamic modelling for soils 15920 SAFE
Empirical critical loads of N 1298 -

CCE Status Report 2008
86
Data sources and calculation methods
Lakes
Critical loads The lakes with submitted critical loads are part of a Swedish national synoptic lake survey performed in 2005 including 1974 lakes > 1 ha selected by a stratified random selection. Lake water chemistry was taken from this survey. Limed lakes were corrected by assuming a constant Ca:Mg ratio for nearby lakes and a constant Mg concentration of the liming agent.
For freshwaters the critical loads were calculated using the first-order acidity balance (FAB) model as described in Henriksen et al. (1993), Posch (1995) and Rapp et al. (2002) with some modifications described below. The BCle used in the FAB-model was the calculated BC concentration 2100 according to MAGIC simulations using the CLE scenario. Thus the F-factor for estimating the weathering rate was not used. Nitrogen immobilisation was set to 100% for deposition up to 2 kg N/ha, 50% for the part of the deposition exceeding 2 kg/ha up to 10 kg/ha and 0% for the deposition exceeding 10 kg N/ha. The calculations of nitrogen immobilisation was partly justified by Gundersen et al (1998). In addition to this, leaching of organic nitrogen calculated from the lake concentration of Total Organic Nitrogen, was regarded as immobilised. The chemical threshold, ANClimit, was calculated individually for each lake to a value corresponding to a change in pH of 0.4 units from reference conditions calculated by MAGIC. This threshold is used as a definition of acidification in the Swedish Environmental Quality Criteria and for the fulfilment of Good Ecological Status within the EU Water Frame Directive (Fölster et al, 2007). When MAGIC was not run on the lake itself, the data used in the FAB model was taken from a similar lake within a database of MAGIC simulated lakes by a matching procedure (MAGIC library). Less than 10% of the lakes did not get any match, since no similar lakes were in the library. Those lakes were in most cases well buffered and were unlikely to be acidified even at a very high deposition. CLmaxS, CLmaxS and nANCcrit was then set to high values (10000, 10000 and 5000 eq/ha/yr, respectively) and the critical value of ANC was set to a negative value (-0.2 meq/l) to ensure that the critical load for those lakes were not exceeded in further calculations.
Dynamic modelling The lakes modelled with MAGIC are part of national lake surveys (in the years 1985, 1990, 1995 and 2000) and long term lake monitoring programmes focussing on acidified lakes. Lake water chemistry was obtained from these sources. Long-term averages (1961-1990) of annual runoff volumes provided by the Swedish Meteorological Institute (SMHI) were used. Land use data were obtained from the Swedish National Land Survey. Soil chemistry and properties for the catchments were taken from the Swedish survey of forest soils and vegetation. Soil bulk densities estimated by Karltun (1995) was used and averaged over the soil profiles. Soil water DOC was assumed to be 8 mg/l for all catchments (based on data from permanent forest monitoring plots in Sweden, ICP Forests, level II). Long-term averages of nutrient uptake were derived from the Swedish Forest Inventory 1983-92 and from the ASTA database. Pre-industrial nutrient uptake was set to 0.5 times present day for lake catchments in southern Sweden and zero for lake catchments in northern Sweden, based on existing information about Swedish forests and forestry from the 1870/80-ies. Present day deposition data was estimated from the MATCH model (Robertson et al. 1999, www.smhi.se) in a 20 x 20 km square grid over Sweden for the years 1997-1998 or 2002-2004. For the lakes, the deposition was scaled to a calibration year (calibration year varied from lake to lake; depending on data availability we used 1985, 1990, 1993, 1995, 1997 or 2000) and adjusted using the observed lake water chemistry to account for the local variation within the 20x20 km

CCE Status Report 2008
87
squares (Moldan et al. 1997). The total deposition of Cl-, SO42- and base cations was adjusted at
each site using lake water chemistry. It was assumed that, as a result of the declining SO42-
deposition in the years 1985 to 2000, an estimated percentage of the output flux of SO42- from the
lakes had been desorbed from catchment soils or from the lake sediment. The percentage used was 0-35%, depending on the rate of decline in SO4
2- deposition in the calibration year. The modelled deposition of N species was adjusted to account for variations in dry deposition by assuming that the ratio between the adjusted deposition and the deposition given by the MATCH model was the same for the N species and SO4
2- at each lake. Historical deposition sequences were derived from updated EMEP150 grid specific deposition histories 1880- 2000 over Europe according to Schöpp et al (2003) and were not (yet) updated with the new historic sequences from CCE which were provided for the purpose of the Call for data issued in November 2007. Future CLE and MFR deposition scenarios were those provided by CCE. The 12 intermediate deposition scenarios were interpolated between the CLE and MFR according to the instructions in the call. For practical purposes the future deposition scenarios were grouped together and averaged in 7 geographical regions with similar sequences.
The nitrogen dynamics for lakes and lake catchments was modelled in a simplified way without coupling between N deposition and the long term development of the ability of ecosystems to assimilate nitrogen. It was assumed that the percentage of N deposition leached in runoff will remain constant in the future for all scenarios. This assumption is probably reasonably accurate for the majority of the modelled lakes and their catchments with given N deposition scenarios (no significant increase in N deposition) and for a given time (up to years 2030, 2040, 2050 and with more uncertainty up to 2100). It needs to be pointed out, however, that this is an optimistic view of future N changes where nitrogen saturation does not progress and where future N deposition does not cause increased leaching of NO3
-. If a less optimistic view of future effects of N deposition is adopted (such as e.g. precautionary principle), it could change the outcome of the dynamic modelling in a major way towards worse surface water quality in terms of higher NO3
-, higher inorganic aluminium, lower pH and lower ANC.
Climate was assumed not to change over the modelled period. To what extent a changing climate will affect the future surface waters quality in response to the 14 modelled deposition scenarios is beyond the scope of the response to the call. However, it needs to be noted that this is – together with the fate of deposited N - another source of uncertainty in the model predictions because the combined effect of changing air pollution and climate could be significantly different from each of the two major driving factors alone.
The dynamic model runs were performed in two steps – first the 14 scenarios were assessed for 325 lakes in Sweden, using previously existing calibrations with the MAGIC model (Cosby et al., 1985, 2001). Those model results were then assigned to all 1974 lakes with calculated critical loads using the MAGIC library. The MAGIC library is a web based tool (www.IVL.se/magicbibliotek) developed at IVL in 2003 – 2007 to do lake acidification assessment in lakes and running waters. The MAGIC library consists of two main parts: a catalogue of lakes and running waters with existing MAGIC model calibration and a so called matching tool. The matching tool is used for comparing any given lake (evaluation lake, in this case one of the 1974 lakes with calculated critical load) described by its key parameters in the matching questionaire with all lakes included in the MAGIC library lake catalogue (library lakes, in this case the 325 modelled lakes in Sweden) and selecting which library lakes are most similar to the evaluation lake. If a similar lake is found among the library lakes (a good match) it is assumed that MAGIC calibration and scenario outputs calculated for the library lake are also valid
CCE Status Report 2008
88
for the evaluation lake. In this way the MAGIC model calculation for the 14 future deposition scenarios modelled at 325 lakes were extrapolated to the larger dataset of 1974 lakes.
For 181 of the (1974) reported lakes the MAGIC library did not contain any lake similar enough to justify the assumption that the two lakes (the evaluation and the library lake) share the same acidification history and future. These 181 lakes either have a high ANC or are polluted by other sources than anthropogenic deposition and therefore the dynamic modelling parameters for these lakes were assumed to be non-acidified and equal to that of the least acidified lake in the MAGIC library.
The total area of Sweden is regarded as ecoarea for lakes, since the lake water quality is a result of processes in the catchment. Only the nine largest, very well buffered lakes are excluded from the total area. The sum of the ecoareas for the 1974 lake stations is equal to the total land area for Sweden with the nine largest lakes subtracted. The ecoareas that each of the sampled 1974 lakes represents, is calculated according to the principles for the stratified random selection of the lake survey (Wilander and Fölster, 2007).
Forest ecosystems
Critical loads Critical loads of acidity and nutrient N was calculated with the steady state soil chemistry model PROFILE (Sverdrup & Warfvinge, 1993). The chemical criteria molar ratio BC/Al in the soil solution was used, where BC is molar concentration of base cations Ca2+, Mg2+ and K+ and the Al is a charged weighted sum of the molar concentrations of inorganic Al in the soil solution. The critical limit was set to BC/Al=1, corresponding to a growth reduction of spruce by 20% (Warfvinge and Sverdrup, 1995). The root weighted BC/Al was used, since it is a more relevant measure than previously used BC/Al in the soil layer with the lowest BC/Al. The BC/Al ratio was weighted over the soil horizons according to the root content of each layer. The soil layer specific root content was represented by an estimated fraction of BC uptake from each layer. The root zone was assumed to be 0.5 m, except for a few sites with shallow soils, were it was assumed to be 0.15 m.
The CL for nutrient nitrogen, CLnutN, was based on the critical nitrogen concentration limit of 0.3 mgN/l in the water leaching from the root zone. This concentration represents the upper limit for Class 1 (low concentrations) according to the Swedish environmental quality standards for lakes (www.naturvardsverket.se) and corresponds also to the critical concentration for vegetation changes of sensitive vegetation (CCE Instructions for submitting... 2007, Table 6). Calculations were performed on sites within the National Forest inventory (Hägglund, 1985). Successful calculations were made on 15 920 forest sites.
Deposition data were derived from the MATCH model (Robertson et al. 1999, www.smhi.se), in a 20 x 20 km square grid over Sweden. The average for three years, 2003-2005 was used. Mineralogy was based on soil data from the Swedish Geological Survey (Lax & Selenius, 2005). Forestry data, e.g. uptake of base cations and nitrogen, originates in the National Forest Inventory (Hägglund, 1985). More detailed information about the input data can be found in Akselsson et al. (2004).
The ecoarea for the forest sites were derived from the National Forest Inventory database. The sum of the ecoarea for all the sites corresponds to the total area of forest in Sweden.

CCE Status Report 2008
89
Dynamic modelling The dynamic soil model SAFE (Alveteg et al. 1998) was used to assess the 14 deposition scenarios defined in the Call at 632 forest sites distributed over the whole country. The model was run without considering nitrogen dynamics in soil beyond nitrification, which means that all nitrogen that is not taken up is assumed to nitrify. Denitrification and N immobilisation were not considered. The model was calibrated based on measured soil base saturation. The simulations include the 14 deposition scenarios defined in the call for data, and optionally a simple run with no change in deposition after 2020. The scenarios were simulated from 2010 to 2100. The format for submitting the data to CCE did not allow for separate reporting of static critical loads and dynamic modelling results. To overcome this technical difficulty the results of the 14 deposition scenarios were assigned to the geographically nearest points with calculated critical loads. Thus were the scenario calculations of the 632 sites assigned to the 15 920 sites with calculated critical load.
Empirical critical loads of N Empirical critical loads of N were defined for two land cover classes in Sweden, forests and mires. The critical loads were set to 8 kg ha-1 y-1 for both forest and mires, based on the recommendations from the Workshop on effects of low-level nitrogen deposition in Stockholm in March 2007 (United Nations 2007). Ground vegetation changes have been observed at this load in both forests and mires (e.g. Nordin et al., 2005; Gunnarsson et al., 2002). The empirical critical loads of N for forests and mires were presented on an EMEP grid resolution. Each combination of land use class and protection class in a grid cell received a unique ID, with corresponding ecosystem area and land use class.
For the empirical critical load calculation, the sum of the ecoarea of forest and wetlands within each EMEP50 square was calculated, representing different levels of protection. Five protection levels were represented; 0) no protection, 1) Special Protection Area (SPA), Birds Directive (Natura 2000), 2) Special Area of Conservation (SAC), Habitats Directive (Natura 2000), 3) SPA and SAC (also Natura 2000) and 9) national nature protection.
Comments and conclusions
Freshwater ecosystems
Critical loads For lakes, the median critical load of S deposition is 413 eq/ha/year, the Nmin is 321 eq/ha/year (i.e. the amount of N deposition that is taken up by the ecosystem and does not cause any acidification) and the Nmax is 1322 eq/ha/year (i.e. the maximum amount of N deposition the ecosystem could take without inacceptable acifification, if the S deposition is zero). The differences between lakes are large, with some lakes that cannot recover with any deposition under present day conditions and many lakes that cannot become acidified under present day conditions. The area with exceedance of critical loads was 19% in 2002-2004 (Figure SE-1).
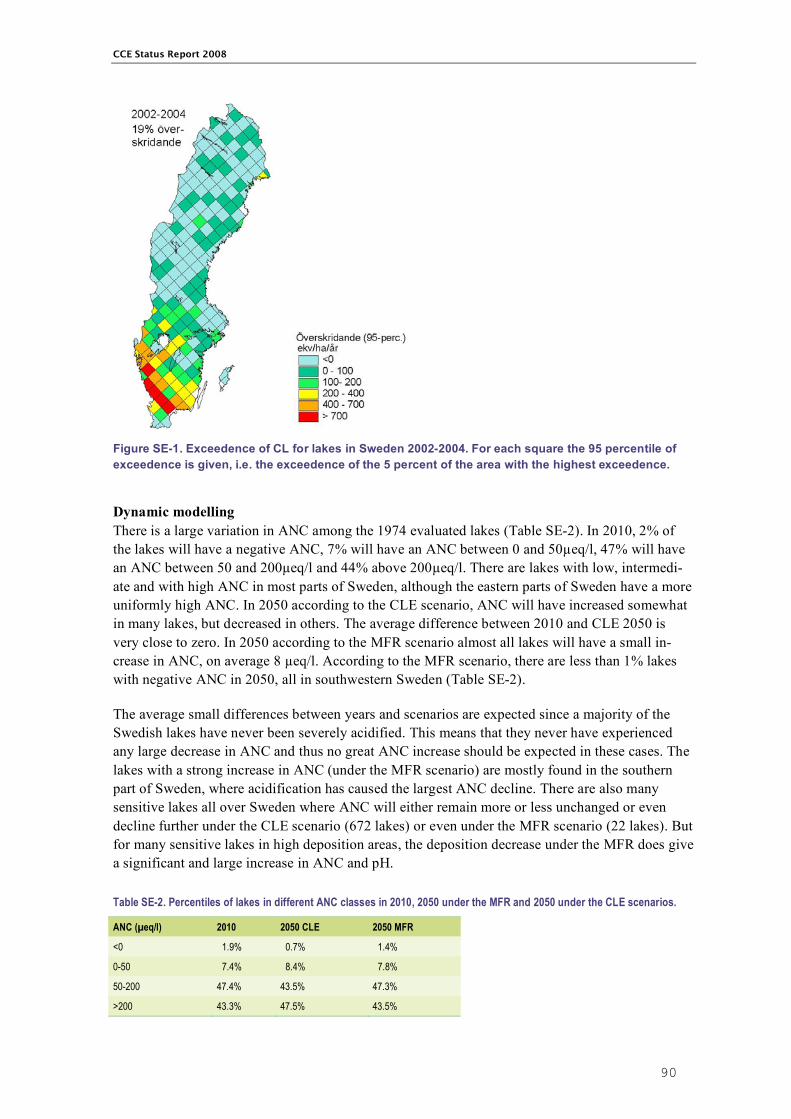
CCE Status Report 2008
90
Figure SE-1. Exceedence of CL for lakes in Sweden 2002-2004. For each square the 95 percentile of exceedence is given, i.e. the exceedence of the 5 percent of the area with the highest exceedence.
Dynamic modelling There is a large variation in ANC among the 1974 evaluated lakes (Table SE-2). In 2010, 2% of the lakes will have a negative ANC, 7% will have an ANC between 0 and 50µeq/l, 47% will have an ANC between 50 and 200µeq/l and 44% above 200µeq/l. There are lakes with low, intermedi-ate and with high ANC in most parts of Sweden, although the eastern parts of Sweden have a more uniformly high ANC. In 2050 according to the CLE scenario, ANC will have increased somewhat in many lakes, but decreased in others. The average difference between 2010 and CLE 2050 is very close to zero. In 2050 according to the MFR scenario almost all lakes will have a small in-crease in ANC, on average 8 µeq/l. According to the MFR scenario, there are less than 1% lakes with negative ANC in 2050, all in southwestern Sweden (Table SE-2).
The average small differences between years and scenarios are expected since a majority of the Swedish lakes have never been severely acidified. This means that they never have experienced any large decrease in ANC and thus no great ANC increase should be expected in these cases. The lakes with a strong increase in ANC (under the MFR scenario) are mostly found in the southern part of Sweden, where acidification has caused the largest ANC decline. There are also many sensitive lakes all over Sweden where ANC will either remain more or less unchanged or even decline further under the CLE scenario (672 lakes) or even under the MFR scenario (22 lakes). But for many sensitive lakes in high deposition areas, the deposition decrease under the MFR does give a significant and large increase in ANC and pH.
Table SE-2. Percentiles of lakes in different ANC classes in 2010, 2050 under the MFR and 2050 under the CLE scenarios.
ANC (µeq/l) 2010 2050 CLE 2050 MFR
<0 1.9% 0.7% 1.4%
0-50 7.4% 8.4% 7.8%
50-200 47.4% 43.5% 47.3%
>200 43.3% 47.5% 43.5%

CCE Status Report 2008
91
Forest ecosystems
Critical loads The critical load of acidity was exceeded at 12.5% of the Swedish sites (Figure SE-2). Exceedances can be explained by weak mineralogies that lead to low base cation weathering rates, in combination with relatively high acid deposition.
Figure SE-2. Exceedance of critical load of acidity, with the criteria molar BC/Al = 1 (root weighted), on 15920 sites in Sweden. Exceedance calculated for an average deposition in years 2003 - 2005. For each square the 95 percentile of exceedence is given, i.e. the exceedence of the 5 percent of the area with the highest exceedence.
The exceedance of the critical load of nutrient N, calculated by the PROFILE model, followed the N deposition gradient, with the highest exceedance in the southwest (> 6 kg ha-1 y-1) and no exceedance in the northernmost parts (Figure SE-3). The exceedance is generally somewhat higher than the exceedance of the empirical critical load of N (Figure SE-5). For Sweden, the critical N load is based on the risk for N leaching to surface waters (Figure SE-3) but is also an important criteria for the protection of the marine environment. The sources for eutrophication of the Baltic Sea are mainly land use and sewage. The N (and P) input to has already changed the ecosystems of the Baltic Sea significantly. Further deterioration of the marine ecosystem is a major concern in Sweden.

CCE Status Report 2008
92
Figure SE-3. Exceedance of critical load of nutrient N calculated with PROFILE with the criteria Criti-cal N concentration in soil solution = 0.3 mg l-1 on 15920 sites in Sweden. Exceedance calculated for an average deposition in years 2003 - 2005.
Dynamic modelling The 14 deposition scenarios give valuable information about the response of the soils to different deposition levels (Figure SE-4).
Figure SE-4. An example of a soil BS response to the 14 deposition scenarios.
There is a rather clear difference in development of the BC/Al (root density weighted average) over time under the MFR and CLE emission scenarios. While the number of points with BC/Al <1 decrease from 2010 to 2050 only modestly under the CLE scenario from 27% to 23% of the 15 920 sites (Table SE-3), the MFR would improve the conditions in the soil water dramatically leaving only 4% of the modeled sites with a BC/Al<1.

CCE Status Report 2008
93
Table SE-3. Percentage of 15 920 modeled with BC/Al ratios divided into four categories.
BC/Al 2010 2050 CLE 2050 MFR
< 0.1 0.1% 0.1% 0.0%
0.1-1 26.7% 22.5% 3.6%
1-10 53.2% 53.1% 48.5%
>10 20.0% 24.3% 47.9%
Empirical critical loads of N The same value (8 kg ha-1 y-1) for the critical load was used for the two considered types of ecosystems (forests and mires) all over Sweden. This leads to a gradient in exceedance of critical loads which follows the N deposition gradient, with the highest exceedance in the southwest (up to 6 kg ha-1 y-1) and no exceedance in the central and northern part of the country (Figure SE-5).
Figure SE-5. Exceedance of empirical critical load of nitrogen.
No long-term experimental data from Swedish forest and mires are available where lower N loads than 8 kg ha/yr have been used, and thus it is unclear (but not unlikely) if ground vegetation changes occur at even lower N loads. Moreover, there are no data that makes it possible to differentiate be-tween different forest types. Forests and mires cover most of the land area with natural and semi-natural vegetation in Sweden. It is desirable to include also mountain areas, and grasslands which are probably sensitive to N loads, but at present we have no data. The empirical critical load for N as a nutrient should be updated when new experimental data becomes available.
CCE Status Report 2008
94
References Akselsson, C., Holmqvist, J., Alveteg, M., Kurz, D. and Sverdrup, H., 2004: Scaling and mapping regional calculations
of soil chemical weathering rates in Sweden. Water, Air, & Soil Pollution: Focus 4: 671-681. Alveteg, M., Kurz, D. and Sverdrup, H.: 1998, Integrated assessment ofsoil chemical status. 1. Integration of existing
models and derivationof a regional database for Switzerland, Water Air and Soil Pollution105, 1-9. Cosby B J, Hornberge, G M, Galloway J N and Wright R F. 1985. Time scales of catchmen acidification: a quantitative
model for estimating freshwater acidification. Environ. Sci. Technol. 19:1144-1149. Cosby B, Ferrier R C, Jenkins A and Wright R F. 2001. Modelling the effects of acid deposition: refinements,
adjustments and inclusion of nitrogen dynamics in the MAGIC model. Hydrol. Earth Syst. Sci. 5: 499-517. Gunnarsson, U., Malmer, N., Rydin, H., 2002. Dynamics or constancy in Sphagnum dominated mire ecosystems? A 40-
year study. Ecography 25: 685-704. Karltun E. 1995. Acidification of forest soils on glacial till in Sweden. Report 4427, 1-76. Swedish Environmental
Protection Agency, Solna, Sweden. Fölster, J., Andrén, C., Bishop, K., Buffam, I., Cory, N., Goedkoop, W., Holmgren, K., Johnson, R., Laudon, H. and
Wilander, A.: 2007, 'A Novel Environmental Quality Criterion for Acidification in Swedish Lakes – An Application of Studies on the Relationship Between Biota and Water Chemistry', Water, Air, & Soil Pollution: Focus 7, 331-338.
Gundersen, P., Emmett, B.A., Kjonaas, O.J., Koopmans, C.J. and Tietema, A.: 1998, 'Impact of nitrogen deposition on nitrogen cycling in forests: a synthesis of NITREX data', For. Ecol. Manage. 101, 37-55.
Henriksen A, Forsius M, Kämäri J, Posch M and Wilander A. 1993. Exceedance of Critical Loads for lakes in Finland, Norway and Sweden: Norwegian Institute for Water Research, REPORT 32/1993.
Hägglund, B., 1985: En ny svensk riksskogstaxering (A new Swedish National Forest Survey). Swedish University of Agricultural Sciences, Report 37, Uppsala, Sweden. (In Swedish with English summary).
Lax, K. and Selenius, O., 2005. Geochemical mapping at the Geological Survey of Sweden. Geochemistry: Exploration, Environment, Analysis 5: 337-346.
Marklund L G. 1988. Biomass functions for pine, spruce and birch in Sweden. Swedish University of Agricultural Scienecs, Dept of Forest Survey. Report 45.
Moldan F, Kronnäs V, Wilander A, Karltun E and Cosby B J. 2004. Modelling acidification and recovery of Swedish lakes. WASP Focus.
Nordin, A., Strengbom, J., Witzell, J., Näsholm, T., Ericson, L, 2005. Nitrogen deposition and the biodiversity of boreal forests – implications for the nitrogen critical load. Ambio 34: 20 – 24.
Posch M. 1995. Critical Loads for Aquatic Ecosystems. In: Mapping and Modelling of Critical Loads for Nitrogen: a workshop report, Proceedings of the Grange-Over-Sands Workshop 24-26 October 1994.
Rapp L, Wilander A, and Bertills U. 2002. Kritisk belastning för försurning av sjöar. In: Kritisk belastning för svavel och kväve. Swedish Environmental Protection Agency. Report 5174. p 81-106. (In Swedish).
Robertson L, Langne, J and Engard, M. 1999. An Eulerian limited-area atmospheric transport model. J. Appl. Meteor. 38, 190-210.
Schöpp W, Posch, M, Mylona S, Johansson M. 2003. Long term development of acid deposition (1880-2030) in sensitive freshwater regions in Europe. Hydrology and Earth System Sciences 7: 436-446.
Sverdrup, H. and Warfvinge, P., 1993. Calculating field weathering rates using a mechanistic geochemical model (PROFILE). Journal of Applied Geochemistry 1993: 8: 273-283.
United Nations, Economic and social council, 2007. Recent results and updating of scientific and technical knowledge - Workshop on effects of low-level nitrogen deposition. Stockholm, 29 - 30 March 2007.
Warfvinge, P. & Sverdrup, H.: 1995. Critical loads of acidity to Swedish forest soils. Methods, data and results. Reports in ecology and environmental engineering. 5:1995, Department of Chemical Engineering II, Lund University, Lund, 104pp.
Wilander, A. and Fölster, J.: 2007, 'Sjöinventeringen 2005 - En synoptisk vattenkemisk undersökning av Sveriges sjöar. Inst. för Miljöanalys, SLU. Rapport 2007:16'. (In Swedish)
CCE Status Report 2008
95
Switzerland
National Focal Centre
Federal Office for the Environment (FOEN) Air Pollution Control and NIR Division Beat Achermann CH - 3003 Bern
tel: 41-31-322.99.78 fax: 41-31-324.01.37 [email protected]
Collaborating institutions
METEOTEST Beat Rihm Fabrikstrasse 14 CH - 3012 Bern tel:41-31-307.26.26 fax: 41-31-307.26.10 [email protected]
EKG Geo-Science Daniel Kurz Maulbeerstrasse 14 CH - 3011 Bern tel:41-31-302.68.67 fax: 41-31-302.68.25 [email protected]
Overview
In the CCE Status Report 2005 (Posch et al. 2005), data sources and methods used to calculate Swiss sulfur and nitrogen critical loads were described in detail. The contribution of the Swiss NFC in 2007 (in Slootweg et al. 2007) mainly focused on items changed since 2005. This document gives again a short summary of the data sources and methods and highlights the changes since the last data submission one year ago.
As in the data submission of 2007, the Swiss data set on critical loads of acidity and nutrient nitro-gen is compiled from the output of four modelling and mapping approaches (see Figure CH-1): 1. The dynamic models SAFE and VSD (very simple dynamic model) were used for assessing
acidifying effects of air pollutants on forest soils. The multi-layer model SAFE was calibrated and applied on 260 sites, where full soil profiles were available. For calculating critical loads of acidity and deposition scenarios with VSD, the required flux input-data were calculated by the SAFE model.
2. The SMB method for calculating critical loads of nutrient nitrogen (CLnutN) was applied on 10’608 forest sites. 10’348 of these sites originate from the National Forest Inventory (NFI, see LFI 1990/92), which is based on a 1x1 km grid. They are complemented by the 260 sites with soil profiles (which are partly identical with the NFI-sites).
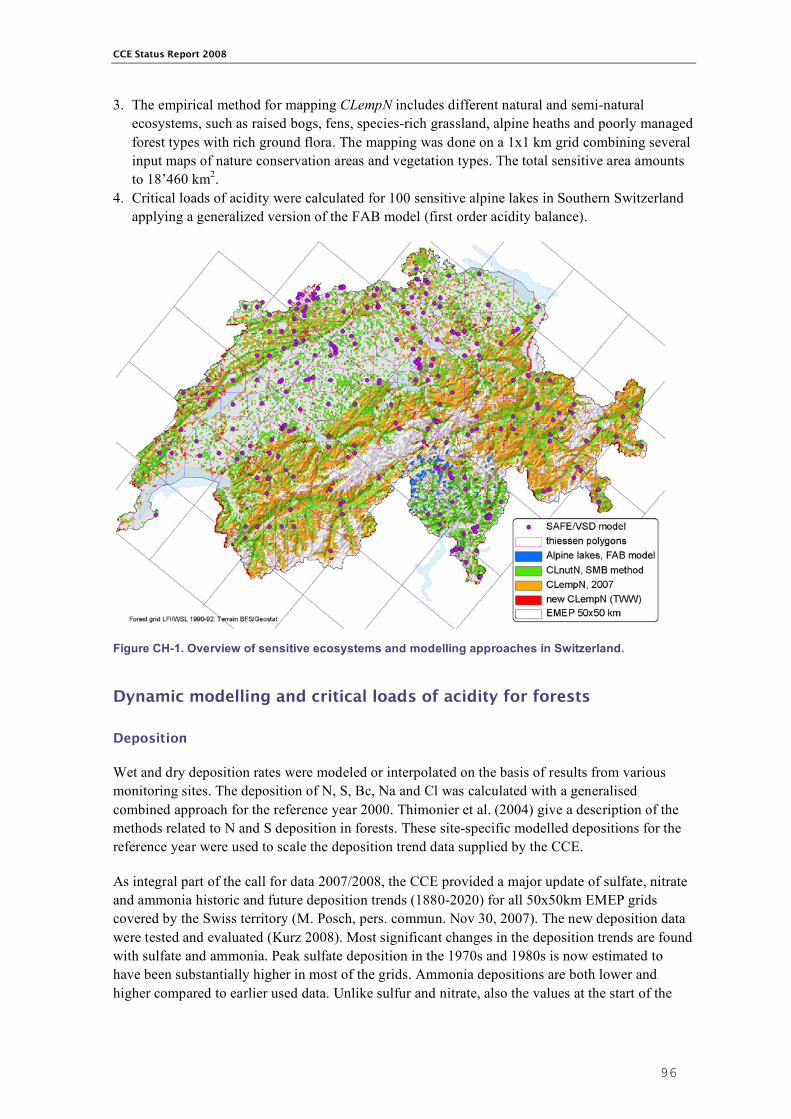
CCE Status Report 2008
96
3. The empirical method for mapping CLempN includes different natural and semi-natural ecosystems, such as raised bogs, fens, species-rich grassland, alpine heaths and poorly managed forest types with rich ground flora. The mapping was done on a 1x1 km grid combining several input maps of nature conservation areas and vegetation types. The total sensitive area amounts to 18’460 km2.
4. Critical loads of acidity were calculated for 100 sensitive alpine lakes in Southern Switzerland applying a generalized version of the FAB model (first order acidity balance).
Figure CH-1. Overview of sensitive ecosystems and modelling approaches in Switzerland.
Dynamic modelling and critical loads of acidity for forests
Deposition
Wet and dry deposition rates were modeled or interpolated on the basis of results from various monitoring sites. The deposition of N, S, Bc, Na and Cl was calculated with a generalised combined approach for the reference year 2000. Thimonier et al. (2004) give a description of the methods related to N and S deposition in forests. These site-specific modelled depositions for the reference year were used to scale the deposition trend data supplied by the CCE.
As integral part of the call for data 2007/2008, the CCE provided a major update of sulfate, nitrate and ammonia historic and future deposition trends (1880-2020) for all 50x50km EMEP grids covered by the Swiss territory (M. Posch, pers. commun. Nov 30, 2007). The new deposition data were tested and evaluated (Kurz 2008). Most significant changes in the deposition trends are found with sulfate and ammonia. Peak sulfate deposition in the 1970s and 1980s is now estimated to have been substantially higher in most of the grids. Ammonia depositions are both lower and higher compared to earlier used data. Unlike sulfur and nitrate, also the values at the start of the

CCE Status Report 2008
97
period covered by data have changed for ammonia. The updated deposition trends for nitrate do not substantially deviate from the trends earlier used.
The new deposition data had to be extended beyond the time interval given because a common simulation period runs from 1500 to 2500. We have assumed for all three compounds deposition trends for years beyond 2020 to be constant until the end of the simulation period. Deposition trends of SOx and NOy prior to 1880 were obtained from scaling the Rothamsted sulfur deposition trend (C. Walse, Lund University, pers. comm., 1996) to the given 1880 SOx and NOy depositions. Resulting grid average background loads of the early 18th century, 27 to 40 molc ha-1 a-1 for SO4 and 7 to 11 molc ha-1 a-1 for NO3, were finally extended into the past as far as needed. The 1880 ammonia depositions were extended unchanged to the beginning of the simulation period also due to a lack of reliable alternatives. Finally, values for years between the provided five-year intervals were obtained by linear interpolation.
Time series of deposition of base cations and Cl have not changed, since their derivation is essentially based on national emission inventories (Kurz 2008, SAEFL 1998, BUWAL 1995).
Consequences of the use of the new deposition data were: • Biomass calibration failures due to an inconsistency between nitrogen availability (too low) and
nitrogen demand to sustain the wanted growth at two sites. This can be avoided by shifting the afforestation year from 1600 to 1500 and by additionally using the site-specific instead of the regional average biomass at one site (2088).
• The need for a recalibration of the sites soil chemistry to reproduce the currently measured base saturations.
Combined application of SAFE and VSD
The modelling of critical loads of acidity and the dynamic model runs of the provided 14 deposition scenarios is based on 260 forest plots (see Figure CH-1) for which the layered soil input is available. The sources of all input data required for the SAFE model runs were listed in the CCE Status Report 2005.
PRESAFE and SAFE are used to simulate input data for the VSD model, especially flux data such as weathering, nutrient uptake and deposition rates. N-processes other than uptake and leaching (immobilisation, denitrification) are yet only considered in VSD. For the current submission, the following modifications were made: • A new version of the SAFE model (V.2008, S. Belyazid, pers. commun. Feb 29, 2008) was
used for preparing the input to VSD. • In former submissions, the multi-layer output of SAFE was aggregated to one layer in order to
run the single-layer model VSD. Now, already the calculations in PRESAFE/SAFE are made in a one-layer mode.
• Fluxes for VSD are drawn from SAFE model runs at critical load deposition (instead of current legislation deposition), using the criterion Bc/Al3+ = 1.
• Due to the results of the data checks performed with the CCE-software (Access data base) input data were improved for a small number of sites, e.g. carbon and nitrogen pools as well as C:N ratios.
Determining the ecosystem area
Critical loads of acidity are calculated for 260 SAFE-sites that are not regularly distributed within the country. The NFI-sites (National Forest Inventory) however are a systematic sample

CCE Status Report 2008
98
representing a forest area of 1 km2, each. Therefore, the area of forest represented by one SAFE-site was determined by those NFI-sites situated within the respective Thiessen-polygon constructed for the SAFE-sites (see Figure CH-1), and all acidity parameters were copied from a SAFE-site to the affiliated NFI-sites. In consequence, EcoArea was set to 1.0 km2 for all resulting sites with critical loads for acidity.
If a NFI-site is situated on a 1x1 km grid cell containing also a site with empirical critical loads, EcoArea is set to 0.8 km2 for the NFI-site and to 0.2 km2 for the empirical site. Thus, double counts are avoided.
Critical loads of nutrient nitrogen (SMB method)
CLnutN are calculated by the SMB method for the 260 forest sites used in dynamic modelling and for 10’348 sites of the National Forest Inventory (NFI). Thereby, only NFI-sites with a defined mixing ratio of deciduous and coniferous trees are included (LFI 1990/92). This corresponds approximately to the managed forest area; for example brush forests and inaccessible forests are excluded.
The input for calculating the nitrogen process was presented in the CCE Report 2007. Table CH-1 gives an overview of the input parameters used . There was no change since then. However, the lower limit of CLnutN calculated by the SMB was set to 10 kg N ha-1 a-1 (corresponding to the lower limit of CLempN for forests). This means, all values of CLnutN below 714 eq ha-1 a-1 were set to 714. This was done with respect to the fact that so far no empirically observed harmful effects in forest ecosystems were published for depositions lower than 10 kg N ha-1 a-1 and for latitudes and altitudes typical for Switzerland. Therefore, the critical loads calculated with the SMB method were adjusted to empirically confirmed values.
Table CH-1. Range of input parameters used for calculating CLnutN with the SMB method.
Parameter Values Comment
fde 0.2 – 0.7 depending on the wetness of the soil
For NFI-sites, information on wetness originates from soil map 1:200’000. For SAFE-sites it is a classification according to the depth of the saturated horizon.
Nle(acc) 4 kg N ha-1 yr-1 at 500m altitude, 2 kg N ha-1 yr-1 at 2000m altitude
linear interpolation in-between. Acceptable leaching mainly occurs by management (after cutting), which is more intense at lower altitudes. Q and [N]acc are not used (for explanations see CCE Progress Report 2007).
Ni 1.5 kg N ha-1 yr-1 at 500m altitude, 2.5 kg N ha-1 yr-1 at 1500m altitude
linear interpolation in-between. At high altitudes the decomposition of organic matter slows down due to lower temperatures and therefore the accumulation rates of N and C are naturally higher.
Nu 0.7 – 7.0 kg N ha-1yr-1 present uptakes calculated on the basis of estimated long-term harvesting rates and average element contents in stems.
Empirical critical loads of nutrient nitrogen
As described in the CCE Progress Report 2007, the application of the empirical method is based on vegetation data compiled from various sources and aggregated to a 1x1 km raster. Until the last submission, 25 sensitive vegetation types were identified and included in the critical load data set (see Figure CH-1, orange colour): 1 type of raised bog (EDI 1991), 3 types of fens (WSL 1993) as well as 21 types with various vegetation worthy of protection (Hegg et al. 1993) including species-rich forest types, grasslands and alpine heaths. If more than one type occurs within a 1x1 km grid-cell the lowest value of CLempN was selected for this cell.
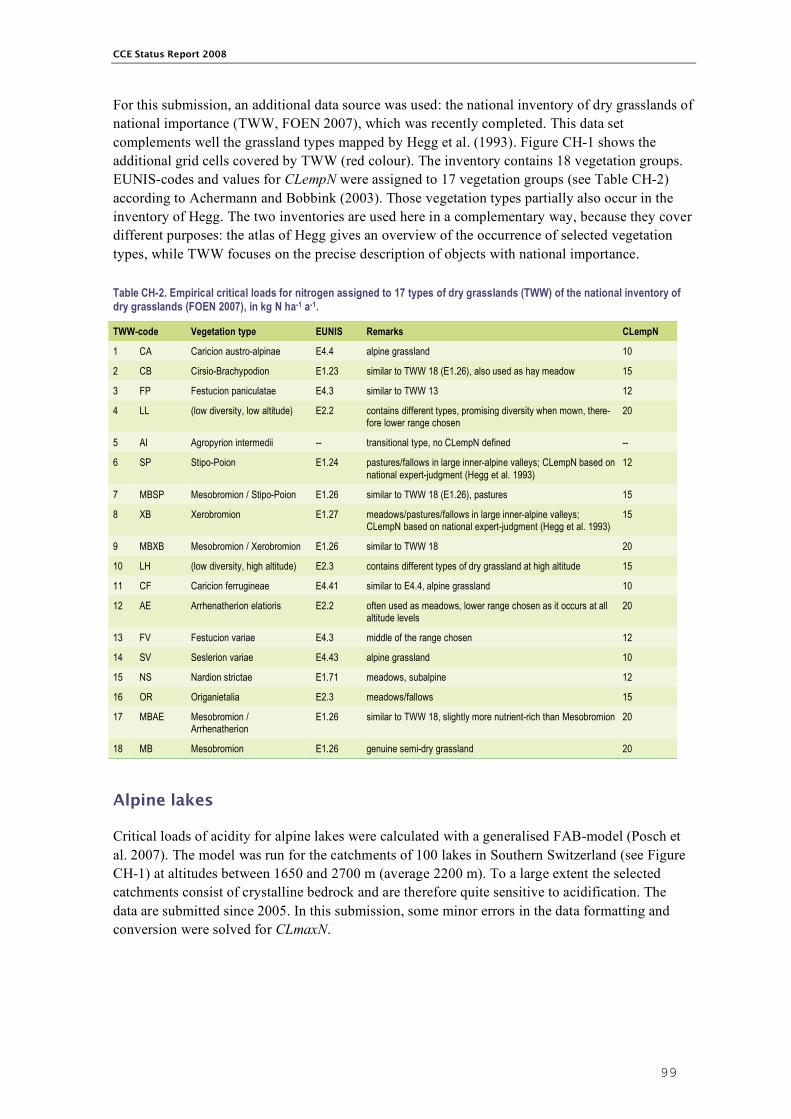
CCE Status Report 2008
99
For this submission, an additional data source was used: the national inventory of dry grasslands of national importance (TWW, FOEN 2007), which was recently completed. This data set complements well the grassland types mapped by Hegg et al. (1993). Figure CH-1 shows the additional grid cells covered by TWW (red colour). The inventory contains 18 vegetation groups. EUNIS-codes and values for CLempN were assigned to 17 vegetation groups (see Table CH-2) according to Achermann and Bobbink (2003). Those vegetation types partially also occur in the inventory of Hegg. The two inventories are used here in a complementary way, because they cover different purposes: the atlas of Hegg gives an overview of the occurrence of selected vegetation types, while TWW focuses on the precise description of objects with national importance.
Table CH-2. Empirical critical loads for nitrogen assigned to 17 types of dry grasslands (TWW) of the national inventory of dry grasslands (FOEN 2007), in kg N ha-1 a-1.
TWW-code Vegetation type EUNIS Remarks CLempN
1 CA Caricion austro-alpinae E4.4 alpine grassland 10
2 CB Cirsio-Brachypodion E1.23 similar to TWW 18 (E1.26), also used as hay meadow 15
3 FP Festucion paniculatae E4.3 similar to TWW 13 12
4 LL (low diversity, low altitude) E2.2 contains different types, promising diversity when mown, there-fore lower range chosen
20
5 AI Agropyrion intermedii -- transitional type, no CLempN defined --
6 SP Stipo-Poion E1.24 pastures/fallows in large inner-alpine valleys; CLempN based on national expert-judgment (Hegg et al. 1993)
12
7 MBSP Mesobromion / Stipo-Poion E1.26 similar to TWW 18 (E1.26), pastures 15
8 XB Xerobromion E1.27 meadows/pastures/fallows in large inner-alpine valleys; CLempN based on national expert-judgment (Hegg et al. 1993)
15
9 MBXB Mesobromion / Xerobromion E1.26 similar to TWW 18 20
10 LH (low diversity, high altitude) E2.3 contains different types of dry grassland at high altitude 15
11 CF Caricion ferrugineae E4.41 similar to E4.4, alpine grassland 10
12 AE Arrhenatherion elatioris E2.2 often used as meadows, lower range chosen as it occurs at all altitude levels
20
13 FV Festucion variae E4.3 middle of the range chosen 12
14 SV Seslerion variae E4.43 alpine grassland 10
15 NS Nardion strictae E1.71 meadows, subalpine 12
16 OR Origanietalia E2.3 meadows/fallows 15
17 MBAE Mesobromion / Arrhenatherion
E1.26 similar to TWW 18, slightly more nutrient-rich than Mesobromion 20
18 MB Mesobromion E1.26 genuine semi-dry grassland 20
Alpine lakes
Critical loads of acidity for alpine lakes were calculated with a generalised FAB-model (Posch et al. 2007). The model was run for the catchments of 100 lakes in Southern Switzerland (see Figure CH-1) at altitudes between 1650 and 2700 m (average 2200 m). To a large extent the selected catchments consist of crystalline bedrock and are therefore quite sensitive to acidification. The data are submitted since 2005. In this submission, some minor errors in the data formatting and conversion were solved for CLmaxN.
CCE Status Report 2008
100
References Achermann B., Bobbink R. (Eds.) (2003) Empirical Critical Loads for Nitrogen. Expert workshop held under the
Convention on Long-range Transboundary Air Pollution, Berne, 11-13 November 2002, Proceedings. Swiss Agency for the Environment, Forests and Landscape (SAEFL), Environmental Documentation No. 164, 43-170, Berne.
BUWAL (ed.) (1995) Vom Menschen verursachte Luftschadstoff-Emissionen in der Schweiz von 1900 bis 2010. Bundesamt für Umwelt, Wald und Landschaft (BUWAL), Bern, Schriftenreihe Umwelt Luft, 256: 121p.
EDI (1991) Bundesinventar der Hoch- und Uebergangsmoore von nationaler Bedeutung. (Federal Inventory of Raised and Transitional Bogs of National Importance). Appendix to the Federal Ordinance on the Protection of Raised Bogs. Eidgenössisches Departement des Innern (EDI), Berne.
Hegg O., Béguin C., Zoller H. (1993) Atlas schutzwürdiger Vegetationstypen der Schweiz (Atlas of Vegetation Types Worthy of Protection in Switzerland). Edited by Federal Office of Environment, Forests and Landscape, Berne.
Kurz D. (2008) Note on “Data Call 2007/2008 – Critical Loads and Dynamic Modeling”. Ref.DK.2/6/08. Internal Document, on behalf of the Swiss National Focal Centre.
FOEN (2007) Inventar der Trockenwiesen und –Weiden von nationaler Bedeutung (TWW) [Inventory of dry grasslands of national importance]. Pers. comm. (GIS data) by Christophe Hunziker on behalf of the Federal Office fort he Environment, 22. Oct. 2007. http://www.bafu.admin.ch/lebensraeume/01553/01576/
LFI (1990/92) Schweizerisches Landesforstinventar (LFI), Datenbankauszüge vom 30. Mai 1990 und vom 8. Dezember 1992. Birmensdorf, Eidg. Forschungsanstalt für Wald, Schnee und Landschaft (WSL).
NFI (1990/92) Schweizerisches Landesforstinventar (National Forest Inventory, NFI), Datenbankauszüge vom 30. Mai 1990 und vom 8. Dezember 1992. Birmensdorf, Eidg. Forschungsanstalt für Wald, Schnee und Landschaft (WSL).
Posch M.,Slootweg J., Hettelingh J.-P. (eds.) (2005) European Critical Loads and Dynamic Modelling. CCE Status Report 2005, Coordination Center for Effects, Netherlands Environmental Assessment Agency (mnp), Bilthoven NL, Report No. 259101016/2005.
Posch M., Eggenberger U., Kurz D., Rihm B. (2007) Critical Loads of Acidity for Alpine Lakes. A weathering rate calculation model and the generalized First-order Acidity Balance (FAB) model applied to Alpine lake catchments. Environmental studies no. 0709. Federal Office for the Environment, Berne. 69 p.
SAEFL (ed.) (1998) Acidification of Swiss Forest Soils – Development of a Regional Dynamic Assessment. Environmental Documentation Air/Forest No. 89. Swiss Agency for the Environment, Forests and Landscape (SAEFL), Berne, 115 p.
Slootweg J., Posch M., Hettelingh J.-P. (eds) (2007) Critical Loads of Nitrogen and Dynamic Modelling. CCE Progress Report 2007, Coordination Center for Effects, Netherlands Environmental Assessment Agency (mnp), Bilthoven NL, Report No. 500090001/2007.
Sverdrup H., Belyazid S., Braun S., Kurz D., Rihm B. (2008) Proposed method for estimating critical loads for nitrogen based on biodiversity using a fully integrated dynamic model – testing in Switzerland and Sweden. Background paper of the presentation at the 18th CCE workshop 21-23 April 2008 in Berne.
Thimonier A., Schmitt M., Waldner P., Rihm B. (2005) Atmospheric deposition on Swiss Long-term Forest Ecosystem Research (LWF) plots. Environmental Monitoring and Assessment, 104: 81-118.
WSL (1993) Federal Inventory of Fenlands of National Importance. Pers. comm. from A. Grünig and P. Schönenberger, Swiss Federal Institute for Forest, Snow and Landscape Research, Birmensdorf. The inventory was published in 1995 as an Appendix to the Federal Ordinance on the Protection of Fenlands.
CCE Status Report 2008
101
United Kingdom
National Focal Centre
Jane Hall, Chris Evans, Ed Rowe Centre for Ecology and Hydrology Environment Centre Wales Deiniol Road, Bangor Gwynedd LL57 2UW
Tel: +44 1248 374500 Fax: +44 1248 355365 [email protected] [email protected] [email protected] http://critloads.ceh.ac.uk
Collaborating institutions
Chris Curtis Environmental Change Research Centre Department of Geography University College London Pearson Building, Gower Street London WC1E 6BT
Tel: +44 20 7679 0547 [email protected]
Introduction
In response to this call for data the UK are re-submitting steady-state critical loads for acidity and nitrogen and empirical critical loads for Special Areas of Conservation (SACs); these data remain largely unchanged from previous data submissions, but are re-submitted using the new table formats required by the CCE. In addition dynamic modelling outputs for the deposition scenarios provided by the CCE are submitted for 310 surface water sites and for acid sensitive regions of nine terrestrial EUNIS habitat classes.
Critical loads for terrestrial broad habitats
The methods and data used to calculate critical loads for broad habitats in the UK are described in detail in Hall et al (2003a,b & 2004a,b) and will not be repeated here. However, for this data submission the following changes or additions have been made: • The values of nitrogen immobilization for the heathland habitats (EUNIS classes F4.11 and
F4.2) incorporate losses of N through fire (Nfire). Different values of Nfire are used for areas of wet and dry heathland (Hall et al, 2004b). The value for Nfire in dry heathland (EUNIS class F4.2) has been revised downwards from 15 kg N ha-1 year-1 to 10 kg N ha-1 year-1 on the basis

CCE Status Report 2008
102
of recent measurements (Power et al, 2004; Terry et al, 2004). Therefore the values submitted for Nimacc, CLminN and CLmaxN for this EUNIS class have been updated.
• The values of Ca, Mg, K, Na and Cl deposition submitted are non-marine (ie, seasalt corrected); in the previous submission “total” (marine plus non-marine) values had been submitted although non-marine data are used in the critical load calculations, with the exception of the acidity critical loads for woodland habitats where “total” Ca deposition is used in deriving ANCle(crit) (Hall et al, 2004a).
• The values of K uptake for managed woodlands on organo-mineral and peat soils have been updated to reflect the application of phosphate and potassium fertilizers (primarily rock phosphate and muriate of potash) and their contribution to the base cation budget (Table UK-1). Whilst included in the methodology used to calculate critical loads previously the values had been omitted from the data submitted.
Table UK-1. The contribution of phosphate and potassium fertilizers to the base cation budget for managed woodlands.
Woodland type Soil type Addition of rock phosphate (eq ha-1 year-1)
Managed broadleaf (G1) Organo-mineral 80
Managed conifer (G3) Organo-mineral 177
Managed conifer (G3) Peat 417
Critical loads are required to protect these managed habitats and to protect the land under managed conifer forest for future non-forest use and possible reversion to semi-natural land uses.
The EUNIS categories assigned to the woodland broad habitats have been revised with G1 and G3 still being used for the managed broadleaved woodland and managed coniferous woodland respectively; and all the unmanaged woodland being assigned to G4 (mixed woodland). For G1 and G3 both acidity and nutrient nitrogen critical loads are based on a simple mass balance approach. For G4 the simple mass balance is used for acidity, but the empirical approach is used for nutrient nitrogen with different values set for (i) the effects of nitrogen on the ground flora of unmanaged ancient and semi-natural woodland (broadleaf and conifer), and (ii) the effects of nitrogen on epiphytic lichens in Atlantic oak woodlands. The methodology and values remain unchanged from previous submissions.
A “protection” code of 9 (ie, “a national nature protection program applies”) is given to all the habitat data submitted as these “Broad Habitats” are of conservation value in the UK.
Critical loads of acidity for freshwaters
The previous submission included acidity critical loads for 1717 freshwaters (EUNIS classes C1 and C2) calculated using the FAB model. For this submission new data for 51 sites representing acid sensitive streams and ponds in the North York Moors area of the UK were added to the existing freshwater data set. Following screening 35 new sites were added to the data set for FAB modelling and critical loads have been submitted for these, bringing the total for this habitat type to 1752 sites. These sites are also assigned a “protection” code of 9 as they are also treated here as a broad habitat.

CCE Status Report 2008
103
Critical loads for Special Areas of Conservation (SACs)
In 2007 site-relevant empirical critical loads of nutrient nitrogen were submitted for the designated features of SACs in the UK. These data have been re-submitted this year to provide the data in the updated table format; the methods and habitats considered are described in Hall et al, 2007.
Dynamic modelling of surface water habitats
The MAGIC model was applied to 310 previously calibrated UK lakes and streams covering the acid sensitive regions of Wales (Snowdonia, Cambrian Mountains), England (Lake District, South Pennines), Scotland (Galloway, Cairngorms) and Northern Ireland (Mourne Mountains). These are the same 310 sites for which dynamic model outputs were submitted in 2007 and the methods and data sources used to calibrate the model are described in Hall et al, 2005. For this submission MAGIC has been run using the latest set of deposition scenarios requested by the CCE.
Dynamic modelling of terrestrial habitats
Steady-state critical loads of acidity are calculated for all 1x1 km squares of the UK that contain at least 1ha of sensitive habitat and for which all the relevant data are available. The additional data required to run the VSD are largely based on a survey by Evans et al (2004) of the acid-sensitive regions of the UK and hence the model has only been applied to 1x1 km habitat squares where the soil base cation weathering is less than 1000 eq ha-1 year-1 (Table UK-2).
Table UK-2. The number of 1x1 km squares where the base cation weathering rate is < 1000 eq ha-1 year-1 and soils data are available for dynamic modelling and outputs have been submitted for terrestrial habitats in the UK.
EUNIS class Habitat Number of habitat 1x1 km squares modelled
Percentage of total habitat 1x1 km squares
D1 Bog 17041 91% E1.7 & E3.5 Acid grassland 66568 86% E4.2 Montane 3018 55% F4.11 & F4.2 Dwarf shrub heath 67323 86% G1 Managed broadleaved wood 38401 51% G3 Managed coniferous wood 26576 71% G4 Unmanaged wood 20525 55%
Parameters for the VSD have been assigned on the basis of soil type alone, or both habitat and soil type. Soil type was defined (as for critical loads) as the dominant soil association or map unit within each 1x1 km grid square and the soil group (eg, podzol), sub-group (eg, brown podzol), or broad soil class (ie, mineral, organo-mineral, peat) to which the soil type belongs. Where both habitat and soil type were required, the parameters for the unmanaged woodland habitat (that consists of both broadleaved and coniferous woodland) were set to those for broadleaved woodland. The parameters used are summarised in Table UK-3.

CCE Status Report 2008
104
Table UK-3. Summary of parameters for the VSD “inputs” table for EUNIS classes D1, E1.26, E1.7, E3.5, E4.2, F4.11, F4.2, G1, G3, G4.
Parameter EUNIS class Value used Notes [] indicates source listed under References
SiteID Unique IDs for habitat and location E1.7, E3.5, E4.2 214 D1, F4.11, F4.2 321 G1, G4 357
cNacc
G3 232
Values used in the VSD but not yet formally adopted in the UK.
D*, E*, F* ANC & CritpH VSD run using ANC criteria for all squares[10] Crittype G* Ca:Al & CritpH VSD run using ANC criteria for all squares[10]
D*, E*, F*
ANC = 0 CritpH = 4.4
Habitat on mineral or organo-mineral soils[10]
Habitat on peat soils[10]
But VSD run using ANC0 for all squares
Critvalue
G* Ca:Al = 1 CritpH = 4.4
Trees on mineral or organo-mineral soils[10]
Trees on peat soils[10]
But VSD run using ANC0 for all squares Thick All 0.5 Default value Bulkdens All Mean values by soil group (NSRI data) Cadep All CBED non-marine values 1998-2000[20, 21]
Mgdep All CBED non-marine values 1998-2000[20,21]
Kdep All Set to zero Data not available Nadep All Set to zero Data not available Cldep All CBED non-marine values 1998-2000[20, 21]
Cawe All Dependent on soil type as fraction of BCwe[8]
Mgwe All (BCwe-Cawe)/3 Assumed to be 1/3 of BCwe - Cawe Kwe All (BCwe-Cawe)/3 Assumed to be 1/3 of BCwe - Cawe Nawe All (BCwe-Cawe)/3 Assumed to be 1/3 of BCwe - Cawe
E1.26 222 [8]
D*, F*, E1.7, E3.5, E4.2 Zero Assumed to be zero[8]
G1 195 eq ha-1 yr-1
290 eq ha-1 yr-1 for trees on Ca-poor soils[8]
for trees on Ca-rich soils[8]
G3 160 eq ha-1 yr-1 [8]
Caupt
G4 Zero Unmanaged woodland, assumes no harvesting[8]
D*, E*, F* Zero Assumed to be zero[8]
G1 35 eq ha-1 yr-1 41 eq ha-1 yr-1
For trees on Ca-poor soils[based on data in 3]
For trees on Ca-rich soils[based on data in 3]
G3 54 eq ha-1 yr-1 [based on data in 3]
Mgupt
G4 zero Unmanaged woodland, assumes no harvesting[10]
D*, E*, F* Zero Assumed to be zero[8]
85 eq ha-1 yr-1 For trees on Ca-poor soils[based on data in 3] G1 79 eq ha-1 yr-1 For trees on Ca-rich soils[based on data in 3]
G3 56 eq ha-1 yr-1 [based on data in 3]
Kupt
G4 zero Unmanaged woodland, assumes no harvesting[10]
Qle All 1x1 km runoff data based on 30-year (1941-1970) mean rainfall data 8.5 Habitats on mineral soils[10, 23]
7.6 Habitats on organo-mineral soils[10, 23]
lgKAlox All
6.5 Habitats on peat soils[10, 23]
expAl All 3 Default value 40 Habitats on mineral soils[M.Billett pers.com.]
100 Habitats on organo-mineral soils[M.Billett pers.com.] pCO2fac All
100 Habitats on peat soils[M.Billett pers.com.] 25 eq m-3 Habitats on mineral soils[C.Evans, unpublished data]
32 eq m-3 Habitats on organo-mineral soils[C.Evans, unpublished data] cOrgacids All
65 eq m-3 Habitats on peat soils[C.Evans, unpublished data] All except F* Assigned by soil type[8, 14]
F4.11 Assigned by soil type and additionally includes Nfire of 4.5 kg N ha-1 yr-1
[1, 4, 8, 14, 23]
Nimacc
F4.2 Assigned by soil type and additionally includes Nfire of 10 kg N ha-1 yr-1
[8, 14, 16, 22, 23]

CCE Status Report 2008
105
Parameter EUNIS class Value used Notes [] indicates source listed under References
D1, E4.2, F4.11, F4.2 36 eq ha-1 yr-1 [2, 7, 8, 15, 17, 18]
E1.26 714 eq ha-1 yr-1 [8]
E1.7, E3.5 81 eq ha-1 yr-1 [6, 8]
G1 420 eq ha-1 yr-1 [8, 10]
Nupt
G3 Zero Unmanaged woodland, assumes no harvesting[8,10]
fde All Nde * -1 For running VSD Nde All Assigned by soil type[8, 14]
CEC All [5]
Bsat All [5]
Yearbsat All 2004 [5]
Cpool All Mean values by soil group (NSRI data) CNrat All [5]
yearCN All 2004 [5]
The VSD was run in Access using the “CalcDM” form with the following settings: • Oliver constants: defaults as supplied by the CCE • Sea-salt correction: set to zero (no sea-salt correction) • Exchange kinetics: Gaines-Thomas Minimum and Maximum values of CN ratio set according to Rowe et al (2006): • CNrat_min: 7.5 gC/gN for all habitats • CNrat_max: 20.8 gC/gN for E1.7, E3.5, E4.2, G1, G4
43.6 gC/gN for D1, F4.11, F4.2, G3
It should be noted that as the VSD is not currently set up to run with the criteria of Ca:Al or critical pH, it was run for all habitat squares using the criterion of ANC set to zero. This enabled scenario outputs to be generated for all sensitive habitat squares for which data were available. The table “CLdata” contains the original UK critical loads data and not outputs from the VSD. The “inputs” table contains the criteria types and values used in the UK as defined in Table UK-3 above.
References
Numbers in [ ] referred to in Table UK-3. Allen, S.E. 1964. Chemical aspects of heather burning. Journal of Applied Ecology, 1, 347-367. [1] Batey, T. 1982. Nitrogen cycling in upland pastures of the UK. Phil. Trans. R. Soc. London, B, 296, 551-556. [2] Broadmeadow, M., Benham, S. & Wilkinson, M. 2004. Growth uptake of heavy metals by British forests: implications
for critical load mapping. Forest Research report. Forest Research, Alice Holt, Lodge, Farnham, Surrey, UK. [3] Chapman, S.B. 1967. Nutrient budgets for a dry heath ecosystem in the south of England. Journal of Ecology, 55, 677-
689. [4] Evans, C.D., Helliwell, R.C., Coull, M.C., Langan, S. & Hall, J. 2004. Results of a survey of UK soils to provide input
data for national-scale dynamic modeling. Report to Department of the Environment, Food and Rural Affairs, Defra Contract CPEA 19. Centre for Ecology and Hydrology, Bangor, UK. [5]
Frissel, M.J. (ed) 1978. Cycling of mineral nutrients in agricultural ecosystems. Developments in Agricultural and Managed Forest Ecology, 3. Elsevier, Amsterdam. 356pp. [6]
Gordon, C., Emmett, B.A., Jones, M.L.M., Barden, T., Wildig, J., Williams, D.L., Woods, C., Bell, S.A., Norris, D.A., Ashenden, T.W., Rushton, S.P. & Sanderson, R.A. 2001. Grazing/nitrogen deposition interactions in upland acid moorland. Welsh Office, Countryside Council for Wales, National Power, Powergen, Eastern Generation Joint Environment Programme. 83pp. [7]
Hall, J., Ullyett, J., Heywood, L. Broughton, R., Fawehinmi, J. & 31 UK experts. 2003a. Status of UK Critical Loads: Critical Loads Methods, Data and Maps. February to Defra (Contract EPG 1/3/185). http://critloads.ceh.ac.uk [8]
Hall, J., Ullyett, J., Heywood, L., Broughton, R. & Fawehinmi, J. 2003b. UK National Focal Centre report. In: Modelling and Mapping of Critical Thresholds in Europe. Status Report 2003, Coordination Centre for Effects (eds. M. Posch, J.-P. Hettelingh, J. Slootweg & R.J. Downing). RIVM Report No. 259101013/2003. RIVM, Bilthoven, Netherlands. p 114-124. http://www.mnp.nl/cce/publ [9]

CCE Status Report 2008
106
Hall, J., Ullyett, J., Heywood, L., Broughton, R. & 12 UK experts. 2004a. Update to: The Status of UK Critical Loads – Critical Loads Methods, Data and Maps. February 2004. Report to Defra (Contract EPG 1/3/185). http://critloads.ceh.ac.uk [10]
Hall, J., Ullyett, J., Heywood, L., Broughton, R.& Fawehinmi, J. 2004b. UK National Focal Centre report. In: Critical Loads and Dynamic Modelling results. CCE Progress Report 2004. ICP M&M Coordination Centre for Effects (eds. J.-P. Hettellingh, M. Posch, J. Slootweg). RIVM Report No. 259101014/2004. RIVM, Bilthoven, Netherlands. pp114-134. http://www.mnp.nl/cce/publ [11]
Hall, J., Ullyett, J., Evans, C., Rowe, E., Aherne, J., Helliwell, R., Ferrier, R., Jenkins, A. & Hutchins, M. 2005. UK National Focal Centre report. In: European Critical Loads and Dynamic Modelling (eds. M. Posch, J. Slootweg, J.-P. Hettelingh). CCE Status Report 2005. Netherlands Environmental Assessment Agency. Report No. 259101016/2005. Bilthoven, Netherlands. pp158-160. http://www.mnp.nl/cce/publ [12]
Hall, J., Rowe, E., Evans, C., Bealey, B., Whitfield, C., Bareham, S., Masters, Z. & Houlgreave, J. UK National Focal Centre report. In: Critical Loads of Nitrogen and Dynamic Modelling (eds. J. Slootweg, M. Posch, J.-P.Hettelingh). CCE Progress Report 2007. Netherlands Environmental Assessment Agency. MNP Report No. 500090001/2007. Bilthoven, Netherlands. pp180-201. http://www.mnp.nl/cce/publ [13]
Hornung, M., Sutton, M.A. & Wilson, R.B. (eds) 1995. Mapping and modelling of critical loads for nitrogen – a workshop report. Proceedings of the Grange-over-Sands Workshop 24-26 October 1994. p81. [14]
Perkins, D.F. 1978. The distribution and transfer of energy and nutrients in the Agrostis-Festuca grassland ecosystem. In: Production Ecology of British Moors and Montane Grasslands (eds. O.W. Heal & D.F. Perkins), Ecological Studies, 27, 374-395. Springer-Verlag, Berlin. [15]
Power, S.A., Ashmore, M.R., Terry, A.C., Caporn, S.J.M., Pilkington, M.G., Wilson, D.B., Barker, C.G., Carroll, J.A., Cresswell, N., Green, E.R. & Heil, G.W. 2004. Linking field experiments to long-term simulation of impacts of nitrogen deposition on heathlands and moorlands. Water, Air and Soil Pollution: Focus 4, 259-267. [16]
Rawes, M. & Heal, O.W. 1978. The blanket bog as part of a Pennine moorland. In: Production Ecology of the British Moors and Montane Grasslands (eds. O.W. Heal & D.F. Perkins), Ecological Studies, 27, 224-243. Springer-Verlag, Berlin. [17]
Reynolds, B., Hornung, M. & Stevens, P.A. 1987. Solute budgets and denudation rate estimates for a mid-Wales catchment. Catena, 14, 13-23. [18]
Rowe, E.C., Evans, C.D., Emmett, B.A., Reynolds, B., Helliwell, R.C., Coull, M.C. & Curtis, C.J. 2006. Vegetation type affects the relationship between soil carbon to nitrogen ratio and nitrogen leaching. Water Air and Soil Pollution, 177, 335-347. [19]
Smith, R.I., Fowler, D., Sutton, M.A., Flechard, C. & Coyle, M. 2000. Regional estimation of pollutant gas deposition in the UK: model description, sensitivity analysis and outputs. Atmospheric Environment, 34, pp 3757-3777. [20]
Smith, R.I. & Fowler, D. 2001. Uncertainty in wet deposition of sulphur. Water, Air and Soil Pollution: Focus 1, pp 341-354. [21]
Terry, A.C., Ashmore, M.R., Power, S.A., Allchin, L. & Heil, G.W. 2004. Modelling of impacts of elevated atmospheric nitrogen deposition on Calluna dominated ecosystems in the UK. Journal of Applied Ecology, 41, 897-909. [22]
UBA (2004) Manual on methodologies and criteria for modelling and mapping critical loads and levels and air pollution effects, risks and trends. Umweltbundesamt Texte 52/04, Berlin www.icpmapping.org [23]
Related Documents