global0580 Global Change Biology (1997) 3, 119–128 Rice responses to drought under carbon dioxide enrichment. 1. Growth and yield JEFFREY T. BAKER,* L. HARTWELL ALLEN, Jr.,² KENNETH J. BOOTE‡ and NIGEL B. PICKERING§ *Department of Horticulture, Texas A&M University, Agricultural Research and Extension Center, Overton, PO Box E, Overton, TX 75684–0290, USA, ²Agronomy Department, University of Florida, Gainesville, FL 32611, USA, ‡United States Department of Agriculture, Building 164, Gainesville, FL 32611, USA, §Agricultural and Biological Engineering Department, University of Florida, Gainesville, FL 32611, USA Abstract Projections of future climate change include a strong likelihood of a doubling of current atmospheric carbon dioxide concentration ([CO 2 ]) and possible shifts in precipitation patterns. Drought stress is a major environmental limitation for crop growth and yield and is common in rainfed rice production systems. This study was conducted to determine the growth and grain yield responses of rice to drought stress under [CO 2 ] enrichment. Rice (cv. IR-72) was grown to maturity in eight naturally sunlit, plant growth chambers in atmospheric carbon dioxide concentrations [CO 2 ] of 350 and 700 μmol CO 2 mol –1 air. In both [CO 2 ], water management treatments included continuously flooded (CF) controls, flood water removed and drought stress imposed at panicle initiation (PI), anthesis (ANT), and both panicle initiation and anthesis (PI & ANT). The [CO 2 ] enrichment increased growth, panicles plant –1 and grain yield. Drought accelerated leaf senescence, reduced leaf area and above-ground biomass and delayed crop ontogeny. The [CO 2 ] enrichment allowed 1–2 days more growth during drought stress cycles. Grain yields of the PI and PI & ANT droughts were similar to the CF control treatments while the ANT drought treatment sharply reduced growth, grain yield and individual grain mass. We conclude that in the absence of air temperature increases, future global increases in [CO 2 ] should promote rice growth and yield while providing a modest reduction of near 10% in water use and so increase drought avoidance. Keywords: carbon dioxide, climate change, drought, growth, rice, yield Received 24 March 1996; revision accepted 15 July 1996 Introduction The current rise in global atmospheric carbon dioxide [CO 2 ] may result in a slight increase in global mean concentration [CO 2 ] has been well documented (Keeling precipitation, large uncertainties exist at the regional scale et al. 1995). Current [CO 2 ] (360 μmol CO 2 mol –1 air) has due in part to the large spatial and temporal variability been projected to increase to about 670–760 μmol mol –1 inherent in precipitation events and intensity (Wigley by the year 2075 due mainly to the continued burning of et al. 1986). The resulting precipitation shifts could have fossil fuels (Rotty & Marland 1986; Trabalka et al. 1986). considerable agricultural impact especially in regions As a result of this rise in [CO 2 ] and other radiatively that become drier (Wigley et al. 1980). Since soil water active gases such as methane, nitrous oxide and CFCs, availability currently limits crop growth more than all several atmospheric general circulation models have pre- other environmental factors combined (Mauney et al. dicted increases in global air temperatures as well as 1979; Boyer 1982), it is important to quantify the effects shifts in regional scale precipitation patterns (Hansen and possible interactions of water management practices et al. 1988; Manabe & Wetherald 1987; Wilson & Mitchell with [CO 2 ] upon major food crops such as rice. 1987). Although model results suggest that increasing Carbon dioxide enrichment has been shown to increase growth by stimulating tillering in both wheat (Gifford 1977; Sionit et al. 1980, 1981a,b) and rice (Imai Correspondence: J. T. Baker, tel. 11/903-834-6191, fax 11/903- 831-7140, e-mail [email protected]. & Murata 1976, 1979a,b; Imai et al. 1985; Baker et al. © 1997 Blackwell Science Ltd. 119

Welcome message from author
This document is posted to help you gain knowledge. Please leave a comment to let me know what you think about it! Share it to your friends and learn new things together.
Transcript
global0580
Global Change Biology (1997) 3, 119–128
Rice responses to drought under carbon dioxideenrichment. 1. Growth and yield
J E F F R E Y T . B A K E R , * L . H A R T W E L L A L L E N , Jr.,† K E N N E T H J . B O O T E ‡ andN I G E L B . P I C K E R I N G §*Department of Horticulture, Texas A&M University, Agricultural Research and Extension Center, Overton, PO Box E,Overton, TX 75684–0290, USA, †Agronomy Department, University of Florida, Gainesville, FL 32611, USA, ‡United StatesDepartment of Agriculture, Building 164, Gainesville, FL 32611, USA, §Agricultural and Biological Engineering Department,University of Florida, Gainesville, FL 32611, USA
Abstract
Projections of future climate change include a strong likelihood of a doubling of currentatmospheric carbon dioxide concentration ([CO2]) and possible shifts in precipitationpatterns. Drought stress is a major environmental limitation for crop growth and yieldand is common in rainfed rice production systems. This study was conducted todetermine the growth and grain yield responses of rice to drought stress under [CO2]enrichment. Rice (cv. IR-72) was grown to maturity in eight naturally sunlit, plant growthchambers in atmospheric carbon dioxide concentrations [CO2] of 350 and 700 µmol CO2mol–1 air. In both [CO2], water management treatments included continuously flooded(CF) controls, flood water removed and drought stress imposed at panicle initiation (PI),anthesis (ANT), and both panicle initiation and anthesis (PI & ANT). The [CO2]enrichment increased growth, panicles plant–1 and grain yield. Drought accelerated leafsenescence, reduced leaf area and above-ground biomass and delayed crop ontogeny.The [CO2] enrichment allowed 1–2 days more growth during drought stress cycles. Grainyields of the PI and PI & ANT droughts were similar to the CF control treatments whilethe ANT drought treatment sharply reduced growth, grain yield and individual grainmass. We conclude that in the absence of air temperature increases, future globalincreases in [CO2] should promote rice growth and yield while providing a modestreduction of near 10% in water use and so increase drought avoidance.
Keywords: carbon dioxide, climate change, drought, growth, rice, yield
Received 24 March 1996; revision accepted 15 July 1996
Introduction
The current rise in global atmospheric carbon dioxide [CO2] may result in a slight increase in global meanconcentration [CO2] has been well documented (Keeling precipitation, large uncertainties exist at the regional scaleet al. 1995). Current [CO2] (360 µmol CO2 mol–1 air) has due in part to the large spatial and temporal variabilitybeen projected to increase to about 670–760 µmol mol–1 inherent in precipitation events and intensity (Wigleyby the year 2075 due mainly to the continued burning of et al. 1986). The resulting precipitation shifts could havefossil fuels (Rotty & Marland 1986; Trabalka et al. 1986). considerable agricultural impact especially in regionsAs a result of this rise in [CO2] and other radiatively that become drier (Wigley et al. 1980). Since soil wateractive gases such as methane, nitrous oxide and CFCs, availability currently limits crop growth more than allseveral atmospheric general circulation models have pre- other environmental factors combined (Mauney et al.dicted increases in global air temperatures as well as 1979; Boyer 1982), it is important to quantify the effectsshifts in regional scale precipitation patterns (Hansen and possible interactions of water management practiceset al. 1988; Manabe & Wetherald 1987; Wilson & Mitchell with [CO2] upon major food crops such as rice.1987). Although model results suggest that increasing Carbon dioxide enrichment has been shown to
increase growth by stimulating tillering in both wheat(Gifford 1977; Sionit et al. 1980, 1981a,b) and rice (ImaiCorrespondence: J. T. Baker, tel. 11/903-834-6191, fax 11/903-
831-7140, e-mail [email protected]. & Murata 1976, 1979a,b; Imai et al. 1985; Baker et al.
© 1997 Blackwell Science Ltd. 119
120 J . T . B A K E R et al.
1990a; Ziska & Teramura 1992). This increased tillering Materials and methodsis often associated with increased grain yield underCO2 enrichment due to the production of more spikes Controlled environment chambersin wheat (Triticum aestivum L.) (Gifford 1977; Sionit
Rice (cv. IR-72) plants were grown season-long in eightet al. 1980, 1981a,b) or panicles in rice (Imai et al. 1985;
naturally sunlit Soil-Plant-Atmosphere-Research (SPAR)Baker et al. 1990a, 1993). Comparing the grain yields
chambers at ambient (350 µmol mol–1, four chambers) andof rice grown season-long in [CO2] ranging from 160
elevated (700 µmol mol–1, four chambers) atmosphericto 900 µmol CO2 mol–1 air, Baker et al. (1990a) reported
carbon dioxide concentration ([CO2]) treatments. Thesethat grain yields in the 160 µmol mol–1 26% lower
chambers were constructed of an aluminium frame, can-than yield in the 330 µmol mol–1, while doubling the
opy zone tops covered with transparent polyethylene[CO2] from 330 to 660 µmol mol–1 increased grain yield
telephtalate ‘Sixlight’ film (Taiyo Kogyo Co., Tokyo)1.by 32%.
Above ground chamber dimensions were 2.0 3 1.0 m inRice is grown under more diverse environmental
cross section by 1.5 m in height. Each chamber topconditions than any other major food crop. Rice is
was attached to a lysimeter constructed of aluminiumcultivated over a considerable geographical range from
measuring 2.0 3 1.0 m in cross section and 0.6 m deep,roughly 53° N (Moormann & Breeman 1978) to 40° S
to provide a water-tight, flooded root environment forand to elevations of more than 2500 m (Grist 1986).
growing rice in paddy culture. Soil filled each lysimeterRice is generally classified into four broad categories
to a depth of 0.5 m and paddy flood water depth wasdepending on soil and water habitat: irrigated or paddy
maintained at 50 mm above the soil surface using a float-grown rice, lowland rainfed rice, upland rice, and
actuated water valve to supply deionized water to eachdeep-water rice. Of the total of 140–145 million hectares
soil lysimeter. The main chamber dimensions wereof land area planted to rice annually, roughly half or
2.0 3 1.0 m in cross-section with a north-to-south slopingabout 53% is grown as irrigated, flooded paddy rice,
top that averaged 1.4 m in height, for a volume of 2.8 m3.one-fourth as rainfed lowland rice, 10–14% as upland
The 0.05 m space above the flood water provided anrice and about 6% as deep-water rice (IRRI 1975, 1982,
additional 0.1 m of aerial volume and the air handling1984). Drought caused by uncertain monsoonal rainfall
ductwork had a volume of 0.3 m3. In 1993, the full-wallfrequently reduces rice plant populations and final
doors of the south sides of each chamber were replacedyield (IRRI 1975). Excluding irrigated rice, about half
with an access compartment that averaged 1.2 m inof the world’s rice land area depends on rainfall and
height with a 2.0 3 0.5 m base, which provided 1.2 m3is often subjected to drought stress (O’Toole & Moya
of additional chamber volume. All together, the total1978; IRRI 1982).
aerial volume of each chamber was 4.4 m3. The calculatedRice is physiologically, morphologically and anatomic-
air exchange rate was 2.7 chamber volumes per minute.ally adapted to grow in wet or flooded soil conditions.
Air was circulated from top to bottom within eachThe degree of rice grain yield reduction caused by
chamber using fans located in external ducting. Exit ductdrought stress depends on the severity and duration
air velocity was 3 m s–1. Chamber dry bulb air temperatureof the stress and is strongly influenced by the particular
was measured with an aspirated, shielded thermocoupledevelopmental stage during which the stress occurs. In
suspended 0.3 m above the canopy. Dew point air temper-terms of final seed yield, the vegetative phase of
ature was measured in the exit duct air stream with adevelopment is far less sensitive to drought than
dew point hygrometer (Dew-10, General Eastman Instru-reproductive development (O’Toole & Moya 1981).
ments). Each chamber [CO2] was monitored with aWorkers at the International Rice Research Institute
dedicated infrared gas analyser (Siemens, Ultramat 22P).(IRRI) have conducted drought stress studies and
The air handling system, located in the external ductingranked the sensitivity of rice reproductive growth stages
contained cold- and hot-water heat exchangers and anin terms of yield reduction or sensitivity to drought in
electrical resistive-heat coil to control dew point and drythe following order: (i) flowering, (ii) gametogenesis,
bulb air temperatures. Cold (4–8 °C*) and hot (45–50 °C*)(iii) panicle initiation, and (iv) grain fill (IRRI 1982).
water was supplied to heat exchangers using a propor-Studies designed to determine the effects of elevated
tional controller to regulate valve position and adjust the[CO2] on the physiological responses of rice to soil water
temperature of the heat exchangers. Dew point wasavailability have not been conducted. The objectives of
controlled to 18/12° (day/night) using the cold-waterthis study were to quantify the effects and possibleinteractions of elevated [CO2] and drought stress 1Mention of this or other proprietary products is for the conveni-imposed at panicle initiation, anthesis and both panicle ence of the readers only, and does not constitute endorsementinitiation and anthesis on rice growth, grain yield and or preferential treatment of these products by USDA-ARS or the
University of Florida.yield components.
© 1997 Blackwell Science Ltd., Global Change Biology, 3, 119–128
R I C E G R O W T H U N D E R D R O U G H T A N D E L E VA T E D C O 2 121
heat exchanger to remove excess humidity. Dry bulb air separately for leaf laminae, stems including leaf sheaths,and panicles after oven drying at 70 °C* for 48 h.temperature was controlled to 28/21 °C* (day/night) by
reheating the air, as needed, using the hot-water heat At final harvest, growth attributes of each of 15 plantsfrom each of three rows (45 plants total) from eachexchanger and an electrical resistive-heat coil. Chamber
[CO2] was maintained by supplying pure CO2 from a chamber were measured as previously described. Inaddition, panicle weight, grain weight, and grain numbercompressed CO2 gas cylinder to mass flow controllers
located in the external ducting of each chamber. Chamber were determined after oven drying and threshing eachindividual panicle. Due to differences among the [CO2]dew point temperature, dry bulb air temperature and
[CO2] were measured every 2 s and averaged and and drought stress treatments in days to physiologicalmaturity, plants were sampled for final harvest from 128recorded every 300 s. Specific methods for controlling
chamber environmental set points (hardware, control to 134 DAP.algorithms) as well as the quality of those environmentalcontrols are given by Pickering et al. (1994).
Drought stress treatments
Since seed yield response of rice to drought stress dependsPlant culture
on growth stage (IRRI 1982) the following water manage-ment treatments were selected: continuously floodedThe rice cultivar used in this experiment (cv. IR-72) is
grown throughout South-east Asia. In order to avoid (CF) controls, drought imposed at panicle initiation (PI),drought imposed at anthesis (ANT) and drought imposedphysiological complications in this experiment arising
from ‘transplanting shock’ associated with transplanting at both panicle initiation and anthesis (PI & ANT). ThePI & ANT treatment was included to test for possibleyoung rice plants into a hill arrangement and to ensure
a sufficient plant population for later destructive sam- acclimation effects to drought at anthesis resulting frompre-treatment to drought at panicle initiation. In all casesplings, the rice in this experiment was direct seeded by
hand into 11 rows 0.18 m apart in each chamber on 15 drought treatments were imposed by shutting off thepaddy water supply and unplugging the base of theJuly 1994. The plants were thinned to 200 plants m–2,
and flood water was applied on 20 July 1994. Shades lysimeter to drain the soil.Since both [CO2] and drought stress can affect themade of black, densely woven, polypropylene fibres were
maintained at canopy height along the outside of each timing of developmental stages (Kimball et al. 1995)careful attention was paid to phenological developmentchamber to provide a light environment similar to that
found created by border rows in a field crop. of the plants in each chamber. To identify the date forthe beginning of the PI droughts, five mainstem tillersOn 20 July, prior to flooding, the soil in each chamber
was fertilized with P and K at a rate of 9.0 g m–2. Nitrogen were sampled twice weekly beginning at 38 DAP fromboth [CO2] treatments. These mainstems were dissectedas urea was applied at 16.5 g N m–2 four times during
the growing season at 17, 38, 76 and 95 days after planting and observed under a binocular microscope using thefigures and plates given by Senanayake et al. (1991) as a(DAP). The soil used was the top soil from a Kendrick
fine sand (a member of the loamy, siliceous, hyperthermic, guide. The PI drought was initiated at 59 DAP (Table 1)near primary branch primordia differentiation as definedfamily of Arenic Paleudults).by Senanayake et al. (1991) in their Fig. 3.
To determine the appropriate date for the beginningGrowth and yield measurements
of the anthesis drought, the canopies in each chamberwere observed daily for panicle appearance. Since ricePlants were destructively sampled at 19, 32, 52, 80, and
96 DAP. In order to avoid the effects of a constantly flowers shortly after panicle appearance, the ANTdroughts were begun on the day the first panicle haddeclining plant population on measured growth and
yield attributes as a result of the destructive sampling, appeared in a particular chamber previously designatedfor an anthesis drought. Previous experiments with bothrows adjacent to the randomly predetermined sampling
positions were treated as border rows and left undis- IR-30 (Baker et al. 1989) and IR-72, in these chambers(Baker et al. 1994) have shown that the duration of panicleturbed throughout the growing season. At 19 and 32
DAP, seven plants were sampled while at 52, 80, and 96 appearance, from the first to the last panicle, ranges from2 to 3 weeks depending on temperature treatment.DAP 20 plants were sampled from each chamber. Each
sampled plant was detached at ground level and the Our goal in this experiment was to impose similarlevels of physiological stress rather than similar durationsnumber of living leaves, tillers, and panicles, when
present, were counted. Laminar area per plant was meas- of stress. Two primary factors that influenced the rate ofwater loss from the soil in this experiment were theured photometrically with a leaf area meter (LI-COR,
LI-3000, Lincoln, NE). Dry weights were determined amount of incident solar radiation, which varied widely
© 1997 Blackwell Science Ltd., Global Change Biology, 3, 119–128
122 J . T . B A K E R et al.
Table 1 Timing of lysimeter drainage, reflooding and drought durations for drought stress treatments imposed near panicle initiationand anthesis under two [CO2] and four water management treatments.
Panicle initiation Anthesis
Water Lysimeter Lysimeter Lysimeter LysimeterDrought [CO2] treatment1 drained reflooded Duration Drought drained reflooded Duration
µmol mol–1 – – – – – – DAP – – – – (d) – – – – – – DAP – – – – (d)
350 CFPI 59 76 17Ant. 95 112 17PI & Ant. 59 76 17 98 113 15
700 CFPI 59 78 19Ant. 95 112 17PI & Ant. 59 77 18 98 117 19
1CF, Continuously flooded; PI, drought at panicle initiation; Ant., drought at anthesis; PI & Ant., drought at both panicle initiationand anthesis.
at three separate locations within each chamber subjectedto drought. For the PI drought, soil moisture was meas-ured in all four chambers subjected to drought at 76 DAPprior to reflooding the 350 [CO2] treatments. For the ANTdrought, soil moisture was measured at the terminationof the drought, just prior to reflooding (Table 1). Addition-ally, soil tensiometers were installed at a depth of 0.3 mat 61 DAP to monitor soil water tension at 300 s intervalsduring the PI drought cycle.
Statistical analysis
Where possible, prior to the ANT drought stress treat-ments, means and standard errors were calculated forthe plant parameters measured during the destructivesamplings using replicated chambers. This resulted in
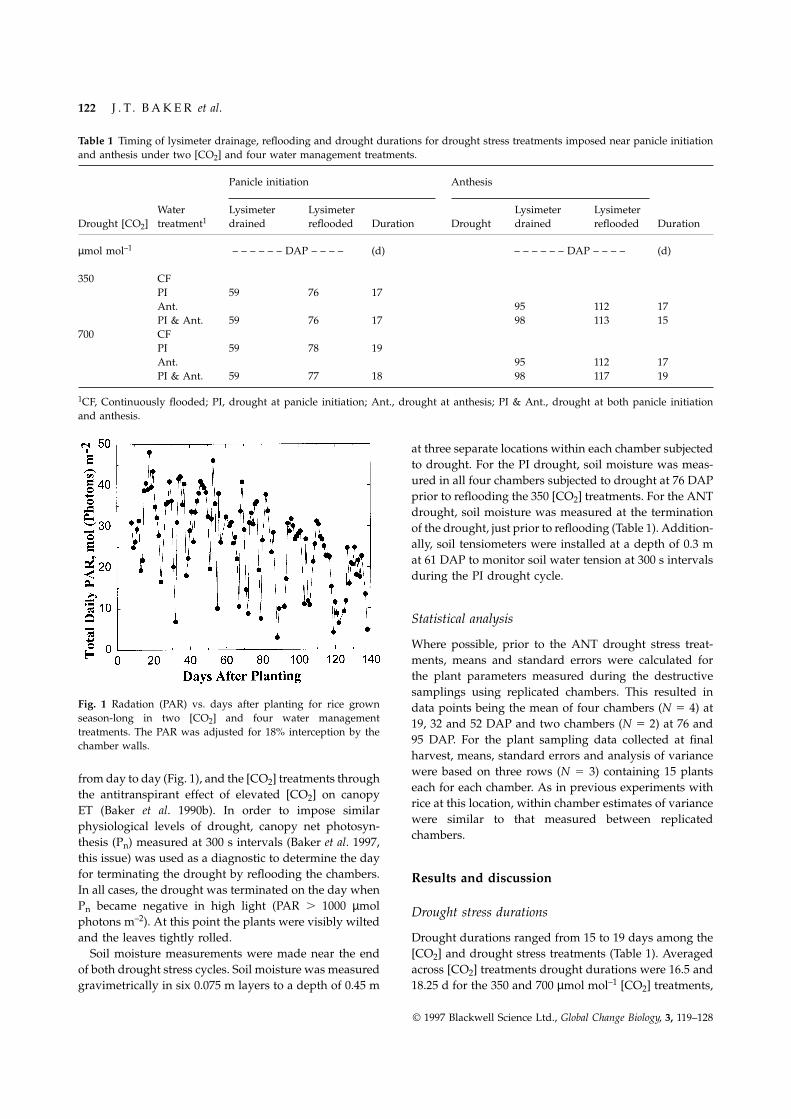
Fig. 1 Radation (PAR) vs. days after planting for rice grown data points being the mean of four chambers (N 5 4) atseason-long in two [CO2] and four water management 19, 32 and 52 DAP and two chambers (N 5 2) at 76 andtreatments. The PAR was adjusted for 18% interception by the
95 DAP. For the plant sampling data collected at finalchamber walls.harvest, means, standard errors and analysis of variancewere based on three rows (N 5 3) containing 15 plantsfrom day to day (Fig. 1), and the [CO2] treatments througheach for each chamber. As in previous experiments withthe antitranspirant effect of elevated [CO2] on canopyrice at this location, within chamber estimates of varianceET (Baker et al. 1990b). In order to impose similarwere similar to that measured between replicatedphysiological levels of drought, canopy net photosyn-chambers.thesis (Pn) measured at 300 s intervals (Baker et al. 1997,
this issue) was used as a diagnostic to determine the dayfor terminating the drought by reflooding the chambers. Results and discussionIn all cases, the drought was terminated on the day whenPn became negative in high light (PAR . 1000 µmol Drought stress durationsphotons m–2). At this point the plants were visibly wiltedand the leaves tightly rolled. Drought durations ranged from 15 to 19 days among the
[CO2] and drought stress treatments (Table 1). AveragedSoil moisture measurements were made near the endof both drought stress cycles. Soil moisture was measured across [CO2] treatments drought durations were 16.5 and
18.25 d for the 350 and 700 µmol mol–1 [CO2] treatments,gravimetrically in six 0.075 m layers to a depth of 0.45 m
© 1997 Blackwell Science Ltd., Global Change Biology, 3, 119–128
R I C E G R O W T H U N D E R D R O U G H T A N D E L E VA T E D C O 2 123
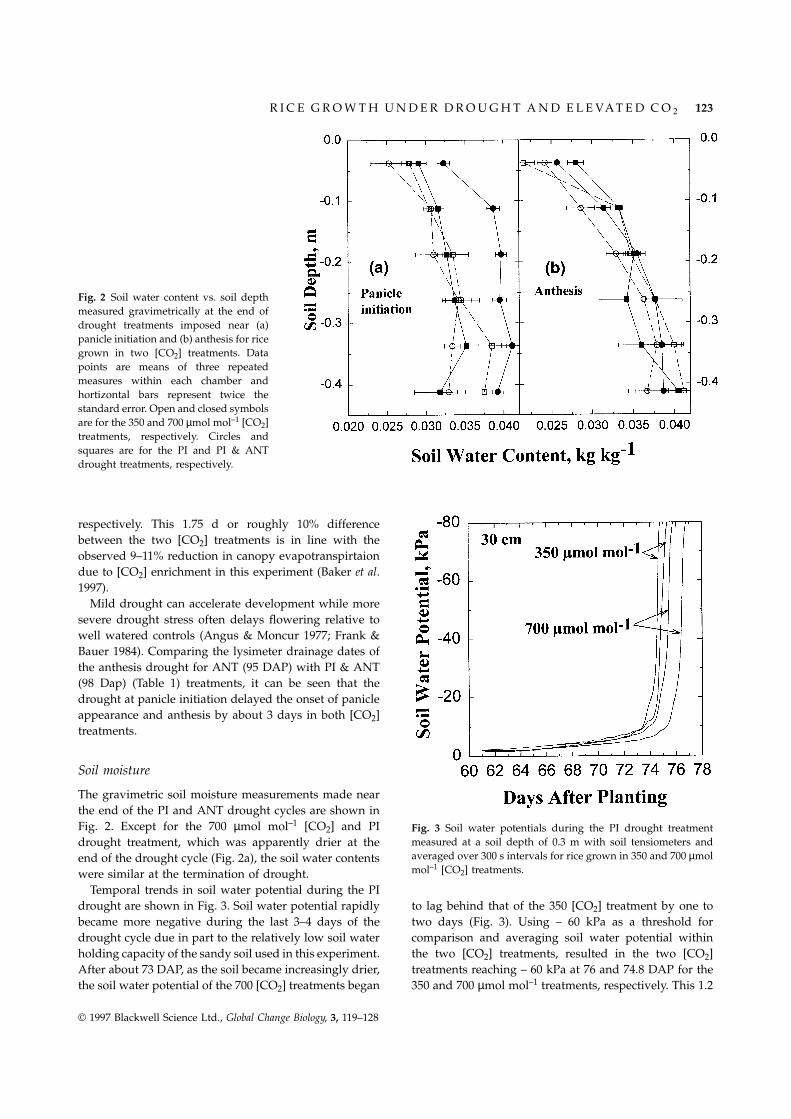
Fig. 2 Soil water content vs. soil depthmeasured gravimetrically at the end ofdrought treatments imposed near (a)panicle initiation and (b) anthesis for ricegrown in two [CO2] treatments. Datapoints are means of three repeatedmeasures within each chamber andhortizontal bars represent twice thestandard error. Open and closed symbolsare for the 350 and 700 µmol mol–1 [CO2]treatments, respectively. Circles andsquares are for the PI and PI & ANTdrought treatments, respectively.
respectively. This 1.75 d or roughly 10% differencebetween the two [CO2] treatments is in line with theobserved 9–11% reduction in canopy evapotranspirtaiondue to [CO2] enrichment in this experiment (Baker et al.1997).
Mild drought can accelerate development while moresevere drought stress often delays flowering relative towell watered controls (Angus & Moncur 1977; Frank &Bauer 1984). Comparing the lysimeter drainage dates ofthe anthesis drought for ANT (95 DAP) with PI & ANT(98 Dap) (Table 1) treatments, it can be seen that thedrought at panicle initiation delayed the onset of panicleappearance and anthesis by about 3 days in both [CO2]treatments.
Soil moisture
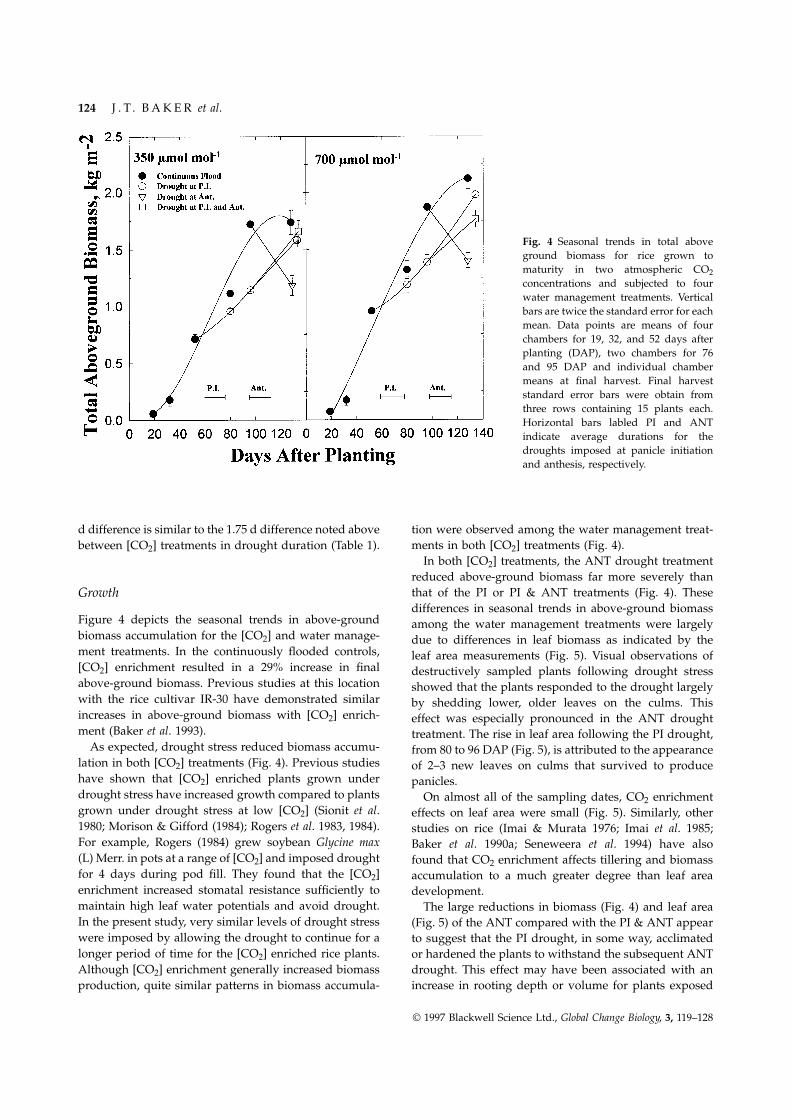
The gravimetric soil moisture measurements made nearthe end of the PI and ANT drought cycles are shown inFig. 2. Except for the 700 µmol mol–1 [CO2] and PI Fig. 3 Soil water potentials during the PI drought treatment
measured at a soil depth of 0.3 m with soil tensiometers anddrought treatment, which was apparently drier at theaveraged over 300 s intervals for rice grown in 350 and 700 µmolend of the drought cycle (Fig. 2a), the soil water contentsmol–1 [CO2] treatments.were similar at the termination of drought.
Temporal trends in soil water potential during the PIdrought are shown in Fig. 3. Soil water potential rapidly to lag behind that of the 350 [CO2] treatment by one to
two days (Fig. 3). Using – 60 kPa as a threshold forbecame more negative during the last 3–4 days of thedrought cycle due in part to the relatively low soil water comparison and averaging soil water potential within
the two [CO2] treatments, resulted in the two [CO2]holding capacity of the sandy soil used in this experiment.After about 73 DAP, as the soil became increasingly drier, treatments reaching – 60 kPa at 76 and 74.8 DAP for the
350 and 700 µmol mol–1 treatments, respectively. This 1.2the soil water potential of the 700 [CO2] treatments began
© 1997 Blackwell Science Ltd., Global Change Biology, 3, 119–128
124 J . T . B A K E R et al.
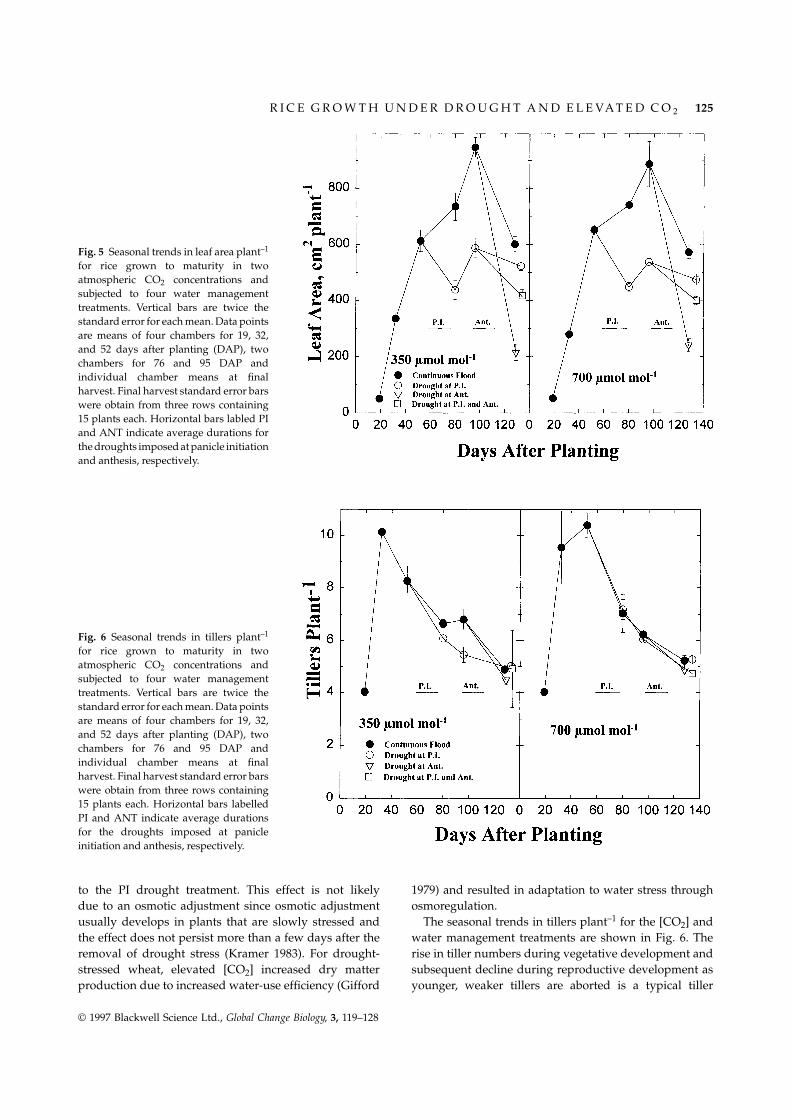
Fig. 4 Seasonal trends in total aboveground biomass for rice grown tomaturity in two atmospheric CO2concentrations and subjected to fourwater management treatments. Verticalbars are twice the standard error for eachmean. Data points are means of fourchambers for 19, 32, and 52 days afterplanting (DAP), two chambers for 76and 95 DAP and individual chambermeans at final harvest. Final harveststandard error bars were obtain fromthree rows containing 15 plants each.Horizontal bars labled PI and ANTindicate average durations for thedroughts imposed at panicle initiationand anthesis, respectively.
d difference is similar to the 1.75 d difference noted above tion were observed among the water management treat-ments in both [CO2] treatments (Fig. 4).between [CO2] treatments in drought duration (Table 1).
In both [CO2] treatments, the ANT drought treatmentreduced above-ground biomass far more severely thanthat of the PI or PI & ANT treatments (Fig. 4). TheseGrowthdifferences in seasonal trends in above-ground biomass
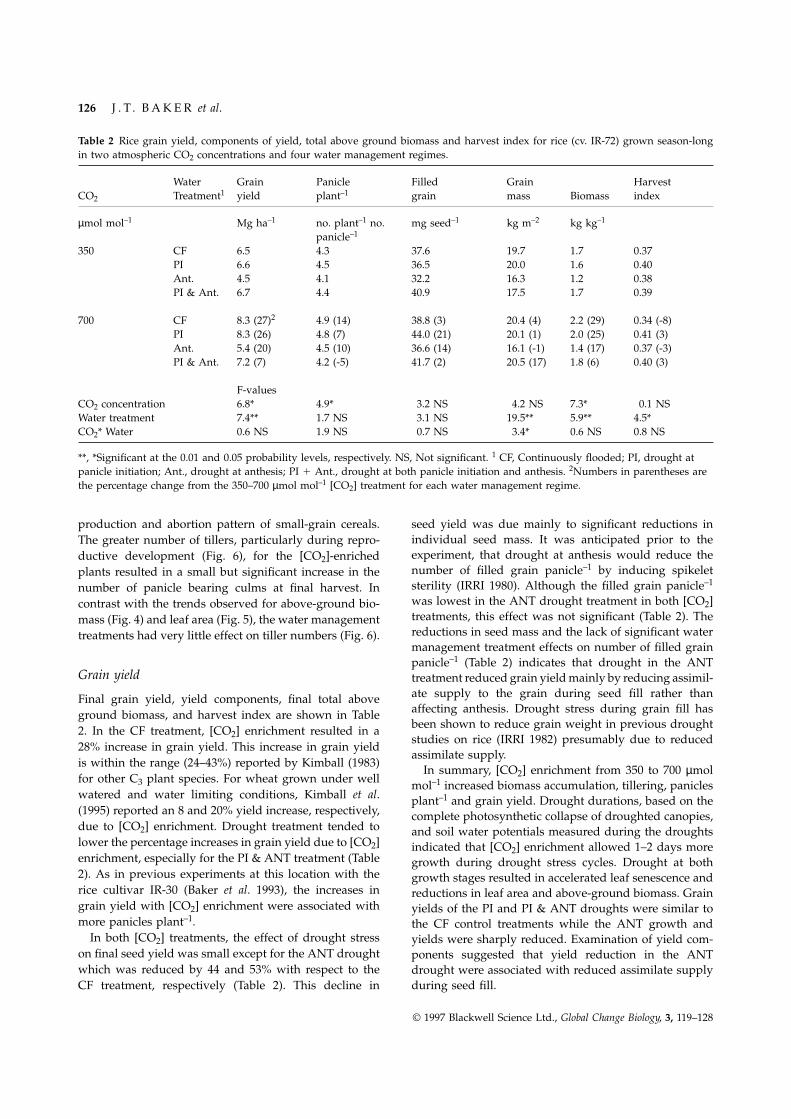
Figure 4 depicts the seasonal trends in above-ground among the water management treatments were largelybiomass accumulation for the [CO2] and water manage- due to differences in leaf biomass as indicated by thement treatments. In the continuously flooded controls, leaf area measurements (Fig. 5). Visual observations of[CO2] enrichment resulted in a 29% increase in final destructively sampled plants following drought stressabove-ground biomass. Previous studies at this location showed that the plants responded to the drought largelywith the rice cultivar IR-30 have demonstrated similar by shedding lower, older leaves on the culms. Thisincreases in above-ground biomass with [CO2] enrich- effect was especially pronounced in the ANT droughtment (Baker et al. 1993). treatment. The rise in leaf area following the PI drought,
As expected, drought stress reduced biomass accumu- from 80 to 96 DAP (Fig. 5), is attributed to the appearancelation in both [CO2] treatments (Fig. 4). Previous studies of 2–3 new leaves on culms that survived to producehave shown that [CO2] enriched plants grown under panicles.drought stress have increased growth compared to plants On almost all of the sampling dates, CO2 enrichmentgrown under drought stress at low [CO2] (Sionit et al. effects on leaf area were small (Fig. 5). Similarly, other1980; Morison & Gifford (1984); Rogers et al. 1983, 1984). studies on rice (Imai & Murata 1976; Imai et al. 1985;For example, Rogers (1984) grew soybean Glycine max Baker et al. 1990a; Seneweera et al. 1994) have also(L) Merr. in pots at a range of [CO2] and imposed drought found that CO2 enrichment affects tillering and biomassfor 4 days during pod fill. They found that the [CO2] accumulation to a much greater degree than leaf areaenrichment increased stomatal resistance sufficiently to development.maintain high leaf water potentials and avoid drought. The large reductions in biomass (Fig. 4) and leaf areaIn the present study, very similar levels of drought stress (Fig. 5) of the ANT compared with the PI & ANT appearwere imposed by allowing the drought to continue for a to suggest that the PI drought, in some way, acclimatedlonger period of time for the [CO2] enriched rice plants. or hardened the plants to withstand the subsequent ANTAlthough [CO2] enrichment generally increased biomass drought. This effect may have been associated with an
increase in rooting depth or volume for plants exposedproduction, quite similar patterns in biomass accumula-
© 1997 Blackwell Science Ltd., Global Change Biology, 3, 119–128
R I C E G R O W T H U N D E R D R O U G H T A N D E L E VA T E D C O 2 125
Fig. 5 Seasonal trends in leaf area plant–1
for rice grown to maturity in twoatmospheric CO2 concentrations andsubjected to four water managementtreatments. Vertical bars are twice thestandard error for each mean. Data pointsare means of four chambers for 19, 32,and 52 days after planting (DAP), twochambers for 76 and 95 DAP andindividual chamber means at finalharvest. Final harvest standard error barswere obtain from three rows containing15 plants each. Horizontal bars labled PIand ANT indicate average durations forthe droughts imposed at panicle initiationand anthesis, respectively.
Fig. 6 Seasonal trends in tillers plant–1
for rice grown to maturity in twoatmospheric CO2 concentrations andsubjected to four water managementtreatments. Vertical bars are twice thestandard error for each mean. Data pointsare means of four chambers for 19, 32,and 52 days after planting (DAP), twochambers for 76 and 95 DAP andindividual chamber means at finalharvest. Final harvest standard error barswere obtain from three rows containing15 plants each. Horizontal bars labelledPI and ANT indicate average durationsfor the droughts imposed at panicleinitiation and anthesis, respectively.
to the PI drought treatment. This effect is not likely 1979) and resulted in adaptation to water stress throughosmoregulation.due to an osmotic adjustment since osmotic adjustment
usually develops in plants that are slowly stressed and The seasonal trends in tillers plant–1 for the [CO2] andwater management treatments are shown in Fig. 6. Thethe effect does not persist more than a few days after the
removal of drought stress (Kramer 1983). For drought- rise in tiller numbers during vegetative development andsubsequent decline during reproductive development asstressed wheat, elevated [CO2] increased dry matter
production due to increased water-use efficiency (Gifford younger, weaker tillers are aborted is a typical tiller
© 1997 Blackwell Science Ltd., Global Change Biology, 3, 119–128
126 J . T . B A K E R et al.
Table 2 Rice grain yield, components of yield, total above ground biomass and harvest index for rice (cv. IR-72) grown season-longin two atmospheric CO2 concentrations and four water management regimes.
Water Grain Panicle Filled Grain HarvestCO2 Treatment1 yield plant–1 grain mass Biomass index
µmol mol–1 Mg ha–1 no. plant–1 no. mg seed–1 kg m–2 kg kg–1
panicle–1
350 CF 6.5 4.3 37.6 19.7 1.7 0.37PI 6.6 4.5 36.5 20.0 1.6 0.40Ant. 4.5 4.1 32.2 16.3 1.2 0.38PI & Ant. 6.7 4.4 40.9 17.5 1.7 0.39
700 CF 8.3 (27)2 4.9 (14) 38.8 (3) 20.4 (4) 2.2 (29) 0.34 (-8)PI 8.3 (26) 4.8 (7) 44.0 (21) 20.1 (1) 2.0 (25) 0.41 (3)Ant. 5.4 (20) 4.5 (10) 36.6 (14) 16.1 (-1) 1.4 (17) 0.37 (-3)PI & Ant. 7.2 (7) 4.2 (-5) 41.7 (2) 20.5 (17) 1.8 (6) 0.40 (3)
F-valuesCO2 concentration 6.8* 4.9* 3.2 NS 4.2 NS 7.3* 0.1 NSWater treatment 7.4** 1.7 NS 3.1 NS 19.5** 5.9** 4.5*CO2* Water 0.6 NS 1.9 NS 0.7 NS 3.4* 0.6 NS 0.8 NS
**, *Significant at the 0.01 and 0.05 probability levels, respectively. NS, Not significant. 1 CF, Continuously flooded; PI, drought atpanicle initiation; Ant., drought at anthesis; PI 1 Ant., drought at both panicle initiation and anthesis. 2Numbers in parentheses arethe percentage change from the 350–700 µmol mol–1 [CO2] treatment for each water management regime.
production and abortion pattern of small-grain cereals. seed yield was due mainly to significant reductions inindividual seed mass. It was anticipated prior to theThe greater number of tillers, particularly during repro-experiment, that drought at anthesis would reduce theductive development (Fig. 6), for the [CO2]-enrichednumber of filled grain panicle–1 by inducing spikeletplants resulted in a small but significant increase in thesterility (IRRI 1980). Although the filled grain panicle–1number of panicle bearing culms at final harvest. Inwas lowest in the ANT drought treatment in both [CO2]contrast with the trends observed for above-ground bio-treatments, this effect was not significant (Table 2). Themass (Fig. 4) and leaf area (Fig. 5), the water managementreductions in seed mass and the lack of significant watertreatments had very little effect on tiller numbers (Fig. 6).management treatment effects on number of filled grainpanicle–1 (Table 2) indicates that drought in the ANT
Grain yield treatment reduced grain yield mainly by reducing assimil-ate supply to the grain during seed fill rather thanFinal grain yield, yield components, final total aboveaffecting anthesis. Drought stress during grain fill hasground biomass, and harvest index are shown in Tablebeen shown to reduce grain weight in previous drought2. In the CF treatment, [CO2] enrichment resulted in astudies on rice (IRRI 1982) presumably due to reduced
28% increase in grain yield. This increase in grain yieldassimilate supply.
is within the range (24–43%) reported by Kimball (1983)In summary, [CO2] enrichment from 350 to 700 µmol
for other C3 plant species. For wheat grown under well mol–1 increased biomass accumulation, tillering, panicleswatered and water limiting conditions, Kimball et al. plant–1 and grain yield. Drought durations, based on the(1995) reported an 8 and 20% yield increase, respectively, complete photosynthetic collapse of droughted canopies,due to [CO2] enrichment. Drought treatment tended to and soil water potentials measured during the droughtslower the percentage increases in grain yield due to [CO2] indicated that [CO2] enrichment allowed 1–2 days moreenrichment, especially for the PI & ANT treatment (Table growth during drought stress cycles. Drought at both2). As in previous experiments at this location with the growth stages resulted in accelerated leaf senescence andrice cultivar IR-30 (Baker et al. 1993), the increases in reductions in leaf area and above-ground biomass. Graingrain yield with [CO2] enrichment were associated with yields of the PI and PI & ANT droughts were similar tomore panicles plant–1. the CF control treatments while the ANT growth and
In both [CO2] treatments, the effect of drought stress yields were sharply reduced. Examination of yield com-on final seed yield was small except for the ANT drought ponents suggested that yield reduction in the ANTwhich was reduced by 44 and 53% with respect to the drought were associated with reduced assimilate supply
during seed fill.CF treatment, respectively (Table 2). This decline in
© 1997 Blackwell Science Ltd., Global Change Biology, 3, 119–128
R I C E G R O W T H U N D E R D R O U G H T A N D E L E VA T E D C O 2 127
Photosynthesis and Evapotranspiration. Global Change Biology,These results indicate that future increases in atmo-3, 129–138.spheric [CO2] should have beneficial effects on rice
Boyer JS (1982) Plant productivity and environment. Science,growth and grain yield while allowing a modest increase218, 443–448.of about 10% in the window of opportunity for growth
Frank AB, Baur A (1984) Cultivar, nitrogen and soil water effectsduring drought. Even with [CO2] enrichment, yield reduc-on apex development in spring wheat. Agronomy Journal, 76,tions resulting from drought appear likely especially if656–660.
the drought is severe and occurs at particularly sensitiveGifford RM (1977) Growth pattern, carbon dioxide exchange,
growth stages such as anthesis and grain filling. and dry weight distribution in wheat growing under differingphotosynthetic environments. Australian Journal of PlantPhysiology, 4, 99–110.Acknowledgements
Gifford RM (1979) Growth and yield of CO2-enriched wheatThe authors acknowledge the support provided by the National under water-limited conditions. Australian Journal of PlantResearch Initiative Competitive Grants Program, USDA-CSRS, Physiology, 33, 317–345.project number 9401541, the US Environmental Protection Grist DH (1986) Rice (6th edn). Longman, London.Agency through Interagency Agreement No. DW129340991, and
Hansen J, Fung I, Lacis A, Lebedeff S, Rind D, Ruedy R, RussellUS Department of Energy, Carbon Dioxide Research Division
G, Stone P (1988) Global climate changes as forecast by thethrough Interagency Agreement NO. DE-AI05–88ER69014 andGISS 3-D model. Journal of Geophysical Research, 98 (08),DE-AI02–93ER61720. This work is a contribution of the Institute9341–9364.of Food and Agricultural Sciences (IFAS), University of Florida
Imai K, Murata Y (1976) Effect of carbon dioxide concentration(Florida Agriculture Expt. Stns. Journal Series no. R-05237), andthe Agricultural Research Service, US Department of Agriculture. on growth and dry matter production in crop plants. I. EffectsThe technical assistance of James Brown and Serge Edme is on leaf area, dry matter, tillering, dry matter distribution ratio,gratefully acknowledged. and transpiration. Japanese Journal of Crop Science, 45, 598–606.
Imai K, Murata Y (1979a) Effect of carbon dioxide concentrationon growth and dry matter production in crop plants. 6. EffectReferencesof oxygen concentration on the carbon dioxide-dry matterproduction relationship in some C3 and C4 crop species.Angus JF, Moncur MW (1977) Water stress and phenology inJapanese Journal of Crop Science, 48, 58–65.wheat. Australian Journal of Agricultural Research, 28, 177–181.
Imai K, Murata Y (1979b) Effect of carbon dioxide concentrationBaker JT, Allen Jr LH, Boote KJ, Rowland-Bamford AJ, Jones JW,on growth and dry matter production in crop plants. 7.Jones PH, Bowes G, Laugel F (1989) Response of Vegetation to
Carbon Dioxide – 053. Temperature and CO2 effects on rice. Influence of light intensity and temperature on the effect of1988. Joint Program of the Carbon Dioxide Research Division, carbon dioxide enrichment in some C3 and C4 species.U.S. Department of Energy, and the Agricultural Research Japanese Journal of Crop Science, 48, 409–417.Service, U.S. Department of Agriculture, in cooperation with Imai K, Coleman DF, Yanagisawa T (1985) Increase ofUniversity of Florida, Gainesville, 111 pp. atmospheric partial pressure of carbon dioxide and growth
Baker JT, Allen Jr LH, Boote KJ (1990a) Growth and yield and yield of rice (Oryza sativa L.). Japanese Journal of Cropresponses of rice to carbon dioxide concentration. Journal of Science, 54, 413–418.Agricultural Science (Cambridge), 115, 313–320. IRRI (International Rice Research Institute) (1975) Major Research
Baker JT, Allen Jr LH, Boote KJ, Jones P, Jones JW (1990b) in Upland Rice. Los Banos, Philippines.Rice photosynthesis and evapotranspiration in subambient, IRRI (1980) Annual Report for 1979. Los Banos, Philippines.ambient, and superambient carbon dioxide concentrations. IRRI (1982) Drought Resistance in Crops with Emphasis on Rice.Agronomy Journal, 82, 834–840. Los Banos, Philippines.
Baker JT, Allen Jr LH, (1993) Effects of CO2 and Temperature IRRI (1984) An Overview of Upland Rice Research. Proceedings ofon Rice: A Summary of Five Growing Seasons. Journal of the 1982 Bouake, Ivory Coast Upland Rice Workshop. Los Banos,Agricultural Meteorology, 48 (5), 575–582. Philippines.
Baker JT, Albrecht SL, Pan Deyun, Allen Jr LH, Pickering NB, Keeling CD, Whorf TP, Wahlen M, van der Plicht J (1995)Boote KJ (1994) Carbon dioxide and temperature effects on Interannual extremes in the rate of rise of atmospheric carbonrice (Oryza sativa L., cv. IR-72). Soil and Crop Science Society dioxide since 1980. Nature, 375, 660–670.of Florida, Proceedings, 50, 90–97. Kimball BA (1983) Carbon Dioxide and agricultural yield: An
Baker JT, Allen Jr LH, Boote KJ, Pickering NB (1997) Rice assemblage of 430 prior observations. Agronomy Journal, 75,responses to drought under carbon dioxide enrichment: II. 779–788.
Kimball BA, Pinter Jr PJ, Garcia RL, LaMorte RL, Wall GA,Hunsaker DJ, Wechsung G, Wechsung F, Kartschall T (1995)1Although the research described in this article has been fundedProductivity and water use of wheat under free-air CO2in part by the U.S. Environmental Protection Agency underenrichment. Global Change Biology, 1, 429–442.interagency agreement number DW12934099 to the U.S.D.A./
Kramer PJ (1983) Water Relations of Plants. Academic Press,A.R.S., it has not been subject to the Agency’s review andNew York.therefore does not necessarily reflect the views of the Agency,
and no official indorsement should be inferred. Manabe S, Wetherald RT (1987) Large-scale changes of soil
© 1997 Blackwell Science Ltd., Global Change Biology, 3, 119–128
128 J . T . B A K E R et al.
wetness induced by an increase in atmospheric carbon differences detected by electron microscopy. AgronomyJournal, 83, 1013–1023.dioxide. Journal of Atmospheric Science, 44, 1211–1235.
Mauney JR, Guinn G, Fry KE, Hesketh JD (1979) Correlation Seneweera S, Milham P, Conroy J (1994) Influence of elevatedCO2 and phosphorous nutrition on the growth and yield ofof photosynthetic carbon dioxide uptake and carbohydrate
accumulation in cotton, soybean, sorghum, and sunflower. short-duration rice (Oryza sativa L. cv. Jarrah). AustralianJournal of Plant Physiology, 21, 281–292.Photosynthetica, 13, 260–266.
Mooreman FR, van Breeman N (1978) Rice: soil, water, land. IRRI, Sionit N, Hellmers H, Strain BR (1980) Growth and yield ofwheat under CO2 enrichment and water stress. Crop Science,Los Banos, Philippines.
Morison JIL Gifford RM (1984) Plant growth and water use with 20, 687–690.Sionit N, Strain BR, Hellmers H (1981a) Effects of differentlimited water supply in high CO2 concentrations. I. Leaf
area, water use and transpiration. Australian Journal of Plant concentrations of atmospheric CO2 on growth and yieldcomponents of wheat. Japanese Journal of Crop Science, 79,Physiology, 11, 361–374.
O’Toole JC, Moya TB (1978) Genotypic variation in maintenance 335–339.Sionit N, Mortensen DA, Strain BR, Hellmers H (1981b) Growthof leaf water potential in rice. Crop Science, 18, 873–876.
O’Toole JC, Moya TB (1981) Water deficits and yield in upland response of wheat to CO2 enrichment and different levels ofmineral nutrition. Agronomy Journal, 73, 1023–1027.rice. Field Crops Research, 4, 247–259.
Pickering NB, Allen Jr LH, Albrecht SL, Jones P, Jones JW, Trabalka JR, Edmonds JA, Reilly JM, Gardner RH, Reichle DE(1986) Atmospheric CO2 projections with globally averagedBaker JT (1994) Environmental plant chambers: Control and
measurement using CR-10T dataloggers. In: Computers in carbon cycle models. In: The Changing Carbon Cycle a GlobalAnalysis (eds Trabalka JR, Reichle DE), pp. 534–560. Springer-Agriculture (eds Watson DG, Zazueta FS, Harrison TV),
pp. 29–35. Proceedings of the 5th International Conference, Verlag, Berlin.Wilson CA, Mitchell JFB (1987) A doubled CO2 climate sensitivityOrlando, Florida, Feb. 5–9. American Society of Agricultural
Engineers, St. Joseph, Michigan. experiment with a global climate model, including a simpleocean. Journal of Geophysical Research, 92, 13315–13343.Rogers HH, Bingham GE, Cure JD, Smith JM, Surano KA (1983)
Response of selected plant species to elevated carbon dioxide Wigley TML, Jones PD, Kelly PM(1980) Scenario for a warm,high-CO2 world. Nature, 283, 17–21.in the field. Journal of Environmental Quality, 12, 569–574.
Rogers HH, Sionit N, Cure JD, Smith JM, Bingham GE (1984) Wigley TML, Jones PD, Kelly PM (1986) Empirical climatestudies. Warm world scenarios and the detection of climaticInfluence of elevated carbon dioxide on water relations of
soybeans. Plant Physiology, 74, 233–238. change induced by radiatively active gases. In: The GreenhouseEffect; Climate Change and Ecosystems (eds Bolin B, Doos BR,Rotty RM, Marland G (1986) Fossil fuel combustion: Recent
amounts, patterns, and trends of CO2. In: The Changing Carbon Joger J, Warrick RA), pp. 271–322. John Wiley, New York.Ziska LH, Teramura AH (1992) Interspecific variation in theCycle a Global Analysis (eds Trabalka JR, Reichle DE), pp. 474–
490. Springer-Verlag, Berlin. response of rice (Oryza sativa) to increased CO2 –photosynthetic, biomass and reproductive characteristics.Senanayake SK, De Datta SK, Naylor REL Thompson WJ (1991)
Lowland rice apical development: stages and cultivar Physiologica Planta, 84, 269–274.
© 1997 Blackwell Science Ltd., Global Change Biology, 3, 119–128
Related Documents