1 Rice post-distribution Report and baseline profile of beneficiaries Part of FAO’s Haiyan Response Philippines Donors and project codes: OSRO/PHI/301/IRE OSRO/PHI/302/BEL OSRO/PHI/303/CHA OSRO/PHI/306/SWI OSRO/PHI/307/ITA OSRO/PHI/308/NOR TCP/PHI/3405 Manila, Philippines, January 2014

Welcome message from author
This document is posted to help you gain knowledge. Please leave a comment to let me know what you think about it! Share it to your friends and learn new things together.
Transcript
1
Rice post-distribution Report
and baseline profile of beneficiaries
Part of FAO’s Haiyan Response
Philippines
Donors and project codes: OSRO/PHI/301/IRE
OSRO/PHI/302/BEL
OSRO/PHI/303/CHA
OSRO/PHI/306/SWI
OSRO/PHI/307/ITA
OSRO/PHI/308/NOR
TCP/PHI/3405
Manila, Philippines,
January 2014
2
1. Table of content
1. Table of content .................................................................................................................. 2
2. Table of figures and tables ................................................................................................. 3
3. Executive summary ............................................................................................................ 5
4. Background information .................................................................................................... 6
4.1.1. General country and sector vulnerability context .................................................. 6
4.1.2. Disaster/crisis context ............................................................................................ 6
4.2. The programme .......................................................................................................... 7
4.2.1. Problems / Issues to be addressed .......................................................................... 7
4.2.2. Stakeholders and Target Beneficiaries ................................................................... 7
4.2.3. Programme justification ......................................................................................... 7
4.2.4. Donors .................................................................................................................... 7
4.2.5. Programme key objectives ..................................................................................... 8
4.2.6. Programme expected outputs ................................................................................. 8
4.3. The Rice package intervention ................................................................................... 8
4.3.1. Programme implementation ................................................................................... 8
4.3.2. Criteria of selection: ............................................................................................... 9
4.3.3. Content of input packages ...................................................................................... 9
4.3.4. The locations of intervention and implementing partners .................................... 10
5. The survey ........................................................................................................................ 11
5.1. Methodology ............................................................................................................ 11
5.2. Scope and reliability of the survey’s data ................................................................ 11
6. Characteristics of the household, livelihoods and practices ............................................. 13
6.1. General aspects of the households ........................................................................... 13
6.2. Socio-economical profile ......................................................................................... 15
6.3. Fishing ...................................................................................................................... 16
6.4. Agriculture and livestock ......................................................................................... 17
6.4.1. Irrigation ............................................................................................................... 21
6.4.2. Agriculture practices ............................................................................................ 21
6.4.3. Post harvest storage .............................................................................................. 24
6.5. Food security and diversity ...................................................................................... 25
6.6. Coping mechanisms ................................................................................................. 26
7. Feedback on the received FAO assistance and distribution process ................................ 28
7.1. Utilization of the received assistance and estimated production .............................. 28
7.2. Aspects of the Accountability to Affected Population ............................................. 30
8. Non-FAO Assistance ........................................................................................................ 34
8.1. Non-FAO assistance received .................................................................................. 34
9. Outstanding needs ............................................................................................................ 36
10. Annex ........................................................................................................................... 37
10.1. Location of rice package distributions, Municipality level .................................. 37
10.2. Rice post distribution survey questionnaire ......................................................... 39
10.3. Locations of rice post distribution survey ............................................................ 45
10.4. Value for money calculation for rice seed intervention ....................................... 46
10.5. Province specific datasets ..................................................................................... 47
3
2. Table of figures and tables
Figure 1 Shares of financial contributions by donor ............................................................ 8
Figure 2 Type of respondents ................................................................................................ 13
Figure 3 Share of vulnerable head of households ................................................................ 13
Figure 4 Type of community based organisations ............................................................... 14
Figure 5 Main livelihood activities before and three months after the typhoon .............. 15
Figure 6 Boat ownership and crew hiring share ................................................................. 16
Figure 7 Livestock owning households and their actual and pre typhoon numbers ....... 20
Figure 8 Sources of irrigation water ..................................................................................... 21
Figure 9 Types of rice seeds used pre typhoon, by region .................................................. 21
Figure 10 Method used for of rice field land preparation .................................................. 22
Figure 11 Planting methods of by region ............................................................................. 22
Figure 12 Sowing, type of nursery and transplanting methods used region specific ....... 23
Figure 13 Ways of fertilizer application ............................................................................... 24
Figure 14 Methods of storage used ....................................................................................... 25
Figure 15 Origin of the different food groups ..................................................................... 26
Figure 16 Frequency of coping mechanisms used ............................................................... 27
Figure 17 Rating of quality and usefulness of the received inputs by region ................... 28
Figure 18 Rating of rice seeds quality parameters .............................................................. 29
Figure 19 Source of information on distribution ................................................................. 31
Figure 20 Rating of distribution process .............................................................................. 31
Figure 21 Other information needs ...................................................................................... 32
Figure 22 Important types of information ........................................................................... 32
Figure 23 Preferred source of information .......................................................................... 33
Figure 24 Main Non-FAO assistance received .................................................................... 34
Figure 25 Sources of non-FAO assistance ............................................................................ 34
Figure 26 Ratings of non-FAO assistance ............................................................................ 35
Figure 27 Main short / medium term needs for Region specific ........................................ 36
Table 1 Locations of intervention and number of beneficiaries by province ................... 10
Table 2 Composition of households and age of head of household, by province .............. 14
Table 3 Actual indebtedness status, region specific ............................................................ 15
Table 4 Boats and engines before typhoon and three months after .................................. 16
Table 5 Number of fishing gear before, % lost and three months after and still needed to
obtain full set ................................................................................................................... 17
Table 6 Area of fish or shrimp farms and areas partially or totally destroyed ................ 17
Table 7 Average area per household by land tenure type .................................................. 17
Table 8 Households shares specified by land tenure agreements ...................................... 18
Table 9 Total planted area and partially or totally destroyed share, crop specific ......... 18
Table 10 Utilization of own production, crop or produce specific ..................................... 19
Table 11 Agriculture asset before typhoon and three months after .................................. 19
Table 12 Average income generated form sold animals since the typhoon ...................... 20
Table 13 Additional fertilizer quantity, area and frequency, region specific ................... 24
Table 14 Actual meals per day gender and age specific ..................................................... 25
Table 15 Frequency of food group intake ............................................................................ 25
Table 16 Utilization of received inputs ................................................................................. 28
Table 17 Quantity of rice seeds, % planted and expected rice yield per household ........ 30
Table 18 Composition of the households and ages of household head and spouse .......... 47
Table 19 Social network or membership of specific groups ............................................... 47
Table 20 Fishing parameters ................................................................................................. 47
4
Table 21 Land type and land tenure and sharing of harvest ............................................. 48
Table 22 Crops planted and area under cultivation per household .................................. 48
Table 23 Level of destruction of various crops cultivated before the typhoon ................. 48
Table 24 Type of animals before and actual ........................................................................ 49
Table 25 Animals sold since the typhoon and income generated ....................................... 49
Table 26 Farm assets before and actual functionning ........................................................ 49
Table 27 Agriculture practice parameters ........................................................................... 50
Table 28 Fishing assets before and actual ............................................................................ 51
Table 29 Meals eaten by age groups before and actual ...................................................... 51
Table 30 Frequency of food groups intake actual ............................................................... 52
Table 31 Use of coping mechanisms over the last month ................................................... 52
Table 32 Level of indebtedness before and new credits taken since typhoon ................... 53
Table 33 Utilization of FAO rice seed assistance ................................................................. 53
Table 34 Main short-term needs ........................................................................................... 54
Table 35 Main medium-term needs ...................................................................................... 54
5
3. Executive summary
On the morning of November 8, 2013, Category 5 Typhoon Haiyan (locally known as Yolanda) made
a direct hit on the Philippines; devastating areas in 36 provinces with its strong winds, massive rain
fall and storm surges. Many cities and towns experienced widespread destruction, with as much as 90
percent of housing destroyed in some areas. Roads were blocked, airports and seaports impaired;
heavy ships were thrown inland. Water supplies and power are cut; much of the food stocks and other
goods are destroyed; many health facilities are not functioning. An estimated 14.1 million people in
nine regions are affected. A state of national calamity was declared three days after the typhoon roared
across the central Philippines to expedite the government’s rescue, relief and rehabilitation efforts in
provinces devastated by the typhoon.
Among the different responses implemented by FAO was the rice seeds package distribution funded
by seven donors (CERF, Ireland, Belgium, FAO, Switzerland, Italy and Norway) with a total
contribution of US$4,105,945.
The programme goal is to restore food and nutrition security as well as agriculture-based livelihoods
of typhoon-affected farming households through the emergency distribution of key agricultural inputs
for the upcoming cropping season in Region VI and VIII.
Major direct results of the intervention are as follows: A total of 43 659 households are now able to
cover their basic staple food needs from the obtained production and generate some surplus for
marketing from the received wheat seeds and fertilizer packages.
The main outcomes of the rice post distribution surveys related to FAO’s intervention are:
Overall 94 percent of the beneficiaries have received the expected quantities on inputs.
85 percent of the seeds and 69 percent of the fertilizer were used up to the moment when the
survey was conducted, covering an area of 0.8 ha on average.
Taking into account the percentage of seeds planted and the seeding rate used, an estimated
milled rice production of 1,760 kg per household is expected from distributed rice seed
packages. This is somewhat below the expected 3,450 Kg / Ha paddy yield (resulting in 2,070
kg milled rice yield per hectare) mainly due to the fact that on average 85 percent of the seeds
were planted and over a larger area as expected. The final production results will be obtained
during the harvest period, where a crop cutting survey is foreseen to be conducted and a post
harvest survey.
The resulting harvest is enough to ensure the self-sufficiency in rice (750 kg) for each
household of 5 members as well as offering potential to generate income from the surplus.
The surplus varies for those households who have to give a share of the harvest to land-
owners if in a share cropping (around 45 percent) or tenancy agreement (around 30 percent).
The main APP outcomes are:
o Overall high level of satisfaction on the received inputs and good rating on their quality and
usefulness.
o Around 24 percent reported that not all affected population received assistance, mainly due
to the fact that the assistance was not enough to cover.
o Some 11 percent reported that they had to pay around 15 to 30 Philippine Pesos to obtain the
assistance. This is justified as it was a contribution to cover the transport either from the
DAs regional warehouse to the municipality or a commonly arranged transport from the
municipality to the Barangay.
A profile of the benefiting households have been obtained, recording a large amount of indicators
covering agriculture and fishery assets, agriculture practices, food security and coping mechanisms,
which will serve as a baseline for the impact or outcome measurement. In addition also a better
knowledge on the actual agricultural practices in the rice crop production has been obtained.
6
4. Background information
4.1.1. General country and sector vulnerability context
The Philippines is highly susceptible and vulnerable to natural disasters with an average of 20
typhoons per year, of which five are predicted to cause significant damage. On the morning of
8 November 2013, Category 5 Typhoon Haiyan made a direct hit on the Philippines, a densely
populated country of 92 million people, devastating areas in 36 provinces. Typhoon Haiyan is
possibly the most powerful storm ever recorded to hit land.
Typhoon Haiyan made first landfall at Guiuan, Eastern Samar province, with wind speeds of
235 km/h and gusts of 275 km/hr. Rain fell at rates of up to 30 mm per hour and massive
storm surges more than six meters high hit Leyte and Samar islands. Many cities and towns
experienced widespread destruction, with as much as 90 percent of housing were destroyed in
some areas. Roads were blocked, and airports and seaports impaired; heavy ships have been
thrown inland. Water supplies and power were and are still in many places cut; much of the
food stocks and other goods were destroyed; many health facilities were not functioning and
medical supplies were quickly being exhausted.
An estimated 14.1 million people in nine different regions – over 10 per cent of the country’s
population - are affected. According to current information, the most affected regions are
Regions VIII (Eastern Visayas), VI (Western Visayas) and VII (Central Visayas). Regions
IV-A (Calabarzon), IV-B (Mimaropa), V (Bicol), X (Northern Mindanao) XI (Davao) and
XIII (Caraga) were also impacted.
A state of national calamity was declared three days after the typhoon hit the central
Philippines to expedite the government’s rescue, relief and rehabilitation efforts in provinces
devastated by the typhoon.
4.1.2. Disaster/crisis context
The Philippine economy is highly dependent on agriculture (crops, poultry and livestock,
fisheries and forest products). Typhoon Haiyan has had a severe impact on people’s lives and
livelihoods in the affected areas, with extensive damage to agriculture, particularly to crop
production, fisheries, and agricultural infrastructure. The typhoon struck at a devastating time
for farmers – shortly after harvest, during a new planting season.
The severely affected regions are prime agricultural areas. Overall, regions VI, VII, and VIII
account for nearly a quarter of the total rice area harvested in 2012 (22.6%). In particular, the
Western Visayas is the second largest rice producing region and the first sugarcane producing
region in the Philippines.
Initial estimates revealed that hundreds of thousands of hectares of rice and other key crops
such as coconut (Eastern Visayas is the second largest coconut producing region in the
country) have been lost. Most of the irrigated land was already planted with irrigated rice for
this season and it is known that these crops are severely damaged.
Based on the partial report on damages released by the Department of Agriculture (DA) on
10 November, total damage to the agriculture sector is estimated at USD 85.8 million.
Damages to rice crops alone are estimated at USD 51.5 million, and the estimated cost of
damages to irrigation is USD 4.9 million.
7
4.2. The programme
4.2.1. Problems / Issues to be addressed
Affected male and female farmers need immediate distribution of rice seeds to restore their
rural livelihoods and replace lost assets. In addition, there is an urgent need to provide
vegetable kits and hand tools to affected families to ensure food security in the short term and
in case of surplus production its generates much needed additional income.
4.2.2. Stakeholders and Target Beneficiaries
The programmes targeted 44 000 vulnerable typhoon-affected farmer households in Region
VI and VIII.
Special focus during the selection process were given to the following affected households:
Households worst hit by the typhoon;
Female-headed and child-headed households and households with one or more
disabled members; (Percentage of these households as measurement of the
programme’s gender impact should be reported during the programme implementation
phase and its final report.)
Households which have not received other rice seed assistance;
Validation of the target sites and beneficiaries was jointly done by FAO and other
stakeholders.
4.2.3. Programme Justification
Typhoon Haiyan caused an unprecedented humanitarian and economic crisis affecting
hundreds of thousands of households with the total costs in losses and damages running into
the hundreds of millions of US dollars. It severely affected the agriculture-based livelihoods
of farmers and fisher folk that live in the path of the typhoon.
Despite the commendable Disaster Risk Reduction efforts of the Government over the years,
crises of this magnitude often have devastating effects that cannot be prevented and therefore
require an efficient and timely response.
Though the DA has immediate plans to provide planting materials and limited livelihood
support to a part of the affected farmers and fisher-folk, the recent calamities such as the
Bohol Earthquake in October 2013 and Typhoon Bopha in December 2012 may have
overstretched the capacity of the government to respond. The affected farmers themselves
have very limited capital to meet their immediate needs to be able to plant or replace lost
fields during the on-going planting season. These includes inputs as well as the costs of on-
farm labour during critical phases of the farm cycle such as land preparation, planting,
weeding and harvesting. In addition the households are concentrating firstly to cover the costs
of food needs as well as the construction of a shelter or rehabilitation of their houses.
4.2.4. Donors
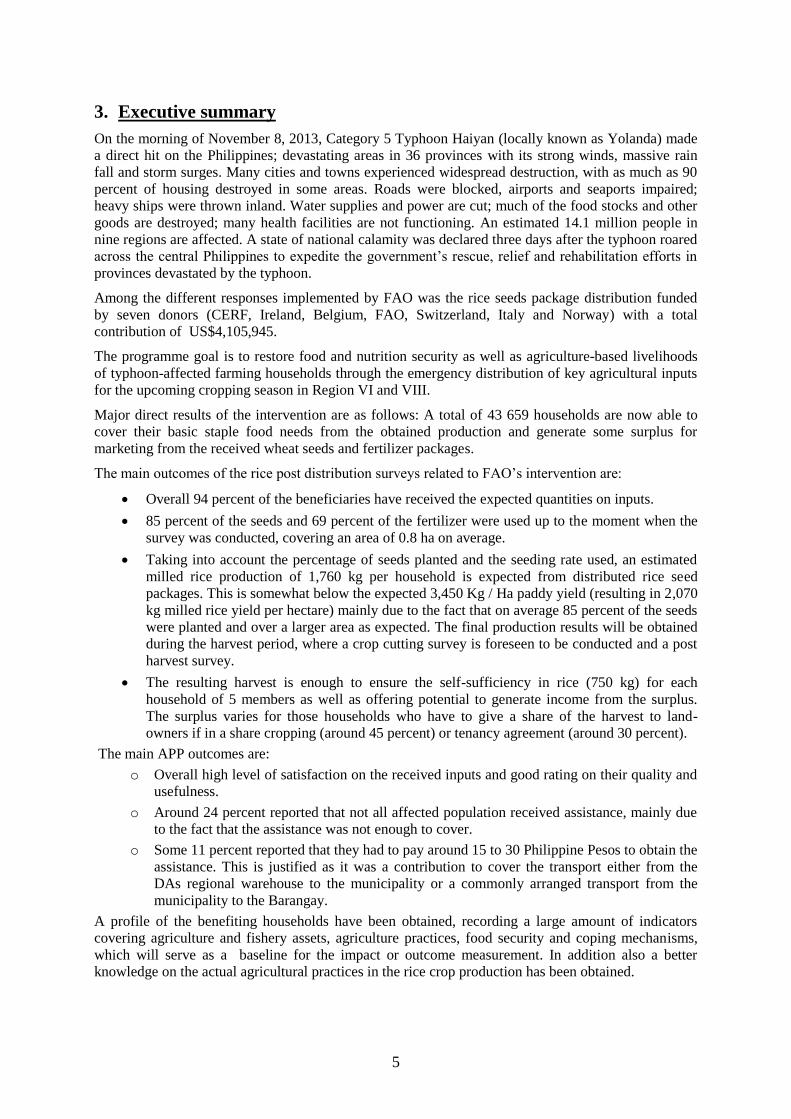
The different donors have contributed a total of US$ 4,105,945 to the implementation of the
Rice seed package intervention with following shares from total, see Figure 1.
8
Figure 1 Shares of financial contributions by donor
4.2.5. Programme key objectives
The programme goal is to restore food and nutrition security and agriculture-based livelihoods
of typhoon-affected farming households through the emergency distribution of key
agricultural inputs for the upcoming cropping season in Region VI and VIII. This will be
achieved through the following objectives and outputs:
The programme will support the resumption of agriculture production thus enhancing food
security of the population affected by Typhoon Haiyan.
The programme will make special efforts to ensure that both male and female farmers are
targeted by the interventions and have access to the agricultural input packages, allocating a
fixed quota for women beneficiaries.
4.2.6. Programme expected outputs
A total of 39 398 households are able to cover their basic staple food needs from the obtained
production and generate some surplus for marketing from the received wheat seeds and
fertilizer packages.
4.3. The Rice package intervention
The Rice seed package was distributed to 43 659 beneficiary households in the two main
affected regions covering in total six provinces. The rice seed package will enable beneficiary
farmers to cultivate rice crop on one hectare of farmland, ensuring household-level food
security. The distributed rice seeds could produce up to 3 400 kg of paddy, sufficient to feed a
household of five persons for a whole year and generating a surplus for marketing purposes.
4.3.1. Programme implementation
The Emergency Response Manager (ERM) had the overall responsibility for the
implementation of programme activities and led the Emergency Response Team. Technical
assistance was provided by staff of the Department of Agriculture (DA) of region VI and VIII
as well as the Local Government Units (LGUs) agriculture officers supported by FAO’s
technical and operational staff in the region.
12%
23%
7%
14%4%
33%
7%
OSRO/PHI/301/IRE
OSRO/PHI/302/BEL
OSRO/PHI/303/CHA
OSRO/PHI/306/SWI
OSRO/PHI/307/ITA
OSRO/PHI/308/NOR
TCP/PHI/3405
9
The implementation of the programme was conducted by FAO in close collaboration with the
DA of region VI and VIII, the municipal Local Government Units and other humanitarian
partners operating in the proposed target areas. This close coordination maximized the
response, as all the needed households received assistance by one of the different
stakeholders. The municipality was in charge of the cross checking of the beneficiaries and
the delivery of inputs.
A National FAO staff (either an agronomist or an M&E officer) supervised the
implementation of programme activities at regional level: reception of the inputs from the
suppliers, verification of inputs delivery to municipalities and programme monitoring. The
implementing partners were the municipalities as well as the Municipal
Agriculturist/Agricultural Officer, particularly during the inputs delivery process and the
distribution to target beneficiaries.
FAO has already a well-developed monitoring and evaluation system relating to the
distribution of all inputs and the assessment of the impact of the intervention. Monitoring of
programme progress was carried out by FAO field staff.
In collaboration with the Capiz or Visayas State Universities, graduates from these institutions
were trained and conducted the fieldwork for the post distribution survey, interviewing the
beneficiaries under the supervision of the field M&E officers. The data entry and controlling
was done by graduates as well. This survey focused both on upward accountability to the
donors and downward accountability to affected population.
FAO will share the gathered information on the outcome of the survey with the Department of
Agriculture and Food Security and Agriculture Cluster (FSAC) members.
4.3.2. Criteria of selection:
The following main criteria of selection were taken into account during the beneficiaries’
identification process:
Farmers who have lost their ready to harvest standing rice crop from the previous
season
or
Farmers who have already planted their rice fields for this season and have lost them
due to floods caused by the heavy rains,
Farmers who are able to cultivate their land
Households with access to around 1 ha of irrigated land.
4.3.3. Content of input packages
Each farmer will receive a package which includes the following items:
40 kilograms certified rice seeds for one hectare land
50 kilograms Urea fertilizers for one hectare
Sets of assorted hand tools consisting of shovel, hoe and machete to be used for land
preparation and the clean-up of fields from debris and the removal of fallen trees and
palms
Each set of hand tools will be shared between ten households.
In some Barangays, the DA in consultation with FAO has decided to split the packages for
two households in case they had only half a hectare of rice field to replant or provided 80kg of
rice seeds to households who had more land available. This will be taken into account during
the analysis of the data related to the quantities received and use of the obtained inputs.
10
4.3.4. The locations of intervention and implementing partners
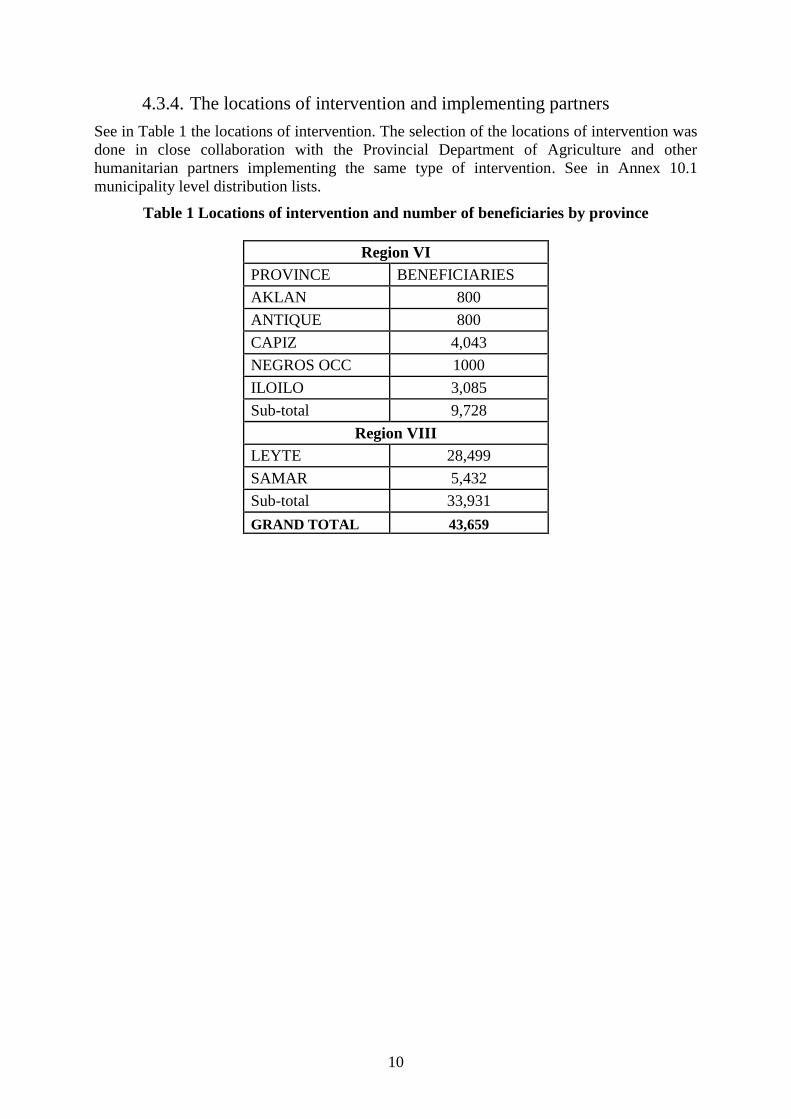
See in Table 1 the locations of intervention. The selection of the locations of intervention was
done in close collaboration with the Provincial Department of Agriculture and other
humanitarian partners implementing the same type of intervention. See in Annex 10.1
municipality level distribution lists.
Table 1 Locations of intervention and number of beneficiaries by province
Region VI
PROVINCE BENEFICIARIES
AKLAN 800
ANTIQUE 800
CAPIZ 4,043
NEGROS OCC 1000
ILOILO 3,085
Sub-total 9,728
Region VIII
LEYTE 28,499
SAMAR 5,432
Sub-total 33,931
GRAND TOTAL 43,659
11
5. The survey
In order to capture the satisfaction and utilization of the rice seeds package distribution
intervention, as well as the profile of the benefiting households, a questionnaire based survey
was conducted.
The general household characteristics and socio economic information will also serve as a
baseline wherefrom the outcome and impact will be measured.
5.1. Methodology
The whole survey was based on the Beneficiaries Results Assessment methodology1. The
information reported here was gathered conducting a survey at beneficiaries’ level with face
to face interviews. The survey was made based on a questionnaire developed by the reporting
consultant, see in Annex 10.2. The questionnaire was first tested, and thereafter adapted. The
enumerators were undergraduates and graduates students either from the Capiz State
University in region VI or Visayas State University for region VIII. They were trained
beforehand The training was provided by an FAO international M&E consultant and included
a theoretical background on how to conduct a survey, on how to fill in the questionnaire and
sampling methodology.
The survey targeted a total of 1,450 beneficiaries’ households from 7 provinces and 32
municipalities. In each municipality three Barangays (villages) were selected where at least 15
households were randomly selected out of the total of assisted rice beneficiaries and
interviewed. See selected Barangays in Annex 10.3.
The survey was conducted during February 2014. Completed questionnaires were sent to the
corresponding State Universities, where the specially hired and trained data entry students
encoded the questionnaires in a previously developed database. The data entry students were
supervised by a senior research assistant of the Universities. A thorough verification and
control system (both before and after data entry) and close supervision were put in place in
order to ensure the quality of the data entered.
The final data control at database level, preparation for analysis, final analysis and reporting
was undertaken by the international M&E consultant. During the control exercise some errors
or inconsistencies were detected and corrected, based on the questionnaires, in order to ensure
that they were properly encoded or through logical deduction where possible; otherwise they
were deleted.
Overall results are presented in the main body of this report, and information specific to
provinces is included into an Annex of the report.
5.2. Scope and reliability of the survey’s data
The sample size is quite large and has a level of reliability of 85% at provincial level, except
for Negros Occidental, where the level of reliability is 80% due to inaccessibility to targeted
Barangays during the survey period. Even so the results should not be extrapolated to the
whole communities or to a larger scale, as the households interviewed were affected by the
typhoon and therefore programme beneficiaries are subject to some other additional criteria of
selection. In addition, the data should be taken as indicative as the variation can be quite large
between the different provinces. Provincial specific data sets are included in the Annex 10.5.
1 For more information see: FAO Methodology: Guide for Beneficiary Results Assessment of Agricultural
Emergency Interventions, Matthias Mollet & Thomas Braunschweig, Rome 2008
http://www.fao.org/emergencies/resources/tools/beneficiary-results/en/
12
The survey was conducted over the month of February 2014, almost three months after the
typhoon made landfall and therefore doesn’t represent the situation just after the disaster.
Even so different food security or livelihood indicators were gathered as a reference baseline,
as the proper livelihood interventions had not been initiated until the start of the survey.
13
6. Characteristics of the household, livelihoods and practices
The term household refers to all members of a family sharing food consumption on a daily
basis (i.e. sharing the same kitchen or eating together). Each member is therefore in general
also contributing directly or indirectly to the income of the household, either through labour,
cash or in kind contribution except for the small children or elderly persons unable to conduct
any kind of household activities.
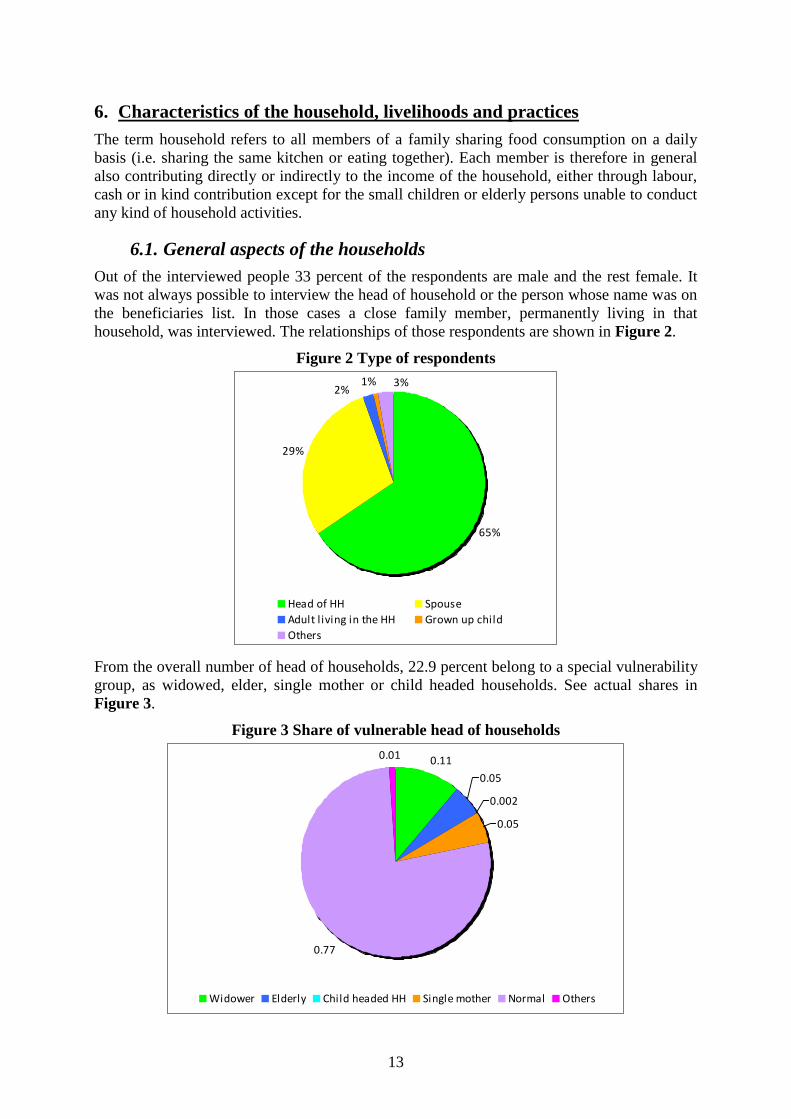
6.1. General aspects of the households
Out of the interviewed people 33 percent of the respondents are male and the rest female. It
was not always possible to interview the head of household or the person whose name was on
the beneficiaries list. In those cases a close family member, permanently living in that
household, was interviewed. The relationships of those respondents are shown in Figure 2.
Figure 2 Type of respondents
From the overall number of head of households, 22.9 percent belong to a special vulnerability
group, as widowed, elder, single mother or child headed households. See actual shares in
Figure 3.
Figure 3 Share of vulnerable head of households
65%
29%
1%2%
3%
Head of HH Spouse
Adult l iving in the HH Grown up child
Others
0.11
0.05
0.05
0.77
0.01
0.002
Widower Elderly Child headed HH Single mother Normal Others
14
On average each household has 4.5 members, wherefrom 63.4 percent are adults and the rest
children below 18 years. The size of families differs slightly in between the provinces where
larger families were recorded in Leyte province with 5.8 members and the smallest in Aklan
with 3.7 members per household; see province specific family related parameters in Table 2.
The average age of the head of household is 52 years and for the spouse 50 years. The average
age is quite high compared to the average of the two regions of 12 percent based on the
country statistics of Bureau of Agriculture Statistics.
Table 2 Composition of households and age of head of household, by province
Out of the interviewed sample, 53.9 percent are Comprehensive Agrarian Reform Program
(CARP) – beneficiaries under Republic Act No. 6657. The beneficiaries of this group were,
before they were involved in the CARP, mainly land less agriculture daily wage labourers and
obtained, through CARP, their own land titles. Overall the CARP beneficiaries are considered
to be more vulnerable.
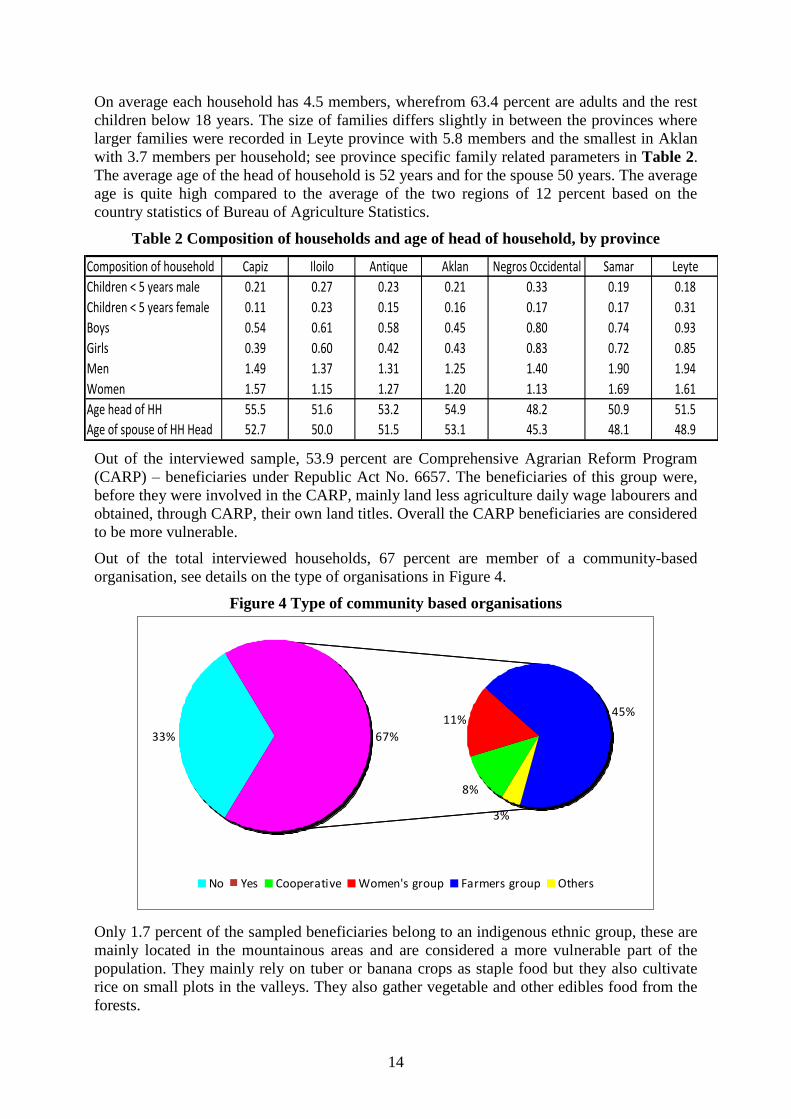
Out of the total interviewed households, 67 percent are member of a community-based
organisation, see details on the type of organisations in Figure 4.
Figure 4 Type of community based organisations
Only 1.7 percent of the sampled beneficiaries belong to an indigenous ethnic group, these are
mainly located in the mountainous areas and are considered a more vulnerable part of the
population. They mainly rely on tuber or banana crops as staple food but they also cultivate
rice on small plots in the valleys. They also gather vegetable and other edibles food from the
forests.
Composition of household Capiz Iloilo Antique Aklan Negros Occidental Samar Leyte
Children < 5 years male 0.21 0.27 0.23 0.21 0.33 0.19 0.18
Children < 5 years female 0.11 0.23 0.15 0.16 0.17 0.17 0.31
Boys 0.54 0.61 0.58 0.45 0.80 0.74 0.93
Girls 0.39 0.60 0.42 0.43 0.83 0.72 0.85
Men 1.49 1.37 1.31 1.25 1.40 1.90 1.94
Women 1.57 1.15 1.27 1.20 1.13 1.69 1.61
Age head of HH 55.5 51.6 53.2 54.9 48.2 50.9 51.5
Age of spouse of HH Head 52.7 50.0 51.5 53.1 45.3 48.1 48.9
33%
45%
67%
3%
11%
8%
No Yes Cooperative Women's group Farmers group Others
15
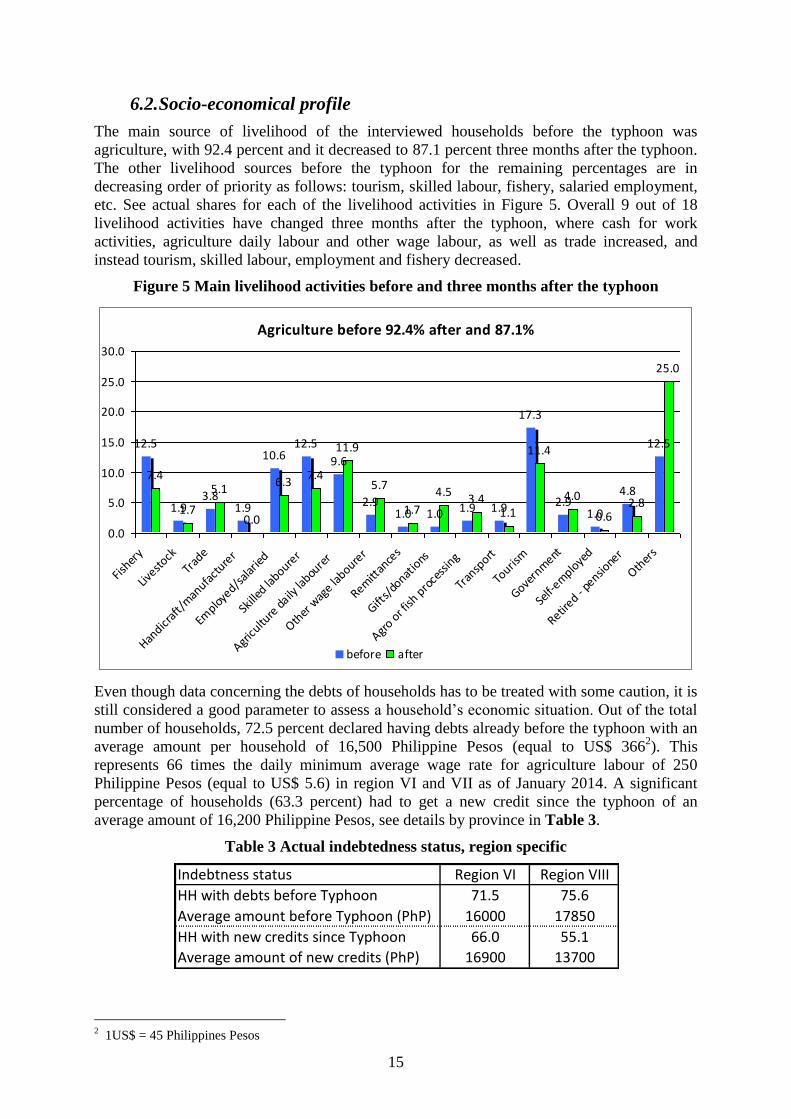
6.2. Socio-economical profile
The main source of livelihood of the interviewed households before the typhoon was
agriculture, with 92.4 percent and it decreased to 87.1 percent three months after the typhoon.
The other livelihood sources before the typhoon for the remaining percentages are in
decreasing order of priority as follows: tourism, skilled labour, fishery, salaried employment,
etc. See actual shares for each of the livelihood activities in Figure 5. Overall 9 out of 18
livelihood activities have changed three months after the typhoon, where cash for work
activities, agriculture daily labour and other wage labour, as well as trade increased, and
instead tourism, skilled labour, employment and fishery decreased.
Figure 5 Main livelihood activities before and three months after the typhoon
Even though data concerning the debts of households has to be treated with some caution, it is
still considered a good parameter to assess a household’s economic situation. Out of the total
number of households, 72.5 percent declared having debts already before the typhoon with an
average amount per household of 16,500 Philippine Pesos (equal to US$ 3662). This
represents 66 times the daily minimum average wage rate for agriculture labour of 250
Philippine Pesos (equal to US$ 5.6) in region VI and VII as of January 2014. A significant
percentage of households (63.3 percent) had to get a new credit since the typhoon of an
average amount of 16,200 Philippine Pesos, see details by province in Table 3.
Table 3 Actual indebtedness status, region specific
2 1US$ = 45 Philippines Pesos
Agriculture before 92.4% after and 87.1%
12.5
1.93.8
1.9
10.612.5
9.6
2.91.0 1.0 1.9 1.9
17.3
2.91.0
4.8
12.5
7.4
1.7
5.1
0.0
6.37.4
11.9
5.7
1.7
4.53.4
1.1
11.4
4.0
0.62.8
25.0
0.0
5.0
10.0
15.0
20.0
25.0
30.0
Fisher
y
Livesto
ck
Trad
e
Handicr
aft/
man
ufact
urer
Employ
ed/sala
ried
Skille
d laboure
r
Agricu
lture
daily
labou
rer
Other
wag
e laboure
r
Remitt
ance
s
Gifts/
donat
ions
Agro o
r fish
pro
cess
ing
Tran
sport
Touris
m
Govern
ment
Self-
emplo
yed
Retired -
pensio
ner
Other
s
before after
Indebtness status Region VI Region VIII
HH with debts before Typhoon 71.5 75.6
Average amount before Typhoon (PhP) 16000 17850
HH with new credits since Typhoon 66.0 55.1
Average amount of new credits (PhP) 16900 13700
16
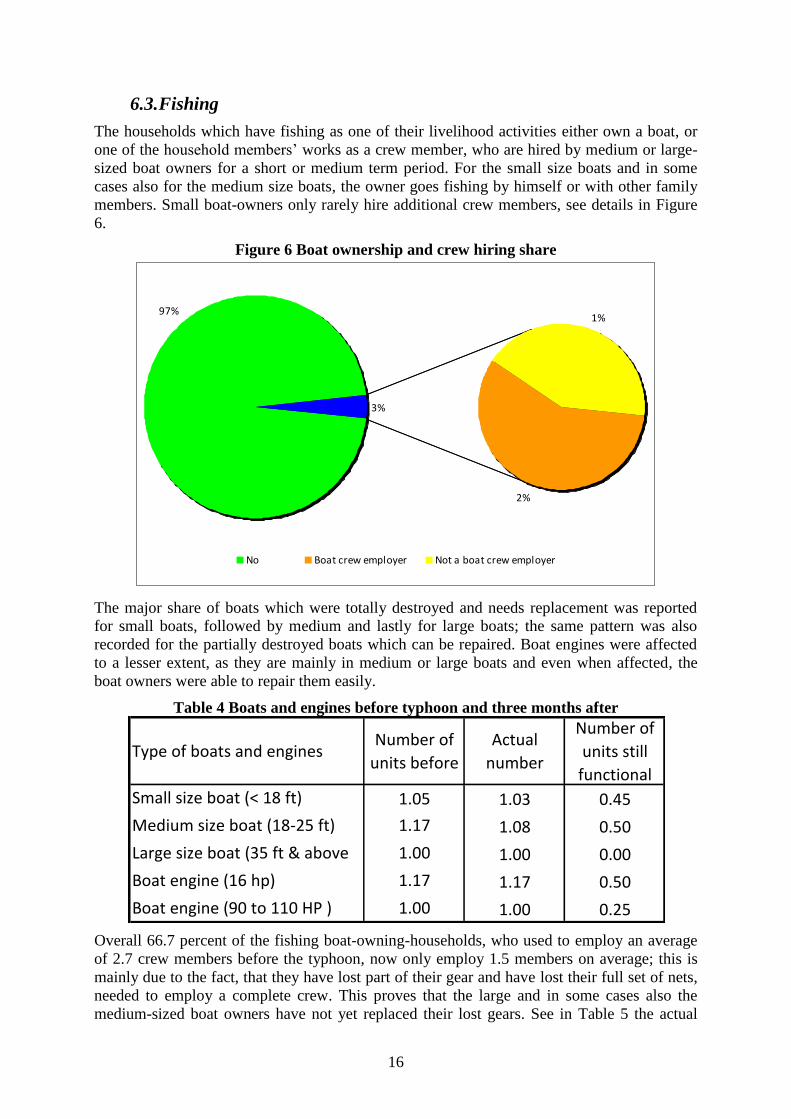
6.3. Fishing
The households which have fishing as one of their livelihood activities either own a boat, or
one of the household members’ works as a crew member, who are hired by medium or large-
sized boat owners for a short or medium term period. For the small size boats and in some
cases also for the medium size boats, the owner goes fishing by himself or with other family
members. Small boat-owners only rarely hire additional crew members, see details in Figure
6.
Figure 6 Boat ownership and crew hiring share
The major share of boats which were totally destroyed and needs replacement was reported
for small boats, followed by medium and lastly for large boats; the same pattern was also
recorded for the partially destroyed boats which can be repaired. Boat engines were affected
to a lesser extent, as they are mainly in medium or large boats and even when affected, the
boat owners were able to repair them easily.
Table 4 Boats and engines before typhoon and three months after
Overall 66.7 percent of the fishing boat-owning-households, who used to employ an average
of 2.7 crew members before the typhoon, now only employ 1.5 members on average; this is
mainly due to the fact, that they have lost part of their gear and have lost their full set of nets,
needed to employ a complete crew. This proves that the large and in some cases also the
medium-sized boat owners have not yet replaced their lost gears. See in Table 5 the actual
2%
1%
3%
97%
No Boat crew employer Not a boat crew employer
Type of boats and enginesNumber of
units before
Actual
number
Number of
units still
functional
Small size boat (< 18 ft) 1.05 1.03 0.45
Medium size boat (18-25 ft) 1.17 1.08 0.50
Large size boat (35 ft & above 1.00 1.00 0.00
Boat engine (16 hp) 1.17 1.17 0.50
Boat engine (90 to 110 HP ) 1.00 1.00 0.25
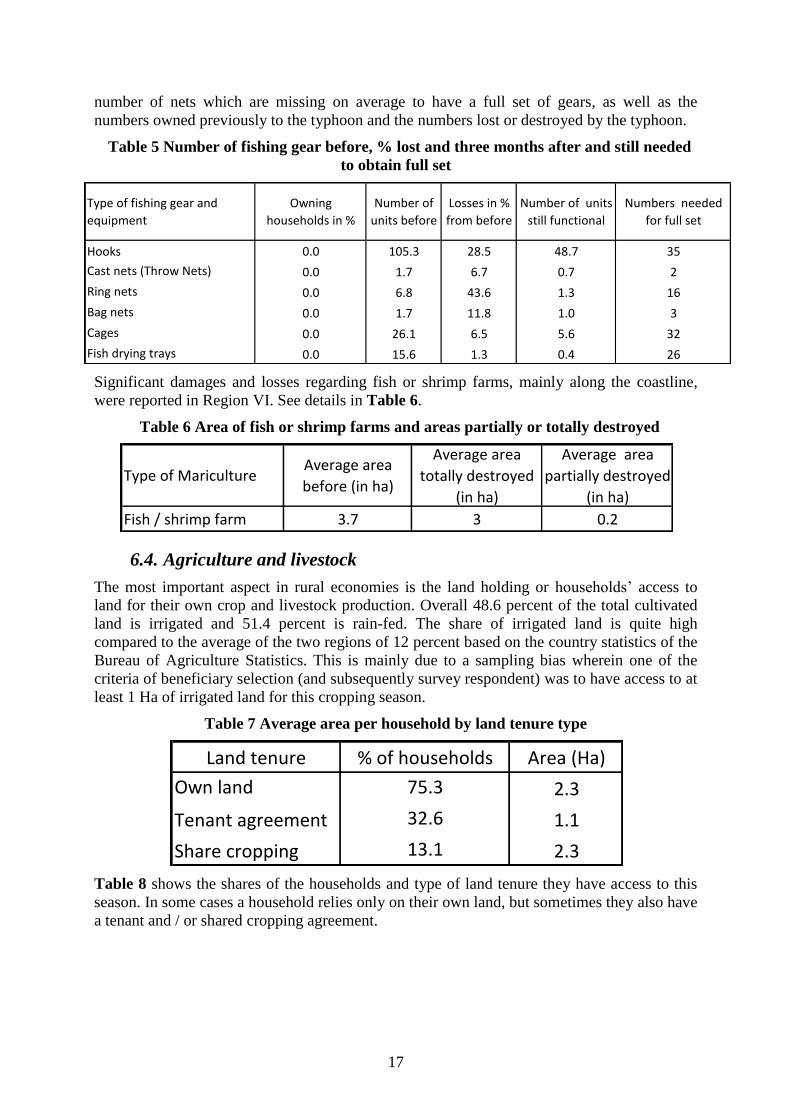
17
number of nets which are missing on average to have a full set of gears, as well as the
numbers owned previously to the typhoon and the numbers lost or destroyed by the typhoon.
Table 5 Number of fishing gear before, % lost and three months after and still needed
to obtain full set
Significant damages and losses regarding fish or shrimp farms, mainly along the coastline,
were reported in Region VI. See details in Table 6.
Table 6 Area of fish or shrimp farms and areas partially or totally destroyed
6.4. Agriculture and livestock
The most important aspect in rural economies is the land holding or households’ access to
land for their own crop and livestock production. Overall 48.6 percent of the total cultivated
land is irrigated and 51.4 percent is rain-fed. The share of irrigated land is quite high
compared to the average of the two regions of 12 percent based on the country statistics of the
Bureau of Agriculture Statistics. This is mainly due to a sampling bias wherein one of the
criteria of beneficiary selection (and subsequently survey respondent) was to have access to at
least 1 Ha of irrigated land for this cropping season.
Table 7 Average area per household by land tenure type
Table 8 shows the shares of the households and type of land tenure they have access to this
season. In some cases a household relies only on their own land, but sometimes they also have
a tenant and / or shared cropping agreement.
Type of fishing gear and
equipment
Owning
households in %
Number of
units before
Losses in %
from before
Number of units
still functional
Numbers needed
for full set
Hooks 0.0 105.3 28.5 48.7 35
Cast nets (Throw Nets) 0.0 1.7 6.7 0.7 2
Ring nets 0.0 6.8 43.6 1.3 16
Bag nets 0.0 1.7 11.8 1.0 3
Cages 0.0 26.1 6.5 5.6 32
Fish drying trays 0.0 15.6 1.3 0.4 26
Type of MaricultureAverage area
before (in ha)
Average area
totally destroyed
(in ha)
Average area
partially destroyed
(in ha)
Fish / shrimp farm 3.7 3 0.2
Land tenure % of households Area (Ha)
Own land 75.3 2.3
Tenant agreement 32.6 1.1
Share cropping 13.1 2.3
18
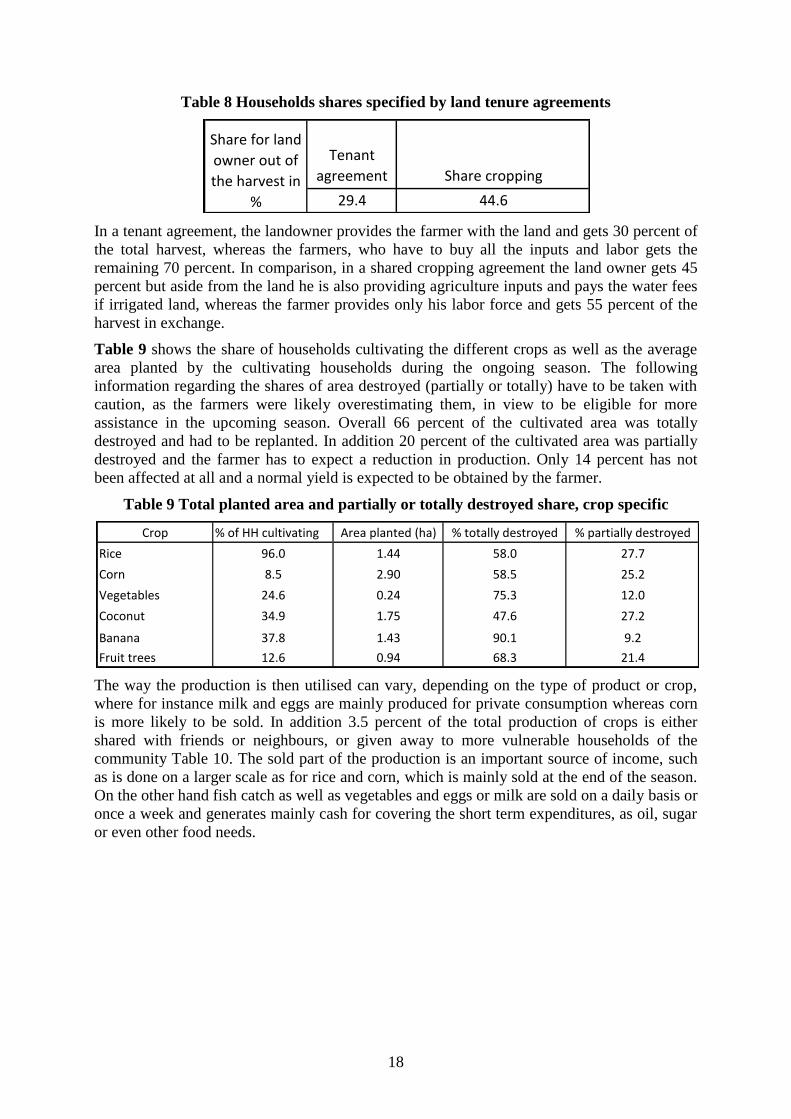
Table 8 Households shares specified by land tenure agreements
In a tenant agreement, the landowner provides the farmer with the land and gets 30 percent of
the total harvest, whereas the farmers, who have to buy all the inputs and labor gets the
remaining 70 percent. In comparison, in a shared cropping agreement the land owner gets 45
percent but aside from the land he is also providing agriculture inputs and pays the water fees
if irrigated land, whereas the farmer provides only his labor force and gets 55 percent of the
harvest in exchange.
Table 9 shows the share of households cultivating the different crops as well as the average
area planted by the cultivating households during the ongoing season. The following
information regarding the shares of area destroyed (partially or totally) have to be taken with
caution, as the farmers were likely overestimating them, in view to be eligible for more
assistance in the upcoming season. Overall 66 percent of the cultivated area was totally
destroyed and had to be replanted. In addition 20 percent of the cultivated area was partially
destroyed and the farmer has to expect a reduction in production. Only 14 percent has not
been affected at all and a normal yield is expected to be obtained by the farmer.
Table 9 Total planted area and partially or totally destroyed share, crop specific
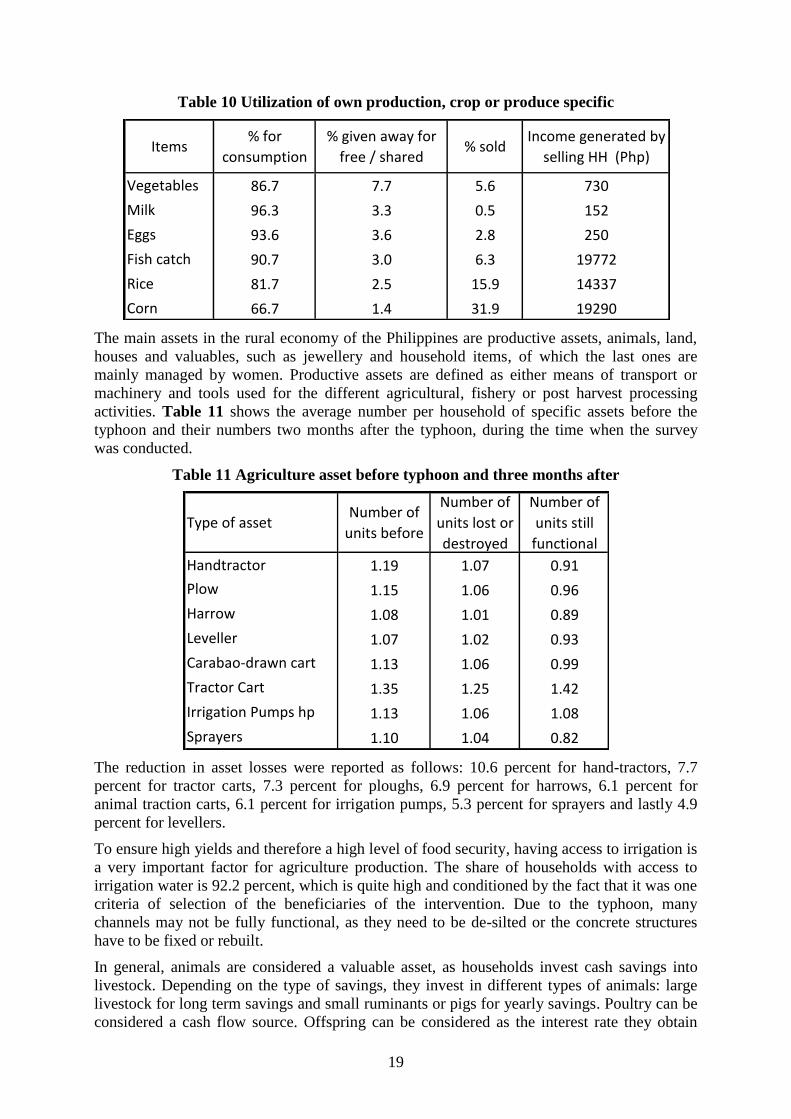
The way the production is then utilised can vary, depending on the type of product or crop,
where for instance milk and eggs are mainly produced for private consumption whereas corn
is more likely to be sold. In addition 3.5 percent of the total production of crops is either
shared with friends or neighbours, or given away to more vulnerable households of the
community Table 10. The sold part of the production is an important source of income, such
as is done on a larger scale as for rice and corn, which is mainly sold at the end of the season.
On the other hand fish catch as well as vegetables and eggs or milk are sold on a daily basis or
once a week and generates mainly cash for covering the short term expenditures, as oil, sugar
or even other food needs.
Tenant
agreement Share cropping
29.4 44.6
Share for land
owner out of
the harvest in
%
Crop % of HH cultivating Area planted (ha) % totally destroyed % partially destroyed
Rice 96.0 1.44 58.0 27.7
Corn 8.5 2.90 58.5 25.2
Vegetables 24.6 0.24 75.3 12.0
Coconut 34.9 1.75 47.6 27.2
Banana 37.8 1.43 90.1 9.2
Fruit trees 12.6 0.94 68.3 21.4
19
Table 10 Utilization of own production, crop or produce specific
The main assets in the rural economy of the Philippines are productive assets, animals, land,
houses and valuables, such as jewellery and household items, of which the last ones are
mainly managed by women. Productive assets are defined as either means of transport or
machinery and tools used for the different agricultural, fishery or post harvest processing
activities. Table 11 shows the average number per household of specific assets before the
typhoon and their numbers two months after the typhoon, during the time when the survey
was conducted.
Table 11 Agriculture asset before typhoon and three months after
The reduction in asset losses were reported as follows: 10.6 percent for hand-tractors, 7.7
percent for tractor carts, 7.3 percent for ploughs, 6.9 percent for harrows, 6.1 percent for
animal traction carts, 6.1 percent for irrigation pumps, 5.3 percent for sprayers and lastly 4.9
percent for levellers.
To ensure high yields and therefore a high level of food security, having access to irrigation is
a very important factor for agriculture production. The share of households with access to
irrigation water is 92.2 percent, which is quite high and conditioned by the fact that it was one
criteria of selection of the beneficiaries of the intervention. Due to the typhoon, many
channels may not be fully functional, as they need to be de-silted or the concrete structures
have to be fixed or rebuilt.
In general, animals are considered a valuable asset, as households invest cash savings into
livestock. Depending on the type of savings, they invest in different types of animals: large
livestock for long term savings and small ruminants or pigs for yearly savings. Poultry can be
considered a cash flow source. Offspring can be considered as the interest rate they obtain
Items% for
consumption
% given away for
free / shared% sold
Income generated by
selling HH (Php)
Vegetables 86.7 7.7 5.6 730
Milk 96.3 3.3 0.5 152
Eggs 93.6 3.6 2.8 250
Fish catch 90.7 3.0 6.3 19772
Rice 81.7 2.5 15.9 14337
Corn 66.7 1.4 31.9 19290
Type of assetNumber of
units before
Number of
units lost or
destroyed
Number of
units still
functional
Handtractor 1.19 1.07 0.91
Plow 1.15 1.06 0.96
Harrow 1.08 1.01 0.89
Leveller 1.07 1.02 0.93
Carabao-drawn cart 1.13 1.06 0.99
Tractor Cart 1.35 1.25 1.42
Irrigation Pumps hp 1.13 1.06 1.08
Sprayers 1.10 1.04 0.82
20
from their savings (animals) in addition to the value of the work done and the increased
market value of the actual animal.
In addition, animal products (milk, wool, skins and meat) are also an important source of
income, either for self consumption or marketing. Cows or buffalo are used for land
preparation and to a lesser extent for transport purposes. Some animals play an important role
for religious purposes or during family ceremonies, such as weddings, funerals, etc.
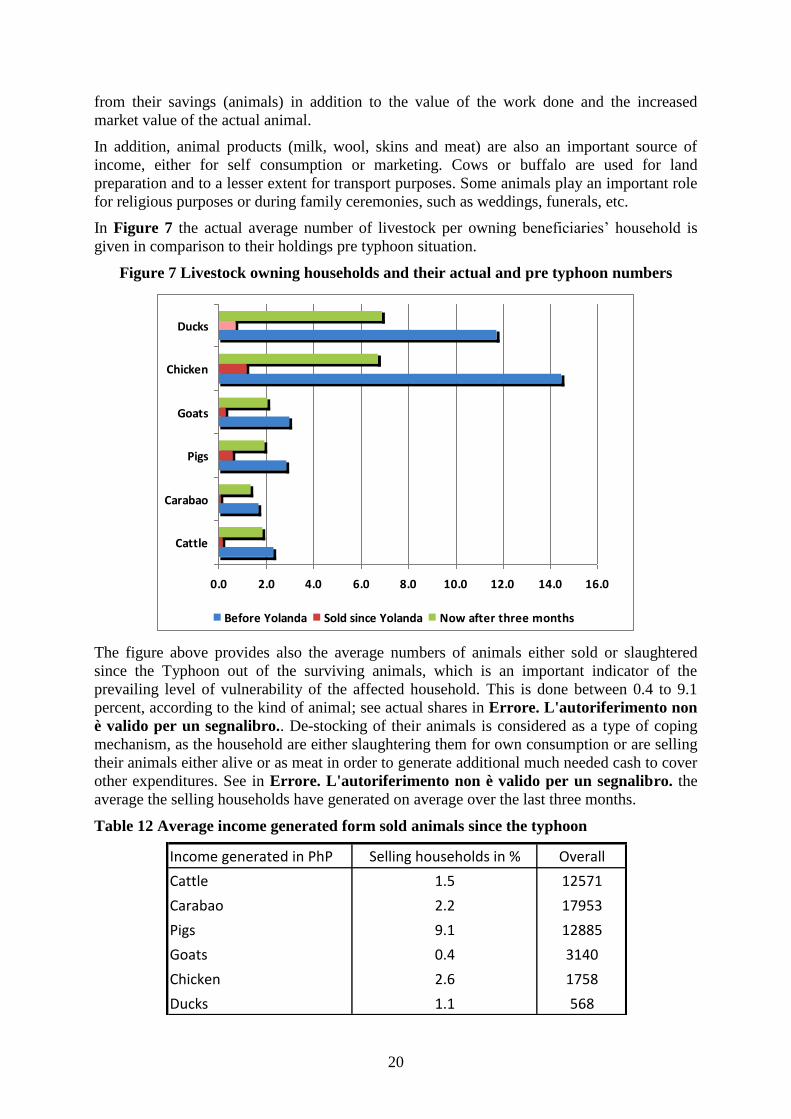
In Figure 7 the actual average number of livestock per owning beneficiaries’ household is
given in comparison to their holdings pre typhoon situation.
Figure 7 Livestock owning households and their actual and pre typhoon numbers
The figure above provides also the average numbers of animals either sold or slaughtered
since the Typhoon out of the surviving animals, which is an important indicator of the
prevailing level of vulnerability of the affected household. This is done between 0.4 to 9.1
percent, according to the kind of animal; see actual shares in Errore. L'autoriferimento non
è valido per un segnalibro.. De-stocking of their animals is considered as a type of coping
mechanism, as the household are either slaughtering them for own consumption or are selling
their animals either alive or as meat in order to generate additional much needed cash to cover
other expenditures. See in Errore. L'autoriferimento non è valido per un segnalibro. the
average the selling households have generated on average over the last three months.
Table 12 Average income generated form sold animals since the typhoon
0.0 2.0 4.0 6.0 8.0 10.0 12.0 14.0 16.0
Cattle
Carabao
Pigs
Goats
Chicken
Ducks
Before Yolanda Sold since Yolanda Now after three months
Income generated in PhP Selling households in % Overall
Cattle 1.5 12571
Carabao 2.2 17953
Pigs 9.1 12885
Goats 0.4 3140
Chicken 2.6 1758
Ducks 1.1 568
21
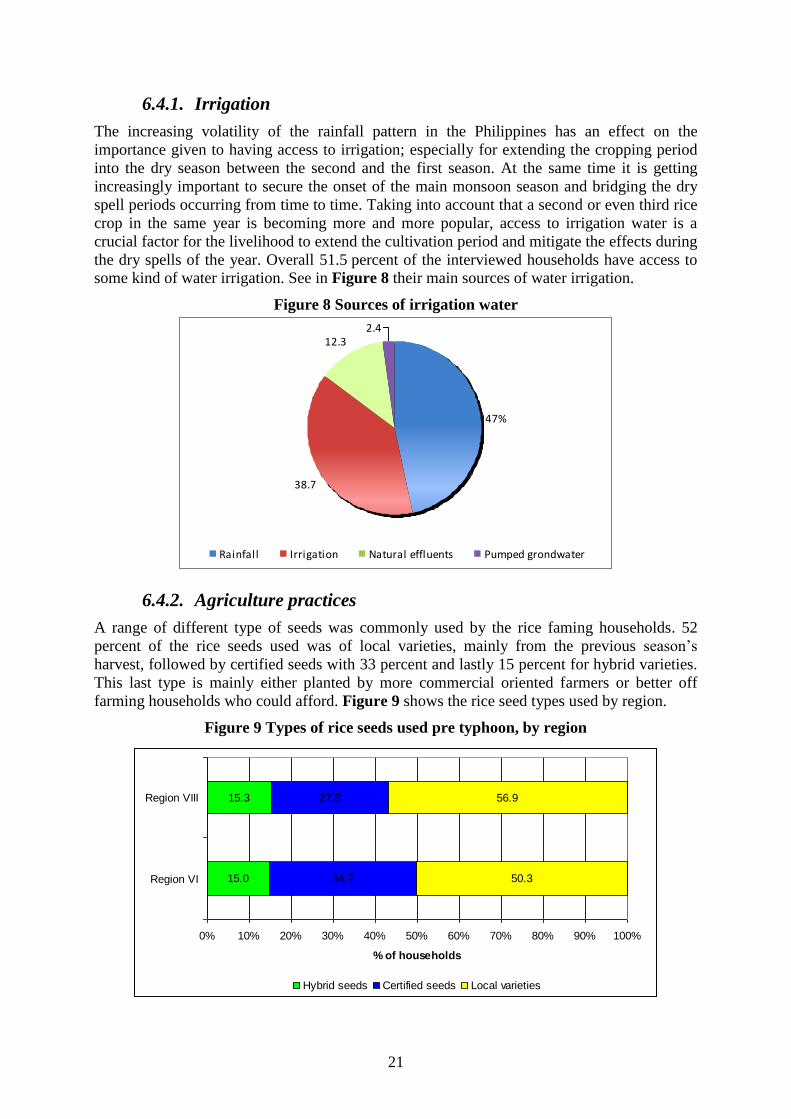
6.4.1. Irrigation
The increasing volatility of the rainfall pattern in the Philippines has an effect on the
importance given to having access to irrigation; especially for extending the cropping period
into the dry season between the second and the first season. At the same time it is getting
increasingly important to secure the onset of the main monsoon season and bridging the dry
spell periods occurring from time to time. Taking into account that a second or even third rice
crop in the same year is becoming more and more popular, access to irrigation water is a
crucial factor for the livelihood to extend the cultivation period and mitigate the effects during
the dry spells of the year. Overall 51.5 percent of the interviewed households have access to
some kind of water irrigation. See in Figure 8 their main sources of water irrigation.
Figure 8 Sources of irrigation water
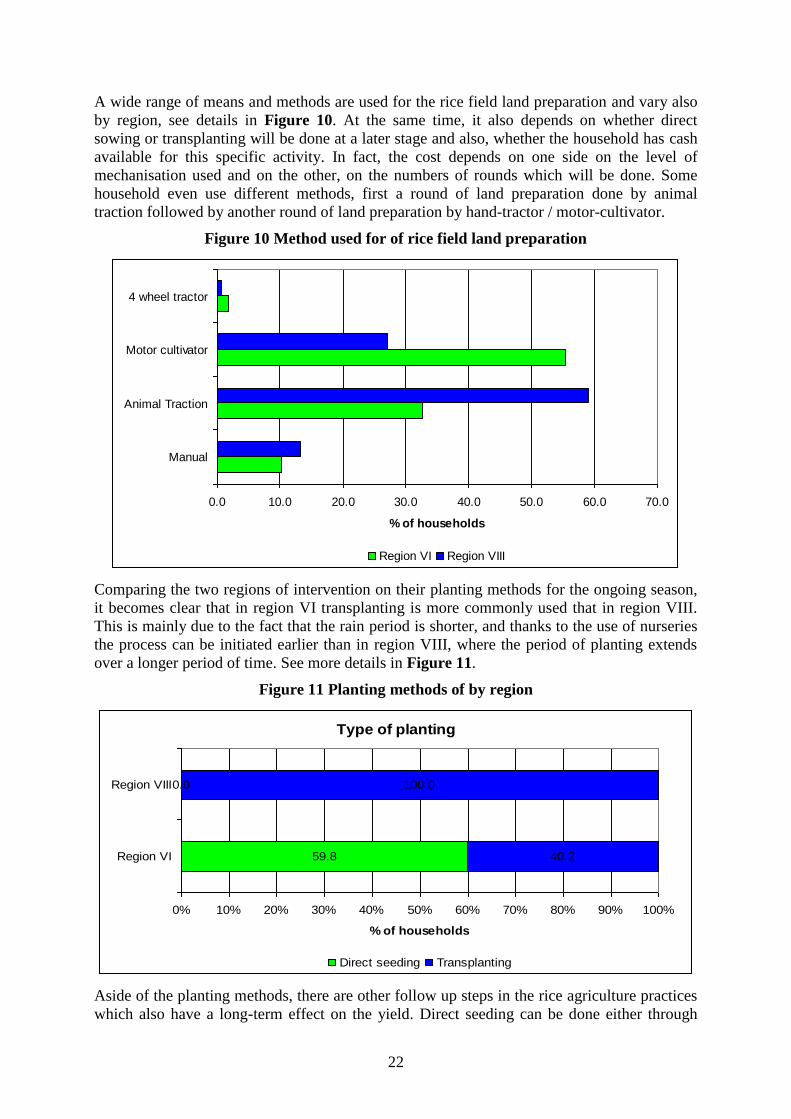
6.4.2. Agriculture practices
A range of different type of seeds was commonly used by the rice faming households. 52
percent of the rice seeds used was of local varieties, mainly from the previous season’s
harvest, followed by certified seeds with 33 percent and lastly 15 percent for hybrid varieties.
This last type is mainly either planted by more commercial oriented farmers or better off
farming households who could afford. Figure 9 shows the rice seed types used by region.
Figure 9 Types of rice seeds used pre typhoon, by region
38.7
12.32.4
47%
Rainfall Irrigation Natural effluents Pumped grondwater
15.0
15.3
34.7
27.8
50.3
56.9
0% 10% 20% 30% 40% 50% 60% 70% 80% 90% 100%
Region VI
Region VIII
% of households
Hybrid seeds Certified seeds Local varieties
22
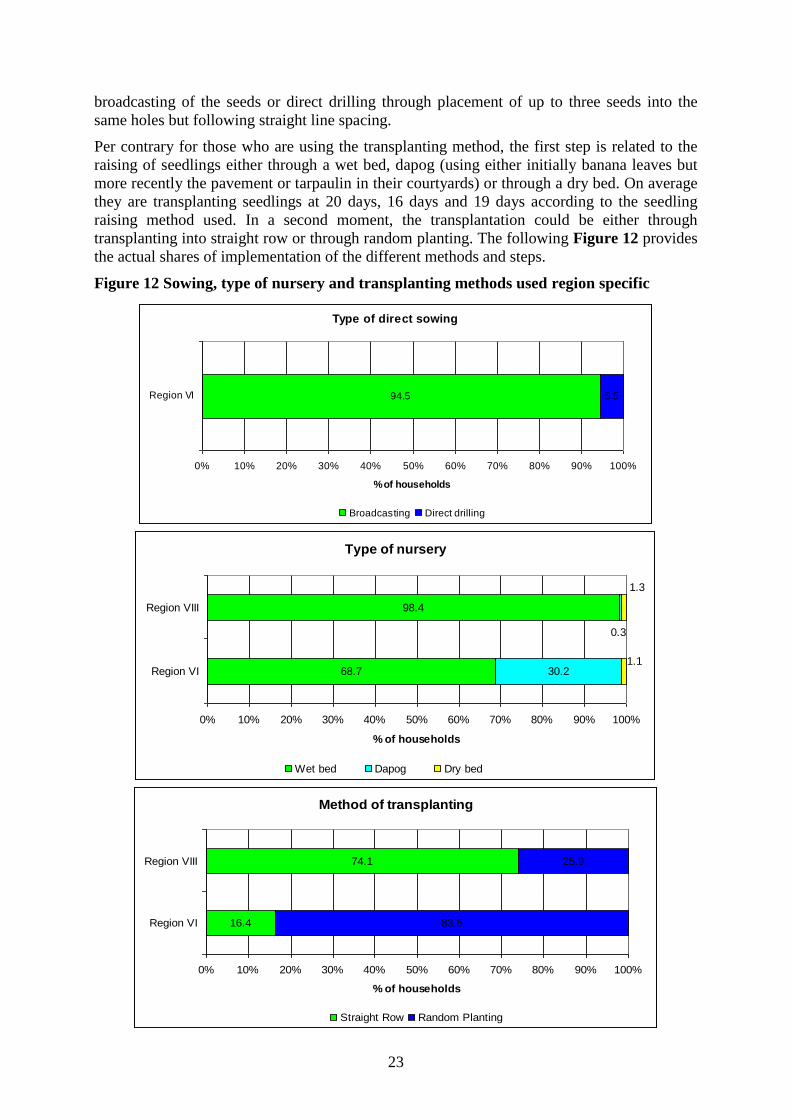
A wide range of means and methods are used for the rice field land preparation and vary also
by region, see details in Figure 10. At the same time, it also depends on whether direct
sowing or transplanting will be done at a later stage and also, whether the household has cash
available for this specific activity. In fact, the cost depends on one side on the level of
mechanisation used and on the other, on the numbers of rounds which will be done. Some
household even use different methods, first a round of land preparation done by animal
traction followed by another round of land preparation by hand-tractor / motor-cultivator.
Figure 10 Method used for of rice field land preparation
Comparing the two regions of intervention on their planting methods for the ongoing season,
it becomes clear that in region VI transplanting is more commonly used that in region VIII.
This is mainly due to the fact that the rain period is shorter, and thanks to the use of nurseries
the process can be initiated earlier than in region VIII, where the period of planting extends
over a longer period of time. See more details in Figure 11.
Figure 11 Planting methods of by region
Aside of the planting methods, there are other follow up steps in the rice agriculture practices
which also have a long-term effect on the yield. Direct seeding can be done either through
0.0 10.0 20.0 30.0 40.0 50.0 60.0 70.0
Manual
Animal Traction
Motor cultivator
4 wheel tractor
% of households
Region VI Region VIII
Type of planting
59.8
0.0
40.2
100.0
0% 10% 20% 30% 40% 50% 60% 70% 80% 90% 100%
Region VI
Region VIII
% of households
Direct seeding Transplanting
23
broadcasting of the seeds or direct drilling through placement of up to three seeds into the
same holes but following straight line spacing.
Per contrary for those who are using the transplanting method, the first step is related to the
raising of seedlings either through a wet bed, dapog (using either initially banana leaves but
more recently the pavement or tarpaulin in their courtyards) or through a dry bed. On average
they are transplanting seedlings at 20 days, 16 days and 19 days according to the seedling
raising method used. In a second moment, the transplantation could be either through
transplanting into straight row or through random planting. The following Figure 12 provides
the actual shares of implementation of the different methods and steps.
Figure 12 Sowing, type of nursery and transplanting methods used region specific
Type of direct sowing
94.5 5.5
0% 10% 20% 30% 40% 50% 60% 70% 80% 90% 100%
Region VI
% of households
Broadcasting Direct drilling
Type of nursery
68.7
98.4
30.2
0.3
1.1
1.3
0% 10% 20% 30% 40% 50% 60% 70% 80% 90% 100%
Region VI
Region VIII
% of households
Wet bed Dapog Dry bed
Method of transplanting
16.4
74.1
83.6
25.9
0% 10% 20% 30% 40% 50% 60% 70% 80% 90% 100%
Region VI
Region VIII
% of households
Straight Row Random Planting
24
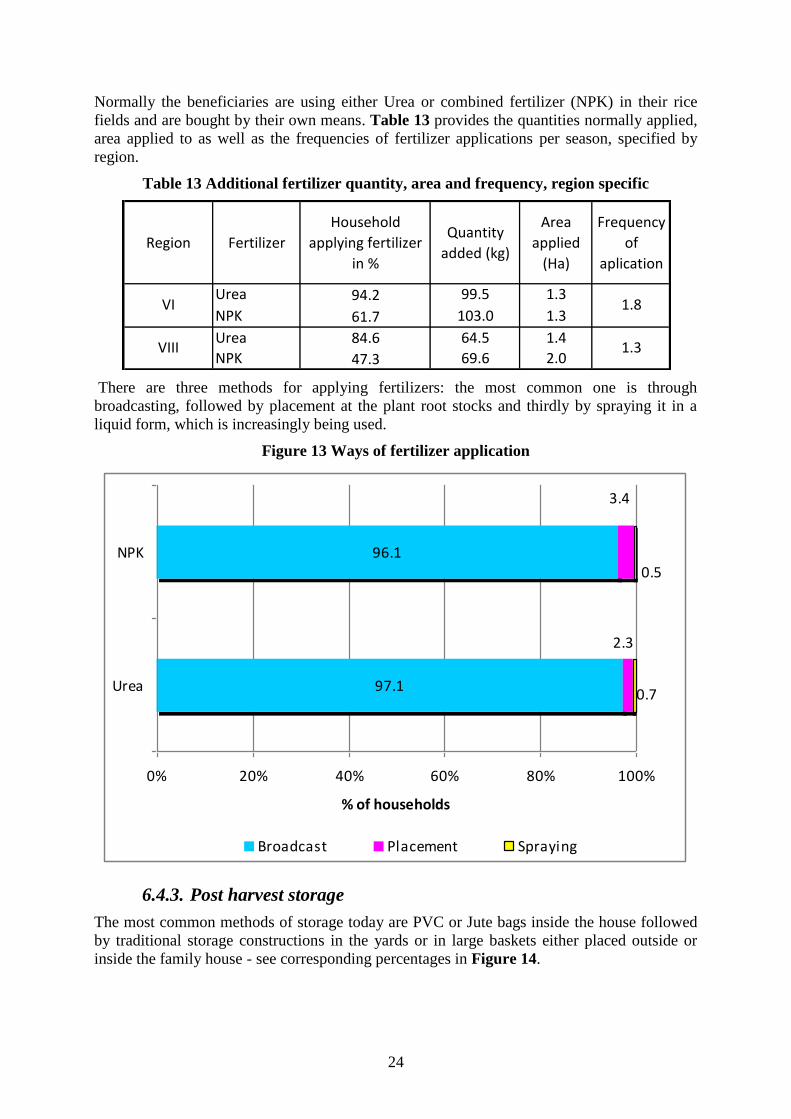
Normally the beneficiaries are using either Urea or combined fertilizer (NPK) in their rice
fields and are bought by their own means. Table 13 provides the quantities normally applied,
area applied to as well as the frequencies of fertilizer applications per season, specified by
region.
Table 13 Additional fertilizer quantity, area and frequency, region specific
There are three methods for applying fertilizers: the most common one is through
broadcasting, followed by placement at the plant root stocks and thirdly by spraying it in a
liquid form, which is increasingly being used.
Figure 13 Ways of fertilizer application
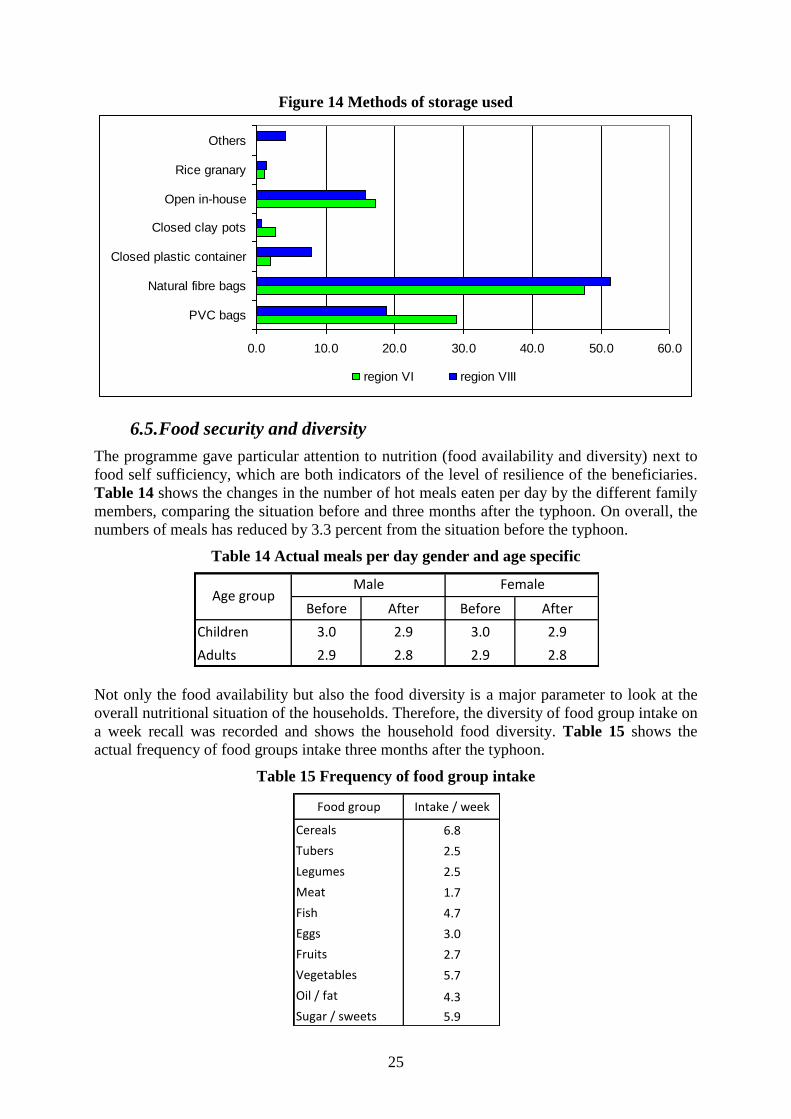
6.4.3. Post harvest storage
The most common methods of storage today are PVC or Jute bags inside the house followed
by traditional storage constructions in the yards or in large baskets either placed outside or
inside the family house - see corresponding percentages in Figure 14.
Region Fertilizer
Household
applying fertilizer
in %
Quantity
added (kg)
Area
applied
(Ha)
Frequency
of
aplication
Urea 94.2 99.5 1.3
NPK 61.7 103.0 1.3
Urea 84.6 64.5 1.4
NPK 47.3 69.6 2.0
1.8
1.3
VI
VIII
97.1
96.1
3.4
2.3
0.5
0.7
0% 20% 40% 60% 80% 100%
Urea
NPK
% of households
Broadcast Placement Spraying
25
Figure 14 Methods of storage used
6.5. Food security and diversity
The programme gave particular attention to nutrition (food availability and diversity) next to
food self sufficiency, which are both indicators of the level of resilience of the beneficiaries.
Table 14 shows the changes in the number of hot meals eaten per day by the different family
members, comparing the situation before and three months after the typhoon. On overall, the
numbers of meals has reduced by 3.3 percent from the situation before the typhoon.
Table 14 Actual meals per day gender and age specific
Not only the food availability but also the food diversity is a major parameter to look at the
overall nutritional situation of the households. Therefore, the diversity of food group intake on
a week recall was recorded and shows the household food diversity. Table 15 shows the
actual frequency of food groups intake three months after the typhoon.
Table 15 Frequency of food group intake
0.0 10.0 20.0 30.0 40.0 50.0 60.0
PVC bags
Natural fibre bags
Closed plastic container
Closed clay pots
Open in-house
Rice granary
Others
region VI region VIII
Before After Before After
Children 3.0 2.9 3.0 2.9
Adults 2.9 2.8 2.9 2.8
Age groupMale Female
Food group Intake / week
Cereals 6.8
Tubers 2.5
Legumes 2.5
Meat 1.7
Fish 4.7
Eggs 3.0
Fruits 2.7
Vegetables 5.7
Oil / fat 4.3
Sugar / sweets 5.9
24
12
50
12
78
60
20
67
34
56
34
30
32
12
40
30
12
34
54
45
40
12
0% 10% 20% 30% 40% 50% 60% 70% 80% 90% 100%
Tubers
Legumes
Meat
Fish
Eggs
Fruits
Vegetables
Oil / fat
Sugar / sweets
Own production Market / borrowed / on credit Gifts / food assistance Others sources
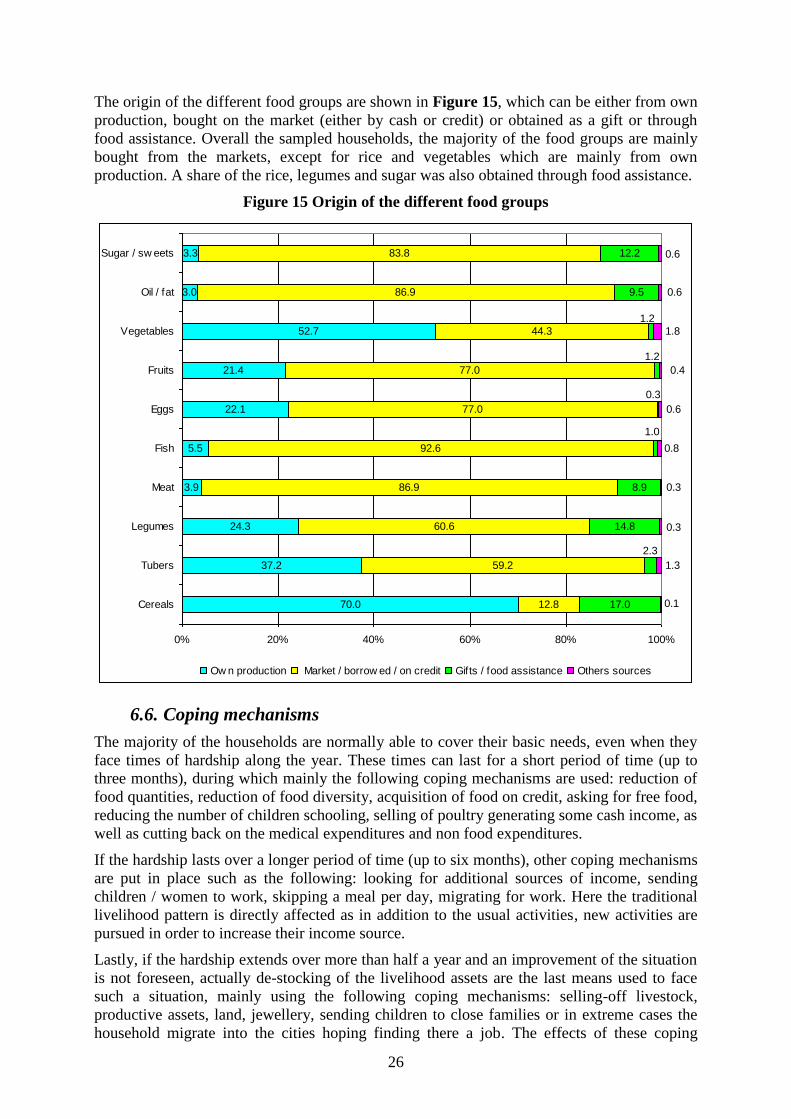
26
The origin of the different food groups are shown in Figure 15, which can be either from own
production, bought on the market (either by cash or credit) or obtained as a gift or through
food assistance. Overall the sampled households, the majority of the food groups are mainly
bought from the markets, except for rice and vegetables which are mainly from own
production. A share of the rice, legumes and sugar was also obtained through food assistance.
Figure 15 Origin of the different food groups
6.6. Coping mechanisms
The majority of the households are normally able to cover their basic needs, even when they
face times of hardship along the year. These times can last for a short period of time (up to
three months), during which mainly the following coping mechanisms are used: reduction of
food quantities, reduction of food diversity, acquisition of food on credit, asking for free food,
reducing the number of children schooling, selling of poultry generating some cash income, as
well as cutting back on the medical expenditures and non food expenditures.
If the hardship lasts over a longer period of time (up to six months), other coping mechanisms
are put in place such as the following: looking for additional sources of income, sending
children / women to work, skipping a meal per day, migrating for work. Here the traditional
livelihood pattern is directly affected as in addition to the usual activities, new activities are
pursued in order to increase their income source.
Lastly, if the hardship extends over more than half a year and an improvement of the situation
is not foreseen, actually de-stocking of the livelihood assets are the last means used to face
such a situation, mainly using the following coping mechanisms: selling-off livestock,
productive assets, land, jewellery, sending children to close families or in extreme cases the
household migrate into the cities hoping finding there a job. The effects of these coping
70.0
37.2
24.3
3.9
5.5
22.1
21.4
52.7
3.0
3.3
12.8
59.2
60.6
86.9
92.6
77.0
77.0
44.3
86.9
83.8
17.0
14.8
8.9
9.5
12.2
1.2
1.2
0.3
1.0
2.3
0.6
0.6
1.8
0.4
0.6
0.8
0.3
0.3
1.3
0.1
0% 20% 40% 60% 80% 100%
Cereals
Tubers
Legumes
Meat
Fish
Eggs
Fruits
Vegetables
Oil / fat
Sugar / sw eets
Ow n production Market / borrow ed / on credit Gifts / food assistance Others sources
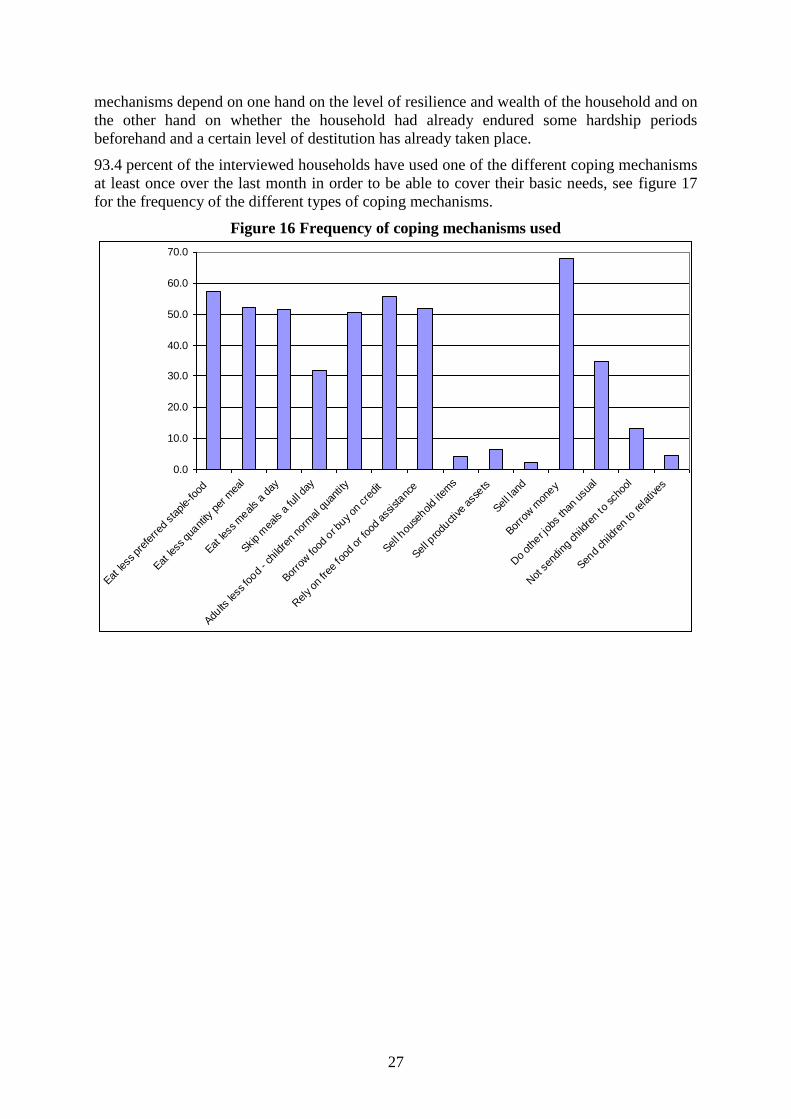
27
mechanisms depend on one hand on the level of resilience and wealth of the household and on
the other hand on whether the household had already endured some hardship periods
beforehand and a certain level of destitution has already taken place.
93.4 percent of the interviewed households have used one of the different coping mechanisms
at least once over the last month in order to be able to cover their basic needs, see figure 17
for the frequency of the different types of coping mechanisms.
Figure 16 Frequency of coping mechanisms used
0.0
10.0
20.0
30.0
40.0
50.0
60.0
70.0
Eat le
ss p
refe
rred
sta
ple-
food
Eat le
ss q
uant
ity p
er m
eal
Eat le
ss m
eals
a da
y
Skip
mea
ls a
full da
y
Adults
less
food
- chi
ldre
n no
rmal
qua
ntity
Borro
w fo
od o
r buy
on c
redit
Rel
y on
free
food
or f
ood
assistanc
e
Sell h
ouse
hold
item
s
Sell p
rodu
ctive
asse
ts
Sell lan
d
Borro
w m
oney
Do
othe
r job
s th
an u
sual
Not
sen
ding
chi
ldre
n to
sch
ool
Send
child
ren
to re
lativ
es
28
7. Feedback on the received FAO assistance and distribution process
7.1. Utilization of the received assistance and estimated production
Overall the beneficiary households 94 percent (rice) and 95 percent (fertilizer) have received
the foreseen quantities. An average of 41 kg of rice seeds and 50.5 kg of Urea fertilizer per
households was obtained instead of the foreseen 40 kg and 50 kg for fertilizer. The rice seeds
were planted on an average area of 0.8 ha, as well as the fertilizer. Table 16 shows the
utilization of the received inputs.
Table 16 Utilization of received inputs
Overall 44.4 percent of the beneficiary households have planted only the received FAO seeds,
where some 55.6 percent of beneficiary households have added own rice seeds, either from
their own previous season’s production, purchased on the market or received as a donation
from another humanitarian agency or from a government department. For households who
added their own seeds, the average amount of rice seed amounted to 91.6 kg. Resulting in a
replanted area of 1.4 ha in between the FAO and own added seeds.
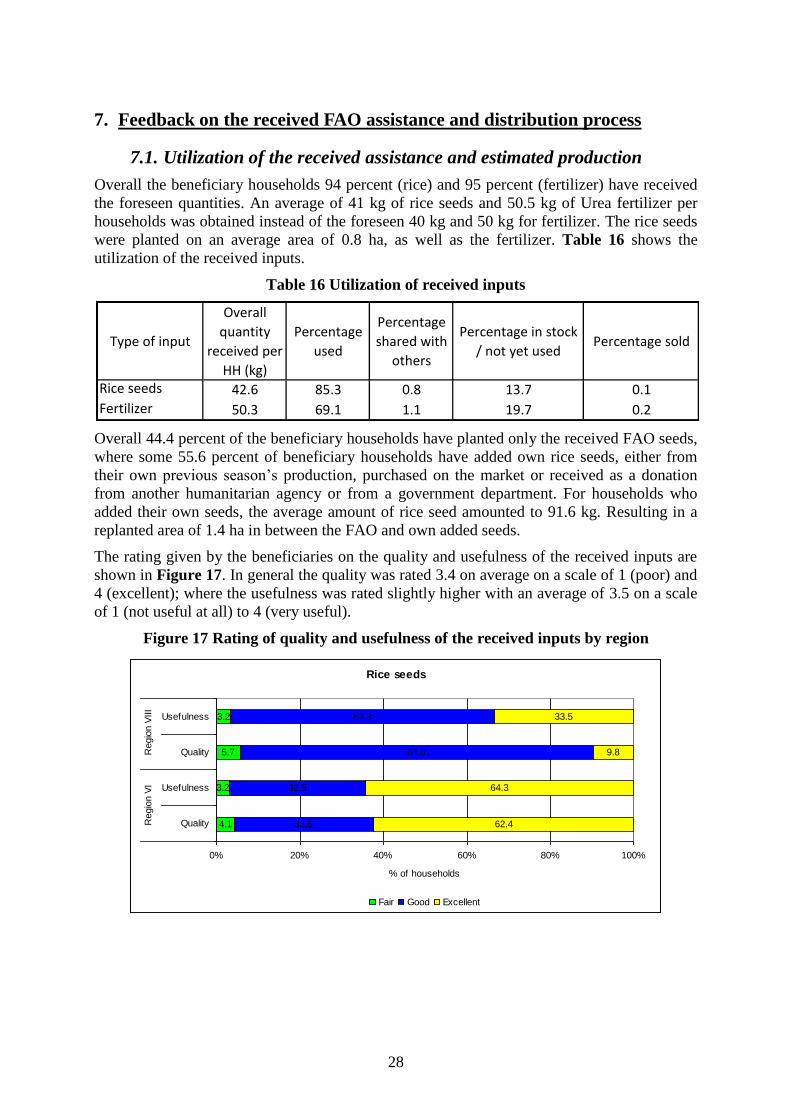
The rating given by the beneficiaries on the quality and usefulness of the received inputs are
shown in Figure 17. In general the quality was rated 3.4 on average on a scale of 1 (poor) and
4 (excellent); where the usefulness was rated slightly higher with an average of 3.5 on a scale
of 1 (not useful at all) to 4 (very useful).
Figure 17 Rating of quality and usefulness of the received inputs by region
Type of input
Overall
quantity
received per
HH (kg)
Percentage
used
Percentage
shared with
others
Percentage in stock
/ not yet usedPercentage sold
Rice seeds 42.6 85.3 0.8 13.7 0.1
Fertilizer 50.3 69.1 1.1 19.7 0.2
Rice seeds
4.1
3.2
5.7
3.2
33.5
32.5
84.6
63.3
62.4
64.3
9.8
33.5
0% 20% 40% 60% 80% 100%
Quality
Usefulness
Quality
Usefulness
Regio
n V
IR
egio
n V
III
% of households
Fair Good Excellent
29
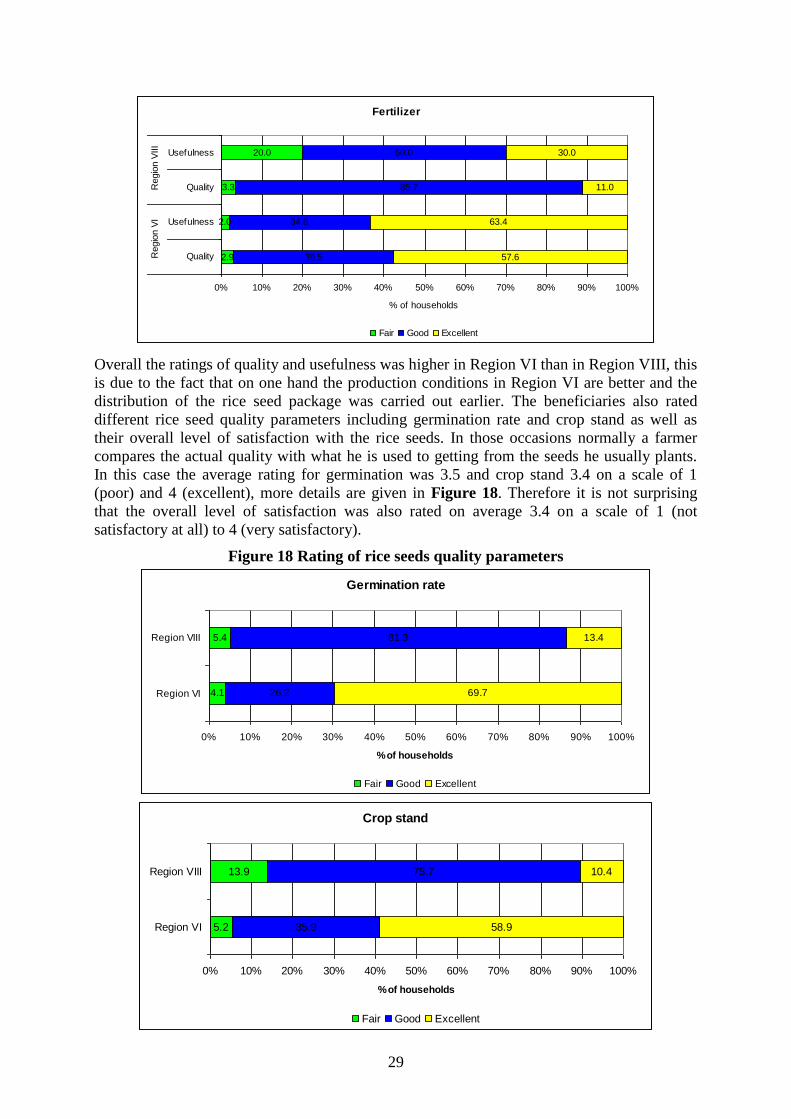
Overall the ratings of quality and usefulness was higher in Region VI than in Region VIII, this
is due to the fact that on one hand the production conditions in Region VI are better and the
distribution of the rice seed package was carried out earlier. The beneficiaries also rated
different rice seed quality parameters including germination rate and crop stand as well as
their overall level of satisfaction with the rice seeds. In those occasions normally a farmer
compares the actual quality with what he is used to getting from the seeds he usually plants.
In this case the average rating for germination was 3.5 and crop stand 3.4 on a scale of 1
(poor) and 4 (excellent), more details are given in Figure 18. Therefore it is not surprising
that the overall level of satisfaction was also rated on average 3.4 on a scale of 1 (not
satisfactory at all) to 4 (very satisfactory).
Figure 18 Rating of rice seeds quality parameters
Fertilizer
2.9
2.0
3.3
20.0
39.5
34.6
85.7
50.0
57.6
63.4
11.0
30.0
0% 10% 20% 30% 40% 50% 60% 70% 80% 90% 100%
Quality
Usefulness
Quality
UsefulnessR
egio
n V
IR
egio
n V
III
% of households
Fair Good Excellent
Germination rate
4.1
5.4
26.2
81.3
69.7
13.4
0% 10% 20% 30% 40% 50% 60% 70% 80% 90% 100%
Region VI
Region VIII
% of households
Fair Good Excellent
Crop stand
5.2
13.9
35.9
75.7
58.9
10.4
0% 10% 20% 30% 40% 50% 60% 70% 80% 90% 100%
Region VI
Region VIII
% of households
Fair Good Excellent
30
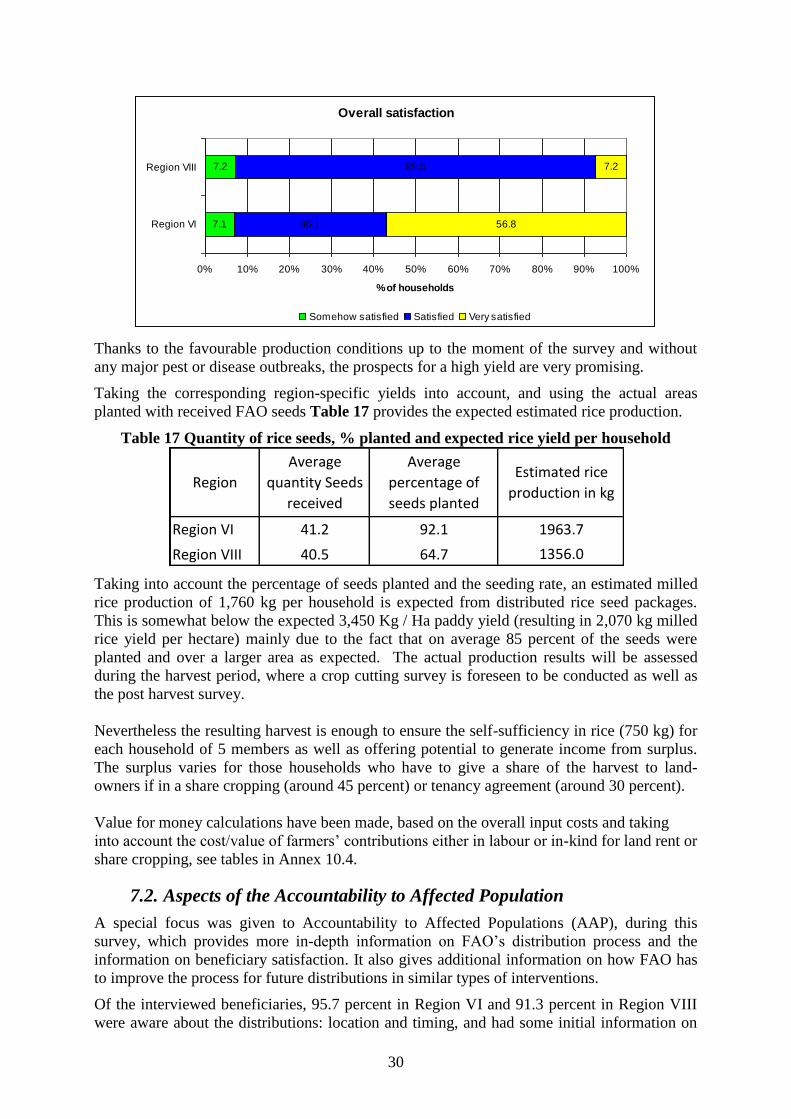
Thanks to the favourable production conditions up to the moment of the survey and without
any major pest or disease outbreaks, the prospects for a high yield are very promising.
Taking the corresponding region-specific yields into account, and using the actual areas
planted with received FAO seeds Table 17 provides the expected estimated rice production.
Table 17 Quantity of rice seeds, % planted and expected rice yield per household
Taking into account the percentage of seeds planted and the seeding rate, an estimated milled
rice production of 1,760 kg per household is expected from distributed rice seed packages.
This is somewhat below the expected 3,450 Kg / Ha paddy yield (resulting in 2,070 kg milled
rice yield per hectare) mainly due to the fact that on average 85 percent of the seeds were
planted and over a larger area as expected. The actual production results will be assessed
during the harvest period, where a crop cutting survey is foreseen to be conducted as well as
the post harvest survey.
Nevertheless the resulting harvest is enough to ensure the self-sufficiency in rice (750 kg) for
each household of 5 members as well as offering potential to generate income from surplus.
The surplus varies for those households who have to give a share of the harvest to land-
owners if in a share cropping (around 45 percent) or tenancy agreement (around 30 percent).
Value for money calculations have been made, based on the overall input costs and taking
into account the cost/value of farmers’ contributions either in labour or in-kind for land rent or
share cropping, see tables in Annex 10.4.
7.2. Aspects of the Accountability to Affected Population
A special focus was given to Accountability to Affected Populations (AAP), during this
survey, which provides more in-depth information on FAO’s distribution process and the
information on beneficiary satisfaction. It also gives additional information on how FAO has
to improve the process for future distributions in similar types of interventions.
Of the interviewed beneficiaries, 95.7 percent in Region VI and 91.3 percent in Region VIII
were aware about the distributions: location and timing, and had some initial information on
Overall satisfaction
7.1
7.2
36.1
85.5
56.8
7.2
0% 10% 20% 30% 40% 50% 60% 70% 80% 90% 100%
Region VI
Region VIII
% of households
Somehow satisfied Satisfied Very satisfied
Region
Average
quantity Seeds
received
Average
percentage of
seeds planted
Estimated rice
production in kg
Region VI 41.2 92.1 1963.7
Region VIII 40.5 64.7 1356.0
31
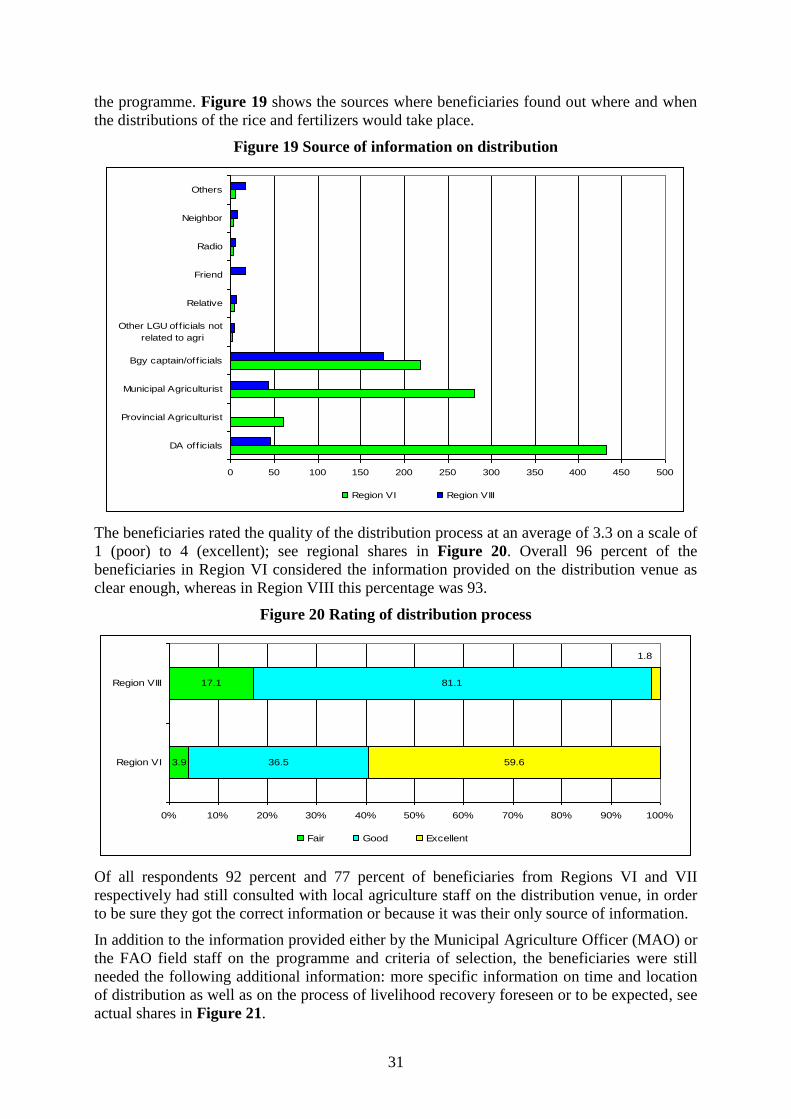
the programme. Figure 19 shows the sources where beneficiaries found out where and when
the distributions of the rice and fertilizers would take place.
Figure 19 Source of information on distribution
The beneficiaries rated the quality of the distribution process at an average of 3.3 on a scale of
1 (poor) to 4 (excellent); see regional shares in Figure 20. Overall 96 percent of the
beneficiaries in Region VI considered the information provided on the distribution venue as
clear enough, whereas in Region VIII this percentage was 93.
Figure 20 Rating of distribution process
Of all respondents 92 percent and 77 percent of beneficiaries from Regions VI and VII
respectively had still consulted with local agriculture staff on the distribution venue, in order
to be sure they got the correct information or because it was their only source of information.
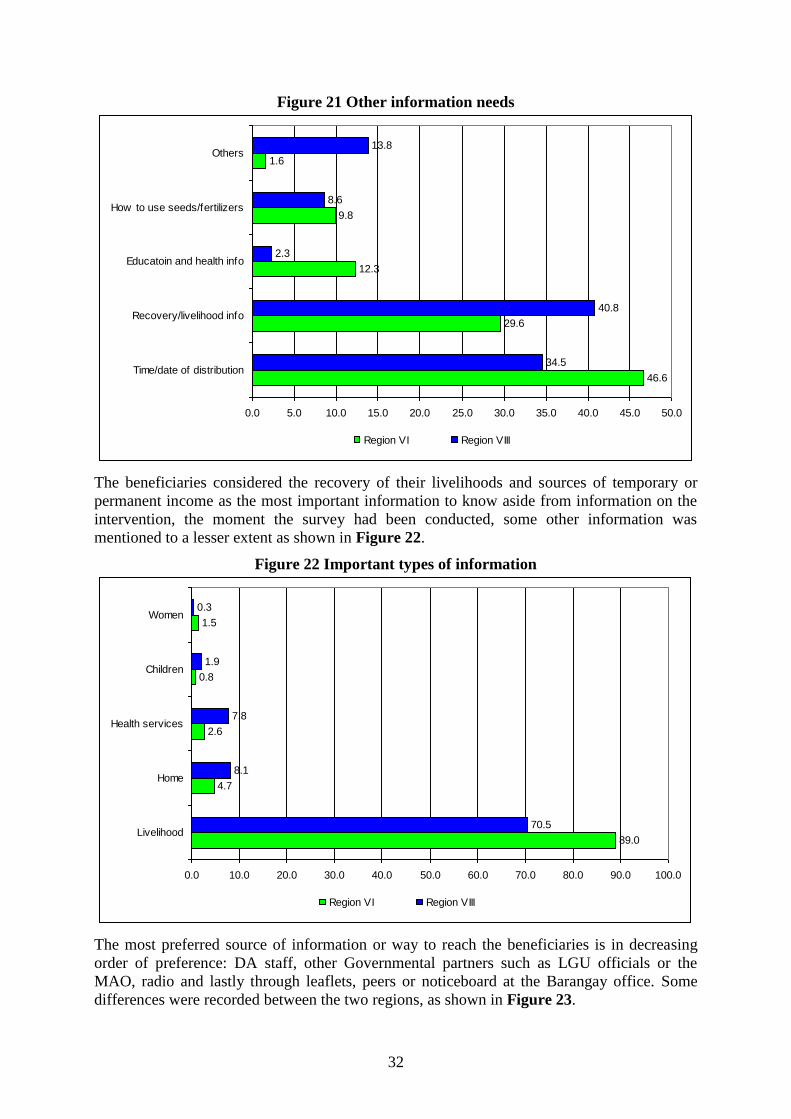
In addition to the information provided either by the Municipal Agriculture Officer (MAO) or
the FAO field staff on the programme and criteria of selection, the beneficiaries were still
needed the following additional information: more specific information on time and location
of distribution as well as on the process of livelihood recovery foreseen or to be expected, see
actual shares in Figure 21.
0 50 100 150 200 250 300 350 400 450 500
DA off icials
Provincial Agriculturist
Municipal Agriculturist
Bgy captain/off icials
Other LGU off icials not
related to agri
Relative
Friend
Radio
Neighbor
Others
Region VI Region VIII
3.9
17.1
36.5
81.1
59.6
1.8
0% 10% 20% 30% 40% 50% 60% 70% 80% 90% 100%
Region VI
Region VIII
Fair Good Excellent
32
Figure 21 Other information needs
The beneficiaries considered the recovery of their livelihoods and sources of temporary or
permanent income as the most important information to know aside from information on the
intervention, the moment the survey had been conducted, some other information was
mentioned to a lesser extent as shown in Figure 22.
Figure 22 Important types of information
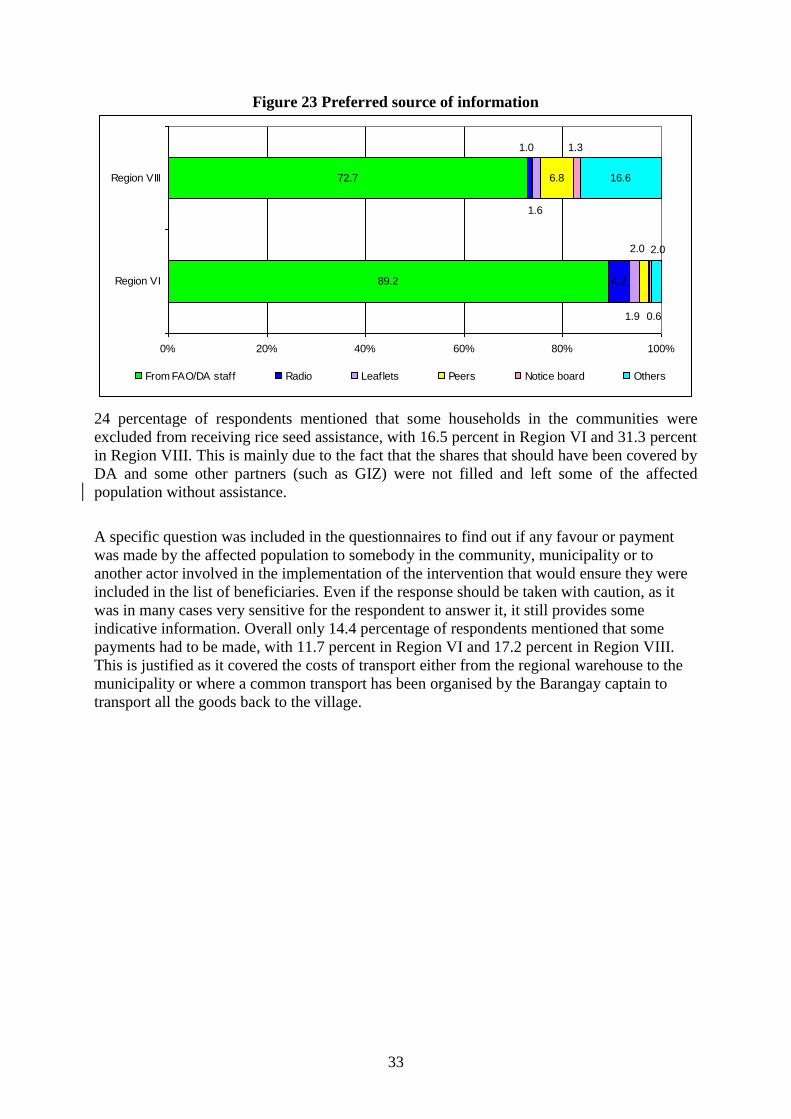
The most preferred source of information or way to reach the beneficiaries is in decreasing
order of preference: DA staff, other Governmental partners such as LGU officials or the
MAO, radio and lastly through leaflets, peers or noticeboard at the Barangay office. Some
differences were recorded between the two regions, as shown in Figure 23.
46.6
29.6
12.3
9.8
1.6
34.5
40.8
2.3
8.6
13.8
0.0 5.0 10.0 15.0 20.0 25.0 30.0 35.0 40.0 45.0 50.0
Time/date of distribution
Recovery/livelihood info
Educatoin and health info
How to use seeds/fertilizers
Others
Region VI Region VIII
89.0
4.7
2.6
0.8
1.5
70.5
8.1
7.8
1.9
0.3
0.0 10.0 20.0 30.0 40.0 50.0 60.0 70.0 80.0 90.0 100.0
Livelihood
Home
Health services
Children
Women
Region VI Region VIII
33
Figure 23 Preferred source of information
24 percentage of respondents mentioned that some households in the communities were
excluded from receiving rice seed assistance, with 16.5 percent in Region VI and 31.3 percent
in Region VIII. This is mainly due to the fact that the shares that should have been covered by
DA and some other partners (such as GIZ) were not filled and left some of the affected
population without assistance.
A specific question was included in the questionnaires to find out if any favour or payment
was made by the affected population to somebody in the community, municipality or to
another actor involved in the implementation of the intervention that would ensure they were
included in the list of beneficiaries. Even if the response should be taken with caution, as it
was in many cases very sensitive for the respondent to answer it, it still provides some
indicative information. Overall only 14.4 percentage of respondents mentioned that some
payments had to be made, with 11.7 percent in Region VI and 17.2 percent in Region VIII.
This is justified as it covered the costs of transport either from the regional warehouse to the
municipality or where a common transport has been organised by the Barangay captain to
transport all the goods back to the village.
89.2
72.7
4.2
6.8 16.6
1.0
1.9
1.6
2.0
0.6
1.3
2.0
0% 20% 40% 60% 80% 100%
Region VI
Region VIII
From FAO/DA staff Radio Leaflets Peers Notice board Others
34
8. Non-FAO Assistance
8.1. Non-FAO assistance received
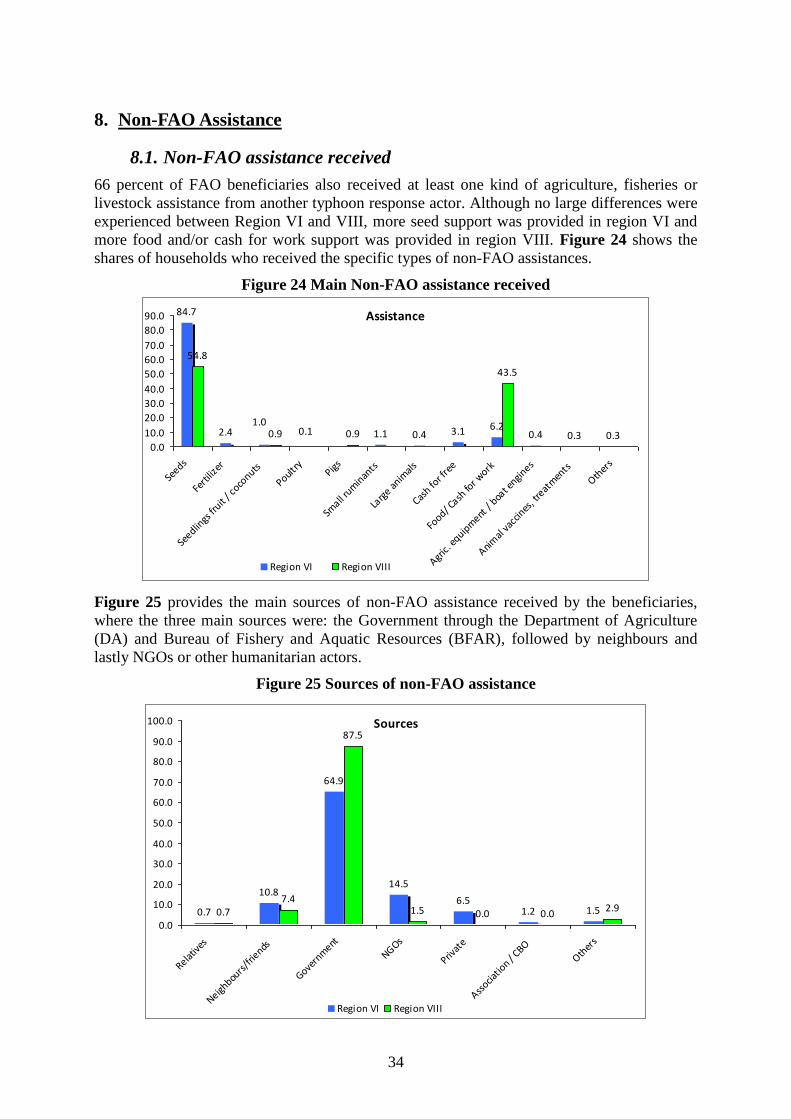
66 percent of FAO beneficiaries also received at least one kind of agriculture, fisheries or
livestock assistance from another typhoon response actor. Although no large differences were
experienced between Region VI and VIII, more seed support was provided in region VI and
more food and/or cash for work support was provided in region VIII. Figure 24 shows the
shares of households who received the specific types of non-FAO assistances.
Figure 24 Main Non-FAO assistance received
Figure 25 provides the main sources of non-FAO assistance received by the beneficiaries,
where the three main sources were: the Government through the Department of Agriculture
(DA) and Bureau of Fishery and Aquatic Resources (BFAR), followed by neighbours and
lastly NGOs or other humanitarian actors.
Figure 25 Sources of non-FAO assistance
Assistance84.7
2.4 1.1 0.4 3.1 6.20.4 0.3 0.3
54.8
0.9 0.9
43.5
1.00.1
0.0
10.0
20.0
30.0
40.0
50.0
60.0
70.0
80.0
90.0
Seeds
Ferti
lizer
Seedlin
gs fr
uit / c
oconuts
Poultry
Pigs
Small r
umin
ants
Larg
e anim
als
Cash fo
r fre
e
Food/ C
ash fo
r work
Agric.
equip
ment
/ boa
t engin
es
Animal
vacc
ines
, tre
atm
ents
Other
s
Region VI Region VIII
Sources
0.7
10.8
64.9
14.5
6.51.2 1.50.7
7.4
87.5
1.5 0.0 0.02.9
0.0
10.0
20.0
30.0
40.0
50.0
60.0
70.0
80.0
90.0
100.0
Relative
s
Neighbou
rs/fr
iends
Govern
ment
NGOs
Privat
e
Associa
tion /
CBO
Other
s
Region VI Region VIII
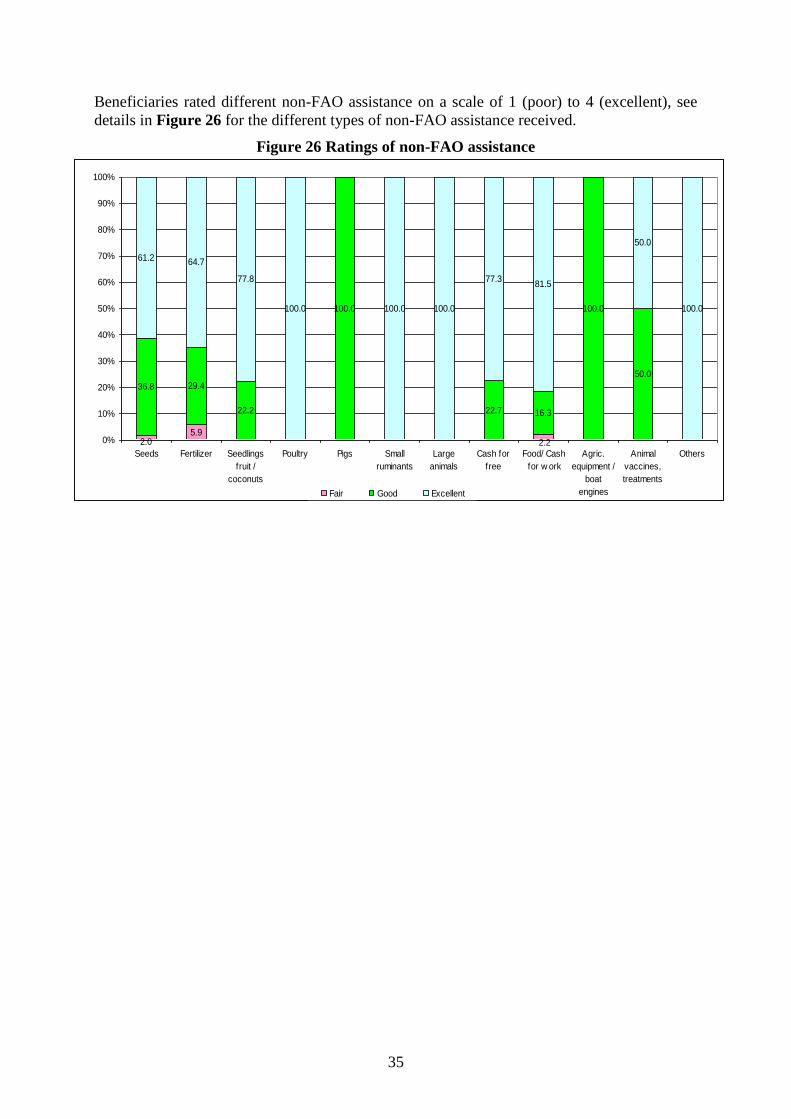
35
Beneficiaries rated different non-FAO assistance on a scale of 1 (poor) to 4 (excellent), see
details in Figure 26 for the different types of non-FAO assistance received.
Figure 26 Ratings of non-FAO assistance
5.9
36.8 29.4
22.2
100.0
22.7 16.3
100.0
50.0
61.2 64.7
77.8
100.0 100.0 100.0
77.381.5
50.0
100.0
2.22.00%
10%
20%
30%
40%
50%
60%
70%
80%
90%
100%
Seeds Fertilizer Seedlings
fruit /
coconuts
Poultry Pigs Small
ruminants
Large
animals
Cash for
free
Food/ Cash
for w ork
Agric.
equipment /
boat
engines
Animal
vaccines,
treatments
Others
Fair Good Excellent
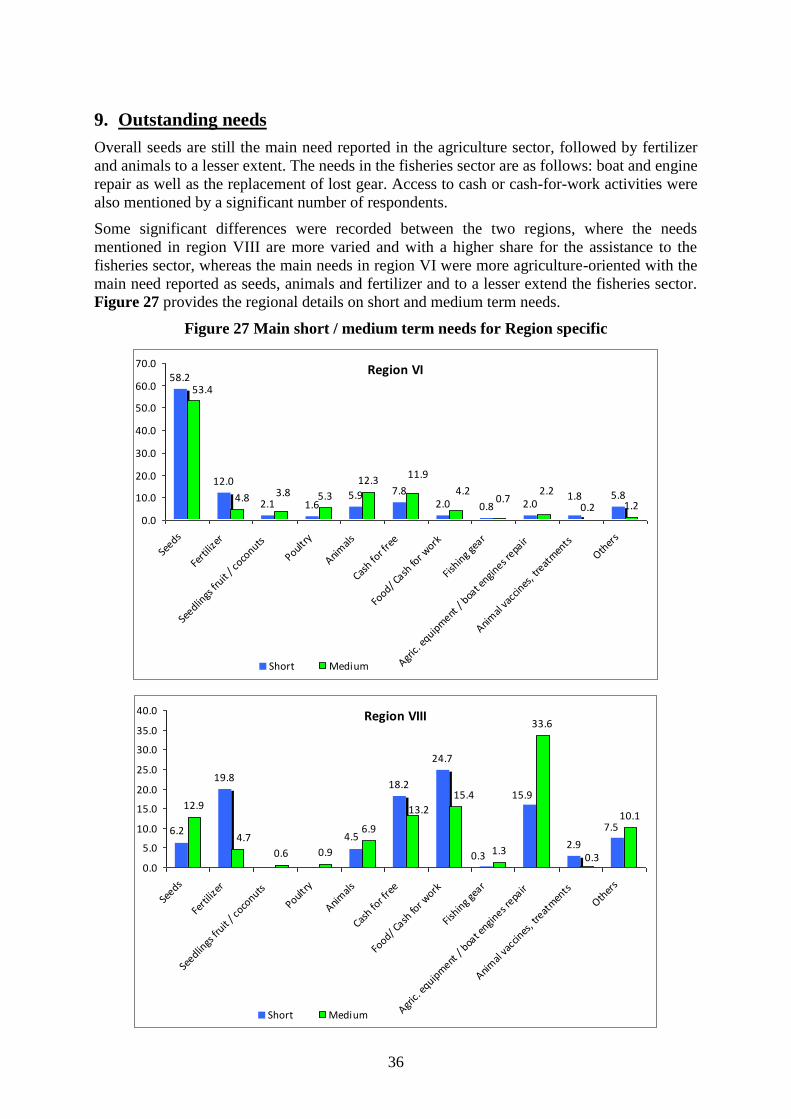
36
9. Outstanding needs
Overall seeds are still the main need reported in the agriculture sector, followed by fertilizer
and animals to a lesser extent. The needs in the fisheries sector are as follows: boat and engine
repair as well as the replacement of lost gear. Access to cash or cash-for-work activities were
also mentioned by a significant number of respondents.
Some significant differences were recorded between the two regions, where the needs
mentioned in region VIII are more varied and with a higher share for the assistance to the
fisheries sector, whereas the main needs in region VI were more agriculture-oriented with the
main need reported as seeds, animals and fertilizer and to a lesser extend the fisheries sector.
Figure 27 provides the regional details on short and medium term needs.
Figure 27 Main short / medium term needs for Region specific
Region VI58.2
12.0
2.1 1.65.9 7.8
2.0 0.8 2.05.85.3
12.3
0.2 1.21.8
53.4
4.8 3.8
11.9
4.2 2.20.7
0.0
10.0
20.0
30.0
40.0
50.0
60.0
70.0
Seeds
Ferti
lizer
Seedlin
gs fr
uit / c
oconuts
Poultry
Animals
Cash fo
r fre
e
Food/ C
ash fo
r work
Fishin
g gea
r
Agric.
equip
ment
/ boa
t engin
es repa
ir
Animal
vacc
ines
, tre
atm
ents
Other
s
Short Medium
Region VIII
19.818.2
24.7
2.9
12.9
0.6 0.9
6.9
1.3
33.6
10.1
6.24.5
7.5
15.9
0.3
15.4
13.2
0.3
4.7
0.0
5.0
10.0
15.0
20.0
25.0
30.0
35.0
40.0
Seeds
Ferti
lizer
Seedlin
gs fr
uit / c
oconuts
Poultry
Animals
Cash fo
r fre
e
Food/ C
ash fo
r work
Fishin
g gea
r
Agric.
equip
ment
/ boa
t engin
es repa
ir
Animal
vacc
ines
, tre
atm
ents
Other
s
Short Medium
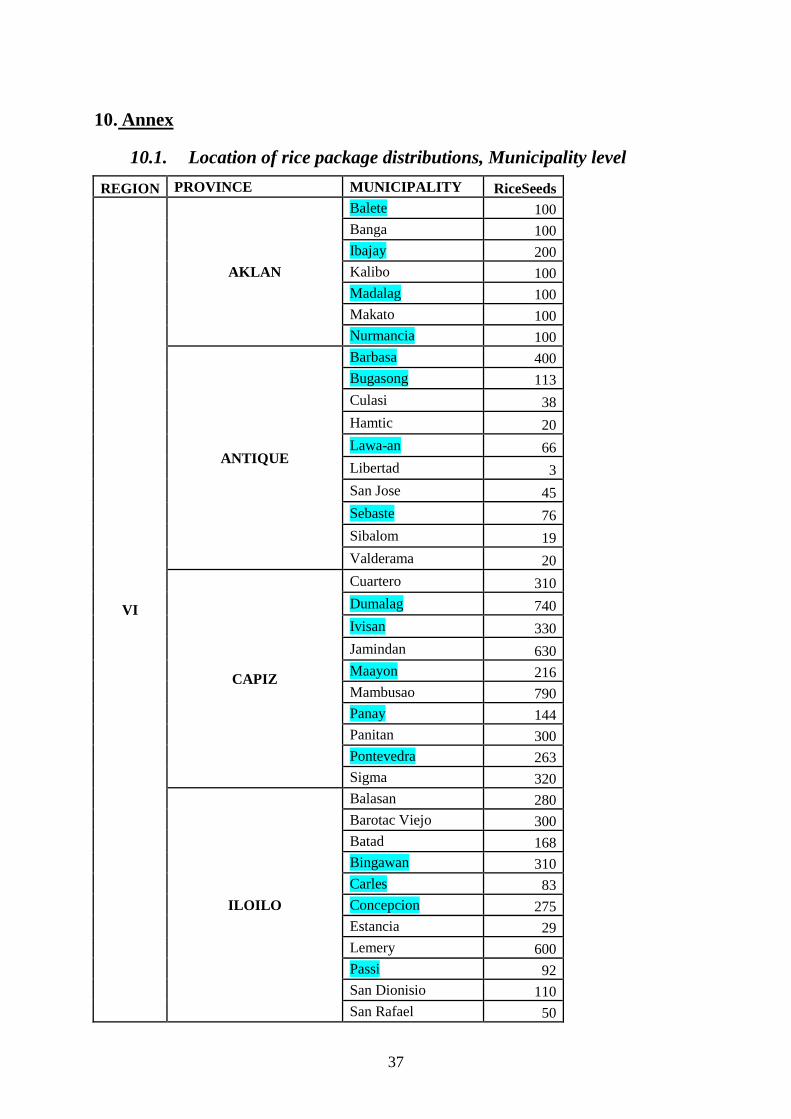
37
10. Annex
10.1. Location of rice package distributions, Municipality level
REGION PROVINCE MUNICIPALITY RiceSeeds
VI
AKLAN
Balete 100
Banga 100
Ibajay 200
Kalibo 100
Madalag 100
Makato 100
Nurmancia 100
ANTIQUE
Barbasa 400
Bugasong 113
Culasi 38
Hamtic 20
Lawa-an 66
Libertad 3
San Jose 45
Sebaste 76
Sibalom 19
Valderama 20
CAPIZ
Cuartero 310
Dumalag 740
Ivisan 330
Jamindan 630
Maayon 216
Mambusao 790
Panay 144
Panitan 300
Pontevedra 263
Sigma 320
ILOILO
Balasan 280
Barotac Viejo 300
Batad 168
Bingawan 310
Carles 83
Concepcion 275
Estancia 29
Lemery 600
Passi 92
San Dionisio 110
San Rafael 50
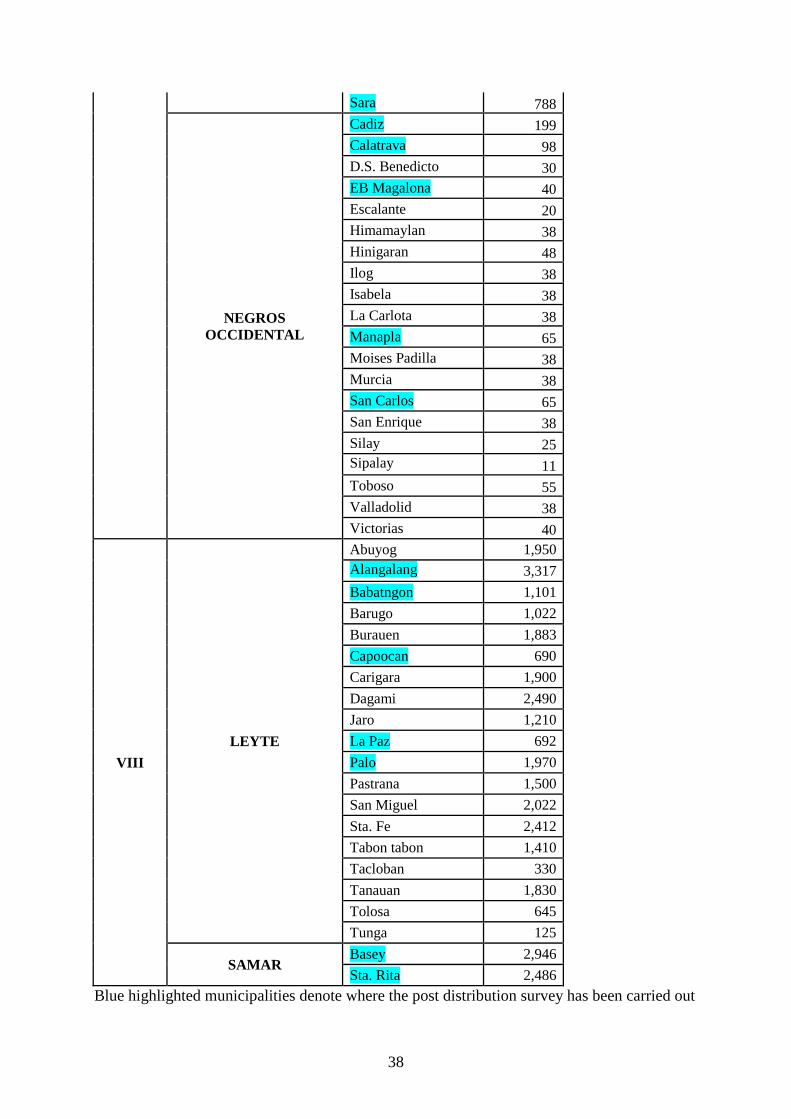
38
Sara 788
NEGROS
OCCIDENTAL
Cadiz 199
Calatrava 98
D.S. Benedicto 30
EB Magalona 40
Escalante 20
Himamaylan 38
Hinigaran 48
Ilog 38
Isabela 38
La Carlota 38
Manapla 65
Moises Padilla 38
Murcia 38
San Carlos 65
San Enrique 38
Silay 25
Sipalay 11
Toboso 55
Valladolid 38
Victorias 40
VIII
LEYTE
Abuyog 1,950
Alangalang 3,317
Babatngon 1,101
Barugo 1,022
Burauen 1,883
Capoocan 690
Carigara 1,900
Dagami 2,490
Jaro 1,210
La Paz 692
Palo 1,970
Pastrana 1,500
San Miguel 2,022
Sta. Fe 2,412
Tabon tabon 1,410
Tacloban 330
Tanauan 1,830
Tolosa 645
Tunga 125
SAMAR Basey 2,946
Sta. Rita 2,486
Blue highlighted municipalities denote where the post distribution survey has been carried out
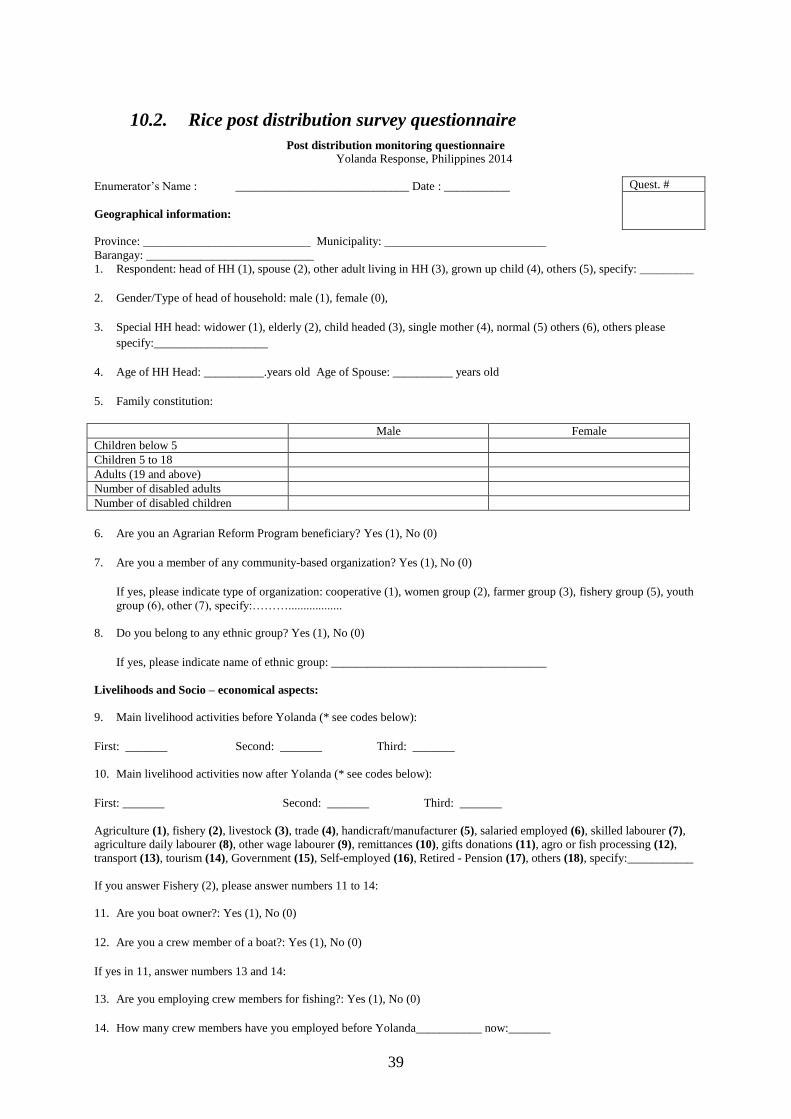
39
10.2. Rice post distribution survey questionnaire
Post distribution monitoring questionnaire
Yolanda Response, Philippines 2014
Enumerator’s Name : _____________________________ Date : ___________
Geographical information:
Province: ____________________________ Municipality: ___________________________
Barangay: ____________________________
1. Respondent: head of HH (1), spouse (2), other adult living in HH (3), grown up child (4), others (5), specify: _________
2. Gender/Type of head of household: male (1), female (0),
3. Special HH head: widower (1), elderly (2), child headed (3), single mother (4), normal (5) others (6), others please
specify:___________________
4. Age of HH Head: __________.years old Age of Spouse: __________ years old
5. Family constitution:
Male Female
Children below 5
Children 5 to 18
Adults (19 and above)
Number of disabled adults
Number of disabled children
6. Are you an Agrarian Reform Program beneficiary? Yes (1), No (0)
7. Are you a member of any community-based organization? Yes (1), No (0)
If yes, please indicate type of organization: cooperative (1), women group (2), farmer group (3), fishery group (5), youth
group (6), other (7), specify:………..................
8. Do you belong to any ethnic group? Yes (1), No (0)
If yes, please indicate name of ethnic group: ____________________________________
Livelihoods and Socio – economical aspects:
9. Main livelihood activities before Yolanda (* see codes below):
First: _______ Second: _______ Third: _______
10. Main livelihood activities now after Yolanda (* see codes below):
First: _______ Second: _______ Third: _______
Agriculture (1), fishery (2), livestock (3), trade (4), handicraft/manufacturer (5), salaried employed (6), skilled labourer (7),
agriculture daily labourer (8), other wage labourer (9), remittances (10), gifts donations (11), agro or fish processing (12),
transport (13), tourism (14), Government (15), Self-employed (16), Retired - Pension (17), others (18), specify:___________
If you answer Fishery (2), please answer numbers 11 to 14:
11. Are you boat owner?: Yes (1), No (0)
12. Are you a crew member of a boat?: Yes (1), No (0)
If yes in 11, answer numbers 13 and 14:
13. Are you employing crew members for fishing?: Yes (1), No (0)
14. How many crew members have you employed before Yolanda___________ now:_______
Quest. #
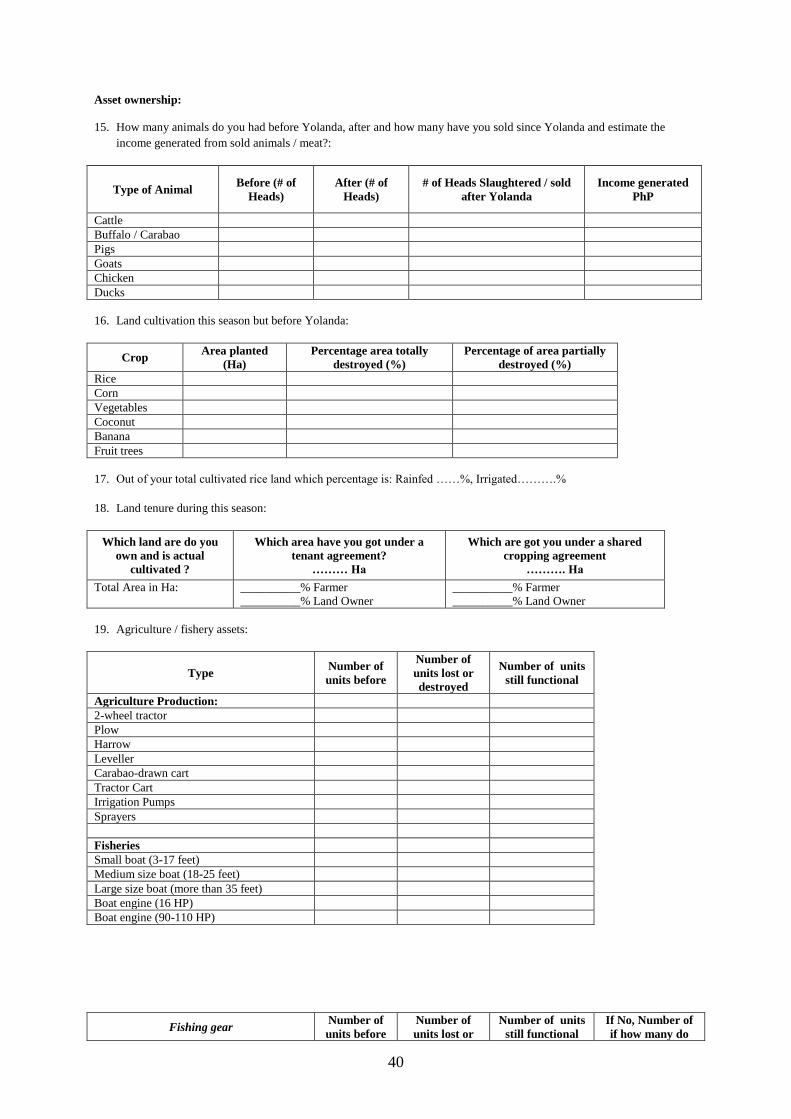
40
Asset ownership:
15. How many animals do you had before Yolanda, after and how many have you sold since Yolanda and estimate the
income generated from sold animals / meat?:
Type of Animal Before (# of
Heads)
After (# of
Heads)
# of Heads Slaughtered / sold
after Yolanda
Income generated
PhP
Cattle
Buffalo / Carabao
Pigs
Goats
Chicken
Ducks
16. Land cultivation this season but before Yolanda:
Crop Area planted
(Ha)
Percentage area totally
destroyed (%)
Percentage of area partially
destroyed (%)
Rice
Corn
Vegetables
Coconut
Banana
Fruit trees
17. Out of your total cultivated rice land which percentage is: Rainfed ……%, Irrigated……….%
18. Land tenure during this season:
Which land are do you
own and is actual
cultivated ?
Which area have you got under a
tenant agreement?
……… Ha
Which are got you under a shared
cropping agreement
………. Ha
Total Area in Ha:
__________% Farmer
__________% Land Owner
__________% Farmer
__________% Land Owner
19. Agriculture / fishery assets:
Type Number of
units before
Number of
units lost or
destroyed
Number of units
still functional
Agriculture Production:
2-wheel tractor
Plow
Harrow
Leveller
Carabao-drawn cart
Tractor Cart
Irrigation Pumps
Sprayers
Fisheries
Small boat (3-17 feet)
Medium size boat (18-25 feet)
Large size boat (more than 35 feet)
Boat engine (16 HP)
Boat engine (90-110 HP)
Fishing gear Number of
units before
Number of
units lost or
Number of units
still functional
If No, Number of
if how many do
41
destroyed you still need
Hooks and lines (#hooks)
Cast nets (Throw Nets)
Ring nets
Bag nets
Cages (panggal)
Net1
Net2
Fish drying equip.
Fish smoking equip.
Mariculture Type or
characteristic
Area Before Area totally
destroyed
Area partially
destroyed
Sea weed farm Ha
Fish / shrimp farm Ha
Crab / oyster farm Ha
Food security and income:
20. How many meals have your HH members eaten yesterday and normally before Yolanda?
Male Female
Time period Before Yolanda Yesterday Before Yolanda Yesterday
Children
Adults
21. How often have you consumed the following items over the last week, and what are the sources of those items in
percentages?
Food items Frequency /
week
Sources of food groups in % of total
Own production
Market /
borrowed / on
credit
Gifts / food
assistance Others sources
Rice
Tubers
Legumes
Meat
Fish
Eggs
Fruits
Vegetables
Oil / fat
Sugar / sweets
Income generated from own produced goods
22. How have you used your own produced goods over the last month, and estimate the income it has generated?:
Items % Consumed at
home
% Given away
for free / shared % Sold
If sold, how much
income (Php)
Vegetables
Milk
Eggs
Fish catch
Rice
Corn
42
Coping mechanisms:
23. Over the last 30 days after Yolanda, have you done at least one of the following actions?
Items Yes (1), No
(0) Items
Yes (1), No
(0)
Eat less preferred staple-food Sell household items
Eat less quantity per meal Sell productive assets
Eat less meals a day Sell land
Skip meals a full day Borrow money
Adults less food - children normal quantity Do other jobs than usual
Borrow food or buy on credit Not sending children to school
Rely on free food or food assistance Send children to relatives
Credits:
24. Had you debts before Yolanda?: Yes (1), No (0)
25. How much was the amount before Yolanda?: Php_______________
26. Have you taken new credits since Yolanda?: Yes (1), No (0)
27. How much was the amount of new credits?: Php_______________
Assistance:
28. Access to and utilization of FAO input
29. Which quantity of rice seeds have you planted in addition to the FAO seeds: ……..…kg
30. Quality and usefulness of FAO inputs:
Type of input Rating of quality (refer to
ratings below)
Rating of usefulness*, (refer to
ratings below)
Rice seeds
Urea fertilizer
Hoe
Shovel
Machete
Rating: poor (1), fair (2), good (3), excellent (4)
Agricultural practices:
Seed storage:
31. Where or how are you storing your seed stocks? (circle maximum three) in PVC bags (1), natural fibre bags (2), closed
plastic container (3), closed clay pots (4), open in-house (5), Rice granary (6), others (7), specify:
___________________
32. How have you prepared the land? (cicle maximum three): Manual (1), with animal traction (2), by motor-cultivator 2
wheel tractor (3), by 4 wheel tractor (4), others (5), please specify:………
33. Type of rice seeds used before Yolanda in percentage: Hybrid seed: …..%, Certified seeds: ……%, local varieties:
……………%
Type of input
Variety
Planted
(Rice)
Quantity received
in kg
Percentage
planted / used
until now
Percentage
shared to
others
Percentage in
stock / not yet
used
Percentage
sold
Area
Planted
(Ha)
Rice seeds
Fertilizer
Tools Nbrs. received Nbrs in use Nbrs shared Nbrs stock Nbrs sold
Hoe
Shovel
Machete
43
34. How have you sown the seeds? (Choose one between Direct Seeding or Transplanting)
Direct Seeding (DS) (1) Transplanting (TPL) (0)
If you did DS: If you did TPL:
Broadcasting (0) 1st Step 2nd Step
Direct-drill (1) Wet Bed (1) Straight Row (0)
Dapog (2) Random Planting (1)
Dry Bed (3)
If Transplanting method was selected:
35. After how many days you transplant the seedlings? ______________days
36. Fertilizer Application:
Type Quantity (kg) Mode* On which area (Ha) Number of times until now
Urea
NPK
*Codes for mode: (1) Broadcast, (2) Placement (3) spraying
37. Main source of water for farming (tick only one): Rainfall (1), Irrigation (2), Natural effluents (river, basin, lake, …) (3),
Pumped groundwater (4), Others (5), please, specify: …………………………
Feedback on received seeds until now:
38. How would you rate the germination of the FAO seeds: poor (below 40%) (1); fair (60% to 40%) (2), Good (61 to 84%)
(3), Excellent (above 85%) (4)
39. How would you rate the crop stand until now: Poor (1), Fair (2), Good (3), Excellent (4)
40. Are you satisfied with the seeds from FAO?: Not Satisfied at all (1), somehow satisfied (2), Satisfied (3), Very Satisfied
(4)
Accountability to Affected Population:
41. How did you hear of planned distributions?: Through (Check maximum three): DA officials/employees (Regional,
Provincial, and/or Municipal) (1), Provincial Agriculturists (2), Municipal Agriculturists (3), Barangay captains and/or
Barangay officials (4), Other LGU officials not related to agriculture (5), relative (6), friend (7), radio (8), neighbour (9),
others (10) please specify:____________
42. Was the information clearly provided? Yes (1), No (0)
43. Did a local agriculture staff speak with you about the project? (probe assessment and validation): Yes (1), No (0)
44. Did you receive information about the process of distribution and what you are entitled to receive? Yes (1), No (0)
45. Are you aware what the distribution is for? Yes (1), No (0)
46. What other information would you be interested to know? (Check maximum three): time/date of distributions (1),
Recovery/livelihood info (2), education and health info (3), how to use seeds/fertilizers (4), others (5), specify:
________________
47. What kind of information is important for you? (Check maximum three): livelihood (1), home (2), health services (3),
children (4), women (5), other (6), specify:____________
48. How would you like to receive information about the seeds/fertilizers/agri inputs? (Check one): from FAO/DA staff (1),
radio (2), leaflets (3), peers (4), notice board (5), others (6), specify __________
49. Rank the way the distribution was organized: Poor (1), Fair (2), Good (3), Excellent (4)
50. Did you notice vulnerable households who were excluded from the list?: Yes (1), No (0) If yes, specify which
one:___________________
51. Did you have to pay, give part of the assistance, or provide special favours to anyone in order to be on the beneficiaries
list?: Yes (1), No (0), If yes, specify to who: ): DA officials/employees (Regional, Provincial, and/or Municipal) (1),
44
Provincial Agriculturists (2), Municipal Agriculturists (3), Barangay captains and/or Barangay officials (4), Other LGU
officials not related to agriculture (5), others (6) please specify:…………….
Other assistance received:
52. Which other agriculture, fishery or livestock assistance have you received since Yolanda:
Type of assistance received
*see codes Quantity received
Source of assistance ** see
codes
Rank usefulness ***
see codes
*Codes for assistance: seeds (1) fertilizer (2), seedlings fruit / coconut trees (3), poultry (4), pigs (5), small ruminants (6),
large animals - cattle / Carabao (7), cash for free (8), Food or cash / work (9), boat replacement or repair (10), fishing gear
(11), replacement or repair agriculture machinery or boat engines (12), animal vaccination /medicament / treatment (13),
others (14), specify: ………………………
** Codes for sources: relatives (1), neighbours/friends (2), government (3), NGO (4), private (5), associations / people
groups (6), others (7), specify:_________________________
*** Codes for usefulness: poor (1), fair (2), good (3), excellent (4)
Outstanding Needs:
Three main needs related to agriculture, fishery or livestock:
53. Short term / immediate needs * (within the next 3 month until next rice harvest).
1st :_________________ 2nd :____________________ 3rd: __________________
54. Medium term needs * (after the upcoming rice harvest until end of the next monsoon).
1st :_________________ 2nd :____________________ 3rd: __________________
*Codes for needs: seeds (1) fertilizer (2), seedlings fruit / coconut trees (3), poultry (4), pigs (5), small ruminants (6), large
animals - cattle / Carabao (7), cash for free (8), Food or cash / work (9), boat replacement or repair (10), fishing gear (11),
replacement or repair agriculture machinery or boat engines (12), animal vaccination /medicament / treatment (13), others
(14), specify: ………………………
55. what is the area for rice which you are normally cultivating………………ha,
and how many bags are you normally production from this area:…………………bags.
THANK YOU VERY MUCH FOR YOUR TIME
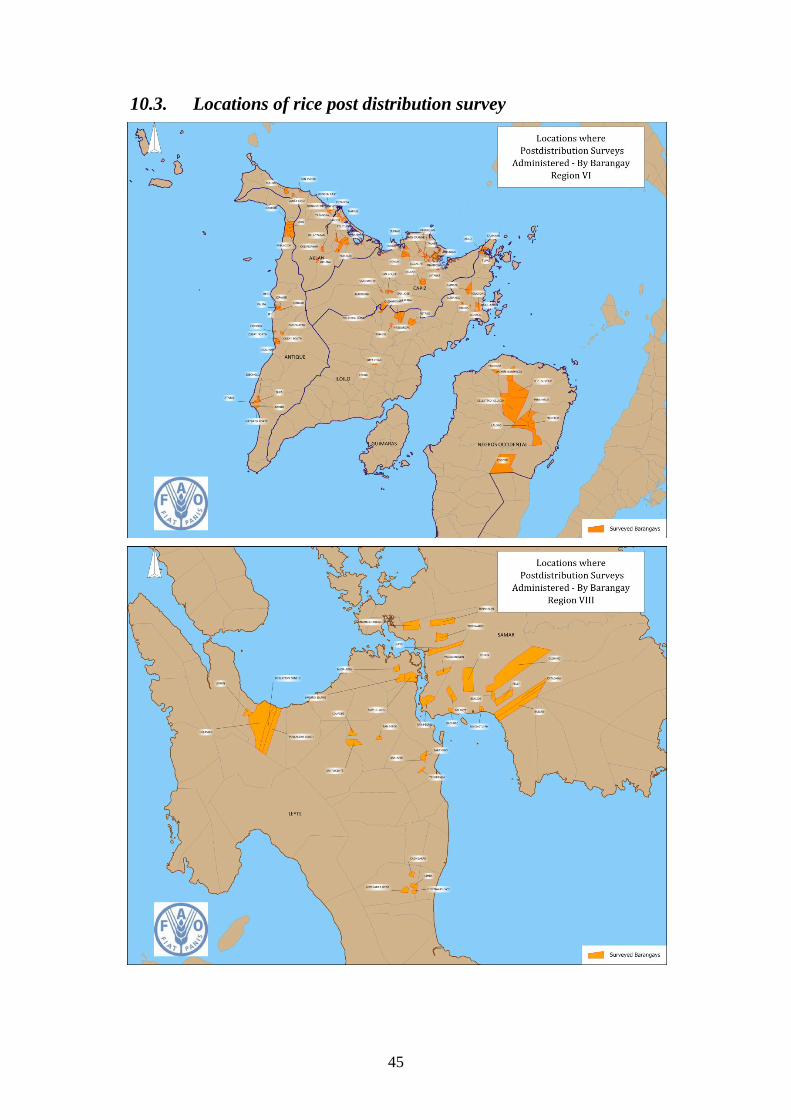
45
10.3. Locations of rice post distribution survey
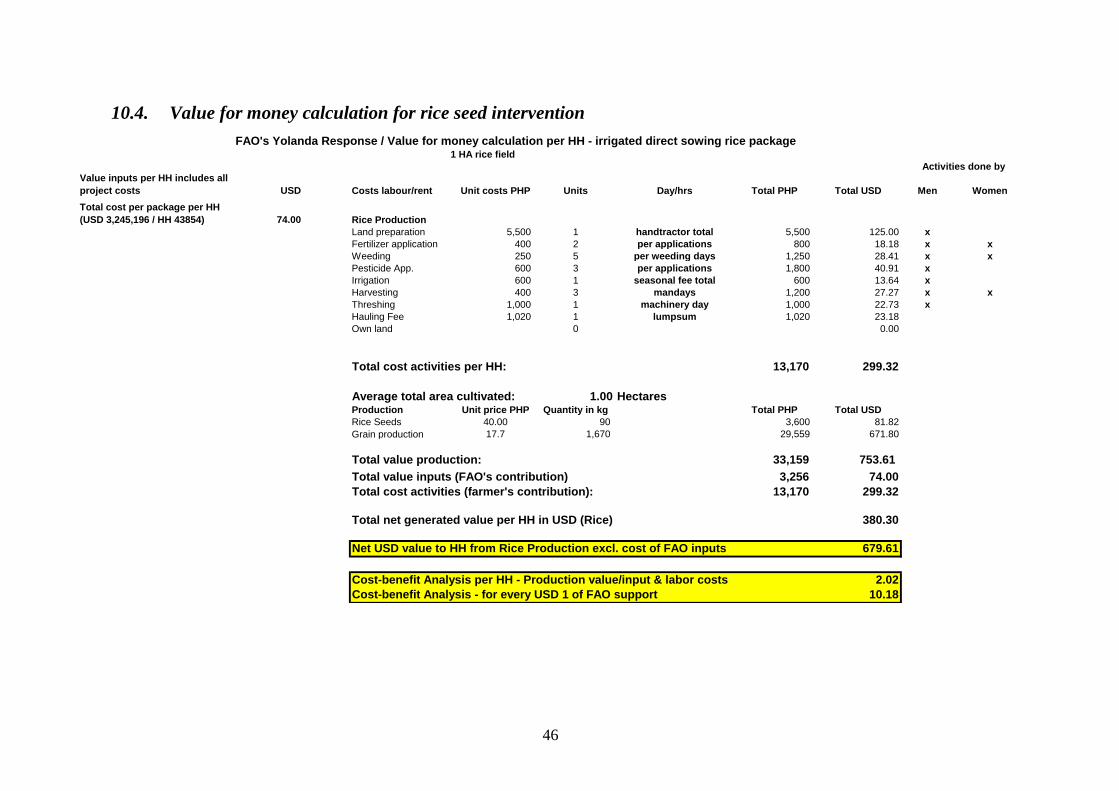
46
10.4. Value for money calculation for rice seed intervention
Value inputs per HH includes all
project costs USD Costs labour/rent Unit costs PHP Units Day/hrs Total PHP Total USD Men Women
Total cost per package per HH
(USD 3,245,196 / HH 43854) 74.00 Rice Production
Land preparation 5,500 1 handtractor total 5,500 125.00 x
Fertilizer application 400 2 per applications 800 18.18 x x
Weeding 250 5 per weeding days 1,250 28.41 x x
Pesticide App. 600 3 per applications 1,800 40.91 x
Irrigation 600 1 seasonal fee total 600 13.64 x
Harvesting 400 3 mandays 1,200 27.27 x x
Threshing 1,000 1 machinery day 1,000 22.73 x
Hauling Fee 1,020 1 lumpsum 1,020 23.18
Own land 0 0.00
Total cost activities per HH: 13,170 299.32
Average total area cultivated: 1.00 HectaresProduction Unit price PHP Quantity in kg Total PHP Total USD
Rice Seeds 40.00 90 3,600 81.82
Grain production 17.7 1,670 29,559 671.80
Total value production: 33,159 753.61
Total value inputs (FAO's contribution) 3,256 74.00
Total cost activities (farmer's contribution): 13,170 299.32
Total net generated value per HH in USD (Rice) 380.30
Net USD value to HH from Rice Production excl. cost of FAO inputs 679.61
Cost-benefit Analysis per HH - Production value/input & labor costs 2.02
Cost-benefit Analysis - for every USD 1 of FAO support 10.18
FAO's Yolanda Response / Value for money calculation per HH - irrigated direct sowing rice package1 HA rice field
Activities done by
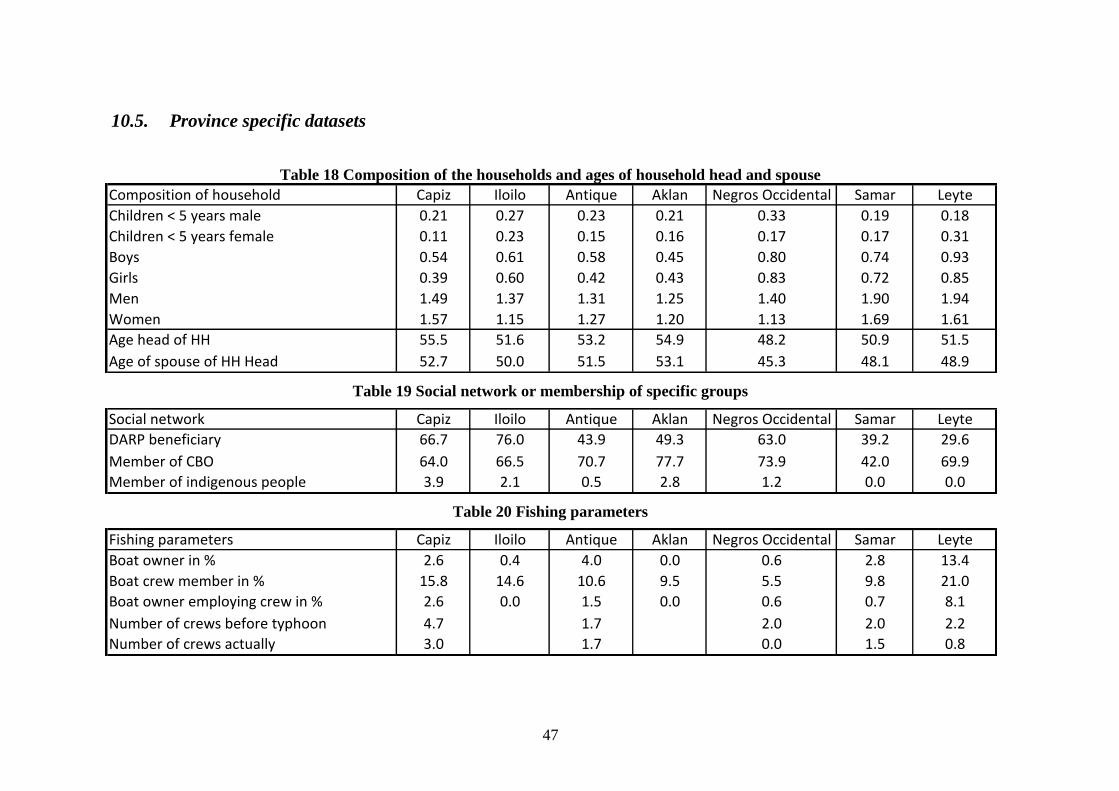
47
10.5. Province specific datasets
Table 18 Composition of the households and ages of household head and spouse
Table 19 Social network or membership of specific groups
Table 20 Fishing parameters
Composition of household Capiz Iloilo Antique Aklan Negros Occidental Samar Leyte
Children < 5 years male 0.21 0.27 0.23 0.21 0.33 0.19 0.18
Children < 5 years female 0.11 0.23 0.15 0.16 0.17 0.17 0.31
Boys 0.54 0.61 0.58 0.45 0.80 0.74 0.93
Girls 0.39 0.60 0.42 0.43 0.83 0.72 0.85
Men 1.49 1.37 1.31 1.25 1.40 1.90 1.94
Women 1.57 1.15 1.27 1.20 1.13 1.69 1.61
Age head of HH 55.5 51.6 53.2 54.9 48.2 50.9 51.5
Age of spouse of HH Head 52.7 50.0 51.5 53.1 45.3 48.1 48.9
Social network Capiz Iloilo Antique Aklan Negros Occidental Samar Leyte
DARP beneficiary 66.7 76.0 43.9 49.3 63.0 39.2 29.6
Member of CBO 64.0 66.5 70.7 77.7 73.9 42.0 69.9
Member of indigenous people 3.9 2.1 0.5 2.8 1.2 0.0 0.0
Fishing parameters Capiz Iloilo Antique Aklan Negros Occidental Samar Leyte
Boat owner in % 2.6 0.4 4.0 0.0 0.6 2.8 13.4
Boat crew member in % 15.8 14.6 10.6 9.5 5.5 9.8 21.0
Boat owner employing crew in % 2.6 0.0 1.5 0.0 0.6 0.7 8.1
Number of crews before typhoon 4.7 1.7 2.0 2.0 2.2
Number of crews actually 3.0 1.7 0.0 1.5 0.8
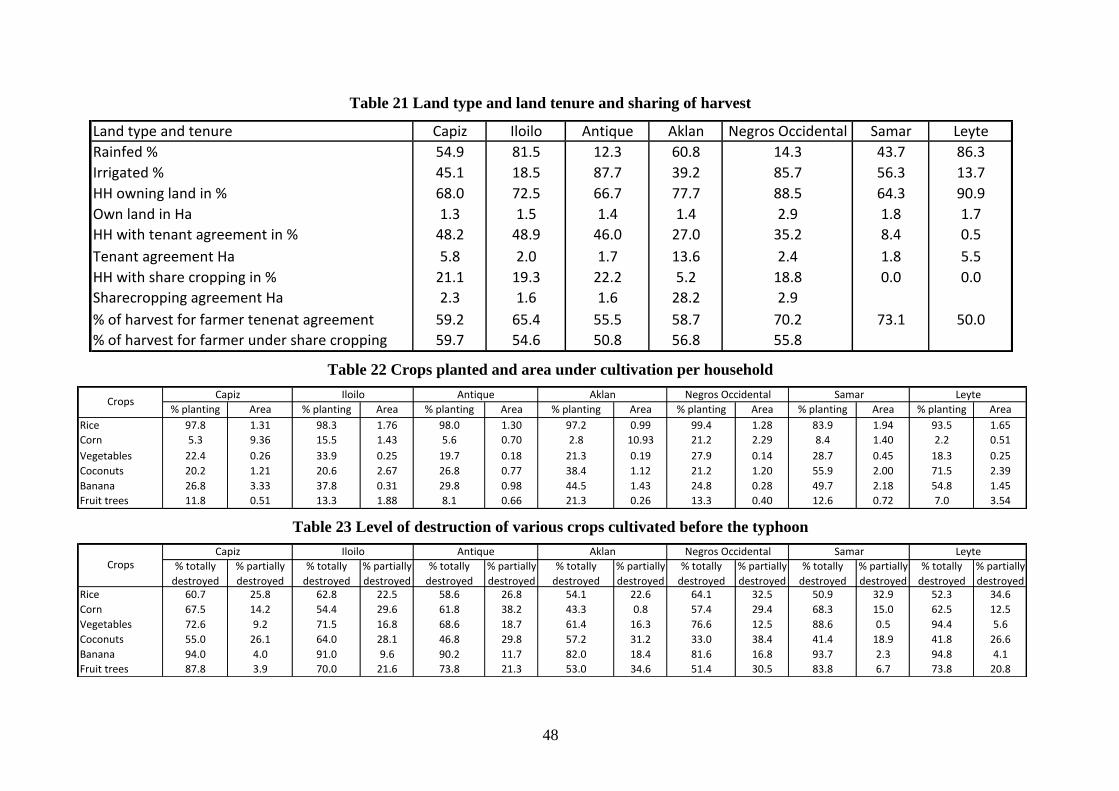
48
Table 21 Land type and land tenure and sharing of harvest
Table 22 Crops planted and area under cultivation per household
Table 23 Level of destruction of various crops cultivated before the typhoon
Land type and tenure Capiz Iloilo Antique Aklan Negros Occidental Samar Leyte
Rainfed % 54.9 81.5 12.3 60.8 14.3 43.7 86.3
Irrigated % 45.1 18.5 87.7 39.2 85.7 56.3 13.7
HH owning land in % 68.0 72.5 66.7 77.7 88.5 64.3 90.9
Own land in Ha 1.3 1.5 1.4 1.4 2.9 1.8 1.7
HH with tenant agreement in % 48.2 48.9 46.0 27.0 35.2 8.4 0.5
Tenant agreement Ha 5.8 2.0 1.7 13.6 2.4 1.8 5.5
HH with share cropping in % 21.1 19.3 22.2 5.2 18.8 0.0 0.0
Sharecropping agreement Ha 2.3 1.6 1.6 28.2 2.9
% of harvest for farmer tenenat agreement 59.2 65.4 55.5 58.7 70.2 73.1 50.0
% of harvest for farmer under share cropping 59.7 54.6 50.8 56.8 55.8
% planting Area % planting Area % planting Area % planting Area % planting Area % planting Area % planting Area
Rice 97.8 1.31 98.3 1.76 98.0 1.30 97.2 0.99 99.4 1.28 83.9 1.94 93.5 1.65
Corn 5.3 9.36 15.5 1.43 5.6 0.70 2.8 10.93 21.2 2.29 8.4 1.40 2.2 0.51
Vegetables 22.4 0.26 33.9 0.25 19.7 0.18 21.3 0.19 27.9 0.14 28.7 0.45 18.3 0.25
Coconuts 20.2 1.21 20.6 2.67 26.8 0.77 38.4 1.12 21.2 1.20 55.9 2.00 71.5 2.39
Banana 26.8 3.33 37.8 0.31 29.8 0.98 44.5 1.43 24.8 0.28 49.7 2.18 54.8 1.45
Fruit trees 11.8 0.51 13.3 1.88 8.1 0.66 21.3 0.26 13.3 0.40 12.6 0.72 7.0 3.54
Samar LeyteCrops
Capiz Iloilo Antique Aklan Negros Occidental
% totally
destroyed
% partially
destroyed
% totally
destroyed
% partially
destroyed
% totally
destroyed
% partially
destroyed
% totally
destroyed
% partially
destroyed
% totally
destroyed
% partially
destroyed
% totally
destroyed
% partially
destroyed
% totally
destroyed
% partially
destroyedRice 60.7 25.8 62.8 22.5 58.6 26.8 54.1 22.6 64.1 32.5 50.9 32.9 52.3 34.6
Corn 67.5 14.2 54.4 29.6 61.8 38.2 43.3 0.8 57.4 29.4 68.3 15.0 62.5 12.5
Vegetables 72.6 9.2 71.5 16.8 68.6 18.7 61.4 16.3 76.6 12.5 88.6 0.5 94.4 5.6
Coconuts 55.0 26.1 64.0 28.1 46.8 29.8 57.2 31.2 33.0 38.4 41.4 18.9 41.8 26.6
Banana 94.0 4.0 91.0 9.6 90.2 11.7 82.0 18.4 81.6 16.8 93.7 2.3 94.8 4.1
Fruit trees 87.8 3.9 70.0 21.6 73.8 21.3 53.0 34.6 51.4 30.5 83.8 6.7 73.8 20.8
CropsCapiz Iloilo Antique Aklan Negros Occidental Samar Leyte
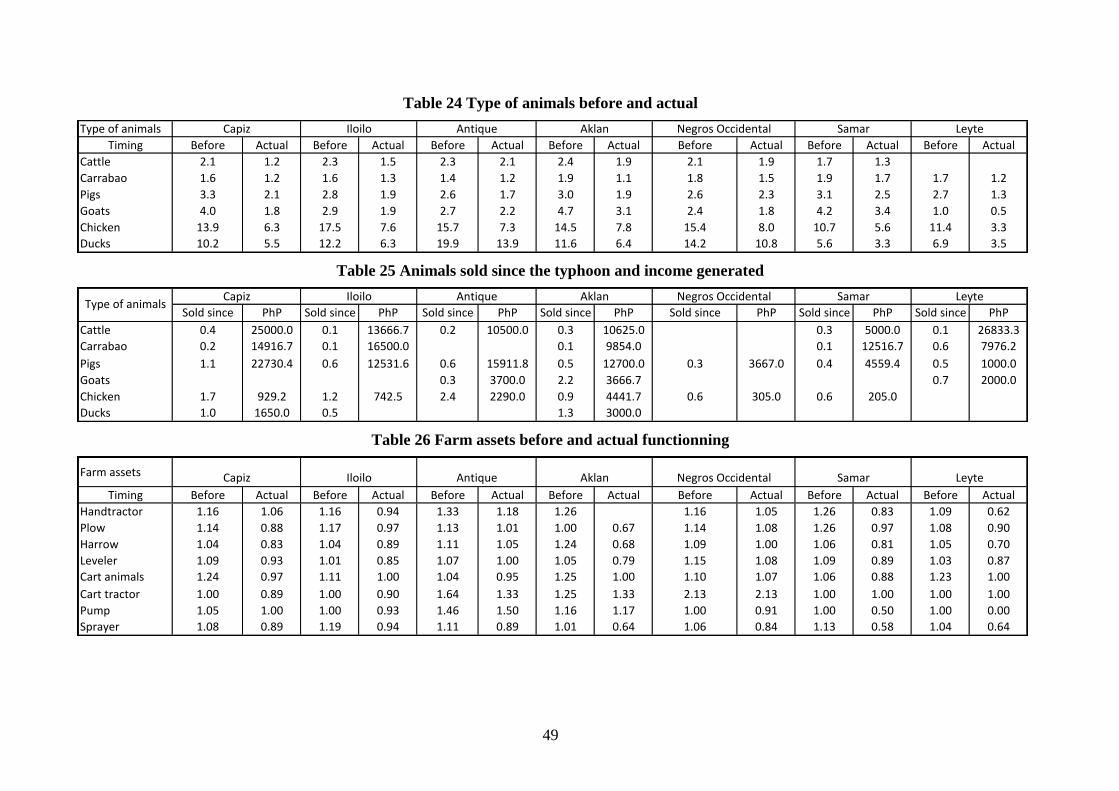
49
Table 24 Type of animals before and actual
Table 25 Animals sold since the typhoon and income generated
Table 26 Farm assets before and actual functionning
Type of animals
Timing Before Actual Before Actual Before Actual Before Actual Before Actual Before Actual Before Actual
Cattle 2.1 1.2 2.3 1.5 2.3 2.1 2.4 1.9 2.1 1.9 1.7 1.3
Carrabao 1.6 1.2 1.6 1.3 1.4 1.2 1.9 1.1 1.8 1.5 1.9 1.7 1.7 1.2
Pigs 3.3 2.1 2.8 1.9 2.6 1.7 3.0 1.9 2.6 2.3 3.1 2.5 2.7 1.3
Goats 4.0 1.8 2.9 1.9 2.7 2.2 4.7 3.1 2.4 1.8 4.2 3.4 1.0 0.5
Chicken 13.9 6.3 17.5 7.6 15.7 7.3 14.5 7.8 15.4 8.0 10.7 5.6 11.4 3.3
Ducks 10.2 5.5 12.2 6.3 19.9 13.9 11.6 6.4 14.2 10.8 5.6 3.3 6.9 3.5
Samar LeyteNegros OccidentalIloilo Antique AklanCapiz
Sold since PhP Sold since PhP Sold since PhP Sold since PhP Sold since PhP Sold since PhP Sold since PhP
Cattle 0.4 25000.0 0.1 13666.7 0.2 10500.0 0.3 10625.0 0.3 5000.0 0.1 26833.3
Carrabao 0.2 14916.7 0.1 16500.0 0.1 9854.0 0.1 12516.7 0.6 7976.2
Pigs 1.1 22730.4 0.6 12531.6 0.6 15911.8 0.5 12700.0 0.3 3667.0 0.4 4559.4 0.5 1000.0
Goats 0.3 3700.0 2.2 3666.7 0.7 2000.0
Chicken 1.7 929.2 1.2 742.5 2.4 2290.0 0.9 4441.7 0.6 305.0 0.6 205.0
Ducks 1.0 1650.0 0.5 1.3 3000.0
Type of animalsCapiz Iloilo Antique Aklan Negros Occidental Samar Leyte
Farm assets
Timing Before Actual Before Actual Before Actual Before Actual Before Actual Before Actual Before Actual
Handtractor 1.16 1.06 1.16 0.94 1.33 1.18 1.26 1.16 1.05 1.26 0.83 1.09 0.62
Plow 1.14 0.88 1.17 0.97 1.13 1.01 1.00 0.67 1.14 1.08 1.26 0.97 1.08 0.90
Harrow 1.04 0.83 1.04 0.89 1.11 1.05 1.24 0.68 1.09 1.00 1.06 0.81 1.05 0.70
Leveler 1.09 0.93 1.01 0.85 1.07 1.00 1.05 0.79 1.15 1.08 1.09 0.89 1.03 0.87
Cart animals 1.24 0.97 1.11 1.00 1.04 0.95 1.25 1.00 1.10 1.07 1.06 0.88 1.23 1.00
Cart tractor 1.00 0.89 1.00 0.90 1.64 1.33 1.25 1.33 2.13 2.13 1.00 1.00 1.00 1.00
Pump 1.05 1.00 1.00 0.93 1.46 1.50 1.16 1.17 1.00 0.91 1.00 0.50 1.00 0.00
Sprayer 1.08 0.89 1.19 0.94 1.11 0.89 1.01 0.64 1.06 0.84 1.13 0.58 1.04 0.64
Negros Occidental Samar LeyteCapiz Iloilo Antique Aklan
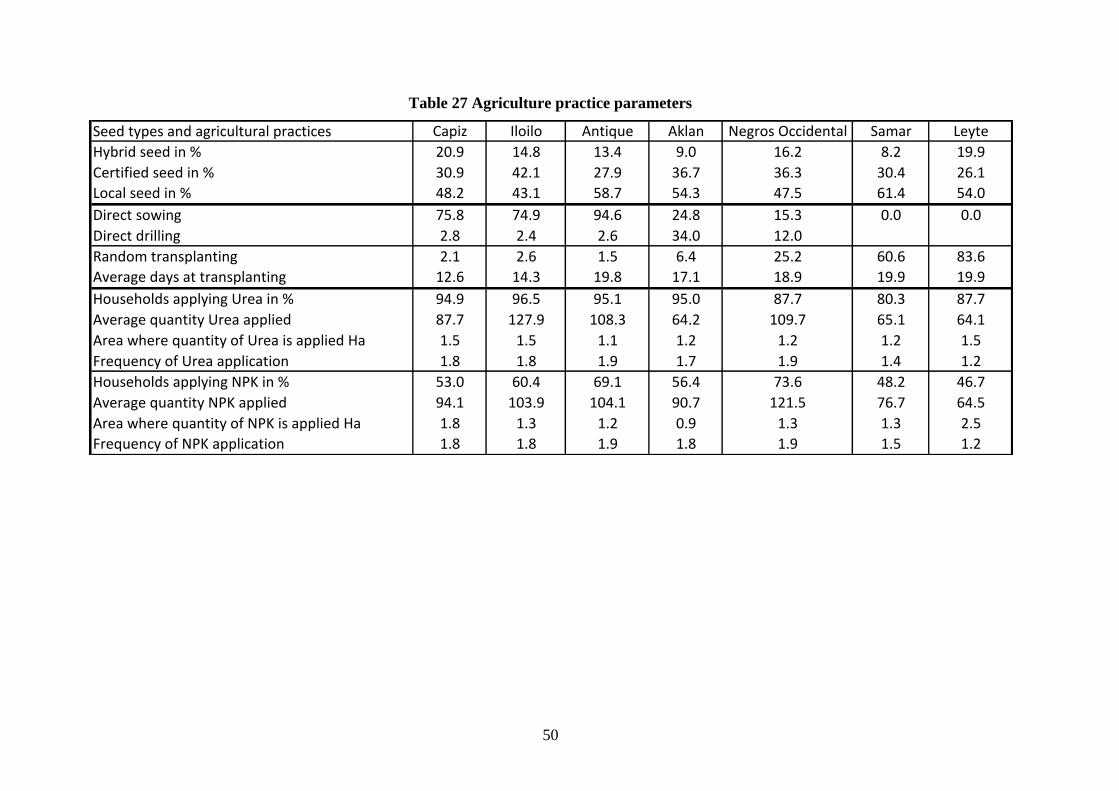
50
Table 27 Agriculture practice parameters
Seed types and agricultural practices Capiz Iloilo Antique Aklan Negros Occidental Samar Leyte
Hybrid seed in % 20.9 14.8 13.4 9.0 16.2 8.2 19.9
Certified seed in % 30.9 42.1 27.9 36.7 36.3 30.4 26.1
Local seed in % 48.2 43.1 58.7 54.3 47.5 61.4 54.0
Direct sowing 75.8 74.9 94.6 24.8 15.3 0.0 0.0
Direct drilling 2.8 2.4 2.6 34.0 12.0
Random transplanting 2.1 2.6 1.5 6.4 25.2 60.6 83.6
Average days at transplanting 12.6 14.3 19.8 17.1 18.9 19.9 19.9
Households applying Urea in % 94.9 96.5 95.1 95.0 87.7 80.3 87.7
Average quantity Urea applied 87.7 127.9 108.3 64.2 109.7 65.1 64.1
Area where quantity of Urea is applied Ha 1.5 1.5 1.1 1.2 1.2 1.2 1.5
Frequency of Urea application 1.8 1.8 1.9 1.7 1.9 1.4 1.2
Households applying NPK in % 53.0 60.4 69.1 56.4 73.6 48.2 46.7
Average quantity NPK applied 94.1 103.9 104.1 90.7 121.5 76.7 64.5
Area where quantity of NPK is applied Ha 1.8 1.3 1.2 0.9 1.3 1.3 2.5
Frequency of NPK application 1.8 1.8 1.9 1.8 1.9 1.5 1.2
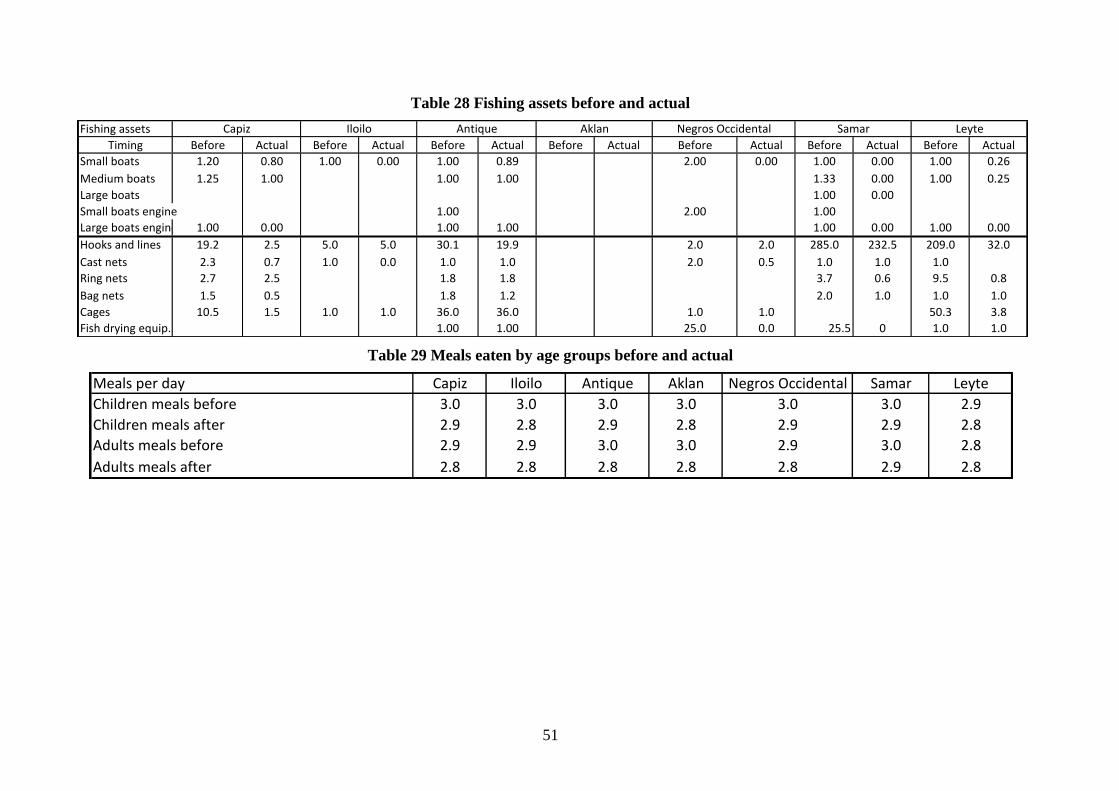
51
Table 28 Fishing assets before and actual
Table 29 Meals eaten by age groups before and actual
Fishing assets
Timing Before Actual Before Actual Before Actual Before Actual Before Actual Before Actual Before Actual
Small boats 1.20 0.80 1.00 0.00 1.00 0.89 2.00 0.00 1.00 0.00 1.00 0.26
Medium boats 1.25 1.00 1.00 1.00 1.33 0.00 1.00 0.25
Large boats 1.00 0.00
Small boats engine 1.00 2.00 1.00
Large boats engine 1.00 0.00 1.00 1.00 1.00 0.00 1.00 0.00
Hooks and lines 19.2 2.5 5.0 5.0 30.1 19.9 2.0 2.0 285.0 232.5 209.0 32.0
Cast nets 2.3 0.7 1.0 0.0 1.0 1.0 2.0 0.5 1.0 1.0 1.0
Ring nets 2.7 2.5 1.8 1.8 3.7 0.6 9.5 0.8
Bag nets 1.5 0.5 1.8 1.2 2.0 1.0 1.0 1.0
Cages 10.5 1.5 1.0 1.0 36.0 36.0 1.0 1.0 50.3 3.8
Fish drying equip. 1.00 1.00 25.0 0.0 25.5 0 1.0 1.0
Capiz Iloilo Antique Aklan Negros Occidental Samar Leyte
Meals per day Capiz Iloilo Antique Aklan Negros Occidental Samar Leyte
Children meals before 3.0 3.0 3.0 3.0 3.0 3.0 2.9
Children meals after 2.9 2.8 2.9 2.8 2.9 2.9 2.8
Adults meals before 2.9 2.9 3.0 3.0 2.9 3.0 2.8
Adults meals after 2.8 2.8 2.8 2.8 2.8 2.9 2.8
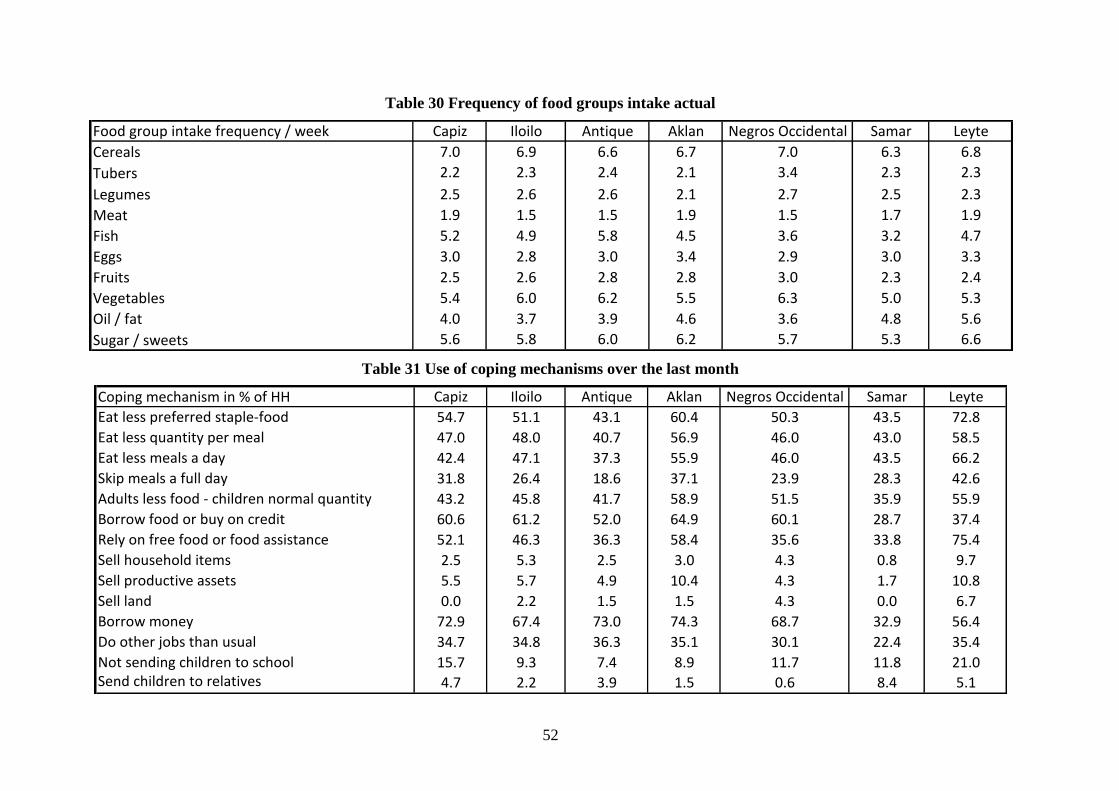
52
Table 30 Frequency of food groups intake actual
Table 31 Use of coping mechanisms over the last month
Food group intake frequency / week Capiz Iloilo Antique Aklan Negros Occidental Samar Leyte
Cereals 7.0 6.9 6.6 6.7 7.0 6.3 6.8
Tubers 2.2 2.3 2.4 2.1 3.4 2.3 2.3
Legumes 2.5 2.6 2.6 2.1 2.7 2.5 2.3
Meat 1.9 1.5 1.5 1.9 1.5 1.7 1.9
Fish 5.2 4.9 5.8 4.5 3.6 3.2 4.7
Eggs 3.0 2.8 3.0 3.4 2.9 3.0 3.3
Fruits 2.5 2.6 2.8 2.8 3.0 2.3 2.4
Vegetables 5.4 6.0 6.2 5.5 6.3 5.0 5.3
Oil / fat 4.0 3.7 3.9 4.6 3.6 4.8 5.6
Sugar / sweets 5.6 5.8 6.0 6.2 5.7 5.3 6.6
Coping mechanism in % of HH Capiz Iloilo Antique Aklan Negros Occidental Samar Leyte
Eat less preferred staple-food 54.7 51.1 43.1 60.4 50.3 43.5 72.8
Eat less quantity per meal 47.0 48.0 40.7 56.9 46.0 43.0 58.5
Eat less meals a day 42.4 47.1 37.3 55.9 46.0 43.5 66.2
Skip meals a full day 31.8 26.4 18.6 37.1 23.9 28.3 42.6
Adults less food - children normal quantity 43.2 45.8 41.7 58.9 51.5 35.9 55.9
Borrow food or buy on credit 60.6 61.2 52.0 64.9 60.1 28.7 37.4
Rely on free food or food assistance 52.1 46.3 36.3 58.4 35.6 33.8 75.4
Sell household items 2.5 5.3 2.5 3.0 4.3 0.8 9.7
Sell productive assets 5.5 5.7 4.9 10.4 4.3 1.7 10.8
Sell land 0.0 2.2 1.5 1.5 4.3 0.0 6.7
Borrow money 72.9 67.4 73.0 74.3 68.7 32.9 56.4
Do other jobs than usual 34.7 34.8 36.3 35.1 30.1 22.4 35.4
Not sending children to school 15.7 9.3 7.4 8.9 11.7 11.8 21.0Send children to relatives 4.7 2.2 3.9 1.5 0.6 8.4 5.1
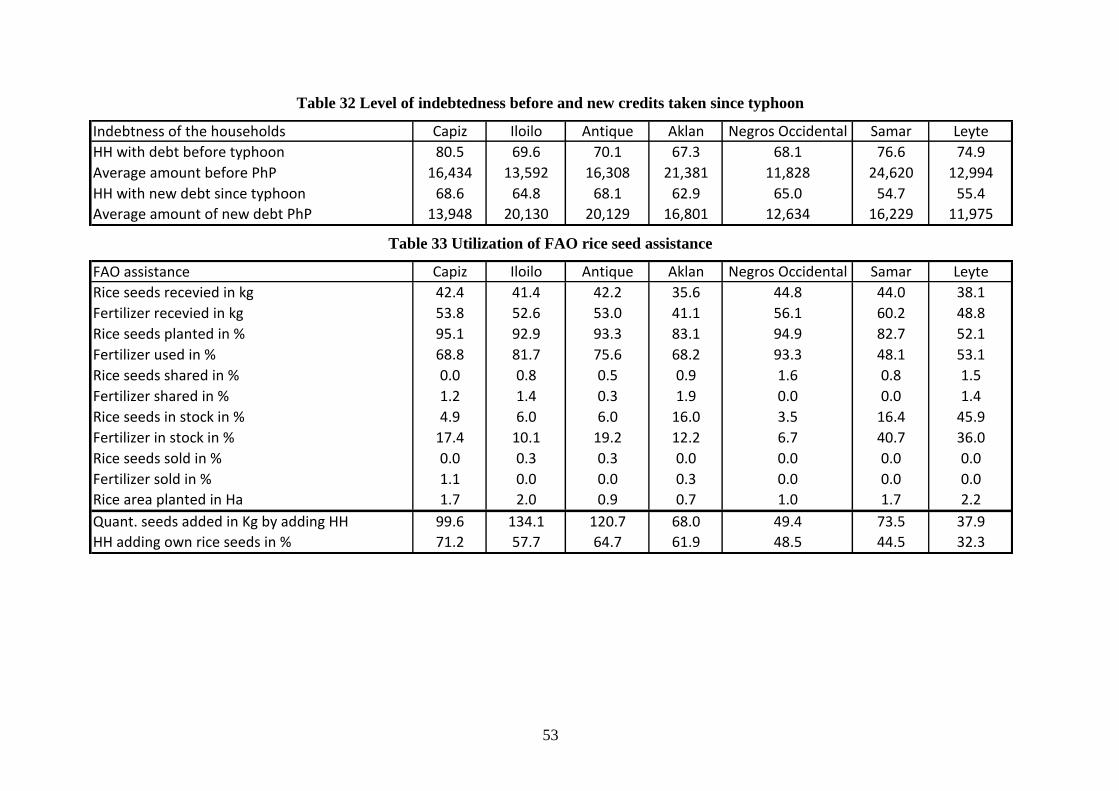
53
Table 32 Level of indebtedness before and new credits taken since typhoon
Table 33 Utilization of FAO rice seed assistance
Indebtness of the households Capiz Iloilo Antique Aklan Negros Occidental Samar Leyte
HH with debt before typhoon 80.5 69.6 70.1 67.3 68.1 76.6 74.9
Average amount before PhP 16,434 13,592 16,308 21,381 11,828 24,620 12,994
HH with new debt since typhoon 68.6 64.8 68.1 62.9 65.0 54.7 55.4
Average amount of new debt PhP 13,948 20,130 20,129 16,801 12,634 16,229 11,975
FAO assistance Capiz Iloilo Antique Aklan Negros Occidental Samar Leyte
Rice seeds recevied in kg 42.4 41.4 42.2 35.6 44.8 44.0 38.1
Fertilizer recevied in kg 53.8 52.6 53.0 41.1 56.1 60.2 48.8
Rice seeds planted in % 95.1 92.9 93.3 83.1 94.9 82.7 52.1
Fertilizer used in % 68.8 81.7 75.6 68.2 93.3 48.1 53.1
Rice seeds shared in % 0.0 0.8 0.5 0.9 1.6 0.8 1.5
Fertilizer shared in % 1.2 1.4 0.3 1.9 0.0 0.0 1.4
Rice seeds in stock in % 4.9 6.0 6.0 16.0 3.5 16.4 45.9
Fertilizer in stock in % 17.4 10.1 19.2 12.2 6.7 40.7 36.0
Rice seeds sold in % 0.0 0.3 0.3 0.0 0.0 0.0 0.0
Fertilizer sold in % 1.1 0.0 0.0 0.3 0.0 0.0 0.0
Rice area planted in Ha 1.7 2.0 0.9 0.7 1.0 1.7 2.2
Quant. seeds added in Kg by adding HH 99.6 134.1 120.7 68.0 49.4 73.5 37.9
HH adding own rice seeds in % 71.2 57.7 64.7 61.9 48.5 44.5 32.3
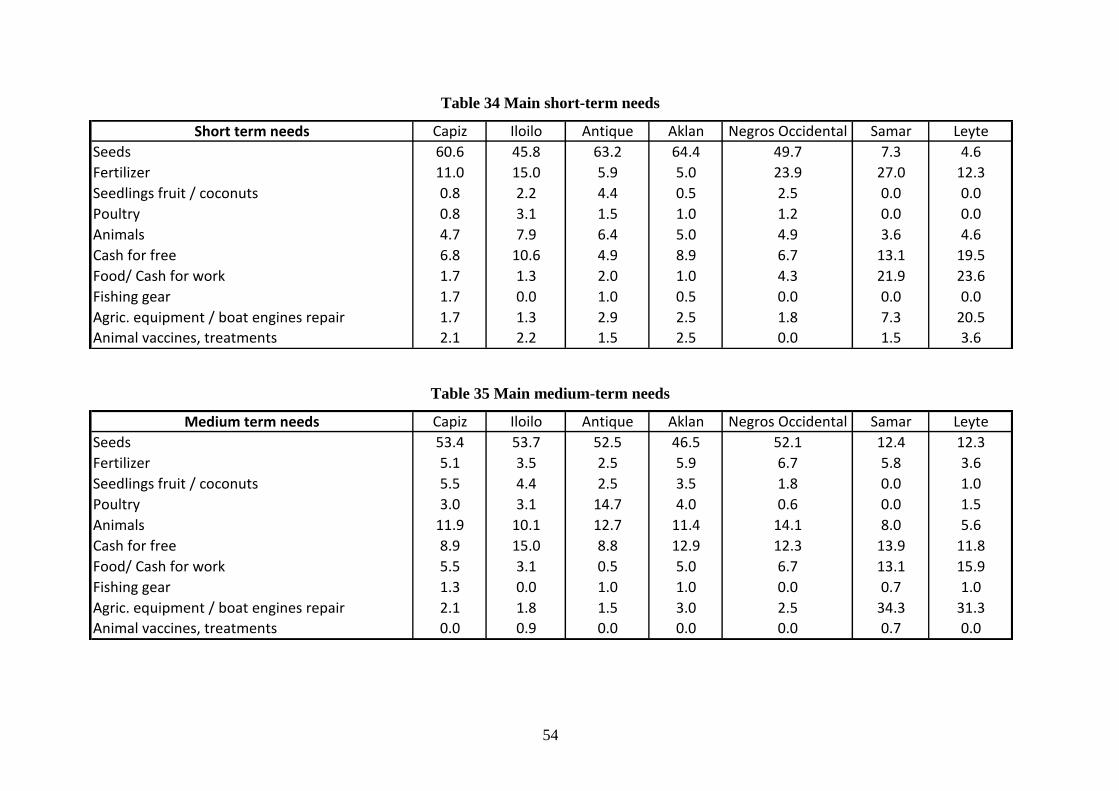
54
Table 34 Main short-term needs
Table 35 Main medium-term needs
Short term needs Capiz Iloilo Antique Aklan Negros Occidental Samar Leyte
Seeds 60.6 45.8 63.2 64.4 49.7 7.3 4.6
Fertilizer 11.0 15.0 5.9 5.0 23.9 27.0 12.3
Seedlings fruit / coconuts 0.8 2.2 4.4 0.5 2.5 0.0 0.0
Poultry 0.8 3.1 1.5 1.0 1.2 0.0 0.0
Animals 4.7 7.9 6.4 5.0 4.9 3.6 4.6
Cash for free 6.8 10.6 4.9 8.9 6.7 13.1 19.5
Food/ Cash for work 1.7 1.3 2.0 1.0 4.3 21.9 23.6
Fishing gear 1.7 0.0 1.0 0.5 0.0 0.0 0.0
Agric. equipment / boat engines repair 1.7 1.3 2.9 2.5 1.8 7.3 20.5
Animal vaccines, treatments 2.1 2.2 1.5 2.5 0.0 1.5 3.6
Medium term needs Capiz Iloilo Antique Aklan Negros Occidental Samar Leyte
Seeds 53.4 53.7 52.5 46.5 52.1 12.4 12.3
Fertilizer 5.1 3.5 2.5 5.9 6.7 5.8 3.6
Seedlings fruit / coconuts 5.5 4.4 2.5 3.5 1.8 0.0 1.0
Poultry 3.0 3.1 14.7 4.0 0.6 0.0 1.5
Animals 11.9 10.1 12.7 11.4 14.1 8.0 5.6
Cash for free 8.9 15.0 8.8 12.9 12.3 13.9 11.8
Food/ Cash for work 5.5 3.1 0.5 5.0 6.7 13.1 15.9
Fishing gear 1.3 0.0 1.0 1.0 0.0 0.7 1.0
Agric. equipment / boat engines repair 2.1 1.8 1.5 3.0 2.5 34.3 31.3
Animal vaccines, treatments 0.0 0.9 0.0 0.0 0.0 0.7 0.0
Related Documents