DOI: http://dx.doi.org/10.1590/1980-5373-MR-2018-0631 Materials Research. 2019; 22(5): e20180631 Rheological Parameters of Shear-Thickening Fluids Using an Experimental Design Alfredo Bosco a , Veronica Calado a * , João Maia b Received: September 21, 2018; Revised: August 07, 2019; Accepted: August 25, 2019 Abstract: The influence of important factors related to fluid preparation on shear-thickening fluids (STF) is not well explored in literature. Thus, this paper aimed at analyzing the statistical significance of experimental conditions, such as fumed silica concentration (C s ), stirring time (t st ), stirring speed (S st ) and sonication time (t so ), on the rheological behavior of fumed silica particles and PEG 400 dispersions. For that, a 2 k factorial Experimental Design (DOE), with three center points, was accomplished. The investigated response variables were: maximum viscosity (η m ); critical shear rate ( m c o ) where the viscosity is maximum; and agglomerate size of particles during preparation (R). All factors were statistically significant for all three response variables. Higher viscosity values for shear rate range analyzed was obtained with longer t st , lower S st and longer t so . An important contribution of this paper was to show discontinuous shear thickening (DST) for lower concentrations than previously found in literature only changing the preparation protocol. Keywords: Rheology, Shear-thickening fluids, Fumed silica, Poly(ethylene glycol), Experimental design. *e-mail: [email protected]. 1. Introduction Shear-thickening fluids can be defined as those whose viscosity increases as the shear rate increases. They are a type of non-Newtonian fluids and this specific rheological behavior presents a number of advantages for certain applications. In fact, Barnes 1 states that shear-thickening behavior occurs in all suspensions, although this can often not be measured mechanically. In industrial scenarios, shear-thickening behavior may become a problem in view of mixer motor overloading; mixer blade damage; complications in pipe flow; and other losses 2,3 . However, dispersions that present shear-thickening behavior have unique mechanical properties, which are useful in specific applications, such as liquid body armor, shock absorbers, packaging, and some others 4,5 . The rheological behavior of fluids is controlled by a number of factors: suspension stability, particle size distribution, continuous phase viscosity, among others 4 . Presently, there are mainly two theories for describing the mechanism of shear-thickening behavior. The first one deals with the formation of so-called hydroclusters, according to which particle aggregation under shear promotes an increase in viscosity. The second mechanism predicts an increase in viscosity that derives from a change in a flow regime from ordered, layered flow, to disordered flow and this is often referred to as order-disorder transition. The theory of hydroclusters has been introduced by Brady and Bossis 6 and it is based on the concept that particles repel each other and move more independently under zero or low shear rates. This then results in lower viscosity values. However, above a certain shear rate, particles assemble abruptly and temporarily in view of hydrodynamic forces. This mass of particles characterizes the formation of hydroclusters (Fig. 1) and the bigger these hydroclusters are, the higher the viscosity of the system is. As the shear rate increases, hydrocluster disruption eventually occurs. Another way that this may happen is when the shear stress is removed, as this allows for interparticle repulsion and a decrease in viscosity values 8,9 . Figure 1a illustrates a slight change in the microstructure of a suspension at low shear rates, although Brownian motion is able to restore the initial configuration, which in turn results in a slight variation in viscosity values. As the shear rate increases, the structure loses its regeneration capacity and the microstructural changes compose small aggregates that orient in the flow direction. This process leads to a suspension with reduced viscosity and, thus, to a shear-thinning behavior (Fig. 1b). As the shear rate is increased further, hydrodynamic forces prevail in the system and its structure is drastically modified as a greater number of aggregates is formed. When the shear rate is greater than a critical value, small aggregates assemble in view of hydrodynamic forces and form hydroclusters. These hydroclusters act as barriers that contribute to a greater resistance to flow, i.e. a much higher viscosity (Fig. 1c) 7 . Although the theory of hydroclusters formation is more broadly accepted to explain shear-thickening rheological behavior, the order-disorder transition mechanism predicts the similar shear rate values for the onset of shear-thickening behavior under the same conditions 10 . a Universidade Federal do Rio de Janeiro, Av. Horácio Macedo, 2030, Cidade Universitária, 21941-914, Rio de Janeiro, RJ, Brasil b Department of Macromolecular Science and Engineering, Case Western Reserve University, Cleveland, OH, 44106, USA

Welcome message from author
This document is posted to help you gain knowledge. Please leave a comment to let me know what you think about it! Share it to your friends and learn new things together.
Transcript

DOI httpdxdoiorg1015901980-5373-MR-2018-0631Materials Research 2019 22(5) e20180631
Rheological Parameters of Shear-Thickening Fluids Using an Experimental DesignAlfredo Boscoa Veronica Caladoa Joatildeo Maiab
Received September 21 2018 Revised August 07 2019 Accepted August 25 2019
Abstract The influence of important factors related to fluid preparation on shear-thickening fluids (STF) is not well explored in literature Thus this paper aimed at analyzing the statistical significance of experimental conditions such as fumed silica concentration (Cs) stirring time (tst) stirring speed (Sst) and sonication time (tso ) on the rheological behavior of fumed silica particles and PEG 400 dispersions For that a 2k factorial Experimental Design (DOE) with three center points was accomplished The investigated response variables were maximum viscosity (ηm) critical shear rate ( mco ) where the viscosity is maximum and agglomerate size of particles during preparation (R) All factors were statistically significant for all three response variables Higher viscosity values for shear rate range analyzed was obtained with longer tst lower Sst and longer tso An important contribution of this paper was to show discontinuous shear thickening (DST) for lower concentrations than previously found in literature only changing the preparation protocol
Keywords Rheology Shear-thickening fluids Fumed silica Poly(ethylene glycol) Experimental design
e-mail caladoequfrjbr
1 Introduction
Shear-thickening fluids can be defined as those whose viscosity increases as the shear rate increases They are a type of non-Newtonian fluids and this specific rheological behavior presents a number of advantages for certain applications In fact Barnes1 states that shear-thickening behavior occurs in all suspensions although this can often not be measured mechanically In industrial scenarios shear-thickening behavior may become a problem in view of mixer motor overloading mixer blade damage complications in pipe flow and other losses23 However dispersions that present shear-thickening behavior have unique mechanical properties which are useful in specific applications such as liquid body armor shock absorbers packaging and some others45
The rheological behavior of fluids is controlled by a number of factors suspension stability particle size distribution continuous phase viscosity among others4 Presently there are mainly two theories for describing the mechanism of shear-thickening behavior The first one deals with the formation of so-called hydroclusters according to which particle aggregation under shear promotes an increase in viscosity The second mechanism predicts an increase in viscosity that derives from a change in a flow regime from ordered layered flow to disordered flow and this is often referred to as order-disorder transition
The theory of hydroclusters has been introduced by Brady and Bossis6 and it is based on the concept that particles repel each other and move more independently under zero or low shear rates This then results in lower viscosity values
However above a certain shear rate particles assemble abruptly and temporarily in view of hydrodynamic forces This mass of particles characterizes the formation of hydroclusters (Fig 1) and the bigger these hydroclusters are the higher the viscosity of the system is As the shear rate increases hydrocluster disruption eventually occurs Another way that this may happen is when the shear stress is removed as this allows for interparticle repulsion and a decrease in viscosity values89
Figure 1a illustrates a slight change in the microstructure of a suspension at low shear rates although Brownian motion is able to restore the initial configuration which in turn results in a slight variation in viscosity values As the shear rate increases the structure loses its regeneration capacity and the microstructural changes compose small aggregates that orient in the flow direction This process leads to a suspension with reduced viscosity and thus to a shear-thinning behavior (Fig 1b) As the shear rate is increased further hydrodynamic forces prevail in the system and its structure is drastically modified as a greater number of aggregates is formed When the shear rate is greater than a critical value small aggregates assemble in view of hydrodynamic forces and form hydroclusters These hydroclusters act as barriers that contribute to a greater resistance to flow ie a much higher viscosity (Fig 1c)7
Although the theory of hydroclusters formation is more broadly accepted to explain shear-thickening rheological behavior the order-disorder transition mechanism predicts the similar shear rate values for the onset of shear-thickening behavior under the same conditions10
aUniversidade Federal do Rio de Janeiro Av Horaacutecio Macedo 2030 Cidade Universitaacuteria 21941-914 Rio de Janeiro RJ Brasil
bDepartment of Macromolecular Science and Engineering Case Western Reserve University Cleveland OH 44106 USA
Bosco et al2 Materials Research
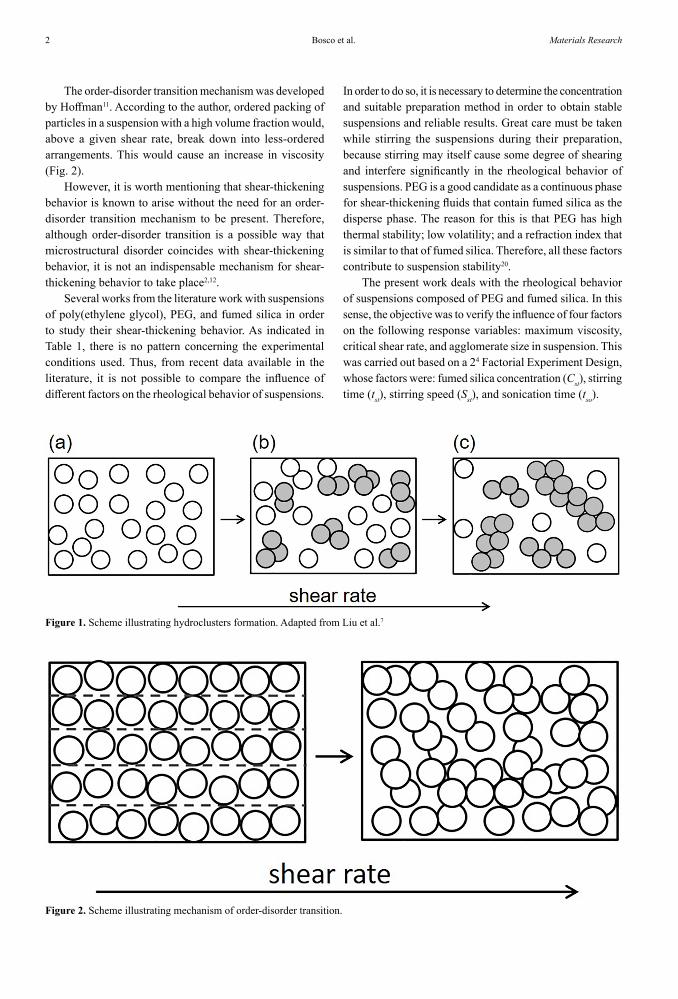
The order-disorder transition mechanism was developed by Hoffman11 According to the author ordered packing of particles in a suspension with a high volume fraction would above a given shear rate break down into less-ordered arrangements This would cause an increase in viscosity (Fig 2)
However it is worth mentioning that shear-thickening behavior is known to arise without the need for an order-disorder transition mechanism to be present Therefore although order-disorder transition is a possible way that microstructural disorder coincides with shear-thickening behavior it is not an indispensable mechanism for shear-thickening behavior to take place212
Several works from the literature work with suspensions of poly(ethylene glycol) PEG and fumed silica in order to study their shear-thickening behavior As indicated in Table 1 there is no pattern concerning the experimental conditions used Thus from recent data available in the literature it is not possible to compare the influence of different factors on the rheological behavior of suspensions
In order to do so it is necessary to determine the concentration and suitable preparation method in order to obtain stable suspensions and reliable results Great care must be taken while stirring the suspensions during their preparation because stirring may itself cause some degree of shearing and interfere significantly in the rheological behavior of suspensions PEG is a good candidate as a continuous phase for shear-thickening fluids that contain fumed silica as the disperse phase The reason for this is that PEG has high thermal stability low volatility and a refraction index that is similar to that of fumed silica Therefore all these factors contribute to suspension stability20
The present work deals with the rheological behavior of suspensions composed of PEG and fumed silica In this sense the objective was to verify the influence of four factors on the following response variables maximum viscosity critical shear rate and agglomerate size in suspension This was carried out based on a 24 Factorial Experiment Design whose factors were fumed silica concentration (Cst) stirring time (tst) stirring speed (Sst) and sonication time (tso)
Figure 1 Scheme illustrating hydroclusters formation Adapted from Liu et al7
Figure 2 Scheme illustrating mechanism of order-disorder transition
3Rheological Parameters of Shear-Thickening Fluids Using an Experimental Design
2 Materials and Methods
Poly(ethylene glycol) PEG with a molar mass of 400 g mol-1 was purchased from Vetec Quiacutemica Fina Ltda (Brazil) and used as the continuous phase Fumed silica nanoparticles (Aerosilreg 200) with a specific surface area of 200 m2g-1 were kindly donated by Evonik Industries AG (Germany) and used as the disperse phase Aerosilreg 200 are synthetic silicone dioxide nanoparticles which can be obtained via a high-temperature reaction that involves silicon tetrachloride hydrogen and oxygen
SiCl H O SiO HCl2 44 2 2 2+ + +
Fumed silica is a non-porous amorphous substance with a high degree of purity (gt 999) and finds its main application in silicon composite manufacturing10 It provides the final composite product characteristics such as high resistance to oxidation good chemical inertia low dielectric constant and high reinforcement effect
A Factorial 24 Experimental Design was carried out with three center point replicates adding up to a total of 19 experiments13 The aim was at identifying which factors were important when studying the rheological behavior of these suspensions as well as which factor levels were more adequate to prepare a suspension with a higher degree of shear-thickening behavior
It is worth mentioning that the existence of center points allows one to evaluate the plane curvature statistical significance Factors and factor levels chosen for this paper which were based on the works presented in Table 1 are listed in Table 2 Statistica software version 13 from StatSoftreg was used to generate the design matrix and to analyze experimental data No prediction model will be presented here as the only objective was to detect the statistical significance of the factors
Fumed silica nanoparticles were suspended in PEG 400 and stirred under vacuum in a Dispermatreg LC 30 (VMA-Getzmann) instrument in order to promote a homogeneous suspension Samples were then submitted to sonication on a Soni-Tech 2510R-MTH 42 kHz (Branson) sonicator to increase the degree of dispersion of the colloidal particles and reduce the degree of particle aggregation Subsequently samples were kept at rest during 24 h at room temperature to remove as much as possible air bubbles that may have formed during the preparation procedure (after sonication)
Suspension characterization was carried out using a Zetasizerreg ZEN 3600 (Malvern) particle analyzer which was also used to determine the particle size in suspension A Turbiscan LAB (Dafratec) was used to analyze the suspension stability Rheological measurements in steady-state were obtained at 25degC on an ARG2 (TA Instruments) rheometer fitted with a 40 mm 2ordm cone-and-plate geometry gap at 100 microm The herein analyzed shear rate range was from 01 to 1000 s-1 with one point at every 05 s
Table 1 Rheological studies of silica-poly(ethylene glycol) suspensions
AuthorsFumed silica
concentration - Continuous phase
Stirring time
Stirring speed Sonication time Critical shear rate1
(s-1)Maximum
viscosity2 (Pa∙s)
Wu et al(2006)14 9 - PEG 200 30 min Non informed 0 h 155 15
Ozel et al(2014)10 20 - PEG 200 4 h 5000 rpm 0 h 130 11
Liu et al(2015)7 20 - PEG 400 8 h Non informed 2 h 70 50
Haris et al(2015)15 275 - PEG 200 from 30 to 90 min
Non informed
from 30 min to several hours 1000 20
Kang et al(2012)16 275 - PEG 200 1 h Non informed 10 h 825 3
Fahool and Sabet (2015)17 35 - PEG 400 2 h 1000 rpm 10 min 60 550
Liu et al(2015)7 40 - PEG 200 8 h Non informed 2 h 500 80
Hasanzadeh et al(2015)18 45 - PEG 200 Non informed
3000 rpm 0 h 80 440
1Critical shear rate the point where there is a transition between shear-thickening and shear-thinning behaviors 2Maximum viscosity Observed at a critical shear rate
Table 2 Factors and factor levels
Factors Low level Center point High level
Fumed silica concentration ( in volume)Cst 5 15 20
Stirring time (h)tst 05 425 8
Stirring speed (rpm)Sst 300 1650 3000
Sonication time (h)tso 0 1 2
Bosco et al4 Materials Research
3 Results and Discussion
SEM and TEM micrographs of fumed silica are shown in Fig 3 it is composed of highly anisotropic randomly organized aggregates of 200 nm to 500 nm in length that is in turn comprised of primary particles with a diameter from 10 nm to 20 nm this is in accordance with the previous studies91019
31 Statistical analysis
The effects of the following factors were evaluated all relating to the preparation of shear-thickening fluids fumed silica concentration stirring time stirring speed and sonication time Results pertaining to each experimental condition are presented in Table 3
Statistical conclusions presented in this work are associated with a 5 level of significance (p-level)
For maximum viscosity ηm Cs was the most statistically relevant factor of all This is expected because suspension viscosity is often related to solids concentration in a direct manner Negative values for the effects of Sst and tst are also expected as higher Sst and tst factor levels yield lower viscosity values
Sonication time tso was the only statistically non-significant factor in determining ηm but its interactions with tst and Cs were statistically significant for ηm This implies that factor tso should not be disregarded In other words all factors under investigation influenced ηm
For critical shear rate mco the statistical significance of factor fumed silica concentration Cs evidently stood out compared to other factors and their respective interactions Therefore Cs was the factor responsible for determining critical shear rate mco Although sonication time tso did not exhibit statistical significance its interaction terms did Consequently this factor was relevant and affected the critical shear rate mco The same conclusion applied to stirring time tst Moreover as expected higher particle concentrations in suspensions demanded lower shear rate values in order to reach a maximum viscosity ηm This was reflected by the negative effect of factor Cs on the critical shear rate mco
For agglomerate size R Cs and Sst were statistically significant with Cs being more statistically significant than Sst Stirring time ts and sonication time tso were statistically non-significant in determining agglomerate size R The interaction factor between Cs and tso factors was statistically significant for the agglomerate size R similarly to trends observed previously implying that factor tso should not be disregarded
Figures 4-6 present means plots that allow to easily figure out trends relating response variables and factors Because it is not possible to evaluate more than 3 factors in a single means plot and there are four factors Cs was left out of the graphs (its value was fixed at the center point 125) as it was statistically significant for all three response variables The average center point (+) of the four factors was placed on the graphs
Figure 3 SEM micrographs (a) and (b) and TEM micrographs (c) and (d) of fumed silica nanoparticles
5Rheological Parameters of Shear-Thickening Fluids Using an Experimental Design
Table 3 Experimental design matrix with factors their levels and response variable values
Sample Fumed silica concentrationCs ()
Stirring time tst(h)
Stirring speed Sst(rpm)
Sonication time tso(h)
Maximum viscosity ηm(Pa∙s)
Critical shear rate mco (s-1)
Agglomerate size R(nm)
1 5 8 3000 2 a a 8812 20 8 3000 2 140 3449 24163 20 8 300 0 1247 3851 25204 5 8 300 0 09 2771 19115 125 425 1650 1 177 292 24616 5 8 3000 0 a a 11677 20 05 300 0 150 36 24928 5 05 3000 0 a a 7329 5 05 3000 2 115 2923 81310 5 05 300 2 a a 170611 125 425 1650 1 158 294 231712 5 8 300 2 235 2892 144913 5 05 300 0 a a 184414 20 8 3000 0 7745 4775 200115 20 05 3000 2 6247 5257 233016 125 425 1650 1 146 2917 245317 20 05 300 2 5793 5858 b
18 20 8 300 2 1237 3972 b
19 20 05 3000 0 6192 586 1970aThey did not present shear-thickening behavior Instead they presented a shear-thinning or nearly Newtonian behaviorb
The suspension could not be poured into the particle analyzerrsquos cuvette to determine agglomerate size because its consistency
Figure 4 Means plot for maximum viscosity ηm Symbols (+) are related to the center point average
Figure 5 Means plot for maximum critical shear rate mco Symbols (+) are related to center point average
Figure 6 Means plot agglomerate size (R) Symbols (+) are related to center point average
There are two sets of conditions statistically similar that lead to higher ηm values as can be seen in Fig 4 However one of them is more energy and time demanding (Cs = 125 tst = 8 h Sst = 3000 rpm and tso = 2 h) Consequently it is suggested that the other set of conditions should be used for obtaining higher maximum viscosity ηm ( Cs = 125 tst = 05 h Sst = 300 rpm and tso = 0 h)
From the means plot in Fig 4 it is possible to infer that there is a point of minimum as the center point corresponds to 16 Pas (represented by +) for maximum viscosity ηm the lowest value of all experiments
In terms of the response variable critical shear rate mco on the other hand it is possible that there exists a point of
maximum in view of a center point average of 293s-1 (Fig 5)
Bosco et al6 Materials Research
In order to obtain higher mco the set of conditions to be used is Cs = 125 tst = 8 h Sst = 300 rpm and tso = 2 h
As occurred for maximum viscosity ηm there are two sets of conditions that lead to higher agglomerate size R values (Fig 6) and one of them is more energy and time demanding ( Cs = 125 tst = 8 h Sst = 300 rpm and tso = 2 h) Therefore the other set should be used ( Cs = 125 tst = 05 h Sst = 300 rpm and tso = 0 h) It is interesting to obtain high agglomerate size R values because agglomerates contribute for suspensions with high viscosities
For maximum viscosity ηm Cs and Sst were the most statistically significant factors with a positive value of the effect for Cs and negative value of the effect for Sst For higher Cs (20) and lower Sst (300 rpm) ηm increases with decreasing tst and tso Curvatures presented in contour lines indicate an interaction between tst and tso (Fig 7) considering all samples
32 Rheological behavior
Initially suspensions present a shear-thinning rheological behavior at low shear rates and all flow curves are shown in Figure 8 However from a given value of shear rate (onset shear rate) onward suspensions present shear-thickening behavior in view of suspension microstructure alterations This onset shear rate value varies with different factor levels used Shear-thickening behavior is maintained up to a critical shear rate is achieved From this point onwards shear-thinning behavior is present again
As discussed in the Introduction there are mainly two possible theories to describe shear-thickening behavior of suspensions order-disorder transition mechanism and hydroclusters formation The order-disorder transition mechanism is not applicable to the present study because particles must have some degree of order before shear-thickening behavior is observed and herein analyzed fumed silica particles do not have a regular shape
Therefore this does not allow for ordered structures to form On the other hand hydroclusters theory is more broadly accepted and more suitable to describe the system under investigation Additionally hydroxyl groups that are present at the ends of PEG chains are able to hydrogen bond with silanol groups on the surface of particles18 This also favors hydrocluster formation and leads to shear-thickening rheological behavior
Figure 7 Effect of maximum viscosity (ηm) with Cs = 20 in volume (silica concentration) and Sst = 300 rpm (stirring speed)
Figure 8 Apparent viscosity versus shear rate for silica-PEG 400 suspensions
Suspension samples 17 and 18 presented yield stress which did not allow for pouring into the particle analyzerrsquos cuvette to determine agglomerate size These samples were prepared with a higher Cs level (20) lower Sst level (300 rpm) and higher tso level (2 h) that can lead to respectively an increase in yield stress less intensive shearing and improved particle distribution These conditions would contribute to fluid structuring and cause an increase in yield stress
As discussed in the Statistical Analysis section Cs was by far the most relevant factor for all response variables Therefore samples and trends in Fig 9 can be analyzed in groups according to Cs factor levels
7Rheological Parameters of Shear-Thickening Fluids Using an Experimental Design
Samples with Cs = 20 presented higher ηm and were then subdivided into two groups group A is composed of samples 02 03 07 and 18 and group B comprises samples 14 15 17 and 19 Group A samples presented higher ηm and lower
mco than the ones from group B As illustrated in Table 3 ηm values from group A samples varied from 1237 to 150 Pas and mco values were in the range of 3449 to 3972 s-1 for group B these ranges varied from 5793 to 7745 Pas and from 4775 to 586 s-1 Maximum viscosities values obtained in this work for fumed silica concentration of 20 were higher than those obtained by Ozel et al10 and by Liu et al7 ie 11 and 50 Pas respectively as presented in Table 1
Samples belonging to group A showed a continuous shear-thickening behavior while samples belonging to group B showed a discontinuous shear-thickening behavior in accordance with the results presented by Jamali et al9 and Jiang and Zukoski21
Continuousdiscontinuous shear-thickening behavior was probably related to the packing of agglomerates generated during sample preparation In view of an irregular morphological distribution of fumed silica particles as received they could be agglomerated because of physical entanglements between themselves With a lower stirring time (tst = 05 h) these physical entanglements would remain in suspension even after samples had been prepared and would thus form suspensions with less packable agglomerates (group B) As to a higher stirring time (tst = 8 h) these physical entanglements would not only be undone but also fumed
silica particles would rupture as a result of the action of the mixer Thus suspensions with agglomerates that are less physically entangled ie more packable (group A) would form Hydrodynamic forces would prevail in the formation of group A agglomerates while physical entanglements would prevail in the formation of agglomerates related to group B
Available literature on shear thickening fluids using fumed silica has no concern about agglomeration that fumed silica presents when received from the supplier According to this present work the degree of agglomeration clearly influences the results obtained Therefore degree of agglomeration analysis is fundamental to obtain reliable results
Simultaneous clearer visualization of rheological behavior of several samples is made possible by normalized apparent viscosity All values of apparent viscosity were divided by their respective initial value This strategy disregards the initial state of each sample and allows for identification of specific trends and relative comparisons besides it highlights the formation kinetics of hydroclusters as shown in Fig 9
Higher degree of packing would contribute to greater interaction between group A agglomerates in comparison with those of group B and lower shear rates would be required for hydrocluster formation Samples belonging to group A indeed presented lower critical shear rates than samples from group B as shown in Figures 8 and 9
Trends in apparent viscosity would also be related to hydrocluster packing Less packed hydroclusters would allow suspensions to reach higher viscosities at higher shear rates as occurred in group B samples Suspensions formed by more packed hydroclusters reached higher viscosities at lower shear rates as occurred in group A samples
The hydroclusters formation rate is proportional to the slope of flow curves during the shear-thickening behavior This slope is related to the flow behavior index (n) presented in the Ostwald de Waele model or Power Law
K mn 1h c= -o Q V
where η is the apparent viscosity K is the flow consistency index and co is the shear rate For shear-thickening behavior of samples with Cs = 20 the flow behavior indexes are presented in Table 4
Figure 9 Normalized apparent viscosity as a function of shear rate
Table 4 Flow behavior indexes for shear-thickening behavior of samples with 20 fumed silica concentration SD = standard deviation and R2 = coefficient of determination
Group sample Samples n plusmn SD R2
A 18 275 plusmn 005 099A 03 275 plusmn 006 091A 07 437 plusmn 018 096A 02 459 plusmn 010 099B 14 977 plusmn 040 098B 19 994 plusmn 082 090B 17 1233 plusmn 102 094B 15 1494 plusmn 083 097
Bosco et al8 Materials Research
Higher n values were observed in group B samples and thus characterize discontinuous shear-thickening behavior which would have been mainly owing to physical entanglements between agglomerates to form hydroclusters On the other hand lower n values were observed in group A samples which characterizes continuous shear-thickening behavior which would have been in turn mainly on account of the formation of hydroclusters by the hydrodynamic forces
According to Barnes1 hydroclusters are broken down at high shear rates when they are formed by hard particles Hence this reduces apparent viscosity However for the case of soft particles hydroclusters are not undone but rather deformed in the direction of flow at high shear rates In this case apparent viscosity also decreases (Fig 10) For a suspension formed by soft particles the critical shear rate tends to be lower than the one from suspension formed by hard particles The reason for this is that less energy would be required to deform packable agglomerates than to undo agglomerates with hard particles
Higher Sst during the preparation of sample 09 may have promoted some degree of damage in suspension microstructure causing a decrease in viscosity compared to sample 12 (Fig 9) Again according to ANOVA test (p-level ( 005) for R Sst was statistically significant while tst did not present statistical significance It is possible that a higher Sst level may have compromised the interactions between particles and may have made it difficult for agglomerates to form This could explain smaller agglomerate sizes for this sample in comparison with sample 12 This same principle could be applied when comparing samples 06 and 13
It is not in all cases that an increase in shear rate causes hydrocluster formation and results in an increase in viscosity Flow curves for samples 06 08 10 and 13 showed similar behavior in the analyzed shear rate range Viscosity values for these samples did not undergo a significant increase and decreased abruptly when a shear rate of 465 s-1 was reached This was possibly due to structural disassembleorientation in the fluid microstructure during shearing
For Cs = 5 and tst = 05h samples 08 and 10 differed between each other in Sst (3000 rpm and 300 rpm respectively) and tso (respectively no sonication treatment and tso = 2h) Sst was responsible for the difference between these samples because it was a factor more statistically significant than tso as shown by ANOVA test A higher Sst resulted in lower agglomerate size (R) for sample 08 than for sample 10 (Table 3) Higher Sst also disturbed the suspension microstructure to a greater extent and caused sample 08 to be less viscous than sample 10 in the entire shear rate range (Fig 9)
Microstructural disassemble may explain the fact that sample 01 presented roughly Newtonian behavior as this sample underwent longer tst (8h) higher Sst (3000 rpm) and longer tso (2h)
4 Conclusions
In order to have a higher viscosity in a higher critical shear rate samples need to be prepared with higher fumed silica concentration longer stirring time lower stirring speed and longer sonication time
Because we are interested in the shear-thickening behavior samples 02 (fumed silica concentration of 20 stirring time of 8 h stirring speed of 3000 rpm and sonication time of 2 h) and 07 (fumed silica concentration of 20 stirring time of 05 h stirring speed of 300 rpm and no sonication) would be the most promising options because they resulted the highest maximum viscosities From this perspective sample 02 would be even more appropriate because it presents higher viscosity values for the most part of the shear rate range In terms of shear rate range sample 03 would be more suitable for future work because presented the highest viscosities in almost all its shear rate range studied (from 01 to 20 s-1) even though its maximum viscosity value was lower than that of the aforementioned samples
Figure 10 Breaking down of hydroclusters formed by hard particles (a) and deformation of hydroclusters formed by soft particles (b) as the shear rate is increased
Agglomerates in suspensions probably presented different degrees of packing given the presence of free volume in their interiors In much the same way that agglomerates with lower degrees of packing could be treated analogously as hard particles those with higher degrees of packing could be treated analogously as soft particles
Samples with Cs = 5 did not show shear-thickening behavior so expressive as that of samples with Cs = 20 Preparation of samples 04 and 12 differed only with respect to tso sample 12 had been submitted to sonication treatment (tso = 2h) and sample 04 had not It appears that sonication treatment favored particle distribution and decreased the degree of agglomeration This would cause a decrease in agglomerate size (R) values and would reflect a lower viscosity for sample 12 in the entire range of shear rates studied as shown in Fig 9 This same principle could be applied when comparing samples 13 and 10
Samples 09 and 12 were prepared with different tst (stirring time) and Sst (stirring speed) According to ANOVA test for ηm Sst presented higher statistical significance than tst In other words Sst prevailed over tst
9Rheological Parameters of Shear-Thickening Fluids Using an Experimental Design
5 Acknowledgment
The authors would like to thank CAPES for the fellowship of the first author and also Evonik Industries AG for the donation of Aerosilreg 200 fumed silica nanoparticles
6 References
1 Barnes HA A handbook of elementary rheology Aberystwyth Cambrian Printers 2000
2 Egres RG Wagner NJ The rheology and microstructure of acicular precipitated calcium carbonate colloidal suspensions through the shear thickening transition Journal of Rheology 200549(3)719-746
3 Jiang W Sun Y Xu Y Peng C Gong X Zhang Z Shear-thickening behavior of polymethylmethacrylate particles suspensions in glycerine-water mixtures Rheologica Acta 2010491157-1163
4 Mewis J Wagner NJ Colloidal suspension rheology Cambridge University Press Cambridge 2012
5 Ding J Tian T Meng Q Guo Z Li W Zhang P Ciacchi FT Huang J Yang W Smart Multifunctional Fluids for Lithium Ion Batteries Enhanced Rate Performance and Intrinsic Mechanical Protection Scientific Reports 201332485
6 Brady JF Bossis G The rheology of concentrated suspensions of spheres in simple shear-flow by numerical-simulation Journal of Fluid Mechanics 1985155105-129
7 Liu XQ Bao RY Wu XJ Yang W Xie BJ Yang MB Temperature induced gelation transition of a fumed silicaPEG shear thickening fluid Rsc Advances 20155(24)18367-18374
8 Cwalina CD Wagner NJ Material properties of the shear-thickened state in concentrated near hard-sphere colloidal dispersions Journal of Rheology 201458(4)949-967
9 Jamali S Boromand A Wagner NJ Maia J Microstructure and rheology of soft to rigid shear-thickening colloidal suspensions Journal of Rheology 201559(6)1377-1395
10 Ozel BG Orum A Yildiz M Menceloglu YZ Experimental study on the rheology of anisotropic flocculated and low volume fraction colloids Korea-Australia Rheology Journal 201426(1)105-116
11 Hoffman RL Discontinuous and dilatant viscosity behavior in concentrated suspensions II Theory and experimental tests Journal of Colloid and Interface Science 197446(3)491-506
12 Jiang W Xuan S Gong X The role of shear in the transition from continuous shear thickening to discontinuous shear thickening Applied Physics Letters 2015106151902
13 Montgomery DC Design and Analysis of Experiments New Jersey John Wiley amp Sons Inc 2016
14 Wu QM Ruan JM Huang BY Zhou ZC Zou JP Rheological behavior of fumed silica suspension in polyethylene glycol Journal of Central South University of Technology 200613(1)1-5
15 Haris A Lee H Tay TE Tan VBC Shear thickening fluid impregnated ballistic fabric composites for shock wave mitigation International Journal of Impact Engineering 201580143-151
16 Kang TJ Kim CY Hong KH Rheological behavior of concentrated silica suspension and its application to soft armor Journal of Applied Polymer Science 2012124(2)1534-1541
17 Fahool M Sabet AR UV-visible assessment of hydrocluster formation and rheological behaviour in bimodal and mono-disperse shear thickening fluids Rheologica Acta 201554(1)77-83
18 Hasanzadeh M Mottaghitalab V Rezaei M Rheological and viscoelastic behavior of concentrated colloidal suspensions of silica nanoparticles A response surface methodology approach Advanced Powder Technology 201526(6)1570-1577
19 Warren J Offenberger S Toghiani H Pittman Junior CU Lacy TE Kundu S Effect of Temperature on the Shear-Thickening Behavior of Fumed Silica Suspensions Acs Applied Materials amp Interfaces 20157(33)18650-61
20 Baharvandi HR Khaksari P Kordani N Alebouyeh M Alizadeh M Khojasteh J Analyzing the Quasi-static Puncture Resistance Performance of Shear Thickening Fluid Enhanced P-aramid Composite Fibers and Polymers 201415(10)2193-2200
21 Jiang T Zukoski C Rheology of high density glass of binary colloidal mixtures in unentangled polymer melts Soft Matter 20139(11)3117-3130
Bosco et al2 Materials Research
The order-disorder transition mechanism was developed by Hoffman11 According to the author ordered packing of particles in a suspension with a high volume fraction would above a given shear rate break down into less-ordered arrangements This would cause an increase in viscosity (Fig 2)
However it is worth mentioning that shear-thickening behavior is known to arise without the need for an order-disorder transition mechanism to be present Therefore although order-disorder transition is a possible way that microstructural disorder coincides with shear-thickening behavior it is not an indispensable mechanism for shear-thickening behavior to take place212
Several works from the literature work with suspensions of poly(ethylene glycol) PEG and fumed silica in order to study their shear-thickening behavior As indicated in Table 1 there is no pattern concerning the experimental conditions used Thus from recent data available in the literature it is not possible to compare the influence of different factors on the rheological behavior of suspensions
In order to do so it is necessary to determine the concentration and suitable preparation method in order to obtain stable suspensions and reliable results Great care must be taken while stirring the suspensions during their preparation because stirring may itself cause some degree of shearing and interfere significantly in the rheological behavior of suspensions PEG is a good candidate as a continuous phase for shear-thickening fluids that contain fumed silica as the disperse phase The reason for this is that PEG has high thermal stability low volatility and a refraction index that is similar to that of fumed silica Therefore all these factors contribute to suspension stability20
The present work deals with the rheological behavior of suspensions composed of PEG and fumed silica In this sense the objective was to verify the influence of four factors on the following response variables maximum viscosity critical shear rate and agglomerate size in suspension This was carried out based on a 24 Factorial Experiment Design whose factors were fumed silica concentration (Cst) stirring time (tst) stirring speed (Sst) and sonication time (tso)
Figure 1 Scheme illustrating hydroclusters formation Adapted from Liu et al7
Figure 2 Scheme illustrating mechanism of order-disorder transition
3Rheological Parameters of Shear-Thickening Fluids Using an Experimental Design
2 Materials and Methods
Poly(ethylene glycol) PEG with a molar mass of 400 g mol-1 was purchased from Vetec Quiacutemica Fina Ltda (Brazil) and used as the continuous phase Fumed silica nanoparticles (Aerosilreg 200) with a specific surface area of 200 m2g-1 were kindly donated by Evonik Industries AG (Germany) and used as the disperse phase Aerosilreg 200 are synthetic silicone dioxide nanoparticles which can be obtained via a high-temperature reaction that involves silicon tetrachloride hydrogen and oxygen
SiCl H O SiO HCl2 44 2 2 2+ + +
Fumed silica is a non-porous amorphous substance with a high degree of purity (gt 999) and finds its main application in silicon composite manufacturing10 It provides the final composite product characteristics such as high resistance to oxidation good chemical inertia low dielectric constant and high reinforcement effect
A Factorial 24 Experimental Design was carried out with three center point replicates adding up to a total of 19 experiments13 The aim was at identifying which factors were important when studying the rheological behavior of these suspensions as well as which factor levels were more adequate to prepare a suspension with a higher degree of shear-thickening behavior
It is worth mentioning that the existence of center points allows one to evaluate the plane curvature statistical significance Factors and factor levels chosen for this paper which were based on the works presented in Table 1 are listed in Table 2 Statistica software version 13 from StatSoftreg was used to generate the design matrix and to analyze experimental data No prediction model will be presented here as the only objective was to detect the statistical significance of the factors
Fumed silica nanoparticles were suspended in PEG 400 and stirred under vacuum in a Dispermatreg LC 30 (VMA-Getzmann) instrument in order to promote a homogeneous suspension Samples were then submitted to sonication on a Soni-Tech 2510R-MTH 42 kHz (Branson) sonicator to increase the degree of dispersion of the colloidal particles and reduce the degree of particle aggregation Subsequently samples were kept at rest during 24 h at room temperature to remove as much as possible air bubbles that may have formed during the preparation procedure (after sonication)
Suspension characterization was carried out using a Zetasizerreg ZEN 3600 (Malvern) particle analyzer which was also used to determine the particle size in suspension A Turbiscan LAB (Dafratec) was used to analyze the suspension stability Rheological measurements in steady-state were obtained at 25degC on an ARG2 (TA Instruments) rheometer fitted with a 40 mm 2ordm cone-and-plate geometry gap at 100 microm The herein analyzed shear rate range was from 01 to 1000 s-1 with one point at every 05 s
Table 1 Rheological studies of silica-poly(ethylene glycol) suspensions
AuthorsFumed silica
concentration - Continuous phase
Stirring time
Stirring speed Sonication time Critical shear rate1
(s-1)Maximum
viscosity2 (Pa∙s)
Wu et al(2006)14 9 - PEG 200 30 min Non informed 0 h 155 15
Ozel et al(2014)10 20 - PEG 200 4 h 5000 rpm 0 h 130 11
Liu et al(2015)7 20 - PEG 400 8 h Non informed 2 h 70 50
Haris et al(2015)15 275 - PEG 200 from 30 to 90 min
Non informed
from 30 min to several hours 1000 20
Kang et al(2012)16 275 - PEG 200 1 h Non informed 10 h 825 3
Fahool and Sabet (2015)17 35 - PEG 400 2 h 1000 rpm 10 min 60 550
Liu et al(2015)7 40 - PEG 200 8 h Non informed 2 h 500 80
Hasanzadeh et al(2015)18 45 - PEG 200 Non informed
3000 rpm 0 h 80 440
1Critical shear rate the point where there is a transition between shear-thickening and shear-thinning behaviors 2Maximum viscosity Observed at a critical shear rate
Table 2 Factors and factor levels
Factors Low level Center point High level
Fumed silica concentration ( in volume)Cst 5 15 20
Stirring time (h)tst 05 425 8
Stirring speed (rpm)Sst 300 1650 3000
Sonication time (h)tso 0 1 2
Bosco et al4 Materials Research
3 Results and Discussion
SEM and TEM micrographs of fumed silica are shown in Fig 3 it is composed of highly anisotropic randomly organized aggregates of 200 nm to 500 nm in length that is in turn comprised of primary particles with a diameter from 10 nm to 20 nm this is in accordance with the previous studies91019
31 Statistical analysis
The effects of the following factors were evaluated all relating to the preparation of shear-thickening fluids fumed silica concentration stirring time stirring speed and sonication time Results pertaining to each experimental condition are presented in Table 3
Statistical conclusions presented in this work are associated with a 5 level of significance (p-level)
For maximum viscosity ηm Cs was the most statistically relevant factor of all This is expected because suspension viscosity is often related to solids concentration in a direct manner Negative values for the effects of Sst and tst are also expected as higher Sst and tst factor levels yield lower viscosity values
Sonication time tso was the only statistically non-significant factor in determining ηm but its interactions with tst and Cs were statistically significant for ηm This implies that factor tso should not be disregarded In other words all factors under investigation influenced ηm
For critical shear rate mco the statistical significance of factor fumed silica concentration Cs evidently stood out compared to other factors and their respective interactions Therefore Cs was the factor responsible for determining critical shear rate mco Although sonication time tso did not exhibit statistical significance its interaction terms did Consequently this factor was relevant and affected the critical shear rate mco The same conclusion applied to stirring time tst Moreover as expected higher particle concentrations in suspensions demanded lower shear rate values in order to reach a maximum viscosity ηm This was reflected by the negative effect of factor Cs on the critical shear rate mco
For agglomerate size R Cs and Sst were statistically significant with Cs being more statistically significant than Sst Stirring time ts and sonication time tso were statistically non-significant in determining agglomerate size R The interaction factor between Cs and tso factors was statistically significant for the agglomerate size R similarly to trends observed previously implying that factor tso should not be disregarded
Figures 4-6 present means plots that allow to easily figure out trends relating response variables and factors Because it is not possible to evaluate more than 3 factors in a single means plot and there are four factors Cs was left out of the graphs (its value was fixed at the center point 125) as it was statistically significant for all three response variables The average center point (+) of the four factors was placed on the graphs
Figure 3 SEM micrographs (a) and (b) and TEM micrographs (c) and (d) of fumed silica nanoparticles
5Rheological Parameters of Shear-Thickening Fluids Using an Experimental Design
Table 3 Experimental design matrix with factors their levels and response variable values
Sample Fumed silica concentrationCs ()
Stirring time tst(h)
Stirring speed Sst(rpm)
Sonication time tso(h)
Maximum viscosity ηm(Pa∙s)
Critical shear rate mco (s-1)
Agglomerate size R(nm)
1 5 8 3000 2 a a 8812 20 8 3000 2 140 3449 24163 20 8 300 0 1247 3851 25204 5 8 300 0 09 2771 19115 125 425 1650 1 177 292 24616 5 8 3000 0 a a 11677 20 05 300 0 150 36 24928 5 05 3000 0 a a 7329 5 05 3000 2 115 2923 81310 5 05 300 2 a a 170611 125 425 1650 1 158 294 231712 5 8 300 2 235 2892 144913 5 05 300 0 a a 184414 20 8 3000 0 7745 4775 200115 20 05 3000 2 6247 5257 233016 125 425 1650 1 146 2917 245317 20 05 300 2 5793 5858 b
18 20 8 300 2 1237 3972 b
19 20 05 3000 0 6192 586 1970aThey did not present shear-thickening behavior Instead they presented a shear-thinning or nearly Newtonian behaviorb
The suspension could not be poured into the particle analyzerrsquos cuvette to determine agglomerate size because its consistency
Figure 4 Means plot for maximum viscosity ηm Symbols (+) are related to the center point average
Figure 5 Means plot for maximum critical shear rate mco Symbols (+) are related to center point average
Figure 6 Means plot agglomerate size (R) Symbols (+) are related to center point average
There are two sets of conditions statistically similar that lead to higher ηm values as can be seen in Fig 4 However one of them is more energy and time demanding (Cs = 125 tst = 8 h Sst = 3000 rpm and tso = 2 h) Consequently it is suggested that the other set of conditions should be used for obtaining higher maximum viscosity ηm ( Cs = 125 tst = 05 h Sst = 300 rpm and tso = 0 h)
From the means plot in Fig 4 it is possible to infer that there is a point of minimum as the center point corresponds to 16 Pas (represented by +) for maximum viscosity ηm the lowest value of all experiments
In terms of the response variable critical shear rate mco on the other hand it is possible that there exists a point of
maximum in view of a center point average of 293s-1 (Fig 5)
Bosco et al6 Materials Research
In order to obtain higher mco the set of conditions to be used is Cs = 125 tst = 8 h Sst = 300 rpm and tso = 2 h
As occurred for maximum viscosity ηm there are two sets of conditions that lead to higher agglomerate size R values (Fig 6) and one of them is more energy and time demanding ( Cs = 125 tst = 8 h Sst = 300 rpm and tso = 2 h) Therefore the other set should be used ( Cs = 125 tst = 05 h Sst = 300 rpm and tso = 0 h) It is interesting to obtain high agglomerate size R values because agglomerates contribute for suspensions with high viscosities
For maximum viscosity ηm Cs and Sst were the most statistically significant factors with a positive value of the effect for Cs and negative value of the effect for Sst For higher Cs (20) and lower Sst (300 rpm) ηm increases with decreasing tst and tso Curvatures presented in contour lines indicate an interaction between tst and tso (Fig 7) considering all samples
32 Rheological behavior
Initially suspensions present a shear-thinning rheological behavior at low shear rates and all flow curves are shown in Figure 8 However from a given value of shear rate (onset shear rate) onward suspensions present shear-thickening behavior in view of suspension microstructure alterations This onset shear rate value varies with different factor levels used Shear-thickening behavior is maintained up to a critical shear rate is achieved From this point onwards shear-thinning behavior is present again
As discussed in the Introduction there are mainly two possible theories to describe shear-thickening behavior of suspensions order-disorder transition mechanism and hydroclusters formation The order-disorder transition mechanism is not applicable to the present study because particles must have some degree of order before shear-thickening behavior is observed and herein analyzed fumed silica particles do not have a regular shape
Therefore this does not allow for ordered structures to form On the other hand hydroclusters theory is more broadly accepted and more suitable to describe the system under investigation Additionally hydroxyl groups that are present at the ends of PEG chains are able to hydrogen bond with silanol groups on the surface of particles18 This also favors hydrocluster formation and leads to shear-thickening rheological behavior
Figure 7 Effect of maximum viscosity (ηm) with Cs = 20 in volume (silica concentration) and Sst = 300 rpm (stirring speed)
Figure 8 Apparent viscosity versus shear rate for silica-PEG 400 suspensions
Suspension samples 17 and 18 presented yield stress which did not allow for pouring into the particle analyzerrsquos cuvette to determine agglomerate size These samples were prepared with a higher Cs level (20) lower Sst level (300 rpm) and higher tso level (2 h) that can lead to respectively an increase in yield stress less intensive shearing and improved particle distribution These conditions would contribute to fluid structuring and cause an increase in yield stress
As discussed in the Statistical Analysis section Cs was by far the most relevant factor for all response variables Therefore samples and trends in Fig 9 can be analyzed in groups according to Cs factor levels
7Rheological Parameters of Shear-Thickening Fluids Using an Experimental Design
Samples with Cs = 20 presented higher ηm and were then subdivided into two groups group A is composed of samples 02 03 07 and 18 and group B comprises samples 14 15 17 and 19 Group A samples presented higher ηm and lower
mco than the ones from group B As illustrated in Table 3 ηm values from group A samples varied from 1237 to 150 Pas and mco values were in the range of 3449 to 3972 s-1 for group B these ranges varied from 5793 to 7745 Pas and from 4775 to 586 s-1 Maximum viscosities values obtained in this work for fumed silica concentration of 20 were higher than those obtained by Ozel et al10 and by Liu et al7 ie 11 and 50 Pas respectively as presented in Table 1
Samples belonging to group A showed a continuous shear-thickening behavior while samples belonging to group B showed a discontinuous shear-thickening behavior in accordance with the results presented by Jamali et al9 and Jiang and Zukoski21
Continuousdiscontinuous shear-thickening behavior was probably related to the packing of agglomerates generated during sample preparation In view of an irregular morphological distribution of fumed silica particles as received they could be agglomerated because of physical entanglements between themselves With a lower stirring time (tst = 05 h) these physical entanglements would remain in suspension even after samples had been prepared and would thus form suspensions with less packable agglomerates (group B) As to a higher stirring time (tst = 8 h) these physical entanglements would not only be undone but also fumed
silica particles would rupture as a result of the action of the mixer Thus suspensions with agglomerates that are less physically entangled ie more packable (group A) would form Hydrodynamic forces would prevail in the formation of group A agglomerates while physical entanglements would prevail in the formation of agglomerates related to group B
Available literature on shear thickening fluids using fumed silica has no concern about agglomeration that fumed silica presents when received from the supplier According to this present work the degree of agglomeration clearly influences the results obtained Therefore degree of agglomeration analysis is fundamental to obtain reliable results
Simultaneous clearer visualization of rheological behavior of several samples is made possible by normalized apparent viscosity All values of apparent viscosity were divided by their respective initial value This strategy disregards the initial state of each sample and allows for identification of specific trends and relative comparisons besides it highlights the formation kinetics of hydroclusters as shown in Fig 9
Higher degree of packing would contribute to greater interaction between group A agglomerates in comparison with those of group B and lower shear rates would be required for hydrocluster formation Samples belonging to group A indeed presented lower critical shear rates than samples from group B as shown in Figures 8 and 9
Trends in apparent viscosity would also be related to hydrocluster packing Less packed hydroclusters would allow suspensions to reach higher viscosities at higher shear rates as occurred in group B samples Suspensions formed by more packed hydroclusters reached higher viscosities at lower shear rates as occurred in group A samples
The hydroclusters formation rate is proportional to the slope of flow curves during the shear-thickening behavior This slope is related to the flow behavior index (n) presented in the Ostwald de Waele model or Power Law
K mn 1h c= -o Q V
where η is the apparent viscosity K is the flow consistency index and co is the shear rate For shear-thickening behavior of samples with Cs = 20 the flow behavior indexes are presented in Table 4
Figure 9 Normalized apparent viscosity as a function of shear rate
Table 4 Flow behavior indexes for shear-thickening behavior of samples with 20 fumed silica concentration SD = standard deviation and R2 = coefficient of determination
Group sample Samples n plusmn SD R2
A 18 275 plusmn 005 099A 03 275 plusmn 006 091A 07 437 plusmn 018 096A 02 459 plusmn 010 099B 14 977 plusmn 040 098B 19 994 plusmn 082 090B 17 1233 plusmn 102 094B 15 1494 plusmn 083 097
Bosco et al8 Materials Research
Higher n values were observed in group B samples and thus characterize discontinuous shear-thickening behavior which would have been mainly owing to physical entanglements between agglomerates to form hydroclusters On the other hand lower n values were observed in group A samples which characterizes continuous shear-thickening behavior which would have been in turn mainly on account of the formation of hydroclusters by the hydrodynamic forces
According to Barnes1 hydroclusters are broken down at high shear rates when they are formed by hard particles Hence this reduces apparent viscosity However for the case of soft particles hydroclusters are not undone but rather deformed in the direction of flow at high shear rates In this case apparent viscosity also decreases (Fig 10) For a suspension formed by soft particles the critical shear rate tends to be lower than the one from suspension formed by hard particles The reason for this is that less energy would be required to deform packable agglomerates than to undo agglomerates with hard particles
Higher Sst during the preparation of sample 09 may have promoted some degree of damage in suspension microstructure causing a decrease in viscosity compared to sample 12 (Fig 9) Again according to ANOVA test (p-level ( 005) for R Sst was statistically significant while tst did not present statistical significance It is possible that a higher Sst level may have compromised the interactions between particles and may have made it difficult for agglomerates to form This could explain smaller agglomerate sizes for this sample in comparison with sample 12 This same principle could be applied when comparing samples 06 and 13
It is not in all cases that an increase in shear rate causes hydrocluster formation and results in an increase in viscosity Flow curves for samples 06 08 10 and 13 showed similar behavior in the analyzed shear rate range Viscosity values for these samples did not undergo a significant increase and decreased abruptly when a shear rate of 465 s-1 was reached This was possibly due to structural disassembleorientation in the fluid microstructure during shearing
For Cs = 5 and tst = 05h samples 08 and 10 differed between each other in Sst (3000 rpm and 300 rpm respectively) and tso (respectively no sonication treatment and tso = 2h) Sst was responsible for the difference between these samples because it was a factor more statistically significant than tso as shown by ANOVA test A higher Sst resulted in lower agglomerate size (R) for sample 08 than for sample 10 (Table 3) Higher Sst also disturbed the suspension microstructure to a greater extent and caused sample 08 to be less viscous than sample 10 in the entire shear rate range (Fig 9)
Microstructural disassemble may explain the fact that sample 01 presented roughly Newtonian behavior as this sample underwent longer tst (8h) higher Sst (3000 rpm) and longer tso (2h)
4 Conclusions
In order to have a higher viscosity in a higher critical shear rate samples need to be prepared with higher fumed silica concentration longer stirring time lower stirring speed and longer sonication time
Because we are interested in the shear-thickening behavior samples 02 (fumed silica concentration of 20 stirring time of 8 h stirring speed of 3000 rpm and sonication time of 2 h) and 07 (fumed silica concentration of 20 stirring time of 05 h stirring speed of 300 rpm and no sonication) would be the most promising options because they resulted the highest maximum viscosities From this perspective sample 02 would be even more appropriate because it presents higher viscosity values for the most part of the shear rate range In terms of shear rate range sample 03 would be more suitable for future work because presented the highest viscosities in almost all its shear rate range studied (from 01 to 20 s-1) even though its maximum viscosity value was lower than that of the aforementioned samples
Figure 10 Breaking down of hydroclusters formed by hard particles (a) and deformation of hydroclusters formed by soft particles (b) as the shear rate is increased
Agglomerates in suspensions probably presented different degrees of packing given the presence of free volume in their interiors In much the same way that agglomerates with lower degrees of packing could be treated analogously as hard particles those with higher degrees of packing could be treated analogously as soft particles
Samples with Cs = 5 did not show shear-thickening behavior so expressive as that of samples with Cs = 20 Preparation of samples 04 and 12 differed only with respect to tso sample 12 had been submitted to sonication treatment (tso = 2h) and sample 04 had not It appears that sonication treatment favored particle distribution and decreased the degree of agglomeration This would cause a decrease in agglomerate size (R) values and would reflect a lower viscosity for sample 12 in the entire range of shear rates studied as shown in Fig 9 This same principle could be applied when comparing samples 13 and 10
Samples 09 and 12 were prepared with different tst (stirring time) and Sst (stirring speed) According to ANOVA test for ηm Sst presented higher statistical significance than tst In other words Sst prevailed over tst
9Rheological Parameters of Shear-Thickening Fluids Using an Experimental Design
5 Acknowledgment
The authors would like to thank CAPES for the fellowship of the first author and also Evonik Industries AG for the donation of Aerosilreg 200 fumed silica nanoparticles
6 References
1 Barnes HA A handbook of elementary rheology Aberystwyth Cambrian Printers 2000
2 Egres RG Wagner NJ The rheology and microstructure of acicular precipitated calcium carbonate colloidal suspensions through the shear thickening transition Journal of Rheology 200549(3)719-746
3 Jiang W Sun Y Xu Y Peng C Gong X Zhang Z Shear-thickening behavior of polymethylmethacrylate particles suspensions in glycerine-water mixtures Rheologica Acta 2010491157-1163
4 Mewis J Wagner NJ Colloidal suspension rheology Cambridge University Press Cambridge 2012
5 Ding J Tian T Meng Q Guo Z Li W Zhang P Ciacchi FT Huang J Yang W Smart Multifunctional Fluids for Lithium Ion Batteries Enhanced Rate Performance and Intrinsic Mechanical Protection Scientific Reports 201332485
6 Brady JF Bossis G The rheology of concentrated suspensions of spheres in simple shear-flow by numerical-simulation Journal of Fluid Mechanics 1985155105-129
7 Liu XQ Bao RY Wu XJ Yang W Xie BJ Yang MB Temperature induced gelation transition of a fumed silicaPEG shear thickening fluid Rsc Advances 20155(24)18367-18374
8 Cwalina CD Wagner NJ Material properties of the shear-thickened state in concentrated near hard-sphere colloidal dispersions Journal of Rheology 201458(4)949-967
9 Jamali S Boromand A Wagner NJ Maia J Microstructure and rheology of soft to rigid shear-thickening colloidal suspensions Journal of Rheology 201559(6)1377-1395
10 Ozel BG Orum A Yildiz M Menceloglu YZ Experimental study on the rheology of anisotropic flocculated and low volume fraction colloids Korea-Australia Rheology Journal 201426(1)105-116
11 Hoffman RL Discontinuous and dilatant viscosity behavior in concentrated suspensions II Theory and experimental tests Journal of Colloid and Interface Science 197446(3)491-506
12 Jiang W Xuan S Gong X The role of shear in the transition from continuous shear thickening to discontinuous shear thickening Applied Physics Letters 2015106151902
13 Montgomery DC Design and Analysis of Experiments New Jersey John Wiley amp Sons Inc 2016
14 Wu QM Ruan JM Huang BY Zhou ZC Zou JP Rheological behavior of fumed silica suspension in polyethylene glycol Journal of Central South University of Technology 200613(1)1-5
15 Haris A Lee H Tay TE Tan VBC Shear thickening fluid impregnated ballistic fabric composites for shock wave mitigation International Journal of Impact Engineering 201580143-151
16 Kang TJ Kim CY Hong KH Rheological behavior of concentrated silica suspension and its application to soft armor Journal of Applied Polymer Science 2012124(2)1534-1541
17 Fahool M Sabet AR UV-visible assessment of hydrocluster formation and rheological behaviour in bimodal and mono-disperse shear thickening fluids Rheologica Acta 201554(1)77-83
18 Hasanzadeh M Mottaghitalab V Rezaei M Rheological and viscoelastic behavior of concentrated colloidal suspensions of silica nanoparticles A response surface methodology approach Advanced Powder Technology 201526(6)1570-1577
19 Warren J Offenberger S Toghiani H Pittman Junior CU Lacy TE Kundu S Effect of Temperature on the Shear-Thickening Behavior of Fumed Silica Suspensions Acs Applied Materials amp Interfaces 20157(33)18650-61
20 Baharvandi HR Khaksari P Kordani N Alebouyeh M Alizadeh M Khojasteh J Analyzing the Quasi-static Puncture Resistance Performance of Shear Thickening Fluid Enhanced P-aramid Composite Fibers and Polymers 201415(10)2193-2200
21 Jiang T Zukoski C Rheology of high density glass of binary colloidal mixtures in unentangled polymer melts Soft Matter 20139(11)3117-3130
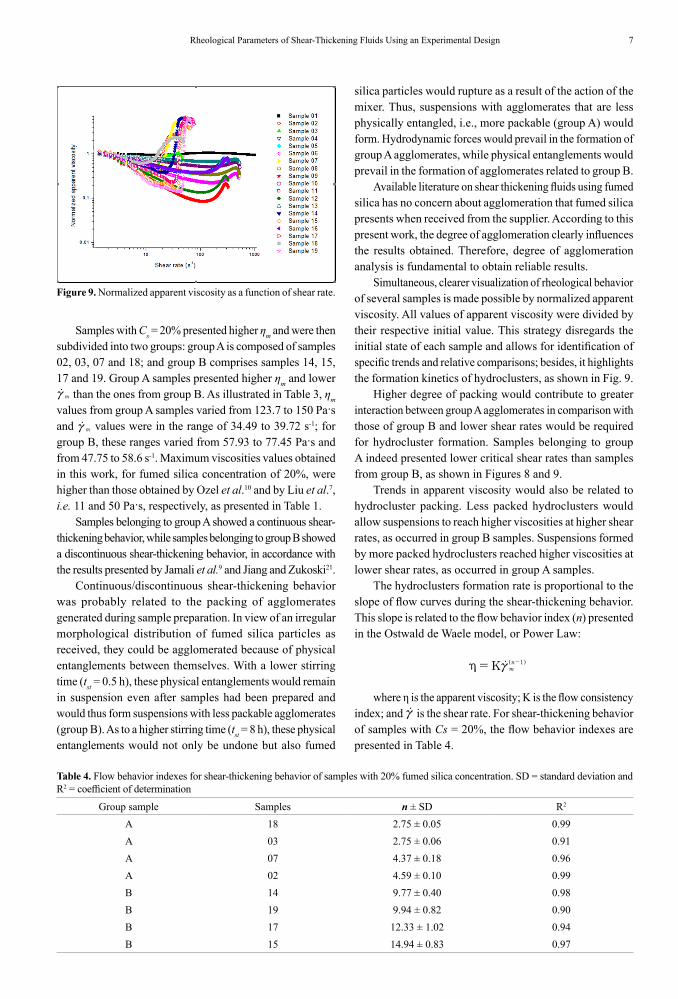
Related Documents