Revisiting the relationship between CRM, business strategy and firm performance by complementing the sources-position-performance framework with value curve analysis An empirical study of the competitiveness in the industrial and small business segments of the liberalized electricity market in Portugal Maria Ana Pinto Osório Católica Porto Business School 2021

Welcome message from author
This document is posted to help you gain knowledge. Please leave a comment to let me know what you think about it! Share it to your friends and learn new things together.
Transcript
Revisiting the relationship between CRM, business
strategy and firm performance by complementing
the sources-position-performance framework with
value curve analysis
An empirical study of the competitiveness in the industrial and small
business segments of the liberalized electricity market in Portugal
Maria Ana Pinto Osório
Católica Porto Business School
2021

Revisiting the relationship between CRM, business
strategy and firm performance by complementing
the sources-position-performance framework with
value curve analysis
An empirical study of the competitiveness in the industrial and small
business segments of the liberalized electricity market in Portugal
Final Work in Organisational Context presented to Universidade Católica
Portuguesa in order to obtain the master’s degree in Management
by
Maria Pinto Osório
Under the guidance of
Professor Doctor Luís Pina Rebelo
Católica Porto Business School, Universidade Católica Portuguesa
June 2021


v
Acknowledgements
First of all, I would like to thank my advisor for the final master's work,
Professor Doctor Luís Pina Rebelo, for his support and help in the development
of my study. It was undoubtedly an orientation that provided me with
motivation and strength throughout the period of research and writing of the
thesis. I also have to thank the Professor for the openness and autonomy that he
provided me in all situations, wanting above all that this thesis resulted from my
own work, always guiding me in the right direction.
I would also like to thank Engineer Edgar John for the opportunity he gave
me to be part of the company EDP Distribuição, currently known as E-REDES,
and for allowing me to acquire more knowledge about the energy sector and all
the dynamics that it involves.
Finally, I would like to express my deepest gratitude to my parents for
their constant help and support during this period of development of the thesis,
as well as for the fact that they allowed me to obtain a master's degree in the area
and institution that I wanted.


vii
Resumo
O Mercado de Liberalizado de Eletricidade em Portugal é caracterizado por
assumir estratégias “fortemente ancoradas no seu ambiente competitivo externo”
(Raimundo e Domingues 2021) e por possuir um reduzido grau de inovação do
produto em questão. Apesar de existir ainda uma presença significativa da
empresa ex-monopolista no setor, as empresas procuram cada vez mais adotar
uma posição atraente no mercado, captando a atenção dos intervenientes de uma
forma diferente, única e inovadora, isto é, definindo uma estratégia de
posicionamento.
Segundo diversos estudos, um posicionamento eficaz permite às empresas
responder às necessidades dos seus clientes, diferenciando-se dos concorrentes
e, desta forma, melhorar o desempenho financeiro da empresa, assim como, a
lealdade e satisfação dos clientes (McAlexander et al. 1993; Porter 1996; Pham e
Muthukrishnan 2002; Fuchs e Diamantopoulos 2010, 2012).
Para além disto, foram identificados diferentes estudos que analisam o
impacto diferencial do CRM no desempenho das empresas, através da aplicação
da framework sources-position-performance (Day e Wensley 1988; Reimann et
al. 2010). Contudo, não foi encontrado nenhum artigo que analisasse o vínculo
entre o CRM, as estratégias de posicionamento e o desempenho no mercado
liberalizado de eletricidade em Portugal.
Este estudo apresenta ainda como fator complementar a análise das curvas de
valor, para definição e estudo da perceção de valor dos clientes do setor de
eletricidade dos respetivos segmentos. Esta ferramenta irá permitir,
posteriormente, analisar e comparar a perceção dos clientes com as estratégias de
posicionamento definidas pelas diferentes empresas de energia.

viii
Posto isto, o objetivo principal deste estudo é analisar as relações entre o CRM,
estratégias de negócio e desempenho das quatro maiores empresas do setor de
eletricidade em Portugal, em particular, no segmento dos pequenos negócios e
no segmento industrial, através da framework sources-position-performance e
ainda, analisar através da ferramenta curva de valor, desenvolvida no âmbito da
Estratégia de Oceano Azul, a perceção de valor dos clientes dos diferentes
segmentos em estudo.
Este estudo é comporto por seis partes: na primeira parte será realizada uma
revisão de literatura dos conceitos-chave ao desenvolvimento de todo o trabalho;
na segunda parte será apresentada uma breve contextualização do setor
português de eletricidade; a terceira parte é constituída pela definição das
diferentes hipóteses; a quarta parte é constituída pela metodologia adotada no
estudo, assim como, pela apresentação das variáveis presentes; na quinta parte
são apresentados os resultados e a discussão; e por último, na sexta parte são
relatadas as conclusões finais do estudo e ainda, as limitações e sugestões de
pesquisas futuras.
Palavras-chave: Framework Sources-Position-Performance; Curvas de Valor;
Estratégia de Negócio; CRM; Mercado Liberalizado de Eletricidade; Setor de
Energia; Portugal


x
Abstract
In Portugal, the Electricity Market is characterized by assuming strategies
strongly anchored in its external competitive environment (Raimundo and
Domingues 2021) and by having a low degree of innovation of the product.
Although there is still a significant presence of the ex-monopolist company in the
sector, companies increasingly seek to adopt an attractive position in the market,
capturing the attention of the stakeholders in a different, unique and innovative
way, that is, defining a positioning strategy.
According to several studies, an effective positioning allows companies to
respond to the needs of their customers, differentiating themselves from
competitors and, thus, improving the company's financial performance, as well
as customer loyalty and satisfaction (McAlexander et al. 1993; Porter 1996; Pham
and Muthukrishnan 2002; Fuchs and Diamantopoulos 2010, 2012).
In addition, different studies have been identified that analyse the differential
impact of CRM on company performance, through the application of the sources-
position-performance framework (Day and Wensley 1988; Reimann et al. 2010).
However, no article was found that analysed the link between CRM, positioning
strategies and performance in the liberalized electricity market in Portugal.
This study also presents as a complementary element the analysis of the value
curves, for the definition and study of the perception of value of the customers
of the electricity sector in the respective segments. This tool will later allow to
analyse and compare the perception of customers with the positioning strategies
defined by the different energy companies.
That said, the main objective of this study is to analyse the relationships
between CRM, business strategies and performance of the four largest companies
in the electricity sector in Portugal, in particular, in the small business segment

xi
and in the industrial segment, through the sources-position-performance
framework and further, analyse through the value curve tool, developed within
the scope of the Blue Ocean Strategy, the perception of value of customers in the
different segments under study.
This study is divided into six parts: in the first part there will be a literature
review of the key concepts for the development of all the work; in the second
part, a brief contextualization of the Portuguese electricity sector will be
presented; the third part consists of defining the different hypotheses; the fourth
part consists of the methodology adopted in the study, as well as the presentation
of the variables present; in the fifth part the results and the discussion are
presented; and finally, in the sixth part, the final conclusions of the study are
reported, as well as the limitations and suggestions for future research.
Keywords: Sources-Position-Performance Framework; Value Curve; Business
Strategy; CRM; Liberalized Electricity Market; Energy Sector; Portugal


xiii
Index
Acknowledgements ....................................................................................................... v
Resumo .......................................................................................................................... vii
Abstract ........................................................................................................................... x
Index ............................................................................................................................. xiii
Figure Index................................................................................................................. xvi
Table Index .................................................................................................................. xix
Introduction .................................................................................................................. 22
Chapter 1: Literatura Review ..................................................................................... 27
1.1 Electricity Market Liberalization ..................................................................... 27
1.1.1 From Monopoly to Competition ............................................................. 28
1.2 Sources-Position-Performance Framework .................................................... 30
1.2.1 Sources ........................................................................................................ 33
1.2.2 Positioning Strategy .................................................................................. 36
1.3 Value Curve Analysis ........................................................................................ 38
Chapter 2: Research Context ...................................................................................... 41
Background Information of Portugal's Energy Market ...................................... 41
Chapter 3: Hypotheses Development ....................................................................... 44
Indirect performance effects of CRM ..................................................................... 44
Chapter 4: Methodology ............................................................................................. 47
Overview .................................................................................................................... 47
4.1 Questionnaire's Structure.................................................................................. 48
4.2 Data Collection ................................................................................................... 50
4.3 Data Description ................................................................................................. 52
4.4 Estimation Procedure ........................................................................................ 56
Chapter 5: Results and Discussion ............................................................................ 58
5.1 Results of the survey carried out for managers ............................................. 59
5.2 Perception of value by customers .................................................................... 66
5.2.1 Industrial Segment .................................................................................... 66
5.2.2 Small Business Segment ........................................................................... 73

xiv
5.2.3 Comparison between Segments .............................................................. 79
5.3 Analysis and discussion of results ................................................................... 83
Chapter 6: Conclusion ................................................................................................. 95
References ..................................................................................................................... 98
Appendix .................................................................................................................... 113


xvi
Figure Index
Figure 1: The elements of competitive Advantage (Day & Wensley, 1988) ........ 31
Figure 2: The structural model of CRM, differentiation, cost leadership, and
performance taken from the study created by Reimann et al. (2010) .................. 36
Figure 3: Adaptation of the model created in the study by Reimann et al. (2010)
........................................................................................................................................ 59
Figure 4: Average valuation of each variable .......................................................... 61
Figure 5: Value Curve of the four biggest energy companies in Portuguese
Electricity Market – Industry Segment ..................................................................... 67
Figure 6: Value Curve according to the change of supplier on entering the
liberalized market – Industrial Segment .................................................................. 68
Figure 7: Value Curve according to the duration of service provision (< 15 years)
– Industry Segment...................................................................................................... 69
Figure 8: Value Curve according to the duration of service provision (> 15 years)
– Industry Segment...................................................................................................... 70
Figure 9: Value Curve according to the degree of customer satisfaction (< 3
values) – Industrial Segment ...................................................................................... 72
Figure 10: Value Curve according to the degree of customer satisfaction (> 3
values) – Industrial Segment ...................................................................................... 72
Figure 11: Value Curve of the four biggest energy companies in Portuguese
Electricity Market – Small Business Segment .......................................................... 74
Figure 12: Value Curve according to the change of supplier on entering the
liberalized market – Small Business Segment ......................................................... 75
Figure 13: Value Curve according to the duration of service provision (< 15 years)
– Small Business Segment........................................................................................... 76

xvii
Figure 14: Value Curve according to the duration of service provision (> 15 years)
– Small Business Segment........................................................................................... 77
Figure 15: Value Curve according to the degree of customer satisfaction (< 3
values) – Small Business Segment ............................................................................. 78
Figure 16: Value Curve according to the degree of customer satisfaction (> 3
values) – Small Business Segment ............................................................................. 79
Figure 17: Summary scheme of relationships between variables adapted from the
model by Reimann et al. (2010) ................................................................................. 91


xix
Table Index
Table 1: Definition of the different segments - Source: Energy Services
Regulatory Authority, Informative Summary Liberalized Market Electricity,
December 2020 ............................................................................................................. 42
Table 2: Market share in the electricity sector in Portugal according to the number
of customers - Source: Energy Services Regulatory Authority (ERSE)................ 43
Table 3: Market share in the electricity sector in Portugal according to the
annualized consumption - Source: Energy Services Regulatory Authority (ERSE)
........................................................................................................................................ 43
Table 4: Summary table of respondent managers' answers ................................. 60
Table 5: Descriptive analysis of the different variables ......................................... 61
Table 6: Spearman's correlation matrix ................................................................... 65
Table 7: Customer satisfaction average of the different companies .................... 85
Table 8: Evolution of EDP Comercial's Market Shares in terms of annualized
consumption – source: Energy Services Regulatory Authority (ERSE) ............... 87
Table 9: Evolution of EDP Comercial's Market Shares in terms of number of
customers – source: Energy Services Regulatory Authority (ERSE) .................... 87
Table 10: Financial information of the EDP Comercial company – source: SABI
database ......................................................................................................................... 88
Table 11: Financial information of the Endesa company – source: SABI database
........................................................................................................................................ 89
Table 12: Financial information of the Iberdrola company – source: SABI
database ......................................................................................................................... 89
Table 13: Financial information of the Galp company – source: SABI database 89

xx
Table 14: Summary table of correlations and p-value of each variable under
study and of collected qualitative information. ...................................................... 92


22
Introduction
Previously, energy supply in the European Union was based on national and
regional markets made up of vertically integrated companies, which were freely
authorized to produce, transmit and distribute energy on the market. These
companies ended up constituting natural monopolies that prevented new
companies from entering the market. Therefore, the process of liberalization and
union of the energy sector aims to create a resilient and integrated market
(Tulloch 2018), which allows the free flow of energy across borders.
Increased competition in the energy market has required ex-monopolist
companies to change both at a strategic and behavioural level, specifically,
changes in their relationship with stakeholders. Over the years, customers in the
energy sector have achieved significant importance in the market dictating, in
many cases, the strategic direction of a company. According to Ruiz et al. (2008),
companies increasingly seek to maintain a solid base with their customers in
order to guarantee their survival, growth and financial performance.
Shemwell et al. (1998), defends that the driving factor of a competitive
advantage in a world that presents a constant evolution of the competition, is the
delivery of high-quality services that, in turn, result in a greater satisfaction of
the customers. However, several studies claim that to achieve a sustainable
competitive advantage it is necessary to adopt a more comprehensive approach
than a simple focus on service quality or customer satisfaction (Woodruff 1997;
Vargo and Lusch 2004; Steenkamp and Geyskens 2006; Rantala et al. 2019). They

23
argue that the creation of value for the customer must represent a new paradigm
and focus on the companies' strategy.
Woodruff (1997, p. 142) describes customer value as something that
“incorporates both desired and received value and emphasizes that value stems
from customers' learned perceptions, preferences, and evaluations.”. In addition
to this, the author Rantala et al. (2019) argue that these customer experiences and
perceptions regarding a service influence their loyalty and, consequently, affect
the performance of a company. However, according to Kataria and Saini (2019)
the intrinsic value of a company's product or service also influences customers'
decision making, as it is through the perception of this value that they establish
their purchasing decisions. It is extremely important nowadays for companies to
demonstrate the value that their products or services hold, as well as ensuring
that they deliver a superior value to the market compared to their competitors.
Over time, Customer Relationship Management (CRM) has shown great
importance in collecting information and managing relationships that allows
companies to understand how they can offer a value perceived and desired by
customers. According to the authors Campbell (2003) and King and Burgess
(2008), CRM has enormous potential in helping companies to understand more
precisely, the behaviour and needs of their customers. In addition, CRM is a tool
capable of systematically accumulating and processing information throughout
the customer's life cycle, allowing companies to achieve profitable relationships
with them and, in this way, differentiate their offerings (Mithas et al 2005).
In addition, the authors Kim and Mauborgne (2005) developed a tool capable
of showing a competitive and attractive value proposal (value curve), which
companies must adopt in order to achieve an advantage in the market. According
to them, it is necessary to create an untapped market in order to change the
current focus on competition to a focus on creating value and innovation of
products or services (Blue Ocean Strategy).
24
Although there are several studies that analysed the impact of CRM on a
company's positioning strategies and performance in different sectors (Day and
Bulte 2002; Reimann et al. 2010) and that applied the value curve analysis to
different markets, such as, the video games (Hollensen 2013), the mobile phones
(Chang 2010) and the fitness industry (Vieira and Ferreira 2018), no author was
found to analyse the liberalized electricity market in Portugal, in particular, the
small business segment and industrial segment.
Therefore, the objective of this study is essentially to analyse the relationship
between CRM, business strategy and performance through the sources-position-
performance framework created by the authors Day and Wensley (1988), in two
of the segments of the energy market in Portugal.
In addition, the value curve tool will be used to highlight the parameters most
valued by customers in the different segments under study, in order to present a
comparative analysis of the positioning strategies of the four largest companies,
after the transition from a domain monopoly to a competitive market.
Furthermore, the objective of this study is to answer the following research
questions:
- What is the relationship between CRM, business strategies and the
performance of the four largest companies in the electricity sector in Portugal,
in particular, in the industrial segment and in the small business segment?
- What are the attributes most valued by customers in the liberalized electricity
market in Portugal, specifically, in the industrial segment and in the small
business segment?
It was discovered that in the liberalized electricity market in Portugal, in
particular in EDP Comercial company, there is no clear relationship between
CRM and the company's differentiation strategy and performance variables.
However, there is a strong possibility that this relationship exists and is directly

25
proportional. Also, it was discovered that the relationship between EDP
Comercial’s CRM and the cost leadership strategy exists.
In addition, it was also apparent through this study that EDP Comercial's
business strategies in the liberalized electricity market, specifically in the small
business and industrial segments, meet the parameters valued by customers in
the different segments under study, when selecting an electricity company in the
liberalized market.
It is important to explain that in this study business customers were selected
because, according to Hollyoake (2009), the difference between the relationship
among two companies versus the relationship among a company and a customer
is the experience, which proves to be an integral part of the general
dynamic/proposition customer management (CM). Also, citing the respective
author, business customers are “more likely to demand a certain experience
package as part of a tendering process, and to actively monitor progress against
their key experience performance indicators.”.
That said and given that the customers of the different segments in the
electricity sector in Portugal have distinct and very specific needs, namely, the
consumer facilities, the study of these customers in the energy market was
considered important.
The analysis carried out in this dissertation is particularly relevant both for
companies in the liberalized energy market in Portugal that want to grow in this
sector and compete with the ex-monopolist company, and for the EDP Comercial
company itself, which intends to maintain its leadership in the market. This study
allows companies to understand the attributes most valued by customers and
their switching behaviour, as well as define marketing and service strategies that
generate value for customers.
The structure of this work is composed of six parts. In the first part, a literature
review was carried out that aims to introduce several key concepts for the
26
development of this study, such as: the liberalization of the energy market; the
different adversities that monopolistic companies face with the entry of new
companies in the market; the sources-position-performance framework; the
clarification of the concepts used in the framework, namely, resources and
positioning strategy and the explanation of the value curve analysis. In the
second part, a brief contextualization of the electricity market in Portugal is
carried out. In the third part, the different hypotheses are presented and in the
fourth part, the research method adopted in this study is described, as well as the
different variables present in it. In the fifth part, the results are shown. And,
finally, the conclusion regarding the study is presented, as well as its limitations
and suggestions for future research.

27
Chapter 1 Literature Review
1.1 Electricity Market Liberalization
The process of liberalizing national electricity markets in the EU has evolved
and expanded gradually. This process consists of deregulation of the retail
market with the objective of progressively eliminating regulated prices,
increasing the quality of services and improving the economic efficiency of the
sector, promoting the possible entry of competing companies (Karahan and
Toptas 2013; Ghazvini 2019).
According to Kuleshov et al. (2012), the electricity markets that are vertically
integrated present only one company responsible for supplying energy and
providing services. This contrasts with the competitive decentralized electricity
market models presented by the authors Finon and Boroumand (2011), who
argue that the production, distribution and commercialization of this utility must
be disaggregated.
The lack of competition in the energy supply market results in a higher price
being paid by consumers who only have one option to choose from. According
to Platt (2012), with the entry of new companies, the profit and operating costs of
energy suppliers, when compared according to the average consumer bill, are
kept as low as possible. In addition, increased competition results in improved

28
innovation and greater cost efficiency, leading to a reduction in prices for
domestic and industrial consumers (Halkos 2019).
In general, the liberalization of the electricity market begins with the
privatization of state monopolies and the breakdown of existing vertically
integrated structures (Joskow 2008), creating the opportunity for even smaller
companies to enter and compete in this sector (Ghazvini 2019). In addition, the
liberalization of the retail electricity market allows consumers to act as active
players in the market, looking for the best offer among a wide range of
companies. This, in turn, encourages different suppliers to innovate their
products or to present differentiated services.
In particular, in the case of the European Union the changes implemented in
the energy market have a broader purpose and meaning than just economic
concerns. This sector reform is part of a general strategic planning aimed at real
political and market unification of the member states (Halkos 2019). The main
objectives of this process are to distinguish between the competitive (supply to
customers) and non-competitive (network operation) elements; to allow the
competitive elements to have access to the energy infrastructure; to remove
barriers to competition; remove restrictions on switching and introduce
independent regulators to monitor the industry (European Commission 2012).
According to Green et al. (2009), the development of this process was
essentially due to the need to improve the quality of market regulation both at
national level and at the level of the European Union.
1.1.1 From Monopoly to Competition
Previously, all electricity markets were characterized by being dominated by
a monopoly, vertically integrated company, which carried out all the activities
present in the sector.
29
In monopoly conditions, efficient electricity production comes from only one
supplier, public or private, which is subject to government regulations on prices,
investment and service quality (Joskow 1997). In addition to this, there are not
enough incentives for vertically integrated electric power companies to improve
their economic efficiency, as in this type of market consumers only have one
option to choose from. According to the authors Dyner and Larsen (2001), the
objectives of these same companies are, among other types, motivated essentially
by political reasons promoting the growth of the company, the maximization of
income, the increase in employment, the provision of additional services, among
others.
Over time, with structural reforms and restructuring processes, the electricity
markets began to gradually present bilateral, competitive and non-competitive
market conditions (Maradin 2021). This transformation of the sector has
important consequences for ex-monopolist companies that face new competitors
and new contexts. According to the authors Wieringa and Verhoef (2007), these
companies despite having a competitive advantage associated with the fact that
they are already known by consumers, are not used to facing competitors,
suffering from an inflexibility to adapt to change and the surrounding
bureaucracy. The same authors also state that, in general, monopolistic
companies do not have a focus on the customer or high-quality products/services
(Mussa and Rosen 1978) and that, therefore, it is important that they understand
the risk of loss of customers and, in particular, the determinants of switching
behaviour.
The entry of new companies on the market can encourage greater control of
costs and stimulate innovation of products and services (Muradov et al. 2019).
Quoting the same author, “competition is one of the driving forces of economic
development. It is the fundamental principle of the activity of the markets and is
involved in innovation, productivity and economic growth”. Thus, and in order

30
to overcome the lack of customer confidence regarding changes in the market,
the new participating companies must implement either an innovation of their
product/service or a pricing policy capable of capturing the attention of
consumers (Panzar and Willig 1977). These must include creativity and
innovation in their business strategy in order to overcome the advantages
presented by the ex-monopolist company (Kourdi, 2007).
However, the authors Grbac and Radulovic (2008) argue that monopoly
companies in the energy sector manage to maintain their dominant position in
the market, through the use of innovative and quality marketing strategies that
create greater proximity between the company and the customers. In agreement
with the respective authors are Wieringa and Verhoef (2007), who claim that
consumers’ exchange intentions can be avoided through a better quality of the
relationship between the energy company and its customers.
Therefore, it is important that companies that intend to compete in the energy
market define their strategy succinctly, so that they can offer something
innovative and unique, that adds value and that allows them to gain a
competitive advantage over the ex-monopolist company already present in the
sector.
1.2 Sources-Position-Performance Framework
Khaligh et al. (2020) argue that the concept of competitive advantage is related
to the fact that the market perceives a higher value of a company's product or
service, in relation to its competitors. This conceptualization based on the value
perceived by customers is associated with positional market superiority.
However, the concept of competitive advantage can sometimes be related to the

31
term “distinct competence” to mention a superiority over a capability or
resources (Day and Wensley 1988).
According to the authors Day and Wensley (1988), none of the concepts is
entirely right or entirely wrong and, when applied together, they manage to
describe a condition of competitive advantage and the way in which it was
achieved. They also argue that the ambiguity in the notion of competitive
advantage can be overcome by breaking down the concept into 3 component and
irreplaceable parts: the sources, positions, and performance outcomes (SPP). This
breakdown gave rise to the creation of the Source-Position-Performance
framework which, according to the respective authors, is the basis for a
sustainable competitive advantage.
Figure 1: The elements of competitive Advantage (Day & Wensley, 1988)
In general, the proposed linear determinism structure argues that companies
through superior capabilities and resources are able to achieve a competitive
position, which allows them to add more value to their customers
(differentiation) and present lower relative costs (cost leadership). This will allow
companies to improve their performance, namely profitability, market share and
customer relations (Day and Wensley 1988; Jayachandran et al. 2005; Acquaah e
Yasai-Ardekani 2008; Reimann et al. 2010). However, in order to maintain a
sustainable positional advantage, it is necessary to create barriers that make it
difficult to imitate superior capabilities and resources and citing Day and

32
Wensley (1988), “As these barriers to imitation are continually decreasing, the
company must continue to invest to maintain or improve the advantage.”.
The sources-position-performance framework, in defending that
organizational resources and capabilities are the main sources of competitive
advantage, is incorporating elements presented in the resource-based view
(Reimann et al. 2010). According to this logic, the basis for a sustainable
competitive advantage is associated with the creation of a resource that is valid,
durable, superior when compared to competitors and difficult to imitate or
replace (Amit and Schoemaker 1993; Barney 1991; Barney and Hesterly 2008).
Although the sources-position-performance framework is understood as an
extension of the study carried out by Porter (1980), it presents small divergences
in relation to it. According to Porter (1998), companies are able to achieve a
competitive advantage in the market through the application of one of two main
strategies, namely, product differentiation and low-cost strategy.
Porter (1998) argues that differentiation implies being distinct and different
from competitors, namely, offering a superior value in the market and, thus,
improving the performance of a company gaining a competitive advantage. Also,
according to Cavusgil and Knight (2015), differentiation isolates a company from
competition by engendering brand loyalty and associated lower sensitivity to
price. A company can adopt a differentiation strategy applying it in several ways,
such as offering innovative resources, launching effective promotions, providing
superior service, developing a strong brand, among others (Li and Zhou 2010;
Kaliappen and Hilman 2017) to achieve competitive advantage and superior
performance (Sun and Lee 2019).
In contrast, cost leadership may involve creating higher margins than
competitors, achieving lower manufacturing and distribution costs (Reimann et
al. 2010). To this end, companies seek to create efficient scale facilities, reduce

33
costs and tightly control overheads, minimize the costs of R&D, services, sales,
marketing and advertising (Miles 2013; Kaliappen and Hilman 2017).
Also, according to Lorenzo et al. (2018), the company adopts a cost leadership
strategy when it intends to increase its market share, based on the specialization
in certain products or services, as well as on the efficient use of technology and
shortening of the distribution channels to reduce costs. In turn, companies that
invest in the development of products or services that offer unique and necessary
qualities to their customers and that aim to achieve a competitive advantage in
the market, adopt a differentiation strategy.
Although both strategies mentioned by Porter can be used together, the
previous literature argues that there is an incompatibility between both, also
stating that their joint application can lead to the adoption of a stuck-in-the-
middle position (Porter 1980; Kaliappen and Hilman 2017). However, in
agreement with the authors Day and Wensley (1988) are more recent studies that
argue that both strategies can be used in parallel (Kotha and Vadlamani 1995)
and that, in many sectors, applying only one of the two strategies can make a
company vulnerable to its competitors (Reimann et al. 2010).
1.2.1 Sources
According to the sources-position-performance framework created by Day
and Wensley (1988), there are two main sources of positional advantage, namely,
superior capabilities and resources.
The superior resources, citing the respective authors, are “tangible
requirements for advantage that enable a firm to exercise its capabilities”. These
can be characterized in different ways, such as a strategic location of a company's
facilities, automated assembly lines that provide more efficient and faster
production, greater coverage of distribution channels, among others. In turn,
superior capabilities are associated with a company's ability to produce a product

34
or service that is distinct from its competitors. Also, capabilities can be
understood as “discrete practices” (Knott 2003, p. 935) that allow companies to
achieve their goals through a “coordinated deployment of assets” (Sanchez et al.
1996, p. 8).
The authors Day and Bulte (2002), argue that a superior capacity needs to
support a company's competitive strategy in order to extract its full potential in
an efficient and productive way. Also, according to Khalifa (2009), a company's
strategy aims to develop a competitive advantage, and in order to achieve it is
necessary that it creates difference and value where it is important. For this, it is
necessary for the company to pay attention to its most critical stakeholders in
order to capture and retain their loyalty, which are constantly persuaded by
competitors (Campbell and Alexander, 1997).
It is undeniably noticeable that customers are the most important active
stakeholders in the business. A company's goals, such as its growth and
evolution, will not be achieved if customers are not getting the value they
expected to acquire with a particular product or service (Khalifa 2009). Generally,
a customer's purchase decision is based on the perceived value of the different
offers on the market.
A company achieves a positional advantage when it offers relevant benefits
perceived and valued by customers, and when it is not easily imitated by
competitors. This conception of value includes both the perception of the
superiority of a product (product advantage), as well as the perception of
superiority in managing the relationship with customers (relational advantage).
The value perceived by customers in relation to a certain product or service of a
company, when recognized as superior in relation to competitors, has an impact
on their loyalty (Brodie et al. 2009; Grosso and Castaldo 2015) and provides a
positional advantage in the market (Day and Wensley 1988; Adner and Zemsky
2006; Grahovac and Miller 2009). It is through this positional advantage that
35
subsequently translates into a superior performance in customer retention,
positive sales evolution and increased profit (Day and Bulte 2002).
In agreement with the respective authors mentioned, there are several studies
that argue that customer satisfaction and the ability of companies to relate to
them are two variables that are strongly related to customer retention,
profitability, and increased sales (Hallowell 1996; Day and Bulte 2002; Čolaković
e Bajrić 2017). Reimann et al. (2010), state that knowledge about how companies
can profit from their relationships with customers is of significant importance. In
addition, other studies argue that the ability of a company to acquire, manage
and process relational information in an efficient manner, allows it to achieve a
sustainable competitive advantage (Cravens et al. 1997; Higgins 1998; Huber et
al. 2001; Porter 1996; Woodruff 1997; Hogan et al. 2002).
In the different studies carried out by Day (1994, 2004) and in simultaneously
with Van den Bulte (2002), the authors define CRM as the organizational tool
most capable of providing companies with a positional advantage. They also
claim that CRM, in addition to being a tool, is a multifunctional process capable
of providing customer retention and the effectiveness of marketing initiatives,
through continuous dialogue with the most valuable customers, allowing to
define an individualized and personalized treatment to them (Grönroos 2006;
Dash and Das 2009; Shams 2017).
Also, the authors Reimann, Schilke and Thomas (2010) describe CRM as an
element that focuses on the practices that companies use to regularly manage
their customers, extracting the greatest possible value from the relationship with
them.
By associating the CRM concepts of the different authors with the resource-
based view, we can give to this tool a connotation of organizational capability
because, according to the aforementioned logic, the basis for a sustainable
competitive advantage is associated with the creation of a resource that is valid,

36
durable, superior when compared to competitors and difficult to imitate or
replace (Amit and Schoemaker 1993; Barney 1991; Rafiki et al. 2019).
Consequently, CRM as an organizational capability, acts as a source of
sustainable competitive advantage, capable of improving the positioning and
performance of a company (Reimann et al. 2010).
Since this study is an adaptation of the model created by Reimann et al. (2010),
the relationship between CRM and a company's performance will be studied
according to a decomposition of the concept into customer satisfaction,
profitability and market effectiveness.
Figure 2: The structural model of CRM, differentiation, cost leadership, and performance
taken from the study created by Reimann et al. (2010)
1.2.2 Positioning Strategy
There is an extensive literature that justifies the importance of positioning,
referring to this as the central factor of success in the launch and performance of
new products or services on the market, and also in highlighting the peculiarities
of a company and its products and services in compared to direct competitors..
A properly defined and successful positioning results in a brand preference
that influences consumers' decision to choose a particular company over other
competing brands and, consequently, results in a better competitive advantage
(Pham and Muthukrishnan 2002). The authors Fuchs and Diamantopoulos
(2010), state that customers' preference for a particular brand has an impact on
their loyalty, thus increasing a company's opportunities for financial success,

37
namely, its market share, profitability and revenues (McAlexander et al. 1993;
Porter 1996; Smith and Wright 2004; Eklof et al. 2018; Otto et al. 2019). In addition,
when a company creates and maintains the customer loyalty it develops a
mutually beneficial long-term relationship (Pan et al., 2012), that provides
financial and non-financial benefits (Siu et al., 2013) based on its ability to
increase customer value, thereby improving its performance (Kandampully et al.,
2015).
There are several different approaches to measuring the effectiveness of a
company's position presented by the literature. However, according to the
authors Fuchs and Diamantopoulos (2012), all of these can be categorized into
two general approaches, namely, based on the company and based on the
customer.
According to Roth (1992), company-based approaches consist of collecting
information from the respective employees of a company, including managers
and executives, about the positioning they perform, comparing and subsequently
linking this information with the real financial performance of the company, in
particular, sales, market shares and profitability. This approach is the target of
several criticisms because there may be a difference between what companies
want consumers to value from their products or services (i.e., intended position)
and the value they actually perceive (i.e., perceived position) (Lee et al. 2018).
Still, and quoting the author Lovelock (1996, p. 168), “people make their decisions
based on their individual perceptions of reality, rather than on the marketer’s
definition of that reality”. Thus, it is noticeable that the great shortcoming of this
approach is the fact that the perceived position of customers may differ from the
intended position of a company, that is, that the position desired by a company
is not perceived by consumers.
In contrast, the customer-based approach is considered conceptually more
solid since the success of a company's positioning is related to the understanding

38
and perception of the value of a product or service by customers (Sweeney and
Soutar 2001). In this type of approach, information extraction is carried out
through research and studies carried out directly with consumers and can take
different forms.
1.3 Value Curve Analysis
According to Kim and Mauborgne (2004, 2005), the most successful companies
in a given sector are the ones that create or find unique and innovative growth
opportunities in new undisputed and unexplored market spaces, namely, the
“Blue Oceans”.
The “Blue Ocean” strategy proposed by Kim and Mauborgne (2004), it aims to
create a standout among competitors, creating value innovation that reduces
costs and, at the same time, increases value for consumers. This strategy is
essentially a systematic combination of differentiation and low-cost strategies
(Dvorak and Razova 2018) which, unlike the Red Ocean Strategy, seeks to create
an undisputed market space (Shafiq et al. 2017).
The same authors Kim and Mauborgne (2004) created the value curve tool,
which they later called it a “strategy canvas”, which serves to define the general
view of an organization's strategy and facilitate its analysis. According to them,
“The value curve is the basic component of the strategy canvas and constitutes a
graphical representation of the relative performance of a firm in terms of the
competitiveness variables of its industry […]”.
Khalifa (2009) argues that the strategy canvas has two purposes, specifically,
to indicate the current strategy of an organization and its respective competitors
in the market and also to reveal which of the dimensions that add value to the
market companies are investing and focusing on. Therefore, this tool, well
39
applied and analysed by companies, can be a source of positional and
competitive advantage, allowing them to observe “the future in the present”
(Pérez et al. 2010). That is, through value curves, companies are able to obtain a
large amount of information and strategic knowledge about their current and
future competitive position in the market, and also information about the
parameters most valued by customers in relation to a future product or service,
comparing even with existing products or services.
In addition, it is increasingly necessary for companies to place a greater focus
on the customers than on competitors, in order to be able to better adjust the
products or services to their needs, thus managing to outperform competing
companies, acquiring competitive advantages and achieving business success
(Ziggers and Henseler 2016; Yang and Zhang 2018). Consequently, the value
curve becomes a central tool in the development of a competitive and attractive
value proposition. This allows a company to determine which characteristics of
a product or service have the potential to create value for customers.
According to Kaplan (2005), the way in which a company develops a
competitive and innovative value proposal in a market should include certain
attributes, explicitly, related to a product or service (price, quality, availability,
selection and functionality), relationship attributes (service, partner) and image
attributes (brand). Still, the authors Sheehan and Bruni-bossio (2015) argue that
the correct application of these parameters will provide an acceptable value
delivery to customers and, in turn, an increase in the profitability of a company.
In the present study, the strategy canvas tool will be used to draw the different
value curves of companies in the energy sector, based on the information
obtained in the survey regarding the parameters most valued by customers when
choosing a company. This tool will make it possible to assess and compare the
perceptions of customers in the respective segments under study and the

40
positional strategies adopted by each company in the liberalized electricity
market in Portugal.
41
Chapter 2 Research Context
Background Information of Portugal’s Energy Market
The energy market is one of the largest active markets in Portugal due to its
number of customers, individuals and companies, and its high volume of
business. This has undergone several changes over time, with liberalization being
the most evident in the current context.
Previously, the energy sector in Portugal existed under a regulated market
with a monopoly by EDP Serviço Universal (EDP-SU). However, and despite the
high level of maturity, between 1995 and 2006, Portugal gradually accepted the
opening of the market to new companies, following the gradual example of other
European Union countries. Currently, all consumers living in mainland Portugal
are now entitled to choose their energy supplier, with 85% of the total number of
customers and 95% of registered consumption belonging to the retail free market
(ERSE 2020). This new market generated an intensification of competition that
was reflected mainly in prices and in the improvement of the quality of service
provided by companies in the sector.
In 2019, according to the Report published by ERSE on the retail electricity and
natural gas markets, there were 34 companies operating in the market in
Portugal, spread across the four segments, namely, the domestic, small business,
industrial and large consumers segment. All of these segments are differentiated
42
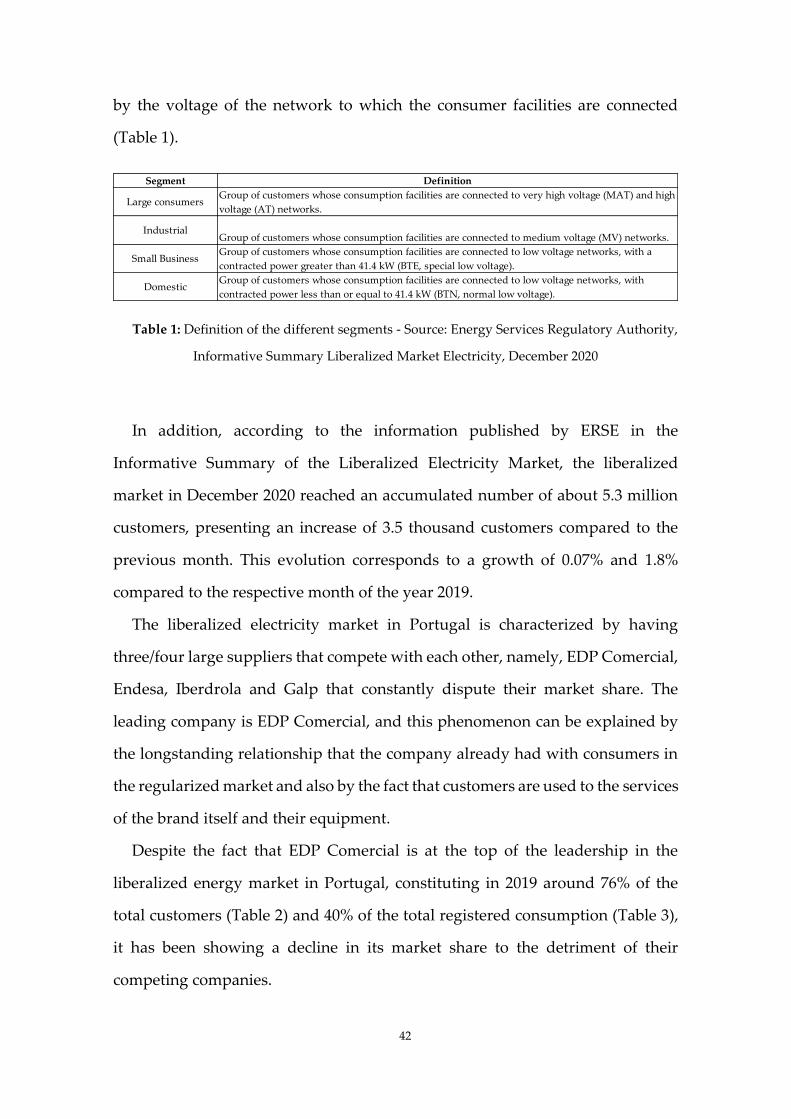
by the voltage of the network to which the consumer facilities are connected
(Table 1).
Table 1: Definition of the different segments - Source: Energy Services Regulatory Authority,
Informative Summary Liberalized Market Electricity, December 2020
In addition, according to the information published by ERSE in the
Informative Summary of the Liberalized Electricity Market, the liberalized
market in December 2020 reached an accumulated number of about 5.3 million
customers, presenting an increase of 3.5 thousand customers compared to the
previous month. This evolution corresponds to a growth of 0.07% and 1.8%
compared to the respective month of the year 2019.
The liberalized electricity market in Portugal is characterized by having
three/four large suppliers that compete with each other, namely, EDP Comercial,
Endesa, Iberdrola and Galp that constantly dispute their market share. The
leading company is EDP Comercial, and this phenomenon can be explained by
the longstanding relationship that the company already had with consumers in
the regularized market and also by the fact that customers are used to the services
of the brand itself and their equipment.
Despite the fact that EDP Comercial is at the top of the leadership in the
liberalized energy market in Portugal, constituting in 2019 around 76% of the
total customers (Table 2) and 40% of the total registered consumption (Table 3),
it has been showing a decline in its market share to the detriment of their
competing companies.
Segment Definition
Large consumersGroup of customers whose consumption facilities are connected to very high voltage (MAT) and high
voltage (AT) networks.
IndustrialGroup of customers whose consumption facilities are connected to medium voltage (MV) networks.
Small BusinessGroup of customers whose consumption facilities are connected to low voltage networks, with a
contracted power greater than 41.4 kW (BTE, special low voltage).
DomesticGroup of customers whose consumption facilities are connected to low voltage networks, with
contracted power less than or equal to 41.4 kW (BTN, normal low voltage).

43
Table 2: Market share in the electricity sector in Portugal according to the number of customers
- Source: Energy Services Regulatory Authority (ERSE)
Table 3: Market share in the electricity sector in Portugal according to the annualized
consumption - Source: Energy Services Regulatory Authority (ERSE)
The following methodology section describes the details of the different
dimensions as used in the data collection instrument, as well as describing the
way in which data is collected.
Month EDP Comercial Endesa Iberdrola Galp
01/12/2016 84,9% 3,7% 2,2% 5,6%
01/12/2017 83,8% 4,3% 2,9% 5,3%
01/12/2018 80,8% 5,7% 4,9% 5,1%
01/12/2019 78,4% 6,5% 6,2% 5,2%
01/12/2020 75,5% 7,5% 6,3% 5,0%
Market share by number of customers - LIBERALIZED MARKET
Month EDP Comercial Endesa Iberdrola Galp
01/12/2016 46,0% 18,1% 14,8% 7,8%
01/12/2017 42,8% 18,3% 15,6% 9,0%
01/12/2018 41,8% 16,8% 17,1% 7,6%
01/12/2019 41,7% 16,6% 17,6% 6,6%
01/12/2020 40,1% 17,2% 16,4% 7,3%
Market share by annualized consumption - LIBERALIZED MARKET
44
Chapter 3 Hypotheses development
Indirect performance effects of CRM
Studies by Palmatier et al. (2006), Sawhney and Zabin (2002), Payne and Frow
(2005), Reimann, Schilke and Thomas (2010) argue that business strategies should
be considered when evaluating the effects of CRM on the performance of a
company, and that companies should present an orientation focused on business
strategies and customer strategy.
Applying the sources-position-performance structure, the authors Reimann et
al. (2010) argue that the performance effect of CRM (as a source), mediated by
the company's business strategies (such as positions), generates superior firm
performance and promotes a sustainable competitive advantage.
More recently, Sozuer et al. (2020) argue that a company to achieve a
sustainable competitive advantage, needs to outline which customers it wants to
satisfy (segmentation) and how it intends to do it (positioning). That said, the
importance of CRM becomes evident as it allows companies to obtain detailed
information about their customers and, in this way, respond effectively to their
needs and expectations, offer a superior value compared to the competition,
predict more accurately the demand and also optimize operations.
The fact that CRM allows companies to effectively collect and analyse
customer information, guarantees the development of customer management
45
practices that allows them to maximize the value of the relationship throughout
their life cycle (Santouridis and Veraki 2017). It is also this tool that allows
companies to develop effective strategies for different segments, in order to
differentiate their offerings and customize their marketing activities and
decisions (such as communication, price, distribution and brand differentiation)
according to the value and needs of the client (Peppers and Rogers 2004, p. 401;
Mithas et al. 2005; Ramaseshan et al. 2006; Richards and Jones 2008).
In addition, CRM allows companies, when integrated into their operational
structures, to reduce sales and service costs, increase buyer retention and
decrease customer replacement costs (Reichheld 1996). This is only achievable
because, through CRM, it is possible to establish long-term relationships between
companies and their customers, thus reducing costs in their management
(Reichheld and Sasser 1990).
Furthermore, the successful implementation of CRM processes allows
companies to identify their most profitable customers and achieve greater
customer loyalty (Reichheld 1996), which in turn results in less volatility
(Reimann 2010) and a more effective forecast demand (Bharadwaj 2000). Both of
these aspects contribute to an increase in the capacity of companies to plan ahead,
thus reducing storage costs and making their use of resources efficient (Reimann
2010).
There is a clear link implicit in the sources-position-performance framework
developed by the authors Day and Wensley (1988), when considering CRM as
the source that allows companies to reach a differentiation or a cost leadership
position, which has an impact on the company performance.
Consequently, the hypotheses present in this study are:
H1: For each of the four largest companies in the liberalized electricity market
in Portugal, there is a relationship between CRM and their differentiation
strategy.

46
H2: For each of the four largest companies in the liberalized electricity market
in Portugal, there is a relationship between CRM and their cost leadership
strategy.
H3: For each of the four largest companies in the liberalized electricity market
in Portugal, there is a relationship between differentiation strategy and their
performance.
H4: For each of the four largest companies in the liberalized electricity market
in Portugal, there is a relationship between cost leadership strategy and their
performance.
H5: For each of the four largest companies in the liberalized electricity market
in Portugal, there is a relationship between CRM and their performance.
It is important to mention that in the development of this study the main
objective was not to "test" the respective hypotheses, but only to discuss them
according to an extraction of market information.

47
Chapter 4 Methodology
Overview
To obtain a better understanding of the energy market and the role that CRM
has in this sector, in particular, in the small business segment and the industrial
segment, an adaptation of Reimann, Schilke and Thomas (2010)’s model was
followed. This model is based on the sources-position-performance framework
and in this study it was applied to the liberalized electricity market in Portugal,
in particular, in what concerns the four largest companies in the sector.
As such, an online survey was applied to the managers of the different
electricity trading companies. The structure of the survey addressed to the
managers of the companies was based on the questionnaire used by the
forementioned article. After collecting information through the survey, a cross-
sectional exploratory-descriptive analysis was carried out.
Finally, the sources-position-performance framework approach by Reimann
et al (2010) was complemented with the use of the strategy canvas developed
under the Blue Ocean strategy (Kim and Mauborgne 2004, 2005) to achieve a
better knowledge of the perception of business customers regarding the
performance in terms of service provided by the different electricity suppliers. In
order to do so, value curves were drawn for the different services provided by
companies in the small business segment and industrial segment from the
48
perspective of customers and, a comparative analysis of the positioning strategies
of the four largest companies defined by managers and the parameters most
valued by customers was carried out. Critical success factors to build value
curves were assessed based on an online survey distributed among the business
community present in the national territory (Appendix 1). This was developed
after an analysis of the existing literature about the different dimensions or
critical success factors valued by customers when evaluating and choosing a
service (Hartmann e Ibáñez 2007; Achchuthan 2014; Aggarwal e Kumar 2018).
Also, it was written in Portuguese to facilitate the correct understanding of the
questions and thus raise the response rate.
In addition to the questionnaires, the collection of information was
complemented with secondary sources, such as: institutional websites, annual
and monthly reports prepared by the Energy Services Regulatory Entity (ERSE)
and also information taken from the SABI platform about the main companies
operating in the electricity market.
4.1 Questionnaire’s Structure
The questionnaire applied to the managers of the different companies consists
of 15 questions distributed over 2 sections. The first section consists of questions
related to CRM and an open question about another types of resources or
capacities that managers consider superior in relation to the competition. In the
second section, questions were raised related to the differentiation and cost
leadership strategies, and also about performance. The questions were presented
on five-point rating scales (for example, 1 = “Strongly disagree” and 5 = “Strongly
agree”).
The questionnaire applied to the business customers consists of 16 questions
distributed over 3 sections, namely, an introductory part where questions are
asked about the respondent company, such as its sector of activity, its electricity

49
supplier, the period of service provision, the amount billing and satisfaction with
the service provided; the second section explores the possibility that the customer
has already been exposed to the regularized market, addressing his satisfaction
with the previous service, and also comparing the current service with the service
provided by the company in the RM; and finally, the third section that analyses
the parameters valued by the customer when choosing his energy supplier, as
well as, different dimensions of a service such as tangibility, reliability,
responsibility, guarantee and empathy.
All the variables studied in the questionnaire, as well as the questions in which
they are inserted, were developed according to a literature analysis about the
parameters valued by customers in relation to a service provided (Hartmann and
Ibáñez 2007; Achchuthan 2014; Aggarwal and Kumar 2018). This selection is due
to the fact that, although the authors Parasuraman, Zeithaml and Berry (1988)
play an important role in the creation of a global scale entitled SERVQUAL,
which aims to measure the quality of services in different sectors based on
expectations and customer perceptions, there are studies that argue that this
generic scale does not transfer the necessary information when applied to specific
sectors (Ladhari 2008).
That said, some of the attributes that the authors Hartmann and Ibáñez (2007),
Achchuthan (2014) and Aggarwal and Kumar (2018) defined for the energy
sector were considered in this study and that are associated with the 5
dimensions of services (tangibility, responsibility, reliability, guarantee and
empathy). These attributes are price, corporate values (environmental and social
commitment), service quality, appealing and easy to understand equipment,
value added services, brand trust and company performance.
To ensure that there were no missing values in both surveys, all the questions
were marked as mandatory, implying that the respondent could not move to the
next questions without answering the previous ones. However, it is important to
50
mention that there was the option "Other", giving the respondents freedom to
add attributes if they did not agree with those present.
4.2 Data Collection
Sampling procedure – The questionnaire created for and applied to the
managers of the energy companies was shared in different ways. For the EDP
Comercial company, internal contacts from EDP Distribuição were used,
acquired throughout a curricular internship, and kindly shared so that the survey
would be applied to the EDP Comercial managers that are responsible for the
company's CRM. For the remaining companies in the electricity sector, the
survey was shared according to data taken from the SABI database, where the
names of the respective managers and the institutional email were removed.
Since the companies competing with EDP Comercial did not respond
successfully to the survey, a message was sent via LinkedIn to the respective
company managers with the request to participate in it. Thus, 11 emails were
sent, resulting in only 3 responses related to the EDP Comercial company. The
messages sent via LinkedIn had no influence on the responses to the survey.
The questionnaire created for and applied to business customers was shared
according to a list extracted from the SABI database, which was organized in
alphabetical order, and subsequently, a selection of companies was made in 5 out
of 5, to create randomness in the sample. The restrictions used in the database
that gave rise to the listing of companies were, namely, restrictions associated
with the essential conditions for a small and medium-sized company (SME). That
is, the number of workers over 10 and less than 250, turnover or operating income
between 2 and 50 million euros, and a total asset between 2 million and 43 million
euros. Besides, it was also restricted to companies that provide their institutional
email contact so that, subsequently, the survey could be sent individually to each
company addressed to the company's General Director or Financial Director.
51
Thus, 2003 emails were sent, resulting in 185 spontaneous responses (120
related to Medium Voltage consumption installations and 65 related to Low
Voltage consumption installations), representing a response rate of 9.24%. It is
important to note that only the completed surveys were considered in the
sample, uncompleted surveys were rejected from the analysis (375 responses,
that is, a rate of 67%).
Respondent characteristics – The sample from the EDP Comercial managers
is composed of 3 male managers, aged between 45 and 60 years.
The sample for the industrial segment is composed of 18% of companies in the
food sector, 15% of the textile and footwear sector, 10% of the automobile and
construction sectors, 5% of the metalworking, metallurgy and ceramics sectors,
6% of the transformation sector, 3% of the chemical and plastics sector and also
of the logistics and transport sector and about 31% of other sectors of activity. In
turn, the sample of the small business segment comprises 14% of companies in
the construction sector, 11% of the textile and footwear sector, 9% of the food
sector, 8% of the pharmaceutical sector, 6% of the automotive sector, 5% of the
technology sector and 48% of other sectors of activity.
Sample characteristics – Both samples from the different segments present a
great representativeness of the EDP Comercial company in its entirety.
Regarding the industrial segment, 37% of the sample consists of customers of the
company EDP Comercial, 4% of EDP-SU, 15% of Endesa, 12% of Iberdrola, 7% of
Galp, 6% of Aldro, 5% of Audax, 4% of Axpo and 11% of Other electricity trading
companies. In the small business segment, the sample consists of 69% of
customers of the company EDP Comercial, 9% of EDP-SU, 5% of Endesa, 3% of
Iberdrola and also of the company Axpo and Audax, 2% of Galp, of Ylce, Aldro,
Ecochoice and Enforce.
52
4.3 Data Description
Through this study, and in order to identify and analyse the CRM and the
positioning strategy of the four largest companies in the energy market, as well
as analyse their performance, the following variables will be studied:
Customer Relationship Management (CRM) – CRM is a tool that allows
aggregating and analysing customer data, with the purpose of generating
superior value for the company and for customers. In addition, it is a process that
involves the integration of marketing, sales, customer service and functions of
the organizations supply chain, which allows to effectively monitor and
understand the innate needs of customers, essential for their retention (Rathore
et al. 2016).
In the operationalization and analysis of this variable, we followed Reimann
et al. (2010), in which they measured CRM as a second-order construct of type
IV: formative first-order (CRM initiation, CRM maintenance and CRM
termination) and formative second-order.
Differentiation – With regard to this variable, there are two positioning
strategies previously identified by Porter (1985) and that will be analysed in this
study: differentiation and cost leadership. Regarding the differentiation strategy,
as in the study by Reimann et al. (2010), four of the dimensions identified in
different articles have been identified, such as communication differentiation
(Boulding et al. 1994; Hill 1990), price differentiation (Hooley and Greenley 2005;
Hupperich et al. 2018; Phillips 2020), distribution differentiation (Costanzo et al.
2003; Kotler and Keller 2012) and brand differentiation (Chaudhuri and
Holbrook 2001; Smith and Park 1992; Li 2020). According to Hill (1990),
communication differentiation can be understood as advertising and promotion
actions, as they are essential marketing communication tools to deliver a
53
company's image and distinguishing message in relation to its competitors. Price
differentiation corresponds to the strategy used by companies that determine the
price of a product or service according to the needs of their potential customers
(Hupperich et al. 2018). Typically, this differentiation strategy involves charging
different prices to different customers for the same product or for partially
different versions of that product (Phillips 2020). Distribution differentiation,
according to Kotler and Keller (2012), consists of efficient and effective planning
on the coverage, specialty and performance of a company's distribution channel,
with the aim of making the purchase of a product easier, more enjoyable and
rewarding. This type of strategy involves presenting mechanisms of distribution
different from those of competitors (Costanzo et al. 2003). Finally, Berger and
Heath (2007) state that when there is an identification between the customer and
a brand, we are talking about brand differentiation. This type of differentiation
capable of winning customers, covers cultural traditions and orientations of the
brand itself, which become important factors responsible for evoking the
psychological identity of people and, sometimes, acting as a symbol that remains
in the minds of consumers (Li 2020).
Differentiation will be measured according to several indicators adapted from
existing scales, used in the study Reimann et al. (2010). The respective authors
used measures from the articles by Kotha and Vadlamani (1995) and Nayyar
(1993) to assess the price and communication differentiation, from the article by
Bienstock et al. (1997) to assess the distribution differentiation and articles by
Chaudhuri and Holbrook (2001) and Davis and Schul (1993) to assess brand
differentiation.
Cost Leadership – In the words of Baack and Boggs (2008), cost leadership is
“the result of some extra efficiency in the cost structure in comparison to
competitors”. Also, according to Murray (1988), this efficiency can be created

54
from extra-beneficial access to distribution channels or resources or be
consolidated in several economies in the production or distribution process, such
as economies of scale, scope, marketing, among others.
This variable will be assessed according to the reflective measure used in the
study Reimann et al. (2010) and according to an analysis of the percentage of costs
per business volume of the different companies, calculated through information
taken from the SABI database.
Although this study focuses essentially on the analysis of the industrial and
small business segments, this variable was analysed as a whole, that is, taking
into account the total operating costs of companies. From a competitive point of
view, this analysis proves to be more relevant in the sense that, although the cost
leadership strategy does not fully reflect the reality of the two segments under
study, it is more advantageous for a company to present reduced total costs in its
generality of the business, than just presenting reduced costs in a certain
segment.
Performance – We followed the lead of Vorhies and Morgan (2005) as well as
Schilke et al. (2009) and Reimann et al. (2010) in measuring firm performance as
three different outcomes, such as, market share or market effectiveness,
profitability and customer satisfaction.
Market share – through this outcome we are able to understand who are the
winners and losers in a market (Day & Wensley 1988). However, if we only
analyse this dimension, we will be carrying out a very simplistic analysis of a
market, because in reality the competitive advantage occurs over the years and
consists of other dimensions. Buzzell (1981) presents in his study an
interpretation of market shares and their evolution.
55
Profitability – several studies argue that there is a relationship between a
company's market share and profitability (Buzzell et al. 1975; Szymanski et al.
1993). This can be considered as the result obtained by a company after deducting
all expenses incurred in a given period of time. Citing Day & Wensley (1988),
profitability “is the reward from past advantages after the current outlays needed
to sustain or enhance future advantages have been paid.”. However, the
interpretation of this outcome is considered complex due to the different
approaches that this concept involves, namely, an accounting approach and a
financial approach (Alberts and McTaggart 1984; Rappaport 1981).
Customer Satisfaction – according to Aggarwal and Kumar (2018), customer
satisfaction is achieved when their expectations and perceptions regarding the
purchase of a certain product or service are met or exceeded. There are two
distinct points of view regarding the definition of customer satisfaction: a
cognitive point of view that defines a customer's satisfaction as the evaluation
that results from comparing the expectations and the customer's perception of
the value of a product or service provided (Spreng and Olshavsky 1993;
Anderson and Sullivan 1993); and an emotional point of view that defines
customer satisfaction as a positive emotional state that resulted from a good
consumption experience (Bagozzi et al., 1999; Oliver 1997; Liljander and
Strandvik 1997).
The value curve tool used in this study allows, in turn, to study the cognitive
point of view of customers, as it indicates the attributes they most value in a given
product or service.
In this study each of the concepts associated with performance was measured
using three items based on Vorhies and Morgan (2005), applied in the study
Reimann et al. (2010). In addition, an analysis of the return on sales (ROS) was
56
carried out using data taken from the SABI database and also an analysis of
customer satisfaction, which they themselves evaluated in the survey applied to
business customers, in order to study effectively the two variables associated
with performance.
4.4 Estimation Procedure
To analyse the relationship between CRM, positioning strategies and
performance in the four largest companies in the electricity sector in Portugal,
the respective hypotheses were tested according to a cross-sectional exploratory
analysis. In the global characterization of the sample, the numerical variables are
summarized through the mean, standard deviation (SD), maximum and
minimum.
Although there is a variety of statistical tests that verify the fit of data to the
normal distribution based on different assumptions and algorithms, there is an
influence of the sample size on their efficiency. In the case of small samples, as
can be seen in this specific study, the Shapiro-Wilk or Shapiro-Francia tests prove
to be the most appropriate for analysis (greater specificity).
Therefore, to verify the existence of relationships between the variables, the
Shapiro-Wilk normality test was performed and, subsequently, a Spearman
correlation analysis was presented. The hypotheses were considered statistically
significant if test values (p-value) were less than 0.05. Statistical analysis was
performed using IBM SPSS software version 27.
It is important to reinforce what was mentioned above, namely, that in the
development of this study the main objective was not to "test" the respective
hypotheses, but only to discuss them according to an extraction of market
information.
In order to map the value curve of the small business and industrial segment
of the energy sector, the surveyed customers were asked to place the attributes
57
previously studied in relation to the assessment of service quality in order of
preference (Barron and Barrett 1996; Stillwell et al. 1981). Although there are
studies that contradict the effectiveness of this question format (Ovadia 2004),
according to Revilla and Couper (2018) it proves to be very attractive because it
allows to obtain different information in just a single question.
The method used to analyse the responses to this question and subsequently
draw up the value curve, was to calculate the average of each of the attributes of
the services provided by energy companies for all respondents. In order to obtain
a more complete analysis, an evaluation of the differences in the value curves
will be carried out according to the change from the regularized market to the
liberalized market, customer satisfaction, the duration of the provision of services
and invoicing volume. It is important to mention that the duration of the
provision of services was differentiated between remaining loyal for at least the
last 15 years or not, given that 2006 refers to the moment when negotiations and
the different phases of the process for liberalization of the energy market in
Portugal ended.

58
Chapter 5 Results and Discussion
The main objective of this study, as previously mentioned, was to study the
relationship between CRM, business strategies and the performance of the four
largest electricity companies in the Portuguese market, in the small business
segment and in the industrial segment. However, due to certain limitations
inherent in the current context, it was only possible to study the intended
relationship in the EDP Comercial company. Once again, it is important to refer
that in this study the main objective was not to "test" the respective hypotheses,
but only to discuss them according to an extraction of market information,
namely, through a questionnaire applied to managers and business customers in
the industrial and small business segments and also through market data.
That said, the hypotheses that will be studied are:
H1: There is a relationship between the EDP Comercial's CRM and its
differentiation strategy in the liberalized electricity market in Portugal.
H2: There is a relationship between the EDP Comercial's CRM and its cost
leadership strategy in the liberalized electricity market in Portugal.
H3: There is a relationship between the EDP Comercial's differentiation
strategy and its performance in the liberalized electricity market in Portugal.
H4: There is a relationship between the EDP Comercial's cost leadership
strategy and its performance in the liberalized electricity market in Portugal.

59
H5: There is a relationship between the EDP Comercial's CRM and its
performance in the liberalized electricity market in Portugal.
As has been mentioned, this study is essentially based on the article Reimann
et al. (2010) to analyse the relationship between the variables under study. That
said and adapted from the model created in the respective article, the
relationships to be analysed in this study are presented below in schematic
format (Figure 4).
Figure 3: Adaptation of the model created in the study by Reimann et al. (2010)
5.1 Results of the survey carried out for managers
In order to better analyse and expose the answers of the three interviewed
managers, a summary table with the valuations attributed by them to each
question will be presented below.
Variables Questions 1 2 3 Average We have a formal system for identifying potential
customers. (4) Partially Agree (4) Partially Agree (4) Partially Agree 4,00
We have a formal system for identifying which of the
potential customers are more valuable.(5) Totally Agree (5) Totally Agree (4) Partially Agree 4,67
We use data from external sources for identifying
potential high value customers.
(3) Neither agree nor
disagree
(3) Neither agree nor
disagree
(3) Neither agree nor
disagree3,00
We have a formal system in place that facilitates the
continuous evaluation of prospects.(4) Partially Agree (5) Totally Agree (4) Partially Agree 4,33
We have a system in place to determine the cost of
reestablishing a relationship with a lost customer.(4) Partially Agree (5) Totally Agree (4) Partially Agree 4,33
We have a systematic process for assessing the value of
past customers with whom we no longer have a
relationship.
(4) Partially Agree (4) Partially Agree (4) Partially Agree 4,00
We made attempts to attract prospects in order to
coordinate messages across media channels.(4) Partially Agree (4) Partially Agree (4) Partially Agree 4,00
We have a formal system in place that differentiates
targeting of our communications based on the
prospect’s value.
(5) Totally Agree (5) Totally Agree (4) Partially Agree 4,67
We systematically present different offers to prospects
based on the prospects’ economic value.(4) Partially Agree (5) Totally Agree (5) Totally Agree 4,67
We have a systematic process/approach to reestablish
relationships with valuable customers who have been
lost to competitors.
(4) Partially Agree (4) Partially Agree (4) Partially Agree 4,00
We have a system in place to be able to interact with
lost customers. (4) Partially Agree (4) Partially Agree (4) Partially Agree 4,00
We have a formal system for determining which of our
current customers are of the highest value.(4) Partially Agree (4) Partially Agree (4) Partially Agree 4,00
We continuously track customer information in order
to assess customer value. (4) Partially Agree (5) Totally Agree (5) Totally Agree 4,67
We actively attempt to determine the costs of retaining
customers.(4) Partially Agree (4) Partially Agree (4) Partially Agree 4,00
We track the status of the relationship during the entire
customer life cycle (relationship maturity).
(3) Neither agree nor
disagree
(3) Neither agree nor
disagree
(3) Neither agree nor
disagree3,00
We maintain an interactive two-way communication
with our customers.
(3) Neither agree nor
disagree
(3) Neither agree nor
disagree
(3) Neither agree nor
disagree3,00
We actively stress customer loyalty or retention
programs. (4) Partially Agree (5) Totally Agree (4) Partially Agree 4,33
We are structured to optimally respond to groups of
customers with different values.
(3) Neither agree nor
disagree
(3) Neither agree nor
disagree
(3) Neither agree nor
disagree3,00
We systematically attempt to customize
products/services based on the value of the customer.(4) Partially Agree (4) Partially Agree (4) Partially Agree 4,00
We systematically attempt to manage the expectations
of high value customers. (4) Partially Agree (4) Partially Agree (4) Partially Agree 4,00
We attempt to build long-term relationships with our
high-value customers.(4) Partially Agree (5) Totally Agree (4) Partially Agree 4,33
We provide individualized incentives for valuable
customers if they intensify their business with us.(4) Partially Agree (4) Partially Agree (4) Partially Agree 4,00
We have a formal system for identifying non-profitable
or lower-value customers.
(3) Neither agree nor
disagree
(3) Neither agree nor
disagree
(3) Neither agree nor
disagree3,00
We have a formal policy or procedure for actively
discontinuing relationships with low-value or problem
customers (e.g., canceling customer accounts).
(4) Partially Agree(3) Neither agree nor
disagree(4) Partially Agree 3,67
We try to passively discontinue relationships with low-
value or problem customers (e.g., raising basic service
fees).
(3) Neither agree nor
disagree
(3) Neither agree nor
disagree
(3) Neither agree nor
disagree3,00
We make greater efforts than our competitors to
enhance the quality of our sales promotion.
(3) Neither agree nor
disagree(4) Partially Agree
(3) Neither agree nor
disagree3,33
We make use of innovative promotional methods.(3) Neither agree nor
disagree(4) Partially Agree
(3) Neither agree nor
disagree3,33
Our promotional activities aim at emphasizing our
distinctiveness from competition.(4) Partially Agree (4) Partially Agree (4) Partially Agree 4,00
Our pricing strategy targets segments that are different
from our competitors.(2) Partially Disagree (2) Partially Disagree (2) Partially Disagree 2,00
Our customers view our pricing as distinct from our
competition. (4) Partially Agree (4) Partially Agree (4) Partially Agree 4,00
Our products target high-priced segments. (2) Partially Disagree (2) Partially Disagree (2) Partially Disagree 2,00
We are highly selective in our choice of channel supply
partners. (4) Partially Agree (4) Partially Agree (4) Partially Agree 4,00
Compared to our competition, our approach to
distribution is more selective.
(3) Neither agree nor
disagree
(3) Neither agree nor
disagree
(3) Neither agree nor
disagree3,00
We pursue a differentiation strategy by place. (2) Partially Disagree (2) Partially Disagree (2) Partially Disagree 2,00
Customers can easily recall our brand. (5) Concordo
Totalmente(5) Totally Agree
(4) Concordo
Parcialmente4,67
Our brand is different from all other brands in terms of
actual product attributes (features that can be
physically identified).
(4) Partially Agree (4) Partially Agree (4) Partially Agree 4,00
Our brand is different from all other brands in terms of
overall perceived quality (incl. non-tangible,
psychological perceptions of the customer).
(5) Totally Agree (5) Totally Agree (5) Totally Agree 5,00
We pursue a differentiation strategy by branding. (5) Totally Agree (5) Totally Agree (5) Totally Agree 5,00
Brand
Differentiation
Q11. Comparing EDP
Comercial with its major
competitors, to what extent
do you agree with the
following statements?
Communication
Differentiation
Q11. Comparing EDP
Comercial with its major
competitors, to what extent
do you agree with the
following statements?
Price
Differentiation
Q11. Comparing EDP
Comercial with its major
competitors, to what extent
do you agree with the
following statements?
Distribution
Differentiation
Q11. Comparing EDP
Comercial with its major
competitors, to what extent
do you agree with the
following statements?
CRM Initiation
Q1. To what extent do you
agree with the following
statements?
CRM
Maintenance
Q2. To what extent do you
agree with the following
statements?
CRM
Termination
Q3. To what extent do you
agree with the following
statements?

60
Table 4: Summary table of respondent managers' answers
Variables Questions 1 2 3 Average We have a formal system for determining which of our
current customers are of the highest value.(4) Partially Agree (4) Partially Agree (4) Partially Agree 4,00
We continuously track customer information in order
to assess customer value. (4) Partially Agree (5) Totally Agree (5) Totally Agree 4,67
We actively attempt to determine the costs of retaining
customers.(4) Partially Agree (4) Partially Agree (4) Partially Agree 4,00
We track the status of the relationship during the entire
customer life cycle (relationship maturity).
(3) Neither agree nor
disagree
(3) Neither agree nor
disagree
(3) Neither agree nor
disagree3,00
We maintain an interactive two-way communication
with our customers.
(3) Neither agree nor
disagree
(3) Neither agree nor
disagree
(3) Neither agree nor
disagree3,00
We actively stress customer loyalty or retention
programs. (4) Partially Agree (5) Totally Agree (4) Partially Agree 4,33
We are structured to optimally respond to groups of
customers with different values.
(3) Neither agree nor
disagree
(3) Neither agree nor
disagree
(3) Neither agree nor
disagree3,00
We systematically attempt to customize
products/services based on the value of the customer.(4) Partially Agree (4) Partially Agree (4) Partially Agree 4,00
We systematically attempt to manage the expectations
of high value customers. (4) Partially Agree (4) Partially Agree (4) Partially Agree 4,00
We attempt to build long-term relationships with our
high-value customers.(4) Partially Agree (5) Totally Agree (4) Partially Agree 4,33
We provide individualized incentives for valuable
customers if they intensify their business with us.(4) Partially Agree (4) Partially Agree (4) Partially Agree 4,00
We have a formal system for identifying non-profitable
or lower-value customers.
(3) Neither agree nor
disagree
(3) Neither agree nor
disagree
(3) Neither agree nor
disagree3,00
We have a formal policy or procedure for actively
discontinuing relationships with low-value or problem
customers (e.g., canceling customer accounts).
(4) Partially Agree(3) Neither agree nor
disagree(4) Partially Agree 3,67
We try to passively discontinue relationships with low-
value or problem customers (e.g., raising basic service
fees).
(3) Neither agree nor
disagree
(3) Neither agree nor
disagree
(3) Neither agree nor
disagree3,00
We make greater efforts than our competitors to
enhance the quality of our sales promotion.
(3) Neither agree nor
disagree(4) Partially Agree
(3) Neither agree nor
disagree3,33
We make use of innovative promotional methods.(3) Neither agree nor
disagree(4) Partially Agree
(3) Neither agree nor
disagree3,33
Our promotional activities aim at emphasizing our
distinctiveness from competition.(4) Partially Agree (4) Partially Agree (4) Partially Agree 4,00
Our pricing strategy targets segments that are different
from our competitors.(2) Partially Disagree (2) Partially Disagree (2) Partially Disagree 2,00
Our customers view our pricing as distinct from our
competition. (4) Partially Agree (4) Partially Agree (4) Partially Agree 4,00
Our products target high-priced segments. (2) Partially Disagree (2) Partially Disagree (2) Partially Disagree 2,00
We are highly selective in our choice of channel supply
partners. (4) Partially Agree (4) Partially Agree (4) Partially Agree 4,00
Compared to our competition, our approach to
distribution is more selective.
(3) Neither agree nor
disagree
(3) Neither agree nor
disagree
(3) Neither agree nor
disagree3,00
We pursue a differentiation strategy by place. (2) Partially Disagree (2) Partially Disagree (2) Partially Disagree 2,00
Customers can easily recall our brand. (5) Concordo
Totalmente(5) Totally Agree
(4) Concordo
Parcialmente4,67
Our brand is different from all other brands in terms of
actual product attributes (features that can be
physically identified).
(4) Partially Agree (4) Partially Agree (4) Partially Agree 4,00
Our brand is different from all other brands in terms of
overall perceived quality (incl. non-tangible,
psychological perceptions of the customer).
(5) Totally Agree (5) Totally Agree (5) Totally Agree 5,00
We pursue a differentiation strategy by branding. (5) Totally Agree (5) Totally Agree (5) Totally Agree 5,00
We continuously improve our processes in order to
keep cost low. (4) Partially Agree (5) Totally Agree (4) Partially Agree 4,33
We are constantly improving our operating efficiency. (4) Partially Agree (5) Totally Agree (4) Partially Agree 4,33
Our manufacturing costs are lower than our
competitors’.
(3) Neither agree nor
disagree
(3) Neither agree nor
disagree
(3) Neither agree nor
disagree3,00
Our economy of scale enables us to achieve a cost
advantage. (4) Partially Agree (4) Partially Agree (4) Partially Agree 4,00
We have achieved a cost-leadership position in the
industry.(4) Partially Agree (4) Partially Agree (4) Partially Agree 4,00
Customer satisfaction 4 4 4 4,00
Delivering value to our customers 4 4 4 4,00
Delivering what our customers want 4 4 4 4,00
Retaining valued customers 4 4 4 4,00
Market share growth (3) Average(4) Partially Above
Average(3) Average 3,33
Growth in sales revenue (3) Average (3) Average (3) Average 3,00
Acquiring new customers (3) Average (3) Average (3) Average 3,00
Increasing sales to existing customers (4) Partially Above
Average
(4) Partially Above
Average
(4) Partially Above
Average4,00
Business unit profitability(3) Approximately the
same
(3) Approximately the
same
(3) Approximately the
same3,00
Reaching financial goals(3) Approximately the
same(4) Partially better (4) Partially better 3,67
Return on investment (ROI) (3) Approximately the
same
(3) Approximately the
same
(3) Approximately the
same3,00
Return on sales (ROS)(3) Approximately the
same
(3) Approximately the
same
(3) Approximately the
same3,00
CRM
Maintenance
Q2. To what extent do you
agree with the following
statements?
CRM
Termination
Q3. To what extent do you
agree with the following
statements?
Communication
Differentiation
Q11. Comparing EDP
Comercial with its major
competitors, to what extent
do you agree with the
following statements?
Price
Differentiation
Q11. Comparing EDP
Comercial with its major
competitors, to what extent
do you agree with the
following statements?
Distribution
Differentiation
Q11. Comparing EDP
Comercial with its major
competitors, to what extent
do you agree with the
following statements?
Market
Effectiveness
Q14. Please evaluate the
market effectiveness of the
EDP Comercial business
over the past year relative
to its major competitors.
Profitability
Q15. Please evaluate the
profitability of the EDP
Comercial company over
the past year relative to its
major competitors.
Brand
Differentiation
Q11. Comparing EDP
Comercial with its major
competitors, to what extent
do you agree with the
following statements?
Cost Leadership
Customer
Satisfaction
Q13. Please evaluate the
customer satisfaction of the
EDP Comercial company
over the past year relative
to its major competitors (1 -
extremely dissatisfied and
5 - extremely satisfied).
Q12. Comparing EDP
Comercial with its major
competitors, to what extent
do you agree with the
following statements?
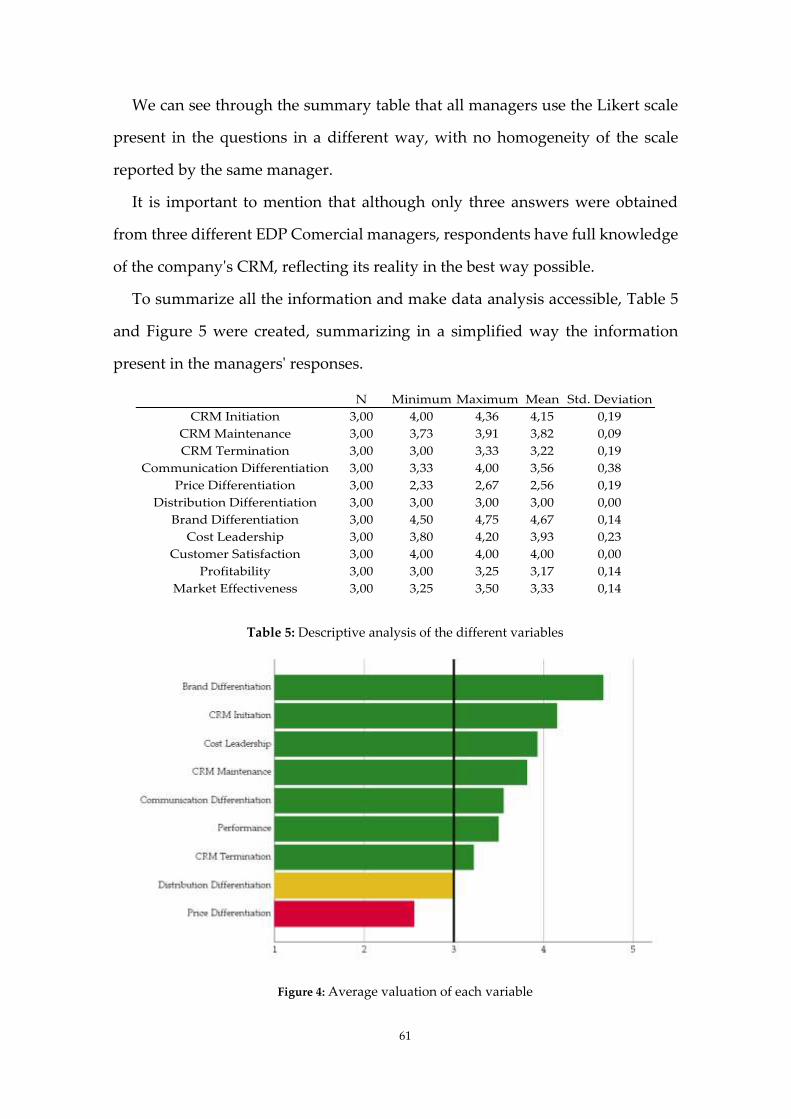
61
We can see through the summary table that all managers use the Likert scale
present in the questions in a different way, with no homogeneity of the scale
reported by the same manager.
It is important to mention that although only three answers were obtained
from three different EDP Comercial managers, respondents have full knowledge
of the company's CRM, reflecting its reality in the best way possible.
To summarize all the information and make data analysis accessible, Table 5
and Figure 5 were created, summarizing in a simplified way the information
present in the managers' responses.
Table 5: Descriptive analysis of the different variables
Figure 4: Average valuation of each variable
N Minimum Maximum Mean Std. Deviation
CRM Initiation 3,00 4,00 4,36 4,15 0,19
CRM Maintenance 3,00 3,73 3,91 3,82 0,09
CRM Termination 3,00 3,00 3,33 3,22 0,19
Communication Differentiation 3,00 3,33 4,00 3,56 0,38
Price Differentiation 3,00 2,33 2,67 2,56 0,19
Distribution Differentiation 3,00 3,00 3,00 3,00 0,00
Brand Differentiation 3,00 4,50 4,75 4,67 0,14
Cost Leadership 3,00 3,80 4,20 3,93 0,23
Customer Satisfaction 3,00 4,00 4,00 4,00 0,00
Profitability 3,00 3,00 3,25 3,17 0,14
Market Effectiveness 3,00 3,25 3,50 3,33 0,14

62
Through the analysis of Table 4 and 5 and Figure 4, we can see that the
variables that obtained the highest valuation according to the managers'
perspective were the brand differentiation, the customer satisfaction, the CRM
initiation and maintenance, the cost leadership strategy and the communication
differentiation. In turn, the distribution differentiation variable showed a neutral
appreciation, while the price differentiation presented a negative valuation, that
is, below 2 (partially disagree). It is important to note that there are no missing
values in this sample.
In addition, we can see that, according to the three managers surveyed, there
is a predominance in the positive valuation of brand differentiation, cost
leadership and communication differentiation. However, although it is possible
to observe the significant appreciation of the cost leadership strategy, it can also
be seen that it has a high standard deviation. That said, it is evident that the
respective variable has less consensus among the interviewed managers.
Therefore, we can conclude that the brand differentiation and the communication
differentiation are possibly the main business strategies implemented by EDP
Comercial in the segments under study.
According to Norman and Streiner (2008), in order to have an adequate
description and analysis of a sample, it is essentially necessary to carry out an
assessment of the normality of data distribution.
As previously mentioned in section 4.4, the Shapiro-Wilk normality test was
implemented in this study, which proves to be the procedure with greater
specificity for small-sized samples. In this test, similar to the others, it is assumed
that there is a hypothesis of normality of the data (H0), returning a p-value > 0.05
if they result in adherence to the normality parameters.
After performing the normality test, it was possible to differentiate the
variables that had a normal distribution (CRM initiation, CRM maintenance and
differentiation and performance in its general) and those that did not have a
63
normal distribution. Since the vast majority of variables did not show a normal
distribution, an analysis of Spearman correlations was performed (Table 6).
Analysing Table 6, we can see that there is an inversely proportional
relationship between the CRM in their global and the CRM termination, between
communication differentiation and CRM termination, between price
differentiation and CRM Global, between price differentiation and
communication differentiation, between the variable cost leadership and CRM
termination, between cost leadership and price differentiation and, finally,
between market effectiveness and CRM Termination and price differentiation
variables. This means that when there is a change in one of the variables, the one
associated with it reacts in the opposite direction. For example, when there is a
greater appreciation of communication differentiation, there is a lower
appreciation of price differentiation.
On the contrary, data from the 3 respondents indicate that there may be a
directly proportional relationship between the communication differentiation
variables and CRM in its global, between price differentiation and CRM
termination, between the variable relative to the totality of differentiation
strategies and CRM initiation, between cost leadership and Global CRM and
communication differentiation variables and, finally, between market
effectiveness and CRM in its global and communication differentiation variables.
This means that when a variable is positively affected, it has a positive influence
on the associated variable and the other way around. Distribution differentiation
and customer satisfaction have no correlation because they are constant
variables.
Analysing the p-value of the variable relative to CRM in its global, we can
verify that there is possibly a strong correlation between this variable and the
cost leadership strategy and also, possibly there is a strong correlation between
the CRM and the differentiation strategy in its overall and market effectiveness.

64
Although there is possibly a relationship between CRM and cost leadership
strategy, since p-value < 0.05, we cannot say with certainty that there is this same
relationship between CRM and differentiation strategy and the performance
variables. In this case, as p value > 0.05 we cannot reject H0, which indicates
towards the non-existence of a relationship between the variables.
Due to the small sample size (only 3 responses), no further statistical analysis
was performed.

65
CRM
Initi
atio
n
CRM
Mai
nten
ance
CRM
Term
inat
ion
CRM
Glo
bal
Com
mun
icat
ion
Diff
eren
tiatio
n
Pric
e
Diff
eren
tiatio
n
Dis
trib
utio
n
Diff
eren
tiatio
n
Bran
d
Diff
eren
tiatio
n
Diff
eren
tiatio
n
Glo
bal
Cost
Lead
ersh
ip
Cust
omer
Satis
fact
ion
Mar
ket
Effe
ctiv
enes
sPr
ofita
bilit
y
Corr
elat
ion
Coef
ficie
nt--
Sig.
(2-ta
iled)
Corr
elat
ion
Coef
ficie
nt0,
500
--
Sig.
(2-ta
iled)
0,66
7
Corr
elat
ion
Coef
ficie
nt-0
,866
-0,8
66--
Sig.
(2-ta
iled)
0,33
30,
333
Corr
elat
ion
Coef
ficie
nt0,
866
0,86
6-1
,000
--
Sig.
(2-ta
iled)
0,33
30,
333
0,00
0
Corr
elat
ion
Coef
ficie
nt0,
866
0,86
6-1
,000
1,00
0--
Sig.
(2-ta
iled)
0,33
30,
333
0,00
00,
000
Corr
elat
ion
Coef
ficie
nt-0
,866
-0,8
661,
000
-1,0
00-1
,000
--
Sig.
(2-ta
iled)
0,33
30,
333
0,00
00,
000
0,00
0
Corr
elat
ion
Coef
ficie
nt
Sig.
(2-ta
iled)
Corr
elat
ion
Coef
ficie
nt0,
866
0,00
0-0
,500
0,50
00,
500
-0,5
00--
Sig.
(2-ta
iled)
0,33
31,
000
0,66
70,
667
0,66
70,
667
Corr
elat
ion
Coef
ficie
nt1,
000
0,50
0-0
,866
0,86
60,
866
-0,8
660,
866
--
Sig.
(2-ta
iled)
0,00
00,
667
0,33
30,
333
0,33
30,
333
0,33
3
Corr
elat
ion
Coef
ficie
nt0,
866
0,86
6-1
,000
1,00
01,
000
-1,0
000,
500
0,86
6--
Sig.
(2-ta
iled)
0,33
30,
333
0,00
00,
000
0,00
00,
000
0,66
70,
333
Corr
elat
ion
Coef
ficie
nt
Sig.
(2-ta
iled)
Corr
elat
ion
Coef
ficie
nt0,
000
0,86
6-0
,500
0,50
00,
500
-0,5
00-0
,500
0,00
00,
500
--
Sig.
(2-ta
iled)
1,00
00,
333
0,66
70,
667
0,66
70,
667
0,66
71,
000
0,66
7
Corr
elat
ion
Coef
ficie
nt0,
866
0,86
6-1
,000
1,00
01,
000
-1,0
000,
500
0,86
61,
000
0,50
0--
Sig.
(2-ta
iled)
0,33
30,
333
0,00
00,
000
0,00
00,
000
0,66
70,
333
0,00
00,
667
**. C
orre
latio
n is
sign
ifica
nt a
t the
0.0
1 le
vel (
2-ta
iled)
.
CRM
Initi
atio
n
CRM
Mai
nten
ance
CRM
Ter
min
atio
n
CRM
Glo
bal
Com
mun
icat
ion
Diff
eren
tiatio
n
Pric
e D
iffer
entia
tion
Prof
itabi
lity
Mar
ket E
ffect
iven
ess
Dis
trib
utio
n
Diff
eren
tiatio
n
Bran
d D
iffer
entia
tion
Diff
eren
tiatio
n G
loba
l
Cost
Lea
ders
hip
Cust
omer
Sat
isfa
ctio
n
Table 6: Spearman's correlation matrix
66
5.2 Perception of value by customers
The delivery of a better combination of the attributes valued by customers in
relation to a product or service, allows companies to offer a better value to the
market compared to their competitors, thus promoting a sustainable competitive
advantage (Ulaga & Chacour 2001).
That said, the different value curves will be presented and to facilitate the
presentation of the data obtained on the parameters valued by customers, the
information of each segment will be presented separately. It is important to note
that the value curves according to the invoicing volume will not be presented
because, given that they did not show any differentiation pattern for the
categories that were presented.
5.2.1 Industrial Segment
The horizontal axis of the strategy canvas is composed of parameters or
attributes that are related to the evaluation of an energy service and that are
valued by customers. In contrast, the vertical axis represents the relative
performance of each parameter, which can be increased or reduced.
That said, we can verify in Figure 5 that, in general, the parameter considered
as primordial in the evaluation of a service and selection of an energy trading
company is the price factor, which is curiously contrary to the perception
presented by managers in section 5.1. Endesa's customers are those who most
value this factor to the detriment of the rest.
Only Iberdrola's customers considered the added value of services related to
renewable energy as the main parameter to be valued, followed by the price
factor. In addition, it should be noted that the customers of this same company
are those who most value corporate values, namely, the social and environmental
commitment of an energy company.

67
In addition to this, Galp's customers, despite being the ones who least value
the performance of the company, are those who most value the quality of service
and trust in the brand and its service. On the other hand, EDP Comercial's
customers are the ones who most value the appealing and easy to understand
equipment and are position the trust in the company and its service attribute
second in importance. These results may be related to the fact that the EDP
company is already known to older consumers who previously only had this
company as a choice in the regularized market and are already used to its service
and equipment.
Figure 5: Value Curve of the four biggest energy companies in Portuguese Electricity Market –
Industry Segment
It is important to mention that the value curves according to the change of
supplier from the regularized market to the free market and according to the
duration of the service provision are presented comparing only the EDP and the
others, since the companies that compete with the EDP Comercial in the
liberalized market have only had customers for less than 15 years. Thus, and in
order to highlight the differences between the parameters valued by these
1,00
2,00
3,00
4,00
5,00
6,00
7,00
8,00
P R I C E A P P E A L I N G A N D
E A S Y T O
U N D E R S T A N D
E Q U I P M E N T
A D D E D V A L U E O F
T H E S E R V I C E
( E L E C T R I C I T Y A N D
G A S )
C O M P A N Y
P E R F O R M A N C E
A D D E D V A L U E O F
T H E S E R V I C E
( R E N E W A B L E
E N E R G Y )
C O N F I D E N C E I N
T H E B R A N D A N D
I T S S E R V I C E
S E R V I C E Q U A L I T Y C O R P O R A T E
V A L U E S
( E N V I R O N M E N T A L
A N D S O C I A L
C O M M I T M E N T )
EDP Comercial Endesa Iberdrola Galp
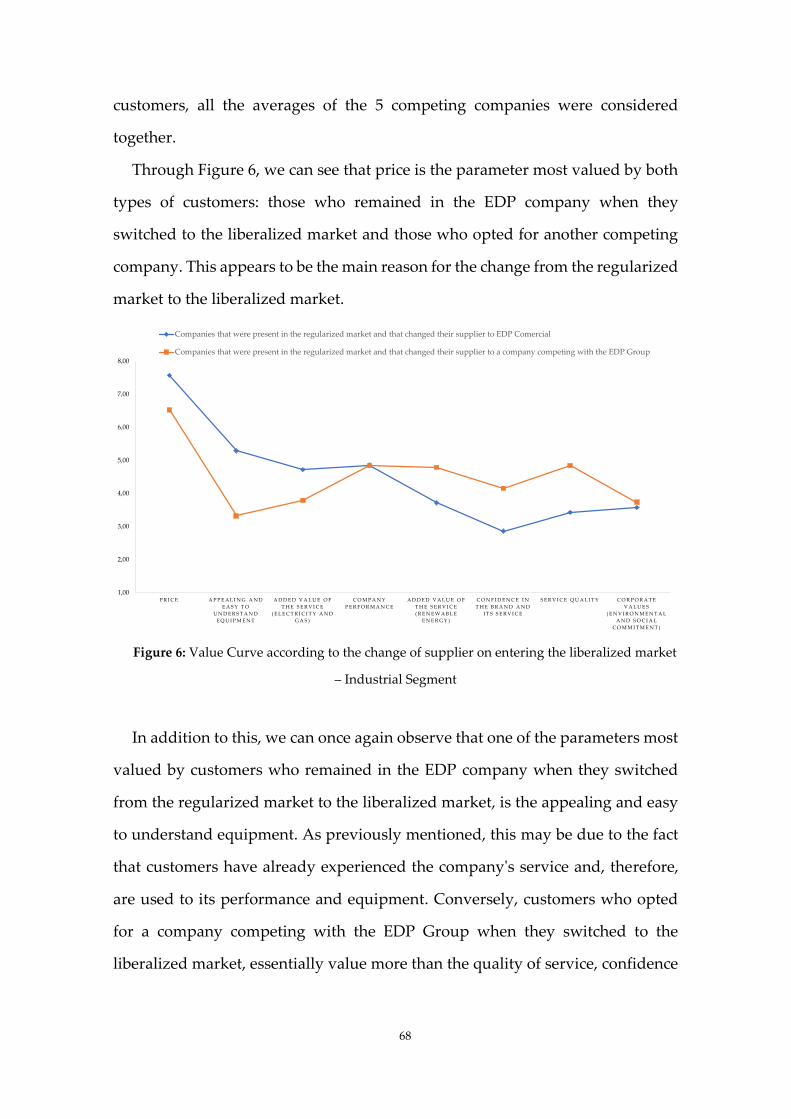
68
customers, all the averages of the 5 competing companies were considered
together.
Through Figure 6, we can see that price is the parameter most valued by both
types of customers: those who remained in the EDP company when they
switched to the liberalized market and those who opted for another competing
company. This appears to be the main reason for the change from the regularized
market to the liberalized market.
Figure 6: Value Curve according to the change of supplier on entering the liberalized market
– Industrial Segment
In addition to this, we can once again observe that one of the parameters most
valued by customers who remained in the EDP company when they switched
from the regularized market to the liberalized market, is the appealing and easy
to understand equipment. As previously mentioned, this may be due to the fact
that customers have already experienced the company's service and, therefore,
are used to its performance and equipment. Conversely, customers who opted
for a company competing with the EDP Group when they switched to the
liberalized market, essentially value more than the quality of service, confidence
1,00
2,00
3,00
4,00
5,00
6,00
7,00
8,00
P R I C E A P P E A L I N G A N D
E A S Y T O
U N D E R S T A N D
E Q U I P M E N T
A D D E D V A L U E O F
T H E S E R V I C E
( E L E C T R I C I T Y A N D
G A S )
C O M P A N Y
P E R F O R M A N C E
A D D E D V A L U E O F
T H E S E R V I C E
( R E N E W A B L E
E N E R G Y )
C O N F I D E N C E I N
T H E B R A N D A N D
I T S S E R V I C E
S E R V I C E Q U A L I T Y C O R P O R A T E
V A L U E S
( E N V I R O N M E N T A L
A N D S O C I A L
C O M M I T M E N T )
Companies that were present in the regularized market and that changed their supplier to EDP Comercial
Companies that were present in the regularized market and that changed their supplier to a company competing with the EDP Group

69
in the brand, parameters that may have affected the choice of another electricity
supplier.
It can be seen that the curves intersect at a given point (company performance
attribute), which indicates that there is clearly a distinct positioning in a given set
of attributes, namely, to the left and right of the intersection. This is in line with
the blue ocean strategy which states that business success is about creating
unique and innovative growth opportunities in new market spaces. Through
Figure 6, we can see which of the dimensions that add value to the market
companies are investing and focusing on, as there is an evident gap between
appealing equipment, service quality and trust in the brand and its service.
Regarding the value curves according to the duration of the service provision
(Figure 7 and 8), we can see that customers who have been supplied for less than
15 years by both EDP and other companies competing in the liberalized market,
value the price factor. It is clear that there are two parameters that stand out to
customers that have been provided by EDP Comercial for less than 15 years, they
are the company's performance and trust in the brand and its service.
Figure 7: Value Curve according to the duration of service provision (< 15 years) – Industry
Segment
1,00
2,00
3,00
4,00
5,00
6,00
7,00
8,00
P R I C E A P P E A L I N G A N D
E A S Y T O
U N D E R S T A N D
E Q U I P M E N T
A D D E D V A L U E O F
T H E S E R V I C E
( E L E C T R I C I T Y A N D
G A S )
C O M P A N Y
P E R F O R M A N C E
A D D E D V A L U E O F
T H E S E R V I C E
( R E N E W A B L E
E N E R G Y )
C O N F I D E N C E I N
T H E B R A N D A N D
I T S S E R V I C E
S E R V I C E Q U A L I T Y C O R P O R A T E
V A L U E S
( E N V I R O N M E N T A L
A N D S O C I A L
C O M M I T M E N T )
EDP Comercial Customers < 15 years Other Companies Customers < 15 years

70
These results may be associated with the historical evolution of the company
itself. In contrast, companies that have been supplied for less than 15 years by
competing companies, value the service quality more.
Figure 8, contrary to what happened in Figure 7, shows a reduced difference
between the valuation of the different attributes. This indicates that there is, from
the perspective of the most “recent” customer in the liberalized market, a
reduced differential positioning between companies.
Through Figure 8, we can conclude that there are only EDP Comercial
customers in the sample that have been supplied for more than 15 years. These,
in turn, value the price, the appealing and easy to understand equipment and the
confidence in the brand and its service.
It is important to remember that customers were differentiated between
remaining loyal for at least the last 15 years, or not given that 2006 refers to the
moment when negotiations and the different phases of the process for
liberalization of the energy market in Portugal ended. Thus, this date, represents
the moment when barriers to competition were dropped and a new competitive
market was created.
Figure 8: Value Curve according to the duration of service provision (> 15 years) – Industry
Segment
1,00
2,00
3,00
4,00
5,00
6,00
7,00
8,00
P R I C E A P P E A L I N G A N D
E A S Y T O
U N D E R S T A N D
E Q U I P M E N T
A D D E D V A L U E O F
T H E S E R V I C E
( E L E C T R I C I T Y A N D
G A S )
C O M P A N Y
P E R F O R M A N C E
A D D E D V A L U E O F
T H E S E R V I C E
( R E N E W A B L E
E N E R G Y )
C O N F I D E N C E I N
T H E B R A N D A N D
I T S S E R V I C E
S E R V I C E Q U A L I T Y C O R P O R A T E
V A L U E S
( E N V I R O N M E N T A L
A N D S O C I A L
C O M M I T M E N T )
EDP Comercial Customers < 15 years EDP Comercial Customers > 15 years
71
We can see in Figure 8 that there is a difference in the valuation of distinct
attributes by older (> 15 years) and newer (< 15 years) customers of the EDP
Comercial company. Newer customers essentially value the price, the company's
performance and the quality of its service, while older customers value the
appealing and easy-to-understand equipment, as well as the trust in the brand
and its service and the added value of the same.
In addition, we can see that there is a large discrepancy between the price and
appealing equipment parameters, and, combining this information with Figure 7
it is clear that the most "recent" customers in the liberalized market have a greater
appreciation of the price attribute, compared to older customers who
experienced the EDP company's services in the regularized market.
The value curves presented in Figures 9 and 10 were drawn according to
customer satisfaction and it is important to mention that customers who rated
the service provided by their current supplier below 3 values were considered
dissatisfied, and those who rated above 3 values were considered satisfied.
When we analyse both value curves, we realize that the factor responsible for
the contentment and discontent of customers present in the liberalized market is
essentially the price parameter.
Regarding EDP Comercial's customers, it is clear that customer satisfaction is
essentially in the price, as there is a large discrepancy between the values
obtained in the different parameters in comparison with the same (Fig. 10). On
the contrary, we were able to observe through Figure 9 that EDP Comercial
customers who are dissatisfied with the service provided by the company,
despite valuing more, among all the attributes, the price parameter, this does not
present a significant difference as seen in the value curve of satisfied customers
(Figure 10). Attributes such as company performance and service quality have
more important positions, standing out as being, like price, the parameters most
valued by customers dissatisfied with the service.
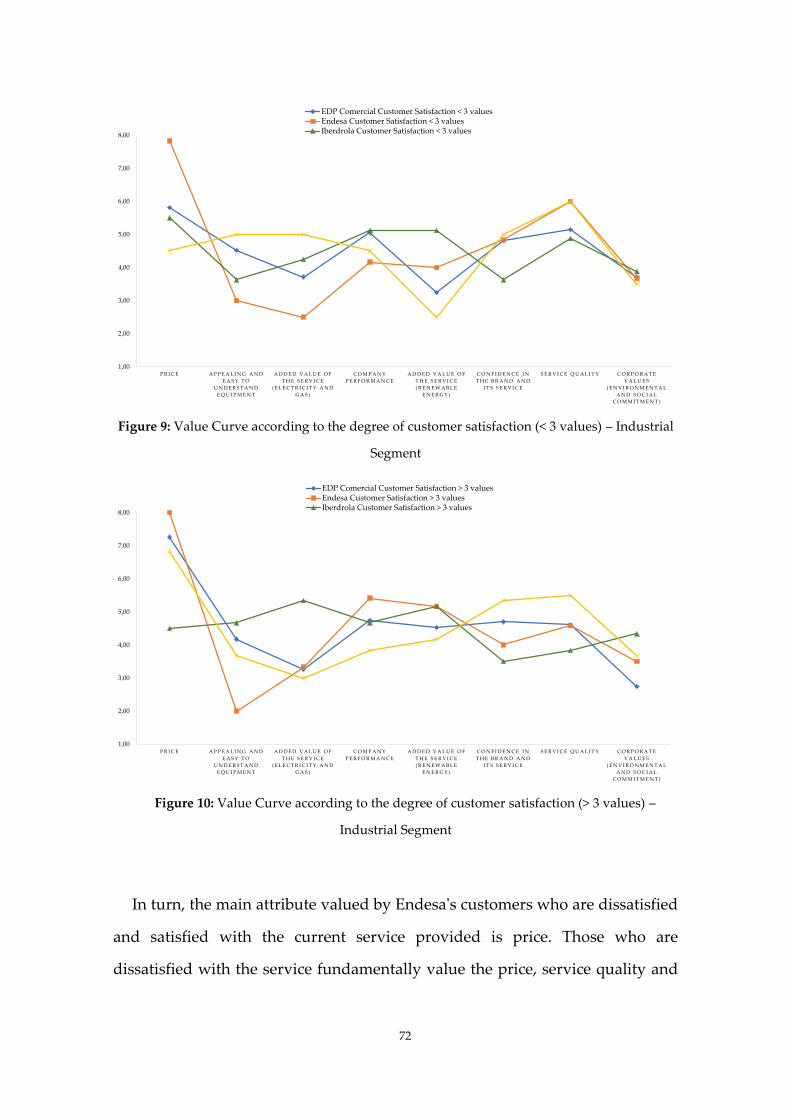
72
Figure 9: Value Curve according to the degree of customer satisfaction (< 3 values) – Industrial
Segment
Figure 10: Value Curve according to the degree of customer satisfaction (> 3 values) –
Industrial Segment
In turn, the main attribute valued by Endesa's customers who are dissatisfied
and satisfied with the current service provided is price. Those who are
dissatisfied with the service fundamentally value the price, service quality and
1,00
2,00
3,00
4,00
5,00
6,00
7,00
8,00
P R I C E A P P E A L I N G A N D
E A S Y T O
U N D E R S T A N D
E Q U I P M E N T
A D D E D V A L U E O F
T H E S E R V I C E
( E L E C T R I C I T Y A N D
G A S )
C O M P A N Y
P E R F O R M A N C E
A D D E D V A L U E O F
T H E S E R V I C E
( R E N E W A B L E
E N E R G Y )
C O N F I D E N C E I N
T H E B R A N D A N D
I T S S E R V I C E
S E R V I C E Q U A L I T Y C O R P O R A T E
V A L U E S
( E N V I R O N M E N T A L
A N D S O C I A L
C O M M I T M E N T )
EDP Comercial Customer Satisfaction < 3 valuesEndesa Customer Satisfaction < 3 valuesIberdrola Customer Satisfaction < 3 values
1,00
2,00
3,00
4,00
5,00
6,00
7,00
8,00
P R I C E A P P E A L I N G A N D
E A S Y T O
U N D E R S T A N D
E Q U I P M E N T
A D D E D V A L U E O F
T H E S E R V I C E
( E L E C T R I C I T Y A N D
G A S )
C O M P A N Y
P E R F O R M A N C E
A D D E D V A L U E O F
T H E S E R V I C E
( R E N E W A B L E
E N E R G Y )
C O N F I D E N C E I N
T H E B R A N D A N D
I T S S E R V I C E
S E R V I C E Q U A L I T Y C O R P O R A T E
V A L U E S
( E N V I R O N M E N T A L
A N D S O C I A L
C O M M I T M E N T )
EDP Comercial Customer Satisfaction > 3 valuesEndesa Customer Satisfaction > 3 valuesIberdrola Customer Satisfaction > 3 values
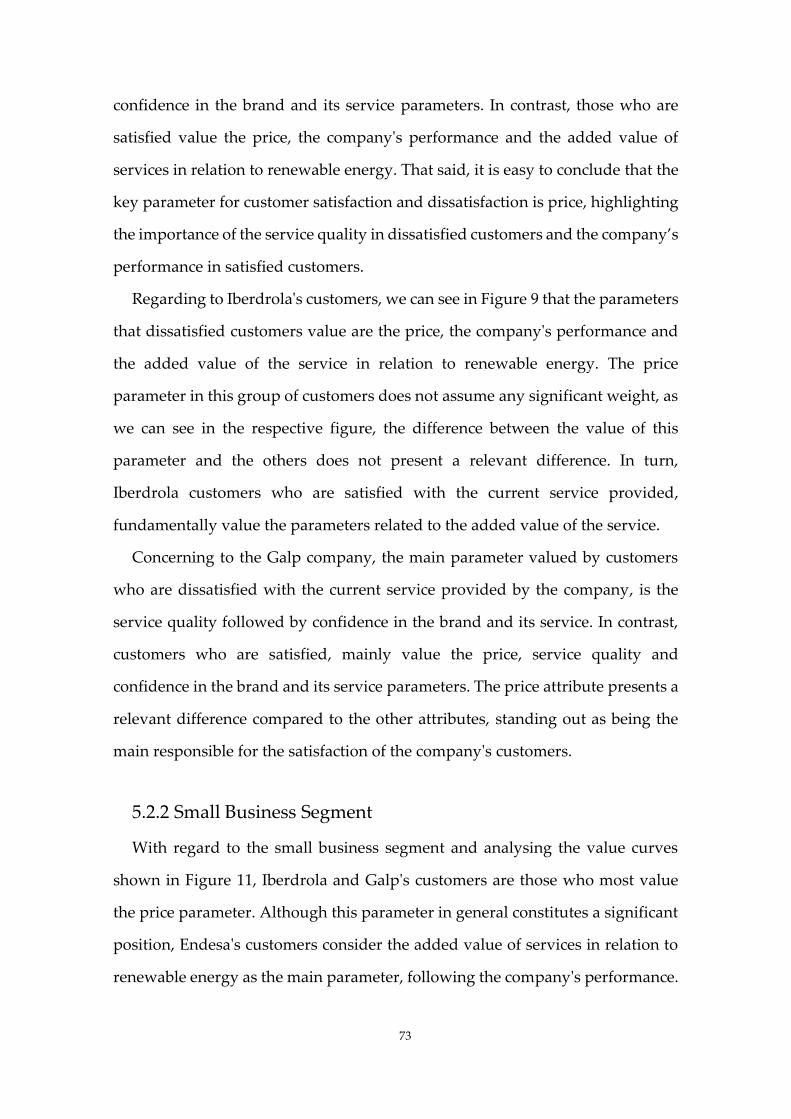
73
confidence in the brand and its service parameters. In contrast, those who are
satisfied value the price, the company's performance and the added value of
services in relation to renewable energy. That said, it is easy to conclude that the
key parameter for customer satisfaction and dissatisfaction is price, highlighting
the importance of the service quality in dissatisfied customers and the company’s
performance in satisfied customers.
Regarding to Iberdrola's customers, we can see in Figure 9 that the parameters
that dissatisfied customers value are the price, the company's performance and
the added value of the service in relation to renewable energy. The price
parameter in this group of customers does not assume any significant weight, as
we can see in the respective figure, the difference between the value of this
parameter and the others does not present a relevant difference. In turn,
Iberdrola customers who are satisfied with the current service provided,
fundamentally value the parameters related to the added value of the service.
Concerning to the Galp company, the main parameter valued by customers
who are dissatisfied with the current service provided by the company, is the
service quality followed by confidence in the brand and its service. In contrast,
customers who are satisfied, mainly value the price, service quality and
confidence in the brand and its service parameters. The price attribute presents a
relevant difference compared to the other attributes, standing out as being the
main responsible for the satisfaction of the company's customers.
5.2.2 Small Business Segment
With regard to the small business segment and analysing the value curves
shown in Figure 11, Iberdrola and Galp's customers are those who most value
the price parameter. Although this parameter in general constitutes a significant
position, Endesa's customers consider the added value of services in relation to
renewable energy as the main parameter, following the company's performance.

74
In addition, it is also important to highlight the appreciation of the parameter
related to renewable energy by Galp's customers, as well as the appreciation of
corporate values regarding the company's social and environmental
commitment.
The EDP Comercial customers are the ones that present a greater appreciation
in relation to the parameters of trust in the brand and its service, as well as the
quality of service. Curiously, we can find here a similarity with the answers given
by the EDP Comercial managers in section 5.1, as there is no great appreciation
of the price attribute.
Figure 11: Value Curve of the four biggest energy companies in Portuguese Electricity
Market – Small Business Segment
As in the industrial segment, the value curves according to the change from
the regularized market to the liberalized market and according to the duration of
the provision of services, will be presented according to a comparison between
the EDP Comercial and the set of the remaining three competing companies, for
the reasons explained above. Also, given the small sample size for the small
business segment, the value curves related to the different degrees of customer
1,00
2,00
3,00
4,00
5,00
6,00
7,00
8,00
P R I C E A P P E A L I N G A N D
E A S Y T O
U N D E R S T A N D
E Q U I P M E N T
A D D E D V A L U E O F
T H E S E R V I C E
( E L E C T R I C I T Y A N D
G A S )
C O M P A N Y
P E R F O R M A N C E
A D D E D V A L U E O F
T H E S E R V I C E
( R E N E W A B L E
E N E R G Y )
C O N F I D E N C E I N
T H E B R A N D A N D
I T S S E R V I C E
S E R V I C E Q U A L I T Y C O R P O R A T E
V A L U E S
( E N V I R O N M E N T A L
A N D S O C I A L
C O M M I T M E N T )
EDP Comercial Endesa Iberdrola Galp

75
satisfaction will be presented in the same format in order to better transmit and
analyse the information obtained.
Regarding the differences in the value curves according to the customers who
changed from the regularized market to the liberalized market (Fig. 12), it is clear
that in both segments the parameter most valued by customers who changed
supplier and those who remained in the EDP company, is the price parameter. In
addition to this, and as in the industrial segment, the parameter most valued after
the price by customers who chose EDP Comercial in the liberalized market is
confidence in the brand and its service.
Figure 12: Value Curve according to the change of supplier on entering the liberalized
market – Small Business Segment
On the contrary, customers who chose to change their electricity supplier
when they switched to the liberalized market, essentially value the price
attribute, the added value of the services in relation to renewable energy and the
company's performance, which may be one of the factors influencing the change
of supplier.
1,00
2,00
3,00
4,00
5,00
6,00
7,00
8,00
P R I C E A P P E A L I N G A N D
E A S Y T O
U N D E R S T A N D
E Q U I P M E N T
A D D E D V A L U E O F
T H E S E R V I C E
( E L E C T R I C I T Y A N D
G A S )
C O M P A N Y
P E R F O R M A N C E
A D D E D V A L U E O F
T H E S E R V I C E
( R E N E W A B L E
E N E R G Y )
C O N F I D E N C E I N
T H E B R A N D A N D
I T S S E R V I C E
S E R V I C E Q U A L I T Y C O R P O R A T E
V A L U E S
( E N V I R O N M E N T A L
A N D S O C I A L
C O M M I T M E N T )
Companies that were present in the regularized market and that changed their supplier to EDP Comercial
Companies that were present in the regularized market and that changed their supplier to a company competing with the EDP Group
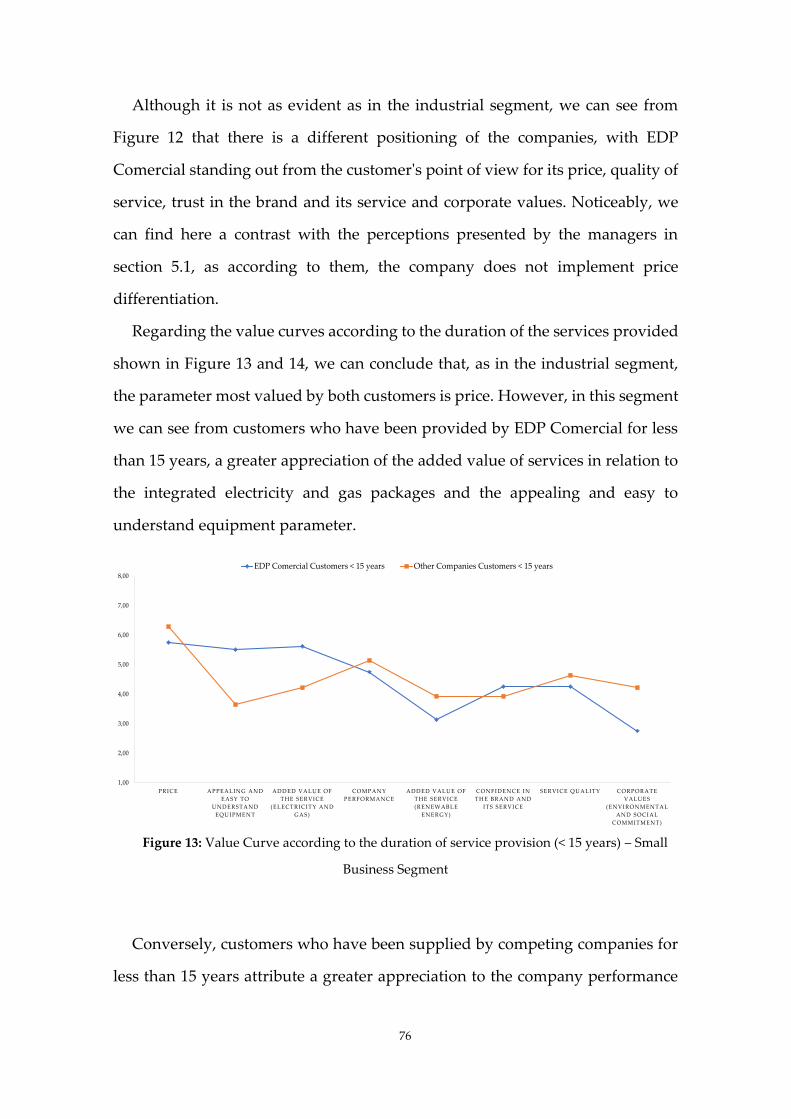
76
Although it is not as evident as in the industrial segment, we can see from
Figure 12 that there is a different positioning of the companies, with EDP
Comercial standing out from the customer's point of view for its price, quality of
service, trust in the brand and its service and corporate values. Noticeably, we
can find here a contrast with the perceptions presented by the managers in
section 5.1, as according to them, the company does not implement price
differentiation.
Regarding the value curves according to the duration of the services provided
shown in Figure 13 and 14, we can conclude that, as in the industrial segment,
the parameter most valued by both customers is price. However, in this segment
we can see from customers who have been provided by EDP Comercial for less
than 15 years, a greater appreciation of the added value of services in relation to
the integrated electricity and gas packages and the appealing and easy to
understand equipment parameter.
Figure 13: Value Curve according to the duration of service provision (< 15 years) – Small
Business Segment
Conversely, customers who have been supplied by competing companies for
less than 15 years attribute a greater appreciation to the company performance
1,00
2,00
3,00
4,00
5,00
6,00
7,00
8,00
P R I C E A P P E A L I N G A N D
E A S Y T O
U N D E R S T A N D
E Q U I P M E N T
A D D E D V A L U E O F
T H E S E R V I C E
( E L E C T R I C I T Y A N D
G A S )
C O M P A N Y
P E R F O R M A N C E
A D D E D V A L U E O F
T H E S E R V I C E
( R E N E W A B L E
E N E R G Y )
C O N F I D E N C E I N
T H E B R A N D A N D
I T S S E R V I C E
S E R V I C E Q U A L I T Y C O R P O R A T E
V A L U E S
( E N V I R O N M E N T A L
A N D S O C I A L
C O M M I T M E N T )
EDP Comercial Customers < 15 years Other Companies Customers < 15 years

77
parameter, service quality, corporate values and added value of services in
relation to renewable energy.
In both samples, there are only customers of EDP Comercial that have been
provided for more than 15 years. These, in turn, value the price parameter first,
followed by the parameter trust in the brand and its service and in third place
the corporate values.
From the perspective of customers who have been supplied for less than 15
years and for more than 15 years, there is a distinct positioning of the EDP
Comercial company, as there is a difference to the left and right of the intersection
of both value curves. This can be explained by the fact that customers who have
been provided for more than 15 years have a different perspective of the service
compared to more “recent” customers, as they have already been provided by
the company in the regularized market.
Figure 14: Value Curve according to the duration of service provision (> 15 years) – Small
Business Segment
The value curves presented in Figures 15 and 16 were drawn according to
customer satisfaction and, as in the industrial segment, customers who rated the
1,00
2,00
3,00
4,00
5,00
6,00
7,00
8,00
P R I C E A P P E A L I N G A N D
E A S Y T O
U N D E R S T A N D
E Q U I P M E N T
A D D E D V A L U E O F
T H E S E R V I C E
( E L E C T R I C I T Y A N D
G A S )
C O M P A N Y
P E R F O R M A N C E
A D D E D V A L U E O F
T H E S E R V I C E
( R E N E W A B L E
E N E R G Y )
C O N F I D E N C E I N
T H E B R A N D A N D
I T S S E R V I C E
S E R V I C E Q U A L I T Y C O R P O R A T E
V A L U E S
( E N V I R O N M E N T A L
A N D S O C I A L
C O M M I T M E N T )
EDP Comercial Customers < 15 years EDP Comercial Customers > 15 years

78
service provided by their current supplier below 3 values were considered
dissatisfied, and those who rated above 3 values were considered satisfied.
Regarding the value curves in Figure 15 we can conclude that there is a greater
appreciation of the price parameter by customers who are supplied by companies
competing with the EDP Group and who are dissatisfied with their current
service.
Figure 15: Value Curve according to the degree of customer satisfaction (< 3 values) – Small
Business Segment
In addition, through Figure 15 we can see that there is a greater relevance
attributed to the company's performance parameter by dissatisfied customers
from competing companies. However, the dissatisfaction of EDP Comercial's
customers in this segment is, in addition to the price, essentially related to the
service quality and to the company's corporate values.
1,00
2,00
3,00
4,00
5,00
6,00
7,00
8,00
P R I C E A P P E A L I N G A N D
E A S Y T O
U N D E R S T A N D
E Q U I P M E N T
A D D E D V A L U E O F
T H E S E R V I C E
( E L E C T R I C I T Y A N D
G A S )
C O M P A N Y
P E R F O R M A N C E
A D D E D V A L U E O F
T H E S E R V I C E
( R E N E W A B L E
E N E R G Y )
C O N F I D E N C E I N
T H E B R A N D A N D
I T S S E R V I C E
S E R V I C E Q U A L I T Y C O R P O R A T E
V A L U E S
( E N V I R O N M E N T A L
A N D S O C I A L
C O M M I T M E N T )
EDP Comercial Customer Satisfaction < 3 values Other Companies Customer Satisfaction < 3 values
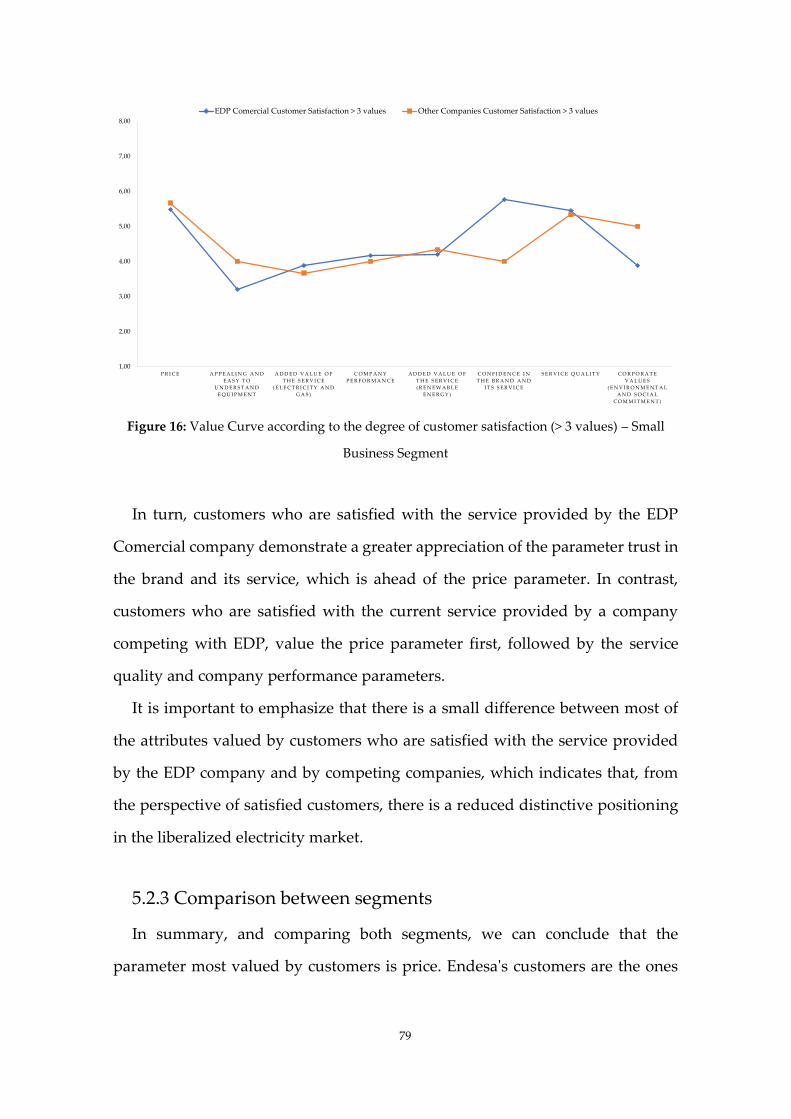
79
Figure 16: Value Curve according to the degree of customer satisfaction (> 3 values) – Small
Business Segment
In turn, customers who are satisfied with the service provided by the EDP
Comercial company demonstrate a greater appreciation of the parameter trust in
the brand and its service, which is ahead of the price parameter. In contrast,
customers who are satisfied with the current service provided by a company
competing with EDP, value the price parameter first, followed by the service
quality and company performance parameters.
It is important to emphasize that there is a small difference between most of
the attributes valued by customers who are satisfied with the service provided
by the EDP company and by competing companies, which indicates that, from
the perspective of satisfied customers, there is a reduced distinctive positioning
in the liberalized electricity market.
5.2.3 Comparison between segments
In summary, and comparing both segments, we can conclude that the
parameter most valued by customers is price. Endesa's customers are the ones
1,00
2,00
3,00
4,00
5,00
6,00
7,00
8,00
P R I C E A P P E A L I N G A N D
E A S Y T O
U N D E R S T A N D
E Q U I P M E N T
A D D E D V A L U E O F
T H E S E R V I C E
( E L E C T R I C I T Y A N D
G A S )
C O M P A N Y
P E R F O R M A N C E
A D D E D V A L U E O F
T H E S E R V I C E
( R E N E W A B L E
E N E R G Y )
C O N F I D E N C E I N
T H E B R A N D A N D
I T S S E R V I C E
S E R V I C E Q U A L I T Y C O R P O R A T E
V A L U E S
( E N V I R O N M E N T A L
A N D S O C I A L
C O M M I T M E N T )
EDP Comercial Customer Satisfaction > 3 values Other Companies Customer Satisfaction > 3 values

80
that most value this attribute in the industrial segment, however, in the small
business segment, they are the only customers that did not consider price as the
main parameter, placing the added value of services (renewable energy) as a
primary factor.
The customers of EDP Comercial, in both segments, are those who most value
the parameter trust in the brand and its service. This is in line with the
perspective of the different EDP Comercial managers who indicated brand
differentiation as the company's main strategy. The fact that the company has
been operating in the energy market in Portugal for a longer time, having
previously been a monopoly in the regularized market, allows it to create a
feeling of trust in the brand and in its service that seems to be valued by the
company's customers.
Furthermore, despite the fact that in the industrial segment price is the
attribute most valued by EDP Comercial customers, contrasting with the
perspective of the company's managers, in the small business segment the
perspectives of both sides are similar. This can be explained by the fact that the
number of customers in the small business segment in the energy market is
higher than in the industrial segment and, for that reason, there is a greater focus
on it.
Analysing both segments in relation to customers who switched from the
regularized market to the liberalized market for a company competing with the
EDP Group, we can conclude that the most valued parameter is price. Thus, it is
perceived that possibly the driving factor for the change in the trader in the
switch from the regularized market to the liberalized market, is essentially due
to the price.
Furthermore, we can see in the different segments that there is a discrepancy
between some attributes in the different value curves, indicating that there is
clearly a differentiated positioning from the customer's perspective in a given set
81
of attributes. This, in turn, meets the concept of “Blue Oceans” created by authors
Kim and Mauborgne (2004, 2005), which portrays innovative market spaces
unexplored by the competition.
Combining the information from the value curves according to supplier
changes in the liberalized market with the value curves according to the duration
of service provision, we can see that, from the perspective of customers in the
different segments, there is a pricing policy on the part of companies in the
market. This pricing policy is carried out by EDP Comercial to loyal customers,
that is, those who have been with the company for over 15 years and who did not
change their supplier when they moved from the regularized market to the free
market, and the other companies practice this policy to customers who “stole”
from the ex-monopolist company.
That said, it is possible to justify that the competitive advantage of EDP
Comercial can be sustained by the loyalty of customers who remained with the
company in the change from the regularized market to the free market, that is,
who come from a monopoly situation.
Regarding the value curves according to the duration of service provision,
what distinguishes both segments is the difference in the valuation of attributes
by more "recent" and "old" customers in the liberalized market. In the industrial
segment, there is a small “gap” between the attributes, indicating that, according
to the customers' perspective, there is no distinct position among the four largest
companies in the liberalized electricity market in Portugal.
In turn, in the small business segment, the difference between the attributes is
not as small as in the industrial segment, with a slight difference between the
positioning of companies from the perspective of the “oldest” and “newest”
customers in the liberalized market. This difference is essentially present in the
attributes of appealing and easy-to-understand equipment, the added value of
services related to the joint light and gas packages and corporate values.
82
Regarding the degree of customer satisfaction, we can conclude that the price
attribute is the most valued by customers of the companies Endesa, EDP
Comercial and Iberdrola, in the industrial segment, who are dissatisfied with
their current service provided. The same is true in the small business segment
with customers who are dissatisfied with the service provided by EDP
Comercial.
In the industrial segment, Galp's customers who are dissatisfied with the
service provided, essentially value the service quality parameter. In turn, in the
small business segment, customers of companies competing with the EDP Group
that negatively assessed the current service provided, essentially value the
parameter of the company's added value in relation to renewable energies,
followed by the price attribute.
Also, in the industrial segment, customers of the Endesa, EDP Comercial and
Galp who are satisfied with the service provided fundamentally value the price
parameter, while customers of the company Iberdrola value the added value of
the company's service. In turn, customers of the EDP Comercial company who
are satisfied with the service provided, value the parameter trust in the brand
and its service first, followed by the price attribute. On the contrary, customers
of competing companies value the price parameter, followed by the service
quality parameter.
It is concluded that there is a greater appreciation of the price, service quality,
company performance and confidence in the brand and its service attribute, in
most value curves. In general, these were considered in both segments the
primary attributes to contemplate when customers choose or evaluate a company
that provides energy services.
83
5.3 Analysis and discussion of results
Although the authors Wieringa and Verhoef (2007) present in their study
several competitive advantages of monopolistic companies in the transition to a
liberalized market, if there is no correct use of these advantages in the definition
of a future strategy, the same companies that previously held a total dominance
over the sector may end up losing their market share.
According to the respective authors, monopolistic companies have the
positional advantage of being known companies with forcibly loyal customers,
of resistance to change on the part of customers, in particular because there is
uncertainty regarding the quality of the product or service delivered by the new
intervening companies. Incidentally, these were all the advantages that EDP had
when the energy sector was liberalized, as it was the only company that
previously operated in the regulated market and had stablished relations with
customers.
Furthermore, the positional and competitive advantage of the ex-monopolist
company in the liberalized market can be explained according to the theory of
Porter's five forces (Porter 1998) given that there would naturally exist barriers
to the entry of new competitors. These are characterized by being associated with
the fact that EDP has privileged information through its greater knowledge of
consumers and their needs, as well as a history in its relationship with supply
chains. Also, the company has advantages such as an ability to take advantage of
economies of scale and range, namely due to the fact that the company already
sell gas in the regulated market, and also because the company has already had
a return on the initial investment applied in the various structures of the sector,
among others.
According to the sources-position-performance framework (Day and Wensley
1988) on which we have revisited, CRM should prove to be a source of
competitive advantage capable of helping to understand the customers’
84
perception of value, having a subsequent impact on the definition of company's
positional strategy, thus improving its performance. By complementing this
framework with Value Curve analysis, we should be able to understand whether
the same customers’ perception of value is indeed understood or driven by
management.
According to the interviewed managers, EDP Comercial is a customer-
oriented company with a CRM that has a moderately significant advantage over
its competitors.
However, although EDP Comercial adopts, according to the interviewed
managers, a brand and communication differentiation that meets the attributes
of trust in the brand and its service and service quality valued by customers, it
was possible to highlight a difference between the perception of value by
customers and the strategies adopted by the company. In both segments, the
attribute most valued is price, and according to the respective managers, the
company does not adopt a differentiation based on price.
We suspect that this difference may result of an inflexibility of culture or
organizational structure of the ex-monopolist company, which may be associated
with different reasons, namely, the lack of understanding of its sources of
competitive advantage, the failure to implement a positioning that reflect its
sources or a resource-based view, or the failure to implement a positioning that
influences the company's performance, that is, that influences the customers’
perception.
According to a qualitative analysis of the information in its generality,
although there is a positive, though not significant correlation, between EDP
Comercial's CRM and the company's differentiation strategy (Table 6), we were
able to verify in this study that there is no clear association between the variables
as was expected according to the sources-position-performance framework. This
is due to the fact that there seems to be scarce alignment between the perception

85
of the company's managers and the perception of its customers, rendering highly
improbable the veracity of hypothesis 1.
Regarding the relationship between the differentiation strategy and the
company's performance (H3), it was not possible to identify a clear relationship
between the variables according to the analysis of data taken from the survey
applied to managers. This is due to the fact that there is no significantly strong
correlation to accept or reject the veracity of the hypothesis.
However, and given that, in general, the most valued attribute in the different
segments under study by the customers of EDP Comercial and competing
companies is price, this "misalignment" of the company's differential strategy and
the customers' perception of value may explain the fact that the company has the
second lowest average satisfaction rate, around 3.46 values (Table 7). This may
justify why the company is continually losing its dominance in the liberalized
electricity market in Portugal, hinting at the veracity to hypothesis 3, namely, that
there is a relationship between the company's differentiation strategy and its
performance.
Table 7: Customer satisfaction average of the different companies
Regarding hypothesis 5, which states that there is a relationship between EDP
Comercial's CRM and its performance, we can see through table 6 that, although
there is no correlation between CRM and customer satisfaction and no
significantly strong correlation between CRM and a company's profitability, in
contrast, a positively strong relationship is observed between CRM and market
effectiveness. This is present in the fact that the company does not use CRM
Company Customer Satisfaction (average)
EDP Company 3,46
Endesa 3,76
Iberdrola 3,44
Galp 3,78
86
effectively, that is, it fully corresponds to the needs of its customers and,
therefore, presents a decrease in its market share (market effectiveness).
In addition, through Table 8 and 9 which shows the evolution of EDP
Comercial's market shares in terms of the number of customers and in terms of
annual consumption, we can see that the company's participation in the
liberalized electricity market as a whole has declined. Combining this
information with data taken from the survey applied to EDP Comercial
managers, we can see that two of the inquired managers claim that the average
length of stay of customers in the company is high. Note, however that we are
reporting in Table 8 and 9 the only aggregate numbers we have access to, and
that reflect the share of the global four market segments: domestic, small
business, industrial and large consumers. Additionally, it is possible that this
reduction in market share does not in itself mean a reduction in the number of
the company's customers, but rather an increase in the number of customers who,
when moving from the regularized market to the free market or when entering
in the liberalized market for the first time, opted for companies that competed
with the EDP Group. This reinforces the idea mentioned above in point 5.2.3 that
EDP Comercial has advantages arising from its previous market dominance,
such as customer loyalty.
Furthermore, this reduction in market share could mean the loss of larger
customers, thus reducing the market share in terms of annualized consumption,
especially in the first years, keeping the market share in terms of number of
customers slightly constant. Despite this decrease in shares, the company
demonstrates that it has recovered from the crisis in 2011, with the recovery in
terms of the number of customers being higher in percentage points than in terms
of annualized consumption.

87
Thus, although EDP Comercial managers claim that there is a high length of
stay of their customers, they may only be referring to small consumers or just in
comparison with their competitors, being in turn out of line with the reality.
That said, in a qualitative way we can also affirm that possibly the CRM of the
EDP Comercial company is related to the respective performance indicator,
market effectiveness, since the company is not being able to understand the
market needs and attract new customers, losing market share.
Regarding hypothesis 2, which states the relationship between EDP
Comercial's CRM and its cost leadership strategy, we can conclude, according to
the correlations in table 6, that there is a strong positive association between the
variables.
Month EDP Comercial
31/12/2006 -
31/12/2007 98,0%
31/12/2008 99,0%
31/12/2009 94,0%
31/12/2010 88,0%
31/12/2011 77,0%
31/12/2012 80,0%
31/12/2013 84,0%
31/12/2014 86,0%
31/12/2015 85,0%
31/12/2016 84,9%
31/12/2017 83,8%
31/12/2018 80,8%
31/12/2019 78,4%
31/12/2020 75,5%
Market share by number of customers
Month EDP Comercial
31/12/2006 -
31/12/2007 76,0%
31/12/2008 92,0%
31/12/2009 63,0%
31/12/2010 46,0%
31/12/2011 41,0%
31/12/2012 42,0%
31/12/2013 44,0%
31/12/2014 46,0%
31/12/2015 43,0%
31/12/2016 46,0%
31/12/2017 42,8%
31/12/2018 41,8%
31/12/2019 41,7%
31/12/2020 40,1%
Market share by annualized consumption
Table 8: Evolution of EDP Comercial's
Market Shares in terms of annualized
consumption – source: Energy Services
Regulatory Authority (ERSE)
Table 9: Evolution of EDP Comercial's
Market Shares in terms of number of
customers – source: Energy Services
Regulatory Authority (ERSE)
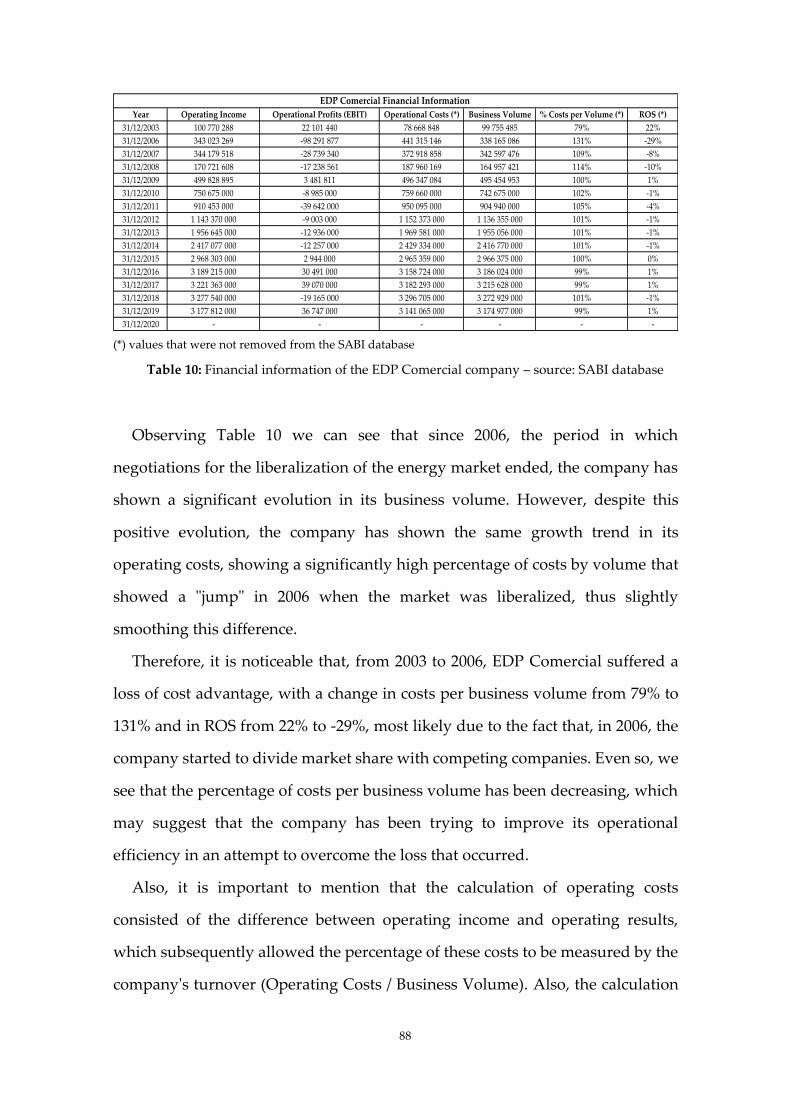
88
(*) values that were not removed from the SABI database
Table 10: Financial information of the EDP Comercial company – source: SABI database
Observing Table 10 we can see that since 2006, the period in which
negotiations for the liberalization of the energy market ended, the company has
shown a significant evolution in its business volume. However, despite this
positive evolution, the company has shown the same growth trend in its
operating costs, showing a significantly high percentage of costs by volume that
showed a "jump" in 2006 when the market was liberalized, thus slightly
smoothing this difference.
Therefore, it is noticeable that, from 2003 to 2006, EDP Comercial suffered a
loss of cost advantage, with a change in costs per business volume from 79% to
131% and in ROS from 22% to -29%, most likely due to the fact that, in 2006, the
company started to divide market share with competing companies. Even so, we
see that the percentage of costs per business volume has been decreasing, which
may suggest that the company has been trying to improve its operational
efficiency in an attempt to overcome the loss that occurred.
Also, it is important to mention that the calculation of operating costs
consisted of the difference between operating income and operating results,
which subsequently allowed the percentage of these costs to be measured by the
company's turnover (Operating Costs / Business Volume). Also, the calculation
Year Operating Income Operational Profits (EBIT) Operational Costs (*) Business Volume % Costs per Volume (*) ROS (*)
31/12/2003 100 770 288 22 101 440 78 668 848 99 755 485 79% 22%
31/12/2006 343 023 269 -98 291 877 441 315 146 338 165 086 131% -29%
31/12/2007 344 179 518 -28 739 340 372 918 858 342 597 476 109% -8%
31/12/2008 170 721 608 -17 238 561 187 960 169 164 957 421 114% -10%
31/12/2009 499 828 895 3 481 811 496 347 084 495 454 953 100% 1%
31/12/2010 750 675 000 -8 985 000 759 660 000 742 675 000 102% -1%
31/12/2011 910 453 000 -39 642 000 950 095 000 904 940 000 105% -4%
31/12/2012 1 143 370 000 -9 003 000 1 152 373 000 1 136 355 000 101% -1%
31/12/2013 1 956 645 000 -12 936 000 1 969 581 000 1 955 056 000 101% -1%
31/12/2014 2 417 077 000 -12 257 000 2 429 334 000 2 416 770 000 101% -1%
31/12/2015 2 968 303 000 2 944 000 2 965 359 000 2 966 375 000 100% 0%
31/12/2016 3 189 215 000 30 491 000 3 158 724 000 3 186 024 000 99% 1%
31/12/2017 3 221 363 000 39 070 000 3 182 293 000 3 215 628 000 99% 1%
31/12/2018 3 277 540 000 -19 165 000 3 296 705 000 3 272 929 000 101% -1%
31/12/2019 3 177 812 000 36 747 000 3 141 065 000 3 174 977 000 99% 1%
31/12/2020 - - - - - -
EDP Comercial Financial Information
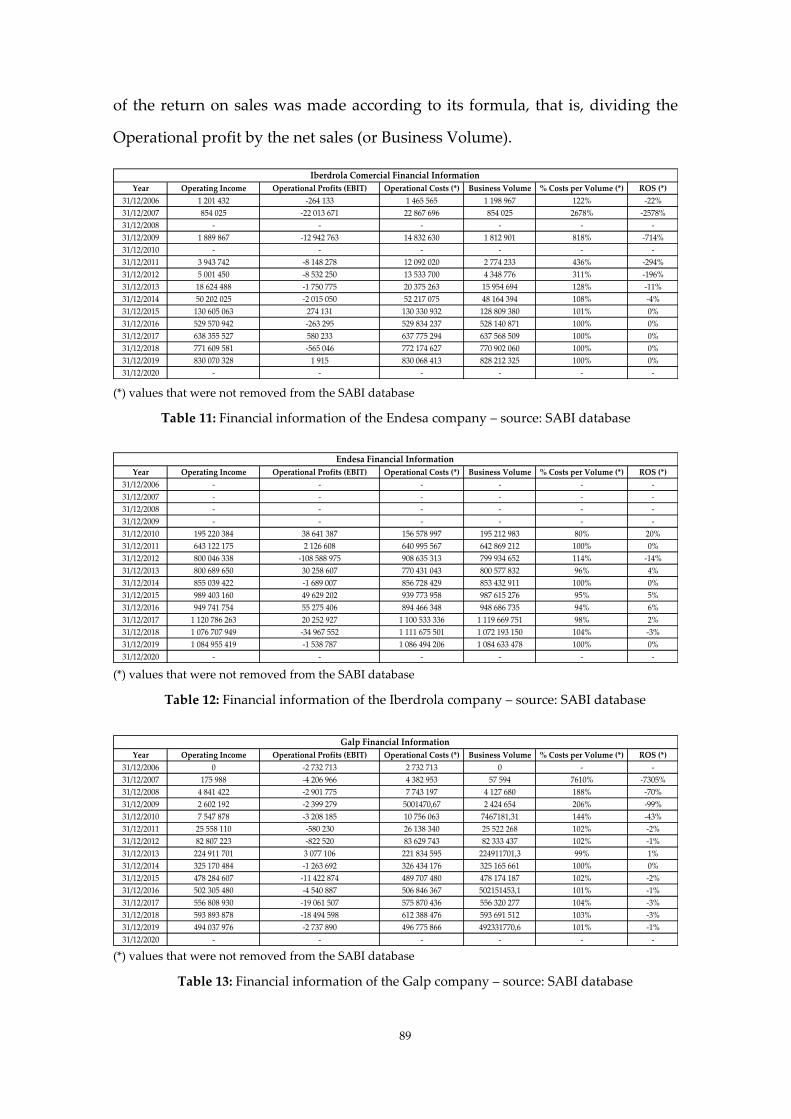
89
of the return on sales was made according to its formula, that is, dividing the
Operational profit by the net sales (or Business Volume).
(*) values that were not removed from the SABI database
Table 11: Financial information of the Endesa company – source: SABI database
(*) values that were not removed from the SABI database
Table 12: Financial information of the Iberdrola company – source: SABI database
(*) values that were not removed from the SABI database
Table 13: Financial information of the Galp company – source: SABI database
Year Operating Income Operational Profits (EBIT) Operational Costs (*) Business Volume % Costs per Volume (*) ROS (*)
31/12/2006 1 201 432 -264 133 1 465 565 1 198 967 122% -22%
31/12/2007 854 025 -22 013 671 22 867 696 854 025 2678% -2578%
31/12/2008 - - - - - -
31/12/2009 1 889 867 -12 942 763 14 832 630 1 812 901 818% -714%
31/12/2010 - - - - - -
31/12/2011 3 943 742 -8 148 278 12 092 020 2 774 233 436% -294%
31/12/2012 5 001 450 -8 532 250 13 533 700 4 348 776 311% -196%
31/12/2013 18 624 488 -1 750 775 20 375 263 15 954 694 128% -11%
31/12/2014 50 202 025 -2 015 050 52 217 075 48 164 394 108% -4%
31/12/2015 130 605 063 274 131 130 330 932 128 809 380 101% 0%
31/12/2016 529 570 942 -263 295 529 834 237 528 140 871 100% 0%
31/12/2017 638 355 527 580 233 637 775 294 637 568 509 100% 0%
31/12/2018 771 609 581 -565 046 772 174 627 770 902 060 100% 0%
31/12/2019 830 070 328 1 915 830 068 413 828 212 325 100% 0%
31/12/2020 - - - - - -
Iberdrola Comercial Financial Information
Year Operating Income Operational Profits (EBIT) Operational Costs (*) Business Volume % Costs per Volume (*) ROS (*)
31/12/2006 0 -2 732 713 2 732 713 0 - -
31/12/2007 175 988 -4 206 966 4 382 953 57 594 7610% -7305%
31/12/2008 4 841 422 -2 901 775 7 743 197 4 127 680 188% -70%
31/12/2009 2 602 192 -2 399 279 5001470,67 2 424 654 206% -99%
31/12/2010 7 547 878 -3 208 185 10 756 063 7467181,31 144% -43%
31/12/2011 25 558 110 -580 230 26 138 340 25 522 268 102% -2%
31/12/2012 82 807 223 -822 520 83 629 743 82 333 437 102% -1%
31/12/2013 224 911 701 3 077 106 221 834 595 224911701,3 99% 1%
31/12/2014 325 170 484 -1 263 692 326 434 176 325 165 661 100% 0%
31/12/2015 478 284 607 -11 422 874 489 707 480 478 174 187 102% -2%
31/12/2016 502 305 480 -4 540 887 506 846 367 502151453,1 101% -1%
31/12/2017 556 808 930 -19 061 507 575 870 436 556 320 277 104% -3%
31/12/2018 593 893 878 -18 494 598 612 388 476 593 691 512 103% -3%
31/12/2019 494 037 976 -2 737 890 496 775 866 492331770,6 101% -1%
31/12/2020 - - - - - -
Galp Financial Information
Year Operating Income Operational Profits (EBIT) Operational Costs (*) Business Volume % Costs per Volume (*) ROS (*)
31/12/2006 - - - - - -
31/12/2007 - - - - - -
31/12/2008 - - - - - -
31/12/2009 - - - - - -
31/12/2010 195 220 384 38 641 387 156 578 997 195 212 983 80% 20%
31/12/2011 643 122 175 2 126 608 640 995 567 642 869 212 100% 0%
31/12/2012 800 046 338 -108 588 975 908 635 313 799 934 652 114% -14%
31/12/2013 800 689 650 30 258 607 770 431 043 800 577 832 96% 4%
31/12/2014 855 039 422 -1 689 007 856 728 429 853 432 911 100% 0%
31/12/2015 989 403 160 49 629 202 939 773 958 987 615 276 95% 5%
31/12/2016 949 741 754 55 275 406 894 466 348 948 686 735 94% 6%
31/12/2017 1 120 786 263 20 252 927 1 100 533 336 1 119 669 751 98% 2%
31/12/2018 1 076 707 949 -34 967 552 1 111 675 501 1 072 193 150 104% -3%
31/12/2019 1 084 955 419 -1 538 787 1 086 494 206 1 084 633 478 100% 0%
31/12/2020 - - - - - -
Endesa Financial Information
90
Analysing Tables 10, 11, 12 and 13 together, we find some evidence that
suggests that EDP Comercial and Endesa are the companies that “dispute” for
cost advantage in the market, with the lowest percentages of costs per business
volume.
In turn, although Table 6 hints solely at a strong relationship between EDP
Comercial's cost leadership strategy and its market effectiveness, we can attribute
a possible relationship between this strategy and the company's profitability.
This is due to the fact that in periods when a company presents lower percentages
of costs per business volume, it also presents higher return on sales (Table 10).
This suggests that the higher return on sales results from greater efficiency
(reduction of operating costs) and not from a greater ability to charge a price
premium for differentiation, which would be expected in this sector, reinforcing
the idea that the company has a low ability to differentiate without being by
price. As the return on sales (ROS) is an indicator of performance and operational
efficiency, its value is an indicator of the company's profitability. Note, however
that we are reporting in Table 10 the only aggregate numbers we have access to,
and that reflect the share of the global four market segments: domestic, small
business, industrial and large consumers.
Also, it is important to mention that, although there are other more complete
profitability measures that include financial (or other sources of) revenues and
costs and other impacts on net profit, it was only possible, according to the
available information, to use the return on sales (ROS) in this study.
Although it was not possible in this study to draw conclusions about the
relationship of EDP Comercial's cost leadership strategy with customer
satisfaction, we can only attribute a certain veracity to hypothesis 4, which states
that there is a positive relationship between the respective strategy and the
company performance.
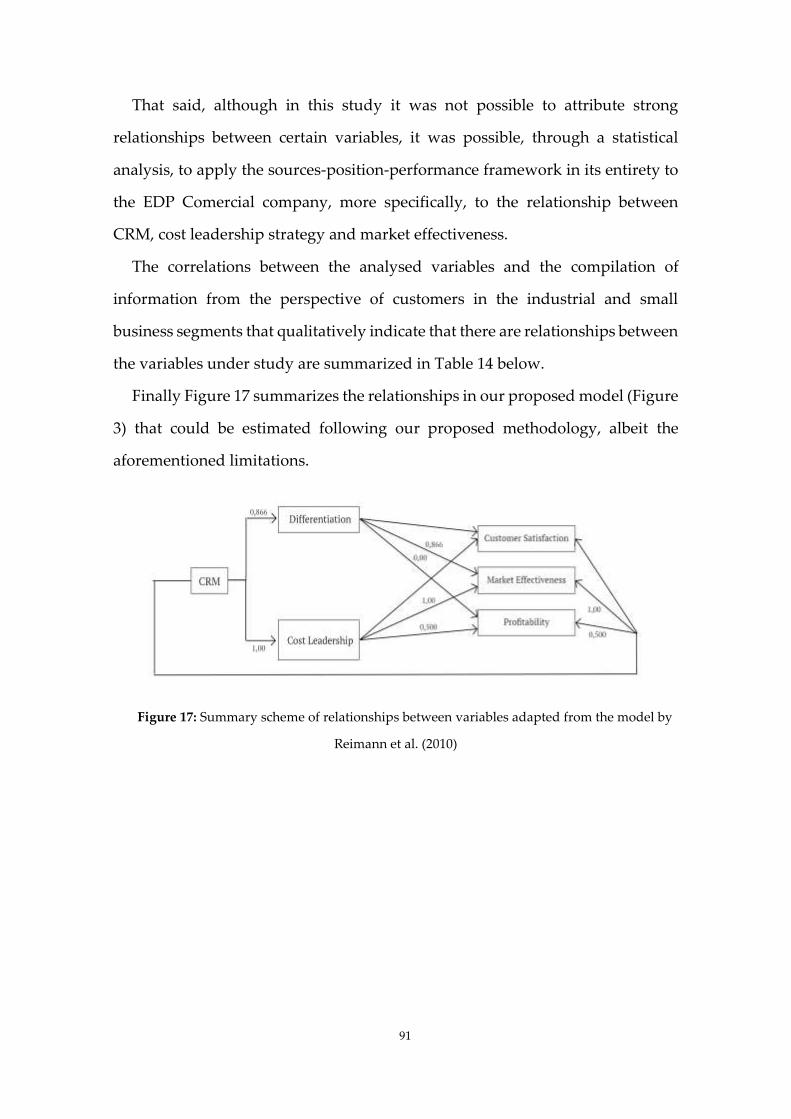
91
That said, although in this study it was not possible to attribute strong
relationships between certain variables, it was possible, through a statistical
analysis, to apply the sources-position-performance framework in its entirety to
the EDP Comercial company, more specifically, to the relationship between
CRM, cost leadership strategy and market effectiveness.
The correlations between the analysed variables and the compilation of
information from the perspective of customers in the industrial and small
business segments that qualitatively indicate that there are relationships between
the variables under study are summarized in Table 14 below.
Finally Figure 17 summarizes the relationships in our proposed model (Figure
3) that could be estimated following our proposed methodology, albeit the
aforementioned limitations.
Figure 17: Summary scheme of relationships between variables adapted from the model by
Reimann et al. (2010)

92
Table 14: Summary table of correlations and p-value of each variable under study and of
collected qualitative information.
Although further research on evaluating the impact of CRM on competing
companies would be interesting, in order to understand their attempts to
overcome the superior position of the ex-monopolist company, it seems
reasonable to assume that possibly there is, on the part of these same companies,
a consideration of the customers' perception of value, which allows them to
adopt strategies that meet the needs and desires of customers.
This thesis has, however, deepened the understanding of customer satisfaction
for the major current players in the industry, through the use of Value Curve
analysis, and customer satisfaction has, over time, proved to be an essential factor
Correlation P-value Test Result Qualitative Analysis (*)
Variables CRM Differentiation Strategy
managers surveyed managers surveyed
managers surveyed (*) customers surveyed (*)
Variables CRM Cost Leadership Strategy
managers surveyed managers surveyed
managers surveyed (*) customers surveyed (*)
Variables Differentiation Strategy Customer Satisfaction
managers surveyed managers surveyed
managers surveyed (*) customers surveyed (*)
Variables Differentiation Strategy Profitability
managers surveyed managers surveyed
managers surveyed (*) SABI database information (*)
Variables Differentiation Strategy Market Effectiveness
managers surveyed managers surveyed
managers surveyed (*) ERSE market information (*)
Variables Cost Leadership Strategy Customer Satisfaction
managers surveyed managers surveyed
managers surveyed (*) customers surveyed (*)
Variables Cost Leadership Strategy Profitability
managers surveyed managers surveyed
managers surveyed (*) SABI database information (*)
Variables Cost Leadership Strategy Market Effectiveness
managers surveyed managers surveyed
managers surveyed (*) ERSE market information (*)
Variables CRM Customer Satisfaction
managers surveyed managers surveyed
managers surveyed (*) customers surveyed (*)
Variables CRM Profitability
managers surveyed managers surveyed
managers surveyed (*) SABI database information (*)
Variables CRM Market Effectiveness
managers surveyed managers surveyed
managers surveyed (*) ERSE market information (*)
Source
Source
-
-
There is a relationship.
There is a relationship.
There is a relationship.
-
There is a relationship.
-
There is a relationship.
There is a relationship.
There is a relationship.
Source
Source
Source
Source
Source
Source
Source
Source
Source
-
-
-
0,000 Reject H0.
Do not reject
the H0.
-
-
-
0,667
0,000
0,000 1,000
0,866 0,333
1,000
-
-
0,500
1,000
0,500 0,667
-
Do not reject
the H0.
Reject H0.
Do not reject
the H0.
Do not reject
the H0.
Relationship Studied - EDP Comercial
0,866
1,000
0,333
0,000
Do not reject
the H0.
Reject H0.

93
for improving a company's performance as well as for achieving competitive
advantage in the market where it operates. According to the author Bose (2002),
a company that successfully responds to the needs of its customers, is more likely
to become a leader in the market in which it operates.
With this in mind, a brief additional analysis of the main EDP competitor’s
institutional website was conducted in order to understand whether their
publicly stated directional strategies were aligned with what we found to be their
customers' perception of value. It is important to note that the websites of
competing companies, like EDP Comercial website, have a section for domestic
customers and another section for business customers. It was this second section,
which presents general strategies aimed at business customers, that was
analysed.
Analysing the Endesa and Iberdrola institutional websites (Appendix 3, 4, 5
and 6) and the offers they present, we can see that both have strategies aligned
with their business customers' perception of value. In both segments and
although there is a difference between the most valued attributes, customers
assign a certain importance essentially to the price parameter and to the added
value of services associated with renewable energy.
Through the Endesa institutional website we can verify that the company is
investing mostly in price differentiation, offering a light bill and/or a gas bill
every year and forever. In turn, the Iberdrola invests in differentiation based on
the price and on the use of green energy, offering a 25% discount forever to those
who use this type of energy.
These strategies implemented by the companies have allowed them to increase
their market share in terms of number of customers and annualized consumption
(Table 2 and 3), however, we can see through Tables 7, 11 and 12 that only the
Endesa has managed to improve its performance (customer satisfaction,
profitability and market effectiveness). This is due to the fact that return on sales

94
(ROS) is one of the performance and operational efficiency indicators of a
company and, in the case of Iberdrola, it presents significantly negative values.
The low satisfaction of Iberdrola's customers (Table 5) may be associated with
the fact that they essentially value the price attribute, and the company is, despite
the discounts presented, offering high values from the customer's point of view.
However, and despite Iberdrola presenting the worst average for the satisfaction
of the business customers surveyed and still a low ROS, the company has
managed to increase its market share in terms of number of customers (Table 2).
Regarding the Galp institutional website (Appendix 7 and 8), it can be seen
that the company possibly adopts a strategy aimed at the quality of service
provided to the customer. Through the different value curves of the two
segments under study, it can be seen that the most valued attributes are price and
service quality. This alignment of the company's strategy with the attributes
valued by its customers can explain the high average satisfaction rate resulting
from the responses to the survey.
However, despite being the company with the highest average in terms of
customer satisfaction (Table 7) – a measure of performance - this is not reflected
in profitability and market effectiveness, other performance measures in the
model we followed, as it presents high percentages of costs per business volume,
negative sales returns and a decrease in market share in terms of number of
customers.
Finally, looking at the four biggest electricity companies in Portugal and
analysing the three indicators related to a company's performance, namely
customer satisfaction, profitability and market effectiveness, we find evidence
that Endesa is possibly the only company that seems to have a more effective
strategy, allowing it to provide services with a value perceived by its customers,
challenging us to understand, through future research, which sources leverage
it.

95
Chapter 6 Conclusion
EDP Comercial had the resources and capabilities inherent to the advantages
of an ex-monopolist company to, according to the sources-position-performance
framework, achieve a positional advantage and, consequently, an above-average
performance in the liberalized electricity market. This is because, by having
resources and capacities superior to those of its competitors, namely an existing
operational structure and market know-how, it would be able to achieve a
competitive advantage that would allow it to reach optimum performance.
Despite all these apparent advantages, the company seems to have a lack of
alignment of its positional strategies in the industrial and small business
segments (brand differentiation and communication differentiation) with the
attribute most valued by its business customers, namely, price. This is reflected
in the low satisfaction of the customers surveyed in relation to the service
provided by the company, as well as in the decrease of market shares (market
effectiveness).
That said, it was conceivable to recognize a possible relationship between
CRM and company performance and between EDP Comercial's differentiation
strategy and its performance. On the other hand, the misalignment between the
company's differentiation strategy and the parameter most valued by customers,
makes it highly unlikely that there is a relationship between the respective
strategy and the company's CRM.

96
We suspect that the company's lack of understanding of the sources of
competitive advantage, the failure to implement a positioning that reflects its
sources or a resource-based view, and also, the failure to implement a positioning
that influences the company's performance, may be the reason for this
misalignment.
As we find in this study a certain robustness in the analysis of the customers’
perspective in the industrial segment and small business segment, the
misalignment of perceptions seems to point towards the failure of managers to
understand the capabilities or sources of competitive advantage of the company
(Nasution and Mavondo 2008), or the failure to mobilize the capabilities in order
to translate them into positioning and performance.
In addition, it was statistically and qualitatively observed that there is a
relationship between EDP Comercial's cost leadership strategy and the
company's CRM and also between the respective strategy and its performance,
namely, between the market effectiveness and profitability indicators. It is
through this relationship between the CRM, the cost leadership strategy and the
company's performance that the applicability of the sources-position-
performance framework can be seen more clearly.
Limitations and avenues for further research
Although this study is a unique approach and analysis to the electricity sector
in Portugal, it is possible to recognize some limitations.
Firstly, recognizing that the fact that we lived in a period of uncertainty and
isolation due to Covid-19, did not allow the addition of personal means, such as,
interviews, door-to-door feedback collection, between others. This had an impact
on the response rate by managers of companies competing with EDP Comercial,
97
as it was not possible to use the door-to-door strategy to request their
participation. In addition to this, remote work overcrowded online tools, namely,
the e-mail of companies and their employees, thus hampering participation in
the survey. However, it is considered that the response rate was quite satisfactory
given the context.
Thirdly, to recognize that some of the data relating to the e-mail of small and
medium-sized companies in Portugal are out of date in the SABI database, which
also had an impact on the response rate to the survey developed.
Finally, the fact that the curricular internship at EDP Distribuição, currently E-
REDES, was carried out in teleworking dynamics, did not allow for better
feedback from the company, specifically, in accessing internal documents and
information that could be useful to the study.
That said, it is suggested for a future study the analysis and application of the
sources-position-performance framework of the authors Day and Wensley
(1988), in the electricity sector in Portugal, exploring the CRM-performance
relationship in more detail, that is, encompassing all or the main energy supply
companies. In addition, it is also suggested the analysis of other superior
resources and capacities capable of providing a continuous competitive
advantage in the energy market and thus, improving the performance of
companies.

98
References
Achchuthan, S., Sivathaasan, N., & Jayasundara, J. M. R. S. (2014). Service quality
dimensions of electricity services: Evidence from electricity board in Sri
Lanka. Asian Social Science, 10(17), 194.
Acquaah, M., & Yasai-Ardekani, M. (2008). Does the implementation of a
combination competitive strategy yield incremental performance benefits? A
new perspective from a transition economy in Sub-Saharan Africa. Journal of
Business Research, 61(4), 346-354.
Adner, Ron, and Peter B. Zemsky (2006), “A Demand-Based Perspective on
Sustainable Competitive Advantage,” Strategic Management Journal, 27 (3), 215–
39.
Aggarwal, A., & Kumar, R. (2018). Examination of service quality dimensions in
power distribution sector. International Journal on Future Revolution in Computer
Science & Communication Engineering, 4(2), 207-212.
Alberts, W. W., & McTaggart, J. M. (1984). Value based strategic investment
planning. Interfaces, 14(1), 138-151.
Amit, R., & Schoemaker, P. J. (1993). Strategic assets and organizational
rent. Strategic management journal, 14(1), 33-46.
Anderson, E. W., & Sullivan, M. W. (1993). The antecedents and consequences of
customer satisfaction for firms. Marketing science, 12(2), 125-143.
Baack, D. W., & Boggs, D. J. (2008). The difficulties in using a cost leadership
strategy in emerging markets. International Journal of Emerging Markets.
Bagozzi, R. P., Gopinath, M., & Nyer, P. U. (1999). The role of emotions in
marketing. Journal of the academy of marketing science, 27(2), 184-206.
Barney, J. (1991). Competitive Advantage. Journal of management, 17(1), 99-120.

99
Barney, J. B., & Hesterly, W. S. (2008). Evaluating a firm’s internal
capabilities. Strategic Management and Competitive Advantage (2nd ed., pp. 74–107).
New Jersey: Pearson Education.
Barron, F. H., & Barrett, B. E. (1996). Decision quality using ranked attribute
weights. Management science, 42(11), 1515-1523.
Berger, J., & Heath, C. (2007). Where consumers diverge from others: Identity
signaling and product domains. Journal of consumer research, 34(2), 121-134.
Bharadwaj, A. S. (2000). A resource-based perspective on information technology
capability and firm performance: an empirical investigation. MIS Quarterly, 24(1),
169–196.
Bienstock, C. C., Mentzer, J. T., & Bird, M. M. (1997). Measuring physical
distribution service quality. Journal of the Academy of Marketing Science, 25(1), 31–
44.
Bose (2002), “Customer relationship management: key components for IT
success”, Industrial Management and Data Systems, Vol. 102 No. 2, pp. 89-97.
Boulding, W., Lee, E., & Staelin, R. (1994). Mastering the mix: Do advertising,
promotion, and sales force activities lead to differentiation?. Journal of marketing
research, 31(2), 159-172.
Brodie, R. J., J. R. Whittome, and G. J. Brush. 2009. “Investigating the Service
Brand: A Customer Value Perspective.” Journal of Business Research 62 (3): 345–
355.
Buzzell, R. D. (1981). Are there “natural” market structures?. Journal of
Marketing, 45(1), 42-51.
Buzzell, R. D., Gale, B. T., & Sultan, R. G. (1975). Market share-a key to
profitability. Harvard business review, 53(1), 97-106.
Campbell, A. and Alexander, M. (1997), “What’s wrong with strategy”, Harvard
Business Review, Vol. 75 No. 6, pp. 42-9.

100
Campbell, A. J. (2003). Creating customer knowledge competence: managing
customer relationship management programs strategically. Industrial marketing
management, 32(5), 375-383.
Cavusgil, S. T., & Knight, G. (2015). The born-globalfirm: An entrepreneurial and
cap-abilities perspective on early and rapid internationalization.Journal of
InternationalBusiness Studies, 46(1), 3–16. https://doi.org/10.1057/jibs.2014.62.
Chang, S. C. (2010). Bandit cellphones: A blue ocean strategy. Technology in
society, 32(3), 219-223.
Chaudhuri, A., & Holbrook, M. B. (2001). The chain of effects from brand trust
and brand affect to brand performance: the role of brand loyalty. Journal of
marketing, 65(2), 81-93.
Čolaković, A., & Bajrić, H. (2017). ASSESSING CUSTOMER SATISFACTION
BASED ON QoS PARAMETERS. International Journal for Quality Research, 11(1).
Costanzo, L. A., Keasey, K., & Short, H. (2003). A strategic approach to the study
of innovation in the financial services industry. Journal of Marketing Management,
19(3/4), 259–281.
Cravens, D.W., Greenley, G., Piercy, N.F. and Slater, S. (1997), “Integrating
contemporary strategic management perspectives”, Long Range Planning, Vol.
30 No. 4, pp. 493-506.
Dash, Mihir and Das, Annyesha, A CAMELS Analysis of the Indian Banking
Industry (July 14, 2009). Available at: https://ssrn.com/abstract=1666900 or
http://dx.doi.org/10.2139/ssrn.1666900.
Davis, P. S., & Schul, P. L. (1993). Addressing the contingent effects of business
unit strategic orientation on relationships between organizational context and
business unit performance. Journal of Business Research, 27(3), 183–200.
Day, G. S. (1994). The capabilities of market-driven organizations. Journal of
Marketing, 58(4), 37–52.

101
Day, G. S. (2004). Invited commentaries on ‘evolving to a new dominant logic for
marketing’: achieving advantage with a new dominant logic. Journal of Marketing,
68(1), 18–19.
Day, G. S., & Van den Bulte, C. (2002). Superiority in customer relationship
management: Consequences for competitive advantage and performance (pp. 1-49). MSI.
Day, G. S., & Wensley, R. (1988). Assessing advantage: a framework for
diagnosing competitive superiority. Journal of marketing, 52(2), 1-20.
Dvorak, J., & Razova, I. (2018). Empirical validation of blue ocean strategy
sustainability in an international environment. Foundations of Management, 10(1),
143-162.
Dyner, I., & Larsen, E. R. (2001). From planning to strategy in the electricity
industry. Energy policy, 29(13), 1145-1154.
Eklof, J., Podkorytova, O. and Malova, A. (2018), “Linking customer satisfaction
with financial performance: an empirical study of Scandinavian banks”, Total
Quality Management and Business Excellence, pp. 1-19, doi: 10.1080/14783363.2018.
Endesa. (2021). Accessed on June 7, 2021, in: https://www.endesa.pt/
Entidade Reguladora de Serviços Energéticos (2020). Relatório sobre os Mercados
Retalhistas de Eletricidade e Gás Natural em Portugal em 2019. Accessed on January
20, 2021, in: https://www.erse.pt/media/w4dpnu3d/relat%C3%B3rio-sobre-os-
mercados-retalhistas-de-eletricidade-e-de-g%C3%A1s-natural-em-2019-em-
portugal.pdf
Entidade Reguladora de Serviços Energéticos (2020). Resumo Informativo do
Mercado Liberalizado de Elettricidade (novembro 2020). Accessed on January 20, 2021,
in: https://www.erse.pt/media/rienwjbt/ml-ele-nov-2020.pdf
European Commission, 2012. Energy and Environment Overview.
/http://ec.europa.eu/competition/sectors/energy/overview_en.html stable URLS
Finon, D., Boroumand, R.H., (2011). Electricity retail competition: from survival
strategiesto oligopolistic behaviors. In: Colloquium on Regulation of Energy

102
Industries, Economic Center, IFP School (France) and Center for Economic
Regulation, CityUniversity, Londres. Rueil-Malmaison, France, URL: https://hal-
enpc.archives-ouvertes.fr/hal-00827297.
Fuchs, C. and Diamantopoulos, A. (2010). “Evaluating the effectiveness of brand‐
positioning strategies from a consumer perspective”, European Journal of
Marketing, Vol. 44 Nos 11/12, pp. 1763-1786.
Fuchs, C., & Diamantopoulos, A. (2012). Customer‐perceived positioning
effectiveness: Conceptualization, operationalization, and implications for new
product managers. Journal of Product Innovation Management, 29(2), 229-244.
Galp. (2021). Accessed on June 7, 2021, in: https://casa.galp.pt/
Ghazvini, M. A. F., Ramos, S., Soares, J., Castro, R., & Vale, Z. (2019).
Liberalization and customer behavior in the Portuguese residential retail
electricity market. Utilities Policy, 59, 100919.
Grahovac, Jovan, and Douglas J. Miller (2009), “Competitive Advantage and
Performance: The Impact of Value Creation and Costliness of Imitation,” Strategic
Management Journal, 30 (11), 1192–212.
Grbac, B., & RADULOVIC, D. (2008). New energy marketing. Gas, 3, 7-790.
Green, R., Lorenzoni, A., Pérez, Y., & Pollitt, M. (2009). ‘Policy assessment and
good practices’.
Grönroos, C. (2006). On defining marketing: finding a new roadmap for
marketing. Marketing theory, 6(4), 395-417.
Grosso, M., and S. Castaldo. 2015. “How Store Attributes Impact Shoppers’
Loyalty: Do Different National Cultures Follow the Same Loyalty Building
Process?” The International Review of Retail, Distribution and Consumer Research 25
(5): 503–515.
Halkos, G. (2019). Examining the level of competition in the energy sector.

103
Hallowell, R. (1996). The Relationships of Customer Satisfaction, Customer
Loyalty, and Profitability: An Empirical Study. International Journal of Service
Industry Management, 7(4), 27-42.
Hartmann, P., & Ibáñez, V. A. (2007). Managing customer loyalty in liberalized
residential energy markets: The impact of energy branding. Energy Policy, 35(4),
2661-2672.
Helmig, B., Huber, J.A. and Leeflang, P. (2007), “Explaining behavioural
intentions toward co-branded products”, Journal of Marketing Management, Vol.
23 Nos 3-4, pp. 285-304.
Higgins, K.T. (1998), “The value of customer value analysis”, Marketing
Research, Vol. 10 No. 4, pp. 39-44.
Hill, N. (1990). Commodity products and stalemate industries: is there a role for
marketing? Journal of Marketing Management, 5(3), 259–281.
Hogan, J. E., Lemon, K. N., & Rust, R. T. (2002). Customer equity management:
charting new directions for the future of marketing. Journal of Service Research,
5(1), 4–12.
Hollensen, S. (2013). The Blue Ocean that disappeared–the case of Nintendo
Wii. Journal of business strategy.
Hollyoake, M. (2009). The four pillars: Developing a ‘bonded’business-to-
business customer experience. Journal of Database Marketing & Customer Strategy
Management, 16(2), 132-158.
Hooley, G., & Greenley, G. (2005). The resource underpinnings of competitive
positions. Journal of Strategic Marketing, 13(2), 93– 116.
Huber, F., Herrmann, A. and Morgan, R.E. (2001), “Gaining competitive
advantage through customer value oriented management”, The Journal of
Consumer Marketing, Vol. 18 No. 1, pp. 41-53.

104
Hupperich, T., Tatang, D., Wilkop, N., & Holz, T. (2018, March). An empirical
study on online price differentiation. In Proceedings of the Eighth ACM Conference
on Data and Application Security and Privacy (pp. 76-83).
Iberdrola. (2021). Accessed on June 7, 2021, in: https://www.iberdrola.pt/
Jayachandran, S., Sharma, S., Kaufman, P., & Raman, P. (2005). The role of
relational information processes and technology use in customer relationship
management. Journal of Marketing, 69(4), 177–192.
Joskow, P., (2008). Lessons learned from electricity market liberalization. Energy
J. 29 (2),9–42.
Joskow, P. L. (1997). Restructuring, competition and regulatory reform in the US
electricity sector. Journal of Economic perspectives, 11(3), 119-138.
Kaliappen, N. and Hilman, H. (2017) ‘Competitive strategies, market orientation
types and innovation strategies: finding the strategic fit’, World Journal of
Entrepreneurship, Management and Sustainable Development, 13 (3), pp.257–261.
Kandampully J, Zhang T (Christina), et al. (2015) Customer loyalty: A review and
future directions with a special focus on the hospitality industry. International
Journal of Contemporary Hospitality Management 27(3): 379–414.
Kaplan, R. S. (2005). How the balanced scorecard complements the McKinsey 7-
S model. Strategy & Leadership, 33(3): 41–46.
Karahan, H., Toptas, M., (2013). The effect of power distribution privatization on
electricity prices in Turkey: has liberalization served the purpose? Energy Policy
63 (0),614–621.
Kataria, S., & Saini, V. (2019). The mediating impact of customer satisfaction in
relation of brand equity and brand loyalty. South Asian Journal of Business Studies.
Khalifa, A. S. (2009). Drawing on students' evaluation to draw a strategy canvas
for a business school. International Journal of Educational Management.
Khaligh, A. A., Haghighi, M., Nazari, M., & Hosseini, H. K. (2020). An
Exploratory Model of Competitive Advantage through Dynamic Capabilities
105
and Differentiation Approach for Knowledge-Based Companies. Research
Square. DOI: 10.21203/rs.3.rs-42614/v1.
Kim, W. C., & Mauborgne, R. (2005). Blue Ocean Strategy: From Theory to
Practice. California Management Review, 47(3): 105–121.
Kim, W. C., & Mauborgne, R. (2004). Value innovation. Harvard business
review, 82(7/8), 172-180.
King, S. F., & Burgess, T. F. (2008). Understanding success and failure in customer
relationship management. Industrial Marketing Management, 37(4), 421-431.
Kotha, S., & Vadlamani, B. L. (1995). Assessing generic strategies: an empirical
investigation of two competing typologies in discrete manufacturing
industries. Strategic Management Journal, 16(1), 75-83.
Kotler, P., & Keller, L. K. (2012). Marketing Management. 14e. Global ed
Knott, A. M. (2003). The organizational routines factor market paradox. Strategic
Management Journal, 24(10), 929–43.
Kourdi, J. (2007). Business Strategy. Zagreb: Masmedia.
Kuleshov, D., Viljainen, S., Annala, S., & Gore, O., (2012). Russian electricity
sector reform: challenges to retail competition. Util. Pol. 23 (0), 40–49.
Ladhari, R. (2008). Alternative measures of service quality: a review. Managing
Service Quality: An International Journal.
Lee, J. L., Kim, Y., & Won, J. (2018). Sports brand positioning: Positioning
congruence and consumer perceptions toward brands. International Journal of
Sports Marketing and Sponsorship.
Li, J. J., & Zhou, K. Z. (2010). How foreign firms achieve competitive advantage
in the chinese emerging economy: managerial ties and market orientation. Journal
Business of Research, 63(8), 856–862.
Li, X. (2020). In the Road Map of China's Steel Industry. Springer, Singapore.
Liljander, V., & Strandvik, T. (1997). Emotions in service satisfaction. International
Journal of service industry management.

106
Lorenzo, J. R. F., Rubio, M. T. M. and Garcés, S. A. (2018) ‘The competitive
advantage in business, capabilities and strategy. What general performance
factors are found in the Spanish wine industry?’, Wine Economics and Policy, 7
(2), pp.94–108.
Lovelock, C. H. (1996). Services marketing (2nd ed.). Upper Saddle River, NJ:
Prentice Hall.
Maradin, D. (2021) Restructuring of Electric Power Sector: The Transition from
Monopoly to Competitive Market Conditions. Journal of Economics, Finance and
Management Studies, 4(01), 35-40.
McAlexander, J., Becker, B. and Kaldenberg, D. (1993). “Positioning health care
services: Yellow Pages advertising and dental practice performance”, Journal of
Health Care Marketing, Vol. 13 No. 1, pp. 54-57.
Miles, P. C. (2013) ‘Competitive strategy: the link between service characteristics
and customer satisfaction’, International Journal of Quality and Service Sciences, 5(4),
pp.395–414.
Mithas, S., Krishnan, M. S., & Fornell, C. (2005). Why do customer relationship
management applications affect customer satisfaction?. Journal of
Marketing, 69(4), 201-209.
Muradov, A. J., Hasanli, Y. H., & Hajiyev, N. O. (2019). The Assesment of Impact
of Competitiveness to Economic Development. Economic and Social Development:
Book of Proceedings, 1170-1177.
Murray, A. I. (1988). A contingency view of Porter's “generic strategies”. Academy
of management review, 13(3), 390-400.
Mussa, M., & Rosen, S. (1978). Monopoly and product quality. Journal of Economic
theory, 18(2), 301-317.
Nasution, H. N., & Mavondo, F. T. (2008). Organisational capabilities:
antecedents and implications for customer value. European Journal of Marketing.

107
Nayyar, P. R. (1993). On the measurement of competitive strategy: evidence from
a large multiproduct U.S. firm. Academy of Management Journal, 36(6), 652–1669.
Oliver, C. (1997). Sustainable competitive advantage: combining institutional and
resource‐based views. Strategic management journal, 18(9), 697-713.
Otto, A.S., Szymanski, D.M. and Varadarajan, R. (2019), “Customer satisfaction
and firm performance: insights from over a quarter century of empirical
research”, Journal of the Academy of Marketing Science, Vol. 48 No. 3, doi:
10.1007/s11747-019-00657-7.
Ovadia, S. (2004). Ratings and rankings: Reconsidering the structure of values
and their measurement. International Journal of Social Research Methodology, 7(5),
403-414.
Palmatier, R. W., Gopalakrishna, S., & Houston, M. B. (2006). Returns on
business-to-business relationship marketing investments: strategies for
leveraging profits. Marketing Science, 25(5), 477–493.
Pan Y, Sheng S and Xie FT (2012) Antecedents of customer loyalty: An empirical
synthesis and reexamination. Journal of Retailing and Consumer Services 19(1): 150–
158.
Panzar, J. C., & Willig, R. D. (1977). Free entry and the sustainability of natural
monopoly. The Bell Journal of Economics, 1-22.
Parasuraman, A., Zeithaml, V. A., & Berry, L. L. (1988). Servqual – a multiple-
item scale for measuring consumer perceptions of service quality. Journal of
Retailing, 64(1), 12–40.
Payne, A., & Frow, P. (2005). Strategic framework for customer relationship
management. Journal of Marketing, 69(4), 167– 176.
Peppers, D., & Rogers, M. (2004). Managing customer relationships. A strategic
framework. New Jersey: John Wiley & Sons (516 pp.).
108
Pérez, P. B., González-Cruz, M. C., & Pastor-Ferrando, J. P. (2010). Analysis of
construction projects by means of value curves. International Journal of Project
Management, 28(7), 719-731.
Pham, M. and Muthukrishnan, A. (2002). “Search and alignment in judgment
revision: implications for brand positioning”, Journal of Marketing Research, Vol.
39 No. 1, pp. 18-30.
Phillips, R. (2020). Price Differentiation. In Pricing and Revenue Optimization (pp. 74-
98). Stanford University Press.
Platt, S., (2012). The True Cost of Energy. Institute for Public Policy Research.
Porter, M. E. (1980). Competitive strategy. New York: Free.
Porter, M. (1985), Competitive Advantage, Free Press, New York.
Porter, M. E. (1998). Competitive Advantage: Creating and Sustaining Superior
Performance (1 edition). New York: Free Press.
Porter, M. E. (1996), “What is strategy?”, Harvard Business Review, Vol. 44 No. 6,
pp. 61-78.
Rafiki, A., Hidayat, S. E., & Razzaq, D. A. A. (2019). CRM and organizational
performance. International Journal of Organizational Analysis.
Raimundo, R., & Domingues, N. (2021). The Model of the Five Competitive
Forces on Portuguese Electricity Market. Modern Economy, 12(01), 140.
Ramaseshan, B., Bejou, D., Jain, S. C., Mason, C., & Pancras, J. (2006). Issues and
perspectives in global customer relationship management. Journal of Service
Research, 9(2), 195–207.
Rantala, T., Ukko, J., Saunila, M., Puolakoski, H., & Rantanen, H. (2019). Creating
sustainable customer value through digitality. World Journal of Entrepreneurship,
Management and Sustainable Development.
Rappaport, A. (1981). Selecting strategies that create shareholder value. Harvard
Business Review, 59(3).
109
Rathore, A. K., Shioramwar, S., & Ilavarasan, P. V. (2016, September). Social
customer relationship management as predictor of customer relationship
performance: an empirical study of b2b and b2c companies. In Conference on e-
Business, e-Services and e-Society (pp. 173-182). Springer, Cham.
Reichheld, F. F. (1996). Learning from customer defections. Harvard Business
Review, 74(2), 56–69.
Reichheld, F. F., & Sasser, W. E., Jr. (1990). Zero defections: quality comes to
services. Harvard Business Review, 68(5), 105–111.
Reimann, M., Schilke, O., & Thomas, J. S. (2010). Customer relationship
management and firm performance: the mediating role of business
strategy. Journal of the academy of marketing science, 38(3), 326-346.
Revilla, M., & Couper, M. P. (2018). Comparing grids with vertical and horizontal
item-by-item formats for PCs and smartphones. Social Science Computer
Review, 36(3), 349-368.
Richards, K. A., & Jones, E. (2008). Customer relationship management: finding
value drivers. Industrial Marketing Management, 37(2), 120–130.
Roth, M. S. (1992). Depth versus breadth strategies for global brand image
management. Journal of Advertising, 21(2), 25-36.
Ruiz, D. M., Gremler, D. D., Washburn, J. H., & Carrión, G. C. (2008). Service
value revisited: Specifying a higher-order, formative measure. Journal of Business
Research, 61(12), 1278-1291.
Sanchez, R., Heene, A., & Thomas, H. (1996). Dynamics of competence-based
competition: theory and practice in the new strategic management. Oxford: Pergamon.
Santouridis, I., & Veraki, A. (2017). Customer relationship management and
customersatisfaction: The mediating role of relationship quality. Total Quality
Management and Business Excellence, 28(9–10), 1122–1132.
Sawhney, M., & Zabin, J. (2002). Managing and measuring relational equity in
the network economy. Journal of the Academy of Marketing Science, 30(4), 313–332.
110
Schilke, O., Reimann, M., & Thomas, J. S. (2009). When does international
marketing standardization matter to firm performance?. Journal of International
Marketing, 17(4), 24-46.
Shafiq, M., Tasmin, R., Takala, J., Qureshi, M. I., & Rashid, M. (2017). Relationship
of blue ocean strategy and innovation performance, an empirical study. City
University Research Journal Special Issue: AIC, Malaysia, 74-80.
Shams, S. R. (2017). Transnational education and total quality management: a
stakeholder-centred model. Journal of Management Development.
Sheehan, N. T., & Bruni-bossio, V. (2015). Strategic value curve analysis:
Diagnosing and improving customer value propositions. Business Horizons, 58(3):
317–324.
Shemwell, D. J., Yavas, U., & Bilgin, Z. (1998). Customer‐service provider
relationships: an empirical test of a model of service quality, satisfaction and
relationship‐oriented outcomes. International journal of service industry
management.
Siu NY-M, Zhang TJ-F, Dong P, et al. (2013) New service bonds and customer
value in customer relationship management: The case of museum visitors.
Tourism Management 36: 293–303.
Smith, D. C., & Park, C. W. (1992). The effects of brand extensions on market
share and advertising efficiency. Journal of Marketing Research, 29(3), 296–313.
Smith, R.F. and Wright, W.F. (2004), “Determinants of customer loyalty and
financial performance”, Journal of Management Accounting Research, Vol. 16 No. 1,
pp. 183-205, doi: 10.2308/ jmar.2004.16.1.183.
Sozuer, S., Carpenter, G. S., Kopalle, P. K., McAlister, L. M., & Lehmann, D. R.
(2020). The past, present, and future of marketing strategy. Marketing
Letters, 31(2), 163-174.
Spreng, R. A., & Olshavsky, R. W. (1993). A desires congruency model of
consumer satisfaction. Journal of the Academy of Marketing Science, 21(3), 169-177.
111
Steenkamp, J. B. E., Van Trijp, H. C., & Berge, J. M. T. (1994). Perceptual mapping
based on idiosyncratic sets of attributes. Journal of Marketing Research, 31(1), 15-
27.
Steenkamp, J. B. E. M., & Geyskens, I. (2006). How country characteristics affect
the perceived value of a website. Journal of Marketing, 70(3), 136–150.
Stillwell, W. G., Seaver, D. A., & Edwards, W. (1981). A comparison of weight
approximation techniques in multiattribute utility decision
making. Organizational behavior and human performance, 28(1), 62-77.
Sun, K. A. and Lee, S. (2019) ‘Competitive advantages of franchising industrial
organizations and the moderating role of organizational characteristics:
Evidence from the restaurant industry’, International Journal of Hospitality
Management, 77 (October 2017), pp.281–289.
Sweeney, J. C., and Soutar, G. N. (2001). Consumer perceived value: The
development of a multiple item scale. Journal of retailing, 77(2), 203-220.
Szymanski, D. M., Bharadwaj, S. G., & Varadarajan, P. R. (1993). An analysis of
the market share-profitability relationship. Journal of marketing, 57(3), 1-18.
Tulloch, D. J., Diaz-Rainey, I., & Premachandra, I. M. (2018). The impact of
regulatory change on EU energy utility returns: the three liberalization
packages. Applied Economics, 50(9), 957-972.
Ulaga, W., & Chacour, S. (2001). Measuring customer-perceived value in business
markets: a prerequisite for marketing strategy development and
implementation. Industrial marketing management, 30(6), 525-540.
Vargo, S. L., & Lusch, R. F. 2004. Evolving to a New Dominant Logic for
Marketing. Journal of Marketing, 68(1): 1–17.
Vieira, E. R. M., & Ferreira, J. J. (2018). Strategic framework of fitness clubs based
on quality dimensions: the blue ocean strategy approach. Total Quality
Management & Business Excellence, 29(13-14), 1648-1667.

112
Vorhies, D. W., & Morgan, N. A. (2005). Benchmarking marketing capabilities for
sustainable competitive advantage. Journal of Marketing, 69(1), 80–94.
Wieringa, J. E., & Verhoef, P. C. (2007). Understanding customer switching
behavior in a liberalizing service market: an exploratory study. Journal of Service
Research, 10(2), 174-186.
Woodruff, R. B. 1997. Customer value: The next source for competitive
advantage. Journal of the Academy of Marketing Science, 25(2): 139–153.
Yang, F., & Zhang, H. (2018). The impact of customer orientation on new product
development performance. International Journal of Productivity and Performance
Management.
Ziggers, G. W., & Henseler, J. (2016). The reinforcing effect of a firm's customer
orientation and supply-base orientation on performance. Industrial marketing
management, 52, 18-26.

113
Appendix
Appendix 1. Images of the survey applied to business customers (English
version)
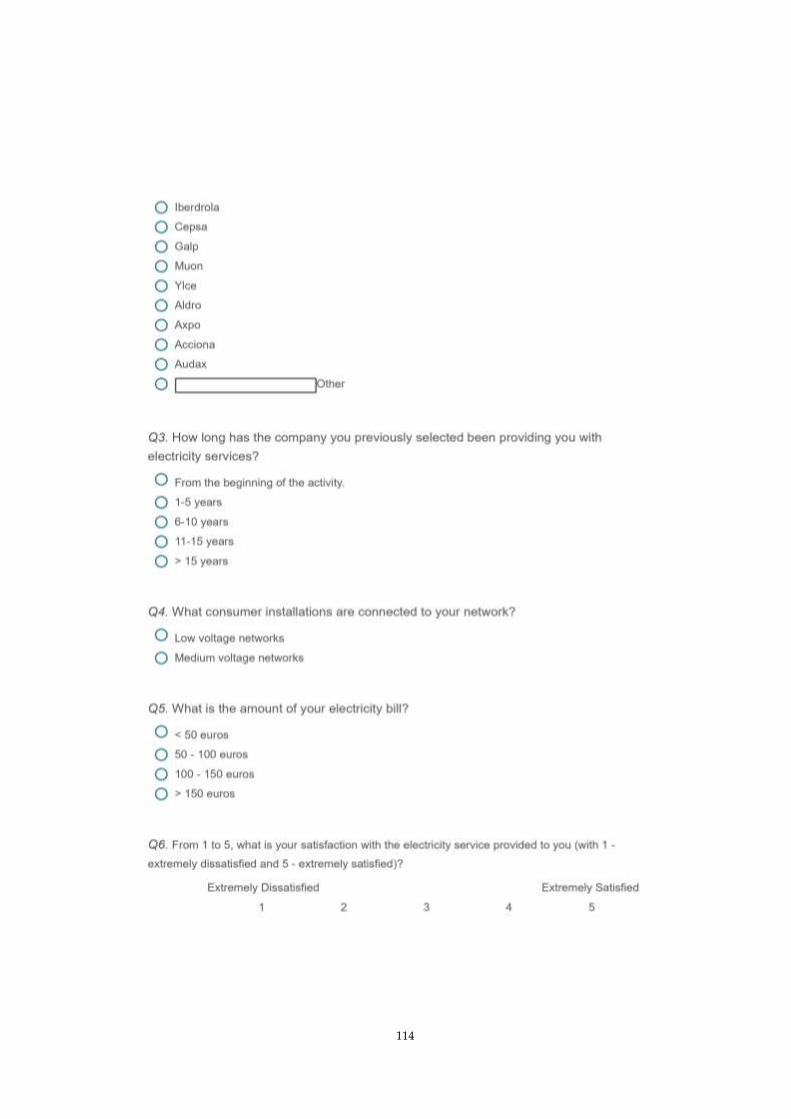
114

115
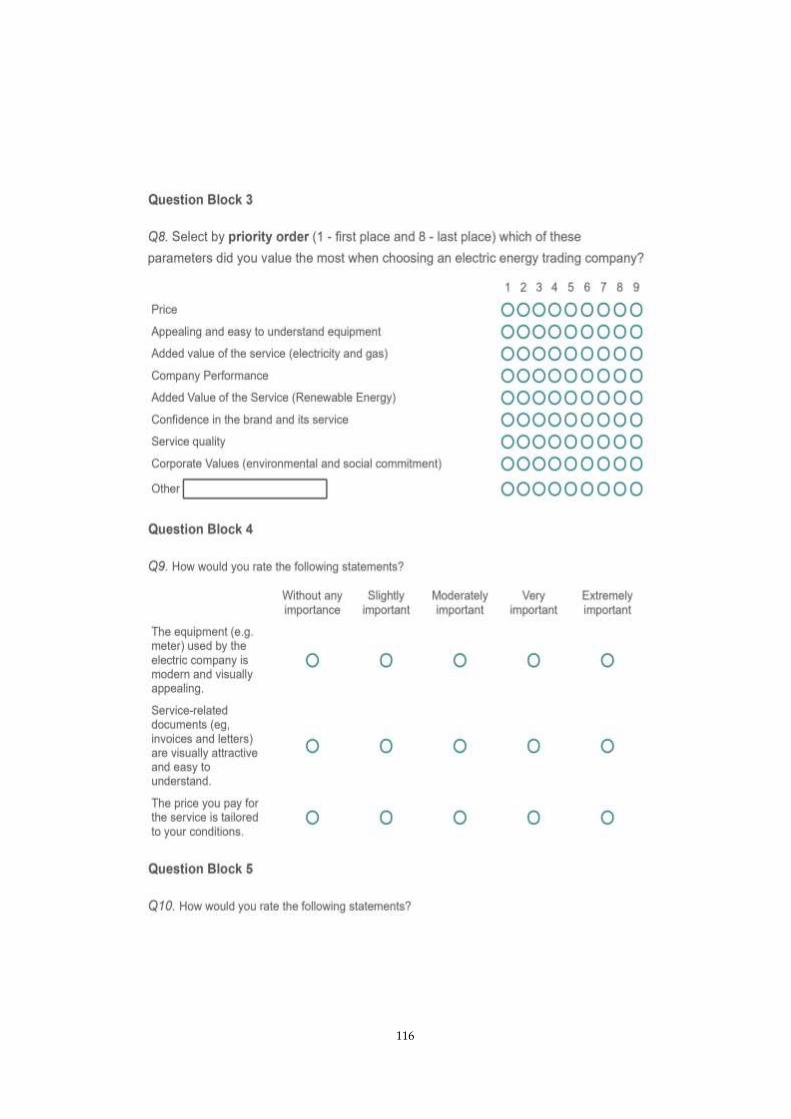
116
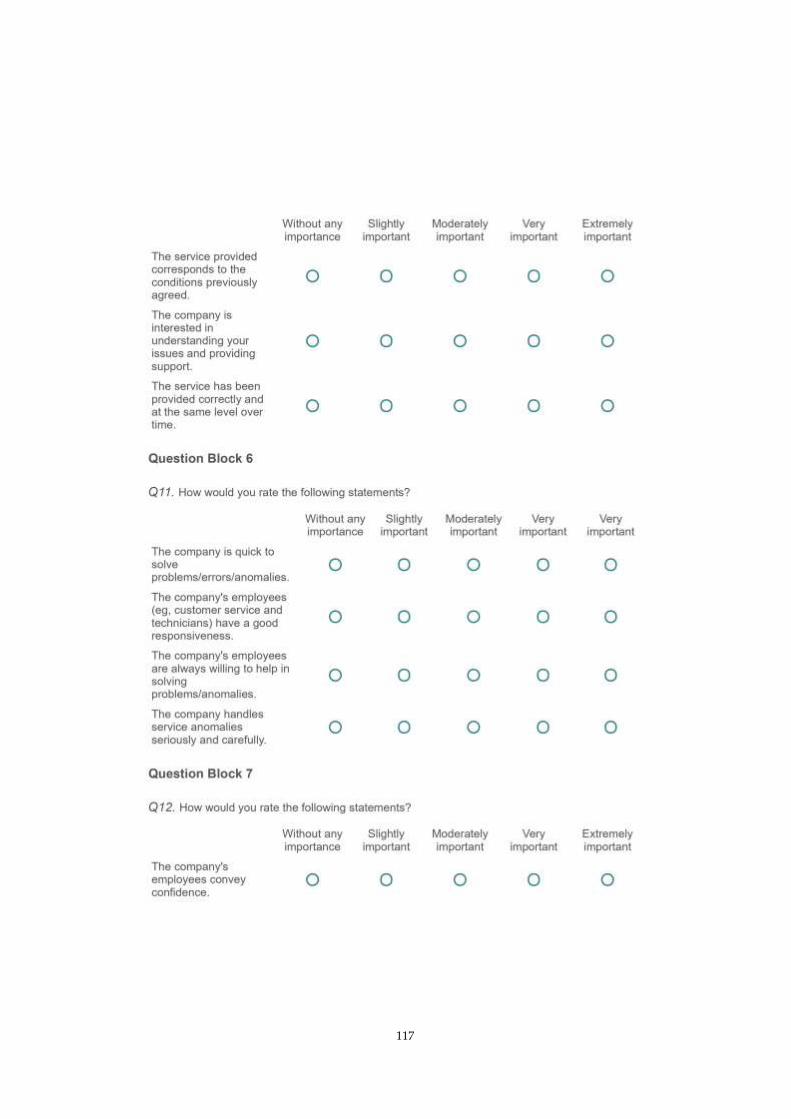
117

118
Appendix 2. Example of a question validation
Questions Validation
Q8
Validated by the authors Patrick Hartmann & Vanessa Apaolaza
Ibánez in the article "Managing customer loyalty in liberalized
residential energy markets: The impact of energy branding"
(2006).

119
Appendix 3. Endesa Website
Appendix 4. Endesa's vision and strategy

120
Appendix 5. Iberdrola Website
Appendix 6. Iberdrola’s vision and strategy
121

122
Appendix 7. Galp Website
Appendix 8. Galp’s vision and strategy

123
Related Documents