Project Name Document Name 1 Review of potential for carbon savings from residential energy efficiency Final report for The Committee on Climate Change 18 th December 2013 Element Energy Limited 20 Station Road Cambridge CB1 2JD Tel: 01223 852499 Fax: 01223 353475

Welcome message from author
This document is posted to help you gain knowledge. Please leave a comment to let me know what you think about it! Share it to your friends and learn new things together.
Transcript

Project Name Document Name
1
Review of potential for
carbon savings from
residential energy
efficiency
Final report
for
The Committee on
Climate Change
18th December 2013
Element Energy Limited
20 Station Road
Cambridge CB1 2JD
Tel: 01223 852499
Fax: 01223 353475

Review of Carbon Savings from Residential Energy efficiency
Contents
1 Executive Summary........................................................................................................ 4
1.1 Key Findings .............................................................................................................. 4
1.2 Measure performance and cost effectiveness across the UK stock ......................... 5
2 Introduction ..................................................................................................................... 4
2.1 Overview .................................................................................................................... 4
2.2 Methodology .............................................................................................................. 5
2.3 Measures included in the MACC ............................................................................... 5
3 Methodology for energy modelling ................................................................................. 8
3.1 Overview .................................................................................................................... 8
3.2 HEM stock breakdown .............................................................................................. 8
3.3 SAP calculation ......................................................................................................... 9
3.4 Mapping of energy saving onto the technical potential for measures ....................... 9
3.5 Final UK stock segmentation in MACC model ........................................................ 10
4 Measure performance .................................................................................................. 12
4.1 Overview .................................................................................................................. 12
4.2 Technical specifications of the measures ............................................................... 12
4.3 Energy savings across the stock ............................................................................. 15
5 Technical potential for energy efficiency measures ..................................................... 17
5.1 Overview .................................................................................................................. 17
5.2 Total stock savings .................................................................................................. 31
5.3 Overlapping savings between measures ................................................................ 34
6 In use factors ................................................................................................................ 36
6.1 Overview .................................................................................................................. 36
6.2 Methodology ............................................................................................................ 36
6.3 Measure in use factor breakdown ........................................................................... 37
7 Measure cost ................................................................................................................ 42
7.1 Overview .................................................................................................................. 42
7.2 Measure cost breakdown ........................................................................................ 43
8 The Marginal Abatement Cost Curves (MACC) ........................................................... 53
8.1 MACC methodology ................................................................................................ 53
8.2 The MACC Outputs ................................................................................................. 53

Review of Carbon Savings from Residential Energy efficiency
9 Appendix ....................................................................................................................... 66
9.1 Cavity wall insulation potential ................................................................................ 66
9.2 Fuel cost and CO2 content ...................................................................................... 73
9.3 Weighted average installation costs, lifetime fuel (£) and emission savings (t CO2)74
Authors
For comments or queries please contact:
Element Energy:
Foaad Tahir
0330 1190988
Ian Walker
0330 1190981
Energy Saving Trust:
Will Rivers
020 7222 0101

Review of Carbon Savings from Residential Energy efficiency
4
1 Executive Summary
Increasing the energy efficiency of the building stock is an important component of the shift
toward a more sustainable energy system. There is a significant potential for abatement of
CO2 emissions through uptake of energy efficiency measures. These include thermal
insulation measures which reduce the heating demand, electrical appliances that reduce
the electricity consumption and replacement of existing heating and lighting equipment
with more efficient technology, often driven by regulations. As well as reducing the level of
aggregate emissions, energy efficiency measures can reduce the cost of energy,
potentially offsetting any increases required to reduce the carbon intensity of fuel supply.
Efficiency measures are often amongst the most cost effective means of carbon reduction.
This study aims to review and update the evidence base on the remaining technical
potential for the installation of energy efficiency measures, based on the previous
Committee on Climate Change (CCC) work issued in 2011. The energy savings achieved
from these measures have been calculated for a range of UK house types using the
Standard Assessment Procedure (SAP) calculation methodology for domestic sector. The
revised potential and energy savings across the stock are used to generate the marginal
abatement cost curves for all measures.
1.1 Key Findings
1.1.1 Technical potential for emission savings
The remaining technical potential in 2013 and the energy savings attributed to each
measure result in a total potential for annual emission savings of around 49Mt (without the
inclusion of in use factors). These savings take into account any potential overlap between
the impact of measures when applied together e.g. boiler replacement reduces the
potential for savings from other thermal fabric measures. It should be noted that these
savings do not take into account uptake of low carbon heating technologies such as heat
pumps (HP) and combined heat and power (CHP) systems, i.e. these savings are not
additional to the emission reduction from a shift of heating technology towards HP and
CHP. With a significant uptake of low carbon heating solutions, the potential for additional
savings from energy efficiency measures is further reduced.
The technical potential for measures in this analysis takes account of ‘in-use’ factors which
are designed to reflect recent evidence on the shortfall of real life savings achieved by
measures compared to modelled values. In general, the ‘in use’ factors that are provided
by DECC for Green Deal calculations have been used. It should be noted that there is a
lack of evidence regarding the in use performance of a wide range of measures and
further evidence will be required before it is possible to assess whether the DECC in-use
factors applied here accurately reflect the difference between real energy savings and
theoretical calculations or whether they are too conservative.
1.1.2 Revisions to cost effectiveness of measures
The revised MACC outputs also show some significant changes to the cost effectiveness
(£/tCO2) relative to the previous CCC MACC model. The most notable difference is for
solid wall insulation (SWI), which has a cost effectiveness of £79/t and £361/t for internal
and external insulation respectively compared to £9/t in the previous MACC model. This is
due to a higher cost of installation and lower energy savings from an overall improvement
in stock boiler efficiency. The cost for SWI in the previous MACC model were £6200,
however the revised cost evidence shows that these costs vary between £8,500 - £12,000
Review of Carbon Savings from Residential Energy efficiency
5
and £4,000 - £10,500 for external and internal SWI respectively. The energy savings from
SWI were previously identified as 9,440kWh /year however with the revised modelling
across UK stock, taking into account improved boiler efficiencies, results in weighted
average savings of 6,700kWh /year and 6,000kWh /year for external and internal SWI
respectively. Costs data in this analysis is based on current market prices where available
As such, these prices generally do not take into account potential cost reductions from
bulk installations, cost reductions over time etc.
1.1.3 Cost effective measures with good potential for emissions
savings
The major cost effective energy efficiency measures include cavity wall insulation (CWI,
easy to treat and hard to treat with cavity insulation) and loft insulation (easy to treat
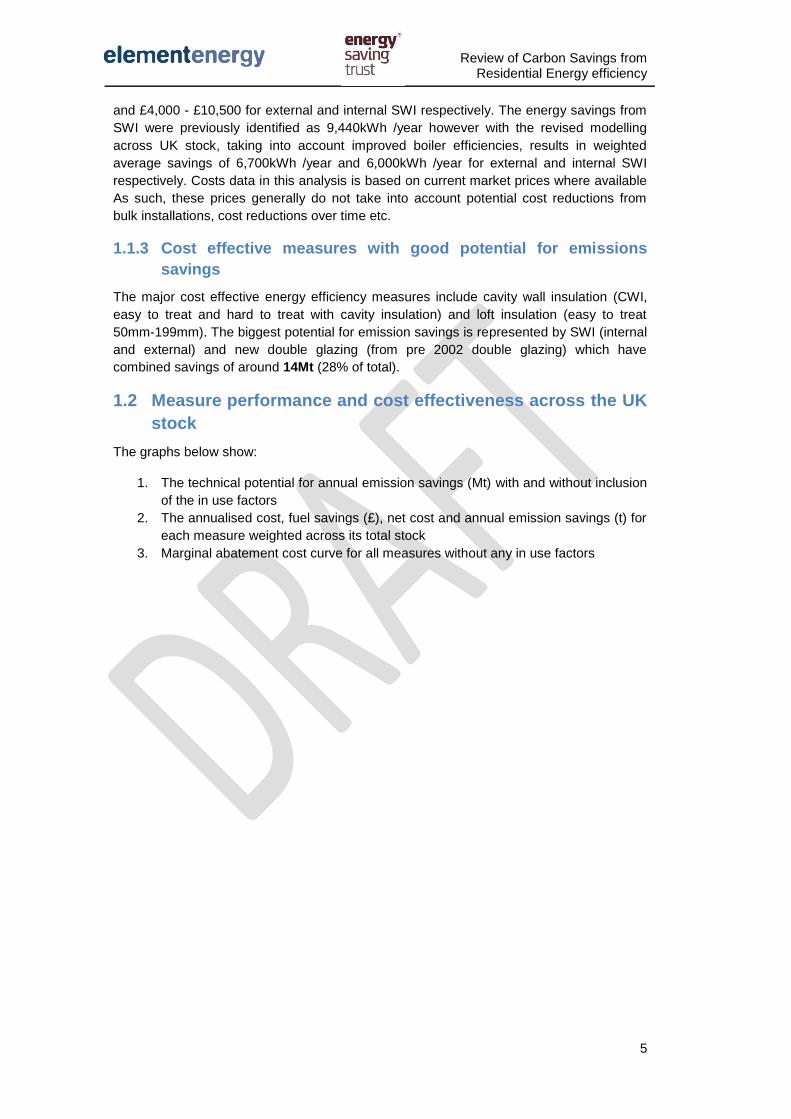
50mm-199mm). The biggest potential for emission savings is represented by SWI (internal
and external) and new double glazing (from pre 2002 double glazing) which have
combined savings of around 14Mt (28% of total).
1.2 Measure performance and cost effectiveness across the UK
stock
The graphs below show:
1. The technical potential for annual emission savings (Mt) with and without inclusion
of the in use factors
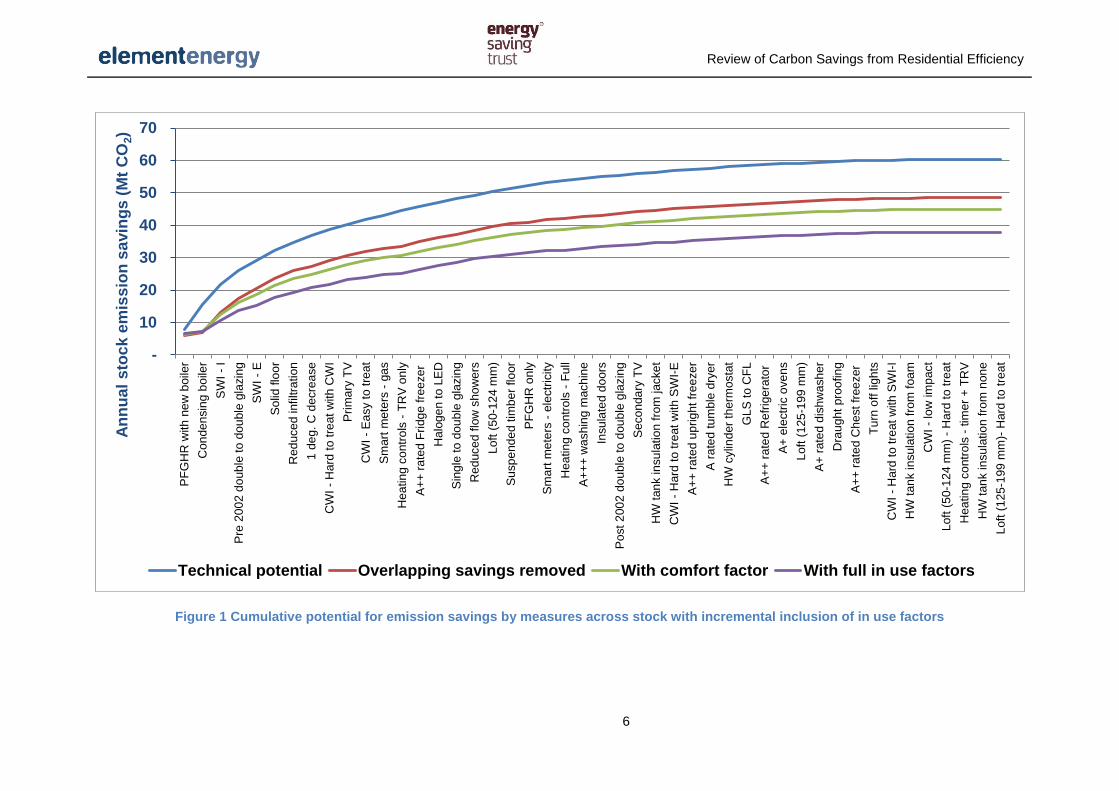
2. The annualised cost, fuel savings (£), net cost and annual emission savings (t) for
each measure weighted across its total stock
3. Marginal abatement cost curve for all measures without any in use factors
Review of Carbon Savings from Residential Efficiency
6
Figure 1 Cumulative potential for emission savings by measures across stock with incremental inclusion of in use factors
-
10
20
30
40
50
60
70
PF
GH
R w
ith
ne
w b
oile
r
Con
de
nsin
g b
oile
r
SW
I -
I
Pre
20
02 d
oub
le t
o d
ou
ble
gla
zin
g
SW
I -
E
So
lid flo
or
Red
uce
d infiltra
tion
1 d
eg
. C
de
cre
ase
CW
I -
Hard
to t
reat
with C
WI
Pri
ma
ry T
V
CW
I -
Ea
sy t
o tre
at
Sm
art
me
ters
- g
as
Hea
tin
g c
ontr
ols
- T
RV
on
ly
A+
+ r
ate
d F
ridg
e fre
eze
r
Halo
ge
n t
o L
ED
Sin
gle
to
do
ub
le g
lazin
g
Red
uce
d f
low
sho
wers
Loft
(5
0-1
24 m
m)
Su
sp
end
ed
tim
be
r flo
or
PF
GH
R o
nly
Sm
art
me
ters
- e
lectr
icity
Hea
tin
g c
ontr
ols
- F
ull
A+
++
wa
shin
g m
ach
ine
Insu
late
d d
oors
Po
st
200
2 d
ou
ble
to
dou
ble
gla
zin
g
Se
co
nda
ry T
V
HW
tan
k in
su
latio
n f
rom
jacke
t
CW
I -
Hard
to t
reat
with S
WI-
E
A+
+ r
ate
d u
prig
ht fr
ee
ze
r
A r
ate
d tu
mble
dry
er
HW
cylin
der
therm
osta
t
GL
S t
o C
FL
A+
+ r
ate
d R
efr
ige
rato
r
A+
ele
ctr
ic o
ve
ns
Loft
(1
25
-199
mm
)
A+
rate
d d
ish
wash
er
Dra
ugh
t pro
ofin
g
A+
+ r
ate
d C
he
st
free
zer
Tu
rn o
ff lig
hts
CW
I -
Hard
to t
reat
with S
WI-
I
HW
tan
k in
su
latio
n f
rom
foa
m
CW
I -
low
im
pact
Loft
(5
0-1
24 m
m)
- H
ard
to
tre
at
Hea
tin
g c
ontr
ols
- tim
er
+ T
RV
HW
tan
k in
su
latio
n f
rom
non
e
Loft
(1
25
-199
mm
)- H
ard
to
tre
at
An
nu
al
sto
ck
em
iss
ion
sa
vin
gs
(M
t C
O2)
Technical potential Overlapping savings removed With comfort factor With full in use factors
Review of Carbon Savings from Residential Efficiency
7
Figure 2 Breakdown of weighted average annualised cost, annual fuel (£) and emission (t CO2) savings by measure (no IUF applied)
(0.50)
-
0.50
1.00
1.50
2.00
-£200
-£100
£0
£100
£200
£300
£400
£500
£600
£700
£800
Ave
rag
e a
nn
ua
l e
mis
sio
n s
avin
gs
(t
CO
2)
Ave
rag
e m
ea
su
re a
nn
uali
se
d c
osts
an
d s
avin
gs
(£)
Annualised cost per installation (£) Annual fuel savings (£) Net annual cost Annual emission savings (t CO2)

Review of Carbon Savings from Residential Efficiency
1
Figure 3 MACC based on total potential without in use factors (overlapping savings removed)
Review of Carbon Savings from Residential Efficiency
2
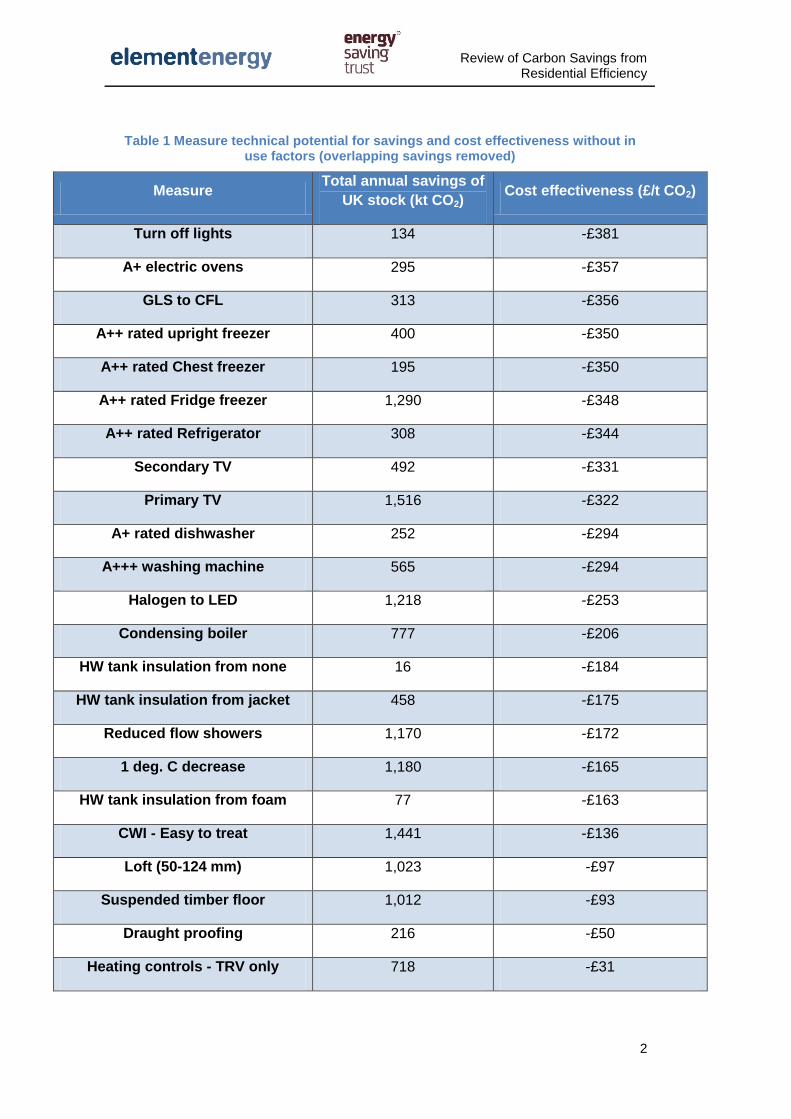
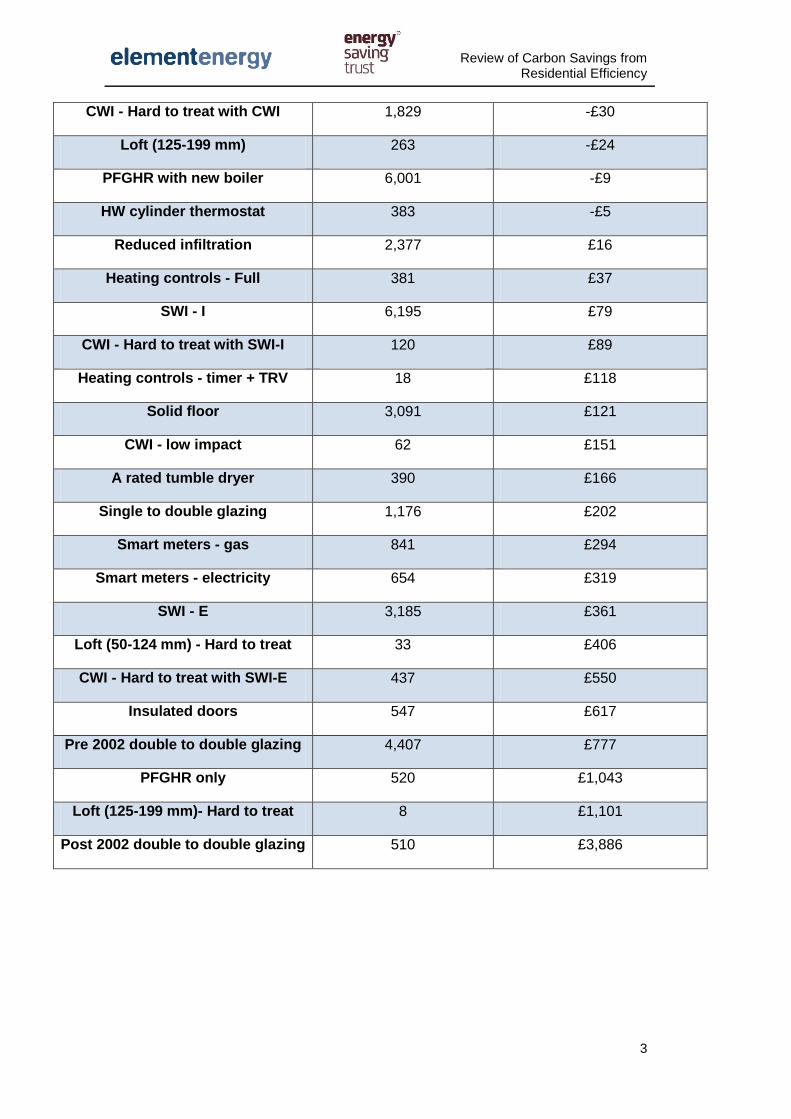
Table 1 Measure technical potential for savings and cost effectiveness without in use factors (overlapping savings removed)
Measure Total annual savings of
UK stock (kt CO2) Cost effectiveness (£/t CO2)
Turn off lights 134 -£381
A+ electric ovens 295 -£357
GLS to CFL 313 -£356
A++ rated upright freezer 400 -£350
A++ rated Chest freezer 195 -£350
A++ rated Fridge freezer 1,290 -£348
A++ rated Refrigerator 308 -£344
Secondary TV 492 -£331
Primary TV 1,516 -£322
A+ rated dishwasher 252 -£294
A+++ washing machine 565 -£294
Halogen to LED 1,218 -£253
Condensing boiler 777 -£206
HW tank insulation from none 16 -£184
HW tank insulation from jacket 458 -£175
Reduced flow showers 1,170 -£172
1 deg. C decrease 1,180 -£165
HW tank insulation from foam 77 -£163
CWI - Easy to treat 1,441 -£136
Loft (50-124 mm) 1,023 -£97
Suspended timber floor 1,012 -£93
Draught proofing 216 -£50
Heating controls - TRV only 718 -£31
Review of Carbon Savings from Residential Efficiency
3
CWI - Hard to treat with CWI 1,829 -£30
Loft (125-199 mm) 263 -£24
PFGHR with new boiler 6,001 -£9
HW cylinder thermostat 383 -£5
Reduced infiltration 2,377 £16
Heating controls - Full 381 £37
SWI - I 6,195 £79
CWI - Hard to treat with SWI-I 120 £89
Heating controls - timer + TRV 18 £118
Solid floor 3,091 £121
CWI - low impact 62 £151
A rated tumble dryer 390 £166
Single to double glazing 1,176 £202
Smart meters - gas 841 £294
Smart meters - electricity 654 £319
SWI - E 3,185 £361
Loft (50-124 mm) - Hard to treat 33 £406
CWI - Hard to treat with SWI-E 437 £550
Insulated doors 547 £617
Pre 2002 double to double glazing 4,407 £777
PFGHR only 520 £1,043
Loft (125-199 mm)- Hard to treat 8 £1,101
Post 2002 double to double glazing 510 £3,886
Review of Carbon Savings from Residential Efficiency
4
2 Introduction
2.1 Overview
In light of recent evidence on the variation in the installation costs of energy efficiency
measures and the actual (rather than modelled) performance of measures the Committee
on Climate Change (CCC) wishes to update its earlier work on Marginal Abatement Cost
Curves (MACCs) for the residential energy sector. The steps involved in generating the
revised MACCs presented in this study were as follows:
1. Review of the technical potential (total installations) for deployment
2. Review of the energy and carbon savings (i.e. technical) potential, noting the issue
of overstating savings
3. Updating measure installation costs
4. Calculation of the cost effectiveness (£/t CO2) of each measure to generate MACC
outputs
The report is structured into the following sections:
Methodology for energy modelling
This section provides details around the energy calculation methodology (SAP) and the
segmentation of the UK housing stock that has been applied in order to derive the detailed
breakdown of energy savings delivered by the installation of each measure across
different house types.
Measure performance
This section provides details on the performance improvement delivered by the installation
of each of the measures.
Technical potential for energy efficiency measures
This section provides details on the remaining potential for application of each of the
measures and how this potential is distributed across the UK housing stock.
In use factors
This section looks at the recent evidence on the underperformance of the measures i.e.
the discrepancy between the observed energy savings and those predicted by energy
modelling. These reduced savings are a result of consumer behaviour (e.g. comfort-
taking), quality of installation and the assumptions around the specification before the
installation of the measure.
Measure cost
This section provides a detailed breakdown of the cost of installation of the measures. The
cost consists of a fixed and variable component.
The Marginal Abatement Cost Curves (MACC)
This section combines the cost and performance data for each measure to calculate its
cost effectiveness (£/t) in delivering emission savings. This allows the MACC to be
generated with and without the inclusion of in use factors.
Review of Carbon Savings from Residential Efficiency
5
2.2 Methodology
A comprehensive and updated dataset on the fixed and variable cost of residential energy
efficiency measure installation has been prepared. These costs, along with data on the
attributes of the UK’s domestic building stock (wall areas, loft thickness, windows and door
areas etc.), can be used to assess the cost of installing these measures in individual
house types and the total costs associated with application across the UK housing stock
as a whole. Element Energy’s Housing Energy Model (HEM)1 has been used to calculate
the energy savings associated with these measures when applied to the various house
types within the stock.
The measure installation costs, lifetime fuel and emission savings are then aggregated
across the stock for each measure, enabling a calculation of its cost effectiveness (e.g.
£/tCO2). The cost-effectiveness of the measure and the emissions reduction it can deliver
when applied across the stock can then be used to generate the Marginal Abatement Cost
Curve (MACC).
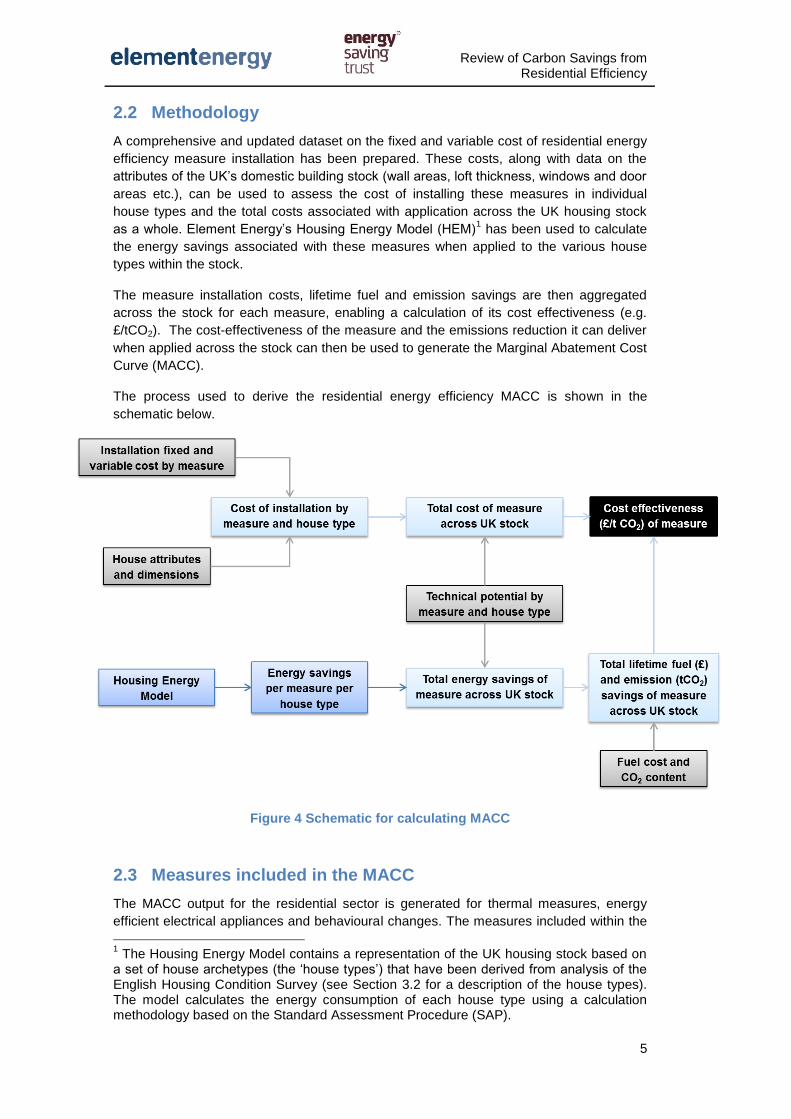
The process used to derive the residential energy efficiency MACC is shown in the
schematic below.
Figure 4 Schematic for calculating MACC
2.3 Measures included in the MACC
The MACC output for the residential sector is generated for thermal measures, energy
efficient electrical appliances and behavioural changes. The measures included within the
1 The Housing Energy Model contains a representation of the UK housing stock based on
a set of house archetypes (the ‘house types’) that have been derived from analysis of the English Housing Condition Survey (see Section 3.2 for a description of the house types). The model calculates the energy consumption of each house type using a calculation methodology based on the Standard Assessment Procedure (SAP).

Review of Carbon Savings from Residential Efficiency
6
MACC were initially selected on the basis of consistency with the previous MACC model
developed by the CCC. The list of measures was further refined, in consultation with the
CCC and on the basis of availability of good quality data on technical availability. The
potential for low carbon heating technologies has not been included in the MACC after
consultation with CCC. It is important to note that there will be some overlap between the
energy and carbon savings included within this MACC with the savings that could be
delivered by the uptake of low carbon heating technologies. The measures covered in the
review are summarised in the table below:
Table 2 List of measures covered in residential sector
Thermal measures Appliances Behavioural changes
Solid wall insulation (SWI) –
internal / external
Incandescent light bulb (GLS)
to compact fluorescent light
(CFL)
1 degree C decrease
Cavity wall insulation (CWI) Halogen to light emitting
diode (LED) Turn off lights
Loft insulation A++ rated chest freezer Smart meters - electricity
Suspended timber floor A++ rated fridge freezer Smart meters - gas
Solid floor A++ rated refrigerator
Double glazing A++ rated upright freezer
Insulated doors A+++ washing machine
Draught proofing A rated tumble dryer
Reduced infiltration A+ rated dishwasher
Condensing boiler A+ electric ovens
Heating controls Primary TV
Hot water cylinder thermostat Secondary TV
Hot water tank insulation Reduced flow showers
Passive flue gas heat recovery
In order to quantify the carbon saving that could be delivered by applying these measures
to the housing stock, the remaining potential for each measure needs to be determined
(i.e. the number of homes that the measure can be applied to). For certain measures, the
level of improvement varies depending on what is present in the house initially. For
example the heating controls measure could involve installation of a complete package of
heating controls (e.g. thermostat, timer control and TRV) or could involve installation of
TRVs only in a home that already has a thermostat and timer control. In these cases the

Review of Carbon Savings from Residential Efficiency
7
remaining potential of the measure has been further sub-divided into the potential for
different levels of upgrade, within the constraints of available data. This is described in
detail in Section 5.

Review of Carbon Savings from Residential Efficiency
8
3 Methodology for energy modelling
3.1 Overview
Element Energy’s Housing Energy Model (HEM) has been used to model the energy
savings from the application of the thermal measures. The HEM contains a representation
of the UK housing stock based on a set of distinct ‘house types’. The definition of the
house types, based on data on the UK housing stock is described below. The HEM
calculates the annual heating (space and hot water) and regulated electricity (lighting, fans
and pumps) demand for each individual house type in the UK stock segmentation using
the SAP calculation methodology.
3.2 HEM stock breakdown
The housing stock within HEM is based on a statistical analysis of the English Housing
Survey (EHS) to accurately represent the wide variety of different homes in Great Britain.
Through a series of trend analyses, the wide variety of variables available in the EHS are
filtered to a small set of parameters, allowing the model to distinguish between different
house types, whilst maintaining enough granularity to examine trends in different tenure /
age / size / heating fuel / wall construction categories.
The final breakdown of the existing GB housing stock used the following distinguishing
parameters:
1. Tenure: Owner occupied, private landlord and social
2. Age: Pre-1919, 1919 to 1980 and post-1980
3. Size: Small (flats), medium (bungalows and terraced housing), large (semi and detached housing)
4. Fuel type: Gas, oil, electric, community heating
5. Wall construction: cavity filled, cavity unfilled and solid walls
6. Level of energy efficiency: ‘Good’ and ‘Poor’
The variables included in the ‘Good’/’Poor’ categorisation are double glazing, heating
controls (including Thermostatic Radiator Valves (TRVs), room thermostats and central
timers) and hot water cylinder insulation thickness. Using an age and tenure
categorisation, the percentage of each category with the energy efficiency measures of
‘Good’ house type is calculated.
Table 3 Distinguishing properties between ‘Good’ and ‘Poor’ homes
‘Good’ homes ‘Poor’ homes
Double glazing Single glazing
Heat controls present No heating controls (5% less efficient boiler)
Foam hot water cylinder insulation Jacket hot water cylinder insulation

Review of Carbon Savings from Residential Efficiency
9
3.3 SAP calculation
The SAP methodology is applied to calculate the annual heating (space and hot water)
and regulated electricity (i.e. without consumer appliances) demand for each individual
house type before and after the application of the measure. This gives the detailed
breakdown of the energy saving delivered by each measure across the stock
segmentation (i.e. the energy saving by measure for each house type that the measure is
applicable to).
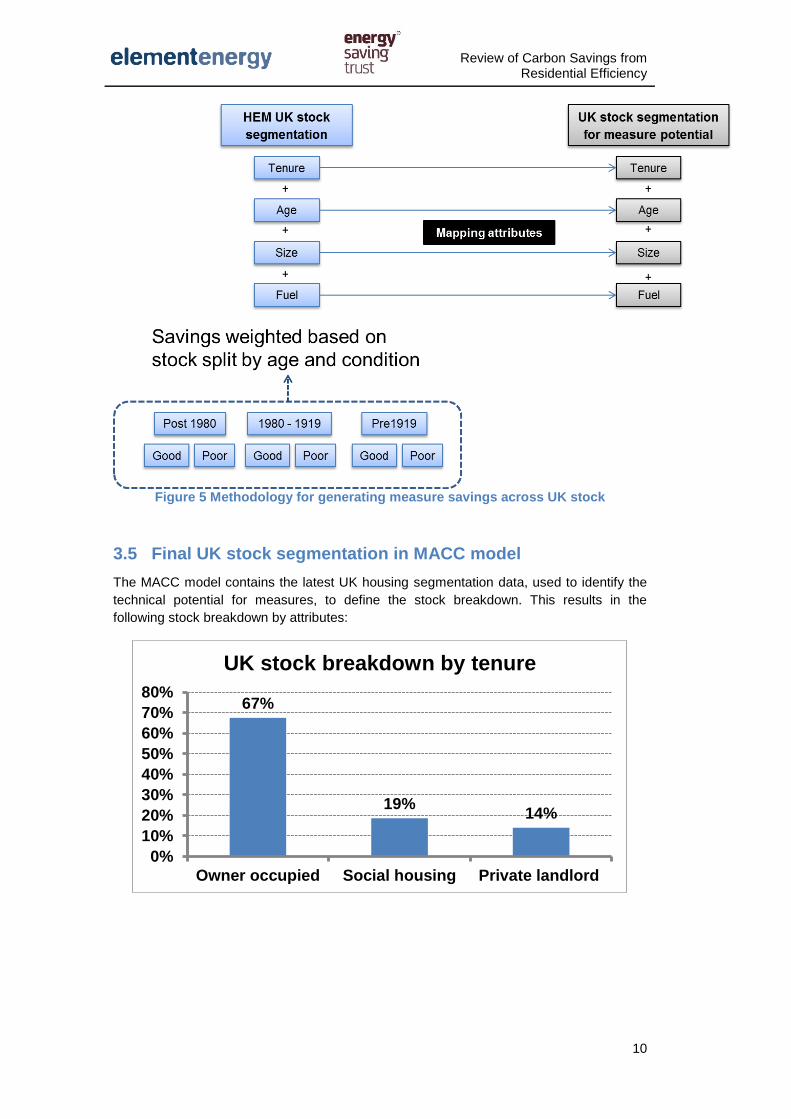
3.4 Mapping of energy saving onto the technical potential for
measures
The technical potential for the installation of each measure is the number of homes that
have potential for the measure to be installed (i.e. excluding homes that have already had
the measure installed or that are not suitable for the measure). The technical potential has
also been disaggregated across a range of house types based on a segmentation of the
UK stock. The stock segmentation used to characterise the potential for installation of
measures consist of 135 individual house types, based on the following parameters:
1. 3 tenure types: owner occupied, private landlord and social housing
2. 3 sizes: small (flats), medium (bungalows and terraced housing), large (semi and
detached housing)
3. 5 fuel types: gas, oil, electric, coal and community heating
4. 3 wall construction types: cavity filled, cavity unfilled and solid walls
This gives a detailed stock segmentation to identify the technical potential of the measures
across UK stock. However, due to availability of data, the stock segmentation used to
describe the technical potential is based on a reduced set of attributes compared to the
more granular stock segmentation used in the HEM. The result of this is that for each
house type in the technical potential stock segmentation, there are multiple house types in
the HEM with matching attributes of tenure, age, size and fuel (but that are further
differentiated by age and good/poor condition). The energy saving associated with each
measure for each house type identified within the HEM has been mapped onto the house
types used for defining the remaining potential by deriving weighted averages across
house types with matching attributes. This results in measure energy savings for each of
the house types with a defined technical potential.
The process of mapping energy savings calculated by the HEM onto the stock
segmentation used to define the technical potential for the application of measures is
illustrated graphically below.
Review of Carbon Savings from Residential Efficiency
10
Figure 5 Methodology for generating measure savings across UK stock
3.5 Final UK stock segmentation in MACC model
The MACC model contains the latest UK housing segmentation data, used to identify the
technical potential for measures, to define the stock breakdown. This results in the
following stock breakdown by attributes:
67%
19% 14%
0%
10%
20%
30%
40%
50%
60%
70%
80%
Owner occupied Social housing Private landlord
UK stock breakdown by tenure

Review of Carbon Savings from Residential Efficiency
11
Figure 6 UK stock segmentation for measure potential
82%
6% 9% 1% 1%
0%
20%
40%
60%
80%
100%
Gas Oil Electricity CWH Coal
UK stock breakdown by fuel
19%
37%
44%
0%
10%
20%
30%
40%
50%
Small Medium Large
UK stock breakdown by size
27%
51%
22%
0%
10%
20%
30%
40%
50%
60%
SWI CWI CWU
UK stock breakdown by wall type

Review of Carbon Savings from Residential Efficiency
12
4 Measure performance
4.1 Overview
In order to calculate the energy savings associated with application of each of the
measures, technical specifications are required for the improvement in the performance of
the relevant components of the house, e.g. the fabric U-values, boiler efficiency etc.. The
technical specification and performance of all thermal and electrical appliance measures
has been updated based on the latest building regulations, data on appliances in the stock
and on the highest energy rated products on the market. These specifications allow the
energy demand before and after the installation of measure to be calculated, resulting in
the calculation of the modelled savings.
4.2 Technical specifications of the measures
The detailed breakdown of the performance of the measures is shown in the table below.
The performance of some of the measures differ based on age, size and loft thickness.
Table 4 Detailed technical specifications of thermal measures and appliances
Measure Parameter Specification
Baseline Measure
SWI internal/external
Post 1980
U value (W/m2K)
0.500 0.300
1919-1980 1.822 0.300
Pre 1919 2.200 0.300
CWI low impact
Post 1980 0.464 0.360
1919-1980 0.464 0.360
Pre 1919 0.464 0.360
CWI high impact
Post 1980 0.508 0.508
1919-1980 1.683 0.547
Pre 1919 2.149 0.556
Loft insulation
0-50 mm 1.70 0.150
51-125 mm 0.434 0.150
126-200 mm 0.270 0.150
Solid / suspended timber
Post 1980 0.45 0.22
1919-1980 (Large) 0.76 0.22
1919-1980 (Medium) 0.53 0.22
1919-1980 (Small) 0.45 0.22
Pre 1919 (Large) 0.68 0.22
Pre 1919 (Medium) 0.52 0.22
Pre 1919 (Small) 0.44 0.22
Double glazing
From single 4.8 1.6
From pre 2002 double 3.1 1.6
From post 2002 double 2 1.6
Insulated doors 3 1.8
Draught proofing Fraction of
windows / doors 0% 100%
Reduced infiltration m3/m
2hr 8-18 7
Condensing boiler Gas
Efficiency 75% 88%
Oil 84% 88%
Heating controls
Thermostat+ timer +TRV Control type / Temperature
variation
1/+0.6C 2/+0.0C
Timer +TRV 1/+0.0C 2/+0.0C
TRV only 1/+0.0C 2/+0.0C
Hot water cylinder thermostat
Large
kWh reduction
500
Medium 590
Small 570

Review of Carbon Savings from Residential Efficiency
13
Hot water cylinder jacket insulation
No insulation
Thickness (mm)
0 80
Jacket insulation 24 80
Foam insulation 15 80
Passive flue gas heat recovery Condensing boiler
Efficiency 88% 91%
Non condensing gas boiler 75% 91%
1 degree decrease Target internal temperature
18C 17C
GLS to CFL Electricity Reduction 83%
Heating Gain 60%
Halogen to LED Electricity Reduction 77%
Heating Gain 55%
Turning off lights Reduction 10%
Smart meter Electricity
Reduction 2.8%
Gas 1.8%
A++ rated Chest freezer
Electricity kWh reduction
/ Heating kWh
gain
178 / 101
A++ rated Fridge freezer 265 / 150
A++ rated Refrigerator 116 / 66
A++ rated upright freezer 182 / 103
A+++ washing machine 70 / 2
A rated tumble dryer 85 / 2
A+ rated dishwasher 67 / 2
A+ electric ovens 66 / 40
Primary TV 220 / 132
Secondary TV 54 / 32
Reduced flow showers 0/-968
The specific data sources used to determine the technical specification of each of the
measures are referenced in the table below.
Table 5 Reference for specification of measures before and after installation
Measure
Reference
Baseline With measure
SWI
Post 1980: Average of ages2 G to
J for top three solid wall
constructions
As in Building Regulations Part L1B
- Existing dwellings (2010)
1919-1980: Average of ages C to
F and half of B for three top solid
wall constructions
Pre 1919: Average of ages A and
B for top three solid wall
constructions
CWI – low impact From In-built 2012 DECC report,
same for all ages
From In-built 2012 DECC report,
same for all ages
CWI – high impact Based on values calibrated from
the initial U-values available in
Weighted average of low cost
(39%) and high cost (61%) high
2 SAP age band: A (pre 1900), B (1900-1929), B (1900-1929), C (1930-1949), D (1950-
1966), E (1967-1975), F (1976-1982), G (1983-1990), H (1991-1995), I (1996-2002), J (2003-2006)
Review of Carbon Savings from Residential Efficiency
14
SAP corresponding to the whole
CWU stock (Post 1980: 0.5; 1919-
1980: 1.467; Pre-1919: 1.85), the
initial U-values for low impact
CWU, and the stock
corresponding to low impact
(18%) and high impact (82%)
cavity walls
impact CWU
Breakdown of low cost high impact
by age is:
Post 1980: Average of ages G, H, I
and J for 'filled cavity'
1919-1980: Average of ages C, D,
E, F and half of age B for 'filled
cavity' row
Pre 1919: Average for age A and
half of age B in the 'filled cavity' row
High cost high impact is derived
from In-build 2012 DECC report,
same for all ages
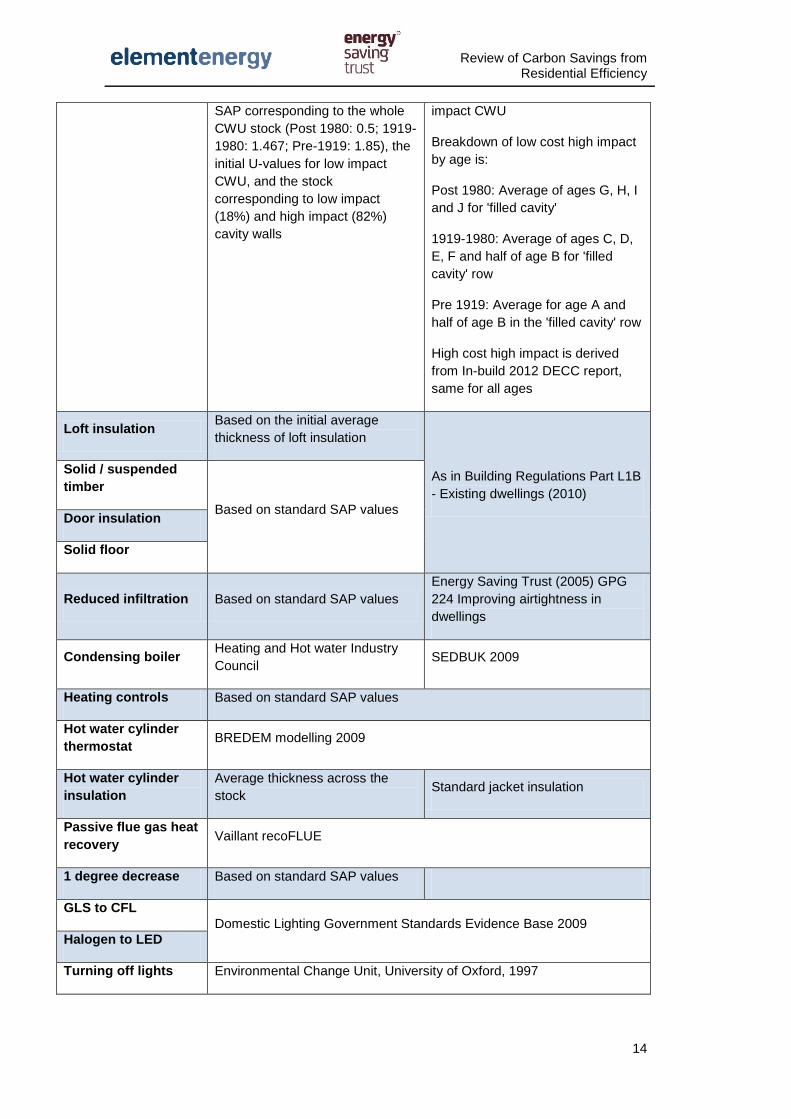
Loft insulation Based on the initial average
thickness of loft insulation
As in Building Regulations Part L1B
- Existing dwellings (2010)
Solid / suspended
timber
Based on standard SAP values Door insulation
Solid floor
Reduced infiltration Based on standard SAP values
Energy Saving Trust (2005) GPG
224 Improving airtightness in
dwellings
Condensing boiler Heating and Hot water Industry
Council SEDBUK 2009
Heating controls Based on standard SAP values
Hot water cylinder
thermostat BREDEM modelling 2009
Hot water cylinder
insulation
Average thickness across the
stock Standard jacket insulation
Passive flue gas heat
recovery Vaillant recoFLUE
1 degree decrease Based on standard SAP values
GLS to CFL
Domestic Lighting Government Standards Evidence Base 2009
Halogen to LED
Turning off lights Environmental Change Unit, University of Oxford, 1997

Review of Carbon Savings from Residential Efficiency
15
Smart meter Smart meter roll-out for the non-domestic sector (GB) – Impact
Assessment, DECC 2012
A++ rated chest
freezer
EU energy label calculations for
appliances by energy band
EU energy label calculations for
A++ rated appliances and heat
replacement effects based on
Defra’s Market Transformation
Programme
A++ rated fridge
freezer
A++ rated
refrigerator
A++ rated upright
freezer
A+++ washing
machine
A rated tumble dryer
A+ rated dishwasher
Primary TV
Secondary TV
Reduced flow
showers Defra (2009) Market Transformation Programme What if tool
4.3 Energy savings across the stock
The HEM provides a calculation of the energy saving associated with each of the thermal
measures that varies across the house types based on their size, tenure and fuel (to
reflect the efficiency of the counterfactual heating system). The savings form the electrical
appliances are based on the EU energy label calculations for appliances by energy band.
In parallel with the reduced electricity consumption, more efficient appliances also result in
an uplift in heating demand (i.e. negative heating fuel savings) due to lower internal gains.
The resulting average savings by measure, weighted based on the stock of different house
types (i.e. total stock energy savings divided by total identified potential), are shown in the
chart below:

Review of Carbon Savings from Residential Efficiency
16
Figure 7 Breakdown of weighted average fossil fuel and electricity savings
-1,000
-
1,000
2,000
3,000
4,000
5,000
6,000
7,000A
nn
ual
en
erg
y s
avin
gs
(kW
h)
Fossil fuel savings (kWh) Electricity savings (kWh)

Review of Carbon Savings from Residential Efficiency
17
5 Technical potential for energy efficiency measures
5.1 Overview
The data on the technical potential for energy efficiency measures in the UK housing stock
was developed by the Energy Saving Trust (EST) by synthesising a variety of existing data
sources as outlined in the methodology statements below. Summary tables are provided at
the UK wide level for each measure type below. For the MACC and trajectory analysis, the
potential for each measure was calculated for each of the 135 housing archetypes
described in Section 3.2.
In calculating the potential for wall type, loft insulation, boiler type, glazing type, heating
controls, energy efficient doors, hot water cylinder thermostat and hot water cylinder
insulation, EST adopted an outline methodology based on that used by DECC in the
calculation of the Quarterly Insulation Potential (QIP) updates3 as illustrated in Figure 5.
This methodology was chosen as it was deemed suitable and would better enable the
CCC to monitor progress reported in the (QIP) against the trajectories over time.
Figure 8 DECC Methodology to calculate measure potential
The English Housing Survey (EHS) 2008, Scottish House Condition Survey (SHCS) 2008
and Living in Wales (LiW) survey 2008 were combined to create a master survey record
file of 21,907 survey records. The 2008 housing surveys were chosen instead of more
recent housing survey data available as:
3 https://www.gov.uk/government/statistical-data-sets/estimates-of-home-insulation-levels-
in-great-britain

Review of Carbon Savings from Residential Efficiency
18
The surveys allow for a consistent dataset across all countries (the most recent
survey for Wales is 2008)
There is good quality data on the level of installation activity Post 2008, therefore
using a 2008 baseline enables more ‘actual’ data to be factored in the data as
opposed to survey records
The Northern Ireland Housing Survey was not available at the address level for inclusion in
the UK survey dataset however summarised results from this study were available from
the Northern Ireland Housing Survey Report 2011. These results were added at a later
stage of the process.
In some cases the different housing surveys contain different categorisations of house
type and measure categories. Where this was the case these were mapped to the nearest
equivalent category to provide a common format. The classifications of the English
Housing Survey were used as that is the largest survey.
Differences to the DECC Quarterly Insulation Potential estimates
Although the methodology described by DECC was followed where possible, it should be
noted that in certain cases this methodology was deemed to be inaccurate or it was not
possible for EST to follow it completely therefore the results do not always mirror DECC’s
estimates of measure potential in the QIP. This difference is notable in the case of the split
between hard to treat and easy to treat cavity walls where the DECC methodology
appears to double count a number of hard to treat cavity wall figures, thereby over-
estimating the number of hard to treat cavity walls at the expense of easy to treat cavity
walls. Details are given in this report where these methods diverge and detailed
description of the differences between the DECC and EST estimates is provided in the
appendix.
5.1.1 Wall Insulation Potential
Figure 5 gives an overview of the methodology used by EST to calculate the current wall
types and insulation levels of the UK housing stock in 2013.
In order to calculate the total stock of the different categories of hard to treat cavity walls,
EST followed the definitions described in the Inbuilt 2012 report on hard to treat cavity
walls which was used as the source of the DECC estimates of hard to treat cavity wall
numbers. This methodology was based on extracting relevant data from the 2008 EHS,
SHCS and Living in Wales Surveys and is described in detail below.
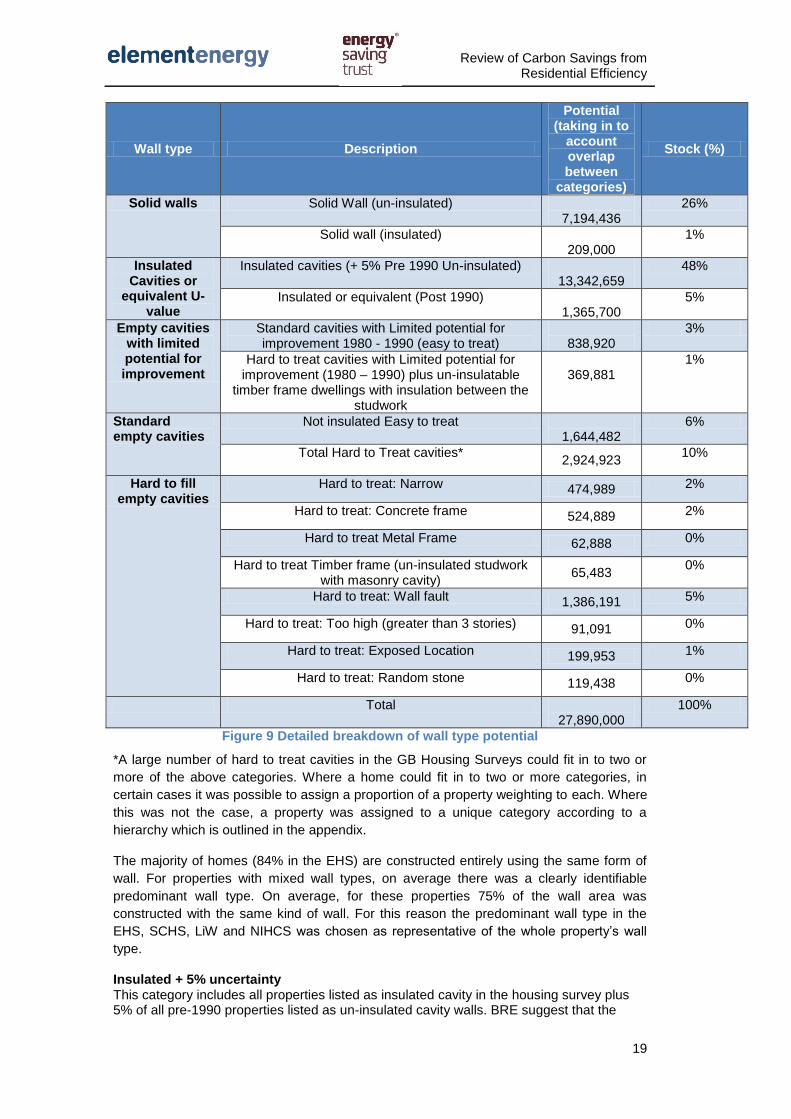
The results of the wall type potentials analysis are provided in the table below:
Review of Carbon Savings from Residential Efficiency
19
Wall type Description
Potential (taking in to
account overlap between
categories)
Stock (%)
Solid walls Solid Wall (un-insulated) 7,194,436
26%
Solid wall (insulated) 209,000
1%
Insulated Cavities or
equivalent U-value
Insulated cavities (+ 5% Pre 1990 Un-insulated) 13,342,659
48%
Insulated or equivalent (Post 1990) 1,365,700
5%
Empty cavities with limited potential for improvement
Standard cavities with Limited potential for improvement 1980 - 1990 (easy to treat)
838,920
3%
Hard to treat cavities with Limited potential for improvement (1980 – 1990) plus un-insulatable
timber frame dwellings with insulation between the studwork
369,881
1%
Standard empty cavities
Not insulated Easy to treat 1,644,482
6%
Total Hard to Treat cavities* 2,924,923
10%
Hard to fill empty cavities
Hard to treat: Narrow 474,989 2%
Hard to treat: Concrete frame 524,889 2%
Hard to treat Metal Frame 62,888 0%
Hard to treat Timber frame (un-insulated studwork with masonry cavity)
65,483 0%
Hard to treat: Wall fault 1,386,191 5%
Hard to treat: Too high (greater than 3 stories) 91,091 0%
Hard to treat: Exposed Location 199,953 1%
Hard to treat: Random stone 119,438 0%
Total 27,890,000
100%
Figure 9 Detailed breakdown of wall type potential
*A large number of hard to treat cavities in the GB Housing Surveys could fit in to two or
more of the above categories. Where a home could fit in to two or more categories, in
certain cases it was possible to assign a proportion of a property weighting to each. Where
this was not the case, a property was assigned to a unique category according to a
hierarchy which is outlined in the appendix.
The majority of homes (84% in the EHS) are constructed entirely using the same form of
wall. For properties with mixed wall types, on average there was a clearly identifiable
predominant wall type. On average, for these properties 75% of the wall area was
constructed with the same kind of wall. For this reason the predominant wall type in the
EHS, SCHS, LiW and NIHCS was chosen as representative of the whole property’s wall
type.
Insulated + 5% uncertainty This category includes all properties listed as insulated cavity in the housing survey plus 5% of all pre-1990 properties listed as un-insulated cavity walls. BRE suggest that the
Review of Carbon Savings from Residential Efficiency
20
housing surveys may underestimate the number of insulated cavity walls by 5 – 10% due to the difficulties in identifying retrofit and in-situ cavity wall insulation. Only the first 5% of this uncertainty has been included here because a typical cause of surveyors not identifying cavity wall insulation, cited by BRE, is where the insulation is built in to the cavity wall rather than retrofitted in which case it is harder for a surveyor to identify the insulation. The vast majority of these instances will be in post 1980 homes which are now considered separately in the ‘insulated or equivalent’ and ‘limited potential’ categories. It was therefore assumed that 5% was sufficient to account for the non-identification of cavity wall insulation by surveyors. The number of cavity wall installations post April 2007 was sourced from the DECC QIP data. In addition, all new build dwellings post April 2008 were added to this category, the numbers of which were sourced from the DECC QIP. Insulated or equivalent All properties constructed after 1990 are assumed to have a wall with a U value of 0.45 or better. Any properties listed as having un-insulated cavity walls, or other wall types in this age band have been classified as equivalent to an insulated wall. This category differs from the DECC methodology in that DECC assume that all properties Post 1995 are Insulated or Equivalent. However, the post 1995 age band is not in the EHS 2008 housing survey and so it is unclear how DECC was able to apply this assumption. It was felt that assuming all post 1990 cavities are insulated or equivalent was the closest equivalent assumption that could be made. Limited potential – easy to treat This category includes all un-insulated cavities, which do not meet a definition of hard to treat, constructed between 1981 – 1990 (1983 and 1990 in Scotland). All cavities built between 1981 and 1990 (1983 and 1990 in Scotland) are assumed to have a U-value of 0.6, whether the cavity is insulated or not. Although there will be additional savings from insulating the cavity, these savings are small compared to pre 1980 properties. In the DECC methodology, this category includes all cavities between 1983 and 1995. Again, because this age band is not included in the EHS 2008 we are unclear how the DECC figure was derived and using the 1981- 1990 age band was the nearest equivalent assumption. Limited potential – hard to treat This category includes all timber frame properties with a masonry cavity where insulation is included between the studwork but not in the cavity wall. In addition, this category contains all other definitions of hard to treat cavity that sit within the 1981 – 1990 age band (1983 – 1990 in Scotland) including narrow cavities, concrete frames, metal frames, timber frames, random stone, too tall and exposed cavities. The DECC methodology also includes partial fill cavity walls in this category. In the EST data these are included in the Insulated cavity column as it is not possible to identify them from the EHS data. Not insulated – easy to treat All pre 1980 properties listed in the housing survey as having un-insulated cavity walls minus all properties that meet the definitions of hard to treat cavities below. Hard to treat – narrow cavity All empty cavities 1920 – 1945 are assumed to have a 20% likelihood of having a cavity narrower than 50mm. All un-insulated cavity walls constructed between 1945 and 1990 are assumed to have a 5% likelihood of having a cavity narrower than 50mm. There is a large overlap between properties identified as narrow cavity and properties listed as having wall faults (approximately 120,000 dwellings according to the housing surveys). Where this overlap occurs, narrow cavity was listed as the primary value. Hard to treat concrete frame All properties listed as being un-insulated with concrete construction, excluding in-situ concrete and crosswall construction. A large number of concrete frame properties are also

Review of Carbon Savings from Residential Efficiency
21
listed as being greater than 3 stories (approximately 150,000 according to the housing surveys). Where this overlap occurs, Concrete frame was listed as the primary value. Hard to treat – metal construction All properties listed as being of metal construction with no insulation. There are a significant number of properties with metal frames listed as being greater than 3 stories. Where this overlap occurs, Metal frame was listed as the primary value. Hard to treat – timber frame (un-insulated studwork plus a masonry cavity) All pre 1980 properties listed as being of timber frame construction with a masonry cavity and no evidence of having either insulated studwork or cavity. Hard to treat – random stone All non-urban non-flat properties in Scotland built before 1980 without solid walls but with walls constructed from whin/granite or sandstone are classified as random stone construction. 25% of English un-insulated masonry construction properties built before 1980 that are not in an urban location and identified as not having solid walls are assumed to have random stone walls. Hard to treat – exposed DECC assume that 225,000 standard cavity walls are in exposed locations. This equates to approximately 4% of all pre-1990 un-insulated standard cavity walls. Given that exposure data is not available in the housing surveys it has been assumed that 4% of all standard un-insulated cavities are in exposed locations. Hard to treat – wall fault Any pre 1980 properties with un-insulated cavity walls listed in the English or Welsh surveys as having a wall fault, or any Scottish properties reported as requiring urgent repair to the wall finish or having evidence of penetrating damp. Hard to treat – too high All pre 1980 properties listed as having un-insulated cavity walls and being greater than 3 stories in height. Properties in the Scottish housing survey are recorded as having 3 stories or more. It is assumed that 50% of these properties are more than 3 stories. Please note that the DECC estimates of Hard to treat cavities – too high are based on a definition of being greater than 4 stories in height. This is an older definition that does not reflect the Ofgem definition of a hard to treat cavity under ECO. Therefore, in this analysis there is a much larger number of properties listed as being too tall in the housing surveys, however, a large number of these are also listed as being concrete or metal frame of having a wall fault. Where this overlap occurs, the properties are listed as either concrete frame, metal frame or wall fault rather than being listed as too high. Ignoring all of the overlaps, there are approximately 419,000 properties listed as being too high in the GB housing surveys. Internal vs External Wall Insulation potential
All properties listed as having solid walls in the housing surveys (solid brick, solid stone or
in-situ concrete without masonry pointing) are assumed to be suitable for either internal or
external solid wall insulation. In theory, any type of solid wall could be suitable for either
internal wall or external wall. To inform the MACC and uptake analysis undertaken by
Element Energy, it was necessary to develop estimates of the potential for internal wall
and external wall insulation. In this analysis we have assumed that all properties suitable
for solid wall insulation built before 1919 are suitable for internal wall insulation as opposed
to external wall insulation. This assumes that households in homes built before 1919
would be more inclined to install internal rather than external wall insulation so as to
preserve the outside appearance of the home. In reality this distinction is unlikely to be as
clear cut. Savings from internal and external wall insulation are similar as both measures
result in external walls having a similar U-value while the costs are higher for external
insulation.

Review of Carbon Savings from Residential Efficiency
22
5.1.2 Loft insulation
The DECC Methodology outlined in Figure 5 was used to calculate loft insulation potential.
Using the combined GB housing surveys, homes were categorised as having one of four
loft insulation levels or no loft:
1. 0-49mm
2. 50 -124mm
3. 125-199mm
4. 200mm+
5. No loft
This assumes that all types of roof insulation have the same insulation properties. Each of
these categories was further split into easy to treat and hard to treat lofts. DECC classify
all hard to treat lofts as “properties that contain lofts which are hard to insulate. For
example properties with a flat roof or very shallow pitch (to make the loft space
inaccessible”. For this analysis all roofs classified in the GB housing surveys as having a
mansard roof, chalet roof, flat roof or mono-pitch roof are classified as hard to treat. Flat
roofs by definition do not have a loft space; mansard roofs do have a roof space but it is
usually shallow and therefore difficult to access. Chalet roofs may have some roof space
that can be insulated however this level of detail is not reported in any of the housing
surveys. No properties built after 1990 are assumed to have hard to treat lofts, as it is
assumed that these dwellings have sufficient insulation in accordance with building
regulations.
Data on the number of loft insulation since April 2008 was taken from the DECC QIP. EST
was able to provide representative data of how these installations were applied across the
stock with data from the Homes Energy Efficiency Database (HEED).
In determining the proportion of loft insulation that was installed in to virgin lofts vs lofts
that only required top up insulation, EST was able to draw on CERT installations data in
HEED which contains information on the before and after levels of loft insulation for CERT
measures. This is only available for professionally installed loft insulation, not DIY
insulation. It should be noted that, even though the figures were available for professional
installation only, there were more installations reported in 0 – 50mm lofts than there were 0
– 50mm lofts available for insulation according to the combined GB 2008 housing surveys.
This highlights the inherent uncertainties in the survey based data. For this analysis, it was
assumed that the technical potential for 0 – 50mm lofts is now zero, although in practice it
is likely that a number do still exist.
The results of the loft insulation potential analysis are provided below:

Review of Carbon Savings from Residential Efficiency
23
Loft type Thickness Potential Stock (%)
Easy to treat lofts
0-49mm 0 0%
50 - 124mm 6,539,108 23%
125 - 199mm 3,780,099 14%
200mm+ 13,028,024 47%
Hard to treat lofts
0-49mm HTT 25,889 0%
50 - 124mm HTT 201,688 1%
125 - 199mm HTT 111,073 0%
200mm+ HTT 114,640 0%
No potential Non suitable for insulation / No loft 4,089,479 15%
Total 27,890,000 100%
These numbers are closely aligned with the DECC estimates of insulation potential for
April 2013 which are provided below.
Start of: Insulated
>=125mm
Uncertainty Remaining potential Properties
with a loft Easy to treat Hard to treat
Apr-2013 16,160,000 100,000 5,740,000 1,700,000 23,690,000
5.1.3 Floor insulation
Insulation for floors is split into two categories of suspended timber floor insulation and
solid floor insulation. It is assumed that no floors have been insulated since the 2008
housing surveys and that all new builds 2008 – 2013 have fully insulated floors. The
English Housing Survey contains data on floors that have insulation, however no data
exists in any of the housing surveys as to the construction type of the ground floor and for
this reason the age of the property was used as a proxy for the floor type. All homes built
before 1929 are assumed to have suspended timber floors whereas all built in subsequent
years are assumed to have solid floors. This follows the assumptions used in RdSAP 2009
(See appendix S table S 11 of the SAP 2009 document)4. The proportion of floors
insulated in the EHS pre 1929 was taken to be representative of the UK as a whole. The
results of the floor insulation potentials analysis are provided below:
Floor Insulation Potential Stock (%) Suspended timber floor insulation potential 4,896,737 18%
Solid floor insulation potential 15,272,980 55%
Insulated floor / no potential 7,720,284 28%
Total 27,890,000 100%
4 http://www.bre.co.uk/filelibrary/SAP/2009/SAP-2009_9-90.pdf

Review of Carbon Savings from Residential Efficiency
24
5.1.4 Double glazing
A similar methodology as outlined in figure 5 was used to calculate different types of
glazing in the housing stock. All homes in EHS, SHCS and LiW were placed into three
glazing categories; those having either predominantly single glazing, double glazing
installed before 2002 or double glazing installed after 2002. In 2002 England and Wales
building regulations were enforced, specifying that any new or replacement window must
have a minimum Window Energy Rating (WER) of C or above. All surveys contain data on
single vs. double glazing. Many homes have multiple types of windows (approx. 25% of
EHS homes), for these the predominant type of glazing was used as representative of the
whole home.
EHS and LiW contain data on the age of the double glazing enabling us to ascertain
whether the glazing is pre or post 2002. For Scotland this data was not available, therefore
the data for double glazing was taken from the SHCS but the proportion of double glazing
that is Pre 2002 vs. Post 2002 was applied from the EHS.
Data for installations of glazing since April 2008 was taken from the CERT and CESP
scheme reporting to Ofgem. This reporting is presented in terms of m2 glazing provided.
An average glazed area of homes in GB was used to divide the square meter data
provided by Ofgem. It was assumed that the glazing was applied to whole dwellings rather
than individual window replacements across a number of dwellings. The results of the
glazing analysis are provided below:
Glazing Potential Stock (%)
Double glazing Homes with post 2002 Double Glazing 8,685,169 31%
Homes with Pre 2002 Double Glazing 17,277,138 62%
Single Glazing Single Glazing 1,927,693 7%
5.1.5 Energy efficient doors
The English, Scottish and Welsh Housing Surveys 2008 each record the material
construction of each external door as either UPVC, metal or wood. The predominant
external door type for each property was taken to be representative of each of the
property’s external doors. It has been assumed each property with predominantly wooden
or metal doors external doors will be suitable for replacement with an insulated door.
5.1.6 Draught proofing
In the absence of UK wide draught proofing potential data from any of the UK housing
stock surveys, it is assumed that only dwellings that have primarily single glazing will
substantially benefit from draught proofing strips. Double glazed dwellings would already
have sealed window units not requiring further draught proofing. Although draught strips
are applicable to external doors we deemed glazing to have a larger air leakage perimeter
therefore have a larger influence upon the air leakage rate.
Draught Proofing Potential Stock (%) Potential for Draught proofing (draught stripping) 1,903,707 7%
No potential for draught stripping 25,986,293 93%
Total 27,890,000 100%
Review of Carbon Savings from Residential Efficiency
25
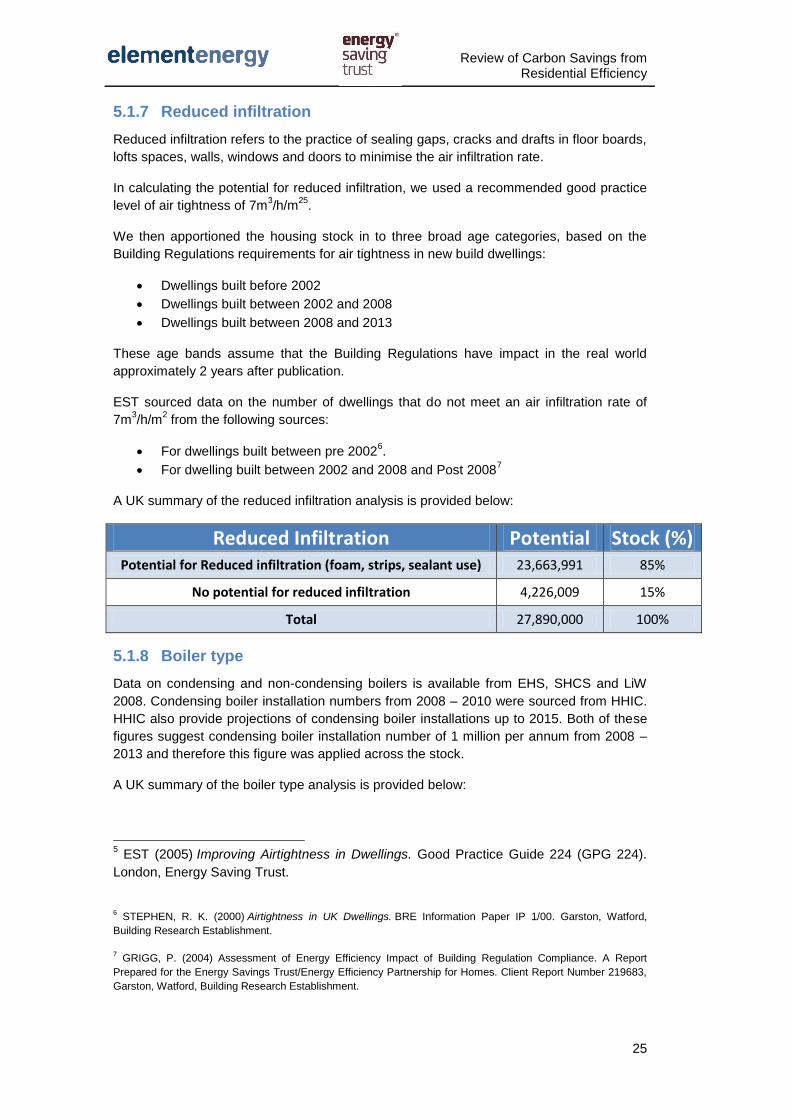
5.1.7 Reduced infiltration
Reduced infiltration refers to the practice of sealing gaps, cracks and drafts in floor boards,
lofts spaces, walls, windows and doors to minimise the air infiltration rate.
In calculating the potential for reduced infiltration, we used a recommended good practice
level of air tightness of 7m3/h/m
25.
We then apportioned the housing stock in to three broad age categories, based on the
Building Regulations requirements for air tightness in new build dwellings:
Dwellings built before 2002
Dwellings built between 2002 and 2008
Dwellings built between 2008 and 2013
These age bands assume that the Building Regulations have impact in the real world
approximately 2 years after publication.
EST sourced data on the number of dwellings that do not meet an air infiltration rate of
7m3/h/m
2 from the following sources:
For dwellings built between pre 20026.
For dwelling built between 2002 and 2008 and Post 20087
A UK summary of the reduced infiltration analysis is provided below:
Reduced Infiltration Potential Stock (%) Potential for Reduced infiltration (foam, strips, sealant use) 23,663,991 85%
No potential for reduced infiltration 4,226,009 15%
Total 27,890,000 100%
5.1.8 Boiler type
Data on condensing and non-condensing boilers is available from EHS, SHCS and LiW
2008. Condensing boiler installation numbers from 2008 – 2010 were sourced from HHIC.
HHIC also provide projections of condensing boiler installations up to 2015. Both of these
figures suggest condensing boiler installation number of 1 million per annum from 2008 –
2013 and therefore this figure was applied across the stock.
A UK summary of the boiler type analysis is provided below:
5 EST (2005) Improving Airtightness in Dwellings. Good Practice Guide 224 (GPG 224).
London, Energy Saving Trust.
6 STEPHEN, R. K. (2000) Airtightness in UK Dwellings. BRE Information Paper IP 1/00. Garston, Watford,
Building Research Establishment.
7 GRIGG, P. (2004) Assessment of Energy Efficiency Impact of Building Regulation Compliance. A Report
Prepared for the Energy Savings Trust/Energy Efficiency Partnership for Homes. Client Report Number 219683,
Garston, Watford, Building Research Establishment.

Review of Carbon Savings from Residential Efficiency
26
Boiler type Potential Stock (%) Condensing Boiler 10,236,838 37%
No boiler 3,508,407 13%
Standard Boiler 14,144,755 51%
Total 27,890,000 100%
5.1.9 Heating controls
The presence of the following types of heating controls was sourced from the English,
Scottish and Welsh Housing Surveys:
- Thermostat
- Timer
- TRVs
EST calculated the combinations of all of these technologies in the stock, as well as the
proportion where heating controls were not applicable (e.g. electric heating).
The 840,000 new build dwellings (2008 – 2013) were assumed to be built with a full
package of heating controls (Thermostat, Timer and TRV) in the proportion of the stock
where gas heating was assumed to be installed.
All new boiler installations were assumed to be installed with a full package of heating as
this is specified in the Domestic Heating Compliance Guide 20088.
Data was available on the number of heating control installations under CERT. However,
for this analysis it was assumed that none of these installations were additional to those
accompanying new boilers.
A UK summary of the results for the heating controls analysis is presented below:
Heating controls Potential Stock (%) Homes with No heating controls 660,017 2%
Homes with Room Thermostat only 135,564 0%
Homes with Timer only 973,708 3%
Homes with TRVs only 5,948 0%
Homes with Thermostat + timer 5,372,517 19%
Homes with Thermostat + TRVs 75,731 0%
Homes with Timer + TRVs 2,435,435 9%
Homes with Thermostat + Timer + TRVs 15,811,263 57%
Heating Controls not applicable (e.g. electric heating) 2,419,817 9%
Total 27,890,000 100%
8 http://www.planningportal.gov.uk/uploads/br/BR_PDF_PTL_DOMHEAT.pdf

Review of Carbon Savings from Residential Efficiency
27
5.1.10 Hot water cylinder thermostat
Data on the presence of a hot water cylinder thermostat was sourced from the English,
Scottish and Welsh housing surveys. New build dwellings were assumed to have a hot
water cylinder thermostat. A UK summary of this analysis is provided below;
Hot Water Cylinder Thermostat Potential Stock (%) Potential for Hot Water Cylinder Thermostat 4,611,718 17%
No potential for Hot Water Cylinder Thermostat 23,278,282 83%
Total 27,890,000 100%
5.1.11 Hot water cylinder insulation
The thickness of hot water cylinder insulation was taken the English, Scottish and Welsh
housing surveys. The potential for hot water cylinder insulation included all homes with
cylinders that had foam insulation under 26mm in thickness or a hot water cylinder jacket
insulation less than 80mm in thickness. This is in accordance with recommendations in
Appendix T of SAP 20099. Homes without a hot water cylinder, for instance those with
combi-boilers are classed as not applicable. Hot water cylinder insulation installations
since April 2008 were sourced from Ofgem under the CERT programme.
A UK summary of the hot water cylinder insulation potential analysis are provided below:
Hot Water Cylinder Insulation Potential Stock (%) Cylinder virgin insulation potential 27,787 0%
Cylinder top up insulation potential 5,004,822 18%
Not applicable 11,153,732 40%
No potential 11,703,658 42%
Total 27,890,000 100%
5.1.12 Energy efficient lighting
The Market Transformation Programme (MTP) Policy Scenario was used as an estimate
of the number of light bulbs currently owned by UK households, grouped across various
technology categories (e.g. GLS, CFL, Halogen, Linear Fluorescent, and LED). The
scenario is a projection of the market under a defined set of relevant policies, extrapolated
from 2007 Tangible / Lighting Association research10
. It is used as the source for the
number of light bulbs owned by UK households published in the DECC statistical release
Energy Consumption in the UK (ECUK). The table below provides a summary of the
assumed proportion of bulbs in each technology in an average UK home:
9 DECC, (2011) The Government’s Standard Assessment Procedure for Energy Rating of
Dwellings 10
The MTP Policy projection for 2013 has been used due to a lack of availability of any more recent robust audits of lighting. Some new market research sources are available but not at a reasonable cost and, based on analysis of other sources, it is not expected that new market research data would alter the potentials in any significant way.

Review of Carbon Savings from Residential Efficiency
28
Light Bulbs Potential Stock (%)
Standard (GLS) lamps 34,378,000 5%
Halogen lamps 294,985,000 41%
Linear fluorescent lamps 14,152,000 2%
CFL lamps 375,401,000 52%
LED lamps 4,643,000 1%
Total 723,559,000 100%
5.1.13 Passive Flue Gas Heat Recovery (PFGHR)
Passive flue gas heat recovery systems can be installed on all gas central heating
systems. It was assumed that a statistically insignificant number already have the
technology installed therefore all properties identified as having a gas heating have been
classified as suitable for PFGHR. The system is recommended for condensing boilers
only, therefore we have differentiated between homes that require just a PFGHR system
and those that require a new boiler plus a PFGHR system.
Passive Flue Gas Heat Recovery Potential Stock (%) Potential for passive flue gas heat recovery (would need to
install an A-rated boiler and PFGHR) 432,409 2%
Potential for passive flue gas heat recovery (Upgrade to an A-rated boiler and Install a PFGHR)
12,710,522 46%
Potential for passive flue gas heat recovery (Install PFGHR) 9,626,211 32%
No potential for passive flue gas heat recovery 5,120,857 18%
Total 27,890,000 100%
5.1.14 Turning heating down by 1oC
According to the EST 2011 attitude and behaviour survey, 60% of households claim
already to have their thermostat turned down, leaving 40% of households with the potential
to reduce their internal temperature. Please note that as this is based on a single survey
there is a large level of uncertainty associated with this figure and also, as a ‘self-reported’
survey, responses are likely to be subject to a significant ‘green glow’ bias towards
answers that make the interviewee sound favourable in light of the nature of the questions.
Nevertheless this was deemed to be the only data source available. All homes in the EHS,
LiW and SHCS identified as failing health and safety due to cold risk were excluded from
the potential leaving an overall potential of 32%.
Turning heating down by 1 degree Potential Stock (%) Potential for 1 deg. C decrease in house temperature 8,790,724 32%
Already turns thermostat down by 1 deg. C 16,741,441 60%
Fails Thermal Comfort Standard - not suitable for turning down thermostat
2,357,835 8%

Review of Carbon Savings from Residential Efficiency
29
Total 27,890,000 100%
5.1.15 Turning off lights when not in use
The EST 2011 Attitude and Behaviour research project11
found that 65% of household
claim to always turn their lights off when out of the room. It has therefore been assumed
that 35% of households could save energy by switching off unused lights.
Turning lights off when not in use Potential Stock (%) Potential for turning off lights when not in use 9,761,500 35%
Already turn off lights when not in use 18,128,500 65%
Total 27,890,000 100%
5.1.16 Smart meters
DECC aims for all homes and small businesses to have smart meters by 2020. Between
now and 2020 energy suppliers will be responsible for replacing over 53 million gas and
electricity meters. This will involve visits to 30 million homes and small businesses12
.
Under the smart meter roll-out all homes will be offered a smart meter and, if they use
mains gas, a smart gas meter. Alongside the smart meter, households will be offered an
in-home-display, which can give near real-time information on gas and electricity use. The
in-home-display (IHD) enables householders to make changes to their energy use.
The potential for domestic smart meters as at 2013 was calculated as follows:
For gas smart meters:
• All UK homes which currently use mains gas for heating
For electricity smart meters:
• All UK homes, minus an estimate of those who already have a smart meter, a
smart-type meter, or an in-home-display. Although in-home displays do not provide all the
benefits of a smart meter it was assumed that the behavioural changes resulting from
installing a smart meter could be double counted if existing in-home displays were not
taken in to account.
We estimated the number of homes which already have an IHD as part of an energy
monitor or real time display from DECC’s Quantitative research into public awareness,
attitudes and experience of smart meters, giving an estimate of around 2.4 million IHD’s in
homes, which are used. This number was sense-checked against the number of real time
displays given out under CERT and was found to be a good match (~3 million).
Smart meters – electric Potential Stock (%) Potential for smart meters - electricity 24,866,019 89%
Already has a smart meter or electricity use monitor 3,023,981 11%
11
EST (2011) Attitudes and Behaviour tracker survey (undertaken by SPA) 12
https://www.gov.uk/government/policies/helping-households-to-cut-their-energy-bills/supporting-pages/smart-meters

Review of Carbon Savings from Residential Efficiency
30
Total 27,890,000 100%
Smart meters – gas Potential Stock (%) Potential for smart meters - gas 22,769,143 82%
No potential for smart meter - gas 5,120,857 18%
Total 27,890,000 100%
5.1.17 Energy efficient appliances
Data about the stock ownership of domestic electrical appliances and the total energy
consumed by these products across the UK was sourced from DECC’s Energy Use In the
UK (ECUK) 2012 tables 3.12, 3.11 and 3.10. The modelled data used to produce these
tables came from the Market Transformation Program13
. The appliance categories or
sectors covered in the model are as follows:
Appliance type Description
Cold appliances
Chest freezer
Fridge freezer
Refrigerator
Upright freezer
Wet appliances
Washing machine
Tumble driers
Dishwasher
Cooking Electric ovens
Consumer electronics Primary TV
Secondary TV
This data enabled us to calculate the average electricity consumption per appliance. For
cold appliances, wet appliances and electric ovens the ECUK provides stock data of
appliances by their energy rating. The EU energy label calculations were used to assess
the average consumption for each appliance, where the stock of appliances by energy
band was known, with the following assumptions alterations made:
Appliance Assumption
Chest freezer Average size 163 litres
Fridge freezer Average size 253 litres, 2/3rds of volume is frost free fridge
Refrigerator Average size 144 litres with frost free setting*
Upright freezer Average size 123 litres
13
Briefing notes on how each of these product category stock models were calculated are available here: http://efficient-products.ghkint.eu/product-strategies/viewall/briefing-note.html#viewlist
Review of Carbon Savings from Residential Efficiency
31
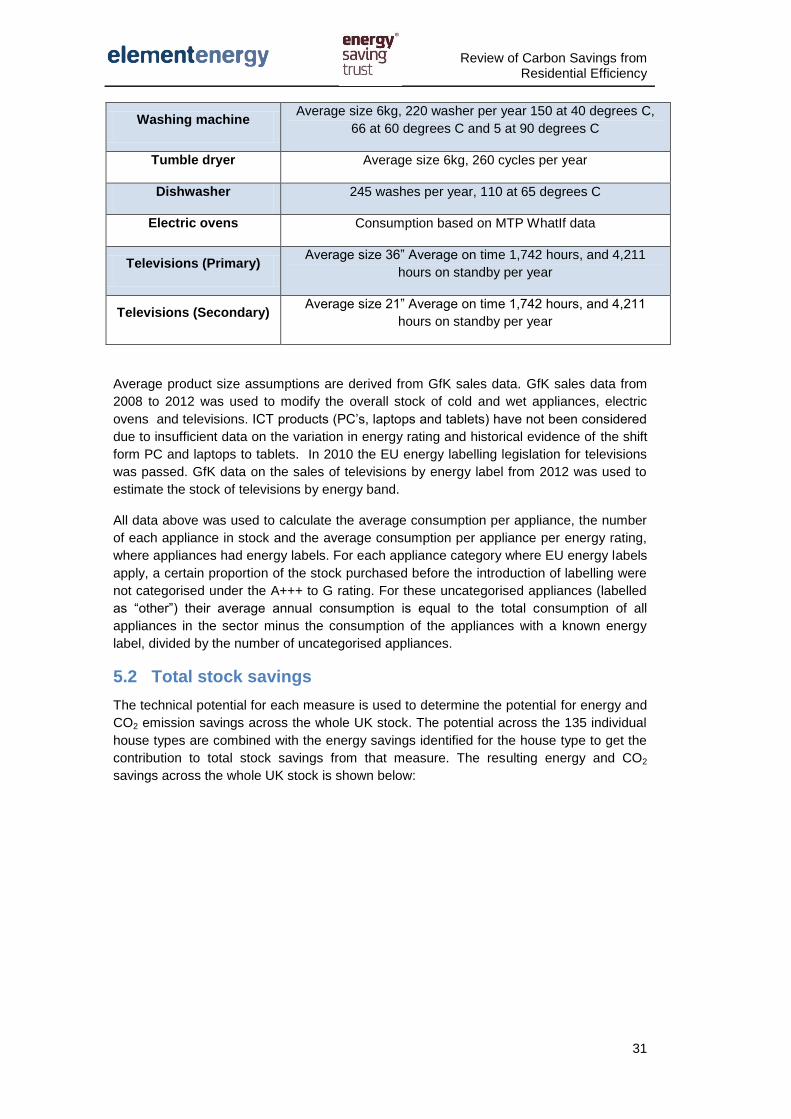
Washing machine Average size 6kg, 220 washer per year 150 at 40 degrees C,
66 at 60 degrees C and 5 at 90 degrees C
Tumble dryer Average size 6kg, 260 cycles per year
Dishwasher 245 washes per year, 110 at 65 degrees C
Electric ovens Consumption based on MTP WhatIf data
Televisions (Primary) Average size 36” Average on time 1,742 hours, and 4,211
hours on standby per year
Televisions (Secondary) Average size 21” Average on time 1,742 hours, and 4,211
hours on standby per year
Average product size assumptions are derived from GfK sales data. GfK sales data from
2008 to 2012 was used to modify the overall stock of cold and wet appliances, electric
ovens and televisions. ICT products (PC’s, laptops and tablets) have not been considered
due to insufficient data on the variation in energy rating and historical evidence of the shift
form PC and laptops to tablets. In 2010 the EU energy labelling legislation for televisions
was passed. GfK data on the sales of televisions by energy label from 2012 was used to
estimate the stock of televisions by energy band.
All data above was used to calculate the average consumption per appliance, the number
of each appliance in stock and the average consumption per appliance per energy rating,
where appliances had energy labels. For each appliance category where EU energy labels
apply, a certain proportion of the stock purchased before the introduction of labelling were
not categorised under the A+++ to G rating. For these uncategorised appliances (labelled
as “other”) their average annual consumption is equal to the total consumption of all
appliances in the sector minus the consumption of the appliances with a known energy
label, divided by the number of uncategorised appliances.
5.2 Total stock savings
The technical potential for each measure is used to determine the potential for energy and
CO2 emission savings across the whole UK stock. The potential across the 135 individual
house types are combined with the energy savings identified for the house type to get the
contribution to total stock savings from that measure. The resulting energy and CO2
savings across the whole UK stock is shown below:

Review of Carbon Savings from Residential Efficiency
32
Figure 10 Total potential for annual energy savings across stock
-2
0
2
4
6
8
10
-10
-
10
20
30
40
50
PF
GH
R w
ith n
ew
boile
r
Co
nde
nsin
g b
oile
r
SW
I -
I
Pre
20
02 d
oub
le to d
oub
le g
lazin
g
SW
I -
E
Solid
flo
or
Re
duced
in
filtra
tion
1 d
eg
. C
decre
ase
CW
I -
Ha
rd to t
reat w
ith
CW
I
Prim
ary
TV
CW
I -
Easy t
o tre
at
Sm
art
mete
rs -
gas
He
ating c
on
trols
- T
RV
on
ly
A+
+ r
ate
d F
rid
ge f
reezer
Ha
log
en t
o L
ED
Sin
gle
to d
oub
le g
lazin
g
Re
duced
flo
w s
how
ers
Lo
ft (
50
-124 m
m)
Suspen
ded
tim
be
r floo
r
PF
GH
R o
nly
Sm
art
mete
rs -
ele
ctr
icity
He
ating c
on
trols
- F
ull
A+
++
washin
g m
achin
e
Insu
late
d d
oors
Post 20
02 d
oub
le to d
oub
le g
lazin
g
Second
ary
TV
HW
ta
nk in
su
lation
fro
m ja
cket
CW
I -
Ha
rd to t
reat w
ith
SW
I-E
A+
+ r
ate
d u
prigh
t fr
ee
ze
r
A r
ate
d tum
ble
dry
er
HW
cylin
der
therm
osta
t
GLS
to C
FL
A+
+ r
ate
d R
efr
ige
rato
r
A+
ele
ctr
ic o
vens
Lo
ft (
12
5-1
99
mm
)
A+
ra
ted d
ishw
asher
Dra
ught
pro
ofing
A+
+ r
ate
d C
hest fr
ee
ze
r
Turn
off lig
hts
CW
I -
Ha
rd to t
reat w
ith
SW
I-I
HW
ta
nk in
su
lation
fro
m foa
m
CW
I -
low
im
pact
Lo
ft (
50
-124 m
m)
- H
ard
to t
reat
He
ating c
on
trols
- tim
er
+ T
RV
HW
ta
nk in
su
lation
fro
m n
on
e
Lo
ft (
12
5-1
99
mm
)- H
ard
to
tre
at
An
nu
al
em
iss
ion
sa
vin
gs
(M
t C
CO
2)
An
nu
al
en
erg
y s
avin
gs
(T
Wh
)
Fossil fuel savings (TWh) Electricity savings (kWh) CO2 savings (Mt/y)

Review of Carbon Savings from Residential Efficiency
33
Figure 11 Total potential for annual energy savings across stock
-2
0
2
4
6
8
10
12
14
16
18
-10
-
10
20
30
40
50
60
70
80
90
Bo
ile
r
Wa
ll
Ap
pli
an
ce
s
Do
ub
le g
lazin
g
Beh
avio
ura
l
Flo
or
Red
uc
ed
le
ak
ag
e
Heati
ng
co
ntr
ol
Lig
hit
ng
Lo
ft
HW
cy
lin
de
r in
su
lati
on
An
nu
al
em
iss
ion
sa
vin
gs
(M
t C
CO
2)
An
nu
al
en
erg
y s
avin
gs
(T
Wh
)
Fossil fuel savings (TWh) Electricity savings (kWh) CO2 savings (Mt/y)
Review of Carbon Savings from Residential Efficiency
34
The biggest potential for energy savings is from boiler replacement, SWI, heating controls
with TRV and pre 2002 double glazing, while appliance replacement with A++/A+++
energy rating also has good potential for CO2 emission reduction.
5.3 Overlapping savings between measures
The measures include some level of overlapped savings e.g. the majority of the saving
from passive flue gas heat recovery (PFGHR) with a new boiler comes from the installation
of the condensing boiler rather than the PFGHR itself. Also, with the reduction of baseline
heating demand through installation of thermal measures, the potential savings from boiler
replacement reduces. Taking this double counting of savings into account, the revised
potential for CO2 emission reduction is 49Mt/y. The breakdown of this total potential by
measure is shown in the figure below. It should be noted that these savings do not take
into account uptake of low carbon heating technologies such as heat pumps (HP) and
combined heat and power (CHP) systems, i.e. these savings are not additional to the
emission reduction from a shift of heating technology towards low carbon heating
technologies. With a significant uptake of low carbon heating solutions, the potential for
additional savings from energy efficiency measures is further reduced.
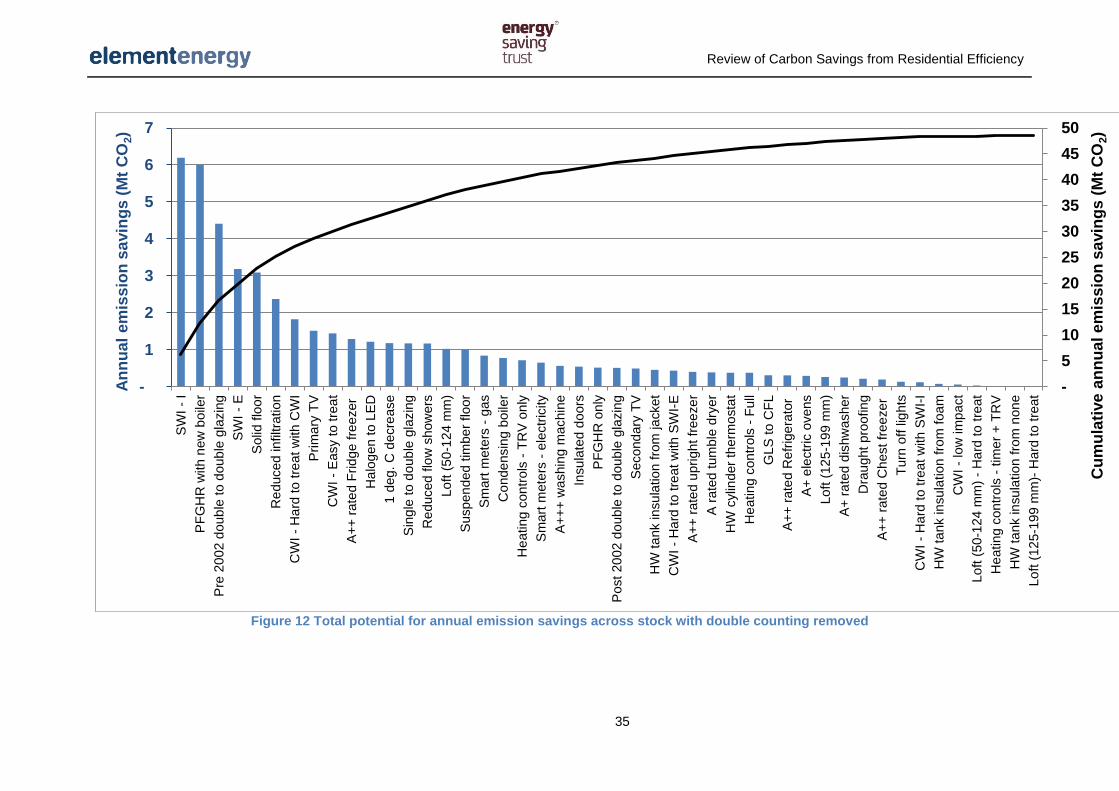
Review of Carbon Savings from Residential Efficiency
35
Figure 12 Total potential for annual emission savings across stock with double counting removed
-
5
10
15
20
25
30
35
40
45
50
-
1
2
3
4
5
6
7
SW
I -
I
PF
GH
R w
ith n
ew
boile
r
Pre
20
02 d
oub
le to d
oub
le g
lazin
g
SW
I -
E
Solid
flo
or
Re
duced
in
filtra
tion
CW
I -
Ha
rd to t
reat w
ith
CW
I
Prim
ary
TV
CW
I -
Easy t
o tre
at
A+
+ r
ate
d F
rid
ge f
reezer
Ha
log
en t
o L
ED
1 d
eg
. C
decre
ase
Sin
gle
to d
oub
le g
lazin
g
Re
duced
flo
w s
how
ers
Lo
ft (
50
-124 m
m)
Suspen
ded
tim
be
r floo
r
Sm
art
mete
rs -
gas
Co
nde
nsin
g b
oile
r
He
ating c
on
trols
- T
RV
on
ly
Sm
art
mete
rs -
ele
ctr
icity
A+
++
washin
g m
achin
e
Insu
late
d d
oors
PF
GH
R o
nly
Post 20
02 d
oub
le to d
oub
le g
lazin
g
Second
ary
TV
HW
ta
nk in
su
lation
fro
m ja
cket
CW
I -
Ha
rd to t
reat w
ith
SW
I-E
A+
+ r
ate
d u
prigh
t fr
ee
ze
r
A r
ate
d tum
ble
dry
er
HW
cylin
der
therm
osta
t
He
ating c
on
trols
- F
ull
GLS
to C
FL
A+
+ r
ate
d R
efr
ige
rato
r
A+
ele
ctr
ic o
vens
Lo
ft (
12
5-1
99
mm
)
A+
ra
ted d
ishw
asher
Dra
ught
pro
ofing
A+
+ r
ate
d C
hest fr
ee
ze
r
Turn
off lig
hts
CW
I -
Ha
rd to t
reat w
ith
SW
I-I
HW
ta
nk in
su
lation
fro
m foa
m
CW
I -
low
im
pact
Lo
ft (
50
-124 m
m)
- H
ard
to t
reat
He
ating c
on
trols
- tim
er
+ T
RV
HW
ta
nk in
su
lation
fro
m n
on
e
Lo
ft (
12
5-1
99
mm
)- H
ard
to
tre
at
Cu
mu
lati
ve
an
nu
al e
mis
sio
n s
avin
gs
(M
t C
O2)
An
nu
al
em
iss
ion
sa
vin
gs
(M
t C
O2)
Review of Carbon Savings from Residential Efficiency
36
6 In use factors
6.1 Overview
There is growing evidence that there is often a gap between the actual in-situ performance
and the theoretical performance we can expect from energy efficiency measures. This is of
substantial interest in this study as it directly challenges the confidence with which we can
estimate the energy, cost and carbon savings resulting from the measures analysed. A
number of factors have been posited as contributing to this observed discrepancy. These
include:
• Variation in thermal performance of building fabrics and in particular the effect of
using standardized U-value assumptions.
• Underperformance of measures in-situ when compared to laboratory expectations,
including deterioration of performance over time.
• Imperfect installation and inaccessible/untreatable areas.
• Changes in occupant behaviour in response to installation that cannot be well
described or predicted by conventional models; including internal temperature (thermal
comfort behaviour), ventilation (“heat dumping”), and user-control (how effectively they use
thermostat, timer etc.).
• Models have difficulty explicitly describing heat demand accounting for secondary
sources (often unmetered), and hot water and appliance use (as separable from space
heating).
6.2 Methodology
The requirement for the purposes of this study is to identify from current research the best
available estimates that we can use to adjust expected savings.
Our approach was first to take the DECC Green Deal in-use factors14
, and inaccessibility
and comfort factors from the DECC Green Deal Impact Assessment15
, and then to critically
evaluate the sources and justification for these, including against any new or overlooked
evidence and insight from our field trial experience. DECC in use factors were used as the
basis of the study as this is the only place where in-use factors have been systematically
developed across all measures.
A particular focus has been on assessing how conservative the DECC factors may be as,
whilst conservatism is pertinent from a Green Deal delivery perspective, it is not
appropriate for the MACC and trajectory analysis. However, it should be noted that DECC
employ the same in-use factors in their Green Deal Impact Assessment as they do in
household Green Deal calculations, with the addition of comfort and inaccessibility
elements.
14
DECC (2012): How the Green Deal will reflect the in-situ performance of energy efficiency measures. 15
DECC (2012): Final stage impact assessment for the Green Deal and Energy Company Obligation.
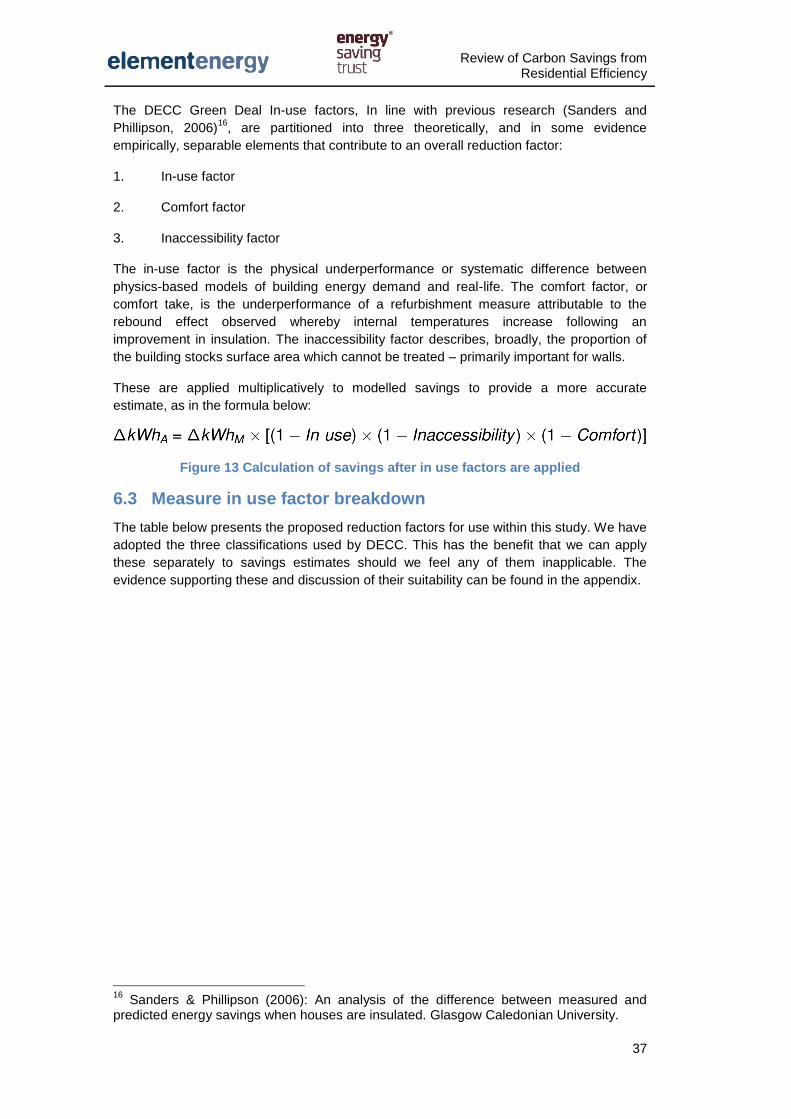
Review of Carbon Savings from Residential Efficiency
37
The DECC Green Deal In-use factors, In line with previous research (Sanders and
Phillipson, 2006)16
, are partitioned into three theoretically, and in some evidence
empirically, separable elements that contribute to an overall reduction factor:
1. In-use factor
2. Comfort factor
3. Inaccessibility factor
The in-use factor is the physical underperformance or systematic difference between
physics-based models of building energy demand and real-life. The comfort factor, or
comfort take, is the underperformance of a refurbishment measure attributable to the
rebound effect observed whereby internal temperatures increase following an
improvement in insulation. The inaccessibility factor describes, broadly, the proportion of
the building stocks surface area which cannot be treated – primarily important for walls.
These are applied multiplicatively to modelled savings to provide a more accurate
estimate, as in the formula below:
Figure 13 Calculation of savings after in use factors are applied
6.3 Measure in use factor breakdown
The table below presents the proposed reduction factors for use within this study. We have
adopted the three classifications used by DECC. This has the benefit that we can apply
these separately to savings estimates should we feel any of them inapplicable. The
evidence supporting these and discussion of their suitability can be found in the appendix.
16
Sanders & Phillipson (2006): An analysis of the difference between measured and predicted energy savings when houses are insulated. Glasgow Caledonian University.

Review of Carbon Savings from Residential Efficiency
38
Table 6 Detailed breakdown of performance factors for measure
Measure In – use Comfort
factor Inaccessibility Total IUF
SWI – Internal / external 33% 15% 10% 49%
CWI 35% 15% 10% 50%
Loft 35% 15% 10% 50%
Suspended timber floor 15% 15% 0% 28%
Solid floor 15% 15% 0% 28%
Double glazing 15% 15% 0% 28%
Insulated doors 15% 15% 0% 28%
Draught proofing 15% 15% 0% 25%
Reduced infiltration 15% 15% 0% 25%
Condensing boiler 25% 0% 0% 25%
Heating controls - Full 50% 0% 0% 50%
HW cylinder thermostat 10% 0% 0% 10%
HW tank insulation 15% 0% 0% 15%
GLS to CFL 0% 0% 0% 0%
Halogen to LED 0% 0% 0% 0%
PFGHR only 0% 0% 0% 0%
1oC decrease in temperature 10% 0% 0% 10%
Turn off lights 0% 0% 0% 0%
Smart meters - electricity 0% 0% 0% 0%
Smart meters - gas 0% 0% 0% 0%
6.3.1 Discussion of Evidence
Whilst underperformance of energy efficiency measures, particularly insulation, against
theoretical expectations has been routinely observed in post-occupancy evaluations and
field trials, this insight has not often been structured and collected in such a way that it can
be used directly to derive quantified adjustment factors. Limitations around data collection
methodology, sample size, and representativeness, create problems for the identification
of generalized factors – and there has been relatively little dedicated effort to develop
empirical reduction factors as a primary research output. Acknowledging this, we present
here a review of available secondary evidence and a comment on its applicability and
robustness for our purposes.

Review of Carbon Savings from Residential Efficiency
39
The key focus of the discussion is on DECC’s Green Deal In-Use and Impact Assessment
numbers. They have justified these where possible with cited evidence, and our review of
this confirms that their use of these sources is appropriate and is a comprehensive
representation of currently available research.
6.3.2 Cavity Wall Insulation
The majority of studies that have sought to quantify reduction factors have focused on the
most widely installed insulation measures (cavity wall and loft). Sanders and Phillipson
(2006) provide a useful review of reduction and comfort factor estimates for cavity and loft
insulation. This compares findings from studies that provide quantified values, and
identifies central factors that are in agreement with these – proposing a reduction factor of
50% (based on 4 studies), of which comfort taking contributes around 15% (based on 3
studies). Whilst it does highlight the limited availability of evidence, this is nonetheless the
most comprehensive contribution and provides the primary basis for DECC’s proposal of
50%. Early evidence from recent analysis of the National Energy Efficiency Data-
framework (NEED) corroborates this, finding around a 50% underperformance of CWI in
reality17
. Field trials of refurbishments have approximated that around 10% of wall
coverage remained unfilled following the treatment (AEA, 2004)18
. There is a range of
supporting evidence of underperformance of measures in situ, proposing a range of
causes.
Given the available evidence, and in line with DECC proposals, a reduction factor of 50%
is reasonable, and there is not sufficient evidence to suggest that this is overly
conservative. This is our suggested reduction factor.
6.3.3 Solid Wall Insulation
Due to the relatively low numbers of refurbishments for evaluation, there is much less
evidence on reduction factors for solid wall insulation. Based on recommendation DECC
initially proposed an in-use factor of 25%. Following evidence from field trials, an additional
8% adjustment (to 33%) was made for pre-1966 brick properties which were found to have
higher than assumed pre-insulation U values. EST has undertaken a two phase field trial
of Solid Wall insulation. Analysis of the first phase, with a sample of nearly 100 properties,
found that un-insulated solid wall U values were on average 32% lower than otherwise
assumed by SAP (2.1 W/m2.K)
19. The trial contained both brick and stone properties, and
very few solid wall constructions will have been built since 1966. As a result we propose
that the +8% adjustment is extended to all types of solid wall property.
Analysis of the second phase, with a smaller sample of around 35, is ongoing. However
early results have found a discrepancy between actual and modelled savings of a similar
order of magnitude of DECCs proposed factors – suggesting that these are reasonable.
Whilst in-use, comfort and inaccessibility cannot be independently identified in the field trial
results, and the sample is too small to generalise about individual heating behaviour or
installations, it seems reasonable to suppose that all wall insulation has a similar effect on
occupant heating behaviour. There will also be untreated areas of wall, for example stone
detailing, inaccessible/awkward areas; as clear in thermal imaging analysis. For
consistency the proposed figure of 10% for inaccessibility is apposite.
17
For example DECC (2012): Final stage impact assessment for the Green Deal and Energy Company Obligation 18
Capel, C. & Wilczek, J. (2004): Measurement of the Performance of Cavity Wall Insulation Installed in Domestic Dwellings, Final Report for Energy Saving Trust, AEA Technology plc 19
EST Field trials. Field trial results not published externally

Review of Carbon Savings from Residential Efficiency
40
Subsequently, in line with DECC, we suggest that 33% be used as the in-use factor, 15%
as the comfort factor and 10% as the inaccessibility factor for all types of solid wall
property. When compared against the initial results of the Energy Saving Trust’s field trial,
as well as the value for a similar measure in CWI, these do not appear overly
conservative.
6.3.4 Loft Insulation
As with CWI, the key contribution comes from Sanders and Phillipson (2006) since the
majority of the studies reviewed measure the reduction factor from installation of both CWI
and loft insulation. Loft insulation therefore is expected to also produce a savings
underperformance of 50% when compared to theoretical expectations. As with CWI, early
NEED analysis has found a similar 50% reduction factor. These measures are often
grouped together in such studies as they are an insulation package that has been typically
installed in recent retrofit programmes. It has been suggested that measures that increase
radiant temperature (e.g. CWI, double glazing) will generate a lower comfort take than
those that do not, such as loft insulation. BRE (2003)20
find that properties with CWI alone
saw a significantly smaller comfort take (7%) than those with loft alone (29%). However
EST (2008)21
in attempting to differentiate the energy savings from CWI and loft insulation
installed under EESoP3 and EEC, find that there was no significant difference in overall
reduction factor between the two measures. BRE (2006)22
in an ex-post study of the
effectiveness of loft insulation find a few factors in installation that reduce its coverage,
such as areas of space left for heat escape from ceiling lights. More substantially they
highlight imperfections in installation – and this may be a particular issue given the
popularity of DIY loft insulation installation. Due to the nature of the insulation, a lower
inaccessibility factor seems reasonable whilst a higher in-use factor due to imperfect or
degraded installation also seems reasonable. In the Green Deal Impact Assessment
inaccessibility and in-use are grouped (as 41%), and whilst this is not explained in the
document it does suggest some uncertainty around the appropriate split between these.
Considering the evidence then, we propose that loft insulation has the same overall
reduction factor as cavity wall insulation. Contributing to this, we suggest that a slightly
higher in-use factor (38%) and lower inaccessibility factor (5%) is used. This is to reflect
evidence that the split of contributing factors may be different to wall insulation –
specifically that issues in installation may be more likely due to poor or degraded
installations than to spatial coverage. We are satisfied that the DECC factors are not
overly conservative.
6.3.5 Other Insulation Measures
There is very little evidence for appropriate reduction factors for other insulation measures
– floor, glazing, doors, draught proofing and reduced infiltration. DECC apply a 15% in-use
factor to each of these based on expert recommendation, and in recognition that this is a
precautionary value. When considered against the size of observed discrepancy
evidenced for loft and cavity insulation, we do not deem this an excessive value – despite
lacking the evidence to discuss with any precision its accuracy. Since these are also
20
Building Research Establishment (2003): Standards of Performance 2: Findings from Monitoring. BRE Client Report 16099, Building Research Establishment, Watford 21
Energy Monitoring Company (2008): Disaggregation of the energy savings achieved from insulation in EESoP3 and the Energy Efficiency Commitment. Final Report Updated November 2008 for Energy Saving Trust. 22
Building Research Establishment (2006): Research into the effectiveness of loft insulation Phases II & III. BRE Client Reports 227479 and 227480, Building Research Establishment, Watford.
Review of Carbon Savings from Residential Efficiency
41
insulation measures that affect internal thermal comfort, we recommend that the standard
comfort factor of 15% be applied; in line with Sanders and Phillipson’s review.
6.3.6 Condensing Boilers
DECC have proposed an in-use factor of 25% applied to the saving when switching a non-
condensing boiler to a condensing gas or oil boiler. This is in recognition of field trial
evidence that condensing boilers underperform in situ compared to theoretical
performance. The condensing boiler field trial undertaken by Gastec and the Energy
Saving Trust for DECC (2009) finds that the mean heat efficiency of condensing boilers is
significantly less than suggested by mean SEDBUK seasonal efficiencies – as used in
SAP. The trial recommends a correction factor of ~0.95 to improve the correlation between
trial efficiency and SAP predicted efficiency; however this may be lower during the summer
months when domestic hot water is the primary function. However, the pure system
efficiency alone does not account for all of the possible factors affecting performance in
use, including, for example where SAP can potentially overestimate original energy use.
For this reason, and through lack of available evidence, we recommend that the 25%
factor assumed by DECC be applied. Of all the DECC in-use factors, this could be seen as
being conservative but no other evidence exists to counter this assumption. It is unclear
from the literature to what extent real-life performance data from NEED was available to
inform DECC’s assumption.
6.3.7 Heating Controls
The in-use factor proposed by DECC for heating controls is 50%. This is a slightly atypical
use of the in-use approach as it is less to identify underperformance and more to question
whether there is evidence for any saving from this measure. Shipworth et al (2010)23
review the evidence for savings from heating controls and undertake a trial of 427 homes
to test thermostat and timer controls. They find very little robust evidence for a saving,
identifying poor and misleading sourcing as a particular issue in policy evaluations of this
measure. In their trial, they do not find evidence for any energy saving impact of the
measure. Specifically, homes with a thermostat installed did not have a significantly
different average internal temperature and homes with a timer installed did not have a
significantly different average daily heating duration. Nonetheless savings have been
found in some studies, for example RLW Analytics (2007)24
which found a 6.2% reduction
in gas consumption from the installation of programmable thermostats. Comfort and
inaccessibility factors are inapplicable here due to the nature of the measure.
Clearly further research is required around this measure to determine its likely savings,
and the application of an in-use factor reflects this, rather than any specific limitations of
models. DECC cite the Shipworth et al study as evidence that controls may underperform
in reality against theoretical expectations and this seems reasonable. The choice of a 50%
in-use factor however is less certain. If we were to expect no savings, then we would apply
a 100% reduction factor and eliminate heating controls as an option. However, as
insufficient evidence exists to substantiate this claim either way, the DECC assumption of
50% seems a more reasonable working assumption.
23
Shipworth, M., Firth, S.K., Gentry, M.I3, Wright, A.J., Shipworth, D.T. and Lomas, K.J. (2010): Central heating thermostat settings and timing: building demographics, Building Research & Information, 38(1), 50-69. 24
RLW Analytics (2007): Validating the impact of programmable thermostats. Middletown, CT, Prepared for GasNetworks by RLW Analytics.

Review of Carbon Savings from Residential Efficiency
42
7 Measure cost
7.1 Overview
EST undertook an analysis of available data on the cost of measures to derive estimated
costs for all measures on the MACC. All measure costs are presented in terms of the price
charged for the work by an installer and therefore include all the cost of materials, labour
costs and VAT, plus any transaction costs associated with finding the lead and marketing
etc. However, please note that in the policy analysis, there are certain additional costs
associated with the ECO and Green Deal which were assumed to be additional to the
standard costs of marketing and assessment. These additional costs refer to the Green
Deal Advice Report and Technical Surveys required by ECO and Green Deal. It is also
assumed that for certain elements of ECO, there are additional costs of finding qualifying
leads due to the restricted eligibility criteria. These additional costs are covered separately
below.
All the costs provided exclude the value of grants and subsidies and hidden or hassle
costs. The analysis of measure costs has, where possible, tried to distinguish between
fixed and marginal elements. The fixed value is independent of the capacity or size of the
measure and may include, for example, in the case of external solid wall insulation the
fixed cost of transport to the job site. Marginal costs, for instance in the case of wall
insulation, include the cost of materials per m2 of wall insulated.
Each of the property types within the Housing Energy Model falls under one of three
categories of shape and dimension: Small (representing all flats), Medium (representing all
bungalows and terraced homes) and Large (representing all detached and semi-detached
homes). In order, to apply the variable costs to these archetypes, typical dimensions for
each were established from the BRE’s Standard Dwellings for Energy Modelling
document25
.
25
ILES. P, J (1999) Standard Dwellings For Energy Modelling, Centre for Technology Statistics and Assessment, Department of the Environment Transport and the Regions.

Review of Carbon Savings from Residential Efficiency
43
7.2 Measure cost breakdown
The results of the costs analysis is presented below.
Table 7 Detailed cost breakdown of measures
Measure Fixed costs Variable cost Low Fixed
Cost
Low Variable
Cost
High Fixed
Cost
High Variable
Cost
Variable
cost unit Variable
External wall insulation £6,000.00 £111.49 £3,600.00 £111.49 £8,400.00 £111.49 m2 Wall Area
Internal wall insulation £2,400.00 £73.35 £1,200.00 £66.01 £3,600.00 £80.68 m2 Wall Area
Easy to treat cavities £250.12 £5.06 £236.95 £4.04 £263.28 £5.15 m2 Wall Area
Hard to treat cavities (CWI
Solution) £2,240.42 £4.76 £1,293.31 £3.80 £2,875.70 £4.84 m2 Wall Area
Limited savings easy to
treat cavities £250.12 £5.06 £236.95 £4.04 £263.28 £5.15 m2 Wall Area
Loft Insulation £157.97 £0.012 £144.805 £0.011 £171.134 £0.013 mm x m2 Thickness required *
Loft Area
Hard to treat lofts £986.82 £22.79 £564.06 £13.03 £1,763.46 £40.73 m2 Loft area
Solid floor insulation £0.00 £29.27 £0.00 £24.85 £0.00 £46.22 m2 Ground Floor Area
Suspended timber floor
insulation £0.00 £8.81 £0.00 £2.18 £0.00 £13.26 m2 Ground Floor Area

Review of Carbon Savings from Residential Efficiency
44
B-rated double glazing £1,683.62 £108.65 £1,482.16 £95.65 £1,885.07 £121.65 m2 Window Area
Insulated doors £0.00 £504.47 per door Number of doors
Draught proofing £0.00 £3.57 m Window and Door
Perimeter
Reduced infiltration
treatment £22.01 £3.57 m
Window and Door
Perimeter
Condensing boiler £2,401.52 £0.00 £700.00
£5,998.31 per dwelling Number of dwellings
Heating controls (Timer,
Thermostat and TRV) £451.71 £0.00 per dwelling Number of dwellings
Heating controls (Timer and
TRV) £368.68 £0.00 per dwelling Number of dwellings
Heating controls (TRVs
only) £168.84 £0.00 per dwelling Number of dwellings
Hot Water Cylinder
Thermostat £119.99 £0.00 per Unit Number of dwellings
Hot Water Tank insulation £12.65 £0.00 per Unit Number of dwellings
Halogen lamps £0.00 £2.89 per Bulb Number of bulbs
replaceable
CFL lamps £0.00 £5.52 per Bulb Number of bulbs
replaceable

Review of Carbon Savings from Residential Efficiency
45
LED lamps £0.00 £9.80 per Bulb Number of bulbs
replaceable
Passive Flue Gas Heat
Recovery £652.79 £0.00
Number of
dwellings Number of dwellings
Smart meter (gas and
electric) £212.28 £0.00 per meter Number of meters
Chest freezer £270 £0.00 per unit per unit
Fridge freezer £278 £0.00 per unit per unit
Refrigerator £276 £0.00 per unit per unit
Upright freezer £442 £0.00 per unit per unit
Washing machine £321 £0.00 per unit per unit
Tumble driers £236 £0.00 per unit per unit
Dishwasher £365 £0.00 per unit per unit
Electric ovens £382 £0.00 per unit per unit
TV £542 £0.00 per unit per unit
Review of Carbon Savings from Residential Efficiency
46
The following methodology statement provides details of how costs data was sourced and
analysed for imputation in the MACC model.
7.2.1 Solid wall insulation, Internal and External
Costs for solid wall insulation were taken from the Solid Wall Insulation Supply Chain
Review (2009)26
undertaken by Purple research on behalf of the Energy Saving Trust and
the Energy Efficiency Partnership for Homes. The fixed costs for both types of wall
insulation were taken from the report. To calculate the variable costs the average material
costs as given in the report were divided by the typical wall area for a large semi-detached
home (81.9 m2) as given in BRE’s Standard Dwellings for Energy Modelling document
27.
Costs quoted in the report were exclusive of VAT hence 20% was added to both the fixed
and variable costs. To calculate the low and high estimated costs, the ranges provided in
the underlying Purple Research report were used. The Purple Market Research was
deemed to be a more robust dataset than industry data from schemes such as CESP as it
is often difficult to establish the true un-subsidised cost under energy efficiency obligation
programmes.
7.2.2 Cavity wall insulation (Easy to treat)
It is difficult to establish the unsubsidised cost of cavity wall insulation due to the fact that
the market has been almost entirely subsidised since the Energy Efficiency Commitment
was established in 2002. The National Insulation Association (NIA) recently carried out a
survey of its members28
and established that the current average price for insulating a 3
bedroom semi-detached home without subsidy is £450 - £500. The high and low cost
estimates were based on this range.
7.2.3 Cavity wall insulation (Hard to treat)
There are several forms of hard to treat cavity under DECC’s definition. The appropriate
solution varies depending on the type of cavity wall and the particular circumstances of the
property meaning that costs can vary greatly between the different hard to treat types. To
establish the solution most suitable to each hard to treat type, EST referenced the report
commissioned by DECC on Hard to Treat Cavity Walls, first in 201029
and subsequent
revisions in 201230
which provides recommendations for different uses. In a number of
cases (e.g. Narrow cavity walls) there is no clear guidance as to the appropriate solution.
Therefore, an assumption was made based on the EST Housing Teams Technical
Knowledge.
Costs for these treatments were sourced from the Inbuilt 2010 and 2012 reports for DECC
on hard to treat cavities, the EST supply chain research for solid wall insulation, Spon's
Architects and Builders Price Book 201331
and a report from Calderdale Council32
containing case studies on the costs of insulating different types of hard to treat cavity wall.
26
Purple Market Research (2009) Solid Wall Insulation Supply Chain Review, Energy Saving Trust, Energy Efficiency Partnership for Homes. 27
ILES. P, J (1999) Standard Dwellings For Energy Modelling, Centre for Technology Statistics and Assessment, Department of the Environment Transport and the Regions. 28
National Insulation Association (http://www.nia-uk.org/) 29
http://www.bre.co.uk/filelibrary/pdf/rpts/Hard_to_Treat_Homes_Part_I.pdf https://www.gov.uk/government/uploads/system/uploads/attachment_data/file/65993/788-hard-to-fill-cavity-walls-domestic.pdf 30
https://www.gov.uk/government/uploads/system/uploads/attachment_data/file/48433/5620-review-of-the-number-of-cavity-walls-in-great-brit.pdf 31
SPON’S Architects’ and builders’ price book 2013 ISBN:978-0-415-69077-5
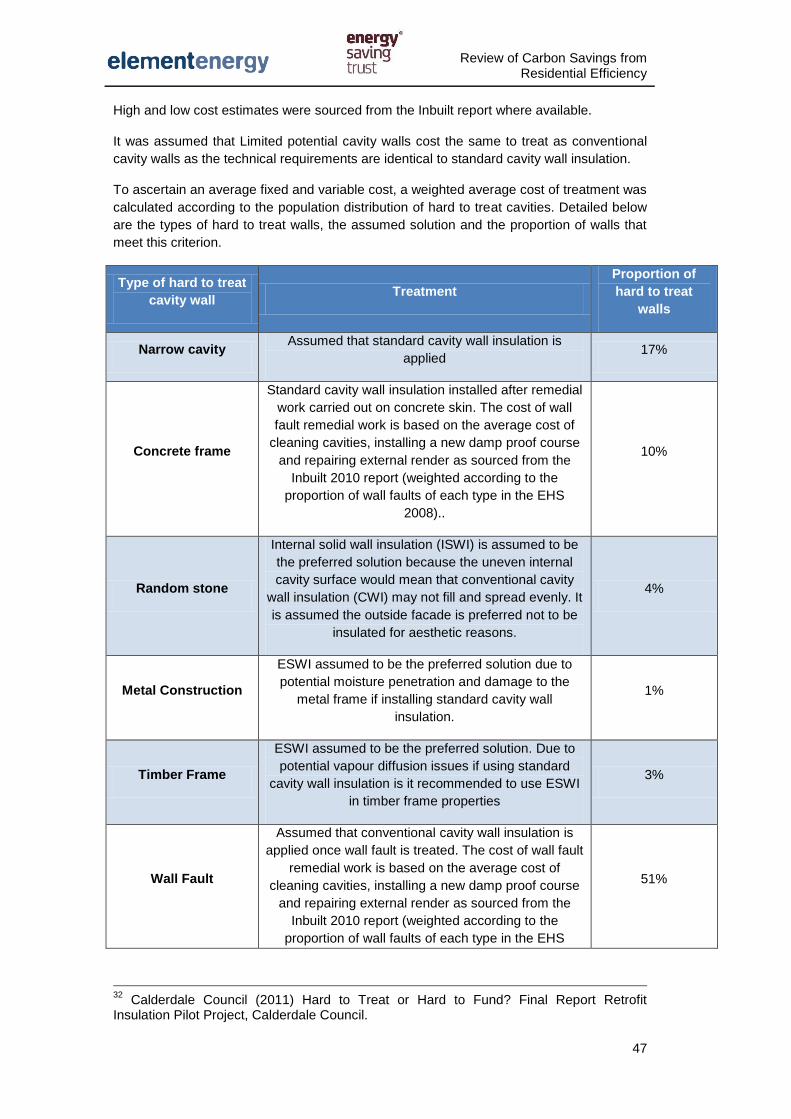
Review of Carbon Savings from Residential Efficiency
47
High and low cost estimates were sourced from the Inbuilt report where available.
It was assumed that Limited potential cavity walls cost the same to treat as conventional
cavity walls as the technical requirements are identical to standard cavity wall insulation.
To ascertain an average fixed and variable cost, a weighted average cost of treatment was
calculated according to the population distribution of hard to treat cavities. Detailed below
are the types of hard to treat walls, the assumed solution and the proportion of walls that
meet this criterion.
Type of hard to treat
cavity wall Treatment
Proportion of
hard to treat
walls
Narrow cavity Assumed that standard cavity wall insulation is
applied 17%
Concrete frame
Standard cavity wall insulation installed after remedial
work carried out on concrete skin. The cost of wall
fault remedial work is based on the average cost of
cleaning cavities, installing a new damp proof course
and repairing external render as sourced from the
Inbuilt 2010 report (weighted according to the
proportion of wall faults of each type in the EHS
2008)..
10%
Random stone
Internal solid wall insulation (ISWI) is assumed to be
the preferred solution because the uneven internal
cavity surface would mean that conventional cavity
wall insulation (CWI) may not fill and spread evenly. It
is assumed the outside facade is preferred not to be
insulated for aesthetic reasons.
4%
Metal Construction
ESWI assumed to be the preferred solution due to
potential moisture penetration and damage to the
metal frame if installing standard cavity wall
insulation.
1%
Timber Frame
ESWI assumed to be the preferred solution. Due to
potential vapour diffusion issues if using standard
cavity wall insulation is it recommended to use ESWI
in timber frame properties
3%
Wall Fault
Assumed that conventional cavity wall insulation is
applied once wall fault is treated. The cost of wall fault
remedial work is based on the average cost of
cleaning cavities, installing a new damp proof course
and repairing external render as sourced from the
Inbuilt 2010 report (weighted according to the
proportion of wall faults of each type in the EHS
51%
32
Calderdale Council (2011) Hard to Treat or Hard to Fund? Final Report Retrofit Insulation Pilot Project, Calderdale Council.

Review of Carbon Savings from Residential Efficiency
48
2008).
Too high (e.g. tower
blocks)
Costs provided in InBuilt 2012 report for this
treatment 5%
Exposed location (i.e.
those in coastal
locations or
frequently exposed
to driving rain)
Water proof external wall insulation used to prevent
moisture penetrating into the inner wall 9%
When applying these costs to the MACC and trajectories, three costs were used
depending on the recommended solution
- Internal wall insulation cost
- External wall insulation
- An average of the hard to treat cavity wall cost
Hard to treat cavity type Fixed cost Variable cost
Narrow cavity £250.12 £5.06
Concrete frame £6,000.00 £111.49
Random stone £2,400.00 £73.35
Metal construction £6,000.00 £111.49
Timber has cavity £6,000.00 £111.49
Wall fault £3,083.45 £5.06
Too high £4,000.00 £0.00
Exposed location £250.12 £5.06
7.2.4 Loft Insulation
According to a survey of NIA members33
the unsubsidised cost for insulating a 3 bed semi-
detached home is £300. As loft insulation is generally made of fibreglass, a relatively
inexpensive material, it has been assumed that 53% of the costs insulating a 3 bedroom
semi-detached home are fixed and 47% are variable, as per assumptions previously used
in the housing energy model. 47% of the variable cost was divided by the roof area of a
large semi-detached home (44.4 m2) according to the BRE Standard Dwelling dimensions.
The NIA did not provide a range of cost estimates for loft insulation, however, it was
assumed that the same costs range would apply as was provided for cavity wall insulation.
Therefore, a cost range of £275 - £325 was assumed for loft insulation. To calculate the
high and low range for hard to treat loft insulation, the average, min and max costs data
was sourced from the Calderdale Council report. The % range against the average was
used as the high and low range.
33
National Insulation Association (http://www.nia-uk.org/)

Review of Carbon Savings from Residential Efficiency
49
7.2.5 Floor Insulation (for Solid and Suspended Timber Floors)
Data on the costs of floor insulation was unavailable from the NIA. The best available
source was deemed to be from the EST Pay As You Save (PAYS) pilot scheme which has
records for the cost of floor insulation in 13 properties that had their floors insulated
alongside a description of each properties built form. There are two forms of floor
insulation: solid floor insulation and suspended timber floor insulation, the latter being
generally more expensive than the former. The cost of installation in the PAYS pilot varied
significantly from £160 to £1,820. The PAYS pilot data did not record what type of floor
was insulated however based on property age and a natural grouping of costs in to two
broad groups it was assumed that all installations costing less than £900 were suspended
timber floor and those costing over £900 were solid floor insulation. The total installation
costs were divided by the assumed ground floor area for each property type, as per the
BRE Standard Dwelling dimensions to calculate the variable cost per square meter. No
fixed installation cost was calculated. It should be noted that the incredibly small sample
size of this dataset means that the figures derived should be treated with caution and
further research is necessary to establish a reliable average cost for different types of floor
insulation. To calculate the high and low cost estimates the range of costs provided in the
PAYS data was used.
7.2.6 Double glazing
Data from the Glazing Federation for the cost of fitting C rated double glazing to 7
properties, along with the total window area replaced was processed using a regression
analysis to calculate the fixed and variable costs for installation. Then using Spon’s34
glazing cost estimation for installing A and C rated glazing we split out the total cost into a
fixed and variable format using the ratio between the two from the Glazing Federation
data. New VAT rates were applied to the costs. Data collected by Which showed A rated
triple glazing to be 1.8 times more expensive than C rated glazing35
. For this analysis, it
was assumed that the costs of B rated glazing would be half way in between the costs and
A and C rated glazing.
7.2.7 Insulated Doors
Average costs were derived from online research into insulated door costs from a sample
of 41 quotes. All doors with a U-value of 1.2 or lower are classed as insulated doors,
although insulated doors can be found with U-values as low as 0.6. Spon's Architects and
Builders Price Book 201336
was used to determine the installation cost. It is assumed to
take 1.5 hours to install a door at a cost of £46.13 per hour for labour.
7.2.8 Draught Proofing
The NIA quote that the unsubsidised cost for draught-proofing a 3 bedroom semi-detached
home is £200. The total perimeter of all windows and doors in a 3 bedroom semi-detached
home were taken from BRE’s standard dwellings (5.61 meters). This was used to calculate
the variable installation and material cost per meter of material required.
34
SPON’S Architects’ and builders’ price book 2013 ISBN:978-0-415-69077-5 35
http://www.which.co.uk/home-and-garden/home-improvements/reviews-ns/best-double-glazing-companies/double-glazing-prices/ 36
SPON’S Architects’ and builders’ price book 2013 ISBN:978-0-415-69077-5
Review of Carbon Savings from Residential Efficiency
50
7.2.9 Reduced Infiltration
The cost of reduced infiltration is assumed to be the same as draught proofing with the
inclusion of a fixed cost for expanding foam and decorators sealant used for blocking
gaps. The costs for these extra materials were sourced from online searches of three
major online DIY retailers.
7.2.10 Boiler Upgrade
Installation cost data for new condensing boilers was sourced from the 2010 boiler
scrappage scheme. Several thousand quoted unsubsidised prices were analysed to obtain
the average cost for installing an A rated boiler in each of the three categories of house
sizes used in the Housing Energy Model for both oil and gas boilers. The installation costs
assume that the household previously had a wet central heating system.
7.2.11 Heating Controls (Central Heating Programmer, Room
Thermostat and Thermostatic Radiator Valves (TRVs))
Material costs for heating controls were sourced from online research of 3 major DIY
retailers37
. The installation costs were taken from the Spon’s Electrical and Mechanical
Price Book 2013. The installation time of 1.15 hours was assumed charged at the same
hourly rate as a boiler installation.
7.2.12 Hot Water Cylinder Thermostat
Material costs were sourced from online research of 3 major DIY retailers38
. The
installation costs were taken from the Spon’s Electrical and Mechanical Price Book 2013.
The installation time of 30 minutes was assumed to be charged at the same hourly rate as
a boiler installation.
7.2.13 Passive Flue Gas Heat Recovery (PFGHR)
The most popular PFGHR unit on the market currently costs £55039
. Installation costs
were assumed to be £103 as per Spon's 2013 Mechanical & Electrical Price Book for 30
minutes work. Please note that the PFGHR refers to only the cost to install and buy the
unit, it does not including the cost of a gas condensing boiler if required.
7.2.14 Smart Meters
Costs per unit were derived from the DECC impact assessment on smart meters40
,
dividing the total business costs of £12.1 billion by the number of meters to be installed.
This is assumed to be installed is 57 million according to Consumer Focus Report Go
Smart, Get Smart41
.
37
Wicks, B&Q and Screwfix. 38
Wicks, B&Q and Screwfix. 39
Bourgeois. P, (2012) Mechical Ventilation and Heat Recovery Postive Input Ventilation and GasSaver Units Supply Chain Installer Analysis, Zero Carbon Britain, Energy Saving Trust. 40
DECC (2013) Smart meter roll-out for the domestic and small and medium non-domestic sectors. IA No: DECC0009 41
Consumer focus (2013) Go smart, get smart: http://www.consumerfocus.org.uk/files/2012/05/FAQ-Go-smart-get-smart5.pdf

Review of Carbon Savings from Residential Efficiency
51
Figure 14 Total potential for measures savings across stock with incremental inclusion of in use factors
0
1
2
3
4
5
6
7
8
9
PF
GH
R w
ith
ne
w b
oile
r
Con
de
nsin
g b
oile
r
SW
I -
I
Hea
tin
g c
ontr
ols
- T
RV
on
ly
Pre
20
02 d
oub
le t
o d
ou
ble
gla
zin
g
SW
I -
E
So
lid flo
or
Red
uce
d infiltra
tion
1 d
eg
. C
de
cre
ase
CW
I -
Hard
to t
reat
with C
WI
Pri
ma
ry T
V
Red
uce
d f
low
sho
wers
CW
I -
Ea
sy t
o tre
at
Sm
art
me
ters
- g
as
Hea
tin
g c
ontr
ols
- tim
er
+ T
RV
A+
+ r
ate
d F
ridg
e fre
eze
r
Halo
ge
n t
o L
ED
Sin
gle
to
do
ub
le g
lazin
g
Loft
(5
0-1
24 m
m)
Su
sp
end
ed
tim
be
r flo
or
PF
GH
R o
nly
Sm
art
me
ters
- e
lectr
icity
Hea
tin
g c
ontr
ols
- F
ull
A+
++
wa
shin
g m
ach
ine
Insu
late
d d
oors
Po
st
200
2 d
ou
ble
to
dou
ble
gla
zin
g
Se
co
nda
ry T
V
HW
tan
k in
su
latio
n f
rom
jacke
t
CW
I -
Hard
to t
reat
with S
WI-
E
A+
+ r
ate
d u
prig
ht fr
ee
ze
r
A r
ate
d tu
mble
dry
er
HW
cylin
der
therm
osta
t
GL
S t
o C
FL
A+
+ r
ate
d R
efr
ige
rato
r
A+
ele
ctr
ic o
ve
ns
Loft
(1
25
-199
mm
)
A+
rate
d d
ish
wash
er
Dra
ugh
t pro
ofin
g
A+
+ r
ate
d C
he
st
free
zer
Tu
rn o
ff lig
hts
CW
I -
Hard
to t
reat
with S
WI-
I
HW
tan
k in
su
latio
n f
rom
foa
m
CW
I -
low
im
pact
Loft
(5
0-1
24 m
m)
- H
ard
to
tre
at
HW
tan
k in
su
latio
n f
rom
non
e
Loft
(1
25
-199
mm
)- H
ard
to
tre
at
To
tal s
toc
k a
nn
ual e
mis
sio
n s
avin
gs
(M
t C
O2)
Technical potential Overlapping savings removed With comfort factor With full in use factors

Review of Carbon Savings from Residential Efficiency
52
Figure 15 Cumulative potential for emission savings by measures across stock with incremental inclusion of in use factors
-
10
20
30
40
50
60
70
PF
GH
R w
ith
ne
w b
oile
r
Con
de
nsin
g b
oile
r
SW
I -
I
Pre
20
02 d
oub
le t
o d
ou
ble
gla
zin
g
SW
I -
E
So
lid flo
or
Red
uce
d infiltra
tion
1 d
eg
. C
de
cre
ase
CW
I -
Hard
to t
reat
with C
WI
Pri
ma
ry T
V
CW
I -
Ea
sy t
o tre
at
Sm
art
me
ters
- g
as
Hea
tin
g c
ontr
ols
- T
RV
on
ly
A+
+ r
ate
d F
ridg
e fre
eze
r
Halo
ge
n t
o L
ED
Sin
gle
to
do
ub
le g
lazin
g
Red
uce
d f
low
sho
wers
Loft
(5
0-1
24 m
m)
Su
sp
end
ed
tim
be
r flo
or
PF
GH
R o
nly
Sm
art
me
ters
- e
lectr
icity
Hea
tin
g c
ontr
ols
- F
ull
A+
++
wa
shin
g m
ach
ine
Insu
late
d d
oors
Po
st
200
2 d
ou
ble
to
dou
ble
gla
zin
g
Se
co
nda
ry T
V
HW
tan
k in
su
latio
n f
rom
jacke
t
CW
I -
Hard
to t
reat
with S
WI-
E
A+
+ r
ate
d u
prig
ht fr
ee
ze
r
A r
ate
d tu
mble
dry
er
HW
cylin
der
therm
osta
t
GL
S t
o C
FL
A+
+ r
ate
d R
efr
ige
rato
r
A+
ele
ctr
ic o
ve
ns
Loft
(1
25
-199
mm
)
A+
rate
d d
ish
wash
er
Dra
ugh
t pro
ofin
g
A+
+ r
ate
d C
he
st
free
zer
Tu
rn o
ff lig
hts
CW
I -
Hard
to t
reat
with S
WI-
I
HW
tan
k in
su
latio
n f
rom
foa
m
CW
I -
low
im
pact
Loft
(5
0-1
24 m
m)
- H
ard
to
tre
at
Hea
tin
g c
ontr
ols
- tim
er
+ T
RV
HW
tan
k in
su
latio
n f
rom
non
e
Loft
(1
25
-199
mm
)- H
ard
to
tre
at
An
nu
al
sto
ck
em
iss
ion
sa
vin
gs
(M
t C
O2)
Technical potential Overlapping savings removed With comfort factor With full in use factors

Review of Carbon Savings from Residential Efficiency
53
8 The Marginal Abatement Cost Curves (MACC)
8.1 MACC methodology
The MACC model uses the energy savings identified across the UK building stock, the
heating fuel type to determine the annual fuel bill (£) and annual emission (tCO2) savings.
The fuel bill savings are based on the DECC long run variable fuel costs for fossil fuels,
while electricity costs are based on the average of the long run marginal cost of nuclear
and onshore wind generation under CCC projections. The measure fixed and marginal
cost of installation and the measure lifetime is used to determine the annualised cost of
installation in individual house types. The cost effectiveness of the measures is then
calculated as:
( )
( ) ( )
( )
The annualised installation costs, annual fuel bill savings (£) and the CO2 savings (t) are
then aggregated across the whole UK stock for each measure to calculate its average cost
effectiveness across the whole domestic stock. The measures are then sorted by their cost
effectiveness in ascending order to generate the MACC outputs.
8.2 The MACC Outputs
The MACC outputs are generated including all the thermal measures, electrical appliances
and behavioural changes. The electrical appliances, energy efficient lighting and boiler
replacement show negative cost effectiveness due to having no incremental cost attributed
to them, as they are end of lifetime replacement measures. The additional cost of the best
energy rating appliance is negligible compared to the conventional replacement
technology and in most cases regulation means that there is no low efficiency alternative
e.g. condensing boilers, CFL lighting. For all other measures, the full installation cost is
considered in the calculation of the annualised capital cost. Amongst the thermal
measures, easy to treat CWI, loft insulation in homes with existing loft thickness of 0-
49mm, hot water cylinder insulation and heating controls (TRV) show favourable
economics with the fuel savings paying back for the installation costs over their lifetime
(discounted at 3.5%). However with the inclusion of full in use factors, measures such as
heating controls, HW cylinder thermostat and loft (125-199mm) are no longer economic
due to reduced savings. The measures with high cost of emission reduction but with
significant potential for savings include SWI (internal and external), double glazing,
reduced infiltration and solid floor insulation. The detailed MACC outputs and the
performance of individual measures are shown below:

Review of Carbon Savings from Residential Efficiency
54
Figure 16 Breakdown of weighted average cost, annual fuel (£) and emission (t CO2) savings by measure (no IUF applied)
-0.5
0
0.5
1
1.5
2
-£200
-£100
£0
£100
£200
£300
£400
£500
£600
£700
£800
Ave
rag
e a
nn
ua
l e
mis
sio
n s
avin
gs
(t
CO
2)
Ave
rag
e m
ea
su
re a
nn
uali
se
d c
osts
an
d s
avin
gs
(£)
Annualised cost per installation (£) Annual fuel savings (£) Net annual cost Annual emission savings (t CO2)

Review of Carbon Savings from Residential Efficiency
55
Figure 17 MACC based on total potential without in use factors (overlapping savings removed)

Review of Carbon Savings from Residential Efficiency
56
Table 8 Measure technical potential for savings and cost effectiveness without in use factors (overlapping savings removed)
Measure Total annual savings of
UK stock (kt CO2) Cost effectiveness (£/t CO2)
Turn off lights 134 -£381
A+ electric ovens 295 -£357
GLS to CFL 313 -£356
A++ rated upright freezer 400 -£350
A++ rated Chest freezer 195 -£350
A++ rated Fridge freezer 1,290 -£348
A++ rated Refrigerator 308 -£344
Secondary TV 492 -£331
Primary TV 1,516 -£322
A+ rated dishwasher 252 -£294
A+++ washing machine 565 -£294
Halogen to LED 1,218 -£253
Condensing boiler 777 -£206
HW tank insulation from none 16 -£184
HW tank insulation from jacket 458 -£175
Reduced flow showers 1,170 -£172
1 deg. C decrease 1,180 -£165
HW tank insulation from foam 77 -£163
CWI - Easy to treat 1,441 -£136
Loft (50-124 mm) 1,023 -£97
Suspended timber floor 1,012 -£93
Draught proofing 216 -£50
Heating controls - TRV only 718 -£31
CWI - Hard to treat with CWI 1,829 -£30

Review of Carbon Savings from Residential Efficiency
57
Loft (125-199 mm) 263 -£24
PFGHR with new boiler 6,001 -£9
HW cylinder thermostat 383 -£5
Reduced infiltration 2,377 £16
Heating controls - Full 381 £37
SWI - I 6,195 £79
CWI - Hard to treat with SWI-I 120 £89
Heating controls - timer + TRV 18 £118
Solid floor 3,091 £121
CWI - low impact 62 £151
A rated tumble dryer 390 £166
Single to double glazing 1,176 £202
Smart meters - gas 841 £294
Smart meters - electricity 654 £319
SWI - E 3,185 £361
Loft (50-124 mm) - Hard to treat 33 £406
CWI - Hard to treat with SWI-E 437 £550
Insulated doors 547 £617
Pre 2002 double to double glazing 4,407 £777
PFGHR only 520 £1,043
Loft (125-199 mm)- Hard to treat 8 £1,101
Post 2002 double to double glazing 510 £3,886

Review of Carbon Savings from Residential Efficiency
58
Figure 18 MACC based on total potential in traded sector without in use factors (overlapping savings removed)

Review of Carbon Savings from Residential Efficiency
59
Figure 19 MACC based on total potential in non-traded sector without in use factors (overlapping savings removed)

Review of Carbon Savings from Residential Efficiency
60
Figure 20 MACC based on total potential with comfort factor included (overlapping savings removed)
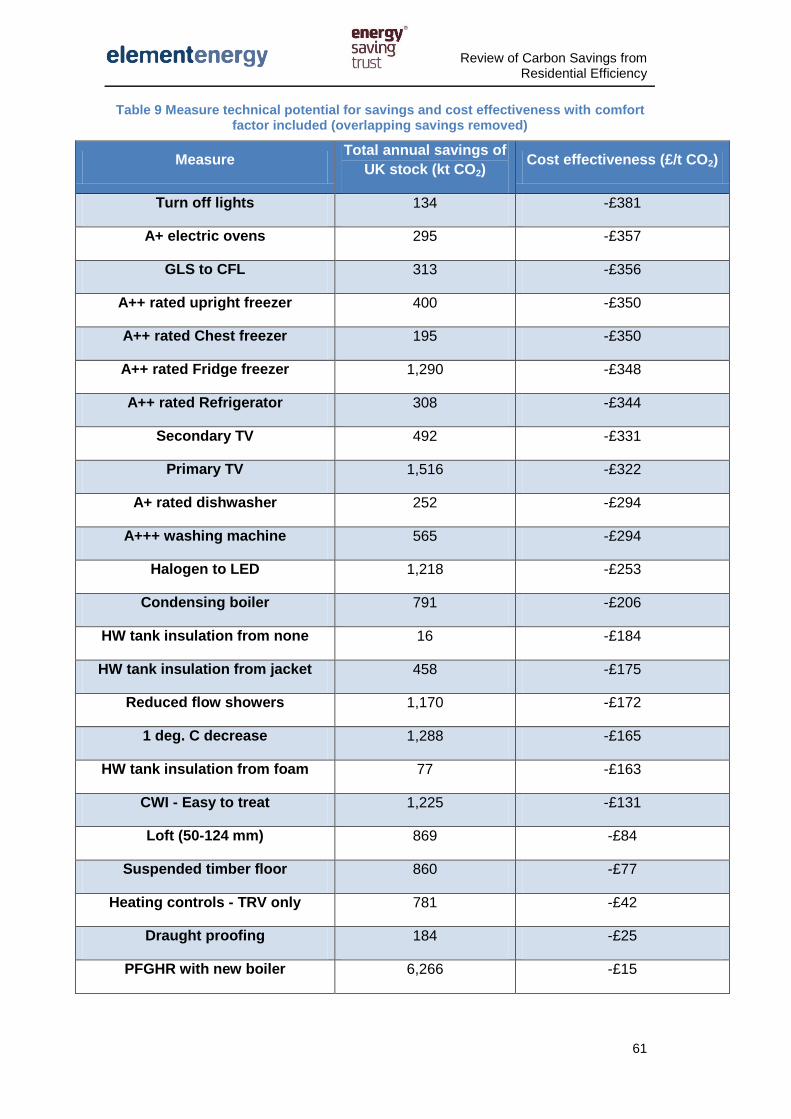
Review of Carbon Savings from Residential Efficiency
61
Table 9 Measure technical potential for savings and cost effectiveness with comfort factor included (overlapping savings removed)
Measure Total annual savings of
UK stock (kt CO2) Cost effectiveness (£/t CO2)
Turn off lights 134 -£381
A+ electric ovens 295 -£357
GLS to CFL 313 -£356
A++ rated upright freezer 400 -£350
A++ rated Chest freezer 195 -£350
A++ rated Fridge freezer 1,290 -£348
A++ rated Refrigerator 308 -£344
Secondary TV 492 -£331
Primary TV 1,516 -£322
A+ rated dishwasher 252 -£294
A+++ washing machine 565 -£294
Halogen to LED 1,218 -£253
Condensing boiler 791 -£206
HW tank insulation from none 16 -£184
HW tank insulation from jacket 458 -£175
Reduced flow showers 1,170 -£172
1 deg. C decrease 1,288 -£165
HW tank insulation from foam 77 -£163
CWI - Easy to treat 1,225 -£131
Loft (50-124 mm) 869 -£84
Suspended timber floor 860 -£77
Heating controls - TRV only 781 -£42
Draught proofing 184 -£25
PFGHR with new boiler 6,266 -£15

Review of Carbon Savings from Residential Efficiency
62
CWI - Hard to treat with CWI 1,554 -£7
HW cylinder thermostat 383 -£5
Loft (125-199 mm) 224 £1
Heating controls - Full 412 £23
Reduced infiltration 2,020 £49
Heating controls - timer + TRV 20 £96
SWI - I 5,266 £126
CWI - Hard to treat with SWI-I 102 £132
A rated tumble dryer 390 £166
Solid floor 2,628 £172
CWI - low impact 52 £210
Smart meters - gas 894 £267
Single to double glazing 1,000 £271
Smart meters - electricity 654 £319
SWI - E 2,707 £453
Loft (50-124 mm) - Hard to treat 28 £508
CWI - Hard to treat with SWI-E 372 £679
Insulated doors 465 £758
PFGHR only 581 £916
Pre 2002 double to double glazing 3,746 £944
Loft (125-199 mm)- Hard to treat 7 £1,325
Post 2002 double to double glazing 433 £4,602
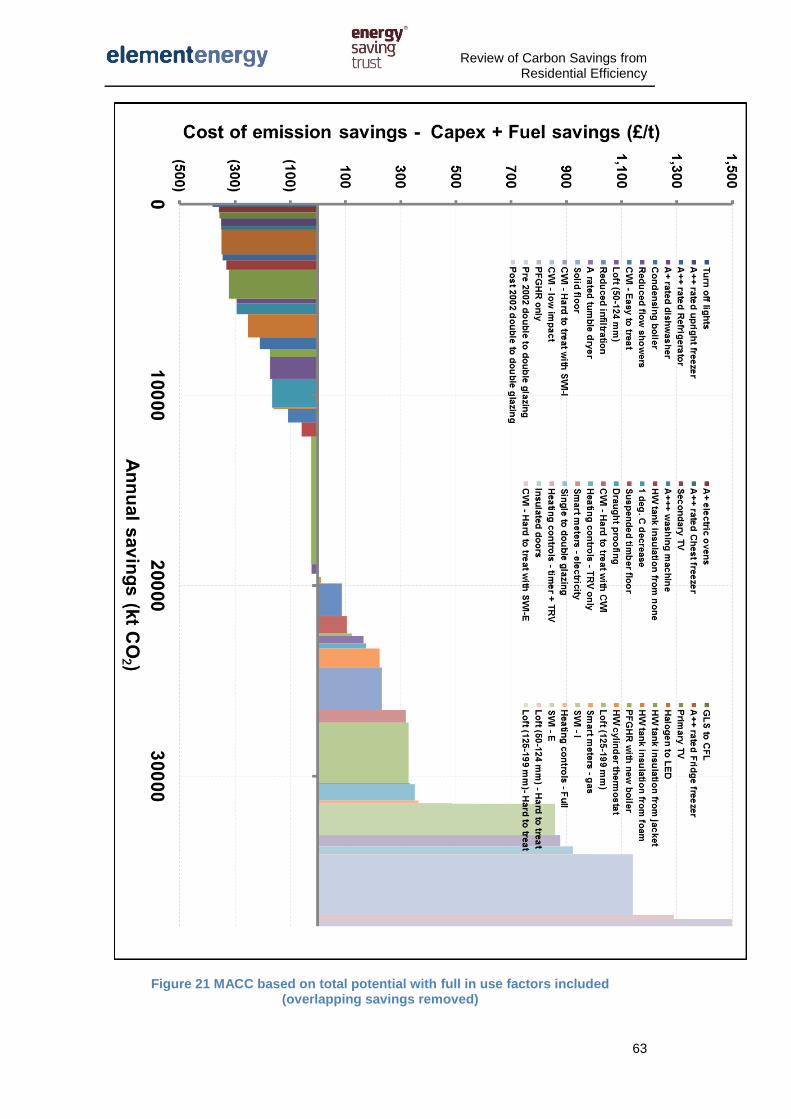
Review of Carbon Savings from Residential Efficiency
63
Figure 21 MACC based on total potential with full in use factors included (overlapping savings removed)

Review of Carbon Savings from Residential Efficiency
64
Table 10 Measure technical potential for savings and cost effectiveness with full in use factors included (overlapping savings removed)
Measure Total annual savings of
UK stock (kt CO2) Cost effectiveness (£/t CO2)
Turn off lights 134 -£381
A+ electric ovens 295 -£357
GLS to CFL 313 -£356
A++ rated upright freezer 400 -£350
A++ rated Chest freezer 195 -£350
A++ rated Fridge freezer 1,290 -£348
A++ rated Refrigerator 308 -£344
Secondary TV 492 -£331
Primary TV 1,516 -£322
A+ rated dishwasher 252 -£294
A+++ washing machine 565 -£294
Halogen to LED 1,218 -£253
Condensing boiler 614 -£209
HW tank insulation from none 14 -£183
HW tank insulation from jacket 389 -£174
Reduced flow showers 1,170 -£172
1 deg. C decrease 1,499 -£165
HW tank insulation from foam 66 -£160
CWI - Easy to treat 717 -£107
Suspended timber floor 731 -£59
PFGHR with new boiler 6,697 -£23
Loft (50-124 mm) 509 -£22
Draught proofing 156 £3
HW cylinder thermostat 345 £11
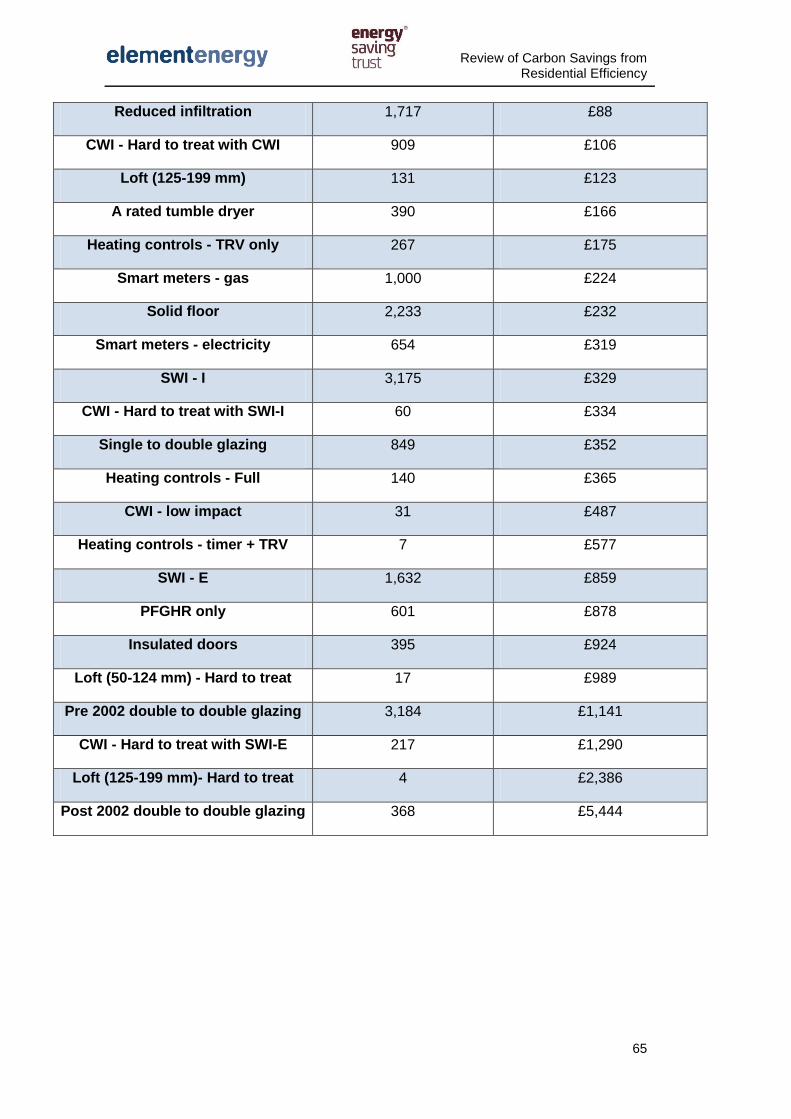
Review of Carbon Savings from Residential Efficiency
65
Reduced infiltration 1,717 £88
CWI - Hard to treat with CWI 909 £106
Loft (125-199 mm) 131 £123
A rated tumble dryer 390 £166
Heating controls - TRV only 267 £175
Smart meters - gas 1,000 £224
Solid floor 2,233 £232
Smart meters - electricity 654 £319
SWI - I 3,175 £329
CWI - Hard to treat with SWI-I 60 £334
Single to double glazing 849 £352
Heating controls - Full 140 £365
CWI - low impact 31 £487
Heating controls - timer + TRV 7 £577
SWI - E 1,632 £859
PFGHR only 601 £878
Insulated doors 395 £924
Loft (50-124 mm) - Hard to treat 17 £989
Pre 2002 double to double glazing 3,184 £1,141
CWI - Hard to treat with SWI-E 217 £1,290
Loft (125-199 mm)- Hard to treat 4 £2,386
Post 2002 double to double glazing 368 £5,444

Review of Carbon Savings from Residential Efficiency
66
9 Appendix
9.1 Cavity wall insulation potential
Calculating total numbers of Hard to Treat Cavity walls
A large number of the homes in the EHS, SHCS and Living in Wales surveys could be put in
to two or more of the available wall type categories. For example, approximately 120,000
homes in the Narrow cavity category are also listed as having wall faults.
The following hierarchy was used to ensure that homes in the survey were placed in to
one category only.
Limited potential Hard to treat
V
Limited potential
V
Narrow cavity
V
Concrete / Metal / Timber frame
V
Wall Fault
V
Greater than 3 stories
V
Exposed location
V
Random stone
V
Standard easy to treat cavity
Please note that, although this approach has the advantage of more accurately
quantifying hard to treat cavities in total, it makes the results less useful in quantifying
the relative potential for each hard to treat cavity type as categories at the top of the
hierarchy are represented more accurately than those at the bottom of the hierarchy.

Review of Carbon Savings from Residential Efficiency
67
The total number of each hard to treat cavity wall type before taking in to account the
overlap between categories is provided in the table below:
Wall type Description
Potential (ignoring overlap
between categories)
GB only 2008
Potential (taking in to
account overlap
between categories)
Stock (%)
Solid walls Solid Wall (un-insulated) 7,194,436
26%
Solid wall (insulated) 209,000
1%
Insulated Cavities or
equivalent U-value
Insulated cavities (+ 5% Pre 1990 Un-insulated) 13,342,659
48%
Insulated or equivalent (Post 1990) 1,365,700
5%
Empty cavities with limited potential for improvement
Standard cavities with Limited potential for improvement 1980 - 1990 (easy to treat)
838,920
3%
Hard to treat cavities with Limited potential for improvement (1980 – 1990) plus un-insulatable timber frame dwellings with insulation between
the studwork
369,881
1%
Standard empty cavities
Not insulated Easy to treat 1,644,482
6%
Total Hard to Treat cavities* 3,617,031 2,924,923 10%
Hard to fill empty cavities
Hard to treat: Narrow 505,853 474,989 2%
Hard to treat: Concrete frame 506,153 524,889 2%
Hard to treat Metal Frame 74,651 62,888 0%
Hard to treat Timber frame (un-insulated studwork with masonry cavity)
69,159 65,483 0%
Hard to treat: Wall fault 1,642,354 1,386,191 5%
Hard to treat: Too high (greater than 3 stories) 418,861 91,091 0%
Hard to treat: Exposed Location 225,000 199,953 1%
Hard to treat: Random stone 175,000 119,438 0%
Total 27,890,000
100%
Approximately 120,000 narrow cavities are also listed as having wall faults in the GB
housing surveys. Approximately 170,000 homes listed as being 3 stories of greater are
also classified as being a hard to treat cavity due to being of concrete, metal or timber
frame construction.

Review of Carbon Savings from Residential Efficiency
68
Notes on the differences between EST and DECC analysis The EST estimates differ from the DECC potentials for wall insulation, particularly in the area of easy to treat vs hard to treat cavity walls. The differences between the two estimates are presented below:
DECC April 2013
EST April 2013
Insulated
Insulated 10,450,000 13,342,659
Insulated or equivalent
2,920,000 1,365,700
Uncertainty 470,000
Remaining potential
Limited potential
Easy to treat 940,000 838,920
Hard to treat 500,000 369,881
Not insulated
Easy to treat 740,000 1,644,482
Hard to treat
Narrow 535,000 474,989
Concrete 555,000 524,889
Random Stone 175,000 119,438
Metal Construction 110,000 62,888
Timber (has cavity) 103,000 65,483
Wall Fault 1,350,000 1,386,191
Too high 66,500 91,091
Exposed location 225,000 199,953
Total Not Insulated Hard to Treat
3,120,000 2,924,923

Review of Carbon Savings from Residential Efficiency
69
Solid walls
Insulated Solid wall
205,000 209,000
Uncertainty (Solid wall)
126,000
Un-insulated solid wall
7,660,000 7,194,436
Total properties
26,661,000
27,890,000
In addition to the specific reasons for the divergence listed in the methodology above, there are a number of other general reasons why the EST analysis would be expected to yield different results to the DECC quarterly insulation potentials;
1. The DECC estimates for hard to treat cavity wall numbers are based on the figures provided in the Inbuilt 2012 report on hard to treat cavity walls. This report provides a range for the likely number of dwellings in each individual hard to treat category. In calculating the Quarterly Insulation potentials, DECC assumes the mid-point of these ranges as being the most likely number of hard to treat cavity walls in each category and assumes that each hard to treat category is additional with no overlap between them. These mid-points mirror closely the EST estimates for Hard to treat cavity wall categories before overlap between them is taken in to account as provided in the above table. The EST analysis looks at the overlap between the hard to treat types and therefore arrives at a lower estimate of hard to treat cavity walls overall. This is despite the fact that in certain cases, more hard to treat cavity wall are identified in each individual category (for example by including all dwellings over three stories, as opposed to all dwellings over four stories).
2. In a number of cases, hard to treat cavity walls as classified by Inbuilt could also be classified as solid walls by the housing surveys. This is particularly the case for concrete, metal and timber frame construction. Therefore, we believe there is an overlap between the hard to treat cavity wall numbers and the solid wall numbers in the DECC analysis.
3. DECC adds 5% of un-insulated cavity walls to the insulated column and puts an additional 5% of un-insulated cavities in to the uncertainty columns. EST does not think it necessary to allow for 10% inaccuracy in the housing surveys due to the creation of the limited potential and insulated or equivalent columns which already remove a large amount of the potential for non-identification of cavity wall insulation.
4. In the DECC quarterly insulation potentials, the Northern Ireland stock is assumed to mirror the mix of wall types in the UK stock and these number are applied proportionally to the Northern Ireland housing stock. The EST analysis used data from the 2011 Northern Ireland housing survey which shows a greater proportion of insulated cavities than the UK stock as a whole.
5. The DECC analysis also assumes that there are no additional hard to treat cavities in Northern Ireland whereas the EST analysis applies a proportional increase in hard to treat cavity wall numbers based on the Northern Ireland housing stock numbers.

Review of Carbon Savings from Residential Efficiency
70
6. The EST analysis uses the latest Ofgem definition of Hard to treat cavities – too tall which is a cavity wall greater than 3 stories. DECC uses a definition of too tall as being 4 stories or greater.
The table below describes in detail the methodology for each category of wall type making
reference to any differences to the DECC methodology.
Measure
DECC methodology EST methodology Explanation for difference
Insulated cavity wall
All pre 1996 (1992 in Scotland) properties listed as having cavity wall insulation in the GB housing surveys + 5% additional Pre 1996 cavities
All properties listed as having a cavity wall in the GB housing surveys + 5% additional Pre 1990 cavities
840,000 new build dwellings post 2008 all assumed to be Insulated Cavity
1996 age band does not exist in the EHS. Not clear how DECC applied this age band to the housing survey age bands.
Insulated or meets equivalent standard
All post 1995 properties (post 1991 in Scotland) assumed to meet a U-value of 0.45 or better
840,000 new build dwellings post 2008 all assumed to be Insulated Cavity
All post 1990 properties assumed to meet a U-value of 0.45 or better
1996 age band does not exist in the EHS. Not clear how DECC applied this age band to the housing survey age bands.
Uncertainty Based on the BRE recommendation of 5-10% under-reporting of insulated cavities in the EHS, DECC apply an additional 5% uncertainty to all pre 1996 empty cavities (the other 5% is accounted for in the ‘Insulated Cavity’ category).
Category removed. The BRE recommendation of 5 - 10% adjustment of the Insulated cavity potential was suggested to account for the difficulty of surveyors identifying cavity wall insulation, particularly in dwellings with cavities filled during construction. 5% of this uncertainty is already accounted for in the ‘Insulated Cavity’ category. The remainder of the uncertainty is assumed to have been eliminated by the creation of the ‘Insulated or meets equivalent standard’ and ‘Limited potential’ categories which already accounts for any post 1980 properties listed as ‘un-insulated’. EST’s view is that to remove Post 1980s empty cavities from the
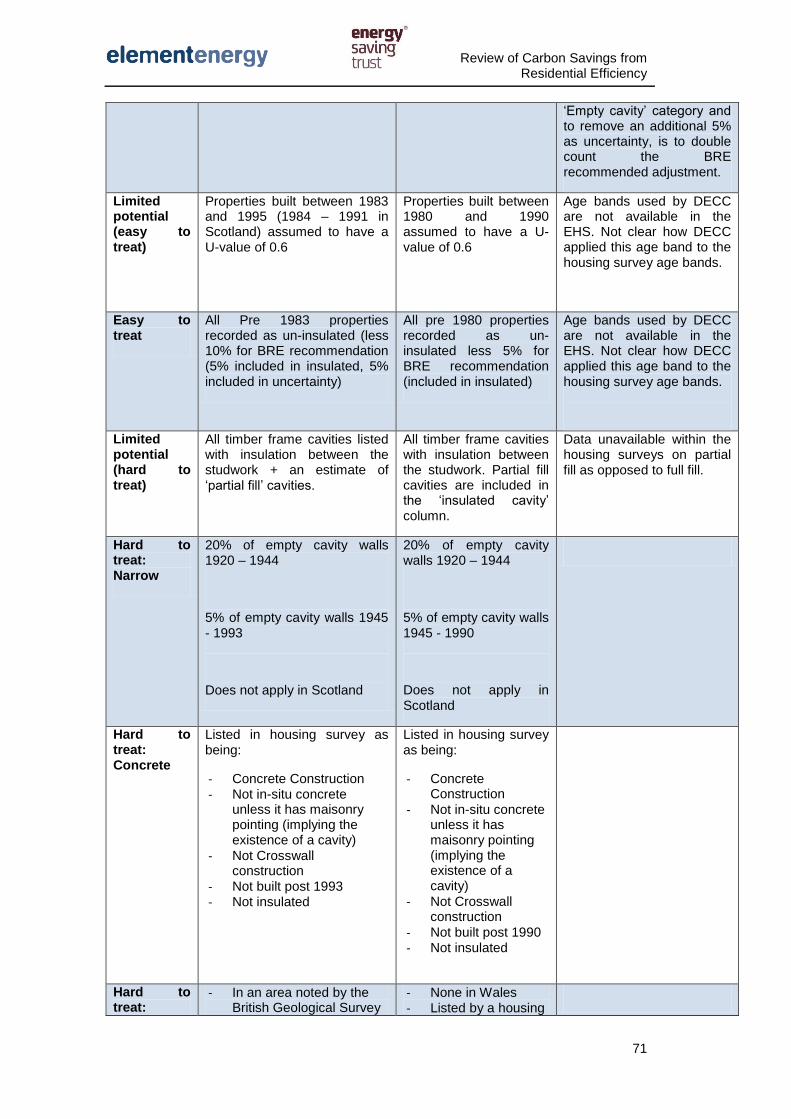
Review of Carbon Savings from Residential Efficiency
71
‘Empty cavity’ category and to remove an additional 5% as uncertainty, is to double count the BRE recommended adjustment.
Limited potential (easy to treat)
Properties built between 1983 and 1995 (1984 – 1991 in Scotland) assumed to have a U-value of 0.6
Properties built between 1980 and 1990 assumed to have a U-value of 0.6
Age bands used by DECC are not available in the EHS. Not clear how DECC applied this age band to the housing survey age bands.
Easy to treat
All Pre 1983 properties recorded as un-insulated (less 10% for BRE recommendation (5% included in insulated, 5% included in uncertainty)
All pre 1980 properties recorded as un-insulated less 5% for BRE recommendation (included in insulated)
Age bands used by DECC are not available in the EHS. Not clear how DECC applied this age band to the housing survey age bands.
Limited potential (hard to treat)
All timber frame cavities listed with insulation between the studwork + an estimate of ‘partial fill’ cavities.
All timber frame cavities with insulation between the studwork. Partial fill cavities are included in the ‘insulated cavity’ column.
Data unavailable within the housing surveys on partial fill as opposed to full fill.
Hard to treat: Narrow
20% of empty cavity walls 1920 – 1944
5% of empty cavity walls 1945 - 1993
Does not apply in Scotland
20% of empty cavity walls 1920 – 1944
5% of empty cavity walls 1945 - 1990
Does not apply in Scotland
Hard to treat: Concrete
Listed in housing survey as being:
- Concrete Construction - Not in-situ concrete
unless it has maisonry pointing (implying the existence of a cavity)
- Not Crosswall construction
- Not built post 1993 - Not insulated
Listed in housing survey as being:
- Concrete Construction
- Not in-situ concrete unless it has maisonry pointing (implying the existence of a cavity)
- Not Crosswall construction
- Not built post 1990 - Not insulated
Hard to treat:
- In an area noted by the British Geological Survey
- None in Wales - Listed by a housing

Review of Carbon Savings from Residential Efficiency
72
Random Stone
as using random stone cavity construction
- None in Wales - Listed by a housing
survey as having; - Masonry construction in
England
- In a BGS local authority - Stone Construction in
Scotland
- Built prior to 1993, Not a flat
- Not solid wall - Not insulated - Not in an urban location
survey as having;
- Masonry construction in England
- Stone Construction in Scotland
- Built prior to 1990, Not a flat
- Not solid wall - Not insulated - Not in an urban
location
Hard to treat: Metal Construction
- Listed as Metal construction in a housing survey
- Not Post 1993 - Not insulated
- Listed as Metal construction in a housing survey
- Not Post 1990 - Not insulated
Hard to treat: Timber frame (un-insulated studwork) with masonry cavity
- Timber frame - Built pre 1979 - Not identified as having
insulation in the studwork
- Cavity wall construction (Scotland)
- Masonry Pointing (England and Wales)
- Timber frame - Built pre 1979 - Not identified as
having insulation in the studwork
- Cavity wall construction (Scotland)
- Masonry Pointing (England and Wales)
Hard to treat: Wall fault
- Unfit or defective walls (Wales)
- Urgent repair required for wall finish or penetrative damp (Scotland)
- Unfit or defective walls (England)
- Unfit or defective walls (Wales)
- Urgent repair required for wall finish or penetrative damp (Scotland)
- Unfit or defective walls (England)
Hard to treat: Too High
- Greater than 4 stories Greater than 4 stories
Hard to treat: Exposed Location
- Located in Exp Zone 3 but local conditions accentuate exposure
- Located in Exp Zone 4 and local conditions do not protect from Exposure
- Located in Exp Zone 3 but local conditions accentuate exposure
- Located in Exp Zone 4 and local conditions do not protect from Exposure

Review of Carbon Savings from Residential Efficiency
73
9.2 Fuel cost and CO2 content42
Fuel 2013 central cost (p/kWh) CO2 content (kg/kWh)
Gas 2.34 0.18
Electricity 9.79 0.38
Oil 5.16 0.24
Coal 3.26 0.33
42
Electricity cost and CO2 content provided by CCC Fossil fuel costs and CO2 content based on DECC central scenario
-
2.0
4.0
6.0
8.0
10.0
12.0
14.0
Fu
el c
ost
(p/k
Wh
)
Gas Electricity

Review of Carbon Savings from Residential Efficiency
74
9.3 Weighted average installation costs, lifetime fuel (£) and
emission savings (t CO2)
The installation costs of the measures depend on the house type attributes such as wall
area, loft area and thickness, glazing area etc. This gives a variation of installation costs
and performance (annual fuel (£) and emission (t CO2) savings). The weighted average
cost and savings from measure across the total UK stock is presented below:

Review of Carbon Savings from Residential Efficiency
75
Figure 22 Breakdown of weighted average cost of installation of measures
£0
£2,000
£4,000
£6,000
£8,000
£10,000
£12,000
£14,000
Weighted average cost per installation of measure

Review of Carbon Savings from Residential Efficiency
76
Figure 23 Breakdown of weighted average discounted (3.5%) lifetime fuel savings (£)
£0
£500
£1,000
£1,500
£2,000
£2,500
£3,000
£3,500
£4,000
£4,500
£5,000
Weighted average discounted (3.5%) lifetime fuel savings

Review of Carbon Savings from Residential Efficiency
77
Figure 24 Breakdown of weighted average lifetime emission savings (t CO2)
0
5
10
15
20
25
30
35
40
45
Weighted average lifetime emission savings (t CO2)
Related Documents