University of Bath PHD Passive and renewable low carbon strategies for residential buildings in hot humid climates Al Shamsi, Yahya Award date: 2017 Awarding institution: University of Bath Link to publication Alternative formats If you require this document in an alternative format, please contact: [email protected] Copyright of this thesis rests with the author. Access is subject to the above licence, if given. If no licence is specified above, original content in this thesis is licensed under the terms of the Creative Commons Attribution-NonCommercial 4.0 International (CC BY-NC-ND 4.0) Licence (https://creativecommons.org/licenses/by-nc-nd/4.0/). Any third-party copyright material present remains the property of its respective owner(s) and is licensed under its existing terms. Take down policy If you consider content within Bath's Research Portal to be in breach of UK law, please contact: [email protected] with the details. Your claim will be investigated and, where appropriate, the item will be removed from public view as soon as possible. Download date: 16. Feb. 2022

Welcome message from author
This document is posted to help you gain knowledge. Please leave a comment to let me know what you think about it! Share it to your friends and learn new things together.
Transcript
University of Bath
PHD
Passive and renewable low carbon strategies for residential buildings in hot humidclimates
Al Shamsi, Yahya
Award date:2017
Awarding institution:University of Bath
Link to publication
Alternative formatsIf you require this document in an alternative format, please contact:[email protected]
Copyright of this thesis rests with the author. Access is subject to the above licence, if given. If no licence is specified above,original content in this thesis is licensed under the terms of the Creative Commons Attribution-NonCommercial 4.0International (CC BY-NC-ND 4.0) Licence (https://creativecommons.org/licenses/by-nc-nd/4.0/). Any third-party copyrightmaterial present remains the property of its respective owner(s) and is licensed under its existing terms.
Take down policyIf you consider content within Bath's Research Portal to be in breach of UK law, please contact: [email protected] with the details.Your claim will be investigated and, where appropriate, the item will be removed from public view as soon as possible.
Download date: 16. Feb. 2022
University of Bath
PHD
Passive and renewable low carbon strategies for residential buildings in hot humidclimates
Al Shamsi, Yahya
Award date:2017
Awarding institution:University of Bath
Link to publication
General rightsCopyright and moral rights for the publications made accessible in the public portal are retained by the authors and/or other copyright ownersand it is a condition of accessing publications that users recognise and abide by the legal requirements associated with these rights.
• Users may download and print one copy of any publication from the public portal for the purpose of private study or research.• You may not further distribute the material or use it for any profit-making activity or commercial gain• You may freely distribute the URL identifying the publication in the public portal ?
Take down policyIf you believe that this document breaches copyright please contact us providing details, and we will remove access to the work immediatelyand investigate your claim.
Download date: 15. May. 2019
PASSIVE AND RENEWABLE LOW CARBON
STRATEGIES FOR RESIDENTIAL BUILDINGS IN
HOT HUMID CLIMATES
Yahya Al Shamsi
A thesis submitted for the degree of Doctor of Philosophy
University of Bath
Department of Architecture and Civil Engineering
September 2017
ii
Abstract
The building sector alone accounts for almost 40% of the total energy demand, whereas people
spend more than 80% of their time indoors. Reducing the energy demand in buildings is crucial
to the achievement of a sustainable building environment. At the same time, it is important not
to deteriorate people’s health, well-being and comfort in buildings. Thus, designing healthy
and energy efficient buildings is one of the most challenging tasks. The housing industry in
Oman overlooked the energy consumption of buildings and their adverse impact on the climate.
This led to an increased energy consumption and its associated CO2 emissions. Hence, this
research aims to experimentally evaluate the key elements and strategies required to increase
the adoption of lifetime low-carbon domestic buildings in Oman, that will provide the most
benefits towards a more sustainable energy future.
In order to achieve the aims stated above, a comprehensive, multi-stage study has been
conducted, involving the review of the status of low carbon buildings in the GCC countries and
in Oman compared to the global scale. The technical viability of low-energy codes and
standards for domestic buildings in the Sultanate of Oman were then examined in order to
identify the factors resulting in increased energy consumption. These factors include a
regulatory framework, market support, as well as the wellness and awareness of the society
with respect to sustainability. Thereafter, the research identified the main elements of the
operational deficiency interfering with the adoption of low carbon buildings. This covered the
status of the housing stock typology in Oman, building energy consumption characteristics and
usage patterns, occupant behaviours, regulation and government support. Accordingly, a
roadmap was suggested for low carbon strategy to help the country overcome the adverse
effects of energy usage in domestic buildings.
In this context, each stage of this research utilised a specific methodology including public
survey analyses, site visits, modelling analyses and expert consultation using an analytical
approach. Furthermore, the research methodology incorporated a comparative analysis for the
samples of the buildings including conventional and low carbon buildings in the Sultanate of
Oman using descriptive, qualitative and spatial analyses for these case studies.
iii
In addition, the study reviewed the key features characterising the energy efficiency of low
carbon buildings in the hot humid climate through the assessment of a set of energy efficiency
measures (EEMs) for residential buildings in the selected climate. These EEMs involved the
building envelope, building shape, orientation, materials, glazing, insulation, shading, natural
ventilation, daylight and the application of renewables. Subsequently, a low carbon domestic
building design template was established that supports architects, civil engineers and building
professionals in the design of sustainable homes for the selected climate, context and cultural
requirements. The template was designed to evaluate the overall building energy consumption
based on building physics and the operation pattern and provided the energy evaluation for the
proposed design in order to maximise energy savings. Then, the template was tested on the
energy use of viable housing prototypes employing the criteria of the established template.
This study contributes to the body of knowledge within this field by offering a low carbon
domestic framework for the design of low energy residential buildings in Oman. It proves that
it is possible to reduce the energy consumption of residential buildings due to the application
of each EEM by 3.7% to 18.2%. Furthermore, the research identified the possible lower and
zero cost EEMs which can be implemented in the context of Oman. The findings are broadly
applicable to other regions with similar climatic conditions and cultural constraints, such as
those of the Middle East and the GCC countries. The results showed that different sets of
actions are required to achieve the building energy performance in the researched country’s
case study.

iv
Acknowledgements
I would like to thank everyone for their support and encouragements, which have made this
thesis possible. This research would not have been possible without the support and advice
given to me by my two supervisors. I would like to express my sincere gratitude to my first
supervisor Dr Steve Lo for this invaluable help throughout the entire PhD research and his
confidence in my ability to carry out the investigation. His guidance helped me throughout the
research and writing of this thesis. I would also like to thank my second supervisor Dr Sukumar
Natarajan for his support and guidance throughout the entire study.
I would like to acknowledge The Research Council (TRC), Oman for giving me the opportunity
to access to their documents and data on the green buildings they were monitoring.
Finally, I am deeply grateful for my family, relatives and my mother who has always been my
great teacher, and for my friends and colleagues for their help and unlimited support.
v
Table of Content
Background ........................................................................................................................... 1
Building and climate change ................................................................................................ 3
Oman geography and climate .............................................................................................. 4
Construction practice in Oman and GCC countries ......................................................... 7
Importance of the research ................................................................................................ 10
Hypothesis ............................................................................................................................ 11
Aim of the research ............................................................................................................. 11
Objectives ............................................................................................................................. 12
Scope and limitation of the research ................................................................................. 13
Contribution to the body of knowledge ............................................................................. 13
Introduction ......................................................................................................................... 15
The concept of energy and building .................................................................................. 16
Review of related international standards on energy conservation in buildings .......... 17
2.3.1 International application of energy standards for buildings .................................. 20
Best practice low carbon buildings .................................................................................... 22
2.4.1 International best practice of low carbon construction ................................................. 23
Application of energy standards in MENA countries ...................................................... 25
2.5.1 Application of energy standards in Iran ........................................................................ 27
2.5.2 Application of energy standards in Jordan .................................................................... 28
2.5.3 Application of energy standards in Egypt ..................................................................... 28
2.5.4 Application of energy standards in Lebanon ................................................................ 29
2.5.5 Application of energy standards in Tunisia .................................................................. 30
2.5.6 Application of energy standards in Morocco ................................................................ 31
2.5.7 The MENA LCB status ................................................................................................. 32
Building energy regulation and policies in the GCC countries ....................................... 33
vi
2.6.1 Status of energy standards in the GCC countries .......................................................... 35
Household energy use in Oman: Efficiency and policy implications.............................. 39
Sustainable domestic building construction practices in the GCC countries ................ 41
Vernacular construction practice: materials, methods & exemplars ............................. 44
GCC current construction practice ................................................................................... 46
2.10.1 Modern construction ..................................................................................................... 47
2.10.2 Effects of the current GCC construction practice on the energy consumption ............. 48
GCC low carbon building practice status ......................................................................... 49
2.11.1 Examples of low carbon building construction strategies in GCC ............................... 50
2.11.2 Omani examples of domestic LCB: Case study buildings ............................................ 51
Energy efficiency labelling of buildings ............................................................................ 54
Deficiencies of LCB practice and strategies in Oman ...................................................... 55
Barriers facing the building energy regulation application in the GCC ........................ 56
Benefits of applying energy regulations in domestic buildings ....................................... 57
2.15.1 Environmental benefits ................................................................................................. 57
2.15.2 Impacts of energy conservation on building design ...................................................... 58
2.15.3 Impacts of energy conservation on building materials ................................................. 59
2.15.4 Feasibility of domestic low carbon buildings in the GCC ............................................ 59
Chapter summary ............................................................................................................... 59
2.16.1 Identified gaps in knowledge ........................................................................................ 60
Introduction ......................................................................................................................... 62
Research philosophy and methods .................................................................................... 62
3.2.1 Quantitative Research ................................................................................................... 63
3.2.2 Qualitative Research ..................................................................................................... 63
3.2.3 Mixed mode research .................................................................................................... 64
Research concept ................................................................................................................. 67
Research approach .............................................................................................................. 68
Data collection ..................................................................................................................... 69
3.5.1 Literature review ........................................................................................................... 70
3.5.2 Interviews ...................................................................................................................... 71
3.5.3 Survey and Questionnaire ............................................................................................. 71
3.5.4 The selection of case study as a method ....................................................................... 72
3.5.5 Reference case study buildings ..................................................................................... 73
3.5.6 Energy audit .................................................................................................................. 74
3.5.7 Energy monitoring ........................................................................................................ 75
vii
3.5.8 Monitoring devices and strategy ................................................................................... 75
3.5.9 Simulation of Energy Consumption .............................................................................. 78
Data collection considerations ............................................................................................ 79
Buildings energy calculations principle ............................................................................ 80
Chapter summary ............................................................................................................... 82
Introduction ......................................................................................................................... 83
Introduction to Omani housing stock ................................................................................ 83
4.2.1 Review of existing housing typologies ......................................................................... 85
4.2.2 Residential building materials and construction methods ............................................. 90
Energy conservation practice in residential buildings in Oman ..................................... 91
4.3.1 Characteristics of the energy consumption of residential buildings ............................. 93
Public awareness of sustainable residential buildings in Oman ..................................... 94
4.4.1 Impact of occupant behaviours on the energy consumption ......................................... 96
4.4.2 Occupant comfort and well-being requirements ........................................................... 97
Future trends in building energy consumption in Oman ................................................ 97
Main barriers to the widespread adoption of low-carbon building in Oman ................ 99
4.6.1 Environmental barriers ................................................................................................ 100
4.6.2 Social/cultural barriers ................................................................................................ 101
4.6.3 Limited awareness of energy saving and public participation .................................... 102
4.6.4 Economic Barriers (Financial and cost (marketing) ................................................... 102
4.6.5 Funding or financing difficulties ................................................................................. 103
4.6.6 Limited governmental and technical drivers ............................................................... 104
4.6.7 Limited policy framework and strategic planning ...................................................... 105
4.6.8 Low adoption and high cost of LCB technologies & strategies .................................. 105
4.6.9 Lack of research support ............................................................................................. 106
4.6.10 Limited action on use of renewables ........................................................................... 106
Roadmap for Oman’s low-carbon buildings strategy .................................................... 107
4.7.1 Weather and climate changes challenges solutions..................................................... 108
4.7.2 Social/cultural barriers ................................................................................................ 108
4.7.3 Economic feasibility ................................................................................................... 109
4.7.4 Limited governmental and technical drivers ............................................................... 110
Chapter summary ............................................................................................................. 111
Introduction ....................................................................................................................... 112
Building energy system ..................................................................................................... 112
viii
Key performance attributes of efficient low carbon building ....................................... 115
Building energy demand ................................................................................................... 115
5.4.1 Evaluation of building energy demand for thermal comfort ....................................... 117
5.4.2 Lighting requirement and evaluation .......................................................................... 123
5.4.3 Domestic hot water requirements and its energy use .................................................. 124
5.4.4 Cold appliances energy requirements ......................................................................... 125
5.4.5 Household energy requirements for cooking .............................................................. 125
5.4.6 Miscellaneous ............................................................................................................. 126
Total load estimation and annual energy profile ........................................................... 126
Building energy performance and reduction measures ................................................. 126
5.6.1 Reduction measures in building energy systems and operations ................................ 127
Energy consumption profile and measurements: A case study .................................... 127
5.7.1 Energy consumption of conventional buildings and LCBs ......................................... 131
Low carbon building design guideline requirements for hot humid climate ............... 138
Chapter summary ............................................................................................................. 139
Introduction ....................................................................................................................... 140
Low carbon building guideline framework and scope ................................................... 141
Architectural specification of the guideline .................................................................... 144
Building Shape and orientation ....................................................................................... 145
Building envelope and construction materials ............................................................... 146
6.5.1 Building envelope ....................................................................................................... 147
6.5.2 External walls design and materials ............................................................................ 148
6.5.3 Low carbon building roof options for hot climate ...................................................... 149
6.5.4 Construction materials and market support ................................................................. 150
Thermal insulation requirements within building envelope ......................................... 151
Shading devices ................................................................................................................. 152
Ventilation ......................................................................................................................... 155
Daylight use and availability ............................................................................................ 157
Energy uses and sources ................................................................................................... 158
6.10.1 Use of renewable energy ............................................................................................. 159
Evaluation of energy measures ........................................................................................ 161
Proposed LCB guideline framework and energy template ........................................... 169
Chapter summary ............................................................................................................. 171
Introduction ....................................................................................................................... 172
ix
Low carbon building template outline ............................................................................ 173
Theoretical framework ..................................................................................................... 175
7.3.1 Energy requirements calculation ................................................................................. 176
Technological framework ................................................................................................. 178
7.4.1 Envelope and orientation ............................................................................................ 179
7.4.2 Building services data input sheets ............................................................................. 180
7.4.3 Home appliances and electronics ................................................................................ 183
7.4.4 Renewable energy consideration................................................................................. 184
7.4.5 Occupancy ................................................................................................................... 185
7.4.6 Template output .......................................................................................................... 186
Validating the Concept of the template ........................................................................... 188
Recommendations for potential application of the template ........................................ 190
Chapter summary ............................................................................................................. 191
Introduction ....................................................................................................................... 193
Low carbon residential building roadmap overview ..................................................... 194
Roadmap towards low carbon residential building in Oman ....................................... 194
8.3.1 Sustainable standards and regulation update ............................................................... 195
Technical recommendation for application of LCB strategy ........................................ 196
8.4.1 The Building Envelope ............................................................................................... 197
8.4.2 Ventilation system....................................................................................................... 197
8.4.3 Space Conditioning Equipment .................................................................................. 198
8.4.4 Lighting ....................................................................................................................... 199
8.4.5 System-Level Opportunities ....................................................................................... 199
Energy performances and renewable energy use ........................................................... 200
Benchmarks of energy consumption ............................................................................... 201
Cost of low carbon building ............................................................................................. 202
8.7.1 Benchmarking of cost payback ................................................................................... 207
Potential roadmap for residential LCB .......................................................................... 208
8.8.1 Vision .......................................................................................................................... 210
8.8.2 Target Areas ................................................................................................................ 210
8.8.3 Action .......................................................................................................................... 211
Chapter summary ............................................................................................................. 212
Introduction ....................................................................................................................... 213
Limitations ......................................................................................................................... 213
x
Low carbon houses opportunities .................................................................................... 215
9.3.1 Design ......................................................................................................................... 215
9.3.2 Optimum orientation ................................................................................................... 216
9.3.3 Glazing ratio, size and orientation .............................................................................. 216
9.3.4 Daylight and shading .................................................................................................. 217
9.3.5 Cooling and ventilation strategies ............................................................................... 218
9.3.6 Construction practice .................................................................................................. 218
9.3.7 Home appliances ......................................................................................................... 219
9.3.8 Landscaping and building envelope shading devices ................................................. 220
9.3.9 Occupant lifestyle ....................................................................................................... 221
9.3.10 Social impact ............................................................................................................... 221
Template application ........................................................................................................ 221
9.4.1 Economic impact of integrating LCB practice in Oman ............................................. 222
9.4.2 Environmental impact ................................................................................................. 223
9.4.3 Carbon footprint reduction .......................................................................................... 223
Interdependencies ............................................................................................................. 226
Chapter Summary ............................................................................................................ 227
Introduction ....................................................................................................................... 228
Research Outcomes ........................................................................................................... 229
10.2.1 Objectives fulfilled ...................................................................................................... 229
10.2.2 Contribution ................................................................................................................ 231
10.2.3 LCB energy efficiency measures for hot climates ...................................................... 232
Recommendations ............................................................................................................. 234
Potential future research areas ........................................................................................ 236
xi
Table of tables Table 1.1: Thesis objectives and structure ............................................................................... 12
Table 2.1: Energy consumption per capita per country in MENA .......................................... 27
Table 2.2: Status of building energy regulations in the MENA countries ............................... 33
Table 2.3: Typical Omani house average monthly electricity consumption ........................... 40
Table 2.4: Examples of state-of-the-art residential LCB buildings in Oman .......................... 53
Table 3.1: Qualitative research: strategies of inquiry .............................................................. 64
Table 3.2: Research methods adopted to achieve the research objectives ............................... 67
Table 3.3: List of Interviews. ................................................................................................... 71
Table 3.4: List of surveys and questionnaires .......................................................................... 72
Table 3.5: Factors and constraints of selecting reference buildings ........................................ 73
Table 3.6: Selected reference buildings ................................................................................... 74
Table 4.1: Classification of the residential building typologies .............................................. 86
Table 4.2: Deficiency in low carbon techniques in conventional building.............................. 90
Table 4.3: Energy consumption tasks and drivers ................................................................... 92
Table 4.4: Barrier classification in the literature ..................................................................... 99
Table 4.5: Summary of market survey on construction cost of reference LCB .................... 106
Table 4.6: Suggested solution to the main barriers ................................................................ 108
Table 5.1: Key performance attributes and variables reference categories ........................... 115
Table 5.2: Monthly electricity consumption of four reference conventional buildings ........ 130
Table 5.3: Conventional building energy audit for sample houses in Oman ......................... 130
Table 5.4: Specification of case study buildings ................................................................... 134
Table 5.5: Electricity consumption in kWh/day for the selected household tasks ................ 137
Table 6.1: Building envelope energy measures ..................................................................... 143
Table 6.2: List of energy efficiency measures implemented in reference LCBs ................... 144
Table 6.3: Reference buildings shapes properties .................................................................. 146
Table 6.4: Summary of reference buildings fabric ................................................................ 149
Table 6.5: Summary of LCBs materials sources ................................................................... 150
Table 6.6: LCBs exemplar cost breakdown in OR and (£) .................................................... 151
Table 6.7: Energy reduction due to implementing thermal insulation in hot climate ............ 152
Table 6.8: RE in (kWh) generation (G) and energy consumption (C) of LCBs .................... 161
Table 6.9: Modelling parameters of reference building......................................................... 162
Table 6.10: Internal heat gain profile data for LCB3 ............................................................. 163
Table 6.11: Internal heat gain profile data for CB1 ............................................................... 163
xii
Table 6.12: Internal heat gain profile data for CB3 ............................................................... 164
Table 6.13: Summary of calibration of modelling input parameters ..................................... 165
Table 6.14: Framework of energy efficient building guideline ............................................. 170
Table 7.1: EEMs and parameters of R-BEET ........................................................................ 173
Table 7.2: Summary of R-BEET energy consumption results .............................................. 188
Table 7.3: Percentage errors .................................................................................................. 190
Table 8.1: LCB roadmap suggested transformations ............................................................. 195
Table 8.2: Sample of international codes and their objectives .............................................. 196
Table 8.3: Reference LCBs’ spaces cooling load in November 2014 ................................... 199
Table 8.4: Potential CBs’ PV systems energy productions and consumptions. .................... 200
Table 8.5: The main parameters used in cost analysis of LCB .............................................. 203
Table 8.6: Analysis of cost benefits and thickness of insulation ........................................... 204
Table 8.7: Potential RE energy production and cost saving .................................................. 206
Table 8.8: Viability of implementing insulation and suggested energy cost ......................... 207
Table 8.9: Elements of roadmap for LCB transformation ..................................................... 209
Table 9.1: Possible energy reduction due to usage of R-BEET ............................................. 224
Table 10.1: EEMs potential reduction of energy ................................................................... 232
Table 10.2: Lower cost EEMs ............................................................................................... 233
xiii
Table of figures Figure 1.1: Yearly earth surface temperature records (Carlowicz, 2016).................................. 4
Figure 1.2: Muscat monthly maximum and minimum temperature 2016 ................................. 5
Figure 1.3: Oman climatic conditions map ................................................................................ 6
Figure 1.4: Historical changes of Oman’s building construction and energy use ..................... 9
Figure 1.5: Oman 2012 Electricity consumption per sectors ................................................... 11
Figure 1.6: Limitation of the research ...................................................................................... 13
Figure 2.1: Low carbon building hierarchy (Sustainable Approach, 2016) ............................ 22
Figure 2.2: Clarum zero energy research homes at Borrego Springs, California .................... 24
Figure 2.3: Greenwatt Way development (Moving towards zero carbon living, 2017) .......... 25
Figure 2.4: Energy consumption per capita per country .......................................................... 26
Figure 2.5: Tunisian building energy label .............................................................................. 31
Figure 2.6: Electricity prices in the GCC countries and selected developed countries ........... 35
Figure 2.7: Typical Omani house electricity consumption in summer .................................... 41
Figure 2.8: Tree palm house (Arish) ........................................................................................ 43
Figure 2.9: Energy consumption of the GCC and selected industrialised countries ............... 49
Figure 2.10: Majan Electricity Company building .................................................................. 52
Figure 2.11: Building performance in England and Wales...................................................... 55
Figure 2.12: Relationship between energy consumption, savings and CO2 emissions ........... 57
Figure 3.1: Triangulation of quantitative and qualitative data ................................................. 65
Figure 3.2: Application of methodologies adopted in this research ........................................ 66
Figure 3.3: The research concept ............................................................................................. 68
Figure 3.4: Data collection approach ....................................................................................... 69
Figure 3.5: Monitoring system principle ................................................................................. 76
Figure 3.6: Weather station in LCB3 (Appendix E) ................................................................ 77
Figure 3.7: Zone temperature and humidity measuring device ............................................... 77
Figure 3.8: Electricity consumption data collection ................................................................ 78
Figure 4.1: Demographics of Oman......................................................................................... 84
Figure 4.2: Increase in construction of new residential buildings in Oman ............................ 85
Figure 4.3: Sample residential building typologies in Oman from the 1970s until today ....... 87
Figure 4.4: Percentage of preferred housing typology for Omani families ............................. 88
Figure 4.5: Sample of 4-bedroom Omani house layout ........................................................... 89
Figure 4.6: Residential typology energy consumption classification ...................................... 93
Figure 4.7: Daily energy demand profile for Omani houses ................................................... 94
xiv
Figure 4.8: Energy consumption per sector ............................................................................. 95
Figure 4.9: Summer air conditioning usage in a typical Omani house .................................... 96
Figure 4.10: Projected future electricity consumption in Oman .............................................. 98
Figure 4.11: Muscat weather data .......................................................................................... 101
Figure 5.1: Building energy system components and boundaries ......................................... 113
Figure 5.2: Subsystem (home tasks) arrangements................................................................ 114
Figure 5.3: Breakdown of home tasks electricity consumption for residential building in
Oman ...................................................................................................................................... 118
Figure 5.4: Heat gain in buildings.......................................................................................... 119
Figure 5.5: Annual electricity consumption profile for Omani residential buildings ............ 128
Figure 5.6: Reference conventional building location ........................................................... 129
Figure 5.7: Reference LCB location ...................................................................................... 132
Figure 5.8: Reference LCB3 .................................................................................................. 133
Figure 5.9: Monitoring system principle ............................................................................... 135
Figure 5.10: Online LCB energy arrangement ...................................................................... 136
Figure 5.11: One day electricity (the main source of energy) consumption of low carbon and
conventional buildings ........................................................................................................... 138
Figure 6.1: Chapter outline and design guideline criteria ...................................................... 141
Figure 6.2: Energy efficiency guideline F ............................................................................. 142
Figure 6.3: Progress of development of LCB envelope ......................................................... 147
Figure 6.4: Large unshaded windows in a building in Muscat .............................................. 153
Figure 6.5: Shading device misplaced ................................................................................... 153
Figure 6.6: Shading devices examined by (Freewan, 2014) .................................................. 154
Figure 6.7: Use of shading in reference LCB1& LCB3 ........................................................ 155
Figure 6.8: LCB4 water pond and pipe system ...................................................................... 156
Figure 6.9: LCB4 natural ventilation system ......................................................................... 156
Figure 6.10: Recording temperature reduction due to natural ventilation ............................. 157
Figure 6.11: Section with photo illustrates utilization of natural lighting in LCB3 .............. 158
Figure 6.12: Dust accumulation effects on solar hot water heater ......................................... 160
Figure 6.13: Wind effects lead to the removal of PV system ................................................ 160
Figure 6.14: One month modelled vs. measured energy consumption of LCB3 ................... 166
Figure 6.15: Modelled annual energy consumption of CB1 and CB2 ................................... 167
Figure 6.16: Modelled vs measured monthly energy consumption for LCB1 and LCB3 ..... 168
Figure 6.17: Summary of percentage energy reduction due to implementation of EEMs .... 169
xv
Figure 7.1: R-BEET home interface and Excel sheets .......................................................... 174
Figure 7.2: Schematic diagram of R-BEET principle ............................................................ 175
Figure 7.3: Building information data entry sheet ................................................................. 179
Figure 7.4: Building envelope data entry sheet ..................................................................... 180
Figure 7.5: Building HVAC system data entry sheets ........................................................... 181
Figure 7.6: Domestic hot water data entry sheets .................................................................. 182
Figure 7.7: Building lighting data entry sheets ...................................................................... 182
Figure 7.8: Home appliance and electronics sheets ............................................................... 183
Figure 7.9: Home appliance and electronics sheets ............................................................... 184
Figure 7.10: Renewables data entry sheet.............................................................................. 185
Figure 7.11: Building occupancy profile ............................................................................... 186
Figure 7.12: Sample template output ..................................................................................... 187
Figure 7.13: Energy report for reference CBs prepared by R-BEET .................................... 189
Figure 8.1: A roadmap to best practice LCB ......................................................................... 193
Figure 8.2: Suggested energy rating scheme ......................................................................... 202
Figure 8.3: Viability of implementing RE and suggested energy cost .................................. 208
Figure 9.1: Entire the building shading.................................................................................. 217
Figure 9.2: Shading by surrounding trees and vegetation on walls (LCB5) .......................... 220
Figure 9.3: Oman and world average CO2 emissions tones per capita .................................. 225
xvi
List of Abbreviations
ANRE Agence Nationale de Régulation de l’Energie
AC Air-Conditioning
ACCA Air Conditioning Contractors of America
BEI building energy index
ARZ Building Rating System
BREEAM Building Research Establishment Environmental Assessment Method
BEE Bureau of Energy Efficiency
CO2 Carbon Dioxide
CIBSE Chartered Institute of Building Services Engineers
COAs Continuously occupied areas
CBs Conventional building
CDDs cooling degree days
DECs Display Energy Certificates
DHW Domestic Hot Water
ECO Energy Conservation and Commercialization
EEI Energy Efficiency Index
EEMs Energy Efficiency Measures
EnEV Energy Saving Regulation
GSAS Global Sustainability Assessment System
GHG Greenhouse gases
GCC Gulf Cooperation Council
TC06 Gulf Technical Committee
HDDs Heating degree days
IESVE IES Virtual Environment
IPCC Intergovernmental Panel on Climate Change
ICC International Code Centre
IEA International Energy Agency
IECC International Energy Conservation Code
IgCC International Green Construction Code
IIEC International Institute for Energy Conservation
LEED Leadership in Energy and Environmental Design
LGBC Lebanon Green Building Council
LPG Liquefied petroleum gas
LCB Low Carbon Building
MENA Middle East and North Africa
NASA National Aeronautics and Space Administration
NCBB National Committee of Buildings in Bahrain
NCC National Construction Code
NOAA National Oceanic and Atmospheric Administration
OPWP Oman Power and Water Procurement Company
PV Photovoltaic
xvii
QCS 2010 Qatar Construction Specifications
REMM Reactive Energy Management Model
ASHRAE Refrigerating and Air-Conditioning Engineers
RE Renewable energy
R-BEET Residential Building Energy Efficiency Template
SBC Saudi Building Code
SBCNC Saudi Building Code National Committee
SSE Scottish and Southern Energy
SHGC solar heat gain coefficient
SOTA state-of-the-arts
SA surrounding area
TA task area
ECQ The Energy City Qatar
GSO The GCC Standardization Organization
GORD The Gulf Organization for Research and Development
TRC The Research Council, Oman
TES Thermal Energy Storage
UNFCCC United Nations Framework Convention on Climate Change
USAID United States Agency for International Development
USGBC US Green Building Council
WBDG Whole Building Design Guide
WWR window-to-wall ratio
1
Chapter 1: Introduction
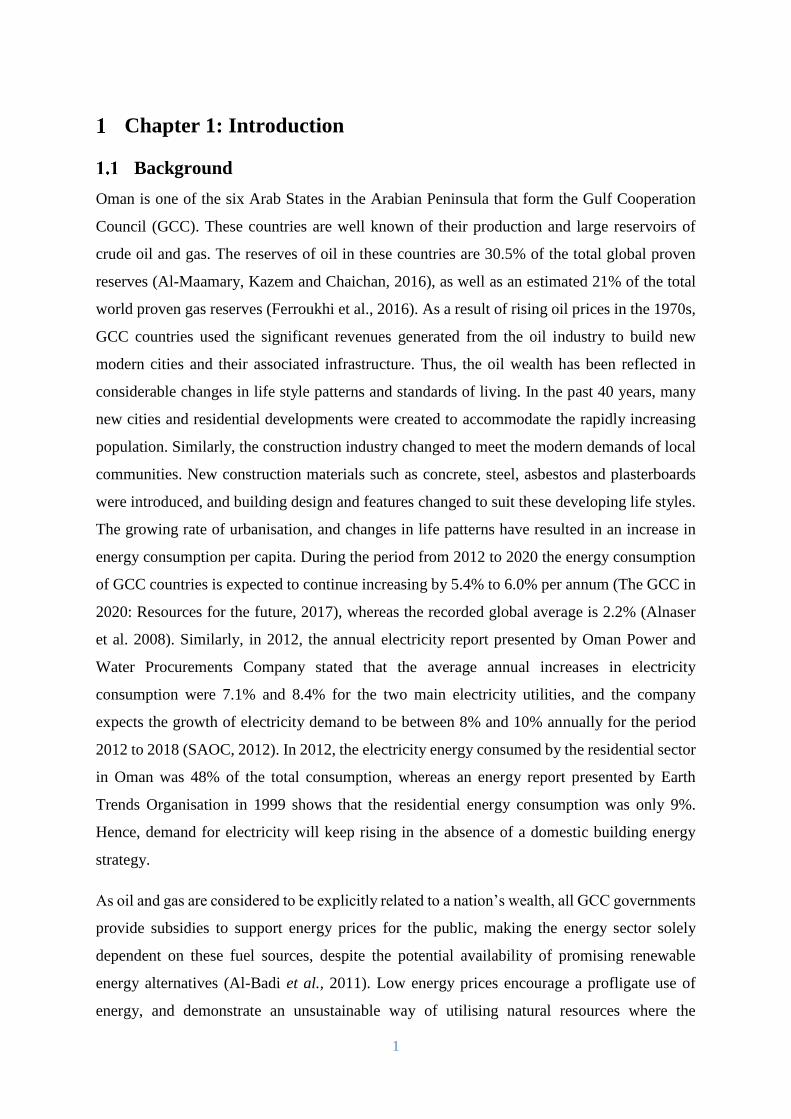
Background
Oman is one of the six Arab States in the Arabian Peninsula that form the Gulf Cooperation
Council (GCC). These countries are well known of their production and large reservoirs of
crude oil and gas. The reserves of oil in these countries are 30.5% of the total global proven
reserves (Al-Maamary, Kazem and Chaichan, 2016), as well as an estimated 21% of the total
world proven gas reserves (Ferroukhi et al., 2016). As a result of rising oil prices in the 1970s,
GCC countries used the significant revenues generated from the oil industry to build new
modern cities and their associated infrastructure. Thus, the oil wealth has been reflected in
considerable changes in life style patterns and standards of living. In the past 40 years, many
new cities and residential developments were created to accommodate the rapidly increasing
population. Similarly, the construction industry changed to meet the modern demands of local
communities. New construction materials such as concrete, steel, asbestos and plasterboards
were introduced, and building design and features changed to suit these developing life styles.
The growing rate of urbanisation, and changes in life patterns have resulted in an increase in
energy consumption per capita. During the period from 2012 to 2020 the energy consumption
of GCC countries is expected to continue increasing by 5.4% to 6.0% per annum (The GCC in
2020: Resources for the future, 2017), whereas the recorded global average is 2.2% (Alnaser
et al. 2008). Similarly, in 2012, the annual electricity report presented by Oman Power and
Water Procurements Company stated that the average annual increases in electricity
consumption were 7.1% and 8.4% for the two main electricity utilities, and the company
expects the growth of electricity demand to be between 8% and 10% annually for the period
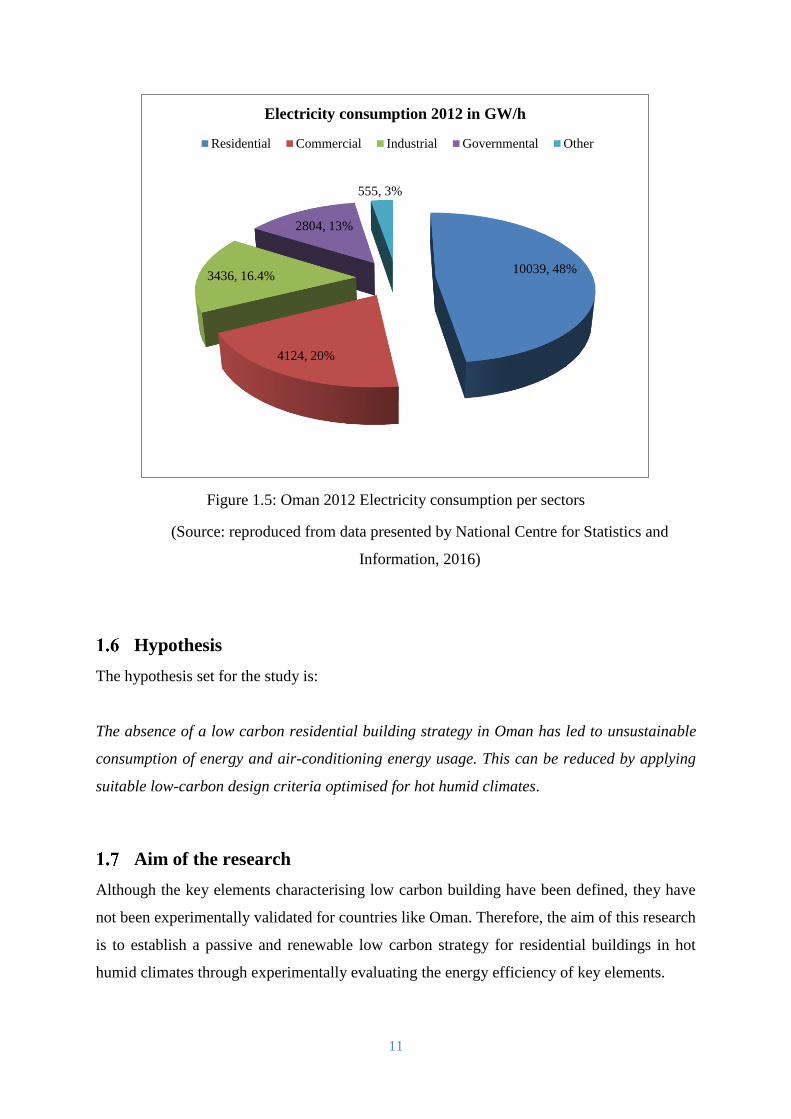
2012 to 2018 (SAOC, 2012). In 2012, the electricity energy consumed by the residential sector
in Oman was 48% of the total consumption, whereas an energy report presented by Earth
Trends Organisation in 1999 shows that the residential energy consumption was only 9%.
Hence, demand for electricity will keep rising in the absence of a domestic building energy
strategy.
As oil and gas are considered to be explicitly related to a nation’s wealth, all GCC governments
provide subsidies to support energy prices for the public, making the energy sector solely
dependent on these fuel sources, despite the potential availability of promising renewable
energy alternatives (Al-Badi et al., 2011). Low energy prices encourage a profligate use of
energy, and demonstrate an unsustainable way of utilising natural resources where the
2
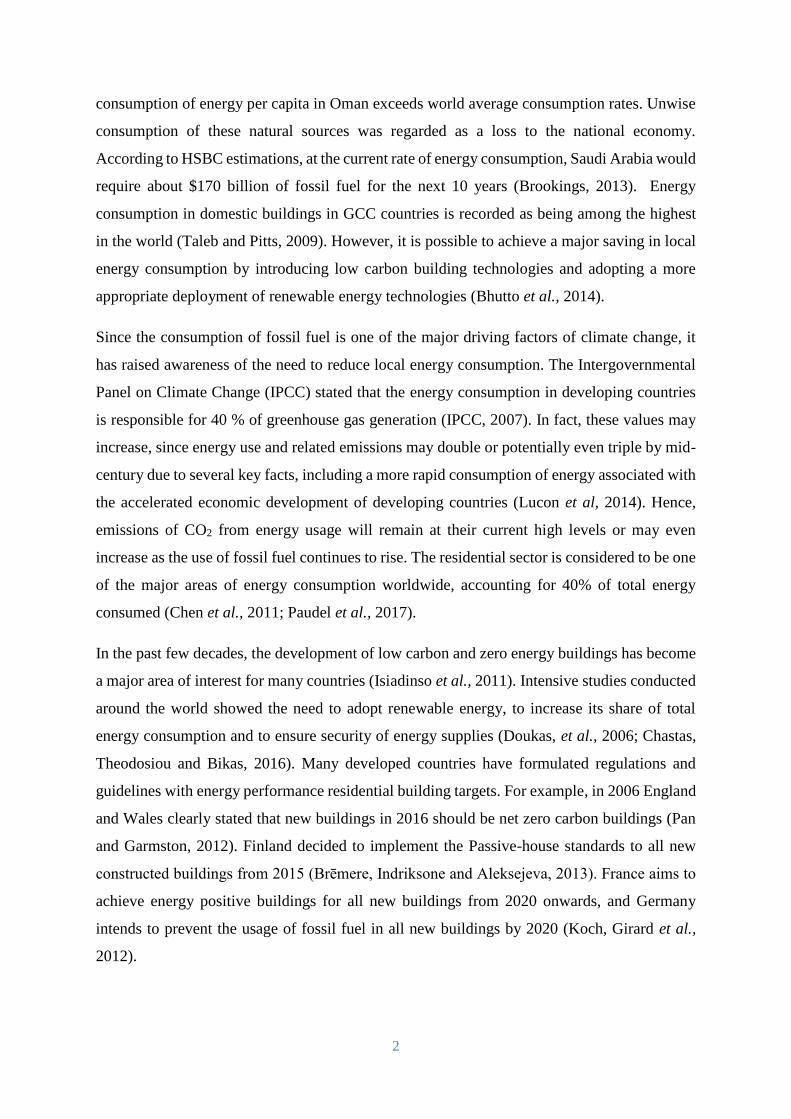
consumption of energy per capita in Oman exceeds world average consumption rates. Unwise
consumption of these natural sources was regarded as a loss to the national economy.
According to HSBC estimations, at the current rate of energy consumption, Saudi Arabia would
require about $170 billion of fossil fuel for the next 10 years (Brookings, 2013). Energy
consumption in domestic buildings in GCC countries is recorded as being among the highest
in the world (Taleb and Pitts, 2009). However, it is possible to achieve a major saving in local
energy consumption by introducing low carbon building technologies and adopting a more
appropriate deployment of renewable energy technologies (Bhutto et al., 2014).
Since the consumption of fossil fuel is one of the major driving factors of climate change, it
has raised awareness of the need to reduce local energy consumption. The Intergovernmental
Panel on Climate Change (IPCC) stated that the energy consumption in developing countries
is responsible for 40 % of greenhouse gas generation (IPCC, 2007). In fact, these values may
increase, since energy use and related emissions may double or potentially even triple by mid-
century due to several key facts, including a more rapid consumption of energy associated with
the accelerated economic development of developing countries (Lucon et al, 2014). Hence,
emissions of CO2 from energy usage will remain at their current high levels or may even
increase as the use of fossil fuel continues to rise. The residential sector is considered to be one
of the major areas of energy consumption worldwide, accounting for 40% of total energy
consumed (Chen et al., 2011; Paudel et al., 2017).
In the past few decades, the development of low carbon and zero energy buildings has become
a major area of interest for many countries (Isiadinso et al., 2011). Intensive studies conducted
around the world showed the need to adopt renewable energy, to increase its share of total
energy consumption and to ensure security of energy supplies (Doukas, et al., 2006; Chastas,
Theodosiou and Bikas, 2016). Many developed countries have formulated regulations and
guidelines with energy performance residential building targets. For example, in 2006 England
and Wales clearly stated that new buildings in 2016 should be net zero carbon buildings (Pan
and Garmston, 2012). Finland decided to implement the Passive-house standards to all new
constructed buildings from 2015 (Brēmere, Indriksone and Aleksejeva, 2013). France aims to
achieve energy positive buildings for all new buildings from 2020 onwards, and Germany
intends to prevent the usage of fossil fuel in all new buildings by 2020 (Koch, Girard et al.,
2012).
3
Until recently, Gulf countries have not developed any policies to reduce CO2 emissions or
encouraged the use of renewable energy technologies. The six countries listed in the GCC are
in the top 10 countries of CO2 emission per capita (Reiche, 2010). Greenhouse gases (GHG)
emissions per capita in the GCC are at least two to three times higher than the average in the
EU-15, while compared to GDP, the GHG emissions are almost four times higher
(Papadopoulou et al., 2013). In addition, their residents generate two to ten times the amount
of CO2 emissions of the average global citizen (Hussain, 2014). However, in 2005 Oman and
other GCC countries signed and ratified the United Nations Framework Convention on Climate
Change (UNFCCC), and accessed the Kyoto Protocol (Doukas et al. 2006). Since then the
energy and CO2 policy of these countries has changed, and renewable energy has now become
an option for investigation in many Gulf countries. This is evident in the scale of investment in
this option and decisions taken in the direction of sustainability. The Energy City Qatar (ECQ),
established in Qatar and Masdar City in the UAE, shows the current commitment of these
countries to move to a more sustainable energy environment. Apart from their accession to the
Kyoto Protocol and, their involvement in and ratification of UNFCCC, their commitment to
renewable energy was driven by the rapid increase in energy consumption demanded by the
development in these countries. There have been a number of studies carried out in these
countries showing the potential of using renewable energy as replacements for current
conventional energy supplies (Doukas et al., 2006). Oman’s vision 2020 is aiming to achieve
10% renewable energy by the end of the 8th five-year plan (Oman Solar, 2017).
Building and climate change
The average earth temperatures are rising due to increases in the present levels of greenhouse
gases in the atmosphere. Scientists have linked the increase in the levels of atmospheric GHGs
to industrial activities and increases of urbanisation (IPCC 2014). The Copenhagen Climate
Summit in 2009 targeted to limit this increase to 2.0 ºC by 2020. However, with current
progress, it is not possible to achieve this target and the average temperature will keep rising if
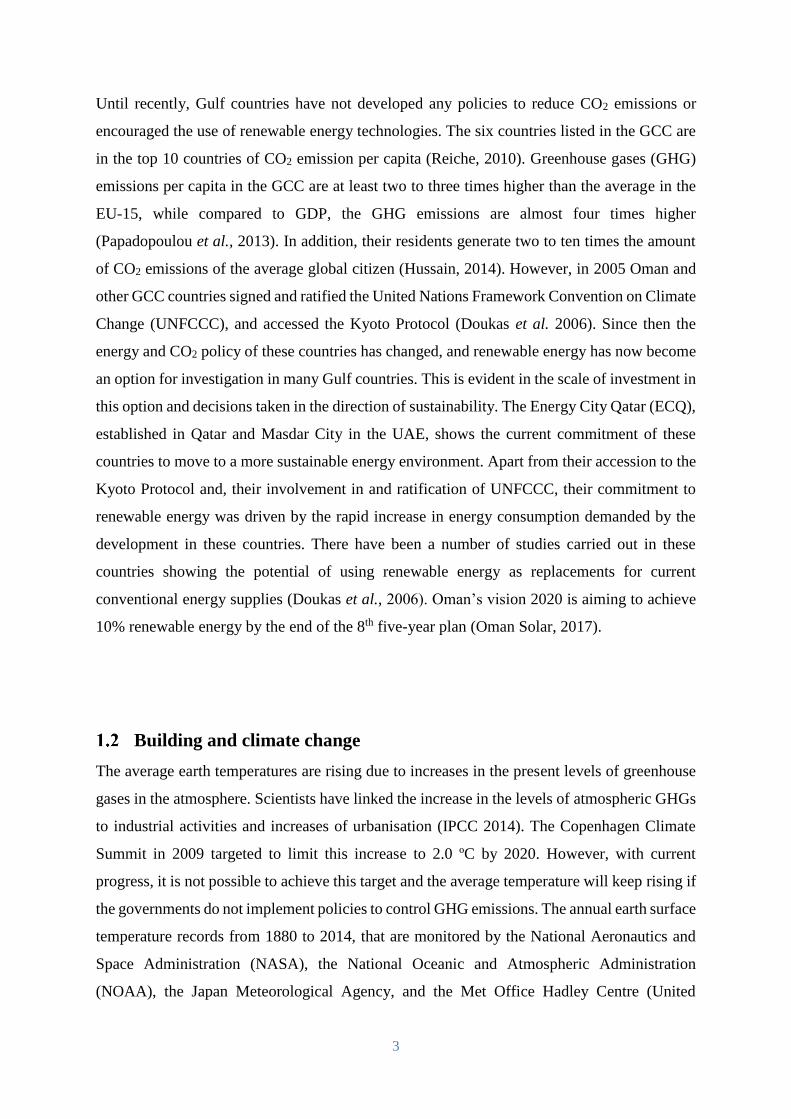
the governments do not implement policies to control GHG emissions. The annual earth surface
temperature records from 1880 to 2014, that are monitored by the National Aeronautics and
Space Administration (NASA), the National Oceanic and Atmospheric Administration
(NOAA), the Japan Meteorological Agency, and the Met Office Hadley Centre (United
4
Kingdom), show increasing trends. Furthermore, all four records show that the last decade was
the warmest (Figure 1.1) (Carlowicz, 2016). Such changes in global temperature will result in
severe environmental consequences that include flooding, droughts and disturbance to
ecological systems.
Figure 1.1: Yearly earth surface temperature records (Carlowicz, 2016)
Oman geography and climate
Oman is located in the Middle East in the south-east corner of the Arabian Peninsula. It has an
area of 309,500 km2, and is situated between latitudes of 16ᴼ 40ʹ N to 26ᴼ 20ʹ N and longitudes
of 51ᴼ 50ʹ to 59ᴼ 40ʹ E. It has 1700 km of coastline extending from Hormuz in the north to the
boarder of the Republic of Yemen on the southern part of the sultanate, overlooking three main
seas: the Arabian Gulf (Persian Gulf), the Sea of Oman (previously known as the Gulf of
Oman) and the Arabian Sea. Omani topography varies between deserts, (about 82%), and
Mountains, (15%), with the remaining being valleys and oasis (Kazem, 2011). The
administration structure of the country consists of 9 governorates. According to data from the
National Centre for Statistics and Information the total population of the country in March 2017
was 4.5 million, mostly concentrated along the coast and mainly in three governorates in the
northern part of the country (Monthly Statistical Bulletin, 2017). Thus, this study will focus on
these three governorates where the greatest population densities are located. As per the general
5
census conducted in 2010, the total available housing units were 540,770, consisting of
individual houses (villa), flats, and apartments. Furthermore, the residential sector is expanding
rapidly, the number of new residential plots distributed to the citizen increased in 2015 by 45%
from its value between 2010 and 2014.
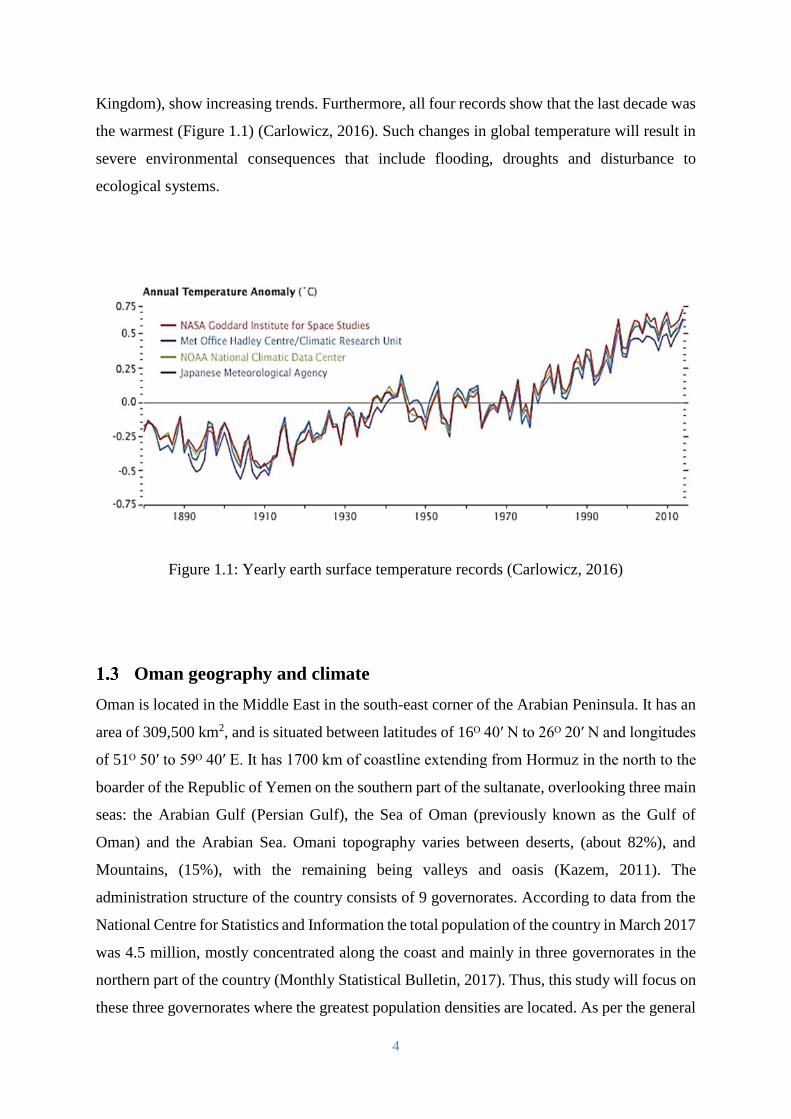
The climatic condition of Oman is hot and humid in the coastal regions, and hot and dry in the
interior of the country (Figure 1.2). The weather data for 2012 shows that the highest recorded
temperature in the country was 50ºC in Khasab, the minimum temperature was -1ºC in Saiq,
the highest recorded humidity was 100% in Sohar and the lowest humidity was 1% in Jabal-
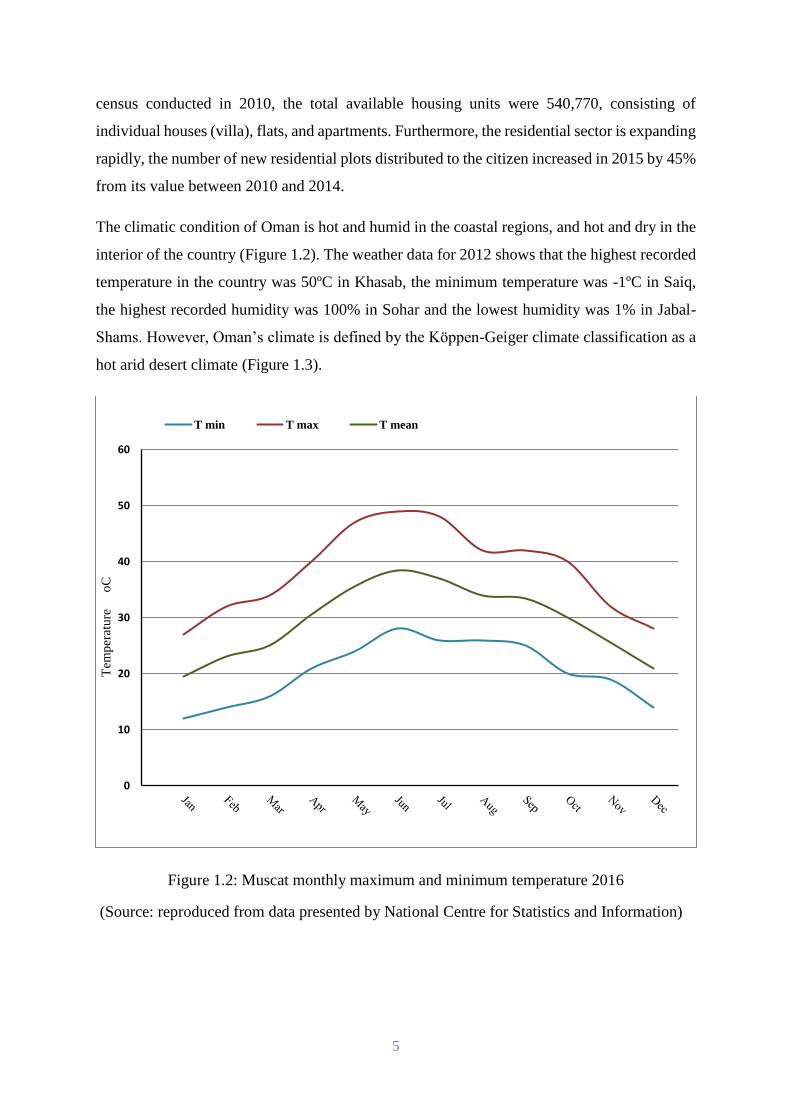
Shams. However, Oman’s climate is defined by the Köppen-Geiger climate classification as a
hot arid desert climate (Figure 1.3).
Figure 1.2: Muscat monthly maximum and minimum temperature 2016
(Source: reproduced from data presented by National Centre for Statistics and Information)
0
10
20
30
40
50
60
Tem
per
ature
oC
T min T max T mean
6
However, whilst the Koppen Classification system can be used to classify climate and
environmental conditions for any location in the world, it is difficult for designers to use when
relating local climate to energy-reduction design strategies (Aksamija, 2013).
Figure 1.3: Oman climatic conditions map
(Source: World Map of the Köppen-Geiger climate classification)
7
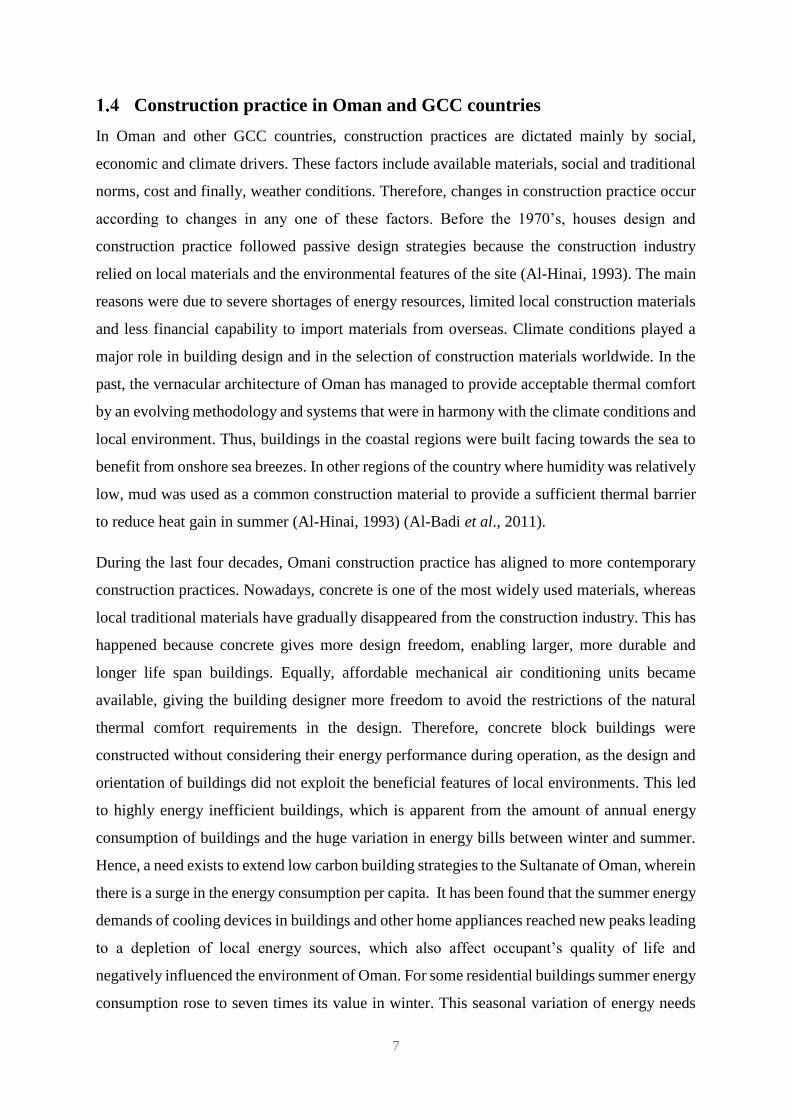
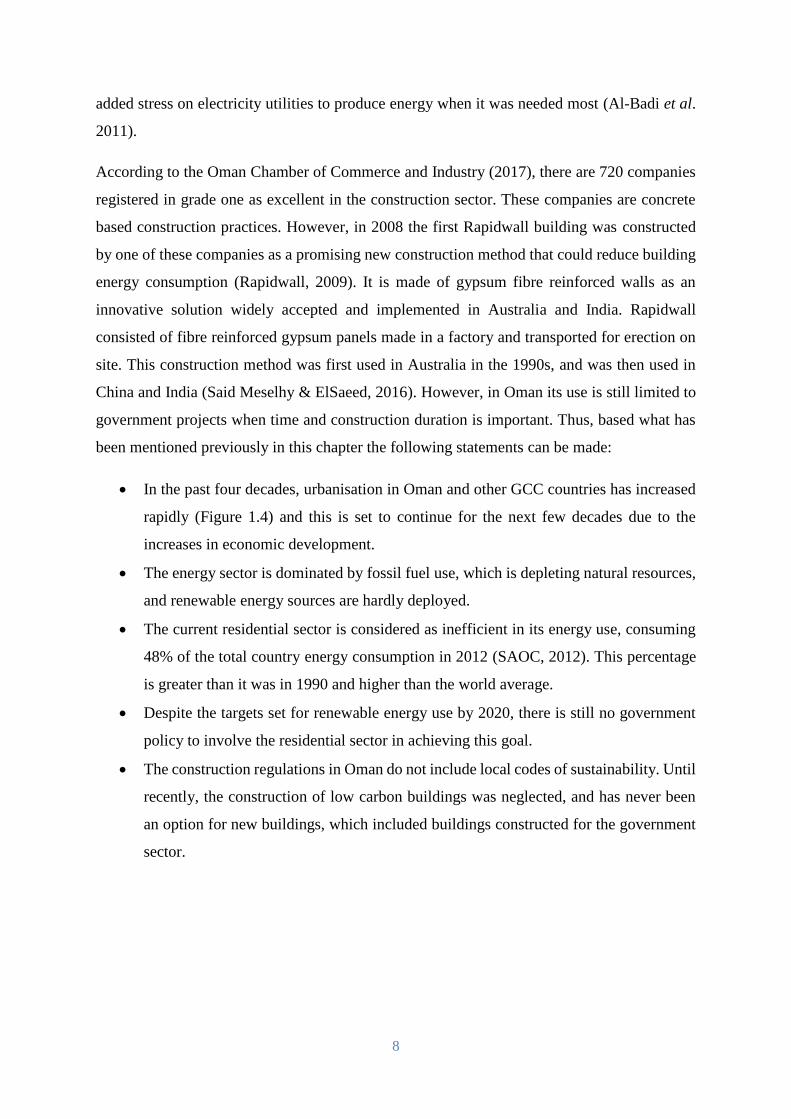
Construction practice in Oman and GCC countries
In Oman and other GCC countries, construction practices are dictated mainly by social,
economic and climate drivers. These factors include available materials, social and traditional
norms, cost and finally, weather conditions. Therefore, changes in construction practice occur
according to changes in any one of these factors. Before the 1970’s, houses design and
construction practice followed passive design strategies because the construction industry
relied on local materials and the environmental features of the site (Al-Hinai, 1993). The main
reasons were due to severe shortages of energy resources, limited local construction materials
and less financial capability to import materials from overseas. Climate conditions played a
major role in building design and in the selection of construction materials worldwide. In the
past, the vernacular architecture of Oman has managed to provide acceptable thermal comfort
by an evolving methodology and systems that were in harmony with the climate conditions and
local environment. Thus, buildings in the coastal regions were built facing towards the sea to
benefit from onshore sea breezes. In other regions of the country where humidity was relatively
low, mud was used as a common construction material to provide a sufficient thermal barrier
to reduce heat gain in summer (Al-Hinai, 1993) (Al-Badi et al., 2011).
During the last four decades, Omani construction practice has aligned to more contemporary
construction practices. Nowadays, concrete is one of the most widely used materials, whereas
local traditional materials have gradually disappeared from the construction industry. This has
happened because concrete gives more design freedom, enabling larger, more durable and
longer life span buildings. Equally, affordable mechanical air conditioning units became
available, giving the building designer more freedom to avoid the restrictions of the natural
thermal comfort requirements in the design. Therefore, concrete block buildings were
constructed without considering their energy performance during operation, as the design and
orientation of buildings did not exploit the beneficial features of local environments. This led
to highly energy inefficient buildings, which is apparent from the amount of annual energy
consumption of buildings and the huge variation in energy bills between winter and summer.
Hence, a need exists to extend low carbon building strategies to the Sultanate of Oman, wherein
there is a surge in the energy consumption per capita. It has been found that the summer energy
demands of cooling devices in buildings and other home appliances reached new peaks leading
to a depletion of local energy sources, which also affect occupant’s quality of life and
negatively influenced the environment of Oman. For some residential buildings summer energy
consumption rose to seven times its value in winter. This seasonal variation of energy needs
8
added stress on electricity utilities to produce energy when it was needed most (Al-Badi et al.
2011).
According to the Oman Chamber of Commerce and Industry (2017), there are 720 companies
registered in grade one as excellent in the construction sector. These companies are concrete
based construction practices. However, in 2008 the first Rapidwall building was constructed
by one of these companies as a promising new construction method that could reduce building
energy consumption (Rapidwall, 2009). It is made of gypsum fibre reinforced walls as an
innovative solution widely accepted and implemented in Australia and India. Rapidwall
consisted of fibre reinforced gypsum panels made in a factory and transported for erection on
site. This construction method was first used in Australia in the 1990s, and was then used in
China and India (Said Meselhy & ElSaeed, 2016). However, in Oman its use is still limited to
government projects when time and construction duration is important. Thus, based what has
been mentioned previously in this chapter the following statements can be made:
In the past four decades, urbanisation in Oman and other GCC countries has increased
rapidly (Figure 1.4) and this is set to continue for the next few decades due to the
increases in economic development.
The energy sector is dominated by fossil fuel use, which is depleting natural resources,
and renewable energy sources are hardly deployed.
The current residential sector is considered as inefficient in its energy use, consuming
48% of the total country energy consumption in 2012 (SAOC, 2012). This percentage
is greater than it was in 1990 and higher than the world average.
Despite the targets set for renewable energy use by 2020, there is still no government
policy to involve the residential sector in achieving this goal.
The construction regulations in Oman do not include local codes of sustainability. Until
recently, the construction of low carbon buildings was neglected, and has never been
an option for new buildings, which included buildings constructed for the government
sector.
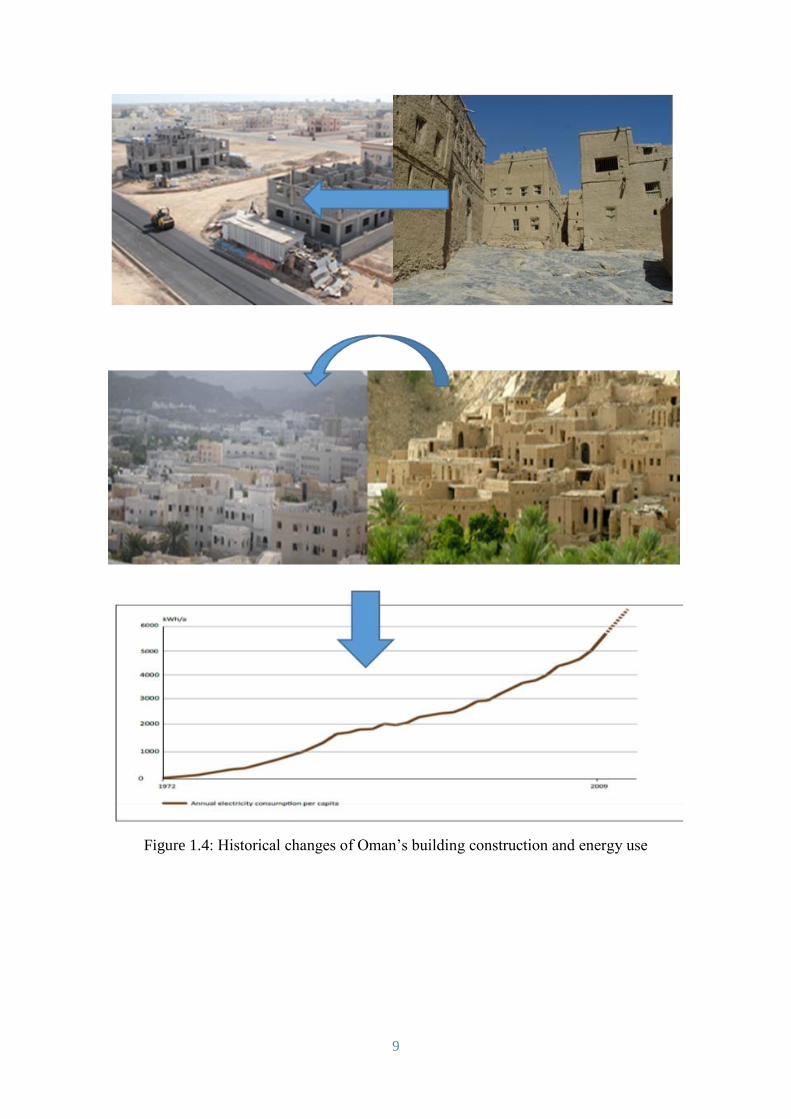
9
Figure 1.4: Historical changes of Oman’s building construction and energy use
10
Importance of the research
Building energy consumption and carbon emissions associated with domestic buildings has
been researched extensively in many countries around the world (Chen S, et al., 2014) and the
topic of low carbon building has been under increasing investigation in recent years
(Napolitano et al., 2012). In the developed countries, a great deal of effort has been spent to
encourage and enhance the energy performance of buildings in order to reduce overall energy
demand. However, in the Gulf countries, particularly in Oman, less consideration has been
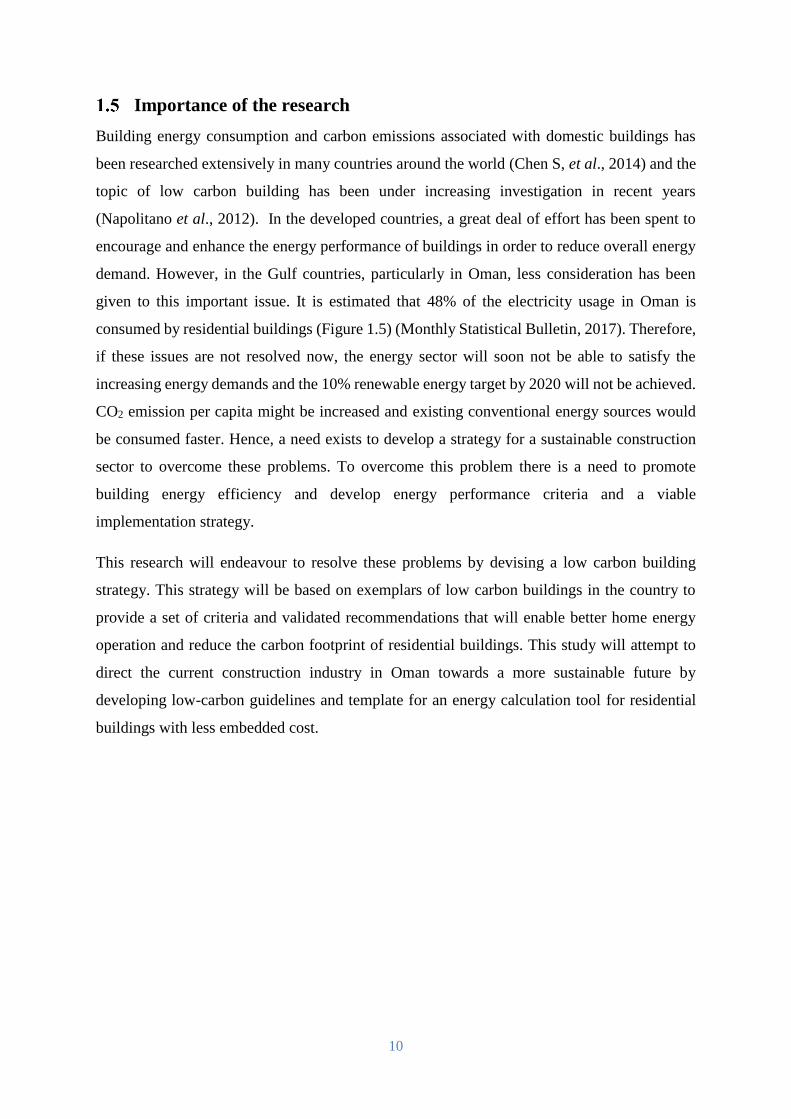
given to this important issue. It is estimated that 48% of the electricity usage in Oman is
consumed by residential buildings (Figure 1.5) (Monthly Statistical Bulletin, 2017). Therefore,
if these issues are not resolved now, the energy sector will soon not be able to satisfy the
increasing energy demands and the 10% renewable energy target by 2020 will not be achieved.
CO2 emission per capita might be increased and existing conventional energy sources would
be consumed faster. Hence, a need exists to develop a strategy for a sustainable construction
sector to overcome these problems. To overcome this problem there is a need to promote
building energy efficiency and develop energy performance criteria and a viable
implementation strategy.
This research will endeavour to resolve these problems by devising a low carbon building
strategy. This strategy will be based on exemplars of low carbon buildings in the country to
provide a set of criteria and validated recommendations that will enable better home energy
operation and reduce the carbon footprint of residential buildings. This study will attempt to
direct the current construction industry in Oman towards a more sustainable future by
developing low-carbon guidelines and template for an energy calculation tool for residential
buildings with less embedded cost.
11
Figure 1.5: Oman 2012 Electricity consumption per sectors
(Source: reproduced from data presented by National Centre for Statistics and
Information, 2016)
Hypothesis
The hypothesis set for the study is:
The absence of a low carbon residential building strategy in Oman has led to unsustainable
consumption of energy and air-conditioning energy usage. This can be reduced by applying
suitable low-carbon design criteria optimised for hot humid climates.
Aim of the research
Although the key elements characterising low carbon building have been defined, they have
not been experimentally validated for countries like Oman. Therefore, the aim of this research
is to establish a passive and renewable low carbon strategy for residential buildings in hot
humid climates through experimentally evaluating the energy efficiency of key elements.
10039, 48%
4124, 20%
3436, 16.4%
2804, 13%
555, 3%
Electricity consumption 2012 in GW/h
Residential Commercial Industrial Governmental Other
12
Objectives
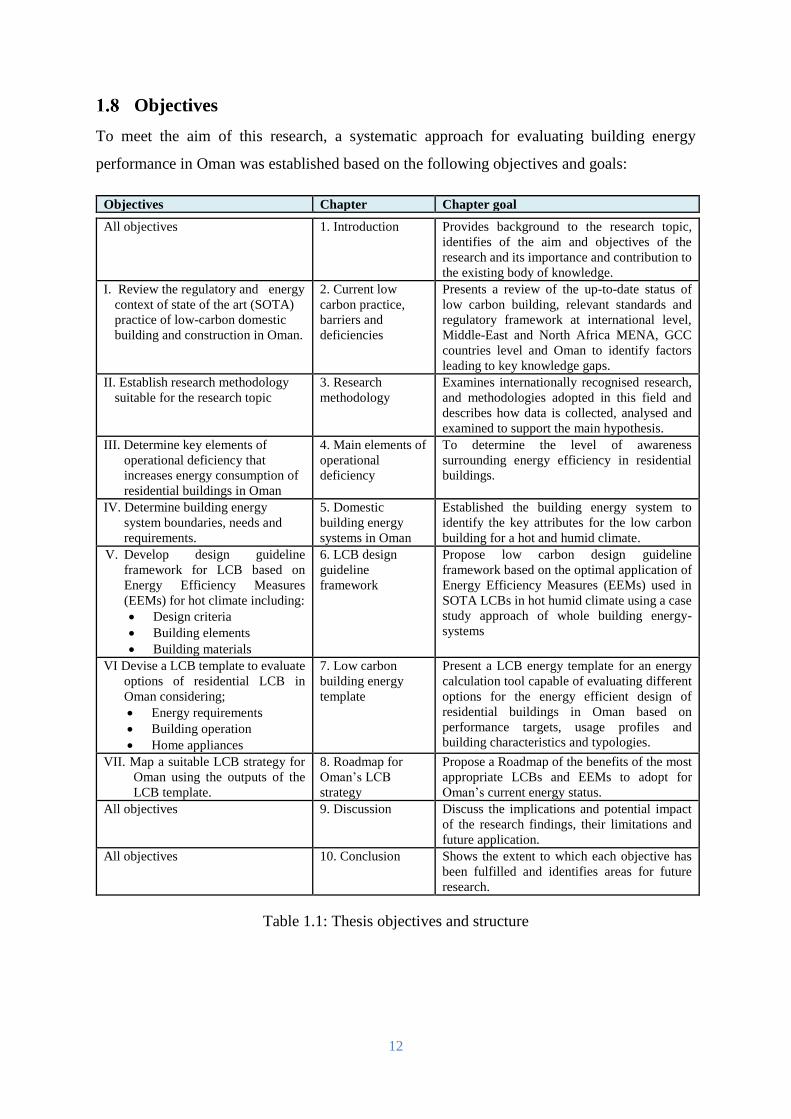
To meet the aim of this research, a systematic approach for evaluating building energy
performance in Oman was established based on the following objectives and goals:
Objectives Chapter Chapter goal
All objectives 1. Introduction Provides background to the research topic,
identifies of the aim and objectives of the
research and its importance and contribution to
the existing body of knowledge.
I. Review the regulatory and energy
context of state of the art (SOTA)
practice of low-carbon domestic
building and construction in Oman.
2. Current low
carbon practice,
barriers and
deficiencies
Presents a review of the up-to-date status of
low carbon building, relevant standards and
regulatory framework at international level,
Middle-East and North Africa MENA, GCC
countries level and Oman to identify factors
leading to key knowledge gaps.
II. Establish research methodology
suitable for the research topic
3. Research
methodology
Examines internationally recognised research,
and methodologies adopted in this field and
describes how data is collected, analysed and
examined to support the main hypothesis.
III. Determine key elements of
operational deficiency that
increases energy consumption of
residential buildings in Oman
4. Main elements of
operational
deficiency
To determine the level of awareness
surrounding energy efficiency in residential
buildings.
IV. Determine building energy
system boundaries, needs and
requirements.
5. Domestic
building energy
systems in Oman
Established the building energy system to
identify the key attributes for the low carbon
building for a hot and humid climate. V. Develop design guideline
framework for LCB based on
Energy Efficiency Measures
(EEMs) for hot climate including:
Design criteria
Building elements
Building materials
6. LCB design
guideline
framework
Propose low carbon design guideline
framework based on the optimal application of
Energy Efficiency Measures (EEMs) used in
SOTA LCBs in hot humid climate using a case
study approach of whole building energy-
systems
VI Devise a LCB template to evaluate
options of residential LCB in
Oman considering;
Energy requirements
Building operation
Home appliances
7. Low carbon
building energy
template
Present a LCB energy template for an energy
calculation tool capable of evaluating different
options for the energy efficient design of
residential buildings in Oman based on
performance targets, usage profiles and
building characteristics and typologies.
VII. Map a suitable LCB strategy for
Oman using the outputs of the
LCB template.
8. Roadmap for
Oman’s LCB
strategy
Propose a Roadmap of the benefits of the most
appropriate LCBs and EEMs to adopt for
Oman’s current energy status.
All objectives 9. Discussion Discuss the implications and potential impact
of the research findings, their limitations and
future application.
All objectives 10. Conclusion Shows the extent to which each objective has
been fulfilled and identifies areas for future
research.
Table 1.1: Thesis objectives and structure
13
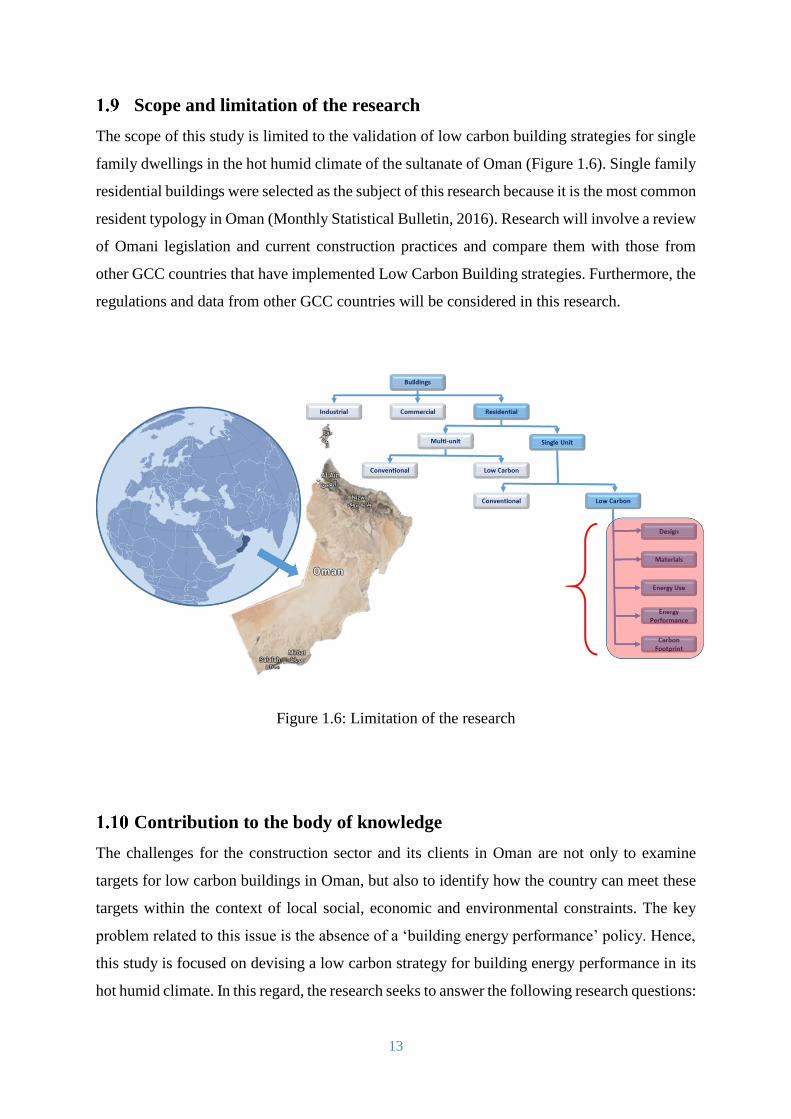
Scope and limitation of the research
The scope of this study is limited to the validation of low carbon building strategies for single
family dwellings in the hot humid climate of the sultanate of Oman (Figure 1.6). Single family
residential buildings were selected as the subject of this research because it is the most common
resident typology in Oman (Monthly Statistical Bulletin, 2016). Research will involve a review
of Omani legislation and current construction practices and compare them with those from
other GCC countries that have implemented Low Carbon Building strategies. Furthermore, the
regulations and data from other GCC countries will be considered in this research.
Figure 1.6: Limitation of the research
Contribution to the body of knowledge
The challenges for the construction sector and its clients in Oman are not only to examine
targets for low carbon buildings in Oman, but also to identify how the country can meet these
targets within the context of local social, economic and environmental constraints. The key
problem related to this issue is the absence of a ‘building energy performance’ policy. Hence,
this study is focused on devising a low carbon strategy for building energy performance in its
hot humid climate. In this regard, the research seeks to answer the following research questions:
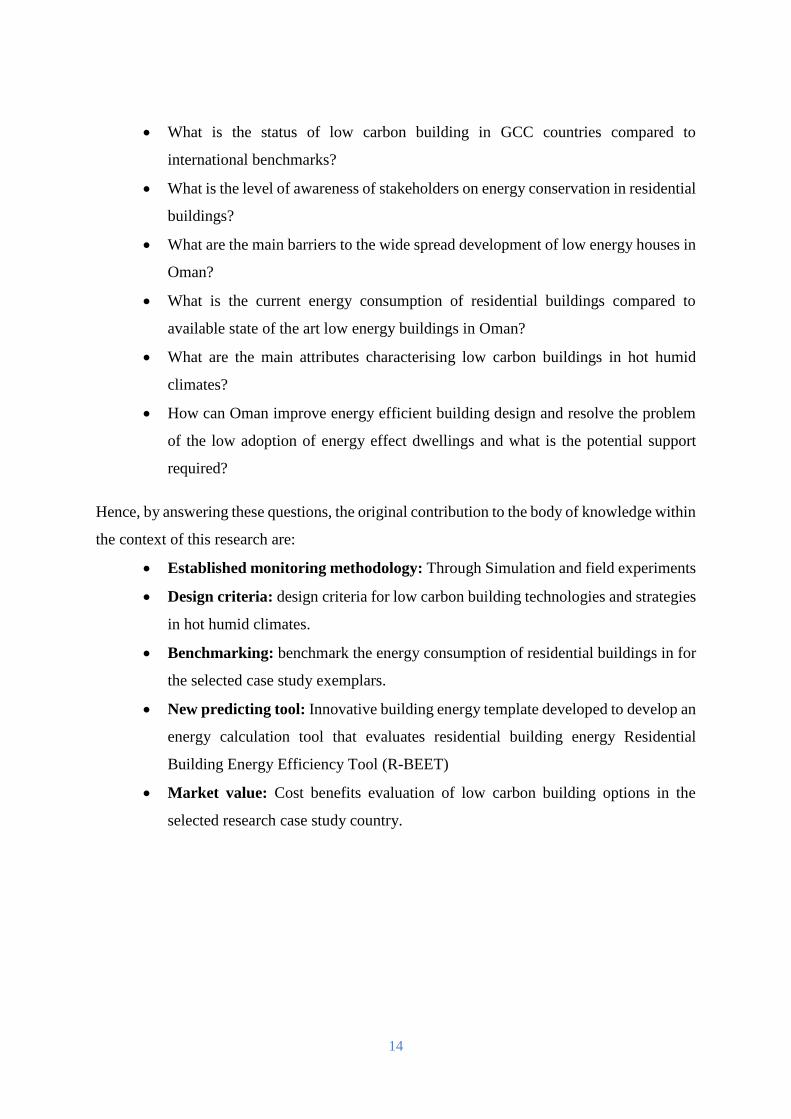
14
What is the status of low carbon building in GCC countries compared to
international benchmarks?
What is the level of awareness of stakeholders on energy conservation in residential
buildings?
What are the main barriers to the wide spread development of low energy houses in
Oman?
What is the current energy consumption of residential buildings compared to
available state of the art low energy buildings in Oman?
What are the main attributes characterising low carbon buildings in hot humid
climates?
How can Oman improve energy efficient building design and resolve the problem
of the low adoption of energy effect dwellings and what is the potential support
required?
Hence, by answering these questions, the original contribution to the body of knowledge within
the context of this research are:
Established monitoring methodology: Through Simulation and field experiments
Design criteria: design criteria for low carbon building technologies and strategies
in hot humid climates.
Benchmarking: benchmark the energy consumption of residential buildings in for
the selected case study exemplars.
New predicting tool: Innovative building energy template developed to develop an
energy calculation tool that evaluates residential building energy Residential
Building Energy Efficiency Tool (R-BEET)
Market value: Cost benefits evaluation of low carbon building options in the
selected research case study country.
15
Chapter II: Current low carbon building practice, barriers
and deficiencies
Introduction
The energy consumption of buildings accounts for nearly 40% of the recorded global
consumption of primary energy resources and is responsible for 24% of the world's CO2
emissions (Shen et al., 2016). Hence, the energy performance of buildings received increasing
concern from researchers, the government, and non-governmental organisations in the past
decades in an attempt to improve energy conservation. Many researchers believe that the
energy performance of buildings can contribute to preventing global climate change, if we
endeavour to build and rebuild more energy efficient buildings (Olonscheck, Holsten & Kropp,
2011; Brown et al., 2015). Furthermore, the use of technology at the operational stage, along
with the awareness of the communities with respect to energy consumption alongside with the
implementation of practical regulations and standards will substantially reduce the overall
energy consumption of the buildings sector (Curtis & Pentecost, 2015); (Shen et al., 2016).
The oil crises in the 1970s (Ward et al., 2011) alongside rapid development of developing
countries have raised global concerns in relation to the energy conservation in the industrial,
transport and building sectors (Iwaro & Mwasha, 2010). Accordingly, developed countries
have devised regulations and standards to improve the energy consumption of their buildings
(Iwaro & Mwasha, 2010). Today energy efficient buildings, low energy buildings and zero
energy buildings are common practice in most developed countries (Papineau, 2017).
Conversely, some of the Gulf Cooperation Countries (GCC), such as Oman, have not taken
any steps to conserve energy in the building sector, such as periodically updating legislation
and standards. The absence of governmental concern and awareness of the public in relation to
energy conservation resulted in an increased energy consumption of the residential building
sector (Reiche, 2010).
In this context, the aim of this chapter is to review the status of low carbon buildings (LCBs)
in Oman compared to GCC countries, the MENA region and at an international level.
Furthermore, the review focuses on the regulations and standards, construction practice,
materials, vernacular architecture and energy consumption of residential buildings in Oman in
16
order to identify the gaps in knowledge that has led to a reduced adoption of low carbon
building in the gulf countries with a main focus on the status of Oman.
The concept of energy and building
Energy conservation has become an important part of national energy strategies for many
countries and will continue growing in the future (Kaynakli, 2008). Managing the energy use
in buildings is a critical task for the main partners of the building industry, as it is controlled
by several factors. Energy consumption in buildings is affected by the local culture of the
occupants, climate conditions, and energy strategy and policies of the country (Xu et al., 2013).
Hence, the energy consumption of buildings varies across countries on the basis of their social,
environmental and economic status. This is one of the main reasons for the variety of
regulations and standards across the world. Therefore, it is difficult to precisely define the
magnitude of energy consumption required for low carbon buildings suitable for all countries
(Andaloro et al., 2010). For example, the annual energy consumption for home heating across
the 27 members of the European Union (EU) is 2,299 TWh with an average consumption of
152 kWh/m2. The annual consumption varies across the members states, from 19kWh/m2 in
Malta to 215 kWh/m2 in Latvia (EU, 2009). Therefore, what is considered to be low energy
practice in one country may not be considered as good practice in another country. This means
that an efficient energy practice in one country that helps to reduce the energy consumption in
buildings in a particular location may not be suitable for another location characterised by a
different cultural backgrounds, climate conditions, availability of building materials or
economic conditions. In this regard, many developed countries have set up a plan for energy
conservation in the building sector in order to fulfil their local conditions. From this
prospective, these countries established official standards to define the band of energy
consumption in residential buildings using kWh/m² per year metrics based on the country’s
energy policy, taking into consideration the climate, culture and occupants` needs. Currently,
energy conservation in buildings remains an objective to be addressed by many countries in
order to achieve a sustainable environmental and secure economic development. An example
of legislation on energy in buildings is the Energy Star label in the US, which is awarded to
houses that use 15% less energy than specified by the regulations imposed on typical new
homes (EU, 2009).
17
The European Union and other developed countries have reached an advanced level in the
status of low energy buildings, whereas most of the GCC countries have still not developed a
clear policy for energy conservation in the building sector (Papadopoulou et al., 2013; Alhorr
& Elsarrag, 2015). A review on the status of low carbon buildings and low carbon building
strategies in the GCC countries compared to the international status shows that these countries
are still lagging behind and the need still exists to either establish a clear vision or update the
existing strategies and regulations in order to promote the implementation of low carbon
buildings.
Review of related international standards on energy conservation in
buildings
International energy codes and standards are set to offer minimum/maximum acceptable values
of energy consumption of buildings in order to help designers meet the required efficiency for
a design that can achieve an optimal energy use and carbon emission (Fossati et al., 2016).
Therefore, an energy efficient building is required to comply with the available energy
codes/standards or, may perform better than what has been set in the codes, to be classified as
an efficient building. These regulations are normally classified according to the building type
and climate zone with mandatory and compulsory options (Fossati et al., 2016). The objective
of the energy conservation code is to improve the overall sustainability of buildings by setting
a single standard for the construction industry to design and build housing exerting a low
impact on the environment. The 2006 edition of the International Building Code (USA) stated:
“the purpose of code is to establish the minimum requirements to safeguard the public health,
safety and general welfare through structural strength, means of egress facilities, stability,
sanitation, adequate light and ventilation, energy consumption, and safety to life and property
from fire and other hazards attributed to the built environment and to provide safety to fire
fighters and emergency responders during emergency operations.” According to the
International Energy Agency (IEA), the 2008 building energy codes were also referred to as
“energy standards for buildings”, “thermal building regulations”, “energy conservation
building codes” or “energy efficiency building codes”. They were the key policy tools used by
governments to reduce the energy consumption of buildings. Codes normally consist of a set
of mandatory minimum energy performance requirements in the design to regulate the energy
use in buildings. They may cover both new buildings and existing buildings undergoing
18
renovation or alteration. In this regard, architects and engineers follow the instructions stated
in the codes to design buildings that meet the required energy performance. The most well-
known codes and standards that are concerned with energy conservation in buildings on a
global scale are:
1. The International Energy Conservation Code (IECC): A building code established by
the International Code Council in 2000. This is a model code used in many states in the
United States to set the minimum requirements for the design and construction of energy
efficient buildings (International Energy Conservation Code, 2012).
2. ASHRAE 90.1 (Energy Standard for Buildings Except for Low-Rise Residential
Buildings): The US standard provided for the minimum requirements of low energy
buildings except for low-rise residential buildings. The first version of the standard,
ASHRAE 90 was published in 1975. Then in 1999, the Board of Directors for ASHRAE
voted to place the standard on a continuous upgrade based on the rapid changes in energy
technology and energy prices (ASHRAE standard, 2010). The standard was renamed as
ASHRAE 90.1 in 2001. Since then, several editions and updates have been made to the
original version in 2004, 2007, 2010, and 2013 considering newer and more efficient
technologies (ASHRAE 90.1, n.d.). Standard 90.1 has served as a benchmark for
commercial building energy codes in the United States and as a key basis for codes and
standards around the world for more than 35 years (Standard 90.1 | ashrae.org, n.d.).
3. ENERGY STAR: It is a trademark in the United States standards used for energy efficient
products. It was established in 1992 by the US Environmental Protection Agency and
Department of Energy (History & Accomplishments, n.d.). Since then, it has been
successful in achieving substantial market penetration and influencing consumer decision-
making (Tonn et al., 2013). Products having the Energy Star mark label including kitchen
appliances, buildings and other products may use up to 30% less energy than what standard
appliances require (Ward et al., 2011). In the US, the label is displayed on appliances
certifying them as qualified products (Energy Savings at Home, n.d.).
4. ASHRAE Standard 189.1: It is the standard for the Design of High Performance, Green
Buildings Except Low-Rise Residential Buildings. It provides a comprehensive building
19
sustainability guidance for the designing and operation of high-performance green
buildings. The standard sets the foundation for green buildings based on the review of site
sustainability by addressing the water use efficiency, energy efficiency, indoor
environmental quality (IEQ), the building's impact on the atmosphere, materials and
resources (Understanding Standard 189.1 for High-Performance Green Buildings |
ashrae.org, 2014).
5. 2012 International Green Construction Code (IgCC): This code has been developed in
the USA by the International Code Centre ICC in collaboration with the American Institute
of Architects (AIA), ASTM International, American Society of Heating, Refrigerating and
Air-Conditioning Engineers (ASHRAE), Illuminating Engineering Society (IES) and US
Green Building Council (USGBC) in order to establish the minimum regulations for
building systems and site considerations using performance-related provisions. The release
of the public version 1.0 was announced by ICC on March 11, 2010, and the current
available version is the 2015 IgCC, whilst the upcoming version will be released in 2018
(IgCC | ICC, 2017).
6. Building Code of Australia BCA 2006, National Construction Code (NCC) introduced
the energy efficiency requirements for implementation in 2003 with detached housing and
now applies to all the classifications of buildings covered by the NCC. The current version
of the code is the NCC 2016 Volumes One, Two and Three, which are a uniform set of
technical provisions for the design and construction of buildings and other structures
throughout Australia and provides the thermal performance of the house and its domestic
services. The next version of the code is planned for publication in 2019. (NCC Volume
Two Energy Efficiency Provisions | Australian Building Codes Board, 2015).
7. The Indian Energy Conservation Building Code (BEE 2006) has been developed by
the International Institute for Energy Conservation (IIEC) under contract with the United
States Agency for International Development (USAID) as part of the Energy Conservation
and Commercialization (ECO) Project providing support to the Bureau of Energy
Efficiency (BEE) Action Plan. The purpose of this code is to provide minimum
requirements for the energy-efficient design and construction of buildings. The code is
mandatory for commercial buildings or building complexes that have a connected load of
more than 500 kW. The code is also applicable to all buildings with a conditioned floor
20
area greater than 1,000 m2. Furthermore, the code can be recommended for all other
buildings (Energy Conservation Building Code User Guide, 2009).
8. Building Regulations (Part L) for UK and Ireland: It is an approved document for the
conservation of fuel and power in buildings. The document consists of four parts L1 A, L1
B and L2 B. Document L1 is specific for dwellings whereas document L2 refers to all
other buildings. Part L of the code explains the required values of insulation of the building
elements, the permitted sizes of windows, doors and other openings and the air
permeability. It sets out the heating efficiency of boilers and the insulation and controls
for heating appliances and systems together with hot water storage and lighting efficiency
(Guide to Part L of the Building Regulations, 2010). The 2013 edition L1A: Conservation
of fuel and power in new dwellings is the current edition for use in England which replaced
the previous editions starting from 6 April 2014 (Portal, 2017).
2.3.1 International application of energy standards for buildings
UK & Wales: In the UK, there is an increasing interest among policy makers and researchers
in the energy regulations of new dwellings. The Building Regulations (Part L) were revised in
2002, 2006, 2010 and 2013 towards a target of zero carbon in new homes. Part L ‘Conservation
of fuel and power’ deals specifically with the energy efficiency requirements in the built
environment and contains four parts: Part L1A for new dwellings, Part L1B for existing
dwellings, Part L2A for new buildings other than dwellings, and Part L2B for existing buildings
other than dwellings (Portal, 2017). The UK is committed to the reduction of 80% of carbon
emissions by year 2050, compared to its levels in 1990. A 25% reduction was achieved in 2010,
whilst new buildings are planned to be zero carbon between 2016 and 2020 (Zapata-Lancaster,
2014).
United States: The ENERGY STAR programme is considered as the largest programme in the
country defining low energy homes. Buildings certified by ENERGY STAR reduce more than
15% of the energy use compared to similar standard new homes (Tonn et al., 2013). Also, the
US Department of Energy introduced a programme in 2008 to increase the adoption of zero-
energy domestic buildings in the US. Now, developers commit to delivering new homes that
achieve 30% savings on a home energy rating scale (Ward et al., 2011).
21
Germany: In Germany, the Energy Saving Regulation EnEV defined the thermal insulation
standards that need to be satisfied in new buildings and in refurbishment projects. It aims to
save heating costs and reduce greenhouse gases, such as CO2. The energy saving regulations
were introduced in 2009 and are referred to as the EnEV 2009. Then, it has been updated to the
current version EnEV 2014. The requirements of EnEV 2014 for new buildings are calculated
in relation to a reference building with an identical geometry. The standard specifies the
envelope properties, such as the U-values and the standard installation for the reference
building provided by EnEV. It states that the primary energy use of the proposed building must
be below or equal to the energy use of the reference building (GmbH, 2017; Melita Tuschinski,
2017). The aim of the regulation is largely to achieve a climate neutral inventory of the existing
buildings by 2050 and around 60% savings in energy consumption through efficiency measures
on the building envelope and construction technology compared to its status in 2010 (Energy-
efficient building and refurbishment the right way, 2017).
France: The new French regulation RT 2012 issued in December 2012 aims to limit energy
consumption in buildings. It came into force for both residential and non-residential buildings
in January 2013. RT 2012 defines the total primary energy consumption for heating, cooling,
hot water production, lighting, ventilation, and any auxiliary systems used for these purposes.
RT 2012 stated the target maximum value of Cep to be 50 kWh/m2a, where the Cep coefficient
represents the conventional annual consumption of primary energy of a building, reduced to
the floor surface, using the net floor area of the building defined by the French building code
(Feldmann, 2013). Furthermore, with the implementation of “RT2020”, buildings’ occupants
will be educated to use less energy in order to reduce the energy consumption of their home
equipment (Thermal regulations 2012 and 2020 in France, 2017).
Denmark: The Danish building code issued by the Danish Enterprise and Construction
Authority, clearly addresses the minimum energy performance required by the code in the form
of the primary energy indicator for new buildings. The code, namely BR 10, was amended and
updated to the current version BR 15 which has two voluntary low-energy classes named class
2015 and class 2020. These classes represent references for the expected minimum energy
performance of buildings in 2015 and 2020. The regulations came into force on the 1st of
January 2011. The difference between BR10 and BR08 is that there is a tightening of 25% of
the energy performance frameworks and insulation requirements for components and building
elements (BR15 in English, 2017).
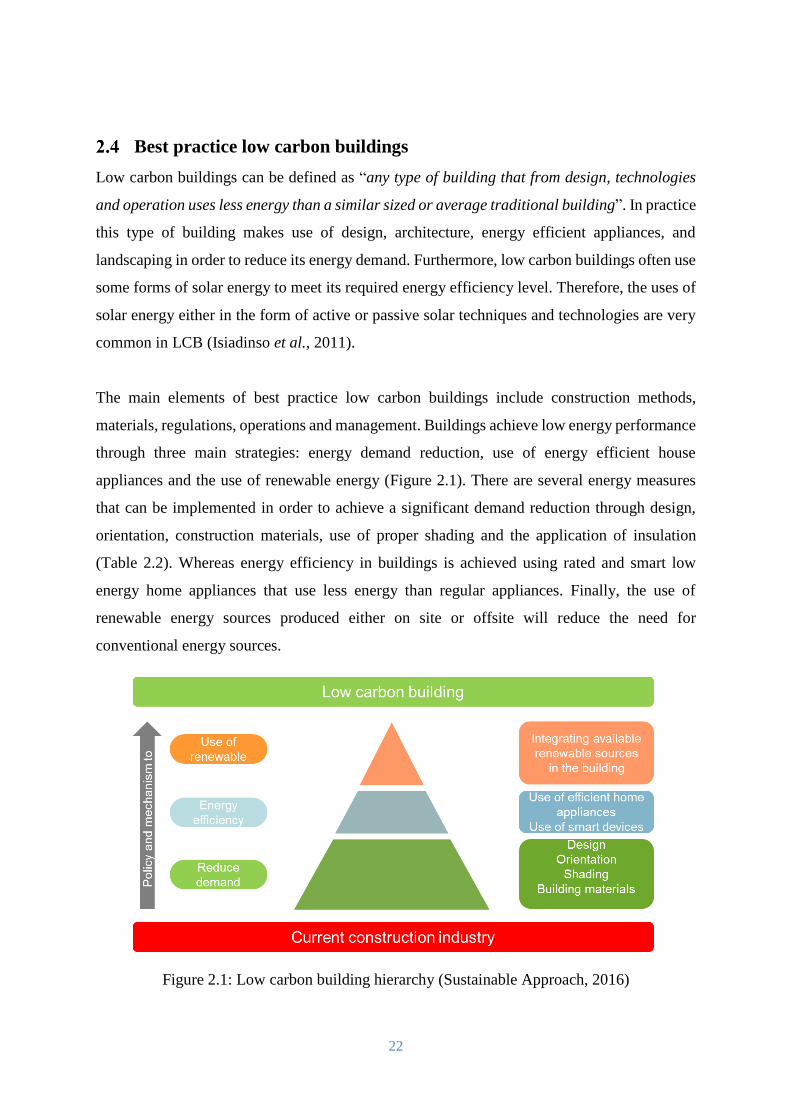
22
Best practice low carbon buildings
Low carbon buildings can be defined as “any type of building that from design, technologies
and operation uses less energy than a similar sized or average traditional building”. In practice
this type of building makes use of design, architecture, energy efficient appliances, and
landscaping in order to reduce its energy demand. Furthermore, low carbon buildings often use
some forms of solar energy to meet its required energy efficiency level. Therefore, the uses of
solar energy either in the form of active or passive solar techniques and technologies are very
common in LCB (Isiadinso et al., 2011).
The main elements of best practice low carbon buildings include construction methods,
materials, regulations, operations and management. Buildings achieve low energy performance
through three main strategies: energy demand reduction, use of energy efficient house
appliances and the use of renewable energy (Figure 2.1). There are several energy measures
that can be implemented in order to achieve a significant demand reduction through design,
orientation, construction materials, use of proper shading and the application of insulation
(Table 2.2). Whereas energy efficiency in buildings is achieved using rated and smart low
energy home appliances that use less energy than regular appliances. Finally, the use of
renewable energy sources produced either on site or offsite will reduce the need for
conventional energy sources.
Figure 2.1: Low carbon building hierarchy (Sustainable Approach, 2016)
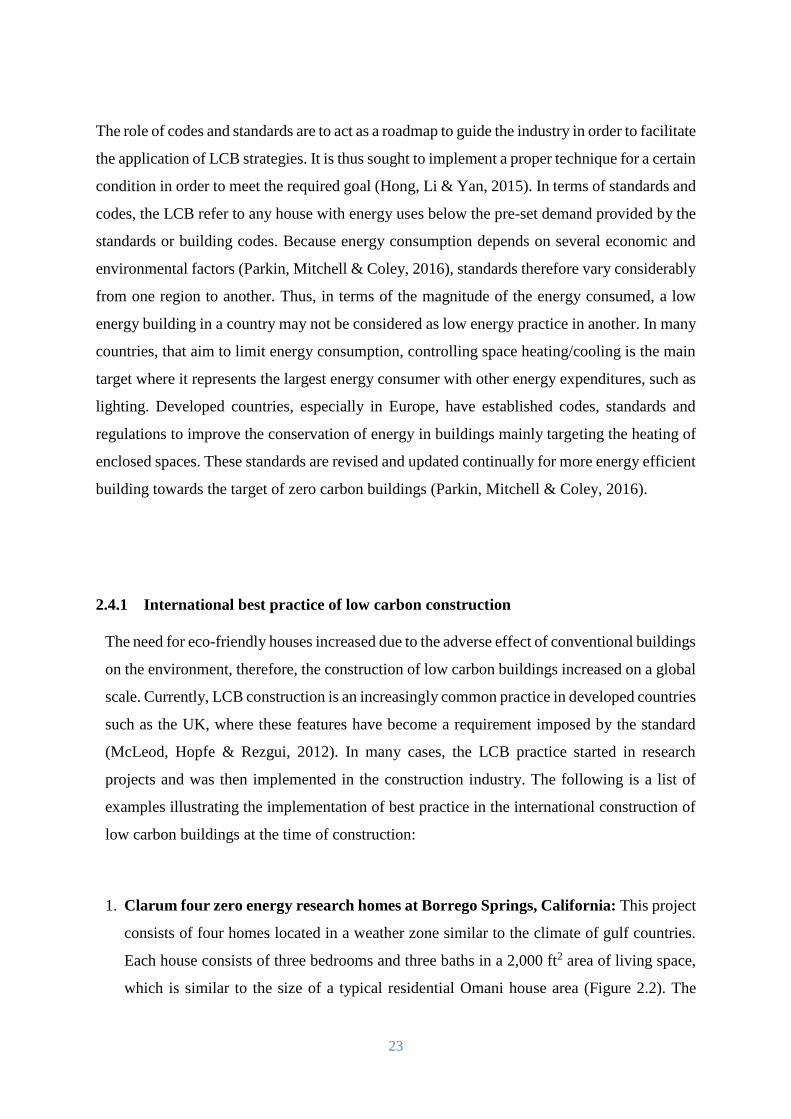
23
The role of codes and standards are to act as a roadmap to guide the industry in order to facilitate
the application of LCB strategies. It is thus sought to implement a proper technique for a certain
condition in order to meet the required goal (Hong, Li & Yan, 2015). In terms of standards and
codes, the LCB refer to any house with energy uses below the pre-set demand provided by the
standards or building codes. Because energy consumption depends on several economic and
environmental factors (Parkin, Mitchell & Coley, 2016), standards therefore vary considerably
from one region to another. Thus, in terms of the magnitude of the energy consumed, a low
energy building in a country may not be considered as low energy practice in another. In many
countries, that aim to limit energy consumption, controlling space heating/cooling is the main
target where it represents the largest energy consumer with other energy expenditures, such as
lighting. Developed countries, especially in Europe, have established codes, standards and
regulations to improve the conservation of energy in buildings mainly targeting the heating of
enclosed spaces. These standards are revised and updated continually for more energy efficient
building towards the target of zero carbon buildings (Parkin, Mitchell & Coley, 2016).
2.4.1 International best practice of low carbon construction
The need for eco-friendly houses increased due to the adverse effect of conventional buildings
on the environment, therefore, the construction of low carbon buildings increased on a global
scale. Currently, LCB construction is an increasingly common practice in developed countries
such as the UK, where these features have become a requirement imposed by the standard
(McLeod, Hopfe & Rezgui, 2012). In many cases, the LCB practice started in research
projects and was then implemented in the construction industry. The following is a list of
examples illustrating the implementation of best practice in the international construction of
low carbon buildings at the time of construction:
1. Clarum four zero energy research homes at Borrego Springs, California: This project
consists of four homes located in a weather zone similar to the climate of gulf countries.
Each house consists of three bedrooms and three baths in a 2,000 ft2 area of living space,
which is similar to the size of a typical residential Omani house area (Figure 2.2). The
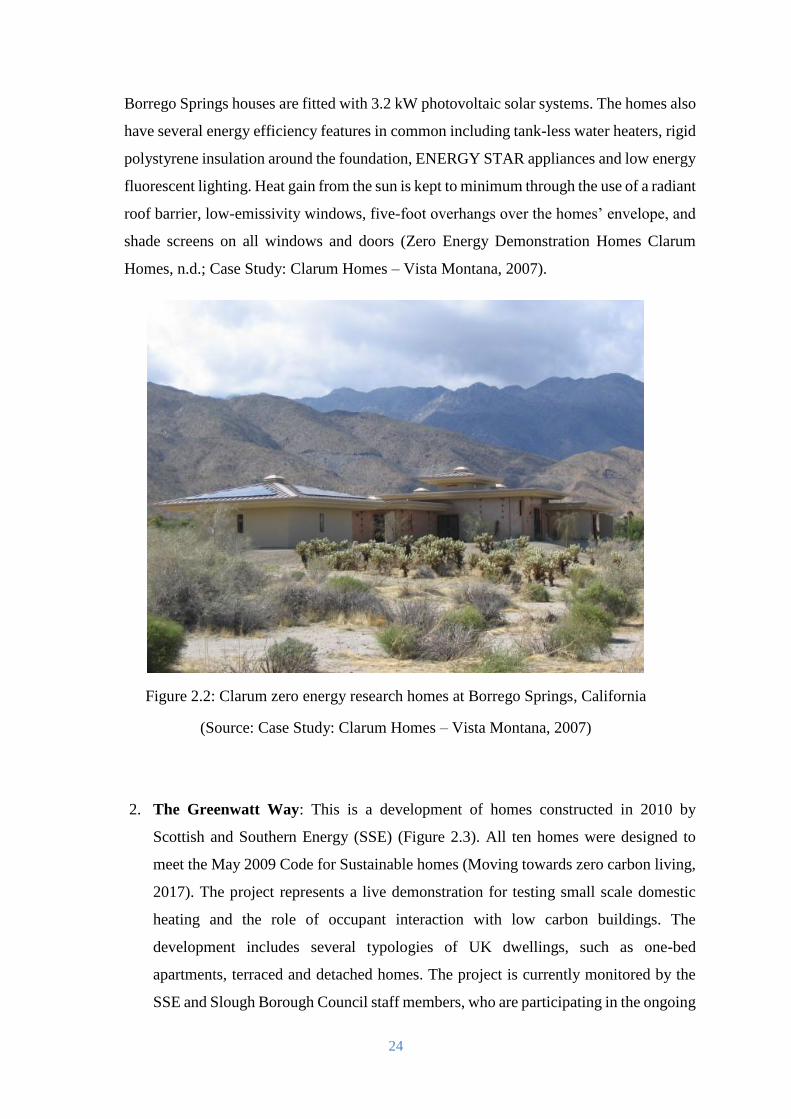
24
Borrego Springs houses are fitted with 3.2 kW photovoltaic solar systems. The homes also
have several energy efficiency features in common including tank-less water heaters, rigid
polystyrene insulation around the foundation, ENERGY STAR appliances and low energy
fluorescent lighting. Heat gain from the sun is kept to minimum through the use of a radiant
roof barrier, low-emissivity windows, five-foot overhangs over the homes’ envelope, and
shade screens on all windows and doors (Zero Energy Demonstration Homes Clarum
Homes, n.d.; Case Study: Clarum Homes – Vista Montana, 2007).
Figure 2.2: Clarum zero energy research homes at Borrego Springs, California
(Source: Case Study: Clarum Homes – Vista Montana, 2007)
2. The Greenwatt Way: This is a development of homes constructed in 2010 by
Scottish and Southern Energy (SSE) (Figure 2.3). All ten homes were designed to
meet the May 2009 Code for Sustainable homes (Moving towards zero carbon living,
2017). The project represents a live demonstration for testing small scale domestic
heating and the role of occupant interaction with low carbon buildings. The
development includes several typologies of UK dwellings, such as one-bed
apartments, terraced and detached homes. The project is currently monitored by the
SSE and Slough Borough Council staff members, who are participating in the ongoing
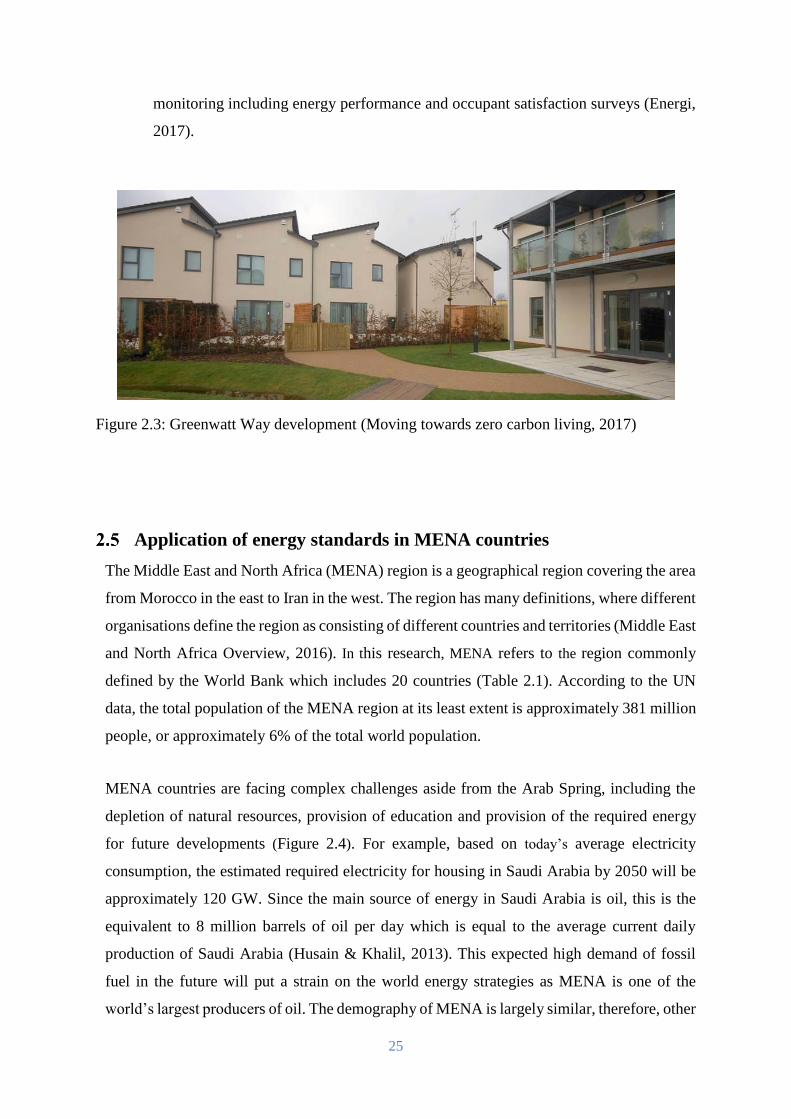
25
monitoring including energy performance and occupant satisfaction surveys (Energi,
2017).
Figure 2.3: Greenwatt Way development (Moving towards zero carbon living, 2017)
Application of energy standards in MENA countries
The Middle East and North Africa (MENA) region is a geographical region covering the area
from Morocco in the east to Iran in the west. The region has many definitions, where different
organisations define the region as consisting of different countries and territories (Middle East
and North Africa Overview, 2016). In this research, MENA refers to the region commonly
defined by the World Bank which includes 20 countries (Table 2.1). According to the UN
data, the total population of the MENA region at its least extent is approximately 381 million
people, or approximately 6% of the total world population.
MENA countries are facing complex challenges aside from the Arab Spring, including the
depletion of natural resources, provision of education and provision of the required energy
for future developments (Figure 2.4). For example, based on today’s average electricity
consumption, the estimated required electricity for housing in Saudi Arabia by 2050 will be
approximately 120 GW. Since the main source of energy in Saudi Arabia is oil, this is the
equivalent to 8 million barrels of oil per day which is equal to the average current daily
production of Saudi Arabia (Husain & Khalil, 2013). This expected high demand of fossil
fuel in the future will put a strain on the world energy strategies as MENA is one of the
world’s largest producers of oil. The demography of MENA is largely similar, therefore, other
26
countries will have an increasing demand for energy especially for housing purposes in a
similar manner. In order to meet the domestic energy needs and provide more natural
resources, MENA needs to set goals to develop alternative sources of energy, such as,
producing energy from renewable sources for a given target. In fact, little has been done to
conserve energy in most of these countries. Buildings account for the majority of energy
consumption in all of these countries due to a lack of strict building energy laws to help reduce
their overall consumption of energy (Meir et al., 2012).
Figure 2.4: Energy consumption per capita per country
(Source: The United Nations world water development report 2014, 2014))
Based on the countries’ ranking by energy consumption, apart from Yemen and Sudan, the
MENA region can be classified in the medium to high energy consumers per capita. It is well
observed that this status reflects a lesser implementation of strategic plans towards
sustainability. From this point of view, most of the MENA region including all GCC countries
is characterised by the same pattern of energy consumption involving fewer energy standards
and high energy use (Table 2.1). However, the application of these standards in each country
in the region varies according to their political and economic status. Moreover, from the data
presented in the world energy consumption map in Figure 2.4, most MENA countries are
considered as high or medium energy consumers per capita. Oman ranked in 10th position in
the world and in 5th position in the MENA region (Meir et al., 2012).
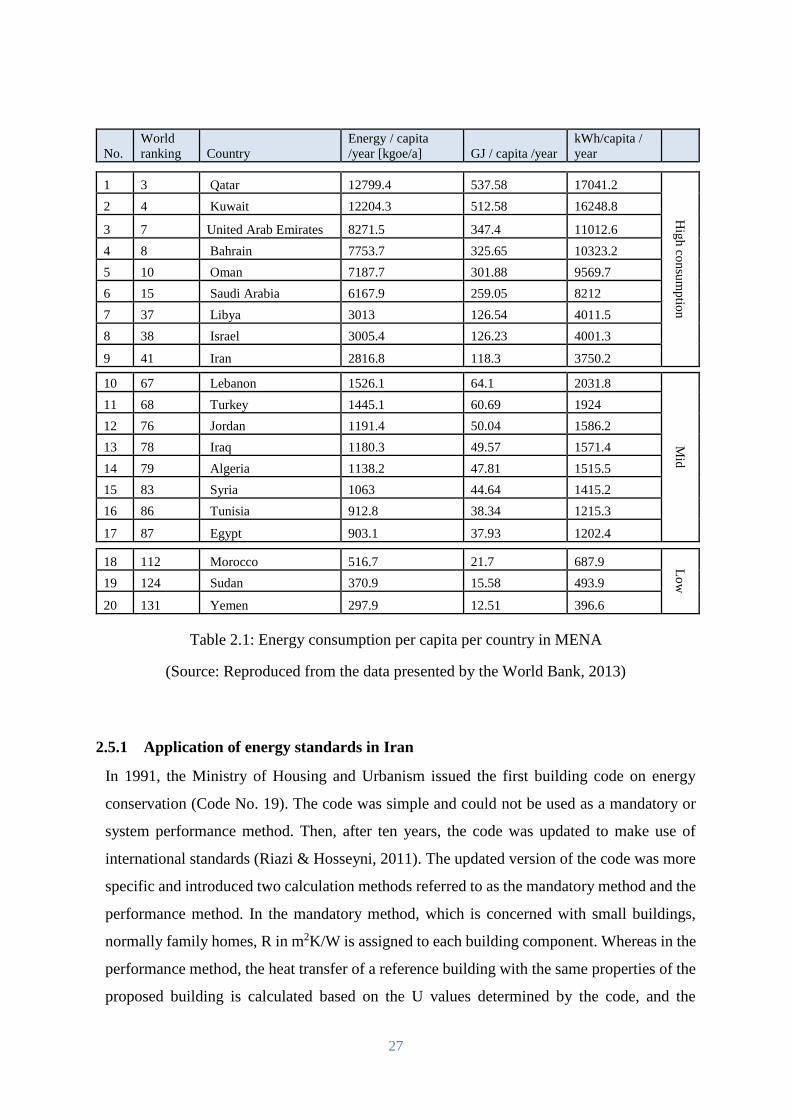
27
No.
World
ranking Country
Energy / capita
/year [kgoe/a] GJ / capita /year
kWh/capita /
year
1 3 Qatar 12799.4 537.58 17041.2
Hig
h co
nsu
mp
tion
2 4 Kuwait 12204.3 512.58 16248.8
3 7 United Arab Emirates 8271.5 347.4 11012.6
4 8 Bahrain 7753.7 325.65 10323.2
5 10 Oman 7187.7 301.88 9569.7
6 15 Saudi Arabia 6167.9 259.05 8212
7 37 Libya 3013 126.54 4011.5
8 38 Israel 3005.4 126.23 4001.3
9 41 Iran 2816.8 118.3 3750.2
10 67 Lebanon 1526.1 64.1 2031.8
Mid
11 68 Turkey 1445.1 60.69 1924
12 76 Jordan 1191.4 50.04 1586.2
13 78 Iraq 1180.3 49.57 1571.4
14 79 Algeria 1138.2 47.81 1515.5
15 83 Syria 1063 44.64 1415.2
16 86 Tunisia 912.8 38.34 1215.3
17 87 Egypt 903.1 37.93 1202.4
18 112 Morocco 516.7 21.7 687.9 Lo
w
19 124 Sudan 370.9 15.58 493.9
20 131 Yemen 297.9 12.51 396.6
Table 2.1: Energy consumption per capita per country in MENA
(Source: Reproduced from the data presented by the World Bank, 2013)
2.5.1 Application of energy standards in Iran
In 1991, the Ministry of Housing and Urbanism issued the first building code on energy
conservation (Code No. 19). The code was simple and could not be used as a mandatory or
system performance method. Then, after ten years, the code was updated to make use of
international standards (Riazi & Hosseyni, 2011). The updated version of the code was more
specific and introduced two calculation methods referred to as the mandatory method and the
performance method. In the mandatory method, which is concerned with small buildings,
normally family homes, R in m2K/W is assigned to each building component. Whereas in the
performance method, the heat transfer of a reference building with the same properties of the
proposed building is calculated based on the U values determined by the code, and the
28
calculated results should be more than the total heat transfer of the proposed building. Also,
the new version of the code included descriptions of the lighting and mechanical systems.
Despite the number of codes, Iran paid $84 billion in subsidies for energy in 2008 including
residential buildings’ electricity (Omrany & Marsono, 2016). Energy consumption data
shows that the energy per capita consumption was 15 times higher than that of Japan and 10
times that of the European Union. Similarly to the GCC countries, due to huge energy
subsidies, Iran is one of the most energy inefficient countries in the world, with an energy
intensity three times higher than the world average and 2.5 times higher than the Middle East
average (Fayaz & Kari, 2009; Omrany & Marsono, 2016).
2.5.2 Application of energy standards in Jordan
In Jordan, the building energy code was developed in 2008 by the Royal scientific Society as
an update to the 1998 code. It is a voluntary code which covers insulation and other energy
applications in buildings based on ASHRAE 90.11-2007. Recently, as part of the new
Jordanian national energy efficiency strategy, the use of thermal insulation in residential and
commercial buildings in certain zoning areas will be enforced. The strategy also encourages
The Jordan Green Building Council to promote appropriate green building concepts and
practices for the Jordanian building and construction sector. However, in the real industry
there are no energy standards implemented (The State of Energy Efficiency Policies in Middle
East Buildings, 2017).
2.5.3 Application of energy standards in Egypt
Egypt developed its own residential building energy efficiency codes between 2005 and 2010.
Then, another code was introduced in 2013 to improve the indoor air quality and ventilation
requirements. Researchers expect that compliance with the new energy code will have the
potential to save approximately 20% of the energy consumption of buildings (Hanna, 2015).
However, the new codes are still not compulsory and will be implemented as voluntary
requirements. Recent research has also shown that these efforts are yet to make a change in
the Egyptian design practices towards an improvement in energy efficiency (Huang et al.,
2003; Hanna, 2015). Furthermore, the Egypt Green Building Council established in 2009,
developed its Green Pyramids Rating System in December 2010. In addition to the
development of energy efficiency standards and rating systems, the Egyptian government
29
developed energy labels for the most used home appliances including room air conditioners,
washing machines, and refrigerators. Now, it is mandatory for both local manufactured and
imported appliances to meet the energy efficiency specifications (Hanna, 2015). The Egyptian
Residential Energy Code provided specifications and recommendations for the construction
of buildings that aim to provide comfort for the occupants. Although these specifications are
well-defined in the code, recommendations for obtaining the best combinations for each
climate zone do not exist (Mahdy & Nikolopoulou, 2014).
2.5.4 Application of energy standards in Lebanon
In Lebanon, a thermal energy standard for buildings is under development with the support
of the ADEME of France. The Lebanese construction law also provides economic incentives
for the voluntary thermal insulation of buildings. However, due to a weak legislative and
institutional framework, subsidies of energy prices, and the absence of a national energy
strategy, many energy efficiency projects in Lebanon have failed to achieve tangible results
(Mourtada, 2008). On the other hand, the Lebanon Green Building Council (LGBC) created
the Building Rating System (ARZ), as the first Lebanese green building initiative to
implement international standards. It has been established in order to support the growth and
adoption of sustainable building practices in Lebanon with a specific focus on the
environmental assessment and rating system for commercial buildings. Its aim is to maximise
the operational efficiency and minimise the environmental impact. The system includes a list
of technologies, techniques, procedures and energy consumption levels that the LGBC
recommended to be adopted in green buildings (ARZ Building Rating System, 2017).
However, similarly to many other MENA countries, Lebanon's legislative framework remains
fragmented and incomplete. The country still lacks comprehensive laws dealing with several
energy issues, including renewable energy or energy efficiency. The implementation of the
existing legislation remains a major challenge, as the provisions of the existing laws are not
implemented. This can be referred to the 2006 July war and how its consequent political
difficulties have postponed the implementation of energy codes (The State of Energy
Efficiency Policies in Middle East Buildings, 2017).
30
2.5.5 Application of energy standards in Tunisia
Tunisia has recently implemented both standards and a labelling system for household
appliances. As a result of this initiative, it is expected that by 2030 this will save
approximately 3.4 Mt of CO2 emissions (LIHIDHEB, 2007). Law No. 2004-72 defined the
conservation of energy as a national priority for the country and will act as the main element
of its sustainable development policy. The law referenced three main goals, namely energy
saving, the use of renewable energy and the introduction of new forms of construction.
Additionally, The National Energy Conservation Action Plan aims to achieve a 30-30 goal,
which refers to a production of 30% of electricity from renewable sources by 2030. In parallel
with the implementation of the conservation code, the building energy labelling scheme was
also developed in 2004. The code and the labelling system became mandatory for office
buildings and residential buildings exceeding 500 m2 in July 2008, with the exception of
single-family houses. The code was drafted on the basis of the overall performance of
buildings. Whilst the energy rating scale ranges from one to eight and is based on the
estimated energy needs for heating and cooling, using the calculation methodology from the
building energy code. The reference value in the labelling scheme corresponds to the
maximum allowed energy need for the buildings designed according to the current code.
Then, this value is set as a reference value of 100% energy consumption for the designed
building and corresponds to energy grade 5 in the rating scale. The label system includes three
grades below and four grades above this requirement. The lower efficiency grades correspond
to buildings which require more energy, that is to say in a proportion of 15%, 35% and 50%
than the reference building requirement, whereas the higher efficient grades refer to buildings
requiring 15%, 25%, 35% and 40% lower energy rates than the maximum energy requirement
allowed by the code (Figure 2.5) (The State of Energy Efficiency Policies in Middle East
Buildings, 2017).
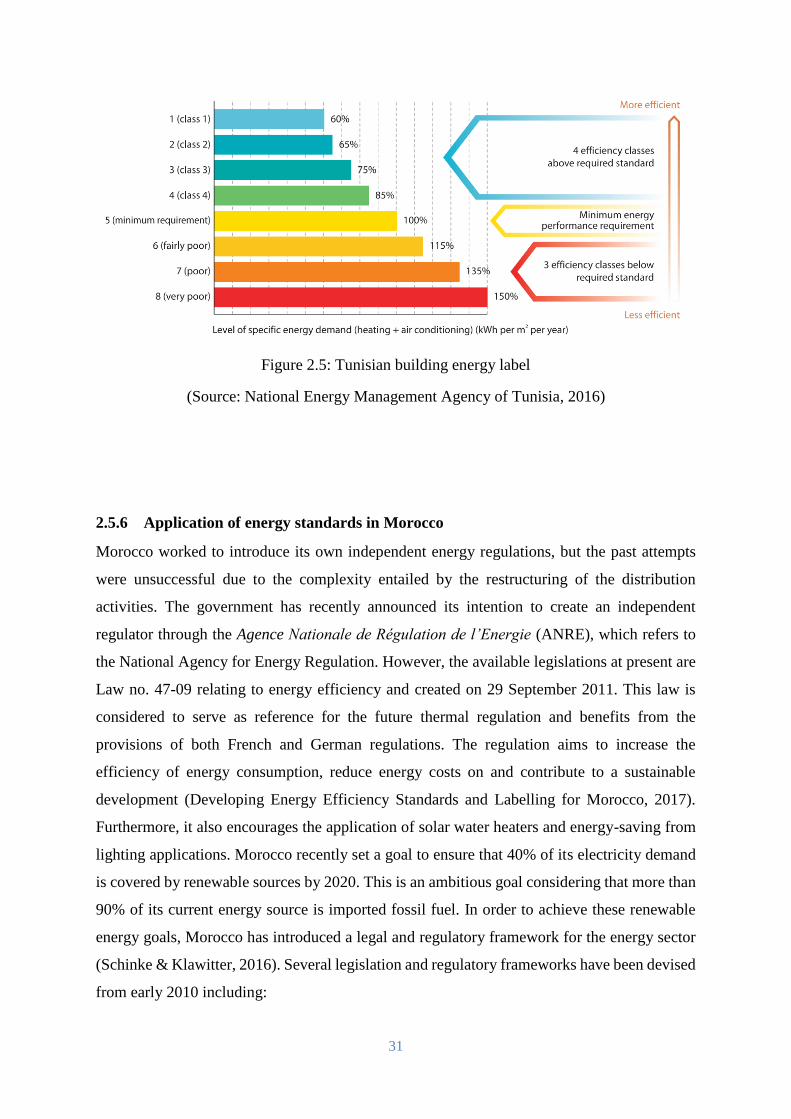
31
Figure 2.5: Tunisian building energy label
(Source: National Energy Management Agency of Tunisia, 2016)
2.5.6 Application of energy standards in Morocco
Morocco worked to introduce its own independent energy regulations, but the past attempts
were unsuccessful due to the complexity entailed by the restructuring of the distribution
activities. The government has recently announced its intention to create an independent
regulator through the Agence Nationale de Régulation de l’Energie (ANRE), which refers to
the National Agency for Energy Regulation. However, the available legislations at present are
Law no. 47-09 relating to energy efficiency and created on 29 September 2011. This law is
considered to serve as reference for the future thermal regulation and benefits from the
provisions of both French and German regulations. The regulation aims to increase the
efficiency of energy consumption, reduce energy costs on and contribute to a sustainable
development (Developing Energy Efficiency Standards and Labelling for Morocco, 2017).
Furthermore, it also encourages the application of solar water heaters and energy-saving from
lighting applications. Morocco recently set a goal to ensure that 40% of its electricity demand
is covered by renewable sources by 2020. This is an ambitious goal considering that more than
90% of its current energy source is imported fossil fuel. In order to achieve these renewable
energy goals, Morocco has introduced a legal and regulatory framework for the energy sector
(Schinke & Klawitter, 2016). Several legislation and regulatory frameworks have been devised
from early 2010 including:
32
The Renewable Energy Law 13.09 of February 11, 2010 which aims to foster and
promote renewable energy and regulates its commercialisation (reegle - clean energy
information gateway, 2014).
The law for the creation of the National Agency for the Promotion of Renewable Energy
and Energy Conservation (ADEREE) of January 13, 2010 (reegle - clean energy
information gateway, 2014).
The law for the creation of the Moroccan Agency for Solar Energy (MASEN) of
January 14, 2010, which is the prime contractor for solar power projects (Reegle - clean
energy information gateway, 2014).
2.5.7 The MENA LCB status
The current review of the construction process in many of the MENA countries seems to be
lacking in energy conservation and environmental initiatives, and the construction of low
carbon buildings in particular is still not a common practice. A closer look, however, indicates
that the LCB can be considered as one of the key solutions for the area’s problems in terms of
resource depletion, population growth and urbanisation. This is due to the fact that all MENA
countries provide a large amount of subsidies on energy, particularly for domestic use, which
will assist in the subsequent development of these countries. According to Meir et al. (2012),
the majority of MENA countries do not practice energy conservation in domestic buildings or
have not established standard yet (Table 2.2).
Among these countries, Oman has not achieved or devised any strategy for adopting a green
building standard or introducing any labelling system.
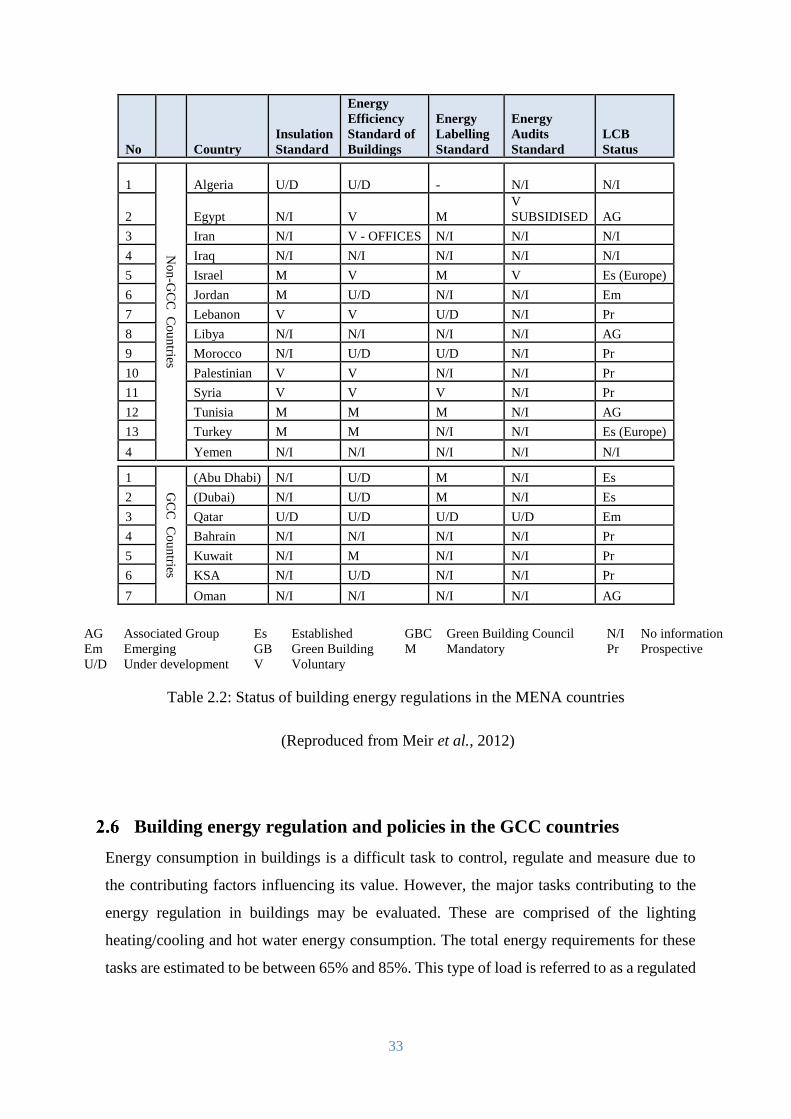
33
No Country
Insulation
Standard
Energy
Efficiency
Standard of
Buildings
Energy
Labelling
Standard
Energy
Audits
Standard
LCB
Status
1
No
n-G
CC
Co
un
tries
Algeria U/D U/D - N/I N/I
2 Egypt N/I V M
V
SUBSIDISED AG
3 Iran N/I V - OFFICES N/I N/I N/I
4 Iraq N/I N/I N/I N/I N/I
5 Israel M V M V Es (Europe)
6 Jordan M U/D N/I N/I Em
7 Lebanon V V U/D N/I Pr
8 Libya N/I N/I N/I N/I AG
9 Morocco N/I U/D U/D N/I Pr
10 Palestinian V V N/I N/I Pr
11 Syria V V V N/I Pr
12 Tunisia M M M N/I AG
13 Turkey M M N/I N/I Es (Europe)
4 Yemen N/I N/I N/I N/I N/I
1
GC
C C
ou
ntries
(Abu Dhabi) N/I U/D M N/I Es
2 (Dubai) N/I U/D M N/I Es
3 Qatar U/D U/D U/D U/D Em
4 Bahrain N/I N/I N/I N/I Pr
5 Kuwait N/I M N/I N/I Pr
6 KSA N/I U/D N/I N/I Pr
7 Oman N/I N/I N/I N/I AG
AG Associated Group Es Established GBC Green Building Council N/I No information
Em Emerging GB Green Building M Mandatory Pr Prospective
U/D Under development V Voluntary
Table 2.2: Status of building energy regulations in the MENA countries
(Reproduced from Meir et al., 2012)
Building energy regulation and policies in the GCC countries
Energy consumption in buildings is a difficult task to control, regulate and measure due to
the contributing factors influencing its value. However, the major tasks contributing to the
energy regulation in buildings may be evaluated. These are comprised of the lighting
heating/cooling and hot water energy consumption. The total energy requirements for these
tasks are estimated to be between 65% and 85%. This type of load is referred to as a regulated
34
or measurable load, whilst the remaining is known as an unregulated or unmeasured load
(Birchall et al., 2014).
The statistics data from The Cooperation Council for the Arab States of the Gulf Secretariat
General stated that by 2020, the total population of the GCC is forecast to be 53.5 million
representing an increase of 30% compared to the record total population in 2000, whereas the
real GDP is expected to grow by 56% in the next decade. This will provide more potential for
development (GCC Statistics, 2017). As the GCC population and developments expand in a
rapid manner, the Gulf region faces an increasing strain on its demand for services, including
energy consumption for domestic buildings. Furthermore, the regulation of electricity use in
domestic buildings, the largest electricity consumers, is still not properly implemented,
whereby all GCC countries provide subsidies on electricity. Each country has established a
single buyer organisation commissioned to buy electricity from utility companies and resell
it to the consumer at reduced costs:
Saudi Arabia has formed the Electricity and Co-Generation Regulatory Authority
(Statistical, 2015).
Qatar created the Qatar General Electricity & Water Corporation in 2000 (Al-Kuwari,
2017).
In the UAE, the Abu Dhabi Water and Electricity Authority is a single buyer (About
Us – ADWEA, 2017)
In Oman, the Oman Power and Water Procurement Company acts as a single buyer
(The Oman Power and Water Procurement Company (OPWP), 2017).
The UN Agenda 21 (CIB & UNEP-IETC, 2002) stated that the majority of the developing
world is undergoing a process of rapid construction. Therefore, sustainable development
needs to be better understood in the Gulf countries because of the issues associated with the
environmental impact of the rapid construction of buildings, such as health issues, dense
urban spaces, and increased energy supply requirements (Sustainable Patterns of
Urbanization in Oman | aurelVR architecture, 2014). On the other hand, the increasing
population paired with an increased housing demand, the need for more energy, and the
limited age of the conventional energy supply, make the issue of energy consumption in
buildings a challenging task for the GCC countries. Energy in buildings has become more
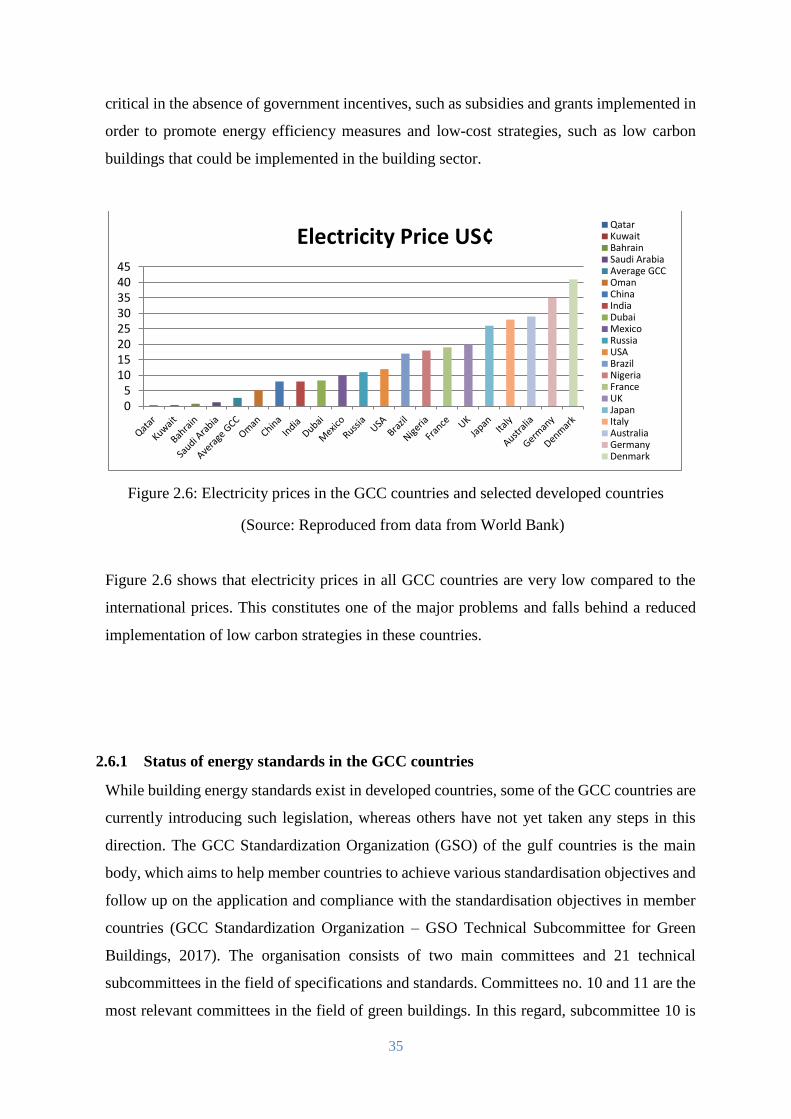
35
critical in the absence of government incentives, such as subsidies and grants implemented in
order to promote energy efficiency measures and low-cost strategies, such as low carbon
buildings that could be implemented in the building sector.
Figure 2.6: Electricity prices in the GCC countries and selected developed countries
(Source: Reproduced from data from World Bank)
Figure 2.6 shows that electricity prices in all GCC countries are very low compared to the
international prices. This constitutes one of the major problems and falls behind a reduced
implementation of low carbon strategies in these countries.
2.6.1 Status of energy standards in the GCC countries
While building energy standards exist in developed countries, some of the GCC countries are
currently introducing such legislation, whereas others have not yet taken any steps in this
direction. The GCC Standardization Organization (GSO) of the gulf countries is the main
body, which aims to help member countries to achieve various standardisation objectives and
follow up on the application and compliance with the standardisation objectives in member
countries (GCC Standardization Organization – GSO Technical Subcommittee for Green
Buildings, 2017). The organisation consists of two main committees and 21 technical
subcommittees in the field of specifications and standards. Committees no. 10 and 11 are the
most relevant committees in the field of green buildings. In this regard, subcommittee 10 is
05
1015202530354045
Electricity Price US¢QatarKuwaitBahrainSaudi ArabiaAverage GCCOmanChinaIndiaDubaiMexicoRussiaUSABrazilNigeriaFranceUKJapanItalyAustraliaGermanyDenmark
36
numbered as the TC06 Gulf Technical Committee on the specification of construction and
construction materials. The task of this technical committee is to prepare draft standards and
technical regulations for the GCC in the field of construction materials and activities and to
set priorities that meet the actual needs in order to achieve the relevant health, safety and
environmental requirements. Conversely, subcommittee 11 numbered TC06/SC01 is an
emerging subcommittee concerning the technical specification of green buildings for the Gulf
countries. Nevertheless, up to this point, these committees have not yet set up common
standards that can be referred to in all GCC countries. Therefore, most members have either
created or have started to create their own standards. This is due to the differences in the
economic and climatic conditions of each country and the construction visions that each
country selected (GCC Standardization Organization – GSO Technical Subcommittee for
Green Buildings, 2017). Hence, the building energy standard in the member countries of the
GCC is summarised as follows:
Kuwait: In Kuwait, buildings consume 48% of the total energy demand on a national level,
whereas air-conditioning accounts for approximately 70% of the buildings’ energy demand
(Ameer & Krarti, 2016). The latest code of practice for energy conservation was developed
to set limits for the electrical consumption of the air-conditioning systems of buildings. The
code was developed as part of the Energy Conservation Program referred to as the Code of
Practice MEW/R-6/2014. The code introduced energy conservation measures and limits for
different types of buildings, but the application of this code is yet to be practically enforced.
MEW/R6/1983 is the early version of the energy code for buildings developed by the Ministry
of Electricity and Water. The code did not consider any application of thermal storage systems
or the thermal insulation of exposed floors. Then in 2010, a new version of the code was
issued under the designation MEW/R6/20, as an improvement to the previous version. The
new version considered cool storage systems as mandatory for partially occupied buildings.
The thermal insulation for exposed floors with an R-value of 10 is mandatory. Moreover, in
late 2009, the ASHRAE members from the United States and the Kuwait University created
a version of the ASHRAE Standard 90.2-2007 which took account of the differences between
the existing standards and the needs of Kuwait. As a result of this cooperation, ASHRAE
Standard 90.2 Kuwait, was published in March 2010 and presented to the Kuwait Ministry of
Energy and Water (Code of Practice, 2014).
37
United Arab Emirates: For the last few decades, the rapid urbanisation in the UAE was
characterised by forms of imported modern architecture, which is not environmentally
responsive to the region’s climate. This caused a significant demand for electricity for air
conditioning purposes, as can be seen in most major cities, such as Dubai and Abu Dhabi.
These unsustainable designs of residential and commercial buildings, in addition to being
major consumers of energy, are also massive contributors to the GHG emissions. Therefore,
the Government of Abu Dhabi developed a set of measures to reduce energy consumption,
including the launch of the Estidama programme and the Pearls green building rating system
which was integrated into the building code and became partly enforceable, as well as the
launch of the Emirates Green Buildings Council (Estidama – Estidama and Urban
Development, 2015).
In Dubai, the latest developments in the construction industry are constituted by the
regulations introduced by the Dubai Municipality under Circular No. (198) of 2014 for energy
conservation in buildings. In its first publication, the regulations applied to government
buildings only. However, from 1 March 2014, the regulations have started to apply to all new
construction projects across the residential, commercial and industrial sectors. Furthermore,
extensions to and the refurbishment of existing buildings must also comply with the
regulations as a basic requirement for a building permit from the Dubai Municipality (Manual
of Green Building Materials, Products & Their Testing Facilities, 2017; Green Building
Regulations & Specifications, 2015). The primary purpose of the regulations is to improve
the energy performance of buildings by seeking to reduce their consumption of energy, water
and materials. In order to achieve this, the regulations directly affect all parts of the
construction process, from the initial site selection and building design through to
construction, post-completion operation and maintenance of the building and finally the
removal of the building at the end of its life cycle. When applying for a building permit with
the Dubai Municipality, developers are now required to complete a ‘Green Building
Declaration’, defined in the regulations as an “unconditional commitment from the
development team to meet the requirements of the Green Building Regulations” (Green
Building Regulations & Specifications, 2015).
Moreover, the Emirates Authority for Standardisation and Metrology has launched a scheme
in 2010 to certify electronic goods, and air-conditioning units according to their energy
efficiency. In 2014, The UAE Energy Efficiency Lighting Standard was introduced as a step
38
taken by the UAE Ecological Footprint Initiative. The standard prevents low-efficiency
indoor bulbs from entering the UAE market. As a result of this in terms of energy
consumption, it is expected to cut the UAE energy consumption on an annual basis by up to
500 MW (UAE Lighting Standard, 2017).
Qatar: The Ministry of Environment launched the fourth edition of the Qatar Construction
Specifications, QCS 2010, specifying a series of measures to pave way for green buildings
and gardens in the country and to ensure the safety of construction workers. The Gulf
Organization for Research and Development (GORD), the authority for knowledge on
sustainability in the MENA region, launched the Global Sustainability Assessment System
(GSAS) as the standard for excellence on sustainability in the MENA region as per the 7th of
June 2012 (Qatar Construction Standard, 2017). The GSAS looks into various typologies of
buildings, such as the Schools Residential Single and Residential Group. The GSAS/QSAS
is incorporated within the Qatar Construction Specifications (QCS 2010) in order to provide
a clear vision for sustainable building development in the country. The current available
version of the standard is referred to as the New Qatar Construction Standards and Practices.
Bahrain: In Bahrain, the energy regulations were started in the 1990s by the National
Committee of Buildings in Bahrain (NCBB). In 1997, the government requested the NCBB
to provide advice on the conservation of energy in buildings. The committee recommendation
was to improve the thermal insulation as the most suitable and practical energy conservation
strategy with respect to the current situation of Bahrain (NCBB, 2002). Then, the Bahrain
national building codes introduced in 1998 aimed to reduce the electricity consumption within
buildings. Additionally, other international codes on building systems and equipment are
considered for implementation with respect to energy conservation by the local authority, but
there is a serious lack of knowledge and experience that prevent the codes from achieving
these objectives. Therefore, in reality there are no existing mandatory or compulsory codes
for practice (Radhi, 2008).
Saudi Arabia: The introduction of the Saudi Building Code SBC was effected in June 2000
by a Royal Decree in order to establish the Saudi Building Code National Committee
(SBCNC). The SBC was established based on several international building codes from
developed and developing countries. The first version of the code approved by the Council
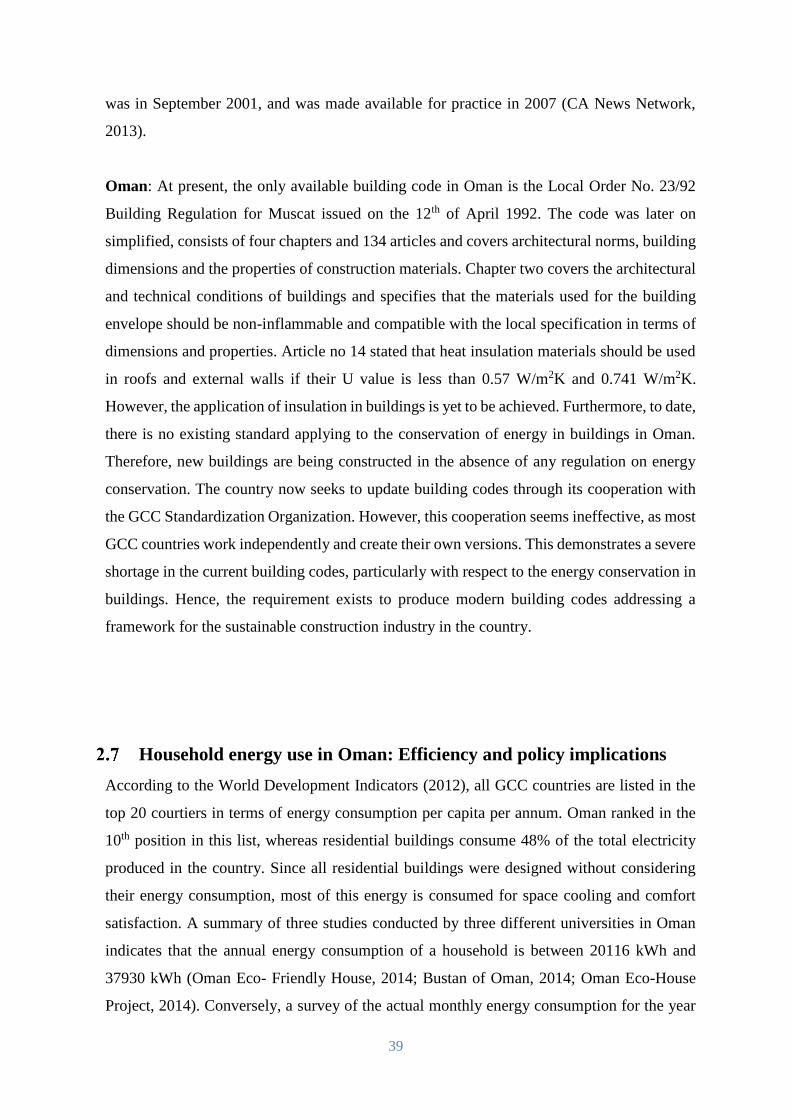
39
was in September 2001, and was made available for practice in 2007 (CA News Network,
2013).
Oman: At present, the only available building code in Oman is the Local Order No. 23/92
Building Regulation for Muscat issued on the 12th of April 1992. The code was later on
simplified, consists of four chapters and 134 articles and covers architectural norms, building
dimensions and the properties of construction materials. Chapter two covers the architectural
and technical conditions of buildings and specifies that the materials used for the building
envelope should be non-inflammable and compatible with the local specification in terms of
dimensions and properties. Article no 14 stated that heat insulation materials should be used
in roofs and external walls if their U value is less than 0.57 W/m2K and 0.741 W/m2K.
However, the application of insulation in buildings is yet to be achieved. Furthermore, to date,
there is no existing standard applying to the conservation of energy in buildings in Oman.
Therefore, new buildings are being constructed in the absence of any regulation on energy
conservation. The country now seeks to update building codes through its cooperation with
the GCC Standardization Organization. However, this cooperation seems ineffective, as most
GCC countries work independently and create their own versions. This demonstrates a severe
shortage in the current building codes, particularly with respect to the energy conservation in
buildings. Hence, the requirement exists to produce modern building codes addressing a
framework for the sustainable construction industry in the country.
Household energy use in Oman: Efficiency and policy implications
According to the World Development Indicators (2012), all GCC countries are listed in the
top 20 courtiers in terms of energy consumption per capita per annum. Oman ranked in the
10th position in this list, whereas residential buildings consume 48% of the total electricity
produced in the country. Since all residential buildings were designed without considering
their energy consumption, most of this energy is consumed for space cooling and comfort
satisfaction. A summary of three studies conducted by three different universities in Oman
indicates that the annual energy consumption of a household is between 20116 kWh and
37930 kWh (Oman Eco- Friendly House, 2014; Bustan of Oman, 2014; Oman Eco-House
Project, 2014). Conversely, a survey of the actual monthly energy consumption for the year
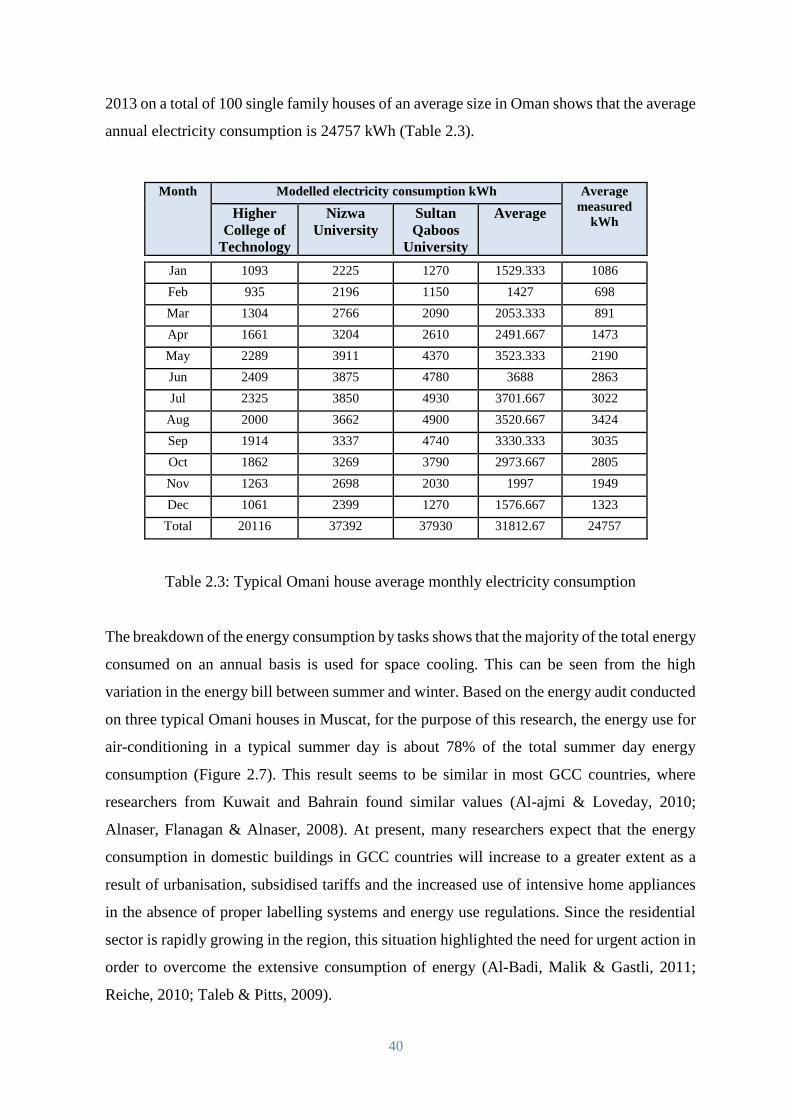
40
2013 on a total of 100 single family houses of an average size in Oman shows that the average
annual electricity consumption is 24757 kWh (Table 2.3).
Month Modelled electricity consumption kWh Average
measured
kWh Higher
College of
Technology
Nizwa
University
Sultan
Qaboos
University
Average
Jan 1093 2225 1270 1529.333 1086
Feb 935 2196 1150 1427 698
Mar 1304 2766 2090 2053.333 891
Apr 1661 3204 2610 2491.667 1473
May 2289 3911 4370 3523.333 2190
Jun 2409 3875 4780 3688 2863
Jul 2325 3850 4930 3701.667 3022
Aug 2000 3662 4900 3520.667 3424
Sep 1914 3337 4740 3330.333 3035
Oct 1862 3269 3790 2973.667 2805
Nov 1263 2698 2030 1997 1949
Dec 1061 2399 1270 1576.667 1323
Total 20116 37392 37930 31812.67 24757
Table 2.3: Typical Omani house average monthly electricity consumption
The breakdown of the energy consumption by tasks shows that the majority of the total energy
consumed on an annual basis is used for space cooling. This can be seen from the high
variation in the energy bill between summer and winter. Based on the energy audit conducted
on three typical Omani houses in Muscat, for the purpose of this research, the energy use for
air-conditioning in a typical summer day is about 78% of the total summer day energy
consumption (Figure 2.7). This result seems to be similar in most GCC countries, where
researchers from Kuwait and Bahrain found similar values (Al-ajmi & Loveday, 2010;
Alnaser, Flanagan & Alnaser, 2008). At present, many researchers expect that the energy
consumption in domestic buildings in GCC countries will increase to a greater extent as a
result of urbanisation, subsidised tariffs and the increased use of intensive home appliances
in the absence of proper labelling systems and energy use regulations. Since the residential
sector is rapidly growing in the region, this situation highlighted the need for urgent action in
order to overcome the extensive consumption of energy (Al-Badi, Malik & Gastli, 2011;
Reiche, 2010; Taleb & Pitts, 2009).
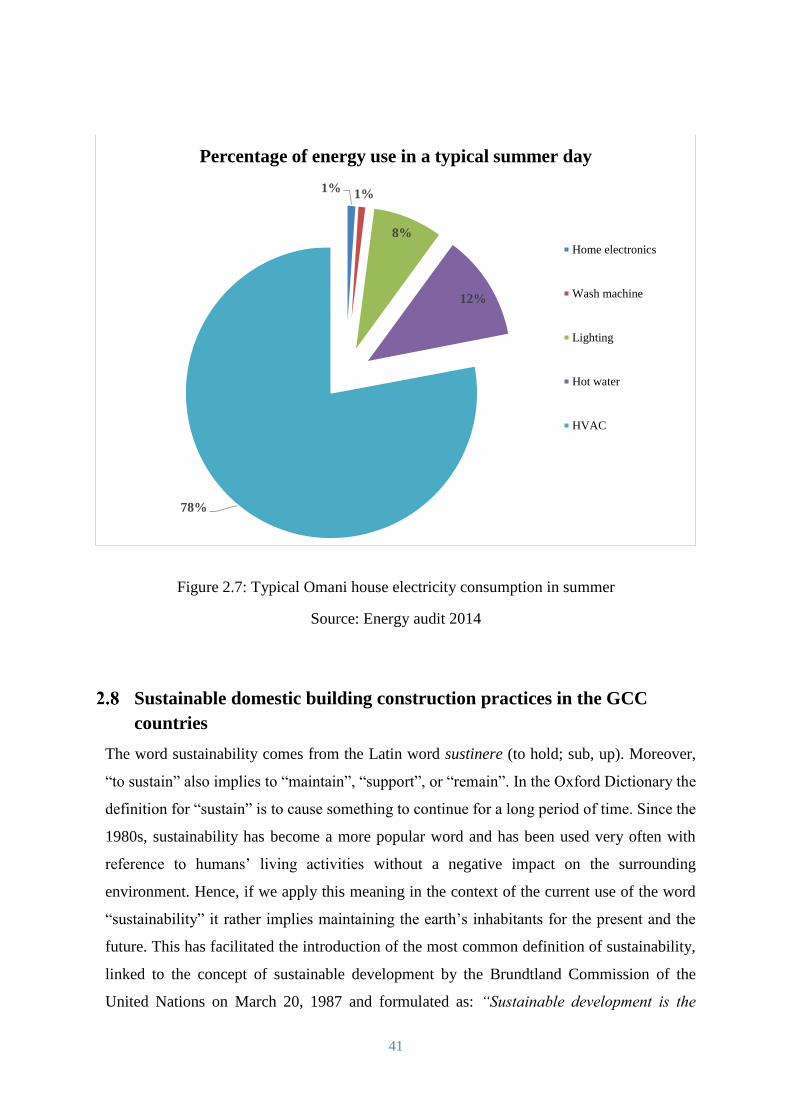
41
Figure 2.7: Typical Omani house electricity consumption in summer
Source: Energy audit 2014
Sustainable domestic building construction practices in the GCC
countries
The word sustainability comes from the Latin word sustinere (to hold; sub, up). Moreover,
“to sustain” also implies to “maintain”, “support”, or “remain”. In the Oxford Dictionary the
definition for “sustain” is to cause something to continue for a long period of time. Since the
1980s, sustainability has become a more popular word and has been used very often with
reference to humans’ living activities without a negative impact on the surrounding
environment. Hence, if we apply this meaning in the context of the current use of the word
“sustainability” it rather implies maintaining the earth’s inhabitants for the present and the
future. This has facilitated the introduction of the most common definition of sustainability,
linked to the concept of sustainable development by the Brundtland Commission of the
United Nations on March 20, 1987 and formulated as: “Sustainable development is the
1%1%
8%
12%
78%
Percentage of energy use in a typical summer day
Home electronics
Wash machine
Lighting
Hot water
HVAC
42
development that meets the needs of the present without compromising the ability of future
generations to meet their own needs”. According to Chiu (2012), the definition of the
sustainability of housing is: “The extent to which the environmental impact of housing
activities is reduced, thereby conforming to levels which are within the capacity of the natural
environment to carry, such that the environmental quality of the surroundings is improved to
enable healthy living.” (Chiu, 2012)
In this regard, people’s daily living requirements include buildings by utilising available
natural sources in a way that will not affect the requirements of future generations with respect
to these resources. Traditional building construction is a result of the constraints imposed on
the availability of existing resources, whether conditions or financial capacity. Historically,
building construction in any region of the world relied on local materials to control the
internal environment of the building to a comfortable environment in a sustainable manner.
This has happened in the preindustrial period without modern means or often extraordinary
energy sources (Thomas, 2002). A notable change in the course of civilisation was triggered
by the Industrial Revolution, which first started in the UK in the 17th century. One of its
distinguished features was a shift in the sources of energy from wood to fossil fuels, which
subsequently altered human activities in many ways and also exerted an impact on the
construction industry. After the industrial revolution, and with the development of modern
cement in the 18th century, the construction of buildings became an unsustainable industry,
as it consumed large amounts of energy and resulted in increased CO2 emissions. In the 20th
century, construction materials used include more energy intense products such as aluminium,
glass and industrialised fabric. This has raised the need for an increased awareness in the
sustainable construction industry.
The traditional building construction in the gulf countries was a result product of the
interaction between the environmental factors (site, geography, topography, and climate) and
the social and cultural constrains (religion, traditions, norms, and cultural background). In the
pre-oil era, people in the gulf area lived in buildings that modified temperatures and provided
natural ventilation with zero environmental impact. It is well known that the climate was a
major factor in the formation of the gulf’s traditional architecture, where several responses to
the climatic conditions could be found in traditional buildings such as court yard houses and
Arish (houses built from palm tree and leaves (Figure 2.8). Tents were the traditional home
for the Bedouins in the desert, and stone houses with openings close to the roofs were the
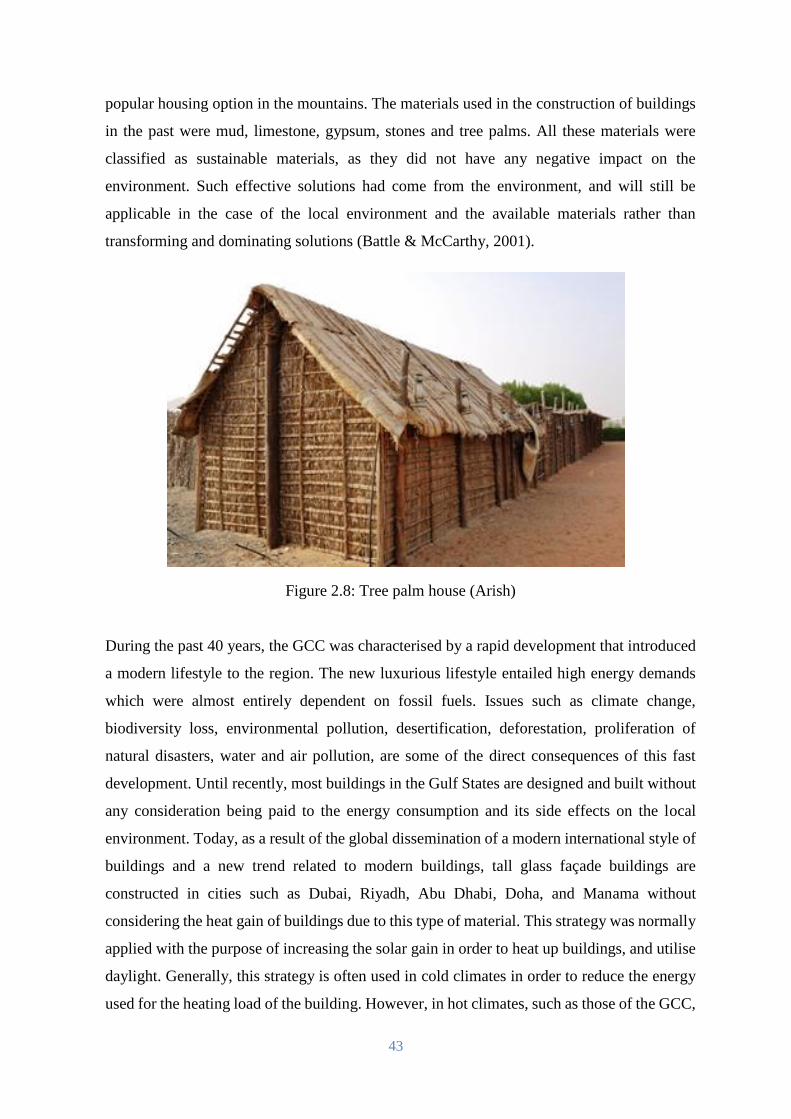
43
popular housing option in the mountains. The materials used in the construction of buildings
in the past were mud, limestone, gypsum, stones and tree palms. All these materials were
classified as sustainable materials, as they did not have any negative impact on the
environment. Such effective solutions had come from the environment, and will still be
applicable in the case of the local environment and the available materials rather than
transforming and dominating solutions (Battle & McCarthy, 2001).
Figure 2.8: Tree palm house (Arish)
During the past 40 years, the GCC was characterised by a rapid development that introduced
a modern lifestyle to the region. The new luxurious lifestyle entailed high energy demands
which were almost entirely dependent on fossil fuels. Issues such as climate change,
biodiversity loss, environmental pollution, desertification, deforestation, proliferation of
natural disasters, water and air pollution, are some of the direct consequences of this fast
development. Until recently, most buildings in the Gulf States are designed and built without
any consideration being paid to the energy consumption and its side effects on the local
environment. Today, as a result of the global dissemination of a modern international style of
buildings and a new trend related to modern buildings, tall glass façade buildings are
constructed in cities such as Dubai, Riyadh, Abu Dhabi, Doha, and Manama without
considering the heat gain of buildings due to this type of material. This strategy was normally
applied with the purpose of increasing the solar gain in order to heat up buildings, and utilise
daylight. Generally, this strategy is often used in cold climates in order to reduce the energy
used for the heating load of the building. However, in hot climates, such as those of the GCC,
44
using this strategy may lead to increased energy consumption with respect to the cooling load.
The high consumption of energy for cooling buildings in the Gulf region due to building
design and materials incentivises architects to pay more attention to the energy performance
of buildings, especially with respect to the right selection of construction materials to make
the construction industry sustainable again.
Vernacular construction practice: materials, methods & exemplars
The word “vernacular” has different meanings depending on the context of its use. This term
is used by architects, archaeologists, folklorists, historians and other specialists. It is derived
from the Latin word “vernaculus”, which means "native". In architecture, it is defined as the
science of building (Oliver, 2006). Hence, the general meaning of the term vernacular
architecture can be translated as the native science of building. From an architectural point of
view, vernacular architecture is the process of designing and building a dwelling by people
for people to meet the specific needs for comfort or utility and functionality in the building.
The use of local building materials and ideas inspired from the surrounding environment are
the key elements of vernacular architecture, which sustain it over an extended period of time.
Today, vernacular architecture refers to building new structures based on old techniques,
shapes or model while at the same time including traditional attributes. Moreover, the
vernacular architecture refers to the efficient use of resources within a climate responsive
design. The vernacular architecture is a result of several factors to provide acceptable living
spaces to the occupants through the selection of a suitable living pattern, building designs and
materials. In Oman and the GCC countries, the important factors affecting the construction
practice are the weather conditions and the social factors including religions and norms where
all the native population comes from an Arab Muslim background. Before the oil era, the
economic and social factors of all GCC countries were the same, therefore, building types
differed based on the topography and climate conditions of the region. These considerations
and a limited possibility to import construction materials from overseas directed the
construction practice to a specific technique and methodology to provide a comfortable
thermal performance of buildings in the absence of energy sources. These considerations are
deemed as the main drivers of vernacular architecture in terms of providing living spaces that
are thermally acceptable.
45
Oman’s topography, the location and the area of the country create a variation in the climatic
categories, which have influenced the prototypes of the Omani vernacular architecture. Most
of Oman’s populations are concentrated in cities located in the coastal regions, where the
climate is mostly moderate in winter and hot humid in summer. In addition, there are number
of population settlements located in the mainland region that have the same winters but hot
dry summers, whereas very a limited portion of the population live in the mountains where
the climate is relatively cooler in winter and moderate in summer. Based on this, and for the
purpose of this study, the vernacular architecture of Oman can be classified into two main
categories: the costal type of buildings, and the desert and interior type of buildings. The main
features of these building typologies are:
1. In the coastal regions, buildings were built from materials that could moderate the
amount of transmitted moisture and the building design exploited sea breezes to
improve internal thermal comfort. Such houses can be found in the coastal cities of
Oman, for example in Sohar, Muscat and Sur, where the land/sea breeze is a local
climatic phenomenon. Since the natural air movement is an important mechanism to
achieving thermal comfort in this climatic condition, houses were designed to utilise
this breeze and direct it into the inhabited spaces of the buildings (Al-Hinai et al.,
1993).
2. The desert and interior type of buildings were influenced significantly by the
topography of the impressive mountain range and the arid desert located at a distance
from the sea. With this type of climate and topography, the diurnal and annual local
ambient temperature fluctuations generally exceed those experienced on the coastal.
Therefore, in these regions buildings’ walls were constructed from mud and stones
with a thickness of more than 500mm. This type of building can be seen in mainland
Oman in cities such as Nizwa, Ibri and Buraimi (Al-Hinai et al., 1993).
Nowadays the vernacular architecture of Oman disappeared due to several reasons. As a direct
result of ignoring traditional construction patterns, current residential buildings tend not to
consider the energy consumption involved. According to Al-Hinai et al. (1993), this has
happened due to a misunderstanding of Oman’s vernacular architecture by the foreign
architects and labourers who participated in the early stage of the country developments. In
addition, Al- Hinai argued that modern concrete buildings tend to be more hygienic, easy to
clean and require less maintenance, which make better options for clients. Furthermore, one
of the major reasons behind the disappearance of the local vernacular architecture in Oman is
the lack of building regulations that adopt the use of local architecture in the current
46
construction industry. Despite the fact that the building regulations stated that the construction
of buildings in Muscat should follow the local Arab Islamic design, in reality, a traditional
building methodology is adopted in the appearance of the building without considering the
energy performance of new buildings compared to vernacular constructions. Hence, the need
exists to review building regulation and practice in order to benefit from what has been
achieved by the past construction industry. Nevertheless, the vernacular architecture of Oman
may not be able to provide a level of thermal comfort as well as modern technology does, but
some of its techniques can be integrated into the modern construction industry to reduce
energy use in buildings through benefits from the past experience applied to future
constructions.
GCC current construction practice
Nowadays the construction industry in the Gulf countries is one of the largest expanding
sectors with an annual worth of more than $5 billion involving more than 2.7 million
companies of various sizes (Construct Arabia, 2012). The construction industry is growing
rapidly, and these countries are facing a continuous demand for housing, especially in major
cities. This is due to the rapid increases in population and the expanding oil industry sector
that attracts many people to migrate to these cities (Al-Mulla, 2013). The continued demand
for housing units has resulted in a shift to new methods of construction in the industry in order
to sustain its ability to construct the required buildings. Therefore, building designs, materials
and methods of construction are influenced by the construction practices of modern industrial
countries. In some cases, low rise buildings have been replaced by high rise buildings in order
to overcome the rapid increase in the required housing units. According to the data collected
from the Skyscraper Centre, 23 of the top 100 tallest completed towers in the world are located
in GCC countries (at the time of writing this thesis) (100 Tallest Completed Buildings in the
World - The Skyscraper Centre, 2017). Consequently, the construction of new dwellings has
increased at a high rate and this rate may remain the same for the next few years since the
rate of the population growth is increasing. According to the census data in Oman, residential
building construction permits increased from 18,230 to 33,264 between 2010 and 2012,
accounting for an increase of 55% over the course of two years.
47
2.10.1 Modern construction
Modern construction in the GCC countries practically began in the 1930s with the beginning
of the oil era. The modernisation process accelerated in the 1950s and 1960s, when the oil
industry attracted international companies to the region as a future source of energy and for
its potential opportunities of investment. These issues enhanced the widely adopted visions
of the GCC countries towards the future and their persistence to be in the same modern levels
with the industrialised countries (Al-Zubaidi, 2007). The general tendency of people in the
GCC is to seek larger floor spaces especially under a generally increasing income. Therefore,
with the increasing trends in floor space, the energy demand associated with buildings is also
increasing, which highlights the need for solutions to overcome this rapid increase in energy
consumption. Reducing the energy demand of buildings not only reduces the energy
consumption and subsequently the energy cost, but it also improves its value in the property
market. As it has been mentioned in the previous section of this chapter, the construction
practice in GCC countries was affected by the social environmental and economic constrains.
Nevertheless, the social and environmental constrains have not been changed before and after
the oil era, whereas the economic factor changed dramatically. The significant amount of
money gained from the oil industry provided a significant change which accelerated the
transition of the local construction industry towards a modern industry. Consequently, the
construction technique has developed to meet continued requirements, such as the load
bearing wall system being replaced by a steel/concrete column and beams system, known as
the frame structure. The growing rate of urbanisation has resulted in a higher demand for new
dwellings and land prices have increased significantly. This has resulted in the building
market applying cheap modern ways of construction to optimise land use and be able to
construct buildings faster and at reasonable costs. Currently, a typical residential building in
Oman is made of a reinforced concrete frame structure and concrete blocks walls. The outer
skin of the building is usually made from concrete and consists of a single layer of blocks
(100 - 200 mm wide) covered by a 10-25 mm layer of plaster. The roofs are normally flat
reinforced concrete slabs covered by waterproof tiles. The thermal performance of most of
these buildings is relatively poor, and characterised by the absence of thermal insulation. The
energy consumption for cooling purposes in these buildings is relatively high because of a
lack of consideration being given to the use of insulation in order to avoid heat gain.
48
2.10.2 Effects of the current GCC construction practice on the energy consumption
It has been recognised that all GCC countries experience high energy consumption in
residential buildings and these findings have been ranked in the top 20 list of CO2 emissions
per capita. Energy efficiency improvements in residential buildings and the implementation
of sustainability codes and regulations are the most effective methods used in order to reduce
energy consumption and its associated CO2 emissions. Rapid developments and the current
state of the modern construction industry neglected the local traditional architectural solutions
provided by the vernacular architecture in order to solve the current energy consumption
challenges that face the built environment in the region. Instead, modern technology solutions
have been implemented, which usually require energy in order to solve the problems, and as
a result, this created a cycle of unsustainable developments. This has created a separation
between past and present built environments and raises concerns for a sustainable future.
As a result of the unsustainable construction practice in the GCC countries and unregulated
energy use, the energy consumption and CO2 per capita increased. Now, the energy
consumption in the residential sector in GCC countries represents 48% to 52% of the total
energy consumption while this is estimated to be between 30% and 35% in the industrialised
countries. The energy consumption per capita increased in the past four decades and is
predicted to continue to increase under the same conditions. The electricity demand increases
every year by 8% compared to the international average of 2% (Ibid, 2014). This shows an
increasing gap in people’s life between past and present in terms of sustainability. According
to the report presented by the Economist Intelligence Unit (2012), the energy consumption
per capita in the GCC countries is considerably higher compared to the industrialised
countries. It is almost more than double its value in Germany and more than seven times the
value in China. Moreover, it is increasing and expected to increase in the future under the
same conditions (Figure 2.9).
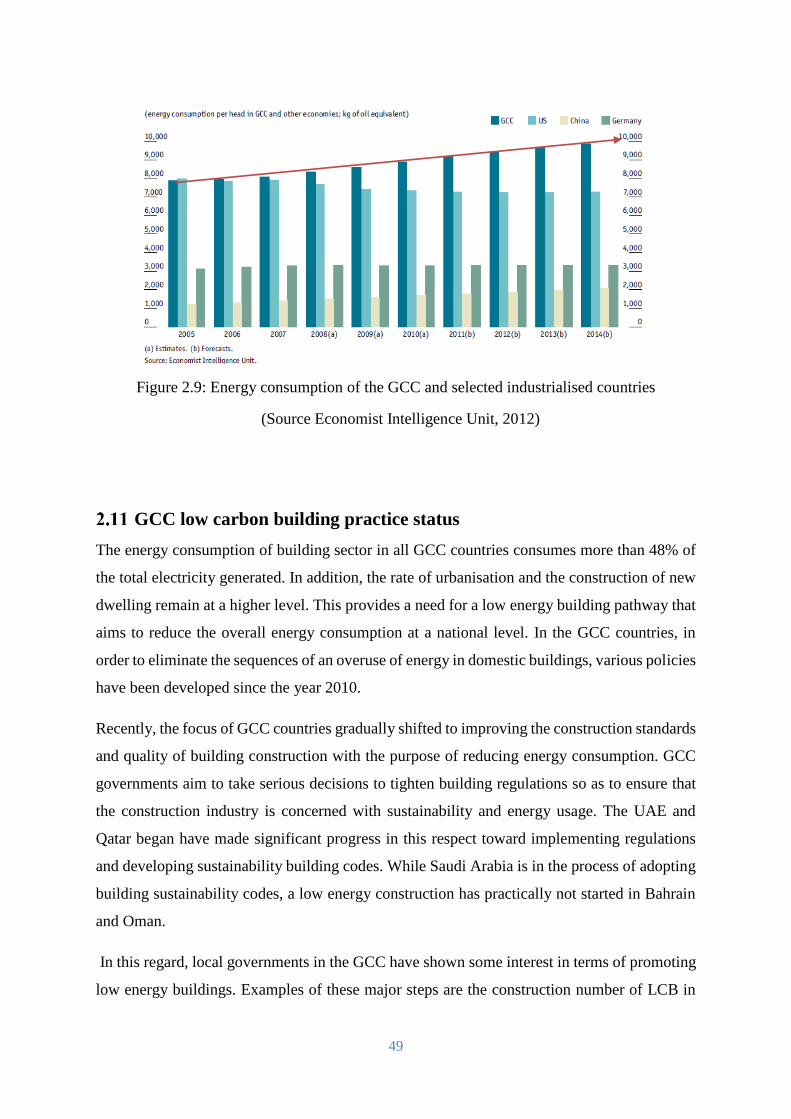
49
Figure 2.9: Energy consumption of the GCC and selected industrialised countries
(Source Economist Intelligence Unit, 2012)
GCC low carbon building practice status
The energy consumption of building sector in all GCC countries consumes more than 48% of
the total electricity generated. In addition, the rate of urbanisation and the construction of new
dwelling remain at a higher level. This provides a need for a low energy building pathway that
aims to reduce the overall energy consumption at a national level. In the GCC countries, in
order to eliminate the sequences of an overuse of energy in domestic buildings, various policies
have been developed since the year 2010.
Recently, the focus of GCC countries gradually shifted to improving the construction standards
and quality of building construction with the purpose of reducing energy consumption. GCC
governments aim to take serious decisions to tighten building regulations so as to ensure that
the construction industry is concerned with sustainability and energy usage. The UAE and
Qatar began have made significant progress in this respect toward implementing regulations
and developing sustainability building codes. While Saudi Arabia is in the process of adopting
building sustainability codes, a low energy construction has practically not started in Bahrain
and Oman.
In this regard, local governments in the GCC have shown some interest in terms of promoting
low energy buildings. Examples of these major steps are the construction number of LCB in
50
the UAE and Qatar, such as Masdar City as a project for a carbon-neutral and Energy City
Qatar (ECQ). However, energy efficiency regulations and energy saving practice in domestic
buildings are still lagging on an international level, which indicates that there is still a need for
updating existing regulations. Furthermore, in some GCC countries, knowledge about the
performance of regulations and policies is still required in order to encourage more energy
efficiency in buildings, whereas other GCC countries such as Oman have not yet started to
develop a policy for energy in the residential sector. In fact, there is a need for further ‘policy
development’ in order to gain experience about the regulation of energy efficiency in buildings
and their practice before the full establishment of such policies.
2.11.1 Examples of low carbon building construction strategies in GCC
A number of low carbon building projects have recently been established in most GCC
countries. GCC governments have greatly placed their support to start energy efficient
construction because of the existing opportunities in the region for energy saving and green
development. In 2014, a report by Ventures Middle East mentioned that "Green buildings
witnessed a slow take off in the GCC," but local governments acted positively in the past four
years to embrace sustainability through education and legislation. However, the construction
of LCB residential low carbon buildings remains inactive due to a limited awareness in the
local community. In this respect, the interest in effective low energy buildings remained limited
to government and semi-governmental buildings. Examples of the most energy efficient
buildings in the GCC countries include:
1- King Abdullah Financial District. Tadawul Tower 40-storey tower totalling to 140,000
m2 plus a three-storey car park. Designed to achieve a Leadership in Energy and
Environmental Design (LEED) rating Started 2010.
2- King Abdullah University of Science and Technology (KAUST), a new international
graduate-level research university with a 12 km2 desert campus located in Thuwal,
Saudi Arabia. Designed and built by developer Hellmuth Obata Kassabaum, Dubai
(HOK) in less than three years, completed in 2009. KAUST (up to date) is the world’s
largest LEED NC-Platinum project.
3- Dubai Smart Sustainable City is a 14,000-hectare residential development, shaped like
a desert flower, has 20,000 plots for the UAE national citizens. The roofs of the homes
and buildings are designed to be covered with solar panels, which will provide 200 MW
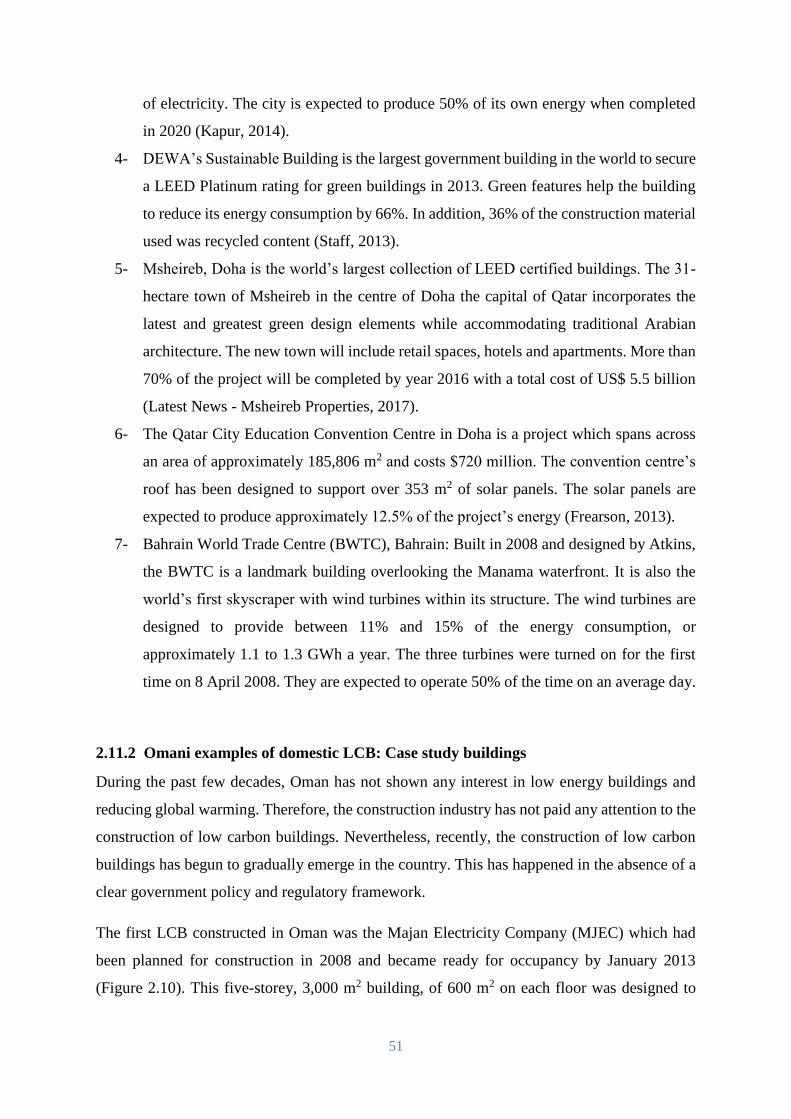
51
of electricity. The city is expected to produce 50% of its own energy when completed
in 2020 (Kapur, 2014).
4- DEWA’s Sustainable Building is the largest government building in the world to secure
a LEED Platinum rating for green buildings in 2013. Green features help the building
to reduce its energy consumption by 66%. In addition, 36% of the construction material
used was recycled content (Staff, 2013).
5- Msheireb, Doha is the world’s largest collection of LEED certified buildings. The 31-
hectare town of Msheireb in the centre of Doha the capital of Qatar incorporates the
latest and greatest green design elements while accommodating traditional Arabian
architecture. The new town will include retail spaces, hotels and apartments. More than
70% of the project will be completed by year 2016 with a total cost of US$ 5.5 billion
(Latest News - Msheireb Properties, 2017).
6- The Qatar City Education Convention Centre in Doha is a project which spans across
an area of approximately 185,806 m2 and costs $720 million. The convention centre’s
roof has been designed to support over 353 m2 of solar panels. The solar panels are
expected to produce approximately 12.5% of the project’s energy (Frearson, 2013).
7- Bahrain World Trade Centre (BWTC), Bahrain: Built in 2008 and designed by Atkins,
the BWTC is a landmark building overlooking the Manama waterfront. It is also the
world’s first skyscraper with wind turbines within its structure. The wind turbines are
designed to provide between 11% and 15% of the energy consumption, or
approximately 1.1 to 1.3 GWh a year. The three turbines were turned on for the first
time on 8 April 2008. They are expected to operate 50% of the time on an average day.
2.11.2 Omani examples of domestic LCB: Case study buildings
During the past few decades, Oman has not shown any interest in low energy buildings and
reducing global warming. Therefore, the construction industry has not paid any attention to the
construction of low carbon buildings. Nevertheless, recently, the construction of low carbon
buildings has begun to gradually emerge in the country. This has happened in the absence of a
clear government policy and regulatory framework.
The first LCB constructed in Oman was the Majan Electricity Company (MJEC) which had
been planned for construction in 2008 and became ready for occupancy by January 2013
(Figure 2.10). This five-storey, 3,000 m2 building, of 600 m2 on each floor was designed to
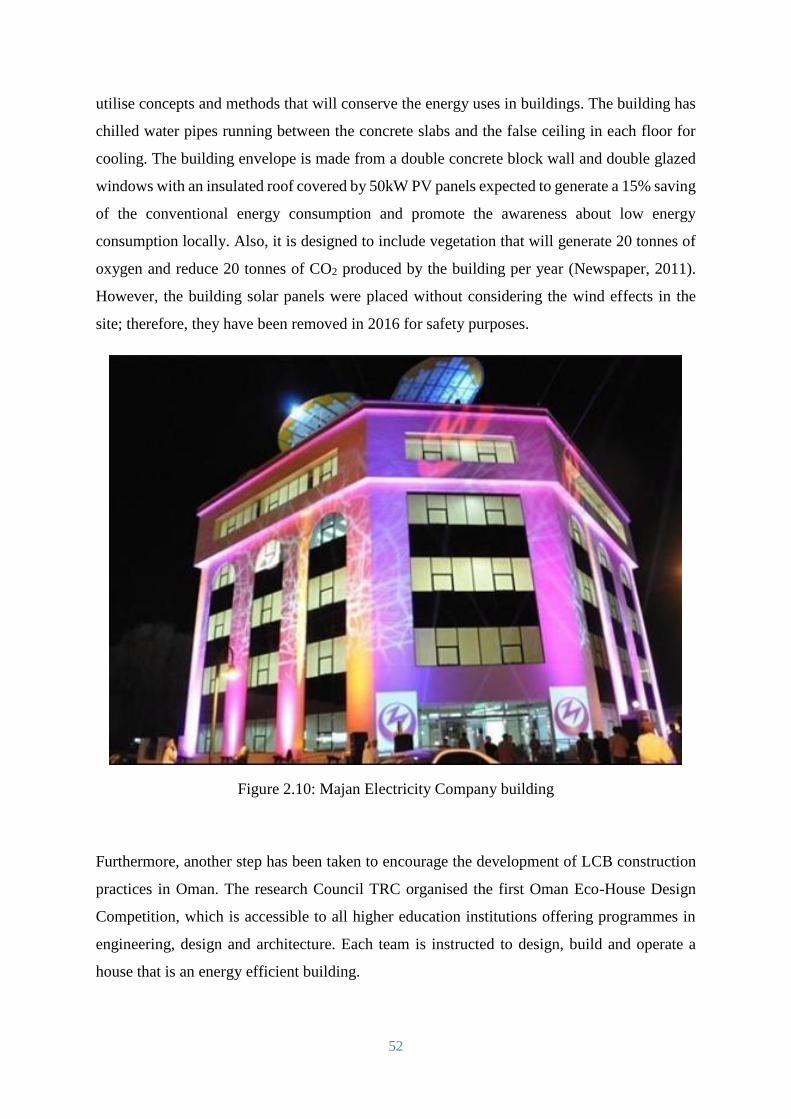
52
utilise concepts and methods that will conserve the energy uses in buildings. The building has
chilled water pipes running between the concrete slabs and the false ceiling in each floor for
cooling. The building envelope is made from a double concrete block wall and double glazed
windows with an insulated roof covered by 50kW PV panels expected to generate a 15% saving
of the conventional energy consumption and promote the awareness about low energy
consumption locally. Also, it is designed to include vegetation that will generate 20 tonnes of
oxygen and reduce 20 tonnes of CO2 produced by the building per year (Newspaper, 2011).
However, the building solar panels were placed without considering the wind effects in the
site; therefore, they have been removed in 2016 for safety purposes.
Figure 2.10: Majan Electricity Company building
Furthermore, another step has been taken to encourage the development of LCB construction
practices in Oman. The research Council TRC organised the first Oman Eco-House Design
Competition, which is accessible to all higher education institutions offering programmes in
engineering, design and architecture. Each team is instructed to design, build and operate a
house that is an energy efficient building.
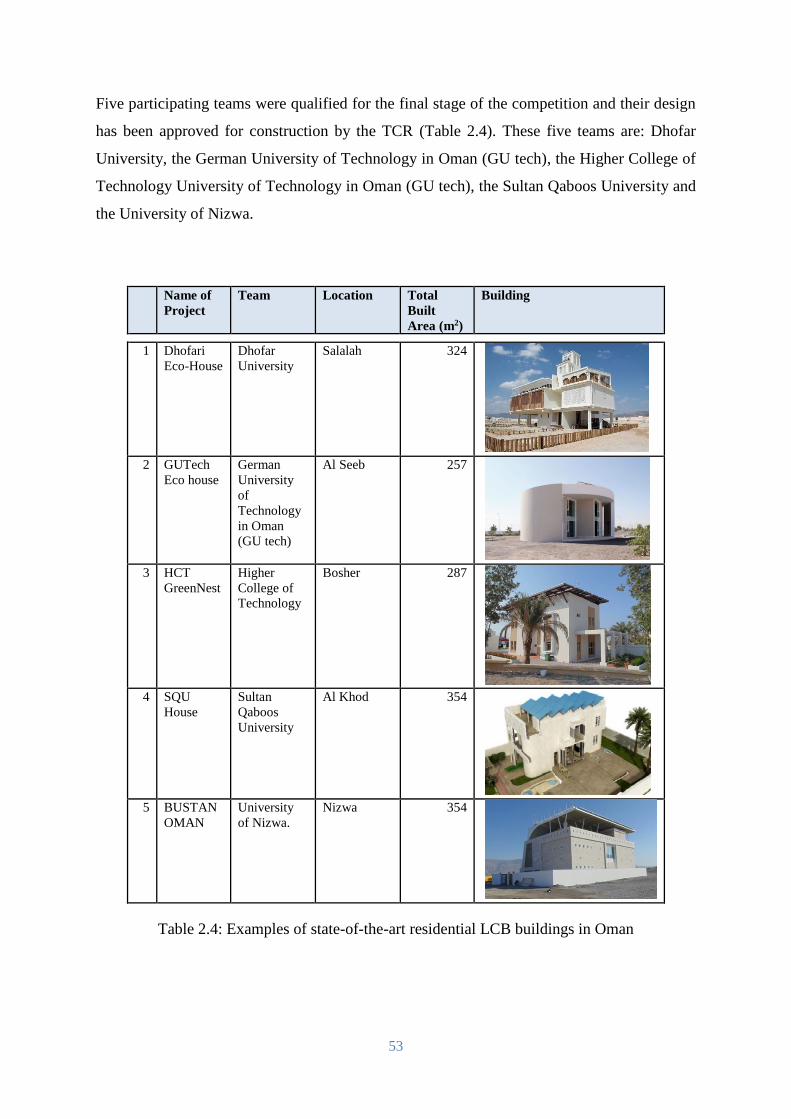
53
Five participating teams were qualified for the final stage of the competition and their design
has been approved for construction by the TCR (Table 2.4). These five teams are: Dhofar
University, the German University of Technology in Oman (GU tech), the Higher College of
Technology University of Technology in Oman (GU tech), the Sultan Qaboos University and
the University of Nizwa.
Name of
Project
Team Location Total
Built
Area (m2)
Building
1 Dhofari
Eco-House
Dhofar
University
Salalah 324
2 GUTech
Eco house
German
University
of
Technology
in Oman
(GU tech)
Al Seeb 257
3 HCT
GreenNest
Higher
College of
Technology
Bosher 287
4 SQU
House
Sultan
Qaboos
University
Al Khod 354
5 BUSTAN
OMAN
University
of Nizwa.
Nizwa 354
Table 2.4: Examples of state-of-the-art residential LCB buildings in Oman
54
The teams employed various strategies to increase the energy efficiency and reduce the energy
consumption of buildings. Among these techniques, traditional Omani mud bricks, solar
panels, natural ventilation and double glazing were used in the construction of these buildings.
Despite the steps being taken to start a low energy building culture, the number of available
projects is very limited and not evaluated to assess the real benefits of these projects.
Energy efficiency labelling of buildings
The World Energy Council stated that labelling and the minimum energy efficiency criteria are
among the top performing options for a fast improvement in energy consumption. Therefore,
it is considered as an effective tool in reducing energy consumption in residential buildings.
For more benefits from a labelling system, it requires to be set to a performance goal through
a mechanism that includes both the consumer and the domestic market to encourage both to
provide more energy efficient home appliances. The energy efficient labelling of buildings is
a technique to ensure the conservation of energy during the operation stage. Household
appliances labelling can have significant impacts on reducing the overall energy consumption
if they meet the requirements as per the design. However, if home appliances are not rated,
they may lead to a higher consumption of energy than planned in the design stage.
The labelling of residential buildings is a system used to provide information on the overall
energy performance of buildings (Figure 2.11). The objective of labelling is to raise awareness
and to provide occupants with the classification of the energy use of the building compared to
the general ranking system. A good example of building energy labelling is the system used in
the UK established as per the requirements of EU Directive 2002.
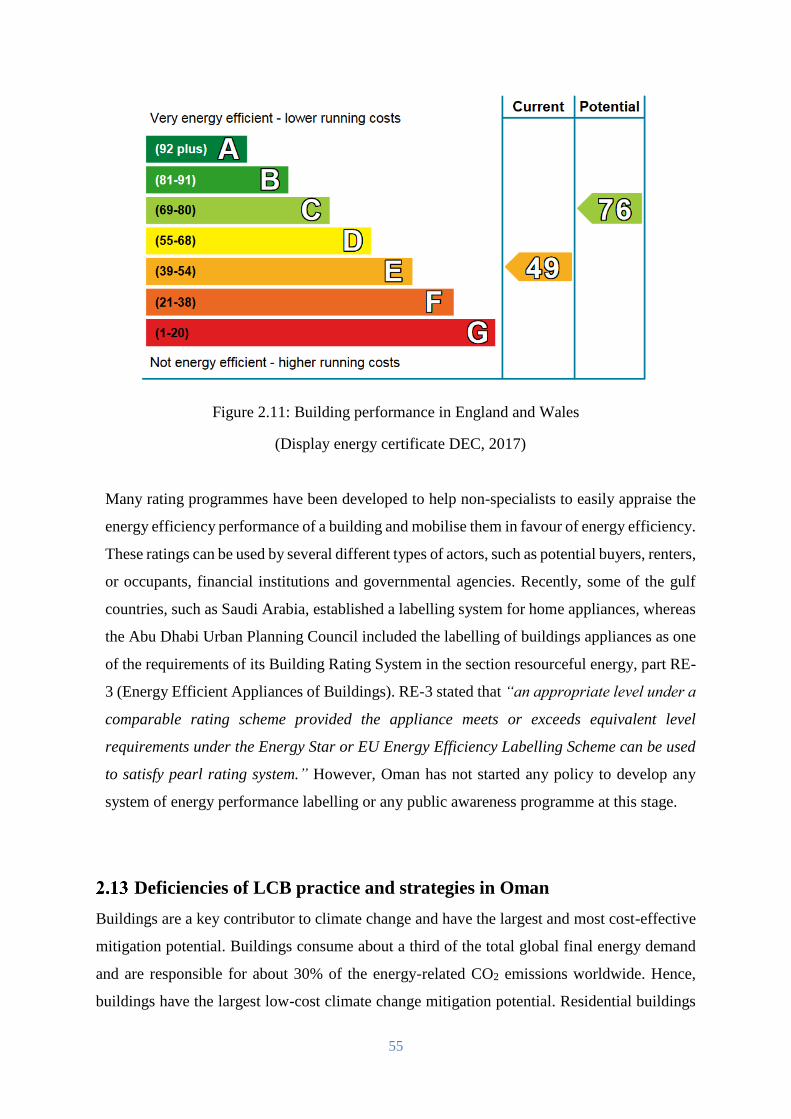
55
Figure 2.11: Building performance in England and Wales
(Display energy certificate DEC, 2017)
Many rating programmes have been developed to help non-specialists to easily appraise the
energy efficiency performance of a building and mobilise them in favour of energy efficiency.
These ratings can be used by several different types of actors, such as potential buyers, renters,
or occupants, financial institutions and governmental agencies. Recently, some of the gulf
countries, such as Saudi Arabia, established a labelling system for home appliances, whereas
the Abu Dhabi Urban Planning Council included the labelling of buildings appliances as one
of the requirements of its Building Rating System in the section resourceful energy, part RE-
3 (Energy Efficient Appliances of Buildings). RE-3 stated that “an appropriate level under a
comparable rating scheme provided the appliance meets or exceeds equivalent level
requirements under the Energy Star or EU Energy Efficiency Labelling Scheme can be used
to satisfy pearl rating system.” However, Oman has not started any policy to develop any
system of energy performance labelling or any public awareness programme at this stage.
Deficiencies of LCB practice and strategies in Oman
Buildings are a key contributor to climate change and have the largest and most cost-effective
mitigation potential. Buildings consume about a third of the total global final energy demand
and are responsible for about 30% of the energy-related CO2 emissions worldwide. Hence,
buildings have the largest low-cost climate change mitigation potential. Residential buildings
56
in Oman consume 48% of the total energy demand on a national level and thus the residential
sector is one of the main sectors responsible for country’s high CO2 emission ranking. Despite
this tremendous opportunity to significantly decrease the consumption of energy and emissions
in buildings, there are limited studies that rigorously quantify the potential of reducing the
adverse effects. More than 50% of the residential buildings in Oman were built after 2004,
whereas the current construction practice in the country shows an inexistent to a more limited
implementation of practical LCB in the construction industry. According to the Oman Chamber
of Commerce and Industry, there are more than 700 companies registered in grade one and
excellent in the construction sector (Said Meselhy & ElSaeed, 2016). These companies pertain
to the concrete based construction practice. In 2008, the first Rapidwall building was
constructed by one of these companies as a new promising construction method that could
reduce the building's energy consumption. Rapidwall consists of fibre reinforced gypsum
panels made in a factory and transported for erection in the site. This construction method was
first initiated in Australia in the 1990s, and it was then used in China and India (Rapidwall,
2009). However, in Oman, its use is mainly limited to government projects. This demonstrates
a lack of strategies to increase the adoption of low carbon buildings in the country.
Barriers facing the building energy regulation application in the GCC
The application of energy regulations will be one of the biggest threats to the GCC’s
sustainability development because of the nature of the local society and the dependency of the
energy sector on subsidised fossil fuel. The application of the energy regulation will be a real
measure for successful energy efficiency policies. The objective of the energy efficiency
regulations in buildings can only be achieved by the efforts of all parties including the
construction industry, public, governmental authorities with a continuous R&D on the energy
performance of buildings, which is suitable for the gulf region climate. Hence, the barriers
associated with different parties’ expectation will tend to prevent the application of energy
regulations. Therefore, a study specifying the relationships between all parties with reference
to these barriers to energy regulations will be conducted in this research.
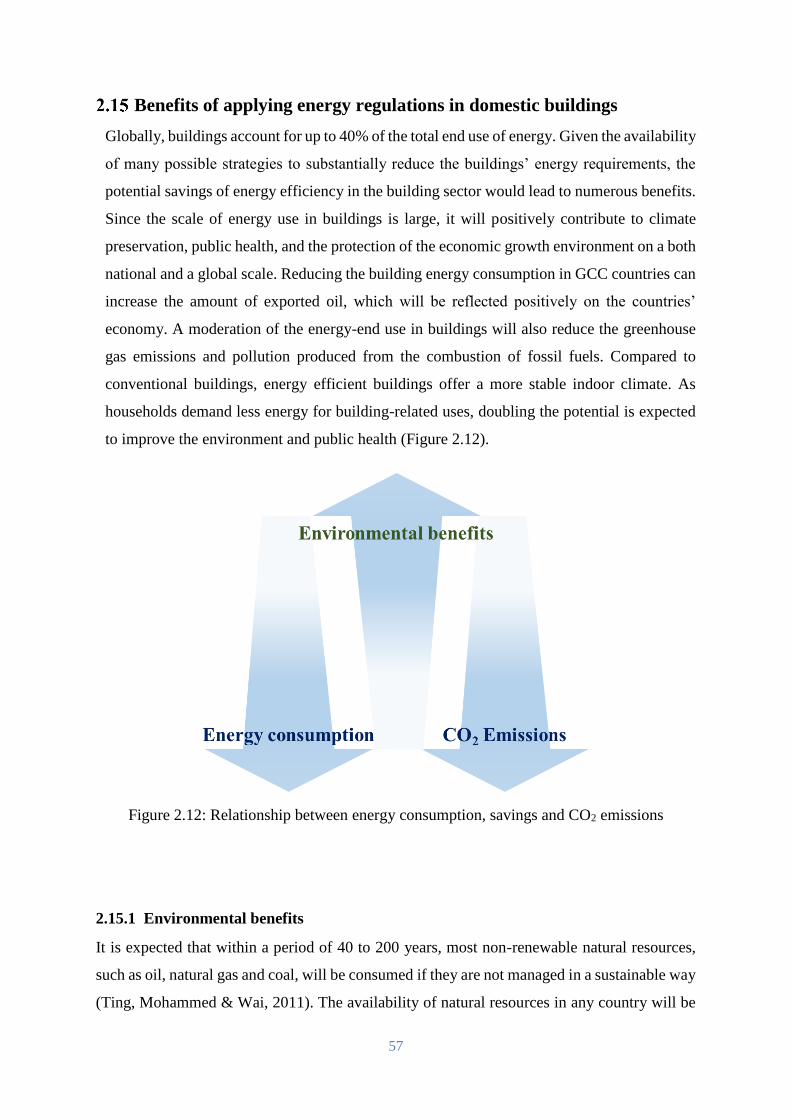
57
Benefits of applying energy regulations in domestic buildings
Globally, buildings account for up to 40% of the total end use of energy. Given the availability
of many possible strategies to substantially reduce the buildings’ energy requirements, the
potential savings of energy efficiency in the building sector would lead to numerous benefits.
Since the scale of energy use in buildings is large, it will positively contribute to climate
preservation, public health, and the protection of the economic growth environment on a both
national and a global scale. Reducing the building energy consumption in GCC countries can
increase the amount of exported oil, which will be reflected positively on the countries’
economy. A moderation of the energy-end use in buildings will also reduce the greenhouse
gas emissions and pollution produced from the combustion of fossil fuels. Compared to
conventional buildings, energy efficient buildings offer a more stable indoor climate. As
households demand less energy for building-related uses, doubling the potential is expected
to improve the environment and public health (Figure 2.12).
Figure 2.12: Relationship between energy consumption, savings and CO2 emissions
2.15.1 Environmental benefits
It is expected that within a period of 40 to 200 years, most non-renewable natural resources,
such as oil, natural gas and coal, will be consumed if they are not managed in a sustainable way
(Ting, Mohammed & Wai, 2011). The availability of natural resources in any country will be
58
reflected in economic prosperity and a better lifestyle. Oil, for example, has facilitated the
transition of Oman from rural scattered areas to a modern urbanised country. However, based
on the current production of oil and available reservoir in Oman, the production will last for
only 20 years. The conservation and management of natural resources for the sake of future
generations is the main concept that is common among all the definitions available for
sustainability. Hence, the preservation of natural resources can be achieved through the
application and adaptation of a sustainable construction industry. Developing countries have
the advantage of applying the concepts and applications of sustainability while projects are still
undergoing development. Oman is an example of a developing country which will benefit from
the country’s natural resources in the future if it endeavours to apply sustainability in the built
environment at this stage. The benefits earned will include air quality deterioration in urban
areas, high energy demand and consumption due to regional population growth and economic
development, concerns about safe drinking water supplies due to a scarcity of fresh water,
industrial pollution, waste management, pollution in coastal areas; and subsequent stress on the
marine ecosystems.
2.15.2 Impacts of energy conservation on building design
The architectural design of a building is the concept in which it will operate and function, and
thus the better the design considering the functionality of the building, the better the outcome.
Considering the energy consumption of buildings in the design during the early stages along
with the multi-disciplinary aspects thereof, constitutes the work process of the architect. The
architectural design process and more specifically the early design stages, embrace major
opportunities in achieving low carbon buildings. During the early design stage, the important
parameters affecting the building performance are addressed. Hence, a modelling aid will be
required to achieve optimal efficiency in the design. Tasks, such as form finding should include
environmental performance and energy efficiency aspects, such as space layout, aesthetics and
natural ventilation. Hence, the sizes of spaces, layout, orientation and opening sizes will be
considered to achieve more energy efficient buildings. In addition, with respect to the low
carbon design, the design should consider construction materials to enhance the performance
of the building. The adoption of properly available sustainable materials will be counted in the
overall energy budget of the building. The application of these energy measures was made
possible by looking at state-of-the-art LCB in Oman compared to conventional buildings.
59
2.15.3 Impacts of energy conservation on building materials
A building consisting of a building envelope includes external walls and roof and partition
walls separating the internal spaces. The building envelope in the gulf forms an effective barrier
against the extremes of the external climate. It provides filtering that modifies the climate
sufficiently for the internal conditions to be more acceptable. It acts as a passive modifier to
the external climate, depending on the characteristics of each material and their arrangement
determines the way the external climate influences the internal conditions (Collier, 1995).
Therefore, building materials need to be selected carefully to provide comfort conditions in the
building interior and help in reducing the energy consumption in the building. Thus, the use of
insulations, low heat transfer material and glazing are highly required in a hot climate.
2.15.4 Feasibility of domestic low carbon buildings in the GCC
The application of LCB measures in housing will reduce the overall costs of the lifecycle of
the building. Low-carbon buildings can achieve up to a 70% reduction of the operation energy,
which will positively contribute to the reduction of the overall cost of the building. Moreover,
energy efficient housing achieves environmental benefits that will add further values to its
overall costs. However, the critical question is the affordable housing that can achieve these
benefits based on the current energy and construction market will be. Affordable housing units,
according to Smith (2012), are ‘dwellings built specifically for those whose income denies them
the ability to purchase or rent on the open market’. Another important question is up to what
extent the construction market can apply sustainability features based on its current
technological ability.
Chapter summary
As this chapter shows, the building sector can contribute significantly to mitigating climate
change, while delivering many other societal benefits. For the building sector to act positively
in reducing the energy consumption of a country, the energy efficiency code for a building is
required in order to ensure that said building uses less energy while achieving the required
function. However, the good policy requires good knowledge about the status of building
performance.
60
While the MENA and GCC countries have a different LCB status, there is a gap in knowledge
and insufficient literature to cover the adoption of low carbon buildings in Oman. This
demonstrated that this area requires further investigation to evaluate the current options of low
carbon buildings in terms of the building energy performance and comfort to provide guidelines
for future sustainable buildings. Additionally, more research is required in order to assess the
society and industry support for a paradigm shift towards low carbon buildings, and establish
a preference benchmark for the energy use of a building based on the building area and the
number of occupants that can be referred to when evaluating the energy consumption.
2.16.1 Identified gaps in knowledge
It is clear that there are some specific issues and challenges facing the development and
implementation of sustainable housing in Oman. This is more particular to the current time as
the traditional vernacular style of architecture proved to be sustainable in the past in multiple
ways, at a time before the term sustainability was included in our vocabulary and building
designs. Today, housing in the Sultanate of Oman has transitioned from a traditional local
society to new and advanced housing units, prompted by the use of modern architectural
construction methods and design styles similar to those in many developed societies. In
addition, Oman is naturally afflicted by a harsh arid climate and a high consumption of non-
renewable natural resources. The building construction sector is the main energy consumer in
the country as it consumes more than 48% of the total delivered electricity. This has happened
as a result of absent strategies and codes for low carbon buildings. Currently, the construction
industry in Oman is lagging in the application of low carbon building due to the following
reasons:
I. Oman like most of the MENA including all GCC countries have the same pattern of
energy consumptions characterised by reduced energy standards and increased energy
uses.
II. Oman ranked in the 10th position in the world and in the 5th position in MENA in terms
of the CO2 emissions per capita as a result of the increasing use of fossil fuels.
III. GCC countries’ knowledge about the performance of the regulations and policies is still
required in order to encourage higher energy efficiency in buildings, whereas Oman
has not yet started to develop an energy policy in the residential sector.
61
IV. Electricity prices in all GCC countries are very low compared to the existing
international prices, constituting one of the major problems behind a reduced adoption
of low carbon strategies in these countries.
V. The vernacular architecture is ignored in the current construction industry, which
obstructed past benefits for future constructions.
VI. A lack of national drivers for adopting low energy solutions in the GCC still exists,
especially in residential buildings, despite current achievements.
VII. Fewer low-carbon residential buildings are constructed compared to the size of the
construction industry.
VIII. Available LCB options in Oman need to be investigated because:
i. There is insufficient literature that discusses the thermal comfort need and the
associated energy performances in Oman.
ii. To implement energy measures in the construction of new dwellings which
increased at a high rate and this rate may remain the same for the next few years
since the rate of population growth is increasing.
IX. More research is needed to assess social needs and industry support to the available
options of low carbon buildings and their acceptance boundaries.
X. The need for benchmarks and guidelines for energy consumption in buildings.
62
Chapter III: Research methodology
Introduction
The objective of this research is to explore different passive design strategies appropriate to the
construction of residential buildings in Oman’s hot and humid climate. It sets-out a basis for a
framework-guideline describing a low-energy building strategy for this climate. Further, the
research provides robust quantifiable data on the strategies for constructing low-energy
domestic buildings, which have been adopted in Oman. This chapter examines the generic
research concepts and methodologies commonly described in the literature related to built-
environment research and the application of this research. A systematic approach is adopted at
various stages of this study in order to facilitate the achievement of its aim and objectives. In
addition, this chapter addresses the various concepts, which make up the ‘world view’ of this
research then discusses and differentiates between the qualitative and quantitative research
methods used. The chapter also explains why a mixed methodology was adopted in this
research and the actual techniques used in conducting this study. Finally, it describes how data
were collected, analysed and examined in order to support the hypothesis of the research.
Research philosophy and methods
A common definition used for research study might be as follows: a detailed enquiry or
exploration of solutions using approaches aimed at making discoveries that will contribute to
the associated body of knowledge (Fellow and Liu, 2008). In addition, research can be
described as a structured methodical inquiry that leads to an acceptable scientific solution to a
problem or creates new knowledge in the field of the research (Kumar, 2011). Research can be
a ‘voyage of discovery’, whether anything is discovered or not. On the other hand, it is highly
likely that some discovery will result because discoveries can be concerned with the process of
investigation as well as the topic of investigation. Even if no new knowledge becomes apparent,
the investigation may lend further support to existing theory (Dresch, Pacheco Lacerda and
Cauchick Miguel, 2015).
There are various methodologies that lead to acceptable results that can be used in any area of
research. Nevertheless, for good research results, the chosen methodology needs to be rigorous,
systematic, integrated and focused (Peters and Howard, 2001). Further, the methodology is
63
required to fulfil the aim of the research, whether it is pure research or applied research (Holt,
1998). There are several views on research philosophies, which exist within the research
community relating to the use of suitable paradigms (Fellows and Liu, 2008). Yin (2009)
argued that the choice of an appropriate research method should be influenced by three main
factors: the nature of the inquiry, the extent of the researcher’s control over the actual
behavioural event, and the degree of focus on contemporary events. The common primary
classification of research approaches in literature is as follows: quantitative, qualitative, and a
combination of the two methods commonly referred to as triangulation (Neuman, 2006).
3.2.1 Quantitative Research
The quantitative research method is used to test objective theories by examining the
relationship between variables that can be measured, for example by instruments, so that the
data generated can be analysed by mathematical and/or statistical procedures (Creswell, 2009).
Fellows and Liu (2008) stated that quantitative research uses the scientific method – in which
an initial study of the theory and literature yields precise aims and objectives with hypotheses
to be tested. Sarantakos (1998) noted that the quantitative method is objective in nature and
capable of providing explanations for social phenomena or processes such as standardisation.
Quantitative research can take the form of either experimental or survey-based research
(McQueen and Knussen, 2002).
3.2.2 Qualitative Research
Exploring and understanding the meaning individuals or groups attribute to a social or human
problem is referred to as qualitative research (Creswell, 2009). Qualitative approaches seek to
uncover why things happen in the manner that they do, and to determine the meanings, which
people give to events, processes and structures. Qualitative research involves the collection,
organisation and interpretation of textual data gathered from talks or observations; these are
used in the exploration of the meanings of social phenomena as experienced by the individuals
involved in their natural context (Malterud, 2001). One of the features of this research method
is the flexibility of the overall research process since the questions and procedures, which
emerge (Creswell, 2009), are not usually predetermined. A qualitative research project can be
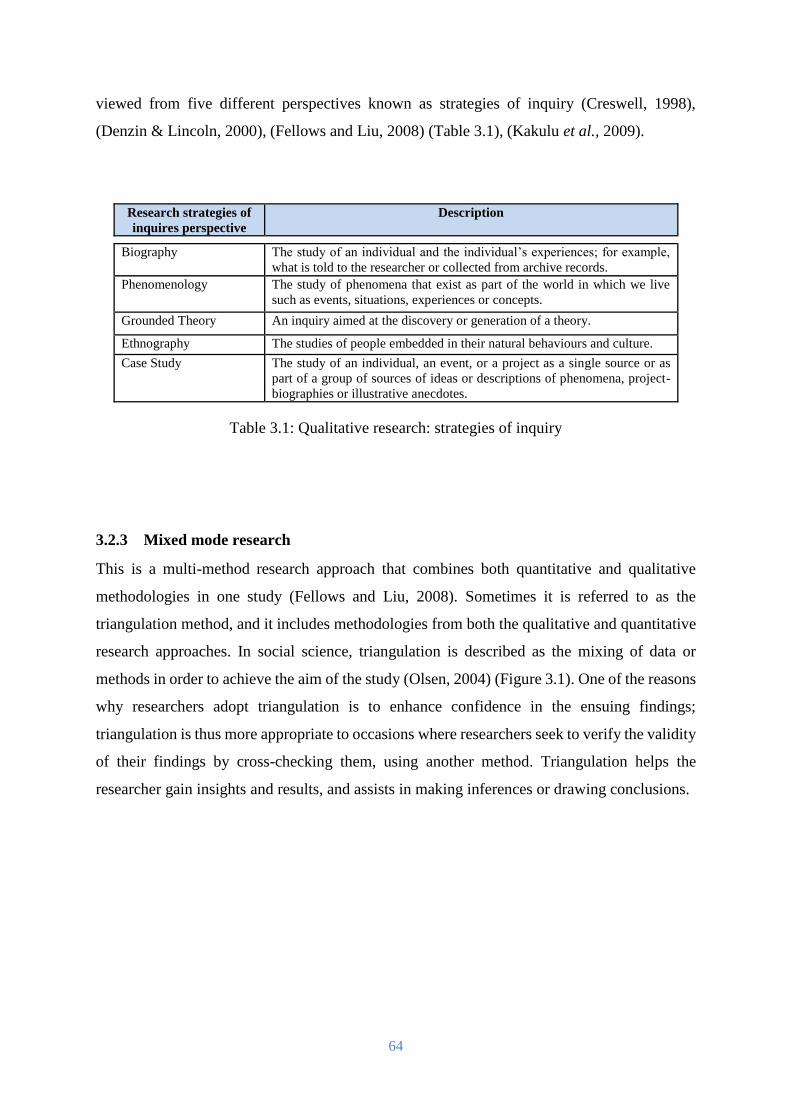
64
viewed from five different perspectives known as strategies of inquiry (Creswell, 1998),
(Denzin & Lincoln, 2000), (Fellows and Liu, 2008) (Table 3.1), (Kakulu et al., 2009).
Research strategies of
inquires perspective
Description
Biography The study of an individual and the individual’s experiences; for example,
what is told to the researcher or collected from archive records.
Phenomenology The study of phenomena that exist as part of the world in which we live
such as events, situations, experiences or concepts.
Grounded Theory An inquiry aimed at the discovery or generation of a theory.
Ethnography The studies of people embedded in their natural behaviours and culture.
Case Study The study of an individual, an event, or a project as a single source or as
part of a group of sources of ideas or descriptions of phenomena, project-
biographies or illustrative anecdotes.
Table 3.1: Qualitative research: strategies of inquiry
3.2.3 Mixed mode research
This is a multi-method research approach that combines both quantitative and qualitative
methodologies in one study (Fellows and Liu, 2008). Sometimes it is referred to as the
triangulation method, and it includes methodologies from both the qualitative and quantitative
research approaches. In social science, triangulation is described as the mixing of data or
methods in order to achieve the aim of the study (Olsen, 2004) (Figure 3.1). One of the reasons
why researchers adopt triangulation is to enhance confidence in the ensuing findings;
triangulation is thus more appropriate to occasions where researchers seek to verify the validity
of their findings by cross-checking them, using another method. Triangulation helps the
researcher gain insights and results, and assists in making inferences or drawing conclusions.
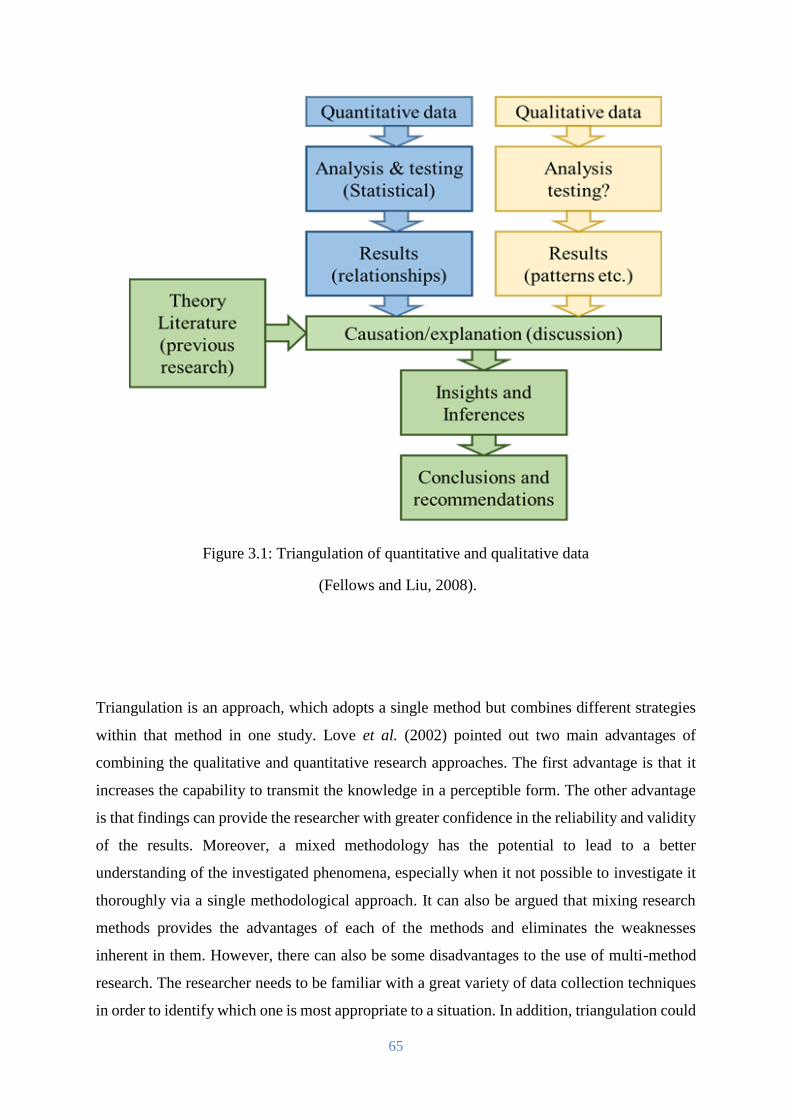
65
Figure 3.1: Triangulation of quantitative and qualitative data
(Fellows and Liu, 2008).
Triangulation is an approach, which adopts a single method but combines different strategies
within that method in one study. Love et al. (2002) pointed out two main advantages of
combining the qualitative and quantitative research approaches. The first advantage is that it
increases the capability to transmit the knowledge in a perceptible form. The other advantage
is that findings can provide the researcher with greater confidence in the reliability and validity
of the results. Moreover, a mixed methodology has the potential to lead to a better
understanding of the investigated phenomena, especially when it not possible to investigate it
thoroughly via a single methodological approach. It can also be argued that mixing research
methods provides the advantages of each of the methods and eliminates the weaknesses
inherent in them. However, there can also be some disadvantages to the use of multi-method
research. The researcher needs to be familiar with a great variety of data collection techniques
in order to identify which one is most appropriate to a situation. In addition, triangulation could
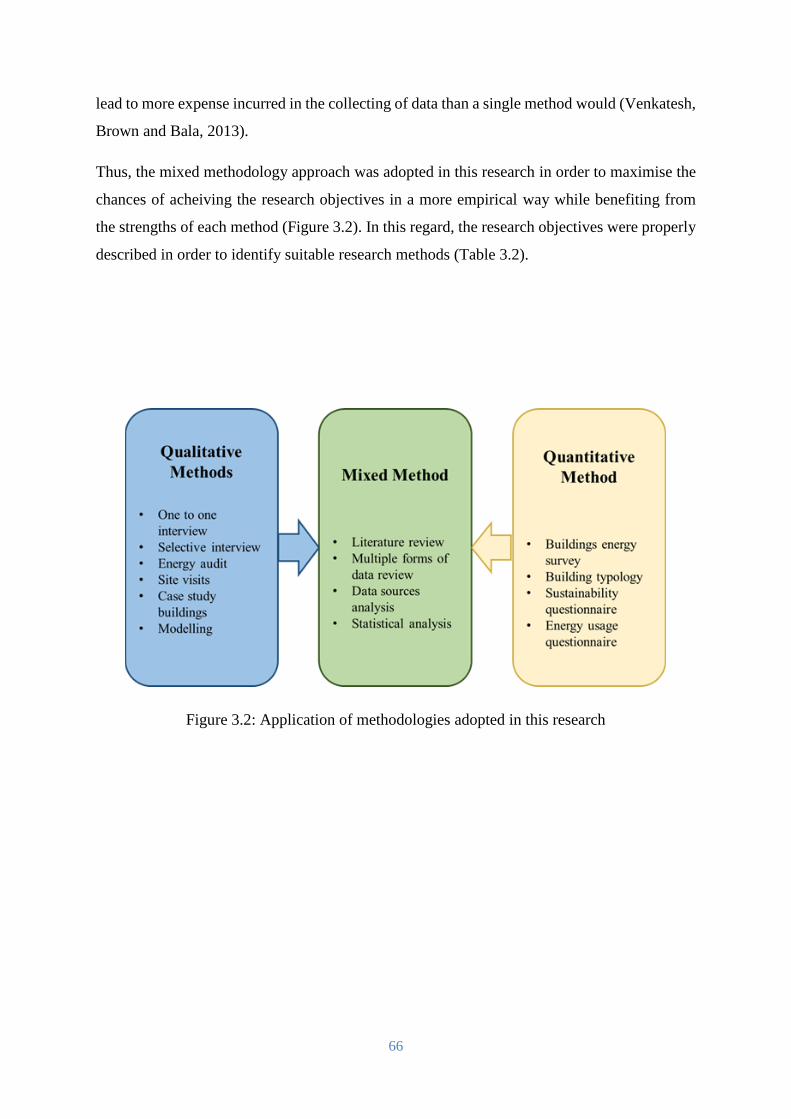
66
lead to more expense incurred in the collecting of data than a single method would (Venkatesh,
Brown and Bala, 2013).
Thus, the mixed methodology approach was adopted in this research in order to maximise the
chances of acheiving the research objectives in a more empirical way while benefiting from
the strengths of each method (Figure 3.2). In this regard, the research objectives were properly
described in order to identify suitable research methods (Table 3.2).
Figure 3.2: Application of methodologies adopted in this research
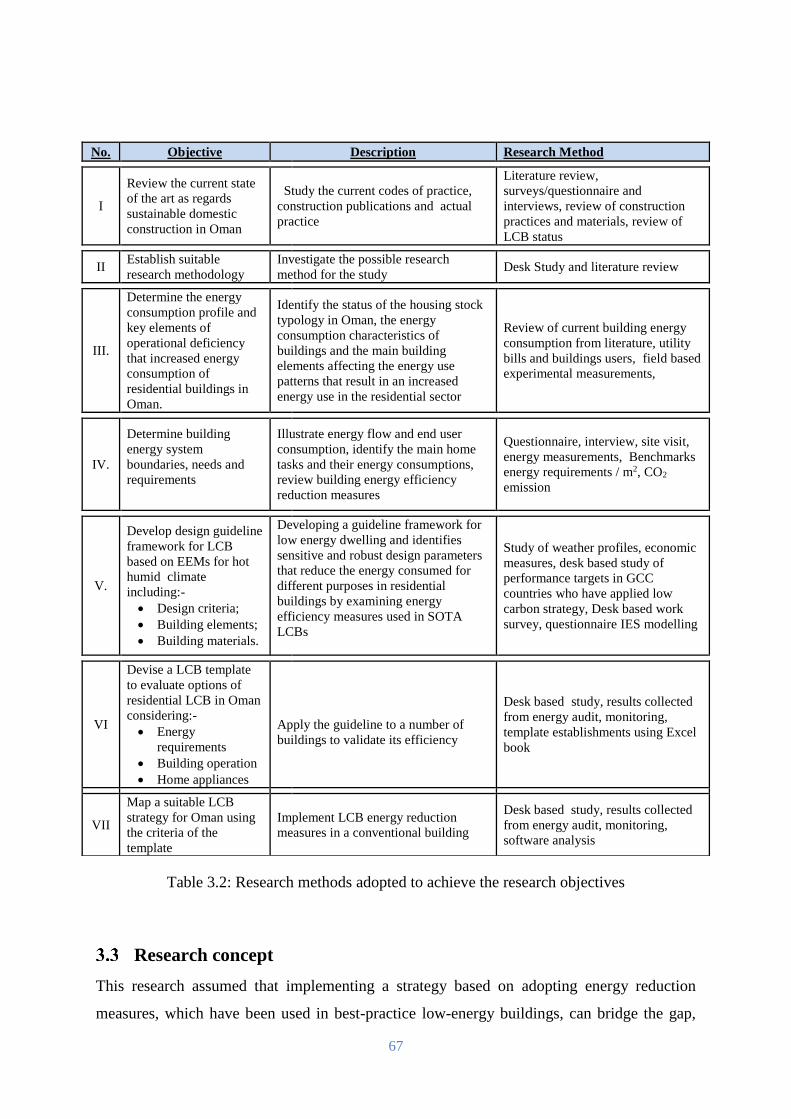
67
Table 3.2: Research methods adopted to achieve the research objectives
Research concept
This research assumed that implementing a strategy based on adopting energy reduction
measures, which have been used in best-practice low-energy buildings, can bridge the gap,
No. Objective Description Research Method
I
Review the current state
of the art as regards
sustainable domestic
construction in Oman
Study the current codes of practice,
construction publications and actual
practice
Literature review,
surveys/questionnaire and
interviews, review of construction
practices and materials, review of
LCB status
II Establish suitable
research methodology
Investigate the possible research
method for the study Desk Study and literature review
III.
Determine the energy
consumption profile and
key elements of
operational deficiency
that increased energy
consumption of
residential buildings in
Oman.
Identify the status of the housing stock
typology in Oman, the energy
consumption characteristics of
buildings and the main building
elements affecting the energy use
patterns that result in an increased
energy use in the residential sector
Review of current building energy
consumption from literature, utility
bills and buildings users, field based
experimental measurements,
IV.
Determine building
energy system
boundaries, needs and
requirements
Illustrate energy flow and end user
consumption, identify the main home
tasks and their energy consumptions,
review building energy efficiency
reduction measures
Questionnaire, interview, site visit,
energy measurements, Benchmarks
energy requirements / m2, CO2
emission
V.
Develop design guideline
framework for LCB
based on EEMs for hot
humid climate
including:-
Design criteria;
Building elements;
Building materials.
Developing a guideline framework for
low energy dwelling and identifies
sensitive and robust design parameters
that reduce the energy consumed for
different purposes in residential
buildings by examining energy
efficiency measures used in SOTA
LCBs
Study of weather profiles, economic
measures, desk based study of
performance targets in GCC
countries who have applied low
carbon strategy, Desk based work
survey, questionnaire IES modelling
VI
Devise a LCB template
to evaluate options of
residential LCB in Oman
considering:-
Energy
requirements
Building operation
Home appliances
Apply the guideline to a number of
buildings to validate its efficiency
Desk based study, results collected
from energy audit, monitoring,
template establishments using Excel
book
VII
Map a suitable LCB
strategy for Oman using
the criteria of the
template
Implement LCB energy reduction
measures in a conventional building
Desk based study, results collected
from energy audit, monitoring,
software analysis
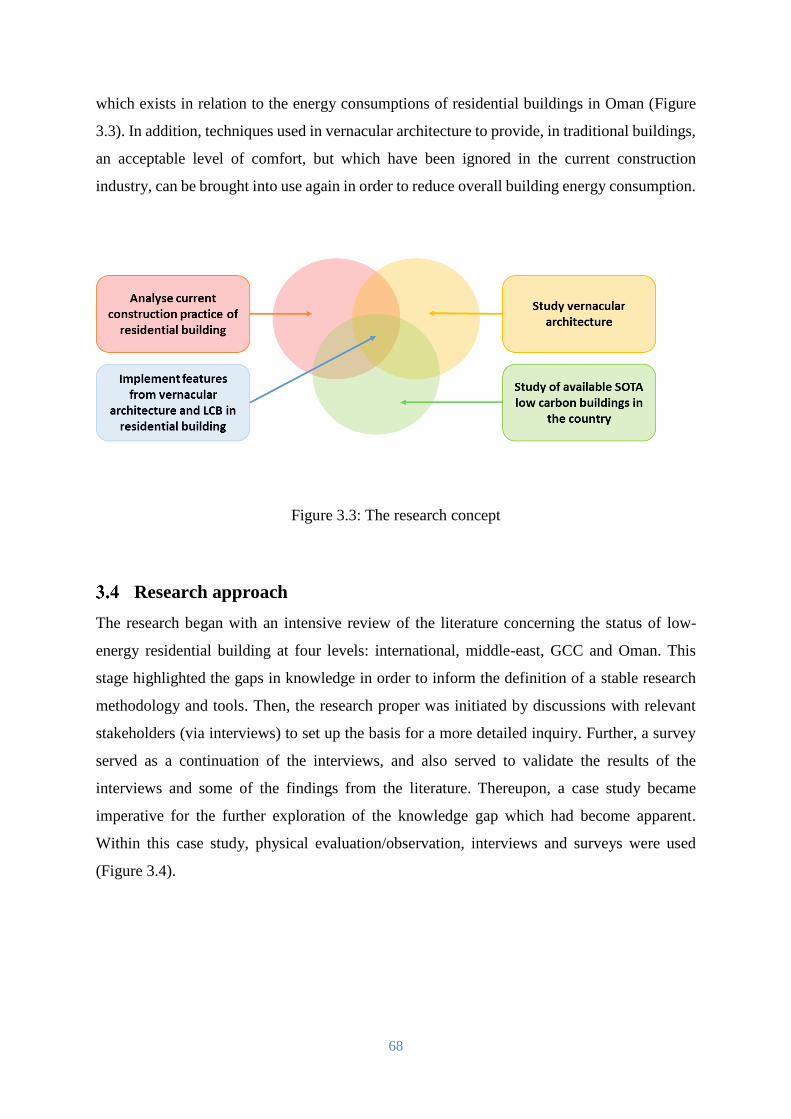
68
which exists in relation to the energy consumptions of residential buildings in Oman (Figure
3.3). In addition, techniques used in vernacular architecture to provide, in traditional buildings,
an acceptable level of comfort, but which have been ignored in the current construction
industry, can be brought into use again in order to reduce overall building energy consumption.
Figure 3.3: The research concept
Research approach
The research began with an intensive review of the literature concerning the status of low-
energy residential building at four levels: international, middle-east, GCC and Oman. This
stage highlighted the gaps in knowledge in order to inform the definition of a stable research
methodology and tools. Then, the research proper was initiated by discussions with relevant
stakeholders (via interviews) to set up the basis for a more detailed inquiry. Further, a survey
served as a continuation of the interviews, and also served to validate the results of the
interviews and some of the findings from the literature. Thereupon, a case study became
imperative for the further exploration of the knowledge gap which had become apparent.
Within this case study, physical evaluation/observation, interviews and surveys were used
(Figure 3.4).
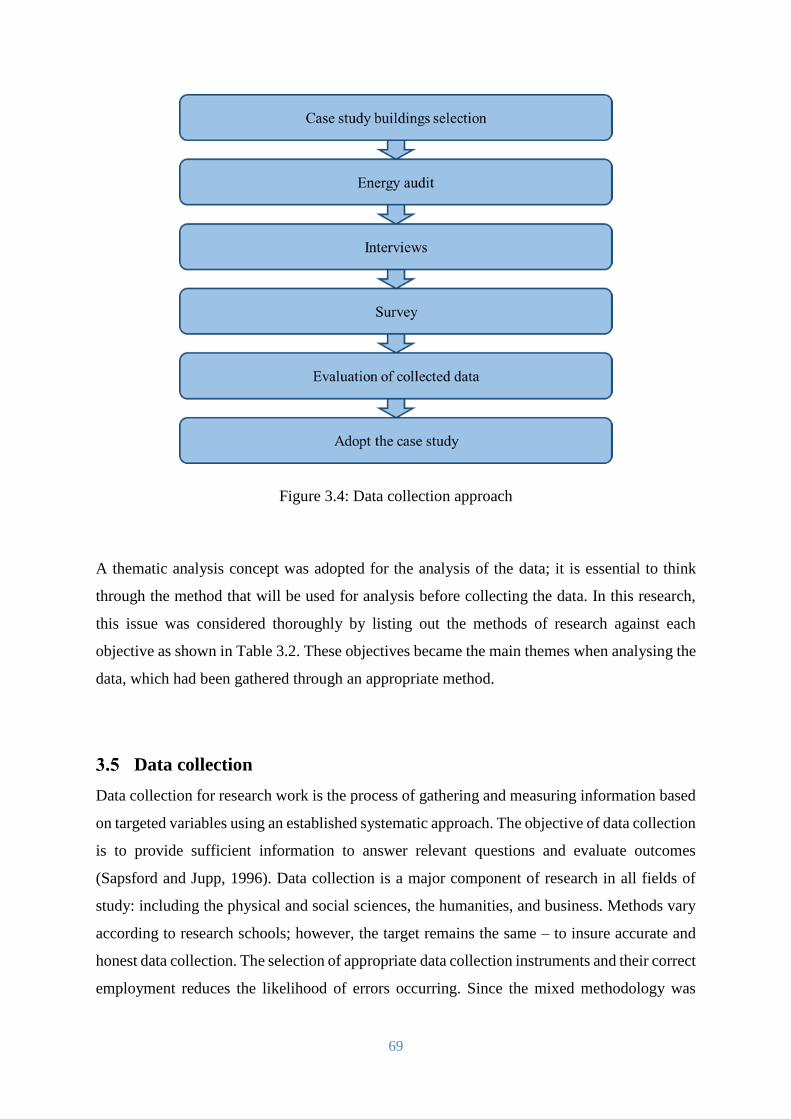
69
Figure 3.4: Data collection approach
A thematic analysis concept was adopted for the analysis of the data; it is essential to think
through the method that will be used for analysis before collecting the data. In this research,
this issue was considered thoroughly by listing out the methods of research against each
objective as shown in Table 3.2. These objectives became the main themes when analysing the
data, which had been gathered through an appropriate method.
Data collection
Data collection for research work is the process of gathering and measuring information based
on targeted variables using an established systematic approach. The objective of data collection
is to provide sufficient information to answer relevant questions and evaluate outcomes
(Sapsford and Jupp, 1996). Data collection is a major component of research in all fields of
study: including the physical and social sciences, the humanities, and business. Methods vary
according to research schools; however, the target remains the same – to insure accurate and
honest data collection. The selection of appropriate data collection instruments and their correct
employment reduces the likelihood of errors occurring. Since the mixed methodology was
70
selected for this research, data collection will involve a literature review, a questionnaire, a
survey, interviews and case studies of buildings.
3.5.1 Literature review
A literature review is a review of the available texts of scholarly papers, which encompass the
current knowledge, findings, theories, and methods that are relevant to the research topic
(Fellows and Liu, 2008). The review of relevant literature essentially served the following three
major purposes in this research:
Clarifying relevant issues of the research topic
Highlighting the gaps in knowledge and practice
Providing references to the results
The search for relevant literature was carried out through the study of state-of-the-art (SOTA)
low-energy buildings, relevant standards and codes, and the latest publications from reports
and media. A literature review was conducted both at the outset and was carried on all through
the research process on relevant topics within the research domain such as:
An overview of sustainability in the construction of low-energy building.
The historical background of the vernacular architecture of Oman and GCC countries.
Available legal frameworks and regulations.
Residential building physics and materials.
Energy consumption characteristics of a residential buildings.
Barriers to the widespread construction of low-energy buildings in Oman and GCC
countries.
Built environment impacts on climate.
Global concerns for a low carbon environment and the efforts made towards the zero
carbon buildings target.
Low carbon and renewable energy technologies and their opportunities, operation and
challenges in Oman.
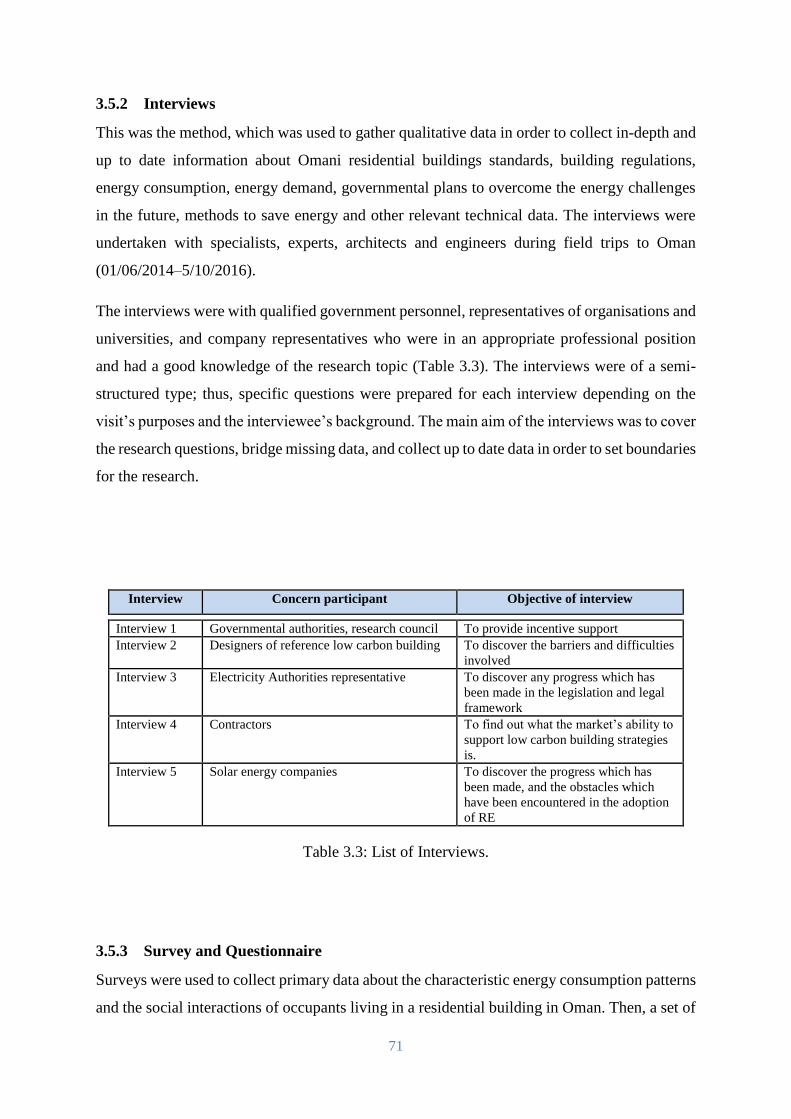
71
3.5.2 Interviews
This was the method, which was used to gather qualitative data in order to collect in-depth and
up to date information about Omani residential buildings standards, building regulations,
energy consumption, energy demand, governmental plans to overcome the energy challenges
in the future, methods to save energy and other relevant technical data. The interviews were
undertaken with specialists, experts, architects and engineers during field trips to Oman
(01/06/2014–5/10/2016).
The interviews were with qualified government personnel, representatives of organisations and
universities, and company representatives who were in an appropriate professional position
and had a good knowledge of the research topic (Table 3.3). The interviews were of a semi-
structured type; thus, specific questions were prepared for each interview depending on the
visit’s purposes and the interviewee’s background. The main aim of the interviews was to cover
the research questions, bridge missing data, and collect up to date data in order to set boundaries
for the research.
Interview Concern participant Objective of interview
Interview 1 Governmental authorities, research council To provide incentive support
Interview 2 Designers of reference low carbon building To discover the barriers and difficulties
involved
Interview 3 Electricity Authorities representative To discover any progress which has
been made in the legislation and legal
framework
Interview 4 Contractors To find out what the market’s ability to
support low carbon building strategies
is.
Interview 5 Solar energy companies To discover the progress which has
been made, and the obstacles which
have been encountered in the adoption
of RE
Table 3.3: List of Interviews.
3.5.3 Survey and Questionnaire
Surveys were used to collect primary data about the characteristic energy consumption patterns
and the social interactions of occupants living in a residential building in Oman. Then, a set of
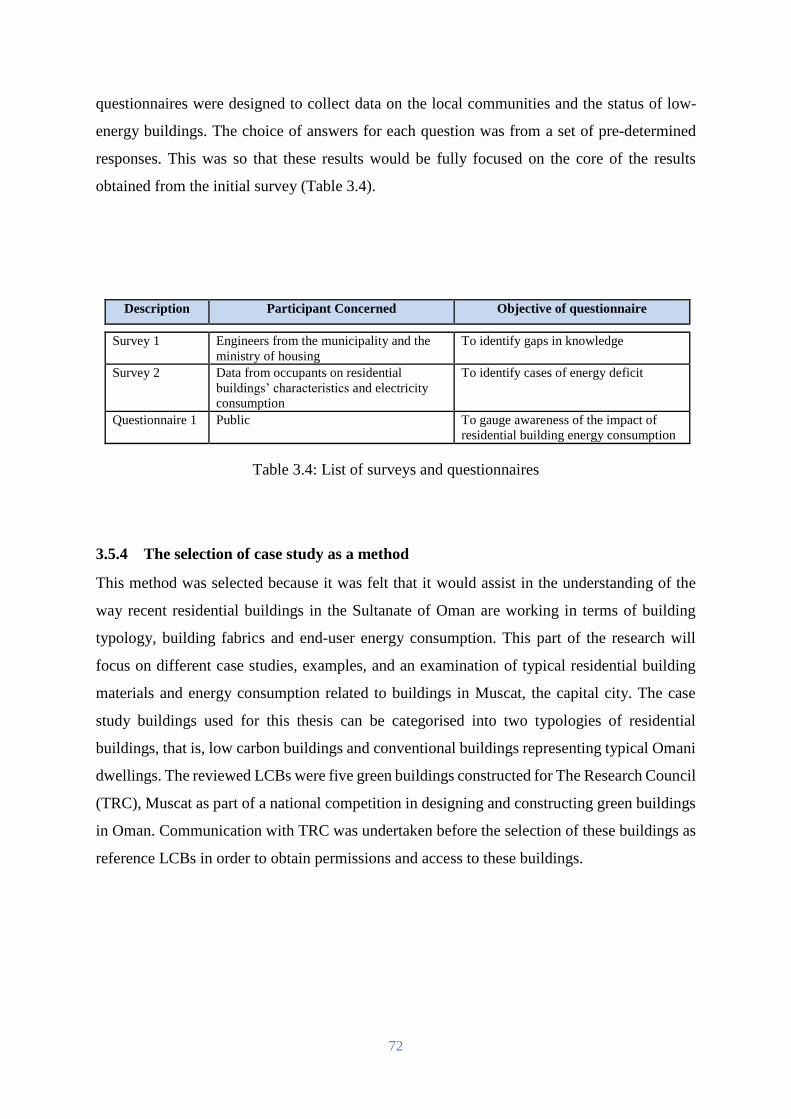
72
questionnaires were designed to collect data on the local communities and the status of low-
energy buildings. The choice of answers for each question was from a set of pre-determined
responses. This was so that these results would be fully focused on the core of the results
obtained from the initial survey (Table 3.4).
Description Participant Concerned Objective of questionnaire
Survey 1 Engineers from the municipality and the
ministry of housing
To identify gaps in knowledge
Survey 2 Data from occupants on residential
buildings’ characteristics and electricity
consumption
To identify cases of energy deficit
Questionnaire 1 Public To gauge awareness of the impact of
residential building energy consumption
Table 3.4: List of surveys and questionnaires
3.5.4 The selection of case study as a method
This method was selected because it was felt that it would assist in the understanding of the
way recent residential buildings in the Sultanate of Oman are working in terms of building
typology, building fabrics and end-user energy consumption. This part of the research will
focus on different case studies, examples, and an examination of typical residential building
materials and energy consumption related to buildings in Muscat, the capital city. The case
study buildings used for this thesis can be categorised into two typologies of residential
buildings, that is, low carbon buildings and conventional buildings representing typical Omani
dwellings. The reviewed LCBs were five green buildings constructed for The Research Council
(TRC), Muscat as part of a national competition in designing and constructing green buildings
in Oman. Communication with TRC was undertaken before the selection of these buildings as
reference LCBs in order to obtain permissions and access to these buildings.
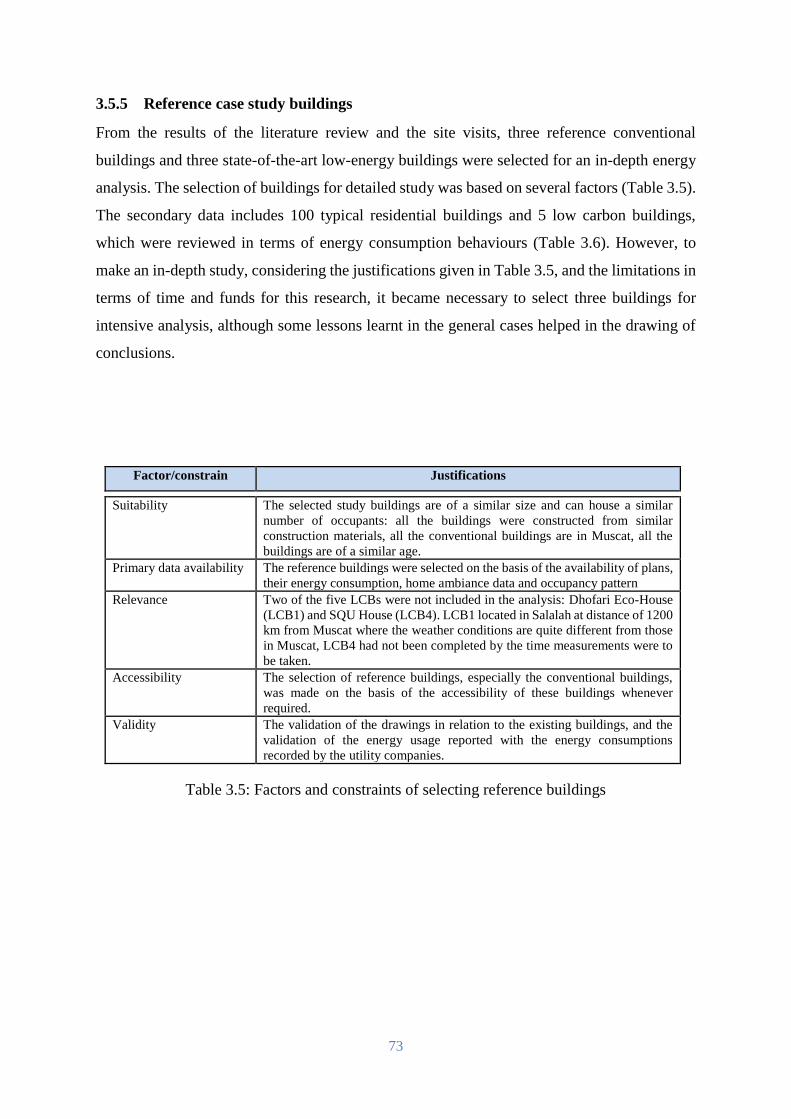
73
3.5.5 Reference case study buildings
From the results of the literature review and the site visits, three reference conventional
buildings and three state-of-the-art low-energy buildings were selected for an in-depth energy
analysis. The selection of buildings for detailed study was based on several factors (Table 3.5).
The secondary data includes 100 typical residential buildings and 5 low carbon buildings,
which were reviewed in terms of energy consumption behaviours (Table 3.6). However, to
make an in-depth study, considering the justifications given in Table 3.5, and the limitations in
terms of time and funds for this research, it became necessary to select three buildings for
intensive analysis, although some lessons learnt in the general cases helped in the drawing of
conclusions.
Factor/constrain Justifications
Suitability The selected study buildings are of a similar size and can house a similar
number of occupants: all the buildings were constructed from similar
construction materials, all the conventional buildings are in Muscat, all the
buildings are of a similar age.
Primary data availability The reference buildings were selected on the basis of the availability of plans,
their energy consumption, home ambiance data and occupancy pattern
Relevance Two of the five LCBs were not included in the analysis: Dhofari Eco-House
(LCB1) and SQU House (LCB4). LCB1 located in Salalah at distance of 1200
km from Muscat where the weather conditions are quite different from those
in Muscat, LCB4 had not been completed by the time measurements were to
be taken.
Accessibility The selection of reference buildings, especially the conventional buildings,
was made on the basis of the accessibility of these buildings whenever
required.
Validity The validation of the drawings in relation to the existing buildings, and the
validation of the energy usage reported with the energy consumptions
recorded by the utility companies.
Table 3.5: Factors and constraints of selecting reference buildings
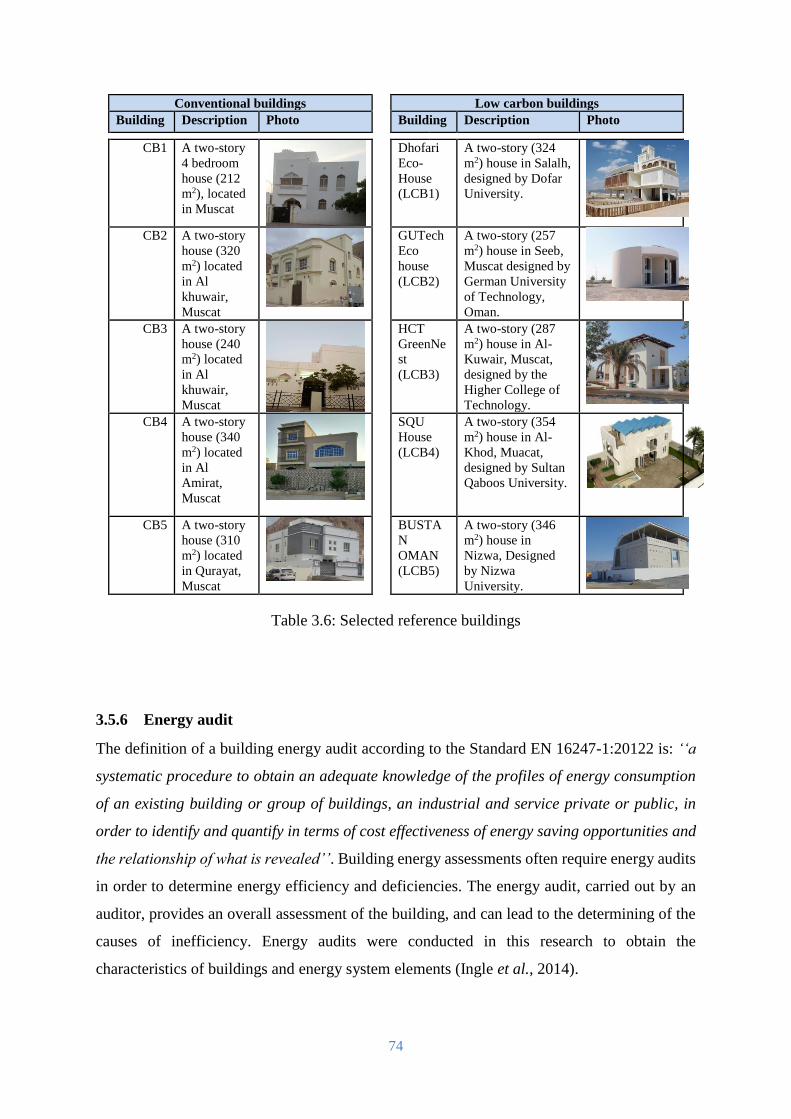
74
Conventional buildings
Low carbon buildings
Building Description Photo
Building Description Photo
CB1 A two-story
4 bedroom
house (212
m2), located
in Muscat
Dhofari
Eco-
House
(LCB1)
A two-story (324
m2) house in Salalh,
designed by Dofar
University.
CB2 A two-story
house (320
m2) located
in Al
khuwair,
Muscat
GUTech
Eco
house
(LCB2)
A two-story (257
m2) house in Seeb,
Muscat designed by
German University
of Technology,
Oman.
CB3 A two-story
house (240
m2) located
in Al
khuwair,
Muscat
HCT
GreenNe
st
(LCB3)
A two-story (287
m2) house in Al-
Kuwair, Muscat,
designed by the
Higher College of
Technology.
CB4 A two-story
house (340
m2) located
in Al
Amirat,
Muscat
SQU
House
(LCB4)
A two-story (354
m2) house in Al-
Khod, Muacat,
designed by Sultan
Qaboos University.
CB5 A two-story
house (310
m2) located
in Qurayat,
Muscat
BUSTA
N
OMAN
(LCB5)
A two-story (346
m2) house in
Nizwa, Designed
by Nizwa
University.
Table 3.6: Selected reference buildings
3.5.6 Energy audit
The definition of a building energy audit according to the Standard EN 16247-1:20122 is: ‘‘a
systematic procedure to obtain an adequate knowledge of the profiles of energy consumption
of an existing building or group of buildings, an industrial and service private or public, in
order to identify and quantify in terms of cost effectiveness of energy saving opportunities and
the relationship of what is revealed’’. Building energy assessments often require energy audits
in order to determine energy efficiency and deficiencies. The energy audit, carried out by an
auditor, provides an overall assessment of the building, and can lead to the determining of the
causes of inefficiency. Energy audits were conducted in this research to obtain the
characteristics of buildings and energy system elements (Ingle et al., 2014).
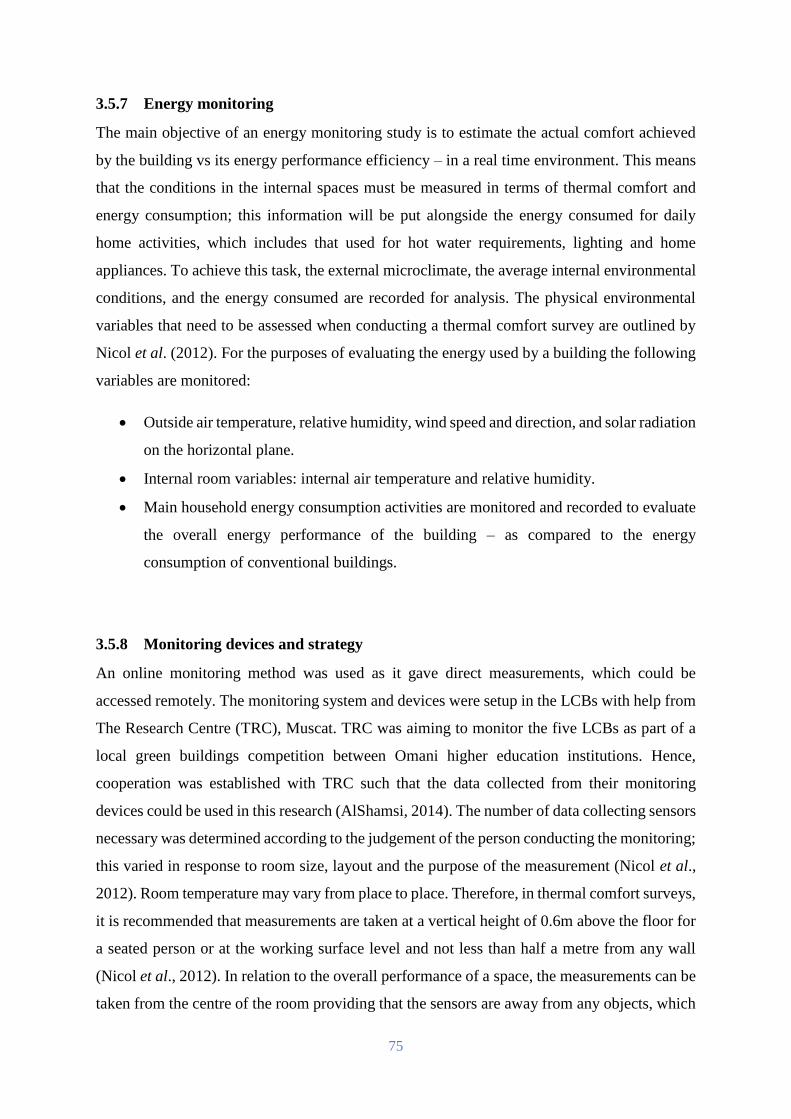
75
3.5.7 Energy monitoring
The main objective of an energy monitoring study is to estimate the actual comfort achieved
by the building vs its energy performance efficiency – in a real time environment. This means
that the conditions in the internal spaces must be measured in terms of thermal comfort and
energy consumption; this information will be put alongside the energy consumed for daily
home activities, which includes that used for hot water requirements, lighting and home
appliances. To achieve this task, the external microclimate, the average internal environmental
conditions, and the energy consumed are recorded for analysis. The physical environmental
variables that need to be assessed when conducting a thermal comfort survey are outlined by
Nicol et al. (2012). For the purposes of evaluating the energy used by a building the following
variables are monitored:
Outside air temperature, relative humidity, wind speed and direction, and solar radiation
on the horizontal plane.
Internal room variables: internal air temperature and relative humidity.
Main household energy consumption activities are monitored and recorded to evaluate
the overall energy performance of the building – as compared to the energy
consumption of conventional buildings.
3.5.8 Monitoring devices and strategy
An online monitoring method was used as it gave direct measurements, which could be
accessed remotely. The monitoring system and devices were setup in the LCBs with help from
The Research Centre (TRC), Muscat. TRC was aiming to monitor the five LCBs as part of a
local green buildings competition between Omani higher education institutions. Hence,
cooperation was established with TRC such that the data collected from their monitoring
devices could be used in this research (AlShamsi, 2014). The number of data collecting sensors
necessary was determined according to the judgement of the person conducting the monitoring;
this varied in response to room size, layout and the purpose of the measurement (Nicol et al.,
2012). Room temperature may vary from place to place. Therefore, in thermal comfort surveys,
it is recommended that measurements are taken at a vertical height of 0.6m above the floor for
a seated person or at the working surface level and not less than half a metre from any wall
(Nicol et al., 2012). In relation to the overall performance of a space, the measurements can be
taken from the centre of the room providing that the sensors are away from any objects, which
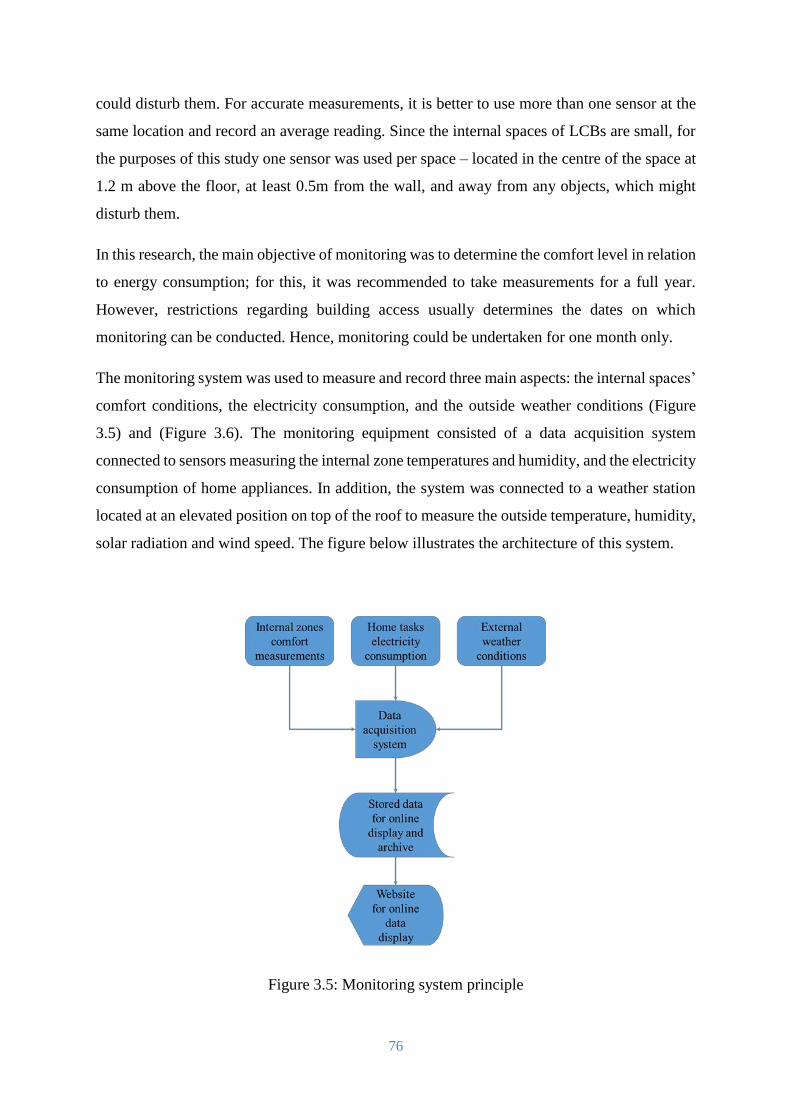
76
could disturb them. For accurate measurements, it is better to use more than one sensor at the
same location and record an average reading. Since the internal spaces of LCBs are small, for
the purposes of this study one sensor was used per space – located in the centre of the space at
1.2 m above the floor, at least 0.5m from the wall, and away from any objects, which might
disturb them.
In this research, the main objective of monitoring was to determine the comfort level in relation
to energy consumption; for this, it was recommended to take measurements for a full year.
However, restrictions regarding building access usually determines the dates on which
monitoring can be conducted. Hence, monitoring could be undertaken for one month only.
The monitoring system was used to measure and record three main aspects: the internal spaces’
comfort conditions, the electricity consumption, and the outside weather conditions (Figure
3.5) and (Figure 3.6). The monitoring equipment consisted of a data acquisition system
connected to sensors measuring the internal zone temperatures and humidity, and the electricity
consumption of home appliances. In addition, the system was connected to a weather station
located at an elevated position on top of the roof to measure the outside temperature, humidity,
solar radiation and wind speed. The figure below illustrates the architecture of this system.
Figure 3.5: Monitoring system principle
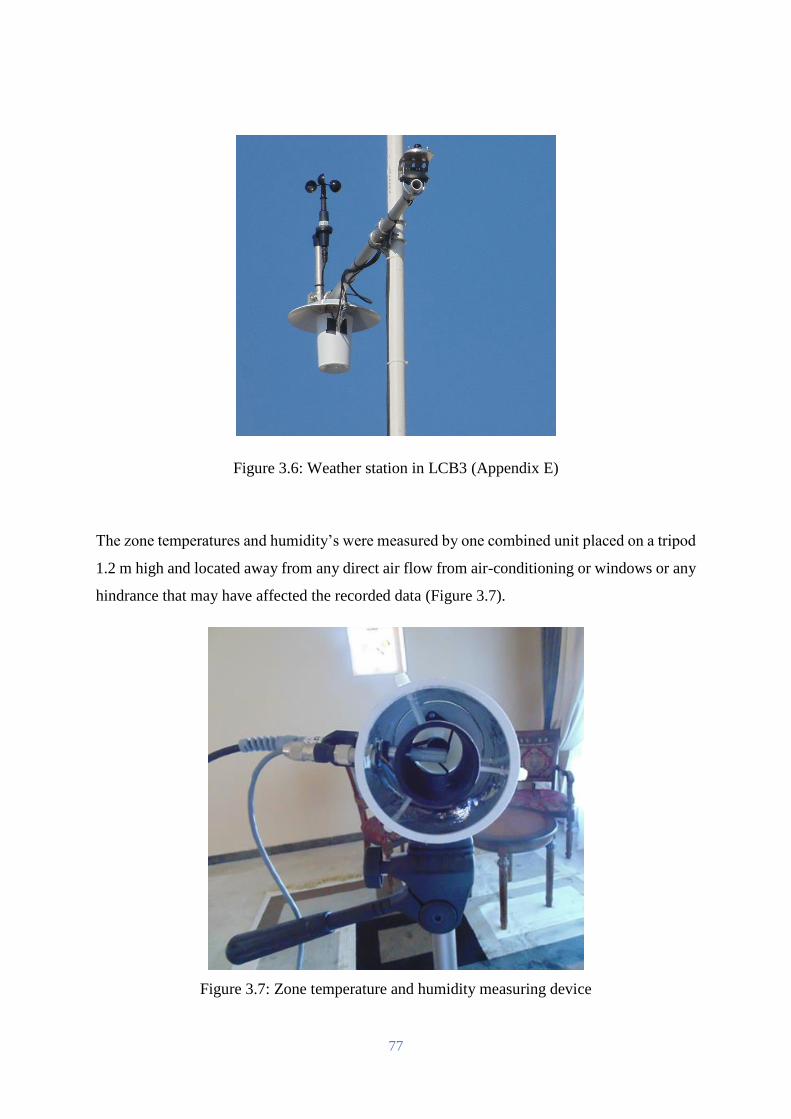
77
Figure 3.6: Weather station in LCB3 (Appendix E)
The zone temperatures and humidity’s were measured by one combined unit placed on a tripod
1.2 m high and located away from any direct air flow from air-conditioning or windows or any
hindrance that may have affected the recorded data (Figure 3.7).
Figure 3.7: Zone temperature and humidity measuring device
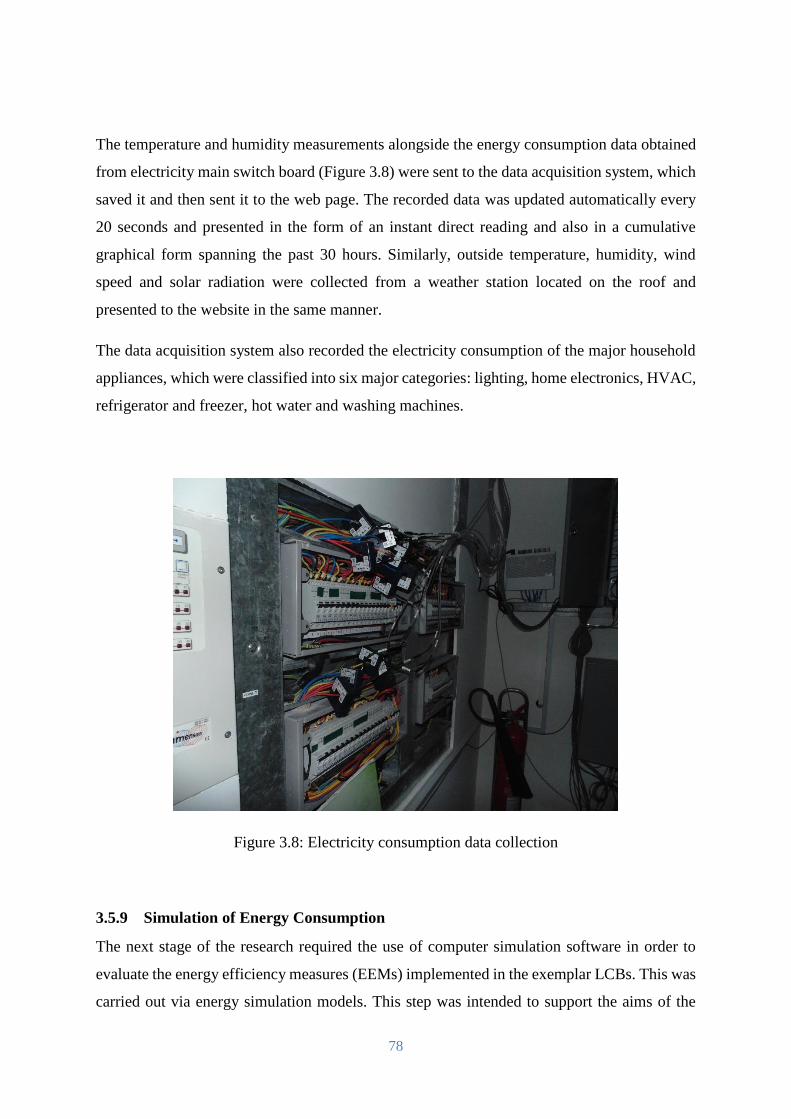
78
The temperature and humidity measurements alongside the energy consumption data obtained
from electricity main switch board (Figure 3.8) were sent to the data acquisition system, which
saved it and then sent it to the web page. The recorded data was updated automatically every
20 seconds and presented in the form of an instant direct reading and also in a cumulative
graphical form spanning the past 30 hours. Similarly, outside temperature, humidity, wind
speed and solar radiation were collected from a weather station located on the roof and
presented to the website in the same manner.
The data acquisition system also recorded the electricity consumption of the major household
appliances, which were classified into six major categories: lighting, home electronics, HVAC,
refrigerator and freezer, hot water and washing machines.
Figure 3.8: Electricity consumption data collection
3.5.9 Simulation of Energy Consumption
The next stage of the research required the use of computer simulation software in order to
evaluate the energy efficiency measures (EEMs) implemented in the exemplar LCBs. This was
carried out via energy simulation models. This step was intended to support the aims of the
79
research by providing a clear validation and estimation of the energy efficiency of the
residential buildings. The simulation required investigations into building fabrics, the
geometric dimensions of the buildings and also the energy consumption of the buildings. The
IES Virtual Environment (VE) was selected for the simulation phase of this research. It is a
suite of building performance analysis applications used to test different building options,
identify passive solutions, compare low-carbon and renewable technologies, and draw
conclusions on energy use, CO2 emissions and occupant comfort (VE for Architects |
Architectural analysis package, 2017).
Energy simulation was used for this thesis for two main purposes. The first purpose was to
establish a base case modelled energy consumption of the reference buildings. The second
purpose was to evaluate the different design strategies.
Data collection considerations
Regardless of the field of study or the research methodology in use, accurate data collection is
essential to maintaining the integrity of any research. In addition, the general and specific
considerations that have been taken into account in this context must be clarified. There are
several ethical issues that must be considered when collecting any type of data. Thus, care was
taken to minimise the shortcomings identified for each of the research approaches. The actions
taken in this regard are as follows:
The samples for the interviews were relatively small because of the in-depth
requirements of the investigations; hence, interviews were conducted with very
experienced professionals involved in the construction industry currently and in respect
of residential buildings in Oman.
The data collected and analysed from the interviews were the results obtained from a
structured set of questions. These were open ended in order to allow adequate freedom
for participants to express their opinions based on their experience.
Interviews were recorded via a digital voice recorder for future reference. The verbatim
transcriptions were sent back to the interviewees for editing and correction.
Before each questionnaire, a pilot study was conducted and the questionnaire was
reviewed in relation to this before the main survey was administered.
80
Attention was paid to the selection of the buildings to be surveyed, in order to obtain
similar sized buildings with similar levels of occupancy.
The reference LCBs had been constructed for a green building design competition,
specifically for the climate of Oman. This had received generous funds and donations
from governmental bodies and many companies. Therefore, the real construction costs
were evaluated by local contractors.
A variety of precautions were taken in the delivery of the questionnaires, such as hand
delivery and physical visits to retrieve them in order to maximise the responses, data
protection and consent, which are important ethical considerations.
Buildings energy calculations principle
The methods typically used to predict and calculate building energy consumption are based on
deterministic models that accounts for buildings’ energy demand according to pre-defined
input data describing the building’s sub-systems, usage patterns and weather conditions.
However, the complexity of real-life buildings is influencing their whole-system energy
calculations. The main cases of building energy complexity is due to factors including building
conditions, age, appliances type and efficiency, appliance age, occupants’ financial status and
social life inside buildings. This reduces the accuracy of deterministic approaches, which their
capabilities are unable to deal with unknown or uncertain input parameters. Hence, the model
validation and calibration against measured data will accounts for these additional socio-
economic factors which are responsible for this inaccuracy, which cannot be predicted due to
real-life building energy complexity.
For any energy calculation and demand, it would be necessary to specify the boundaries
of energy flows with in the building. Usually, all energy used in the buildings is recommended
to be considered in the calculation. Energy calculation determines energy use in relation to
indoor climate control, the heating of hot water and the operation of electrical equipment. These
calculation are performed using deferent methods explained by standards, building
certifications and rating schemes. An example of these methods is ISO/TC 163 “Thermal
performance and energy use in the built environment”. This standard involves test and
calculation methods for energy use in buildings, including the industrial built environment; test
and calculation methods for heating and cooling loads in buildings; test and calculation
methods for daylighting and ventilation / air infiltration. Also degree-days method is another
81
method used to calculate required energy for thermal comfort in buildings. It is a tool that can
be used in the assessment and analysis of weather related energy consumption in buildings.
This method is selected for energy consumption calculation for thermal comfort in this research
because of its simplicity and applicable in any region in the world.
The methodology for assessment of building energy in this research will involves estimating
the building energy consumption and demand based on building geometry, materials, home
appliances and usage. The energy demand estimation is required for this research in order to
evaluate building energy consumption and requirements under deferent scenarios.
The scope of calculation based on engineering techniques range from simple calculation of
usage to complex concepts such as heat and mass transfer. The analysis of the building energy
consumption includes the possible renewable energy generated within the building site, where
the combination of energy consumption together with the generated in site renewable energy
will be referred to as the residential building energy system. The principles of estimating the
energy consumption of building is by grouping of energy end consumers in the building. The
energy consumers groups in building are based on six home tasks:-
Thermal comfort (HVAC);
Lighting (L);
Hot water requirements (HW);
Washing (W);
Refrigeration (R);
Electronics devices (ED).
The building energy consumption predicting tool which will be created for this research will
be based on a static approach assuming a steady-state condition of the building. In this tool the
energy estimation of buildings includes both energy consumptions and demands based due to
the architectural configuration of the building as well as consumption related to the people in
the building. Based on this the energy consumption prediction tool will be made based on the
following:-
Home appliances sizes and frequent of use
Occupant behaviours and usage patterns
Building energy system efficiency and ratings.
While the energy demand calculation considers the following factors:
82
Building architecture including size, geometry and orientations
Environmental interaction: heat transfer (both losses and gains) between building and
environment;
Home appliances conditions including usage profile;
Energy requirements directly related to the presence of people in the building, considers
hot water supply, electric and electronics devices.
Chapter summary
A general overview of research concepts and methodologies has been presented in this chapter.
It identified that research may mean different things to different people. Research is a form of
logical or systematic, detailed and careful inquiry, aimed at making discoveries that will add
to knowledge; it is also solution-seeking in a methodical manner, that is, research is either
looking to develop or enhance a theory (pure research) or to solve a problem (applied research).
This chapter has reviewed the two key research approaches (quantitative and qualitative), and
also the mixed method referred to as triangulation – which was found to be most suited for this
research because of its exploratory nature. The methods adopted to investigate each objective
of this research have also been described, along with the general precautions taken and how
the resultant data was analysed; adopting the thematic content analysis approach for the
qualitative interviews, and the BUS methodology as a POE approach for the case study
buildings. The ethical precautions taken, as proposed by the faculty Ethics Committee, were
also enumerated in this chapter.
The methodology of this research was adopted on the assumption that designing strategies for
a low carbon residential building in the hot and humid climate of the Sultanate of Oman is
capable of bridging the gap which exists in the energy consumption of residential buildings.
Hence, this research analysed how adopting cost efficient energy measures have been
implemented in state-of-the-art low carbon buildings in the country.
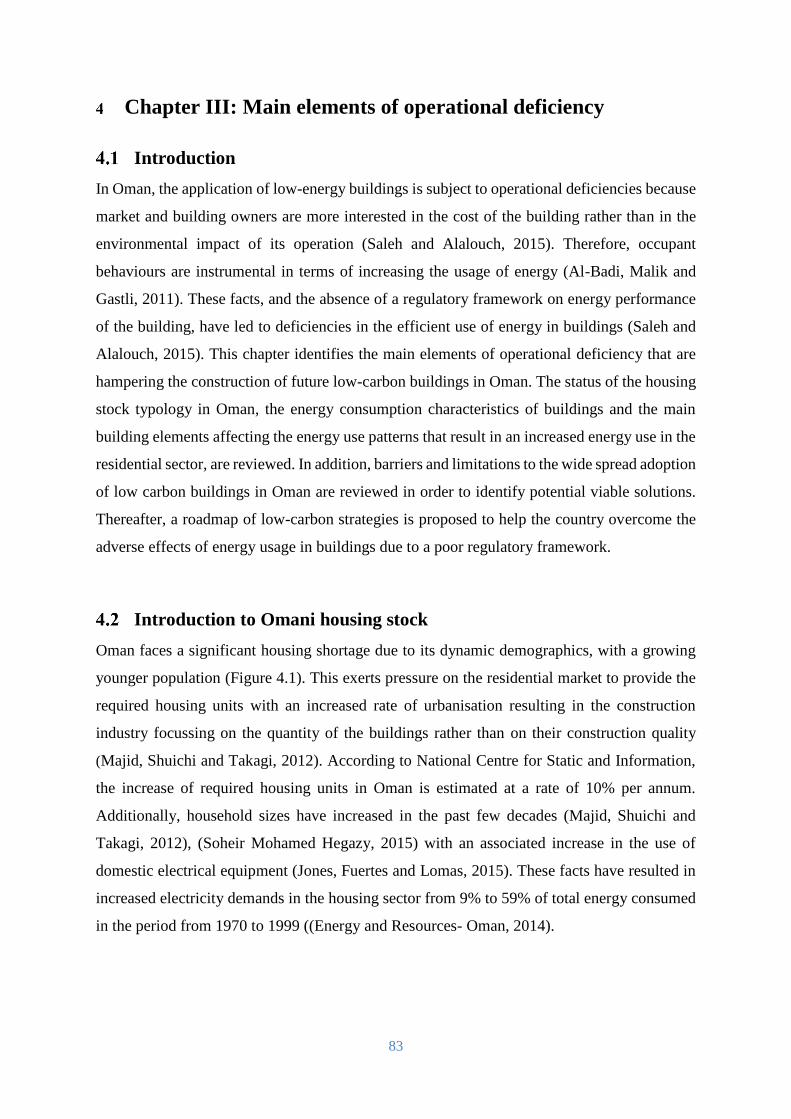
83
Chapter III: Main elements of operational deficiency
Introduction
In Oman, the application of low-energy buildings is subject to operational deficiencies because
market and building owners are more interested in the cost of the building rather than in the
environmental impact of its operation (Saleh and Alalouch, 2015). Therefore, occupant
behaviours are instrumental in terms of increasing the usage of energy (Al-Badi, Malik and
Gastli, 2011). These facts, and the absence of a regulatory framework on energy performance
of the building, have led to deficiencies in the efficient use of energy in buildings (Saleh and
Alalouch, 2015). This chapter identifies the main elements of operational deficiency that are
hampering the construction of future low-carbon buildings in Oman. The status of the housing
stock typology in Oman, the energy consumption characteristics of buildings and the main
building elements affecting the energy use patterns that result in an increased energy use in the
residential sector, are reviewed. In addition, barriers and limitations to the wide spread adoption
of low carbon buildings in Oman are reviewed in order to identify potential viable solutions.
Thereafter, a roadmap of low-carbon strategies is proposed to help the country overcome the
adverse effects of energy usage in buildings due to a poor regulatory framework.
Introduction to Omani housing stock
Oman faces a significant housing shortage due to its dynamic demographics, with a growing
younger population (Figure 4.1). This exerts pressure on the residential market to provide the
required housing units with an increased rate of urbanisation resulting in the construction
industry focussing on the quantity of the buildings rather than on their construction quality
(Majid, Shuichi and Takagi, 2012). According to National Centre for Static and Information,
the increase of required housing units in Oman is estimated at a rate of 10% per annum.
Additionally, household sizes have increased in the past few decades (Majid, Shuichi and
Takagi, 2012), (Soheir Mohamed Hegazy, 2015) with an associated increase in the use of
domestic electrical equipment (Jones, Fuertes and Lomas, 2015). These facts have resulted in
increased electricity demands in the housing sector from 9% to 59% of total energy consumed
in the period from 1970 to 1999 ((Energy and Resources- Oman, 2014).
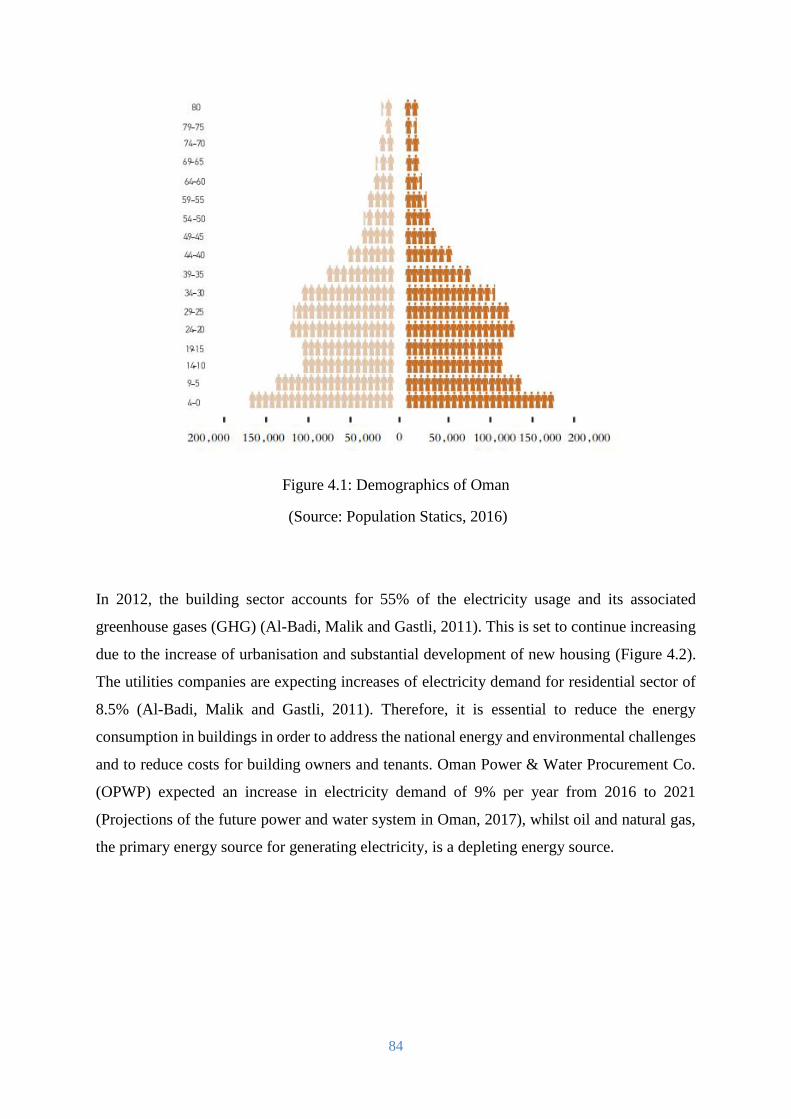
84
Figure 4.1: Demographics of Oman
(Source: Population Statics, 2016)
In 2012, the building sector accounts for 55% of the electricity usage and its associated
greenhouse gases (GHG) (Al-Badi, Malik and Gastli, 2011). This is set to continue increasing
due to the increase of urbanisation and substantial development of new housing (Figure 4.2).
The utilities companies are expecting increases of electricity demand for residential sector of
8.5% (Al-Badi, Malik and Gastli, 2011). Therefore, it is essential to reduce the energy
consumption in buildings in order to address the national energy and environmental challenges
and to reduce costs for building owners and tenants. Oman Power & Water Procurement Co.
(OPWP) expected an increase in electricity demand of 9% per year from 2016 to 2021
(Projections of the future power and water system in Oman, 2017), whilst oil and natural gas,
the primary energy source for generating electricity, is a depleting energy source.
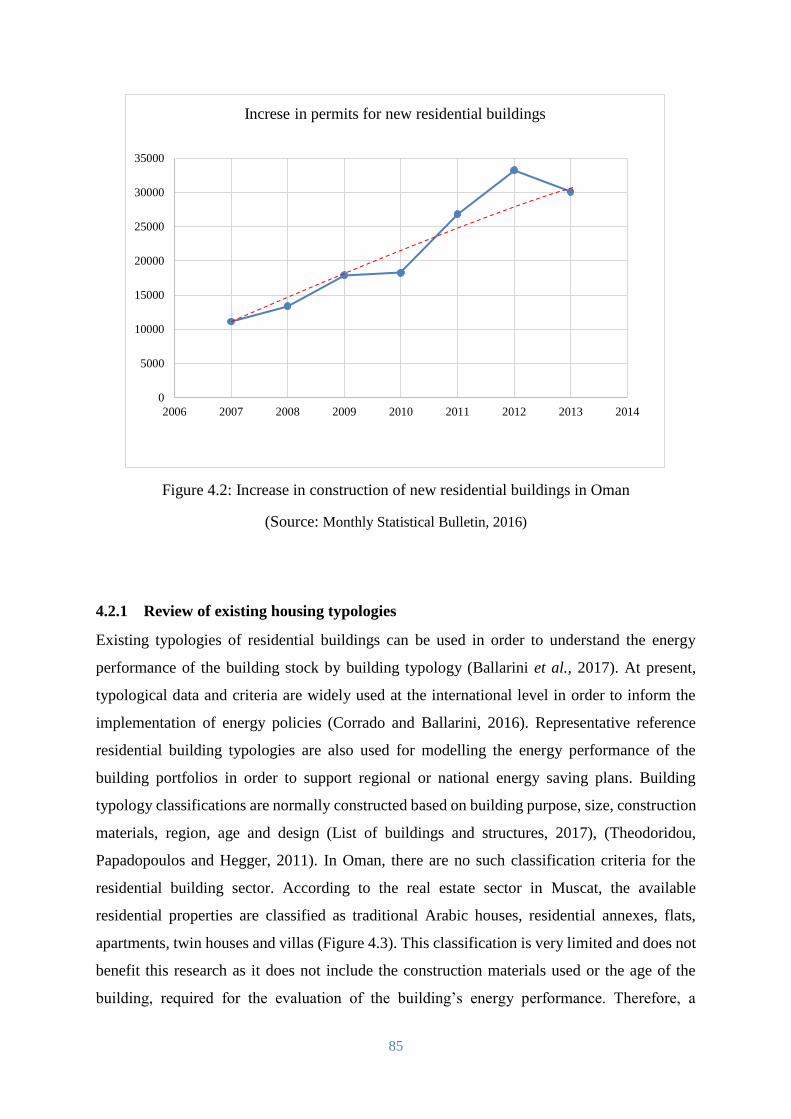
85
Figure 4.2: Increase in construction of new residential buildings in Oman
(Source: Monthly Statistical Bulletin, 2016)
4.2.1 Review of existing housing typologies
Existing typologies of residential buildings can be used in order to understand the energy
performance of the building stock by building typology (Ballarini et al., 2017). At present,
typological data and criteria are widely used at the international level in order to inform the
implementation of energy policies (Corrado and Ballarini, 2016). Representative reference
residential building typologies are also used for modelling the energy performance of the
building portfolios in order to support regional or national energy saving plans. Building
typology classifications are normally constructed based on building purpose, size, construction
materials, region, age and design (List of buildings and structures, 2017), (Theodoridou,
Papadopoulos and Hegger, 2011). In Oman, there are no such classification criteria for the
residential building sector. According to the real estate sector in Muscat, the available
residential properties are classified as traditional Arabic houses, residential annexes, flats,
apartments, twin houses and villas (Figure 4.3). This classification is very limited and does not
benefit this research as it does not include the construction materials used or the age of the
building, required for the evaluation of the building’s energy performance. Therefore, a
0
5000
10000
15000
20000
25000
30000
35000
2006 2007 2008 2009 2010 2011 2012 2013 2014
Increse in permits for new residential buildings
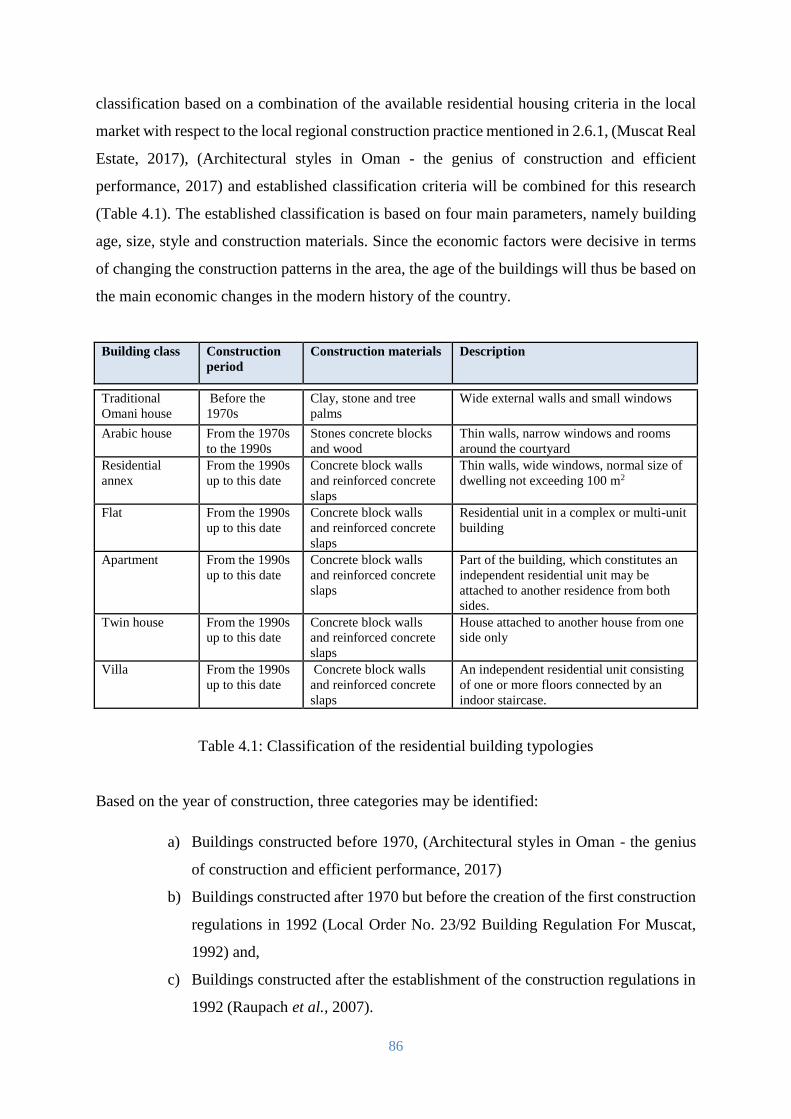
86
classification based on a combination of the available residential housing criteria in the local
market with respect to the local regional construction practice mentioned in 2.6.1, (Muscat Real
Estate, 2017), (Architectural styles in Oman - the genius of construction and efficient
performance, 2017) and established classification criteria will be combined for this research
(Table 4.1). The established classification is based on four main parameters, namely building
age, size, style and construction materials. Since the economic factors were decisive in terms
of changing the construction patterns in the area, the age of the buildings will thus be based on
the main economic changes in the modern history of the country.
Building class Construction
period
Construction materials Description
Traditional
Omani house
Before the
1970s
Clay, stone and tree
palms
Wide external walls and small windows
Arabic house From the 1970s
to the 1990s
Stones concrete blocks
and wood
Thin walls, narrow windows and rooms
around the courtyard
Residential
annex
From the 1990s
up to this date
Concrete block walls
and reinforced concrete
slaps
Thin walls, wide windows, normal size of
dwelling not exceeding 100 m2
Flat From the 1990s
up to this date
Concrete block walls
and reinforced concrete
slaps
Residential unit in a complex or multi-unit
building
Apartment From the 1990s
up to this date
Concrete block walls
and reinforced concrete
slaps
Part of the building, which constitutes an
independent residential unit may be
attached to another residence from both
sides.
Twin house From the 1990s
up to this date
Concrete block walls
and reinforced concrete
slaps
House attached to another house from one
side only
Villa From the 1990s
up to this date
Concrete block walls
and reinforced concrete
slaps
An independent residential unit consisting
of one or more floors connected by an
indoor staircase.
Table 4.1: Classification of the residential building typologies
Based on the year of construction, three categories may be identified:
a) Buildings constructed before 1970, (Architectural styles in Oman - the genius
of construction and efficient performance, 2017)
b) Buildings constructed after 1970 but before the creation of the first construction
regulations in 1992 (Local Order No. 23/92 Building Regulation For Muscat,
1992) and,
c) Buildings constructed after the establishment of the construction regulations in
1992 (Raupach et al., 2007).
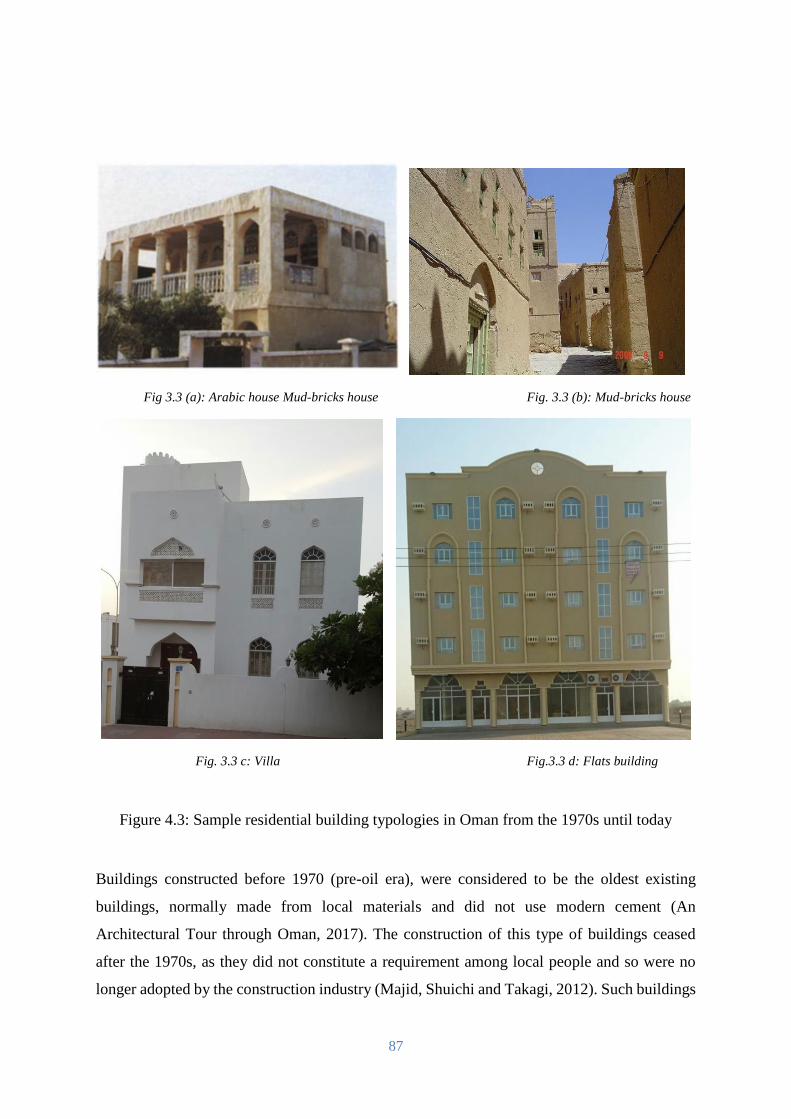
87
Fig 3.3 (a): Arabic house Mud-bricks house Fig. 3.3 (b): Mud-bricks house
Fig. 3.3 c: Villa Fig.3.3 d: Flats building
Figure 4.3: Sample residential building typologies in Oman from the 1970s until today
Buildings constructed before 1970 (pre-oil era), were considered to be the oldest existing
buildings, normally made from local materials and did not use modern cement (An
Architectural Tour through Oman, 2017). The construction of this type of buildings ceased
after the 1970s, as they did not constitute a requirement among local people and so were no
longer adopted by the construction industry (Majid, Shuichi and Takagi, 2012). Such buildings
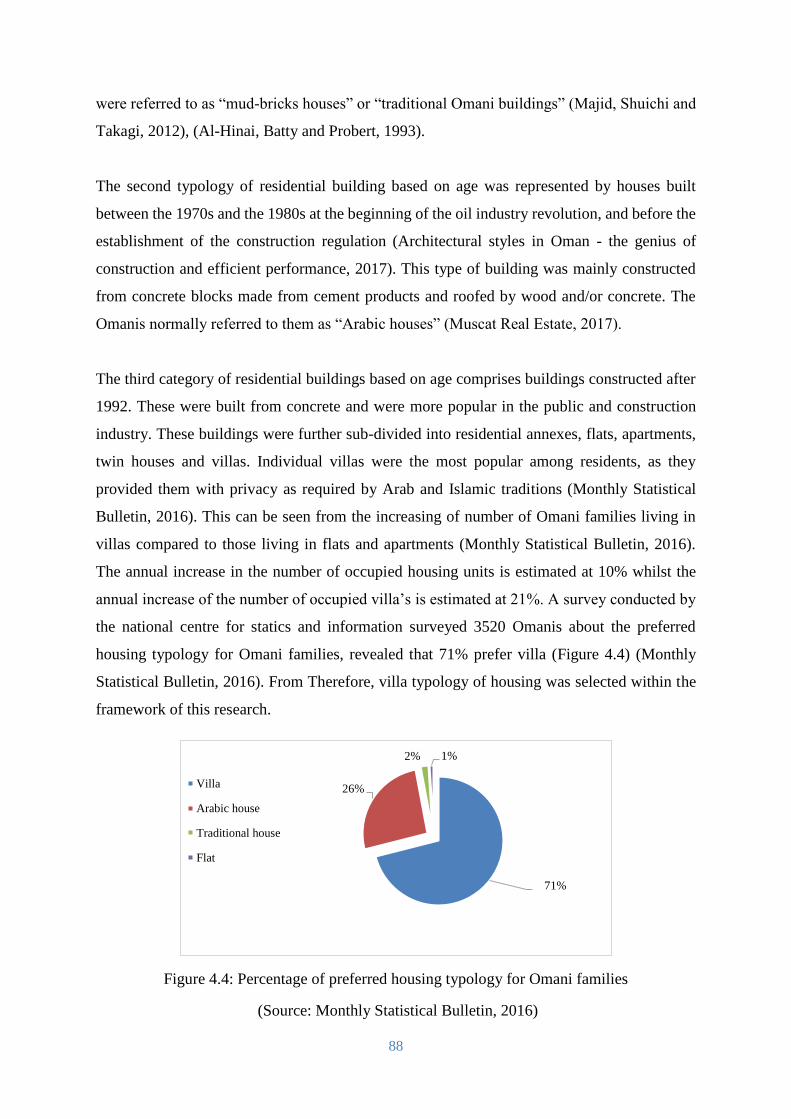
88
were referred to as “mud-bricks houses” or “traditional Omani buildings” (Majid, Shuichi and
Takagi, 2012), (Al-Hinai, Batty and Probert, 1993).
The second typology of residential building based on age was represented by houses built
between the 1970s and the 1980s at the beginning of the oil industry revolution, and before the
establishment of the construction regulation (Architectural styles in Oman - the genius of
construction and efficient performance, 2017). This type of building was mainly constructed
from concrete blocks made from cement products and roofed by wood and/or concrete. The
Omanis normally referred to them as “Arabic houses” (Muscat Real Estate, 2017).
The third category of residential buildings based on age comprises buildings constructed after
1992. These were built from concrete and were more popular in the public and construction
industry. These buildings were further sub-divided into residential annexes, flats, apartments,
twin houses and villas. Individual villas were the most popular among residents, as they
provided them with privacy as required by Arab and Islamic traditions (Monthly Statistical
Bulletin, 2016). This can be seen from the increasing of number of Omani families living in
villas compared to those living in flats and apartments (Monthly Statistical Bulletin, 2016).
The annual increase in the number of occupied housing units is estimated at 10% whilst the
annual increase of the number of occupied villa’s is estimated at 21%. A survey conducted by
the national centre for statics and information surveyed 3520 Omanis about the preferred
housing typology for Omani families, revealed that 71% prefer villa (Figure 4.4) (Monthly
Statistical Bulletin, 2016). From Therefore, villa typology of housing was selected within the
framework of this research.
Figure 4.4: Percentage of preferred housing typology for Omani families
(Source: Monthly Statistical Bulletin, 2016)
71%
26%
2% 1%
Villa
Arabic house
Traditional house
Flat
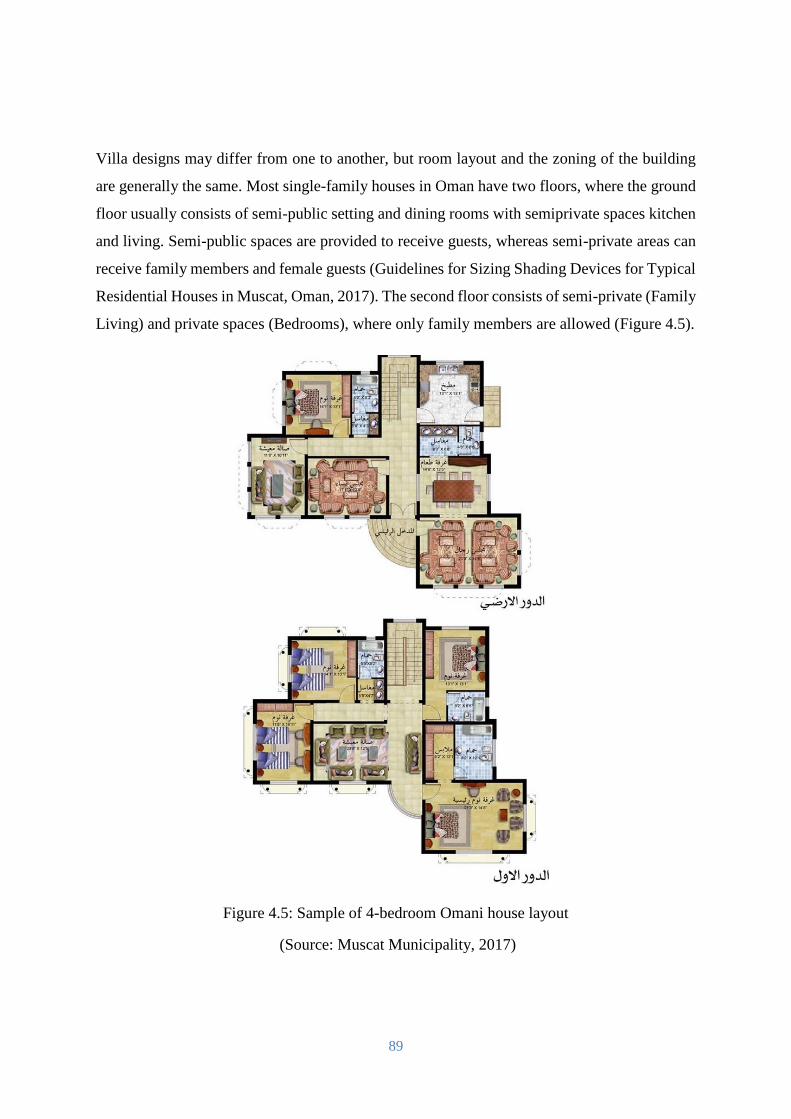
89
Villa designs may differ from one to another, but room layout and the zoning of the building
are generally the same. Most single-family houses in Oman have two floors, where the ground
floor usually consists of semi-public setting and dining rooms with semiprivate spaces kitchen
and living. Semi-public spaces are provided to receive guests, whereas semi-private areas can
receive family members and female guests (Guidelines for Sizing Shading Devices for Typical
Residential Houses in Muscat, Oman, 2017). The second floor consists of semi-private (Family
Living) and private spaces (Bedrooms), where only family members are allowed (Figure 4.5).
Figure 4.5: Sample of 4-bedroom Omani house layout
(Source: Muscat Municipality, 2017)
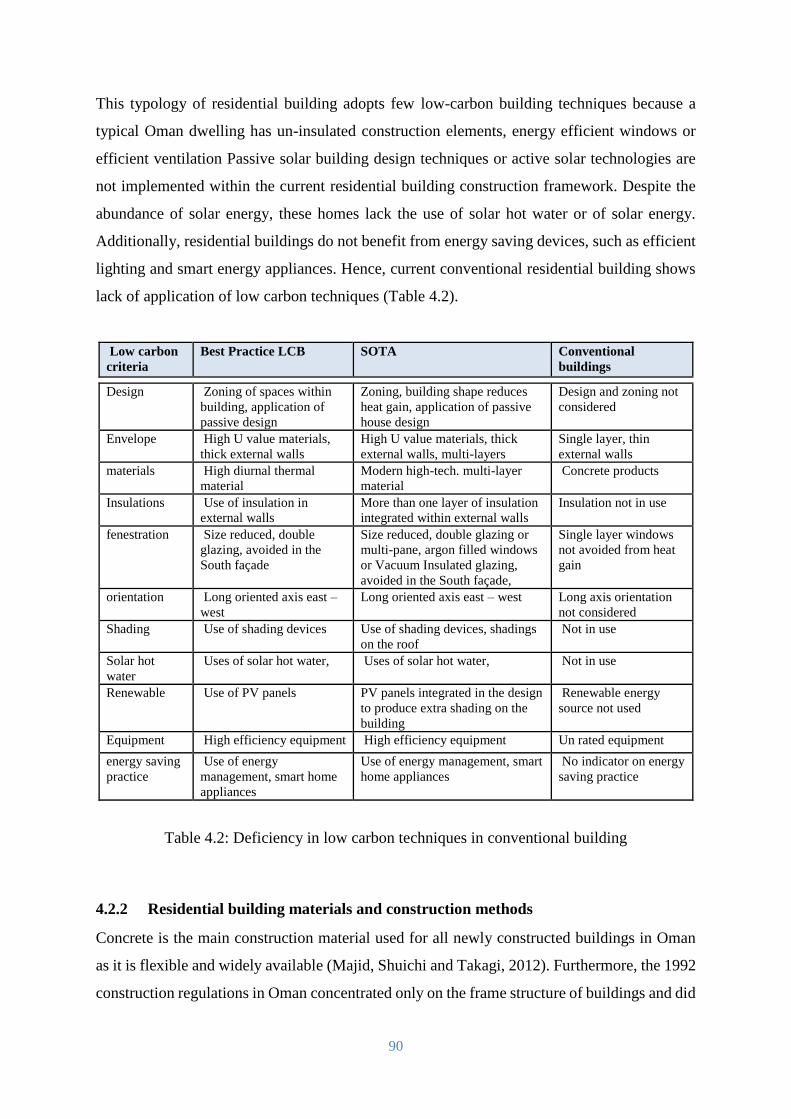
90
This typology of residential building adopts few low-carbon building techniques because a
typical Oman dwelling has un-insulated construction elements, energy efficient windows or
efficient ventilation Passive solar building design techniques or active solar technologies are
not implemented within the current residential building construction framework. Despite the
abundance of solar energy, these homes lack the use of solar hot water or of solar energy.
Additionally, residential buildings do not benefit from energy saving devices, such as efficient
lighting and smart energy appliances. Hence, current conventional residential building shows
lack of application of low carbon techniques (Table 4.2).
Low carbon
criteria
Best Practice LCB SOTA Conventional
buildings
Design Zoning of spaces within
building, application of
passive design
Zoning, building shape reduces
heat gain, application of passive
house design
Design and zoning not
considered
Envelope High U value materials,
thick external walls
High U value materials, thick
external walls, multi-layers
Single layer, thin
external walls
materials High diurnal thermal
material
Modern high-tech. multi-layer
material
Concrete products
Insulations Use of insulation in
external walls
More than one layer of insulation
integrated within external walls
Insulation not in use
fenestration Size reduced, double
glazing, avoided in the
South façade
Size reduced, double glazing or
multi-pane, argon filled windows
or Vacuum Insulated glazing,
avoided in the South façade,
Single layer windows
not avoided from heat
gain
orientation Long oriented axis east –
west
Long oriented axis east – west Long axis orientation
not considered
Shading Use of shading devices Use of shading devices, shadings
on the roof
Not in use
Solar hot
water
Uses of solar hot water, Uses of solar hot water, Not in use
Renewable Use of PV panels PV panels integrated in the design
to produce extra shading on the
building
Renewable energy
source not used
Equipment High efficiency equipment High efficiency equipment Un rated equipment
energy saving
practice
Use of energy
management, smart home
appliances
Use of energy management, smart
home appliances
No indicator on energy
saving practice
Table 4.2: Deficiency in low carbon techniques in conventional building
4.2.2 Residential building materials and construction methods
Concrete is the main construction material used for all newly constructed buildings in Oman
as it is flexible and widely available (Majid, Shuichi and Takagi, 2012). Furthermore, the 1992
construction regulations in Oman concentrated only on the frame structure of buildings and did
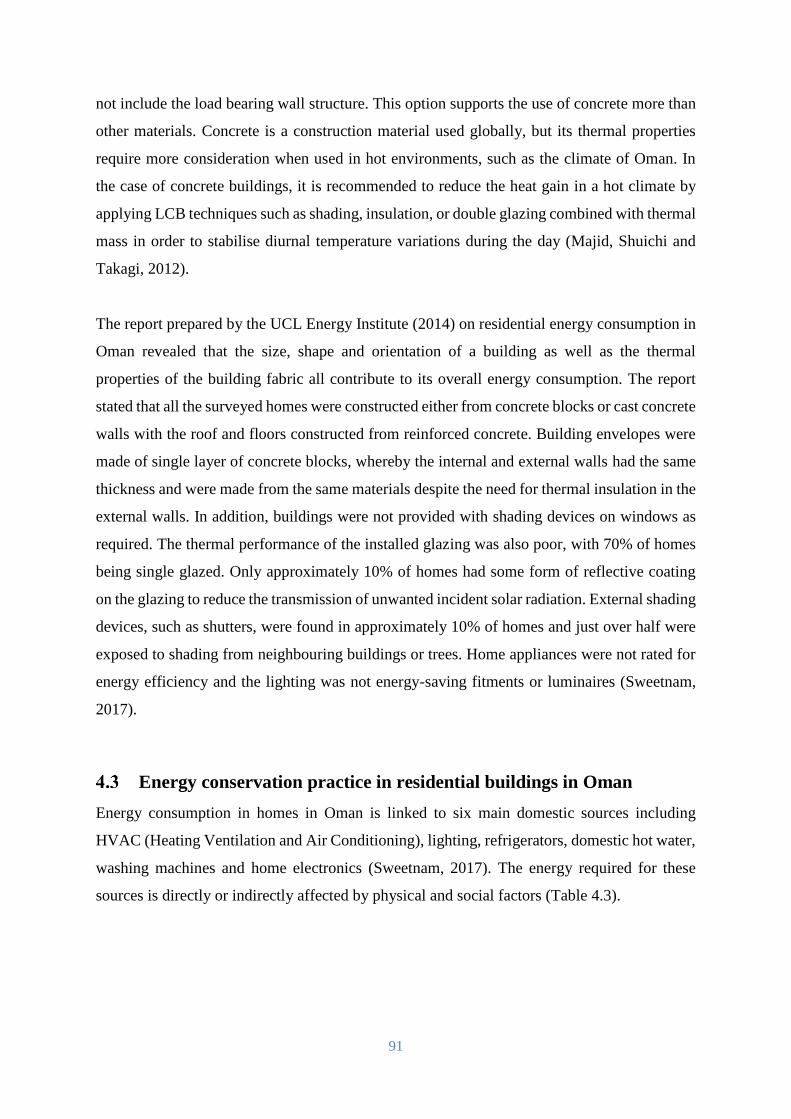
91
not include the load bearing wall structure. This option supports the use of concrete more than
other materials. Concrete is a construction material used globally, but its thermal properties
require more consideration when used in hot environments, such as the climate of Oman. In
the case of concrete buildings, it is recommended to reduce the heat gain in a hot climate by
applying LCB techniques such as shading, insulation, or double glazing combined with thermal
mass in order to stabilise diurnal temperature variations during the day (Majid, Shuichi and
Takagi, 2012).
The report prepared by the UCL Energy Institute (2014) on residential energy consumption in
Oman revealed that the size, shape and orientation of a building as well as the thermal
properties of the building fabric all contribute to its overall energy consumption. The report
stated that all the surveyed homes were constructed either from concrete blocks or cast concrete
walls with the roof and floors constructed from reinforced concrete. Building envelopes were
made of single layer of concrete blocks, whereby the internal and external walls had the same
thickness and were made from the same materials despite the need for thermal insulation in the
external walls. In addition, buildings were not provided with shading devices on windows as
required. The thermal performance of the installed glazing was also poor, with 70% of homes
being single glazed. Only approximately 10% of homes had some form of reflective coating
on the glazing to reduce the transmission of unwanted incident solar radiation. External shading
devices, such as shutters, were found in approximately 10% of homes and just over half were
exposed to shading from neighbouring buildings or trees. Home appliances were not rated for
energy efficiency and the lighting was not energy-saving fitments or luminaires (Sweetnam,
2017).
Energy conservation practice in residential buildings in Oman
Energy consumption in homes in Oman is linked to six main domestic sources including
HVAC (Heating Ventilation and Air Conditioning), lighting, refrigerators, domestic hot water,
washing machines and home electronics (Sweetnam, 2017). The energy required for these
sources is directly or indirectly affected by physical and social factors (Table 4.3).
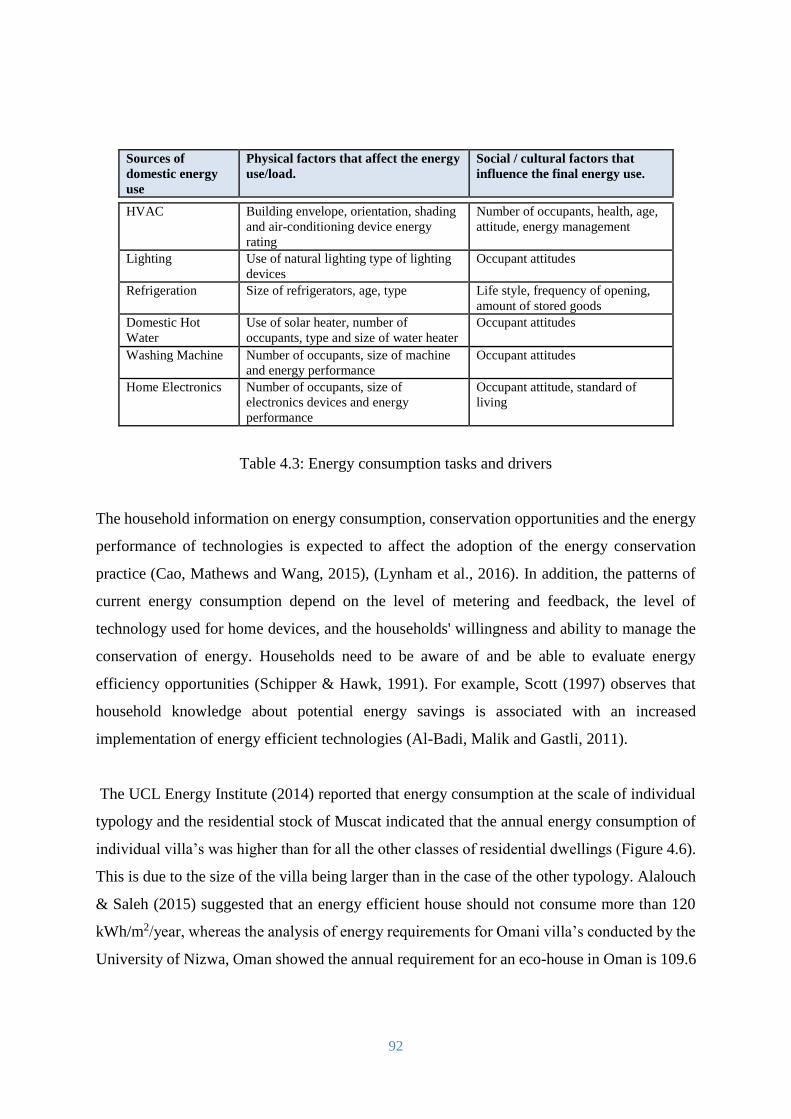
92
Sources of
domestic energy
use
Physical factors that affect the energy
use/load.
Social / cultural factors that
influence the final energy use.
HVAC Building envelope, orientation, shading
and air-conditioning device energy
rating
Number of occupants, health, age,
attitude, energy management
Lighting Use of natural lighting type of lighting
devices
Occupant attitudes
Refrigeration Size of refrigerators, age, type Life style, frequency of opening,
amount of stored goods
Domestic Hot
Water
Use of solar heater, number of
occupants, type and size of water heater
Occupant attitudes
Washing Machine Number of occupants, size of machine
and energy performance
Occupant attitudes
Home Electronics Number of occupants, size of
electronics devices and energy
performance
Occupant attitude, standard of
living
Table 4.3: Energy consumption tasks and drivers
The household information on energy consumption, conservation opportunities and the energy
performance of technologies is expected to affect the adoption of the energy conservation
practice (Cao, Mathews and Wang, 2015), (Lynham et al., 2016). In addition, the patterns of
current energy consumption depend on the level of metering and feedback, the level of
technology used for home devices, and the households' willingness and ability to manage the
conservation of energy. Households need to be aware of and be able to evaluate energy
efficiency opportunities (Schipper & Hawk, 1991). For example, Scott (1997) observes that
household knowledge about potential energy savings is associated with an increased
implementation of energy efficient technologies (Al-Badi, Malik and Gastli, 2011).
The UCL Energy Institute (2014) reported that energy consumption at the scale of individual
typology and the residential stock of Muscat indicated that the annual energy consumption of
individual villa’s was higher than for all the other classes of residential dwellings (Figure 4.6).
This is due to the size of the villa being larger than in the case of the other typology. Alalouch
& Saleh (2015) suggested that an energy efficient house should not consume more than 120
kWh/m2/year, whereas the analysis of energy requirements for Omani villa’s conducted by the
University of Nizwa, Oman showed the annual requirement for an eco-house in Oman is 109.6
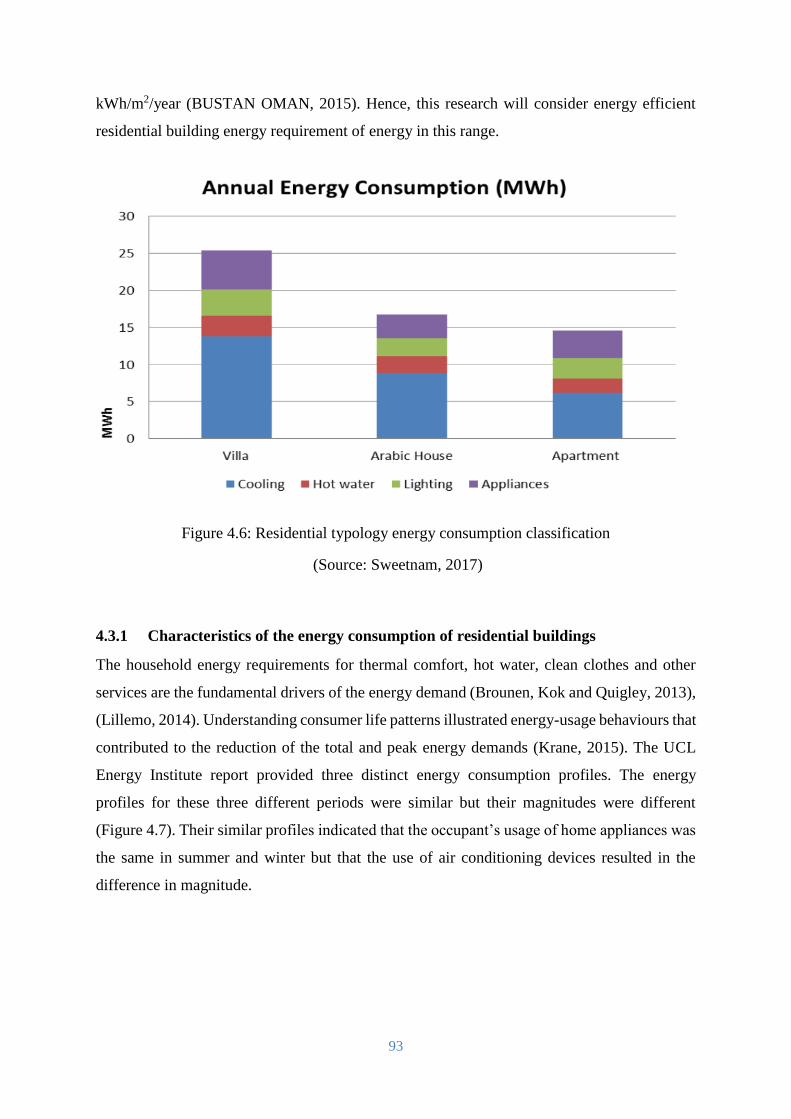
93
kWh/m2/year (BUSTAN OMAN, 2015). Hence, this research will consider energy efficient
residential building energy requirement of energy in this range.
Figure 4.6: Residential typology energy consumption classification
(Source: Sweetnam, 2017)
4.3.1 Characteristics of the energy consumption of residential buildings
The household energy requirements for thermal comfort, hot water, clean clothes and other
services are the fundamental drivers of the energy demand (Brounen, Kok and Quigley, 2013),
(Lillemo, 2014). Understanding consumer life patterns illustrated energy-usage behaviours that
contributed to the reduction of the total and peak energy demands (Krane, 2015). The UCL
Energy Institute report provided three distinct energy consumption profiles. The energy
profiles for these three different periods were similar but their magnitudes were different
(Figure 4.7). Their similar profiles indicated that the occupant’s usage of home appliances was
the same in summer and winter but that the use of air conditioning devices resulted in the
difference in magnitude.
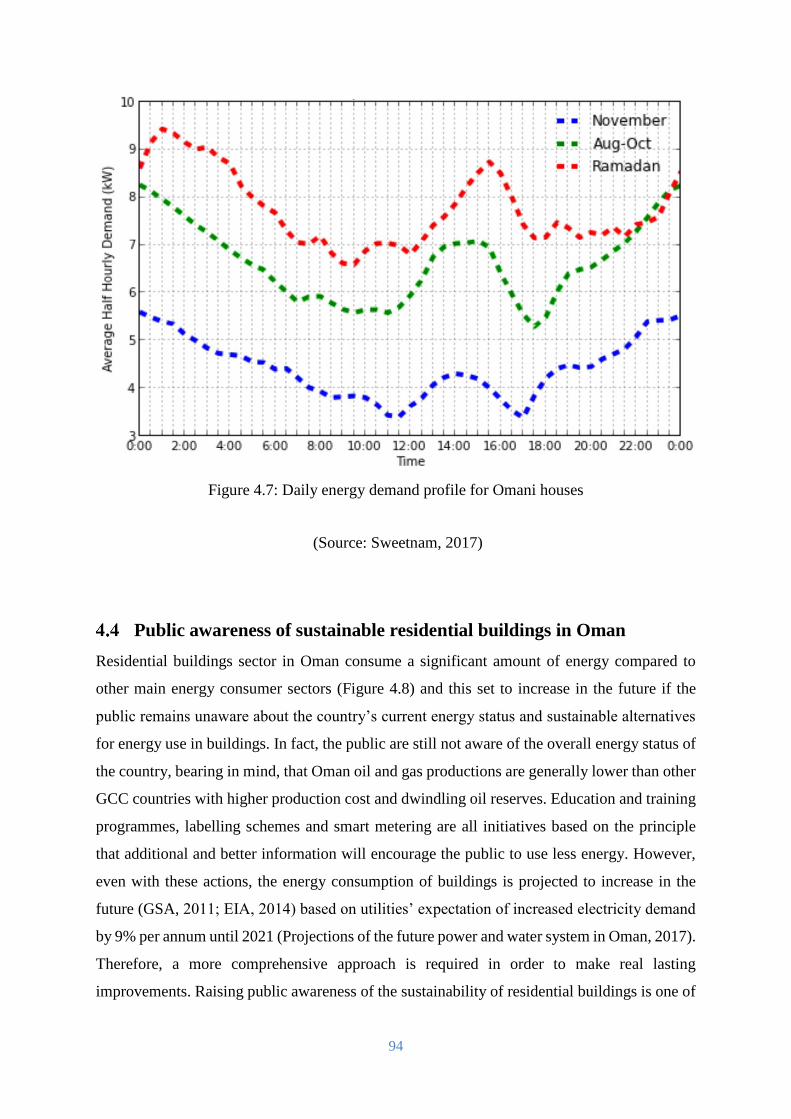
94
Figure 4.7: Daily energy demand profile for Omani houses
(Source: Sweetnam, 2017)
Public awareness of sustainable residential buildings in Oman
Residential buildings sector in Oman consume a significant amount of energy compared to
other main energy consumer sectors (Figure 4.8) and this set to increase in the future if the
public remains unaware about the country’s current energy status and sustainable alternatives
for energy use in buildings. In fact, the public are still not aware of the overall energy status of
the country, bearing in mind, that Oman oil and gas productions are generally lower than other
GCC countries with higher production cost and dwindling oil reserves. Education and training
programmes, labelling schemes and smart metering are all initiatives based on the principle
that additional and better information will encourage the public to use less energy. However,
even with these actions, the energy consumption of buildings is projected to increase in the
future (GSA, 2011; EIA, 2014) based on utilities’ expectation of increased electricity demand
by 9% per annum until 2021 (Projections of the future power and water system in Oman, 2017).
Therefore, a more comprehensive approach is required in order to make real lasting
improvements. Raising public awareness of the sustainability of residential buildings is one of
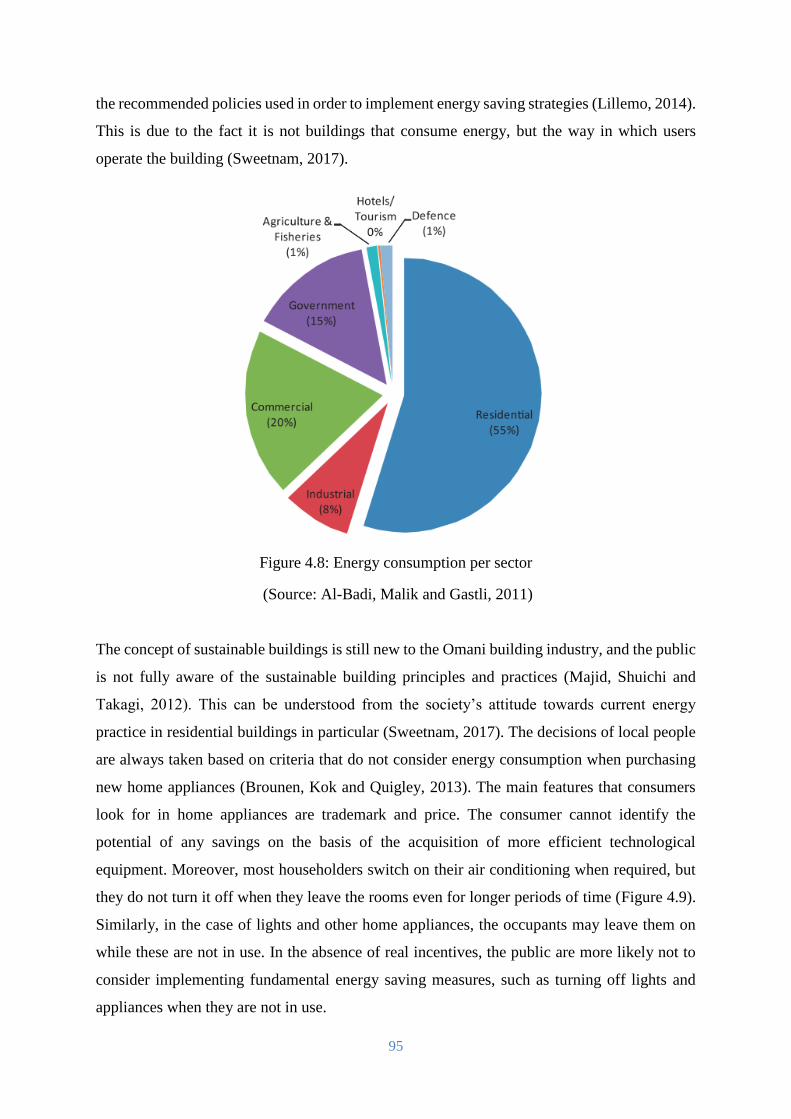
95
the recommended policies used in order to implement energy saving strategies (Lillemo, 2014).
This is due to the fact it is not buildings that consume energy, but the way in which users
operate the building (Sweetnam, 2017).
Figure 4.8: Energy consumption per sector
(Source: Al-Badi, Malik and Gastli, 2011)
The concept of sustainable buildings is still new to the Omani building industry, and the public
is not fully aware of the sustainable building principles and practices (Majid, Shuichi and
Takagi, 2012). This can be understood from the society’s attitude towards current energy
practice in residential buildings in particular (Sweetnam, 2017). The decisions of local people
are always taken based on criteria that do not consider energy consumption when purchasing
new home appliances (Brounen, Kok and Quigley, 2013). The main features that consumers
look for in home appliances are trademark and price. The consumer cannot identify the
potential of any savings on the basis of the acquisition of more efficient technological
equipment. Moreover, most householders switch on their air conditioning when required, but
they do not turn it off when they leave the rooms even for longer periods of time (Figure 4.9).
Similarly, in the case of lights and other home appliances, the occupants may leave them on
while these are not in use. In the absence of real incentives, the public are more likely not to
consider implementing fundamental energy saving measures, such as turning off lights and
appliances when they are not in use.
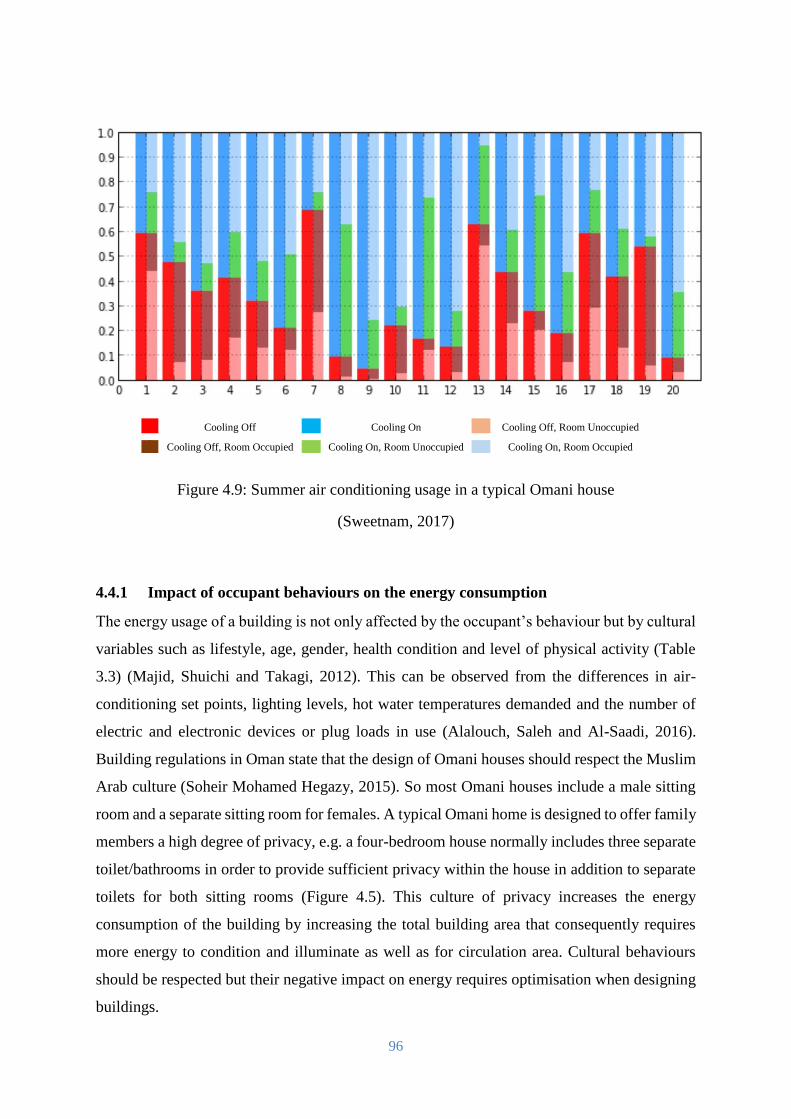
96
Cooling Off Cooling On Cooling Off, Room Unoccupied
Cooling Off, Room Occupied Cooling On, Room Unoccupied Cooling On, Room Occupied
Figure 4.9: Summer air conditioning usage in a typical Omani house
(Sweetnam, 2017)
4.4.1 Impact of occupant behaviours on the energy consumption
The energy usage of a building is not only affected by the occupant’s behaviour but by cultural
variables such as lifestyle, age, gender, health condition and level of physical activity (Table
3.3) (Majid, Shuichi and Takagi, 2012). This can be observed from the differences in air-
conditioning set points, lighting levels, hot water temperatures demanded and the number of
electric and electronic devices or plug loads in use (Alalouch, Saleh and Al-Saadi, 2016).
Building regulations in Oman state that the design of Omani houses should respect the Muslim
Arab culture (Soheir Mohamed Hegazy, 2015). So most Omani houses include a male sitting
room and a separate sitting room for females. A typical Omani home is designed to offer family
members a high degree of privacy, e.g. a four-bedroom house normally includes three separate
toilet/bathrooms in order to provide sufficient privacy within the house in addition to separate
toilets for both sitting rooms (Figure 4.5). This culture of privacy increases the energy
consumption of the building by increasing the total building area that consequently requires
more energy to condition and illuminate as well as for circulation area. Cultural behaviours
should be respected but their negative impact on energy requires optimisation when designing
buildings.
97
4.4.2 Occupant comfort and well-being requirements
The discipline of well-being or thermal comfort pertains to the notion of a comfortable
environment (Fabbri, 2015). This concept became widely used in the twentieth century after it
became possible to directly control the microclimate of the indoor spaces (Fabbri, 2015). Since
the HVAC system is the largest single energy user in Omani dwellings occupant comfort and
wellbeing in the house affects the energy usage behaviours and influences the total and peak
energy demand.
ASHRAE Standard 55 states that comfort is the condition of mind that expresses satisfaction
with the thermal environment assessed by subjective evaluation (ASHRAE 2004). The
ANSI/ASHRAE standard 55 sought to assist the industry and the public by offering a uniform
method for testing and evaluating thermal comfort for rating purposes. The standard specifies
“acceptable conditions by the majority of a group of occupants exposed to the same conditions
within a space” (Olesen & Brager, 2004). The “majority” is in this instance was defined by an
80% overall acceptability, whereas the specific discomfort limits vary for different sources of
local discomfort. The acceptable range for indoor temperature are defined by the indoor
operative temperature and mean monthly outdoor air temperature. They are based on the
comfort equation for naturally conditioned buildings derived from ASHRAE RP884:
Tcomf = a Tout + b Eq. 3.1
Energy efficiency of building refer to its ability to operate with minimum energy consumption,
and if comfort is a prerequisite for human, then building need to provide required degree of
comfort with less energy use. Understanding and influencing occupant behaviour has the
potential to deliver cost effective energy savings.
Future trends in building energy consumption in Oman
No energy conservation practice exists in the country and the demand for electricity is
increasing and the main indicators for this increase are listed as follows:
The annual energy consumption is growing faster than the population (9% vs. 1.4%)
(Oman energy report, 2013). The energy consumption per capita has increased by
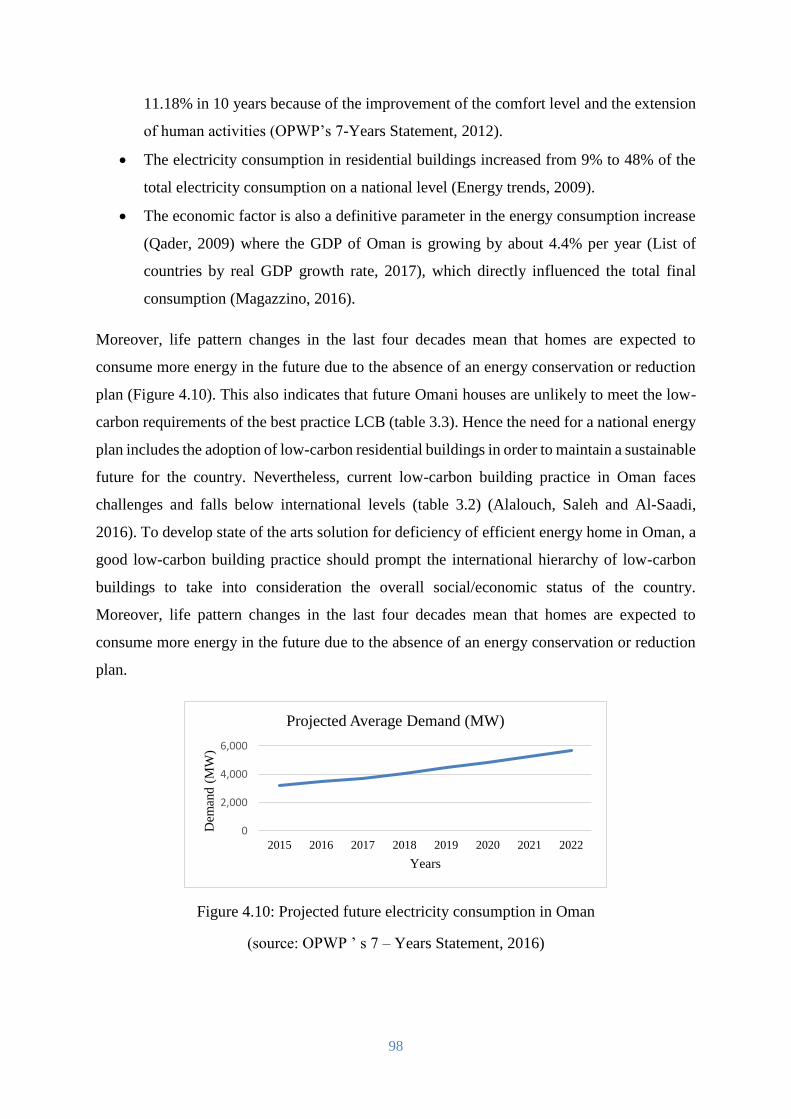
98
11.18% in 10 years because of the improvement of the comfort level and the extension
of human activities (OPWP’s 7-Years Statement, 2012).
The electricity consumption in residential buildings increased from 9% to 48% of the
total electricity consumption on a national level (Energy trends, 2009).
The economic factor is also a definitive parameter in the energy consumption increase
(Qader, 2009) where the GDP of Oman is growing by about 4.4% per year (List of
countries by real GDP growth rate, 2017), which directly influenced the total final
consumption (Magazzino, 2016).
Moreover, life pattern changes in the last four decades mean that homes are expected to
consume more energy in the future due to the absence of an energy conservation or reduction
plan (Figure 4.10). This also indicates that future Omani houses are unlikely to meet the low-
carbon requirements of the best practice LCB (table 3.3). Hence the need for a national energy
plan includes the adoption of low-carbon residential buildings in order to maintain a sustainable
future for the country. Nevertheless, current low-carbon building practice in Oman faces
challenges and falls below international levels (table 3.2) (Alalouch, Saleh and Al-Saadi,
2016). To develop state of the arts solution for deficiency of efficient energy home in Oman, a
good low-carbon building practice should prompt the international hierarchy of low-carbon
buildings to take into consideration the overall social/economic status of the country.
Moreover, life pattern changes in the last four decades mean that homes are expected to
consume more energy in the future due to the absence of an energy conservation or reduction
plan.
Figure 4.10: Projected future electricity consumption in Oman
(source: OPWP ’ s 7 – Years Statement, 2016)
0
2,000
4,000
6,000
2015 2016 2017 2018 2019 2020 2021 2022
Dem
and
(M
W)
Years
Projected Average Demand (MW)
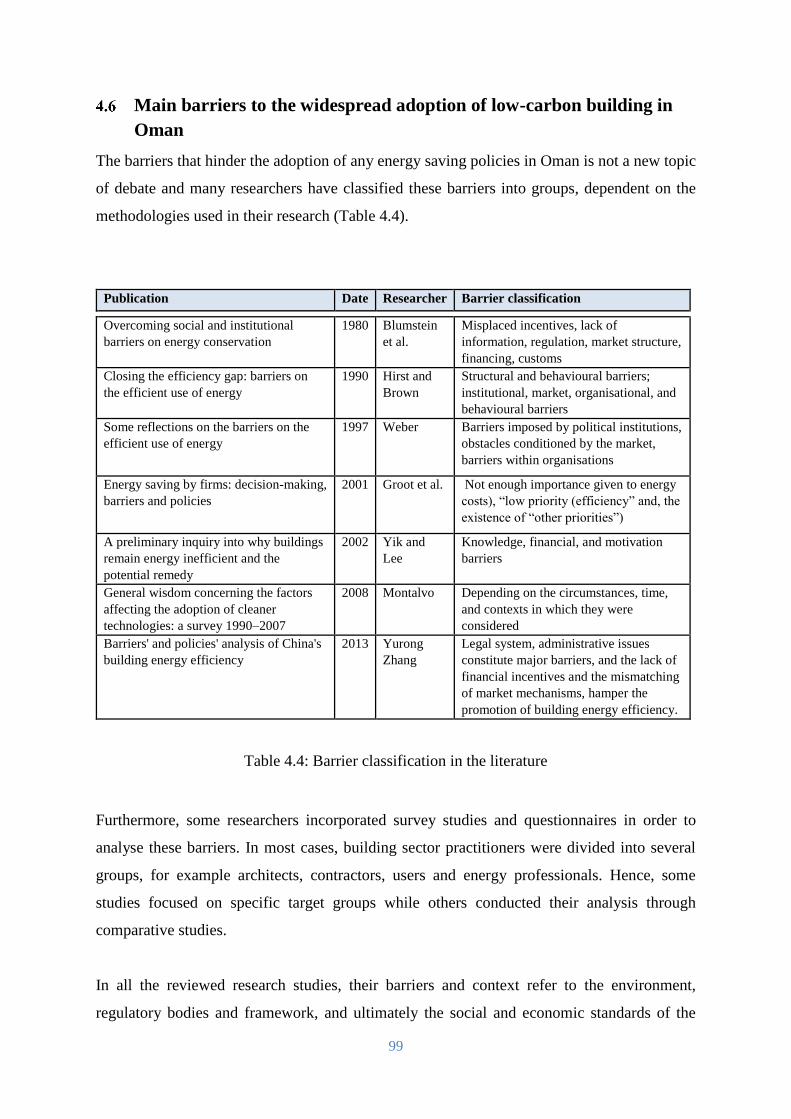
99
Main barriers to the widespread adoption of low-carbon building in
Oman
The barriers that hinder the adoption of any energy saving policies in Oman is not a new topic
of debate and many researchers have classified these barriers into groups, dependent on the
methodologies used in their research (Table 4.4).
Publication Date Researcher Barrier classification
Overcoming social and institutional
barriers on energy conservation
1980 Blumstein
et al.
Misplaced incentives, lack of
information, regulation, market structure,
financing, customs
Closing the efficiency gap: barriers on
the efficient use of energy
1990 Hirst and
Brown
Structural and behavioural barriers;
institutional, market, organisational, and
behavioural barriers
Some reflections on the barriers on the
efficient use of energy
1997 Weber Barriers imposed by political institutions,
obstacles conditioned by the market,
barriers within organisations
Energy saving by firms: decision-making,
barriers and policies
2001 Groot et al. Not enough importance given to energy
costs), “low priority (efficiency” and, the
existence of “other priorities”)
A preliminary inquiry into why buildings
remain energy inefficient and the
potential remedy
2002 Yik and
Lee
Knowledge, financial, and motivation
barriers
General wisdom concerning the factors
affecting the adoption of cleaner
technologies: a survey 1990–2007
2008 Montalvo Depending on the circumstances, time,
and contexts in which they were
considered
Barriers' and policies' analysis of China's
building energy efficiency
2013 Yurong
Zhang
Legal system, administrative issues
constitute major barriers, and the lack of
financial incentives and the mismatching
of market mechanisms, hamper the
promotion of building energy efficiency.
Table 4.4: Barrier classification in the literature
Furthermore, some researchers incorporated survey studies and questionnaires in order to
analyse these barriers. In most cases, building sector practitioners were divided into several
groups, for example architects, contractors, users and energy professionals. Hence, some
studies focused on specific target groups while others conducted their analysis through
comparative studies.
In all the reviewed research studies, their barriers and context refer to the environment,
regulatory bodies and framework, and ultimately the social and economic standards of the
100
country. Based on this, and the nature of Oman, the barriers preventing the widespread adoption
of low-carbon buildings in Oman can be classified into the following groups: -
Environmental: Including current weather conditions and impact of climate change on
energy use of future buildings.
Social and cultural: Including the existence of social and institutional structures that
limit the dissemination and cultural incorporation of this practice.
Limited awareness of energy saving including public participation.
Economic barriers: Such as lack of available LCB technologies, funding or financing
difficulties and limited support.
Limited government and technical drivers: Including the absence of rules,
regulations and guidance documentation, limited policy framework and strategic
planning, funding or financing difficulties and limited action to exploit renewable
energy sources.
In this context, it is important to emphasise that some barriers are possible to resolve with less
additional cost such as public awareness, while other barriers require substantial changes in
residential building design concept.
4.6.1 Environmental barriers
Environmental barriers including current weather and climate changes, are considered
important barriers against the widespread adoption of low carbon buildings in Oman. Weather
conditions play a major role on building energy usage as heating and cooling energy demands
are directly affected by environmental temperature and humidity. The share of energy
consumption dedicated to achieving thermal comfort criteria (heating and cooling) is
substantial and ranges from 55% to 74%, depending on the climatic region (Santos et al., 2011).
It is well known that providing thermal comfort in hot humid climates such as Muscat (Figure
4.11) is difficult to achieve by natural means and requires mechanical systems to provide the
required range of comfort (Al-Hinai, Batty and Probert, 1993).
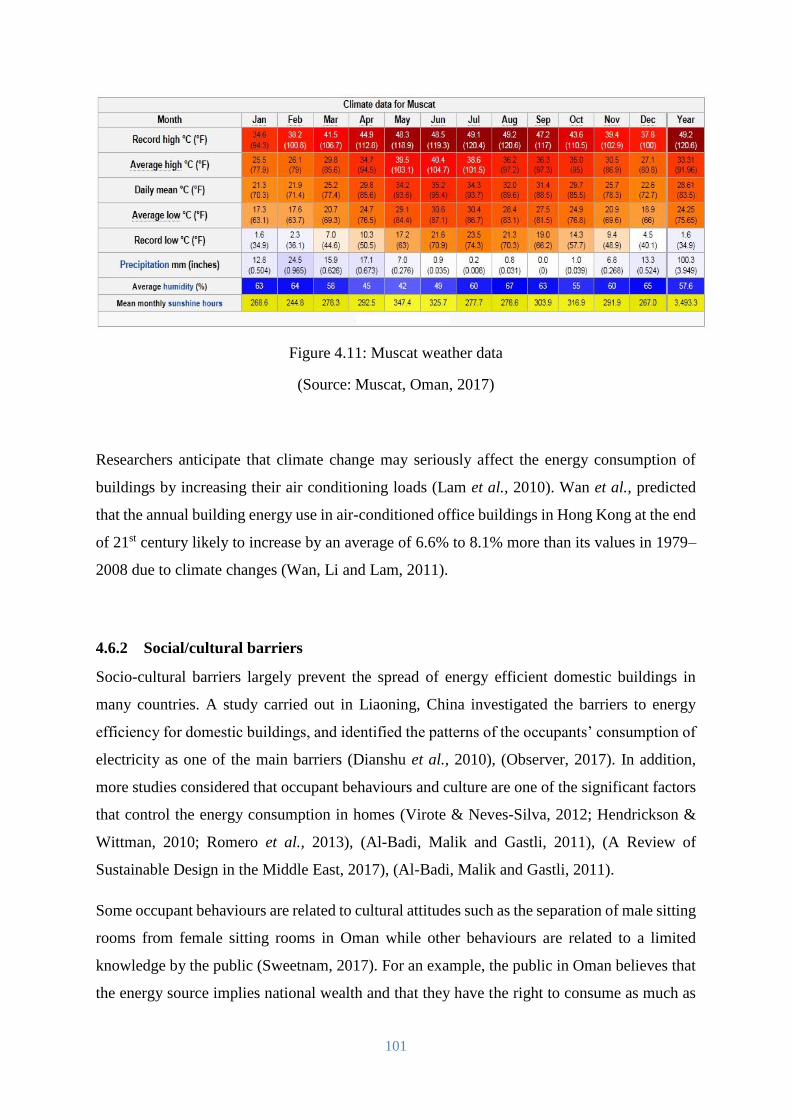
101
Figure 4.11: Muscat weather data
(Source: Muscat, Oman, 2017)
Researchers anticipate that climate change may seriously affect the energy consumption of
buildings by increasing their air conditioning loads (Lam et al., 2010). Wan et al., predicted
that the annual building energy use in air-conditioned office buildings in Hong Kong at the end
of 21st century likely to increase by an average of 6.6% to 8.1% more than its values in 1979–
2008 due to climate changes (Wan, Li and Lam, 2011).
4.6.2 Social/cultural barriers
Socio-cultural barriers largely prevent the spread of energy efficient domestic buildings in
many countries. A study carried out in Liaoning, China investigated the barriers to energy
efficiency for domestic buildings, and identified the patterns of the occupants’ consumption of
electricity as one of the main barriers (Dianshu et al., 2010), (Observer, 2017). In addition,
more studies considered that occupant behaviours and culture are one of the significant factors
that control the energy consumption in homes (Virote & Neves-Silva, 2012; Hendrickson &
Wittman, 2010; Romero et al., 2013), (Al-Badi, Malik and Gastli, 2011), (A Review of
Sustainable Design in the Middle East, 2017), (Al-Badi, Malik and Gastli, 2011).
Some occupant behaviours are related to cultural attitudes such as the separation of male sitting
rooms from female sitting rooms in Oman while other behaviours are related to a limited
knowledge by the public (Sweetnam, 2017). For an example, the public in Oman believes that
the energy source implies national wealth and that they have the right to consume as much as
102
they need from this source without any restrictions (Qatar Financial Centre (QFC) Authority,
2010). These attitudes lead to a society that pays little or consideration to energy conservation
in residential buildings, that is subsequently reflected in an increased energy demand both now
and in the future (Sweetnam, 2017).
4.6.3 Limited awareness of energy saving and public participation
Public awareness in terms of energy saving in buildings is a substantial factor in implementing
a low-carbon strategy in a country (Huang, Mauerhofer and Geng, 2016). The awareness of the
public will change the occupant’s attitude towards energy conservation in the building.
Consequently, the society will shift from traditional homes to energy efficient buildings (A
Review of Sustainable Design in the Middle East, 2017). Traditional homes are equipped with
appliances that are manually controlled by operating an on-off switch such as traditional
lighting and air-conditioning. These devices have limited controls and managing the energy
use can be difficult. Smart homes allow for the remote electronic control and management of
smart appliances (heaters, air conditioners, washing machines etc.) and demonstrates the
convergence of energy efficient appliances and real-time access to energy usage data,
facilitated by a network of sensors and computers (ITU, 2010). Increasing public knowledge
on energy and cost information will enable building occupants to proactively manage energy
use in a cost effective and environmentally beneficial way. This will require educating the
society on the negative aspects of the excessive use of energy in homes.
4.6.4 Economic Barriers (Financial and cost (marketing)
The cost and market value of a building determine its ability to compete against other options.
The method used to compare building options, in terms of costs, includes the construction price
and the operation costs during the whole life of the building (Motuzienė et al., 2016). The life
cycle cost analysis is an appropriate analytical method for building evaluation that considers
the costs of construction, operation, maintenance and disposal of the building at the end of its
life cycle (Fuller and Petersen, 1996). The National Institute of Standards and Technology
(NIST) Handbook 135, 1995 edition (Cabeza et al., 2014), defines life cycle cost (LCC) as
“the total discounted dollar cost of owning, operating, maintaining, and disposing of a building
or a building system” over a period of time.
103
The main concept of the life cycle cost analysis is to determine the most cost effective option
from different alternatives of projects based on the whole life cycle of the project (Cabeza et
al., 2014), (Fuller and Petersen, 1996). For the life cycle cost of a building, the sum of the
initial value (I) which represents the cost of constructing buildings including design, materials
and home appliances is added to the total cost of energy operation during its life cycle (E),
maintenance (M), minus the salvage value (S).
Life Cycle Cost (LCC) = I + E + M – S Eq. 4.1
In evaluating different construction options for buildings the lower LCC options are more
viable for the building because the higher initial capital costs are eventually recovered by the
significantly reduced annual running costs. However, if the energy cost is low and the cost of
low-carbon technology is high such as in the case of Oman and in most GCC countries, then
the construction of low-carbon buildings will not be economically viable and hence the LCB
option would not be marketed.
4.6.5 Funding or financing difficulties
The sustainable housing concept, in general, includes in its framework rules and regulations
pertaining to the provision of land, urban planning, the construction industry materials, health
systems and financial funding for such housing projects (Akadiri, Chinyio and Olomolaiye,
2012). Due to the nature of Omani economies, a sustainable housing implementation requires
strong support from the public, government and the housing industry (Al-Badi, Malik and
Gastli, 2011). Under these circumstances, governmental support in terms of attracting private
funding is necessary in order to implement green building projects. Financial funds for low-
carbon buildings will reduce the difference in the total cost between energy efficient buildings
and conventional buildings that helps the proliferation of this type of building in the country
and increases their environmental benefits (Alalouch, Saleh and Al-Saadi, 2016). This can be
achieved through the provision of financial or technological support for the use of renewable
energy or through low-interest lending programmes to reduce the high initial cost of this type
of construction (Al-Badi et al., 2009).
104
4.6.6 Limited governmental and technical drivers
Many studies have indicated that the regulatory system and environmental assessment
procedures are necessary to construct low-carbon buildings (Kajikawa et al., 2011; Gou and
Lau, 2014). In developed countries, the policies relating to building energy are moving quickly
toward regulatory levels that are close to zero energy. Some developed countries have
established a regulatory target for a zero-net carbon aimed to achieve a substantial reduction of
the overall energy consumption. Building regulations is one policy aspect addressing both
climate change and energy security (Murphy, 2012).
At present, there is an increasing concern in both developing and developed countries, towards
employing building energy regulations and standards in order to minimise the negative impact
of the energy consumption of buildings (Vine, 2003, Iwaro and Mwasha, 2010; Radhi, 2009).
Low-carbon building regulations act as drivers within the construction industry seeking to
reduce the energy consumption of buildings and CO2 emissions. The absence of these laws
indicates that the construction sector is not committed to the implementation of the energy
conservation policy. Currently, there are no such regulatory frameworks in Oman for low-
carbon buildings (Alalouch, Saleh and Al-Saadi, 2016). Hence, most residential buildings lack
the required LCB techniques such as appropriate orientation or shading devices (Alalouch,
Saleh and Al-Saadi, 2016). The building regulations for Muscat focus on building materials,
areas and the dimensions of the rooms (Local Order No. 23/92 Building Regulation for Muscat,
1992). It states that the architectural design of the building should conform to the social norms
of the Arab Muslim families. Privacy within the residential unit should be maintained
regardless of whether the building consists of a single residential unit or multi-floor apartments.
For example, the main entrance should not be exposed or interfere with the privacy and freedom
of the internal movement of the family members inside the house. The boundary walls of any
dwelling, separating two residential units or separating the living room from the guest room
shall not be less than 20 cm thick, in order to prevent and reduce the transmission of sound.
The sizes of the bedrooms should not be less than 12 m2 with the smallest dimension not being
less than 3 m. The regulation does not provide any description of energy performance or any
compulsory action to reduce the energy consumption of the building.
105
4.6.7 Limited policy framework and strategic planning
The government plays a critical role in prompting owners to adopt a low-carbon strategy, as
they will not be comprehensively implemented without government support (Timilsina and
Shah, 2016). In order to secure a sustainable future for the country, governments are
responsible for the national energy strategy. The role of governments is thus to provide the
required legislation and regulations and amend them periodically in order to meet the targets
of a low-carbon home, and more stringently in order to achieve sustainable urbanisation
(Chapman, McLellan and Tezuka, 2016). Strategic planning requires effective policies that
motivate owners to implement a sustainable development. Such a strategy mainly consists of
targets and a comprehensive plan to achieve the goal of this strategy. Research by Abidin and
Powmya (2014), through market survey, identified the lack of governmental incentives is one
of the major barriers in promoting LCB in Oman (Powmya and Zainul Abidin2, 2014).
4.6.8 Low adoption and high cost of LCB technologies & strategies
The number of efficient energy homes in Oman is very low, and this is due to the limited ability
of construction firms, understanding of the public for the need for LCB and absence of support
from the government (Powmya and Zainul Abidin2, 2014), (Alalouch, Saleh and Al-Saadi,
2016). Most construction firms employ small workforces and are limited in their research and
development (R&D) capacity (Saleh and Alalouch, 2015). In Oman, only a few construction
firms are able to deal with new materials and often exploit new construction methodology in
order to reduce the energy consumption of the building to a value that is convenient to the
country’s environment. For example, the five low-carbon buildings studied in this research
were constructed by class (A) contractors (Saleh and Alalouch, 2015). Prominent contractors
in Oman normally do not consider the construction of small projects, such as individual villas,
because of the low margin of profit (Saleh and Alalouch, 2015). Hence, the construction cost
of these five low-carbon buildings was relatively high compared to the construction cost of
conventional residential buildings in Oman. The market survey conducted to identify the
construction cost of reference buildings used in this research shows that the difference in
construction cost of some reference LCB compared to conventional building is more than 100%
(Table 4.5).
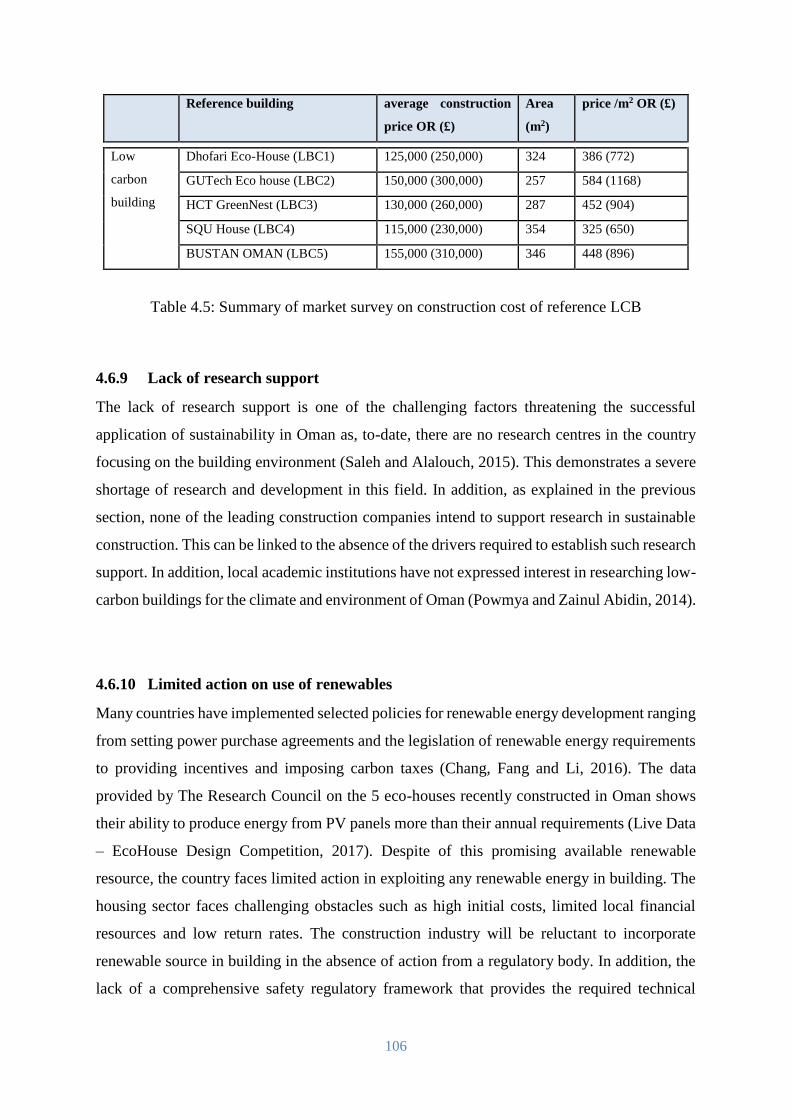
106
Reference building average construction
price OR (£)
Area
(m2)
price /m2 OR (£)
Low
carbon
building
Dhofari Eco-House (LBC1) 125,000 (250,000) 324 386 (772)
GUTech Eco house (LBC2) 150,000 (300,000) 257 584 (1168)
HCT GreenNest (LBC3) 130,000 (260,000) 287 452 (904)
SQU House (LBC4) 115,000 (230,000) 354 325 (650)
BUSTAN OMAN (LBC5) 155,000 (310,000) 346 448 (896)
Table 4.5: Summary of market survey on construction cost of reference LCB
4.6.9 Lack of research support
The lack of research support is one of the challenging factors threatening the successful
application of sustainability in Oman as, to-date, there are no research centres in the country
focusing on the building environment (Saleh and Alalouch, 2015). This demonstrates a severe
shortage of research and development in this field. In addition, as explained in the previous
section, none of the leading construction companies intend to support research in sustainable
construction. This can be linked to the absence of the drivers required to establish such research
support. In addition, local academic institutions have not expressed interest in researching low-
carbon buildings for the climate and environment of Oman (Powmya and Zainul Abidin, 2014).
4.6.10 Limited action on use of renewables
Many countries have implemented selected policies for renewable energy development ranging
from setting power purchase agreements and the legislation of renewable energy requirements
to providing incentives and imposing carbon taxes (Chang, Fang and Li, 2016). The data
provided by The Research Council on the 5 eco-houses recently constructed in Oman shows
their ability to produce energy from PV panels more than their annual requirements (Live Data
– EcoHouse Design Competition, 2017). Despite of this promising available renewable
resource, the country faces limited action in exploiting any renewable energy in building. The
housing sector faces challenging obstacles such as high initial costs, limited local financial
resources and low return rates. The construction industry will be reluctant to incorporate
renewable source in building in the absence of action from a regulatory body. In addition, the
lack of a comprehensive safety regulatory framework that provides the required technical
107
guidance acted as a technical barrier to using new technology. For an example, the 50 kW solar
panels installed on the Majan Electricity Company (MJEC) building recently were removed
for safety reasons (Al Shibli, 2016).
Roadmap for Oman’s low-carbon buildings strategy
A successful energy efficiency policy requires the right incentives from all parties to support
the markets supply chains for the residential buildings sector in order to deliver improvements
in the energy conservation (Chapman, McLellan and Tezuka, 2016). This policy needs to
involve and address the role of each party of the residential household in order to ensure for
the success of the policy objectives. Thus, it is sought to inform policy-makers, energy firms
and civil society actors by showing how different parties could contribute to a low-carbon
energy future (Saleh and Alalouch, 2015).
In terms of reducing building energy consumption, it is important to consider the impact of
possible futures in terms of use and climatic conditions. This initially suggests the identification
of the level of low-carbon practice that the country is aiming to achieve, and solution to the
main obstacles (Table 4.6). Then, a roadmap for Oman’s low-carbon building strategy needs
to be devised in order to maintain energy security, contribute to economic prosperity and ensure
the affordability of energy services. In this regard, the main elements of low-carbon buildings
for the environment of Oman need to be addressed and evaluated in order to determine a
possible target thereof. Based on the assessments of the key elements of the low-carbon that
are technically viable, a master plan for the country can be drafted to include economic
feasibility, social awareness, legislation and technical issues. Therefore, the contribution to
knowledge of this research aims to device a residential building energy template to evaluate
the effectiveness of different techniques and low-carbon building strategies that could lead to
promising results, and highlight the challenges posed for different stakeholders.
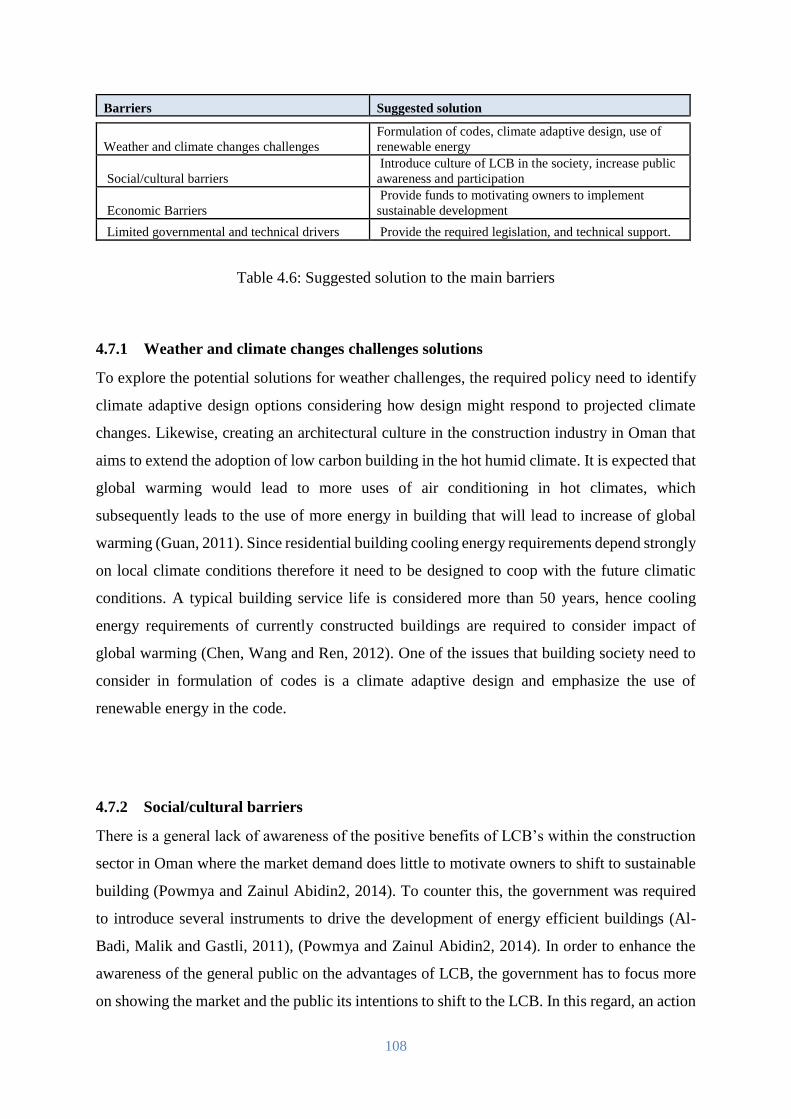
108
Barriers Suggested solution
Weather and climate changes challenges
Formulation of codes, climate adaptive design, use of
renewable energy
Social/cultural barriers
Introduce culture of LCB in the society, increase public
awareness and participation
Economic Barriers
Provide funds to motivating owners to implement
sustainable development
Limited governmental and technical drivers Provide the required legislation, and technical support.
Table 4.6: Suggested solution to the main barriers
4.7.1 Weather and climate changes challenges solutions
To explore the potential solutions for weather challenges, the required policy need to identify
climate adaptive design options considering how design might respond to projected climate
changes. Likewise, creating an architectural culture in the construction industry in Oman that
aims to extend the adoption of low carbon building in the hot humid climate. It is expected that
global warming would lead to more uses of air conditioning in hot climates, which
subsequently leads to the use of more energy in building that will lead to increase of global
warming (Guan, 2011). Since residential building cooling energy requirements depend strongly
on local climate conditions therefore it need to be designed to coop with the future climatic
conditions. A typical building service life is considered more than 50 years, hence cooling
energy requirements of currently constructed buildings are required to consider impact of
global warming (Chen, Wang and Ren, 2012). One of the issues that building society need to
consider in formulation of codes is a climate adaptive design and emphasize the use of
renewable energy in the code.
4.7.2 Social/cultural barriers
There is a general lack of awareness of the positive benefits of LCB’s within the construction
sector in Oman where the market demand does little to motivate owners to shift to sustainable
building (Powmya and Zainul Abidin2, 2014). To counter this, the government was required
to introduce several instruments to drive the development of energy efficient buildings (Al-
Badi, Malik and Gastli, 2011), (Powmya and Zainul Abidin2, 2014). In order to enhance the
awareness of the general public on the advantages of LCB, the government has to focus more
on showing the market and the public its intentions to shift to the LCB. In this regard, an action
109
plan is needed to create local low-carbon community service building exemplars that are used
daily by the public such as mosques and schools. Currently the society is not fully aware of
successful low carbon technologies on Oman, hence, creating low carbon community buildings
is expected to encourage the private developer of residential projects to respect government
decisions and consider low energy building alternatives. Public education and awareness are
recognised as the most promising approach to conserve energy base on people decisions to
protect the environment (Suryawanshi and Jumle, 2016). Hence, this will be another initiative
can be carried out in this regard by raising the level of awareness in terms of sustainability in
schools and universities. On the other hand, providing training workshops for the construction
sector will improve market awareness (Energy Efficiency in Buildings Workshop, 2011).
4.7.3 Economic feasibility
Economic feasibility is the most critical factor and it is positively correlated with the adoption
of a low-carbon strategy from the owner's perspective. This is consistent with the studies
conducted in China regarding the effects of additional costs as the most significant barrier to
green construction from the owner's perspective (Liu et al., 2012; Shi et al., 2013.). The
additional costs of constructing a LCB over traditional buildings in Oman are mainly due to
technologies and materials that are not available in the local market. In Oman, the cost of the
currently available LCB options ranged from 325 OR to 484 OR per m2, whereas traditional
residential buildings may cost from 140 OR to 350 OR per m2 (Economic Studies & Working
Papers, 2017). This leads to a difference in prices between the two options of more than 100%,
whereas Liu (2015) stated that the initial cost will increase 5% - 10% (Liu, 2015). This presents
a major challenge for the use of related technologies and materials during the current rapid
urbanisation. Therefore, the financial incentive policies provided by the government can
alleviate the issues of higher initial investments. The Omani government has provided subsidies
on energy prices especially for the residential sector. Currently, the amount of subsidies
provided by the government for the electricity sector, which in the case of residential buildings
their main consumption is estimated to be 67% of the cost of tariff (Al Aufi, 2016). In 2015,
the support on electricity prices was OR 450 million (£ 900 million), however, this figure did
not include everything, as the government sells the natural gas used to generate electricity at a
subsidised price as well (Al Aufi, 2016). If this fund was directed to support the effectiveness
of policies in terms of motivating owners to implement sustainable development, the latter will
110
reduce the energy consumption of the building, and subsequently the amount of subsidies
required for electricity in the future.
It is therefore, worth considering this subsidies for certified green buildings or for
implementing low-carbon building technologies in order to support the prices of low-carbon
building compared to conventional buildings. Another considerable measure can be used to
overcome the poor economic visibility of the LCB in Oman by introducing a bilateral
electricity market such as a bought in tariff where any extra energy generated by the building
can be fed to the utility grid while the building owner receives financial returns. This will
decrease the life cycle cost of low-carbon buildings and will increase the adoption of renewable
energy (Saleh and Alalouch, 2015).
4.7.4 Limited governmental and technical drivers
The laws on energy conservation in buildings act as an effective instrument to encourage the
construction industry to adopt low-carbon technologies in buildings (Powmya and Zainul
Abidin2, 2014). The absence of these codes in Oman is one of the main reasons that led to the
low prevalence of energy efficient buildings (Powmya and Zainul Abidin2, 2014). Therefore,
in order to address this, the government should enact legislation and laws that incentivise the
construction sector to follow low building energy policies. In this context, the government will
need to determine the necessary specifications for low-carbon buildings that may be used to
inform building laws in line with the distinctive elements of Oman. These laws include
standards for the classification of green buildings, codes for the use of clean energy, laws for
the quality of building materials and any other required legislation. Thereafter, these
legislations should be revised periodically (Saleh and Alalouch, 2015).
Further, the comprehensive national plan for Oman needs to consider the necessary technical
requirements for the transformation of the construction sector to a low energy construction
industry. Currently, there is a lack of local market experience in the technology required for
low-carbon buildings. For example, there are only five companies available for installing PV
panels for buildings located in Muscat only.
111
Chapter summary
This research found that the factors leading to the non-adoption of low-carbon buildings in the
Sultanate of Oman are correlated to the culture of the local society, the absence of appropriate
government initiatives and support, the poor construction ability of the local construction sector
and marketing difficulties due to higher initial costs that discouraged the construction sector
from going further in this direction.
The culture of Omani society does not promote the idea of energy efficiency in residential
buildings. This is clearly illustrated by the general social practices in the use of energy and the
lack of interest in energy conservation. In addition, the role of the government in this area is
almost absent due to the failure to create required laws or to provide the necessary financial
support. The local market does not have the necessary technical ability or motivation to adopt
a low building energy policy. The market is subjected to the commercial viability of supply
and demand hence, if the demand for this type of construction remains low, the market will not
consider the option.
In order to address this problem, the country requires an effective and comprehensive national
energy plan that involves all concerned stakeholders. This plan should seek to raise the
awareness of the society and the market, improving the economic viability of such low carbon
buildings, introducing effective initiatives in order to support this trend and provide a
regulatory framework in the form of codes and standards. However, before proceeding in this
direction, the Sultanate must specify and practically examine the main elements of low-carbon
construction in the environment of Oman for energy benchmarking. Hence, the next parts of
this research will focus on this issue through the development of criteria for a residential
building energy template for the Sultanate of Oman and similar environments.
112
Domestic building energy systems in Oman
Introduction
Understanding the key attributes of low carbon building is essential for developing low carbon
strategies for a given climate. Climatic conditions are one of the main factors which directly
affect the energy performance of buildings (Dhaka, Mathur & Garg, 2013). Multiple research
approaches, including building energy monitoring and mathematical methods have been
applied at associated stages of this chapter in order to provide the required theory and methods
for the next chapters. In this respect, this chapter provided an illustration of the energy flow
and end user consumption of energy in residential buildings by identifying the main home tasks
and their associated energy usage. Then, a building energy system was established for
evaluating the energy consumption of residential buildings for energy benchmarking.
Furthermore, the building energy sub-system and parameter controlling demands were
analysed for each home energy task. In addition, the building energy reduction measures for
low carbon strategies in the hot humid climate were reviewed and the building energy profile
for the energy diagnostic and energy strategy application was analysed through a case study.
Finally, the key attributes for the low carbon guideline design for the hot humid climate were
listed. The conclusions of the analysis determined by this chapter will be used in order to device
criteria for the low carbon building template in the selected climatic zone.
Building energy system
The energy flow in buildings is needed as the basis for the energy management and analysis
for the conservation policy (Nazari, Kazemi & Hashem, 2015). In this research, the analysis
was performed by quantifying the energy flows with the interior of the building starting with
the energy supply stage. This is often referred to as supplied energy or delivered energy.
Supplied energy refers to the energy supplied from the utility company (Santamouris, 2005),
while the energy losses due to the generation of energy from primary resources and the
transportation of energy to the building are not accounted for in this analysis (Figure 5.1). In
addition, in this research, the analysis of the building energy consumption included the
renewable energy generated within the building site. The combination of these two sources
together with their consumption and usage by the end consumer in the building will be referred
to as the residential building energy system (Figure 5.1).
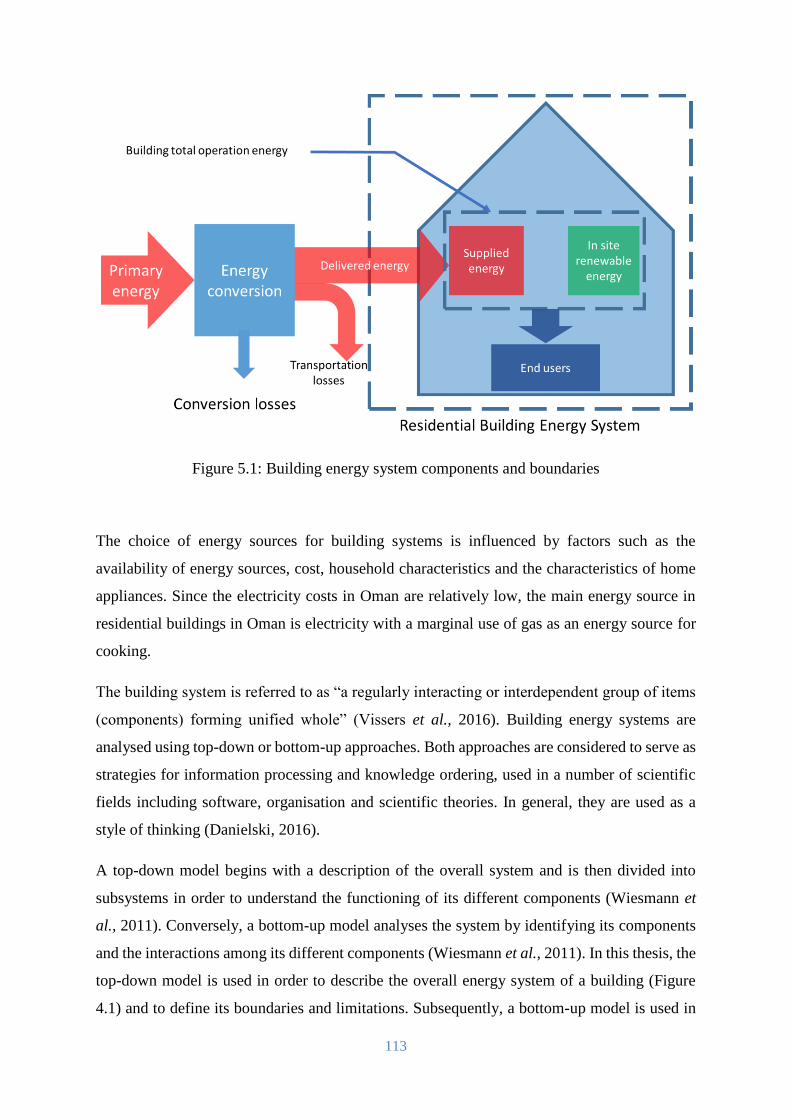
113
Figure 5.1: Building energy system components and boundaries
The choice of energy sources for building systems is influenced by factors such as the
availability of energy sources, cost, household characteristics and the characteristics of home
appliances. Since the electricity costs in Oman are relatively low, the main energy source in
residential buildings in Oman is electricity with a marginal use of gas as an energy source for
cooking.
The building system is referred to as “a regularly interacting or interdependent group of items
(components) forming unified whole” (Vissers et al., 2016). Building energy systems are
analysed using top-down or bottom-up approaches. Both approaches are considered to serve as
strategies for information processing and knowledge ordering, used in a number of scientific
fields including software, organisation and scientific theories. In general, they are used as a
style of thinking (Danielski, 2016).
A top-down model begins with a description of the overall system and is then divided into
subsystems in order to understand the functioning of its different components (Wiesmann et
al., 2011). Conversely, a bottom-up model analyses the system by identifying its components
and the interactions among its different components (Wiesmann et al., 2011). In this thesis, the
top-down model is used in order to describe the overall energy system of a building (Figure
4.1) and to define its boundaries and limitations. Subsequently, a bottom-up model is used in
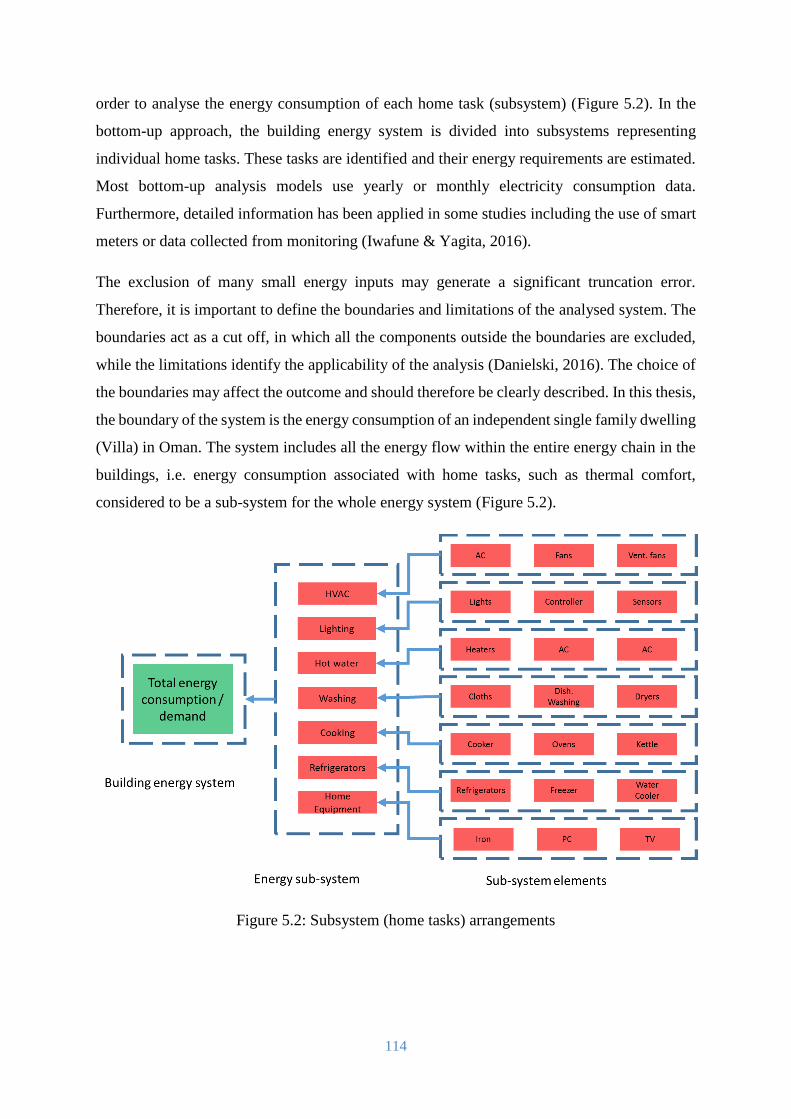
114
order to analyse the energy consumption of each home task (subsystem) (Figure 5.2). In the
bottom-up approach, the building energy system is divided into subsystems representing
individual home tasks. These tasks are identified and their energy requirements are estimated.
Most bottom-up analysis models use yearly or monthly electricity consumption data.
Furthermore, detailed information has been applied in some studies including the use of smart
meters or data collected from monitoring (Iwafune & Yagita, 2016).
The exclusion of many small energy inputs may generate a significant truncation error.
Therefore, it is important to define the boundaries and limitations of the analysed system. The
boundaries act as a cut off, in which all the components outside the boundaries are excluded,
while the limitations identify the applicability of the analysis (Danielski, 2016). The choice of
the boundaries may affect the outcome and should therefore be clearly described. In this thesis,
the boundary of the system is the energy consumption of an independent single family dwelling
(Villa) in Oman. The system includes all the energy flow within the entire energy chain in the
buildings, i.e. energy consumption associated with home tasks, such as thermal comfort,
considered to be a sub-system for the whole energy system (Figure 5.2).
Figure 5.2: Subsystem (home tasks) arrangements
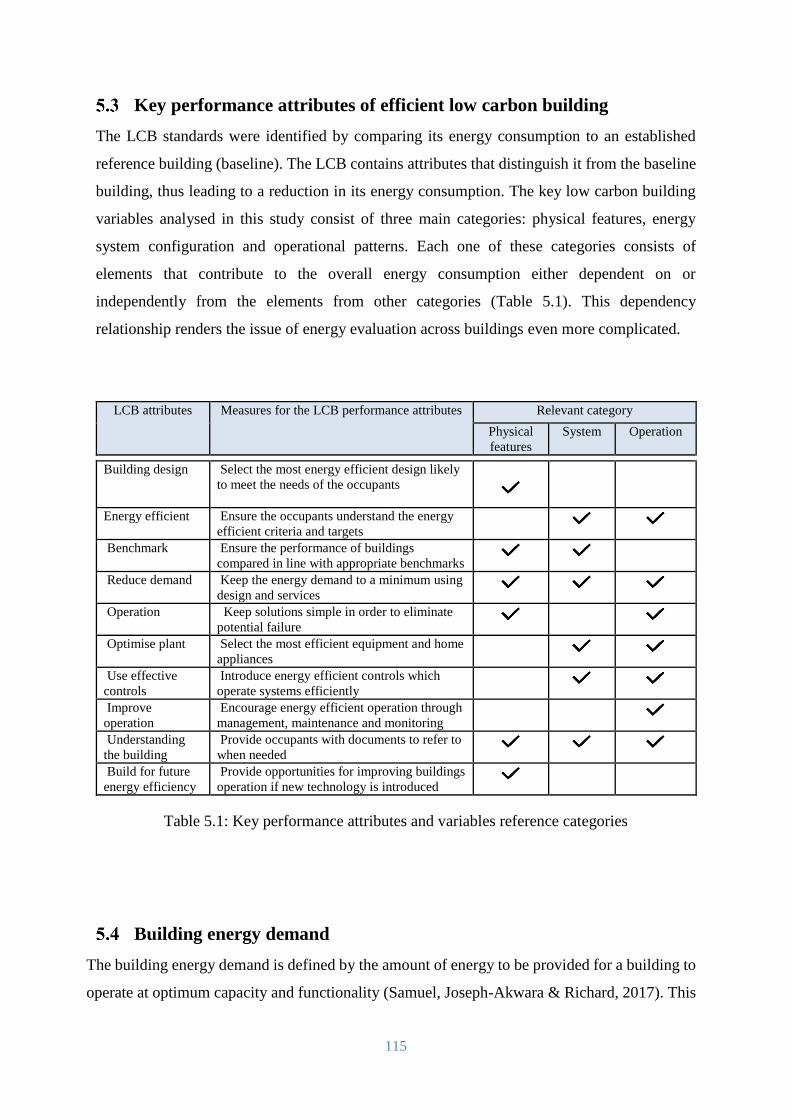
115
Key performance attributes of efficient low carbon building
The LCB standards were identified by comparing its energy consumption to an established
reference building (baseline). The LCB contains attributes that distinguish it from the baseline
building, thus leading to a reduction in its energy consumption. The key low carbon building
variables analysed in this study consist of three main categories: physical features, energy
system configuration and operational patterns. Each one of these categories consists of
elements that contribute to the overall energy consumption either dependent on or
independently from the elements from other categories (Table 5.1). This dependency
relationship renders the issue of energy evaluation across buildings even more complicated.
LCB attributes Measures for the LCB performance attributes Relevant category
Physical
features System Operation
Building design Select the most energy efficient design likely
to meet the needs of the occupants
Energy efficient Ensure the occupants understand the energy
efficient criteria and targets
Benchmark Ensure the performance of buildings
compared in line with appropriate benchmarks
Reduce demand Keep the energy demand to a minimum using
design and services
Operation Keep solutions simple in order to eliminate
potential failure
Optimise plant Select the most efficient equipment and home
appliances
Use effective
controls
Introduce energy efficient controls which
operate systems efficiently
Improve
operation
Encourage energy efficient operation through
management, maintenance and monitoring
Understanding
the building
Provide occupants with documents to refer to
when needed
Build for future
energy efficiency
Provide opportunities for improving buildings
operation if new technology is introduced
Table 5.1: Key performance attributes and variables reference categories
Building energy demand
The building energy demand is defined by the amount of energy to be provided for a building to
operate at optimum capacity and functionality (Samuel, Joseph-Akwara & Richard, 2017). This
116
requires estimating the amount of energy required and equating the energy demand of buildings
to conducive living environments for the occupants. The calculated energy demand includes
energy losses such as heat losses within the building envelope (Schlueter & Thesseling, 2009).
Researchers proposed various methods for the evaluation of buildings’ energy including:
1. Statistical analysis
2. Input–output analysis
3. Process analysis
Furthermore, in line with these methods, the energy performance analysis is classified into two
types: physical calculation models and statistical calculation models (Schlueter & Thesseling,
2009). In this respect, Al-Homoud (2001) listed a number of factors to be considered when
selecting the analysis method: accuracy, sensitivity, speed and cost of learning and use,
reproducibility, ease of use and detail level, availability of the required date, output quality and
project stage.
In real life, buildings do not use energy, but rather the occupants are the ones responsible for the
energy consumption (Heywood, 2015). The occupant energy requirements at home can be
summarised as: thermal comfort (TC), lighting (L), hot water (HW), washing (W), cooking (C),
refrigeration (R) and electronics devices (ED). Based on this, the annual building energy demand
(ABED) is equal to the summation of these energy subsystems (Eq.5.1).
ABED=E(TC)+E(L)+E(HW)+E(W)+E(C)+E(R)+E(ED)=kWh/y Eq. 5.1
Where: -
E(TC) is the annual energy consumed for thermal comfort = ∑ETC
E(L) is the annual energy consumed for lighting = ∑EL
E(HW) is the annual energy consumed for domestic hot water = ∑EHW
E(W) is the annual energy consumed by wash machines= ∑EW
E(C) is the annual energy consumed for cooking = +∑EC
E(R) is the annual energy consumed for refrigeration, freezers and water coolers =
∑ER
E(ED) is the annual energy used for electronic devices and miscellaneous applications
= ∑EED
This expression shows the flow of energy within the boundary of the system without considering
the efficiency of each subsystem. The efficiency of the subsystem plays a major role in the
117
magnitude of the total energy consumption (Wu & Zhao, 2015). Therefore, the efficiency of
each subsystem (η) is required to account for the real energy consumption, and hence, the total
operation energy equation (BTOE) is devised (Eq. 5.2).
BTOE = E(TC)
η+
E(L)
η+
E(HW)
η+
E(W)
η+
E(C)
η+
E(R)
η+
E(ED)
η= kWh/y Eq. 5.2
Furthermore, detailed subsystem components are required in order to estimate the energy usage
of these home tasks and the whole building energy profile. In addition, the fundamental
parameters controlling the energy consumption of each subsystem are required. Finally, the
annual energy consumption of the building is generated by adding the energy requirements for
each subsystem.
The level of energy efficiency in a building is measured by dividing the BTOE by the floor area
of the building resulting in an energy index for the building operation (Eq. 5.3). However, the
issue of energy efficiency in buildings is more complex as it varies depending on the occupancy
rate of the building and on the climatic conditions (Clark, 2013). Therefore, different approaches
were used for energy benchmarking in different rating systems such as Display Energy
Certificates (DECs) in the UK, Energy Star in the USA and NABER Energy in Australia (Clark,
2013). All these rating systems used energy per area as a metric unit, but each tool used different
adjustments for occupancy and climate. Thus, the building energy efficiency index equation had
to include these factors (Eq. 4.4).
Energy index for the building operation = BTOE
Area = kWh/y/m2 Eq. 5.3
Building energy efficiency index = BTOE
Area x Occupancy factor = kWh/y/m2 Eq. 5.4
Moreover, for a low carbon building index measurement, the use of available in-site renewable
energy (RE) will be accounted to estimate the level of low carbon achieved by the building (Eq.
5.5).
Low carbon building index = BTOE−Re
Area × Occupancy factor = kWh/y/m2 Eq.5.5
5.4.1 Evaluation of building energy demand for thermal comfort
The energy consumption for the purpose of obtaining indoor thermal comfort in buildings on a
global scale has experienced a constant growth (Dias et al., 2014). According to the energy audits
(Appendix A) conducted on 4 typical Omani houses within the framework of this research, the
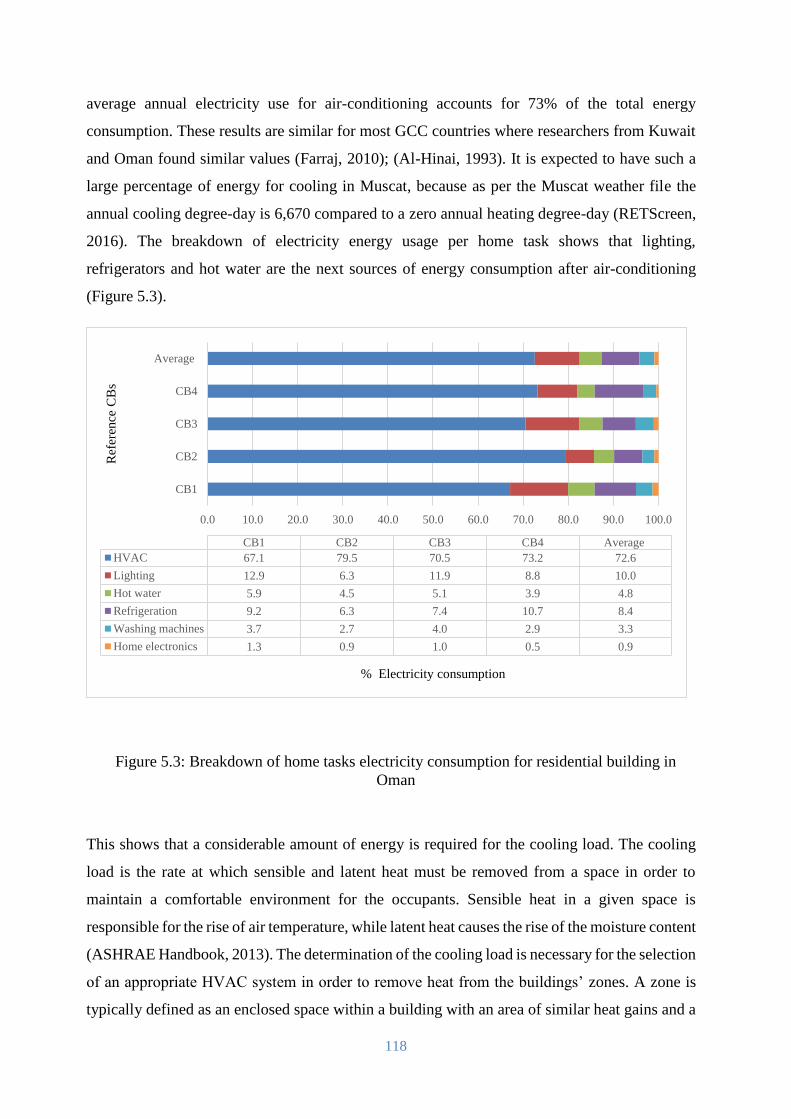
118
average annual electricity use for air-conditioning accounts for 73% of the total energy
consumption. These results are similar for most GCC countries where researchers from Kuwait
and Oman found similar values (Farraj, 2010); (Al-Hinai, 1993). It is expected to have such a
large percentage of energy for cooling in Muscat, because as per the Muscat weather file the
annual cooling degree-day is 6,670 compared to a zero annual heating degree-day (RETScreen,
2016). The breakdown of electricity energy usage per home task shows that lighting,
refrigerators and hot water are the next sources of energy consumption after air-conditioning
(Figure 5.3).
Figure 5.3: Breakdown of home tasks electricity consumption for residential building in
Oman
This shows that a considerable amount of energy is required for the cooling load. The cooling
load is the rate at which sensible and latent heat must be removed from a space in order to
maintain a comfortable environment for the occupants. Sensible heat in a given space is
responsible for the rise of air temperature, while latent heat causes the rise of the moisture content
(ASHRAE Handbook, 2013). The determination of the cooling load is necessary for the selection
of an appropriate HVAC system in order to remove heat from the buildings’ zones. A zone is
typically defined as an enclosed space within a building with an area of similar heat gains and a
0.0 10.0 20.0 30.0 40.0 50.0 60.0 70.0 80.0 90.0 100.0
CB1
CB2
CB3
CB4
Average
% Electricity consumption
Ref
eren
ce C
Bs
CB1 CB2 CB3 CB4 Average
HVAC 67.1 79.5 70.5 73.2 72.6
Lighting 12.9 6.3 11.9 8.8 10.0
Hot water 5.9 4.5 5.1 3.9 4.8
Refrigeration 9.2 6.3 7.4 10.7 8.4
Washing machines 3.7 2.7 4.0 2.9 3.3
Home electronics 1.3 0.9 1.0 0.5 0.9
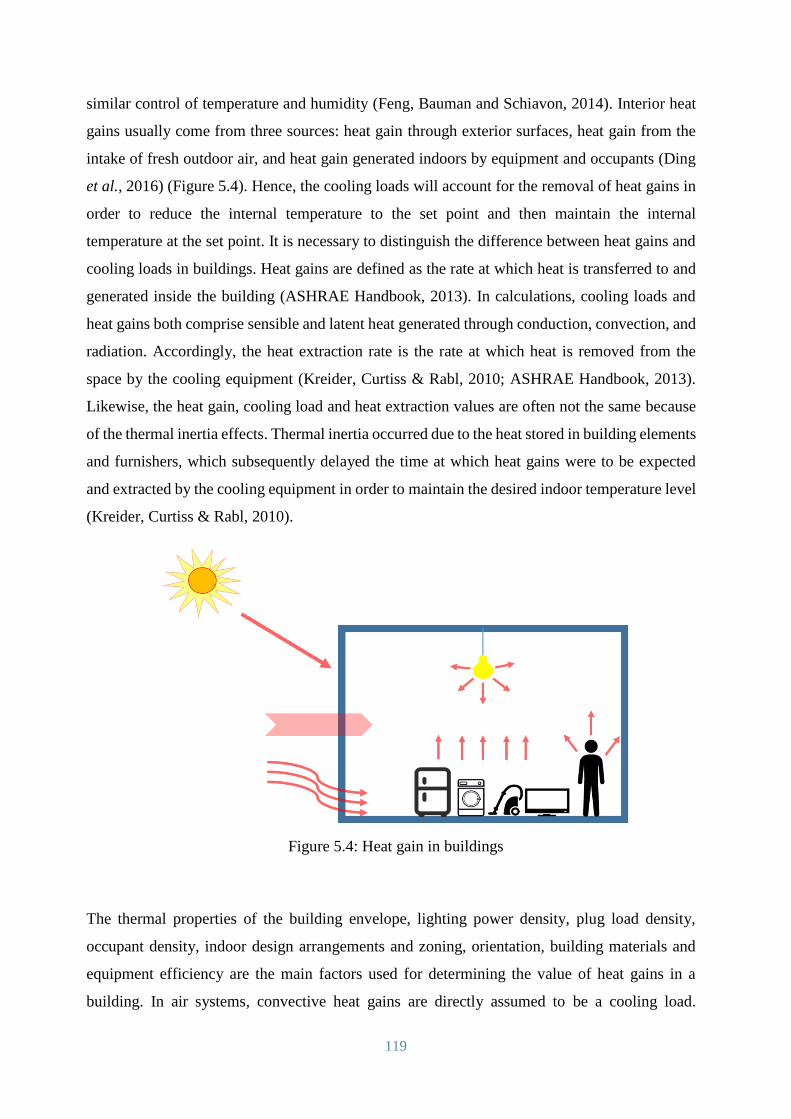
119
similar control of temperature and humidity (Feng, Bauman and Schiavon, 2014). Interior heat
gains usually come from three sources: heat gain through exterior surfaces, heat gain from the
intake of fresh outdoor air, and heat gain generated indoors by equipment and occupants (Ding
et al., 2016) (Figure 5.4). Hence, the cooling loads will account for the removal of heat gains in
order to reduce the internal temperature to the set point and then maintain the internal
temperature at the set point. It is necessary to distinguish the difference between heat gains and
cooling loads in buildings. Heat gains are defined as the rate at which heat is transferred to and
generated inside the building (ASHRAE Handbook, 2013). In calculations, cooling loads and
heat gains both comprise sensible and latent heat generated through conduction, convection, and
radiation. Accordingly, the heat extraction rate is the rate at which heat is removed from the
space by the cooling equipment (Kreider, Curtiss & Rabl, 2010; ASHRAE Handbook, 2013).
Likewise, the heat gain, cooling load and heat extraction values are often not the same because
of the thermal inertia effects. Thermal inertia occurred due to the heat stored in building elements
and furnishers, which subsequently delayed the time at which heat gains were to be expected
and extracted by the cooling equipment in order to maintain the desired indoor temperature level
(Kreider, Curtiss & Rabl, 2010).
Figure 5.4: Heat gain in buildings
The thermal properties of the building envelope, lighting power density, plug load density,
occupant density, indoor design arrangements and zoning, orientation, building materials and
equipment efficiency are the main factors used for determining the value of heat gains in a
building. In air systems, convective heat gains are directly assumed to be a cooling load.
120
Whereas, radiative heat gains are absorbed by walls, floors, ceilings, and furnishers causing an
increase in their temperature, which will then transfer heat to the air by means of convection
(ASHRAE Handbook, 2013). Finally, conductive heat gains are converted to convective and
radiative heat gains. When the space air temperature and humidity reach a study state and remain
constant, the heat extraction rate will then be equal to the space cooling and heat gains (ASHRAE
Handbook, 2013).
Today the use of commercial software in order to calculate heating and cooling loads has
simplified the process. There are various software applications available on the market and
recognised by professional bodies such as the Air Conditioning Contractors of America (ACCA)
for the simplicity of the HVAC design (Spitler, McQuiston & Lindsey, 1993). Regardless of the
computer software design or manual calculation used in the calculation, the basic design process
involves systematic steps based on the thermodynamic concept and fundamentals of heat
balance.
5.4.1.1 Cooling load estimation In the hot humid climate of Oman, the thermal comfort energy consumption (∑ETC) involved
the energy usage for the purpose of space cooling / heating, ventilation and any other equipment
used for controlling the temperature and humidity within the building zones. A fundamental and
simple method used in order to estimate the heating and cooling energy demand for buildings is
the degree-day method. Heating degree days (HDDs) are calculated by simple subtractions of
the outdoor temperature from the base temperature, considering only positive values. The base
temperature is considered as the outdoor temperature above which there is no need for a building
to be heated. Likewise, cooling degree days (CDDs) are calculated from the temperatures
exceeding the base temperature. In this case, a base temperature is considered as the outdoor
temperature below which a building requires no cooling. The calculation of the degree days can
be carried out using several methods and timescales (CIBSE, 2006):
Mean degree hours, calculated from the hourly temperature record
Using daily maximum and minimum temperatures
Using mean daily temperatures
121
Direct calculation of the monthly degree days from the mean monthly temperature and
the monthly standard deviation
There are a few different ways of calculating the HDD and CDD, in terms of the availability of
data and the integrating period. The most accurate calculation is by using hourly data (0≤k≤24)
of the outdoor air temperature (Ti) and integrating it directly by using the base temperature (Eq.
5.6).
HDD = ∑ T𝐻𝑏−T𝑖
𝑘𝑖=1
24if (T𝐻𝑏 − T𝑖) > 0, 0 ≤ 𝑘 ≤ 24 Eq. 5.6
CDD = ∑ T𝑖−T𝐶𝑏
𝑘𝑖=1
24if (T𝑖 − T𝐶𝑏) > 0, 0 ≤ 𝑘 ≤ 24 Eq.5.7
Where THb and TCb are the corresponding base temperature values for the HDD and CDD,
respectively. For each month of the year, the daily values are summed giving the monthly values
of the CDD and HDD and, in the process, the annual values of the CDD and HDD are estimated.
For Oman, the threshold base temperatures of 27 °C and 18 °C are considered for the calculation
of the CDD and HDD. The choice of these temperatures was issued by The Research Council,
Oman. The weather file in Muscat shows no need for heating, however in the case of some places
in Oman where heating is required, the annual energy consumption for heating Eh (kWh) for a
building is calculated from the summation of HDD (Eq.5.8) (CIBSE 2006); (Kolokotroni et al.,
2010).
Eh = U′(AHDD)24
𝜂 Eq. 5.8
U′ = A.U+
1
3N.V
1000 Eq.5.9
Where: -
U′ is the overall building heat loss coefficient (kW/K)
AHDD is the annual sum of HDD multiplied by 24 (hours per day) to convert to hours
η is the coefficient of efficiency of the internal heat sources (0 < η < 1)
U is the fabric U value (W/m2K)
A is the component area (m2)
N is the air infiltration rate in air changes per hour (h−1)
V is the volume of the space (m3).
122
Moustris et al., (2014) illustrated that the second part of Eq. (5.9) represents the natural
ventilation heat losses; therefore, the numerical factor (1/3) arises from the product of the
specific heat of the air CP and the air density ρa. By assigning typical values, the corresponding
numerical value is determined by the following calculation (Moustris et al., 2014):
d.Cp = [1.2 kg
m3] × [1.005kJ
kgK×
1
3600×
kWh
kJ×
W
kW]=0.335
Wh
m3 ≈1
3
Wh
m3K Eq.5.10
Similarly, the annual energy consumption for cooling (Ec) for a building is calculated as (Eq.
5.11):
Ec = ṁCp × ACDD24
COP = kWh Eq. 5.11
Where: -
ṁ is the mass flow rate of the air cooled per second (kg/s)
Cp is the specific heat of air (kJ/kg/K)
ACDD is the annual sum of the CDD multiplied by 24 h day−1
COP is the coefficient of performance of the cooling unit.
In case of deferent energy sources used for heating and cooling, both the annual heating energy
consumption and the annual cooling energy consumption need to be converted to their primary
energy consumption (PEC), to be added to the total building energy consumption. Primary
energy consumption refers to the direct use at the source, or in other words the energy that has
not been subjected to any conversion or transformation process (Eq. 4.12) (Moustris et al., 2014).
PEC = Exa Eq. 5.12
Where (Ex) is the total annual cooling or heating energy consumption (kWh) and (a) is the
primary energy conversion factor, respectively. The PEC factor a takes different values
depending on fuel. It furthermore changes with time because it depends on the generating mix
in any given period.
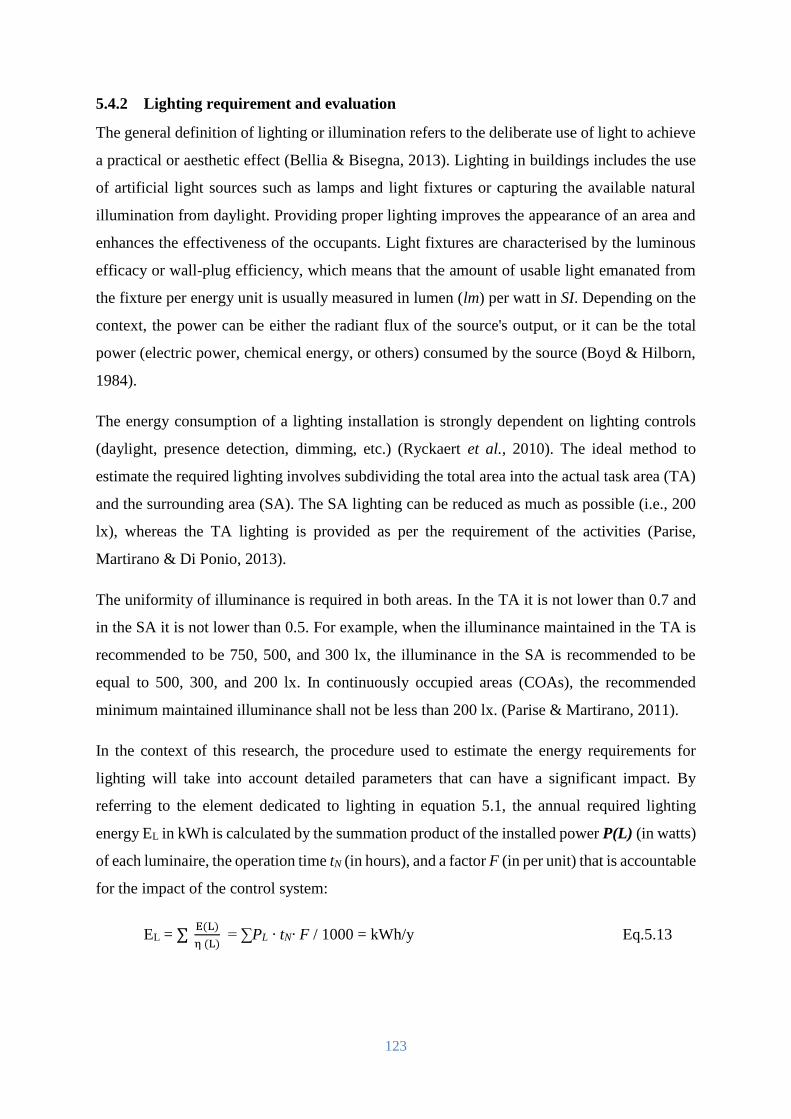
123
5.4.2 Lighting requirement and evaluation
The general definition of lighting or illumination refers to the deliberate use of light to achieve
a practical or aesthetic effect (Bellia & Bisegna, 2013). Lighting in buildings includes the use
of artificial light sources such as lamps and light fixtures or capturing the available natural
illumination from daylight. Providing proper lighting improves the appearance of an area and
enhances the effectiveness of the occupants. Light fixtures are characterised by the luminous
efficacy or wall-plug efficiency, which means that the amount of usable light emanated from
the fixture per energy unit is usually measured in lumen (lm) per watt in SI. Depending on the
context, the power can be either the radiant flux of the source's output, or it can be the total
power (electric power, chemical energy, or others) consumed by the source (Boyd & Hilborn,
1984).
The energy consumption of a lighting installation is strongly dependent on lighting controls
(daylight, presence detection, dimming, etc.) (Ryckaert et al., 2010). The ideal method to
estimate the required lighting involves subdividing the total area into the actual task area (TA)
and the surrounding area (SA). The SA lighting can be reduced as much as possible (i.e., 200
lx), whereas the TA lighting is provided as per the requirement of the activities (Parise,
Martirano & Di Ponio, 2013).
The uniformity of illuminance is required in both areas. In the TA it is not lower than 0.7 and
in the SA it is not lower than 0.5. For example, when the illuminance maintained in the TA is
recommended to be 750, 500, and 300 lx, the illuminance in the SA is recommended to be
equal to 500, 300, and 200 lx. In continuously occupied areas (COAs), the recommended
minimum maintained illuminance shall not be less than 200 lx. (Parise & Martirano, 2011).
In the context of this research, the procedure used to estimate the energy requirements for
lighting will take into account detailed parameters that can have a significant impact. By
referring to the element dedicated to lighting in equation 5.1, the annual required lighting
energy EL in kWh is calculated by the summation product of the installed power P(L) (in watts)
of each luminaire, the operation time tN (in hours), and a factor F (in per unit) that is accountable
for the impact of the control system:
EL = ∑ E(L)
η (L) = ∑PL · tN· F / 1000 = kWh/y Eq.5.13
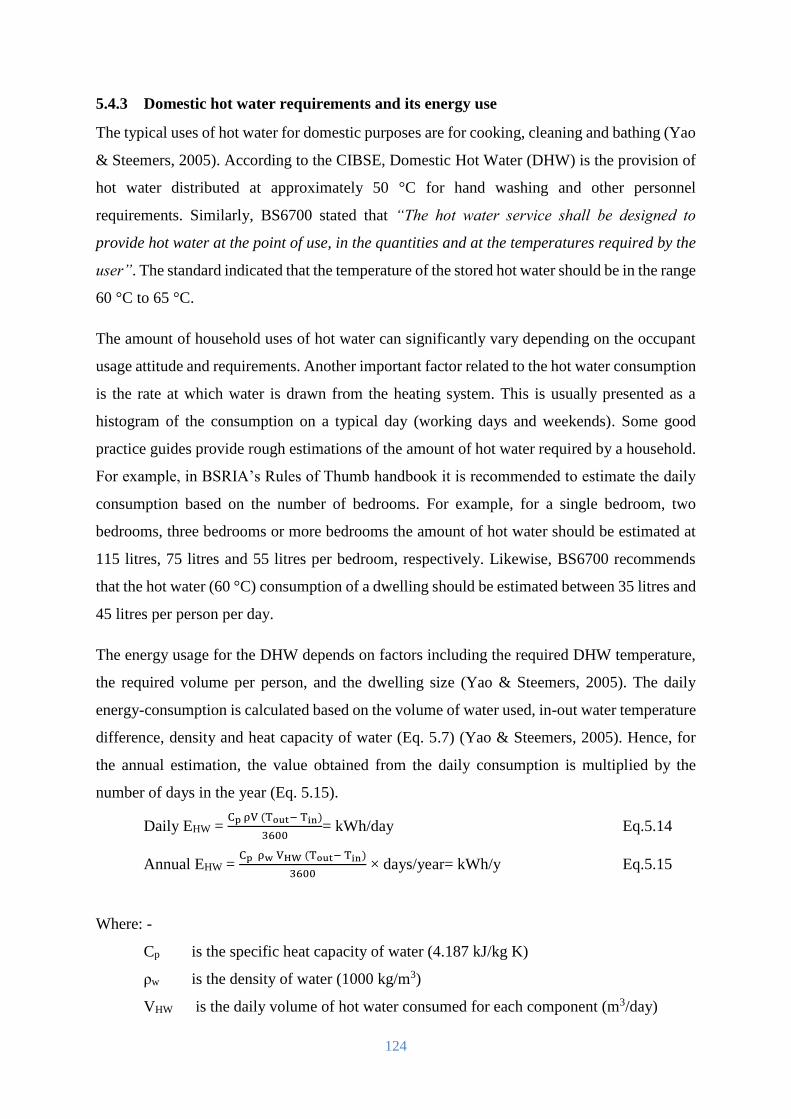
124
5.4.3 Domestic hot water requirements and its energy use
The typical uses of hot water for domestic purposes are for cooking, cleaning and bathing (Yao
& Steemers, 2005). According to the CIBSE, Domestic Hot Water (DHW) is the provision of
hot water distributed at approximately 50 °C for hand washing and other personnel
requirements. Similarly, BS6700 stated that “The hot water service shall be designed to
provide hot water at the point of use, in the quantities and at the temperatures required by the
user”. The standard indicated that the temperature of the stored hot water should be in the range
60 °C to 65 °C.
The amount of household uses of hot water can significantly vary depending on the occupant
usage attitude and requirements. Another important factor related to the hot water consumption
is the rate at which water is drawn from the heating system. This is usually presented as a
histogram of the consumption on a typical day (working days and weekends). Some good
practice guides provide rough estimations of the amount of hot water required by a household.
For example, in BSRIA’s Rules of Thumb handbook it is recommended to estimate the daily
consumption based on the number of bedrooms. For example, for a single bedroom, two
bedrooms, three bedrooms or more bedrooms the amount of hot water should be estimated at
115 litres, 75 litres and 55 litres per bedroom, respectively. Likewise, BS6700 recommends
that the hot water (60 °C) consumption of a dwelling should be estimated between 35 litres and
45 litres per person per day.
The energy usage for the DHW depends on factors including the required DHW temperature,
the required volume per person, and the dwelling size (Yao & Steemers, 2005). The daily
energy-consumption is calculated based on the volume of water used, in-out water temperature
difference, density and heat capacity of water (Eq. 5.7) (Yao & Steemers, 2005). Hence, for
the annual estimation, the value obtained from the daily consumption is multiplied by the
number of days in the year (Eq. 5.15).
Daily EHW = Cp ρV (Tout− Tin)
3600= kWh/day Eq.5.14
Annual EHW = Cp ρw VHW (Tout− Tin)
3600 × days/year= kWh/y Eq.5.15
Where: -
Cp is the specific heat capacity of water (4.187 kJ/kg K)
ρw is the density of water (1000 kg/m3)
VHW is the daily volume of hot water consumed for each component (m3/day)
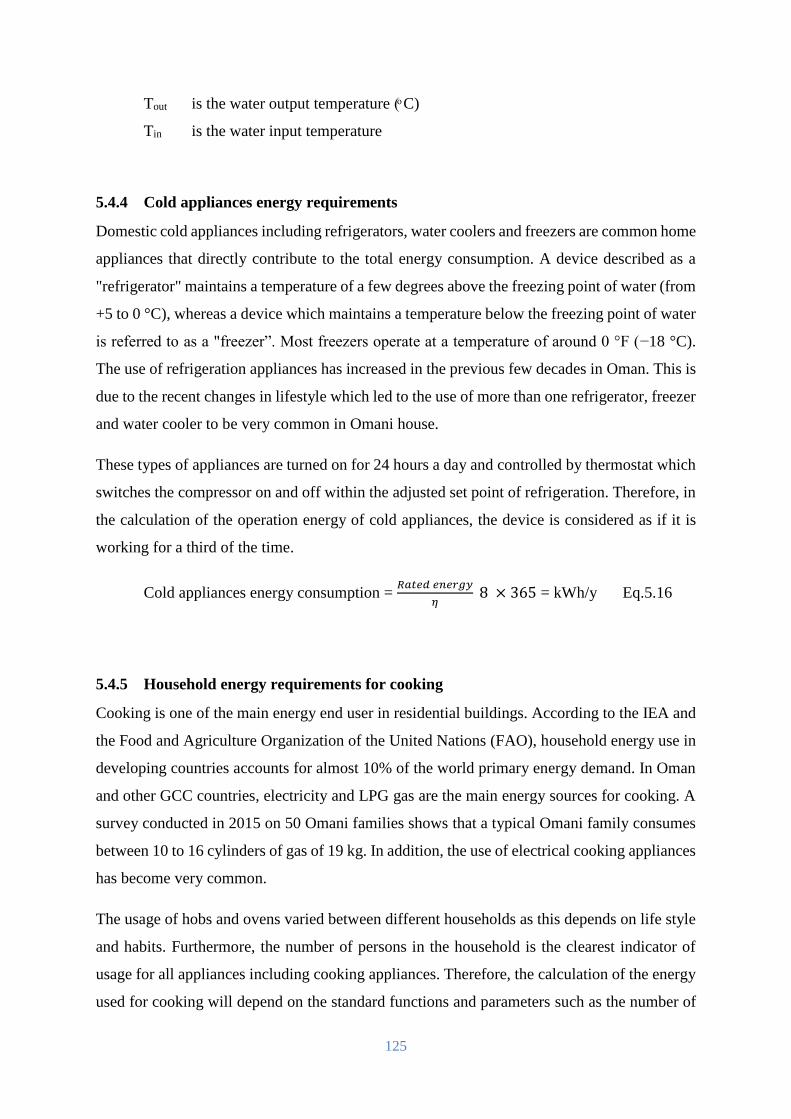
125
Tout is the water output temperature ( C)
Tin is the water input temperature
5.4.4 Cold appliances energy requirements
Domestic cold appliances including refrigerators, water coolers and freezers are common home
appliances that directly contribute to the total energy consumption. A device described as a
"refrigerator" maintains a temperature of a few degrees above the freezing point of water (from
+5 to 0 °C), whereas a device which maintains a temperature below the freezing point of water
is referred to as a "freezer”. Most freezers operate at a temperature of around 0 °F (−18 °C).
The use of refrigeration appliances has increased in the previous few decades in Oman. This is
due to the recent changes in lifestyle which led to the use of more than one refrigerator, freezer
and water cooler to be very common in Omani house.
These types of appliances are turned on for 24 hours a day and controlled by thermostat which
switches the compressor on and off within the adjusted set point of refrigeration. Therefore, in
the calculation of the operation energy of cold appliances, the device is considered as if it is
working for a third of the time.
Cold appliances energy consumption = 𝑅𝑎𝑡𝑒𝑑 𝑒𝑛𝑒𝑟𝑔𝑦
𝜂 8 × 365 = kWh/y Eq.5.16
5.4.5 Household energy requirements for cooking
Cooking is one of the main energy end user in residential buildings. According to the IEA and
the Food and Agriculture Organization of the United Nations (FAO), household energy use in
developing countries accounts for almost 10% of the world primary energy demand. In Oman
and other GCC countries, electricity and LPG gas are the main energy sources for cooking. A
survey conducted in 2015 on 50 Omani families shows that a typical Omani family consumes
between 10 to 16 cylinders of gas of 19 kg. In addition, the use of electrical cooking appliances
has become very common.
The usage of hobs and ovens varied between different households as this depends on life style
and habits. Furthermore, the number of persons in the household is the clearest indicator of
usage for all appliances including cooking appliances. Therefore, the calculation of the energy
used for cooking will depend on the standard functions and parameters such as the number of
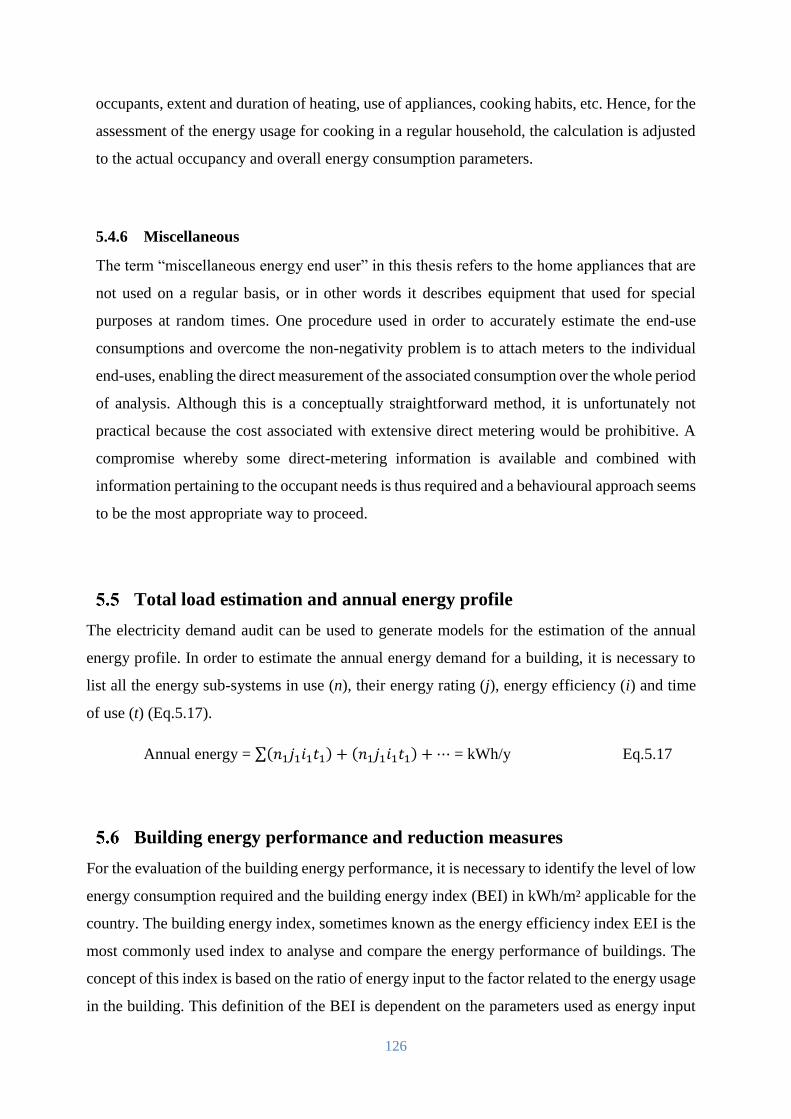
126
occupants, extent and duration of heating, use of appliances, cooking habits, etc. Hence, for the
assessment of the energy usage for cooking in a regular household, the calculation is adjusted
to the actual occupancy and overall energy consumption parameters.
5.4.6 Miscellaneous
The term “miscellaneous energy end user” in this thesis refers to the home appliances that are
not used on a regular basis, or in other words it describes equipment that used for special
purposes at random times. One procedure used in order to accurately estimate the end-use
consumptions and overcome the non-negativity problem is to attach meters to the individual
end-uses, enabling the direct measurement of the associated consumption over the whole period
of analysis. Although this is a conceptually straightforward method, it is unfortunately not
practical because the cost associated with extensive direct metering would be prohibitive. A
compromise whereby some direct-metering information is available and combined with
information pertaining to the occupant needs is thus required and a behavioural approach seems
to be the most appropriate way to proceed.
Total load estimation and annual energy profile
The electricity demand audit can be used to generate models for the estimation of the annual
energy profile. In order to estimate the annual energy demand for a building, it is necessary to
list all the energy sub-systems in use (n), their energy rating (j), energy efficiency (i) and time
of use (t) (Eq.5.17).
Annual energy = ∑(𝑛1𝑗1𝑖1𝑡1) + (𝑛1𝑗1𝑖1𝑡1) + ⋯ = kWh/y Eq.5.17
Building energy performance and reduction measures
For the evaluation of the building energy performance, it is necessary to identify the level of low
energy consumption required and the building energy index (BEI) in kWh/m² applicable for the
country. The building energy index, sometimes known as the energy efficiency index EEI is the
most commonly used index to analyse and compare the energy performance of buildings. The
concept of this index is based on the ratio of energy input to the factor related to the energy usage
in the building. This definition of the BEI is dependent on the parameters used as energy input
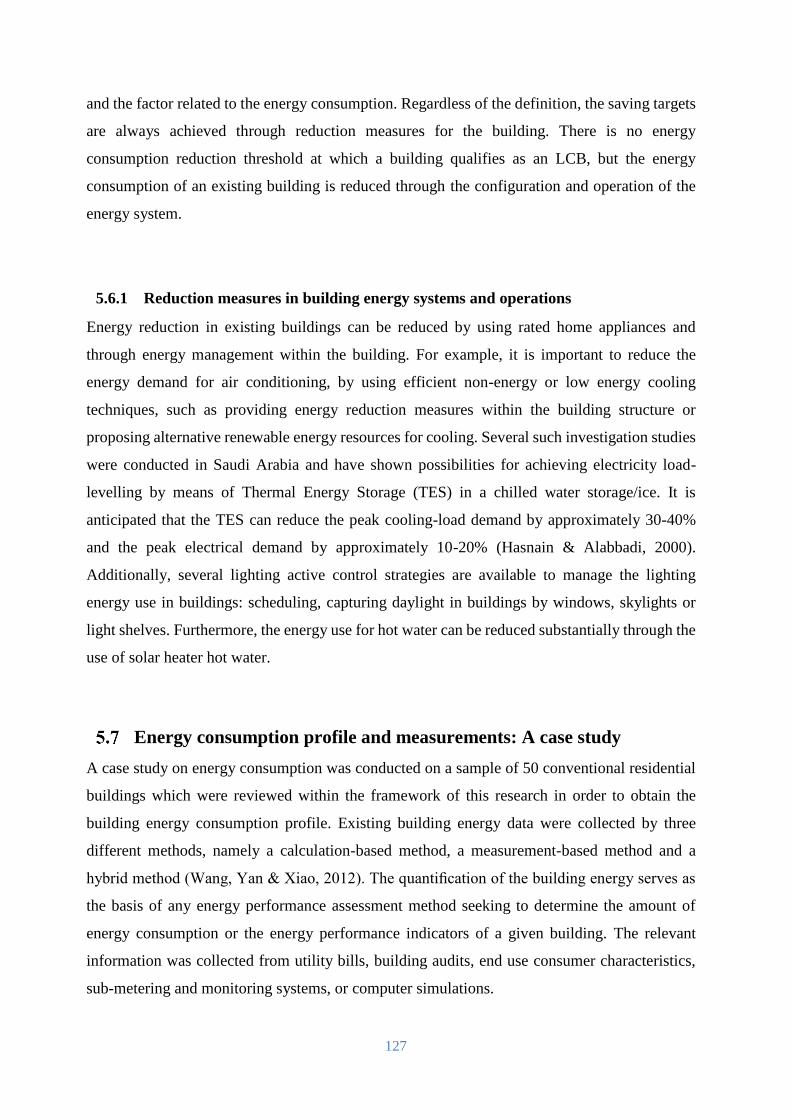
127
and the factor related to the energy consumption. Regardless of the definition, the saving targets
are always achieved through reduction measures for the building. There is no energy
consumption reduction threshold at which a building qualifies as an LCB, but the energy
consumption of an existing building is reduced through the configuration and operation of the
energy system.
5.6.1 Reduction measures in building energy systems and operations
Energy reduction in existing buildings can be reduced by using rated home appliances and
through energy management within the building. For example, it is important to reduce the
energy demand for air conditioning, by using efficient non-energy or low energy cooling
techniques, such as providing energy reduction measures within the building structure or
proposing alternative renewable energy resources for cooling. Several such investigation studies
were conducted in Saudi Arabia and have shown possibilities for achieving electricity load-
levelling by means of Thermal Energy Storage (TES) in a chilled water storage/ice. It is
anticipated that the TES can reduce the peak cooling-load demand by approximately 30-40%
and the peak electrical demand by approximately 10-20% (Hasnain & Alabbadi, 2000).
Additionally, several lighting active control strategies are available to manage the lighting
energy use in buildings: scheduling, capturing daylight in buildings by windows, skylights or
light shelves. Furthermore, the energy use for hot water can be reduced substantially through the
use of solar heater hot water.
Energy consumption profile and measurements: A case study
A case study on energy consumption was conducted on a sample of 50 conventional residential
buildings which were reviewed within the framework of this research in order to obtain the
building energy consumption profile. Existing building energy data were collected by three
different methods, namely a calculation-based method, a measurement-based method and a
hybrid method (Wang, Yan & Xiao, 2012). The quantification of the building energy serves as
the basis of any energy performance assessment method seeking to determine the amount of
energy consumption or the energy performance indicators of a given building. The relevant
information was collected from utility bills, building audits, end use consumer characteristics,
sub-metering and monitoring systems, or computer simulations.
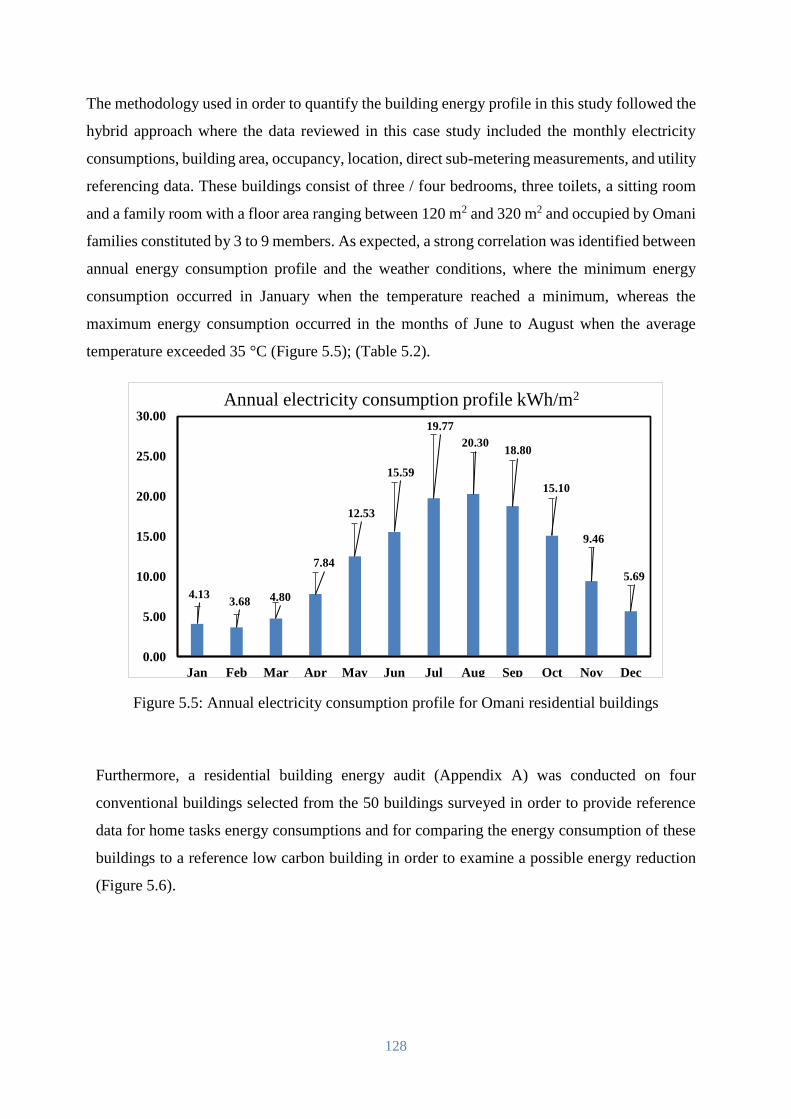
128
The methodology used in order to quantify the building energy profile in this study followed the
hybrid approach where the data reviewed in this case study included the monthly electricity
consumptions, building area, occupancy, location, direct sub-metering measurements, and utility
referencing data. These buildings consist of three / four bedrooms, three toilets, a sitting room
and a family room with a floor area ranging between 120 m2 and 320 m2 and occupied by Omani
families constituted by 3 to 9 members. As expected, a strong correlation was identified between
annual energy consumption profile and the weather conditions, where the minimum energy
consumption occurred in January when the temperature reached a minimum, whereas the
maximum energy consumption occurred in the months of June to August when the average
temperature exceeded 35 °C (Figure 5.5); (Table 5.2).
Figure 5.5: Annual electricity consumption profile for Omani residential buildings
Furthermore, a residential building energy audit (Appendix A) was conducted on four
conventional buildings selected from the 50 buildings surveyed in order to provide reference
data for home tasks energy consumptions and for comparing the energy consumption of these
buildings to a reference low carbon building in order to examine a possible energy reduction
(Figure 5.6).
4.133.68 4.80
7.84
12.53
15.59
19.77
20.3018.80
15.10
9.46
5.69
0.00
5.00
10.00
15.00
20.00
25.00
30.00
Jan Feb Mar Apr May Jun Jul Aug Sep Oct Nov Dec
Annual electricity consumption profile kWh/m2
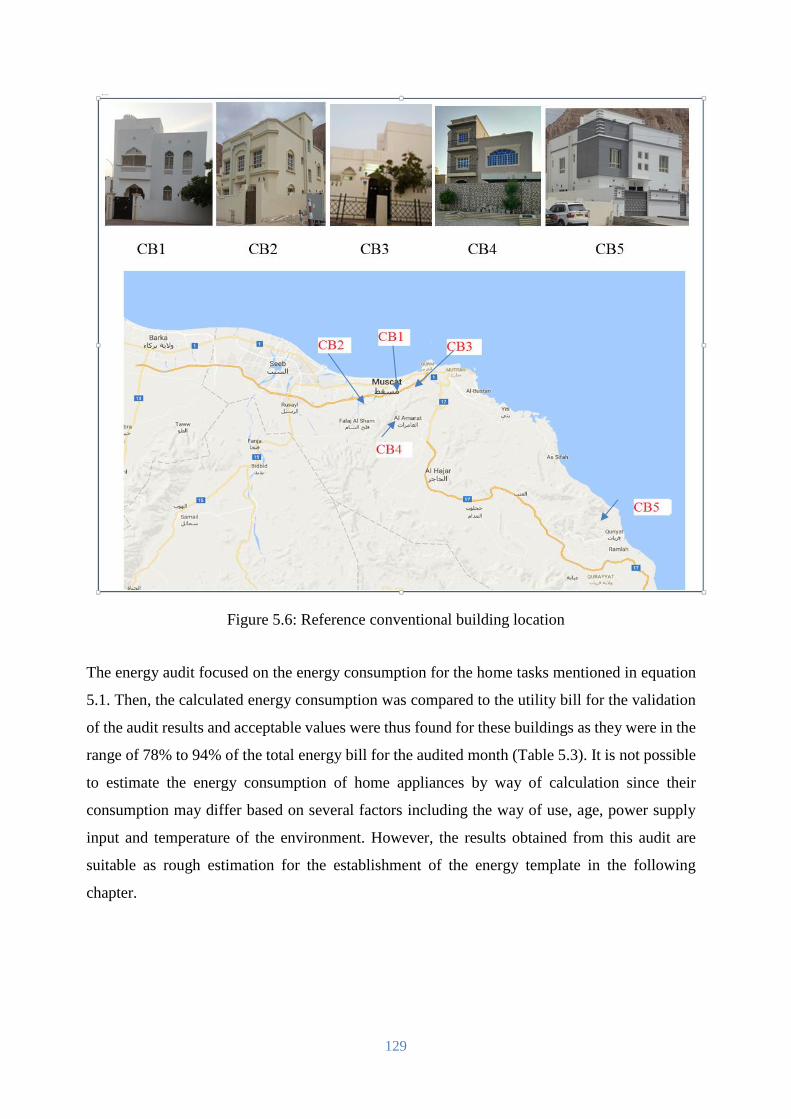
129
Figure 5.6: Reference conventional building location
The energy audit focused on the energy consumption for the home tasks mentioned in equation
5.1. Then, the calculated energy consumption was compared to the utility bill for the validation
of the audit results and acceptable values were thus found for these buildings as they were in the
range of 78% to 94% of the total energy bill for the audited month (Table 5.3). It is not possible
to estimate the energy consumption of home appliances by way of calculation since their
consumption may differ based on several factors including the way of use, age, power supply
input and temperature of the environment. However, the results obtained from this audit are
suitable as rough estimation for the establishment of the energy template in the following
chapter.
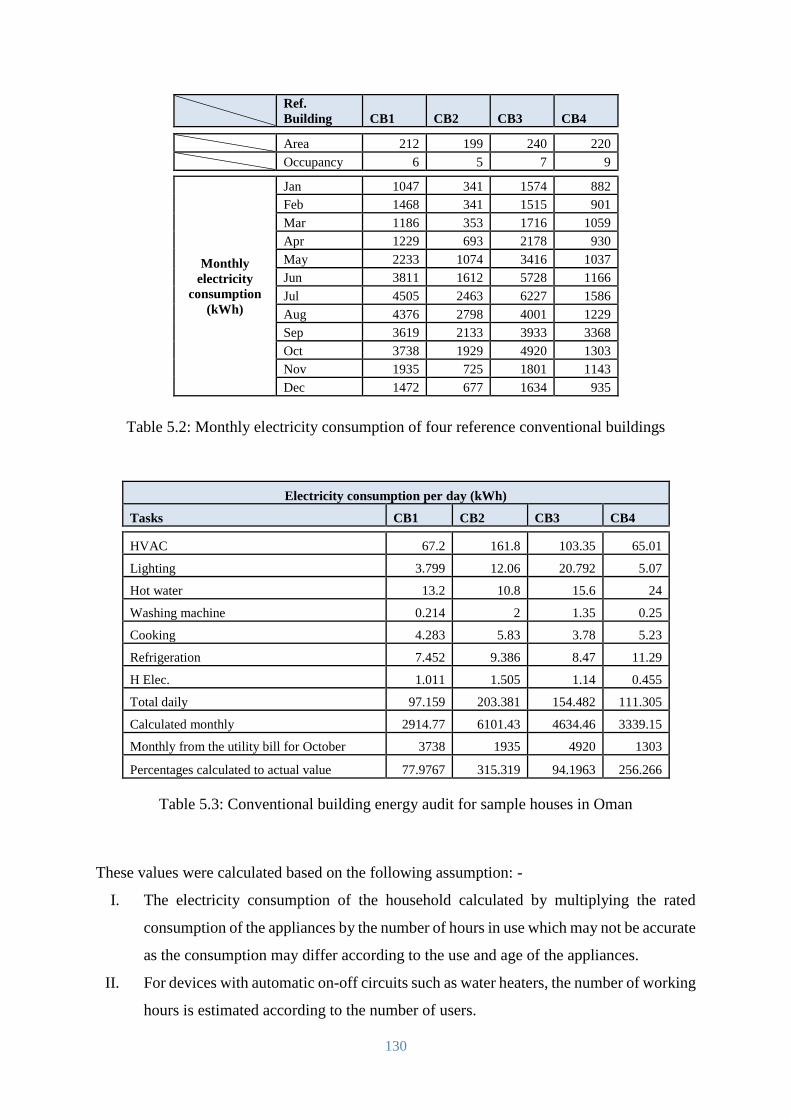
130
Ref.
Building CB1 CB2 CB3 CB4
Area 212 199 240 220 Occupancy 6 5 7 9
Monthly
electricity
consumption
(kWh)
Jan 1047 341 1574 882
Feb 1468 341 1515 901
Mar 1186 353 1716 1059
Apr 1229 693 2178 930
May 2233 1074 3416 1037
Jun 3811 1612 5728 1166
Jul 4505 2463 6227 1586
Aug 4376 2798 4001 1229
Sep 3619 2133 3933 3368
Oct 3738 1929 4920 1303
Nov 1935 725 1801 1143
Dec 1472 677 1634 935
Table 5.2: Monthly electricity consumption of four reference conventional buildings
Electricity consumption per day (kWh)
Tasks CB1 CB2 CB3 CB4
HVAC 67.2 161.8 103.35 65.01
Lighting 3.799 12.06 20.792 5.07
Hot water 13.2 10.8 15.6 24
Washing machine 0.214 2 1.35 0.25
Cooking 4.283 5.83 3.78 5.23
Refrigeration 7.452 9.386 8.47 11.29
H Elec. 1.011 1.505 1.14 0.455
Total daily 97.159 203.381 154.482 111.305
Calculated monthly 2914.77 6101.43 4634.46 3339.15
Monthly from the utility bill for October 3738 1935 4920 1303
Percentages calculated to actual value 77.9767 315.319 94.1963 256.266
Table 5.3: Conventional building energy audit for sample houses in Oman
These values were calculated based on the following assumption: -
I. The electricity consumption of the household calculated by multiplying the rated
consumption of the appliances by the number of hours in use which may not be accurate
as the consumption may differ according to the use and age of the appliances.
II. For devices with automatic on-off circuits such as water heaters, the number of working
hours is estimated according to the number of users.
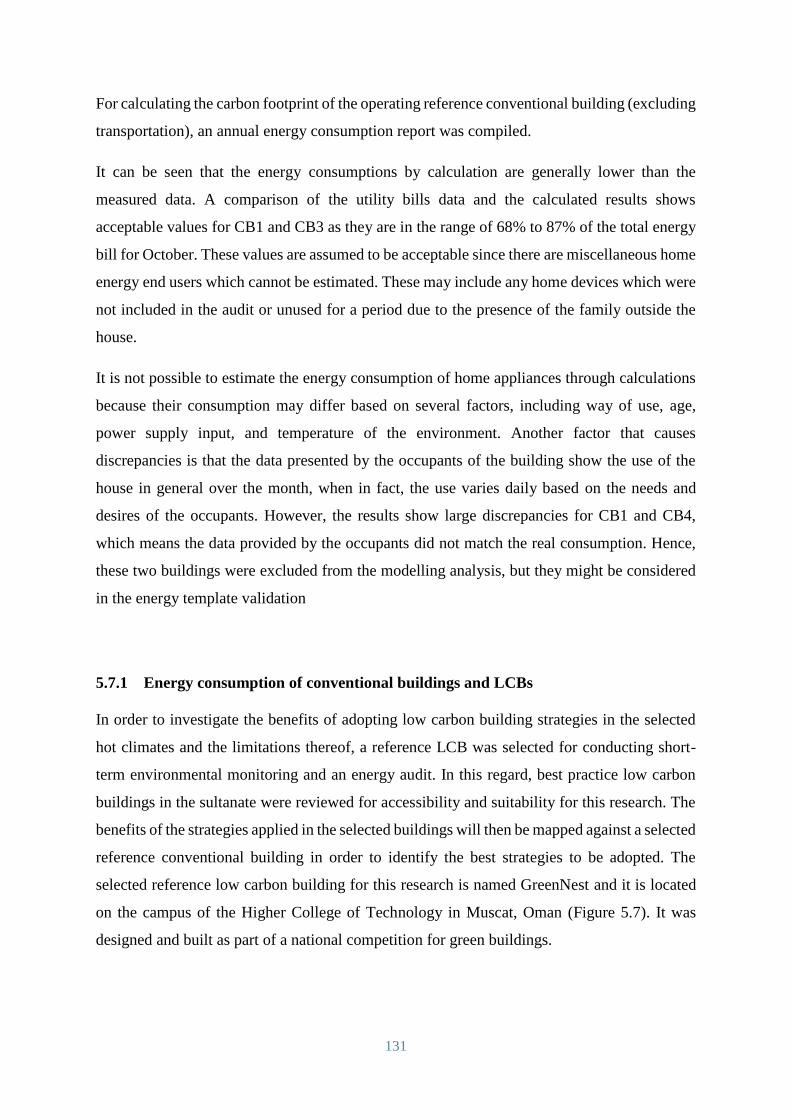
131
For calculating the carbon footprint of the operating reference conventional building (excluding
transportation), an annual energy consumption report was compiled.
It can be seen that the energy consumptions by calculation are generally lower than the
measured data. A comparison of the utility bills data and the calculated results shows
acceptable values for CB1 and CB3 as they are in the range of 68% to 87% of the total energy
bill for October. These values are assumed to be acceptable since there are miscellaneous home
energy end users which cannot be estimated. These may include any home devices which were
not included in the audit or unused for a period due to the presence of the family outside the
house.
It is not possible to estimate the energy consumption of home appliances through calculations
because their consumption may differ based on several factors, including way of use, age,
power supply input, and temperature of the environment. Another factor that causes
discrepancies is that the data presented by the occupants of the building show the use of the
house in general over the month, when in fact, the use varies daily based on the needs and
desires of the occupants. However, the results show large discrepancies for CB1 and CB4,
which means the data provided by the occupants did not match the real consumption. Hence,
these two buildings were excluded from the modelling analysis, but they might be considered
in the energy template validation
5.7.1 Energy consumption of conventional buildings and LCBs
In order to investigate the benefits of adopting low carbon building strategies in the selected
hot climates and the limitations thereof, a reference LCB was selected for conducting short-
term environmental monitoring and an energy audit. In this regard, best practice low carbon
buildings in the sultanate were reviewed for accessibility and suitability for this research. The
benefits of the strategies applied in the selected buildings will then be mapped against a selected
reference conventional building in order to identify the best strategies to be adopted. The
selected reference low carbon building for this research is named GreenNest and it is located
on the campus of the Higher College of Technology in Muscat, Oman (Figure 5.7). It was
designed and built as part of a national competition for green buildings.
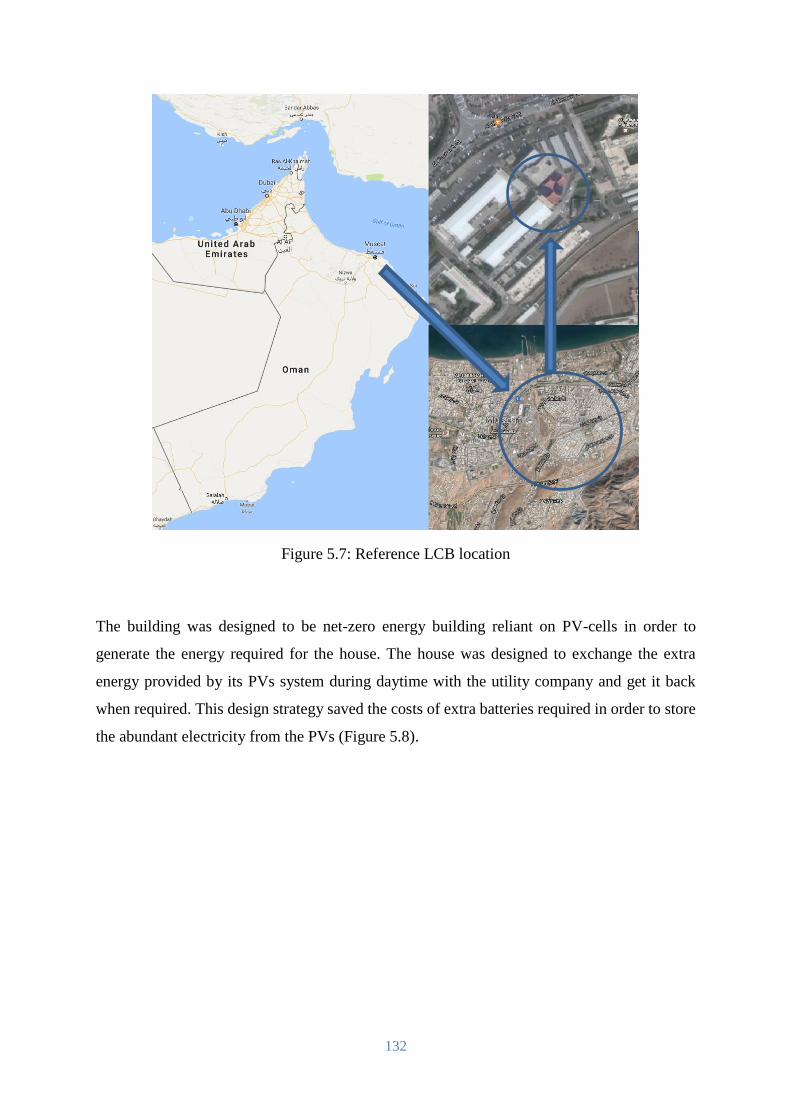
132
Figure 5.7: Reference LCB location
The building was designed to be net-zero energy building reliant on PV-cells in order to
generate the energy required for the house. The house was designed to exchange the extra
energy provided by its PVs system during daytime with the utility company and get it back
when required. This design strategy saved the costs of extra batteries required in order to store
the abundant electricity from the PVs (Figure 5.8).
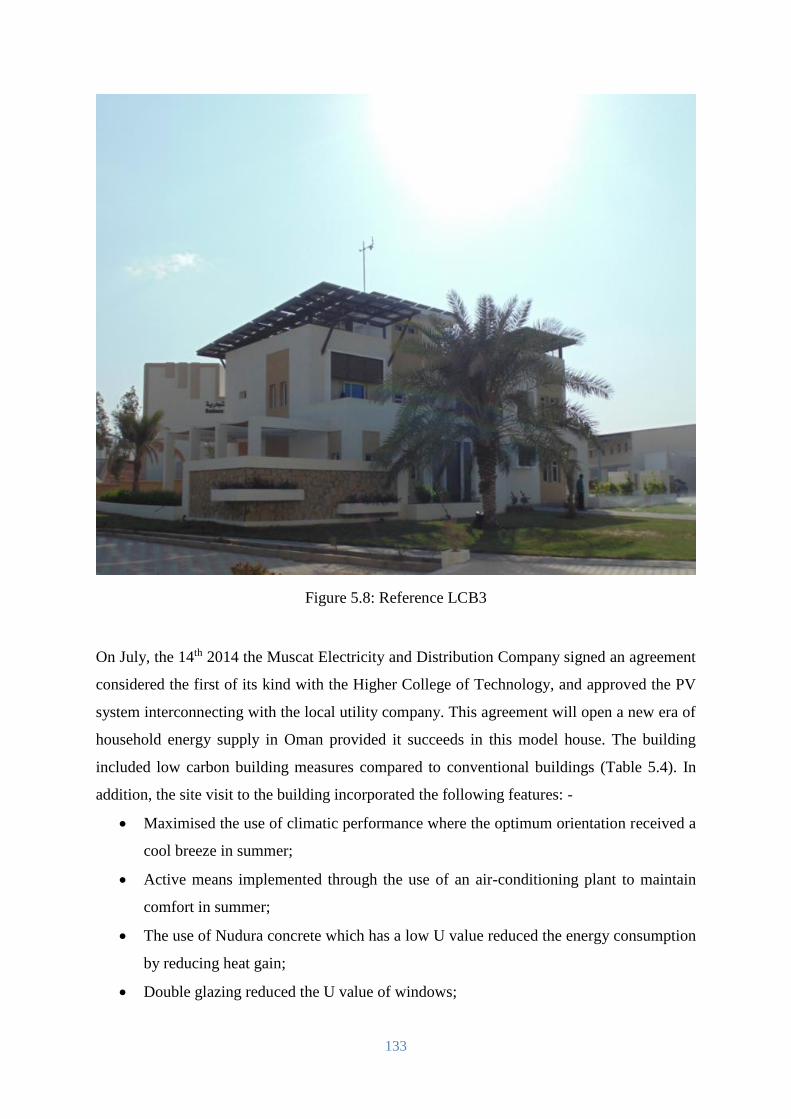
133
Figure 5.8: Reference LCB3
On July, the 14th 2014 the Muscat Electricity and Distribution Company signed an agreement
considered the first of its kind with the Higher College of Technology, and approved the PV
system interconnecting with the local utility company. This agreement will open a new era of
household energy supply in Oman provided it succeeds in this model house. The building
included low carbon building measures compared to conventional buildings (Table 5.4). In
addition, the site visit to the building incorporated the following features: -
Maximised the use of climatic performance where the optimum orientation received a
cool breeze in summer;
Active means implemented through the use of an air-conditioning plant to maintain
comfort in summer;
The use of Nudura concrete which has a low U value reduced the energy consumption
by reducing heat gain;
Double glazing reduced the U value of windows;
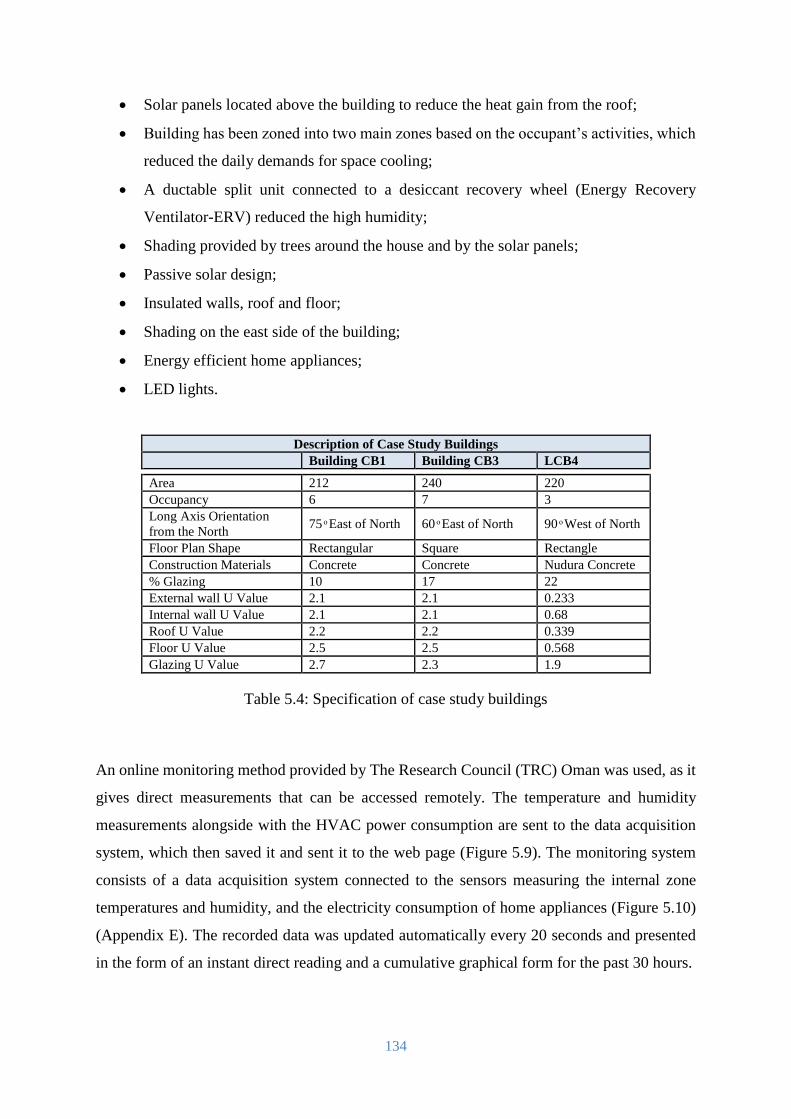
134
Solar panels located above the building to reduce the heat gain from the roof;
Building has been zoned into two main zones based on the occupant’s activities, which
reduced the daily demands for space cooling;
A ductable split unit connected to a desiccant recovery wheel (Energy Recovery
Ventilator-ERV) reduced the high humidity;
Shading provided by trees around the house and by the solar panels;
Passive solar design;
Insulated walls, roof and floor;
Shading on the east side of the building;
Energy efficient home appliances;
LED lights.
Description of Case Study Buildings
Building CB1 Building CB3 LCB4
Area 212 240 220
Occupancy 6 7 3
Long Axis Orientation
from the North 75 East of North 60 East of North 90 West of North
Floor Plan Shape Rectangular Square Rectangle
Construction Materials Concrete Concrete Nudura Concrete
% Glazing 10 17 22
External wall U Value 2.1 2.1 0.233
Internal wall U Value 2.1 2.1 0.68
Roof U Value 2.2 2.2 0.339
Floor U Value 2.5 2.5 0.568
Glazing U Value 2.7 2.3 1.9
Table 5.4: Specification of case study buildings
An online monitoring method provided by The Research Council (TRC) Oman was used, as it
gives direct measurements that can be accessed remotely. The temperature and humidity
measurements alongside with the HVAC power consumption are sent to the data acquisition
system, which then saved it and sent it to the web page (Figure 5.9). The monitoring system
consists of a data acquisition system connected to the sensors measuring the internal zone
temperatures and humidity, and the electricity consumption of home appliances (Figure 5.10)
(Appendix E). The recorded data was updated automatically every 20 seconds and presented
in the form of an instant direct reading and a cumulative graphical form for the past 30 hours.

135
Figure 5.9: Monitoring system principle
The number of data collecting sensors varies according to the room size, layout and the purpose
of the measurement (Nicol et al., 2012). Therefore, in thermal comfort surveys, measurements
are recommended to be taken at a vertical height of 0.6 m above the floor for a seated person
or at the working surface level, but not less than half a metre from any wall (Nicol et al., 2012).
Since the internal spaces of the LCB are small, one sensor is used per space located in the
centre of the space at 1.2 m above the floor, at least 0.5 m from the wall, and at a distance from
any disturbing objects.
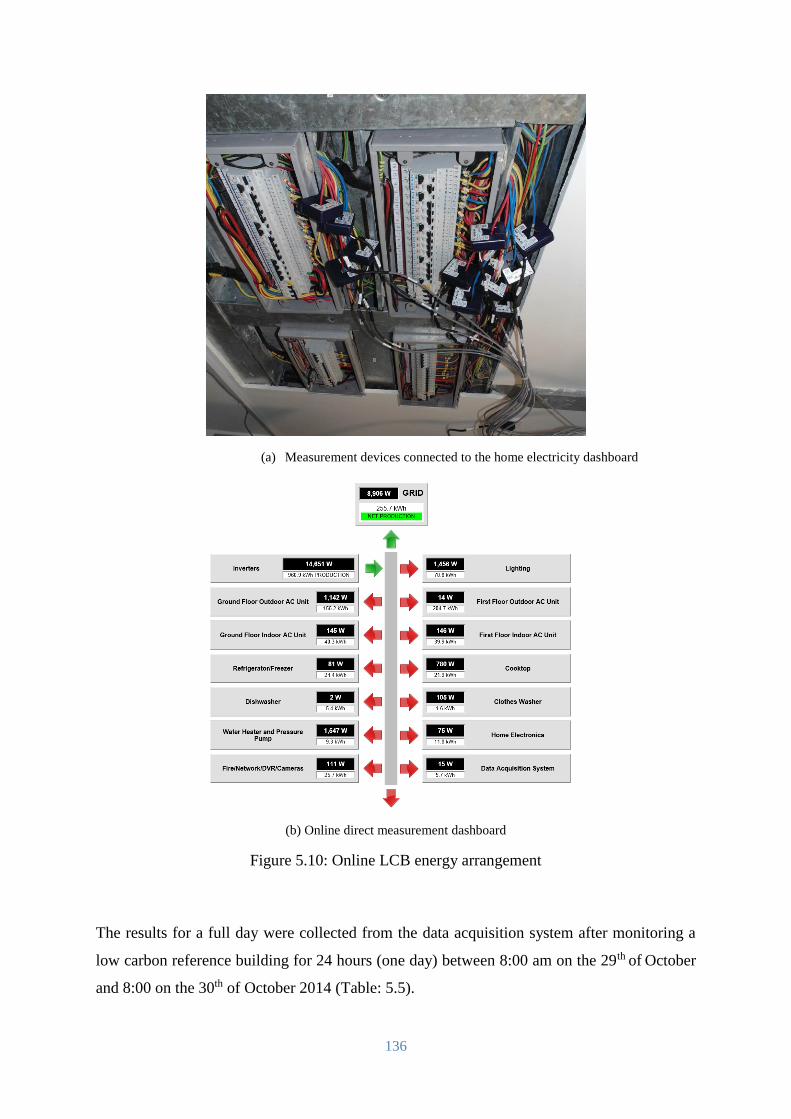
136
(a) Measurement devices connected to the home electricity dashboard
(b) Online direct measurement dashboard
Figure 5.10: Online LCB energy arrangement
The results for a full day were collected from the data acquisition system after monitoring a
low carbon reference building for 24 hours (one day) between 8:00 am on the 29th of October
and 8:00 on the 30th of October 2014 (Table: 5.5).
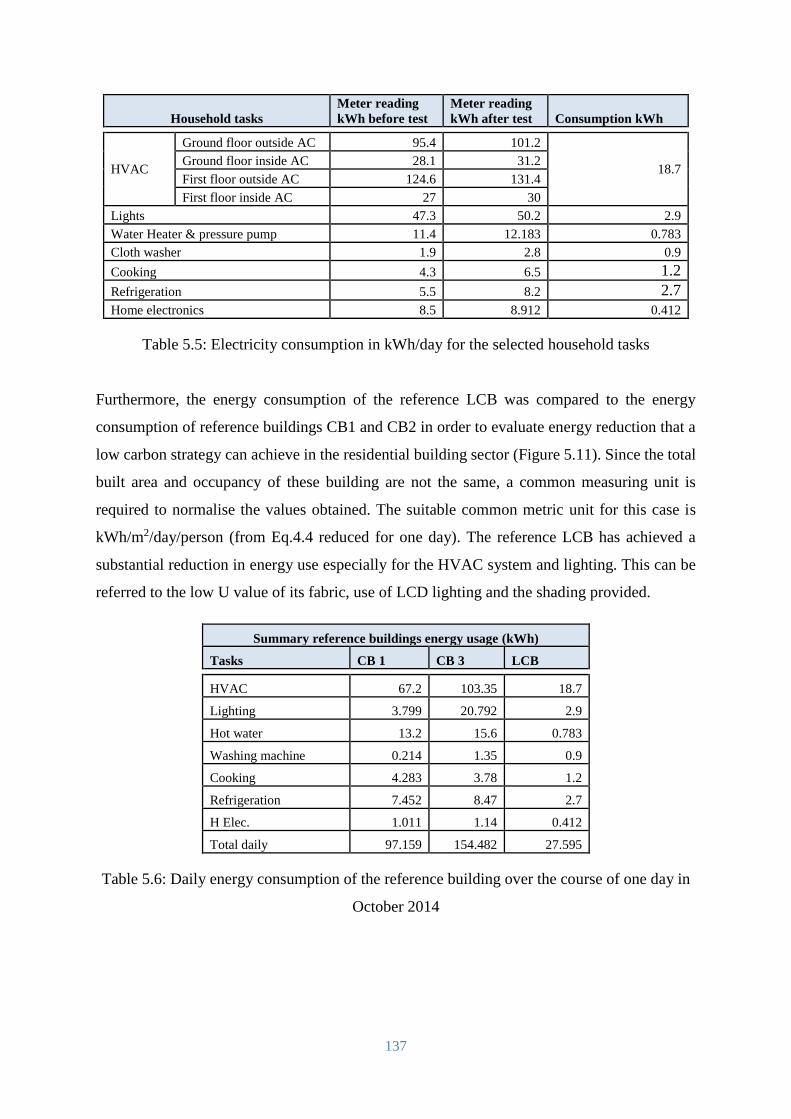
137
Household tasks
Meter reading
kWh before test
Meter reading
kWh after test Consumption kWh
HVAC
Ground floor outside AC 95.4 101.2
18.7 Ground floor inside AC 28.1 31.2
First floor outside AC 124.6 131.4
First floor inside AC 27 30
Lights 47.3 50.2 2.9
Water Heater & pressure pump 11.4 12.183 0.783
Cloth washer 1.9 2.8 0.9
Cooking 4.3 6.5 1.2
Refrigeration 5.5 8.2 2.7
Home electronics 8.5 8.912 0.412
Table 5.5: Electricity consumption in kWh/day for the selected household tasks
Furthermore, the energy consumption of the reference LCB was compared to the energy
consumption of reference buildings CB1 and CB2 in order to evaluate energy reduction that a
low carbon strategy can achieve in the residential building sector (Figure 5.11). Since the total
built area and occupancy of these building are not the same, a common measuring unit is
required to normalise the values obtained. The suitable common metric unit for this case is
kWh/m2/day/person (from Eq.4.4 reduced for one day). The reference LCB has achieved a
substantial reduction in energy use especially for the HVAC system and lighting. This can be
referred to the low U value of its fabric, use of LCD lighting and the shading provided.
Summary reference buildings energy usage (kWh)
Tasks CB 1 CB 3 LCB
HVAC 67.2 103.35 18.7
Lighting 3.799 20.792 2.9
Hot water 13.2 15.6 0.783
Washing machine 0.214 1.35 0.9
Cooking 4.283 3.78 1.2
Refrigeration 7.452 8.47 2.7
H Elec. 1.011 1.14 0.412
Total daily 97.159 154.482 27.595
Table 5.6: Daily energy consumption of the reference building over the course of one day in
October 2014
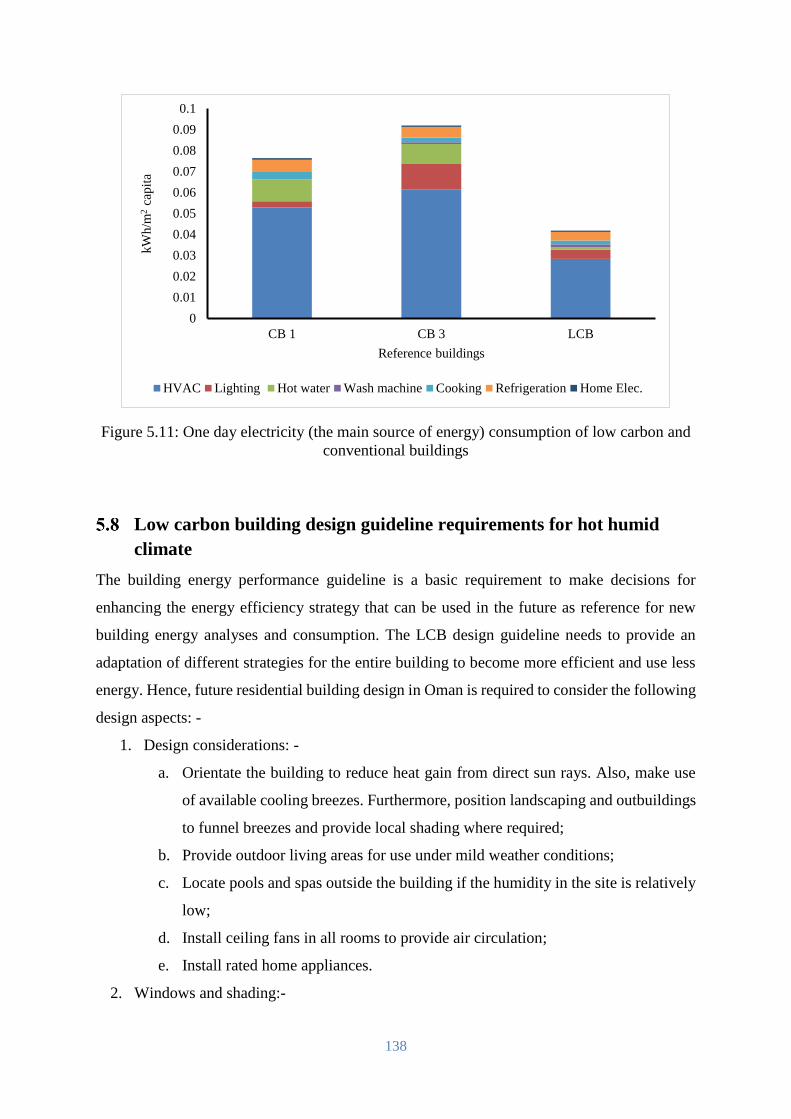
138
Figure 5.11: One day electricity (the main source of energy) consumption of low carbon and
conventional buildings
Low carbon building design guideline requirements for hot humid
climate
The building energy performance guideline is a basic requirement to make decisions for
enhancing the energy efficiency strategy that can be used in the future as reference for new
building energy analyses and consumption. The LCB design guideline needs to provide an
adaptation of different strategies for the entire building to become more efficient and use less
energy. Hence, future residential building design in Oman is required to consider the following
design aspects: -
1. Design considerations: -
a. Orientate the building to reduce heat gain from direct sun rays. Also, make use
of available cooling breezes. Furthermore, position landscaping and outbuildings
to funnel breezes and provide local shading where required;
b. Provide outdoor living areas for use under mild weather conditions;
c. Locate pools and spas outside the building if the humidity in the site is relatively
low;
d. Install ceiling fans in all rooms to provide air circulation;
e. Install rated home appliances.
2. Windows and shading:-
0
0.01
0.02
0.03
0.04
0.05
0.06
0.07
0.08
0.09
0.1
CB 1 CB 3 LCB
kW
h/m
2ca
pit
a
Reference buildings
HVAC Lighting Hot water Wash machine Cooking Refrigeration Home Elec.
139
a. Shade all windows and walls where possible;
b. Avoid overuse of glazing;
c. Use low solar heat gain coefficient glazing;
3. Construction systems:-
a. Use lightweight (low mass) construction (recommended for hot humid weather);
b. Use light coloured reflective materials for the building exterior;
c. Design and build for local site conditions;
d. Insulate internal wall surfaces from any external thermal mass;
e. Exclude solar radiation from roofs, windows and walls;
f. Consider shading the whole building;
g. Select appropriate insulation levels for the climate zone.
Chapter summary
A vast body of literature, ranging from the background of energy use and indoor environment to
the research approaches used in associated studies, has been comprehensively surveyed in this
chapter in order to identify the key attributes of low carbon buildings for a hot and humid climate.
It analysed the pilot case study houses, where the energy consumption for various home tasks
was evaluated. The objective of this case study was to generate effective raw data for pre-
processing and analysis purposes. In conclusion, this chapter: -
1. Established the building energy system for evaluating the energy consumption of
residential buildings for energy benchmarking;
2. Analysed the building energy sub-system and parameter controlling demands;
3. Reviewed the building energy reduction measures for low carbon strategies in the hot
and humid climate;
4. Analysed the building energy profile for the energy diagnostic and strategy application
through a case study;
5. Identified the key attributes for the low carbon guideline design for a hot and humid
climate.
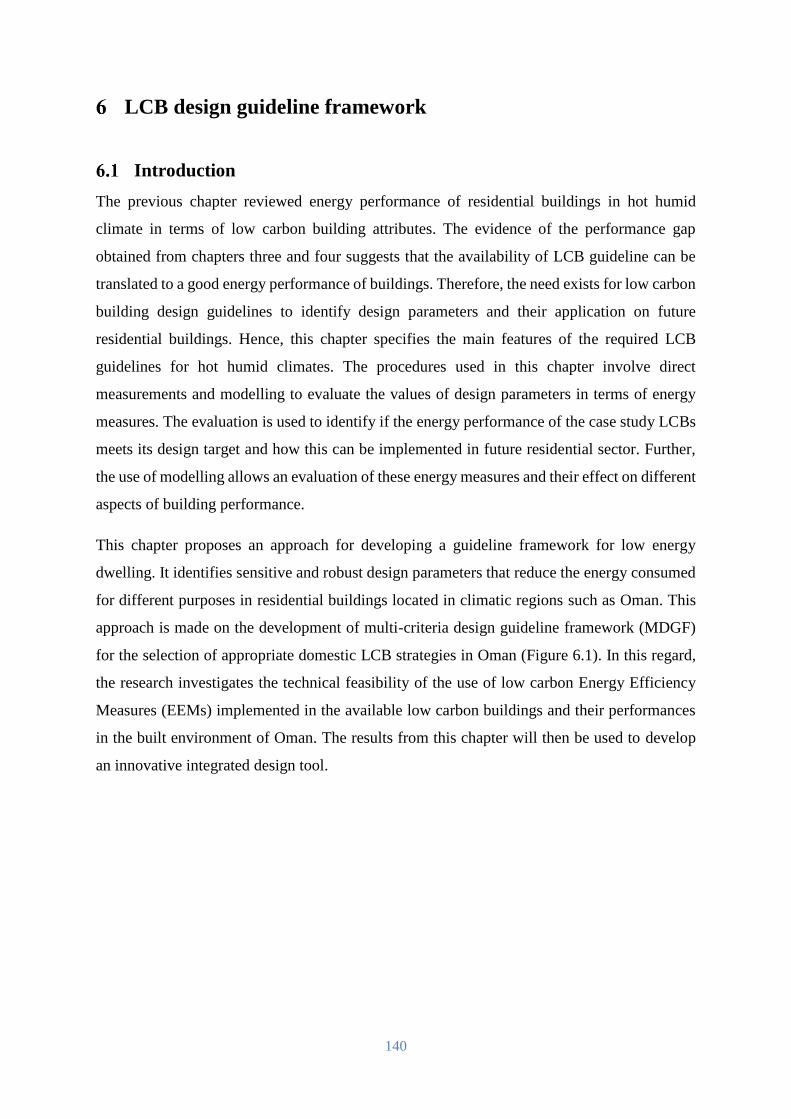
140
LCB design guideline framework
Introduction
The previous chapter reviewed energy performance of residential buildings in hot humid
climate in terms of low carbon building attributes. The evidence of the performance gap
obtained from chapters three and four suggests that the availability of LCB guideline can be
translated to a good energy performance of buildings. Therefore, the need exists for low carbon
building design guidelines to identify design parameters and their application on future
residential buildings. Hence, this chapter specifies the main features of the required LCB
guidelines for hot humid climates. The procedures used in this chapter involve direct
measurements and modelling to evaluate the values of design parameters in terms of energy
measures. The evaluation is used to identify if the energy performance of the case study LCBs
meets its design target and how this can be implemented in future residential sector. Further,
the use of modelling allows an evaluation of these energy measures and their effect on different
aspects of building performance.
This chapter proposes an approach for developing a guideline framework for low energy
dwelling. It identifies sensitive and robust design parameters that reduce the energy consumed
for different purposes in residential buildings located in climatic regions such as Oman. This
approach is made on the development of multi-criteria design guideline framework (MDGF)
for the selection of appropriate domestic LCB strategies in Oman (Figure 6.1). In this regard,
the research investigates the technical feasibility of the use of low carbon Energy Efficiency
Measures (EEMs) implemented in the available low carbon buildings and their performances
in the built environment of Oman. The results from this chapter will then be used to develop
an innovative integrated design tool.
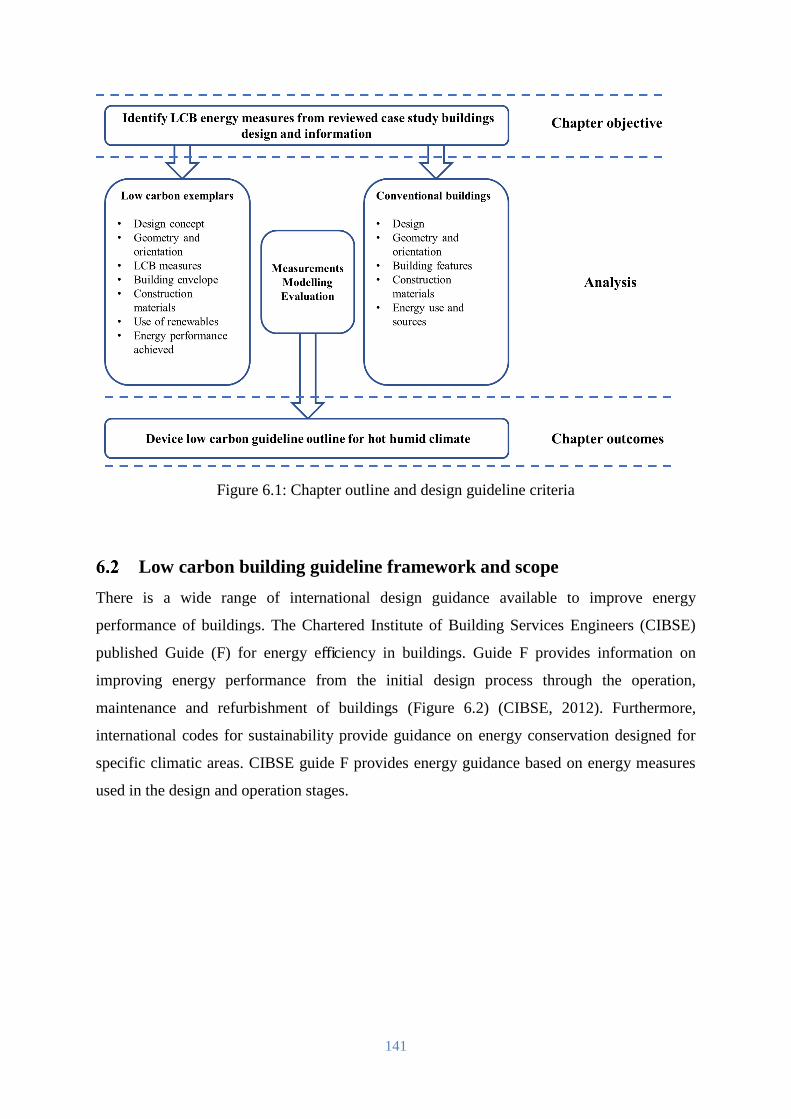
141
Figure 6.1: Chapter outline and design guideline criteria
Low carbon building guideline framework and scope
There is a wide range of international design guidance available to improve energy
performance of buildings. The Chartered Institute of Building Services Engineers (CIBSE)
published Guide (F) for energy efficiency in buildings. Guide F provides information on
improving energy performance from the initial design process through the operation,
maintenance and refurbishment of buildings (Figure 6.2) (CIBSE, 2012). Furthermore,
international codes for sustainability provide guidance on energy conservation designed for
specific climatic areas. CIBSE guide F provides energy guidance based on energy measures
used in the design and operation stages.
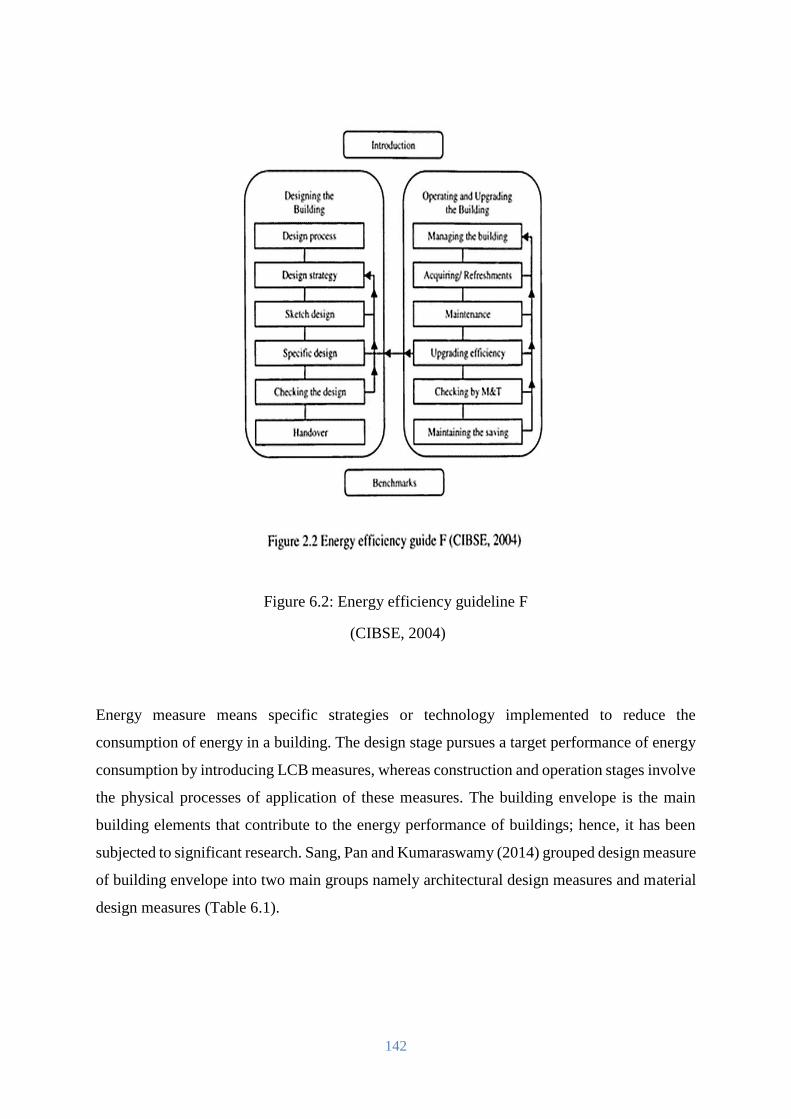
142
Figure 6.2: Energy efficiency guideline F
(CIBSE, 2004)
Energy measure means specific strategies or technology implemented to reduce the
consumption of energy in a building. The design stage pursues a target performance of energy
consumption by introducing LCB measures, whereas construction and operation stages involve
the physical processes of application of these measures. The building envelope is the main
building elements that contribute to the energy performance of buildings; hence, it has been
subjected to significant research. Sang, Pan and Kumaraswamy (2014) grouped design measure
of building envelope into two main groups namely architectural design measures and material
design measures (Table 6.1).
143
Architectural design measures Material design measures
Optimise building form to minimize heat gains through
surface;
Insulate the exterior wall and roof to avoid
humid air infiltration to reduce
dehumidification energy;
Orient building towards north-south exposures to take
advantage of north–south day-lighting
Use high performance concrete for its thermal
mass;
Turn long facades toward the prevailing breezes to
enhance natural ventilation
Use reflective exterior wall/roof finishes to
reduce solar heat gain;
Employ solar shading devices to block direct solar
radiation;
Use innovative construction materials, e.g.
Fibber-reinforced polymer;
Use innovative wall type, e.g. double skin wall; Incorporate windows with low-e or reflective
coating;
Proper design of window area and size (window to wall
ratio);
Incorporate windows with tinted or multiple
layers of glazing;
Install wing walls to improve natural ventilation; Incorporate windows with thermally improved
frame.
Install light shelves to penetrate daylight deep into the
building.
Table 6.1: Building envelope energy measures
(Sang, Pan and Kumaraswamy, 2014)
Aksamija (2013) stated that there are four main consideration for designing high performance
building in the hot climate:
Solar control: protection of the building facade from direct solar radiation by self-
shading methods (using building form) or introducing shading devices
Reduction of external heat gains: protection from solar heat gain by infiltration using
well-insulated opaque envelope elements and from conduction by using shading
devices
Cooling: optimise natural ventilation when weather conditions and environmental
characteristics of the building permit
Daylight: use of natural light sources while minimizing solar heat gain through use of
shading devices and light shelves
The success of LCB energy measures in the operation stage depends on making the right
choices during design and their applicability in construction stage. In this regard, the energy
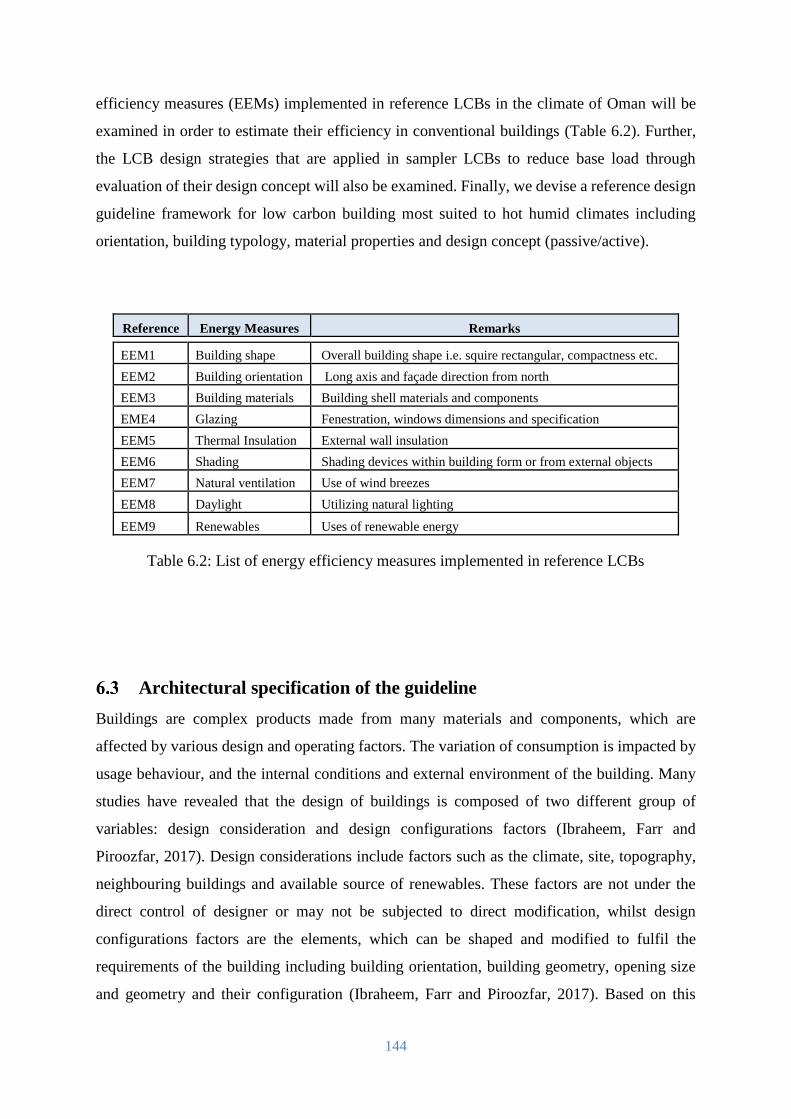
144
efficiency measures (EEMs) implemented in reference LCBs in the climate of Oman will be
examined in order to estimate their efficiency in conventional buildings (Table 6.2). Further,
the LCB design strategies that are applied in sampler LCBs to reduce base load through
evaluation of their design concept will also be examined. Finally, we devise a reference design
guideline framework for low carbon building most suited to hot humid climates including
orientation, building typology, material properties and design concept (passive/active).
Reference Energy Measures Remarks
EEM1 Building shape Overall building shape i.e. squire rectangular, compactness etc.
EEM2 Building orientation Long axis and façade direction from north
EEM3 Building materials Building shell materials and components
EME4 Glazing Fenestration, windows dimensions and specification
EEM5 Thermal Insulation External wall insulation
EEM6 Shading Shading devices within building form or from external objects
EEM7 Natural ventilation Use of wind breezes
EEM8 Daylight Utilizing natural lighting
EEM9 Renewables Uses of renewable energy
Table 6.2: List of energy efficiency measures implemented in reference LCBs
Architectural specification of the guideline
Buildings are complex products made from many materials and components, which are
affected by various design and operating factors. The variation of consumption is impacted by
usage behaviour, and the internal conditions and external environment of the building. Many
studies have revealed that the design of buildings is composed of two different group of
variables: design consideration and design configurations factors (Ibraheem, Farr and
Piroozfar, 2017). Design considerations include factors such as the climate, site, topography,
neighbouring buildings and available source of renewables. These factors are not under the
direct control of designer or may not be subjected to direct modification, whilst design
configurations factors are the elements, which can be shaped and modified to fulfil the
requirements of the building including building orientation, building geometry, opening size
and geometry and their configuration (Ibraheem, Farr and Piroozfar, 2017). Based on this
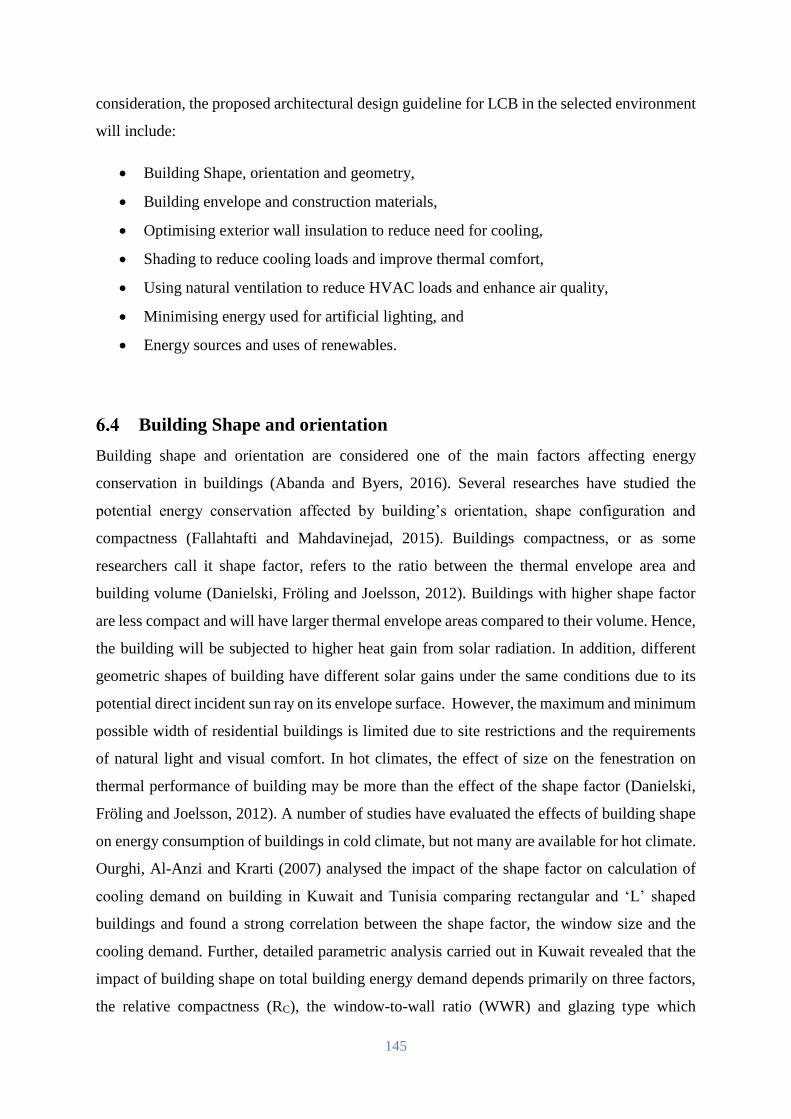
145
consideration, the proposed architectural design guideline for LCB in the selected environment
will include:
Building Shape, orientation and geometry,
Building envelope and construction materials,
Optimising exterior wall insulation to reduce need for cooling,
Shading to reduce cooling loads and improve thermal comfort,
Using natural ventilation to reduce HVAC loads and enhance air quality,
Minimising energy used for artificial lighting, and
Energy sources and uses of renewables.
Building Shape and orientation
Building shape and orientation are considered one of the main factors affecting energy
conservation in buildings (Abanda and Byers, 2016). Several researches have studied the
potential energy conservation affected by building’s orientation, shape configuration and
compactness (Fallahtafti and Mahdavinejad, 2015). Buildings compactness, or as some
researchers call it shape factor, refers to the ratio between the thermal envelope area and
building volume (Danielski, Fröling and Joelsson, 2012). Buildings with higher shape factor
are less compact and will have larger thermal envelope areas compared to their volume. Hence,
the building will be subjected to higher heat gain from solar radiation. In addition, different
geometric shapes of building have different solar gains under the same conditions due to its
potential direct incident sun ray on its envelope surface. However, the maximum and minimum
possible width of residential buildings is limited due to site restrictions and the requirements
of natural light and visual comfort. In hot climates, the effect of size on the fenestration on
thermal performance of building may be more than the effect of the shape factor (Danielski,
Fröling and Joelsson, 2012). A number of studies have evaluated the effects of building shape
on energy consumption of buildings in cold climate, but not many are available for hot climate.
Ourghi, Al-Anzi and Krarti (2007) analysed the impact of the shape factor on calculation of
cooling demand on building in Kuwait and Tunisia comparing rectangular and ‘L’ shaped
buildings and found a strong correlation between the shape factor, the window size and the
cooling demand. Further, detailed parametric analysis carried out in Kuwait revealed that the
impact of building shape on total building energy demand depends primarily on three factors,
the relative compactness (RC), the window-to-wall ratio (WWR) and glazing type which
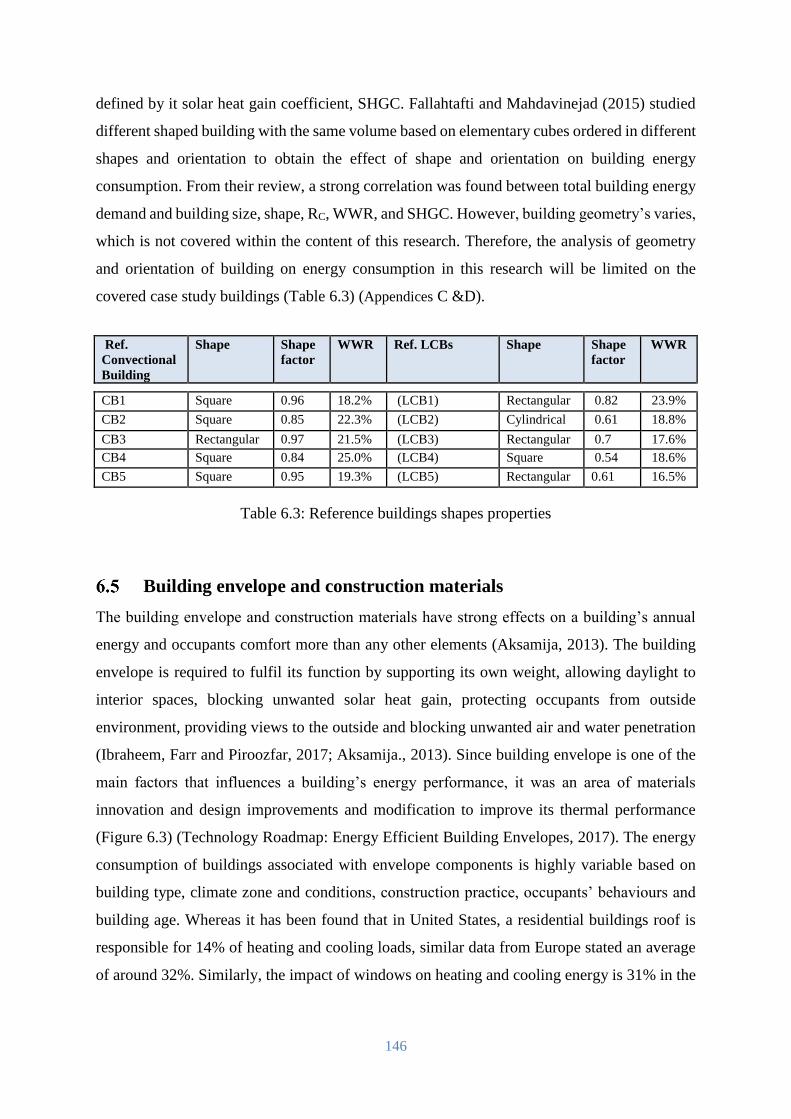
146
defined by it solar heat gain coefficient, SHGC. Fallahtafti and Mahdavinejad (2015) studied
different shaped building with the same volume based on elementary cubes ordered in different
shapes and orientation to obtain the effect of shape and orientation on building energy
consumption. From their review, a strong correlation was found between total building energy
demand and building size, shape, RC, WWR, and SHGC. However, building geometry’s varies,
which is not covered within the content of this research. Therefore, the analysis of geometry
and orientation of building on energy consumption in this research will be limited on the
covered case study buildings (Table 6.3) (Appendices C &D).
Table 6.3: Reference buildings shapes properties
Building envelope and construction materials
The building envelope and construction materials have strong effects on a building’s annual
energy and occupants comfort more than any other elements (Aksamija, 2013). The building
envelope is required to fulfil its function by supporting its own weight, allowing daylight to
interior spaces, blocking unwanted solar heat gain, protecting occupants from outside
environment, providing views to the outside and blocking unwanted air and water penetration
(Ibraheem, Farr and Piroozfar, 2017; Aksamija., 2013). Since building envelope is one of the
main factors that influences a building’s energy performance, it was an area of materials
innovation and design improvements and modification to improve its thermal performance
(Figure 6.3) (Technology Roadmap: Energy Efficient Building Envelopes, 2017). The energy
consumption of buildings associated with envelope components is highly variable based on
building type, climate zone and conditions, construction practice, occupants’ behaviours and
building age. Whereas it has been found that in United States, a residential buildings roof is
responsible for 14% of heating and cooling loads, similar data from Europe stated an average
of around 32%. Similarly, the impact of windows on heating and cooling energy is 31% in the
Ref.
Convectional
Building
Shape Shape
factor
WWR Ref. LCBs Shape Shape
factor
WWR
CB1 Square 0.96 18.2% (LCB1) Rectangular 0.82 23.9%
CB2 Square 0.85 22.3% (LCB2) Cylindrical 0.61 18.8%
CB3 Rectangular 0.97 21.5% (LCB3) Rectangular 0.7 17.6%
CB4 Square 0.84 25.0% (LCB4) Square 0.54 18.6%
CB5 Square 0.95 19.3% (LCB5) Rectangular 0.61 16.5%
147
United States and 15% in Europe (Transition to Sustainable Buildings Strategies and
Opportunities to 2050, 2013).
Figure 6.3: Progress of development of LCB envelope
(Resource: Technology Roadmap: Energy Efficient Building Envelopes, 2013)
6.5.1 Building envelope
The envelope of building consists of opaque areas and fenestration includes windows that are
separating internal environment from external environment. Whole Building Design Guide
(WBDG) (2017), stated that building envelope is the enclosed area surrounding the internal of
the building consists of the foundation, walls, doors, windows, roof, and any elements included
in the shell of the building. ASHRAE (2007) 90.1, provides periodically updated
recommendations for building envelopes based on climatic zones, within which the building
envelope is divided into four major systems:
Below grade system: element separates building environment from the ground,
Wall system: the vertical opaque parts of the envelope e of the building.
Roof system: refers to the overheads opaque elements separates buildings’
environment from the external.
Fenestration system: include all glazed area windows, louvers and entrances.
Building envelopes are often constructed from various layers of materials with relative
thicknesses arranged to yield better thermal insulation based on the use of the building and
148
whether conditions (Bojić and Loveday, 1997). Wall, roof and fenestrations are more subjected
to heat gains. Therefore, they have been targets for material improvements since the early
twentieth century due to material innovation (Arnold, 2017). These elements of the envelope
will be considered in this research to identify energy-efficient design measures through a
detailed review of these systems in both groups of the referenced buildings.
6.5.2 External walls design and materials
Walls, for thermal envelope evaluation of building comprises of four main elements include
exterior texture and colour, structural elements, insulation and interior finishes. Guidelines for
Condition Assessment of the Building Envelope (Standard ASCE/SEI 30-14) provide guidance
for assessing performance of building envelope systems and materials. The standard classified
building envelope into four groups namely mass walls, metal building walls, steel-framed
walls, wood-framed and other walls (Structural Engineering Institute. and American Society
of Civil Engineers., 2014). The envelope of single family residential buildings in Oman are
made of 220 mm thick precast concrete blocks and a reinforced concrete frame structure. The
exterior wall finishes including 10 - 20 mm sand cement plaster coated by paint and texture. In
the reviewed case study the LCBs and conventional building shows huge difference in building
fabric, which subsequently reflected in deference in energy consumption of buildings (Table
6.4) (Energy Balance, 2015). Building materials properties were collected from the reference
documents submitted to TRC, although windows U values for LCB3 seems to be higher than
expected value for double glazing window while it looks too low for triple glazing in LCB4.
However, these values will be used in this research at this stage, but these values will be
considered for modification if required at the modelling stage to expected values.
Hence, the need exists to improve the building fabric, and provide performance measures such
as insulation or cavity wall. Insulation is one of the widespread effective energy measures
adopted, and can be implemented within the building fabric, for an example in the external
walls and roof of a building. Furthermore, a wide range of materials can be applied with in the
building envelope acts as thermal insulation.
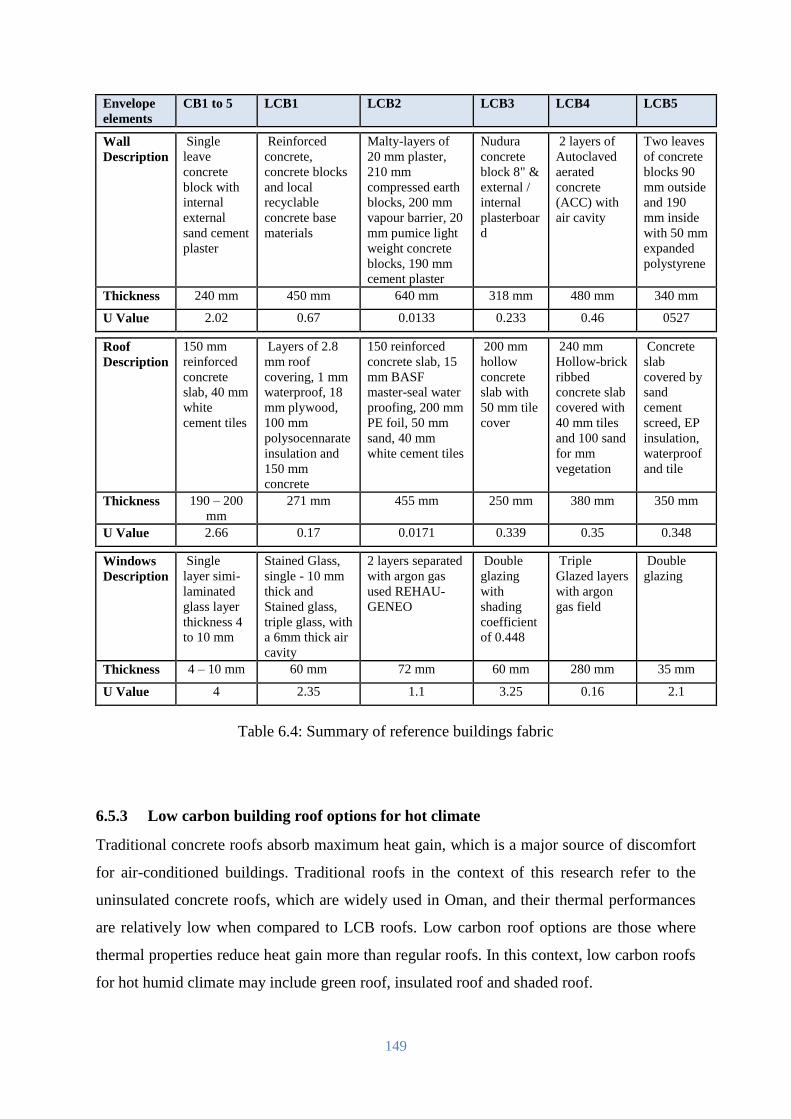
149
Envelope
elements
CB1 to 5 LCB1 LCB2 LCB3 LCB4 LCB5
Wall
Description
Single
leave
concrete
block with
internal
external
sand cement
plaster
Reinforced
concrete,
concrete blocks
and local
recyclable
concrete base
materials
Malty-layers of
20 mm plaster,
210 mm
compressed earth
blocks, 200 mm
vapour barrier, 20
mm pumice light
weight concrete
blocks, 190 mm
cement plaster
Nudura
concrete
block 8" &
external /
internal
plasterboar
d
2 layers of
Autoclaved
aerated
concrete
(ACC) with
air cavity
Two leaves
of concrete
blocks 90
mm outside
and 190
mm inside
with 50 mm
expanded
polystyrene
Thickness 240 mm 450 mm 640 mm 318 mm 480 mm 340 mm
U Value 2.02 0.67 0.0133 0.233 0.46 0527
Roof
Description
150 mm
reinforced
concrete
slab, 40 mm
white
cement tiles
Layers of 2.8
mm roof
covering, 1 mm
waterproof, 18
mm plywood,
100 mm
polysocennarate
insulation and
150 mm
concrete
150 reinforced
concrete slab, 15
mm BASF
master-seal water
proofing, 200 mm
PE foil, 50 mm
sand, 40 mm
white cement tiles
200 mm
hollow
concrete
slab with
50 mm tile
cover
240 mm
Hollow-brick
ribbed
concrete slab
covered with
40 mm tiles
and 100 sand
for mm
vegetation
Concrete
slab
covered by
sand
cement
screed, EP
insulation,
waterproof
and tile
Thickness 190 – 200
mm
271 mm 455 mm 250 mm 380 mm 350 mm
U Value 2.66 0.17 0.0171 0.339 0.35 0.348
Windows
Description
Single
layer simi-
laminated
glass layer
thickness 4
to 10 mm
Stained Glass,
single - 10 mm
thick and
Stained glass,
triple glass, with
a 6mm thick air
cavity
2 layers separated
with argon gas
used REHAU-
GENEO
Double
glazing
with
shading
coefficient
of 0.448
Triple
Glazed layers
with argon
gas field
Double
glazing
Thickness 4 – 10 mm 60 mm 72 mm 60 mm 280 mm 35 mm
U Value 4 2.35 1.1 3.25 0.16 2.1
Table 6.4: Summary of reference buildings fabric
6.5.3 Low carbon building roof options for hot climate
Traditional concrete roofs absorb maximum heat gain, which is a major source of discomfort
for air-conditioned buildings. Traditional roofs in the context of this research refer to the
uninsulated concrete roofs, which are widely used in Oman, and their thermal performances
are relatively low when compared to LCB roofs. Low carbon roof options are those where
thermal properties reduce heat gain more than regular roofs. In this context, low carbon roofs
for hot humid climate may include green roof, insulated roof and shaded roof.
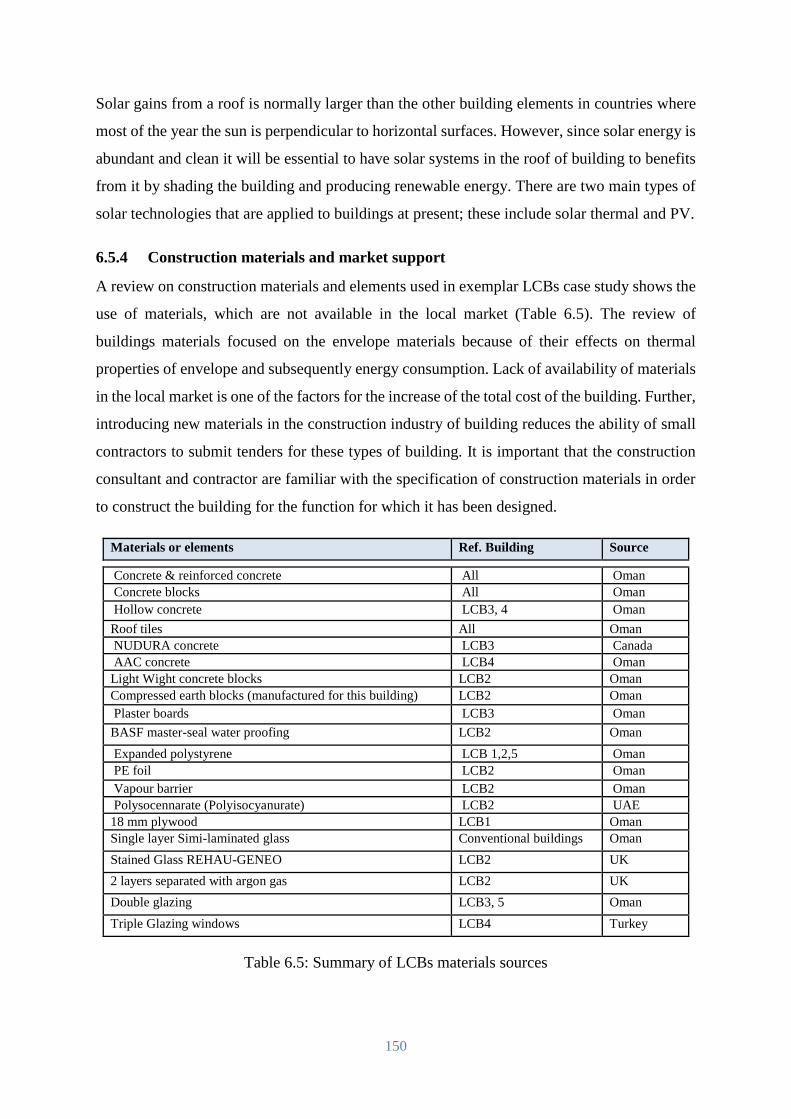
150
Solar gains from a roof is normally larger than the other building elements in countries where
most of the year the sun is perpendicular to horizontal surfaces. However, since solar energy is
abundant and clean it will be essential to have solar systems in the roof of building to benefits
from it by shading the building and producing renewable energy. There are two main types of
solar technologies that are applied to buildings at present; these include solar thermal and PV.
6.5.4 Construction materials and market support
A review on construction materials and elements used in exemplar LCBs case study shows the
use of materials, which are not available in the local market (Table 6.5). The review of
buildings materials focused on the envelope materials because of their effects on thermal
properties of envelope and subsequently energy consumption. Lack of availability of materials
in the local market is one of the factors for the increase of the total cost of the building. Further,
introducing new materials in the construction industry of building reduces the ability of small
contractors to submit tenders for these types of building. It is important that the construction
consultant and contractor are familiar with the specification of construction materials in order
to construct the building for the function for which it has been designed.
Materials or elements Ref. Building Source
Concrete & reinforced concrete All Oman
Concrete blocks All Oman
Hollow concrete LCB3, 4 Oman
Roof tiles All Oman
NUDURA concrete LCB3 Canada
AAC concrete LCB4 Oman
Light Wight concrete blocks LCB2 Oman
Compressed earth blocks (manufactured for this building) LCB2 Oman
Plaster boards LCB3 Oman
BASF master-seal water proofing LCB2 Oman
Expanded polystyrene LCB 1,2,5 Oman
PE foil LCB2 Oman
Vapour barrier LCB2 Oman
Polysocennarate (Polyisocyanurate) LCB2 UAE
18 mm plywood LCB1 Oman
Single layer Simi-laminated glass Conventional buildings Oman
Stained Glass REHAU-GENEO LCB2 UK
2 layers separated with argon gas LCB2 UK
Double glazing LCB3, 5 Oman
Triple Glazing windows LCB4 Turkey
Table 6.5: Summary of LCBs materials sources
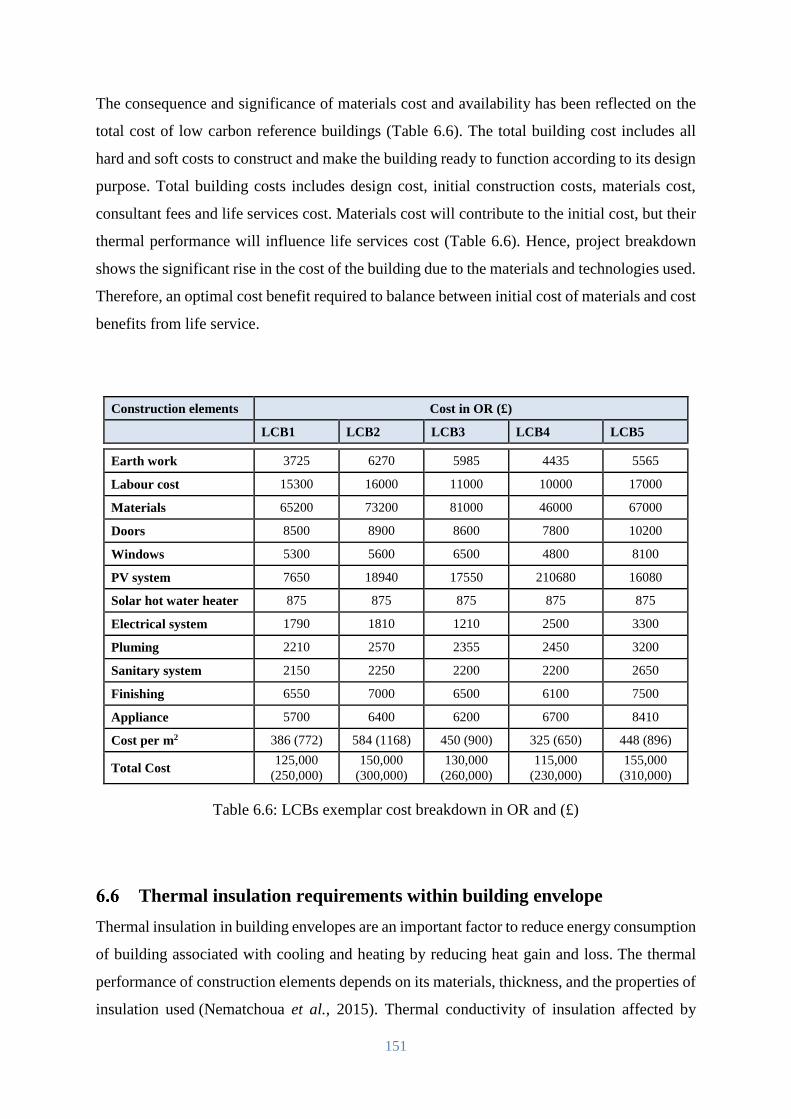
151
The consequence and significance of materials cost and availability has been reflected on the
total cost of low carbon reference buildings (Table 6.6). The total building cost includes all
hard and soft costs to construct and make the building ready to function according to its design
purpose. Total building costs includes design cost, initial construction costs, materials cost,
consultant fees and life services cost. Materials cost will contribute to the initial cost, but their
thermal performance will influence life services cost (Table 6.6). Hence, project breakdown
shows the significant rise in the cost of the building due to the materials and technologies used.
Therefore, an optimal cost benefit required to balance between initial cost of materials and cost
benefits from life service.
Construction elements Cost in OR (£)
LCB1 LCB2 LCB3 LCB4 LCB5
Earth work 3725 6270 5985 4435 5565
Labour cost 15300 16000 11000 10000 17000
Materials 65200 73200 81000 46000 67000
Doors 8500 8900 8600 7800 10200
Windows 5300 5600 6500 4800 8100
PV system 7650 18940 17550 210680 16080
Solar hot water heater 875 875 875 875 875
Electrical system 1790 1810 1210 2500 3300
Pluming 2210 2570 2355 2450 3200
Sanitary system 2150 2250 2200 2200 2650
Finishing 6550 7000 6500 6100 7500
Appliance 5700 6400 6200 6700 8410
Cost per m2 386 (772) 584 (1168) 450 (900) 325 (650) 448 (896)
Total Cost 125,000
(250,000)
150,000
(300,000)
130,000
(260,000)
115,000
(230,000)
155,000
(310,000)
Table 6.6: LCBs exemplar cost breakdown in OR and (£)
Thermal insulation requirements within building envelope
Thermal insulation in building envelopes are an important factor to reduce energy consumption
of building associated with cooling and heating by reducing heat gain and loss. The thermal
performance of construction elements depends on its materials, thickness, and the properties of
insulation used (Nematchoua et al., 2015). Thermal conductivity of insulation affected by
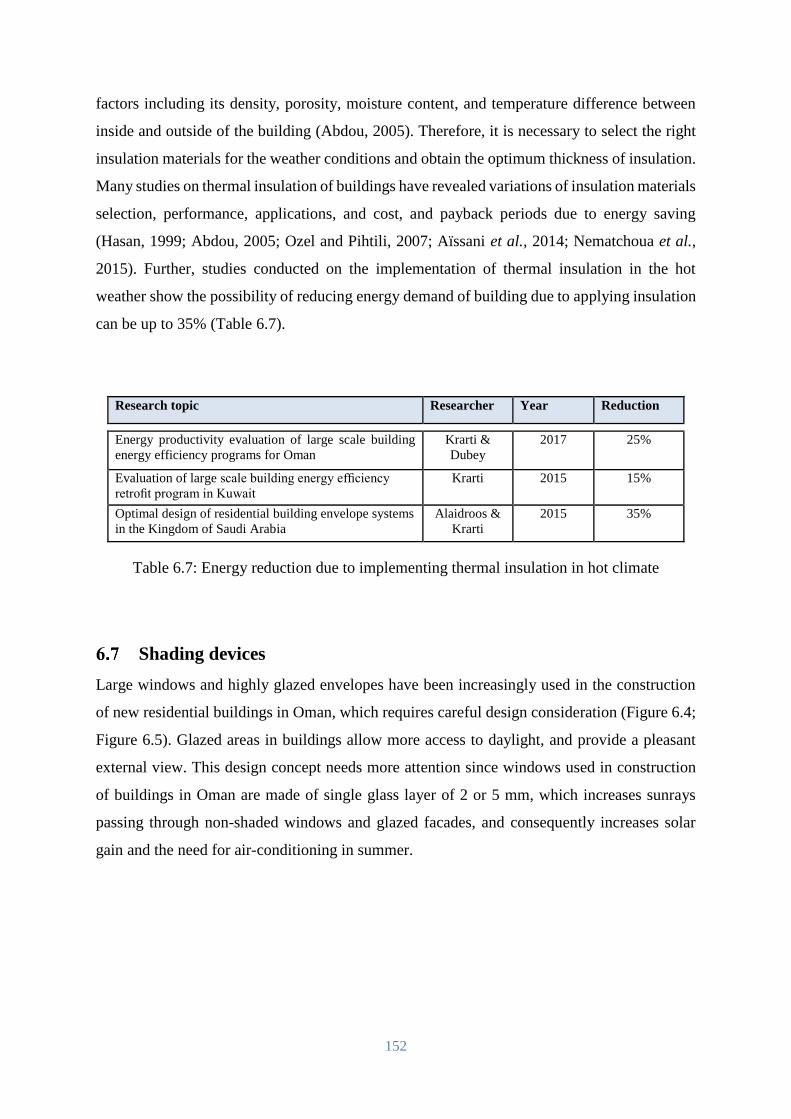
152
factors including its density, porosity, moisture content, and temperature difference between
inside and outside of the building (Abdou, 2005). Therefore, it is necessary to select the right
insulation materials for the weather conditions and obtain the optimum thickness of insulation.
Many studies on thermal insulation of buildings have revealed variations of insulation materials
selection, performance, applications, and cost, and payback periods due to energy saving
(Hasan, 1999; Abdou, 2005; Ozel and Pihtili, 2007; Aïssani et al., 2014; Nematchoua et al.,
2015). Further, studies conducted on the implementation of thermal insulation in the hot
weather show the possibility of reducing energy demand of building due to applying insulation
can be up to 35% (Table 6.7).
Research topic Researcher Year Reduction
Energy productivity evaluation of large scale building
energy efficiency programs for Oman
Krarti &
Dubey
2017 25%
Evaluation of large scale building energy efficiency
retrofit program in Kuwait
Krarti 2015 15%
Optimal design of residential building envelope systems
in the Kingdom of Saudi Arabia
Alaidroos &
Krarti
2015 35%
Table 6.7: Energy reduction due to implementing thermal insulation in hot climate
Shading devices
Large windows and highly glazed envelopes have been increasingly used in the construction
of new residential buildings in Oman, which requires careful design consideration (Figure 6.4;
Figure 6.5). Glazed areas in buildings allow more access to daylight, and provide a pleasant
external view. This design concept needs more attention since windows used in construction
of buildings in Oman are made of single glass layer of 2 or 5 mm, which increases sunrays
passing through non-shaded windows and glazed facades, and consequently increases solar
gain and the need for air-conditioning in summer.
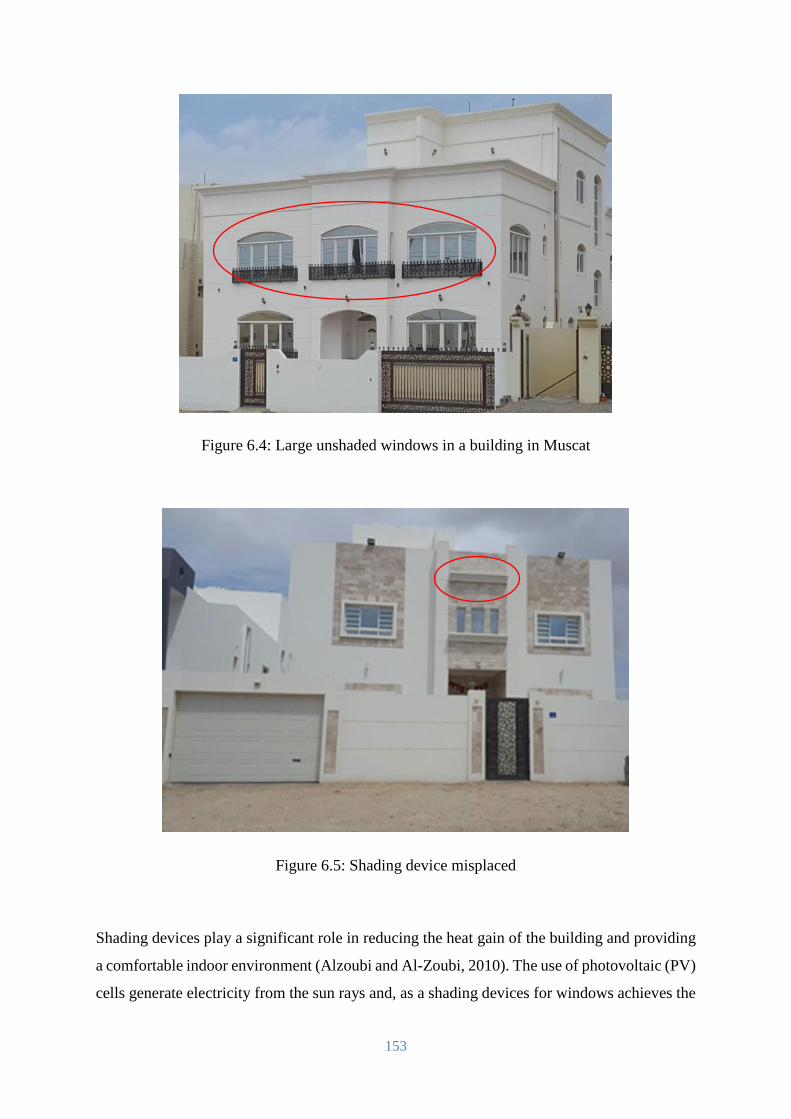
153
Figure 6.4: Large unshaded windows in a building in Muscat
Figure 6.5: Shading device misplaced
Shading devices play a significant role in reducing the heat gain of the building and providing
a comfortable indoor environment (Alzoubi and Al-Zoubi, 2010). The use of photovoltaic (PV)
cells generate electricity from the sun rays and, as a shading devices for windows achieves the
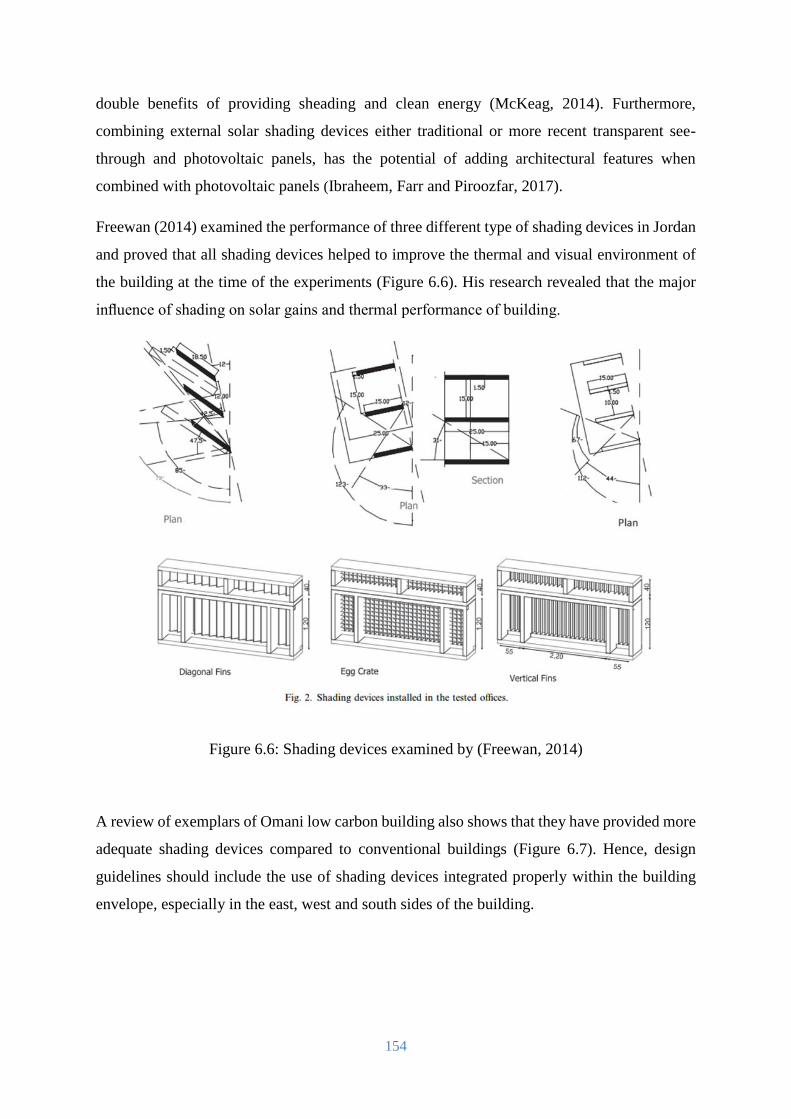
154
double benefits of providing sheading and clean energy (McKeag, 2014). Furthermore,
combining external solar shading devices either traditional or more recent transparent see-
through and photovoltaic panels, has the potential of adding architectural features when
combined with photovoltaic panels (Ibraheem, Farr and Piroozfar, 2017).
Freewan (2014) examined the performance of three different type of shading devices in Jordan
and proved that all shading devices helped to improve the thermal and visual environment of
the building at the time of the experiments (Figure 6.6). His research revealed that the major
influence of shading on solar gains and thermal performance of building.
Figure 6.6: Shading devices examined by (Freewan, 2014)
A review of exemplars of Omani low carbon building also shows that they have provided more
adequate shading devices compared to conventional buildings (Figure 6.7). Hence, design
guidelines should include the use of shading devices integrated properly within the building
envelope, especially in the east, west and south sides of the building.
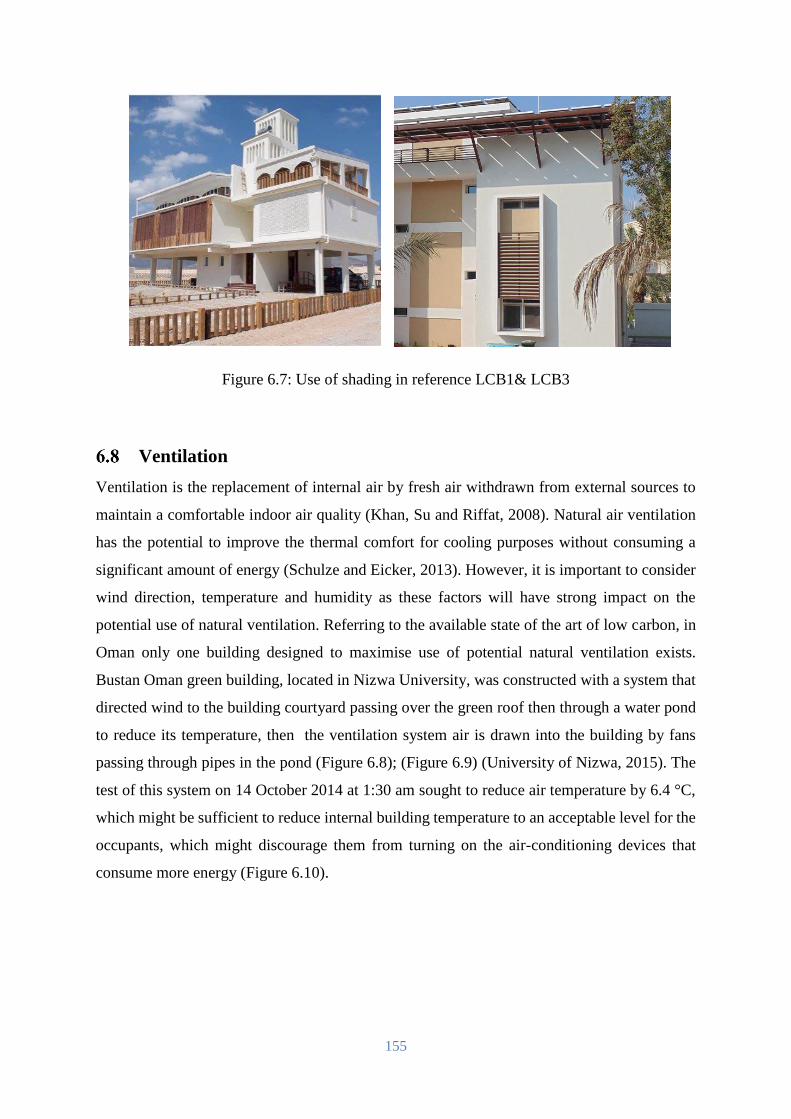
155
Figure 6.7: Use of shading in reference LCB1& LCB3
Ventilation
Ventilation is the replacement of internal air by fresh air withdrawn from external sources to
maintain a comfortable indoor air quality (Khan, Su and Riffat, 2008). Natural air ventilation
has the potential to improve the thermal comfort for cooling purposes without consuming a
significant amount of energy (Schulze and Eicker, 2013). However, it is important to consider
wind direction, temperature and humidity as these factors will have strong impact on the
potential use of natural ventilation. Referring to the available state of the art of low carbon, in
Oman only one building designed to maximise use of potential natural ventilation exists.
Bustan Oman green building, located in Nizwa University, was constructed with a system that
directed wind to the building courtyard passing over the green roof then through a water pond
to reduce its temperature, then the ventilation system air is drawn into the building by fans
passing through pipes in the pond (Figure 6.8); (Figure 6.9) (University of Nizwa, 2015). The
test of this system on 14 October 2014 at 1:30 am sought to reduce air temperature by 6.4 °C,
which might be sufficient to reduce internal building temperature to an acceptable level for the
occupants, which might discourage them from turning on the air-conditioning devices that
consume more energy (Figure 6.10).
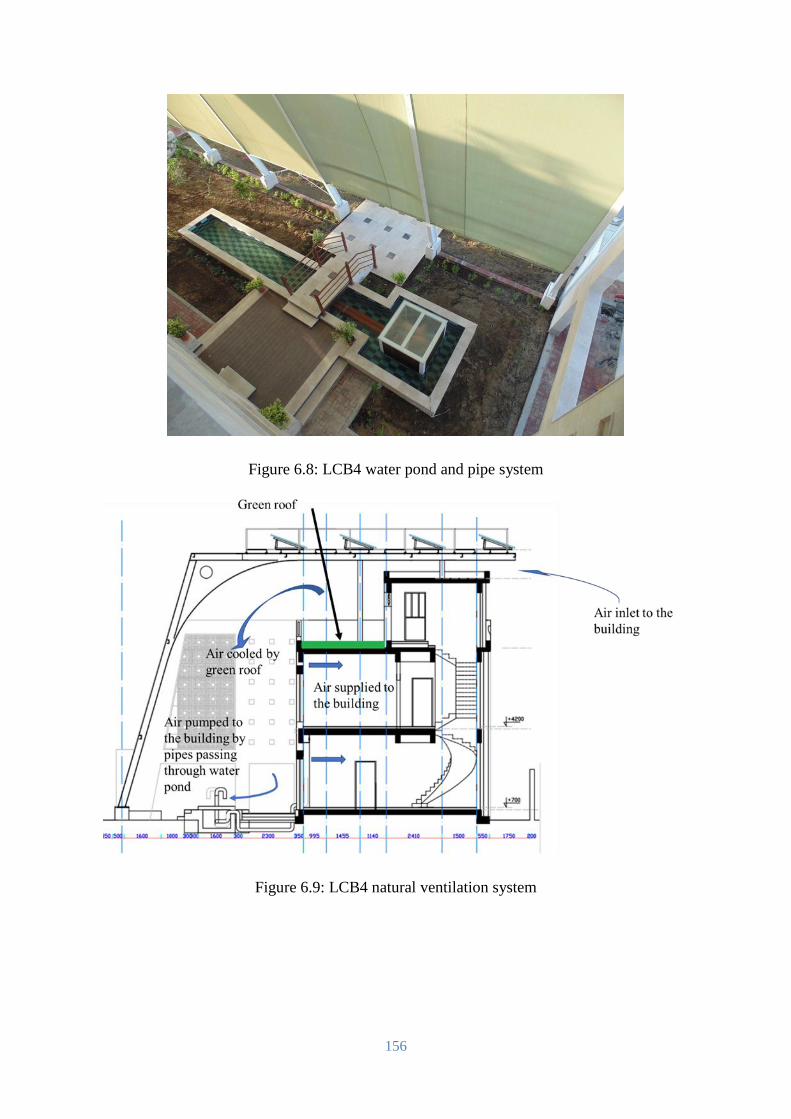
156
Figure 6.8: LCB4 water pond and pipe system
Figure 6.9: LCB4 natural ventilation system
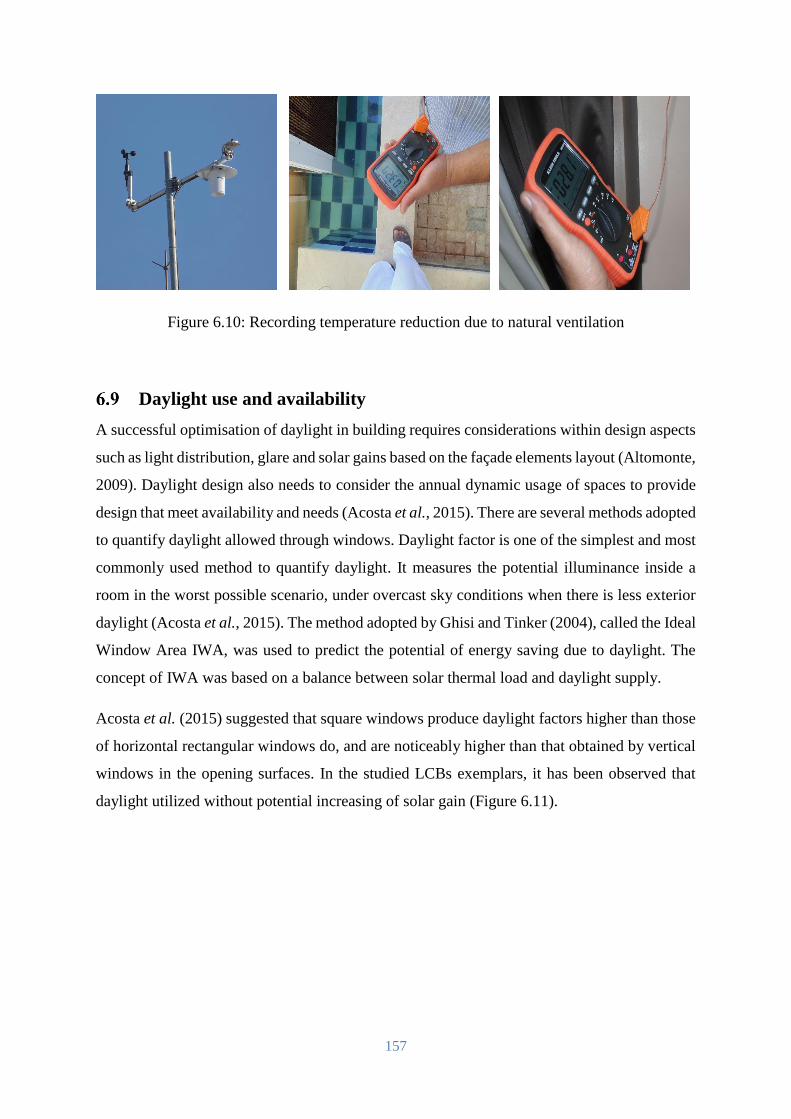
157
Figure 6.10: Recording temperature reduction due to natural ventilation
Daylight use and availability
A successful optimisation of daylight in building requires considerations within design aspects
such as light distribution, glare and solar gains based on the façade elements layout (Altomonte,
2009). Daylight design also needs to consider the annual dynamic usage of spaces to provide
design that meet availability and needs (Acosta et al., 2015). There are several methods adopted
to quantify daylight allowed through windows. Daylight factor is one of the simplest and most
commonly used method to quantify daylight. It measures the potential illuminance inside a
room in the worst possible scenario, under overcast sky conditions when there is less exterior
daylight (Acosta et al., 2015). The method adopted by Ghisi and Tinker (2004), called the Ideal
Window Area IWA, was used to predict the potential of energy saving due to daylight. The
concept of IWA was based on a balance between solar thermal load and daylight supply.
Acosta et al. (2015) suggested that square windows produce daylight factors higher than those
of horizontal rectangular windows do, and are noticeably higher than that obtained by vertical
windows in the opening surfaces. In the studied LCBs exemplars, it has been observed that
daylight utilized without potential increasing of solar gain (Figure 6.11).
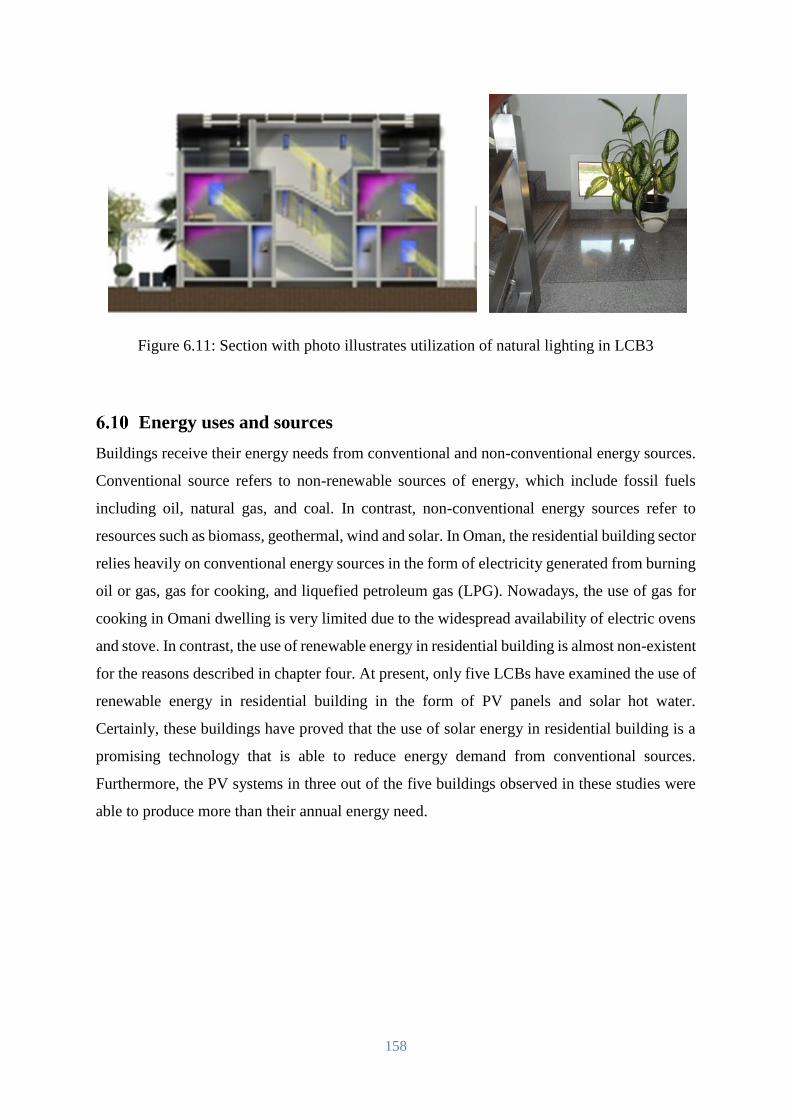
158
Figure 6.11: Section with photo illustrates utilization of natural lighting in LCB3
Energy uses and sources
Buildings receive their energy needs from conventional and non-conventional energy sources.
Conventional source refers to non-renewable sources of energy, which include fossil fuels
including oil, natural gas, and coal. In contrast, non-conventional energy sources refer to
resources such as biomass, geothermal, wind and solar. In Oman, the residential building sector
relies heavily on conventional energy sources in the form of electricity generated from burning
oil or gas, gas for cooking, and liquefied petroleum gas (LPG). Nowadays, the use of gas for
cooking in Omani dwelling is very limited due to the widespread availability of electric ovens
and stove. In contrast, the use of renewable energy in residential building is almost non-existent
for the reasons described in chapter four. At present, only five LCBs have examined the use of
renewable energy in residential building in the form of PV panels and solar hot water.
Certainly, these buildings have proved that the use of solar energy in residential building is a
promising technology that is able to reduce energy demand from conventional sources.
Furthermore, the PV systems in three out of the five buildings observed in these studies were
able to produce more than their annual energy need.
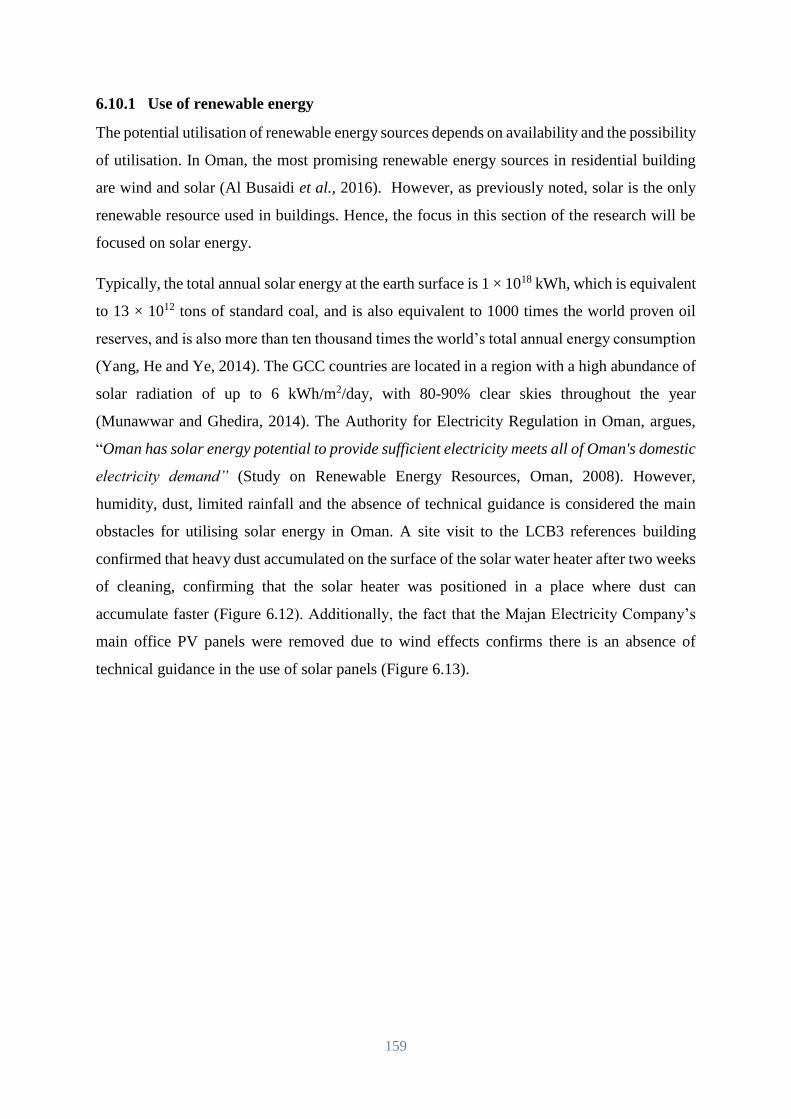
159
6.10.1 Use of renewable energy
The potential utilisation of renewable energy sources depends on availability and the possibility
of utilisation. In Oman, the most promising renewable energy sources in residential building
are wind and solar (Al Busaidi et al., 2016). However, as previously noted, solar is the only
renewable resource used in buildings. Hence, the focus in this section of the research will be
focused on solar energy.
Typically, the total annual solar energy at the earth surface is 1 × 10¹⁸ kWh, which is equivalent
to 13 × 1012 tons of standard coal, and is also equivalent to 1000 times the world proven oil
reserves, and is also more than ten thousand times the world’s total annual energy consumption
(Yang, He and Ye, 2014). The GCC countries are located in a region with a high abundance of
solar radiation of up to 6 kWh/m2/day, with 80-90% clear skies throughout the year
(Munawwar and Ghedira, 2014). The Authority for Electricity Regulation in Oman, argues,
“Oman has solar energy potential to provide sufficient electricity meets all of Oman's domestic
electricity demand” (Study on Renewable Energy Resources, Oman, 2008). However,
humidity, dust, limited rainfall and the absence of technical guidance is considered the main
obstacles for utilising solar energy in Oman. A site visit to the LCB3 references building
confirmed that heavy dust accumulated on the surface of the solar water heater after two weeks
of cleaning, confirming that the solar heater was positioned in a place where dust can
accumulate faster (Figure 6.12). Additionally, the fact that the Majan Electricity Company’s
main office PV panels were removed due to wind effects confirms there is an absence of
technical guidance in the use of solar panels (Figure 6.13).
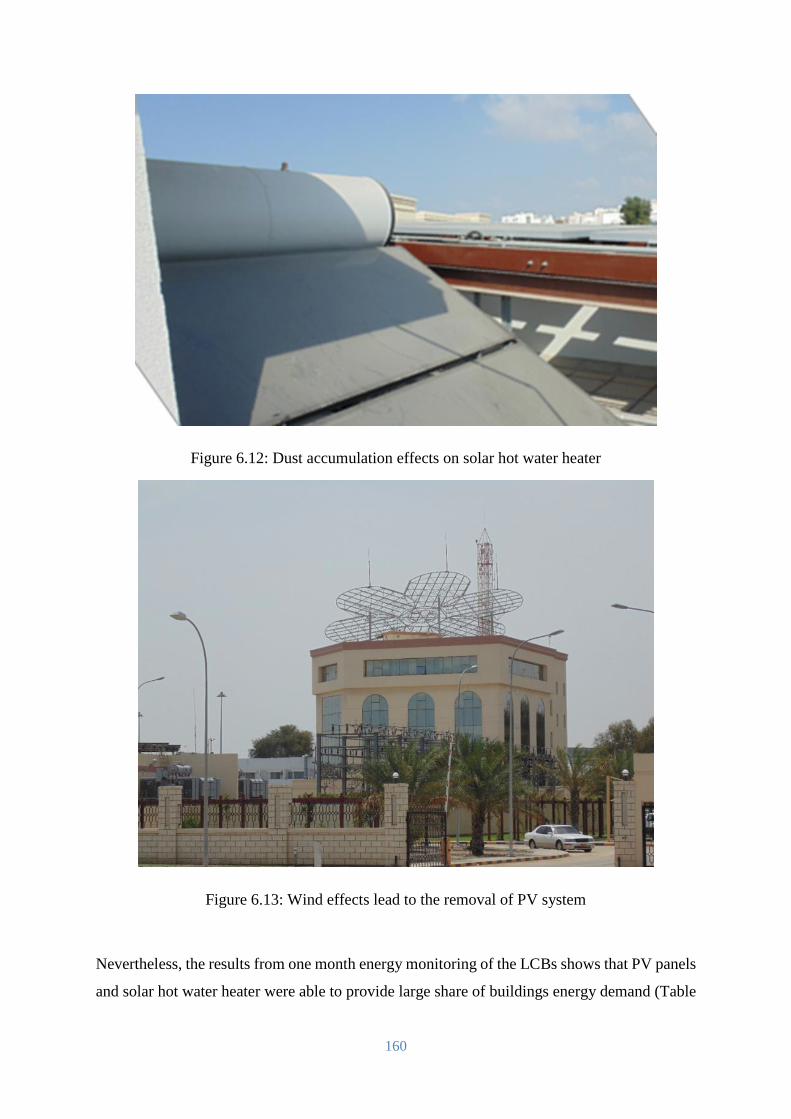
160
Figure 6.12: Dust accumulation effects on solar hot water heater
Figure 6.13: Wind effects lead to the removal of PV system
Nevertheless, the results from one month energy monitoring of the LCBs shows that PV panels
and solar hot water heater were able to provide large share of buildings energy demand (Table
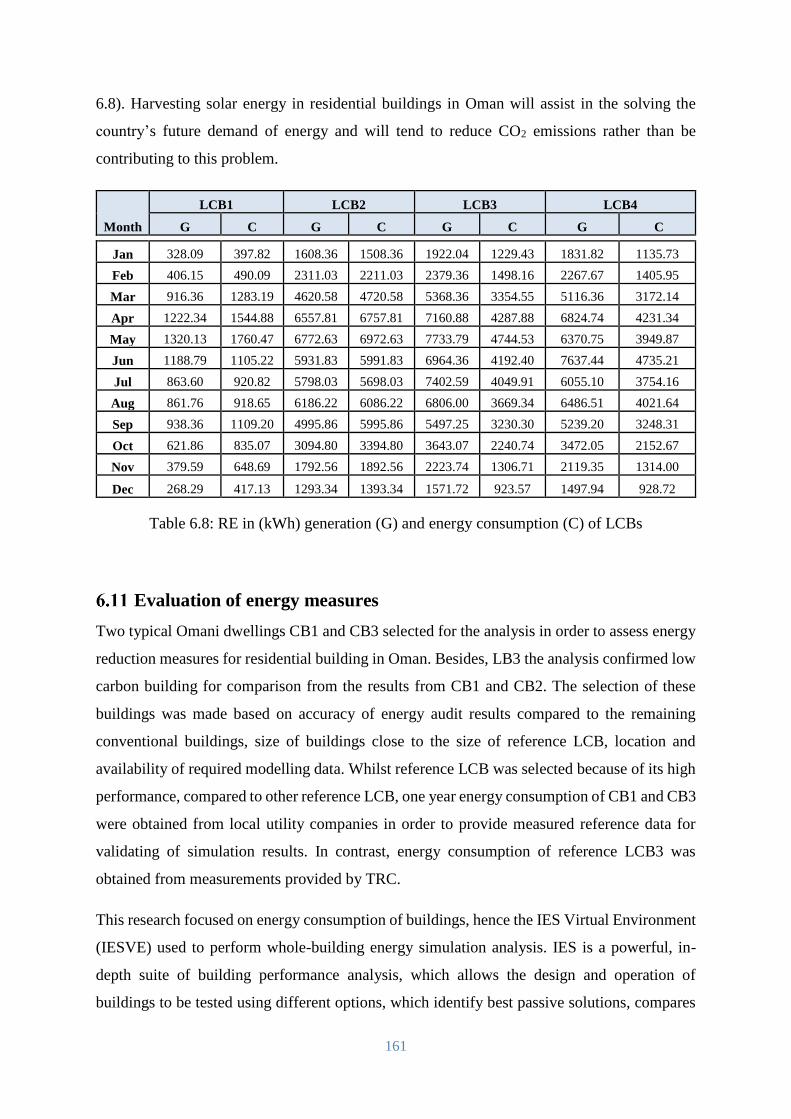
161
6.8). Harvesting solar energy in residential buildings in Oman will assist in the solving the
country’s future demand of energy and will tend to reduce CO2 emissions rather than be
contributing to this problem.
Month
LCB1 LCB2 LCB3 LCB4
G C G C G C G C
Jan 328.09 397.82 1608.36 1508.36 1922.04 1229.43 1831.82 1135.73
Feb 406.15 490.09 2311.03 2211.03 2379.36 1498.16 2267.67 1405.95
Mar 916.36 1283.19 4620.58 4720.58 5368.36 3354.55 5116.36 3172.14
Apr 1222.34 1544.88 6557.81 6757.81 7160.88 4287.88 6824.74 4231.34
May 1320.13 1760.47 6772.63 6972.63 7733.79 4744.53 6370.75 3949.87
Jun 1188.79 1105.22 5931.83 5991.83 6964.36 4192.40 7637.44 4735.21
Jul 863.60 920.82 5798.03 5698.03 7402.59 4049.91 6055.10 3754.16
Aug 861.76 918.65 6186.22 6086.22 6806.00 3669.34 6486.51 4021.64
Sep 938.36 1109.20 4995.86 5995.86 5497.25 3230.30 5239.20 3248.31
Oct 621.86 835.07 3094.80 3394.80 3643.07 2240.74 3472.05 2152.67
Nov 379.59 648.69 1792.56 1892.56 2223.74 1306.71 2119.35 1314.00
Dec 268.29 417.13 1293.34 1393.34 1571.72 923.57 1497.94 928.72
Table 6.8: RE in (kWh) generation (G) and energy consumption (C) of LCBs
Evaluation of energy measures
Two typical Omani dwellings CB1 and CB3 selected for the analysis in order to assess energy
reduction measures for residential building in Oman. Besides, LB3 the analysis confirmed low
carbon building for comparison from the results from CB1 and CB2. The selection of these
buildings was made based on accuracy of energy audit results compared to the remaining
conventional buildings, size of buildings close to the size of reference LCB, location and
availability of required modelling data. Whilst reference LCB was selected because of its high
performance, compared to other reference LCB, one year energy consumption of CB1 and CB3
were obtained from local utility companies in order to provide measured reference data for
validating of simulation results. In contrast, energy consumption of reference LCB3 was
obtained from measurements provided by TRC.
This research focused on energy consumption of buildings, hence the IES Virtual Environment
(IESVE) used to perform whole-building energy simulation analysis. IES is a powerful, in-
depth suite of building performance analysis, which allows the design and operation of
buildings to be tested using different options, which identify best passive solutions, compares
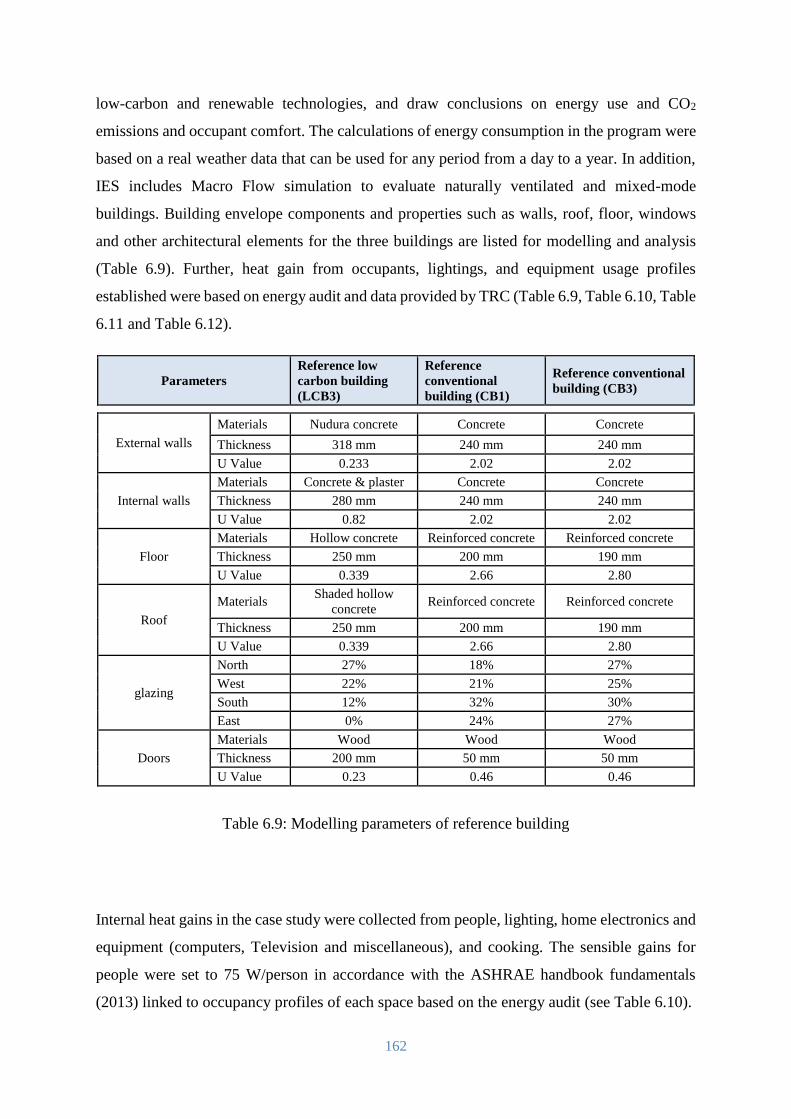
162
low-carbon and renewable technologies, and draw conclusions on energy use and CO2
emissions and occupant comfort. The calculations of energy consumption in the program were
based on a real weather data that can be used for any period from a day to a year. In addition,
IES includes Macro Flow simulation to evaluate naturally ventilated and mixed-mode
buildings. Building envelope components and properties such as walls, roof, floor, windows
and other architectural elements for the three buildings are listed for modelling and analysis
(Table 6.9). Further, heat gain from occupants, lightings, and equipment usage profiles
established were based on energy audit and data provided by TRC (Table 6.9, Table 6.10, Table
6.11 and Table 6.12).
Parameters
Reference low
carbon building
(LCB3)
Reference
conventional
building (CB1)
Reference conventional
building (CB3)
External walls
Materials Nudura concrete Concrete Concrete
Thickness 318 mm 240 mm 240 mm
U Value 0.233 2.02 2.02
Internal walls
Materials Concrete & plaster Concrete Concrete
Thickness 280 mm 240 mm 240 mm
U Value 0.82 2.02 2.02
Floor
Materials Hollow concrete Reinforced concrete Reinforced concrete
Thickness 250 mm 200 mm 190 mm
U Value 0.339 2.66 2.80
Roof
Materials Shaded hollow
concrete Reinforced concrete Reinforced concrete
Thickness 250 mm 200 mm 190 mm
U Value 0.339 2.66 2.80
glazing
North 27% 18% 27%
West 22% 21% 25%
South 12% 32% 30%
East 0% 24% 27%
Doors
Materials Wood Wood Wood
Thickness 200 mm 50 mm 50 mm
U Value 0.23 0.46 0.46
Table 6.9: Modelling parameters of reference building
Internal heat gains in the case study were collected from people, lighting, home electronics and
equipment (computers, Television and miscellaneous), and cooking. The sensible gains for
people were set to 75 W/person in accordance with the ASHRAE handbook fundamentals
(2013) linked to occupancy profiles of each space based on the energy audit (see Table 6.10).
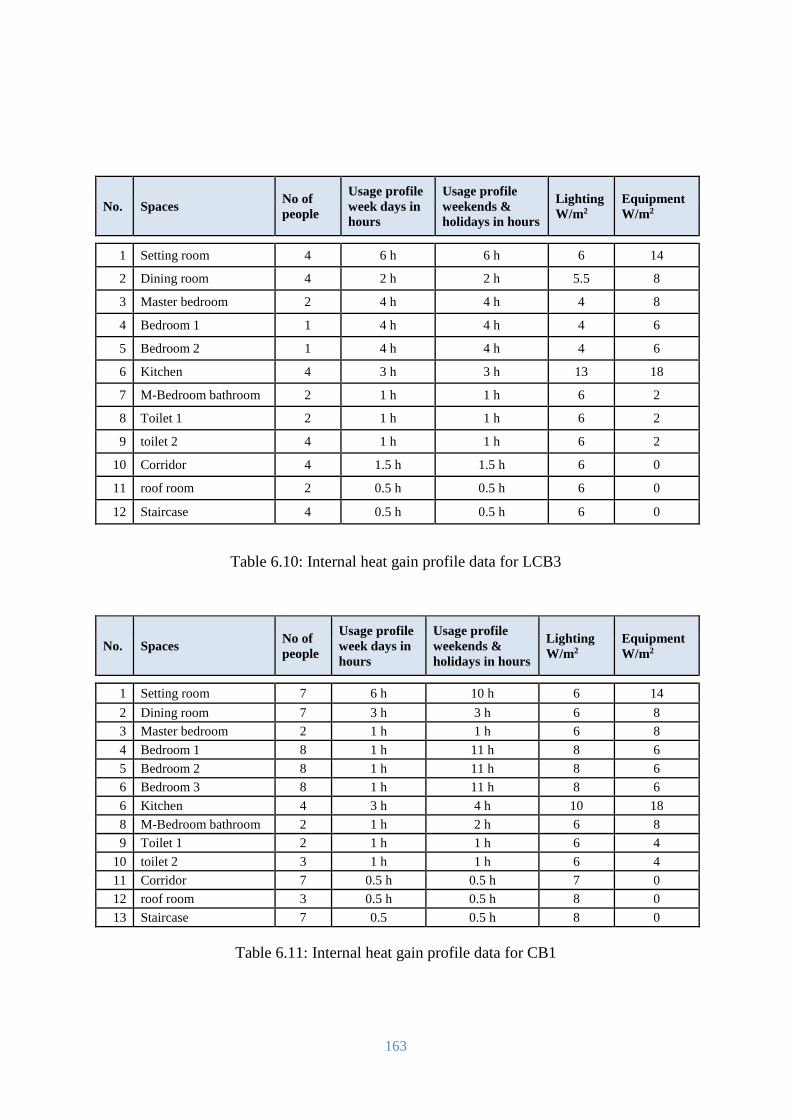
163
No. Spaces No of
people
Usage profile
week days in
hours
Usage profile
weekends &
holidays in hours
Lighting
W/m2
Equipment
W/m2
1 Setting room 4 6 h 6 h 6 14
2 Dining room 4 2 h 2 h 5.5 8
3 Master bedroom 2 4 h 4 h 4 8
4 Bedroom 1 1 4 h 4 h 4 6
5 Bedroom 2 1 4 h 4 h 4 6
6 Kitchen 4 3 h 3 h 13 18
7 M-Bedroom bathroom 2 1 h 1 h 6 2
8 Toilet 1 2 1 h 1 h 6 2
9 toilet 2 4 1 h 1 h 6 2
10 Corridor 4 1.5 h 1.5 h 6 0
11 roof room 2 0.5 h 0.5 h 6 0
12 Staircase 4 0.5 h 0.5 h 6 0
Table 6.10: Internal heat gain profile data for LCB3
No. Spaces No of
people
Usage profile
week days in
hours
Usage profile
weekends &
holidays in hours
Lighting
W/m2
Equipment
W/m2
1 Setting room 7 6 h 10 h 6 14
2 Dining room 7 3 h 3 h 6 8
3 Master bedroom 2 1 h 1 h 6 8
4 Bedroom 1 8 1 h 11 h 8 6
5 Bedroom 2 8 1 h 11 h 8 6
6 Bedroom 3 8 1 h 11 h 8 6
6 Kitchen 4 3 h 4 h 10 18
8 M-Bedroom bathroom 2 1 h 2 h 6 8
9 Toilet 1 2 1 h 1 h 6 4
10 toilet 2 3 1 h 1 h 6 4
11 Corridor 7 0.5 h 0.5 h 7 0
12 roof room 3 0.5 h 0.5 h 8 0
13 Staircase 7 0.5 0.5 h 8 0
Table 6.11: Internal heat gain profile data for CB1

164
No. Spaces No of
people
Usage profile
week days in
hours
Usage profile
weekends &
holidays in hours
Lighting
W/m2
Equipment
W/m2
1 Setting room 5 6 h 11 h 6 14
2 Dining room 5 3 h 4 h 6 8
3 Master bedroom 2 7 h 9 h 8 8
4 Bedroom 1 2 8 h 10 h 6 6
5 Bedroom 2 2 8 h 10 h 6 6
6 Kitchen 3 3 h 4 h 18 18
7 MB bathroom 2 1 h 1.5 h 6 6
8 Toilet 1 2 1 h 1.5 h 6 4
9 toilet 2 2 1 h 1.5 h 6 4
10 Corridor 5 1 h 1 h 6 0
11 roof room 2 1 h 1 h 4 0
12 Staircase 5 1 h 1 h 4 0
Table 6.12: Internal heat gain profile data for CB3
Openings for windows, external and internal doors were modelled in great detail because their
area represents the air flow plugged into IES VE as a percentage of the opening area. In
additions, thermal bridging, a factor referred to as "Ψ value" and measured in (W/m2k) was
applied to the overall U-value of each element. The application of this factor was to account
for heat loss through thermal bridging per m2 of each element area and linked directly to the
external environment. Internal gains from equipment and cooking were assumed as an average
based on the ASHRAE handbook (2013). The appliances were linked to occupancy profiles of
each space within the building in order to provide an estimation average value of consumption.
However, not all appliances are linked to occupancy profiles, such as refrigerators, which are
continuously on. Hence, due to the lack of complete equipment usage data, overall
consumption pattern assumptions were inevitable. Simulation took place several times with
alterations in assumptions to correlate with measured data (Table 6.13).
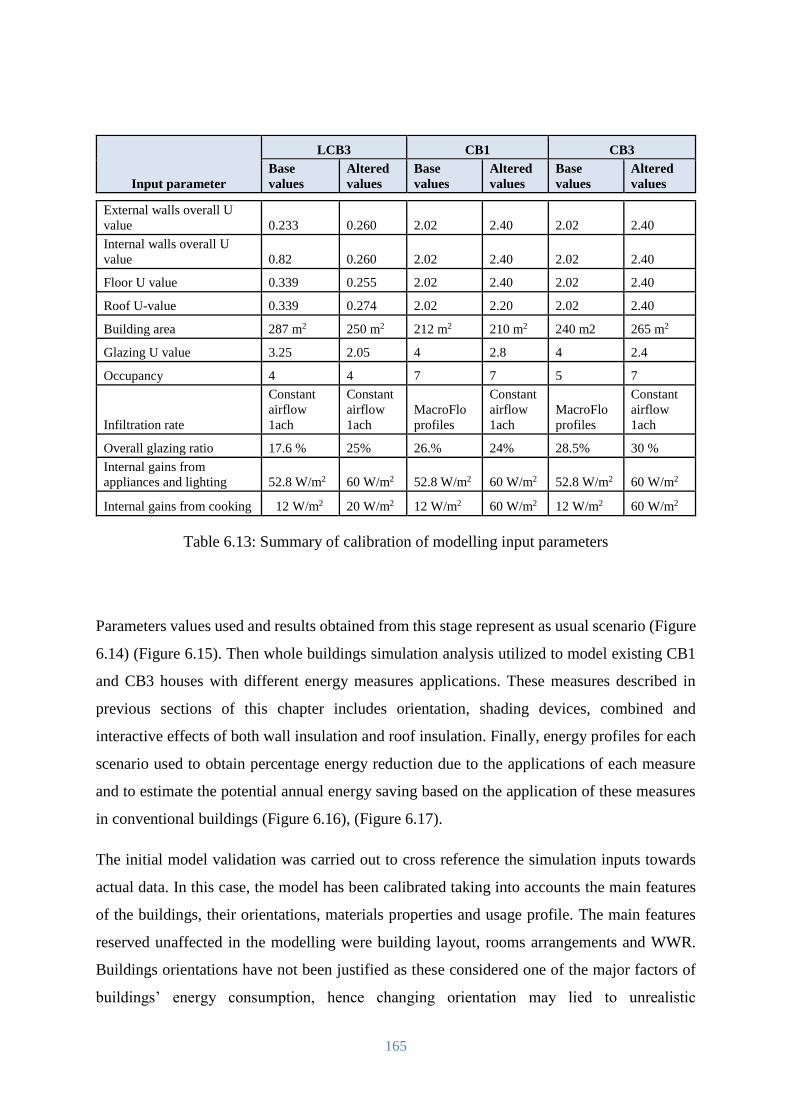
165
Input parameter
LCB3 CB1 CB3
Base
values
Altered
values
Base
values
Altered
values
Base
values
Altered
values
External walls overall U
value 0.233 0.260 2.02 2.40 2.02 2.40
Internal walls overall U
value 0.82 0.260 2.02 2.40 2.02 2.40
Floor U value 0.339 0.255 2.02 2.40 2.02 2.40
Roof U-value 0.339 0.274 2.02 2.20 2.02 2.40
Building area 287 m2 250 m2 212 m2 210 m2 240 m2 265 m2
Glazing U value 3.25 2.05 4 2.8 4 2.4
Occupancy 4 4 7 7 5 7
Infiltration rate
Constant
airflow
1ach
Constant
airflow
1ach
MacroFlo
profiles
Constant
airflow
1ach
MacroFlo
profiles
Constant
airflow
1ach
Overall glazing ratio 17.6 % 25% 26.% 24% 28.5% 30 %
Internal gains from
appliances and lighting 52.8 W/m2 60 W/m2 52.8 W/m2 60 W/m2 52.8 W/m2 60 W/m2
Internal gains from cooking 12 W/m2
20 W/m2 12 W/m2 60 W/m2 12 W/m2 60 W/m2
Table 6.13: Summary of calibration of modelling input parameters
Parameters values used and results obtained from this stage represent as usual scenario (Figure
6.14) (Figure 6.15). Then whole buildings simulation analysis utilized to model existing CB1
and CB3 houses with different energy measures applications. These measures described in
previous sections of this chapter includes orientation, shading devices, combined and
interactive effects of both wall insulation and roof insulation. Finally, energy profiles for each
scenario used to obtain percentage energy reduction due to the applications of each measure
and to estimate the potential annual energy saving based on the application of these measures
in conventional buildings (Figure 6.16), (Figure 6.17).
The initial model validation was carried out to cross reference the simulation inputs towards
actual data. In this case, the model has been calibrated taking into accounts the main features
of the buildings, their orientations, materials properties and usage profile. The main features
reserved unaffected in the modelling were building layout, rooms arrangements and WWR.
Buildings orientations have not been justified as these considered one of the major factors of
buildings’ energy consumption, hence changing orientation may lied to unrealistic
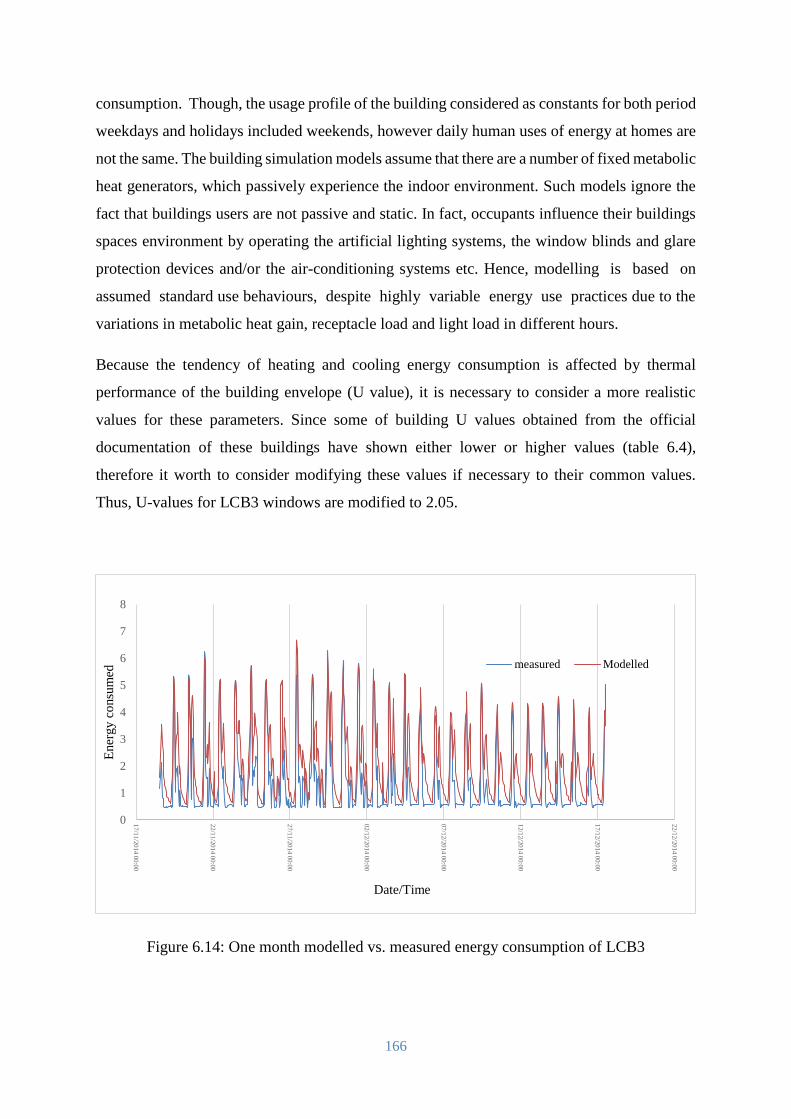
166
consumption. Though, the usage profile of the building considered as constants for both period
weekdays and holidays included weekends, however daily human uses of energy at homes are
not the same. The building simulation models assume that there are a number of fixed metabolic
heat generators, which passively experience the indoor environment. Such models ignore the
fact that buildings users are not passive and static. In fact, occupants influence their buildings
spaces environment by operating the artificial lighting systems, the window blinds and glare
protection devices and/or the air-conditioning systems etc. Hence, modelling is based on
assumed standard use behaviours, despite highly variable energy use practices due to the
variations in metabolic heat gain, receptacle load and light load in different hours.
Because the tendency of heating and cooling energy consumption is affected by thermal
performance of the building envelope (U value), it is necessary to consider a more realistic
values for these parameters. Since some of building U values obtained from the official
documentation of these buildings have shown either lower or higher values (table 6.4),
therefore it worth to consider modifying these values if necessary to their common values.
Thus, U-values for LCB3 windows are modified to 2.05.
Figure 6.14: One month modelled vs. measured energy consumption of LCB3
0
1
2
3
4
5
6
7
8
17
/11/2
01
4 0
0:0
0
22
/11/2
01
4 0
0:0
0
27
/11/2
01
4 0
0:0
0
02
/12/2
01
4 0
0:0
0
07
/12/2
01
4 0
0:0
0
12
/12/2
01
4 0
0:0
0
17
/12/2
01
4 0
0:0
0
22
/12/2
01
4 0
0:0
0E
ner
gy c
onsu
med
Date/Time
measured Modelled
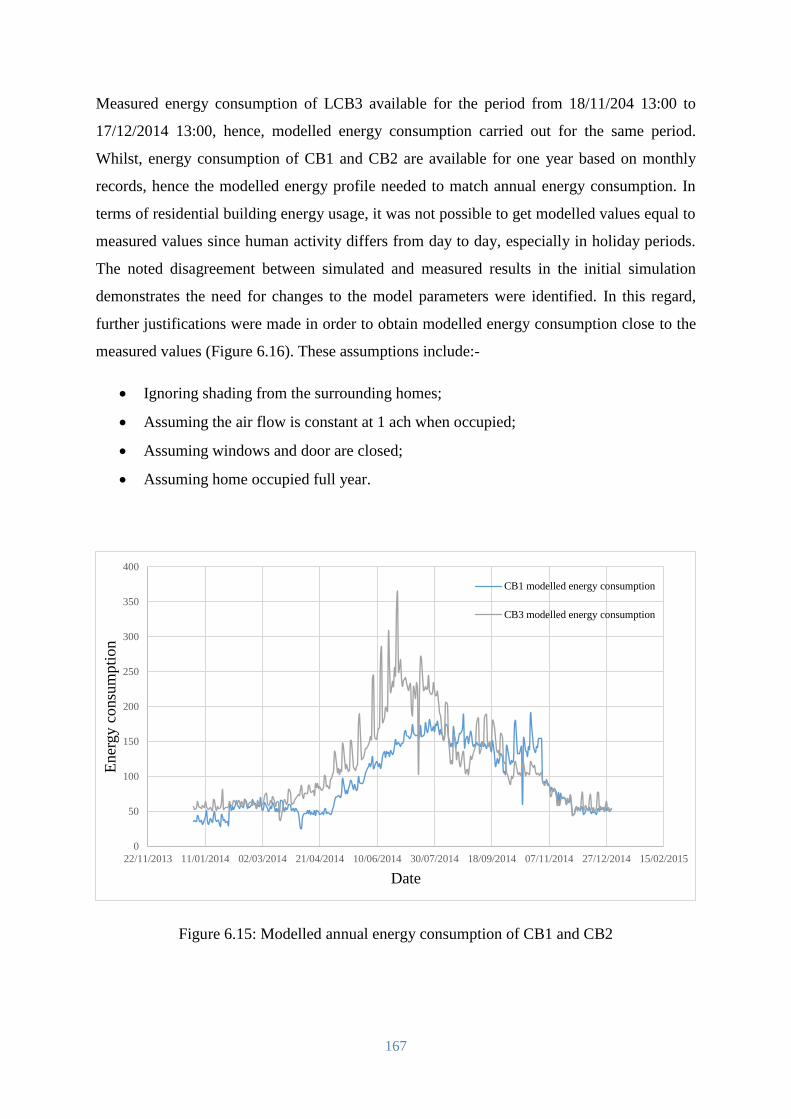
167
Measured energy consumption of LCB3 available for the period from 18/11/204 13:00 to
17/12/2014 13:00, hence, modelled energy consumption carried out for the same period.
Whilst, energy consumption of CB1 and CB2 are available for one year based on monthly
records, hence the modelled energy profile needed to match annual energy consumption. In
terms of residential building energy usage, it was not possible to get modelled values equal to
measured values since human activity differs from day to day, especially in holiday periods.
The noted disagreement between simulated and measured results in the initial simulation
demonstrates the need for changes to the model parameters were identified. In this regard,
further justifications were made in order to obtain modelled energy consumption close to the
measured values (Figure 6.16). These assumptions include:-
Ignoring shading from the surrounding homes;
Assuming the air flow is constant at 1 ach when occupied;
Assuming windows and door are closed;
Assuming home occupied full year.
Figure 6.15: Modelled annual energy consumption of CB1 and CB2
0
50
100
150
200
250
300
350
400
22/11/2013 11/01/2014 02/03/2014 21/04/2014 10/06/2014 30/07/2014 18/09/2014 07/11/2014 27/12/2014 15/02/2015
Ener
gy c
onsu
mpti
on
Date
CB1 modelled energy consumption
CB3 modelled energy consumption
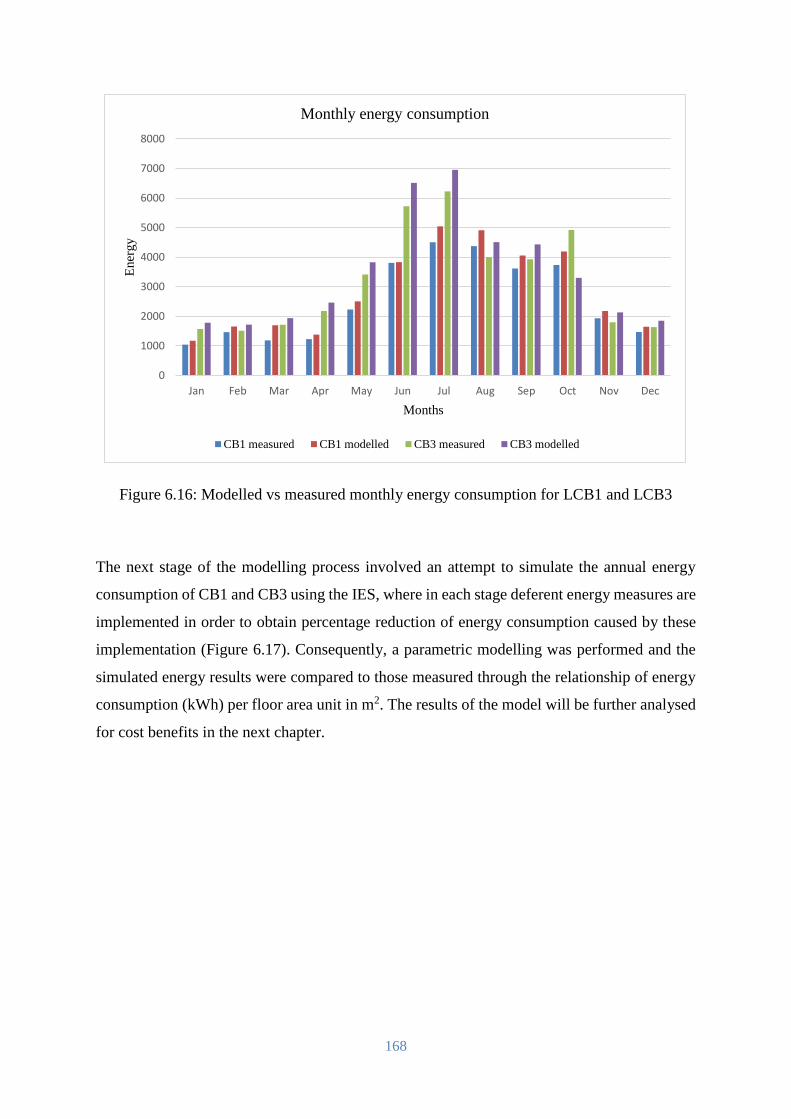
168
Figure 6.16: Modelled vs measured monthly energy consumption for LCB1 and LCB3
The next stage of the modelling process involved an attempt to simulate the annual energy
consumption of CB1 and CB3 using the IES, where in each stage deferent energy measures are
implemented in order to obtain percentage reduction of energy consumption caused by these
implementation (Figure 6.17). Consequently, a parametric modelling was performed and the
simulated energy results were compared to those measured through the relationship of energy
consumption (kWh) per floor area unit in m2. The results of the model will be further analysed
for cost benefits in the next chapter.
0
1000
2000
3000
4000
5000
6000
7000
8000
Jan Feb Mar Apr May Jun Jul Aug Sep Oct Nov Dec
Ener
gy
Months
Monthly energy consumption
CB1 measured CB1 modelled CB3 measured CB3 modelled
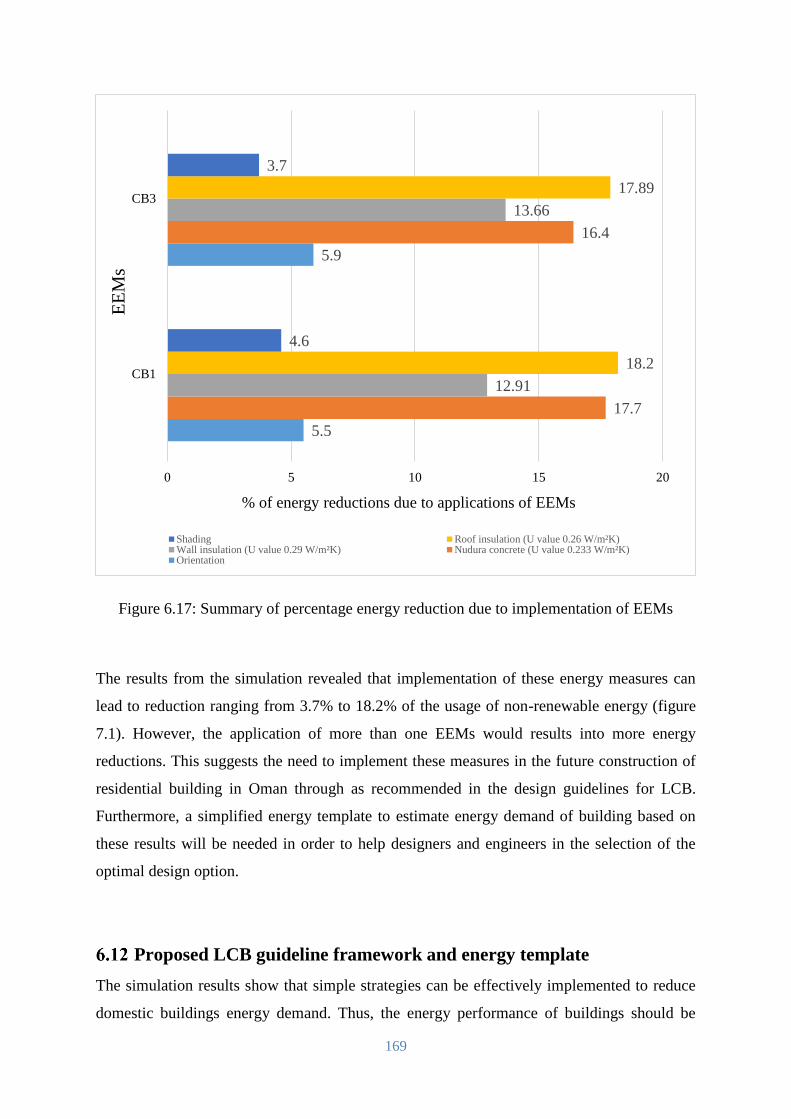
169
Figure 6.17: Summary of percentage energy reduction due to implementation of EEMs
The results from the simulation revealed that implementation of these energy measures can
lead to reduction ranging from 3.7% to 18.2% of the usage of non-renewable energy (figure
7.1). However, the application of more than one EEMs would results into more energy
reductions. This suggests the need to implement these measures in the future construction of
residential building in Oman through as recommended in the design guidelines for LCB.
Furthermore, a simplified energy template to estimate energy demand of building based on
these results will be needed in order to help designers and engineers in the selection of the
optimal design option.
Proposed LCB guideline framework and energy template
The simulation results show that simple strategies can be effectively implemented to reduce
domestic buildings energy demand. Thus, the energy performance of buildings should be
5.5
5.9
17.7
16.4
12.91
13.66
18.2
17.89
4.6
3.7
0 5 10 15 20
CB1
CB3
% of energy reductions due to applications of EEMs
EE
Ms
Shading Roof insulation (U value 0.26 W/m²K)Wall insulation (U value 0.29 W/m²K) Nudura concrete (U value 0.233 W/m²K)Orientation
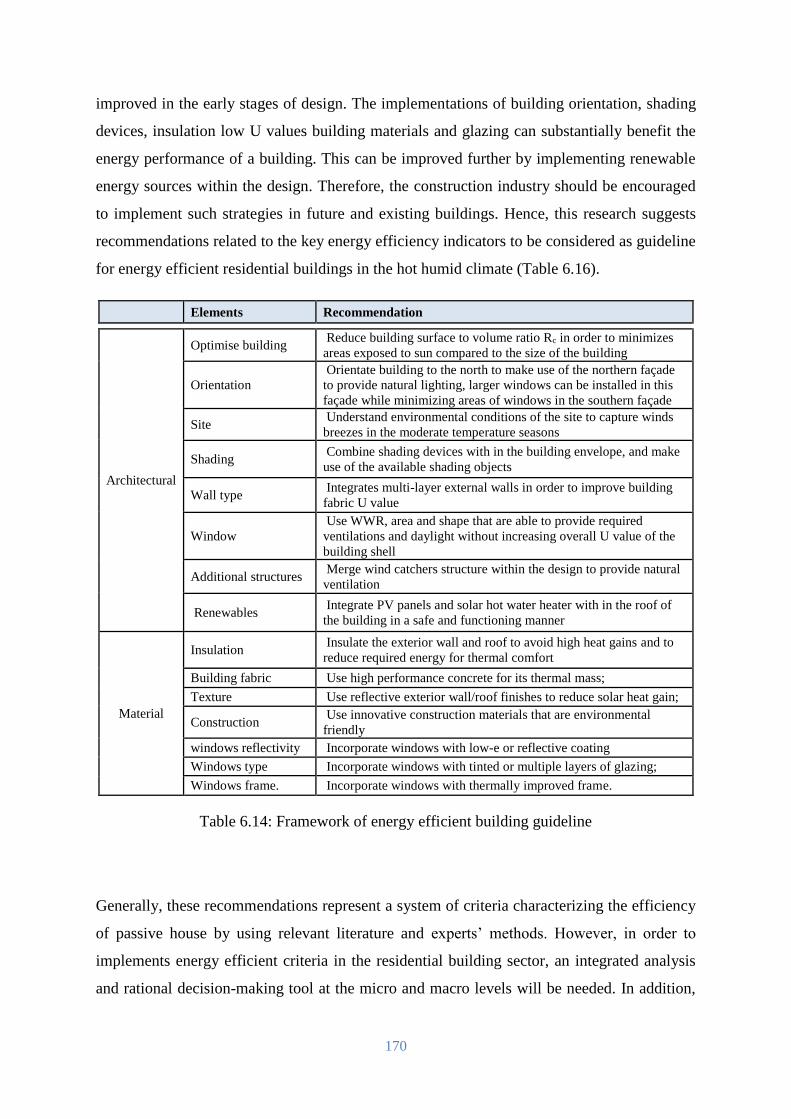
170
improved in the early stages of design. The implementations of building orientation, shading
devices, insulation low U values building materials and glazing can substantially benefit the
energy performance of a building. This can be improved further by implementing renewable
energy sources within the design. Therefore, the construction industry should be encouraged
to implement such strategies in future and existing buildings. Hence, this research suggests
recommendations related to the key energy efficiency indicators to be considered as guideline
for energy efficient residential buildings in the hot humid climate (Table 6.16).
Elements Recommendation
Architectural
Optimise building Reduce building surface to volume ratio Rc in order to minimizes
areas exposed to sun compared to the size of the building
Orientation
Orientate building to the north to make use of the northern façade
to provide natural lighting, larger windows can be installed in this
façade while minimizing areas of windows in the southern façade
Site Understand environmental conditions of the site to capture winds
breezes in the moderate temperature seasons
Shading Combine shading devices with in the building envelope, and make
use of the available shading objects
Wall type Integrates multi-layer external walls in order to improve building
fabric U value
Window
Use WWR, area and shape that are able to provide required
ventilations and daylight without increasing overall U value of the
building shell
Additional structures Merge wind catchers structure within the design to provide natural
ventilation
Renewables Integrate PV panels and solar hot water heater with in the roof of
the building in a safe and functioning manner
Material
Insulation Insulate the exterior wall and roof to avoid high heat gains and to
reduce required energy for thermal comfort
Building fabric Use high performance concrete for its thermal mass;
Texture Use reflective exterior wall/roof finishes to reduce solar heat gain;
Construction Use innovative construction materials that are environmental
friendly
windows reflectivity Incorporate windows with low-e or reflective coating
Windows type Incorporate windows with tinted or multiple layers of glazing;
Windows frame. Incorporate windows with thermally improved frame.
Table 6.14: Framework of energy efficient building guideline
Generally, these recommendations represent a system of criteria characterizing the efficiency
of passive house by using relevant literature and experts’ methods. However, in order to
implements energy efficient criteria in the residential building sector, an integrated analysis
and rational decision-making tool at the micro and macro levels will be needed. In addition,
171
economic and legal/regulatory decisions, and other aspects of political, social, culture, ethical,
psychological, educational, environmental, provision, technological, technical, organizational
and managerial consideration will need to be considered and further investigated. For
simplicity, the application of such criterial guides to estimate the successes of these criteria in
the operation stage of the building from the design stage, and an energy-efficiency calculator
template will be needed. The next chapter will focus on establishing an energy-calculator
model for the hot humid climate of Oman and similar environments.
Chapter summary
This chapter proposed a low carbon design framework for energy efficient domestic buildings
in the Sultanate of Oman, which has a hot humid climate. Energy reduction measures for
residential building were reviewed and examined in order to determine their optimal
application. The design strategies and techniques involving these energy reduction measures
have been investigated and approved through multi rounds of simulation. Then, a proposed
framework was developed which incorporates factors concerning architectural design
strategies, building envelope design, and on-site renewable energy strategies considering Oman
social economic factors.
The analysis has shown potential energy consumption reduction in domestic building by 67%
based on considering these measures. Consequently, the results suggested that it is important
to establish a residential building energy template (energy calculator) to act as tool for
developers, architects and civil engineers to design low energy homes in Oman that meet local
requirements needs and overcomes environmental challenges. Hence, the following chapter
will focus on designing energy template for homes in Oman and similar environments based
on an ‘energy consumption definition system’ (in kWh/m2). The energy template principle will
be based on the framework established in this chapter and the finding presented in chapters 2,
3, 4 and 5.
172
Chapter VII: Low carbon building template
Introduction
Designing buildings for high levels of energy performance is a complex task because buildings
energy usage is difficult and involves multi-factors. Hence, evaluation of building energy
conservation is even a more complicated. In general, performance evaluations are mostly
applied for large and complex buildings, such as office buildings, seeking certifications.
Whilst, for small projects, i.e. single family buildings, the design team often do not include an
energy performance professional. Hence, the architect makes design decisions according to
individual views and knowledge (Yildiz et al., 2012). In this regard, architects may have
general knowledge about effects of building form, materials, and required HVAC systems for
building related to its energy performance. Therefore, if the impacts of these factors on the
energy consumption of building are measured for the architects, then this measurable factor
can be translated to an improvement of building energy performance from the early stages of
design (Schlueter and Thesseling, 2009). Therefore, this research suggests that “the early
design process of residential buildings should involve additional professionals on energy
performance design aides supported by simulation tools, in order to assists energy
performance of building at the early design stages”. One method to achieve this task is to
provide information to architects using paper-based documents in the form of framework
guidelines, national codes and standards (Aksamija, 2015), such as the one provided in chapter
six of this thesis. Furthermore, the availability of an energy efficiency tool or calculator that is
designed based on the conditions of the building site will help the designer of the building to
estimate and compare energy consumptions of deferent options.
This chapter, therefore, aims to develop a building energy model for residential buildings
reflecting the variation in energy consumption caused due to application or non-application of
EEMs. It describes the devising of a design tool called Residential Building Energy Efficiency
Template (R-BEET) that aims to estimate monthly and annual building energy consumptions
and its performances in hot-humid climates. In this regard, this chapter demonstrates how the
proposed template can be used and applied within the context of Oman. This tool considered
the first of its kind designed especially for Oman.
The tool has been developed in Excel workbook format, and it includes separate input sheets
for each variable that affects home energy and the end user. The selection of Excel for
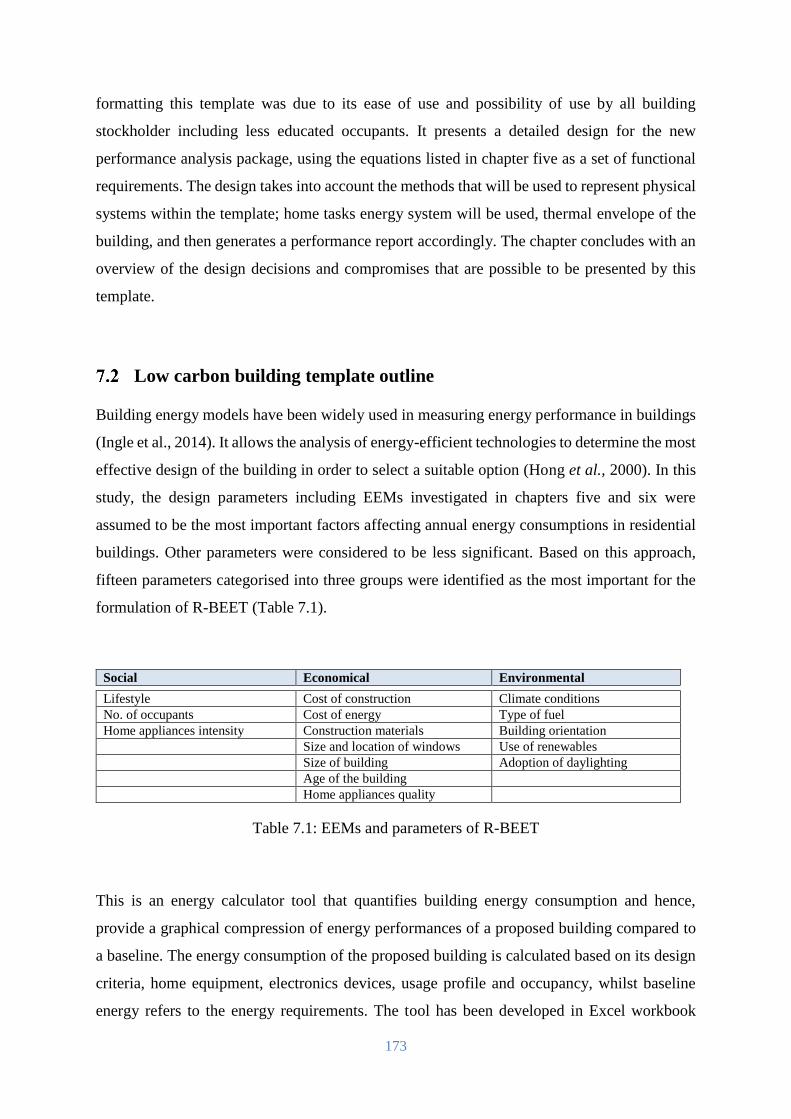
173
formatting this template was due to its ease of use and possibility of use by all building
stockholder including less educated occupants. It presents a detailed design for the new
performance analysis package, using the equations listed in chapter five as a set of functional
requirements. The design takes into account the methods that will be used to represent physical
systems within the template; home tasks energy system will be used, thermal envelope of the
building, and then generates a performance report accordingly. The chapter concludes with an
overview of the design decisions and compromises that are possible to be presented by this
template.
Low carbon building template outline
Building energy models have been widely used in measuring energy performance in buildings
(Ingle et al., 2014). It allows the analysis of energy-efficient technologies to determine the most
effective design of the building in order to select a suitable option (Hong et al., 2000). In this
study, the design parameters including EEMs investigated in chapters five and six were
assumed to be the most important factors affecting annual energy consumptions in residential
buildings. Other parameters were considered to be less significant. Based on this approach,
fifteen parameters categorised into three groups were identified as the most important for the
formulation of R-BEET (Table 7.1).
Social Economical Environmental
Lifestyle Cost of construction Climate conditions
No. of occupants Cost of energy Type of fuel
Home appliances intensity Construction materials Building orientation
Size and location of windows Use of renewables
Size of building Adoption of daylighting
Age of the building
Home appliances quality
Table 7.1: EEMs and parameters of R-BEET
This is an energy calculator tool that quantifies building energy consumption and hence,
provide a graphical compression of energy performances of a proposed building compared to
a baseline. The energy consumption of the proposed building is calculated based on its design
criteria, home equipment, electronics devices, usage profile and occupancy, whilst baseline
energy refers to the energy requirements. The tool has been developed in Excel workbook
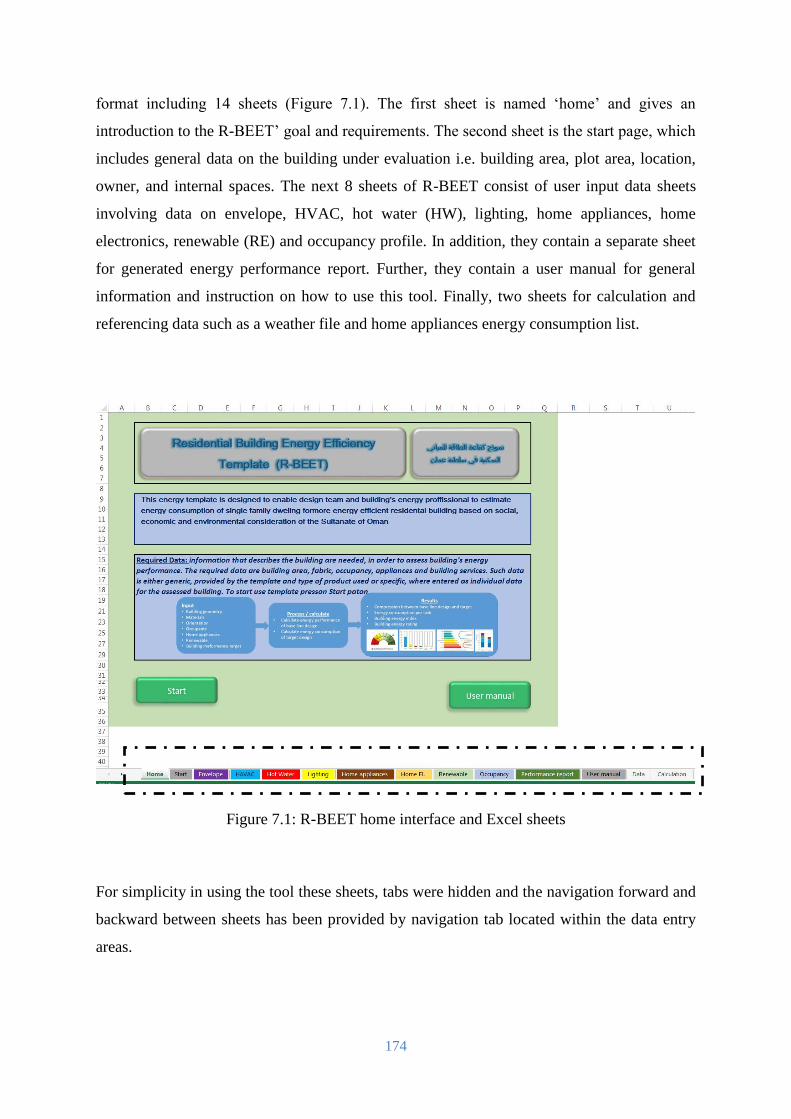
174
format including 14 sheets (Figure 7.1). The first sheet is named ‘home’ and gives an
introduction to the R-BEET’ goal and requirements. The second sheet is the start page, which
includes general data on the building under evaluation i.e. building area, plot area, location,
owner, and internal spaces. The next 8 sheets of R-BEET consist of user input data sheets
involving data on envelope, HVAC, hot water (HW), lighting, home appliances, home
electronics, renewable (RE) and occupancy profile. In addition, they contain a separate sheet
for generated energy performance report. Further, they contain a user manual for general
information and instruction on how to use this tool. Finally, two sheets for calculation and
referencing data such as a weather file and home appliances energy consumption list.
Figure 7.1: R-BEET home interface and Excel sheets
For simplicity in using the tool these sheets, tabs were hidden and the navigation forward and
backward between sheets has been provided by navigation tab located within the data entry
areas.
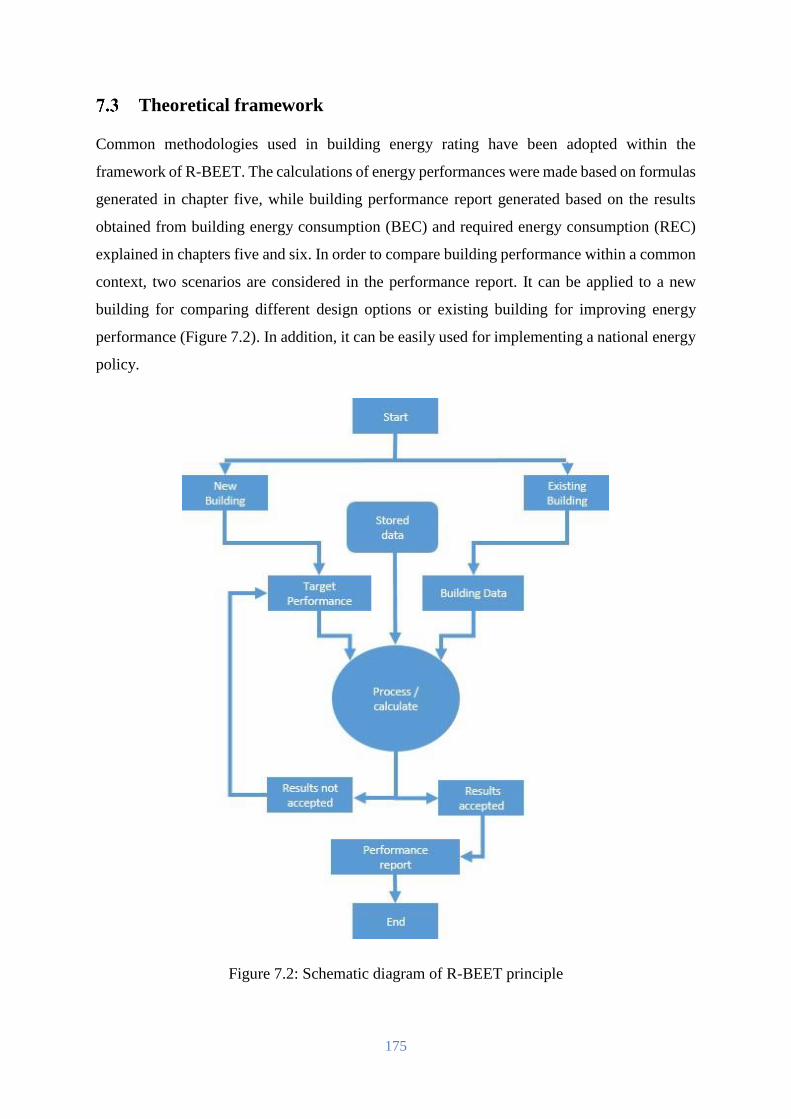
175
Theoretical framework
Common methodologies used in building energy rating have been adopted within the
framework of R-BEET. The calculations of energy performances were made based on formulas
generated in chapter five, while building performance report generated based on the results
obtained from building energy consumption (BEC) and required energy consumption (REC)
explained in chapters five and six. In order to compare building performance within a common
context, two scenarios are considered in the performance report. It can be applied to a new
building for comparing different design options or existing building for improving energy
performance (Figure 7.2). In addition, it can be easily used for implementing a national energy
policy.
Figure 7.2: Schematic diagram of R-BEET principle
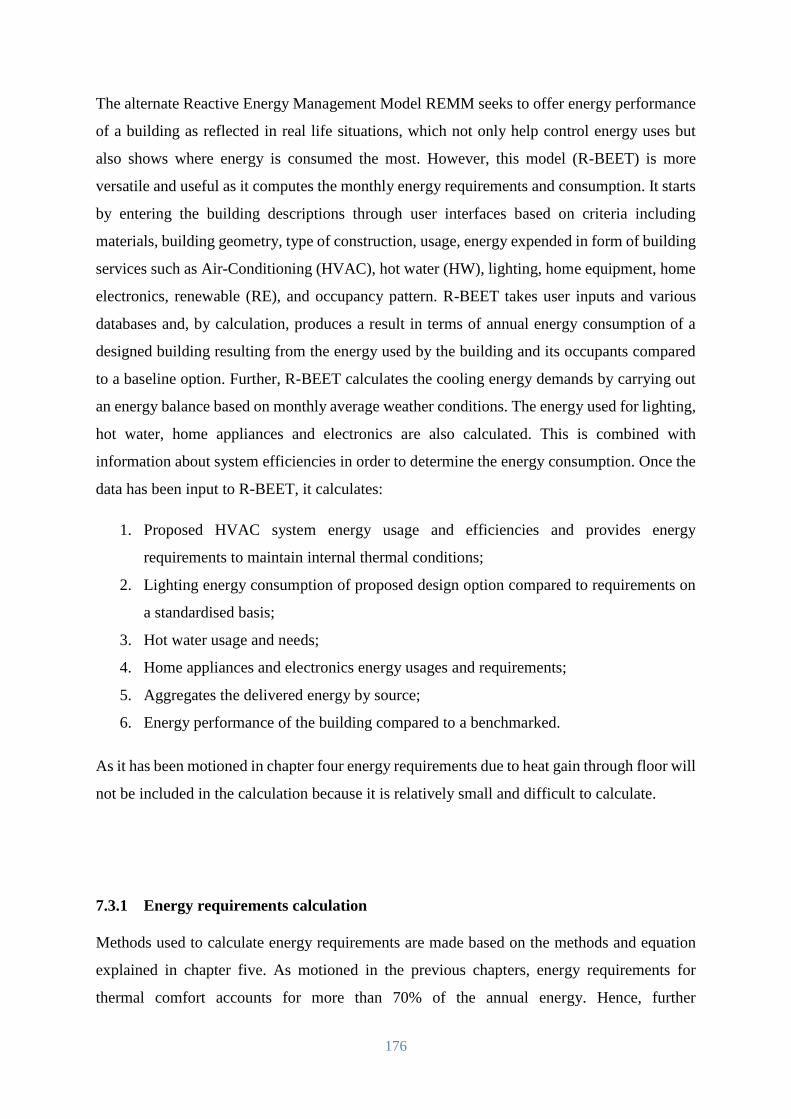
176
The alternate Reactive Energy Management Model REMM seeks to offer energy performance
of a building as reflected in real life situations, which not only help control energy uses but
also shows where energy is consumed the most. However, this model (R-BEET) is more
versatile and useful as it computes the monthly energy requirements and consumption. It starts
by entering the building descriptions through user interfaces based on criteria including
materials, building geometry, type of construction, usage, energy expended in form of building
services such as Air-Conditioning (HVAC), hot water (HW), lighting, home equipment, home
electronics, renewable (RE), and occupancy pattern. R-BEET takes user inputs and various
databases and, by calculation, produces a result in terms of annual energy consumption of a
designed building resulting from the energy used by the building and its occupants compared
to a baseline option. Further, R-BEET calculates the cooling energy demands by carrying out
an energy balance based on monthly average weather conditions. The energy used for lighting,
hot water, home appliances and electronics are also calculated. This is combined with
information about system efficiencies in order to determine the energy consumption. Once the
data has been input to R-BEET, it calculates:
1. Proposed HVAC system energy usage and efficiencies and provides energy
requirements to maintain internal thermal conditions;
2. Lighting energy consumption of proposed design option compared to requirements on
a standardised basis;
3. Hot water usage and needs;
4. Home appliances and electronics energy usages and requirements;
5. Aggregates the delivered energy by source;
6. Energy performance of the building compared to a benchmarked.
As it has been motioned in chapter four energy requirements due to heat gain through floor will
not be included in the calculation because it is relatively small and difficult to calculate.
7.3.1 Energy requirements calculation
Methods used to calculate energy requirements are made based on the methods and equation
explained in chapter five. As motioned in the previous chapters, energy requirements for
thermal comfort accounts for more than 70% of the annual energy. Hence, further
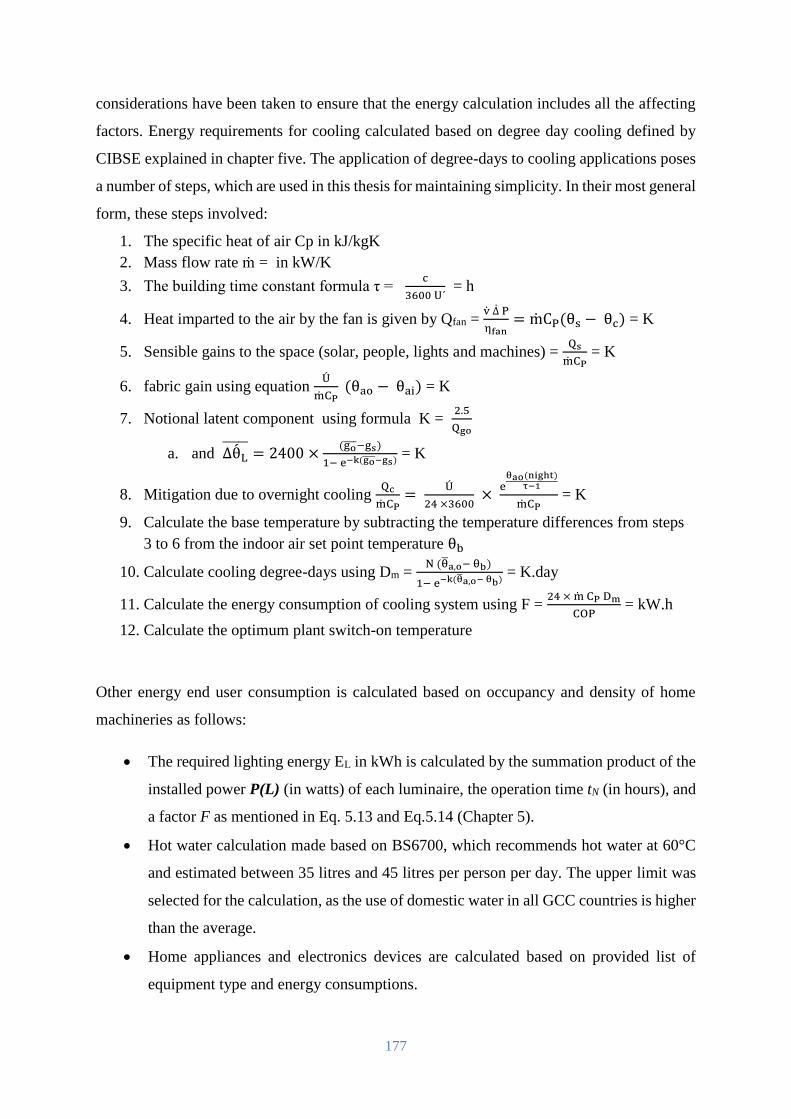
177
considerations have been taken to ensure that the energy calculation includes all the affecting
factors. Energy requirements for cooling calculated based on degree day cooling defined by
CIBSE explained in chapter five. The application of degree-days to cooling applications poses
a number of steps, which are used in this thesis for maintaining simplicity. In their most general
form, these steps involved:
1. The specific heat of air Cp in kJ/kgK
2. Mass flow rate ṁ = in kW/K
3. The building time constant formula τ = c
3600 U´ = h
4. Heat imparted to the air by the fan is given by Qfan = v ∆ P
ηfan= mCP(θs − θc) = K
5. Sensible gains to the space (solar, people, lights and machines) = Qs
mCP = K
6. fabric gain using equation U
mCP (θao − θai) = K
7. Notional latent component using formula K = 2.5
Qgo
a. and ΔθL = 2400 ×
(go −gs)
1− e−k(go −gs) = K
8. Mitigation due to overnight cooling Qc
mCP=
U
24 ×3600 ×
eθao(night)
τ−1
mCP = K
9. Calculate the base temperature by subtracting the temperature differences from steps
3 to 6 from the indoor air set point temperature θb
10. Calculate cooling degree-days using Dm = N (θa,o− θb)
1− e−k(θa,o− θb) = K.day
11. Calculate the energy consumption of cooling system using F = 24 × m CP Dm
COP = kW.h
12. Calculate the optimum plant switch-on temperature
Other energy end user consumption is calculated based on occupancy and density of home
machineries as follows:
The required lighting energy EL in kWh is calculated by the summation product of the
installed power P(L) (in watts) of each luminaire, the operation time tN (in hours), and
a factor F as mentioned in Eq. 5.13 and Eq.5.14 (Chapter 5).
Hot water calculation made based on BS6700, which recommends hot water at 60°C
and estimated between 35 litres and 45 litres per person per day. The upper limit was
selected for the calculation, as the use of domestic water in all GCC countries is higher
than the average.
Home appliances and electronics devices are calculated based on provided list of
equipment type and energy consumptions.
178
Technological framework
In the early stages of a design, the use of sophisticated modelling tools appropriate for detailed
design can be problematic. Experienced designers often fall back on their historical
assumptions to provide initial design and budget input. An alternative approach to traditional
rules of thumb is the use of simplified input spreadsheets. These have proven quick and easy
to use for the early concept, and helpful for inexperienced engineers in evaluating the impact
of assumptions vs. expectation. Therefore, Excel spreadsheets are used in this template because
they are simple to use and a powerful calculation tool. The aim of this template is to show how
a measurement and verification plan can be integrated into a framework to ensure the actual
energy performance of a building is in line with expectation. The key technical framework of
the designed template is made based on the environmental conditions, the building size and
materials properties, equipment, home devices, occupancy and the uses of renewables.
The input data acts as the interface between the user and R-BEET calculation. As far as
possible, the user is guided towards an appropriate data entry set in order to insure simplicity
of using the template. Hence, the user interacts with the interface of the template, and sets up
a model of the building, which describes its size, how it is used, how it is constructed and how
it is serviced. The template will perform calculations based on input data and pre-stored data
using the equations generated in chapter five and the current chapter. The user will not have
access to these equations in order to prevent them from making accidental modifications. After
the calculations are performed, the results and an output reports become accessible through the
performance report sheet. The inputs to the energy calculation include:
Physical configuration of the different areas of the building façades, glazing areas,
geometry and orientation;
Information about the proposed building cooling, lighting, and other building services
systems;
Installed home appliances and expected electronics devices load;
Renewable energy considerations;
Occupancy profile pattern.
Each task of the mentioned above list has been provided on a separate input sheet, the following
sections of this chapter describe how these data are entered into R-BEET.
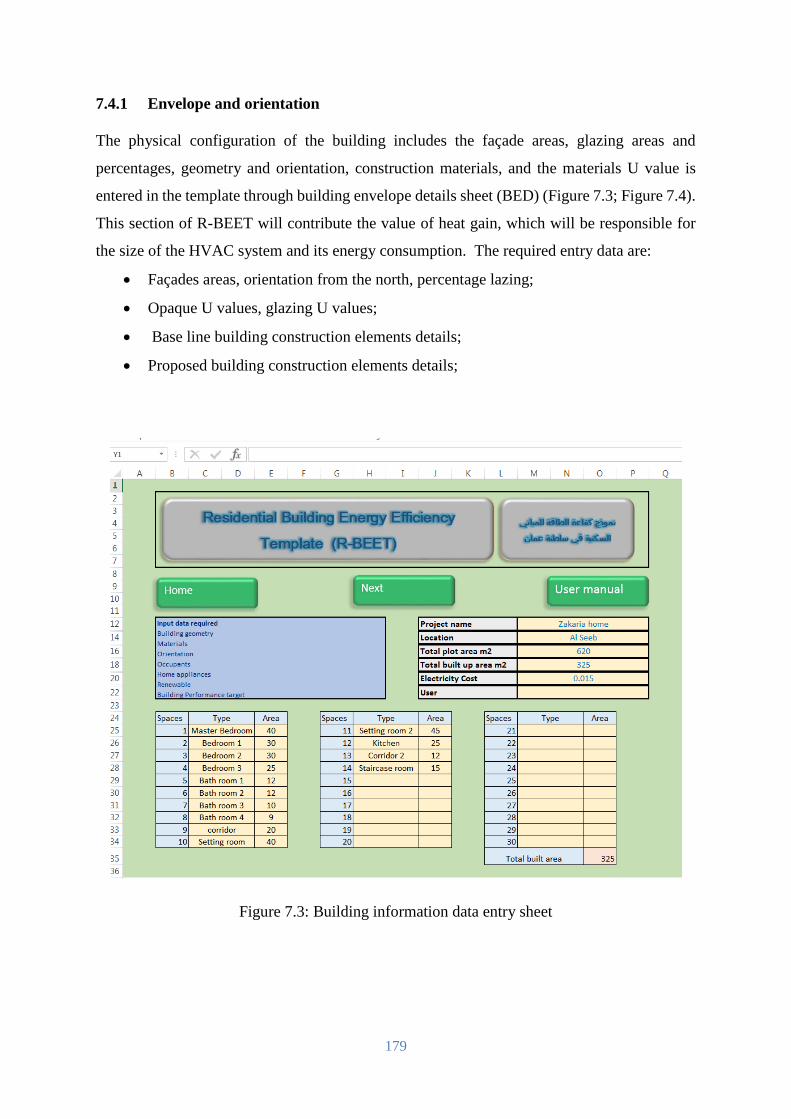
179
7.4.1 Envelope and orientation
The physical configuration of the building includes the façade areas, glazing areas and
percentages, geometry and orientation, construction materials, and the materials U value is
entered in the template through building envelope details sheet (BED) (Figure 7.3; Figure 7.4).
This section of R-BEET will contribute the value of heat gain, which will be responsible for
the size of the HVAC system and its energy consumption. The required entry data are:
Façades areas, orientation from the north, percentage lazing;
Opaque U values, glazing U values;
Base line building construction elements details;
Proposed building construction elements details;
Figure 7.3: Building information data entry sheet
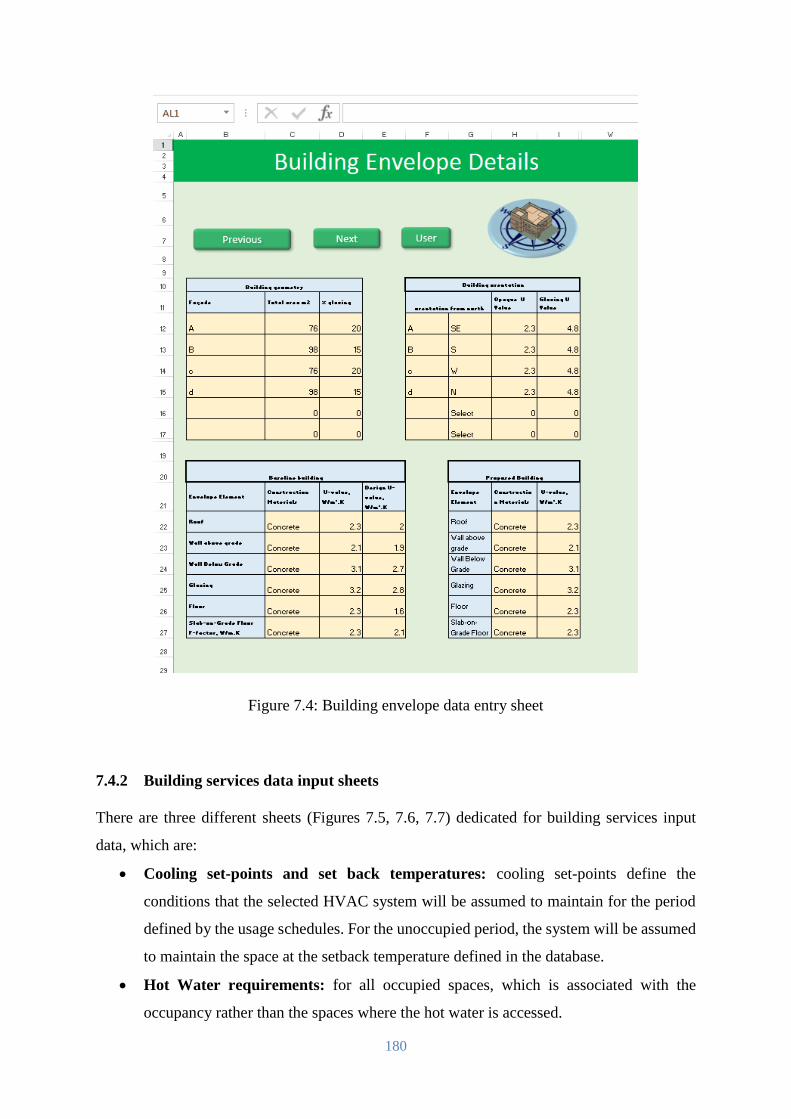
180
Figure 7.4: Building envelope data entry sheet
7.4.2 Building services data input sheets
There are three different sheets (Figures 7.5, 7.6, 7.7) dedicated for building services input
data, which are:
Cooling set-points and set back temperatures: cooling set-points define the
conditions that the selected HVAC system will be assumed to maintain for the period
defined by the usage schedules. For the unoccupied period, the system will be assumed
to maintain the space at the setback temperature defined in the database.
Hot Water requirements: for all occupied spaces, which is associated with the
occupancy rather than the spaces where the hot water is accessed.
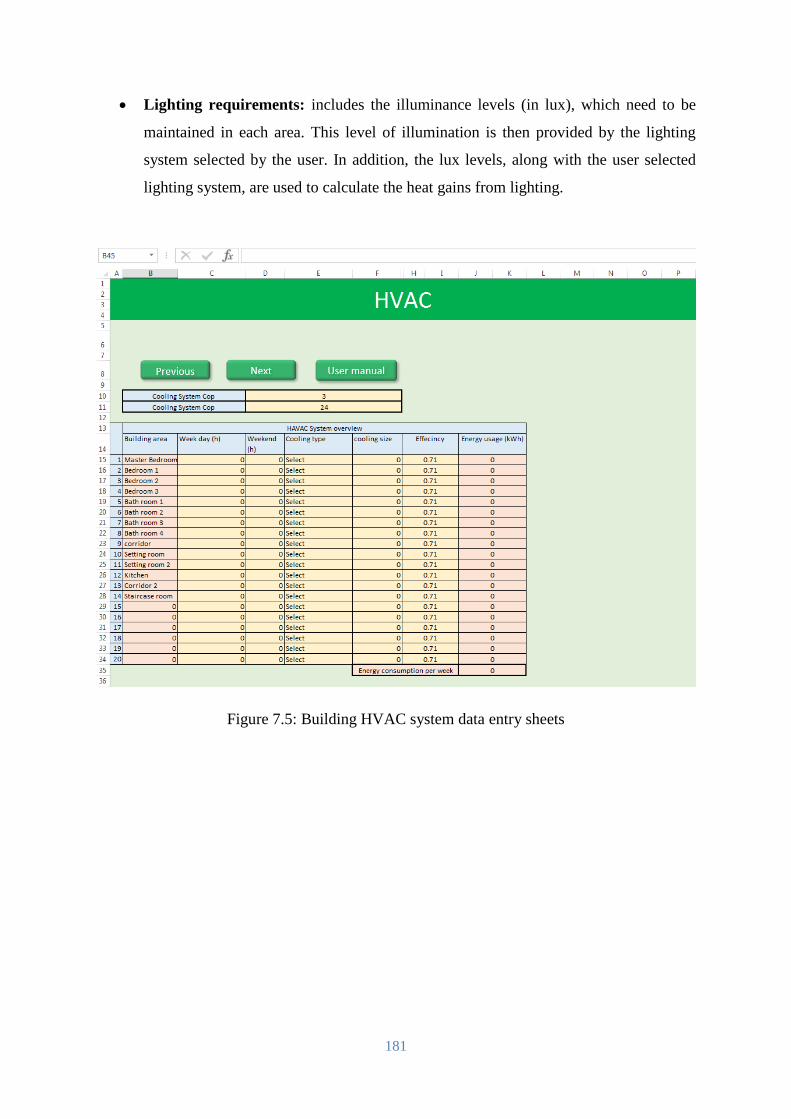
181
Lighting requirements: includes the illuminance levels (in lux), which need to be
maintained in each area. This level of illumination is then provided by the lighting
system selected by the user. In addition, the lux levels, along with the user selected
lighting system, are used to calculate the heat gains from lighting.
Figure 7.5: Building HVAC system data entry sheets
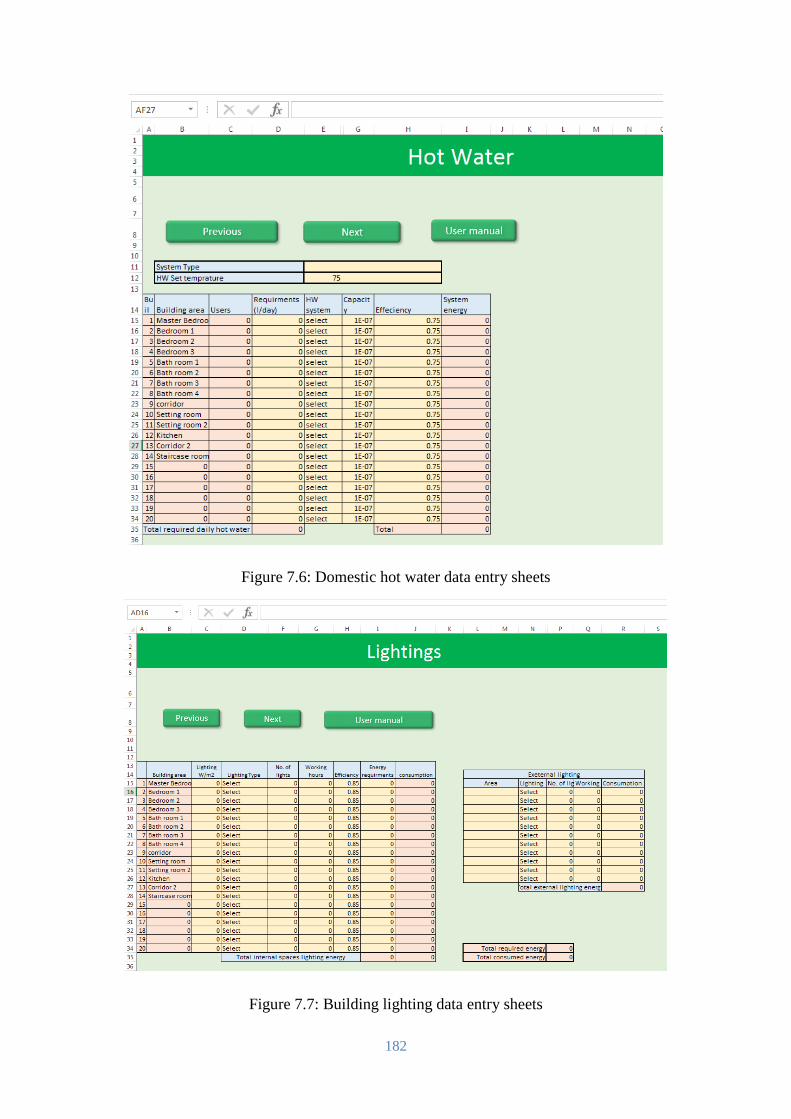
182
Figure 7.6: Domestic hot water data entry sheets
Figure 7.7: Building lighting data entry sheets
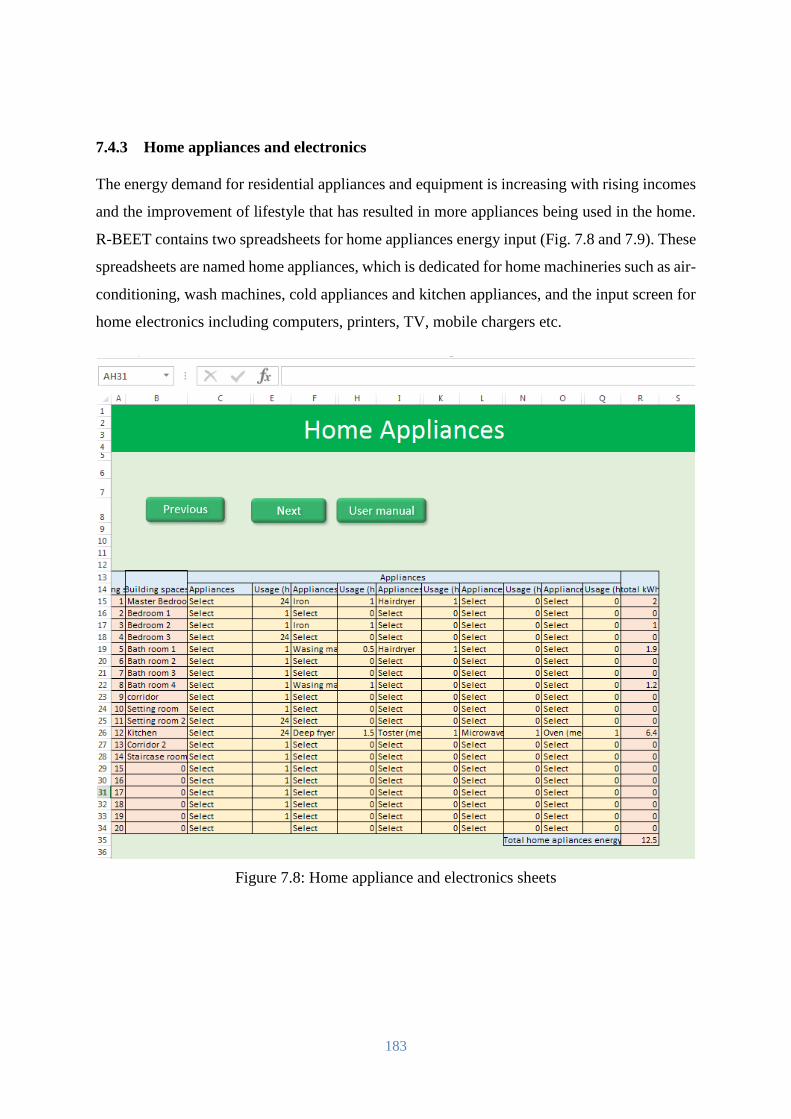
183
7.4.3 Home appliances and electronics
The energy demand for residential appliances and equipment is increasing with rising incomes
and the improvement of lifestyle that has resulted in more appliances being used in the home.
R-BEET contains two spreadsheets for home appliances energy input (Fig. 7.8 and 7.9). These
spreadsheets are named home appliances, which is dedicated for home machineries such as air-
conditioning, wash machines, cold appliances and kitchen appliances, and the input screen for
home electronics including computers, printers, TV, mobile chargers etc.
Figure 7.8: Home appliance and electronics sheets
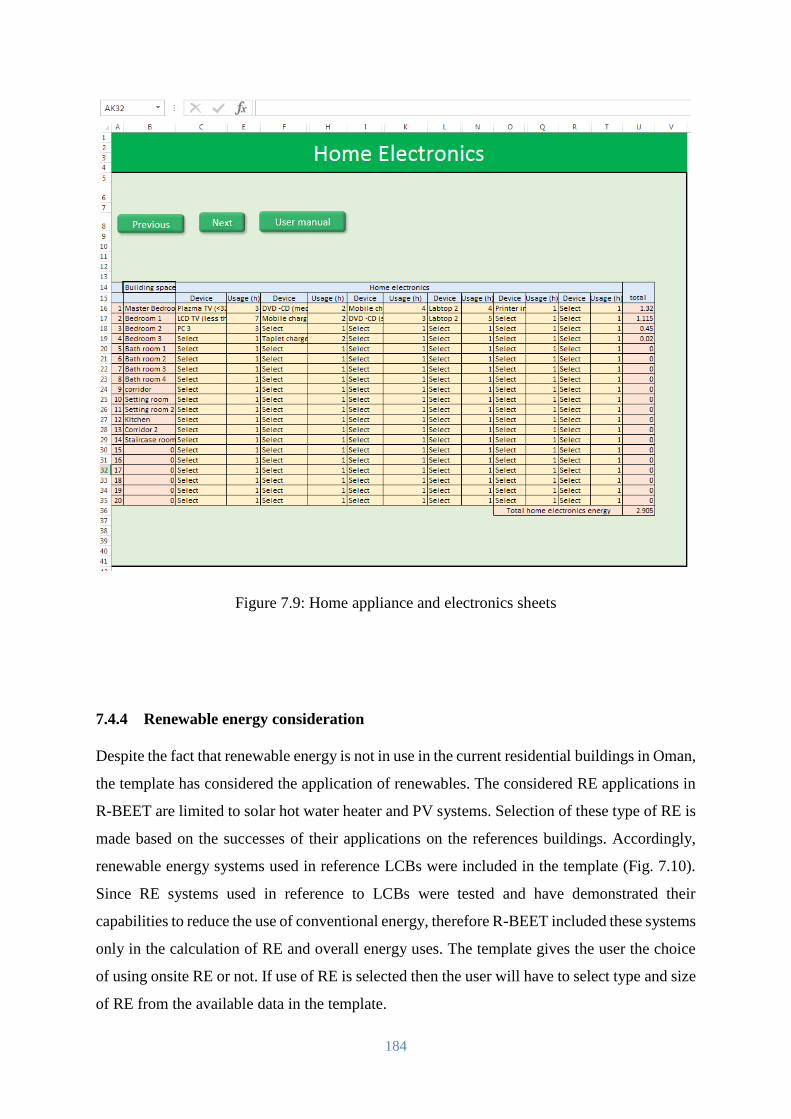
184
Figure 7.9: Home appliance and electronics sheets
7.4.4 Renewable energy consideration
Despite the fact that renewable energy is not in use in the current residential buildings in Oman,
the template has considered the application of renewables. The considered RE applications in
R-BEET are limited to solar hot water heater and PV systems. Selection of these type of RE is
made based on the successes of their applications on the references buildings. Accordingly,
renewable energy systems used in reference LCBs were included in the template (Fig. 7.10).
Since RE systems used in reference to LCBs were tested and have demonstrated their
capabilities to reduce the use of conventional energy, therefore R-BEET included these systems
only in the calculation of RE and overall energy uses. The template gives the user the choice
of using onsite RE or not. If use of RE is selected then the user will have to select type and size
of RE from the available data in the template.
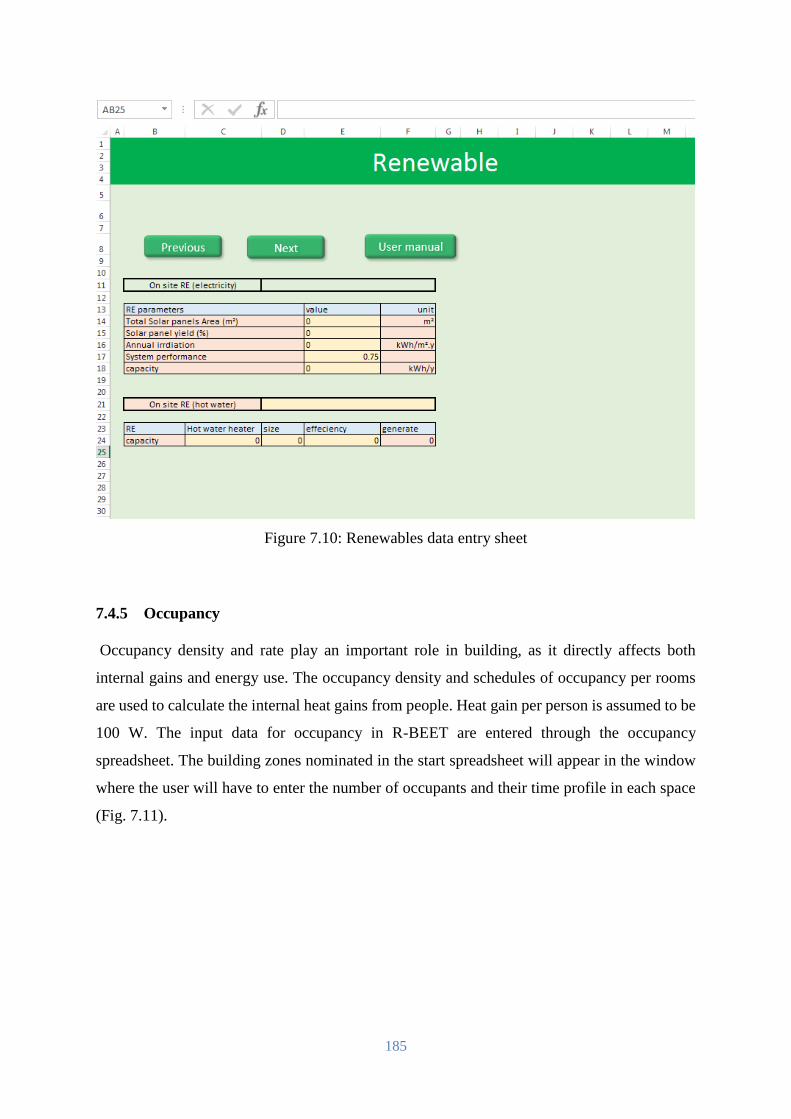
185
Figure 7.10: Renewables data entry sheet
7.4.5 Occupancy
Occupancy density and rate play an important role in building, as it directly affects both
internal gains and energy use. The occupancy density and schedules of occupancy per rooms
are used to calculate the internal heat gains from people. Heat gain per person is assumed to be
100 W. The input data for occupancy in R-BEET are entered through the occupancy
spreadsheet. The building zones nominated in the start spreadsheet will appear in the window
where the user will have to enter the number of occupants and their time profile in each space
(Fig. 7.11).
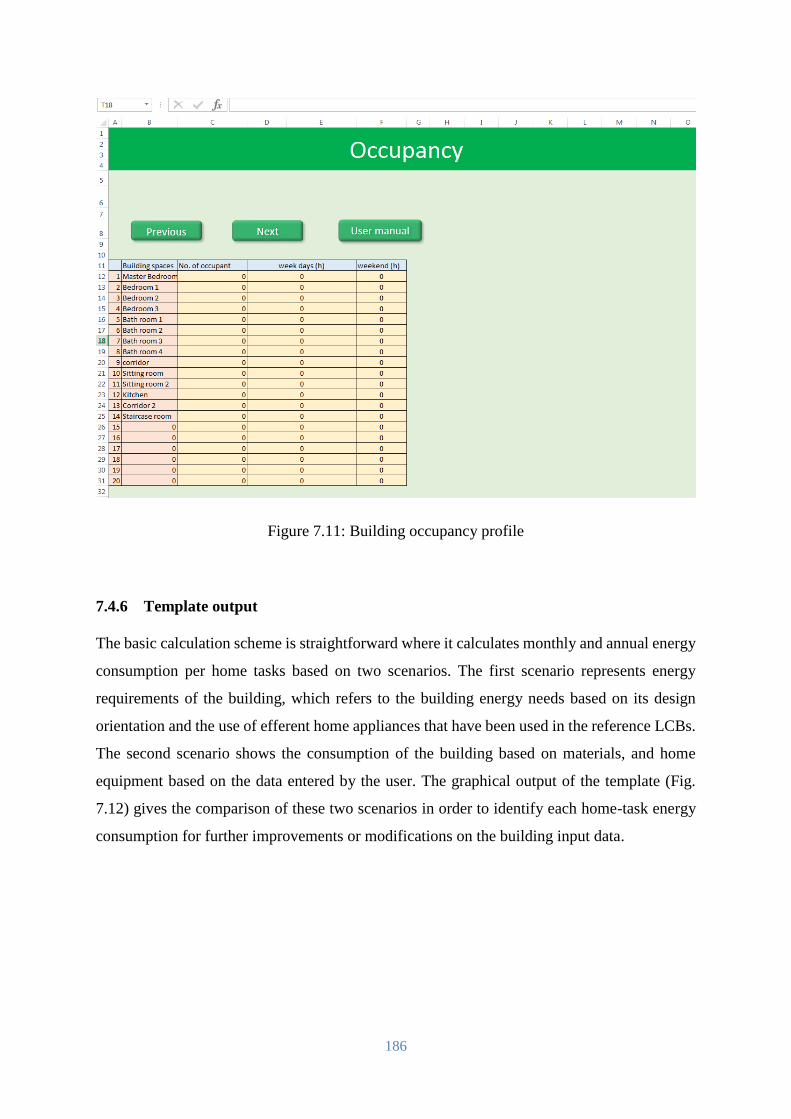
186
Figure 7.11: Building occupancy profile
7.4.6 Template output
The basic calculation scheme is straightforward where it calculates monthly and annual energy
consumption per home tasks based on two scenarios. The first scenario represents energy
requirements of the building, which refers to the building energy needs based on its design
orientation and the use of efferent home appliances that have been used in the reference LCBs.
The second scenario shows the consumption of the building based on materials, and home
equipment based on the data entered by the user. The graphical output of the template (Fig.
7.12) gives the comparison of these two scenarios in order to identify each home-task energy
consumption for further improvements or modifications on the building input data.
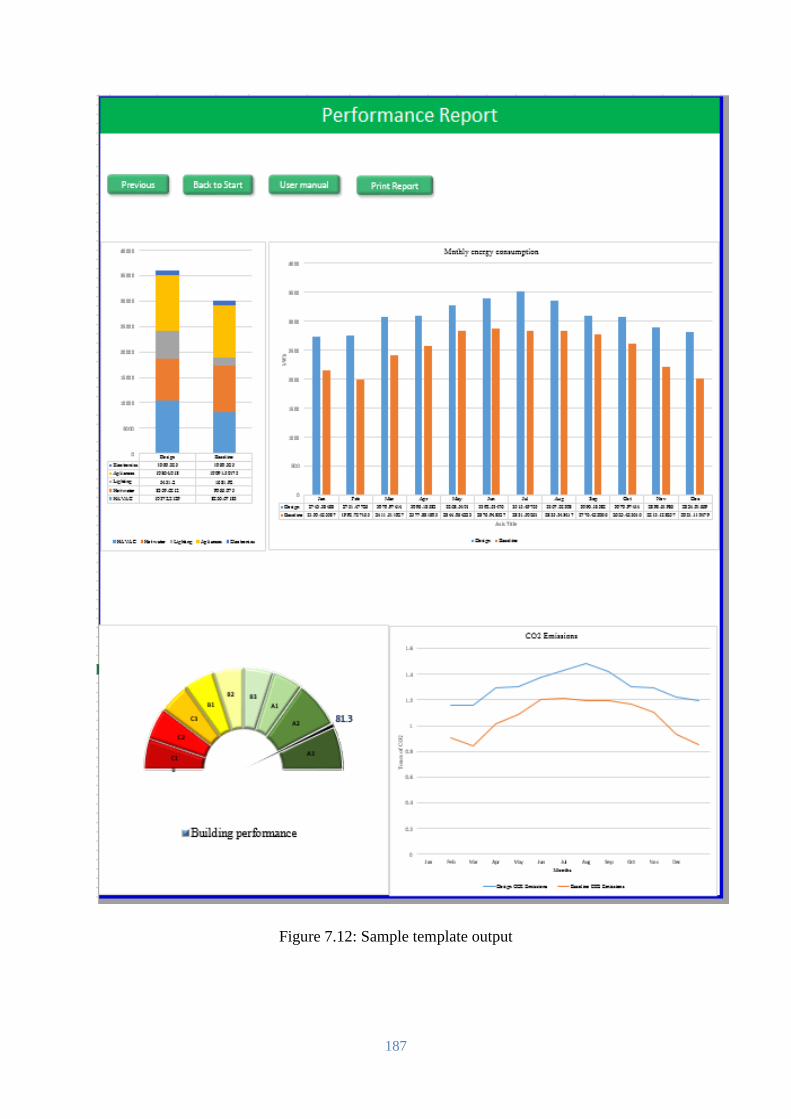
187
Figure 7.12: Sample template output
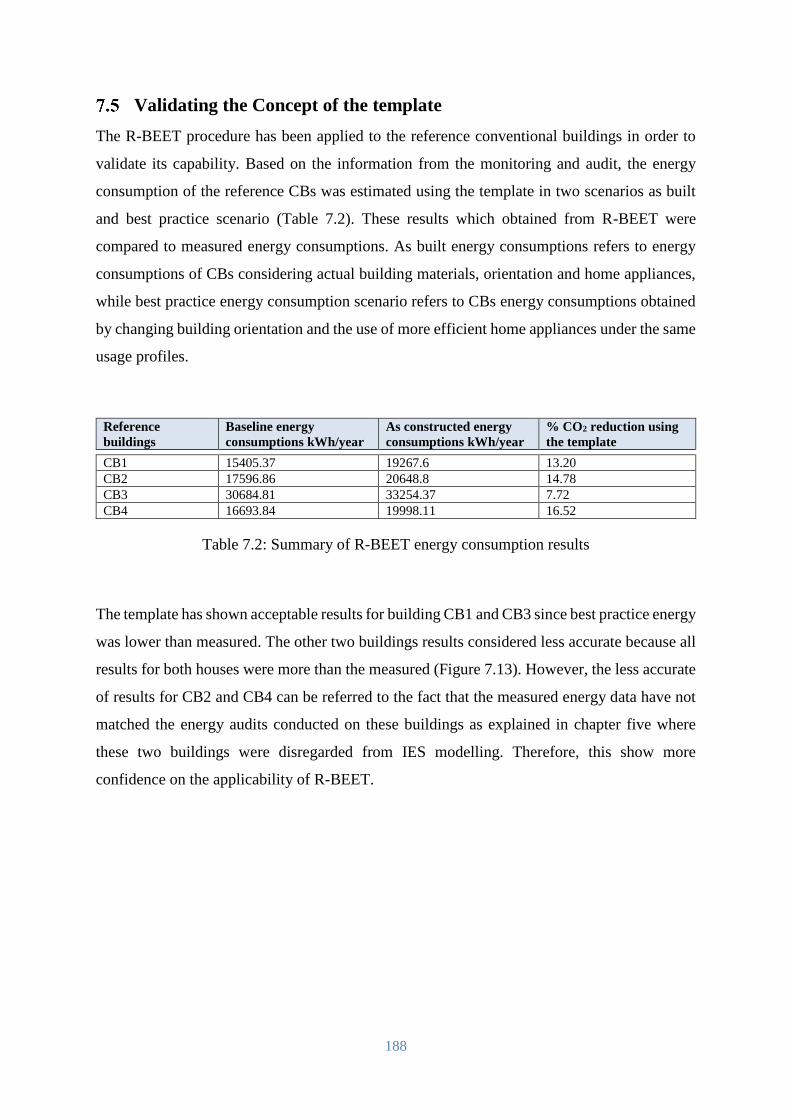
188
Validating the Concept of the template
The R-BEET procedure has been applied to the reference conventional buildings in order to
validate its capability. Based on the information from the monitoring and audit, the energy
consumption of the reference CBs was estimated using the template in two scenarios as built
and best practice scenario (Table 7.2). These results which obtained from R-BEET were
compared to measured energy consumptions. As built energy consumptions refers to energy
consumptions of CBs considering actual building materials, orientation and home appliances,
while best practice energy consumption scenario refers to CBs energy consumptions obtained
by changing building orientation and the use of more efficient home appliances under the same
usage profiles.
Reference
buildings
Baseline energy
consumptions kWh/year
As constructed energy
consumptions kWh/year
% CO2 reduction using
the template
CB1 15405.37 19267.6 13.20
CB2 17596.86 20648.8 14.78
CB3 30684.81 33254.37 7.72
CB4 16693.84 19998.11 16.52
Table 7.2: Summary of R-BEET energy consumption results
The template has shown acceptable results for building CB1 and CB3 since best practice energy
was lower than measured. The other two buildings results considered less accurate because all
results for both houses were more than the measured (Figure 7.13). However, the less accurate
of results for CB2 and CB4 can be referred to the fact that the measured energy data have not
matched the energy audits conducted on these buildings as explained in chapter five where
these two buildings were disregarded from IES modelling. Therefore, this show more
confidence on the applicability of R-BEET.
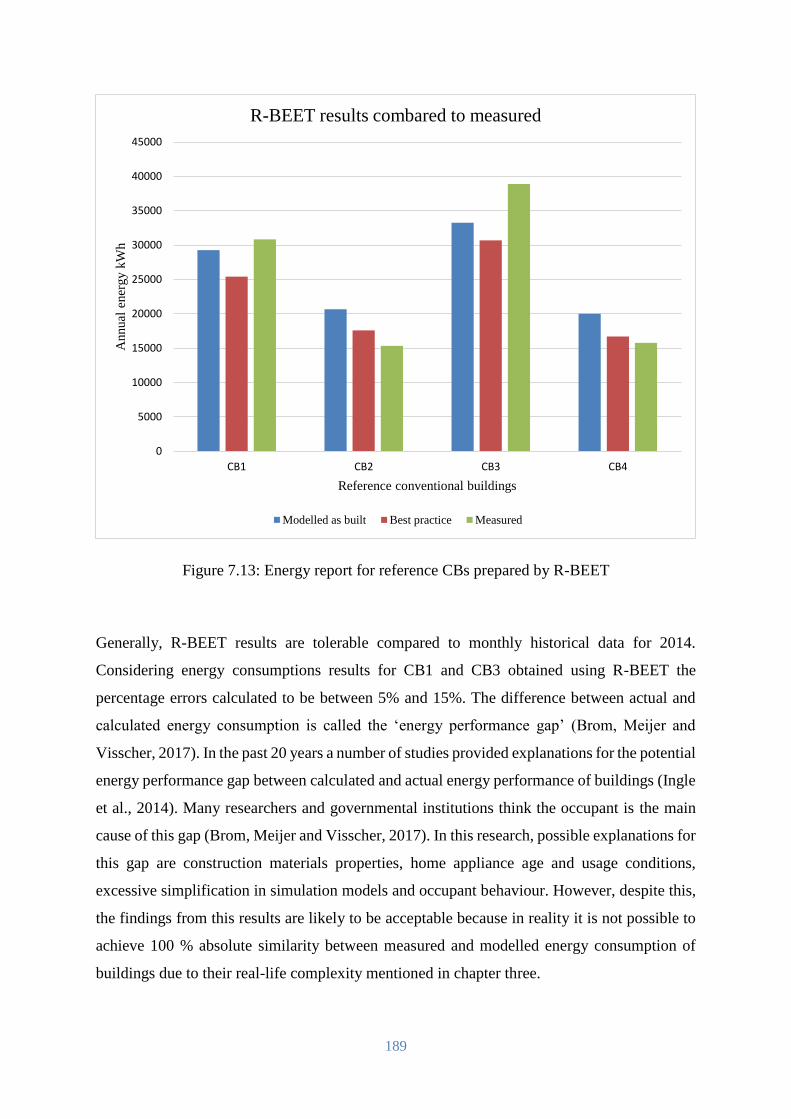
189
Figure 7.13: Energy report for reference CBs prepared by R-BEET
Generally, R-BEET results are tolerable compared to monthly historical data for 2014.
Considering energy consumptions results for CB1 and CB3 obtained using R-BEET the
percentage errors calculated to be between 5% and 15%. The difference between actual and
calculated energy consumption is called the ‘energy performance gap’ (Brom, Meijer and
Visscher, 2017). In the past 20 years a number of studies provided explanations for the potential
energy performance gap between calculated and actual energy performance of buildings (Ingle
et al., 2014). Many researchers and governmental institutions think the occupant is the main
cause of this gap (Brom, Meijer and Visscher, 2017). In this research, possible explanations for
this gap are construction materials properties, home appliance age and usage conditions,
excessive simplification in simulation models and occupant behaviour. However, despite this,
the findings from this results are likely to be acceptable because in reality it is not possible to
achieve 100 % absolute similarity between measured and modelled energy consumption of
buildings due to their real-life complexity mentioned in chapter three.
0
5000
10000
15000
20000
25000
30000
35000
40000
45000
CB1 CB2 CB3 CB4
Annual
ener
gy k
Wh
Reference conventional buildings
R-BEET results combared to measured
Modelled as built Best practice Measured
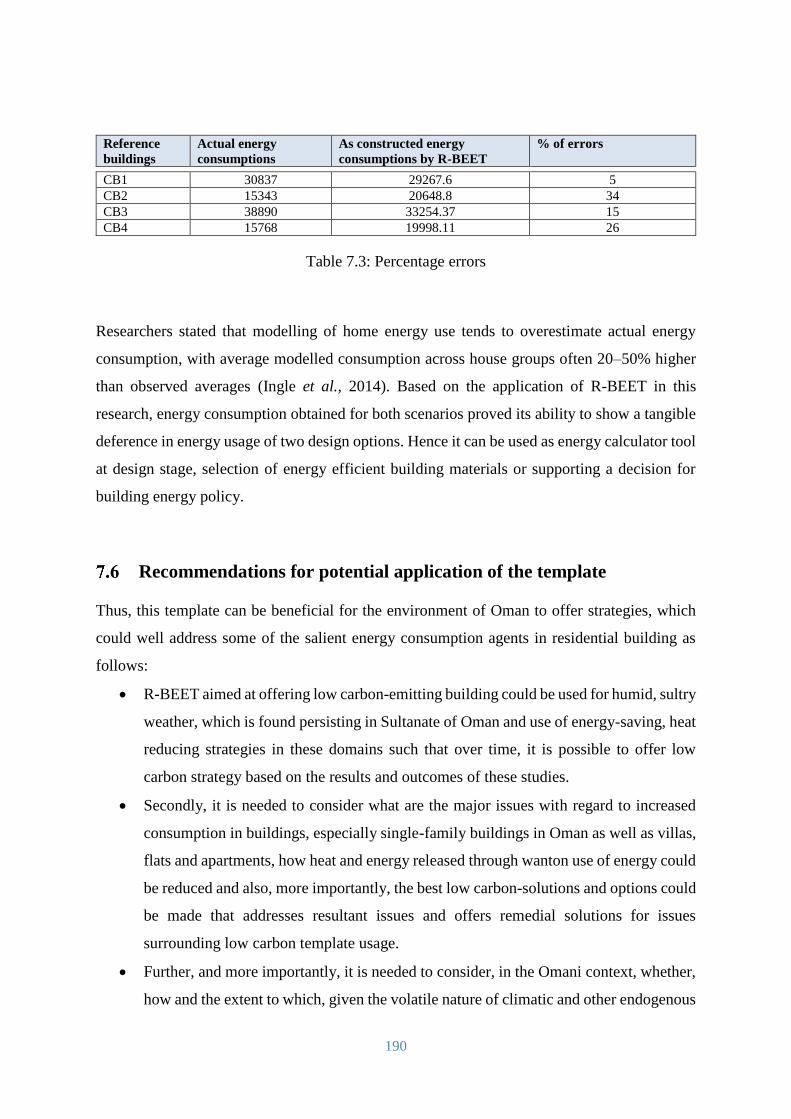
190
Reference
buildings
Actual energy
consumptions
As constructed energy
consumptions by R-BEET
% of errors
CB1 30837 29267.6 5
CB2 15343 20648.8 34
CB3 38890 33254.37 15
CB4 15768 19998.11 26
Table 7.3: Percentage errors
Researchers stated that modelling of home energy use tends to overestimate actual energy
consumption, with average modelled consumption across house groups often 20–50% higher
than observed averages (Ingle et al., 2014). Based on the application of R-BEET in this
research, energy consumption obtained for both scenarios proved its ability to show a tangible
deference in energy usage of two design options. Hence it can be used as energy calculator tool
at design stage, selection of energy efficient building materials or supporting a decision for
building energy policy.
Recommendations for potential application of the template
Thus, this template can be beneficial for the environment of Oman to offer strategies, which
could well address some of the salient energy consumption agents in residential building as
follows:
R-BEET aimed at offering low carbon-emitting building could be used for humid, sultry
weather, which is found persisting in Sultanate of Oman and use of energy-saving, heat
reducing strategies in these domains such that over time, it is possible to offer low
carbon strategy based on the results and outcomes of these studies.
Secondly, it is needed to consider what are the major issues with regard to increased
consumption in buildings, especially single-family buildings in Oman as well as villas,
flats and apartments, how heat and energy released through wanton use of energy could
be reduced and also, more importantly, the best low carbon-solutions and options could
be made that addresses resultant issues and offers remedial solutions for issues
surrounding low carbon template usage.
Further, and more importantly, it is needed to consider, in the Omani context, whether,
how and the extent to which, given the volatile nature of climatic and other endogenous
191
and exogenous impacts in the Omani context, determine how the deployment of R-
BEET could well be institutionalised, deployed and effectuated in the Omani context
in the short, medium and long term of its use, and how its main aims, goals and
objectives for deployment could optimally be gained.
Since the Residential Building Energy Efficiency Template needed to form the core
arguments of the thesis study, it is also needed to be argued what are its chief
advantages, benefits and resource building, especially in terms of its technical, techno-
commercial, techno-economic and importantly, techno-environmental and how could
optimal gains/benefits and minimal losses/drawbacks be gained over time.
Next, it is needed to state the major barriers, challenges, roadblocks and obstacles in
the use of R-BEET in this region, to consider the special characteristics of the hot,
humid climates prevailing in this region and how the best of R-BEET could help in
firstly, effectively addressing, and secondly, resolving overly demand and high
consumption levels of energy in the Omani context, especially for the short, medium
and long term.
The above must be considered in the light of fact that, in as much as the Omani regime
is considered, there is indeed a paucity of policy frameworks or a lack of robust Policy
Instruments, which seek to support deployment of Renewable Energy projects and,
more importantly, the fact that Oman subsidises fossilised fuels which render electrical
–based energy use rather costly. Furthermore, according to the Oman Electricity and
Heat Statistics, Final Consumption of Electricity in Residential Buildings is much
higher than consumption in other construction areas, especially in residential buildings.
Chapter summary
The availability of an energy calculation tool will help in evaluating deferent design options in
order to select a better strategy for low energy building. Consequently, this will lead to
buildings meeting expected performance targets and reduce the high energy construction of the
buildings sector such as in the case of Oman. This chapter discussed the development of a
residential building energy template created in an Excel workbook. The template generates an
energy consumption report that show the monthly and annual consumption of a building based
on user data input. Some of the inputs are standardised to allow consistent comparisons for
192
building energy for rating purposes in new and existing buildings. It can calculate the energy
demands of each space in the building according to the activity occupancy and home
appliances. In more detail, the R-BEET can be used to:
1. Develop a methodology of calculation of the integrated energy performance of
buildings;
2. Set minimum requirements for the energy performance of new and existing buildings;
3. Ensure that those requirements for the energy performance are met in new buildings;
4. Develop energy certification of buildings;
5. Establish standard for low carbon building in the Sultanate;
6. Determine CO2 emissions of operating a building;
7. Determines, on a similar basis, the CO2 emissions of a reference building, which has
fixed ventilation and cooling conditions and space and water heating fuel.
Furthermore, the template has been tested on reference CBs and found to be acceptable, and
hence can be used for the purpose it has been designed for.
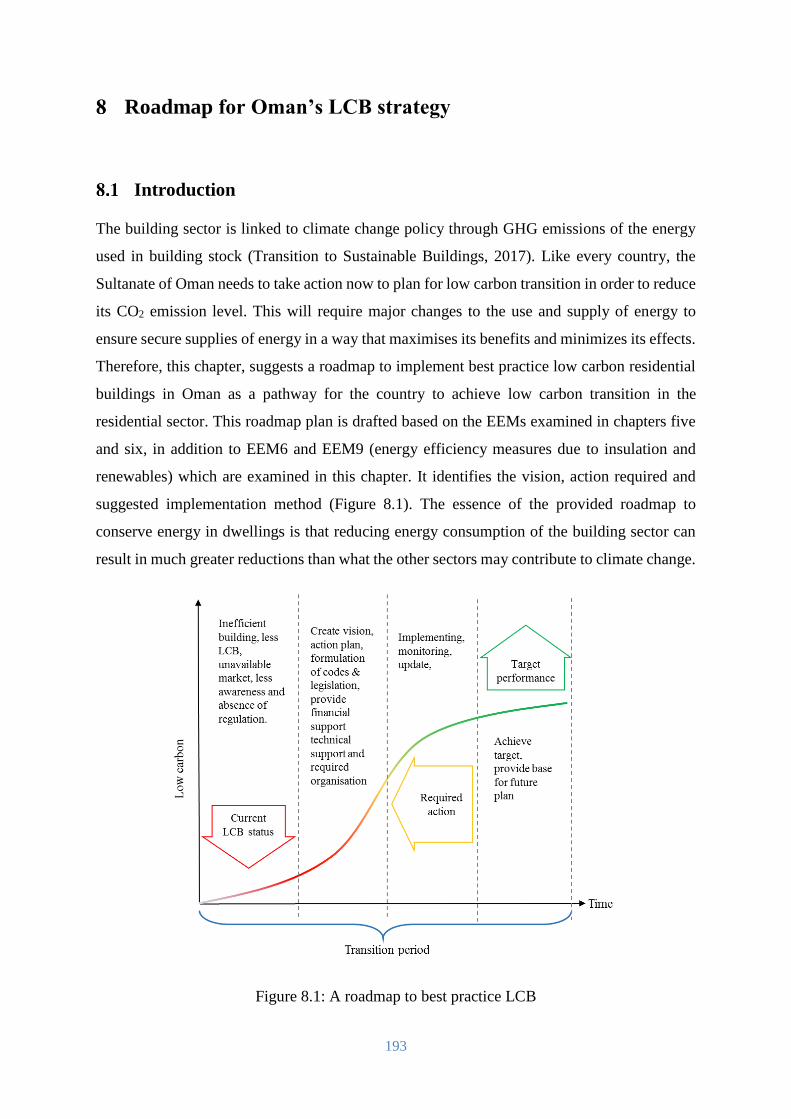
193
Roadmap for Oman’s LCB strategy
Introduction
The building sector is linked to climate change policy through GHG emissions of the energy
used in building stock (Transition to Sustainable Buildings, 2017). Like every country, the
Sultanate of Oman needs to take action now to plan for low carbon transition in order to reduce
its CO2 emission level. This will require major changes to the use and supply of energy to
ensure secure supplies of energy in a way that maximises its benefits and minimizes its effects.
Therefore, this chapter, suggests a roadmap to implement best practice low carbon residential
buildings in Oman as a pathway for the country to achieve low carbon transition in the
residential sector. This roadmap plan is drafted based on the EEMs examined in chapters five
and six, in addition to EEM6 and EEM9 (energy efficiency measures due to insulation and
renewables) which are examined in this chapter. It identifies the vision, action required and
suggested implementation method (Figure 8.1). The essence of the provided roadmap to
conserve energy in dwellings is that reducing energy consumption of the building sector can
result in much greater reductions than what the other sectors may contribute to climate change.
Figure 8.1: A roadmap to best practice LCB
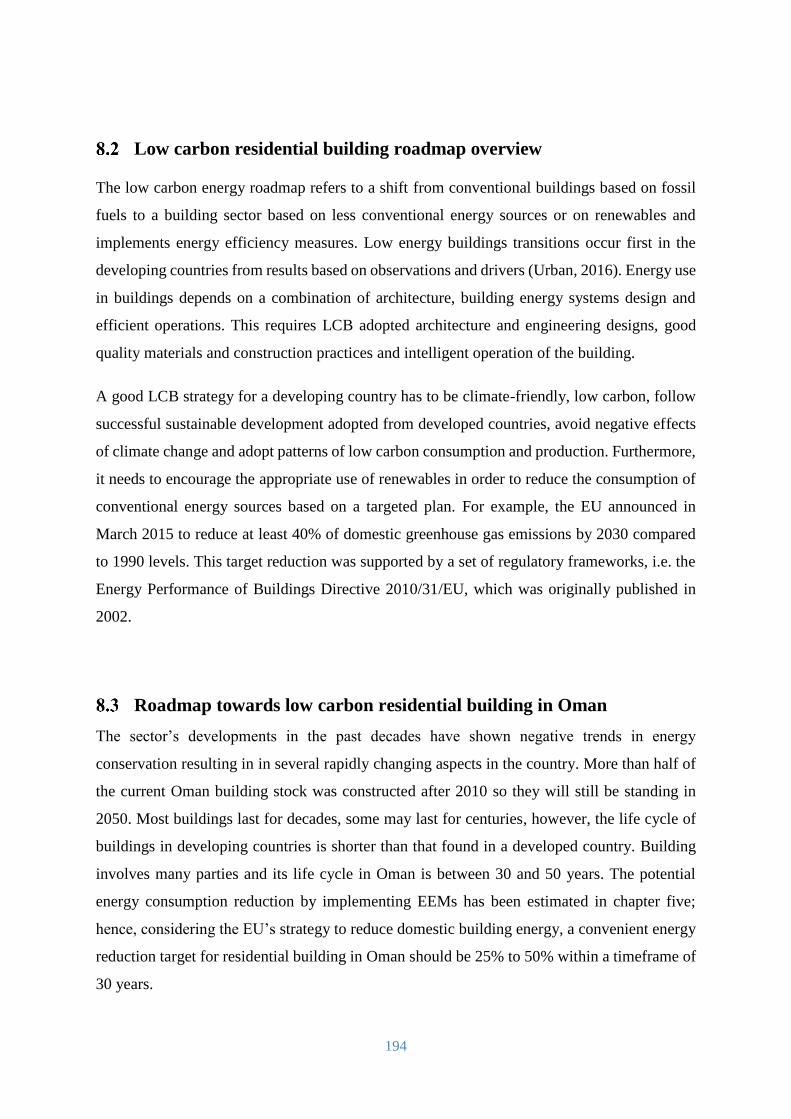
194
Low carbon residential building roadmap overview
The low carbon energy roadmap refers to a shift from conventional buildings based on fossil
fuels to a building sector based on less conventional energy sources or on renewables and
implements energy efficiency measures. Low energy buildings transitions occur first in the
developing countries from results based on observations and drivers (Urban, 2016). Energy use
in buildings depends on a combination of architecture, building energy systems design and
efficient operations. This requires LCB adopted architecture and engineering designs, good
quality materials and construction practices and intelligent operation of the building.
A good LCB strategy for a developing country has to be climate-friendly, low carbon, follow
successful sustainable development adopted from developed countries, avoid negative effects
of climate change and adopt patterns of low carbon consumption and production. Furthermore,
it needs to encourage the appropriate use of renewables in order to reduce the consumption of
conventional energy sources based on a targeted plan. For example, the EU announced in
March 2015 to reduce at least 40% of domestic greenhouse gas emissions by 2030 compared
to 1990 levels. This target reduction was supported by a set of regulatory frameworks, i.e. the
Energy Performance of Buildings Directive 2010/31/EU, which was originally published in
2002.
Roadmap towards low carbon residential building in Oman
The sector’s developments in the past decades have shown negative trends in energy
conservation resulting in in several rapidly changing aspects in the country. More than half of
the current Oman building stock was constructed after 2010 so they will still be standing in
2050. Most buildings last for decades, some may last for centuries, however, the life cycle of
buildings in developing countries is shorter than that found in a developed country. Building
involves many parties and its life cycle in Oman is between 30 and 50 years. The potential
energy consumption reduction by implementing EEMs has been estimated in chapter five;
hence, considering the EU’s strategy to reduce domestic building energy, a convenient energy
reduction target for residential building in Oman should be 25% to 50% within a timeframe of
30 years.
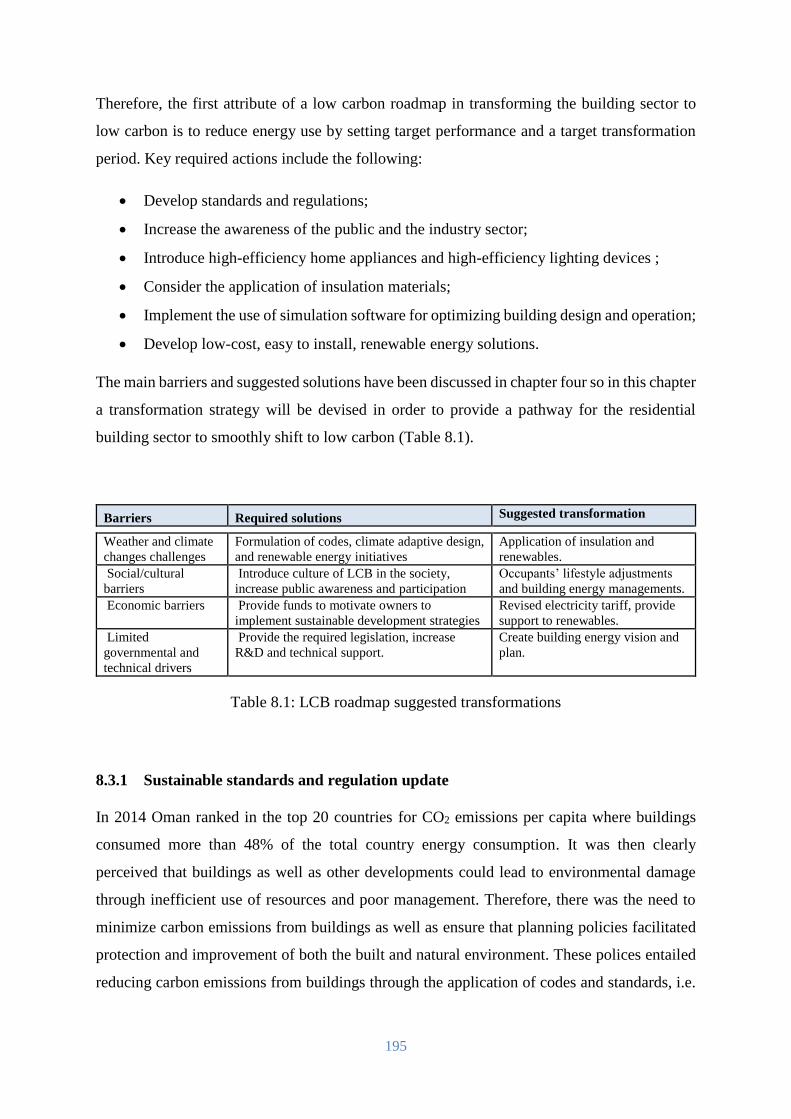
195
Therefore, the first attribute of a low carbon roadmap in transforming the building sector to
low carbon is to reduce energy use by setting target performance and a target transformation
period. Key required actions include the following:
Develop standards and regulations;
Increase the awareness of the public and the industry sector;
Introduce high-efficiency home appliances and high-efficiency lighting devices ;
Consider the application of insulation materials;
Implement the use of simulation software for optimizing building design and operation;
Develop low-cost, easy to install, renewable energy solutions.
The main barriers and suggested solutions have been discussed in chapter four so in this chapter
a transformation strategy will be devised in order to provide a pathway for the residential
building sector to smoothly shift to low carbon (Table 8.1).
Barriers Required solutions Suggested transformation
Weather and climate
changes challenges
Formulation of codes, climate adaptive design,
and renewable energy initiatives
Application of insulation and
renewables.
Social/cultural
barriers
Introduce culture of LCB in the society,
increase public awareness and participation
Occupants’ lifestyle adjustments
and building energy managements.
Economic barriers Provide funds to motivate owners to
implement sustainable development strategies
Revised electricity tariff, provide
support to renewables.
Limited
governmental and
technical drivers
Provide the required legislation, increase
R&D and technical support.
Create building energy vision and
plan.
Table 8.1: LCB roadmap suggested transformations
8.3.1 Sustainable standards and regulation update
In 2014 Oman ranked in the top 20 countries for CO2 emissions per capita where buildings
consumed more than 48% of the total country energy consumption. It was then clearly
perceived that buildings as well as other developments could lead to environmental damage
through inefficient use of resources and poor management. Therefore, there was the need to
minimize carbon emissions from buildings as well as ensure that planning policies facilitated
protection and improvement of both the built and natural environment. These polices entailed
reducing carbon emissions from buildings through the application of codes and standards, i.e.
196
those that are applied in developed countries (Table 8.2). In this regard, it was advisable to
consider these codes as an exemplar for devising codes for Oman.
Code of practice International
example
Country Objectives of implementation
Building code International Energy
Conservation Code
(IECC)
USA The establishment of minimum design and
construction requirements for energy efficiency.
Energy regulation Part L. Conservation
of fuel and power
UK To set out the requirements for the target of LCB
such as sizes of openings and insulations, etc.
Building energy
rating and
certification
BREEAM UK Raise awareness amongst owners, occupiers,
designers and operators of the benefits of taking
a sustainability approach.
Home appliances
labelling
Energy Star USA To provide consumers with information about
energy consumption, efficiency and operating
costs of home appliances.
Renewables
Regulation
The Public Utility
Regulatory Policies
Act 1978 (PURPA)
USA To create a market for power from non-utility
power producers.
Table 8.2: Sample of international codes and their objectives
Technical recommendation for application of LCB strategy
Providing a comfortable and healthy interior environment is one of the core functions of
building energy systems and accounts for about a third of total building energy use. New
construction methods and materials besides technologies for heating, cooling and ventilation
not only improve a building’s efficiency but can also improve the lifestyle of occupants,
providing better control and reducing unwanted heat associated with variations. Opportunities
for improvements were classified in the following basic categories:
Improve the building envelope;
Manage heat loss through ventilation;
Improve space conditioning techniques;
Improve lighting systems and control;
Improve building system level.
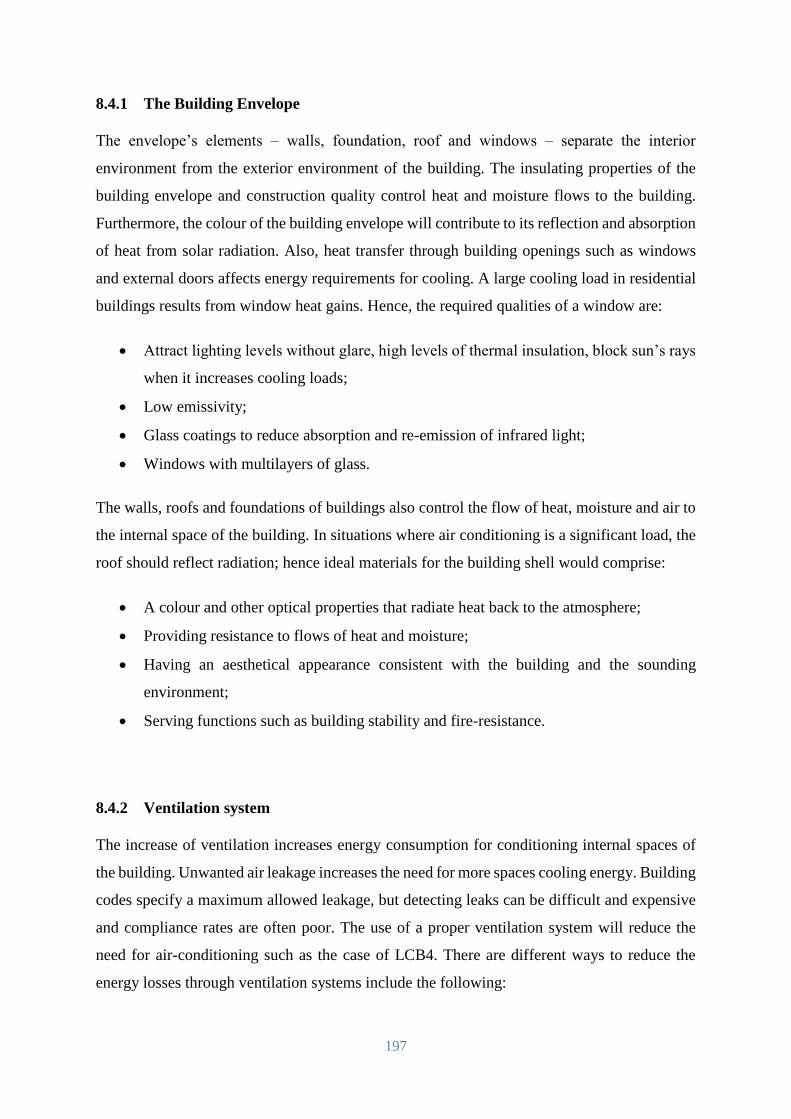
197
8.4.1 The Building Envelope
The envelope’s elements ‒ walls, foundation, roof and windows ‒ separate the interior
environment from the exterior environment of the building. The insulating properties of the
building envelope and construction quality control heat and moisture flows to the building.
Furthermore, the colour of the building envelope will contribute to its reflection and absorption
of heat from solar radiation. Also, heat transfer through building openings such as windows
and external doors affects energy requirements for cooling. A large cooling load in residential
buildings results from window heat gains. Hence, the required qualities of a window are:
Attract lighting levels without glare, high levels of thermal insulation, block sun’s rays
when it increases cooling loads;
Low emissivity;
Glass coatings to reduce absorption and re-emission of infrared light;
Windows with multilayers of glass.
The walls, roofs and foundations of buildings also control the flow of heat, moisture and air to
the internal space of the building. In situations where air conditioning is a significant load, the
roof should reflect radiation; hence ideal materials for the building shell would comprise:
A colour and other optical properties that radiate heat back to the atmosphere;
Providing resistance to flows of heat and moisture;
Having an aesthetical appearance consistent with the building and the sounding
environment;
Serving functions such as building stability and fire-resistance.
8.4.2 Ventilation system
The increase of ventilation increases energy consumption for conditioning internal spaces of
the building. Unwanted air leakage increases the need for more spaces cooling energy. Building
codes specify a maximum allowed leakage, but detecting leaks can be difficult and expensive
and compliance rates are often poor. The use of a proper ventilation system will reduce the
need for air-conditioning such as the case of LCB4. There are different ways to reduce the
energy losses through ventilation systems include the following:
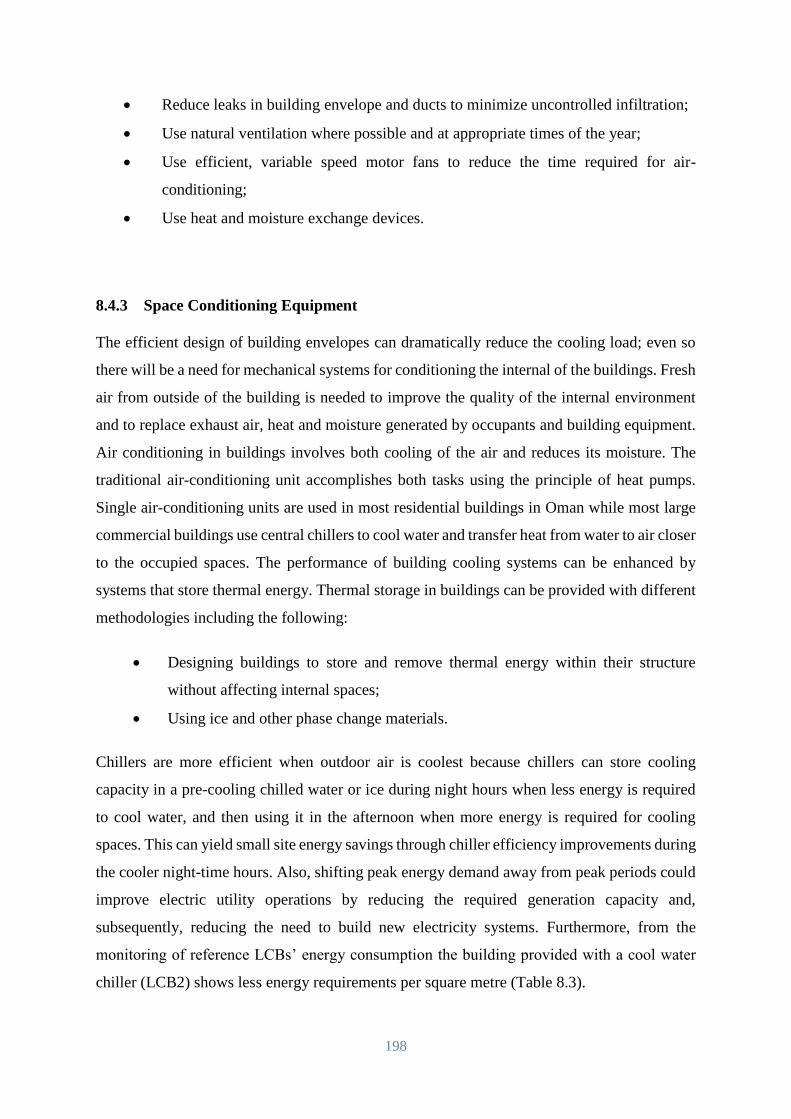
198
Reduce leaks in building envelope and ducts to minimize uncontrolled infiltration;
Use natural ventilation where possible and at appropriate times of the year;
Use efficient, variable speed motor fans to reduce the time required for air-
conditioning;
Use heat and moisture exchange devices.
8.4.3 Space Conditioning Equipment
The efficient design of building envelopes can dramatically reduce the cooling load; even so
there will be a need for mechanical systems for conditioning the internal of the buildings. Fresh
air from outside of the building is needed to improve the quality of the internal environment
and to replace exhaust air, heat and moisture generated by occupants and building equipment.
Air conditioning in buildings involves both cooling of the air and reduces its moisture. The
traditional air-conditioning unit accomplishes both tasks using the principle of heat pumps.
Single air-conditioning units are used in most residential buildings in Oman while most large
commercial buildings use central chillers to cool water and transfer heat from water to air closer
to the occupied spaces. The performance of building cooling systems can be enhanced by
systems that store thermal energy. Thermal storage in buildings can be provided with different
methodologies including the following:
Designing buildings to store and remove thermal energy within their structure
without affecting internal spaces;
Using ice and other phase change materials.
Chillers are more efficient when outdoor air is coolest because chillers can store cooling
capacity in a pre-cooling chilled water or ice during night hours when less energy is required
to cool water, and then using it in the afternoon when more energy is required for cooling
spaces. This can yield small site energy savings through chiller efficiency improvements during
the cooler night-time hours. Also, shifting peak energy demand away from peak periods could
improve electric utility operations by reducing the required generation capacity and,
subsequently, reducing the need to build new electricity systems. Furthermore, from the
monitoring of reference LCBs’ energy consumption the building provided with a cool water
chiller (LCB2) shows less energy requirements per square metre (Table 8.3).
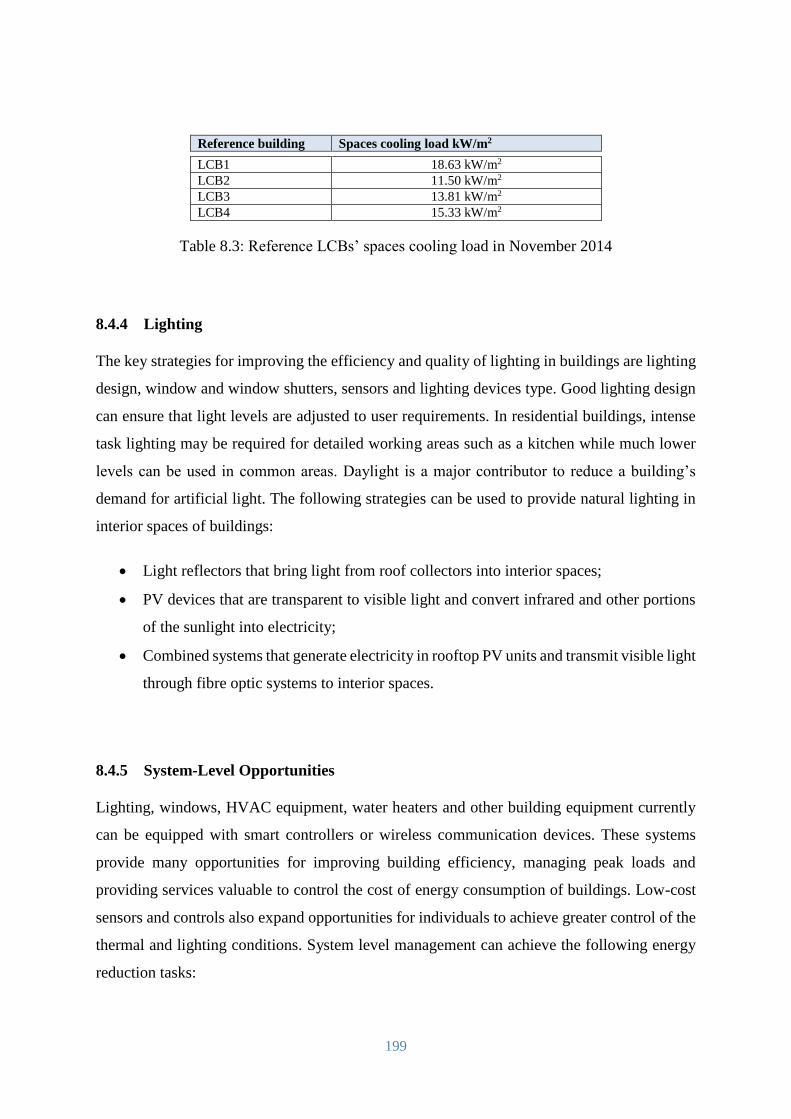
199
Reference building Spaces cooling load kW/m2
LCB1 18.63 kW/m2
LCB2 11.50 kW/m2
LCB3 13.81 kW/m2
LCB4 15.33 kW/m2
Table 8.3: Reference LCBs’ spaces cooling load in November 2014
8.4.4 Lighting
The key strategies for improving the efficiency and quality of lighting in buildings are lighting
design, window and window shutters, sensors and lighting devices type. Good lighting design
can ensure that light levels are adjusted to user requirements. In residential buildings, intense
task lighting may be required for detailed working areas such as a kitchen while much lower
levels can be used in common areas. Daylight is a major contributor to reduce a building’s
demand for artificial light. The following strategies can be used to provide natural lighting in
interior spaces of buildings:
Light reflectors that bring light from roof collectors into interior spaces;
PV devices that are transparent to visible light and convert infrared and other portions
of the sunlight into electricity;
Combined systems that generate electricity in rooftop PV units and transmit visible light
through fibre optic systems to interior spaces.
8.4.5 System-Level Opportunities
Lighting, windows, HVAC equipment, water heaters and other building equipment currently
can be equipped with smart controllers or wireless communication devices. These systems
provide many opportunities for improving building efficiency, managing peak loads and
providing services valuable to control the cost of energy consumption of buildings. Low-cost
sensors and controls also expand opportunities for individuals to achieve greater control of the
thermal and lighting conditions. System level management can achieve the following energy
reduction tasks:
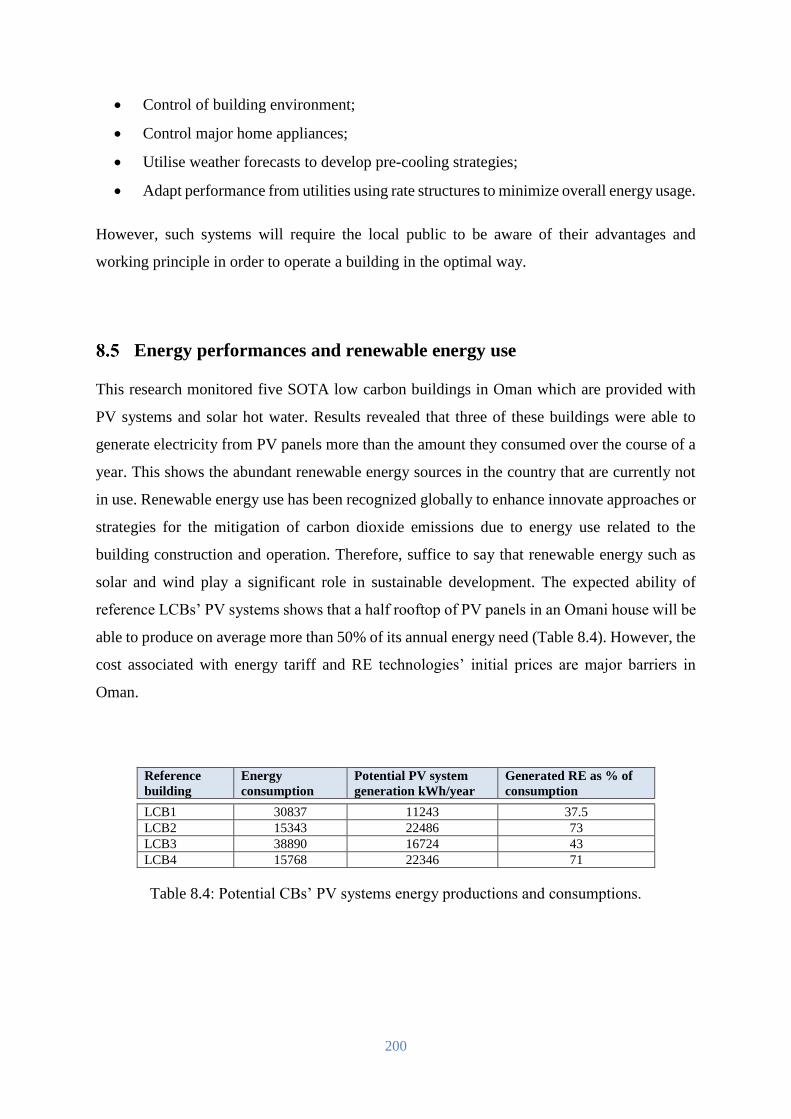
200
Control of building environment;
Control major home appliances;
Utilise weather forecasts to develop pre-cooling strategies;
Adapt performance from utilities using rate structures to minimize overall energy usage.
However, such systems will require the local public to be aware of their advantages and
working principle in order to operate a building in the optimal way.
Energy performances and renewable energy use
This research monitored five SOTA low carbon buildings in Oman which are provided with
PV systems and solar hot water. Results revealed that three of these buildings were able to
generate electricity from PV panels more than the amount they consumed over the course of a
year. This shows the abundant renewable energy sources in the country that are currently not
in use. Renewable energy use has been recognized globally to enhance innovate approaches or
strategies for the mitigation of carbon dioxide emissions due to energy use related to the
building construction and operation. Therefore, suffice to say that renewable energy such as
solar and wind play a significant role in sustainable development. The expected ability of
reference LCBs’ PV systems shows that a half rooftop of PV panels in an Omani house will be
able to produce on average more than 50% of its annual energy need (Table 8.4). However, the
cost associated with energy tariff and RE technologies’ initial prices are major barriers in
Oman.
Reference
building
Energy
consumption
Potential PV system
generation kWh/year
Generated RE as % of
consumption
LCB1 30837 11243 37.5
LCB2 15343 22486 73
LCB3 38890 16724 43
LCB4 15768 22346 71
Table 8.4: Potential CBs’ PV systems energy productions and consumptions.
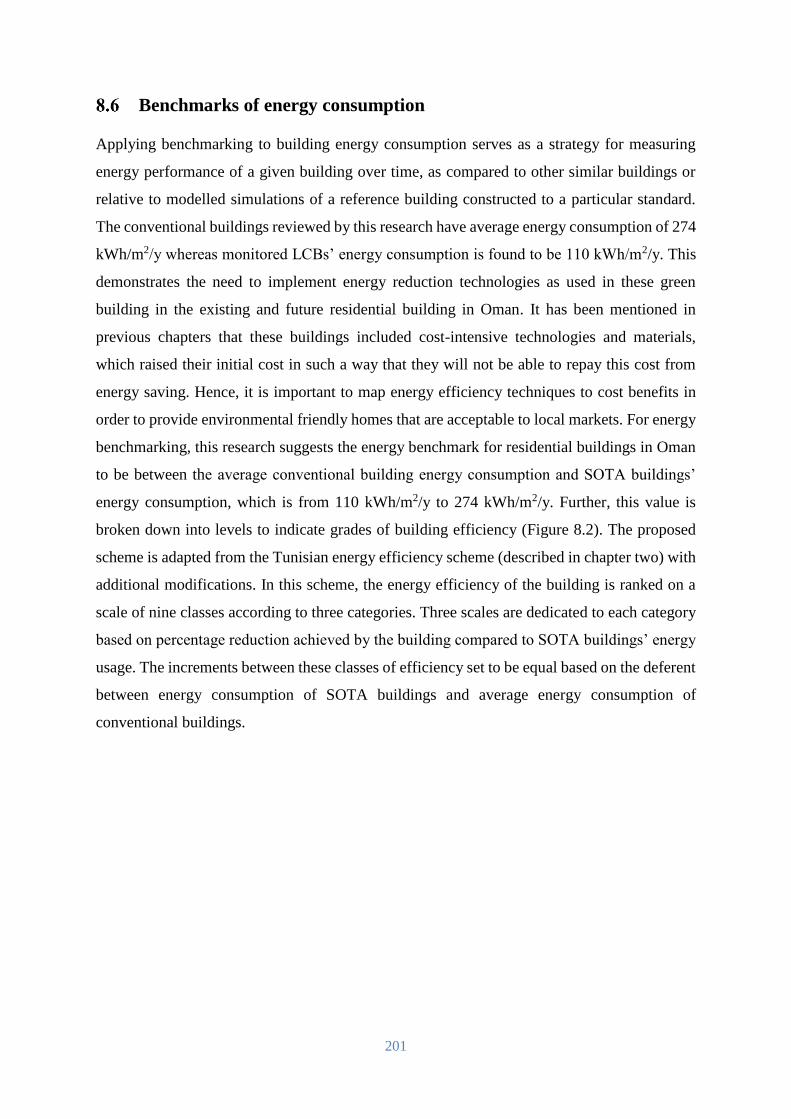
201
Benchmarks of energy consumption
Applying benchmarking to building energy consumption serves as a strategy for measuring
energy performance of a given building over time, as compared to other similar buildings or
relative to modelled simulations of a reference building constructed to a particular standard.
The conventional buildings reviewed by this research have average energy consumption of 274
kWh/m2/y whereas monitored LCBs’ energy consumption is found to be 110 kWh/m2/y. This
demonstrates the need to implement energy reduction technologies as used in these green
building in the existing and future residential building in Oman. It has been mentioned in
previous chapters that these buildings included cost-intensive technologies and materials,
which raised their initial cost in such a way that they will not be able to repay this cost from
energy saving. Hence, it is important to map energy efficiency techniques to cost benefits in
order to provide environmental friendly homes that are acceptable to local markets. For energy
benchmarking, this research suggests the energy benchmark for residential buildings in Oman
to be between the average conventional building energy consumption and SOTA buildings’
energy consumption, which is from 110 kWh/m2/y to 274 kWh/m2/y. Further, this value is
broken down into levels to indicate grades of building efficiency (Figure 8.2). The proposed
scheme is adapted from the Tunisian energy efficiency scheme (described in chapter two) with
additional modifications. In this scheme, the energy efficiency of the building is ranked on a
scale of nine classes according to three categories. Three scales are dedicated to each category
based on percentage reduction achieved by the building compared to SOTA buildings’ energy
usage. The increments between these classes of efficiency set to be equal based on the deferent
between energy consumption of SOTA buildings and average energy consumption of
conventional buildings.
202
Figure 8.2: Suggested energy rating scheme
Cost of low carbon building
In general, high-efficiency building elements are more expensive than equivalent standard-
efficiency elements. As shown in earlier chapters a main barrier to implementing low energy
materials and technology was the high cost of these EEMs. Hence, a cost-optimal LCB needs
to integrate EEMs into the construction of a building without high initial cost. Innovative
design teams can incorporate simple, passive energy-efficiency strategies into the building
architecture and envelope at no additional cost. Building orientation, massing and layout can
be designed to reduce building thermal loads without increasing material or construction costs.
Other passive strategies, including daylight redirection, thermal massing, natural ventilation
and solar shading, can be integrated with the building structure to create architecturally
pleasing designs that also save energy. Well integrated solutions can often eliminate the need
for additional controls and mechanical components that increase first cost and require long-
term maintenance. However, in the case of Oman, additional cost will be needed to integrate
RE and implementing insulation to the envelope. Therefore, in this section the additional cost
due to implementing these measures will be evaluated. Further, the ideal energy price will be
suggested in order to determine the suitable price of energy that will lead to implementing these
EEMs. In this regard, the cost-optimal calculations method, which approved by the EC
Delegated Regulation, is used in the analysis (EU) No. 244/2012 of 16).
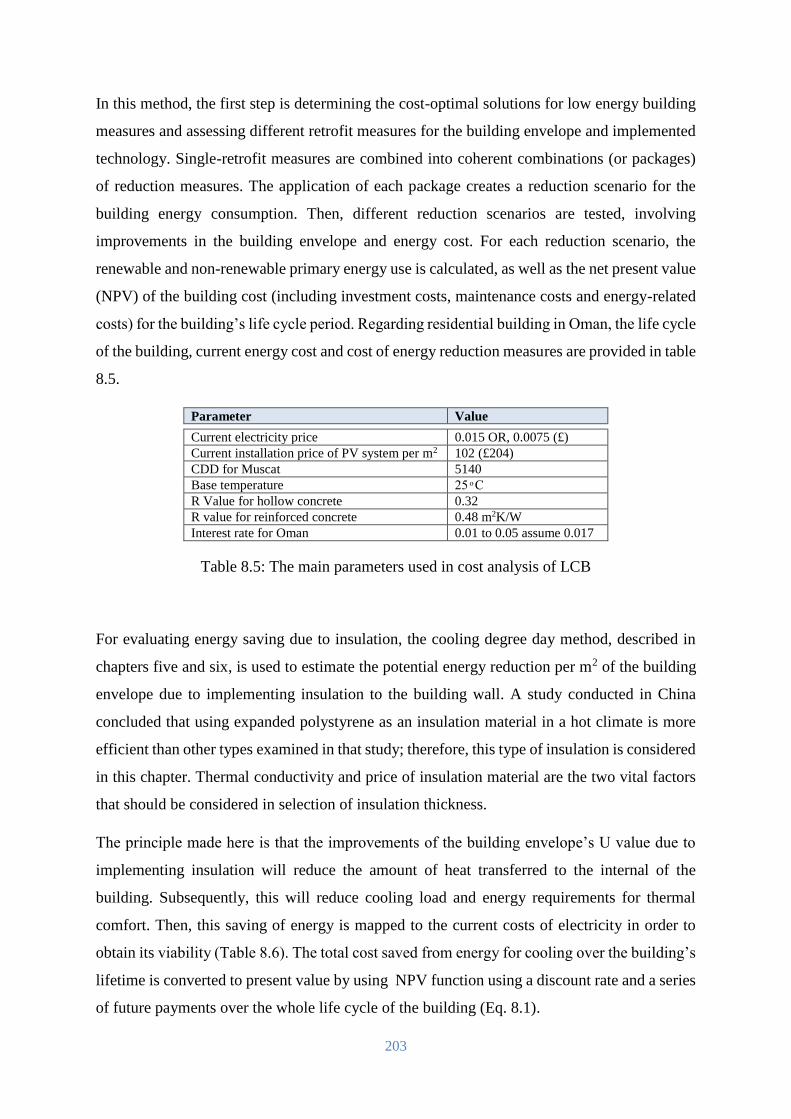
203
In this method, the first step is determining the cost-optimal solutions for low energy building
measures and assessing different retrofit measures for the building envelope and implemented
technology. Single-retrofit measures are combined into coherent combinations (or packages)
of reduction measures. The application of each package creates a reduction scenario for the
building energy consumption. Then, different reduction scenarios are tested, involving
improvements in the building envelope and energy cost. For each reduction scenario, the
renewable and non-renewable primary energy use is calculated, as well as the net present value
(NPV) of the building cost (including investment costs, maintenance costs and energy-related
costs) for the building’s life cycle period. Regarding residential building in Oman, the life cycle
of the building, current energy cost and cost of energy reduction measures are provided in table
8.5.
Parameter Value
Current electricity price 0.015 OR, 0.0075 (£)
Current installation price of PV system per m2 102 (£204)
CDD for Muscat 5140
Base temperature 25 C
R Value for hollow concrete 0.32
R value for reinforced concrete 0.48 m2K/W
Interest rate for Oman 0.01 to 0.05 assume 0.017
Table 8.5: The main parameters used in cost analysis of LCB
For evaluating energy saving due to insulation, the cooling degree day method, described in
chapters five and six, is used to estimate the potential energy reduction per m2 of the building
envelope due to implementing insulation to the building wall. A study conducted in China
concluded that using expanded polystyrene as an insulation material in a hot climate is more
efficient than other types examined in that study; therefore, this type of insulation is considered
in this chapter. Thermal conductivity and price of insulation material are the two vital factors
that should be considered in selection of insulation thickness.
The principle made here is that the improvements of the building envelope’s U value due to
implementing insulation will reduce the amount of heat transferred to the internal of the
building. Subsequently, this will reduce cooling load and energy requirements for thermal
comfort. Then, this saving of energy is mapped to the current costs of electricity in order to
obtain its viability (Table 8.6). The total cost saved from energy for cooling over the building’s
lifetime is converted to present value by using NPV function using a discount rate and a series
of future payments over the whole life cycle of the building (Eq. 8.1).
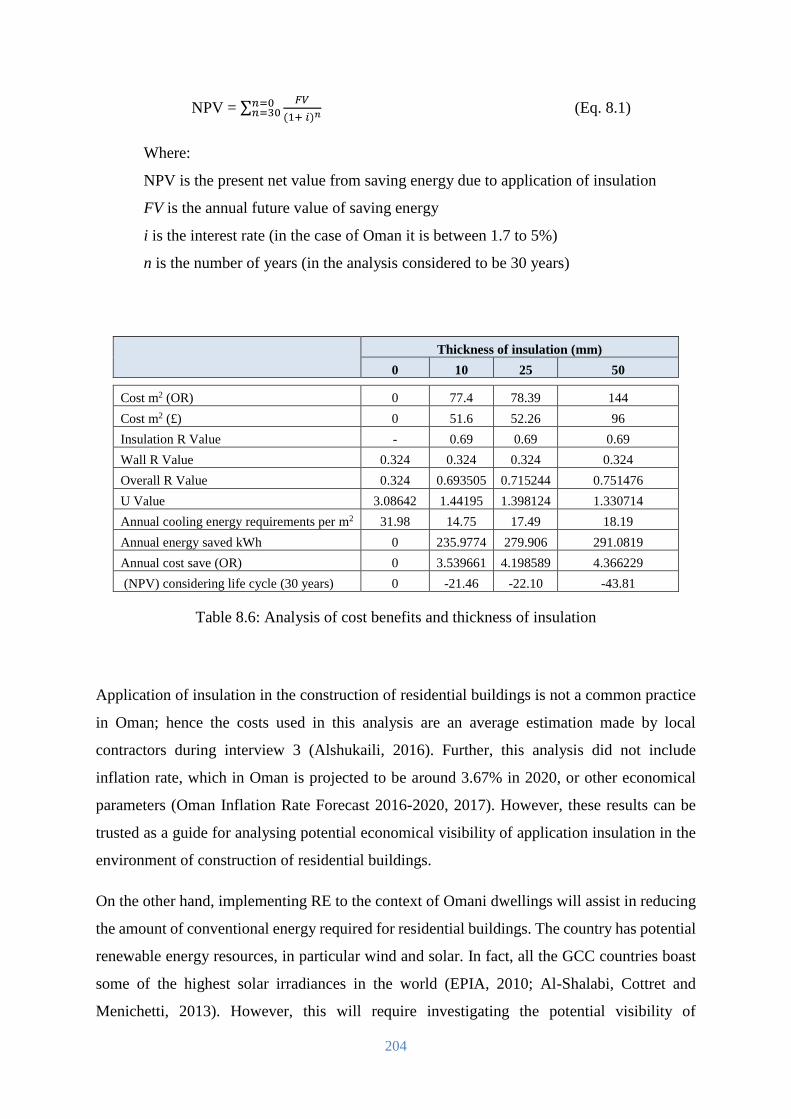
204
NPV = ∑𝐹𝑉
(1+ 𝑖)𝑛𝑛=0𝑛=30 (Eq. 8.1)
Where:
NPV is the present net value from saving energy due to application of insulation
FV is the annual future value of saving energy
i is the interest rate (in the case of Oman it is between 1.7 to 5%)
n is the number of years (in the analysis considered to be 30 years)
Thickness of insulation (mm)
0 10 25 50
Cost m2 (OR) 0 77.4 78.39 144
Cost m2 (£) 0 51.6 52.26 96
Insulation R Value - 0.69 0.69 0.69
Wall R Value 0.324 0.324 0.324 0.324
Overall R Value 0.324 0.693505 0.715244 0.751476
U Value 3.08642 1.44195 1.398124 1.330714
Annual cooling energy requirements per m2 31.98 14.75 17.49 18.19
Annual energy saved kWh 0 235.9774 279.906 291.0819
Annual cost save (OR) 0 3.539661 4.198589 4.366229
(NPV) considering life cycle (30 years) 0 -21.46 -22.10 -43.81
Table 8.6: Analysis of cost benefits and thickness of insulation
Application of insulation in the construction of residential buildings is not a common practice
in Oman; hence the costs used in this analysis are an average estimation made by local
contractors during interview 3 (Alshukaili, 2016). Further, this analysis did not include
inflation rate, which in Oman is projected to be around 3.67% in 2020, or other economical
parameters (Oman Inflation Rate Forecast 2016-2020, 2017). However, these results can be
trusted as a guide for analysing potential economical visibility of application insulation in the
environment of construction of residential buildings.
On the other hand, implementing RE to the context of Omani dwellings will assist in reducing
the amount of conventional energy required for residential buildings. The country has potential
renewable energy resources, in particular wind and solar. In fact, all the GCC countries boast
some of the highest solar irradiances in the world (EPIA, 2010; Al-Shalabi, Cottret and
Menichetti, 2013). However, this will require investigating the potential visibility of
205
implementation based on the current tariff of electricity. In reference to this, the potential
energy production and cost associated with installation of RE in reference CBs analysed using
the NPV method is based on data collected from reference LCBs, interviews and
questionnaires.
The factors controlling energy production of PV systems include total solar panel area (m2),
solar panel efficiency (%), annual average solar radiation (W/m2) and performance ratio (a
coefficient for losses). The coefficient of losses ranged between 0.5 and 0.9, with default value
of 0.75 for Oman, and refers to the losses accrued due to conversion of the energy from DC to
AC power and to installation independently of the panel efficiency. These losses include the
following (Alshukaili, 2016):
Inverter losses (4% to 10 %)
Temperature losses (5% to 20%)
DC cables losses (1% to 3 %)
AC cables losses (1% to 3 %)
Shadings 0 % to 80% (specific to each site)
Losses at weak radiation (3% to 7%)
Losses due to dust, snow (2%)
Other losses
The most efficient solar panels available on the market have efficiency rated as high as 25%
(Beeri et al., 2015), whereas the solar panels used in reference LCBs ranged from 14% to 16%.
The lowest value is considered in this analysis, assuming 95% no shading on the system, and
combining these parameters and factors in a mathematical expression, the following equation
is generated to estimate potential energy production of a PV system for a residential building
(Alshukaili, 2016):-
E = A × r × H × PR (Eq. 8.2)
Where:-
E = Energy (kWh)
A = Total solar panel Area (m2)
r = solar panel efficiency (%)
H = Annual average solar radiation (kWh/m2)
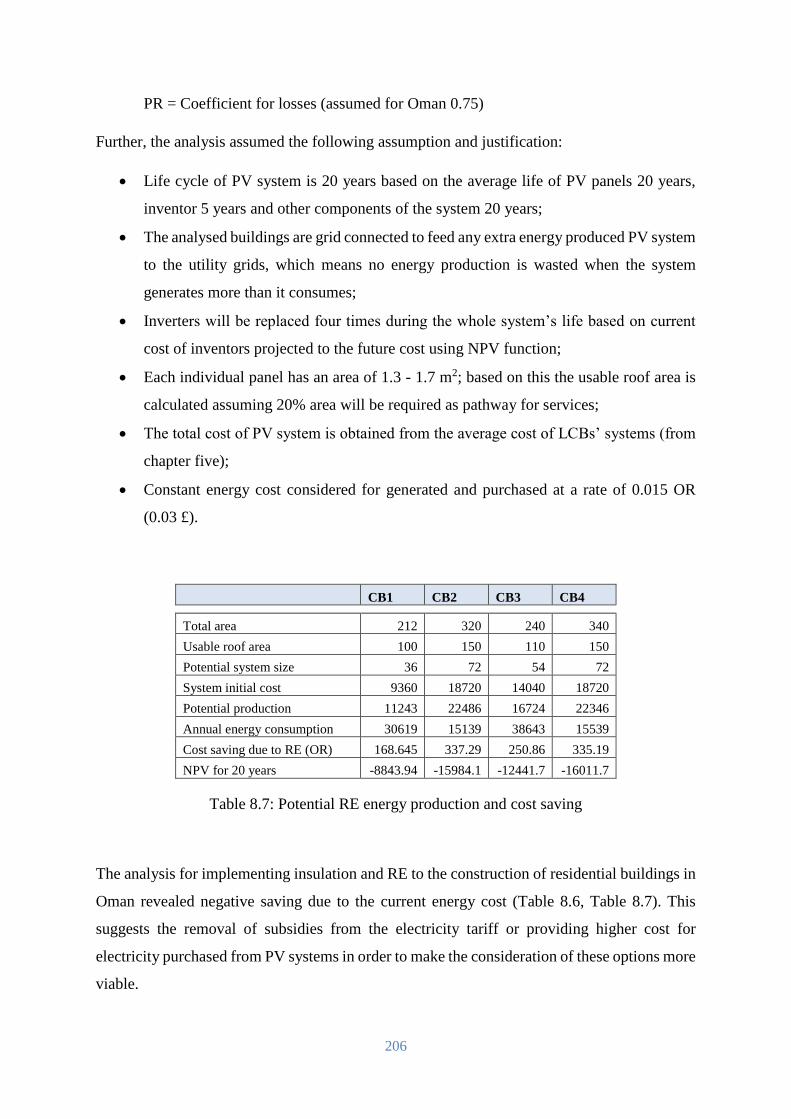
206
PR = Coefficient for losses (assumed for Oman 0.75)
Further, the analysis assumed the following assumption and justification:
Life cycle of PV system is 20 years based on the average life of PV panels 20 years,
inventor 5 years and other components of the system 20 years;
The analysed buildings are grid connected to feed any extra energy produced PV system
to the utility grids, which means no energy production is wasted when the system
generates more than it consumes;
Inverters will be replaced four times during the whole system’s life based on current
cost of inventors projected to the future cost using NPV function;
Each individual panel has an area of 1.3 - 1.7 m2; based on this the usable roof area is
calculated assuming 20% area will be required as pathway for services;
The total cost of PV system is obtained from the average cost of LCBs’ systems (from
chapter five);
Constant energy cost considered for generated and purchased at a rate of 0.015 OR
(0.03 £).
CB1 CB2 CB3 CB4
Total area 212 320 240 340
Usable roof area 100 150 110 150
Potential system size 36 72 54 72
System initial cost 9360 18720 14040 18720
Potential production 11243 22486 16724 22346
Annual energy consumption 30619 15139 38643 15539
Cost saving due to RE (OR) 168.645 337.29 250.86 335.19
NPV for 20 years -8843.94 -15984.1 -12441.7 -16011.7
Table 8.7: Potential RE energy production and cost saving
The analysis for implementing insulation and RE to the construction of residential buildings in
Oman revealed negative saving due to the current energy cost (Table 8.6, Table 8.7). This
suggests the removal of subsidies from the electricity tariff or providing higher cost for
electricity purchased from PV systems in order to make the consideration of these options more
viable.
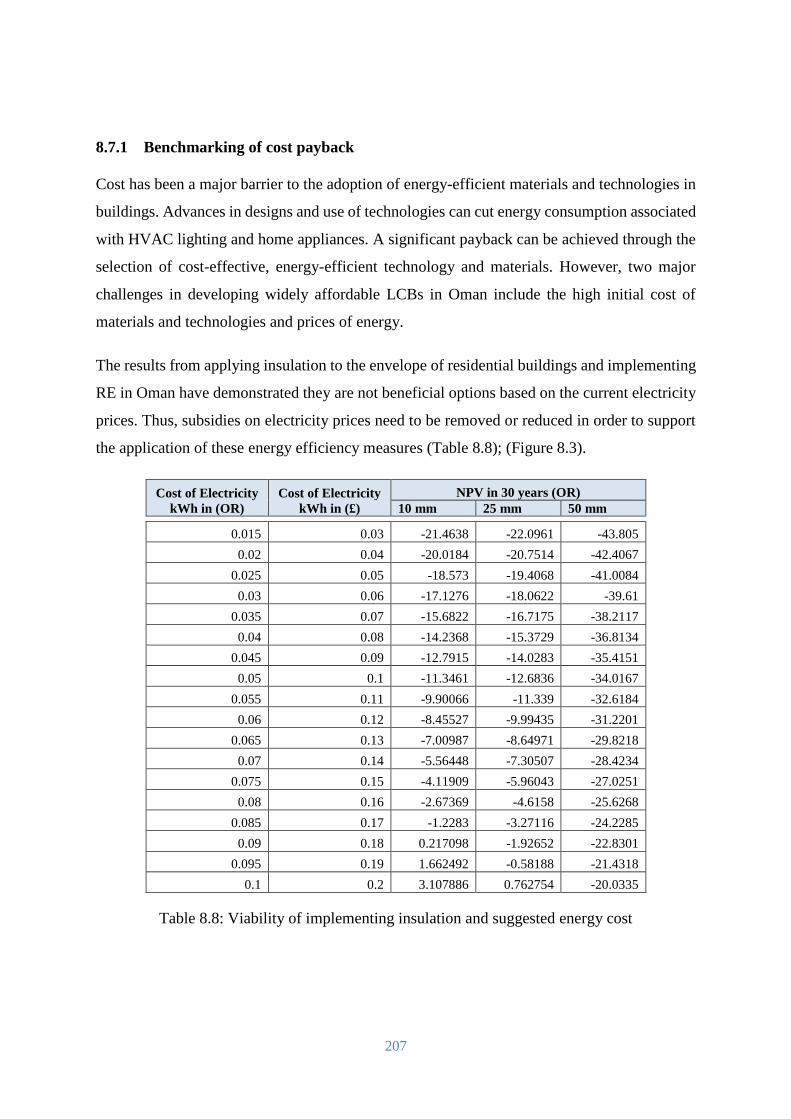
207
8.7.1 Benchmarking of cost payback
Cost has been a major barrier to the adoption of energy-efficient materials and technologies in
buildings. Advances in designs and use of technologies can cut energy consumption associated
with HVAC lighting and home appliances. A significant payback can be achieved through the
selection of cost-effective, energy-efficient technology and materials. However, two major
challenges in developing widely affordable LCBs in Oman include the high initial cost of
materials and technologies and prices of energy.
The results from applying insulation to the envelope of residential buildings and implementing
RE in Oman have demonstrated they are not beneficial options based on the current electricity
prices. Thus, subsidies on electricity prices need to be removed or reduced in order to support
the application of these energy efficiency measures (Table 8.8); (Figure 8.3).
Cost of Electricity
kWh in (OR)
Cost of Electricity
kWh in (£)
NPV in 30 years (OR)
10 mm 25 mm 50 mm
0.015 0.03 -21.4638 -22.0961 -43.805
0.02 0.04 -20.0184 -20.7514 -42.4067
0.025 0.05 -18.573 -19.4068 -41.0084
0.03 0.06 -17.1276 -18.0622 -39.61
0.035 0.07 -15.6822 -16.7175 -38.2117
0.04 0.08 -14.2368 -15.3729 -36.8134
0.045 0.09 -12.7915 -14.0283 -35.4151
0.05 0.1 -11.3461 -12.6836 -34.0167
0.055 0.11 -9.90066 -11.339 -32.6184
0.06 0.12 -8.45527 -9.99435 -31.2201
0.065 0.13 -7.00987 -8.64971 -29.8218
0.07 0.14 -5.56448 -7.30507 -28.4234
0.075 0.15 -4.11909 -5.96043 -27.0251
0.08 0.16 -2.67369 -4.6158 -25.6268
0.085 0.17 -1.2283 -3.27116 -24.2285
0.09 0.18 0.217098 -1.92652 -22.8301
0.095 0.19 1.662492 -0.58188 -21.4318
0.1 0.2 3.107886 0.762754 -20.0335
Table 8.8: Viability of implementing insulation and suggested energy cost
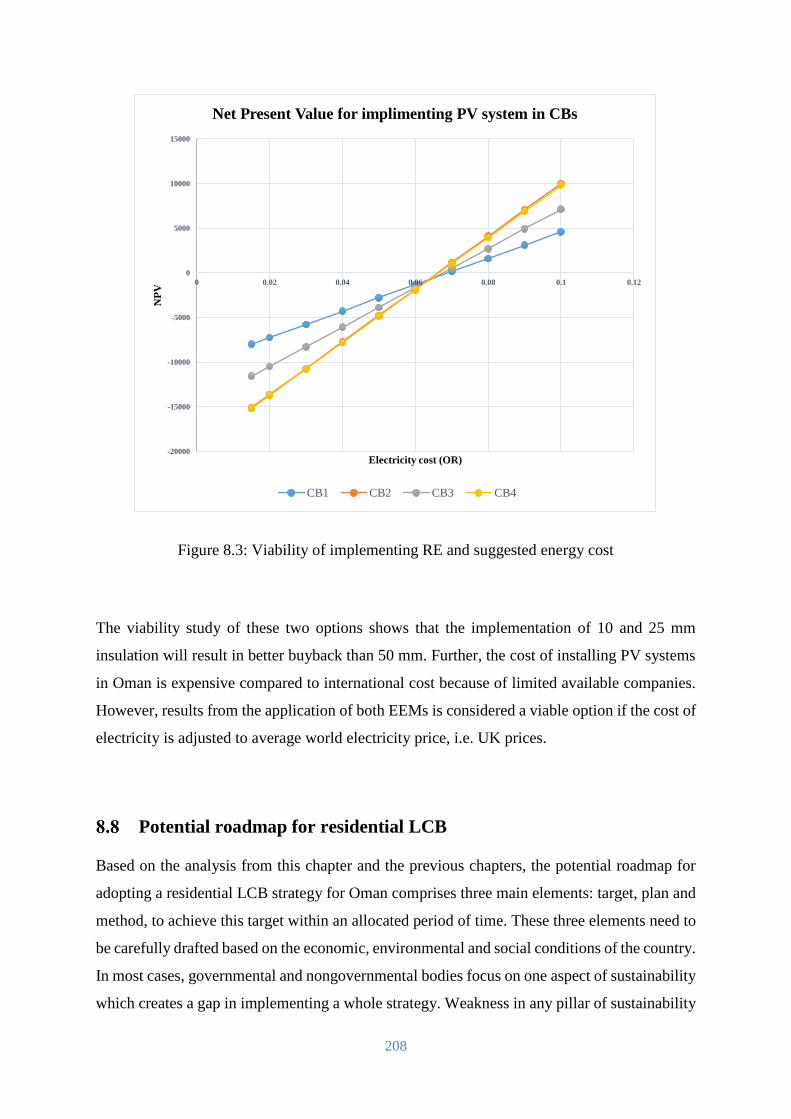
208
Figure 8.3: Viability of implementing RE and suggested energy cost
The viability study of these two options shows that the implementation of 10 and 25 mm
insulation will result in better buyback than 50 mm. Further, the cost of installing PV systems
in Oman is expensive compared to international cost because of limited available companies.
However, results from the application of both EEMs is considered a viable option if the cost of
electricity is adjusted to average world electricity price, i.e. UK prices.
Potential roadmap for residential LCB
Based on the analysis from this chapter and the previous chapters, the potential roadmap for
adopting a residential LCB strategy for Oman comprises three main elements: target, plan and
method, to achieve this target within an allocated period of time. These three elements need to
be carefully drafted based on the economic, environmental and social conditions of the country.
In most cases, governmental and nongovernmental bodies focus on one aspect of sustainability
which creates a gap in implementing a whole strategy. Weakness in any pillar of sustainability
-20000
-15000
-10000
-5000
0
5000
10000
15000
0 0.02 0.04 0.06 0.08 0.1 0.12
NP
V
Electricity cost (OR)
Net Present Value for implimenting PV system in CBs
CB1 CB2 CB3 CB4
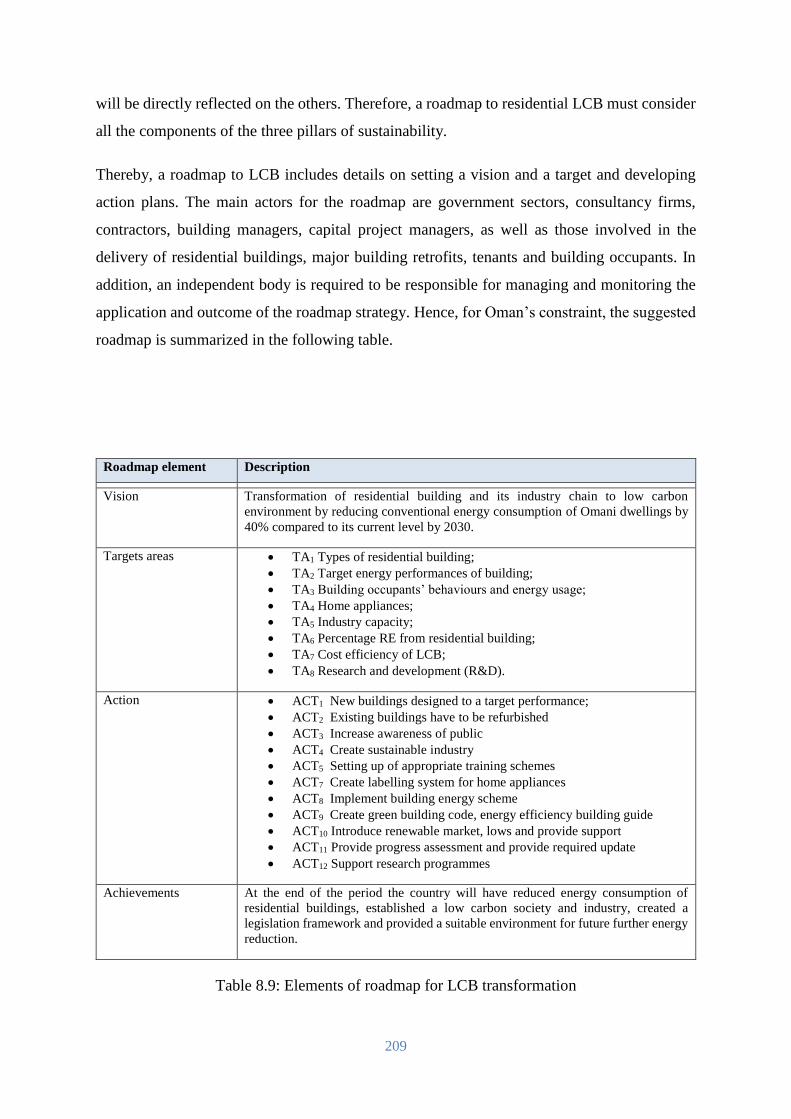
209
will be directly reflected on the others. Therefore, a roadmap to residential LCB must consider
all the components of the three pillars of sustainability.
Thereby, a roadmap to LCB includes details on setting a vision and a target and developing
action plans. The main actors for the roadmap are government sectors, consultancy firms,
contractors, building managers, capital project managers, as well as those involved in the
delivery of residential buildings, major building retrofits, tenants and building occupants. In
addition, an independent body is required to be responsible for managing and monitoring the
application and outcome of the roadmap strategy. Hence, for Oman’s constraint, the suggested
roadmap is summarized in the following table.
Roadmap element Description
Vision Transformation of residential building and its industry chain to low carbon
environment by reducing conventional energy consumption of Omani dwellings by
40% compared to its current level by 2030.
Targets areas TA1 Types of residential building;
TA2 Target energy performances of building;
TA3 Building occupants’ behaviours and energy usage;
TA4 Home appliances;
TA5 Industry capacity;
TA6 Percentage RE from residential building;
TA7 Cost efficiency of LCB;
TA8 Research and development (R&D).
Action ACT1 New buildings designed to a target performance;
ACT2 Existing buildings have to be refurbished
ACT3 Increase awareness of public
ACT4 Create sustainable industry
ACT5 Setting up of appropriate training schemes
ACT7 Create labelling system for home appliances
ACT8 Implement building energy scheme
ACT9 Create green building code, energy efficiency building guide
ACT10 Introduce renewable market, lows and provide support
ACT11 Provide progress assessment and provide required update
ACT12 Support research programmes
Achievements At the end of the period the country will have reduced energy consumption of
residential buildings, established a low carbon society and industry, created a
legislation framework and provided a suitable environment for future further energy
reduction.
Table 8.9: Elements of roadmap for LCB transformation
210
8.8.1 Vision
Oman is vulnerable in terms of energy supply security compared with other GCC countries due
to limited conventional energy sources. The proven production life of oil in Oman is between
16 and 32 years (Almulla, 2014). This requires the country to establish a goal to reduce the
energy consumption of the residential buildings sector, the major energy consumer. Since
achieving a paradigm shift in the building sector requires time, vision to achieve this goal has
to be set within the time period of oil production life. Thus, the transforming period is suggested
to be between 2030 and 2040; year 2030 (V2030) is selected as the target for a transformation
period. The selection of target reduction has originated from the possibility of reducing current
energy consumption by 3.7% to 18.2% without considerable additional cost, which has been
proven in chapter six. Hence, the suggested value is less than average possible reduction value,
therefore, it will be an achievable target. In line with V2030, strategic planning and targets are
required to drive the residential building industry to turn to the energy efficiency business. This
planning is required to ensure that the residential buildings sector and other built environment
systems and stakeholders, over the maintained period of time, are in the right direction through
the creation of the required organization and for governmental bodies to set up the required
actions and follow up the progress.
8.8.2 Target Areas
The target area for this roadmap plan refers to the actors and stockholders of residential
buildings and their role in order to achieve the main vision. Therefore, all residential buildings’
stockholders are involved to participate according to their duties and responsibilities. The
government is the main actor; hence it will be the main target that will be responsible for
providing the required legislation framework and follow-up application and to encourage other
parties to achieve their duties. Further, the government will be required to provide financial
support for research programmes, initial subsidies on low carbon technologies and a training
scheme on the application of new legislations.
211
8.8.3 Action
An energy policy roadmap cannot be represented by a single action or law. The policy consists
of laws, regulations, and programmes, but their directions are under the influence of the
strategic plan provided by government. The main actions required as per table 8.9 are:
Discontinue construction of residential building by the current method, and include
energy efficiency standards. Since the country has not yet devised such standards, it
will be ideal to adopt standards from neighbouring countries, i.e., GCC or MENA
countries. Furthermore:-
o Create standards for green building;
o Establish laws and regulations for renewable energy use;
Create a framework to refurbish existing buildings in order to meet the requirement of
the suggested standard;
Increase public awareness by encouraging people to participate in events and
programmes like Earth Day. Increase the energy efficiency culture by providing data
on energy efficiency and CO2 emissions on home products and make people responsible
for energy efficiency in their own properties;
Establishing appropriate continuous training schemes for industrial parties. All parties
of the construction process are continuously provided with certified education and
training schemes in order to meet the required specialised level for an energy-efficient
buildings industry;
Create or import an internationally recognized home appliances energy labelling
system. The energy efficiency certificates must be displayed on all imported or locally
manufactured home appliances. Further, other home equipment and service devices
should be rated according to a suitable scheme. Also, inefficient lighting should not be
used or accepted for the trade in the country;
Establish research centres and potential collaborative work with international agencies.
212
Chapter summary
This chapter suggested a roadmap on how to implement best practice low carbon residential
buildings in Oman based on the examined EEMs. Before that, it examined the visibility of
implementing insulation and adoption of a PV system in Omani residential buildings based on
the current electricity tariff, and then investigated the optimal electricity price which could lead
to the adoption of these EEMs. Next, it identified the vision, and action required, and suggested
an implementation pathway for the suggested roadmap. The research advocated a transition
period up to 2030 to reduce energy consumption of residential buildings from conventional
energy sources by 25% to 50% based on its current level. The action required to achieve this
reduction comprises forming a legislation framework for efficient buildings, encouraging
society and industry to adopt transformation to a low carbon environment and providing
required funds and support.
213
Discussion
Introduction
This research aimed to investigate domestic building energy performance in order to devise a
suitable reduction strategy. The context of the Sultanate of Oman was selected as a case study,
being one of the top 20 countries in CO2 emission per capita (List of countries by carbon
dioxide emissions per capita, 2017). This work has demonstrated the use of experimentally
validated evaluation of domestic building energy consumption using both quantitative
monitored data and qualitative data obtained from the design and construction team, utility
company, occupants and building users. This enabled a more holistic analysis of factors and
systems that have contributed to the minimal adoption of residential LCB in Oman, and
subsequently the high energy consumption in this sector.
Consequently, this chapter explores the strengths and weaknesses of the application of the
findings of this research in the context of Oman. It discusses lessons learnt from the studied
buildings in relation to their limitations and design, and the economic, social and environmental
aspects that must be considered when evaluating domestic building energy consumption.
The research was subjected to limitations regarding time, data collection and cost of
technologies and materials used in the reference LCBs. However, despite these limitations the
study has addressed the main hypothesis and embraced the potential opportunities for low
carbon building solutions if the building stakeholders considered the issues of design and size,
deployment of building elements, daylight and shading, cooling strategies, construction
practice, home appliances, landscape, occupants’ lifestyle and social impacts. Finally, this
chapter illustrates the potential CO2 reduction from residential buildings in Oman when using
R-BEET and also the interdependencies of the main parameters that control energy usage in
the residential buildings sector.
Limitations
Although the research has covered its goal to devise a possible LCB strategy for Oman, the
first of its kind in the country, there were some limitations. One of the limitations of this work
was the sample size of the case study buildings. This was due to the limited time, logistic
support and cost associated with an increasing number of sample buildings. A larger sample in
214
research terms tends to increase the certainty of its results and reduce the potential for errors.
However, the results obtained illustrate confidence of acceptance based on the analysis
undertaken in the previous chapters.
Another important limitation of this study was the limited availability of data and references
for the case study country. This is because it is the first time the country has been subject to
such a study so most data was collected from primary sources.
The real cost of materials and technologies used in LCBs was difficult to obtain as some of
these materials were not available in the local market or were donated by local and international
companies. The research adopted cost evaluation by local contractors for whom such materials
were new.
Despite the energy performance achieved by the reference LCBs, the study did not examine
the ethical impact of this type of building on society or preferences regarding design, materials
and even the shape; for example, LCB2 is cylindrical in shape which is not usual for residential
buildings in Oman.
The estimation of conventional buildings’ energy use was conservative for many reasons. For
example, it did not address opportunities for reductions in miscellaneous electric loads that
contribute to building energy consumption. It was not possible to collect directly measured
readings for home tasks’ energy consumption due to social factors; therefore an energy audit
and estimation were adopted, that gave trusted results, as shown in chapters four and five, but
are still conservative.
Moreover, the analysis did not place a value on the increased amenities associated with an
energy efficiency measure, or on the ability of these measures to provide valuable services to
utility companies. It was also highly likely that currently unknown innovations would lead to
further cost reductions and performance improvements.
The energy template, Residential Building Energy Efficiency Template (R-BEET), was
designed for residential buildings only, however, its concept can be extended to create different
versions to cover other types of building, such as a Commercial Building Energy Efficiency
Template (C-BEET), etc.
Finally, although the energy template created in this research showed its capability to be used
for evaluating residential building based on the selected reference buildings from Muscat, it
215
was not validated for a larger number of buildings or for sample buildings from outside Muscat.
Furthermore, it was limited to the social, economic and environmental norms of Oman. Thus,
its application in different regions would require modifications, the main one being the weather
file used, that is currently limited to Muscat only. Therefore, if it is approved for use in the
whole of Oman, other main cities’ weather files will need to be uploaded. Also, the template
did not include a heating load because Muscat has no heating degree days.
Low carbon houses opportunities
According to the concept of sustainability, natural resources should be used in a way to secure
them for future generations. The majority of decisions in the building design process are taken
at the early design stage. This means that buildings should be designed and operated during
their life cycle in a manner of less consumed energy. The design phase presents the greatest
opportunity to obtain high-performance buildings, but pertinent performance information is
needed for designers to be able to tackle multidisciplinary and contrasting objectives. This
opportunity can be provided by considering the use of R-BEET as an energy tool calculator for
selecting the optimal design.
In addition, it is recommended to use low-energy rated home appliances to ensure maximum
conservation of energy in the building. In this regard, R-BEET will be beneficial as a building
energy management tool to predict energy usage for different home tasks, zones and times, etc.
9.3.1 Design
One of the most effective strategies for reducing domestic energy consumption is to optimally
design the building envelope to reduce heat gain, that leads to excessive energy consumption
for cooling. A high-performance dwelling envelope can increase the occupants’ comfort and
well-being while reducing energy requirements for cooling and lighting. It has been proven in
this thesis that the building envelope is a major factor in determining the amount of energy
needed for cooling and lighting. Designing a dwelling with non-integrated EEMs clearly leads
to negative results.
216
9.3.2 Optimum orientation
It was noted that the current Omani dwellings omitted the proper orientation of the building in
the absence of architectural design criteria and building codes. The findings of this research
therefore indicated the need for a major update of the construction standards and building codes
and their enforcement in the construction industry in Oman. These codes are required to
observe the basic issues of optimal orientation for energy performance in dwellings. In the
extremely hot climate of Oman the northern orientation of windows typically results in cooler
indoor conditions due to minimisation of incident solar radiation. The majority of conventional
buildings included in this study appear to be badly oriented or designed without attention to
wind direction, solar radiation or other environmental conditions.
It was evident from the results of the investigated dwellings in this study that the orientation of
the building was one of the factors affecting the dwelling’s energy consumption. Research
demonstrated that the orientation of a building could increase its energy consumption by about
5%. Therefore, appropriate orientation of buildings for improved energy performance is a
costless energy reduction measure.
9.3.3 Glazing ratio, size and orientation
Glazing size and orientation are considered to be key issues when considering building energy
consumption in most climatic impacted orientation of the building. Traditionally, in hot
weather countries, area of windows are limited and small in size in order to reduce the impact
of the external climate on indoor spaces and reduce glare. However, most contemporary
dwellings in Oman appear to be designed with large single glazed windows without any
attention given to heat gain from them. Fenestration should be carefully integrated into building
facades considering the amount of heat they will allow to enter into the internal spaces of
dwellings. In the geographical location of Oman, it is recommended to provide maximum
openings along the northern façade and avoid or reduce openings on the eastern and western
façades. This concept allows maximum daylight and minimum heat gain from windows. It
appears, to some extent, in this study that the designers of the studied CBs have not carefully
considered sizes and location of windows. It has been found, in some cases, that windows were
placed in every possible facade of the building. Moreover, the type of windows is a major factor
in energy consumption of buildings. Indeed, multilayer glazing with low emissivity can lead to
further reduction in energy consumption.
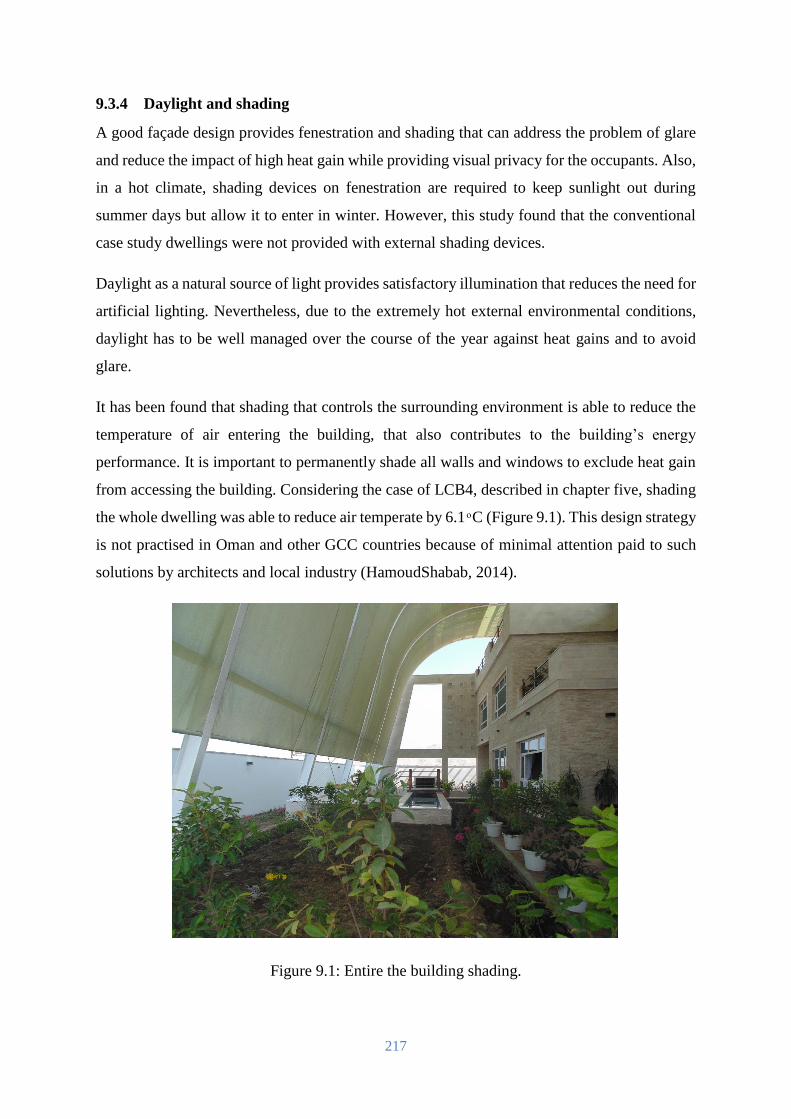
217
9.3.4 Daylight and shading
A good façade design provides fenestration and shading that can address the problem of glare
and reduce the impact of high heat gain while providing visual privacy for the occupants. Also,
in a hot climate, shading devices on fenestration are required to keep sunlight out during
summer days but allow it to enter in winter. However, this study found that the conventional
case study dwellings were not provided with external shading devices.
Daylight as a natural source of light provides satisfactory illumination that reduces the need for
artificial lighting. Nevertheless, due to the extremely hot external environmental conditions,
daylight has to be well managed over the course of the year against heat gains and to avoid
glare.
It has been found that shading that controls the surrounding environment is able to reduce the
temperature of air entering the building, that also contributes to the building’s energy
performance. It is important to permanently shade all walls and windows to exclude heat gain
from accessing the building. Considering the case of LCB4, described in chapter five, shading
the whole dwelling was able to reduce air temperate by 6.1 C (Figure 9.1). This design strategy
is not practised in Oman and other GCC countries because of minimal attention paid to such
solutions by architects and local industry (HamoudShabab, 2014).
Figure 9.1: Entire the building shading.
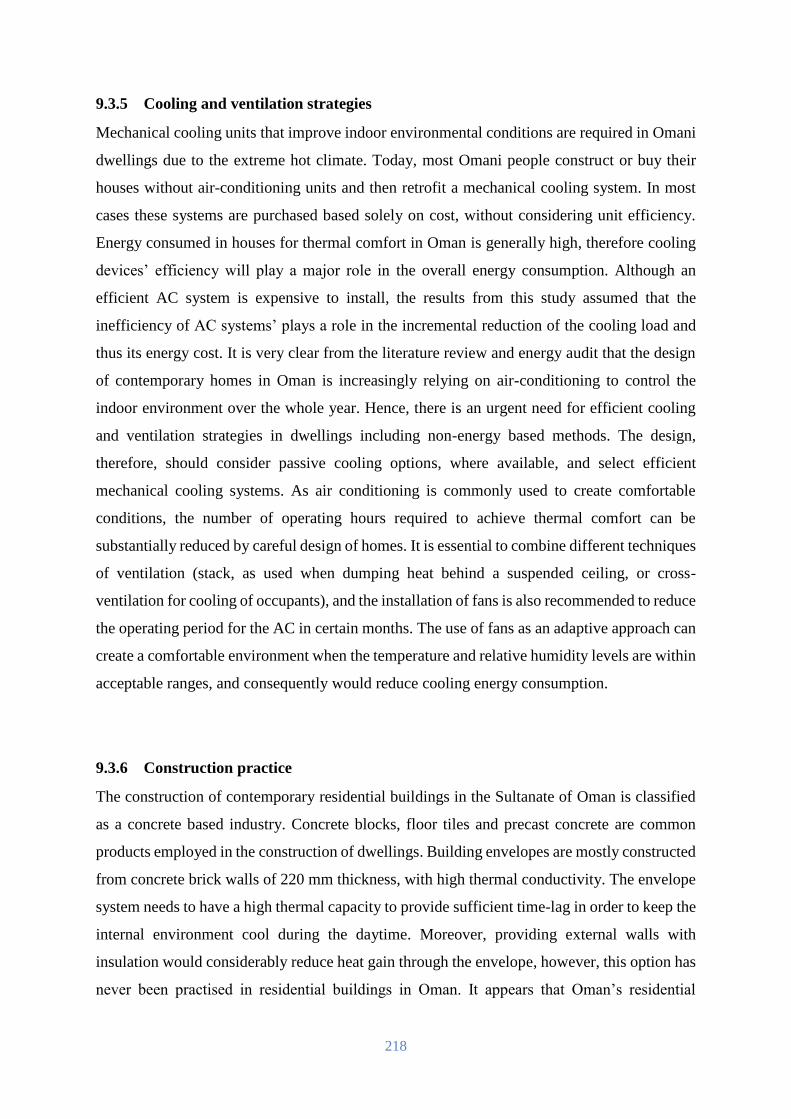
218
9.3.5 Cooling and ventilation strategies
Mechanical cooling units that improve indoor environmental conditions are required in Omani
dwellings due to the extreme hot climate. Today, most Omani people construct or buy their
houses without air-conditioning units and then retrofit a mechanical cooling system. In most
cases these systems are purchased based solely on cost, without considering unit efficiency.
Energy consumed in houses for thermal comfort in Oman is generally high, therefore cooling
devices’ efficiency will play a major role in the overall energy consumption. Although an
efficient AC system is expensive to install, the results from this study assumed that the
inefficiency of AC systems’ plays a role in the incremental reduction of the cooling load and
thus its energy cost. It is very clear from the literature review and energy audit that the design
of contemporary homes in Oman is increasingly relying on air-conditioning to control the
indoor environment over the whole year. Hence, there is an urgent need for efficient cooling
and ventilation strategies in dwellings including non-energy based methods. The design,
therefore, should consider passive cooling options, where available, and select efficient
mechanical cooling systems. As air conditioning is commonly used to create comfortable
conditions, the number of operating hours required to achieve thermal comfort can be
substantially reduced by careful design of homes. It is essential to combine different techniques
of ventilation (stack, as used when dumping heat behind a suspended ceiling, or cross-
ventilation for cooling of occupants), and the installation of fans is also recommended to reduce
the operating period for the AC in certain months. The use of fans as an adaptive approach can
create a comfortable environment when the temperature and relative humidity levels are within
acceptable ranges, and consequently would reduce cooling energy consumption.
9.3.6 Construction practice
The construction of contemporary residential buildings in the Sultanate of Oman is classified
as a concrete based industry. Concrete blocks, floor tiles and precast concrete are common
products employed in the construction of dwellings. Building envelopes are mostly constructed
from concrete brick walls of 220 mm thickness, with high thermal conductivity. The envelope
system needs to have a high thermal capacity to provide sufficient time-lag in order to keep the
internal environment cool during the daytime. Moreover, providing external walls with
insulation would considerably reduce heat gain through the envelope, however, this option has
never been practised in residential buildings in Oman. It appears that Oman’s residential
219
buildings have a poor thermal resistance envelope that increases heat transfer across walls
leading to poor energy performance of dwellings. All CBs reviewed in this study were found
to have an external wall thickness of less than 250 mm, whereas all LCBs have an external wall
thickness of 350 to 600 mm, including insulation. Furthermore, all interviewed contractors
revealed they had not constructed any residential buildings that included additional thermal
insulation (AlBalushi, 2015). Insulating buildings is essential in extremely hot conditions to
exclude the harshness of that climate from the internal environment of the house. However, in
a hot climate with high humidity the insulation material could be damaged by condensation,
that increases the potential of excess dust mite populations and the concentrations of mould
spores. Therefore, it is recommended to choose materials that resist damage from condensation.
Furthermore, it is argued that walls with high thermal mass can store coolness, and potentially
have less problems from dew-point than lightweight insulated walls (Ruivo, Ferreira and Vaz,
2013).
9.3.7 Home appliances
As mentioned in the previous chapters, energy efficiency is not a top priority for Omani’s when
buying appliances, where little attention is paid to energy labelling. It is recommended for low-
energy homes to choose highly energy efficient appliances or upgrade the system when it
reaches the end of its life span. New home appliances offer better energy savings compared to
old technology, such as TVs.
In addition to appliance efficiency, another aspect worth further consideration is that the
standby consumption of certain types of domestic appliance is becoming an increasing problem
with the escalation of their density in homes. These are items that occupants do not tend to
think to turn off, but gradually their numbers in homes accrue and consume a great amount of
electricity over the year. Now there are several solutions to reduce standby electricity
consumption, such as standby savers that turn off appliances from standby status.
220
9.3.8 Landscaping and building envelope shading devices
The discussion in the earlier section of this chapter suggests it is important to consider the
shading of the whole building to manage solar access. Furthermore, it is important to lower the
ground temperature surrounding the house to reduce the local air temperature, and therefore it
is recommended to increase vegetation and plants around the dwelling (Figure 9.2). It is well
known in geographical locations such as Oman that the highest rate of heat gain passes through
the roof so shading the whole building or use of a green roof could substantially reduce the
overall heat gain of the building’s envelope. It is evident that all five LCBs have some sort of
shading on the roof or on the walls. The commonly used shading strategy on the roof was
placing PV system panels on the roof to provide some sort of shading. Therefore, it is important
to spread the experience of these SOTA examples in order to encourage the local market in
creating optimum solutions.
Figure 9.2: Shading by surrounding trees and vegetation on walls (LCB5)
221
9.3.9 Occupant lifestyle
The energy consumption of a building is the result of its occupancy, therefore the occupants’
lifestyle affects their energy requirements at home. This makes occupancy behaviour one of
the most significant drivers of the dwelling’s energy efficiency and performance. Recently,
several studies have confirmed the impact of the users’ behaviour on a building’s energy
consumption and conservation (Yu et al., 2011). Therefore, along with the good design of a
dwelling, the occupants’ lifestyle should also correspond for an ideal high-performance
dwelling.
Education on how to manage building energy is essential to reduce overall energy consumption
of buildings with low thermal performance. Further, providing the occupants with a home
manual on how to use the building efficiently, and data sheets on all types of home appliances
installed or expected to be installed will assist users regarding energy conservation at home.
9.3.10 Social impact
The actual impact of a building’s energy depends on how it is used by the occupants, the quality
of home goods and many other human-related factors. Therefore, a building must be designed
for the possible understanding of users’ needs and their ability to interact with its technologies
for better energy performance. Human decision and associated social and behavioural aspects
impact either positively or negatively on a building’s energy. For example, energy subsidies,
whereby efficiency investments lower the cost of energy services, encourage wasteful
behaviour. The removal of such subsidies would contribute to equipment and interface designs
and forecasting. How we use energy determines the amount of CO2 emissions to the
environment; hence, to control this problem and ensure a conducive outcome we should
mitigate the low-carbon strategies.
Template application
Currently, tools and energy calculators for evaluation impact of energy consumption of
buildings on the environment are highly required. R-BEET is designed for Oman, and opens
opportunities to predict and evaluate residential building energy consumption using a simple
and low-cost method. This makes it possible to evaluate significant samples of different
222
building design concepts for implementing a low carbon strategy. The adoption of a LCB
strategy in Oman faces significant constraints including predicting the potential benefits;
hence, R-BEET could work as an applicable assessment and analytical tool to support an
energy saving option, and subsequently potential social, economic and environmental benefits
of its application.
9.4.1 Economic impact of integrating LCB practice in Oman
The results of the current study demonstrate it is possible to determine minor energy efficiency
improvements without a need for direct increase of construction cost. These improvements
come from design consideration and energy management. For example, orientation and using
shading devices could achieve such reduction. According to results from parametric modelling,
proper orientation of building could reduce its energy consumption by up to 5% and a green
roof and water pond surrounding a house can reduce ambient temperature by 6.1 C. These
reductions will have a positive impact on the energy cost over the life cycle of a building. For
example, considering the 5% annual energy consumption reduction, if the average Omani
house energy usage is 24757 kWh/year (from chapter three), this reduction will equal 1238
kWh/year, which equates to 18.57 OR (£37.14) per year based on current subsided energy. If
the 67% subsidies are removed from electricity prices, and considering the current international
price of fuel used to generate electricity, then this value in 50 years, the life cycle of building,
will equate to 5,018.92 OR (£10,037.84).
However, for further energy savings and reduced use of conventional energy sources,
additional strategies will be required. These strategies involve considering high-performance
materials, additional thermal insulation, high performance glazing, more efficient domestic
appliances and adopting RE sources. These solutions are considered financially non-viable
options based on the current energy cost and ability of local industries. Therefore, a grant rate,
in the form of energy efficiency subsidies, may be needed as a strategy to encourage building
owners and industry to apply these solutions. The energy efficiency subsidies should only apply
to buildings that fulfil the prescribed minimum energy efficiency level ‒ for instance, based on
the energy rating scheme described in chapter eight. In order to motivate further integrated
energy retrofits, the level of grant support should be differentiated to encourage deep, low-
energy retrofits, particularly those that reach the energy efficiency level similar to SOTA LCBs.
223
The use of R-BEET would be valuable here to evaluate energy consumption scenarios to
determine percentage reduction. This action is reasonable to ensure that the best possible
energy efficiency level is installed and practised. This could be applied to any building, not
only for new dwellings, but also it can be extended to existing buildings. The analysis from
chapter eight shows that for an integrated energy efficiency policy, the target efficiency should
be identified in order to provide the required support. Furthermore, on-site renewable energy
production can be added to this scheme for an improved energy efficiency target.
9.4.2 Environmental impact
Global warming and climate change are the recognized global environmental crises that will
have tremendous impacts on human existence on the earth. These issues result from emissions
of GHG generated from industrial activities and anthropogenic activities including use of
energy in residential buildings. Therefore, a low-energy performance building is a beneficial
solution to the environment. Improved building systems and improved building envelopes
reduce the need for mechanical cooling and heating equipment; thus it suffices to say that
buildings with dramatically reduced energy use are in most cases more advantageous to our
environment than conventional designs.
A high-performance envelope reduces the cooling and heating loads that must be satisfied by
the mechanical system and also permits alternative systems that are characterized by low-
energy use to meeting the reduced loads. The use of R-BEET to design and evaluate low-carbon
building has the potential to result in more energy efficient buildings, that will also lead to
greater environmental benefits. In addition, carbon mitigation strategies have co-benefits for
development such as the development of the renewable energy industry and reduced use of
conventional energy sources. The cost mitigating low-carbon strategies is low because
consumers can save what they could have spent on conventional fossil-fuel based energy.
9.4.3 Carbon footprint reduction
With increasing concerns about global warming and climate change, it is imperative for world
governments to impose effective policy instruments to promote energy saving and reduce
carbon emissions. Johansson (2006) theoretically evaluated the policy instruments used to
contribute to the reduction of CO2 emissions while preserving the competitiveness of the
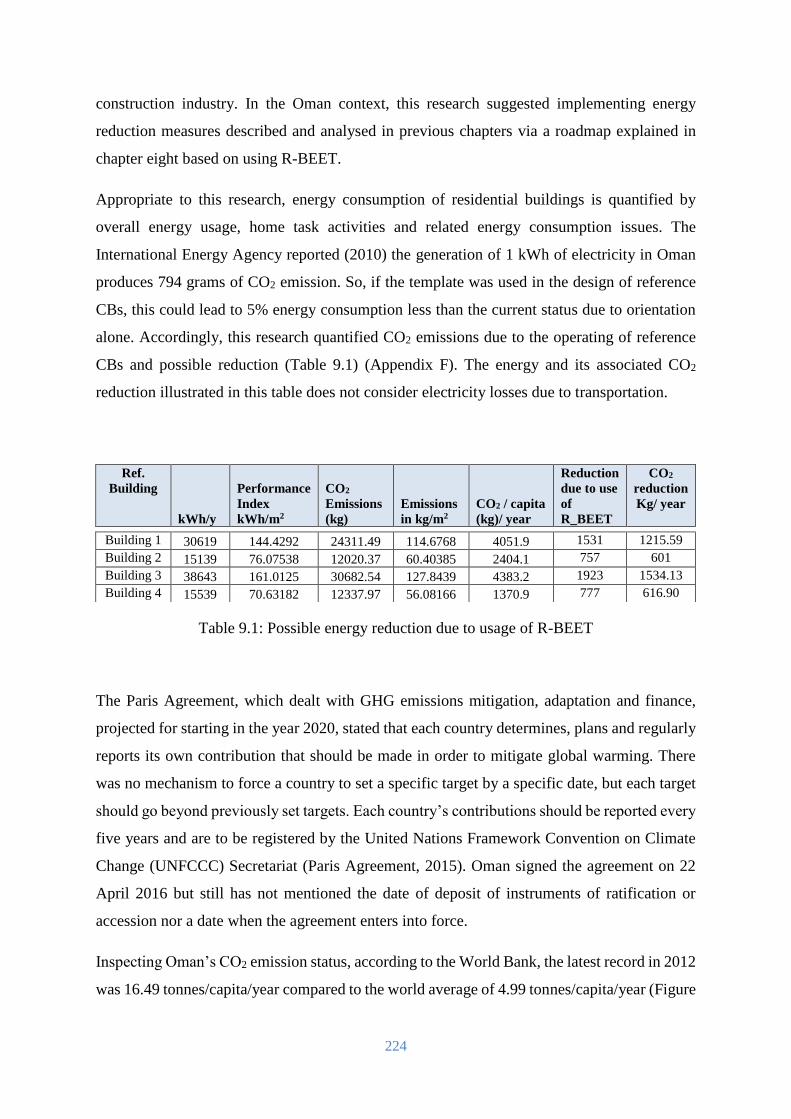
224
construction industry. In the Oman context, this research suggested implementing energy
reduction measures described and analysed in previous chapters via a roadmap explained in
chapter eight based on using R-BEET.
Appropriate to this research, energy consumption of residential buildings is quantified by
overall energy usage, home task activities and related energy consumption issues. The
International Energy Agency reported (2010) the generation of 1 kWh of electricity in Oman
produces 794 grams of CO2 emission. So, if the template was used in the design of reference
CBs, this could lead to 5% energy consumption less than the current status due to orientation
alone. Accordingly, this research quantified CO2 emissions due to the operating of reference
CBs and possible reduction (Table 9.1) (Appendix F). The energy and its associated CO2
reduction illustrated in this table does not consider electricity losses due to transportation.
Table 9.1: Possible energy reduction due to usage of R-BEET
The Paris Agreement, which dealt with GHG emissions mitigation, adaptation and finance,
projected for starting in the year 2020, stated that each country determines, plans and regularly
reports its own contribution that should be made in order to mitigate global warming. There
was no mechanism to force a country to set a specific target by a specific date, but each target
should go beyond previously set targets. Each country’s contributions should be reported every
five years and are to be registered by the United Nations Framework Convention on Climate
Change (UNFCCC) Secretariat (Paris Agreement, 2015). Oman signed the agreement on 22
April 2016 but still has not mentioned the date of deposit of instruments of ratification or
accession nor a date when the agreement enters into force.
Inspecting Oman’s CO2 emission status, according to the World Bank, the latest record in 2012
was 16.49 tonnes/capita/year compared to the world average of 4.99 tonnes/capita/year (Figure
Ref.
Building
kWh/y
Performance
Index
kWh/m2
CO2
Emissions
(kg)
Emissions
in kg/m2
CO2 / capita
(kg)/ year
Reduction
due to use
of
R_BEET
CO2
reduction
Kg/ year
Building 1 30619 144.4292 24311.49 114.6768 4051.9 1531 1215.59
Building 2 15139 76.07538 12020.37 60.40385 2404.1 757 601
Building 3 38643 161.0125 30682.54 127.8439 4383.2 1923 1534.13
Building 4 15539 70.63182 12337.97 56.08166 1370.9 777 616.90
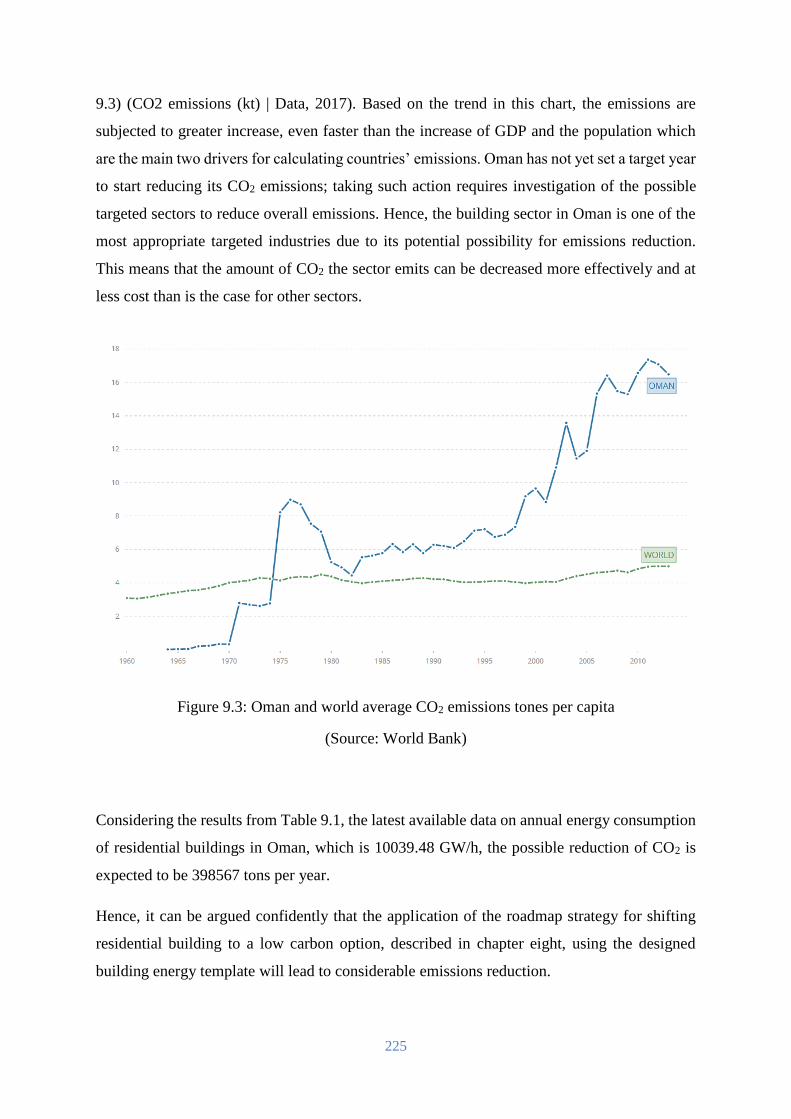
225
9.3) (CO2 emissions (kt) | Data, 2017). Based on the trend in this chart, the emissions are
subjected to greater increase, even faster than the increase of GDP and the population which
are the main two drivers for calculating countries’ emissions. Oman has not yet set a target year
to start reducing its CO2 emissions; taking such action requires investigation of the possible
targeted sectors to reduce overall emissions. Hence, the building sector in Oman is one of the
most appropriate targeted industries due to its potential possibility for emissions reduction.
This means that the amount of CO2 the sector emits can be decreased more effectively and at
less cost than is the case for other sectors.
Figure 9.3: Oman and world average CO2 emissions tones per capita
(Source: World Bank)
Considering the results from Table 9.1, the latest available data on annual energy consumption
of residential buildings in Oman, which is 10039.48 GW/h, the possible reduction of CO2 is
expected to be 398567 tons per year.
Hence, it can be argued confidently that the application of the roadmap strategy for shifting
residential building to a low carbon option, described in chapter eight, using the designed
building energy template will lead to considerable emissions reduction.
226
Interdependencies
The design guideline framework, described in chapter seven, seeks to evaluate some of the
lifecycle EEMs identified in this research. Nevertheless, it omits evaluating performance risk;
hence, this discussion attempts to describe the factors that could be incorporated within this
framework to increase understanding of performance risk, which will lead to more realistic
expectations. The present research has shown that the potential reduction of the energy
consumption of residential buildings by adopting LCB strategies, which have been employed
in the SOTA, is enormous. The results of this study are beneficial to different groups and parties
that are related to the building industry in general and residential building in particular.
However, building energy consumption is related to several interdependent factors. These
include all building stakeholders and the surrounding environmental conditions. Yet, none of
them is capable of optimizing the efficiency of different energy strategies in an ideal scenario
without considering the effects of other factors. The main factors included in this discussion
are related to design and operation, cost, environmental and social constraints.
The collected data contained a great deal of variability, as shown in the analysis of energy
consumption, and illustrated a clear view of the building’s operating patterns. Further, this
variability indicated the existence of the difference between the theoretical design models of
buildings and the practical reality of buildings in operation. Therefore, the design and in-use
operation of buildings are interrelated.
If the construction industry were to move towards the adoption of prescribed energy targets for
dwellings there would be a strong dependency for the building sector on performance
predictions. There are, however, significant factors affecting energy efficient application that
are difficult to predict related to future energy cost and occupant lifestyle as well as government
plans and intentions. Current designers and building operators alike may be unaware of the
expected future changes of consumption and operating patterns. In this regard, probabilistic
predictions that produce a likely range of energy consumption data may be helpful to evaluate
the impact of such changes.
The climatic conditions and future projected scenarios will have a great impact on the building
design and its operational energy. This, as previously mentioned in several sections of this
research, will require the current designed and constructed buildings to be able to serve their
function in the future. The issue of future-proofing buildings has an impact on the current
227
construction methodology and its associated costs. Moreover, it will influence living styles and
building operation, which tends to impact on occupants’ social life.
Finally, the social factor is the main factor in building energy consumption, as the consumed
energy reflects occupants’ life style, income and behaviour, etc. Nevertheless, the ability of the
construction industry alongside environmental conditions and the other factors discussed here
are interdependent on the social and other factors. For example, the industry’s willingness to
adopt a certain building designs is subject to the acceptance of society for this type of building,
while the willingness of people to adjust their life style to suit a certain building design depends
on cost of the building and its operation.
Chapter Summary
In conclusion, this chapter has discussed the research outcome and summarised its limitation
and the impact of the application of its outcome. The research has successfully covered the
topic of adopting LCB strategies for the case of the Sultanate of Oman. However, it was
subjected to limitations due to time, data collected, and acceptance of the designed building.
Despite these limitations, the results from this research are acceptable as it has covered the
main hypothesis. In addition, the discussions revealed that the opportunities for low carbon
building are possible if the building stakeholders considered this issue in the design of building
and size, allocation of building elements, daylight and shading, cooling strategies, construction
practice, home appliances, landscape, occupants’ lifestyle and social impacts. Moreover, it has
illustrated the possibility of CO2 reduction from residential building in Oman using R-BEET.
Finally, it discussed the interdependency of the main factors of the residential sector where it
has been found they are strongly interdependent on each other.
228
Conclusion
Introduction
This thesis sought to explore the suitable passive and renewable low carbon strategies for
residential building in the hot, humid climates considering the Oman environment as a case
study country. Driven by the shortage of experimental validated studies in the Gulf, this mixed
method assessment study was dedicated to the investigation of available SOTA LCBs in Oman
in order to examine the applications of EEMs in the context of the case study country.
The conclusions that follow provide an outline of the most significant contributions to the topic:
“PASSIVE AND RENEWABLE LOW CARBON STRATEGIES FOR RESIDENTIAL
BUILDINGS IN HOT HUMID CLIMATES”. It summarises the key outcomes of the research
in relation to the objectives outlined in chapter one, discusses their significant contributions to
the body of knowledge, the limitations of the research undertaken, and, identifies areas for
further investigation.
In conclusion, this research established that a significant reduction (up to 58%) in total energy
consumption of residential buildings could be achieved by adopting passive and renewable
strategies. In addition, efficient energy reduction could be expected when implementing energy
efficiency measures using the energy template R-BEET. Such reductions of total energy
consumption of residential building could also be achieved without adding to the initial
building cost. Moreover, implementing EEMs could lead to further reduction of energy usage.
However, the absence of a national plan for implementing an energy conservation strategy
leads to less adoption of these measures. Furthermore, it has been found that the current
construction regulations, practice and materials do not support the energy conservation of
buildings. Moreover, the local society is not contributing to the issue of energy conservation in
buildings. Hence, the findings of this thesis recommend the development of a policy for passive
and renewable energy strategies for residential building including energy regulations for
buildings.
229
Research Outcomes
The main research outcome is that this study has successfully achieved its aims and objectives.
This study validated the viability of adopting low carbon building in domestic buildings in
Oman. The study has suggested reducing the energy consumption of residential building by
implementing passive and renewable strategies in order to solve the problem of excessive fossil
fuel consumption in Oman. Thus, the applicability of this proposal was examined in the
environment of Oman as a pathway to shift the residential building sector towards low carbon
building alternatives.
10.2.1 Objectives fulfilled
The research objectives have been fulfilled as follows:
I. Review the regulatory and energy context of state of the art (SOTA) practice of
low carbon domestic building and construction in Oman: The status of low carbon
building has been reviewed in chapter two at four levels; international level, MENA
region level, GCC countries level and Oman. It was found that Oman falls behind in
the current construction practice of low energy domestic buildings. This been caused
by obstacles and challenges facing the development of sustainable housing in Oman.
The housing sector in Oman has transformed from a traditional local society into new
and advanced housing units, prompted by the use of modern architectural construction
methods and design without considering the subsequent energy performance of these
buildings in the hot humid environment of Oman. This has resulted from the absence
of strategy and codes for low carbon building, leading to less adoption of low carbon
buildings. The chapter concluded that the country should establish passive and
renewable energy strategies to overcome this situation. Furthermore, a clear research
methodology was required to investigate the possible strategies.
II. Establish research methodology suitable for the research topic: The study
addressed the world-view of the research, and methodologies adopted in this field of
the research. The mixed method research approach from both qualitative and
quantitative aspects was used, and the selected research methods provided suitable
procedures for achieving each objective, alongside a detailed approach to collect and
analyse data. The methodology adopted was based on the assumption that designing
strategies for low carbon residential buildings in the hot and humid climate of the
230
Sultanate of Oman is capable of bridging the gap that exists in the energy consumption
of residential buildings.
III. Determine the energy consumption profile and key elements of operational
deficiency that increase energy consumption of residential buildings in Oman: The
research determined domestic building annual energy profiles and identified the
significant causal factors resulting in performance discrepancies, and their origins in
the buildings’ life cycle. This research found that the factors leading to the non-adoption
of low-carbon buildings in the Sultanate of Oman were correlated to the culture of the
local society, the absence of any government intervention or support, the poor
construction ability of the local construction industry and marketing difficulties due to
higher initial costs, making the construction sector unwilling to consider this type of
construction.
IV. Determine building energy system boundaries, needs and requirements: The
research identified key building energy system elements and the main factors that
contributed to excessive energy consumption, and then estimated building energy needs
to inform energy performance targets. Furthermore, the key attributes of low carbon
buildings for a hot and humid climate were identified through pilot case study houses,
where the energy consumption for various home tasks were evaluated. In addition, the
research established a building energy system and the boundaries of residential
buildings for energy benchmarking, analysed the building energy sub-systems and
parameters controlling demands, reviewed the building energy reduction measures for
low carbon strategies, analysed the building energy profile for the energy diagnostic
and strategy application through a case study and, finally, summarised the key attributes
for low carbon building guideline design for a hot and humid climate.
V. Develop design guideline framework for LCB based on Energy Efficiency
Measures (EEMs) for a hot climate: The study examined Energy Efficiency Measures
(EEMs) used in SOTA LCBs in a hot, humid climate using a case study approach for
the whole building energy system to develop an energy efficiency guideline framework.
The analysis has shown potential energy consumption reduction in domestic building
of 67% based on the consideration of these measures. Consequently, the results
suggested that it was important to establish a residential building energy template
(energy calculator) to act as tool for developers, architects and civil engineers to design
low energy homes in Oman that meet local requirements and overcome environmental
challenges.
231
VI. Devise a LCB template to evaluate options of residential LCB in Oman
considering; Energy requirements, Building operation, Home appliances: A low
carbon building energy template was devised to evaluate different options of residential
building in Oman based on performance targets, usage profile and building
characteristics. The template generates an energy consumption report for the monthly
and annual consumption of a building based on user data input. The application of this
template shows its potential use as a building energy calculator or as a rating tool for
implementing energy strategy.
VII. Map a suitable LCB strategy for Oman using the criteria of the template: Based
on the benefits of the EEMs’ application a roadmap was devised for a strategy best
suited to Oman’s criteria and constraints. This strategy was designed based on
identification of the planned goal (vision) and required actions, and suggested an
implementation pathway for the suggested roadmap.
10.2.2 Contribution
Finally, based on the achievement of research objectives, this work has contributed to the body
of knowledge as follows:
I. Identified the current status of LCB construction, practice and regulation in Oman
compared to international level, MENA countries and GCC countries.
II. The identification of local domestic building energy profile: the research has
generated a more comprehensive description of the energy consumption profile,
thermal comfort and its relation with the energy consumed in dwellings, with an
exploration of the physical design of the home and occupants’ behaviour.
III. Created climate specific design criteria: a device design criteria framework for low
carbon building in a hot, humid climate based on validated EEMs.
IV. Benchmarking: benchmarked the energy consumption of residential buildings in the
selected case study country.
V. Devised a new predicting tool: a climate specific building energy template was
developed to evaluate residential building energy ‒ the Residential Building Energy
Efficiency Tool (R-BEET).
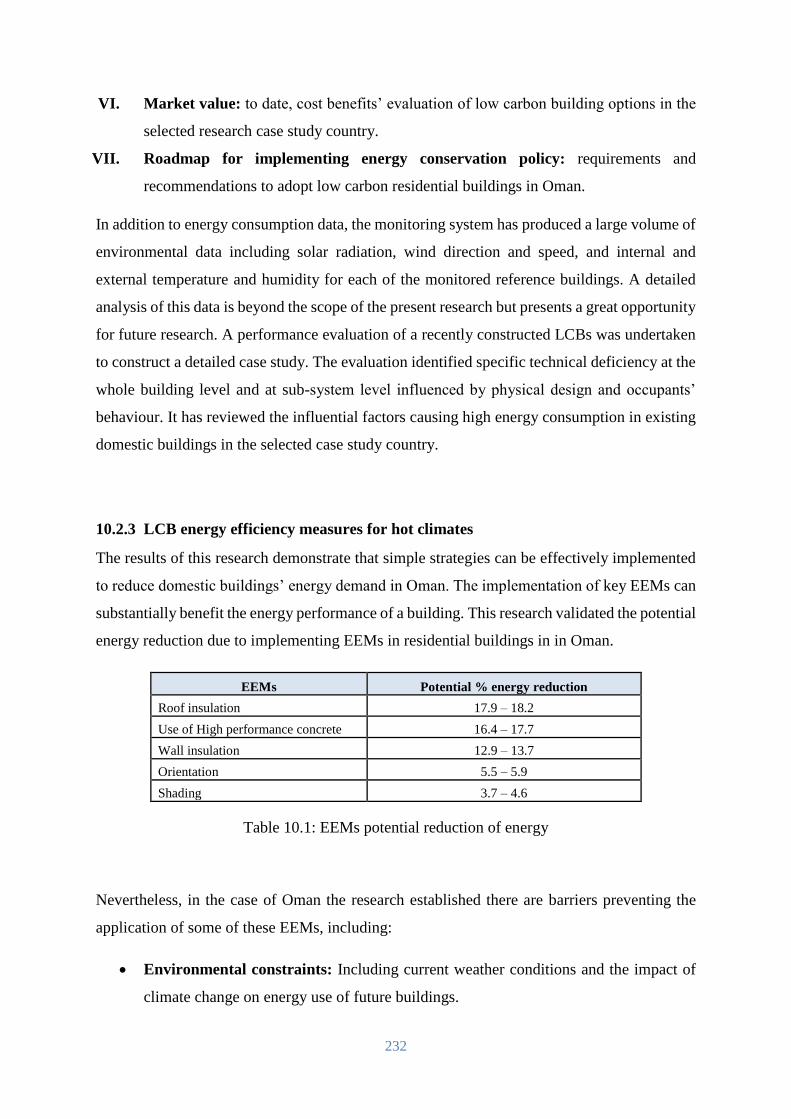
232
VI. Market value: to date, cost benefits’ evaluation of low carbon building options in the
selected research case study country.
VII. Roadmap for implementing energy conservation policy: requirements and
recommendations to adopt low carbon residential buildings in Oman.
In addition to energy consumption data, the monitoring system has produced a large volume of
environmental data including solar radiation, wind direction and speed, and internal and
external temperature and humidity for each of the monitored reference buildings. A detailed
analysis of this data is beyond the scope of the present research but presents a great opportunity
for future research. A performance evaluation of a recently constructed LCBs was undertaken
to construct a detailed case study. The evaluation identified specific technical deficiency at the
whole building level and at sub-system level influenced by physical design and occupants’
behaviour. It has reviewed the influential factors causing high energy consumption in existing
domestic buildings in the selected case study country.
10.2.3 LCB energy efficiency measures for hot climates
The results of this research demonstrate that simple strategies can be effectively implemented
to reduce domestic buildings’ energy demand in Oman. The implementation of key EEMs can
substantially benefit the energy performance of a building. This research validated the potential
energy reduction due to implementing EEMs in residential buildings in in Oman.
EEMs Potential % energy reduction
Roof insulation 17.9 – 18.2
Use of High performance concrete 16.4 – 17.7
Wall insulation 12.9 – 13.7
Orientation 5.5 – 5.9
Shading 3.7 – 4.6
Table 10.1: EEMs potential reduction of energy
Nevertheless, in the case of Oman the research established there are barriers preventing the
application of some of these EEMs, including:
Environmental constraints: Including current weather conditions and the impact of
climate change on energy use of future buildings.
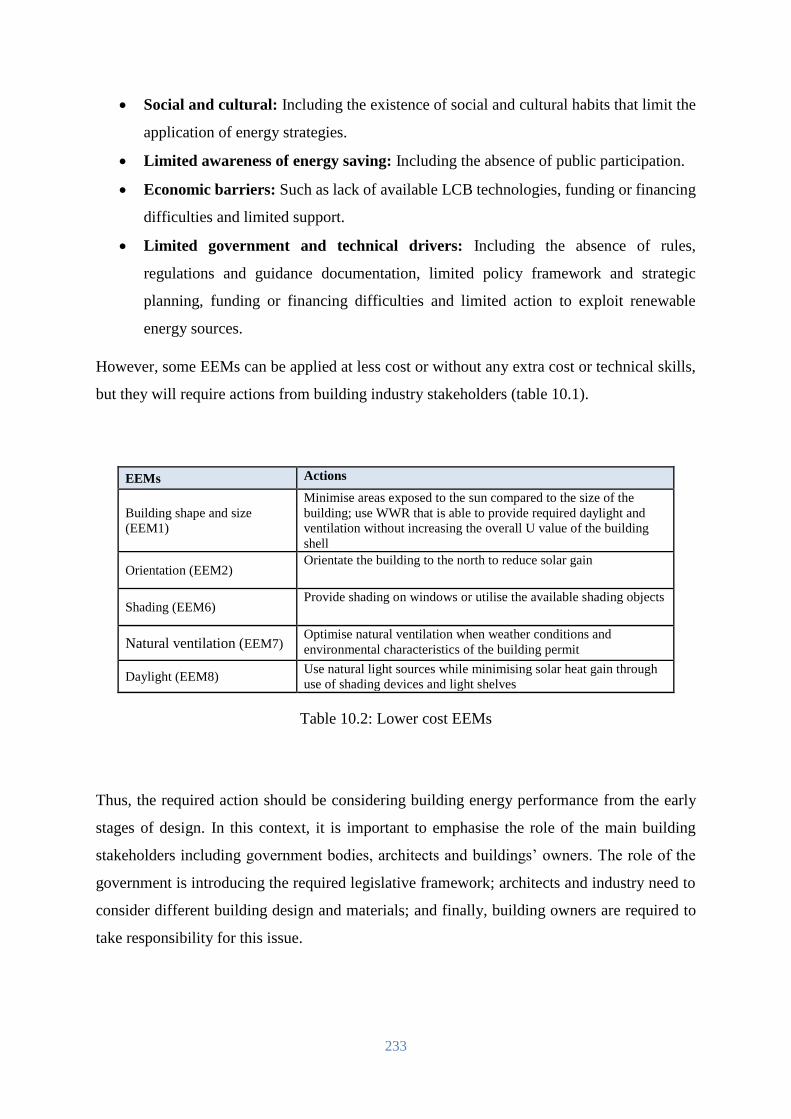
233
Social and cultural: Including the existence of social and cultural habits that limit the
application of energy strategies.
Limited awareness of energy saving: Including the absence of public participation.
Economic barriers: Such as lack of available LCB technologies, funding or financing
difficulties and limited support.
Limited government and technical drivers: Including the absence of rules,
regulations and guidance documentation, limited policy framework and strategic
planning, funding or financing difficulties and limited action to exploit renewable
energy sources.
However, some EEMs can be applied at less cost or without any extra cost or technical skills,
but they will require actions from building industry stakeholders (table 10.1).
EEMs Actions
Building shape and size
(EEM1)
Minimise areas exposed to the sun compared to the size of the
building; use WWR that is able to provide required daylight and
ventilation without increasing the overall U value of the building
shell
Orientation (EEM2) Orientate the building to the north to reduce solar gain
Shading (EEM6) Provide shading on windows or utilise the available shading objects
Natural ventilation (EEM7) Optimise natural ventilation when weather conditions and
environmental characteristics of the building permit
Daylight (EEM8) Use natural light sources while minimising solar heat gain through
use of shading devices and light shelves
Table 10.2: Lower cost EEMs
Thus, the required action should be considering building energy performance from the early
stages of design. In this context, it is important to emphasise the role of the main building
stakeholders including government bodies, architects and buildings’ owners. The role of the
government is introducing the required legislative framework; architects and industry need to
consider different building design and materials; and finally, building owners are required to
take responsibility for this issue.
234
These EEMs are not limited to Oman, they are common to any country located in hot, humid
climates. However, they are more applicable to the whole MENA region, especially the GCC
countries which share similar social and economic conditions with Oman.
Recommendations
The research offers a framework for the base design of domestic LCBs in the hot, humid
climates of the Gulf in general and in the Oman context in particular. On the basis of the
findings of this study, recommendations can be classified into three categories, for the different
groups of stakeholders involved: decision makers, architect and consultants, construction
market and contractors and owners. The recommendations are made to suit both future and
existing domestic buildings in Oman, and to meet the requirement to achieve high energy
performance:
I. Recommendations for the decision makers:-
i. Provide a country-specific master energy plan that includes energy codes,
regulations, market values of green construction, grants and support systems;
ii. Energy efficiency building codes in Oman should be established considering the
impact of microclimates around domestic buildings, to ensure that the design of
high-performance homes, considers the solar orientation of the building as well as
the orientation, ratio of the fenestration within the façade, building materials, use of
renewables and the efficiency of home appliances;
iii. Revise and update the approval conditions for new housing permits, adding energy
consumption analysis to the design requirements;
iv. Revise and upgrade the planning regulations for new developments in Oman
considering the solar orientation of the plots as a way to reduce the residential energy
consumption;
v. Raise public awareness regarding the level of energy consumption in the home, and
educate the public on the importance of reducing energy consumption to benefit
individual household budgets;
vi. Introduce energy efficacy design measures in the construction of new government
and community buildings in order to show the community the potential energy
consumption reduction in buildings;
vii. Establish an energy market, including feed-in tariffs;
235
viii. Provide financial support for implementing energy reduction measures in new and
refurbished buildings instead of providing subsidies based on energy cost;
ix. Establish an energy rating scheme for buildings to support the market value of low
energy buildings;
x. Enforce the real estate developer to provide the energy consumption status of
buildings.
II. Recommendations for architects and contractors
i. Provide a guide to encourage the clients commissioning the home at the early decision
making stages to inform the appropriate choices that result in the designing of high-
performance dwellings for both thermal comfort and reduced future energy
consumption;
ii. Consider the use of building energy modelling tools in order to support design options
that potentially consume less energy;
iii. A north-south orientation should be considered for the location of all habitable rooms
in the home schematic design, regardless of the direction of the street. Also, consider
the adopting low cost energy efficient solutions;
iv. Ensure that during the construction stages efficient, high resistance insulation in the
whole building envelope, including roof, walls, floors and all openings, are specified to
prevent unwanted heat gains from the outdoor environment.
v. Use efficient insulated low-E coated glazing or double, maybe triple glazing to
minimise any unwanted direct solar radiation entering the home.
vi. The window-wall ratio should be reduced as much as possible, for an example should
not more than those in reference buildings (15% to 22%);
vii. Design effective external shading devices and use landscaping to cool the surrounding
environment to assist in the reduction of energy consumed for air conditioning systems;
viii. Living zones that are mostly occupied during the day should not be exposed to the
harshest west facing part of a home. Recommend locating buffer spaces around living
areas to limit the outdoor heat coming into these spaces;
ix. Provide energy modelling and analysis for the client in order to show the potential
energy reduction and subsequently building operation cost reductions;
x. Remain up-to-date with the latest available technologies and materials in the field of
energy efficient materials.
236
III. Recommendations for clients and consumers
i. It is strongly suggested to consult professionals at the early decision making stages of
the design process instead of defaulting to cheap products or relying on the construction
contractor;
ii. It is beneficial for existing low carbon dwellings to be retrofitted to meet the suggested
guidelines as much as possible, in order to reduce electricity use.
iii. Setting the AC system thermostat at a higher temperature would help to reduce the
cooling load on the dwelling and thus the lifespan of the cooling system.
iv. It is advisable to attempt to change the daily lifestyle in favour of less cooling demand
to reduce energy consumption.
v. Consider the energy efficiency of newly purchased home appliances and devices as this
will contribute to the overall energy bill of the house.
Potential future research areas
This research investigated energy consumption of residential buildings for the purposes of
devising a country’s strategy to shift the residential building sector to more low carbon options.
However, the energy consumption of dwellings is a critical issue and the technical viability of
low energy building strategies to meet the target energy performance in Oman requires further
research. Therefore, this research suggests four different main areas of parallel research,
namely: i) optimal architectural design of buildings in a hot, humid climate , ii) the influence
of occupants’ factors on building energy performance, iii) low carbon materials for hot, humid
climates, and iv) optimal cost of low carbon building. The presented work is merely a step on
the road towards low energy buildings in Oman. Much more work remains to be done in the
area of energy standards and performance evaluation. The findings of the current work can
provide the future research with various areas to investigate:
The need exists to explore building energy use for different house design styles,
volumes and surface areas, enabling architects and designers to make informed
decisions on the impact that alterations in the design will have on the overall energy
237
consumption. Further, the design criteria devised in chapter five will require further
investigation to validate their application.
The occupancy factors that influence the efficiency of building performance is not
investigated in depth in this study. Occupants’ effect on energy usage differs based on
when the optimum environment is achieved not everyone is satisfied. Moreover, a
sensitivity analysis of the internal heat gains (people, light, equipment) in the hot
environment needs more consideration.
With respect to the construction, the effectiveness of different construction materials
for both the structure and insulation can be examined, as heat capacity and thermal
conductivity change from material to material under different environmental
conditions.
Subsidising energy, especially electricity, for residential buildings seemed an
intractable policy for many countries, especially those of the GCC. It was seen as part
of the social contract between the citizens and the governments. However, shifting these
subsidies to support energy policy needs more investigation in order to provide the
suitable mechanism for a paradigm shift towards a low carbon environment at low cost.
238
References
Abanda, F. and Byers, L., 2016. An investigation of the impact of building orientation on
energy consumption in a domestic building using emerging BIM (Building Information
Modelling). Energy, 97, pp.517-527.
Abdou, A., 2005. Comparison of Thermal Conductivity Measurements of Building Insulation
Materials under Various Operating Temperatures. Journal of Building Physics, 29(2),
pp.171-184.
Acosta, I., Munoz, C., Campano, M. and Navarro, J., 2015. Analysis of daylight factors and
energy saving allowed by windows under overcast sky conditions. Renewable Energy, 77,
pp.194-207.
Aïssani, A., Chateauneuf, A., Fontaine, J. and Audebert, P., 2014. Cost model for optimum
thicknesses of insulated walls considering indirect impacts and uncertainties. Energy and
Buildings, 84, pp.21-32.
Akadiri, P., Chinyio, E. and Olomolaiye, P., 2012. Design of A Sustainable Building: A
Conceptual Framework for Implementing Sustainability in the Building Sector. Buildings,
2(4), pp.126-152.
Aksamija, A., 2015. A STRATEGY FOR ENERGY PERFORMANCE ANALYSIS AT
THE EARLY DESIGN STAGE: PREDICTED VS. ACTUAL BUILDING ENERGY
PERFORMANCE. Journal of Green Building, 10(3), pp.161-176.
Aksamija., 2013. Sustainable facades. Design methods for high-performance building
envelopes. 1st ed. Bognor Regis: John Wiley & Sons Ltd, p.6.
Al Aufi, M., 2016. يموكحلا معدلاو ءابرهكلا ةفرعت. Al shabiba, p.8.
Al Busaidi, A., Kazem, H., Al-Badi, A. and Farooq Khan, M., 2016. A review of optimum
sizing of hybrid PV–Wind renewable energy systems in oman. Renewable and Sustainable
Energy Reviews, 53, pp.185-193.
Al Shibli, S., 2016. Use of Renewable Energy.
Al-ajmi, F. and Loveday, D., 2010. Indoor thermal conditions and thermal comfort in air-
conditioned domestic buildings in the dry-desert climate of Kuwait. Building and
Environment, 45(3), pp.704-710.
Alalouch, C., Saleh, M. and Al-Saadi, S., 2016. Energy-Efficient House in the GCC Region.
Procedia - Social and Behavioral Sciences, 216, pp.736-743.
AlAnzi, A., Seo, D. and Krarti, M., 2009. Impact of building shape on thermal performance
of office buildings in Kuwait. Energy Conversion and Management, 50(3), pp.822-828.
239
Al-Badi, A., Malik, A. and Gastli, A., 2011. Sustainable energy usage in Oman—
Opportunities and barriers. Renewable and Sustainable Energy Reviews, 15(8), pp.3780-
3788.
Al-Badi, A., Malik, A., Al-Areimi, K. and Al-Mamari, A., 2009. Power sector of Oman—
Today and tomorrow. Renewable and Sustainable Energy Reviews, 13(8), pp.2192-2196.
AlBalushi, A., 2015. Market ability.
Al-Hinai, H., Batty, W. and Probert, S., 1993. Vernacular architecture of Oman: Features that
enhance thermal comfort achieved within buildings. Applied Energy, 44(3), pp.233-258.
Al-Homoud, M., 2001. Computer-aided building energy analysis techniques. Building and
Environment, 36(4), pp.421-433.
Alhorr, Y. and Elsarrag, E., 2015. Climate Change Mitigation through Energy Benchmarking
in the GCC Green Buildings Codes. Buildings, 5(2), pp.700-714.
Al-Kuwari, E., 2017. President Message. [online] Qatar General Electricity and Water
Corporation. Available from:
https://www.km.com.qa/AboutUs/Pages/ElectricitySector.aspx [Accessed 17 Mar. 2017].
Al-Maamary, H., Kazem, H. and Chaichan, M., 2016. The impact of oil price fluctuations on
common renewable energies in GCC countries. Renewable and Sustainable Energy
Reviews.
Almulla, Y., 2014. Gulf Cooperation Council (GCC) countries 2040 energy scenario for
electricity generation and water desalination. MSc. KTH Royal Institute of Technology.
AlShamsi, Y., 2014. Green Buildings Evaluation. [email].
Alshukaili, A., 2016. Interview 3.
Altomonte, S., 2009. Daylight for Energy Savings and Psycho-Physiological Well-Being in
Sustainable Built Environments. Journal of Sustainable Development, 1(3).
Alzoubi, H. and Al-Zoubi, A., 2010. Assessment of building façade performance in terms of
daylighting and the associated energy consumption in architectural spaces: Vertical and
horizontal shading devices for southern exposure facades. Energy Conversion and
Management, 51(8), pp.1592-1599.
Ameer, B. and Krarti, M., 2016. Impact of subsidization on high energy performance designs
for Kuwaiti residential buildings. Energy and Buildings, 116, pp.249-262.
Andaloro, A., Salomone, R., Ioppolo, G. and Andaloro, L., 2010. Energy certification of
buildings: A comparative analysis of progress towards implementation in European
countries. Energy Policy, 38(10), pp.5840-5866.
240
Anon, 1992. Local Order No. 23/92 Building Regulation For Muscat. 1st ed. [ebook] Muscat:
Muscat Municipality. Available from:
http://www.blueumbrella.com.om/pdf/laws/Building%20Regulation%20for%20Muscat%2
0Area.pdf [Accessed 15 Feb. 2017].
Anon, 2001. Aust-Govt-Life_Cycle_Costing. 1st ed. [ebook] Canberra: Australian National
Audit Office, pp.8-12. Available from: http://www.tdsa.org.au/wp-
content/uploads/2016/03/Aust-Govt-Life_Cycle_Costing.pdf [Accessed 15 Feb. 2017].
Anon, 2007. Case Study: Clarum Homes – Vista Montana. 1st ed. [ebook] Building America
Best Practices Series, p.4. Available from: http://www.solaripedia.com/files/553.pdf
[Accessed 16 Apr. 2017].
Anon, 2008. Study on Renewable Energy Resources, Oman. [online] Muscat: COWI and
Partners LLC, p.59. Available from: http://regulationbodyofknowledge.org/wp-
content/uploads/2013/09/AuthorityforElectricityRegulation_Oman_Study_on.pdf
[Accessed 15 Aug. 2015].
Anon, 2009. Energy Conservation Building Code User Guide. 1st ed. [ebook] New Delhi:
Bureau of Energy Efficiency, pp.1-3. Available from:
http://energycodesocean.org/sites/default/files/ECBC-User-Guide(Public).pdf [Accessed
15 Apr. 2017].
Anon, 2009. Rapidwall. [online] Horizons-hidc.com. Available from: http://www.horizons-
hidc.com/resources_downloads.html [Accessed 8 Feb. 2014].
Anon, 2009. The UK low carbon transition plan. London: TSO.
Anon, 2010. ASHRAE standard. 1st ed. Atlanta, GA: ASHRAE.
Anon, 2010. Guide to Part L of the Building Regulations. 1st ed. London: NBS.
Anon, 2012. OPWP’s 7-YEAR STATEMENT (2012 – 2018). [online] Muscat: OMAN
POWER AND WATER PROCUREMENT C O . (SAOC), p.4. Available from:
http://www.omanpwp.com/PDF/Final%207YS%202012-2018.pdf [Accessed 5 Sep.
2014].
Anon, 2013. Ashrae handbook. 1st ed. Atlanta: Ashrae.
Anon, 2013. Oman energy report. [online] Enerdata. Available from:
https://estore.enerdata.net/energy-market/oman-energy-report-and-data.html [Accessed 17
Feb. 2017].
Anon, 2013. Oman energy report. [online] Enerdata. Available from:
https://estore.enerdata.net/energy-market/oman-energy-report-and-data.html [Accessed 17
Feb. 2017].
241
Anon, 2013. Publication: Technology Roadmap: Energy Efficient Building Envelopes.
[online] Iea.org. Available from:
https://www.iea.org/publications/freepublications/publication/technology-roadmap-
energy-efficient-building-envelopes.html [Accessed 10 Apr. 2017].
Anon, 2013. Transition to Sustainable Buildings Strategies and Opportunities to 2050. 1st
ed. [ebook] Paris: International Energy Agency, p.124. Available from:
https://www.iea.org/publications/freepublications/publication/Building2013_free.pdf
[Accessed 10 Apr. 2017].
Anon, 2014. BUSTAN OMAN ECO-FRIENDLY HOUSE COMPETITION OMAN
UNIVERSITY OF NIZWA, SULTANATE OF OMAN. 1st ed. [ebook] Nizwa: University of
Nizwa, p.31. Available from:
https://docs.google.com/uc?id=0BywxsPqdS315RnBxUE03TmNrUWM&export=downlo
ad [Accessed 19 Aug. 2014].
Anon, 2014. ENERGY CONSERVATION PROGRAM Code of Practice. 1st ed. [ebook]
Kuwait: MINISTRY OF ELECTRICITY & WATER. Available from:
http://www.mew.gov.kw/media/The%20Code%20-%20Master%20copy.pdf [Accessed 17
Apr. 2017].
Anon, 2014. Oman Eco- Friendly House PROJECT MANUAL. 1st ed. [ebook] Muscat: HCT,
p.536. Available from:
https://docs.google.com/uc?id=0BywxsPqdS315bGItZm1yVHRrVGs&export=download
[Accessed 19 May 2015].
Anon, 2014. Oman Eco-House Project. 1st ed. [ebook] Muscat: Sultan Qaboos University,
p.150. Available from:
https://docs.google.com/uc?id=0BywxsPqdS315YlVkelN5RjZQbVU&export=download
[Accessed 20 Aug. 2014].
Anon, 2014. reegle - clean energy information gateway. [online] reegle - clean energy
information gateway. Available from: http://www.reegle.info/policy-and-regulatory-
overviews/MA [Accessed 16 Apr. 2017].
Anon, 2014. Sustainable Patterns of Urbanization in Oman | aurelVR architecture. [online]
Aurelvr.com. Available from: http://aurelvr.com/content/sustainable-patterns-
urbanization-oman [Accessed 22 Aug. 2015].
Anon, 2014. Understanding Standard 189.1 for High-Performance Green Buildings |
ashrae.org. [online] Ashrae.org. Available from: https://www.ashrae.org/education--
certification/all-instructor-led-courses/understanding-standard-189-1-for-high-
performance-green-buildings [Accessed 15 Apr. 2017].
Anon, 2015. BUSTAN OMAN. 1st ed. [ebook] Nizwa: University of Nizwa, p.31. Available
from:
242
https://docs.google.com/uc?id=0BywxsPqdS315RnBxUE03TmNrUWM&export=downlo
ad [Accessed 17 Feb. 2017].
Anon, 2015. Energy Balance. [online] Ecohousecompetition.org. Available from:
https://ecohousecompetition.org/scores/measured-contests/energy-balance/ [Accessed 15
Jun. 2017].
Anon, 2015. Estidama - Estidama and Urban Development. [online] Estidama.upc.gov.ae.
Available from: https://estidama.upc.gov.ae/estidama--development-review-
.aspx?lang=en-US [Accessed 17 Apr. 2017].
Anon, 2015. Green Building Regulations & Specifications. 1st ed. [ebook] Dubai: Dubai
Municipality. Available from: https://www.dm.gov.ae/wps/wcm/connect/662c2fc7-03b4-
41a5-aad0-c9d1959773a3/Green+Building+Regulations+and+Speci.pdf?MOD=AJPERES
[Accessed 5 Feb. 2016].
Anon, 2015. NCC Volume Two Energy Efficiency Provisions | Australian Building Codes
Board. [online] Abcb.gov.au. Available from:
http://www.abcb.gov.au/Resources/Publications/Education-Training/NCC-Volume-Two-
Energy-Efficiency-Provisions [Accessed 15 Apr. 2017].
Anon, 2015. New Qatar construction standards and practices may cost contractors, says
expert. [online] Out-law.com. Available from: https://www.out-
law.com/en/articles/2015/april/new-qatar-construction-standards-and-practices-may-cost-
contractors-says-expert/ [Accessed 17 Apr. 2017].
Anon, 2015. Paris Agreement. [ebook] Paris: United Nations, pp.3-6. Available from:
http://unfccc.int/resource/docs/2015/cop21/eng/l09r01.pdf [Accessed 10 Aug. 2017].
Anon, 2015. Statistical. [online] The Electricity & Co-Generation Regulatory Authority.
Available from: http://www.ecra.gov.sa/ar-sa/Pages/default.aspx [Accessed 26 May 2016].
Anon, 2015. University of Nizwa. [online] Ecohousecompetition.org. Available from:
https://ecohousecompetition.org/teams/nizwa/ [Accessed 15 Jun. 2017].
Anon, 2016. Middle East and North Africa Overview. [online] Worldbank.org. Available
from: http://www.worldbank.org/en/region/mena/overview#1 [Accessed 18 Apr. 2017].
Anon, 2016. Monthly Statistical Bulletin. [online] NATIONAL CENTRE FOR STATICS &
INFORMATION. Available from:
https://www.ncsi.gov.om/Elibrary/LibraryContentDoc/bar_MSB%20Nov20162_7d7543ab
-d04a-4e96-924a-b72ae8e34a33.pdf [Accessed 10 Feb. 2017].
Anon, 2016. OPWP ’ s 7 - YEAR STATEMENT ( 201 6 – 20 2 2 ). [online] Muscat: OMAN
POWER AND WATER PROCUREMENT C O . (SAOC), p.9. Available from:
243
http://www.omanpwp.com/PDF/7YS%202016-2022%20Final%20.pdf [Accessed 24 Feb.
2017].
Anon, 2016. RTScreen. Government of Canada | Multiple.
Anon, 2017. 100 Tallest Completed Buildings in the World - The Skyscraper Center. [online]
Skyscrapercenter.com. Available from: http://skyscrapercenter.com/buildings [Accessed
18 Apr. 2017].
Anon, 2017. A Review of Sustainable Design in the Middle East. [online] Carboun:
Advocating Sustainable Cities in the Middle East. Available from:
http://www.carboun.com/sustainable-design/sustainability-in-the-desert/ [Accessed 9 Feb.
2017].
Anon, 2017. About Us - ADWEA. [online] Adwea.ae. Available from:
http://www.adwea.ae/en/about-us.aspx [Accessed 7 Mar. 2016].
Anon, 2017. An Architectural Tour through Oman | Travel & Tour Information - Visit the
Sultanate of Oman. [online] Tourismoman.com.au. Available from:
https://www.tourismoman.com.au/news/an-architectural-tour-through-oman/ [Accessed 17
Feb. 2017].
Anon, 2017. Architectural styles in Oman - the genius of construction and efficient
performance. [online] ىوزن ةلجم. Available from:
http://www.nizwa.com/%D8%A7%D9%84%D8%A7%D9%86%D9%85%D8%A7%D8%
B7-
%D8%A7%D9%84%D9%85%D8%B9%D9%85%D8%A7%D8%B1%D9%8A%D8%A9
-%D9%81%D9%8A-%D8%B9%D9%85%D8%A7%D9%86-
%D8%B9%D8%A8%D9%82%D8%B1%D9%8A%D8%A9-%D8%A7%D9%84/
[Accessed 17 Feb. 2017].
Anon, 2017. ARZ Building Rating System. [online] Arzrating.com. Available from:
http://www.arzrating.com/pages.aspx?id=1 [Accessed 18 Apr. 2017].
Anon, 2017. BR15 in English. [online] Bygningsreglementet.dk. Available from:
http://bygningsreglementet.dk/english/0/40 [Accessed 15 Apr. 2017].
244
Anon, 2017. CO2 emissions (kt) | Data. [online] Data.worldbank.org. Available from:
http://data.worldbank.org/indicator/EN.ATM.CO2E.KT [Accessed 18 Aug. 2017].
Anon, 2017. Developing Energy Efficiency Standards and Labelling for Morocco. [online]
Ebrd.com. Available from: http://www.ebrd.com/work-with-us/projects/tcpsd/developing-
energy-efficiency-standards-and-labelling-for-morocco.html [Accessed 16 Apr. 2017].
Anon, 2017. Economic Studies & Working Papers. 1st ed. [ebook] Muscat: Oman Chamber
of Commerce and Industry, p.4. Available from: http://chamberoman.om/wp-
content/uploads/2016/02/4-.pdf [Accessed 30 Apr. 2015].
Anon, 2017. Energy and Resources-- Oman. [online] UN Environment. Available from:
http://www.unep.org/dewa/westasia/data/Knowledge_Bases/oman/Reports/WRI/Ene_cou
_512.pdf [Accessed 16 Aug. 2014].
Anon, 2017. Energy Efficiency in Bulildings Workshop. [online] Home.trc.gov.om. Available
from: https://home.trc.gov.om/tabid/628/language/en-US/Default.aspx [Accessed 15 Feb.
2017].
Anon, 2017. Energy-efficient building and refurbishment the right way. [online] Dena.de.
Available from: https://www.dena.de/en/topics-projects/energy-
efficiency/buildings/consulting-and-planning/german-energy-saving-ordinance-enev-
standards-and-laws/ [Accessed 18 Apr. 2017].
Anon, 2017. GCC Standardization Organization - GSO Technical Subcommittee for Green
Buildings. [online] Gso.org.sa. Available from:
https://www.gso.org.sa/gd/committee/TC06-SC1?lang=en [Accessed 17 Apr. 2017].
Anon, 2017. GCC Statistics. [online] Gcc-sg.org. Available from: http://www.gcc-sg.org/en-
us/CognitiveSources/GulfDatabases/Pages/GulfInformationwithCategorization.aspx
[Accessed 7 Sep. 2016].
Anon, 2017. Guidelines for Sizing Shading Devices for Typical Residential Houses in
Muscat, Oman.
Anon, 2017. IgCC | ICC. [online] Iccsafe.org. Available from:
https://www.iccsafe.org/codes-tech-support/codes/2015-i-codes/igcc/ [Accessed 15 Apr.
2017].
Anon, 2017. Latest News - Msheireb Properties. [online] Msheireb.com. Available from:
http://www.msheireb.com/en-us/mediacentre/latestnews.aspx [Accessed 18 Apr. 2017].
Anon, 2017. List of buildings and structures. [online] En.wikipedia.org. Available from:
https://en.wikipedia.org/wiki/List_of_buildings_and_structures [Accessed 15 Feb. 2017].
Anon, 2017. List of countries by real GDP growth rate. [online] En.wikipedia.org. Available
from: https://en.wikipedia.org/wiki/List_of_countries_by_real_GDP_growth_rate
[Accessed 17 Feb. 2017].
245
Anon, 2017. Live Data – EcoHouse Design Competition. [online] Ecohousecompetition.org.
Available from: https://ecohousecompetition.org/measurements/live-data/ [Accessed 17
Feb. 2017].
Anon, 2017. Manual of Green Building Materials, Products & Their Testing Facilities. 1st
ed. [ebook] Dubai: Dubai Municipality. Available from:
http://www.dcl.ae/NR/rdonlyres/7D2E7753-8215-44B9-A7FA-
C7305F5111B9/0/ManualofGreenBuildingMaterialsproductsitstestignfacilities.pdf
[Accessed 17 Apr. 2017].
Anon, 2017. MONTHLY STATISTICAL BULLETIN. March 2017. [online] Muscat: National
Center for Statistics and Information, p.2. Available from:
https://www.ncsi.gov.om/Elibrary/LibraryContentDoc/bar_March%202017_d6f4d960-
b6ab-401b-b199-48e1fb3838c6.pdf [Accessed 30 Mar. 2017].
Anon, 2017. Moving towards zero carbon living. [online] Sse.com. Available from:
http://sse.com/newsandviews/allarticles/2013/06/moving-towards-zero-carbon-living/
[Accessed 16 Apr. 2017].
Anon, 2017. Muscat Real Estate. [online] 3qaratonline.com. Available from:
http://www.3qaratonline.com/catid-119-t6.html [Accessed 6 Dec. 2016].
Anon, 2017. Muscat, Oman. [online] En.wikipedia.org. Available from:
https://en.wikipedia.org/wiki/Muscat,_Oman#cite_note-NOAA-30 [Accessed 17 Feb.
2017].
Anon, 2017. Oman Inflation Rate Forecast 2016-2020. [online] Tradingeconomics.com.
Available from: https://tradingeconomics.com/oman/inflation-cpi/forecast [Accessed 17
Jul. 2017].
Anon, 2017. Oman Solar. [online] Solar GCC. Available from:
http://www.solargcc.com/oman-solar/ [Accessed 31 Mar. 2017].
Anon, 2017. Projections of the future power and water system in Oman. 1st ed. [ebook]
Pöyry, p.1. Available from:
http://www.poyry.com/sites/default/files/flyer_oman_futureprojections_2016_v100_hr.pdf
[Accessed 14 Feb. 2017].
Anon, 2017. Qatar Construction Standard 2014 : Free Download & Streaming : Internet
Archive. [online] Internet Archive. Available from: https://archive.org/details/QCS2014
[Accessed 17 Apr. 2017].
Anon, 2017. Rate the climate: Muscat, Oman (hottest, record, temperature, nights) - Weather
-Temperature, sun, sunlight, rain, hurricanes, tornadoes, climate, forecasts, humidity,
heat, snow... - City-Data Forum. [online] City-data.com. Available from: http://www.city-
data.com/forum/weather/1881146-rate-climate-muscat-oman.html [Accessed 17 Feb.
2017].
246
Anon, 2017. Technology Roadmap: Energy Efficient Building Envelopes. 1st ed. [ebook]
International Energy Agency – IEA, pp.10-12. Available from:
https://www.iea.org/publications/freepublications/publication/TechnologyRoadmapEnergy
EfficientBuildingEnvelopes.pdf [Accessed 10 Apr. 2017].
Anon, 2017. The GCC in 2020: Resources for the future. London: The Economist
Intelligence Unit Ltd, p.8.
Anon, 2017. The State of Energy Efficiency Policies in Middle East Buildings. [online]
Carboun: Advocating Sustainable Cities in the Middle East. Available from:
http://www.carboun.com/energy/the-state-of-energy-conservation-policies-in-middle-east-
buildings/ [Accessed 16 Apr. 2017].
Anon, 2017. Thermal regulations 2012 and 2020 in France. [online] Libnam.eu. Available
from: http://www.libnam.eu/en/natural-materials/understand/thermal-regulations-2012-
and-2020-in-france/ [Accessed 15 Apr. 2017].
Anon, 2017. Transition to Sustainable Buildings. [ebook] Paris: International Energy
Agency, pp.117-118. Available from:
https://www.iea.org/publications/freepublications/publication/Building2013_free.pdf
[Accessed 6 May 2017].
Anon, 2017. UAE Lighting Standard. [online] Uae.panda.org. Available from:
http://uae.panda.org/what_we_do/ecological_footprint_initiative/uae_lighting_standard/
[Accessed 17 Apr. 2017].
Anon, 2017. VE for Architects | Architectural analysis package. [online] Iesve.com.
Available from: https://www.iesve.com/software/ve-for-architects#capabilities [Accessed
7 Jun. 2017].
Anon, 2017. Statistic records. [online] Ncsi.gov.om. Available from:
https://www.ncsi.gov.om/Pages/NCSI.aspx [Accessed 30 Mar. 2017].
Anon, n.d. ASHRAE 90.1. [online] En.wikipedia.org. Available from:
Anon, n.d. Energy Savings at Home : ENERGY STAR. [online] Energystar.gov. Available
from: https://www.energystar.gov/campaign/home [Accessed 15 Apr. 2017].
Anon, n.d. History & Accomplishments. [online] Energystar.gov. Available from:
https://www.energystar.gov/about/history [Accessed 15 Apr. 2017].
Anon, n.d. International Energy Conservation Code 2012. 1st ed.
Anon, n.d. International Energy Conservation Code® Resource Page | ICC. [online]
Iccsafe.org. Available from: https://www.iccsafe.org/international-energy-conservation-
code-resource-page/ [Accessed 15 Sep. 2015].
247
Anon, n.d. Standard 90.1 | ashrae.org. [online] Ashrae.org. Available from:
https://www.ashrae.org/resources--publications/bookstore/standard-90-1 [Accessed 15
Apr. 2017].
Anon, n.d. Zero Energy Demonstration Homes Clarum Homes. 1st ed. [ebook] Energy &
Sustainable Solutions, pp.1-2. Available from:
https://www.consol.ws/files/Clarum_BorregoSprings.pdf [Accessed 16 Apr. 2017].
Arnold, C., 2017. Building Envelope Design Guide - Introduction | WBDG Whole Building
Design Guide. [online] Wbdg.org. Available from: http://www.wbdg.org/systems-
specifications/building-envelope-design-guide/building-envelope-design-guide-
introduction [Accessed 6 Apr. 2017].
Ballarini, I., Corrado, V., Madonna, F., Paduos, S. and Ravasio, F., 2017. Energy
refurbishment of the Italian residential building stock: energy and cost analysis through
the application of the building typology. Energy Policy, 105, pp.148-160.
Beeri, O., Rotem, O., Hazan, E., Katz, E., Braun, A. and Gelbstein, Y., 2015. Hybrid
photovoltaic-thermoelectric system for concentrated solar energy conversion:
Experimental realization and modeling. Journal of Applied Physics, 118(11), p.115104.
Bellia, L. and Bisegna, F., 2013. From radiometry to circadian photometry: A theoretical
approach. Building and Environment, 62, pp.63-68.
Bhutto, A., Bazmi, A., Zahedi, G. and Klemeš, J., 2014. A review of progress in renewable
energy implementation in the Gulf Cooperation Council countries. Journal of Cleaner
Production, 71, pp.168-180.
Birchall, S., Wallis, I., Churcher, D., Pezzutto, S., Fedrizzi, R. and Causse, E., 2014. D2.1a -
Survey on the energy needs and architectural features of the EU building stock. 1st ed.
[ebook] iNSPiRe, pp.2-6. Available from: http://inspirefp7.eu/wp-
content/uploads/2016/08/WP2_D2.1a_20140523_P18_Survey-on-the-energy-needs-and-
architectural-features.pdf [Accessed 30 Jun. 2016].
Blumstein, C., Krieg, B., Schipper, L. and York, C., 1980. Overcoming social and
institutional barriers to energy conservation. Energy, 5(4), pp.355-371.
Bojić, M. and Loveday, D., 1997. The influence on building thermal behavior of the
insulation/masonry distribution in a three-layered construction. Energy and Buildings,
26(2), pp.153-157.
Boyd, R. and Hilborn, R., 1984. Radiometry and the Detection of Optical Radiation.
American Journal of Physics, 52(7), pp.668-669.
Brēmere, I., Indriksone, D. and Aleksejeva, I., 2013. Energy efficient and ecological housing
in Finland, Estonia and Latvia: current experiences and future perspectives. Antonijas:
Baltic Environmental Forum-Latvia, pp.79-80.
248
Brinks, P., 2016. Potential-analysis of grey energy limits for residential buildings in
Germany. Energy and Buildings, 127, pp.580-589.
Brounen, D., Kok, N. and Quigley, J., 2013. Energy literacy, awareness, and conservation
behavior of residential households. Energy Economics, 38, pp.42-50.
Brom, P., Meijer, A. and Visscher, H., 2017. Performance gaps in energy consumption:
household groups and building characteristics. Building Research & Information, 46(1),
pp.54-70.
Brown, M., Cox, M., Staver, B. and Baer, P., 2015. Modeling climate-driven changes in U.S.
buildings energy demand. Climatic Change, 134(1-2), pp.29-44.
Cabeza, L., Rincón, L., Vilariño, V., Pérez, G. and Castell, A., 2014. Life cycle assessment
(LCA) and life cycle energy analysis (LCEA) of buildings and the building sector: A
review. Renewable and Sustainable Energy Reviews, 29, pp.394-416.
Cao, K., Mathews, R. and Wang, S., 2015. Modelling Household Energy Consumption Using
ABS Survey Data. Economic Papers: A journal of applied economics and policy, 34(1-2),
pp.36-47.
Carlowicz, M., 2016. World of Change: Global Temperatures : Feature Articles. [online]
Earthobservatory.nasa.gov. Available from:
https://earthobservatory.nasa.gov/Features/WorldOfChange/decadaltemp.php [Accessed
14 Jun. 2016].
Chang, Y., Fang, Z. and Li, Y., 2016. Renewable energy policies in promoting financing and
investment among the East Asia Summit countries: Quantitative assessment and policy
implications. Energy Policy, 95, pp.427-436.
Chapman, A., McLellan, B. and Tezuka, T., 2016. Strengthening the Energy Policy Making
Process and Sustainability Outcomes in the OECD through Policy Design. Administrative
Sciences, 6(3), p.9.
Chastas, P., Theodosiou, T. and Bikas, D., 2016. Embodied energy in residential buildings-
towards the nearly zero energy building: A literature review. Building and Environment,
105, pp.267-282.
Chen, D., Wang, X. and Ren, Z., 2012. Selection of climatic variables and time scales for
future weather preparation in building heating and cooling energy predictions. Energy and
Buildings, 51, pp.223-233.
Clark, D., 2013. What colour is your building?. 1st ed. London: RIBA Publishing, p.28.
Corrado, V. and Ballarini, I., 2016. Refurbishment trends of the residential building stock:
Analysis of a regional pilot case in Italy. Energy and Buildings, 132, pp.91-106.
Curtis, J. and Pentecost, A., 2015. Household fuel expenditure and residential building energy
efficiency ratings in Ireland. Energy Policy, 76, pp.57-65.
249
Danielski, I., 2016. ENERGY PERFORMANCE OF RESIDENTIAL BUILDING S -
projecting , monitoring , and evaluating. PhD. Mid Sweden University,.
Danielski, I., Fröling, F. and Joelsson, A., 2012. Large variations in specific final energy use
in Swedish apartment buildings: Causes and solutions. Energy and Buildings, 49, pp.276-
285.
Danielski, I., Fröling, M. and Joelsson, A., 2012. The impact of the shape factor on final
energy demand in residential buildings in nordic climates. In: World Renewable Energy
Congress. [online] Denver,r, Colorado, USA: World Renewable Energy Congress, pp.12-
19. Available from: http://miun.diva-
portal.org/smash/get/diva2:532979/FULLTEXT01.pdf [Accessed 4 Apr. 2017].
de Groot, H., Verhoef, E. and Nijkamp, P., 2001. Energy saving by firms: decision-making,
barriers and policies. Energy Economics, 23(6), pp.717-740.
Dhaka, S., Mathur, J. and Garg, V., 2013. Effect of building envelope on thermal
environmental conditions of a naturally ventilated building block in tropical climate.
Building Services Engineering Research and Technology, 35(3), pp.280-295.
Dianshu, F., Sovacool, B. and Minh Vu, K., 2010. The barriers to energy efficiency in China:
Assessing household electricity savings and consumer behavior in Liaoning Province.
Energy Policy, 38(2), pp.1202-1209.
Dias, D., Machado, J., Leal, V. and Mendes, A., 2014. Impact of using cool paints on energy
demand and thermal comfort of a residential building. Applied Thermal Engineering,
65(1-2), pp.273-281.
Ding, Y., Wang, Z., Feng, W., Marnay, C. and Zhou, N., 2016. Influence of occupancy-
oriented interior cooling load on building cooling load design. Applied Thermal
Engineering, 96, pp.411-420.
Dresch, A., Pacheco Lacerda, D. and Cauchick Miguel, P., 2015. A Distinctive Analysis of
Case Study, Action Research and Design Science Research. Review of Business
Management, pp.1116-1133.
Energi, V., 2017. Greenwatt Way Zero Carbon Homes | Vital Energi. [online]
Vitalenergi.co.uk. Available from: https://www.vitalenergi.co.uk/casestudies/greenwatt-
way/ [Accessed 16 Apr. 2017].
Fabbri, K., 2015. A Brief History of Thermal Comfort: From Effective Temperature to
Adaptive Thermal Comfort. Indoor Thermal Comfort Perception, pp.7-23.
Fallahtafti, R. and Mahdavinejad, M., 2015. Optimisation of building shape and orientation
for better energy efficient architecture. International Journal of Energy Sector
Management, 9(4), pp.593-618.
250
Fayaz, R. and Kari, B., 2009. Comparison of energy conservation building codes of Iran,
Turkey, Germany, China, ISO 9164 and EN 832. Applied Energy, 86(10), pp.1949-1955.
Feldmann, C., 2013. French building regulation sets 50 kWh/(m2 a) a limit for primary
energy use. REHVA Journal, [online] (5), pp.29-32. Available from:
http://www.rehva.eu/fileadmin/REHVA_Journal/REHVA_Journal_2013/RJ_issue_5/P.29/
Feldman.pdf [Accessed 4 Jun. 2016].
Feng, J., Bauman, F. and Schiavon, S., 2014. Experimental comparison of zone cooling load
between radiant and air systems. Energy and Buildings, 84, pp.152-159.
Ferroukhi, R., Khalid, A., Hawila, D., Nagpal, D., El-Katiri, L., Fthenakis, V. and Al-Fara,
A., 2016. RENEWABLE ENERGY MARKET ANALYSIS THE GCC REGION. [online]
Abu Dhabi: The International Renewable Energy Agency (IRENA), p.95. Available from:
http://www.irena.org/DocumentDownloads/Publications/IRENA_Market_GCC_2016.pdf
[Accessed 29 Mar. 2017].
Fossati, M., Scalco, V., Linczuk, V. and Lamberts, R., 2016. Building energy efficiency: An
overview of the Brazilian residential labeling scheme. Renewable and Sustainable Energy
Reviews, 65, pp.1216-1231.
Frearson, A., 2013. Qatar National Convention Centre by Arata Isozaki. [online] Dezeen.
Available from: https://www.dezeen.com/2013/08/22/qatar-national-convention-centre-
by-arata-isozaki/ [Accessed 18 Apr. 2017].
Freewan, A., 2014. Impact of external shading devices on thermal and daylighting
performance of offices in hot climate regions. Solar Energy, 102, pp.14-30.
Fuller, S. and Petersen, S., 1996. Life-cycle costing manual for the Federal Energy
Management Program. 1st ed. Washington.
GmbH, V., 2017. EnEV 2014 � The latest changes to the Energy Saving Regulation. [online]
Inoutic.de. Available from: http://www.inoutic.de/en/tips-on-window-purchase/saving-
energy/energy-saving-regulations-2014/ [Accessed 15 Apr. 2017].
Gou, Z. and Lau, S., 2014. Contextualizing green building rating systems: Case study of
Hong Kong. Habitat International, 44, pp.282-289.
Guan, L., 2011. Sensitivity of building cooling loads to future weather predictions.
Architectural Science Review, 54(3), pp.178-191.
HamoudShabab, A., 2014. Design teams of refrence LCBs.
Hanna, G., 2015. Energy Efficiency Building Codes and Green Pyramid Rating System.
Renewable Energy in the Service of Mankind Vol I, pp.597-608.
Hasan, A., 1999. Optimizing insulation thickness for buildings using life cycle cost. Applied
Energy, 63(2), pp.115-124.
251
Hendrickson, D. and Wittman, H., 2010. Post-occupancy assessment: building design,
governance and household consumption. Building Research & Information, 38(5), pp.481-
490.
Heywood, H., 2015. 101 rules of thumb for sustainable buildings and cities. 1st ed. RIBA,
p.40.
Hirst, E. and Brown, M., 1990. Closing the efficiency gap: barriers to the efficient use of
energy. Resources, Conservation and Recycling, 3(4), pp.267-281.
Hong, T., Li, C. and Yan, D., 2015. Updates to the China Design Standard for Energy
Efficiency in public buildings. Energy Policy, 87, pp.187-198.
Huang, B., Mauerhofer, V. and Geng, Y., 2016. Analysis of existing building energy saving
policies in Japan and China. Journal of Cleaner Production, 112, pp.1510-1518.
Hussain, K., 2014. CO2 emissions in GCC countries. bq-magazine. [online] Available from:
http://www.bq-magazine.com/gcc-illustrated/2014/08/co2-emissions-gcc-countries
[Accessed 15 Dec. 2016].
Ibraheem, Y., Farr, E. and Piroozfar, P., 2017. Embedding Passive Intelligence into Building
Envelopes: A Review of the State-of-the-art in Integrated Photovoltaic Shading Devices.
Energy Procedia, 111, pp.964-973.
Ingle, A., Moezzi, M., Lutzenhiser, L. and Diamond, R., 2014. Better home energy audit
modelling: incorporating inhabitant behaviours. Building Research & Information, 42(4),
pp.409-421.
Isiadinso, C., Goodhew, S., Marsh, J. and Hoxley, M., 2011. Identifying an appropriate
approach to judge low carbon buildings. Structural Survey, 29(5), pp.436-446.
Iwafune, Y. and Yagita, Y., 2016. High-resolution determinant analysis of Japanese
residential electricity consumption using home energy management system data. Energy
and Buildings, 116, pp.274-284.
Iwaro, J. and Mwasha, A., 2010. A review of building energy regulation and policy for
energy conservation in developing countries. Energy Policy, 38(12), pp.7744-7755.
Jones, R., Fuertes, A. and Lomas, K., 2015. The socio-economic, dwelling and appliance
related factors affecting electricity consumption in domestic buildings. Renewable and
Sustainable Energy Reviews, 43, pp.901-917.
Kapur, R., 2014. Dubai smart Sustainable city - Ambassador report - Our Actions - Tunza
Eco Generation. [online] Tunza.eco-generation.org. Available from: http://tunza.eco-
generation.org/resourcesView.jsp?boardID=ambassadorReport&viewID=9172&searchTy
pe=&searchName=&pageNumber=811 [Accessed 18 Apr. 2017].
252
Kaynakli, O., 2008. A study on residential heating energy requirement and optimum
insulation thickness. Renewable Energy, 33(6), pp.1164-1172.
Kazem, H., 2011. Renewable energy in Oman: Status and future prospects. Renewable and
Sustainable Energy Reviews, 15(8), pp.3465-3469.
Kellenberger, D. and Althaus, H., 2009. Relevance of simplifications in LCA of building
components. Building and Environment, 44(4), pp.818-825.
Khan, N., Su, Y. and Riffat, S., 2008. A review on wind driven ventilation techniques.
Energy and Buildings, 40(8), pp.1586-1604.
Kibert, C. and Fard, M., 2012. Differentiating among low-energy, low-carbon and net-zero-
energy building strategies for policy formulation. Building Research & Information, 40(5),
pp.625-637.
Kolokotroni, M., Davies, M., Croxford, B., Bhuiyan, S. and Mavrogianni, A., 2010. A
validated methodology for the prediction of heating and cooling energy demand for
buildings within the Urban Heat Island: Case-study of London. Solar Energy, 84(12),
pp.2246-2255.
Krane, J., 2015. Stability versus Sustainability: Energy Policy in the Gulf Monarchies. The
Energy Journal, 36(4).
Kreider, J., Curtiss, P. and Rabl, A., 2010. Heating and cooling of buildings. Design for
efficiency. 1st ed. CRC Press.
Lam, T., Wan, K., Wong, S. and Lam, J., 2010. Impact of climate change on commercial
sector air conditioning energy consumption in subtropical Hong Kong. Applied Energy,
87(7), pp.2321-2327.
Lee, E., Selkowitz, S., Klems, J., Clear, R., Arasteh, D., Rubin, M., Haves, P., Wetter, M.,
Jonssen, J., McNeil, A., Hong,, T., Konis, K., Kohler, C., Mitchell, R. and Yazdanian, M.,
2010. High Performance Building Façade Solutions.. [online] Lawrence Berkeley
National Laboratory. Available from: http://www.etcc-
ca.com/sites/default/files/OLD/images/stories/et_summit_mon_tracks/et_summit_mon_tra
ks__2_2010/Eleanor_Lee_Ses2.pdf [Accessed 5 Apr. 2017].
Lillemo, S., 2014. Measuring the effect of procrastination and environmental awareness on
households' energy-saving behaviours: An empirical approach. Energy Policy, 66, pp.249-
256.
Liu, H., 2015. Evaluating Construction Cost of Green Building Based on Life-cycle Cost
Analysis: An empirical analysis from Nanjing, China. International Journal of Smart
Home, 9(12), pp.299-306.
Lynham, J., Nitta, K., Saijo, T. and Tarui, N., 2016. Why does real-time information reduce
energy consumption?. Energy Economics, 54, pp.173-181.
253
Magazzino, C., 2016. The relationship between real GDP, CO2 emissions, and energy use in
the GCC countries: A time series approach. Cogent Economics & Finance, 4(1).
Mahdy, M. and Nikolopoulou, M., 2014. Evaluation of fenestration specifications in Egypt in
terms of energy consumption and long term cost-effectiveness. Energy and Buildings, 69,
pp.329-343.
Majid, N., Shuichi, H. and Takagi, N., 2012. Vernacular Wisdom: The Basis of Formulating
Compatible Living Environment in Oman. Procedia - Social and Behavioral Sciences, 68,
pp.637-648.
Malmqvist, T., Glaumann, M., Scarpellini, S., Zabalza, I., Aranda, A., Llera, E. and Díaz, S.,
2011. Life cycle assessment in buildings: The ENSLIC simplified method and guidelines.
Energy, 36(4), pp.1900-1907.
McKeag, S., 2014. Buildings for Extreme Environments. 1st ed. London: Chartered
Institution of Building Services Engineers (CIBSE).
McLeod, R., Hopfe, C. and Rezgui, Y., 2012. An investigation into recent proposals for a
revised definition of zero carbon homes in the UK. Energy Policy, 46, pp.25-35.
Meir, I., Peeters, A., Pearlmutter, D., Halasah, S., Garb, Y. and Davis, J., 2012. An
assessment of regional constraints, needs and trends. Advances in Building Energy
Research, 6(2), pp.173-211.
Melita Tuschinski, S., 2017. EnEV ab 2016 Versch�rfung: Neue Wohngeb�ude ab 2016.
[online] Enev-online.com. Available from: http://www.enev-
online.com/enev_praxishilfen/vergleich_enev_2016_enev_2014_neubau_wohnbau_15.04.
06.htm [Accessed 15 Apr. 2017].
Montalvo, C., 2008. General wisdom concerning the factors affecting the adoption of cleaner
technologies: a survey 1990–2007. Journal of Cleaner Production, 16(1), pp.S7-S13.
Motuzienė, V., Rogoža, A., Lapinskienė, V. and Vilutienė, T., 2016. Construction solutions
for energy efficient single-family house based on its life cycle multi-criteria analysis: a
case study. Journal of Cleaner Production, 112, pp.532-541.
Moustris, K., Nastos, P., Bartzokas, A., Larissi, I., Zacharia, P. and Paliatsos, A., 2014.
Energy consumption based on heating/cooling degree days within the urban environment
of Athens, Greece. Theoretical and Applied Climatology, 122(3-4), pp.517-529.
Munawwar, S. and Ghedira, H., 2014. A review of Renewable Energy and Solar Industry
Growth in the GCC Region. Energy Procedia, 57, pp.3191-3202.
Nazari, H., Kazemi, A. and Hashem, M., 2015. Selecting the appropriate scenario for
forecasting energy demands of residential and commercial sectors in Iran using two
metaheuristic algorithms. Iranian Journal of Management Studies (IJMS), 9(1), pp.101 -
12 3.
254
Nematchoua, M., Raminosoa, C., Mamiharijaona, R., René, T., Orosa, J., Elvis, W. and
Meukam, P., 2015. Study of the economical and optimum thermal insulation thickness for
buildings in a wet and hot tropical climate: Case of Cameroon. Renewable and Sustainable
Energy Reviews, 50, pp.1192-1202.
Newspaper, M., 2011. Oman's first green building by 2013. [online] Muscat Daily News.
Available from: http://www.muscatdaily.com/Archive/Features/Oman-s-first-green-
building-by-2013#ixzz3wCH9ZPgR [Accessed 19 Apr. 2015].
Nikolaus, K., 2014. Intermediate Report on the Design and Construction of a NetZero-Energy
Building in Muscat, Oman. In: wsb14. [online] Barcelona. Available from:
http://wsb14barcelona.org/programme/pdf_poster/P-011.pdf [Accessed 13 Feb. 2017].
Observer, O., 2017. ‘Residential Energy Use in Oman’ Scoping Study - Oman Observer.
[online] Oman Observer. Available from: http://2016.omanobserver.om/residential-
energy-use-in-oman-scoping-study/ [Accessed 17 Feb. 2017].
Olesen, B., 2004. International standards for the indoor environment. Indoor Air, 14(s7),
pp.18-26.
Olonscheck, M., Holsten, A. and Kropp, J., 2011. Heating and cooling energy demand and
related emissions of the German residential building stock under climate change. Energy
Policy, 39(9), pp.4795-4806.
Omrany, H. and Marsono, A., 2016. National Building Regulations of Iran Benchmarked
with BREEAM and LEED: A Comparative Analysis for Regional Adaptations. British
Journal of Applied Science & Technology, 16(6), pp.1-15.
Ourghi, R., Al-Anzi, A. and Krarti, M., 2007. A simplified analysis method to predict the
impact of shape on annual energy use for office buildings. Energy Conversion and
Management, 48(1), pp.300-305.
Ozel, M. and Pihtili, K., 2007. Optimum location and distribution of insulation layers on
building walls with various orientations. Building and Environment, 42(8), pp.3051-3059.
Pan, W. and Garmston, H., 2012. Building regulations in energy efficiency: Compliance in
England and Wales. Energy Policy, 45, pp.594-605.
Pan, W. and Ning, Y., 2014. A socio-technical framework of zero-carbon building policies.
Building Research & Information, 43(1), pp.94-110.
Papadopoulou, A., Al Hosany, N., Karakosta, C. and Psarras, J., 2013. Building synergies
between EU and GCC on energy efficiency. International Journal of Energy Sector
Management, 7(1), pp.6-28.
Papineau, M., 2017. Setting the standard? A framework for evaluating the cost-effectiveness
of building energy standards. Energy Economics, 64, pp.63-76.
255
Parise, G. and Martirano, L., 2011. Ecodesign of Lighting Systems. IEEE Industry
Applications Magazine, 17(2), pp.14-19.
Parise, G., Martirano, L. and Di Ponio, S., 2013. Energy Performance of Interior Lighting
Systems. IEEE Transactions on Industry Applications, 49(6), pp.2793-2801.
Parkin, A., Mitchell, A. and Coley, D., 2016. A new way of thinking about environmental
building standards: Developing and demonstrating a client-led zero-energy standard.
Building Services Engineering Research and Technology, 37(4), pp.413-430.
Paudel, S., Elmitri, M., Couturier, S., Nguyen, P., Kamphuis, R., Lacarrière, B. and Le Corre,
O., 2017. A relevant data selection method for energy consumption prediction of low
energy building based on support vector machine. Energy and Buildings, 138, pp.240-256.
Portal, P., 2017. Approved Document L1A: Conservation of fuel and power in new dwellings |
Part L - Conservation of fuel and power | Planning Portal. [online] Planningportal.co.uk.
Available from:
https://www.planningportal.co.uk/info/200135/approved_documents/74/part_l_-
_conservation_of_fuel_and_power [Accessed 15 Apr. 2017].
Powmya, A. and Zainul Abidin, N., 2014. The Challenges of Green Construction in Oman.
International Journal of Sustainable Construction Engineering & Technology, 5(1),
pp.33-41.
Qader, M., 2009. Electricity Consumption and GHG Emissions in GCC Countries. Energies,
2(4), pp.1201-1213.
Qatar Financial Centre (QFC) Authority, 2010. The GCC in 2020: Resources for the future.
[online] Economist Intelligence Unit, pp.3-10. Available from:
http://graphics.eiu.com/upload/eb/GCC_in_2020_Resources_WEB.pdf [Accessed 14 Feb.
2017].
Radhi, H., 2008. A SYSTEMATIC APPROACH FOR LOW ENERGY BUILDINGS IN
BAHRAIN. PhD. University of Sheffield, England, U. K.
Raupach, M., Marland, G., Ciais, P., Le Quere, C., Canadell, J., Klepper, G. and Field, C.,
2007. Global and regional drivers of accelerating CO2 emissions. Proceedings of the
National Academy of Sciences, 104(24), pp.10288-10293.
Reiche, D., 2010. Energy Policies of Gulf Cooperation Council (GCC) countries—
possibilities and limitations of ecological modernization in rentier states. Energy Policy,
38(5), pp.2395-2403.
Riazi, M. and Hosseyni, S., 2011. Overview of current energy policy and standards in the
building sector in Iran. Sustainable Development and Planning V.
Rose, J. and Thomsen, K., 2015. Energy Saving Potential in Retrofitting of Non-residential
Buildings in Denmark. Energy Procedia, 78, pp.1009-1014.
256
Ruivo, C., Ferreira, P. and Vaz, D., 2013. Prediction of thermal load temperature difference
values for the external envelope of rooms with setback and setup thermostats. Applied
Thermal Engineering, 51(1-2), pp.980-987.
Ryckaert, W., Lootens, C., Geldof, J. and Hanselaer, P., 2010. Criteria for energy efficient
lighting in buildings. Energy and Buildings, 42(3), pp.341-347.
Said Meselhy ElSaeed, M., 2016. Development for Sustainable Construction System Glass
Fiber Reinforced Gypsum (GFRG) in Egypt Using Nanotechnology. American Journal of
Environmental Protection, 5(4), p.82.
Saleh, M. and Alalouch, C., 2015. Towards Sustainable Construction in Oman: Challenges &
Opportunities. Procedia Engineering, 118, pp.177-184.
Samuel, E., Joseph-Akwara, E. and Richard, A., 2017. Assessment of energy utilization and
leakages in buildings with building information model energy. Frontiers of Architectural
Research.
Sang, X., Pan, W. and Kumaraswamy, M., 2014. Informing Energy-efficient Building
Envelope Design Decisions for Hong Kong. Energy Procedia, 62, pp.123-131.
Santamouris, M., 2005. Energy performance of residential buildings. 1st ed. p.9.
Santos, P., Gervásio, H., da Silva, L. and Lopes, A., 2011. Influence of climate change on the
energy efficiency of light-weight steel residential buildings. Civil Engineering and
Environmental Systems, 28(4), pp.325-352.
Sapsford, R. and Jupp, V., 1996. Data collection and analysis. 1st ed. London [etc.]: Sage in
association with the Open University.
Schinke, B. and Klawitter, J., 2016. Background Paper: Country Fact Sheet Morocco Energy
and Development at a glance 2016. 1st ed. [ebook] Bonn, Germany: Germanwatch, pp.26-
32. Available from: https://germanwatch.org/en/download/15121.pdf [Accessed 16 Dec.
2016].
Schipper, L. and Hawk, D., 1991. More efficient household electricity-use. Energy Policy,
19(3), pp.244-265.
Schlueter, A. and Thesseling, F., 2009. Building information model based energy/exergy
performance assessment in early design stages. Automation in Construction, 18(2),
pp.153-163.
Schulze, T. and Eicker, U., 2013. Controlled natural ventilation for energy efficient buildings.
Energy and Buildings, 56, pp.221-232.
Shen, L., He, B., Jiao, L., Song, X. and Zhang, X., 2016. Research on the development of
main policy instruments for improving building energy-efficiency. Journal of Cleaner
Production, 112, pp.1789-1803.
257
Soheir Mohamed Hegazy, S., 2015. Continuity and Change of Muscat House - Influencing
Factors and Responses. International Journal of Advanced Research, [online] 3(9), pp.95-
107. Available from: http://www.journalijar.com/uploads/906_IJAR-6608.pdf [Accessed
14 Feb. 2017].
Spiegel-Feld, D., Rudyk, B. and Philippidis, G., 2016. Allocating the economic benefits of
renewable energy between stakeholders on Small Island Developing States (SIDS):
Arguments for a balanced approach. Energy Policy, 98, pp.744-748.
Spitler, J., McQuiston, F. and Lindsey, K., 1993. ASHRAE transactions. 1st ed. Atlanta:
ASHRAE, pp.183–192.
Staff, C., 2013. DEWA's LEED Platinum sustainable building opens |
ConstructionWeekOnline.com. [online] Constructionweekonline.com. Available from:
http://www.constructionweekonline.com/article-21017-dewas-leed-platinum-sustainable-
building-opens/ [Accessed 18 Apr. 2017].
Structural Engineering Institute. and American Society of Civil Engineers., 2014. Guideline
for Condition Assessment of the Building Envelope (ASCE. 1st ed. American Society of
Civil Engineers / ASCE.
Suryawanshi, P. and Jumle, A., 2016. Awareness of Energy Conservation Practices: An
Empirical Study among Households in Ahmednagar. Journal for Contemporary Research
in Management, 3(1), pp.21-31.
Sweetnam, T., 2017. Residential Energy Use In Oman: A Scoping Study. 1st ed. [ebook]
Muscat: UCL Energy Institute. Available from:
http://discovery.ucl.ac.uk/1425280/1/Oman%20Final%20Report%20v0%208_revised.pdf
[Accessed 28 Mar. 2017].
Taleb, H. and Pitts, A., 2009. The potential to exploit use of building-integrated photovoltaics
in countries of the Gulf Cooperation Council. Renewable Energy, 34(4), pp.1092-1099.
Theodoridou, I., Papadopoulos, A. and Hegger, M., 2011. A typological classification of the
Greek residential building stock. Energy and Buildings, 43(10), pp.2779-2787.
Timilsina, G. and Shah, K., 2016. Filling the gaps: Policy supports and interventions for
scaling up renewable energy development in Small Island Developing States. Energy
Policy, 98, pp.653-662.
Tonn, B., Hawkins, B., Schweitzer, M. and Eisenberg, J., 2013. Process evaluation of the
home performance with ENERGY STAR Program. Energy Policy, 56, pp.371-381.
Urban, F., 2016. Low carbon transitions for developing countries. [Place of publication not
identified]: Routledge, pp.10-11.
258
Venkatesh, V., Brown, S. and Bala, H., 2013. BRIDGING THE QUALITATIVE-
QUANTITATIVE DIVIDE: GUIDELINES FOR CONDUCTING MIXED METHODS
RESEARCH IN INFORMATION SYSTEMS. MIS Quarterly, 37(1), pp.21-54.
Virote, J. and Neves-Silva, R., 2012. Stochastic models for building energy prediction based
on occupant behavior assessment. Energy and Buildings, 53, pp.183-193.
Vissers, C., Ferraira Pires, L., Quartel, D. and Sinderen, M., 2016. Architectural design. 1st
ed. Switzerland: Springer.
Wan, K., Li, D. and Lam, J., 2011. Assessment of climate change impact on building energy
use and mitigation measures in subtropical climates. Energy, 36(3), pp.1404-1414.
Wan, K., Li, D. and Lam, J., 2011. Assessment of climate change impact on building energy
use and mitigation measures in subtropical climates. Energy, 36(3), pp.1404-1414.
Wang, S., Yan, C. and Xiao, F., 2012. Quantitative energy performance assessment methods
for existing buildings. Energy and Buildings, 55, pp.873-888.
Ward, D., Clark, C., Jensen, K., Yen, S. and Russell, C., 2011. Factors influencing
willingness-to-pay for the ENERGY STAR® label. Energy Policy, 39(3), pp.1450-1458.
Weber, L., 1997. Some reflections on barriers to the efficient use of energy. Energy Policy,
25(10), pp.833-835.
WEI, T. and TANG, Z., 2014. BUILDING LOW-CARBON CITIES: ASSESSING THE
FAST GROWING U.S. CITIES' LAND USE COMPREHENSIVE PLANS. Journal of
Environmental Assessment Policy and Management, 16(01), p.1450003.
Wiesmann, D., Lima Azevedo, I., Ferrão, P. and Fernández, J., 2011. Residential electricity
consumption in Portugal: Findings from top-down and bottom-up models. Energy Policy,
39(5), pp.2772-2779.
Wu, B., Liu, P. and Xu, X., 2017. An evolutionary analysis of low-carbon strategies based on
the government–enterprise game in the complex network context. Journal of Cleaner
Production, 141, pp.168-179.
Wu, J. and Zhao, J., 2015. Evaluation on Building End-user Energy Consumption Using
Clustering Algorithm. Procedia Engineering, 121, pp.1144-1149.
Xu, L., Liu, J., Pei, J. and Han, X., 2013. Building energy saving potential in Hot Summer
and Cold Winter (HSCW) Zone, China—Influence of building energy efficiency standards
and implications. Energy Policy, 57, pp.253-262.
Yang, L., He, B. and Ye, M., 2014. The application of solar technologies in building energy
efficiency: BISE design in solar-powered residential buildings. Technology in Society, 38,
pp.111-118.
259
Yao, R. and Steemers, K., 2005. A method of formulating energy load profile for domestic
buildings in the UK. Energy and Buildings, 37(6), pp.663-671.
Yildiz, Y., Korkmaz, K., Göksal Özbalta, T. and Durmus Arsan, Z., 2012. An approach for
developing sensitive design parameter guidelines to reduce the energy requirements of
low-rise apartment buildings. Applied Energy, 93, pp.337-347.
Yu, Z., Fung, B., Haghighat, F., Yoshino, H. and Morofsky, E., 2011. A systematic procedure
to study the influence of occupant behavior on building energy consumption. Energy and
Buildings, 43(6), pp.1409-1417.
Zapata-Lancaster, G., 2014. Low carbon non-domestic building design process. An
ethnographic comparison of design in Wales and England. Structural Survey, 32(2),
pp.140-157.
Zhang, Y. and Wang, Y., 2013. Barriers' and policies' analysis of China's building energy
efficiency. Energy Policy, 62, pp.768-773.
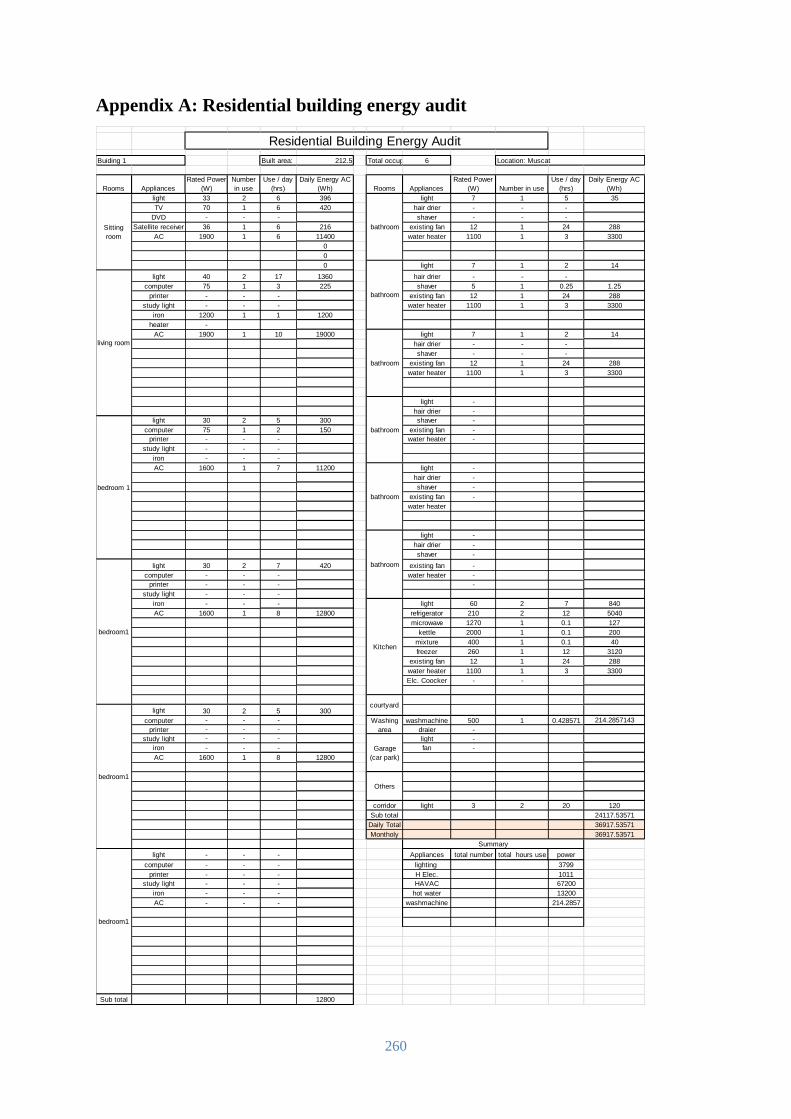
260
Appendix A: Residential building energy audit
Built area: 212.5 Total occupants 6
Rooms Appliances
Rated Power
(W)
Number
in use
Use / day
(hrs)
Daily Energy AC
(Wh) Rooms Appliances
Rated Power
(W) Number in use
Use / day
(hrs)
Daily Energy AC
(Wh)
light 33 2 6 396 light 7 1 5 35
TV 70 1 6 420 hair drier - - -
DVD - - - shaver - - -
Satellite receiver 36 1 6 216 existing fan 12 1 24 288
AC 1900 1 6 11400 water heater 1100 1 3 3300
0
0
0 light 7 1 2 14
light 40 2 17 1360 hair drier - - -
computer 75 1 3 225 shaver 5 1 0.25 1.25
printer - - - existing fan 12 1 24 288
study light - - - water heater 1100 1 3 3300
iron 1200 1 1 1200
heater -
AC 1900 1 10 19000 light 7 1 2 14
hair drier - - -
shaver - - -
existing fan 12 1 24 288
water heater 1100 1 3 3300
light -
hair drier -
light 30 2 5 300 shaver -
computer 75 1 2 150 existing fan -
printer - - - water heater -
study light - - -
iron - - -
AC 1600 1 7 11200 light -
hair drier -
shaver -
existing fan -
water heater
light -
hair drier -
shaver -
light 30 2 7 420 existing fan -
computer - - - water heater -
printer - - - -
study light - - -
iron - - - light 60 2 7 840
AC 1600 1 8 12800 refrigerator 210 2 12 5040
microwave 1270 1 0.1 127
kettle 2000 1 0.1 200
mixture 400 1 0.1 40
freezer 260 1 12 3120
existing fan 12 1 24 288
water heater 1100 1 3 3300
Elc. Coocker - -
light 30 2 5 300
computer - - - washmachine 500 1 0.428571 214.2857143
printer - - - draier -
study light - - - light -
iron - - - fan -
AC 1600 1 8 12800
corridor light 3 2 20 120
Sub total 24117.53571
Daily Total 36917.53571
Montholy 36917.53571
light - - - Appliances total number total hours use power
computer - - - lighting 3799
printer - - - H Elec. 1011
study light - - - HAVAC 67200
iron - - - hot water 13200
AC - - - washmachine 214.2857
Sub total 12800
bathroom
bathroom
bathroom
bedroom1
Residential Building Energy Audit
Buiding 1 Location: Muscat
Sitting
room
bathroom
Summary
Washing
area
Garage
(car park)
living room
Others
bedroom1
bedroom 1
bathroom
bathroom
bedroom1
Kitchen
courtyard
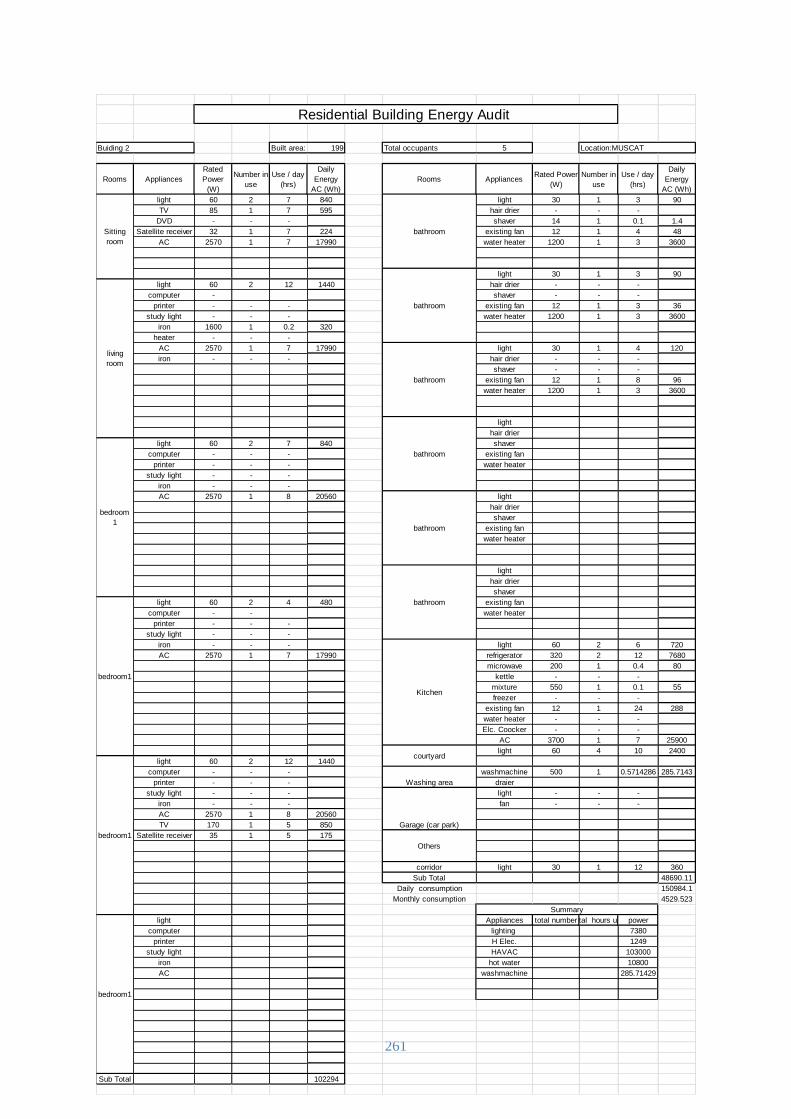
261
Built area: 199 Total occupants 5
Rooms Appliances
Rated
Power
(W)
Number in
use
Use / day
(hrs)
Daily
Energy
AC (Wh)
Rooms AppliancesRated Power
(W)
Number in
use
Use / day
(hrs)
Daily
Energy
AC (Wh)
light 60 2 7 840 light 30 1 3 90
TV 85 1 7 595 hair drier - - -
DVD - - - shaver 14 1 0.1 1.4
Satellite receiver 32 1 7 224 existing fan 12 1 4 48
AC 2570 1 7 17990 water heater 1200 1 3 3600
light 30 1 3 90
light 60 2 12 1440 hair drier - - -
computer - shaver - - -
printer - - - existing fan 12 1 3 36
study light - - - water heater 1200 1 3 3600
iron 1600 1 0.2 320
heater - - -
AC 2570 1 7 17990 light 30 1 4 120
iron - - - hair drier - - -
shaver - - -
existing fan 12 1 8 96
water heater 1200 1 3 3600
light
hair drier
light 60 2 7 840 shaver
computer - - - existing fan
printer - - - water heater
study light - - -
iron - - -
AC 2570 1 8 20560 light
hair drier
shaver
existing fan
water heater
light
hair drier
shaver
light 60 2 4 480 existing fan
computer - - water heater
printer - - -
study light - - -
iron - - - light 60 2 6 720
AC 2570 1 7 17990 refrigerator 320 2 12 7680
microwave 200 1 0.4 80
kettle - - -
mixture 550 1 0.1 55
freezer - - -
existing fan 12 1 24 288
water heater - - -
Elc. Coocker - - -
AC 3700 1 7 25900
light 60 4 10 2400
light 60 2 12 1440
computer - - - washmachine 500 1 0.5714286 285.7143
printer - - - draier
study light - - - light - - -
iron - - - fan - - -
AC 2570 1 8 20560
TV 170 1 5 850
Satellite receiver 35 1 5 175
corridor light 30 1 12 360
Sub Total 48690.11
Daily consumption 150984.1
Monthly consumption 4529.523
light Appliances total numbertotal hours use power
computer lighting 7380
printer H Elec. 1249
study light HAVAC 103000
iron hot water 10800
AC washmachine 285.71429
Sub Total 102294
bathroom
Washing area
bedroom
1
Others
Residential Building Energy Audit
Buiding 2 Location:MUSCAT
Sitting
room
bathroom
bathroom
living
room
Garage (car park)
bathroom
Summary
bedroom1
bathroom
bathroom
bedroom1
Kitchen
courtyard
bedroom1
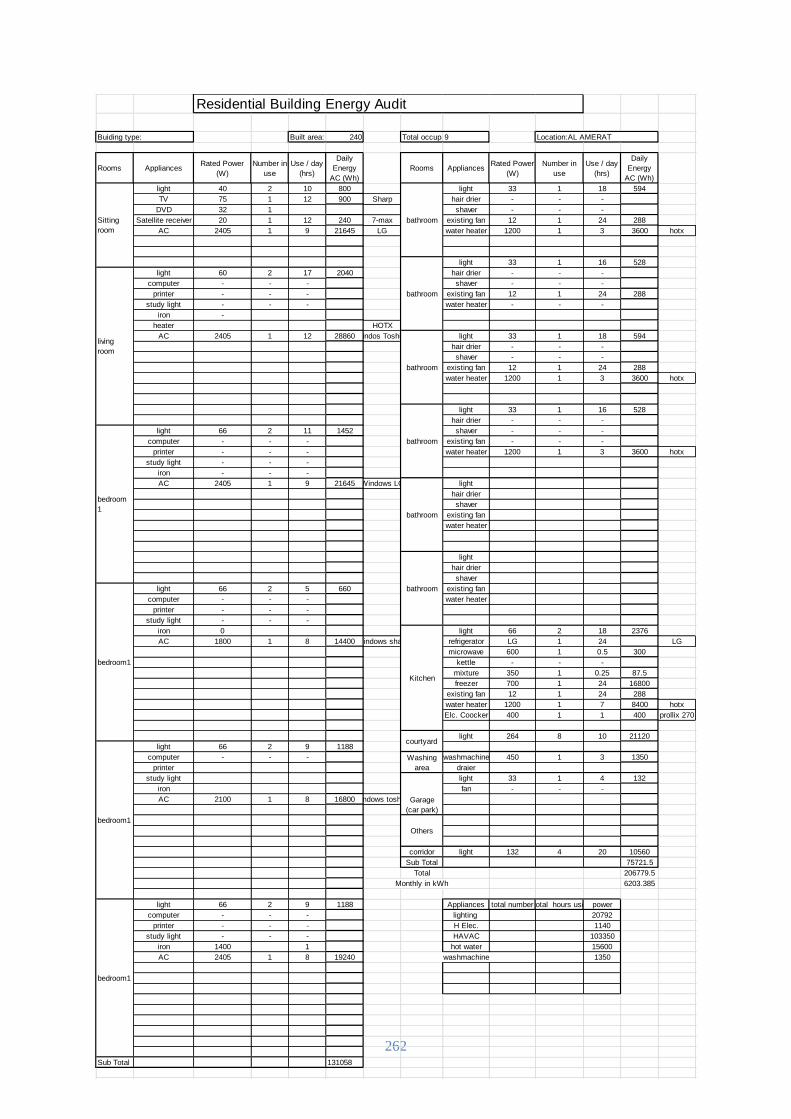
262
Built area: 240 Total occupants9
Rooms AppliancesRated Power
(W)
Number in
use
Use / day
(hrs)
Daily
Energy
AC (Wh)
Rooms AppliancesRated Power
(W)
Number in
use
Use / day
(hrs)
Daily
Energy
AC (Wh)
light 40 2 10 800 light 33 1 18 594
TV 75 1 12 900 Sharp hair drier - - -
DVD 32 1 shaver - - -
Satellite receiver 20 1 12 240 7-max existing fan 12 1 24 288
AC 2405 1 9 21645 LG water heater 1200 1 3 3600 hotx
light 33 1 16 528
light 60 2 17 2040 hair drier - - -
computer - - - shaver - - -
printer - - - existing fan 12 1 24 288
study light - - - water heater - - -
iron -
heater HOTX
AC 2405 1 12 28860Windos Toshipa light 33 1 18 594
hair drier - - -
shaver - - -
existing fan 12 1 24 288
water heater 1200 1 3 3600 hotx
light 33 1 16 528
hair drier - - -
light 66 2 11 1452 shaver - - -
computer - - - existing fan - - -
printer - - - water heater 1200 1 3 3600 hotx
study light - - -
iron - - -
AC 2405 1 9 21645 Windows LG light
hair drier
shaver
existing fan
water heater
light
hair drier
shaver
light 66 2 5 660 existing fan
computer - - - water heater
printer - - -
study light - - -
iron 0 light 66 2 18 2376
AC 1800 1 8 14400 Windows sharp refrigerator LG 1 24 LG
microwave 600 1 0.5 300
kettle - - -
mixture 350 1 0.25 87.5
freezer 700 1 24 16800
existing fan 12 1 24 288
water heater 1200 1 7 8400 hotx
Elc. Coocker 400 1 1 400 prollix 270
light 264 8 10 21120
light 66 2 9 1188
computer - - - washmachine 450 1 3 1350
printer draier
study light light 33 1 4 132
iron fan - - -
AC 2100 1 8 16800Windows toshipa
corridor light 132 4 20 10560
Sub Total 75721.5
Total 206779.5
Monthly in kWh 6203.385
light 66 2 9 1188 Appliances total numbertotal hours use power
computer - - - lighting 20792
printer - - - H Elec. 1140
study light - - - HAVAC 103350
iron 1400 1 hot water 15600
AC 2405 1 8 19240 washmachine 1350
Sub Total 131058
bedroom1
Washing
area
Garage
(car park)
Others
Residential Building Energy Audit
Buiding type: Location:AL AMERAT
Sitting
room
bathroom
bathroom
living
room
bathroom
bathroom
bedroom
1
bedroom1
bathroom
bathroom
bedroom1
Kitchen
courtyard
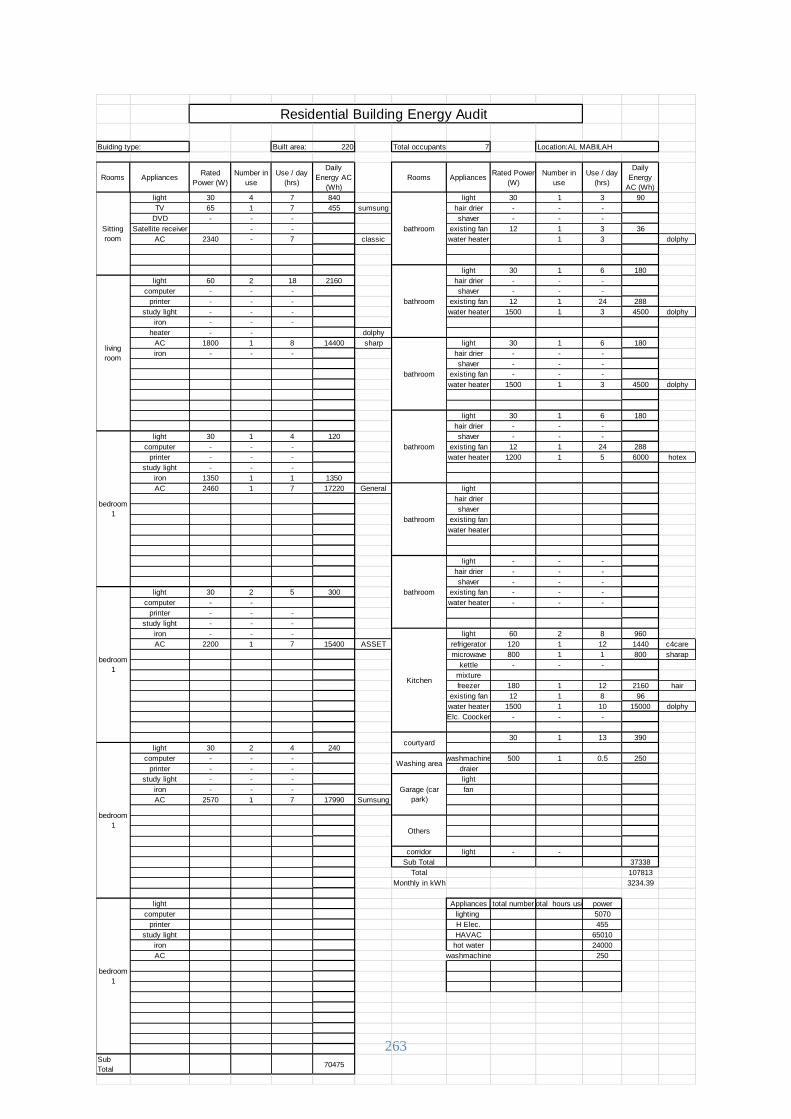
263
Built area: 220 Total occupants 7
Rooms AppliancesRated
Power (W)
Number in
use
Use / day
(hrs)
Daily
Energy AC
(Wh)
Rooms AppliancesRated Power
(W)
Number in
use
Use / day
(hrs)
Daily
Energy
AC (Wh)
light 30 4 7 840 light 30 1 3 90
TV 65 1 7 455 sumsung hair drier - - -
DVD - - - shaver - - -
Satellite receiver - - existing fan 12 1 3 36
AC 2340 - 7 classic water heater 1 3 dolphy
light 30 1 6 180
light 60 2 18 2160 hair drier - - -
computer - - - shaver - - -
printer - - - existing fan 12 1 24 288
study light - - - water heater 1500 1 3 4500 dolphy
iron - - -
heater - - dolphy
AC 1800 1 8 14400 sharp light 30 1 6 180
iron - - - hair drier - - -
shaver - - -
existing fan - - -
water heater 1500 1 3 4500 dolphy
light 30 1 6 180
hair drier - - -
light 30 1 4 120 shaver - - -
computer - - - existing fan 12 1 24 288
printer - - - water heater 1200 1 5 6000 hotex
study light - - -
iron 1350 1 1 1350
AC 2460 1 7 17220 General light
hair drier
shaver
existing fan
water heater
light - - -
hair drier - - -
shaver - - -
light 30 2 5 300 existing fan - - -
computer - - water heater - - -
printer - - -
study light - - -
iron - - - light 60 2 8 960
AC 2200 1 7 15400 ASSET refrigerator 120 1 12 1440 c4care
microwave 800 1 1 800 sharap
kettle - - -
mixture
freezer 180 1 12 2160 hair
existing fan 12 1 8 96
water heater 1500 1 10 15000 dolphy
Elc. Coocker - - -
30 1 13 390
light 30 2 4 240
computer - - - washmachine 500 1 0.5 250
printer - - - draier
study light - - - light
iron - - - fan
AC 2570 1 7 17990 Sumsung
corridor light - -
Sub Total 37338
Total 107813
Monthly in kWh 3234.39
light Appliances total numbertotal hours use power
computer lighting 5070
printer H Elec. 455
study light HAVAC 65010
iron hot water 24000
AC washmachine 250
Sub
Total70475
Residential Building Energy Audit
Buiding type: Location:AL MABILAH
Sitting
room
bathroom
bathroom
living
room
bathroom
bathroom
bedroom
1
bedroom
1
bathroom
bathroom
bedroom
1
Kitchen
courtyard
bedroom
1
Washing area
Garage (car
park)
Others
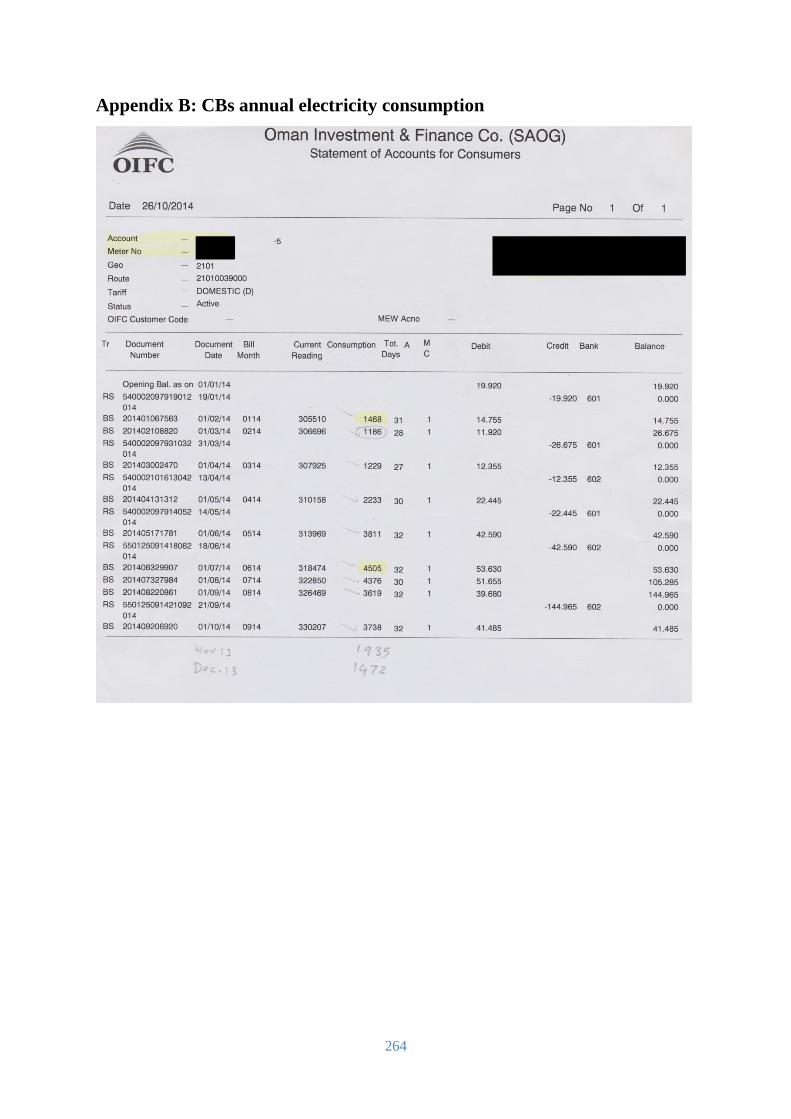
264
Appendix B: CBs annual electricity consumption
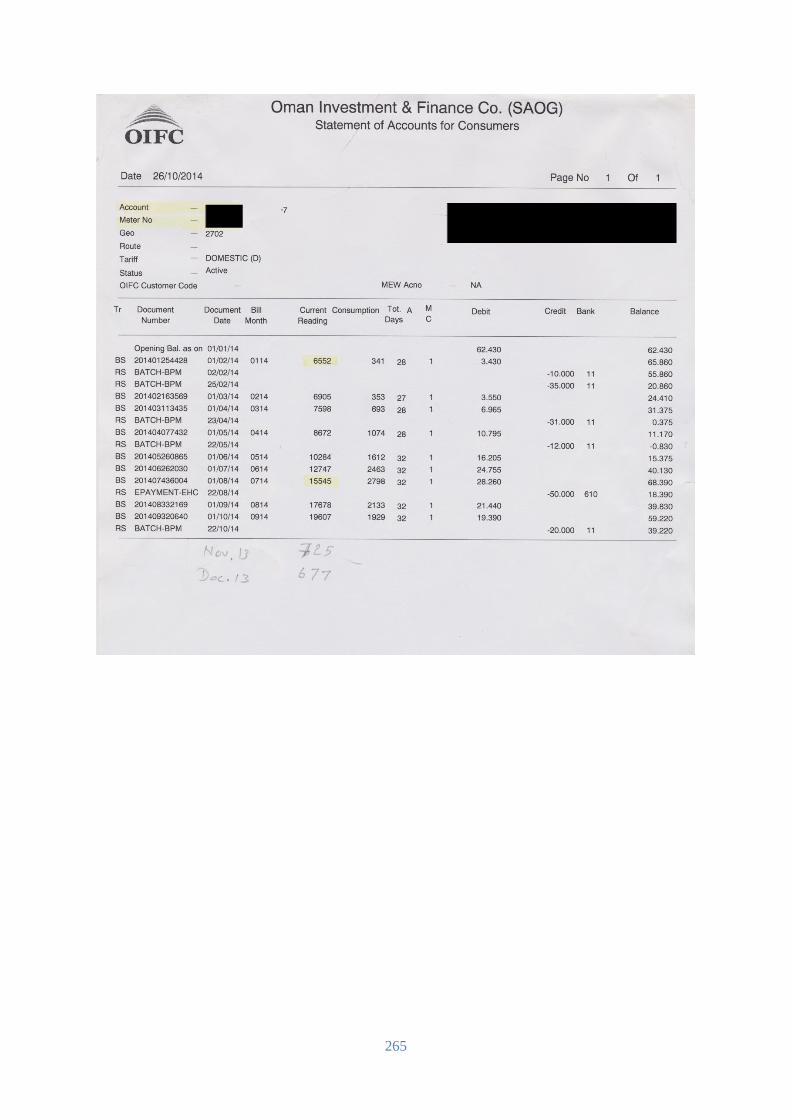
265
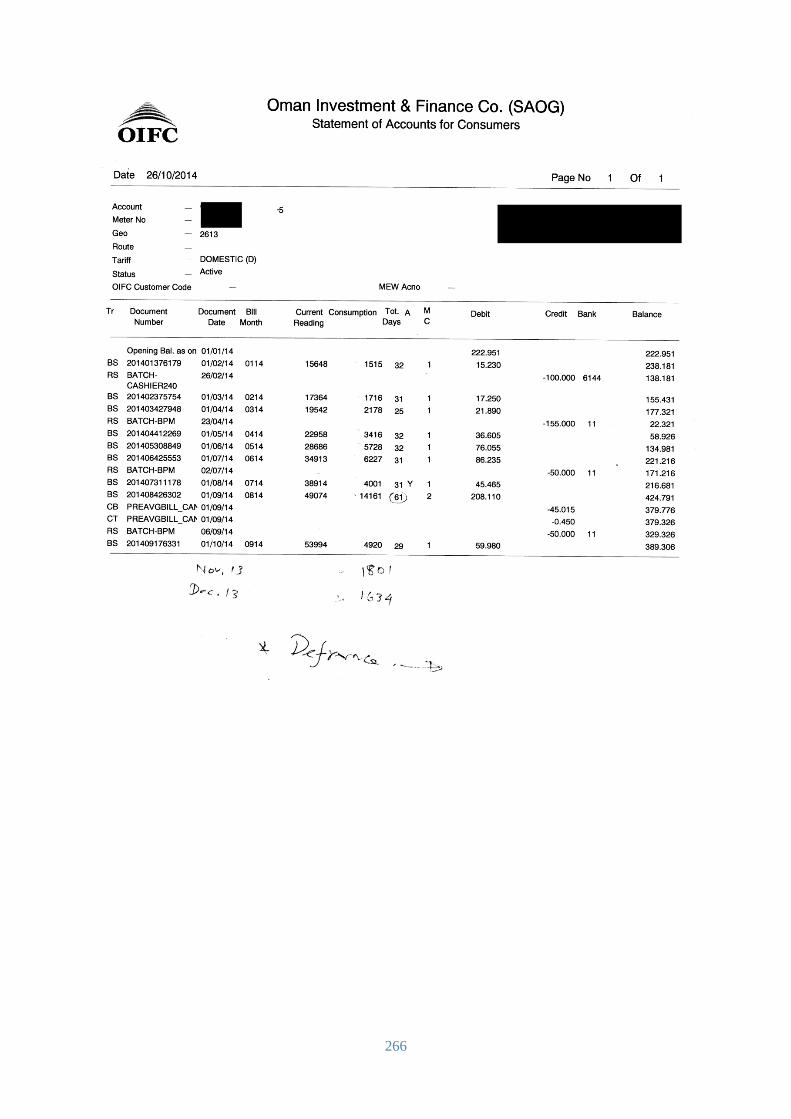
266
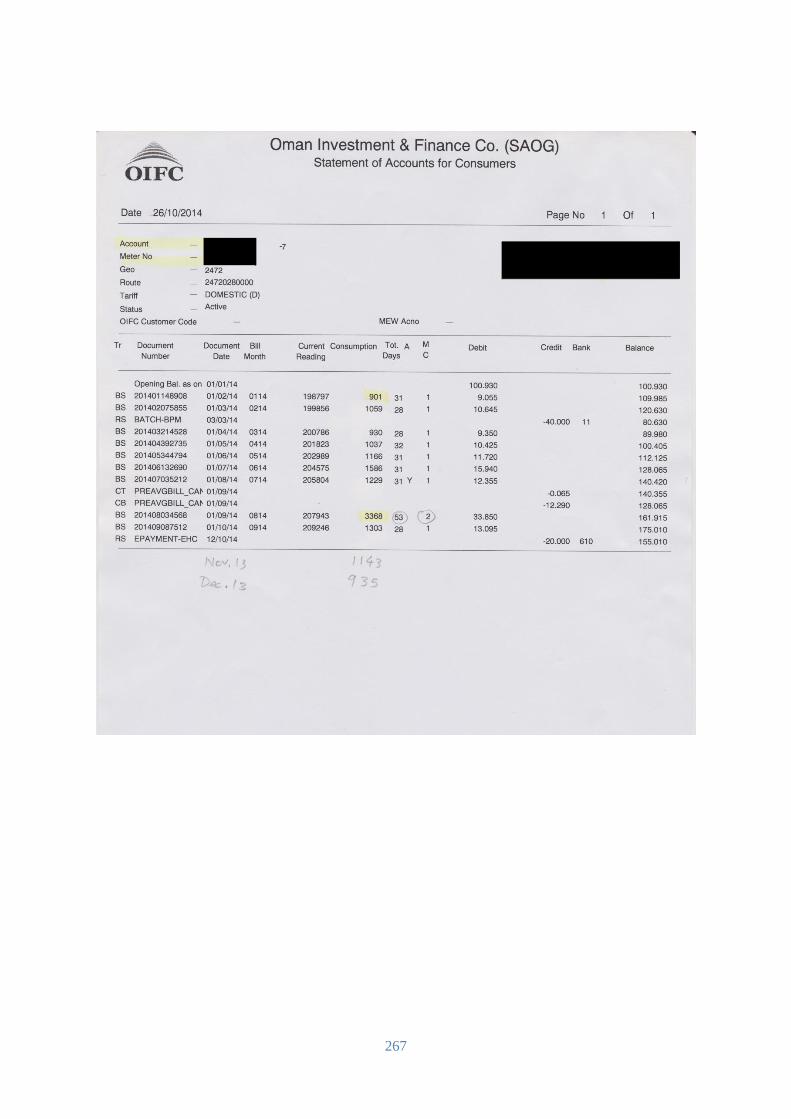
267
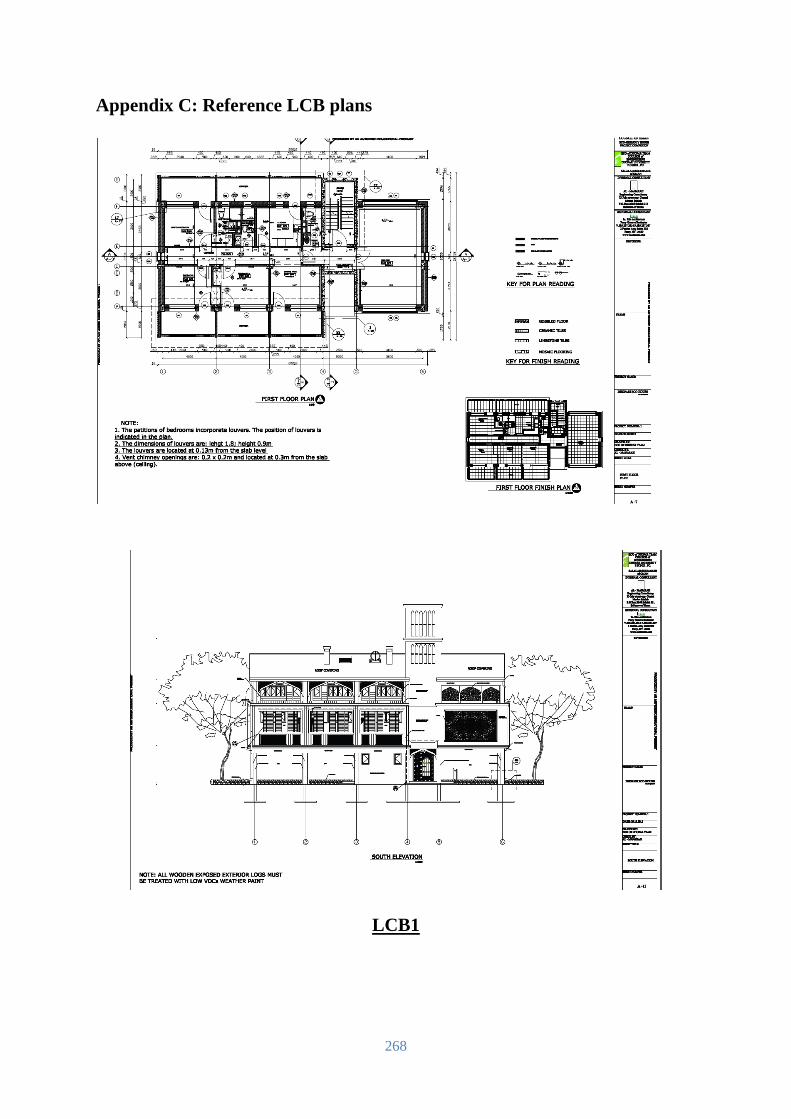
268
Appendix C: Reference LCB plans
LCB1
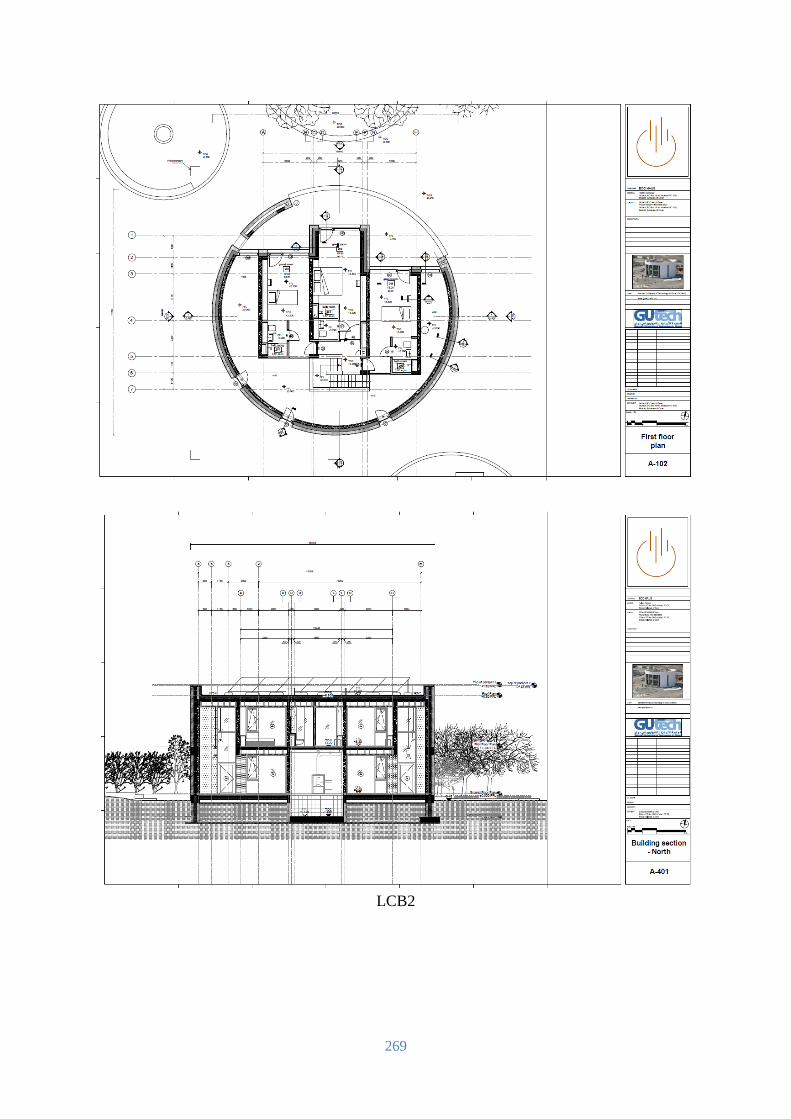
269
LCB2
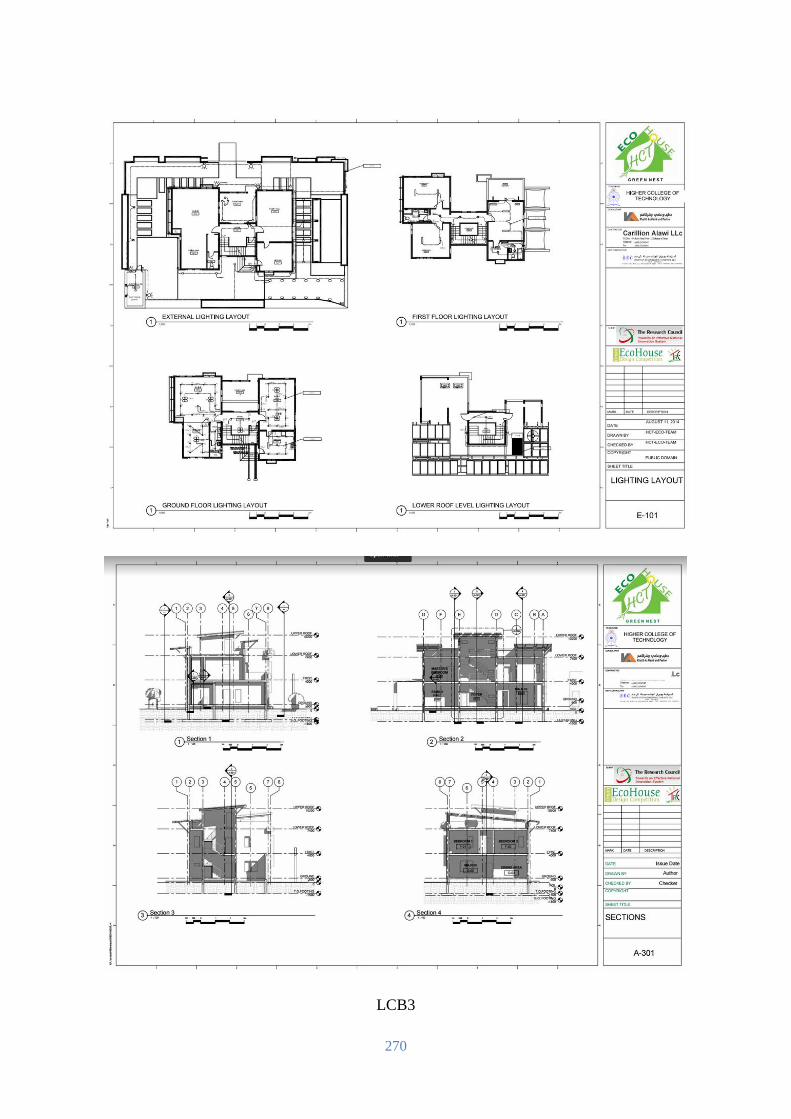
270
LCB3
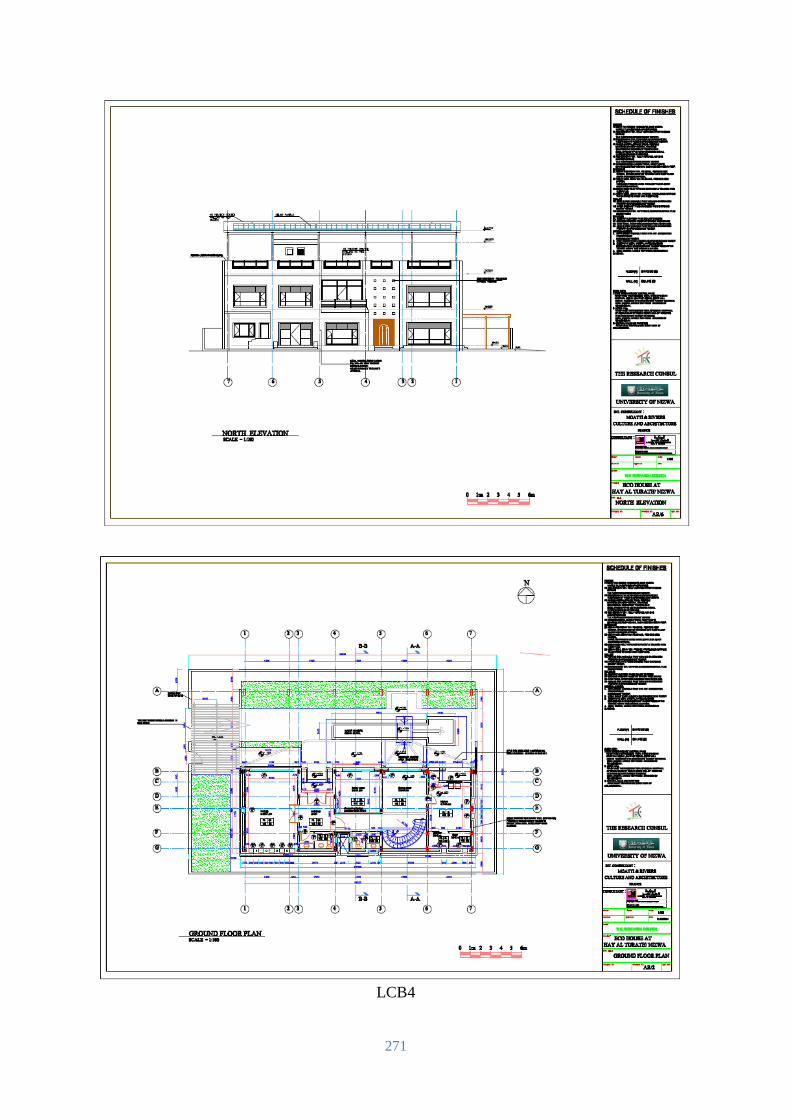
271
LCB4
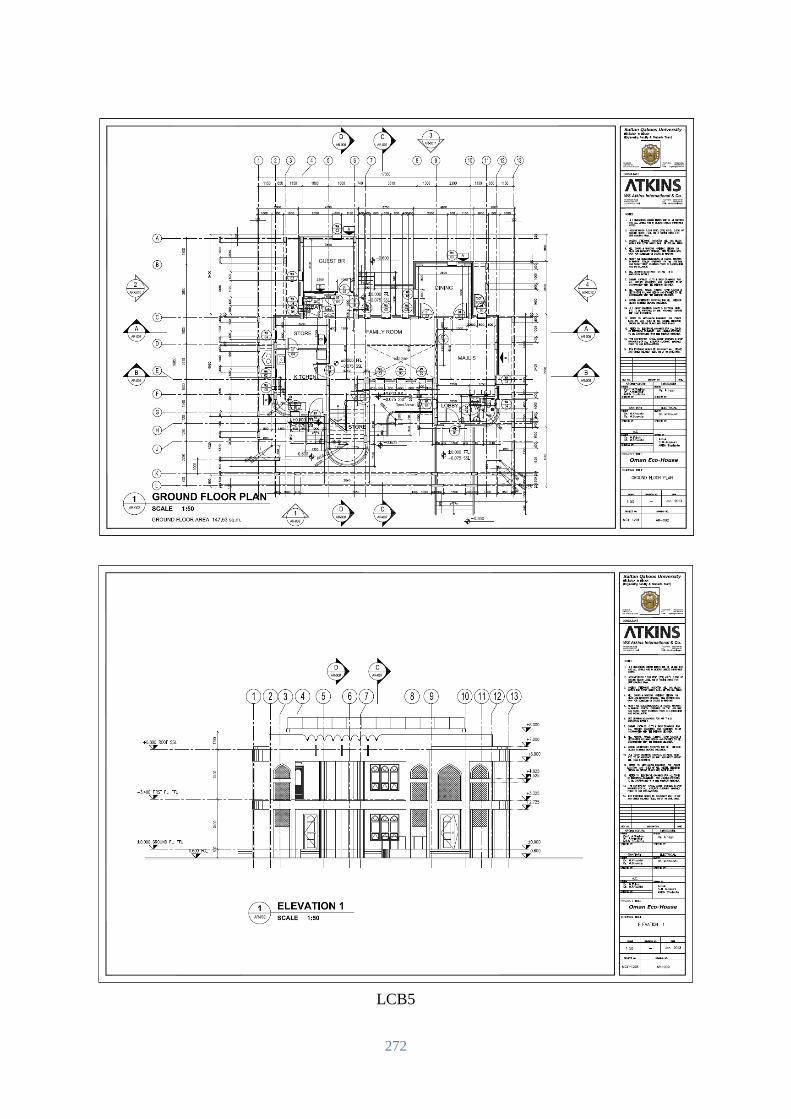
272
LCB5
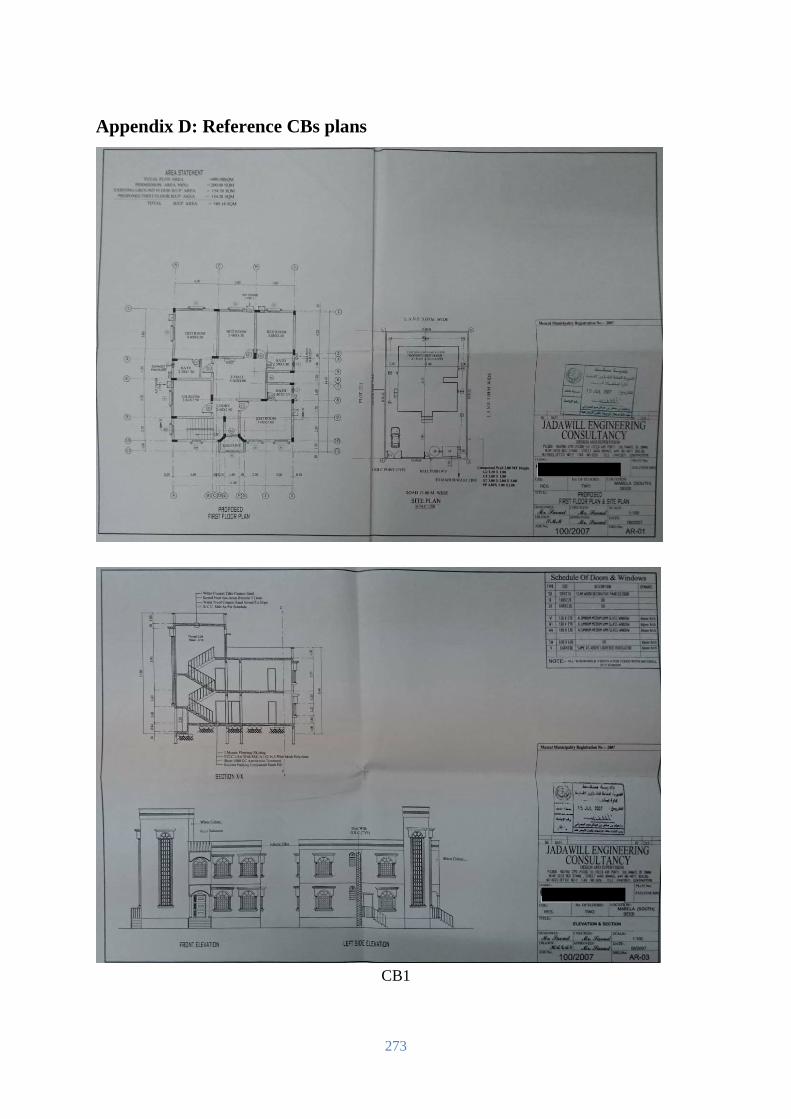
273
Appendix D: Reference CBs plans
CB1
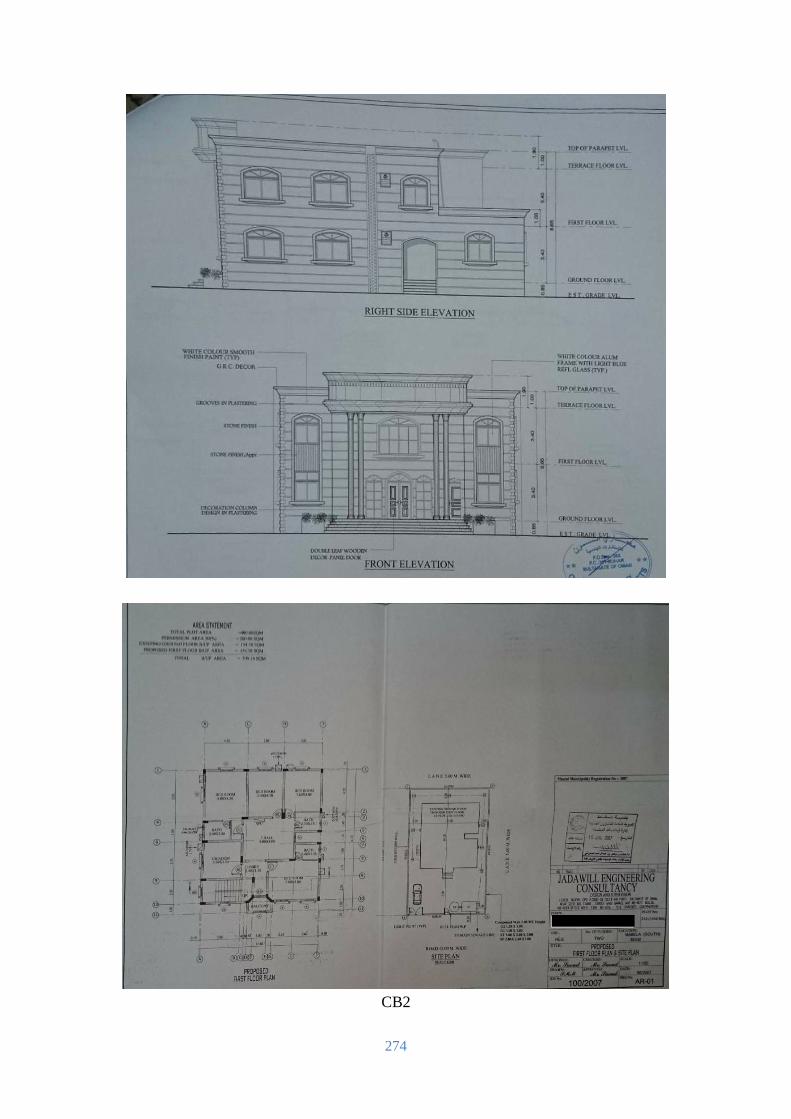
274
CB2
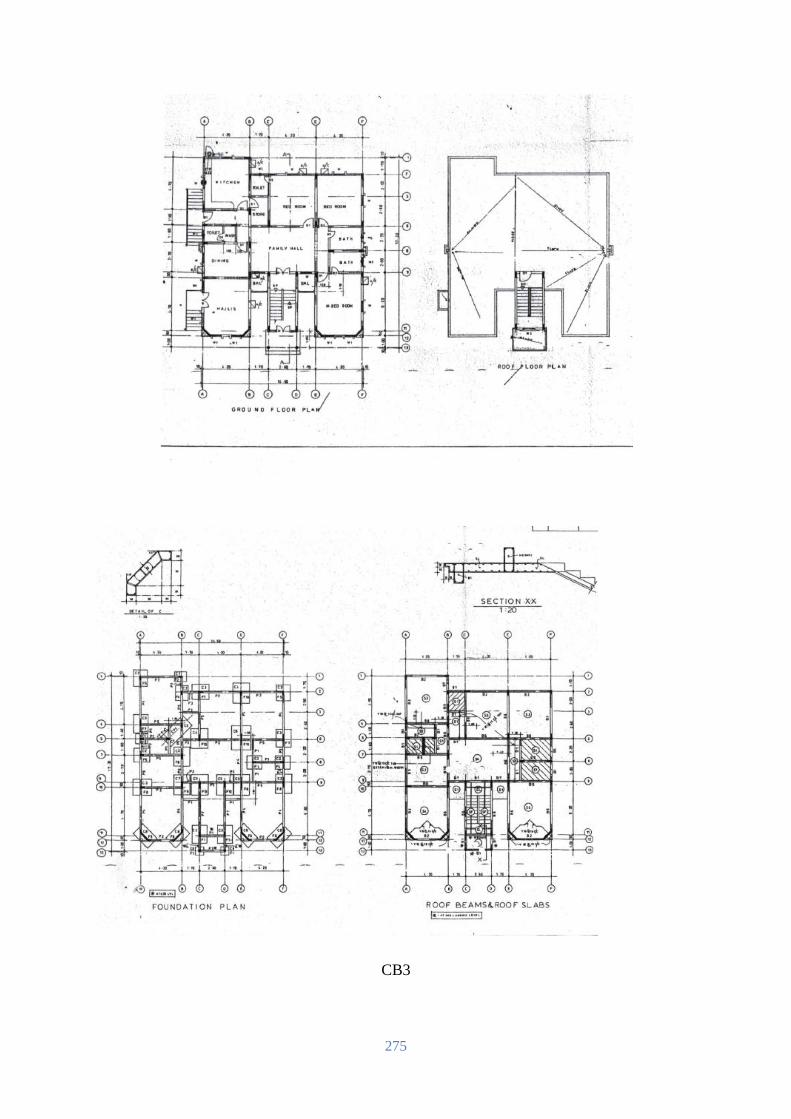
275
CB3
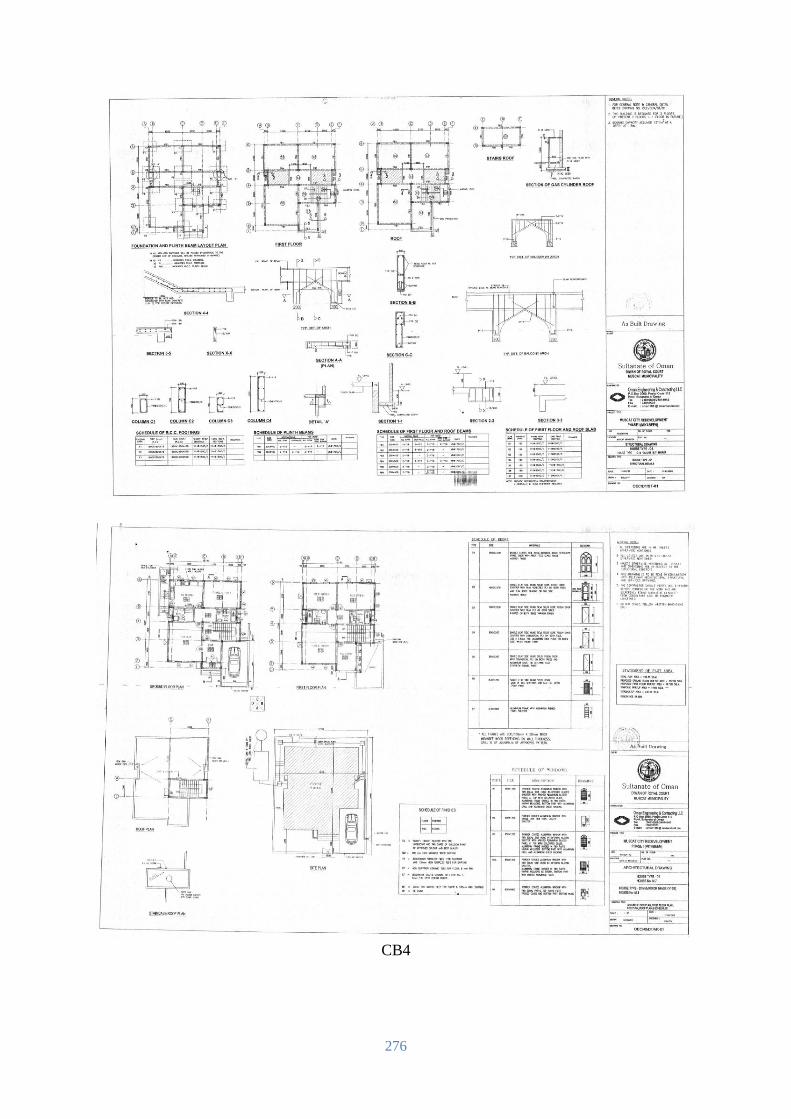
276
CB4
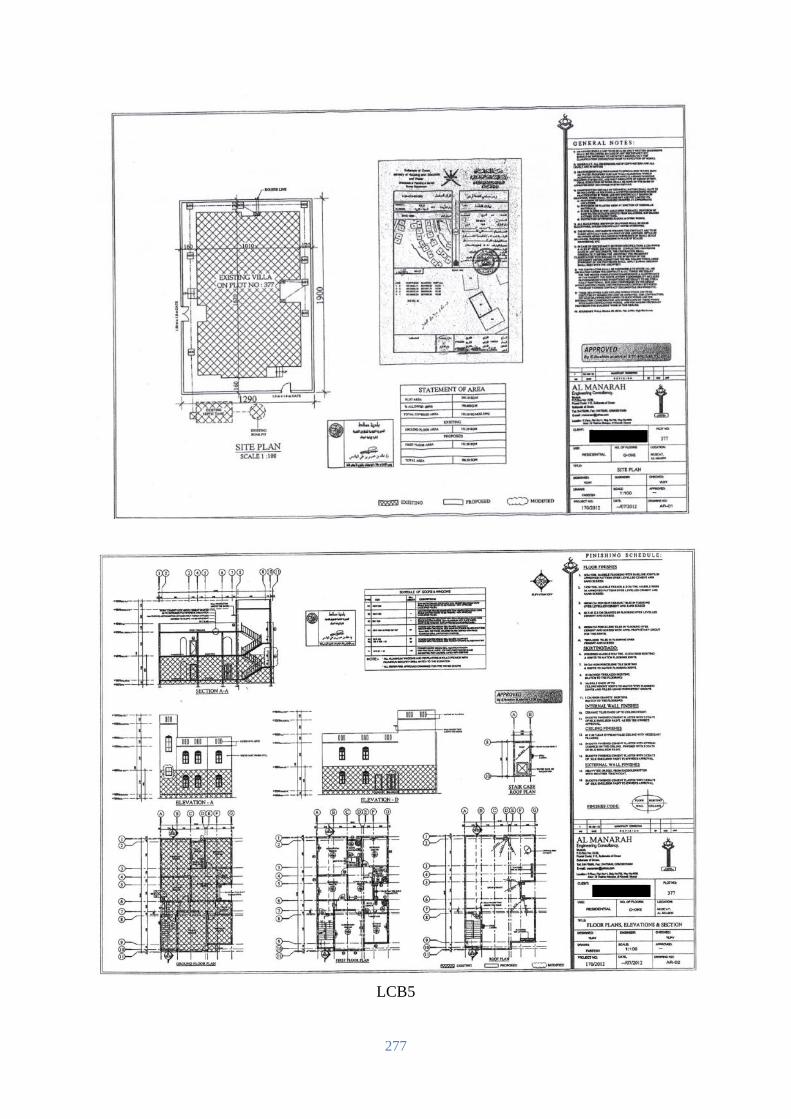
277
LCB5
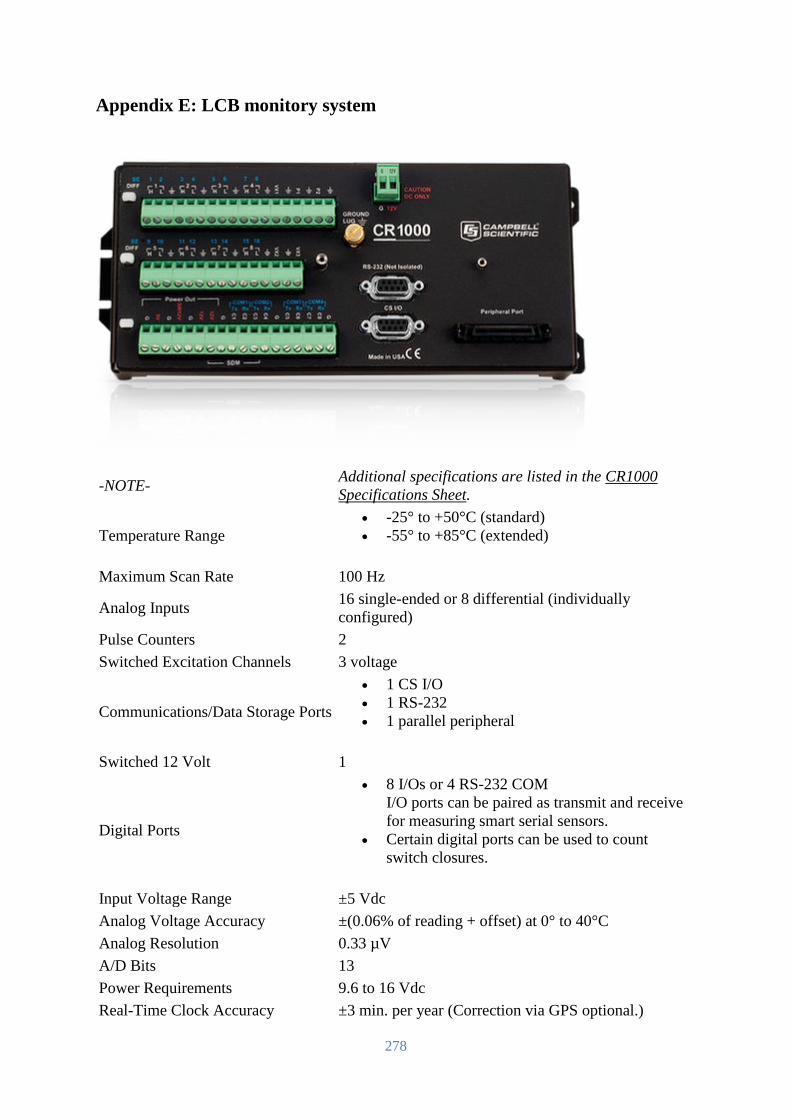
278
Appendix E: LCB monitory system
-NOTE- Additional specifications are listed in the CR1000
Specifications Sheet.
Temperature Range
-25° to +50°C (standard)
-55° to +85°C (extended)
Maximum Scan Rate 100 Hz
Analog Inputs 16 single-ended or 8 differential (individually
configured)
Pulse Counters 2
Switched Excitation Channels 3 voltage
Communications/Data Storage Ports
1 CS I/O
1 RS-232
1 parallel peripheral
Switched 12 Volt 1
Digital Ports
8 I/Os or 4 RS-232 COM
I/O ports can be paired as transmit and receive
for measuring smart serial sensors.
Certain digital ports can be used to count
switch closures.
Input Voltage Range ±5 Vdc
Analog Voltage Accuracy ±(0.06% of reading + offset) at 0° to 40°C
Analog Resolution 0.33 µV
A/D Bits 13
Power Requirements 9.6 to 16 Vdc
Real-Time Clock Accuracy ±3 min. per year (Correction via GPS optional.)
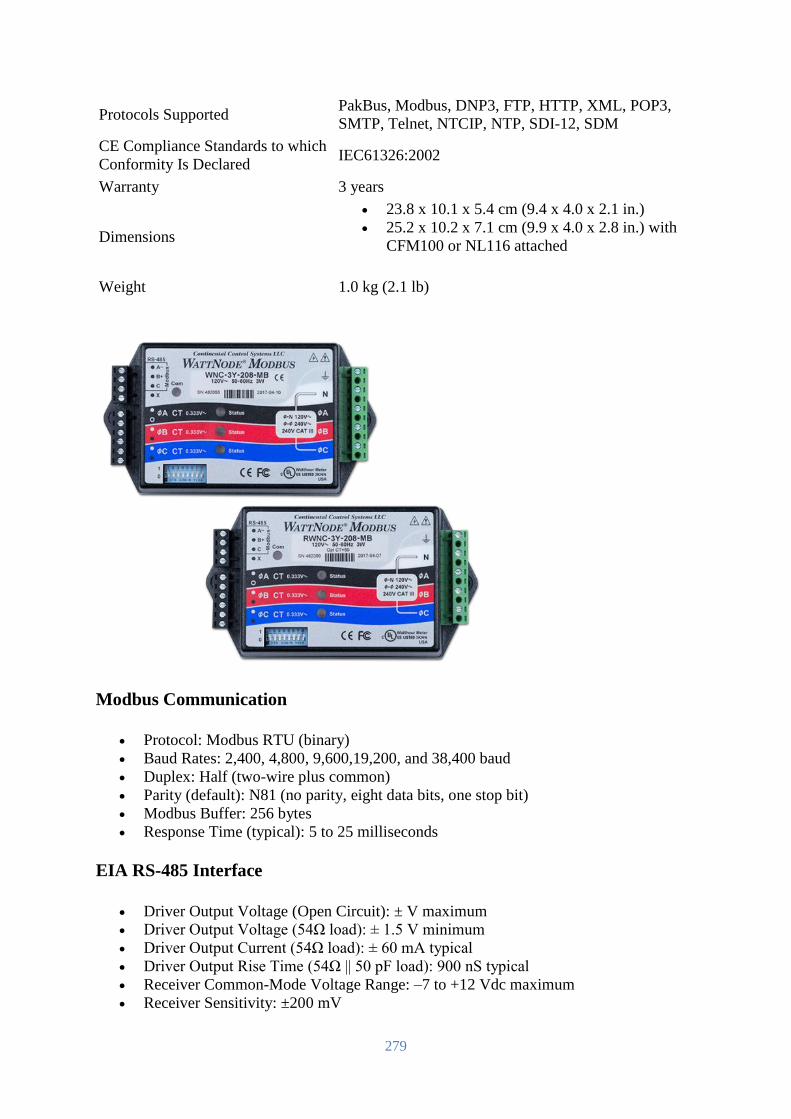
279
Protocols Supported PakBus, Modbus, DNP3, FTP, HTTP, XML, POP3,
SMTP, Telnet, NTCIP, NTP, SDI-12, SDM
CE Compliance Standards to which
Conformity Is Declared IEC61326:2002
Warranty 3 years
Dimensions
23.8 x 10.1 x 5.4 cm (9.4 x 4.0 x 2.1 in.)
25.2 x 10.2 x 7.1 cm (9.9 x 4.0 x 2.8 in.) with
CFM100 or NL116 attached
Weight 1.0 kg (2.1 lb)
Modbus Communication
Protocol: Modbus RTU (binary)
Baud Rates: 2,400, 4,800, 9,600,19,200, and 38,400 baud
Duplex: Half (two-wire plus common)
Parity (default): N81 (no parity, eight data bits, one stop bit)
Modbus Buffer: 256 bytes
Response Time (typical): 5 to 25 milliseconds
EIA RS-485 Interface
Driver Output Voltage (Open Circuit): ± V maximum
Driver Output Voltage (54Ω load): ± 1.5 V minimum
Driver Output Current (54Ω load): ± 60 mA typical
Driver Output Rise Time (54Ω || 50 pF load): 900 nS typical
Receiver Common-Mode Voltage Range: –7 to +12 Vdc maximum
Receiver Sensitivity: ±200 mV
280
Receiver Bus Load: 1/8 unit load
Electrical
Line powered
Operating Voltage Range: –20% to +15% of nominal
Power Line Frequency: 50 or 60 Hz
CT Input: 0.333 Vac nominal, 0 to 0.5 Vac operating, 3 Vac maximum
Measurement Configurations
Models available for:
Single phase: two or three wire
Three phase: four wire wye
Three phase: three wire delta
Three phase: four wire delta
Accuracy
WattNode Modbus
0.5% nominal (see manual for details)
WattNode Revenue Modbus
0.5% nominal (see manual for details)
Meets the accuracy requirements of the ANSI C12.1 standard when used with CCS
CTs rated for IEEE C57.13 class 0.6 accuracy (see Revenue Grade CTs).
Models RWNC-3Y-208-MB, RWNC-3D-240-MB and RWNC-3Y-480-MB are
certified by MET Laboratories to meet ANSI C12.1. MET Labs is a nationally
recognized testing laboratory (NRTL).
Regulatory
FCC Class B, EN 55022 Class B
UL and cUL Listed (UL 61010-1), file number E312220
CE Mark and RoHS Declaration of Conformity
Immunity: EN 61326: 2002 (Industrial Locations)
Environmental
Operating Temperature: –30°C to +55°C (–22°F to +131°F)
Altitude: Up to 2000 m (6560 ft)
Operating Humidity: 5 to 90% relative humidity (RH) up to 40°C, decreasing linearly
to 50% RH at 55°C.
Pollution: POLLUTION DEGREE 2 – Normally only non-conductive pollution;
occasionally, a temporary conductivity caused by condensation must be expected.
Indoor Use: Suitable for indoor use.
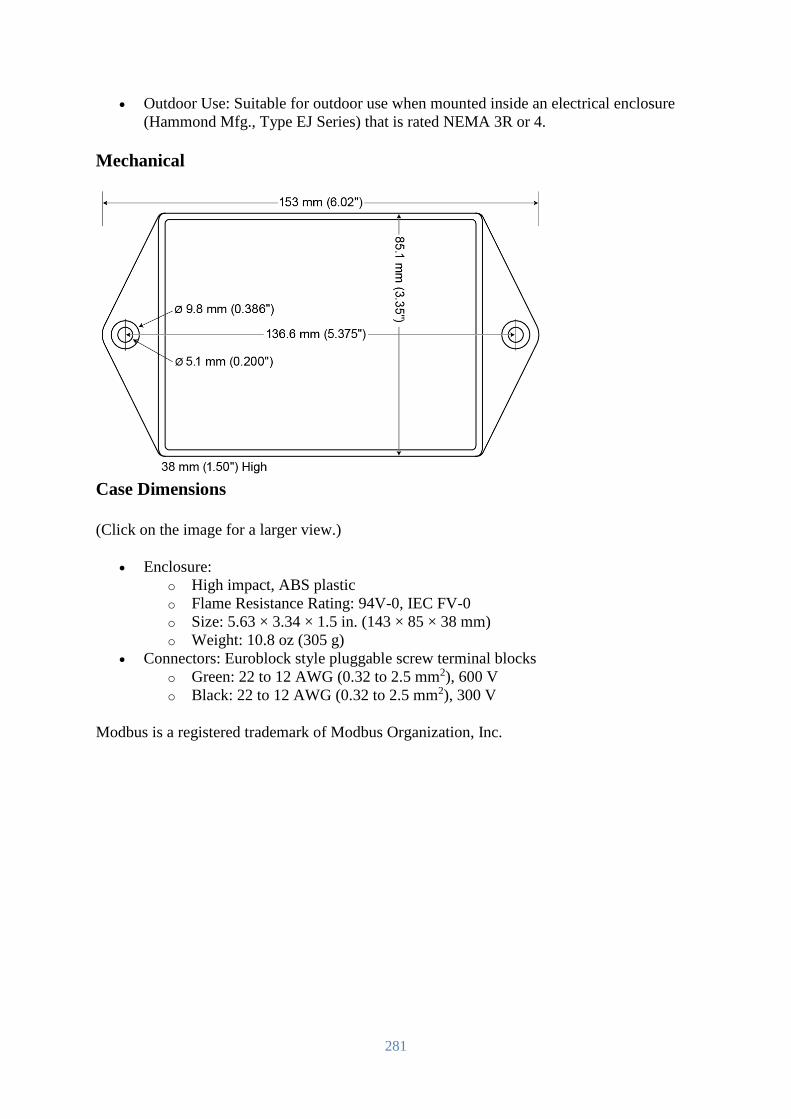
281
Outdoor Use: Suitable for outdoor use when mounted inside an electrical enclosure
(Hammond Mfg., Type EJ Series) that is rated NEMA 3R or 4.
Mechanical
Case Dimensions
(Click on the image for a larger view.)
Enclosure:
o High impact, ABS plastic
o Flame Resistance Rating: 94V-0, IEC FV-0
o Size: 5.63 × 3.34 × 1.5 in. (143 × 85 × 38 mm)
o Weight: 10.8 oz (305 g)
Connectors: Euroblock style pluggable screw terminal blocks
o Green: 22 to 12 AWG (0.32 to 2.5 mm2), 600 V
o Black: 22 to 12 AWG (0.32 to 2.5 mm2), 300 V
Modbus is a registered trademark of Modbus Organization, Inc.
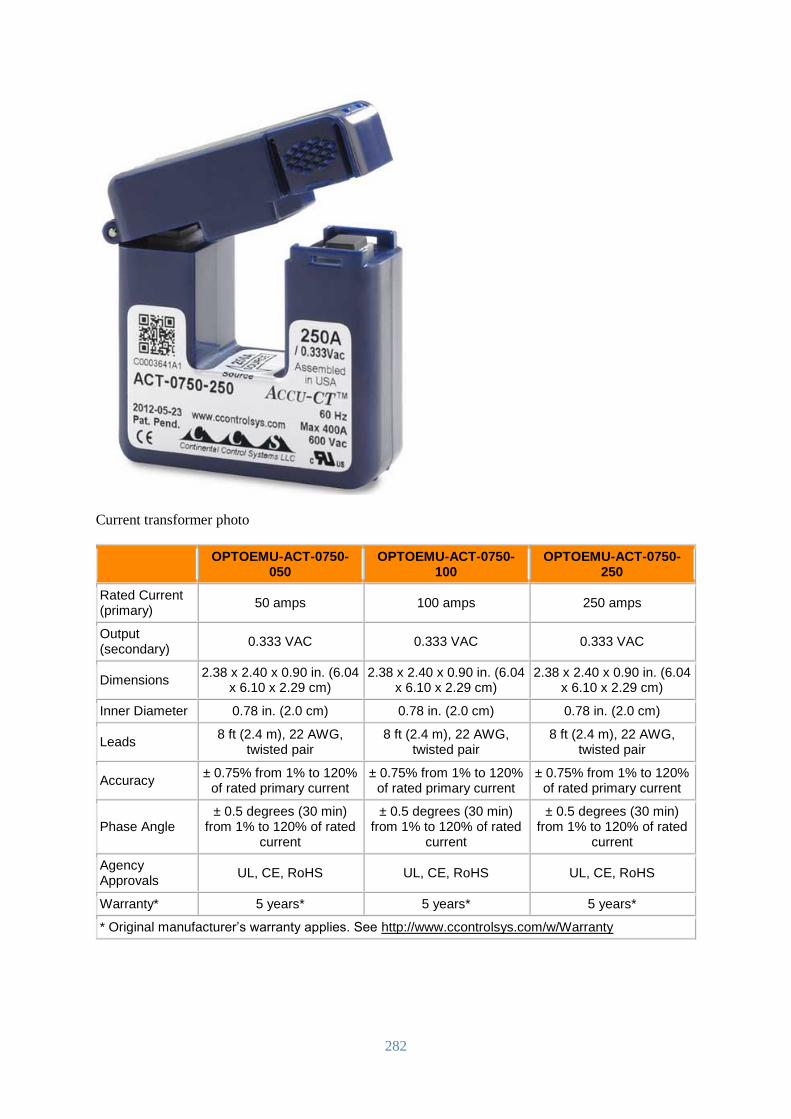
282
Current transformer photo
OPTOEMU-ACT-0750-
050 OPTOEMU-ACT-0750-
100 OPTOEMU-ACT-0750-
250
Rated Current (primary)
50 amps 100 amps 250 amps
Output (secondary)
0.333 VAC 0.333 VAC 0.333 VAC
Dimensions 2.38 x 2.40 x 0.90 in. (6.04
x 6.10 x 2.29 cm) 2.38 x 2.40 x 0.90 in. (6.04
x 6.10 x 2.29 cm) 2.38 x 2.40 x 0.90 in. (6.04
x 6.10 x 2.29 cm)
Inner Diameter 0.78 in. (2.0 cm) 0.78 in. (2.0 cm) 0.78 in. (2.0 cm)
Leads 8 ft (2.4 m), 22 AWG,
twisted pair 8 ft (2.4 m), 22 AWG,
twisted pair 8 ft (2.4 m), 22 AWG,
twisted pair
Accuracy ± 0.75% from 1% to 120%
of rated primary current ± 0.75% from 1% to 120%
of rated primary current ± 0.75% from 1% to 120%
of rated primary current
Phase Angle ± 0.5 degrees (30 min)
from 1% to 120% of rated current
± 0.5 degrees (30 min) from 1% to 120% of rated
current
± 0.5 degrees (30 min) from 1% to 120% of rated
current
Agency Approvals
UL, CE, RoHS UL, CE, RoHS UL, CE, RoHS
Warranty* 5 years* 5 years* 5 years*
* Original manufacturer’s warranty applies. See http://www.ccontrolsys.com/w/Warranty
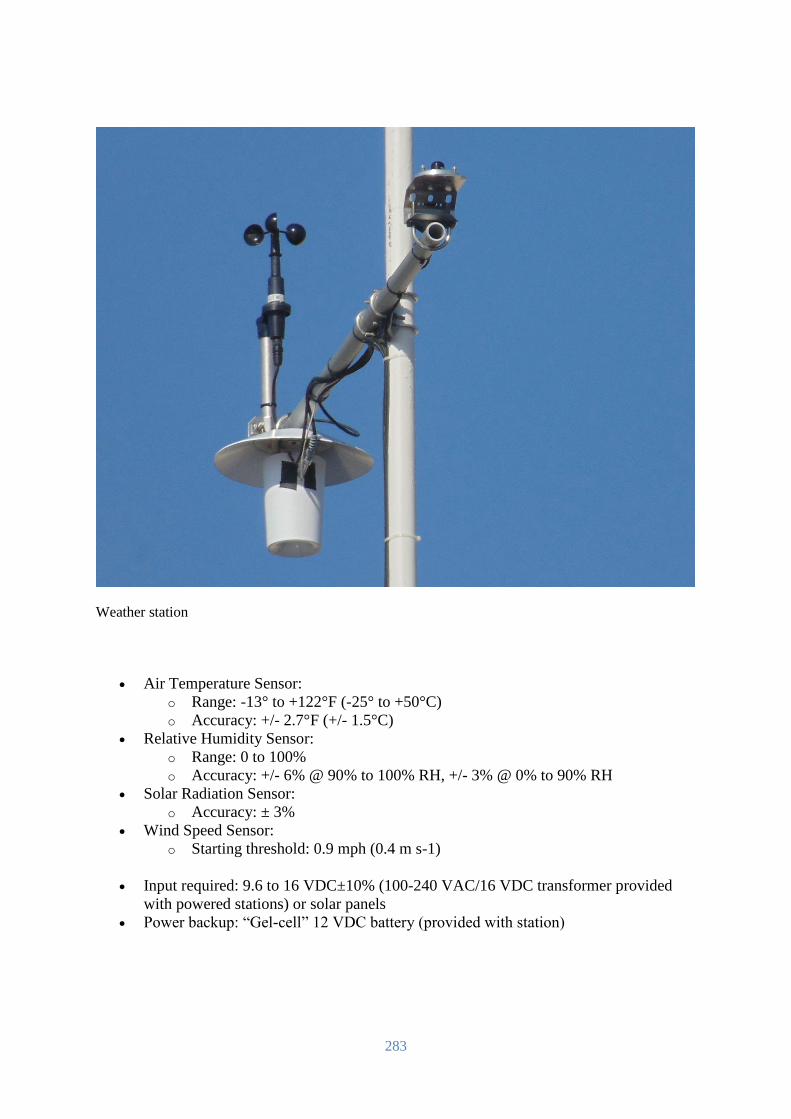
283
Weather station
Air Temperature Sensor:
o Range: -13° to +122°F (-25° to +50°C)
o Accuracy: +/- 2.7°F (+/- 1.5°C)
Relative Humidity Sensor:
o Range: 0 to 100%
o Accuracy: +/- 6% @ 90% to 100% RH, +/- 3% @ 0% to 90% RH
Solar Radiation Sensor:
o Accuracy: ± 3%
Wind Speed Sensor:
o Starting threshold: 0.9 mph (0.4 m s-1)
Input required: 9.6 to 16 VDC±10% (100-240 VAC/16 VDC transformer provided
with powered stations) or solar panels
Power backup: “Gel-cell” 12 VDC battery (provided with station)
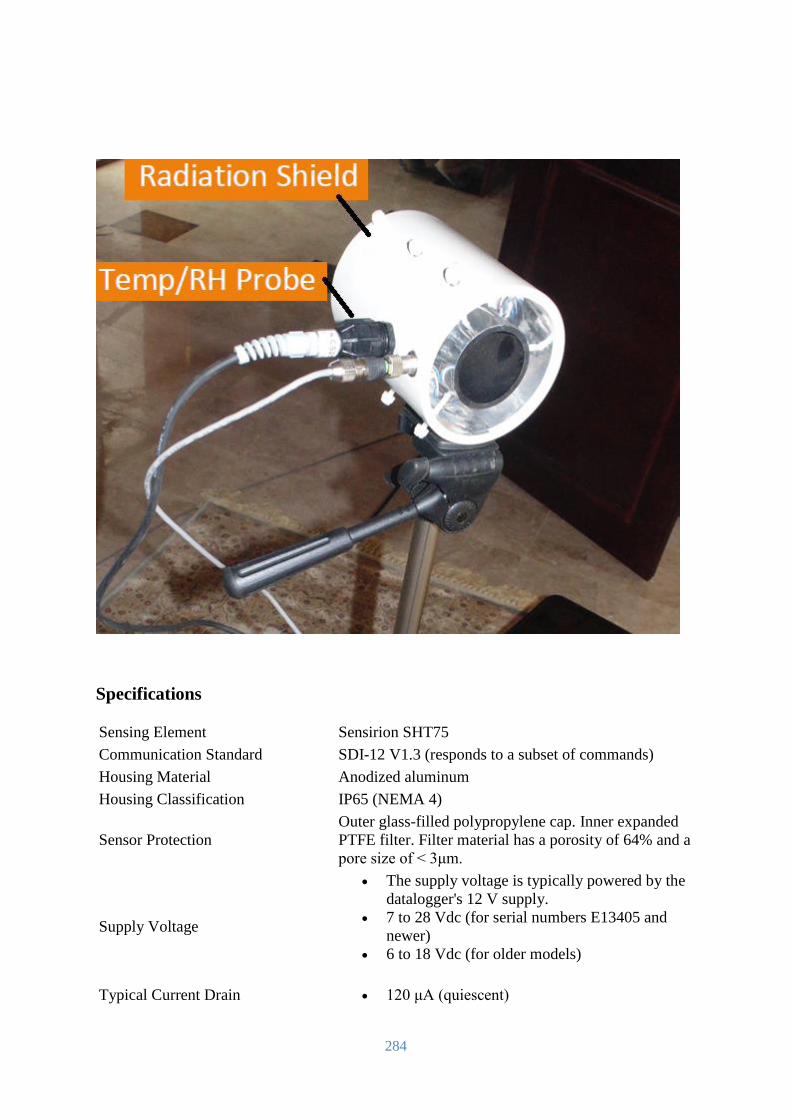
284
Specifications
Sensing Element Sensirion SHT75
Communication Standard SDI-12 V1.3 (responds to a subset of commands)
Housing Material Anodized aluminum
Housing Classification IP65 (NEMA 4)
Sensor Protection
Outer glass-filled polypropylene cap. Inner expanded
PTFE filter. Filter material has a porosity of 64% and a
pore size of < 3μm.
Supply Voltage
The supply voltage is typically powered by the
datalogger's 12 V supply.
7 to 28 Vdc (for serial numbers E13405 and
newer)
6 to 18 Vdc (for older models)
Typical Current Drain 120 μA (quiescent)
285
1.7 mA (measurement takes 0.7 s)
EMC Compliance Tested and conforms to IEC61326:2002.
Operating Temperature Range -40° to +70°C
Diameter
1.2 cm (0.5 in.) at sensor tip
1.8 cm (0.7 in.) at cable end
Length 18.0 cm (7.1 in.) including strain relief
Weight 150 g (5.3 oz) with 3.05-m (10-ft) cable
Relative Humidity
Measurement Range 0 to 100% RH (-20° to +60°C)
Output Resolution 0.03% RH
Accuracy
±2% (10% to 90% range) at 25°C
±4% (0% to 100% range) at 25°C
Short-Term Hysteresis < 1% RH
Temperature Dependence Better than ±2% (-20° to +60°C)
Typical Stability ±1.0% per year
Response Time with Filter < 20 s (63% response time in still air)
Calibration Traceability NIST and NPL standards
Air Temperature
Measurement Range -40° to +70°C
Output Resolution 0.01°C
Accuracy
±0.3°C (at 25°C)
±0.4°C (5° to 40°C)
±0.9°C (-40° to +70°C)
Response Time with Filter < 120 s
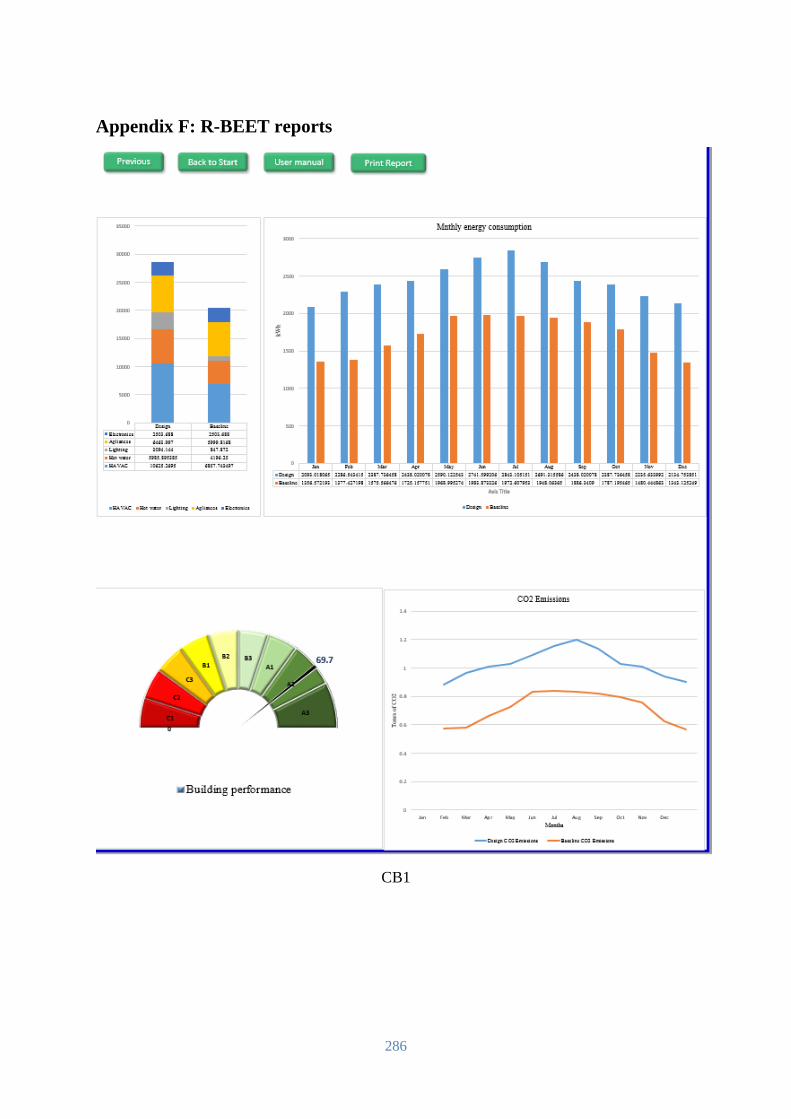
286
Appendix F: R-BEET reports
CB1
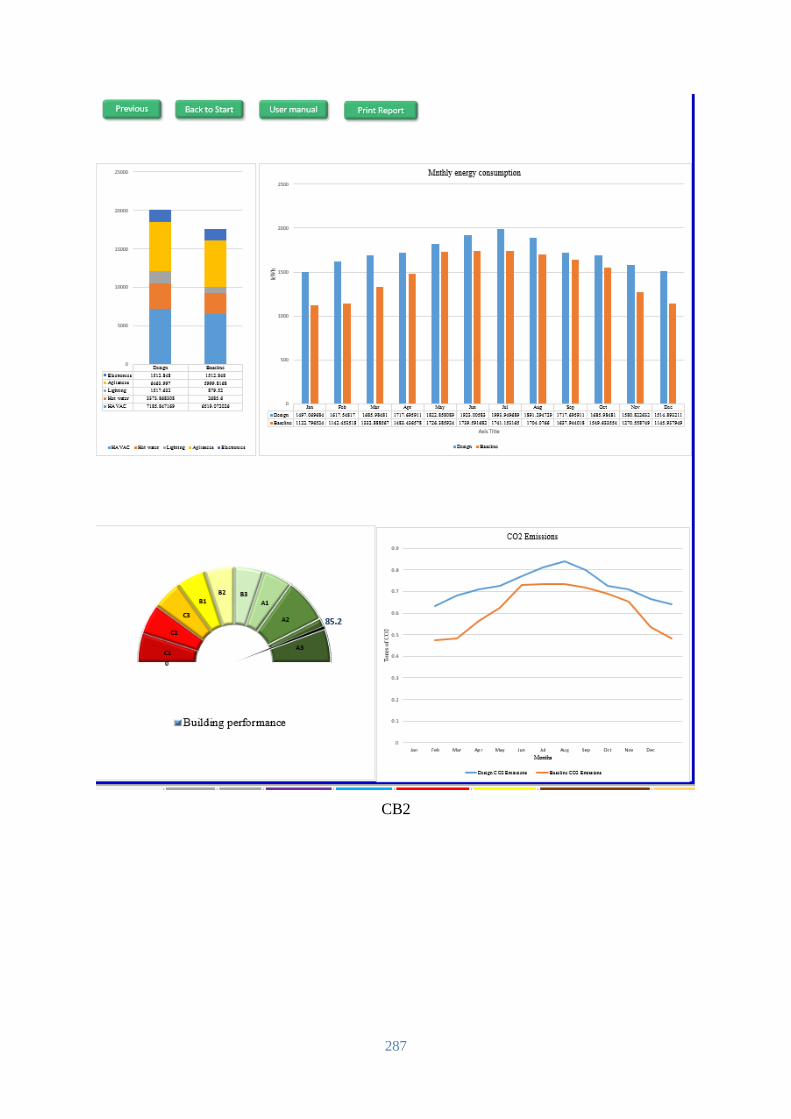
287
CB2
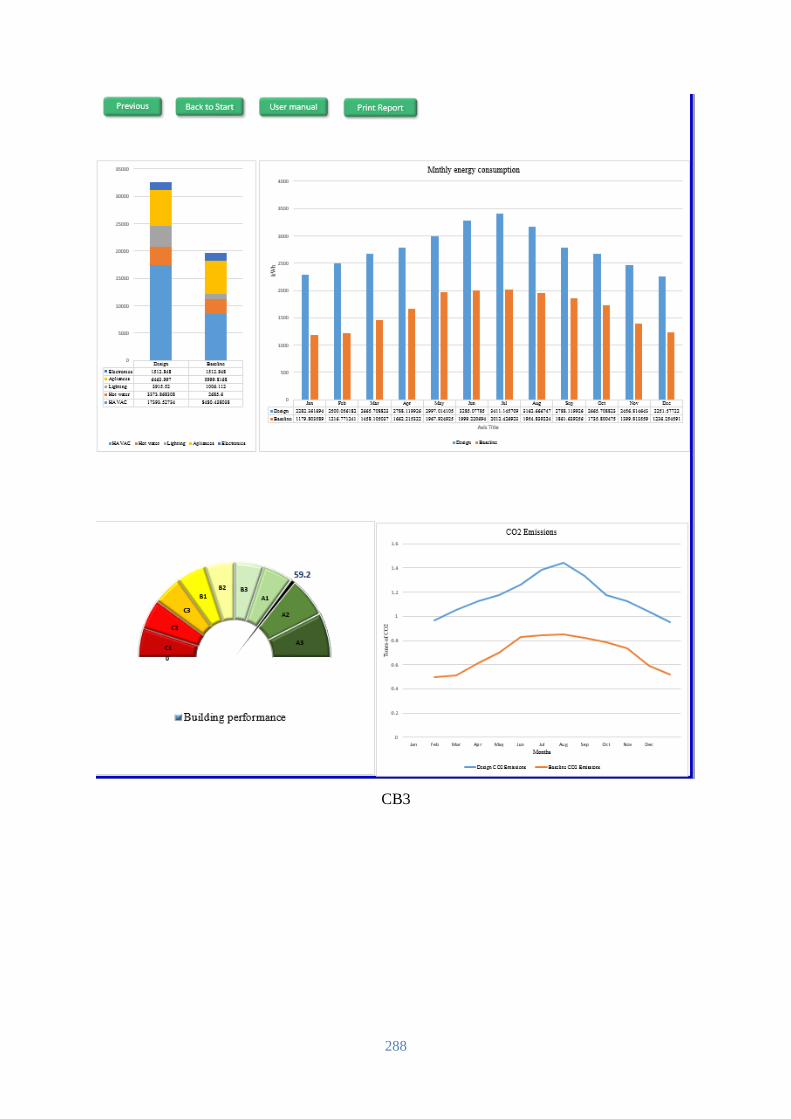
288
CB3
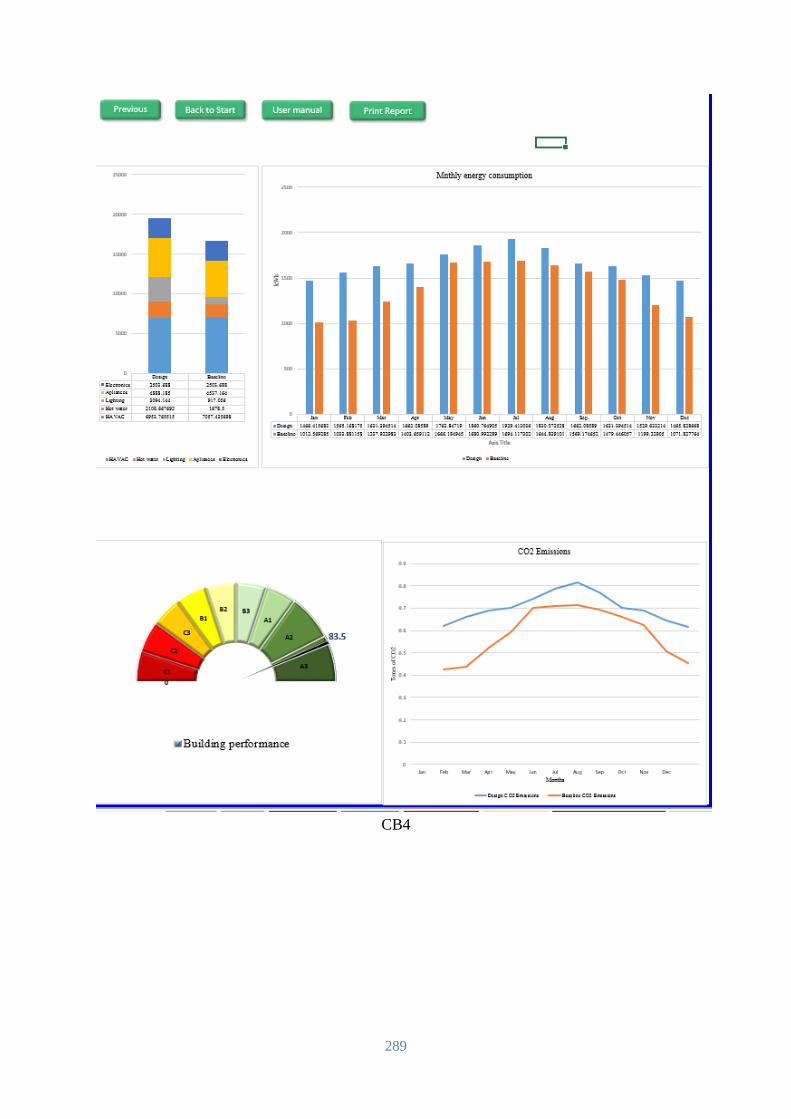
289
CB4
Related Documents