RETARDATION OF BROWNING AND SOFTENING OF THERMALLY PROCESSED PEARS PACKED IN RETORTABLE POUCHES by José Antonio Maldonado Ugaz A thesis submitted to the Graduate School‐New Brunswick Rutgers, The State University of New Jersey in partial fulfillment of the requirements for the degree of Master of Science Graduate Program in Food Science written under the direction of Professor M. V. Karwe and approved by _________________________________ ________________________________ _________________________________ New Brunswick, New Jersey October, 2010

Welcome message from author
This document is posted to help you gain knowledge. Please leave a comment to let me know what you think about it! Share it to your friends and learn new things together.
Transcript

RETARDATION OF BROWNING AND SOFTENING OF THERMALLY PROCESSED PEARS PACKED IN RETORTABLE POUCHES
by
José Antonio Maldonado Ugaz
A thesis submitted to the
Graduate School‐New Brunswick
Rutgers, The State University of New Jersey
in partial fulfillment of the requirements
for the degree of
Master of Science
Graduate Program in Food Science
written under the direction of
Professor M. V. Karwe
and approved by
_________________________________
________________________________
_________________________________
New Brunswick, New Jersey
October, 2010

Abstract of the Thesis
Retardation of Browning and Softening of Thermally Processed Pears
Packed in Retortable Pouches
by José Antonio Maldonado Ugaz
Thesis Director: Dr. Mukund V. Karwe
Wet pack fruit rations have been included in the U.S. Army Meals Ready‐to‐Eat
(MRE) program menus since 1992, when they replaced freeze‐dried fruits. These
rations, designed for soldiers in the field, have high acceptability, are very convenient to
carry, and provide important nutrients. The required shelf life for MRE wet pack fruit
rations is 36 months at 26.7ºC or 6 months at 37.7ºC. However many of the wet pack
fruits, especially pears in syrup, turn brown and mushy during storage before the
required shelf life, and get rejected by the soldiers.
Preliminary experiments had suggested that the oxygen left in the headspace of
the pouches after vacuum packaging had a significant role in the browning, and that
ii

softening was due to canned pears being used instead of fresh pears as starting
material. Therefore, our objective was to develop strategies to slow down the browning
of MRE pears by reducing the available oxygen, and to find a year‐long available fresh
pear that could be used as starting material to avoid double processing.
Accelerated storage studies were carried out at 48.8ºC for 45 days, and samples
were withdrawn periodically to measure headspace volume and composition, color,
ascorbic acid concentration and hardness of the pears. Sensory evaluation by a trained
panel was done at the U.S. Army Natick Soldier Research, Development and Engineering
Center.
The control formulation showed a significant consumption of oxygen in the
headspace, degradation of ascorbic acid in the product, and formation of carbon dioxide
during storage. Based on these findings we think that browning is mainly due to ascorbic
acid degradation. Minimizing the residual headspace by pulling vacuum for a longer
time during packing and doing agitated retorting reduced ascorbic acid degradation by
approximately 87% after thermal processing and decreased browning by approximately
34% after 30 days of storage. Oxygen scavenger films were also used to reduce the
oxygen in the headspace, but the results were inconsistent. Using fresh D’Anjou pears
instead of canned Bartlett pears was enough to increase the hardness of the MRE
rations to acceptable levels according to the sensory analysis.
iii

Acknowledgements
I would like to extend my gratitude to Dr. Mukund V. Karwe for his guidance and
the opportunity he gave me to work on this project and in his laboratory. I feel very
lucky to have worked for such an excellent professor and learnt so much during the last
three years. I would also like to thank Mr. Rieks Bruins, without his input and his help
during the production of the samples this project could not have been carried out.
I would like to thank Dr. Karen Schaich, Dr. Henryk Daun, Dr. Willian Franke and
Dr. Thomas Hartman for all their advice during this research project. I would also like to
thank Dr. Henryk Daun and Dr. Kit Yam for being part of my thesis committee. I would
like to recognize Truitt Bros. Inc., especially Laura Spencer and Drew Huebsch, for
providing support in the experimental phase and for facilitating the plant runs. Also, I
would like to thank Rutgers Food Manufacturing Technology (FMT) and its staff and
personnel, without them the production of samples would not have been possible.
I would like to thank the Combat Ration Network Program (CORANET) of the U.S.
Department of Defense for funding this project, and Dr. Patrick Dunne, Mr. Alan Wright,
Dr. Tom Yang and Dr. Melvin Carter from the U.S. Army Natick Soldier Research,
Development and Engineering Center for overseeing the sensory analysis and their
general advice throughout the execution of this project, Also, I would like to thank Dr.
iv

Magdy Hefnawy from SOPAKCO for providing the MRE samples currently used by the
Army.
Finally I would like to thank and dedicate this thesis to my family and friends,
both in Perú and in the U.S.A., without their support and encouragement I could not
have pursued and finish my Masters.
v

Table of Contents
Abstract of the Thesis. ..................................................................................................................... ii
Acknowledgements ......................................................................................................................... iv
Table of Contents ............................................................................................................................ vi
List of Tables…… ............................................................................................................................ viii
List of Figures .................................................................................................................................. ix
1. Introduction ............................................................................................................................. 1
1.1 Pears ..................................................................................................................... 1
1.1.1 Pear Cultivars ................................................................................................ 3
1.1.2 Composition of pears .................................................................................... 4
1.2 Meals Ready‐to‐Eat (MRE) ................................................................................... 6
1.2.1 Packaging ...................................................................................................... 6
1.2.2 Thermal processing ....................................................................................... 8
1.3 Browning Reactions .............................................................................................. 8
1.3.1 Enzymatic and phenolic browning ................................................................ 9
1.3.2 Maillard browning ....................................................................................... 12
1.3.3 Ascorbic acid browning ............................................................................... 15
1.4 Texture Loss ........................................................................................................ 19
1.5 Rationale ............................................................................................................ 20
1.6 Problem Statement ............................................................................................ 22
1.7 Objectives ........................................................................................................... 22
2. Materials and Methods .......................................................................................................... 23
2.1 Materials ............................................................................................................ 23
2.1.1 Diced pears ................................................................................................. 23
2.1.2 Pouches ....................................................................................................... 24
2.1.3 Reagents and supplies ................................................................................ 26
2.1.4 Equipment and Instruments ....................................................................... 27
2.2 Procedures ......................................................................................................... 28
vi

2.2.1 Sample preparation .................................................................................... 28
2.2.2 Storage studies ............................................................................................ 32
2.3 Methods ............................................................................................................. 32
2.3.1 Ascorbic Acid ............................................................................................... 32
2.3.2 Headspace analysis ..................................................................................... 33
2.3.3 Color Analysis .............................................................................................. 34
2.3.4 Peroxidase activity measurement .............................................................. 35
2.3.5 Ripeness measurement .............................................................................. 36
2.3.6 Hardness measurements ............................................................................ 37
2.3.7 Sensory Analysis .......................................................................................... 38
2.3.8 Soluble solids measurement ....................................................................... 39
2.3.9 Moisture measurement .............................................................................. 39
2.3.10 Statistical Analysis ....................................................................................... 39
3. Results and Discussion ........................................................................................................... 40
3.1 Correlation Between Instrumental Analysis and Sensory Analysis .................... 40
3.2 Fresh D’Anjou Pears and its Effect on Color and Texture of MRE pears ........... 42
3.3 Modifications in Packaging and Thermal Processing ......................................... 45
3.4 Degradation of ascorbic acid .............................................................................. 60
4. Summary and Conclusions ..................................................................................................... 68
5. Future Work ........................................................................................................................... 70
6. References ............................................................................................................................. 71
vii

List of Tables
Table 1.1: Pear Production in the US………………………………………………………………………………2
Table 1.2: Pear utilization in the US ….……………………………………………………………………………2
Table 1.3: Composition of pears (no cultivar specified) …………………………………….…………..5
Table 2.1: Peroxidase activity cuvette contents (250 µL total) ……………………………………36
Table 3.1: ANOVA for color of MRE pears prepared with canned Bartlett pears or fresh
D’Anjou pears………………………………………………..…………………………………………….43
Table 3.2: ANOVA for texture of MRE pears prepared with canned Bartlett pears or
fresh D’Anjou pears …………………………………………………………………………………….45
Table 3.3: ANOVA for pears packed in tin cans and MRE pouches………………………………..46
Table 3.4: ANOVA for color of pears packed in regular MRE film and oxygen scavenger
film, first experiment (at FMT Facility)……………………………..……………..…………..49
Table 3.5: ANOVA for color of pears packed in regular MRE film and oxygen scavenger
film, second experiment (at FMT Facility)…….…………………………..….……………..50
Table 3.6: ANOVA for color of pears packed in regular MRE film and oxygen scavenger
film, third experiment (at Truitt Bros. facility) …………………………………………….51
Table 3.7: ANOVA of color measurements of pears after different types of
processing…………………………………………………………………………………………………....56
Table 3.8: ANOVA of ascorbic acid measurements of pears after different types of
processing …………………………………………………………………………………………………..57
viii
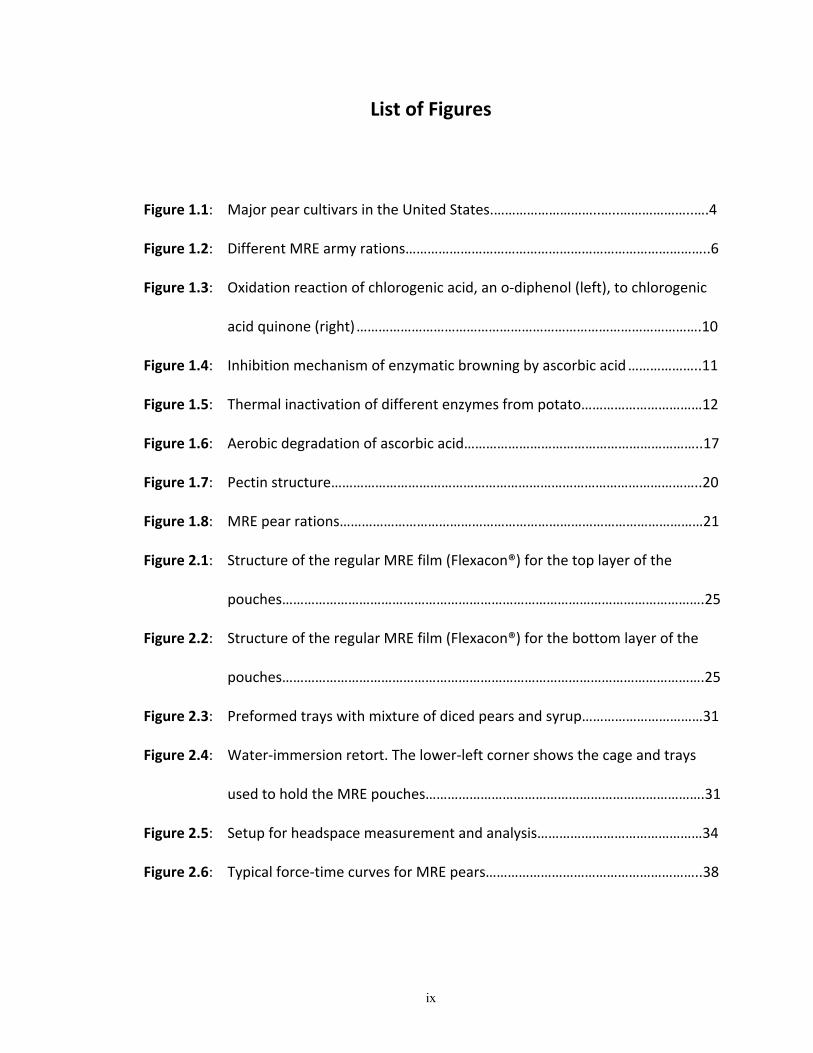
List of Figures
Figure 1.1: Major pear cultivars in the United States.………………………..…..………………..….4
Figure 1.2: Different MRE army rations………………………………………………………………………..6
Figure 1.3: Oxidation reaction of chlorogenic acid, an o‐diphenol (left), to chlorogenic
acid quinone (right) ………………………………………………………………………………….10
Figure 1.4: Inhibition mechanism of enzymatic browning by ascorbic acid ………………..11
Figure 1.5: Thermal inactivation of different enzymes from potato……………………………12
Figure 1.6: Aerobic degradation of ascorbic acid………………………………………………………..17
Figure 1.7: Pectin structure………………………………………………………………………………………..20
Figure 1.8: MRE pear rations………………………………………………………………………………………21
Figure 2.1: Structure of the regular MRE film (Flexacon®) for the top layer of the
pouches…………………………………………………………………………………………………….25
Figure 2.2: Structure of the regular MRE film (Flexacon®) for the bottom layer of the
pouches…………………………………………………………………………………………………….25
Figure 2.3: Preformed trays with mixture of diced pears and syrup……………………………31
Figure 2.4: Water‐immersion retort. The lower‐left corner shows the cage and trays
used to hold the MRE pouches………………………………………………………………….31
Figure 2.5: Setup for headspace measurement and analysis………………………………………34
Figure 2.6: Typical force‐time curves for MRE pears…………………………………………………..38
ix
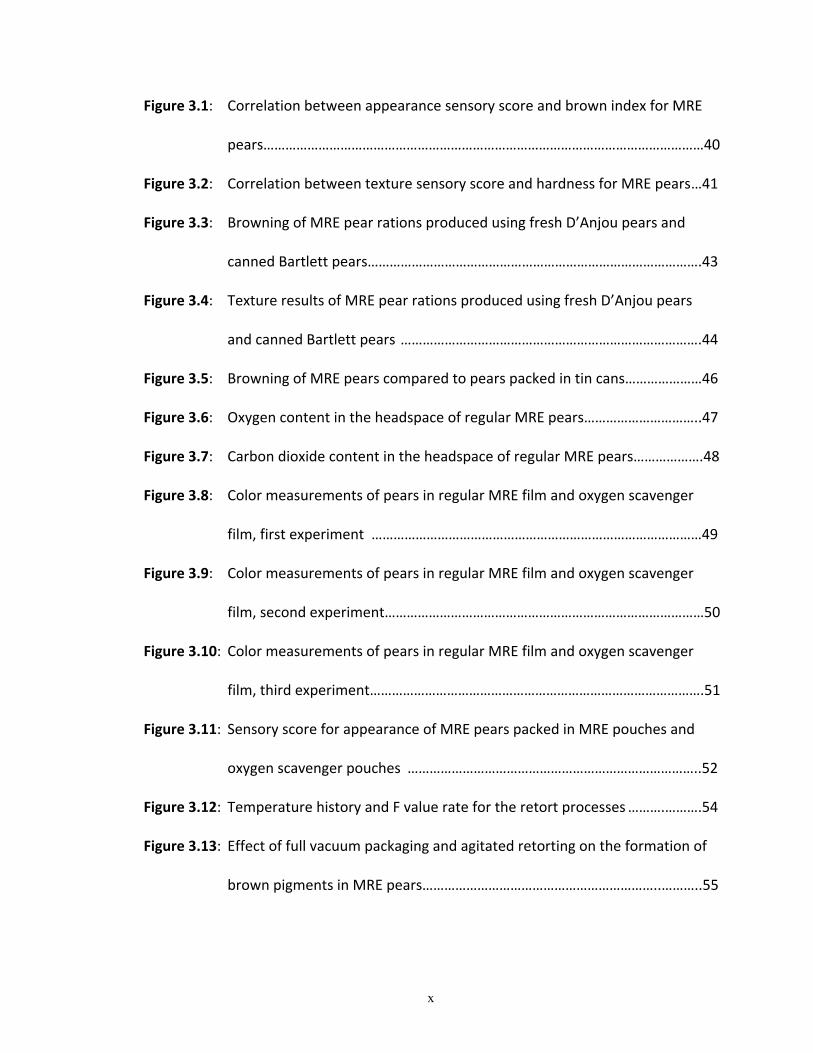
Figure 3.1: Correlation between appearance sensory score and brown index for MRE
pears…………………………………………………………………………………………………………40
Figure 3.2: Correlation between texture sensory score and hardness for MRE pears …41
Figure 3.3: Browning of MRE pear rations produced using fresh D’Anjou pears and
canned Bartlett pears……………………………………………………………………………….43
Figure 3.4: Texture results of MRE pear rations produced using fresh D’Anjou pears
and canned Bartlett pears ……………………………………………………………………….44
Figure 3.5: Browning of MRE pears compared to pears packed in tin cans…………………46
Figure 3.6: Oxygen content in the headspace of regular MRE pears…………………………..47
Figure 3.7: Carbon dioxide content in the headspace of regular MRE pears……………….48
Figure 3.8: Color measurements of pears in regular MRE film and oxygen scavenger
film, first experiment ………………………………………………………………………………49
Figure 3.9: Color measurements of pears in regular MRE film and oxygen scavenger
film, second experiment……………………………………………………………………………50
Figure 3.10: Color measurements of pears in regular MRE film and oxygen scavenger
film, third experiment……………………………………………………………………………….51
Figure 3.11: Sensory score for appearance of MRE pears packed in MRE pouches and
oxygen scavenger pouches ……………………………………………………………………..52
Figure 3.12: Temperature history and F value rate for the retort processes ……….……….54
Figure 3.13: Effect of full vacuum packaging and agitated retorting on the formation of
brown pigments in MRE pears………………………………………………………..………..55
x

xi
Figure 3.14: Effect of thermal processing and vacuum packaging on retention of
ascorbic acid in MRE pear rations……………………………………………………..………57
Figure 3.15: Peroxidase activity in MRE pears …………………………………….……………………….59
Figure 3.16: Ascorbic acid retention with oxygen scavenger films ………………………..……..61
Figure 3.17: Tukey test for ascorbic acid retention with different packaging options …..61
Figure 3.18: Anaerobic ascorbic acid degradation with time as function of initial
concentration of ascorbic acid………………………………………………………………….63
Figure 3.19: Effect of oxygen scavenger pouches on the formation of carbon dioxide ...64
Figure 3.20: Effect of initial concentration of ascorbic acid in browning of MRE pears…66
Figure 3.21: Paired comparison of effect of initial concentration of ascorbic acid on
browning…………………………………………………………………………………………………..66

1
1. Introduction
1.1 Pears
Pears (Pyrus communis), along with apples, are among the oldest of the world’s
fruit crops (Jackson, 2003). The earliest authentic record of pears being cultivated in the
United States is from the year 1630 at Salem, Massachusetts (Childers, 1983). The main
pear producing countries are China, Italy, and USA (Jackson, 2003). Farming of pears is
concentrated in the temperate regions of the world because the tree requires a certain
amount of hours below 7ºC during the day to bear fruit (Salunkhe and Kadam, 1995). In
the United States the leading region in pear production is Washington State, which
produces more than 35% of the pears (Jackson, 2003); California and Oregon State are
other major producers. Annual pear production in the United States has fluctuated
between 700,000 and 1,000,000 MT during the last ten years, as shown in Table 1.1.
Out of the total pears consumed in the United States, approximately 60% are consumed
fresh and 40% are consumed processed (as canned fruit, juice, puree, etc), as shown in
Table 1.2.

2
Table 1.1: Pear Production in the US.
Year Production
(MT)
2000 877,380
2001 912,460
2002 787,840
2003 846,630
2004 823,760
2005 748,720
2006 757,780
2007 791,930
2008 790,020
2009 848,490
Source: Crop Production. National Agricultural Statistic Service.
Table 1.2: Pear utilization in the US.
Year Consumption as
fresh (MT)
Consumed as
Processed (MT)
Total
(MT)
2000 520,490 365,050 885,550
2001 516,030 382,370 898,400
2002 476,190 330,630 806,820
2003 508,430 334,600 843,030
2004 466,960 326,090 793,050
2005 458,000 288,080 746,080
2006 454,650 300,000 754,660
2007 501,180 290,460 791,640
Source: Economic, Statistics and Market Information System – USDA.
3
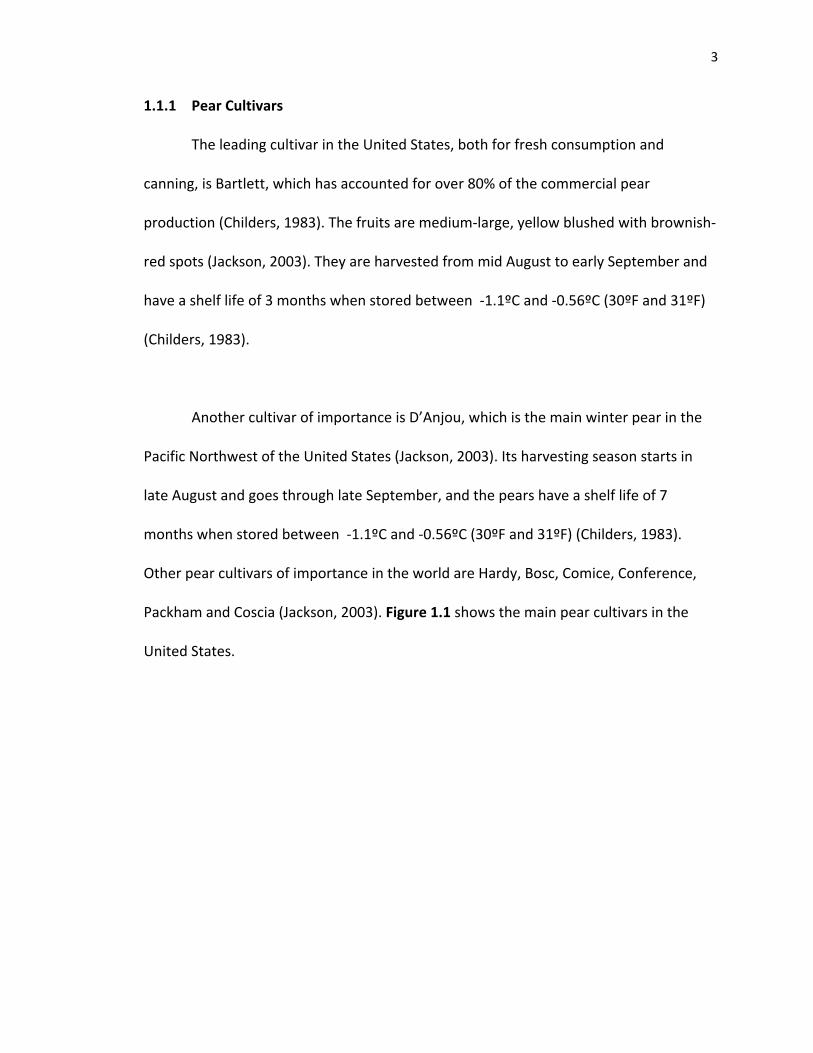
1.1.1 Pear Cultivars
The leading cultivar in the United States, both for fresh consumption and
canning, is Bartlett, which has accounted for over 80% of the commercial pear
production (Childers, 1983). The fruits are medium‐large, yellow blushed with brownish‐
red spots (Jackson, 2003). They are harvested from mid August to early September and
have a shelf life of 3 months when stored between ‐1.1ºC and ‐0.56ºC (30ºF and 31ºF)
(Childers, 1983).
Another cultivar of importance is D’Anjou, which is the main winter pear in the
Pacific Northwest of the United States (Jackson, 2003). Its harvesting season starts in
late August and goes through late September, and the pears have a shelf life of 7
months when stored between ‐1.1ºC and ‐0.56ºC (30ºF and 31ºF) (Childers, 1983).
Other pear cultivars of importance in the world are Hardy, Bosc, Comice, Conference,
Packham and Coscia (Jackson, 2003). Figure 1.1 shows the main pear cultivars in the
United States.

4
a) b)
c) d)
Figure 1.1: Major pear cultivars in the United States
a) Bartlett Pear , b) D’Anjou Pear, c) Comice Pear, d) Bosc Pear.
(Bartlett pear image from: http://www.worldwidegourmet.com,
other images from: http://trade.usapears.com)

5
1.1.2 Composition of pears
Table 1.3 shows the main constituents and nutrients found in most varieties of
pears. Pears are considered a good source of fiber and potassium (Salunkhe and Kadam,
1995; TanrIöven and Eksi, 2005; Schieber et al., 2001). The sugars in pears are primarily
fructose and glucose; sucrose is also present but in a very small amount. The main
polyphenol in pears is chlorogenic acid.
Table 1.3: Composition of pears (no cultivar specified)
Constituent Content
Water 83.71%
Protein 0.38%
Fat 0.12%
Carbohydrates
(by difference)
15.46%
Fiber 3.1%
Sugars 9.8%
Fructose 6.23%
Glucose 2.76%
Sucrose 0.78%
Potassium 1,190 ppm
Phosphorus 110 ppm
Magnesium 70 ppm
Calcium 90 ppm
Copper 0.82 ppm
Ascorbic acid 42 ppm
Vitamin K 45 ppb
Source: USDA National Nutrient Database for Standard Reference, 2009.

6
1.2 Meals Ready‐to‐Eat (MRE)
MRE are the first type of rations used for feeding deployed troops, before field
kitchens are setup. Their use started in the early 1980s and since then they have been
continuously modified to improve the quality and give variety to the menu. After
Operation Desert Storm, it was suggested that taking into account the U.S. Army
soldiers’ preferences would increase their consumption and assure the nourishment of
the troops, so feedback from the soldiers has been used to replace components from
the rations and improve the quality. Figure 1.2 shows different types and presentations
of MRE rations, which include cold and warm entrees, snacks, and desserts.
Figure 1.2: Different MRE army rations (credit: http://www.mreinfo.com)
1.2.1 Packaging
According to the military performance specification MIL‐F‐44067D, MRE rations
should be packed in individual flexible pouches of 148 mL (5 oz) or 237 mL (8 oz) of
capacity. The pouches should be formed using a multilayer material that should have an

7
oxygen transmission rate of no more than 0.06 mL/m2/day/atm and water vapor
transmission rate of no more than 0.01 g/m2/day (temperature unspecified). For fruit
rations, the headspace after packaging should not be higher than 10 mL of air. The
pouch should be able to withstand the thermal processing required by the product
without delaminating or losing the integrity of the seals. Fruit rations are pasteurized at
maximum external temperatures of around 100ºC.
In general, retortable pouches are made of polyester film, aluminum foil and
polypropylene, which allow the pouches to be processed to temperatures up to 135ºC
(Downing, 1996). A typical configuration is an outside layer of polyethylene terephtalate
(PET), middle layers of aluminum foil, biaxially oriented nylon, and an internal layer of
polypropylene (Holdsworth, 2007). According to the military specifications MIL‐F‐
44067D, a multilayer material made with a layer 0.076 – 0.1 mm thick of polyolefin on
the external side, a layer 0.009 – 0.017 mm thick of biaxially oriented polyamide type 6,
a layer 0.015 mm thick of aluminum foil and an internal layer 0.012 mm thick of
oriented polypropylene would comply with the requirements for MRE rations.
Polypropylene is used for its tolerance to thermal processing and heat sealability
properties. Aluminum foil, being a metal, gives the high barrier properties to the film.
Polyamide gives high puncture resistance to the film and is also heat resistant (Lee et al.,
2008). Polyolefin is used for its low surface energy, which allows the pouch to be water
impermeable.

8
1.2.2 Thermal processing
Although in general terms thermal processing of flexible pouches is no different
than thermal processing of metallic containers, some additional considerations have to
be given. The pressure in the headspace of the pouches will increase due to heating,
which has to be compensated with the pressure in the heating medium so the integrity
of the seal is not compromised. The highest pressure differential is at the start of the
cooling cycle, so pressurized air sometimes has to be used to maintain a high pressure
outside the pouch (Downing, 1996). Due to the high surface area and short
characteristic dimension, heat transfer to the coldest point is faster in flexible containers
than in cans. Similar to metallic containers, agitation can accelerate heat penetration by
enhancing convection heat transfer; however, the pouches need to be properly
confined to avoid damage due to the seal loosing strength at high temperature.
Downing (1996) points out that at 121ºC the seal can lose about 75% of its strength
compared to ambient temperature.
1.3 Browning Reactions
Brown pigments are the end product of polymerization reactions that start with
different substrates. Based on the composition of fruits and processing conditions, the
possible reactions would be enzymatic and phenolic browning, ascorbic acid browning,
and Maillard browning. Caramelization could not take place even though the reactants
(sucrose and monosaccharides) are present because it requires high temperatures,
around 200ºC (deMan, 1999), which are never reached during thermal processing.

9
1.3.1 Enzymatic and phenolic browning
Enzymatic browning is the rapid darkening of tissues (mainly fruits, vegetables
and mushrooms) when exposed to the air after being damaged, due to the conversion
of phenolic compounds to brown melanins (Eskin, 1990). This reaction in fresh fruits is
catalyzed by the enzyme polyphenol oxidase (PPO), also known as phenoloxidase,
phenolase, monophenol oxidase, diphenol oxidase and tyrosinase (Marshal et al., 2000).
Several isozymes have been identified in fruit samples, each one exhibiting specificity to
different phenolic substrates (Eskin, 1990). These enzymes have a type 3 binuclear
copper active site (Damodaran et al., 2007), which is crucial for the activity of the
enzyme. Several methods have been identified to inhibit PPO activity, heat denaturation
being the most suitable for processed fruit. Temperatures between 70ºC and 90ºC
generally give complete inactivation of PPO enzyme (Marshal et al., 2000).
PPO catalyzes two reactions: 1) hydroxylation of monophenols to o‐diphenols,
and 2) oxidations of o‐diphenols to o‐benzoquinones (Figure 1.3). Quinone formation is
both enzyme and oxygen dependant; the subsequent reactions occur spontaneously
and no longer depend on these two factors (Eskin, 1990). Quinones can also be formed
without the aid of enzymes (Schüsler‐Van Hees et al., 1985), but at much lower rates.
Cilliers and Singleton (1989) studied the autoxidation of caffeic acid and found the
reaction to be of first order with a rate highly dependent on pH and temperature (16.5
times faster at 35ºC compared to 5ºC at pH 5, and 44.5 times faster at pH 8 compared to
pH 4 at 20ºC). Cornwell and Wrolstad (1981) studied the browning of pear juice

10
concentrate (water activity of 0.73) and found that autoxidation of phenols had no
effect on the formation of pigments.
PPO + ½O2 + H2O
Figure 1.3: Oxidation reaction of chlorogenic acid, an o‐diphenol (left), to
chlorogenic acid quinone (right).
Several methods are available for inactivating PPO enzymes. In processed
products, such as MRE rations, heat would inactivate the enzyme, as the required
temperatures are met during processing. According to Halim and Montgomery (1978),
inactivation of PPO in D’Anjou pears follows a first order kinetics, and 50% of the activity
is lost after 1.1 minutes of processing at 85ºC. Inhibition through additives is also a
common practice, ascorbic acid being the most commonly used. Ascorbic acid reverts
the initial reaction by reducing the o‐benzoquinones back to monophenols, as shown in
Figure 1.4 (Eskin, 1990). A second inhibition mechanism by ascorbic acid and ascorbate
is the reduction of the copper ion in the PPO enzyme, from Cu2+ and Cu+ (Hsu et al.,
1988).

11
PPO O2 H2O
Dehydroascorbic Acid Ascorbic Acid
Figure 1.4: Inhibition mechanism of enzymatic browning by ascorbic acid.
Ascorbic acid oxidizes to dehydroascorbic acid, reducing quinones back to phenols
(adapted from Eskin, 1990).
Peroxidase is another enzyme that could cause browning. Its mechanism is
similar to PPO, but instead of reducing dissolved oxygen it uses hydrogen peroxide or
other organic peroxides as oxidizing agent. Flavonoids and other phenols can serve as
substrates (Eskin, 1990). Peroxidases are considered to be more heat stable than PPO
(Figure 1.5) and can partially recover their activity after thermal processing (Gibriel et
al., 1978; Moulding et al., 1989; McLellan and Robinson, 1981). Although fruits normally
have low levels of hydrogen peroxide (Richard‐Forget and Gauillard, 1997), which would
limit the activity of peroxidase, it can be produced from other reactions, like ascorbic
acid oxidation.

12
D value (s)
Temperature (ºC)
Figure 1.5: Thermal inactivation of different enzymes from potato
(Svenson, 1977)
1.3.2 Maillard browning
Also referred as non enzymatic browning, it is the reaction involving compounds
with amino groups and carbonyl groups (Eskin, 1990). In the case of pears, the carbonyl
groups are provided by reducing sugars, mainly fructose and glucose. Pilipenko et al.
(1999) studied Bere pears and found that the most abundant free amino acids were
asparagine (0.056%), phenylalanine (0.024%), isoleucine (0.017%), and lysine (0.015%).
Lysine is considered the most reactive amino acid (deMan, 1999).

13
The first step of the Maillard browning reaction is the reversible formation of
N‐substituted glycosylamine by condensation of the carbonyl from a reducing sugar with
the amine group of an amino acid; the condensed molecule, known as Schiff’s base,
undergoes a cyclation in the sugar fraction to form the N‐substituted glycosylamine. This
step requires that the carbonyl group be available for reaction, which doesn’t happen
under furanose or pyranose form, and is favored by a pH above the isoelectric point of
the amino acid (Eskin, 1990). The second step of the reaction is called Amadori
rearrangement if the N‐substituted glycosylamine was formed from an aldose or Heyns
rearrangement if it was formed from a ketose. In Amadori rearrangement, the N‐
substituted glycosylamine goes through an internal rearrangement by changing the
sugar fraction to a ketose. In Heyns rearrangement, the sugar fraction goes from ketose
to aldose with the amino group in carbon 2. The Amadori compound is very stable and it
was found to reach a maximum value of concentration in processed apricots before
brown color developed. After the Amadori compound is formed the reaction can take
different pathways depending on the reactants and the environment conditions (Eskin,
1990; deMan, 1999).
The factors that affect Maillard reaction kinetics and pathways are:
a) Temperature: Maillard reaction is extremely sensitive to temperature changes, its
Q10 value is around 3 to 4 (Taub, 1998).
b) pH: A basic pH usually favors the reaction as it puts amino acids in basic form and
increases the amount of reducing sugars in open chain (Eskin, 1990). An exception to
14
this is high sucrose systems (or other disaccharides or polysaccharides), in which a
lower pH promotes hydrolysis of non reducing sugars to glucose and fructose (both
reducing sugars), therefore favoring the reaction (Eskin, 1990). Raisi and Aroujalian
(2007) reported a slight increase in browning in corn syrup 42DE when stored at pH
4 compared to pH 5.
c) Moisture content and water activity: Studies have shown that the reaction is fastest
at water activity levels around 0.6 to 0.7 (Eskin, 1990). This is probably because
several steps involve dehydration reactions, which is favored by dryer environments,
but conditions drier than the optimum would affect molecule mobility. After the
Amadori or Heyns rearrangement, the formed compound may either loose three
water molecules to form a Schiff base of furfural or hydroxymethylfurfural (HMF) or
lose two water molecules and form reductones; additionally it may just split and
form fission products (acetol, diacetyl, pyruvatealdehyde, etc.) (deMan, 1999).
d) Metals: The formation of metal complexes between the amino acids can influence
the reaction (Eskin, 1990); some ions accelerate the reaction while others inhibit it.
Bohart and Carson (1955) found that manganese (added as manganese chloride)
under very little concentration could greatly decrease the formation of brown
pigments in a glucose‐glycine system in air or oxygen, but found no effect under
nitrogen. Iron (as ferric chloride), on the other hand, was found to increase the color
development by four or five times when added at levels of 2 ppm under oxygen
conditions. Markuze (1963) also studied the effects of metals on Maillard reaction
and concluded that iron and cupper in metallic and ionic form increased the reaction
15
rates, manganese and tin in ionic form acted as inhibitors, and tin in metallic form
had no effect.
e) Other conditions: Environment gases and light have also been reported as affecting
Maillard browning, but not much research has been published. Bohart and Carson
(1955) reported that nitrogen flushed sealed samples of glucose‐glycine developed
two to three times as much color as samples sealed with air. They also found that
light accelerated the reaction under absence of oxygen, but it bleached partially
browned samples at ambient temperature when oxygen was available; this last
observation was also made by Markuze (1963). Raisi and Aroujalian (2007) obtained
contradictory results, they found that increasing oxygen concentration (from 0 to
21%) slightly increased the reaction rate in corn syrup 42DE regardless of pH and
temperature, but they also found a higher reaction rate at 100% N2 atmosphere
compared to vacuum packing.
1.3.3 Ascorbic acid browning
It is a very important browning mechanism for processed fruits, along with
Maillard browning (Adams and Brown, 2007). Substantial research on browning of
thermally processed fruits and fruit products has been published in the last 50 years,
and much of it points at ascorbic acid degradation as the origin of browning (Wong and
Stanton, 1989; Kacem et al., 1987a and 1987b; Shinoda et al., 2004). However, some
also points at Maillard reaction (Cornwell and Wrolstad, 1981; Ibarz et al., 1999;
Rattanathanalerk et al., 2005); it is important to point out that these experiments were

16
done either on low water activity samples (Cornwell and Wrolstad, 1981) or with
samples being processed at high temperatures (55ºC – 95ºC) and long times (80 min –
500 min) (Ibarz et al., 1999; Rattanathanalerk et al., 2005).
Two pathways are distinguished for ascorbic acid degradation: aerobic
degradation and anaerobic degradation; the later approximately 10 times slower than
the first (Eskin, 1999). The rate of ascorbic acid browning is inversely proportional to pH
in the range of 2 to 3.5 (Braverman, 1963), however Taqui Khan and Martell (1967a)
found that the rate of uncatalyzed ascorbic acid oxidation increased with pH in the
range of 2 to 6, and concluded that only the monoionic form is susceptible to oxidation.
In later experiments, Buettner (1988) demonstrated that the monoionic form does not
autoxidize without the presence of metals. A scheme of the basic initial steps of the
aerobic degradation reaction is shown in Figure 1.6. Besides xylosone and carbon
dioxide, diketo gulonic acid can also degrade into oxalic acid and other carboxylic acids,
or into furfural, and hydroxyfurfural (Eskin, 1990; Shinoda et al., 2004). Ranganna and
Setty (1974) showed that carbon dioxide was the main by‐product of ascorbic acid
degradation in aqueous medium.

17
Figure 1.6: Aerobic degradation of ascorbic acid (adapted from Damodaran, 2008)
Ascorbic acid
H2O2 O2
Diketo gulonic acid
CO2
Xylosoneacid
Dehydroascorbic
The initial oxidation to dehydroascorbic acid is easily reversible by reducing
agents, so most of the dehydroascorbic acid is still considered to have vitamin C activity;
however the opening of the lactone ring to form 2,3 diketo gulonic acid is irreversible,
and once it happens vitamin C activity is lost (Damodaran, 2008). This initial oxidation
step is catalyzed by the presence of metal ions and, to a lesser degree, by metal
chelates. Taqui Khan and Martell (1967a and 1967b) studied the effect of cupric and
ferric ions and chelates, and found that both Cu2+ and Fe3+ significantly increase the
reaction rate (5 times faster with ferric ion and 10 times faster with cupric ion). They
also concluded that ferric ion has more effect on the fully protonated form and that
cupric ion has more effect on the monoionic form. Regarding the ferric and cupric
chelates, these had negligible effects at pH 2.25 – 3.45 but had a significant effect at
higher pH, indicating that chelated metals can oxidize the monionic form of ascorbic
acid. Shinoda et al. (2004) also found that metals promoted browning in model orange
juice systems.

18
An important by‐product from the oxidation of ascorbic acid is hydrogen
peroxide, as it could be used by peroxidase enzyme to oxidize phenols, which would
then be reduced by ascorbic acid, therefore producing more dehydroascorbic acid. As
mentioned before, peroxidase has been shown to survive thermal processing and even
recover activity during storage.
Amino acids have also been shown to have an important effect on the
degradation of ascorbic acid. Kacem et al. (1987a and 1987b) concluded that increasing
levels of aspartic acid and arginine promoted the degradation of ascorbic acid and
browning of orange juice (pH 3.8). Ranganna and Setty (1968) worked with dried
cabbage and showed that the browning came from oxidized ascorbic acid (either
dehydroascorbic acid or diketo gulonic acid) reacting with amino acids following
Strecker degradation reaction. This reaction was found only at high pH (above 3.5,
optimum at 5.3 to 6.8) and low moisture conditions (both of which favor Maillard
reaction). Citric acid has been shown to promote the formation of brown pigments from
ascorbic acid (Clegg, 1966), but the mechanism was not elucidated. Shinoda et al. (2004)
also found that citric acid promoted ascorbic acid browning in model orange juice
systems.
19
The anaerobic degradation pathway for ascorbic acid has only been partially
described, and is only of importance once the oxygen has been fully consumed (Eskin,
1990; Damodaran, 2008). It has been shown to be pH dependant, with maximum rate at
pH 3 to 4, and also to be promoted by fructose (Huelin, 1953). Huelin et al. (1971) found
out that carbon dioxide and furfural were by‐products of anaerobic degradation of
ascorbic acid, and that the yield of carbon dioxide to ascorbic acid was almost 1:1 on a
molar basis regardless of the pH (on a range from 2 to 6).
1.4 Texture Loss
Softening of fruit tissues is due to loss of cellular integrity, which takes place
mainly during thermal processing above 55ºC (Rosenthal, 1999). This loss of cellular
integrity comes from cellular breakdown, caused by disruption of the cell membrane
and structural changes in the cell wall, as well as cellular separation due to breakdown
and solubilization of the pectin in the middle lamellae, which is the structure that
maintains the cells together. High methoxyl pectin is less water soluble than low
methoxyl pectin; so ripened fruits, in which pectin is mostly demethylated due to
ripening, typically soften more after thermal processing than less ripened fruits, unless
the demethylated sites are used to cross‐link the pectin chains with calcium and
increase the rigidity of the lamellae. Figure 1.7 shows the schematic of pectin chains
cross‐linked with calcium molecules.

20
a)
b)
Figure 1.7: a) Pectin structure.
b) Pectin chains cross‐linked by calcium ions.
1.5 Rationale
This study aims at increasing the shelf life of MRE rations of pears in syrup. Pear
rations are highly appreciated by the soldiers in the field and are an important source of
nutrients but get rejected if they are too degraded, which happens even within the
required shelf life of 3 years at 26.7ºC. Figure 1.8 shows the MRE pears at the beginning
and at the end of their shelf life.

21
a) b)
Figure 1.8: a) MRE pears immediately after processing,
b) MRE pears at the end of their shelf life of 3 years at 26.7ºC.
Canned fruits are generally considered to be acceptable for consumption within
3 years of manufacturing. Therefore, one or more degradation process taking place in
pears packed in MRE pouches have to be inhibited in pears packed in cans.
Understanding the color and texture degradation mechanisms taking place in MRE pear
rations and which one should be inhibited to maintain the product acceptable
throughout its shelf life would allow the findings to be useful for other MRE wet pack
fruit products, which may also face the same problems.

22
1.6 Problem Statement
MRE rations of pears in syrup do not comply with the shelf life of 3 years at
26.7ºC required by the U.S. Army. This shelf life is necessary due to the unpredictable
nature of the Army operations, which require stockpiles of military rations, and the
harsh conditions of the war theatres in the Middle East, which significantly shorten the
shelf life of the rations. It is necessary to find a way to delay the color and texture
degradation processes in MRE pear rations so they comply with the required shelf life
and remain acceptable for the soldiers.
1.7 Objectives
• To develop a strategy to slow down the browning reactions in MRE pear rations
as compared to product manufactured according to the current industry
procedures.
• To decrease the softening of the MRE pears in syrup rations as compared to
product manufactured according to the current industry procedures.

23
2. Materials and Methods
2.1 Materials
2.1.1 Diced pears
Two types of diced pears were used for this study:
a) Fresh D’Anjou pears:
Provided by Truitt Bros Inc., a fruit processor from Salem, Oregon, and used for
large‐scale experiments which were carried out at their facility. The whole pears
were stored at refrigeration and controlled atmosphere and diced on the day of
processing. Their parameters measured on the day of processing were:
• Hardness: 3.4 +/‐ 0.2 kg (7.5 +/‐ 0.5 Lb)
• Brix: 13 – 13.2º
• Ascorbic acid content: 75 +/‐ 25 ppm
• Moisture: 84.16% (w.b.).
b) Canned diced Bartlett pears:
Manufactured by Del Monte (Modesto, CA) and used for small‐scale experiments
carried out at Rutgers Food Manufacturing Technology (FMT) in Piscataway, NJ.
The diced pears were canned in a size 10 tin can with light corn syrup. Their
parameters were:

24
• Hardness: 69 +/‐ 13 g
• Brix: 10 – 14º
• Ascorbic acid content: 50 ppm
• Moisture: 78% (w.b.).
2.1.2 Pouches
Two types of pouches were used to pack MRE pears:
• Regular MRE pouches
• Oxygen scavenger pouches.
Both pouches had a bottom preformable layer and a top flat layer, and were
assembled using the horizontal form fill sealers. The oxygen scavenger pouches only had
the top layer made from oxygen scavenging film, since no preformable oxygen
scavenging film was available for this project; the bottom layer was made from regular
MRE film. The regular MRE film used was Flexalcon®, manufactured by Alcan Packaging
Singen GmbH (Germany); the oxygen scavenger film was Ageless OMAC ®,
manufactured by Mitsubishi Gas Chemical Company Inc. (Tokyo, Japan). Figure 2.1 and
Figure 2.2 show the structure of the regular MRE films; no detailed description of the
structure of the oxygen scavenger film was available.

25
external side
internal side
Figure 2.1: Structure of the regular MRE film (Flexacon®)
for the top layer of the pouches
internal side
external side
Figure 2.2: Structure of the regular MRE film (Flexacon®)
for the bottom layer of the pouches

26
The specifications of the oxygen scavenger film provided by the manufacturer
(Mitsubishi Gas Chemical Company Inc.) are:
• Oxygen absorbing layer: Polypropylene with embedded iron particles
• Sealant layer: Polypropylene
• Oxygen absorption performance during retorting (121.1ºC): 266 mL/m2/hr at 100%
relative humidity
• Minimum water activity required for the product: 0.85.
The regular MRE film complied with the military specification MIL‐F‐44067D that
limits the oxygen transmission rate to 0.06 mL/m2/24 hrs/atm. Based on the pouch size
and ambient conditions, this rate would be 0.16 mL of oxygen per year.
2.1.3 Reagents and supplies
a) EM Quant® ascorbic acid test spatulas (EMD Chemicals, NJ), for ascorbic acid
measurements.
b) 2,6 dichlorophenol indophenol (Acros Organics, NJ), for ascorbic acid
measurement
c) Metaphosphoric acid (Acros Organics, NJ), for ascorbic acid measurement
d) Acetic acid glatial (Fisher Scientific, NJ), for ascorbic acid measurement
e) L‐ascorbic acid (Fisher Scientific, NJ), for ascorbic acid measurement
f) 2‐N‐Morpholinolethanesulfonic acid (Acros Organics, NJ), for peroxidase
assay

27
g) Hydrogen peroxide at 30% (Fisher Scientific, NJ), for peroxidase assay
h) o‐Phenylene‐diamine (Acros Organics, NJ), for peroxidase assay
i) Sodium phosphate monobasic (EMD Chemicals, NJ), for peroxidase assay
j) Sodium fluoride (Fisher Scientific, NJ), for peroxidase assay
k) Chelex 100 (Bio‐Rad Laboratories, CA), for peroxidase assay
l) Ascorbate oxidase spatulas (Roche Applied Science, IN), for peroxidase assay.
2.1.4 Equipment and Instruments
a) CFS Tiromat (Frisco, TX) Tiromat 300 horizontal form fill sealer
b) Stock America (Grafton, WI) Rotomat batch retort
c) Wagner Instruments (Greenwich, CT) fruit penetrometer with a 0.5’’ (12.7
mm) diameter probe
d) Reichert Anaytical Instruments (Depew, NY) r2mini handheld digital
refractometer
e) Nova Analytics Corp. (Woburn, MA) Scholar 425 pH meter
f) Mocon (Minneapolis, MN) PalCheck 325 portable gas analyzer
g) Konica Minolta (Ramsey, NJ) CR‐400 colorimeter
h) Kinematica AG (Lucerne, Switzerland) Polytron PT 1600 E high shear
homogenizer
i) International Equipment Co. (Needham, MA) clinical centrifuge model CL
j) Biotek (Winooski, VT) Synergy‐HT UV‐Visible/Fluorescence microplate reader

28
k) Texture Technologies (Scarsdale, NY) TA‐XT2i texture analyzer, with a 2 mm
diameter probe and a 25 kg cell.
2.2 Procedures
2.2.1 Sample preparation
Samples were prepared using fresh D’Anjou pears and canned Bartlett pears so
when 36 g of syrup was mixed with 107 g of diced pears in the pouches the final product
would equilibrate and comply with the MIL‐F‐44067D Military Specification for Pears in
MRE rations:
• Minimum total weight: 127.57 g (4.5 oz)
• Minimum drained weight: 99.22 g (3.5 oz)
• Brix: 18 – 22º
• pH: 3.85 – 4.15
• Ascorbic acid: 200 – 800 ppm.
For samples made with canned Bartlett pears, these were first drained, then the
soluble solids (ºbrix), moisture, and ascorbic acid of the canned pears were measured.
The amount of sucrose and ascorbic acid to be added to the drained syrup so the MRE
specifications would be met were calculated using the following equations:

29
( )
.
AA.AA.AA
BMSugBBºB
BMºB
Sug
iRTS
T
RT
RT
RTS
T
i
i
036010701430
361071º36
º1107
×−×=
××+×−+×=
−××
=
where Sug is the sugar content of the canned pears, M is the moisture, ºBi is the soluble
solids of the canned pears, is the target soluble solids for the adjusted syrup, is the
target soluble solids for the MRE rations (20º brix), is the target ascorbic acid (ppm) for the
adjusted syrup, is the target ascorbic acid (ppm) for the MRE rations, and AAi is the
ascorbic acid (ppm) of the canned pears.
STºB R
TºB
STAA
RTAA
For pH adjustment, 107 g of pears were ground with 36 g of syrup, and citric acid
or sodium citrate were added to decrease or increase the pH as needed until it met the
MRE specifications. The same amount of citric acid or sodium citrate was added to 36 g
of syrup, and the pH of the syrup was recorded. Finally, the pH regulator was used to
adjust the pH of the whole lot of syrup to the recorded pH, so the pH of the formed
ration would be within the specifications. The target pH was 4.0, which according to
Kluter et. al. (1996) is the optimum value, as a lower pH would have an adverse effect
on color and texture. A higher pH would pose a risk of the product being low acid and
therefore being unsafe after thermal processing.
For fresh D’Anjou pears, the syrup was prepared from scratch using water,
sucrose, ascorbic acid and sodium citrate as pH regulator. Soluble solids (ºbrix),

30
moisture, and ascorbic acid of the pears were measured to calculate the parameters of
the syrup to be prepared. Additionally, D’Anjou pears required flavor enhancing, which
was done with Bartlett pear flavor (Flavor Solutions, Natural Pear Flavor ID#: 112430B)
dissolved into the syrup at a level of 0.4% based on the whole MRE ration.
Cups were manually filled with 107 g of diced pears and 36 g of syrup, and
poured over preformed trays in the horizontal form fill sealers (Tiromat 300 at FMT) for
vacuum packaging. Vacuum pressure was set at 88 kPa and exposure times of 3 s and 6 s
were used; it was determined that 3 s would result in a headspace of 4 to 7 mL in the
pouch, which is the current industry standard, and that 6 s would result in almost no
residual headspace (full vacuum packaging).
The pouches were processed in full water immersion retorts. The process was
designed to achieve an F value during hold time of no less than 2.5 min. Reference
temperature was 93.3ºC and z value was 8.8ºC, water at 100ºC was used as heating
medium. Stationary thermal process, which is the industry standard, and agitated
thermal process (rotation speed of 10 RPM) were used. Heat penetration curves were
obtained by fixing a thermocouple at a center of a pear dice, which was located at the
center of an overfilled pouch (10% above standard weigh of pear dices) placed at the
cold spot of the retort (previously determined). Figure 2.3 and Figure 2.4 show the MRE
pears ready to be packed and the retort used for MRE pouches.

31
Figure 2.3: Preformed trays with mixture of diced pears and syrup
Figure 2.4: Water‐immersion retort. The lower‐left corner shows the cage
and trays used to hold the MRE pouches

32
2.2.2 Storage studies
Retorted pouches were stored at 48.8ºC (120ºF) for 45 days and analyzed at 15
days intervals for headspace volume and composition (oxygen and carbon dioxide),
color, ascorbic acid concentration, and hardness. Additionally, sensory analysis was
performed at U.S. Army Natick Soldier Center. The initial analysis (day 0) were actually
done after 3 days at ambient temperature, which is required for sucrose, ascorbic acid,
and pH to equilibrate between the pears and the syrup. Analysis (not shown) carried
out on samples produced at Truitt Bros. after 3 days of production and after 10 days of
production (transit time between Oregon and New Jersey) show no significant
degradation of MRE pears when kept at ambient temperature.
2.3 Methods
2.3.1 Ascorbic Acid
Ascorbic acid of the MRE pear rations was measured according to AOAC Method
43.060 (1980). Syrup from MRE pears was filtered using Whatman filter paper Nº 1
(Whatman International, England). 1 to 3 mL of syrup were diluted with 5 mL of
extracting solution (3% metaphosphoric acid and 8% acetic acid in distilled water) and
titrated with 2,6 dichlorophenol indophenol solution, which was previously standardized
with 1 mL of a 1,000 ppm L‐ascorbic acid solution (Fisher Scientifics, NJ, U.S.A.) diluted
in 5 mL of extracting solution. Ascorbic acid of the canned or fresh pears that were used
as starting material was measured using ascorbic acid test spatulas; for canned pears

33
the spatula was immersed in the syrup and the concentration was determined with the
color scale provided by the manufacturer, for the fresh pears the spatula was immersed
in puree made with ground pears.
2.3.2 Headspace analysis
Headspace volume was measured by opening 2 to 3 pouches in a water sink and
collecting the headspace gas in a graduated inverted cylinder using a funnel. Analysis
was carried out with a portable headspace analyzer by inserting the probe through a
hole in the cylinder which had been covered with a septum; the instrument expressed
the results as percentage of oxygen and carbon dioxide in the headspace. The setup for
this analysis is shown in Figure 2.5. Volume and composition were used to calculate the
amount of micromoles of each gas present in the headspace by:
TRPmLheadspace
mols gasgas ×
××
=100
)(%μ
Where P is the atmospheric pressure (101,325 Pa), R is the gas constant (8.314
J/mol∙K), and T is the temperature (298 K).
Measurements were only performed on pouches packed with headspace, as no
quantifiable headspace could be collected from the pouches packed with full vacuum at
any point during the shelf life.

34
Septum
Collected headspace
Water level
O2% CO2%
Pouch
Gas analyzer
Figure 2.5: Setup for headspace measurement and analysis
2.3.3 Color Analysis
Color was measured using a Konica Minolta CR‐410 handheld colorimeter
(Konica Minolta, Tokyo, Japan). D65 standard illuminant and 2º observer angle were
used, calibration was done with a white standard Y = 94.7, x = 0.3156 and y = 0.3319.
Between twenty‐four and twenty‐seven pear dices obtained from four to nine pouches
per data set were used.
Results were obtained in the CIE L* a* b* system and converted to brow index
according to Buera (1986):
x 0.31B.I. 1000.172−
=

35
Where x is the chromacity coordinate of a color, which can be calculated from:
* *
* *
a 1.75Lx5.646L a 3.012b
+=
+ − *
(Francis and Clydesdale, 1975)
2.3.4 Peroxidase activity measurement
The method developed by Dunne and Brack (1988) was used to measure
peroxidase activity. 10 g of pears were homogenized with 35 mL of chilled extraction
buffer (0.05 M phosphate and 0.1M sodium fluoride, at pH 7). Homogenization was
carried out in two intervals of one minute each with the container surrounded by ice,
after which the homogenate was transferred to 50 mL polypropylene tubes and
centrifuged until a clear liquid was obtained. 10 mL of the liquid were transferred to a
glass tube and treated with an ascorbate oxidase spatula for approximately 30 minutes,
until ascorbic acid couldn’t be detected. Additionally, the liquid was also treated with
Chelex 100 resin using the batch method, to remove metals.
Peroxidase activity was measured by absorbance at 420 nm and 49ºC (to match
the condition of the accelerated studies) every 30 seconds and determining the rate of
change in absorbance over the linear portion of the curve. The substrate for the
reaction was o‐phenylene‐diamine (10 mM solution), hydrogen peroxide (1 M) was used
as oxidating agent, and 2‐N‐Morpholinolethanesulfonic acid (0.1 M and pH 5) was used
as assay buffer. Sample controls and reagent control were also analyzed to account for

36
sample absorbance and autoxidation, respectively. Table 2.1 shows the volume of each
component and the order as it were added to the cuvettes for the analysis.
Table 2.1: Peroxidase activity cuvette contents (250 µL total)
Sample activity Sample control Reagent control
Substrate (µL) 12.5 ‐ 12.5
Assay buffer (µL) 172.5 185 187.5
Pear supernatant (µL) 15 15 ‐
Hydrogen peroxide (µL) 50 50 50
Peroxidase activity was calculated by subtracting the sample control rate and the
reagent control rate from the sample activity.
2.3.5 Ripeness measurement
Ripeness was defined as the maximum force in pounds required for a 0.5’’ (12.7
mm) diameter steel probe to pierce approximately 1 cm rapidly through the pear flesh.
A section of the fresh D’Anjou pear was peeled and the penetrometer probe was
manually pressed against the peeled surface at a 90º angle. According to Truitt Bros.,
the target value of ripeness for fresh pears to be mechanically diced and canned is 9 lb.
(4.1 kg). This analysis was not performed on canned pears because the dices were too
small for the penetrometer; instead hardness values were measured with the texture
analyzer.

37
2.3.6 Hardness measurements
The parameter hardness, defined by Rosenthal (1999) as the force required for
compressing a food between the molars, was used to measure texture degradation.
Instrumentally, hardness is defined as the peak force in the first cycle of a texture profile
analysis, in which a probe is used to compress the samples and the force required for it
to travel at a constant speed is recorded. Figure 2.6 shows examples of force vs. time
curves, from which hardness was determined. A 2 mm diameter cylindrical probe was
used to assure that the contact area remained the same for all the analysis.
The following test parameters were used:
• Pre test speed: 10 mm/s
• Test speed: 5 mm/s
• Post test speed: 10 mm/s
• Start point: 25 mm
• Distance traveled: 30 mm

38
Hardness
Figure 2.6: Typical force‐time curves for MRE pears.
7 32 ‐20
0
20
40
60
80
100
120
140
160
Each color represents a different sample
2.3.7 Sensory Analysis
A trained panel consisting of 10 to 13 panelists at the U.S. Army Natick Soldier
Center graded the product on a 9 point hedonic scale for appearance, flavor, texture,
odor, and overall preference. A score of 1 was assigned if the attribute was extremely
disliked and 9 if it was extremely liked. The researchers in charge of the sensory
evaluation indicated that appearance score was mostly related to the color of the pears.
Due to the large amount of samples required for this study (50 pouches per variable),
sensory analysis were only carried out for samples produced at Truitt Bros. Also, due to
availability of resources, the samples produced with full vacuum and agitated retorting
were not considered for sensory evaluation.
39
2.3.8 Soluble solids measurement
Soluble solids were measured on the pears that were used as starting material in
order to calculate the sugar required so the MRE ration complied with the Army
parameters. Soluble solids were measured with a handheld digital refractometer as
ºbrix; for the canned pears the syrup was used as sample, for the fresh pears some
dropplets of juice extracted from the pears were used.
2.3.9 Moisture measurement
Moisture of the pears was measured using a moisture balance, with a sample
size of approximately 1 g. The samples were held at 110ºC and the moisture was read
when less than 0.05% of change in weight per minute was detected by the balance.
2.3.10 Statistical Analysis
Analysis of variance (ANOVA) was carried out using Matlab for Windows 64‐bits
version 7.9.0.529 (R2009b); significant difference was found when the significance value
was beneath α=0.05. Tukey’s test with confidence coefficient of 0.95 was used for
paired comparison if factors at three or more levels show significant difference. Linear
regression was also done with Matlab, confidence interval was calculated by hand using
the mean square error provided by Matlab. Error bars in the figures represent standard
error calculated with Excel 2007 SP2.
40
3. Results and Discussion
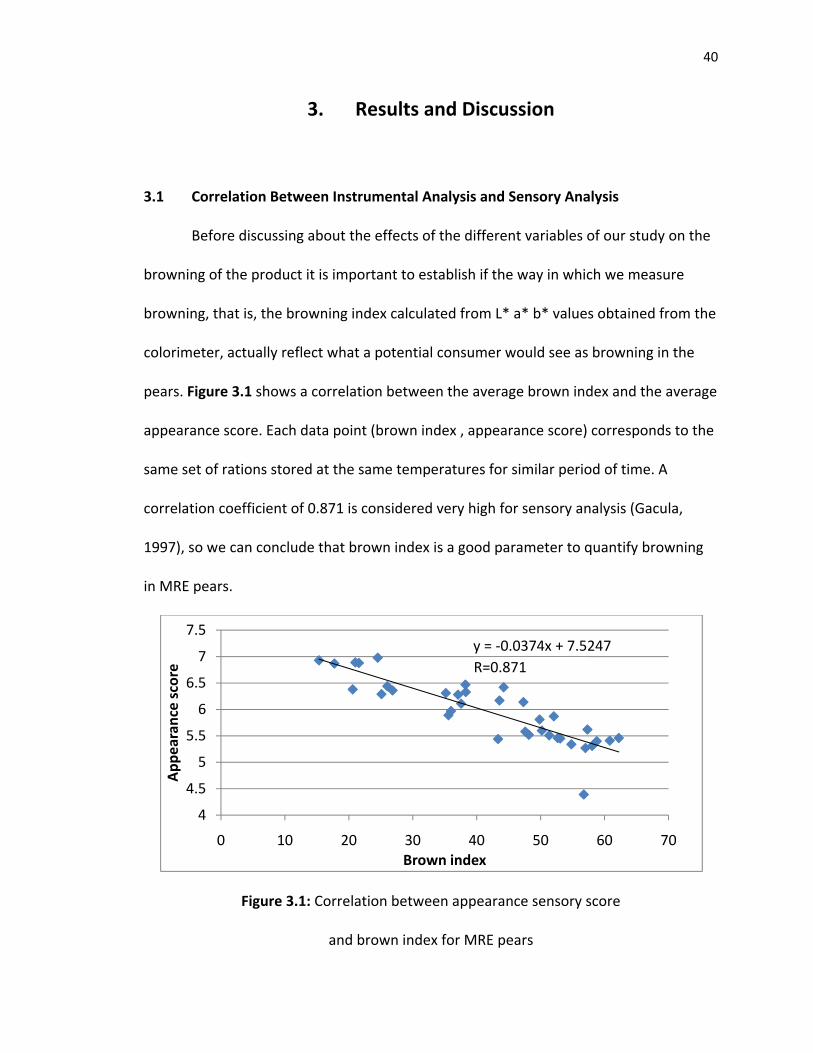
3.1 Correlation Between Instrumental Analysis and Sensory Analysis
Before discussing about the effects of the different variables of our study on the
browning of the product it is important to establish if the way in which we measure
browning, that is, the browning index calculated from L* a* b* values obtained from the
colorimeter, actually reflect what a potential consumer would see as browning in the
pears. Figure 3.1 shows a correlation between the average brown index and the average
appearance score. Each data point (brown index , appearance score) corresponds to the
same set of rations stored at the same temperatures for similar period of time. A
correlation coefficient of 0.871 is considered very high for sensory analysis (Gacula,
1997), so we can conclude that brown index is a good parameter to quantify browning
in MRE pears.
y = ‐0.0374x + 7.5247R² = 0.7586
4
4.5
5
5.5
6
6.5
7
7.5
0 10 20 30 40 50 60 70
Appe
aran
ce sc
ore
Brown index
R=0.871
Figure 3.1: Correlation between appearance sensory score
and brown index for MRE pears

41
Based on the information provided by the U.S. Army Natick Soldier Center, a
score of 6 after 30 days of storage at 48.8ºC (end of shelf life) was considered
acceptable. The 95% confidence interval for brown index that would achieve such a
value would be between 38.3 and 43.7, with a mean of 41.
A similar analysis was done for texture, between the average hardness of the
pears and the average texture score in the sensory analysis. The results, seen in Figure
3.2, indicate that there is no correlation between these parameters. It is important to
consider that the sensory analysis was for preference. Unlike appearance, where a
browner pear would most definitely have a lower score or at best the same score as a
lighter pear, consumers do not necessarily prefer a harder pear over a softer one. The
fact that several samples had similar hardness and yet got very difference scores in the
sensory analysis is an indication of that.
44.55
5.56
6.57
7.58
0 50 100 150 200 250
Texture score
Hardness (grams)
Figure 3.2: Correlation between texture sensory score
and hardness for MRE pears.

42
3.2 Fresh D’Anjou Pears and its Effect on Color and Texture of MRE pears
Fresh D’Anjou pears were introduced as a variable in the study to avoid using
already processed pears as a starting material and end up with a double processed pear
in the MRE rations. The Army requires that the contractors be able to produce MRE pear
rations anytime during the year, because the demand cannot always be anticipated, and
since Bartlett pears have a short harvesting season and shelf life, year‐long supply of
fresh Bartlett pears is not possible. However, D’Anjou pears have a longer harvesting
season and a much longer shelf life under refrigeration, so fresh D’Anjou pears can be
available any time during the year.
Figure 3.3 shows the browning of MRE pears prepared with canned Bartlett
pears and fresh D’Anjou pears; packaging was done in regular film and processed under
regular conditions with 800 ppm of ascorbic acid. The difference in the initial
measurements can be attributed to the thermal processing that Bartlett pears
underwent during canning, so these measurements were not considered for statistical
analysis, which shows no significant difference (Table 3.1).

43
0
10
20
30
40
50
60
70
Before retorting
0 15 30 45
Brow
n inde
x
Storage time (days at 48.8ºC)
Fresh D'Anjou pears
Canned Bartlett pears
Figure 3.3: Browning of MRE pear rations produced using fresh D’Anjou pears
and canned Bartlett pears
Table 3.1: ANOVA for color of MRE pears prepared with canned Bartlett pears or fresh
D’Anjou pears
Source Sums of squares
D.F. Mean Square
F value Significance
Storage time 3332.68 2.00 1666.34 21.29 0.00Pear type 9.37 1.00 9.37 0.12 0.73Storage time *Pear type 105.02 2.00 52.51 0.67 0.51Error 6573.72 84.00 78.26Total 10019.66 89.00

44
Texture, however, was greatly influenced by the type of pears used to prepare
the MRE rations. Figure 3.4 shows the results of hardness measurements, and Table 3.2
shows that there was significant difference for the effect of pear type in the texture.
This result was expected as it is known that thermal processing weakens the structure of
plant cells, so double processing the pears rations would significantly affect the textural
quality of the product. Figure 3.2 shows that the highest sensory scores were achieved
with pears of hardness between 50 and 100 g, which correspond to fresh D’Anjou pears.
0
10
20
30
40
50
60
70
0 15 30 45
Hardn
ess (g)
Storage time (days at 48.8ºC)
D'Anjou pears
Bartlett pears
Figure 3.4: Texture results of MRE pear rations produced
using fresh D’Anjou pears and canned Bartlett pears

45
Table 3.2: ANOVA for texture of MRE pears prepared with canned Bartlett pears or fresh
D’Anjou pears
Source Sums of squares
D.F. Mean Square
F value Significance
Storage time 7147.02 3.00 2382.34 12.25 0.00Pear type 33240.21 1.00 33240.21 170.85 0.00Storage time * Pear type 1330.80 3.00 443.60 2.28 0.08Error 38132.28 196.00 194.55Total 79794.15 203.00
3.3 Modifications in Packaging and Thermal Processing
Experiments were carried out to determine if the MRE pouches had an effect on
browning of pears compared to tin cans, since it is known that canned fruits have a very
long shelf life. The color measurements of MRE pears and pears reformulated according
to the MRE specifications and repacked in tin cans are shown in Figure 3.5; significant
difference was found between pears packed in MRE pouches compared to tin cans, as
shown in Table 3.3. Furthermore, the color of pears packed in lacquered cans and of
MRE pears to which stannous chloride had been added degraded as fast as pears in MRE
pouches (results not shown); however, pears in MRE pouches in which pieces of tin cans
were placed inside did not degrade as fast as regular MRE pears (results not shown).
Since the presence of metallic tin was the only difference between these treatments,
and it is known that tin reacts with oxygen (Lee et. al., 2008; Eskin, 1990), we started
working under the assumption that oxygen had to play a significant role in the browning
reaction.

46
0
10
20
30
40
50
60
70
80
Before retorting
0 15 30 45
Brow
n inde
x
Storage time (days at 48.8ºC)
MRE Bartlett pears
Recanned Bartlett pears
Figure 3.5: Browning of MRE pears compared to pears packed in tin cans
Table 3.3: ANOVA for pears packed in tin cans and MRE pouches
Source Sums of squares
D.F. Mean Square
F value Significance
Storage time 34738.40 3.00 11579.47 162.77 0.00 Packaging 3501.38 1.00 3501.38 49.22 0.00 Storage time * Packaging 299.47 3.00 99.82 1.40 0.24 Error 11168.67 157.00 71.14 Total 49777.35 164.00
Figure 3.6 and Figure 3.7 show the evolution of oxygen and carbon dioxide on a
molar basis in MRE pouches. It was found that almost all the oxygen in the headspace of
the pouches was consumed during thermal processing, and that carbon dioxide was
formed throughout storage. Based on these findings and the literature on browning
reactions, we think that ascorbic acid degradation was involved in the browning of MRE

47
pears. The oxygen is consumed to form dehydroascorbic acid during thermal processing
at a very high rate due to the high temperature. Dehydroascorbic acid is degraded
during storage (Kacem et. al., 1987a) to form diketogulonic acid and carbon dioxide,
among other by‐products, when reacting to form brown pigments.
1
10
100
Before retorting 0 15 30 45
Oxygen (µmoles/pou
ch)
Storage time (days at 48.8ºC)
Figure 3.6: Oxygen content in the headspace of regular MRE pears

48
0
5
10
15
20
25
30
35
40
Before retorting
0 15 30 45
CO2(µmoles/pou
ch)
Storage time (days at 48.8ºC)
Figure 3.7: Carbon dioxide content in the headspace of regular MRE pears
Oxygen scavenger films were used in order to prevent the oxidation of ascorbic
acid and therefore, reduce the formation of brown pigments. Figure 3.8, Figure 3.9 and
Figure 3.10 show the results of three experiments using iron‐based oxygen scavenger
films. The first two experiments were done with Bartlett pears at the FMT facility, the
color results between the pears in regular pouches and in oxygen scavenger pouches
were significantly different as seen in Tables 3.4 and Table 3.5, but still the pears in
oxygen scavenger film were visually determined to be too dark to be acceptable. The
third experiment was done with D’Anjou pears at Truitt Bros. which had pear flavor at
0.4% (which was previously determined not to influence the browning of the pears)
besides the other ingredients. Table 3.6 shows that no significant difference in browning
was found in this experiment between pears packed in regular MRE pouches and pears
packed in oxygen scavenger pouches. This result was confirmed by the sensory analysis

49
shown in Figure 3.11, in which no significant difference in preference of the appearance
of one sample was found (P<0.0001).
0
10
20
30
40
50
60
70
80
0 15 30 45
Brow
n inde
x
Storage time (days at 48.8ºC)
Regular MRE film
Oxygen scavenger film
Figure 3.8: Color measurements of pears in regular MRE film and
oxygen scavenger film, first experiment
Table 3.4: ANOVA for color of pears packed in regular MRE film and oxygen scavenger
film, first experiment (at FMT Facility)
Source Sums of squares
D.F. Mean Square
F value Significance
Storage time 18205.11 3.00 6068.37 90.74 0.00Packaging 1472.28 1.00 1472.28 22.01 0.00Storage time * Packaging 660.09 3.00 220.03 3.29 0.02Error 8694.04 130.00 66.88Total 29173.38 137.00

50
0
10
20
30
40
50
60
70
80
0 15 30 45
Brow
n inde
x
Storage time (days at 48.8ºC)
Regular MRE film
Oxygen scavenger film
Figure 3.9: Color measurements of pears in regular MRE film and
oxygen scavenger film, second experiment
Table 3.5: ANOVA for color of pears packed in regular MRE film and oxygen scavenger
film, second experiment (at FMT facility)
Source Sums of squares
D.F. Mean Square
F value Significance
Storage time 31333.26 3.00 10444.42 161.78 0.00Packaging 2213.22 1.00 2213.22 34.28 0.00Storage time * Packaging 717.09 3.00 239.03 3.70 0.01Error 11491.68 178.00 64.56Total 45813.43 185.00

51
0
10
20
30
40
50
60
70
80
0 15 30 45
Brow
n inde
x
Storage time (days at 48.8ºC)
Regular MRE film
Oxygen scavenger film
Figure 3.10: Color measurements of pears in regular MRE film and
oxygen scavenger film, third experiment
Table 3.6: ANOVA for color of pears packed in regular MRE film and oxygen scavenger
film, third experiment (at Truitt Bros. facility)
Source Sums of squares
D.F. Mean Square
F value Significance
Storage time 14310.87 2.00 7155.43 94.78 0.00Packaging 268.58 1.00 268.58 3.56 0.06Storage time * Packaging 56.68 2.00 28.34 0.38 0.69Error 11776.96 156.00 75.49Total 26413.09 161.00

52
4.00
5.00
6.00
7.00
8.00
0 2 4 6 8
Appe
aran
ce sc
ore
Storage time (weeks at 48.8ºC)
Regular MRE film
Oxygen scavenger film
Figure 3.11: Sensory score for appearance of MRE pears packed in
MRE pouches and oxygen scavenger pouches
We think that the color results with oxygen scavenger films are not consistent
due to the positions and sizes of iron particles embedded in the film being not uniform,
shown by Gomes et al. (2009). This non uniformity would affect oxygen diffusion into
the pouch and its reaction rate with the iron particles as well as the leaching of iron
particles into the syrup during thermal processing, which would accelerate the oxidation
of ascorbic acid and reduce the effectiveness of the film. An alternate mechanism could
be iron leaching during thermal processing and/or storage and catalyzing Maillard
reaction, however it is unlikely as it would be too much coincidence that the browning
levels matched even though the mechanisms were different.

53
Due to the failure of oxygen scavenger films as a solution to prevent browning in
MRE pears, other options were explored. Full vacuum packaging is normally not used in
pouches because it requires that high vacuum be applied for an extended period of
time, which could puncture the film; however we found settings for the horizontal form
fill sealer machine that allowed to remove almost all the headspace while at the same
time preserving the integrity of the pears and the film. Leaving some headspace in
products that are to be retorted is also convenient since the air bubble enhances heat
transfer by convection. Agitated retorting is also not a standard practice by the Army
contractors when processing pouches because the edges of the pouches suffer damage,
however it was found that if the pouches are properly secured in trays they would not
be damaged.
Figure 3.12 shows the heat penetration curves for a regular stationary process
and an agitated one. Agitation fulfilled its purpose of reducing the come up time for the
pear dices, which in turn reduced the overprocessing of the syrup. Since most of the
ascorbic acid at that point is dissolved in the syrup, reducing overprocessing could
reduce the oxidation of ascorbic acid during thermal processing. It was also found that
the air bubble made no difference in thermal processing when agitation was used.

54
0
20
40
60
80
100
120
0 10 20 30 40 50
Tempe
rature (ºC)
Time (min)
Stationary process
Agitated process
Agitated process, full vacuum packaging
0123456789101112
0 10 20 30 40 50
F value (m
in)
Time (min)
Stationary process
Agitated process
Agitated process, full vacuum packaging
Figure 3.12: a) Temperature history for the retort processes.
b) F value for the retort processes.

55
The effects of full vacuum packaging and agitated thermal processing can be
seen in Figure 3.13. Both treatments have a significant effect in reducing browning of
MRE pears during storage (Table 3.7). Although browning was reduced, it wasn’t fully
prevented. This is because either anaerobic ascorbic acid degradation is still taking place
or Maillard browning has also an effect on browning of MRE pears. Based on the brown
index – appearance sensory score (Figure 3.1), we consider the decrease in browning
achieved with full vacuum packaging and agitated retorting to be meaningful and to
fulfill the objective of extending the MRE pear ration shelf life. The mean brown index
after 30 days at 48.8ºC was 40.29, slightly lower than the mean brown index that would
produce an appearance score of 6, the target at the end of shelf life. The brown indices
achieved with the other treatments after 30 days at 48.8ºC were above the 95%
confidence interval of 40.3 +/‐ 2.7, therefore it is expected that the panelists would
notice them to be browner.
15
25
35
45
55
65
75
0 15 30 45
Brow
n inde
x
Storage time (days at 48.8ºC)
Control
Full vacuum packaging
Agitated retorting
Full vacuum packaging and intensive retorting
Figure 3.13: Effect of full vacuum packaging and agitated retorting on
the formation of brown pigments in MRE pears.

56
Table 3.7: ANOVA of color measurements of pears after different types of processing
Source Sums of squares
D.F. Mean Square
F value Significance
Storage time 65333.60 3.00 21777.87 301.04 0.00Agitated thermal processing 1173.05 1.00 1173.05 16.22 0.00Full vacuum packaging 2070.07 1.00 2070.07 28.62 0.00Storage time * Rotation 211.30 3.00 70.43 0.97 0.41Storage time * Full vacuum 1772.51 3.00 590.84 8.17 0.00Agitation * Full vacuum 70.18 1.00 70.18 0.97 0.33Error 26187.83 362.00 72.34 Total 96376.28 374.00
Figure 3.14 shows the effect of the changes of processing conditions on the
retention of ascorbic acid. Similarly to brown color development, both intensity of
vacuum packaging and type of thermal processing had a significant effect on the
retention of ascorbic acid but there was no interaction between the treatments (Table
3.8). Ascorbic acid degradation continued during storage even though the oxygen was
depleted, which confirmed that anaerobic ascorbic acid degradation was taking place,
which could be contributing to browning. Moreover, ascorbic acid degradation rates
during storage were similar regardless of the processing conditions, which was
expected.

57
200
300
400
500
600
700
800
Before retorting
0 15 30 45
Ascorbic acid cone
ntratio
n (ppm
)
Storage time (days at 48.8ºC)
Control
Agitated retorting
Full vacuum packaging
Full vacuum packaging and agitated processing
Figure 3.14: Effect of thermal processing and vacuum packaging on retention
of ascorbic acid in MRE pear rations
Table 3.8: ANOVA of ascorbic acid measurements of pears after different types of
processing
Source Sums of squares
D.F. Mean Square
F value Significance
Storage time 883284.57 3.00 294428.19 905.37 0.00Agitated thermal processing 5586.39 1.00 5586.39 17.18 0.00Full vacuum packaging 32807.40 1.00 32807.40 100.88 0.00Storage time * Rotation 564.72 3.00 188.24 0.58 0.64Storage time * Full vacuum 2018.39 3.00 672.80 2.07 0.14Agitation * Full vacuum 293.97 1.00 293.97 0.90 0.35Error 6178.86 19.00 325.20Total 930734.30 31.00

58
A possible explanation on the significantly high effect in ascorbic acid and color
retention of reducing the headspace from 4 ‐ 7 mL of air to almost nothing is the
formation of hydrogen peroxide during ascorbic acid oxidation, which could be used by
any peroxidase enzyme that survived thermal processing or recovered activity during
storage. Figure 3.15 shows the absorbance at 420 nm of samples prepared to measure
peroxidase activity; MRE pears packed in regular pouches, processed under regular
conditions (with headspace and stationary thermal processing), and stored for 45 days
at 48.8ºC were used. No peroxidase activity could be detected; moreover, the reagent
control showed higher activity than the sample. This indicates that not even the
spontaneous oxidation of o‐phenylendiamine took place, very likely because the
hydrogen peroxide was degraded by metals present in the pears before it could be used
for any reaction. If this was the case then peroxidase enzymes could still remain active
in the pears however would not have any effect as any hydrogen peroxide formed
would be degraded before they could use it. We attempted to test this by using Chelex®
100 resin to remove metals; however the resin was no effective as the results obtained
were similar to the ones shown in Figure 3.15.

59
0.02
0.04
0.06
0.08
0.1
0.12
0.14
0.16
0 10 20 30 40 50 60
Absorban
ce (a.u.)
Time (min)
Sample activity
Sample control
Reagent control
Figure 3.15: Peroxidase activity in MRE pears
Maillard reaction wasn’t ruled out in this study as a mechanism for browning of
MRE pears, however based on the literature on the reaction and the product
parameters and processing conditions, it is unlikely that it has a significant role. Maillard
browning is favored by high pH and intermediate water activity, which this product did
not have (the water activity was 0.92). The product conditions do favor ascorbic acid
degradation, as a significant proportion of ascorbic acid is in monoionic form (pKa is 4.1
while pH of the product was between 3.85 and 4.15), and catalyzers for the reactions,
such as copper and fructose, were present.

60
3.4 Degradation of ascorbic acid
Experiments done on the effect of oxygen scavenger pouches on ascorbic acid
degradation confirm that these do not fully protect ascorbic acid from oxidation. Figure
3.16 shows the result of ascorbic acid measurements on MRE pears using regular
pouches and oxygen scavenger pouches, both packed with regular vacuum packaging
and retorted under stationary, and compares them with MRE pears in regular pouches
with full vacuum packaging and agitated thermal processing. Although the oxygen
scavenger pouch does increase the retention of ascorbic acid compared to the regular
pouch, the best results were achieved with full vacuum packaging. Figure 3.17 shows
the results of a Tukey test at 0.05 confidence level. Similar effects of increased ascorbic
acid retention in tin cans compared to lacquered cans or glass bottles were described by
Nagy (1980). Although no difference in the rate of anaerobic degradation of ascorbic
acid during storage could be appreciated, we think that the better preservation of color
achieved with full vacuum packaging and agitated retorting is due to a decreased
degradation of ascorbic acid during retorting, which would delay the formation of
brown pigments. Stoichiometric analysis shows that there is a significant time between
the oxidation of ascorbic acid and the formation of brown pigments. After retorting the
ascorbic acid concentration decreases by 120 ppm approximately, which corresponds to
97 µmoles per pouch; however only 20 µmoles of carbon dioxide were formed (Figure
3.7). Ranganna and Setty (1974) showed that in aqueous medium most of the ascorbic
acid forms carbon dioxide when degrading. The same analysis shows that anaerobic

61
degradation also starts during retorting, as the amount of oxygen consumed is not
enough to justify the ascorbic acid loss (Figure 3.6).
0
100
200
300
400
500
600
700
800
Before retorting 0 15 30 45
Ascorbic acid concen
tration (ppm
)
Storage time (days at 48.8ºC)
Regular pouch
Oxygen scavenger pouch
Full vacuum packaging and agitated retorting
Figure 3.16: Ascorbic acid retention with oxygen scavenger films
420 440 460 480 500 520 540 560 580 600
Full vacuum packaging
Oxygen scavenger pouch
Regular pouch
Ascorbic acid (ppm)
Figure 3.17: Tukey test for ascorbic acid retention with
different packaging options (α=0.05)

62
Additional studies, such as leaching of iron to the syrup and oxidation of iron
particles in the film during thermal processing, would be needed to determine if oxygen
scavenger pouches could be optimized by narrowing the size distribution and position of
the iron particles so they became a viable solution to browning problems in MRE pears.
From a processor point of view it could be more convenient to use an oxygen scavenger
film instead of full vacuum packaging, since the second option requires more time to
pull the vacuum and therefore reduces the output of the production line.
Our study shows that the degradation rate of ascorbic acid in MRE pears
increases with increasing concentration of ascorbic acid before retorting, but remains
constant during storage (zero‐order kinetics, dAA/dt = k). This contradicts Nagy and
Smoot (1977), who observed first‐order kinetics at temperatures up to 30ºC in canned
orange juice, and polynomial kinetics above those temperatures. Johnson et al. (1995)
observed a first‐order reaction for anaerobic ascorbic acid degradation in orange juice
serum at 91.1ºC. Riemer and Karel (1978) also observed exponential decay for
anaerobic ascorbic acid degradation on dehydrated tomato juice.
Figure 3.18 shows the results of initial concentrations of 800 ppm and 400 pmm
of ascorbic acid; these rations were packed in regular film and processed under regular
conditions. Additionally, we studied samples of MRE pears prepared by the current
Army contractor, these came from a lot made with canned Bartlett pears but packed in
vertical pouches using steam flush to generate the vacuum; almost no headspace was

63
left in the pouches and the ascorbic acid concentration before retorting was unknown. It
is important to notice that the second to last data point of the MRE pears made by the
Army contractor reaches the level of 800 ppm ascorbic acid MRE pears and yet the
ascorbic acid retention remains linear, which proves that it is not a first order reaction
with low reaction rate. It is possible that anaerobic degradation is enhanced by by‐
products of the reaction, however determining the actual causes for this behavior would
require further studies. Analysis of the degradation rates with the initial concentration
suggest that the rate might reach a maximum value at an initial concentration between
800 ppm and 1,200 ppm of ascorbic acid, however the data available from our
experiments are not enough to reach a conclusion.
y = ‐143.88x + 846.63R² = 0.9962
y = ‐46.969x + 263.35R² = 0.944
y = ‐181.03x + 1323.9R² = 0.9964
0
200
400
600
800
1000
1200
0 15 30 45
Ascorbic acid concen
tration
(ppm
)
Storage time (days at 48.8ºC)
800 ppm
400 ppm
Industry product
Figure 3.18: Anaerobic ascorbic acid degradation with time as function of
initial concentration of ascorbic acid

64
Carbon dioxide was monitored during storage of MRE rations packed in regular
pouches and oxygen scavenger pouches. As mentioned before, carbon dioxide was
generated during storage of pears in regular pouches due to ascorbic acid degradation,
however almost no carbon dioxide was produced in oxygen scavenger pouches, as seen
in Figure 3.19. Since ascorbic acid degradation was proven to take place in oxygen
scavenger pouches, we think that leached iron ions altered the pathway of ascorbic acid
degradation in favor of the formation of organic acids instead of carbon dioxide when
diketogulonic acid is degraded. Ranganna and Setty (1974) have shown that switching
from aqueous to alcoholic medium can alter the pathway of aerobic ascorbic acid
degradation to favor the formation of acetaldehyde instead of carbon dioxide.
0
5
10
15
20
25
30
35
40
Before retorting
0 15 30 45
Carbon
dioxide
(µmoles/pou
ch)
Storage time (days at 48.8ºC)
Regular MRE film
Oxygen scavenger film
Figure 3.19: Effect of oxygen scavenger pouches
on the formation of carbon dioxide

65
The effect of the initial concentration of ascorbic acid on the browning of the
pears was also studied. Since ascorbic acid degradation plays a significant role in the
browning of the product, and it was shown that its degradation rate increases with
increasing initial concentration, it would be expected that a lower concentration of
ascorbic acid would decrease browning of the product. Figure 3.20 shows the browning
of MRE pears packed in regular pouches and processed under regular conditions but
with different initial concentrations of ascorbic acid: 800 ppm, 400 ppm, and
approximately 50 ppm (no ascorbic acid added). Additionally, we included the results
from the product manufactured by the current Army contractor shown in the previous
section (higher initial concentration of ascorbic acid than the specifications but packed
with no headspace). Figure 3.21 shows that there was no significant difference in
browning between MRE pears with 800 ppm and 400 ppm of initial concentration of
ascorbic acid; MRE pears with no ascorbic acid added show slight significant difference,
which vanishes at α=0.1. The product manufactured by the current Army contractor
was not included in the statistical analysis because it was packed under full vacuum.
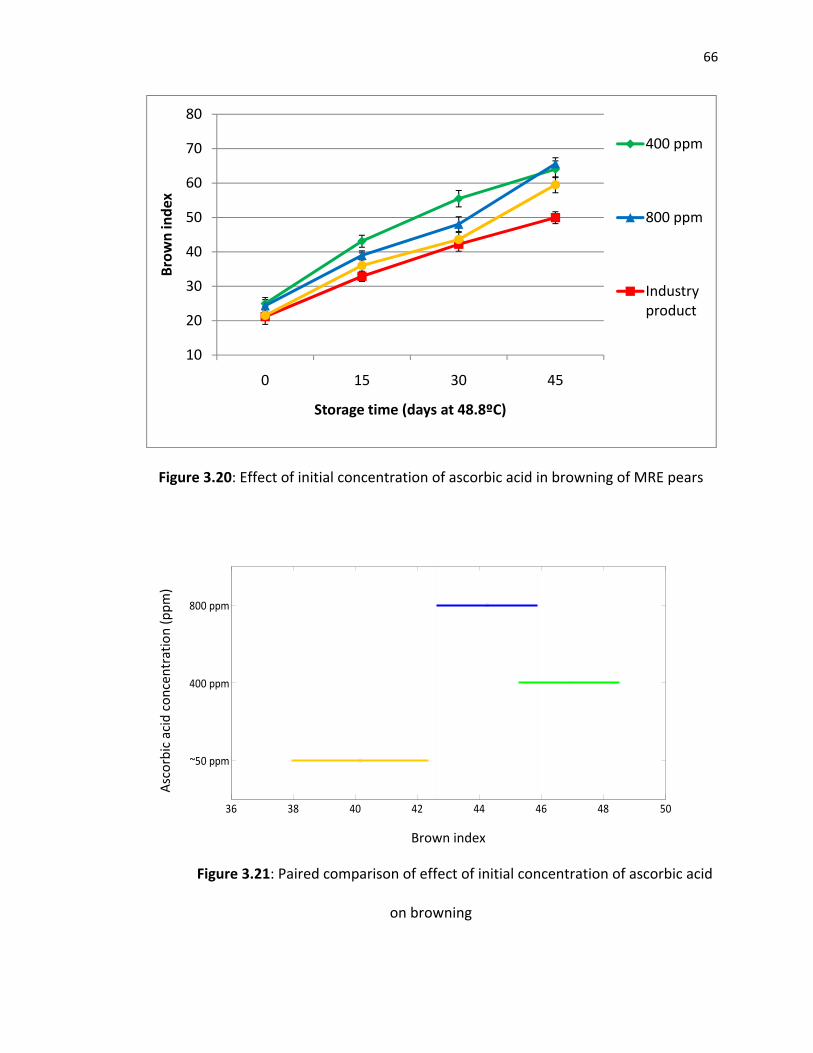
66
10
20
30
40
50
60
70
80
0 15 30 45
Brow
n inde
x
Storage time (days at 48.8ºC)
400 ppm
800 ppm
Industry product
Figure 3.20: Effect of initial concentration of ascorbic acid in browning of MRE pears
36 38 40 42 44 46 48 50
~50 ppm
400 ppm
800 ppm
Ascorbic acid concen
tration (ppm
)
Brown index
Figure 3.21: Paired comparison of effect of initial concentration of ascorbic acid
on browning

67
We think that there is no linear correlation between the amount of brown
pigments and the browning of the product, since no difference was observed between
the samples processed with 800 ppm of ascorbic acid (in which 500 ppm were lost after
45 days) and samples processed with 400 ppm (in which 300 ppm were lost after the
same time). Even though the sample processed with no additional ascorbic acid only
had 50 ppm at the beginning, the difference in browning was not enough to explain a
difference of one order of magnitude in the degradation of ascorbic acid at the end of
shelf life. Another possible explanation is the delay in the formation of brown pigments;
however that cannot fully explain the small difference in browning of the pears with no
additional ascorbic acid and the other samples when the differences in the amount of
ascorbic acid degraded during the first 15 days are considered.

68
4. Summary and Conclusions
The purpose of this project was to delay the browning and increase the hardness
of MRE rations of pears in syrup so they comply with the required shelf life. Headspace
analysis showed that most of the oxygen was consumed during thermal processing, and
that carbon dioxide was formed throughout the shelf life. Ascorbic acid decreased
sharply after thermal processing, and continued to decrease throughout the shelf life
due to anaerobic degradation. Oxygen scavenger films, full vacuum packaging and
agitated retorting were used as strategies to delay browning.
Increasing the intensity of vacuum packing so that almost all the oxygen was
removed from the pouches was the best strategy to reduce the brown color of the MRE
rations to acceptable levels at the end of shelf life. Although it did not affect the rate of
ascorbic acid degradation during storage, which is an anaerobic process, it reduced the
ascorbic acid degradation during retorting as no oxygen was available to react. This
delayed the formation of brown pigments long enough so browning of the pears during
shelf life was significantly reduced. Oxygen scavenger films did not give consistent
results in preserving the color of the pears, and also underperformed full vacuum
packaging in protecting ascorbic acid.
Changing the starting material from canned Bartlett pears to fresh D’Anjou pears
significantly increased the hardness of the MRE pears. Although no correlation between

69
hardness and acceptability of the MRE pears could be determined, it was found that
MRE pears with very low hardness values achieved the lowest scores on the sensory
analysis.

70
5. Future Work
Although shelf life of MRE pears was improved by prevent aerobic degradation
of ascorbic acid, further shelf life extensions would require that anaerobic degradation
be also inhibited. Very few studies were available on the anaerobic degradation of
ascorbic acid, and they only mentioned that fructose was a promoter. Since fructose is a
sugar naturally found in pears and most fruits, a strategy to counter its promoting
effects should be identified.
No studies were done to determine the role of Maillard browning. One method
to do this could be setting up a model system with the same carbohydrates and amino
acids of pears, and at the same water activity and pH levels, but without ascorbic acid.
Measurements of hydroxymethylfurfural, hydroxyfurfural and furfural could also give
insight on the role of Maillard browning in the overall browning of MRE pears.
The kinetics of ascorbic acid degradation found in this study contradicts all
previous studies that were referred. The causes for this are unknown at this point, as
the ascorbic acid levels and other conditions were not very different between our study
and the previous studies. Degradation kinetics of ascorbic acid in MRE pears should be
studied at several initial concentrations in order to better describe its behavior.

71
6. References
1. Adams, J.B.; Brown, H.M. 2007. Discoloration in Raw and Processed Fruits and Vegetables. Critical Reviews in Food Science and Nutrition, 47:319‐333.
2. Bohart, G.S.; Carson, J.F. 1995. Effects of Trace Metals, Oxygen, and Light on the Glucose‐Glycine Browning Reaction. Nature, 175:470.
3. Braverman, J.B.S. 1963. Introduction to the Biochemistry of Foods. London, U.K., Elsevier.
4. Buera, M.P.; Lozano, R.D.; Petriella, C. 1986. Definition of Colour in the Non‐Enzymatic Browning Process. Die Farbe, 32/33:318‐322.
5. Buettner, G.R. 1988. In the Absence of Catalytic Metals Ascorbate does not Autoxidize at pH 7: Ascorbate as a Test for Catalytic Metals. Journal of Biochemical and Biophysical Methods, 16:27‐40.
6. Association of Official Analytical Chemists (AOAC). 1970. Official methods of Analysis of the Association of Official Analytical Chemists.
7. Childers, N.F. 1983. Modern Fruit Science: Orchard and Small Fruit Culture, 9th Ed, Gainesville, FL, Horticultural Publications.
8. Cilliers, J.J.L.; Singleton, V.L. 2002. Nonenzymic Autoxidative Phenolic Browning Reactions in a Caffeic Acid Model System. Journal of Agricultural and Food Chemistry, 37(4):890‐896.
9. Clegg, K.M. 1966. Citric Acid and the Browning of Solutions Containing Ascorbic Acid. Journal of the Science of Food and Agriculture, 17(12):546‐549.
10. Cornwell, C.J.; Wrolstad, R.E. 1981. Causes of Browning in Pear Juice Concentrate During Storage. Journal of Food Science, 46(2):515‐518.
11. Damodaran, S.; Parkin, K.L.; Fennema, O.R. 2008. Fennema's Food Chemistry, 4th Ed., Boca Raton, FLA. CRC Press.
12. deMan, J.M. 1999. Principles of Food Chemistry, 3rd Ed., Gaithersburg, MD, Aspen Publishers.
13. Downing, D.L. 1996. A Complete Course in Canning and Related Processes,13th Ed., Baltimore, MD. CTI Publications.

72
14. Dunne, P.; Brack, H. 1988. Instructions for Performing Polyphenol Oxidase and Peroxidase Enzyme Assays for Fruits and Vegetables. Science and Advanced Technology Directorate ‐ U.S. Army Natick Research, Development, and Engineering Center.
15. Eskin, N.A.M. 1990. Biochemistry of Foods, 2nd Ed., San Diego, CA, Academic Press.
16. Francis, F.J.; Clydesdale, F.M. 1975. Food Colorimetry: Theory and Applications. Westport, Conn. Avi Publications Co.
17. Gacula, M. 1997. Descriptive Sensory Analysis in Practice. Oxford, UK. Blackwell Publishing Ltd.
18. Gibriel, A.Y., El‐Sahrigi, A.F., Kandil S.H.; El‐Mansy, H.A. 1978. Effect of pH, Sodium Chloride and Sucrose on Heat‐Inactivation and Reactivation of Peroxidases in Certain Ffoods. Journal of the Science of Food and Agriculture, 29(3):261‐266.
19. Gomes, C.; Castell‐Perez, M.E.; Chimbombi E.; Barros, F.; Sun, D.; Liu, J.; Sue H.J.; Sherman, P.; Dunne, P.; Wright, A.O. 2009. Effect of Oxygen‐Absorbing Packaging on the Shelf Life of a Liquid‐Based Component of Military Operational Rations. Journal of Food Science, 74(4):E167‐E176.
20. Halim, D.H.; Montgomery, M.W. 1978. Polyphenoloxidase of D’Anjou Pears (Pyrus communis L.). Journal of Food Science, 43(2):603‐608.
21. Holdsworth, S.; Simpson, R. 2007. Thermal Processing of Packaged Foods, 2nd Ed., New York, Springer.
22. Hsu, A.F.; Shieh, J.J; Bills, D.D.; White, K. 1988. Inhibition of Mushroom Polyphenoloxidase by Ascorbic Acid Derivatives. Journal of Food Science, 53(3):765‐767.
23. Ibarz, A.; Pagán, J.; Garza, S. 1999. Kinetic Models for Colour Changes in Pear Puree During Heating at Relatively High Temperatures. Journal of Food Engineering, 39(4):415‐422.
24. Jackson, J.E. 2003. Biology of Apples and Pears, New York, Cambridge University Press.

73
25. Johnson, J.R.; Braddock, R.J.; Chen, C.S. 1995. Kinetic of Ascorbic Acid Loss and Nonenzymatic Browning in Orange Juice Serum: Experimental Rate Constants. Journal of Food Science, 60(3): 502‐505.
26. Kacem, B.; Cornell, J.A.; Marshall, M.R.; Shireman, R.B.; Matthews, R.F. 1987. Nonenzymatic Browning in Aseptically Packaged Orange Drinks: Effect of Ascorbic Acid, Amino Acids and Oxygen. Journal of Food Science, 52(6):1668‐1672.
27. Kacem, B.; Matthews, R.F.; Crandall, P.G.; Cornell, J.A. 1987. Nonenzymatic Browning in Aseptically Packaged Orange Juice and Orange Drinks. Effect of Amino Acids, Deaeration, and Anaerobic Storage. Journal of Food Science, 52(6):1965‐1967.
28. Khan, M.M.T.; Martell, A.E. 1967. Metal Ion and Metal Chelate Catalyzed Oxidation of Ascorbic Acid by Molecular Oxygen. I. Cupric and Ferric Ion Catalyzed Oxidation. Journal of the American Chemical Society, 89(16):4176‐4185.
29. Khan, M.M.T.; Martell, A.E. 1967. Metal Ion and Metal Chelate Catalyzed Oxidation of Ascorbic Acid by Molecular Oxygen. I. Cupric and Ferric Chelate Catalyzed Oxidation. Journal of the American Chemical Society, 89(26):7104‐7111.
30. Kluter, R. A., Nattress, D. T., Dunne, C.P., Popper, R.D. 1996. Shelf Life Evaluation of Bartlett Pears in Retort Pouches. Journal of Food Science 61(6): 1297‐1302.
31. Lee, D.S.; Yam, K.L.; Piergiovanni, L. 2008. Food Packaging Science and Technology, 1st Ed., CRC Press.
32. Markuze, Z. 1963. Effects of Traces of Metals on the Browning of Glucose‐Lysine Solutions. Roczniki Panstwowego Zakladu Hig., 14:65‐70.
33. Marshal, M.R.; Kim, J.; Wei, C. 2000. Enzymatic Browning in Fruits, Vegetables and Seafoods. FAO In: http://www.fao.org/ag/Ags/agsi/ENZYMEFINAL/Enzymatic%20Browning.html.
34. McLellan, K.M.; Robinson, D.S. 1981. The Effect of Heat on Cabbage and Brussels Sprout Peroxidase Enzymes. Food Chemistry, 7(4):257‐266.
35. Moulding, P.H.; Goodfellow, J.; McLellan, K.K.; Robinson, D.S. 1989. The Occurrence of Isoperoxidases in Conference Pears. International Journal of Food Science and Technology, 24(3):269‐275.
36. Nagy, S.; Smoot, J.M. 1977. Temperature and Storage Effects on Percent Retention and Percent US Recommended Dietary Allowance of Vitamin C in

74
Canned Single‐Strength Orange Juice. Journal of Agriculture and Food Chemistry, 25(1): 135–138.
37. Nagy, S. 1980. Vitamin C Contents of Citrus Fruit and their Products: A Review. Journal of Agriculture and Food Chemistry, 28(1): 8–18.
38. Pilipenko, L.; Kalinkov, A.; Spektor, A. 1999. Amino Acid Composition of Fruit in the Manufacture of Sedimentation‐Stabilized Dispersed Products. Chemistry of Natural Compounds, 35(2):208‐211.
39. Raisi, A.; Aroujalian, A. 2007. Reduction of the Glucose Syrup Browning Rate by the Use of Modified Atmosphere Ppackaging. Journal of Food Engineering, 80(1):370‐373.
40. Ranganna, S.; Setty, L. 1968. Ascorbic Acid ‐ Amino Acid Interactions; Nonenzymic Discoloration in Dried Cabbage. Journal of Agricultural and Food Chemistry, 16(3):529‐533.
41. Ranganna, S. & Setty, L. 1974. Nonenzymic Discoloration in Dried Cabbage. III. Decomposition Products of Ascorbic Acid and Glycine. Journal of Agricultural and Food Chemistry, 22(6):1139‐1142.
42. Rattanathanalerk, M.; Chiewchan, N.; Srichumpoung, W. 2005. Effect of Thermal Processing on the Quality Loss of Pineapple Juice. Journal of Food Engineering, 66(2):259‐265.
43. Richard‐Forget, F.C.; Gauillard, F.A. 1997. Oxidation of Chlorogenic Acid, Catechins, and 4‐Methylcatechol in Model Solutions by Combinations of Pear (Pyrus communis Cv. Williams) Polyphenol Oxidase and Peroxidase: A Possible Involvement of Peroxidase in Enzymatic Browning. Journal of Agricultural and Food Chemistry, 45(7):2472‐2476.
44. Riemer, J.; Karel, M. 1978. Journal of Agriculture and Food Chemistry, 26(2):350‐353.
45. Rosenthal, A.J. 1999. Food Texture: Measurement and Perception. Gaithersburg, MD, Aspen Publishers.
46. Salunkhe, D.K.; Kadam, S.S. 1995. Handbook of Fruit Science and Technology: Production, Composition, Storage, and Processing. New York, NY, Marcel Dekker.
47. Schüsler‐Van Hees, M.T.I.W.; Beijersbergen Van Henegouwen, G.M.J.; Stoutenberg, P. 1985. Autoxidation of Catechol (Amine)s. Pharmacy World & Science 7(6):245‐251.

75
48. Shinoda, Y.; Murata, M.; Homma, S.; Komura, H. 2004. Browning and Decomposed Products of Model Orange Juice. Bioscience, Biotechnology, and Biochemistry, 68(3):529‐536.
49. TanrIöven, D.; Eksi, A. 2005. Phenolic Compounds in Pear Juice from Different Cultivars. Food Chemistry, 93(1):89‐93.
50. Taub, I.A.; Singh, R.P. 1998. Food Storage Stability. 1st Ed., Boca Raton, FL, CRC Press.
51. Wong, M.; Stanton, D.W. 1989. Nonenzymatic Browning in Kiwifruit Juice Concentrate Systems during Storage. Journal of Food Science, 54(3):669‐673.
Related Documents