Retail Banking in Hungary: A Foreign Affair? By: John P. Bonin and István Ábel Working Paper Number 356 December 2000

Welcome message from author
This document is posted to help you gain knowledge. Please leave a comment to let me know what you think about it! Share it to your friends and learn new things together.
Transcript
Retail Banking in Hungary: A Foreign Affair?
By: John P. Bonin and István Ábel
Working Paper Number 356December 2000
2
Retail Banking in Hungary:
A Foreign Affair?*
John P. Bonin
Department of EconomicsWesleyan University
Middletown, CT 06459Email: [email protected]
and
Research FellowWilliam Davidson Institute
University of Michigan School of BusinessAnn Arbor, MI
&
István ÁbelProfessor of Economics
Budapest University of Economics
and
Department of MacroeconomcsHungarian National Bank
December 2000
! This paper was prepared for the World Bank as background for the World Development Report2001,"Institutions for Markets." We are very grateful to the World Bank for financial support. We areextremely appreciative of the support, advice and encouragement that we have received from Robert Cullthroughout this project. We thank the Hungarian National Bank for making available much of the dataused in this paper. We are extremely grateful to Elaine Ho for providing expert and timely researchassistance. However, all opinions expressed in this paper are solely the responsibility of the authors andshould not be attributed to any institution with which we are affiliated or to the World Bank. As authors,we take full responsibility for all errors and omissions.
3
Abstract
Over the last decade, Hungary has experienced more foreign bank entry than any
country in world, starting with foreign greenfield operations and then followed by the
privatization of four of its largest banks to strategic foreign owners. Currently about two
thirds of all banking assets in Hungary are foreign owned; the only major bank without a
foreign owner is Országos Takarékpénztár és Kereskedelmi Bank (OTP). During a
decade in which lending to households declined in real terms until recently and
household deposits remained relatively steady at around 20% of GDP, OTP lost its
monopoly in retail banking to foreign-owned banks. By the end of the decade, OTP held
shares of just over 50% in both household deposit and credit markets. In the last half of
the decade, foreign banks increased substantially their market shares and currently hold
more than 40% of all household deposits and about 40% of all loans to households. In
this paper, we identify the important role played by foreign greenfield operations in
intermediation within the household sector, especially from 1997. We provide evidence
that, once they take control of formerly state-owned banks, strategic foreign investors
move aggressively into retail banking. As the decade came to a close, retail banking was
a growth industry in Hungary and foreign-owned banks were actively participating in
both markets.
Foreign entry provided healthy competition to OTP and prodded this widely
held domestically controlled bank to develop new products and better services for
Hungarian households. Over the last half of the decade, bank cards have been introduced
to Hungarian households and transactions using these cards have grown by a factor of
more than five. Over half of the population uses bank cards twice a month on average,
almost exclusively for cash withdrawals from their current accounts. By investing
heavily in information technology and using its extensive branch network, OTP has
become the market leader in this new, growing business with more than 40% of all ATMs
and bank cards issued in Hungary and more than 70% of all bank card transactions. Our
analysis of OTP’s behavior indicates that domestically controlled banks with local
expertise may have a significant role to play in retail banking in small, open transition (or
emerging) economies.
4
Non-Technical Summary
With 56.6% of its banking assets in majority foreign-owned banks in 1999,
Hungary has the highest degree of foreign bank ownership among all emerging market
economies. Banking assets to GDP stood at 68.4% in 1999 so that this measure indicates
significant foreign penetration into the financial sector. Early entry of foreign greenfield
operations and privatization of the major commercial banks to foreign investors over a
three-year period resulted in foreign subscribed capital equal to two-thirds of total
banking equity by the end of the decade. Hungary’s banking sector is concentrated with
the top five banks accounting for 56.2% of assets and 47% of corporate lending. Amidst
this foreign-dominated banking sector, a majority domestic-owned bank, Országos
Takarékpénztár és Kereskedelmi Bank (OTP), is the largest bank in Hungary with 25% of
all banking assets. OTP is a dominant force in retail banking with more than a 50% share
of traditional household business and over 70% of the bank card market. We argue that
foreign bank competition provided the impetus to drive OTP to improve its products and
services while its monopoly position in retail banking was being steadily eroded.
The literature on foreign bank entry contrasts the welfare-enhancing benefits to
the host country’s banking sector with the cream-skimming of high-quality clients that
weakens domestic banks. In transition countries, the inherited legacies of segmented
banking and state-ownership pose special problems for banking sector development.
Recent studies (Buch, 1997 and 2000) indicate the foreign banks are essential to this
process as their presence counters soft lending and generates competitive pressure after
achieving a threshold market share.
This paper documents the rationalization of the retail-banking sector in Hungary
over the last decade. From a monopoly position at the beginning of the decade with
98.4% of loans to households and 93.2% of household deposits collected, OTP steadily
lost market share until it held 55.7% of household loans and 52.4% of household deposits
by the end of the decade. Much of this lost market share was taken up by foreign
greenfield banks that, starting from negligible amounts in 1993, made up 22.7% of the
credit market and 15.9% of the deposit market by 1999. Bank privatization played a
crucial role as four of the seven largest in Hungary were sold to foreign owners from
1994 to 1997. Three of these banks moved aggressively into collecting household
5
deposits and two increased their lending to household significantly after their
privatization. By the first half of 2000, foreign-owned banks held 42.3% of household
deposits and 39.6% of retail loans in Hungary.
By the end of the decade, retail banking was growing in Hungary after steady
declines in activity in real terms throughout the decade. The new plastic era of debit cards
and ATMs dawned around the middle of the decade. With personal checking almost non-
existence, Hungarians use their debit cards primarily to withdraw cash from ATMs for
transaction purposes. With three times more branches than its nearest competitor, 43% of
the ATMs, and a state-of-the-arts IT system, OTP captured 71% by volume of the bank
card business in 1999. This 65% Hungarian-owned bank with the same Hungarian CEO
for the last eight years has positioned itself to compete successfully in the new growth
industry of retail banking in Hungary. This paper demonstrates that domestic banks can
play an important role in the banking sector of an emerging market country even when
foreign bank penetration is significant so long as they use their comparative advantage
properly to meet the competitive challenge.
Key words: Hungarian banking, retail banking in emerging markets, foreign bank entry
JEL classification numbers: G1, P2, F3
6
1. Foreign Entry into Banking: The Transition Economies Are Different
Hungary has the highest level of foreign ownership in the domestic banking
system among emerging market countries. At the end of 1999, the ratio of assets of
banks in which foreigners owned more than 50% of total equity to total assets of the
Hungarian banking sector was 56.6% up from 19.8% in 1994 (IMF, 2000). When the
threshold level for foreign control is lowered to at least 40% foreign ownership in a bank,
the IMF figure increases to 80.4% in 1999. In Latin America, only Chile has more than
50% of its banking sector controlled by foreign interests and that was 53.6% in 1999 by
both measures. In other Central European countries, 52.8% of banking assets were held
by majority foreign owned banks in Poland while this figure was 49.3% in the Czech
Republic in 1999. However, these levels were reached much later in both countries than
in Hungary as only 2.1% of the banking assets in Poland and 5.8% in the Czech Republic
were controlled by foreigners in 1994. Furthermore, when the threshold is lowered to
40%, foreign control in 1999 increases only to 50.7% in the Czech Republic and remains
at 52.8% in Poland. By allowing foreign banks to set up de novo greenfield operations
and by privatizing its large commercial banks to strategic foreign investors, the
Hungarian government permitted foreign banks to penetrate deeper and more quickly into
its banking sector than has any other government in the region.
Even before the political change, the Hungarian government had been receptive to
foreign bank activity. The first such venture, founded in 1979, Central-European
International Bank (CIB) began as an offshore dollar-based bank. The founders were a
consortium of German, Italian, and Japanese partners, with the National Bank of Hungary
(NBH) as a minority shareholder. For most of the previous decade, CIB was actually two
7
large banks. In 1998, these two entities were merged and the NBH sold its stake to the
Italian partners. CIB is now fully owned by an Italian banking group. Citibank Budapest
was established in 1985 with Citibank taking 80% of the shares and the NBH holding the
remaining 20%. In 1993, Citibank purchased NBH’s shares so that it is now the sole
owner of the bank. In addition to CIB and Citibank, 17 other banks with majority foreign
ownership were operating branches in Hungary in 1993 (Bonin, et. al., 1998). In that
year, foreign bank equity equaled 12.4% of the subscribed capital in the Hungarian
banking sector.
After several recapitalizations of large state-owned banks by the Ministry of
Finance, bank privatization began in Hungary in 1994 with the sale of the foreign trade
bank, Magyar Külkereskedelmi Bank (MKB), founded in 1950. Beginning in 1994,
foreign ownership in bank equity increased annually from 16.4% to 35.7% in 1995,
49.0% in 1996 and to 60.8% in 1997 (Karvalits, 2000). By the end of 1997, five of the
seven largest banks in Hungary were foreign owned. At the end of 1999, foreign
subscribed capital amounted to 65% of the total equity of the Hungarian banking sector.
Indicators of both monetization of the economy and market concentration in the
banking sector have decreased over the last decade in Hungary. Banking assets to GDP
fell from 90.9% in 1991 to 68.4% by 1999 while the market share in term of assets of the
five largest banks decreased from 80.2% in 1990 to 56.2% by 1999. In terms of
corporate lending, the market share of the top five banks was reasonably constant over
the last half of the decade and stood at 47% in 1999. Of these five banks, only Országos
Takarékpénztár és Kereskedelmi Bank (OTP), or as it is now known in English, the
National Savings and Commercial Bank, does not have a foreign majority owner. Table 1
8
contains a list of the 35 commercial banks in Hungary divided into three groups by the
NBH based on a bank’s share of total banking sector assets in 1998. Of the large banks,
Postabank, established as a private bank, is the only bank other than OTP that remains
domestically owned. Nationalized in 1998, Postabank is now state-owned. The current,
but controversial, plan is to merge Postabank with OTP in exchange for shares of the
latter.
What is the likely impact of such extensive foreign ownership on the banking
products and services provided to Hungarian households? The literature on foreign bank
entry concentrates on its effects on the efficiency and stability of the entire domestic
banking sector. Although foreign penetration should enhance the efficiency of the
domestic banking sector and, hence, be welfare improving, it also puts competitive
pressure on weak domestic banks. The early literature concludes that foreign banks have
traditionally followed their customers who had already established a position in the host
country through foreign direct investment. Since these foreign multinationals were not
likely to use domestic banking services, foreign banks were not competing directly with
domestic banks for customers according to this view. However, recent literature
indicates that foreign banks are now entering host countries in a more aggressive manner
attempting to acquire domestic clients and to take market share away from domestic
banks (Seth, Nolle and Mohanty, 1998). Thus, foreign bank entry is a double-edged
sword as it is welfare enhancing for the host country’s banking sector as a whole but
often threatening to the market position of already weak domestic banks as foreign banks
cream skim by taking away good clients.
9
Claessens, Demirgüc-Kunt and Huizinga (1998) study the effects of foreign bank
entry in eighty countries, both developed and developing, over an eight-year period from
1988 to 1995. By investigating performance differences between domestic and foreign
banks, these authors find that meaningful foreign entry was followed by a reduction in
both the profitability and the overhead expenses of domestic banks. In their analysis, the
efficiency effects in emerging markets did not depend on foreign banks gaining
significant market share. Goldberg, Dages, and Kimney (2000) find evidence in
Argentina and Mexico that foreign entry increased the stability of the domestic banking
sectors because loan growth increased while the volatility of this growth decreased.
However, banking sectors in transition economies are different from their counterparts in
either developed or developing countries due to the legacies of the monobank system and
culture. During the Communist period in Hungary, a separate state savings bank, OTP,
and a separate foreign trade bank, MKB, existed alongside the NBH, which acted as the
recorder of all domestic commercial transactions. In 1987, a two-tier system was created
by dividing up the commercial portfolio of the NBH among three newly created banks:
Magyar Hitel Bank (MHB), Kereskedelmi és Hitel Bank (K&H), and Budapest Bank
(BB). At that time, all five of these large banks were state-owned and, with the possible
exception of MKB, their personnel lacked experience with modern banking techniques
and culture.
For transition economies, Buch (1997) argues that foreign bank entry improves
the production of financial services, promotes competition, facilitates the privatization of
domestic banks, and transfers know-how and new technology to the host countries. In her
view, foreign banks are essential to the rapid development of a modern banking sector in
10
transition economies. In a later paper, Buch (2000) presents data on interest spreads to
suggest that the achievement of a threshold level of foreign ownership of banking assets
may be necessary before much competitive pricing pressure is felt by domestic banks.
Interest rate spreads in Poland and the Czech Republic have been relatively constant from
1995 to 1999 whereas, in Hungary, the spread has declined by almost 50% since 1997.
By the end of 1997, the three commercial banks created from the NBH portfolio and the
foreign trade bank had been privatized to strategic foreign investors and the share of the
corporate credit market held by foreign banks exceeded 70%. In Poland and the Czech
Republic, this same figure was under 20% at the end of 1997. This evidence is
consistent with a hypothesis that foreign banks do create a more competitive market
environment in transition economies, but only after they have attained sufficient
aggregate market share.
Buch (2000) considers data on classified credits to indicate that the mere presence
of active foreign banks has a positive influence on combating soft lending in transition
economies. In Poland, the share of classified credits decreased from a peak of around
30% in 1993 to around 10% in 1998. In Hungary, qualified credits were 29.1% of the
total loan portfolio in 1993 on the eve of the first major bank privatization (Karvalits,
2000). That ratio had dropped to 7.9% by the end of 1997 but, in 1998 due primarily to
the Russian crisis, it increased to 10.5%. In 1999, qualified credits as a percentage of
total loans stood at 8.4% in Hungary. In the Czech Republic, the share of classified
credits remained high at around 30% throughout the last half of the decade. This
stagnation is due partly to restrictive entry practices regarding greenfield foreign
operations but, more importantly, to the passive attitude toward proper commercial
11
banking practices taken by the foreign owner of IPB, the only large Czech bank to be
privatized until recently. This spring, IPB was taken over by the Czech National Bank
after a scandal involving the tunneling of assets from the bank’s investment funds by the
foreign owner, the Japanese investment bank Nomura. Until 1999, other large Czech
banks were state-owned, a factor that contributed to a soft lending environment. Hence,
evidence from the transition economies is consistent with the hypothesis that a credible
threat of competition from foreign banks disciplines domestic banks and leads to an
improvement in the quality of their portfolios, so long as the soft lending environment is
not perpetrated, or tacitly approved, by the government.
Performance comparisons between domestic and foreign banks have been used as
evidence of the benefits of foreign entry for the banking sectors in transition economies.
Using averages across ownership class from 1996 to 1998, the IMF reports the following
data for the three fast-track Central European countries (IMF, 2000, Table 6.2, p.166). In
the Czech Republic, returns on equity for foreign banks were 14.4% but minus1.6% for
domestic banks while comparable figures for Poland were 24.1% and minus 0.1%. In
Hungary, the difference was more dramatic, 16.1% for foreign banks versus minus 26%
for domestic banks. In the Czech Republic, the percentage of problem loans was
significantly greater in domestic banks, 28.5% to 18.8%, while in Poland domestic banks
actually had a smaller percentage of problem loans, 9.1%, to 11.1% for foreign banks. In
Hungary, foreign banks had fewer problem loans as a percent of total lending, 10.6%
versus 15.1%; however, the margin was not as wide that in the Czech Republic.
However, comparisons of this sort must be interpreted carefully because they may fail to
account for classification changes due to the ongoing privatization of domestic banks.
12
Furthermore, if foreign banks cherry pick and buy the more profitable domestic banks
first, some of the differences observed in transition economies may be due to selection
bias. Hence, we do not rely on such comparisons for judging the impact of foreign bank
entry in Hungary in this paper.
Retail banking takes on even more distinct characteristics in transition economies
due to the inherited monopolistic structure from the monobank regime. In Hungary, OTP
dominated retail banking at the beginning of the decade, as did its counterpart, Ceska
Sporitelna in Czechoslovakia. Due to its extensive branch network throughout the
country, OTP collected virtually all of the household deposits and held all of the housing
loans on its balance sheet. For rational markets to develop for both household lending
and deposit collection, OTP had to lose its monopoly position in retail banking. The
interesting question was: from where would the competition come?
In this paper, we analyze the role played by foreign banks in rationalizing retail
banking over the last decade in Hungary. To account for the changing classification due
to the privatization of state-owned domestic banks, we consider two types of foreign
banks. Foreign greenfield operations consist of independent de novo branches set up in
Hungary by foreign banks. “Foreign owners” refers to banks that were originally state-
owned banks but have been subsequently privatized to foreigners. In section 2, we
present data to show that, after almost a decade of decline, retail banking is currently a
growth industry in Hungary. By examining the market shares for banks grouped by size
and ownership type, we document the dramatic expansion of foreign bank participation in
both household credit and deposit markets over the latter half of the decade. Taking the
shares of six individual large banks in both of these markets, we provide evidence that
13
privatization to a majority foreign owner increases a bank’s retail activity. Section 3
investigates the impact of this foreign competition on the one large healthy remaining
domestic bank, OTP. Although its monopoly position has eroded throughout the decade,
OTP has managed to maintain a dominant position in retail banking. The bank has
moved aggressively into the new bank card business by combining its extensive branch
network with state-of-the-arts information technology. Section 4 concludes with an
assessment of the role played by foreign banks in balancing retail markets and in
prodding OTP to provide improved services and new products to Hungarian households.
2. Retail Banking in Hungary: A Growth Industry
2.1: The Structure of Retail Banking
Table 1 contains a list of the 35 commercial banks in Hungary divided into three
groups by the NBH based on a bank’s share of total banking sector assets in 1998. Of
these, three were liquidated during 1999 so that information on their assets is not
available. For the others, assets in billions of forints and market share at the end of 1999
are provided in the table (data are taken from Hungarian Banking Association, 2000).
Using the 4% threshold to designate a bank as large, Bank Austria-Creditanstalt would
have become a member of this class by the end of 1999. The balance sheet of this bank
grew by 45.2% in 1998 and 27.7% in 1999 (Sebestyén, 1999). As a group, the seven
large banks held 65% of all banking assets, while the twelve medium-sized banks held an
aggregate share of 29.1% in 1999.
In addition to these 35 commercial banks, there were four specialized credit
institutions and four home savings and loan associations operating in Hungary in 1999
14
bringing the total of financial institutions in the banking system to 43. The largest of
these specialized institutions is the state-owned Hungarian Development Bank (MFB),
founded in 1991, having 179.2 billion HUF in assets in 1999. Second in size, the
Hungarian Export-Import Bank held assets valued at 64.6 billion and is the state-owned
bank financing international trade. Founded in 1997, FHB- Land Credit and Mortgage
Bank has the Ministry of Finance (47.2%) and MFB (40.3%) as its principal owners and
held assets valued at 8.6 billion. The fourth specialized financial institution, Cetelem
Bank, is a French-based financial institution specializing in consumer finance that held
assets worth 2.5 billion in 1998 (the 1999 figure is unavailable).
The largest of the four housing and loan associations is OTP Building Society,
founded in 1997 and wholly owned by OTP, with assets of 23.1 billion HUF in 1999.
Fundamenta was founded in 1996 by the Bank of Hungarian Savings Cooperatives along
with a German building society as its majority (86%) foreign owner and held 14.9 billion
assets. HVB Mortgage Bank is owned wholly by HypoVereinsbank, Germany’s second
largest credit institution, and is a real estate bank with assets valued at 4.1 billion. Otthon
Building Society was founded in 1998 by one of Austria’s largest building societies
taking a majority interest (70%) and held 1.5 billion in assets in 1999. In addition to
these 43 banks, there were 217 savings and credit cooperatives operating in Hungary in
1999. The shares in total assets by classification of all credit institutions in Hungary in
1999 were 90.3% for commercial banks, 5.8% for savings and credit cooperatives, and
4.0% for specialized credit institutions and housing and loan associations (calculated
from NBH, 1999, p.101).
15
2.2 A Decade of Retail Banking in Hungary
After almost a decade of decline, the retail credit business is poised to take off and
become a growth industry. Although commercial banks have lost market share to
cooperative credit institutions during this period, they are taking an active part in the
current expansion. Table 2 indicates that credits to households from the entire financial
sector were 5.3% of GDP in 1990 but that ratio declined steadily from a peak of 8% in
1991 to 2.6% in 1998. In real terms, household credits declined in each year beginning in
1992 until 1999. The trends are similar for commercial banks, although their market
share declined from a peak of 87.2% in 1991 to 81.8% in 1998. Finally, 1999 witnessed
strong real growth as credits to households from the financial sector increased at an
annual rate of 25.4% to bring the credit to GDP ratio back up to 3.1%. This growth was
distributed almost equally between commercial banks and cooperative credit institutions.
The growth trend in household credit continued for the first six months of 2000 as the
half-year growth rate of nominal credit was 15.6%, which would be close to the 1999
nominal growth rate of 35% if this increase continued in the second half of 2000. In
summary, lending to household is currently a growth activity in Hungary and commercial
banks play the largest role by far in the expansion.
The household deposit market has been relatively stable throughout the decade
and it also indicates significant current growth. Over the decade, commercial banks
actually gained share in this market relative to cooperative credit institutions. Table 3
shows that the ratio of household deposits to GDP increased from 17.2% in 1990 to
22.3% in 1992 and then stabilized at around 21% for the middle of the decade. In the last
few years, household deposits have been about 20% of GDP. Although, as Table 3
16
indicates, household deposits decreased in real terms in 1993, 1995, 1996 and 1998, real
deposit growth was a strong 7.7% in 1999. The six-month increase in nominal deposits
for the first half of 2000 was 22.2% up substantially from an annual nominal growth rate
of 17.7% in 1999. Household savings institutions began taking deposits in 1997 and their
market share has grown to 1.7% in only two years. The deposit market share of
commercial banks increased from 84% in 1990 to 89.9% in 1999 while that of
cooperatives fell from 16% to 8.4%. In summary, the main primary deposit collecting
institutions in Hungary are commercial banks.
To measure the extent to which primary deposits are returned to the household
sector as loans, we compute the household credit to deposit ratios for financial
institutions by type and size in Table 4. An institution having a high credit to deposit
ratio is involved mainly in intermediation within the household sector, whereas one
having a low ratio is using household deposits primarily to fund corporate lending and
support the other assets on its balance sheet. Over the decade, the overall credit-to-
deposit ratio has decreased, especially for commercial banks, indicating that increasingly
more intermediation is taking place between household and non-household sectors. In
1990, the credit-to-deposit ratio for the financial sector as a whole was 30.6%; this ratio
declined from a peak of 41.7% in 1991 to 15.6% in 1999. In 1991, the household credit-
to-deposit ratio for commercial banks (44.3%) was actually larger than the same ratio for
cooperative credit institutions (38.2 %). Although these ratios were almost equal in 1992,
credits to deposits fell consistently over time for commercial banks so that, by 1999, the
ratio was less than half that of cooperatives, i.e., 14.2% versus 34%. Household savings
institutions are just now beginning to lend from their deposit base so that their ratios are
17
relatively insignificant. In summary, commercial banks used their primary deposits to
fund assets outside of the household sector increasingly over the decade while
cooperative credit institutions relied more heavily on household loans to place their
deposits.
2.3 Size Matters: Indirect Evidence of Foreign Activity
Looking only at the averages for commercial banks masks important differences
among banks of varying size. Because banks move from the state-owned category to
another classification after privatization, it is useful to consider trends over the entire
decade when banks are classified by size in addition to ownership type. From 1994 to the
present, the number of banks considered in the “large” category by the NBH has been
effectively constant at 7. Prior to 1998, CIB consisted of two separate entities so that the
count was 8 but these two were merged into a single bank in 1998. The number of
medium-sized banks has held constant at 12 since 1994. With the exception of General
Banking Trust, which was sold to a Russian bank in 1996, all medium-sized banks were
foreign banks throughout the period (see Table 1). From 1994 to 1997, the number of
small banks decreased from 24 to 19 as a result of consolidation; this number was
reduced further to 16 by the beginning of 1999.
Although moving erratically throughout the decade, Table 4 indicates that the
credit-to-deposit ratio for medium-sized banks becomes larger than that of large banks
beginning in 1998. More dramatic is the credit-to-deposit behavior for small banks;
beginning in 1994, this ratio exceeds that for all other financial institutions by a wide
margin. Currently, small banks are returning more than six times as much of their

18
deposit base to the household sector than are other banks and almost two and a half times
as much as are cooperative credit institutions. Part of the reason for this dramatic
difference can be attributed to the small deposit base of these banks. Until 1995, small
banks held less than 2% of all household deposits (see Table 6). However, the market
share of small banks grew rapidly so that, by 1996, small banks held about 4% of all
household deposits. Hence, the high credit-to-deposit ratios for small banks from 1996
onwards are important indicators of intermediation within the household sector in
Hungary. For the most part, small banks are currently using the household deposits that
they collect to lend to households while larger banks are using them primarily to support
corporate lending and other types of assets.
Turning to the retail activity of commercial banks only, Table 5 indicates that the
large banks have lost their monopoly position in credit markets as medium-sized and
small banks gain significant market share over the decade. Large banks decreased credits
to the household sector in real terms in every year from 1992 to 1998. In 1992, large
banks provided virtually all of the credit to households as they held a commanding
market share of 99.3%. By 1999, this share had decreased to 67.2% and fell still further
to 65.1% after the first six months of this year. Large banks continued to lose market
share even though the real credits that they have extended to households grew by 17.8%
and the six-month increase in nominal credits in 2000 is 12.1% or about the same annual
rate as in 1999. During the decade, large banks went from a monopoly position in
household credit markets in 1992 to having less than two-thirds of the market currently.
In summary, the consumer credit market has been rationalized as large banks faced
increased competition and lost retail business to smaller banks.
19
In contrast to large banks, medium-sized and small banks exhibited substantial
and sustained real growth in credits to households beginning in 1997. Specialized credit
institutions were licensed for operation beginning in 1997; as a group, they now have
about a 1% share of the household credit market. As Table 5 shows, from a market share
of 0.3% in 1992, medium-sized banks accounted for 13.5% of all household credits by
1999 and 14.6% after the first six months of this year. Having a market share of only 0.4
in 1992, small banks increased their market share dramatically in 1994 to 6.8% and again
in 1997 to 18.8%. Since small and medium-sized banks are foreign controlled for the
most part, Table 5 provides indirect evidence of the heightened activity of foreign banks
in the retail credit market in Hungary over the last few years as the combined market
share of small and medium size banks is currently 33.5%.
The dramatic changes in market share by small banks are explained mainly by
changes in the Hungarian tax code. In 1994, a few banks made substantial loans to
households for the purpose of purchasing investment funds that were then used as
collateral for the bank loans. Changes in the treatment of these funds in the personal
income tax code made this especially attractive to households. Among the small banks
actively participating in this venture were Polgári Bank, which lent 9 billion HUF.
Among medium-sized banks, Creditanstalt actively pursued this business by lending to
households 4 billion HUF. In 1997, a change in the tax treatment of car leasing led to an
expansion in car loans. Merkantil Bank increased its lending by 3 billion HUF and
Porsche bank made additional car loans equaling one billion HUF in that year. Currently,
the market share of small banks in household credits is 18.9% up slightly from 18.6% at
the end of 1999. Coupling this information about market share with the figures for their
20
credit-to-deposit ratios, small banks play a significant intermediation role within the
household sector in Hungary. As can be seen from Table 1, small banks tend to be
foreign-owned.
On the deposit side, Table 6 indicates that the monopoly position of large banks
has also eroded over the decade although not as drastically as it did in the credit market.
Medium-sized banks are the large bank’s main competitors for household deposits. From
a share of 96.8% in 1990, the market share of large banks falls steadily to 82.6% at the
end of 1999 and further to 81.5% in the first six months of 2000. Throughout this period,
medium-sized banks exhibit significant positive real growth in their household deposit
base with the exception of 1996. The significant drop in deposits held by medium-sized
banks in 1996 is due to the merger of one bank with K&H, a large bank, and the
liquidation of another bank. Starting from a market share of only 2.6% in 1990, these
banks currently hold 14.7% of all household deposits up slightly from 14.2% at the end
of 1999. Despite real growth in household deposits in all years until 1999, small banks
hold only about 4% of all household deposits. The significant drop in deposits held by
small banks in 1999 is due to the mergers of Polgári Kereskedelmi Bank (which consists
of Pénzintézeti Központ Bank and its affiliation, Polgári Bank) with Postabank and EKB
with Citibank and to the liquidation of Reálbank. As a group, small and medium-sized
banks currently hold 18.5% of all household deposits in Hungary. Hence, we have again
indirect evidence of a strong presence of foreign banks in retail banking.
21
2.4 Ownership Matters but Careful Interpretation is Required
The advantage of looking at commercial banks by size and inferring evidence
about the influence of foreign banks is that changes in categories due to privatization do
not interfere with an interpretation of the trends. Beginning in 1994 with the privatization
of MKB, the Hungarian foreign trade bank, to a strategic foreign owner, the ownership
structure of large banks changed dramatically. CIB remains a foreign majority owned
bank throughout the entire period but all six of the other banks change their ownership
structure. OTP became a domestic private bank when 34% of its shares were sold on
equity markets to domestic and foreign portfolio purchasers in 1995. BB was sold to a
strategic foreign owner (GE Capital) at the end of 1995. In December 1996, MHB was
privatized when ABN-Amro bought virtually all of the state’s shares and later merged
MHB with its greenfield operation to create MHB-ABN-Amro. K&H was privatized to a
strategic foreign owner in July 1997. An insolvent Postabank was nationalized at the
beginning of 1998.
Table 7 presents data for household credit markets organized by ownership type
beginning in 1993. The impact of a change in ownership can be seen dramatically by
looking at the category “domestic” under private banks in 1995. The privatization of
OTP shifted this bank from the “state-owned” category to the private domestic one and
led to an increase in market share for the latter category from 0.9% in 1994 to 88% in
1995. Another example of the same phenomenon occurred in 1994 for the category
“foreign owner” under private banks when the sale of MKB influenced the market share
data. Finally, the nationalization of Postabank caused the state-owned market share to
increase from 0.9% in 1997 to 4.0% in 1998. As expected, the market share of the group
22
of banks classified as “state-owned” declined continually with each subsequent bank
privatization, from a near-monopoly position of 98.9% in 1993 until Postabank’s
nationalization in 1998.
From a market share of 15% at the end of the privatization program, foreign
banks of both types have increased their lending to households and now hold almost 40%
of the household credit market. Table 7 documents the dramatic growth in credit
extended to households by foreign greenfield operations. From a low 0.7% in 1993,
foreign greenfield banks have grown their credit market share to 24.3% currently. The
most dramatic growth began in 1997 when credit extended to households by these banks
more than doubled. From a market share of 4.5% in 1996, foreign greenfield operations
attained a share of 22.7% in 1999 for a more than fourfold increase over this four-year
period. Adding to this trend, the share of household credits extended by foreign majority
owned banks increased from 2% with the privatization of MKB and to 15.3% currently.
By 1998, four of the large former state-owned commercial banks had been
privatized to foreign majority owners so that the data in the category “foreigner owner”
under private banks refer to a fixed set of banks for the last two years only. Interestingly,
Table 7 records a substantial increase in household credits extended by this group of
banks from 1998 onwards as their market share triples. In 1999, foreign banks, a category
that combines both foreign greenfield banks and those privatized to foreigners, have
34.8% of the household credit market and this figure jumps to 39.6% after the first six
months of 2000. In summary, foreign banks as a group have become significant
participants in household credit markets.
23
Regarding the collection of household deposits, Table 8 documents that state-
owned banks steadily lost market share from 90.4% in 1993 to 5.5% in 1999 with the big
drop occurring in 1995 as expected with the privatization of OTP. Foreign greenfield
operations showed strong growth of their household deposit base throughout the period as
their share increased from 1.1% in 1993 to 15.9% in 1999. Looking at the two post-
privatization years for banks that are controlled by a foreign owner, their share of
household deposits increased from 21.7% in 1997 to 25.6% in 1999 and to 27.3% after
the first six months of 2000. From a market share of 31.3% at the end of the privatization
program, foreign banks of both types now hold 42.3% of all household deposits up
slightly from 41.5% at the end of 1999. In summary, foreign banks have taken an active
role in household deposit collection in Hungary, both as greenfield operations and as
strategic foreign investors in domestic banks.
With respect to intermediation, foreign banks tend to return more of their primary
deposits to the household sector. As Table 9 indicates, the credit-to-deposit ratio for
foreign greenfield banks was higher than for any other ownership type by the end of the
decade as it exceeded by about 50% the ratio for all commercial banks from 1998
onwards. This is not due to these banks having a small deposit base, as in the case of
small banks, because the primary deposit base of foreign greenfield banks grows rapidly
from 1993 (see Table 8). Although the credit-to-deposit ratio for foreign-owned banks is
at most one-half of that ratio for all commercial banks throughout the period, this ratio
was increasing rapidly in the two years following the completion of the privatization
program for major banks. In summary, their relatively high credit-to-deposit ratios in the
last few years indicate that, as they become increasingly more active in retail banking,
24
foreign banks are returning a significant proportion of their primary deposits to the
household sector.
Clearly, if the share of foreign banks in retail banking has been increasing rapidly
over the last few years in Hungary, the market share of other banks must have declined.
Table 10 contains market shares of household loans and deposits for six of the seven
large banks during this period, with only CIB missing from the group. The data are
compiled from annual reports of the individual banks; the six-bank totals are slightly
inconsistent with the aggregates for the seven large banks that were based on NBH data
and reported in the previous tables. As the data in Table 10 indicate, OTP held a virtual
monopoly position in retail banking with a market share of 98.4% in the credit market
and 93.2% of all household deposits in 1990. However, OTP’s shares in both markets
eroded continually throughout the decade providing the counter experience to the
increase in shares of foreign banks. Thus, competition in retail banking came from an
unexpected source in Hungary.
2.5 Post-Privatization Behavior of Foreign Owners
Earlier, we argued that some of the effects of the privatization of domestic banks
to strategic foreign owners in Hungary are discernible from Tables 5 and 6 by examining
the credit and deposit activities of banks in the category “foreigner owner” of private
banks from 1998 onwards. Table 10 presents a more detailed picture of the post-
privatization period for each of four previously state-owned banks, MKB, BB, MHB, and
K&H. The bold numbers indicate data for the period following the year of the bank’s
privatization to a majority foreign owner. Three of these four banks increased their share
25
of household deposits significantly in the post-privatization years. Since household
deposits grew in real terms during the post-privatization period for each of the banks (see
Table 3), these increased shares indicate significant real growth of each bank’s primary
deposit base. Over a five-year period, MKB raised its share more than threefold. During
a four-year period, BB’s share almost doubled. MHB-ABN Amro grew its share over
three years by more than 50%. Only K&H did not increase its household deposit market
share after privatization. The likely explanation for this result is that K&H acquired
Ibuszbank, a small retail bank that had been established by the privatized, but previously
state-owned, travel agency, at the end of 1995. The purchase is evident from the table as
K&H’s share of household deposits jumped from 2.5% in 1995 to 8% in 1996. This
acquisition made the K&H’s branch network the second largest in Hungary to OTP and
continued to have a significant impact on K&H’s deposit base throughout the latter part
of the period swamping any privatization effect in deposit collection.
Leaving aside K&H, the evidence indicates that, once privatized to a majority
foreign owner, banks actively seek household deposits. This increase in collecting
household deposits is not surprising since foreign banks often purchase existing domestic
banks for their “bricks and mortar” branch systems. This strategy allows a foreign bank
access to household deposits without making a costly greenfield investment in a new
branch system. Hence, once a state-owned bank is privatized, the new foreign owner is
likely to expand the primary deposit base to take advantage of this relatively cheap source
of funds.
Regarding household credit activity, only BB and MHB-ABN Amro grew market
share appreciably after privatization. Over a four-year period, BB’s market share
26
increased over ten-fold while MHB-ABN Amro grew its share by more than four times
over a three-year period. As is obvious from Table 10, these increases are from very
small base levels. With the fourth largest branch network in Hungary, BB’s post-
privatization strategy was clearly aimed at developing its consumer credit business.
While its share of consumer lending was increasing from 0.4% in 1995 to 3.9% in 1999,
its share of corporate lending was decreasing from 9.7% to 7% during the same period
(Karvalits, 2000). Furthermore, BB’s share of the corporate market sank to only 5.5% in
1997. With the third largest branch network in Hungary consisting of more than 104
branches, ABN-Amro has recently claimed that it is also actively seeking retail banking
business (Business Central Europe, 2000)
By contrast, MKB actually decreased its share in the household credit market over
the entire post-privatization period from 2% in 1994 to 1.1% in 1999, a figure that is
more in line with its pre-privatization share of 0.5% in 1993. Immediately after
privatization, MKB increased its household lending share but drastically reduced this
activity in 1997. Lacking an extensive branch network, MKB’s post-privatization
strategy has been to expand its high net worth private customer base by issuing plastic
cards and selling investment funds and to retain large dynamic corporate clients. MKB’s
share of corporate lending increased progressively after its privatization from 6.8% in
1995 to a peak of 11.5% in 1998 before falling slightly to 10.7% in 1999 (Karvalits,
2000). Hence, the difference in MKB’s behavior in household credit and deposit markets
is understandable. By seeking the business of higher income retail clients, MKB
increased its deposit share significantly but did not match this with an increase in
27
household credits. Rather MKB used its augmented deposit base to expand lending to
blue-chip corporate clients.
The acquisition of Ibuszbank in 1996 by K&H also had a significant influence on
its credit market share in the post-privatization period; however, K&H did increase its
share of household lending substantially in 1999. This behavior is significant in light of
the fact that 1999 was the first year in which credits to households increased in real terms
since 1992 (see Table 2). Returning to BB and MHB-ABN Amro, both of these banks
increased their market share of household lending significantly in 1999. Hence, three of
the four privatized banks are currently moving aggressively into retail credit now that the
market is showing significant real growth. These banks may be attempting to catch up to
the foreign greenfield banks that began to increase dramatically lending to households
starting in 1997 (Table 7).
2.6 Summary: Foreign Banks Are Now Active in Retail Banking
Foreign banks are currently quite active in providing consumer credit and in
collecting household deposits in what are now growing retail markets in Hungary.
Furthermore, foreign banks have higher household credit-to-deposit ratios indicating that
they participate relatively more than other banks in intermediation within the household
sector rather than between households and other borrowers. Foreign greenfield
operations moved aggressively into retail banking beginning in 1997. Small banks, many
of which were foreign-owned, moved into niche activities, e.g., car financing and lending
for investing in mutual funds. Once a state-owned bank was privatized to a foreign
majority owner, the new owner expanded significantly the primary deposit base and, with
28
only one exception, moved aggressively into household lending. In summary, foreign
bank entry has played a crucial role in rationalizing retail banking in Hungary by
providing needed competition for the monopoly, formerly state-owned, national savings
bank, OTP.
3. OTP: a Domestic Success Story
3.1 The Erosion of OTP’s Monopoly Position in Retail Banking
Founded in 1949 as a state-owned savings bank, OTP had a virtual monopoly
position in collecting household deposits and providing loans to the household sector
prior to 1990. In 1989, old long-term, low-interest housing loans made by the bank were
rationalized by offering advantageous buy-back conditions to the holders who would
otherwise have the terms of their loans renegotiated and adjusted to then current market
conditions. Hence, by the beginning of the decade, the asset side of OTP’s balance sheet
was commercialized. As Table 10 indicates, OTP held 98.4% of all loans to households
and collected 93.2% of all primary deposits in 1990. For retail banking to become more
competitive in Hungary, OTP had to vacate this monopoly position.
In the early part of the decade, competition on the deposit side came primarily
from Postabank. A private domestic bank at the time, Postabank garnered 7.9% of the
deposit market in 1993 and maintained a share of about 7% through the end of 1996.
After a mini-run on the bank, Postabank was nationalized in 1998. Later in the decade,
four other large banks, MHB, K&H, MKB, and BB, began to compete more aggressively
for household deposits, especially after each of these was privatized to a majority foreign
owner. Moreover, the combined share of these six large banks in the deposit market
29
declined continuously over the decade falling from 99.4% in 1990 to 84.6% in 1999.
This trend is consistent with the observed increase in the share of household deposits held
by medium-sized banks over the decade in Table 6. In summary, OTP’s near-monopoly
position in collecting household deposits has eroded until the bank now has a market
share of only 52.4%, primarily because of the gains made by foreign banks, both
greenfield operations and those privatized to foreign owners, in attracting household
deposits.
Regarding credits to households, the combined share of these six banks fell
dramatically from 99.4% in 1990 to 66.4% in 1999 (see Table 10). Unlike in the deposit
market, this decrease was not a continuous decline. In 1994 and again in 1997, the share
of these six banks dropped precipitously. As Table 5 indicates, these were years in which
the share of small banks in household credits rose dramatically. In 1994, OTP lost
significant market share both to these small banks and to the other five large banks,
whose combined market share increased from 1.5% in 1993 to 3.4% in 1994. In 1997,
the loss of market share to small banks was distributed about equally between OTP and
the other five, whose combined market share decreased from 6.4% in 1996 to 4.3% in
1997. However, virtually the entire lost market share in the group can be attributed to
MKB. After expanding its share of domestic credit markets from 0.5% in 1993 to 2.7%
in 1996, MKB reduced dramatically its household lending activity as its share of the
market dropped to 0.7% in 1997. OTP’s share in the household credit market continued
to decline so that it had fallen to 55.7% by 1999. Hence, over the entire period, OTP lost
a total market share of 43.7%. By the end of the decade, OTP held a dominant share,
30
around 50%, but no longer a monopoly position in both aspects of retail banking in
Hungary. Currently, its major competition in both activities comes from foreign banks.
3.2 The New Era of Retail Banking: Plastic Prevails
The last half of the past decade has witnessed a dramatic growth in bank cards in
Hungary. With very few checking accounts introduced to retail customers before 1995,
Hungary has leapfrogged this medium of payment and moved directly to plastic money.
Bank cards linked to individual current accounts, of which there were 6.6 million in
1999, are now used regularly by the majority of the Hungarian populace. Compared with
the other transition economies in the region, Hungary had the second (to Slovenia) largest
number of Visa and Europay cards per 1,000 inhabitants at 358 in 1999, while the figures
for Czech Republic and Poland were 208 and 181, respectively (NBH, 2000). Of all
domestically issued bank cards, 96% were debit cards in 1999. In that same year,
European-based cards dominated the market as 33% of all bank cards were Visa cards
and 62% were Europay cards (NBH, 2000). Hence, Hungary has become a bank-card-
based society with the two major European companies issuing virtually all (95%) of the
mainly debit (96%) domestic bank cards.
The main use of domestically issued bank cards is cash withdrawal, an activity
that accounts for 85% of the number and 94% of the value of all bank card transactions
(HNB, 2000). On average, Hungarians used their debit cards about twice a month for
transactions, with an average value per transaction of 19,425 HUF or about 82 USD in
1999 (Table 11). Although 91% of domestically issued bank cards may be used
internationally, only 2% of the value of transactions was activity abroad. Of this amount,
31
63% was for purchases and 37% for cash withdrawals, a significant difference from
domestic usage. For this small percentage (2% in value) of transactions abroad,
Hungarians are much more likely to use their cards for purchases than for cash
withdrawals. In summary, Hungarians use their bank cards almost exclusively at home
and then almost entirely to withdraw cash from their current accounts.
Emerging from these data is a picture of a primarily cash society in which bank
cards are used by the majority of the populace for convenient access to cash. As Table 11
indicates, the number of bank cards issued domestically has grown by a factor of five
since 1995 and the number of transactions were five and one-half times as large in 1999
as in 1995. The average value of a bank card transaction rose from 8,320 HUF in 1995 to
19,425 HUF in 1999 or almost two and a half times over the five-year period. In U.S.
dollar terms, the increase was from $66.20 in 1995 to $81.85 in 1999 or a 23.5% over the
half-decade. During this same period, the number of ATMs has increased by three and a
half times, although about one-third of all ATMs are in Budapest. As Table 11 indicates,
point of service (POS) outlets in merchandise establishments expanded by about five and
a half times over the half decade. In addition, there were 3,518 POS cash withdrawal
outlets in bank branches and 4,246 such terminals in post offices for a total of 7,764 in
1999. Starting from a base of only 1,706 in 1997, the total number of these POS
terminals increased dramatically in 1998 to 6,794 when post offices branches began
installing them. While this dramatic growth in ATMs and POS outlets was taking place,
the number of bank branches in Hungary actually decreased from 1276 in 1995 to 1199
in 1999 (Table 11). Hence, any bank that can combine bank card related activities with
32
easy access to service points and terminals through an extensive branch system will have
a comparative advantage in retail banking in Hungary in the future.
3.3 OTP: Keeping Ahead of the Times And Remaining Hungarian
At the time of its privatization in May 1995, OTP was the dominant force in retail
banking in Hungary with an 82% share of the retail credit market, 67% of all household
deposits, and 382 branches. The privatization of OTP was designed to insure that it
remain a domestic Hungarian bank. In a public offering, 34% of OTP’s shares was sold
leaving only 25% of its shares held by the state at the time. In the sale, 20% of the bank’s
shares was purchased by foreign portfolio investors (mainly institutions) and the
remaining 14% was purchased by domestic investors and bank employees. No single
foreign investor was allowed to take a stake in excess of 5%. As a result of this initial
offering and subsequent sales of shares, OTP’s current ownership structure is 35%
foreign and 65% domestic of which only 0.2% is held by the state. The chairman and
CEO of OTP, Sandor Csanyi, has held that position since 1992. Hence, OTP’s
privatization was significantly different from that of other large state-owned Hungarian
banks. The bank’s management remained intact after privatization and ownership is
dispersed, mainly to domestic owners, with foreign holdings by portfolio investors only.
In the post-privatization period, OTP’s share of the retail credit market declined
from 82% in 1995 to 70.9% in 1997 and then to 55.7% in 1999. During this same period,
the bank’s share of corporate lending started at 10.4% in 1995, peaked at 12.3% in 1997
and then decreased to 10.9% in 1999. Although OTP currently has the highest share of
the corporate lending market, diversification can not explain its loss of retail credit
33
market share after privatization. Rather OTP’s market position in corporate lending is
explained by the fact that it is the largest bank by far in Hungary holding just over 25.1%
of the total assets in the banking sector in 1999, compared to 9.6% for the next largest
bank, MKB (Table 1). Nonetheless, OTP’s share of corporate lending is only slightly
larger than that of MKB, which was 10.7% in 1999. Hence, despite its declining
household credit market share, OTP is still primarily a retail bank.
During the post-privatization period, OTP’s share of household deposits fell less
rapidly than its share of household lending. From 67% in 1995, the deposit share declined
to 59.7% in 1997 and then to 52.4% in 1999. Moreover, OTP retained its dominant
position as the preferred bank of municipal governments, holding 82% of their deposits
and 72% of their loans in 1999. The wages of all government employees have been paid
by transfers to a bank account from 1999. With its stronghold as the banker of
municipalities, OTP is well positioned to garner a significant share of these deposits.
Although competition from other banks, mainly foreign banks, for primary deposits has
become fierce during the last half of the decade, OTP remains the major collector of
household deposits in Hungary.
More importantly, no bank in Hungary is better equipped than OTP to service the
new bank card business. OTP has the largest branch network by far of any bank in the
country with more than three times the number of branches than its nearest competitor,
K&H. To maintain its dominant position in retail banking, OTP’s post-privatization
strategy focused on increasing the profitability and productivity of its retail business by
investing heavily in information technology. In 1995, the bank launched the introduction
of an integrated account management system to link all of its branches. Since March
34
1996, all current accounts and bank card services at every branch use this system. Since
May 1997, OTP bank card holders have been able to transfer amounts in accounts by
telephone. The new technology makes OTP’s extensive branch network a significant
advantage in attracting bank card business given that the vast majority of the transactions
using cards is cash withdrawal in Hungary.
The dramatic growth in bank card related activity documented in Table 11 was
matched by OTP’s participation in this new business. Data in this paragraph are taken
from various issues of OTP’s annual reports. In 1995, OTP accounted for 30% of all
bank branches, 44% of all ATMs, and 54% of all bank cards issued in Hungary. By
1996, OTP’s share of the bank cards had risen to 60% and it remained around this level
through 1998. In 1998, OTP accounted for 67% of the value of all bank card transactions
and had 42% of the ATMs in Hungary. At the end of 1999, OTP had 420 branches,
which was about 35% of all bank branches in Hungary. In 1999, OTP’s owned 43% of
all the ATMs and the value of its bank card transactions was 71% of the total volume of
such business. Over the last half decade, OTP has maintained a share of over 40% of all
domestically issued bank cards, seen its share of bank branches actually increase
somewhat to 35%, and currently is responsible for more than 70% of the value of all bank
card transactions in Hungary. This private domestic bank is the market leader in the new
world of bank card business in Hungary, thanks to an extensive branch network and its
early investment in information technology.
35
4. Conclusion: Retail Banking with a Hungarian Flavor
After a decade in which all major Hungarian banks, with the exception of OTP,
were privatized to majority foreign owners and foreign greenfield operations moved
aggressively into retail banking, household deposit and credit markets have been
rationalized by competition. From its virtual monopoly position in retail banking at the
beginning of the decade, OTP share in both markets has fallen significantly.
Nonetheless, as the largest bank in Hungary with about 25% of all banking assets, OTP
continues be a dominant force in retail banking holding more than 50% of all household
deposits and making more than 50% of all loans to households. Furthermore, OTP has
more than kept pace with new and growing areas of retail business. The competition from
foreign banks has led to improved services and the introduction of new products, e.g.
ATMs and bank cards, in retail banking. With its extensive branch network and state-of-
the-arts information technology, OTP has acquired over 70% of the bank card market in
Hungary. Hence, in the newest area of retail banking, OTP’s share is higher than in old
activities demonstrating the bank’s ability to stay ahead of the field in retail banking.
OTP’s situation at the beginning of this new decade may be surprising to the
critics of the method of its privatization. The gradual divestiture of the state’s shares,
first to domestic institutional holders and then in several market offerings to domestic and
foreign portfolio investors, left the bank with a dispersed ownership structure and no
foreign strategic investor. Currently, 65% of the bank’s shares are held by Hungarian
owners and 35% by foreign owners. The Hungarian CEO has retained his position for
the last eight years through the entire privatization process; with the exception of changes
made by him and not by new owners, the former management of the bank remained in
36
place. Critics argued that OTP’s privatization was not a real transfer of governance and
would not lead to improved performance of the bank. Our evidence indicates that these
concerns were not justifiable, as OTP is currently the market leader in providing
improved services and new products to its retail customers in Hungary.
Foreign entry, both by setting up de novo greenfield operations and by taking
majority stakes in privatized domestic banks, has played a crucial role in the development
of retail banking in Hungary. By introducing meaningful competition in the second half
of the last decade, foreign banks have provided a needed impetus to prod the largest
domestic bank, OTP, into providing new and better financial products and more and
improved services to its retail customers. The performance of this widely held domestic
bank with a Hungarian management that has been in place throughout much of the
decade indicates that domestic control may be useful in identifying local market
opportunities and taking advantage of local relationships. Levered by strong competition
from foreign banks, Hungary’s largest and still domestically owned bank has taken the
lead in promoting strong, innovative growth in retail banking and, in the process,
increased the welfare of Hungarian households. Hungary has managed to avoid being cut
by either blade of the two-edged sword of foreign bank entry; moreover it provides
evidence that domestically controlled banks with local expertise may have a significant
role to play in retail banking in small, open transition (or emerging) economies.
37
References
Bonin, John P., Mizsei, Kálmán, Székely, István and Wachtel, Paul, Banking in
Transition Economies: Developing Market Oriented Banking Sectors in Eastern
Europe, Edward Elgar Publishing Limited (Cheltenham, U.K.), 1998.
Buch, Claudia M., “Is Foreign Control a Panacea? – On Governance and Restructuring
of Commercial Banks in Transition Economies,” Kiel Institute of World
Economics, mimeo, April 2000.
Buch, Claudia M., “Opening Up for Foreign Banks — Why Central and Eastern Europe
Can Benefit,” Economics of Transition 5(2) (1997): 339-366.
Business Central Europe, June 2000, p.34.
Claessens, Stijn, Demirgüc-Kunt, Asli and H. Huizinga, “How Does Foreign Entry Affect
the Domestic Banking Market?” Policy Research Working Paper 1918, The
World Bank, May 1998.
Dages, B. Gerard, Goldberg, Linda, and Kinney, David, “Foreign and Domestic Bank
Participation in Emerging Markets: Lessons from Mexico and Argentina,”
Economic Policy Review, Federal Reserve Bank of New York, September 2000:
17-36.
Hungarian Banking Association 2000, Budapest, 2000.
International Monetary Fund, International Capital Markets: Developments, Prospects,
and Key Issues, International Monetary Fund, Washington D.C., 2000

38
Karvalits, Ferenc, handouts from a presentation at the National Bank of Hungary,
February 2000.
National Bank of Hungary, Annual Report 1999, Budapest, 1999.
National Bank of Hungary, "The Payment Card Business in Hungary,” April 2000,
downloaded from www.mnb.hu
Országos Takarékpénztár és Kereskedelmi Bank (OTP), Annual Report, various editions.
Sebestyén, István, “Hungarian Banking 1998-1999: Looking for Growth Opportunities,”
Central European Banker, November, 1999: 18-29.
Seth, S, D. E. Nolle and S. K. Mohanty, ‘Do Banks Follow Their Customers Abroad’,
Financial Markets, Institutions, and Instruments 7 (1998) 1–25.
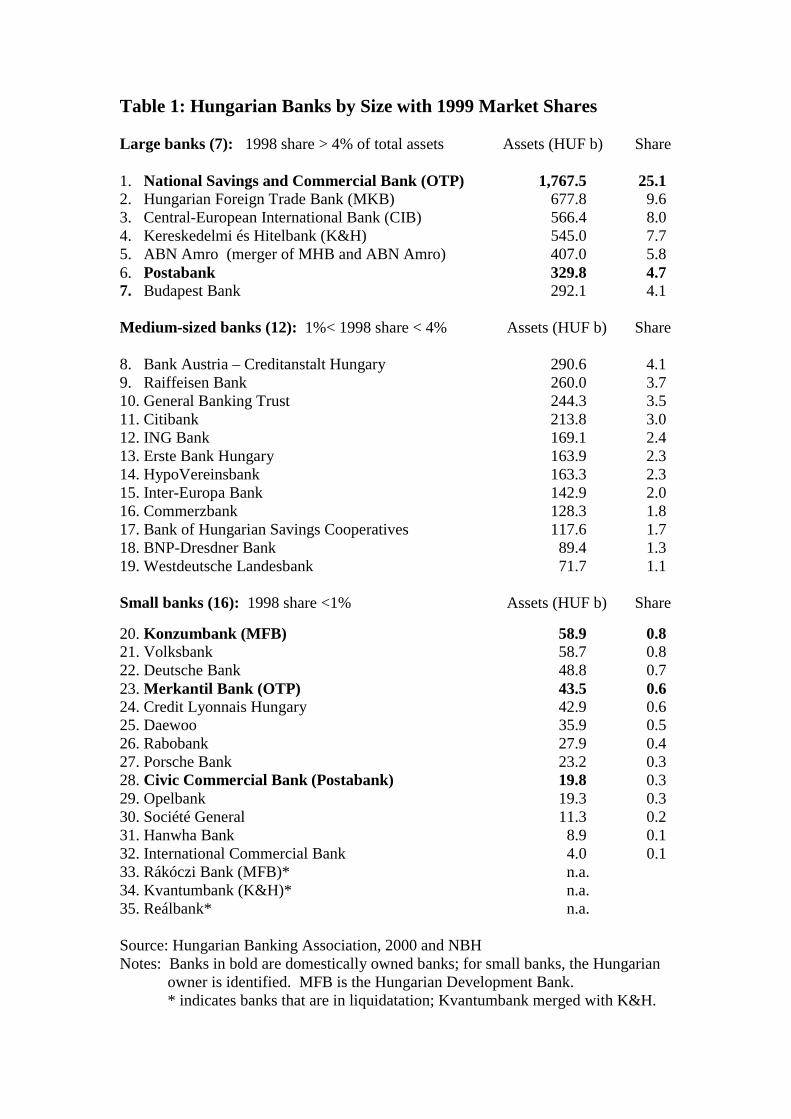
Table 1: Hungarian Banks by Size with 1999 Market Shares
Large banks (7): 1998 share > 4% of total assets Assets (HUF b) Share
1. National Savings and Commercial Bank (OTP) 1,767.5 25.12. Hungarian Foreign Trade Bank (MKB) 677.8 9.63. Central-European International Bank (CIB) 566.4 8.04. Kereskedelmi és Hitelbank (K&H) 545.0 7.75. ABN Amro (merger of MHB and ABN Amro) 407.0 5.86. Postabank 329.8 4.77. Budapest Bank 292.1 4.1
Medium-sized banks (12): 1%< 1998 share < 4% Assets (HUF b) Share
8. Bank Austria – Creditanstalt Hungary 290.6 4.19. Raiffeisen Bank 260.0 3.710. General Banking Trust 244.3 3.511. Citibank 213.8 3.012. ING Bank 169.1 2.413. Erste Bank Hungary 163.9 2.314. HypoVereinsbank 163.3 2.315. Inter-Europa Bank 142.9 2.016. Commerzbank 128.3 1.817. Bank of Hungarian Savings Cooperatives 117.6 1.718. BNP-Dresdner Bank 89.4 1.319. Westdeutsche Landesbank 71.7 1.1
Small banks (16): 1998 share <1% Assets (HUF b) Share
20. Konzumbank (MFB) 58.9 0.821. Volksbank 58.7 0.822. Deutsche Bank 48.8 0.723. Merkantil Bank (OTP) 43.5 0.624. Credit Lyonnais Hungary 42.9 0.625. Daewoo 35.9 0.526. Rabobank 27.9 0.427. Porsche Bank 23.2 0.328. Civic Commercial Bank (Postabank) 19.8 0.329. Opelbank 19.3 0.330. Société General 11.3 0.231. Hanwha Bank 8.9 0.132. International Commercial Bank 4.0 0.133. Rákóczi Bank (MFB)* n.a.34. Kvantumbank (K&H)* n.a.35. Reálbank* n.a.
Source: Hungarian Banking Association, 2000 and NBHNotes: Banks in bold are domestically owned banks; for small banks, the Hungarian
owner is identified. MFB is the Hungarian Development Bank.* indicates banks that are in liquidatation; Kvantumbank merged with K&H.
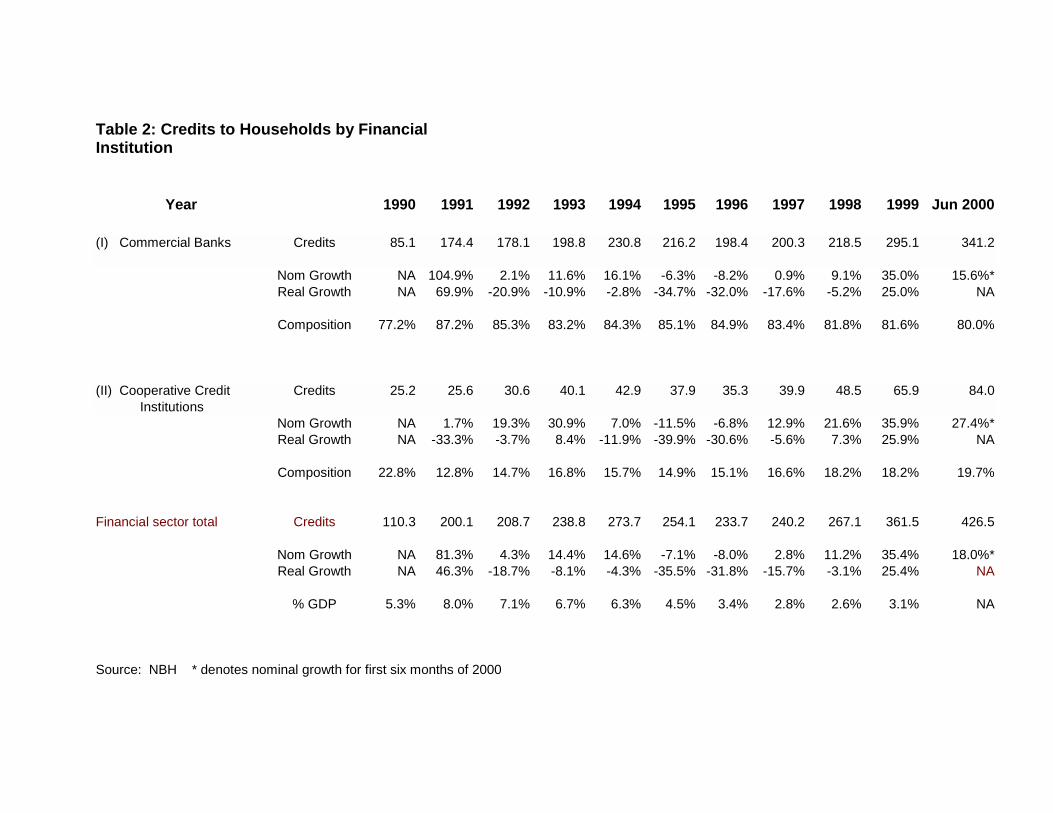
Table 2: Credits to Households by FinancialInstitution
Year 1990 1991 1992 1993 1994 1995 1996 1997 1998 1999 Jun 2000
(I) Commercial Banks Credits 85.1 174.4 178.1 198.8 230.8 216.2 198.4 200.3 218.5 295.1 341.2
Nom Growth NA 104.9% 2.1% 11.6% 16.1% -6.3% -8.2% 0.9% 9.1% 35.0% 15.6%*Real Growth NA 69.9% -20.9% -10.9% -2.8% -34.7% -32.0% -17.6% -5.2% 25.0% NA
Composition 77.2% 87.2% 85.3% 83.2% 84.3% 85.1% 84.9% 83.4% 81.8% 81.6% 80.0%
(II) Cooperative Credit Credits 25.2 25.6 30.6 40.1 42.9 37.9 35.3 39.9 48.5 65.9 84.0 Institutions
Nom Growth NA 1.7% 19.3% 30.9% 7.0% -11.5% -6.8% 12.9% 21.6% 35.9% 27.4%*Real Growth NA -33.3% -3.7% 8.4% -11.9% -39.9% -30.6% -5.6% 7.3% 25.9% NA
Composition 22.8% 12.8% 14.7% 16.8% 15.7% 14.9% 15.1% 16.6% 18.2% 18.2% 19.7%
Financial sector total Credits 110.3 200.1 208.7 238.8 273.7 254.1 233.7 240.2 267.1 361.5 426.5
Nom Growth NA 81.3% 4.3% 14.4% 14.6% -7.1% -8.0% 2.8% 11.2% 35.4% 18.0%*Real Growth NA 46.3% -18.7% -8.1% -4.3% -35.5% -31.8% -15.7% -3.1% 25.4% NA
% GDP 5.3% 8.0% 7.1% 6.7% 6.3% 4.5% 3.4% 2.8% 2.6% 3.1% NA
Source: NBH * denotes nominal growth for first six months of 2000

Table 3: Household Deposits by Type of Financial Institution, inbillions of HUF
Year 1990 1991 1992 1993 1994 1995 1996 1997 1998 1999 Jun2000
(I) Commercial Banks Deposits 302.7 412.9 566.3 671.8 837.2 1,050.3 1,291.0 1,571.3 1,779.2 2,079.7 2,421.5
Nom Growth NA 36.4% 37.2% 18.6% 24.6% 25.4% 22.9% 21.7% 13.2% 16.9% 16.4%*Real Growth NA 1.4% 14.2% -3.9% 5.7% -3.0% -0.9% 3.2% -1.1% 6.9% NA
Composition 84.0% 86.0% 86.1% 86.7% 88.5% 90.2% 89.7% 88.6% 90.5% 89.9% 85.7%
(II) Cooperative CreditInstitutions
Deposits 57.5 67.2 91.1 103.3 108.7 114.3 147.7 199.6 168.2 194.1 354.4
Nom Growth NA 16.8% 35.6% 13.4% 5.2% 5.1% 29.3% 35.1% -15.7% 15.4% 82.6%*Real Growth NA -18.2% 12.6% -9.1% -13.7% -23.3% 5.5% 16.6% -30.0% 5.4% NA
Composition 16.0% 14.0% 13.9% 13.3% 11.5% 9.8% 10.3% 11.3% 8.6% 8.4% 12.5%
(III) Housing Saving Institutions Deposits 0.0 0.0 0.0 0.0 0.0 0.0 0.0 2.8 18.4 40.0 51.0
Nom Growth NA NA NA NA NA NA NA NA 564.4% 116.9% 27.5%*Real Growth NA NA NA NA NA NA NA NA 550.1% 106.9% NA
Composition 0.0% 0.0% 0.0% 0.0% 0.0% 0.0% 0.0% 0.2% 0.9% 1.7% 1.8%
Financial sector total Deposits 360.3 480.1 657.4 775.1 945.9 1,164.5 1,438.7 1,773.6 1,965.9 2,313.7 2,827.0
Nom Growth NA 33.3% 36.9% 17.9% 22.0% 23.1% 23.5% 23.3% 10.8% 17.7% 22.2%*Real Growth NA -1.7% 13.9% -4.6% 3.1% -5.3% -0.3% 4.8% -3.5% 7.7% NA
% GDP 17.2% 19.2% 22.3% 21.8% 21.7% 20.7% 20.9% 20.8% 19.5% 20.1% NA
Source: NBH * denotes nominal growth for first six months of2000
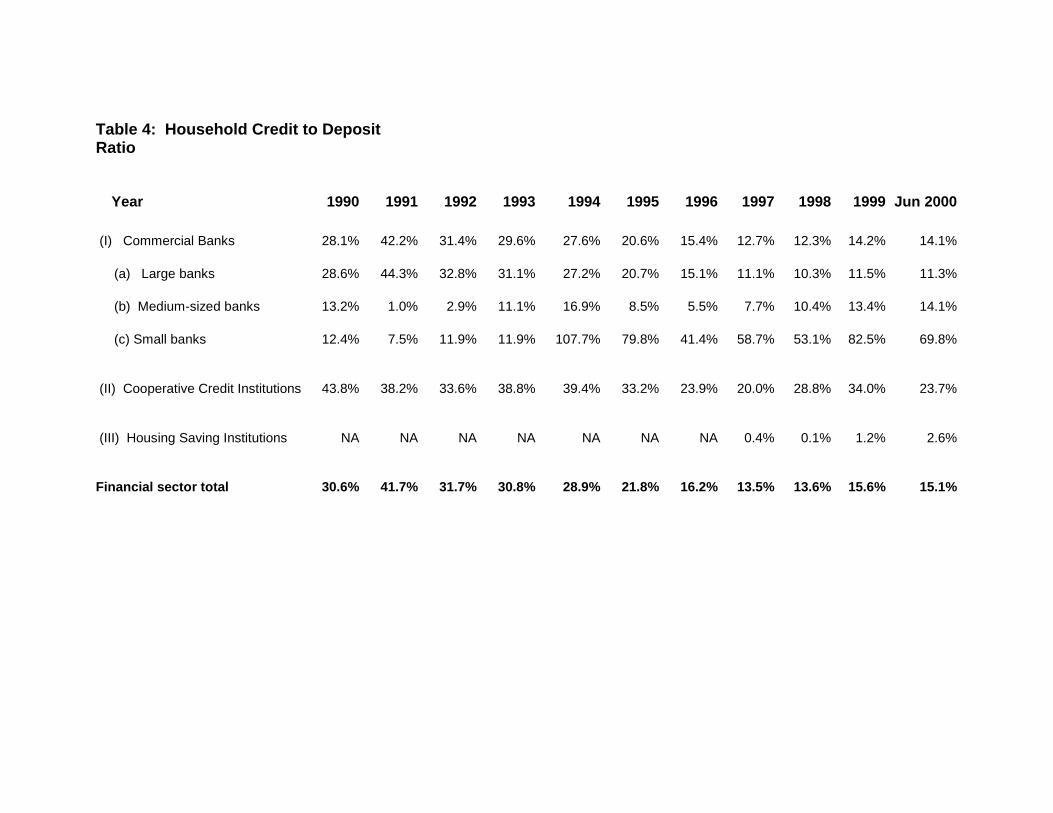
Table 4: Household Credit to DepositRatio
Year 1990 1991 1992 1993 1994 1995 1996 1997 1998 1999 Jun 2000
(I) Commercial Banks 28.1% 42.2% 31.4% 29.6% 27.6% 20.6% 15.4% 12.7% 12.3% 14.2% 14.1%
(a) Large banks 28.6% 44.3% 32.8% 31.1% 27.2% 20.7% 15.1% 11.1% 10.3% 11.5% 11.3%
(b) Medium-sized banks 13.2% 1.0% 2.9% 11.1% 16.9% 8.5% 5.5% 7.7% 10.4% 13.4% 14.1%
(c) Small banks 12.4% 7.5% 11.9% 11.9% 107.7% 79.8% 41.4% 58.7% 53.1% 82.5% 69.8%
(II) Cooperative Credit Institutions 43.8% 38.2% 33.6% 38.8% 39.4% 33.2% 23.9% 20.0% 28.8% 34.0% 23.7%
(III) Housing Saving Institutions NA NA NA NA NA NA NA 0.4% 0.1% 1.2% 2.6%
Financial sector total 30.6% 41.7% 31.7% 30.8% 28.9% 21.8% 16.2% 13.5% 13.6% 15.6% 15.1%

Table 5: Credits to Households byBank Size
Year 1990 1991 1992 1993 1994 1995 1996 1997 1998 1999 Jun 2000
(I) Large banks Credits 83.9 174.0 176.8 192.9 201.2 186.9 173.7 151.8 155.1 198.2 222.2Real Growth NA 72.4% -21.4% -13.4% -14.6% -35.5% -30.9% -31.1% -12.2% 17.8% 12.1%*
Composition 98.5% 99.7% 99.3% 97.1% 87.1% 86.5% 87.5% 75.8% 71.0% 67.2% 65.1%
(II) Medium-sized banks Credits 1.0 0.2 0.6 4.5 13.9 10.5 5.1 10.5 20.5 39.7 49.9Real Growth NA -119.6% 265.7% 607.1% 189.1% -52.5% -75.5% 88.7% 79.8% 83.9% 25.6%*
Composition 1.2% 0.1% 0.3% 2.3% 6.0% 4.9% 2.6% 5.3% 9.4% 13.5% 14.6%
(III) Small banks Credits 0.2 0.3 0.7 1.3 15.8 18.7 19.6 37.7 40.1 54.8 64.4Real Growth NA -6.5% 101.2% 82.7% 1051.7% -9.7% -19.0% 73.6% -8.0% 26.7% 17.5%*
Composition 0.3% 0.2% 0.4% 0.7% 6.8% 8.7% 9.9% 18.8% 18.3% 18.6% 18.9%
(IV)Specializedinstitutions
Credits 0.0 0.0 0.0 0.0 0.0 0.0 0.0 0.2 2.9 2.4 4.7
Real Growth NA NA NA NA NA NA NA NA 1081.2% -28.2% 96.6%*
Composition 0.0% 0.0% 0.0% 0.0% 0.0% 0.0% 0.0% 0.1% 1.3% 0.8% 1.4%
Commercial Banks Credits 85.1 174.4 178.1 198.8 230.8 216.2 198.4 200.3 218.5 295.1 341.2Real Growth NA 69.9% -20.9% -10.9% -2.8% -34.7% -32.0% -17.6% -5.2% 25.0% 15.6%*
Source: NBH * denotes nominal growth for first six months of 2000
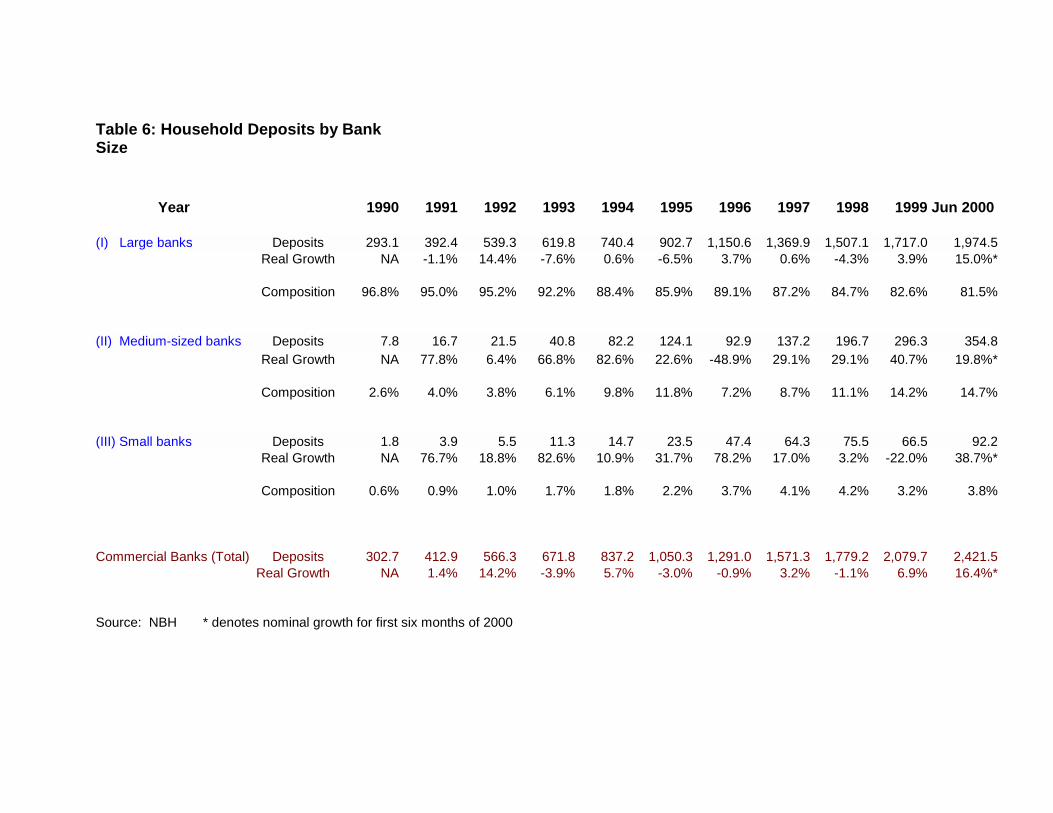
Table 6: Household Deposits by BankSize
Year 1990 1991 1992 1993 1994 1995 1996 1997 1998 1999 Jun 2000
(I) Large banks Deposits 293.1 392.4 539.3 619.8 740.4 902.7 1,150.6 1,369.9 1,507.1 1,717.0 1,974.5Real Growth NA -1.1% 14.4% -7.6% 0.6% -6.5% 3.7% 0.6% -4.3% 3.9% 15.0%*
Composition 96.8% 95.0% 95.2% 92.2% 88.4% 85.9% 89.1% 87.2% 84.7% 82.6% 81.5%
(II) Medium-sized banks Deposits 7.8 16.7 21.5 40.8 82.2 124.1 92.9 137.2 196.7 296.3 354.8Real Growth NA 77.8% 6.4% 66.8% 82.6% 22.6% -48.9% 29.1% 29.1% 40.7% 19.8%*
Composition 2.6% 4.0% 3.8% 6.1% 9.8% 11.8% 7.2% 8.7% 11.1% 14.2% 14.7%
(III) Small banks Deposits 1.8 3.9 5.5 11.3 14.7 23.5 47.4 64.3 75.5 66.5 92.2Real Growth NA 76.7% 18.8% 82.6% 10.9% 31.7% 78.2% 17.0% 3.2% -22.0% 38.7%*
Composition 0.6% 0.9% 1.0% 1.7% 1.8% 2.2% 3.7% 4.1% 4.2% 3.2% 3.8%
Commercial Banks (Total) Deposits 302.7 412.9 566.3 671.8 837.2 1,050.3 1,291.0 1,571.3 1,779.2 2,079.7 2,421.5Real Growth NA 1.4% 14.2% -3.9% 5.7% -3.0% -0.9% 3.2% -1.1% 6.9% 16.4%*
Source: NBH * denotes nominal growth for first six months of 2000
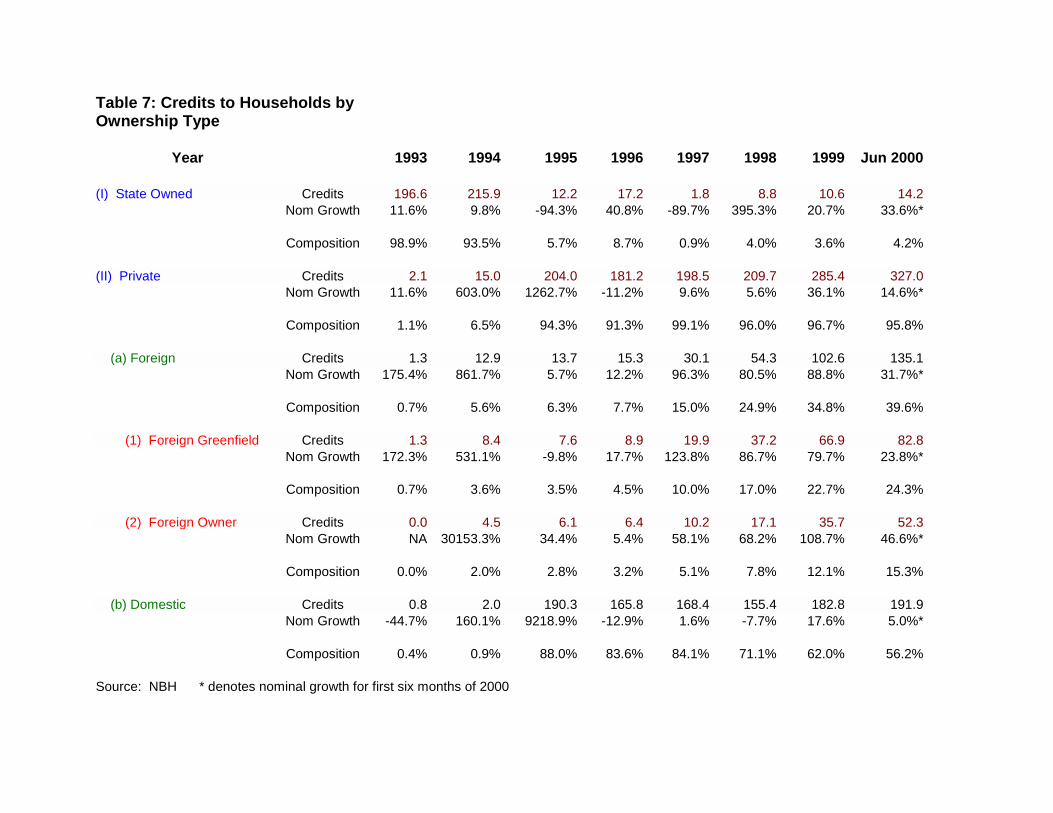
Table 7: Credits to Households byOwnership Type
Year 1993 1994 1995 1996 1997 1998 1999 Jun 2000
(I) State Owned Credits 196.6 215.9 12.2 17.2 1.8 8.8 10.6 14.2Nom Growth 11.6% 9.8% -94.3% 40.8% -89.7% 395.3% 20.7% 33.6%*
Composition 98.9% 93.5% 5.7% 8.7% 0.9% 4.0% 3.6% 4.2%
(II) Private Credits 2.1 15.0 204.0 181.2 198.5 209.7 285.4 327.0Nom Growth 11.6% 603.0% 1262.7% -11.2% 9.6% 5.6% 36.1% 14.6%*
Composition 1.1% 6.5% 94.3% 91.3% 99.1% 96.0% 96.7% 95.8%
(a) Foreign Credits 1.3 12.9 13.7 15.3 30.1 54.3 102.6 135.1Nom Growth 175.4% 861.7% 5.7% 12.2% 96.3% 80.5% 88.8% 31.7%*
Composition 0.7% 5.6% 6.3% 7.7% 15.0% 24.9% 34.8% 39.6%
(1) Foreign Greenfield Credits 1.3 8.4 7.6 8.9 19.9 37.2 66.9 82.8Nom Growth 172.3% 531.1% -9.8% 17.7% 123.8% 86.7% 79.7% 23.8%*
Composition 0.7% 3.6% 3.5% 4.5% 10.0% 17.0% 22.7% 24.3%
(2) Foreign Owner Credits 0.0 4.5 6.1 6.4 10.2 17.1 35.7 52.3Nom Growth NA 30153.3% 34.4% 5.4% 58.1% 68.2% 108.7% 46.6%*
Composition 0.0% 2.0% 2.8% 3.2% 5.1% 7.8% 12.1% 15.3%
(b) Domestic Credits 0.8 2.0 190.3 165.8 168.4 155.4 182.8 191.9Nom Growth -44.7% 160.1% 9218.9% -12.9% 1.6% -7.7% 17.6% 5.0%*
Composition 0.4% 0.9% 88.0% 83.6% 84.1% 71.1% 62.0% 56.2%
Source: NBH * denotes nominal growth for first six months of 2000
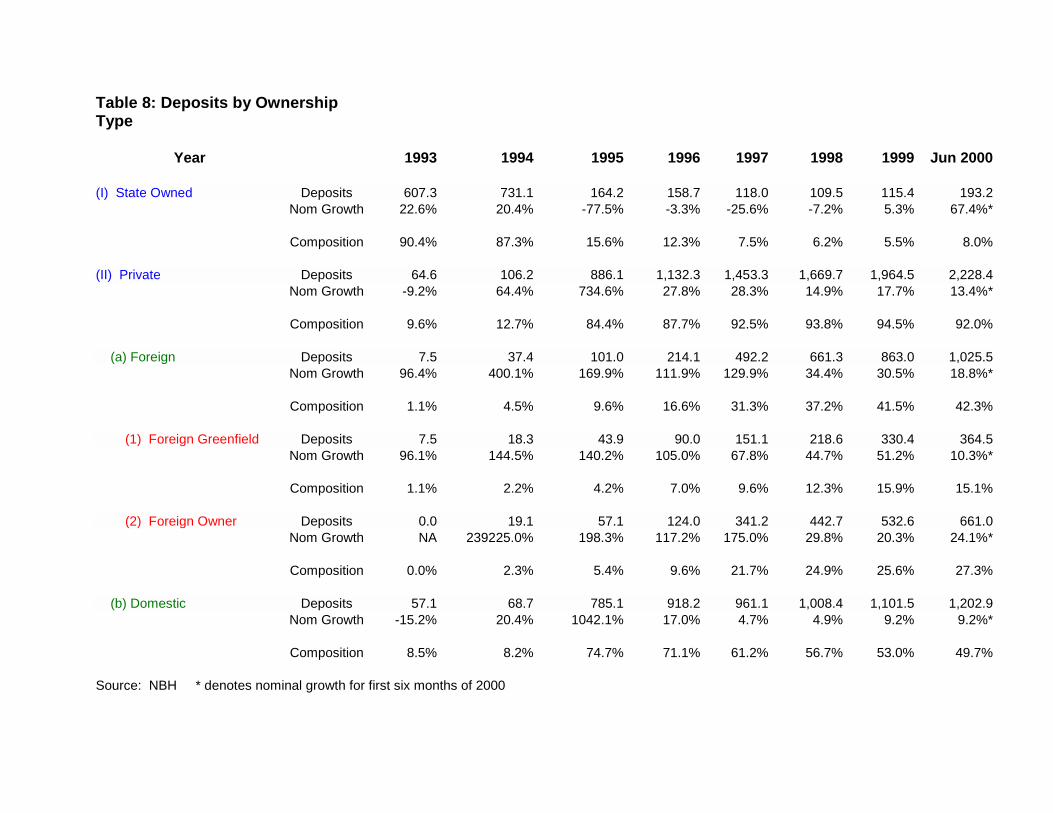
Table 8: Deposits by OwnershipType
Year 1993 1994 1995 1996 1997 1998 1999 Jun 2000
(I) State Owned Deposits 607.3 731.1 164.2 158.7 118.0 109.5 115.4 193.2Nom Growth 22.6% 20.4% -77.5% -3.3% -25.6% -7.2% 5.3% 67.4%*
Composition 90.4% 87.3% 15.6% 12.3% 7.5% 6.2% 5.5% 8.0%
(II) Private Deposits 64.6 106.2 886.1 1,132.3 1,453.3 1,669.7 1,964.5 2,228.4Nom Growth -9.2% 64.4% 734.6% 27.8% 28.3% 14.9% 17.7% 13.4%*
Composition 9.6% 12.7% 84.4% 87.7% 92.5% 93.8% 94.5% 92.0%
(a) Foreign Deposits 7.5 37.4 101.0 214.1 492.2 661.3 863.0 1,025.5Nom Growth 96.4% 400.1% 169.9% 111.9% 129.9% 34.4% 30.5% 18.8%*
Composition 1.1% 4.5% 9.6% 16.6% 31.3% 37.2% 41.5% 42.3%
(1) Foreign Greenfield Deposits 7.5 18.3 43.9 90.0 151.1 218.6 330.4 364.5Nom Growth 96.1% 144.5% 140.2% 105.0% 67.8% 44.7% 51.2% 10.3%*
Composition 1.1% 2.2% 4.2% 7.0% 9.6% 12.3% 15.9% 15.1%
(2) Foreign Owner Deposits 0.0 19.1 57.1 124.0 341.2 442.7 532.6 661.0Nom Growth NA 239225.0% 198.3% 117.2% 175.0% 29.8% 20.3% 24.1%*
Composition 0.0% 2.3% 5.4% 9.6% 21.7% 24.9% 25.6% 27.3%
(b) Domestic Deposits 57.1 68.7 785.1 918.2 961.1 1,008.4 1,101.5 1,202.9Nom Growth -15.2% 20.4% 1042.1% 17.0% 4.7% 4.9% 9.2% 9.2%*
Composition 8.5% 8.2% 74.7% 71.1% 61.2% 56.7% 53.0% 49.7%
Source: NBH * denotes nominal growth for first six months of 2000
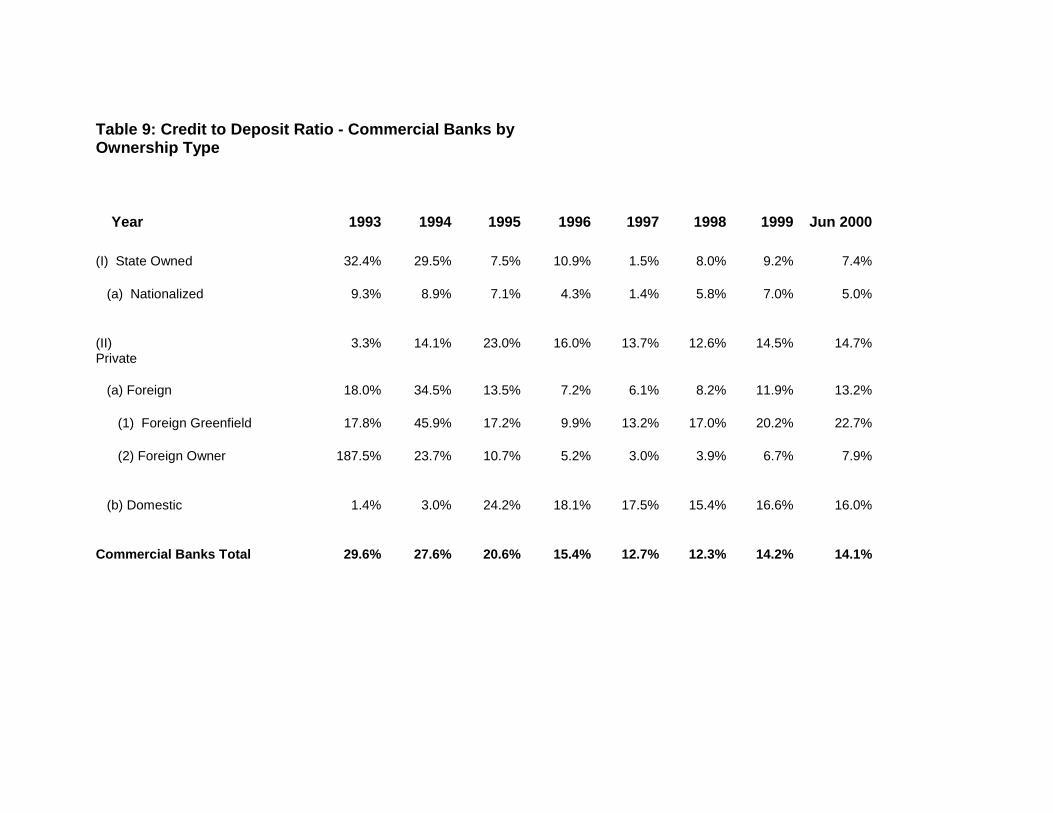
Table 9: Credit to Deposit Ratio - Commercial Banks byOwnership Type
Year 1993 1994 1995 1996 1997 1998 1999 Jun 2000
(I) State Owned 32.4% 29.5% 7.5% 10.9% 1.5% 8.0% 9.2% 7.4%
(a) Nationalized 9.3% 8.9% 7.1% 4.3% 1.4% 5.8% 7.0% 5.0%
(II)Private
3.3% 14.1% 23.0% 16.0% 13.7% 12.6% 14.5% 14.7%
(a) Foreign 18.0% 34.5% 13.5% 7.2% 6.1% 8.2% 11.9% 13.2%
(1) Foreign Greenfield 17.8% 45.9% 17.2% 9.9% 13.2% 17.0% 20.2% 22.7%
(2) Foreign Owner 187.5% 23.7% 10.7% 5.2% 3.0% 3.9% 6.7% 7.9%
(b) Domestic 1.4% 3.0% 24.2% 18.1% 17.5% 15.4% 16.6% 16.0%
Commercial Banks Total 29.6% 27.6% 20.6% 15.4% 12.7% 12.3% 14.2% 14.1%
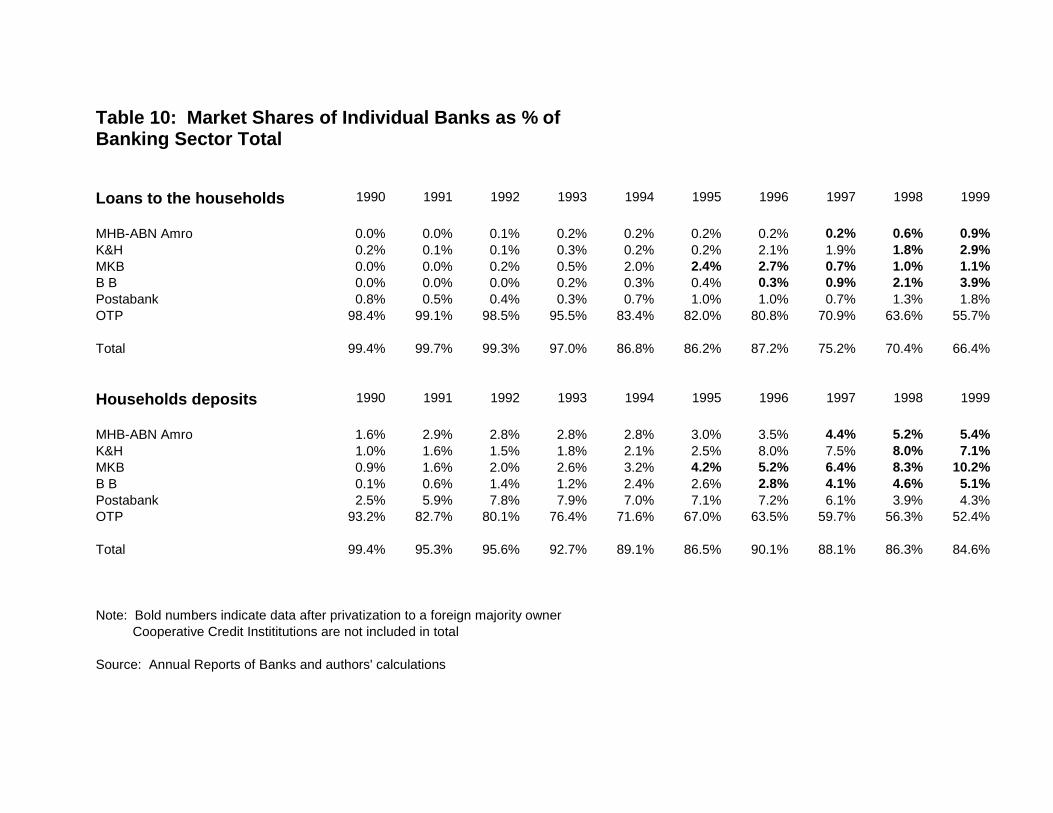
Table 10: Market Shares of Individual Banks as % ofBanking Sector Total
Loans to the households 1990 1991 1992 1993 1994 1995 1996 1997 1998 1999
MHB-ABN Amro 0.0% 0.0% 0.1% 0.2% 0.2% 0.2% 0.2% 0.2% 0.6% 0.9%K&H 0.2% 0.1% 0.1% 0.3% 0.2% 0.2% 2.1% 1.9% 1.8% 2.9%MKB 0.0% 0.0% 0.2% 0.5% 2.0% 2.4% 2.7% 0.7% 1.0% 1.1%B B 0.0% 0.0% 0.0% 0.2% 0.3% 0.4% 0.3% 0.9% 2.1% 3.9%Postabank 0.8% 0.5% 0.4% 0.3% 0.7% 1.0% 1.0% 0.7% 1.3% 1.8%OTP 98.4% 99.1% 98.5% 95.5% 83.4% 82.0% 80.8% 70.9% 63.6% 55.7%
Total 99.4% 99.7% 99.3% 97.0% 86.8% 86.2% 87.2% 75.2% 70.4% 66.4%
Households deposits 1990 1991 1992 1993 1994 1995 1996 1997 1998 1999
MHB-ABN Amro 1.6% 2.9% 2.8% 2.8% 2.8% 3.0% 3.5% 4.4% 5.2% 5.4%K&H 1.0% 1.6% 1.5% 1.8% 2.1% 2.5% 8.0% 7.5% 8.0% 7.1%MKB 0.9% 1.6% 2.0% 2.6% 3.2% 4.2% 5.2% 6.4% 8.3% 10.2%B B 0.1% 0.6% 1.4% 1.2% 2.4% 2.6% 2.8% 4.1% 4.6% 5.1%Postabank 2.5% 5.9% 7.8% 7.9% 7.0% 7.1% 7.2% 6.1% 3.9% 4.3%OTP 93.2% 82.7% 80.1% 76.4% 71.6% 67.0% 63.5% 59.7% 56.3% 52.4%
Total 99.4% 95.3% 95.6% 92.7% 89.1% 86.5% 90.1% 88.1% 86.3% 84.6%
Note: Bold numbers indicate data after privatization to a foreign majority owner Cooperative Credit Instititutions are not included in total
Source: Annual Reports of Banks and authors' calculations
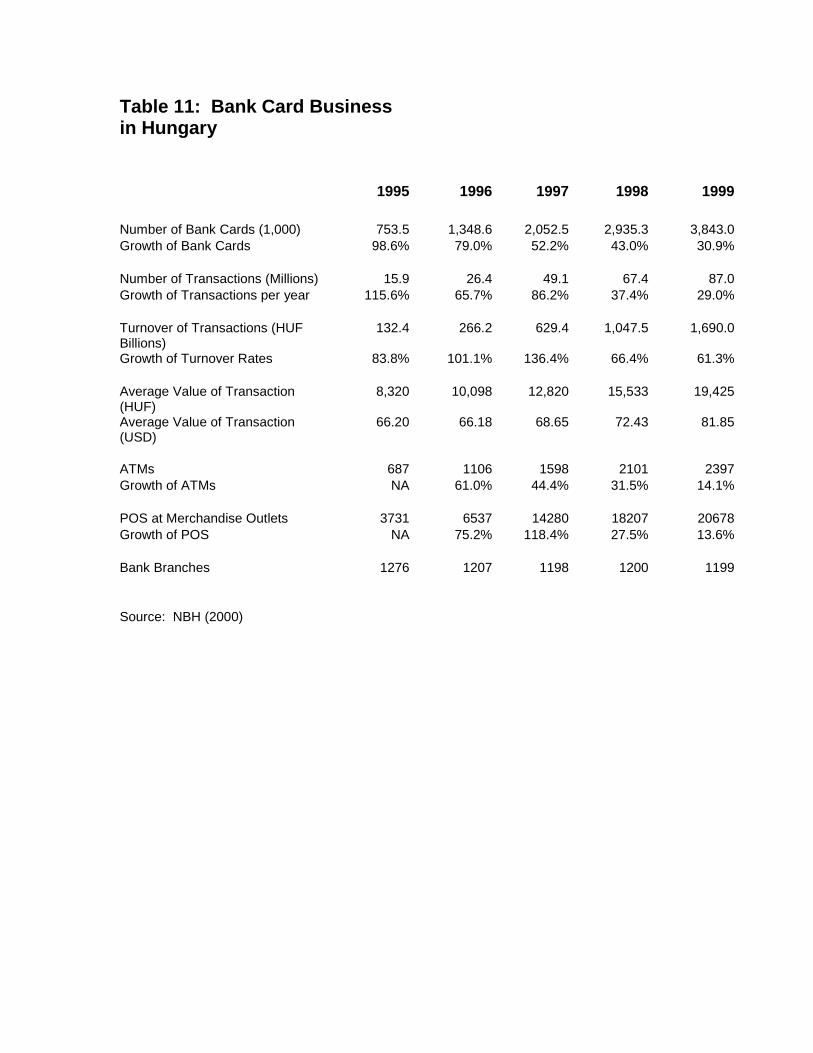
Table 11: Bank Card Businessin Hungary
1995 1996 1997 1998 1999
Number of Bank Cards (1,000) 753.5 1,348.6 2,052.5 2,935.3 3,843.0Growth of Bank Cards 98.6% 79.0% 52.2% 43.0% 30.9%
Number of Transactions (Millions) 15.9 26.4 49.1 67.4 87.0Growth of Transactions per year 115.6% 65.7% 86.2% 37.4% 29.0%
Turnover of Transactions (HUFBillions)
132.4 266.2 629.4 1,047.5 1,690.0
Growth of Turnover Rates 83.8% 101.1% 136.4% 66.4% 61.3%
Average Value of Transaction(HUF)
8,320 10,098 12,820 15,533 19,425
Average Value of Transaction(USD)
66.20 66.18 68.65 72.43 81.85
ATMs 687 1106 1598 2101 2397Growth of ATMs NA 61.0% 44.4% 31.5% 14.1%
POS at Merchandise Outlets 3731 6537 14280 18207 20678Growth of POS NA 75.2% 118.4% 27.5% 13.6%
Bank Branches 1276 1207 1198 1200 1199
Source: NBH (2000)
THE WILLIAM DAVIDSON INSTITUTEAT THE UNIVERSITY OF MICHIGAN BUSINESS SCHOOL
DAVIDSON INSTITUTE WORKING PAPER SERIES - Most Recent PapersThe entire Working Paper Series is available at: www.wdi.bus.umich.edu
CURRENT AS OF 1/21/01Publication Authors DateNo. 356 Retail Banking in Hungary: A Foreign Affair? John P. Bonin and István Ábel Dec. 2000No. 355 Optimal Speed of Transition: Micro Evidence from the CzechRepublic
Stepan Jurajda and KatherineTerrell
Dec. 2000
No. 354 Political Instability and Growth in Dictatorships Jody Overland, Kenneth L.Simons and Michael Spagat
Nov. 2000
No. 353 Disintegration and Trade Jarko Fidrmuc and Jan Fidrmuc Nov. 2000No. 352 Social Capital and Entrepreneurial Performance in Russia: APanel Study
Bat Batjargal Dec. 2000
No. 351 Entrepreneurial Versatility, Resources and Firm Performance inRussia: A Panel Study
Bat Batjargal Dec. 2000
No. 350 The Dynamics of Entrepreneurial Networks in a TransitionalEconomy: The Case of Russia
Bat Batjargal Dec. 2000
No. 349 R&D and Technology Spillovers via FDI: Innovation andAbsorptive Capacity
Yuko Kinoshita Nov. 2000
No. 348 Microeconomic aspects of Economic Growth in EasternEurope and the Former Soviet Union, 1950-2000
Sergei Guriev and Barry W. Ickes Nov. 2000
No. 347 Effective versus Statutory Taxation: Measuring Effective TaxAdministration in Transition Economies
Mark E. Schaffer and GerardTurley
Nov. 2000
No. 346 Objectives and Constraints of Entrepreneurs: Evidence fromSmall and Medium Size Enterprises in Russia and Bulgaria
Francesca Pissarides, MiroslavSinger and Jan Svejnar
Oct. 2000
No. 345 Corruption and Anticorruption in the Czech Republic Lubomír Lízal and EvženKočenda
Oct. 2000
No. 344 The Effects of Direct Foreign Investment on Domestic Firms Jozef Konings Oct. 2000No. 343 On the Identification of Relative Wage Rigidity Dynamics Patrick A. Puhani Oct. 2000No. 342 The Determinants of Foreign Direct Investment in TransitionEconomies
Alan A. Bevan and Saul Estrin Oct. 2000
No. 341 The Global Spread of Stock Exchanges, 1980-1998 Klaus Weber and Gerald F. Davis Nov. 2000No. 340 The Costs and Benefits of Euro-isation in Central-EasternEurope Before or Instead of EMU Membership
D. Mario Nuti Oct. 2000
No. 339 Debt Overhang and Barter in Russia Sergei Guriev, Igor Makarov andMathilde Maurel
Sept. 2000
No. 338 Firm Performance and the Political Economy of CorporateGovernance: Survey Evidence for Bulgaria, Hungary, Slovakia andSlovenia
Patrick Paul Walsh and CiaraWhela
July 2000
No. 337 Investment and Instability Nauro F. Campos and Jeffrey B.Nugent
May 2000
No. 336 The Evolution of the Insurance Sector in Central andEastern Europe and the former Soviet Union
Robert B.K. Pye Aug. 2000
No. 335 Institutional Technology and the Chains of Trust: CapitalMarkets and Privatization in Russia and the Czech Republic
Bruce Kogut and Andrew Spicer Aug. 2000
No. 334 The Evolution of Market Integration in Russia Daniel Berkowitz and David N.DeJong
Aug. 2000
No. 333 Efficiency and Market Share in Hungarian Corporate Sector László Halpern and Gábor Kőrösi July 2000No. 332 Search-Money-and-Barter Models of Financial Stabilization S.I. Boyarchenko and S.Z.
LevendorskiiJuly 2000
No. 331 Worker Training in a Restructuring Economy: Evidence fromthe Russian Transition
Mark C. Berger, John S. Earleand Klara Z. Sabirianova
Aug. 2000

The entire Working Paper Series is available at: www.wdi.bus.umich.edu
No. 330 Economic Development in Palanpur 1957-1993: A Sort ofGrowth
Peter Lanjouw Aug. 2000
No. 329 Trust, Organizational Controls, Knowledge Acquisition fromthe Foreign Parents, and Performance in Vietnamese International JointVentures
Marjorie A. Lyles, Le DangDoanh, and Jeffrey Q. Barden
June 2000
No. 328 Comparative Advertising in the Global Marketplace: TheEffects of Cultural Orientation on Communication
Zeynep Gürhan-Canli andDurairaj Maheswaran
Aug. 2000
No. 327 Post Privatization Enterprise Restructuring Morris Bornstein July 2000No. 326 Who is Afraid of Political Instability? Nauro F. Campos and Jeffrey B.
NugentJuly 2000
No. 325 Business Groups, the Financial Market and Modernization Raja Kali June 2000No. 324 Restructuring with What Success? A Case Study of RussianFirms
Susan Linz July 2000
No. 323 Priorities and Sequencing in Privatization: Theory andEvidence from the Czech Republic
Nandini Gupta, John C. Ham andJan Svejnar
May 2000
No. 322 Liquidity, Volatility, and Equity Trading Costs AcrossCountries and Over Time
Ian Domowitz, Jack Glen andAnanth Madhavan
Mar. 2000
No. 321 Equilibrium Wage Arrears: A Theoretical and EmpiricalAnalysis of Institutional Lock-In
John S. Earle and Klara Z.Sabirianova
Oct. 2000
No. 320 Rethinking Marketing Programs for Emerging Markets Niraj Dawar and AmitavaChattopadhyay
June 2000
No. 319 Public Finance and Low Equilibria in Transition Economies:the Role of Institutions
Daniel Daianu and RaduVranceanu
June 2000
No. 318 Some Econometric Evidence on the Effectiveness of ActiveLabour Market Programmes in East Germany
Martin Eichler and MichaelLechner
June 2000
No. 317 A Model of Russia’s “Virtual Economy” R.E Ericson and B.W Ickes May 2000No. 316 Financial Institutions, Financial Contagion, and FinancialCrises
Haizhou Huang and ChenggangXu
Mar. 2000
No. 315 Privatization versus Regulation in Developing Economies: TheCase of West African Banks
Jean Paul Azam, Bruno Biais, andMagueye Dia
Feb. 2000
No. 314 Is Life More Risky in the Open? Household Risk-Coping andthe Opening of China’s Labor Markets
John Giles Apr. 2000
No. 313 Networks, Migration and Investment: Insiders and Outsiders inTirupur’s Production Cluster
Abhijit Banerjee and KaivanMunshi
Mar. 2000
No. 312 Computational Analysis of the Impact on India of the UruguayRound and the Forthcoming WTO Trade Negotiations
Rajesh Chadha, Drusilla K.Brown, Alan V. Deardorff andRobert M. Stern
Mar. 2000
No. 311 Subsidized Jobs for Unemployed Workers in Slovakia Jan. C. van Ours May 2000No. 310 Determinants of Managerial Pay in the Czech Republic Tor Eriksson, Jaromir Gottvald
and Pavel MrazekMay 2000
No. 309 The Great Human Capital Reallocation: An Empirical Analysisof Occupational Mobility in Transitional Russia
Klara Z. Sabirianova Oct. 2000
No. 308 Economic Development, Legality, and the Transplant Effect Daniel Berkowitz, KatharinaPistor, and Jean-Francois Richard
Feb. 2000
No. 307 Community Participation, Teacher Effort, and EducationalOutcome: The Case of El Salvador’s EDUCO Program
Yasuyuki Sawada Nov. 1999
No. 306 Gender Wage Gap and Segregation in Late Transition Stepan Jurajda May 2000No. 305 The Gender Pay Gap in the Transition from Communism:Some Empirical Evidence
Andrew Newell and Barry Reilly May 2000
No. 304 Post-Unification Wage Growth in East Germany Jennifer Hunt Nov. 1998No. 303 How Does Privatization Affect Workers? The Case of theRussian Mass Privatization Program
Elizabeth Brainerd May 2000
No. 302 Liability for Past Environmental Contamination andPrivatization
Dietrich Earnhart Mar. 2000
No. 301 Varieties, Jobs and EU Enlargement Tito Boeri and Joaquim OliveiraMartins
May 2000
The entire Working Paper Series is available at: www.wdi.bus.umich.edu
No. 300 Employer Size Effects in Russia Todd Idson Apr. 2000No. 299 Information Complements, Substitutes, and Strategic ProductDesign
Geoffrey G. Parker and MarshallW. Van Alstyne
Mar. 2000
No. 298 Markets, Human Capital, and Inequality: Evidence from RuralChina
Dwayne Benjamin, Loren Brandt,Paul Glewwe, and Li Guo
May 2000
No. 297 Corporate Governance in the Asian Financial Crisis Simon Johnson, Peter Boone,Alasdair Breach, and EricFriedman
Nov. 1999
No. 296 Competition and Firm Performance: Lessons from Russia J. David Brown and John S. Earle Mar. 2000No. 295 Wage Determination in Russia: An Econometric Investigation Peter J. Luke and Mark E.
SchafferMar. 2000
No. 294: Can Banks Promote Enterprise Restructuring?: Evidence Froma Polish Bank’s Experience
John P. Bonin and Bozena Leven Mar. 2000
No. 293: Why do Governments Sell Privatised Companies Abroad? Bernardo Bortolotti, MarcellaFantini and Carlo Scarpa
Mar. 2000
No. 292: Going Public in Poland: Case-by-Case Privatizations, MassPrivatization and Private Sector Initial Public Offerings
Wolfgang Aussenegg Dec. 1999
No. 291: Institutional Technology and the Chains of Trust: CapitalMarkets and Privatization in Russia and the Czech Republic
Bruce Kogut and Andrew Spicer Mar. 1999
No. 290: Banking Crises and Bank Rescues: The Effect of Reputation Jenny Corbett and Janet Mitchell Jan. 2000No. 289: Do Active Labor Market Policies Help Unemployed Workersto Find and Keep Regular Jobs?
Jan C. van Ours Feb. 2000
No. 288: Consumption Patterns of the New Elite in Zimbabwe Russell Belk Feb. 2000No. 287: Barter in Transition Economies: Competing ExplanationsConfront Ukranian Data
Dalia Marin, Daniel Kaufmannand Bogdan Gorochowskij
Jan. 2000
No. 286: The Quest for Pension Reform: Poland’s Security throughDiversity
Marek Góra and MichaelRutkowski
Jan. 2000
No. 285: Disorganization and Financial Collapse Dalia Marin and MonikaSchnitzer
Oct. 1999
No. 284: Coordinating Changes in M-form and U-form Organizations Yingyi Qian, Gérard Roland andChenggang Xu
May 1999
No. 283: Why Russian Workers Do Not Move: Attachment of WorkersThrough In-Kind Payments
Guido Friebel and Sergei Guriev Oct. 1999
No. 282: Lessons From Fiascos in Russian Corporate Governance Merritt B. Fox and Michael A.Heller
Oct. 1999
No. 281: Income Distribution and Price Controls: Targeting a SocialSafety Net During Economic Transition
Michael Alexeev and JamesLeitzel
Mar. 1999
No. 280: Starting Positions, Reform Speed, and Economic Outcomes inTransitioning Economies
William Hallagan and Zhang Jun Jan. 2000
No. 279 : The Value of Prominent Directors Yoshiro Miwa & J. MarkRamseyer
Oct. 1999
No. 278: The System Paradigm János Kornai Apr. 1998No. 277: The Developmental Consequences of Foreign DirectInvestment in the Transition from Socialism to Capitalism: ThePerformance of Foreign Owned Firms in Hungary
Lawrence Peter King Sept. 1999
No. 276: Stability and Disorder: An Evolutionary Analysis of Russia’sVirtual Economy
Clifford Gaddy and Barry W.Ickes
Nov. 1999
No. 275: Limiting Government Predation Through AnonymousBanking: A Theory with Evidence from China.
Chong-En Bai, David D. Li,Yingyi Qian and Yijiang Wang
July 1999
No. 274: Transition with Labour Supply Tito Boeri Dec. 1999No. 273: Sectoral Restructuring and Labor Mobility: A ComparativeLook at the Czech Republic
Vit Sorm and Katherine Terrell Nov. 1999
No. 272: Published in: Journal of Comparative Economics “Returns toHuman Capital Under the Communist Wage Grid and During theTransition to a Market Economy” Vol. 27, pp. 33-60 1999.
Daniel Munich, Jan Svejnar andKatherine Terrell
Oct. 1999
The entire Working Paper Series is available at: www.wdi.bus.umich.edu
No. 271: Barter in Russia: Liquidity Shortage Versus Lack ofRestructuring
Sophie Brana and MathildeMaurel
June 1999
No. 270: Tests for Efficient Financial Intermediation with Application toChina
Albert Park and Kaja Sehrt Mar. 1999
No. 269a: Russian Privatization and Corporate Governance: What WentWrong?
Bernard Black, Reinier Kraakmanand Anna Tarassova
May 2000
No. 269: Russian Privatization and Corporate Governance: What WentWrong?
Bernard Black, Reinier Kraakmanand Anna Tarassova
Sept. 1999
No. 268: Are Russians Really Ready for Capitalism? Susan Linz Sept. 1999No. 267: Do Stock Markets Promote Economic Growth? Randall K. Filer, Jan Hanousek
and Nauro CamposSept. 1999
No. 266: Objectivity, Proximity and Adaptability in CorporateGovernance
Arnoud W.A Boot and JonathanR. Macey
Sept. 1999
No. 265: When the Future is not What it Used to Be: Lessons from theWestern European Experience to Forecasting Education and Training inTransitional Economies
Nauro F. Campos, GerardHughes, Stepan Jurajda, andDaniel Munich
Sept. 1999
No. 264: The Institutional Foundation of Foreign-Invested Enterprises(FIEs) in China
Yasheng Huang Sept. 1999
No. 263: The Changing Corporate Governance Paradigm: Implicationsfor Transition and Developing Countries
Erik Berglof and Ernst-Ludwigvon Thadden
June 1999
No. 262: Law Enforcement and Transition Gerard Roland and ThierryVerdier
May 1999
No. 261: Soft Budget Constraints, Pecuniary Externality, and the DualTrack System
Jiahua Che June 2000
No. 260: Missing Market in Labor Quality: The Role of Quality Marketsin Transition
Gary H. Jefferson July 1999
No. 259: Do Corporate Global Environmental Standards in EmergingMarkets Create or Destroy Market Value
Glen Dowell, Stuart Hart andBernard Yeung
June 1999
No. 258: Public Training and Outflows from Unemployment Patrick A. Puhani June 1999No. 257: Ownership Versus Environment: Why are Public Sector FirmsInefficient?
Ann P. Bartel and Ann E.Harrison
June 1999
No. 256: Taxation and Evasion in the Presence of Exortion byOrganized Crime
Michael Alexeev, Eckhard Janebaand Stefan Osborne
Nov. 1999
No. 255: Revisiting Hungary’s Bankruptcy Episode John P. Bonin and Mark E.Schaffer
Sept. 1999
No. 254: FDI in Emerging Markets: A Home-Country View Marina v.N Whitman June 1999No. 253: The Asian Financial Crisis: What Happened, and What is to beDone
Jeffrey D. Sachs and Wing ThyeWoo
Jan. 1999
No. 252: Organizational Law as Asset Partitioning Henry Hansmann and ReinierKraakman
Sept. 1999
No. 251: Consumer Behavior Research in Emerging Consumer Markets:the Case of the Optimum Stimulation Level in South Africa
Jan-Benedict E. M. Steenkampand Steven M. Burgess
Sept. 1999
No. 250: Property Rights Formation and the Organization of Exchangeand Production in Rural China
Matthew A. Turner, LorenBrandt, and Scott Rozelle
July 1998
No. 249: Impacts of the Indonesian Economic Crisis: Price Changes andthe Poor
James Levinsohn, Steven Berry,and Jed Friedman
June 1999
No. 248: Internal Barriers in the Transition of Enterprises from CentralPlan to Market
Charalambos Vlachoutsicos July 1999
No. 247: Spillovers from Multinationals in Developing Countries: theMechanisms at Work
Richard E. Caves June 1999
No. 246: Dynamism and Inertia on the Russian Labour Market: AModel of Segmentation
Irena Grosfeld, Claudia Senik-Leygonie, Thierry Verdier, StanislavKolenikov and Elena Paltseva
May 1999
No. 245: Lessons from Bank Privatization in Central Europe John Bonin and Paul Wachtel May 1999No. 244: Nominal-Real Tradeoffs and the Effects of Monetary Policy:the Romanian Experience
Christian Popa Dec. 1998
Related Documents