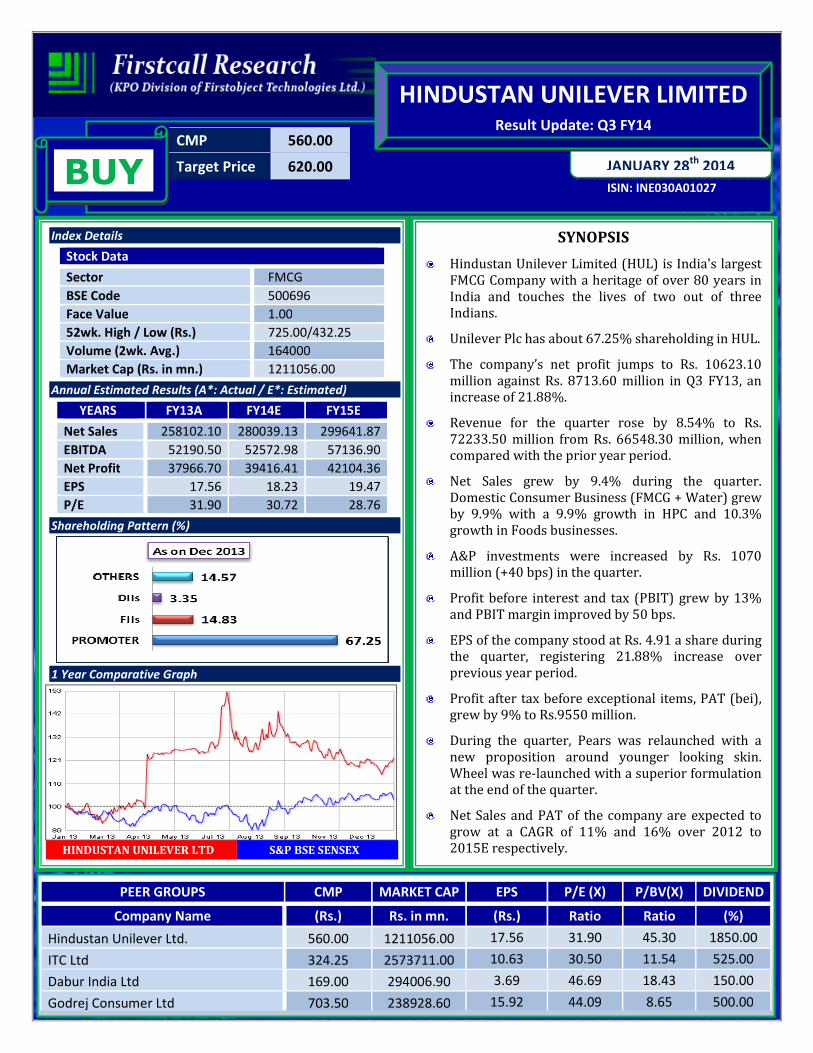
CMP 560.00 Target Price 620.00 ISIN: INE030A01027 JANUARY 28 th 2014 HINDUSTAN UNILEVER LIMITED Result Update: Q3 FY14 BUY Index Details Stock Data Sector FMCG BSE Code 500696 Face Value 1.00 52wk. High / Low (Rs.) 725.00/432.25 Volume (2wk. Avg.) 164000 Market Cap (Rs. in mn.) 1211056.00 Annual Estimated Results (A*: Actual / E*: Estimated) YEARS FY13A FY14E FY15E Net Sales 258102.10 280039.13 299641.87 EBITDA 52190.50 52572.98 57136.90 Net Profit 37966.70 39416.41 42104.36 EPS 17.56 18.23 19.47 P/E 31.90 30.72 28.76 Shareholding Pattern (%) 1 Year Comparative Graph HINDUSTAN UNILEVER LTD S&P BSE SENSEX SYNOPSIS Hindustan Unilever Limited (HUL) is India's largest FMCG Company with a heritage of over 80 years in India and touches the lives of two out of three Indians. Unilever Plc has about 67.25% shareholding in HUL. The company’s net profit jumps to Rs. 10623.10 million against Rs. 8713.60 million in Q3 FY13, an increase of 21.88%. Revenue for the quarter rose by 8.54% to Rs. 72233.50 million from Rs. 66548.30 million, when compared with the prior year period. Net Sales grew by 9.4% during the quarter. Domestic Consumer Business (FMCG + Water) grew by 9.9% with a 9.9% growth in HPC and 10.3% growth in Foods businesses. A&P investments were increased by Rs. 1070 million (+40 bps) in the quarter. Profit before interest and tax (PBIT) grew by 13% and PBIT margin improved by 50 bps. EPS of the company stood at Rs. 4.91 a share during the quarter, registering 21.88% increase over previous year period. Profit after tax before exceptional items, PAT (bei), grew by 9% to Rs.9550 million. During the quarter, Pears was relaunched with a new proposition around younger looking skin. Wheel was re-launched with a superior formulation at the end of the quarter. Net Sales and PAT of the company are expected to grow at a CAGR of 11% and 16% over 2012 to 2015E respectively. PEER GROUPS CMP MARKET CAP EPS P/E (X) P/BV(X) DIVIDEND Company Name (Rs.) Rs. in mn. (Rs.) Ratio Ratio (%) Hindustan Unilever Ltd. 560.00 1211056.00 17.56 31.90 45.30 1850.00 ITC Ltd 324.25 2573711.00 10.63 30.50 11.54 525.00 Dabur India Ltd 169.00 294006.90 3.69 46.69 18.43 150.00 Godrej Consumer Ltd 703.50 238928.60 15.92 44.09 8.65 500.00

Welcome message from author
This document is posted to help you gain knowledge. Please leave a comment to let me know what you think about it! Share it to your friends and learn new things together.
Transcript
CMP 560.00
Target Price 620.00
ISIN: INE030A01027
JANUARY 28th
2014
HINDUSTAN UNILEVER LIMITED
Result Update: Q3 FY14
BUY
Index Details
Stock Data
Sector FMCG
BSE Code 500696
Face Value 1.00
52wk. High / Low (Rs.) 725.00/432.25
Volume (2wk. Avg.) 164000
Market Cap (Rs. in mn.) 1211056.00
Annual Estimated Results (A*: Actual / E*: Estimated)
YEARS FY13A FY14E FY15E
Net Sales 258102.10 280039.13 299641.87
EBITDA 52190.50 52572.98 57136.90
Net Profit 37966.70 39416.41 42104.36
EPS 17.56 18.23 19.47
P/E 31.90 30.72 28.76
Shareholding Pattern (%)
1 Year Comparative Graph
HINDUSTAN UNILEVER LTD S&P BSE SENSEX
SYNOPSIS
Hindustan Unilever Limited (HUL) is India's largest FMCG Company with a heritage of over 80 years in India and touches the lives of two out of three Indians.
Unilever Plc has about 67.25% shareholding in HUL.
The company’s net profit jumps to Rs. 10623.10 million against Rs. 8713.60 million in Q3 FY13, an increase of 21.88%.
Revenue for the quarter rose by 8.54% to Rs. 72233.50 million from Rs. 66548.30 million, when compared with the prior year period.
Net Sales grew by 9.4% during the quarter. Domestic Consumer Business (FMCG + Water) grew by 9.9% with a 9.9% growth in HPC and 10.3% growth in Foods businesses.
A&P investments were increased by Rs. 1070 million (+40 bps) in the quarter.
Profit before interest and tax (PBIT) grew by 13% and PBIT margin improved by 50 bps.
EPS of the company stood at Rs. 4.91 a share during the quarter, registering 21.88% increase over previous year period.
Profit after tax before exceptional items, PAT (bei), grew by 9% to Rs.9550 million.
During the quarter, Pears was relaunched with a new proposition around younger looking skin. Wheel was re-launched with a superior formulation at the end of the quarter.
Net Sales and PAT of the company are expected to grow at a CAGR of 11% and 16% over 2012 to 2015E respectively.
PEER GROUPS CMP MARKET CAP EPS P/E (X) P/BV(X) DIVIDEND
Company Name (Rs.) Rs. in mn. (Rs.) Ratio Ratio (%)
Hindustan Unilever Ltd. 560.00 1211056.00 17.56 31.90 45.30 1850.00
ITC Ltd 324.25 2573711.00 10.63 30.50 11.54 525.00
Dabur India Ltd 169.00 294006.90 3.69 46.69 18.43 150.00
Godrej Consumer Ltd 703.50 238928.60 15.92 44.09 8.65 500.00

Recommendation & Analysis - ‘BUY’
FMCG major Hindustan Unilever Ltd (HUL) reported a 21.91% growth in its standalone net profit for the quarter
ended 31st December, 2013 at Rs 10,623.10 million, driven by strong domestic consumer sales and exceptional
items. Net sales of the company rose by 10% to Rs 67,745.10 million in Q3 FY14 from Rs 61,584.90 million in Q3
FY13, helped by strong volume growth.
During the quarter, the domestic consumer business grew at 10%, ahead of market, with 4% underlying volume
growth. The operating context during the quarter remained challenging with market growth under pressure,
firm input costs given the rupee depreciation, an uncertain media environment and the high competitive
intensity. Investment behind brands was sustained at competitive levels; overall A&P was up by Rs. 1070 million
(+40 bps) in the quarter. Profit before interest and tax (PBIT) grew by 13% and PBIT margin improved by 50
bps.
Soaps and Detergents category grew 7%, driven by Dove, Pears, Lifebuoy and Breeze. In Laundry, growth was led
by the premium segment. Surf growth was buoyed by the robust performance in Surf Excel Easy Wash and Excel
Matic while Rin saw good growth on the bars portfolio. Personal Products category grew by 11% in a slowing
market. The re-launch of Fair & Lovely, with the new ‘Best Ever Formula’ and a focused activation plan in the last
quarter, is on track. In Oral Care, both Pepsodent and Close Up delivered stepped up double digit growth in a
competitive market. Tea delivered another quarter of broad based growth with Taj Mahal, Red Label, 3 Roses and
Taaza growing in double digits, driven by a strengthened mix and focused in-market activities. Packaged Foods
segment grew by 11%.
Over FY2012-15E, we expect the company to post a CAGR of 11% and 16% in its top-line and bottom-line
respectively. Hence, we recommend ‘BUY’ for ‘Hindustan Unilever Ltd’ with a target price of Rs. 620.00 on the
stock.
QUARTERLY HIGHLIGHTS (STANDALONE)
Results updates- Q3 FY14,
Hindustan Unilever Limited (HUL) is India's largest
Fast Moving Consumer Goods Company with a
heritage of over 80 years in India and touches the
lives of two out of three Indians, reported its
financial results for the quarter ended 31st Dec,
2013.
Months Dec-13 Dec-12 % Change
Revenue 72233.50 66548.30 8.54
PAT 10623.10 8713.60 21.91
EPS 4.91 4.03 21.88
EBITDA 13694.60 12152.20 12.69
The company’s net profit jumps to Rs. 10623.10 million against Rs. 8713.60 million in the corresponding quarter
ending of previous year, an increase of 21.91%. Revenue for the quarter rose by 8.54% to Rs. 72233.50 million
from Rs. 66548.30 million, when compared with the prior year period. Reported earnings per share of the
company stood at Rs. 4.91 a share during the quarter, registering 21.88% increase over previous year period.
Profit before interest, depreciation and tax is Rs. 13694.60 millions as against Rs. 12152.20 millions in the
corresponding period of the previous year.
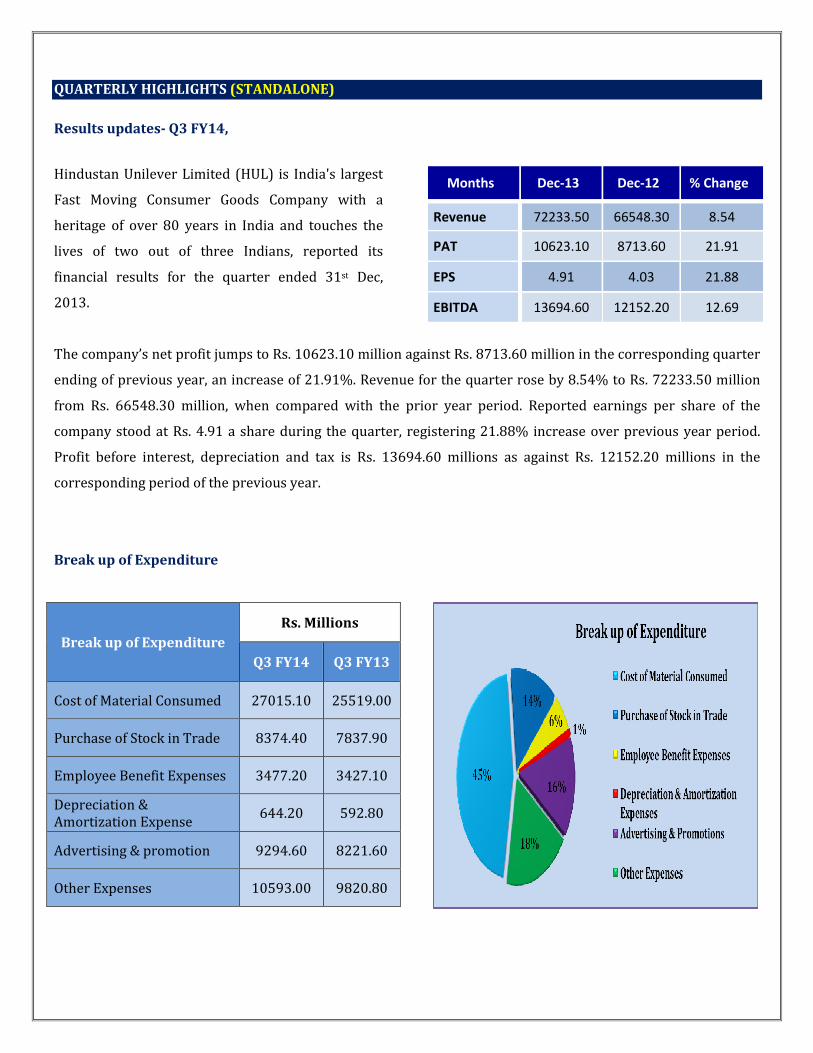
Break up of Expenditure
Break up of Expenditure
Rs. Millions
Q3 FY14 Q3 FY13
Cost of Material Consumed 27015.10 25519.00
Purchase of Stock in Trade 8374.40 7837.90
Employee Benefit Expenses 3477.20 3427.10
Depreciation & Amortization Expense
644.20 592.80
Advertising & promotion 9294.60 8221.60
Other Expenses 10593.00 9820.80
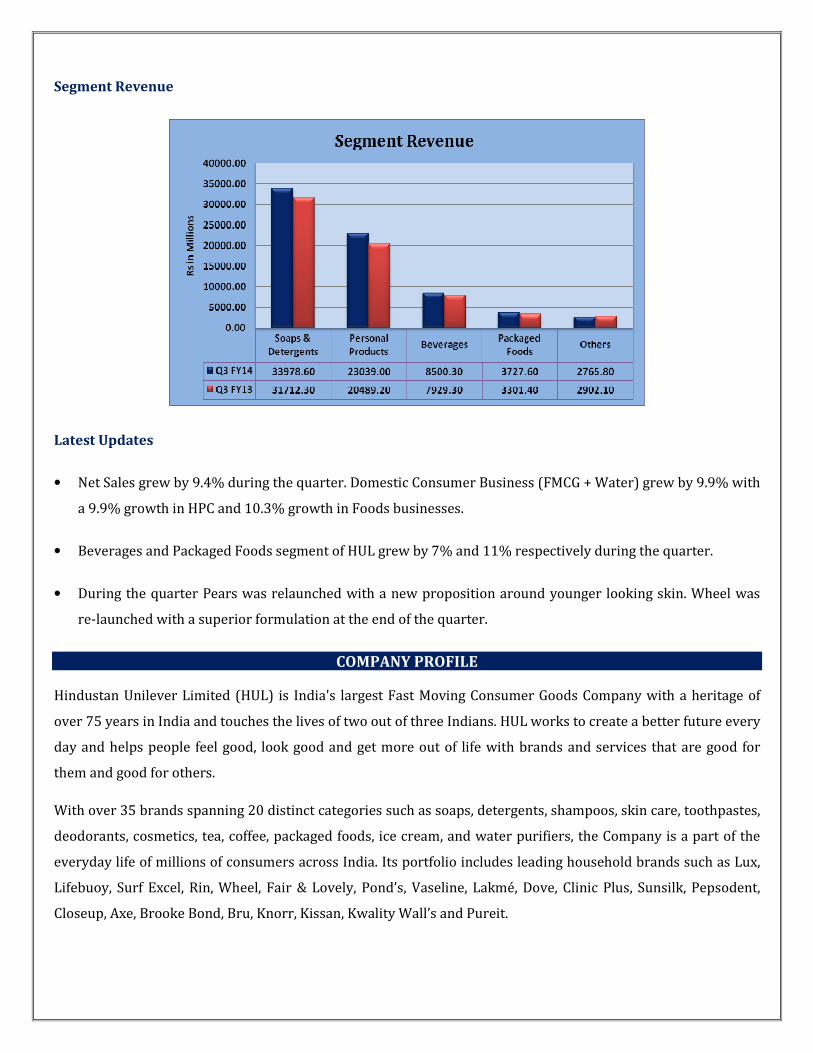
Segment Revenue
Latest Updates
• Net Sales grew by 9.4% during the quarter. Domestic Consumer Business (FMCG + Water) grew by 9.9% with
a 9.9% growth in HPC and 10.3% growth in Foods businesses.
• Beverages and Packaged Foods segment of HUL grew by 7% and 11% respectively during the quarter.
• During the quarter Pears was relaunched with a new proposition around younger looking skin. Wheel was
re-launched with a superior formulation at the end of the quarter.
COMPANY PROFILE
Hindustan Unilever Limited (HUL) is India's largest Fast Moving Consumer Goods Company with a heritage of
over 75 years in India and touches the lives of two out of three Indians. HUL works to create a better future every
day and helps people feel good, look good and get more out of life with brands and services that are good for
them and good for others.
With over 35 brands spanning 20 distinct categories such as soaps, detergents, shampoos, skin care, toothpastes,
deodorants, cosmetics, tea, coffee, packaged foods, ice cream, and water purifiers, the Company is a part of the
everyday life of millions of consumers across India. Its portfolio includes leading household brands such as Lux,
Lifebuoy, Surf Excel, Rin, Wheel, Fair & Lovely, Pond’s, Vaseline, Lakmé, Dove, Clinic Plus, Sunsilk, Pepsodent,
Closeup, Axe, Brooke Bond, Bru, Knorr, Kissan, Kwality Wall’s and Pureit.

The Company has over 16,000 employees and has an annual turnover of around Rs. 258102.10 milions (financial
year 2012 - 2013). HUL is a subsidiary of Unilever, one of the world’s leading suppliers of fast moving consumer
goods with strong local roots in more than 100 countries across the globe with annual sales of about € 51 billion
in 2012. Unilever has about 67.25% shareholding in HUL.
In April, 2012, the Customer Insight & Innovation Centre (CiiC) was inaugurated at the Hindustan Unilever
Campus at Andheri, Mumbai.
In 2011 Uniliver spent €1 billion on research & development. Currently the company has over 6000 people
working in R&D in all Unilever regions across the globe. The company typically files between 250 & 350 new
patent applications a year. Worldwide the company has over 20 000 registered patents & patent applications.
Brands:
• Food Brands
• Home Care Brands
• Personal Care Brands
• Water
• Nutrition
• Health, Hygiene & Beauty
Products
� Food Products
� Brooke Bond 3 Roses
� Brooke Bond Red Label
� Brooke Bond Taj Mahal
� Kissan
� Kwality Wall’s
� Modern
� Annapurna
� Brooke Bond Taaza
� Bru
� Knorr
� Lipton
� Brooke Bond Sehatmand
� Home care brands
� Active Wheel
� Cif
� Comfort Fabric Conditioner
� Domex
� Rin
� Sunlight
� Surf Excel
� Vim

� Personal care brands
� Aviance
� Axe
� LEVER Ayush Therapy
� Breeze
� Clear
� Clinic Plus
� Closeup Gel Toothpaste
� Dove
� Fair & Lovely
� Hamam
� Liril 2000
� Lux
� Pears
� Pepsodent
� Sunsilk
� Ponds
� Rexona
� Vaseline
� Water
� Pureit Marvella RO
� Pureit Marvella
� Pureit Classic 14 litres
� Pureit Classic 23 litres
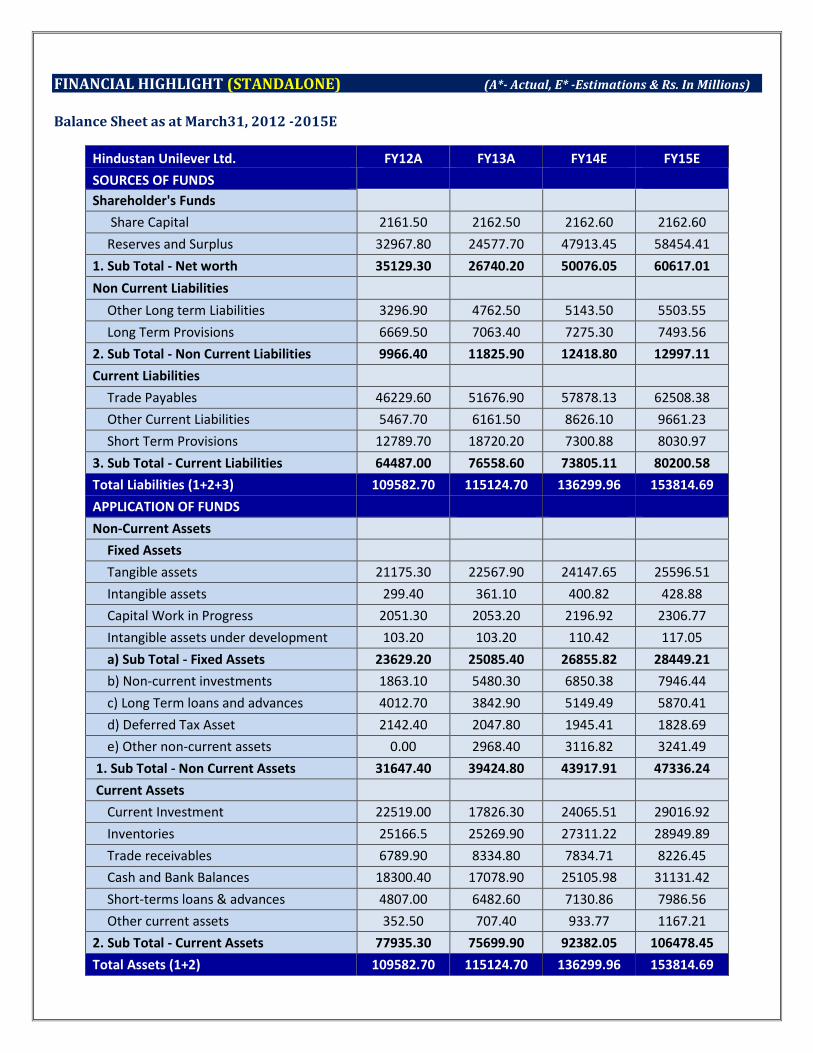
FINANCIAL HIGHLIGHT (STANDALONE) (A*- Actual, E* -Estimations & Rs. In Millions)
Balance Sheet as at March31, 2012 -2015E
Hindustan Unilever Ltd. FY12A FY13A FY14E FY15E
SOURCES OF FUNDS
Shareholder's Funds
Share Capital 2161.50 2162.50 2162.60 2162.60
Reserves and Surplus 32967.80 24577.70 47913.45 58454.41
1. Sub Total - Net worth 35129.30 26740.20 50076.05 60617.01
Non Current Liabilities
Other Long term Liabilities 3296.90 4762.50 5143.50 5503.55
Long Term Provisions 6669.50 7063.40 7275.30 7493.56
2. Sub Total - Non Current Liabilities 9966.40 11825.90 12418.80 12997.11
Current Liabilities
Trade Payables 46229.60 51676.90 57878.13 62508.38
Other Current Liabilities 5467.70 6161.50 8626.10 9661.23
Short Term Provisions 12789.70 18720.20 7300.88 8030.97
3. Sub Total - Current Liabilities 64487.00 76558.60 73805.11 80200.58
Total Liabilities (1+2+3) 109582.70 115124.70 136299.96 153814.69
APPLICATION OF FUNDS
Non-Current Assets
Fixed Assets
Tangible assets 21175.30 22567.90 24147.65 25596.51
Intangible assets 299.40 361.10 400.82 428.88
Capital Work in Progress 2051.30 2053.20 2196.92 2306.77
Intangible assets under development 103.20 103.20 110.42 117.05
a) Sub Total - Fixed Assets 23629.20 25085.40 26855.82 28449.21
b) Non-current investments 1863.10 5480.30 6850.38 7946.44
c) Long Term loans and advances 4012.70 3842.90 5149.49 5870.41
d) Deferred Tax Asset 2142.40 2047.80 1945.41 1828.69
e) Other non-current assets 0.00 2968.40 3116.82 3241.49
1. Sub Total - Non Current Assets 31647.40 39424.80 43917.91 47336.24
Current Assets
Current Investment 22519.00 17826.30 24065.51 29016.92
Inventories 25166.5 25269.90 27311.22 28949.89
Trade receivables 6789.90 8334.80 7834.71 8226.45
Cash and Bank Balances 18300.40 17078.90 25105.98 31131.42
Short-terms loans & advances 4807.00 6482.60 7130.86 7986.56
Other current assets 352.50 707.40 933.77 1167.21
2. Sub Total - Current Assets 77935.30 75699.90 92382.05 106478.45
Total Assets (1+2) 109582.70 115124.70 136299.96 153814.69

Annual Profit & Loss Statement for the period of 2012 to 2015E
Value(Rs.in.mn) FY12A FY13A FY14E FY15E
Description 12m 12m 12m 12m
Net Sales 221163.70 258102.10 280039.13 299641.87
Other Income 2783.10 6069.00 5959.41 6197.78
Total Income 223946.80 264171.10 285998.54 305839.65
Expenditure -187061.60 -211980.60 -233425.56 -248702.75
Operating Profit 36885.20 52190.50 52572.98 57136.90
Interest -12.40 -251.50 -448.96 -336.72
Gross profit 36872.80 51939.00 52124.02 56800.18
Depreciation -2182.50 -2360.20 -2611.33 -2820.23
Exceptional Items 0.00 0.00 564.00 0.00
Profit Before Tax 34690.30 49578.80 50076.70 53979.95
Tax -7776.30 -11612.10 -10660.29 -11875.59
Net Profit 26914.00 37966.70 39416.41 42104.36
Equity capital 2161.50 2162.50 2162.60 2162.60
Reserves 32961.10 24571.00 47913.45 58454.41
Face value 1.00 1.00 1.00 1.00
EPS 12.45 17.56 18.23 19.47
Quarterly Profit & Loss Statement for the period of 30th June, 2013 to 31st March, 2014E
Value(Rs.in.mn) 30-Jun-13 30-Sep-13 31-Dec-13 31-Mar-14E
Description 3m 3m 3m 3m
Net sales 68090.40 68926.40 72233.50 70788.83
Other income 1767.50 1509.90 1426.60 1255.41
Total Income 69857.90 70436.30 73660.10 72044.24
Expenditure -56171.90 -58073.30 -59965.50 -59214.86
Operating profit 13686.00 12363.00 13694.60 12829.38
Interest -62.20 -62.80 -182.00 -141.96
Gross profit 13623.80 12300.20 13512.60 12687.42
Depreciation -664.40 -639.20 -644.20 -663.53
Exceptional Items 0.00 334.30 229.70 0.00
Profit Before Tax 12959.40 11995.30 13098.10 12023.90
Tax -2766.90 -2857.30 -2475.00 -2561.09
Net Profit 10192.50 9138.00 10623.10 9462.81
Equity capital 2162.50 2162.60 2162.60 2162.60
Face value 1.00 1.00 1.00 1.00
EPS 4.71 4.23 4.91 4.38
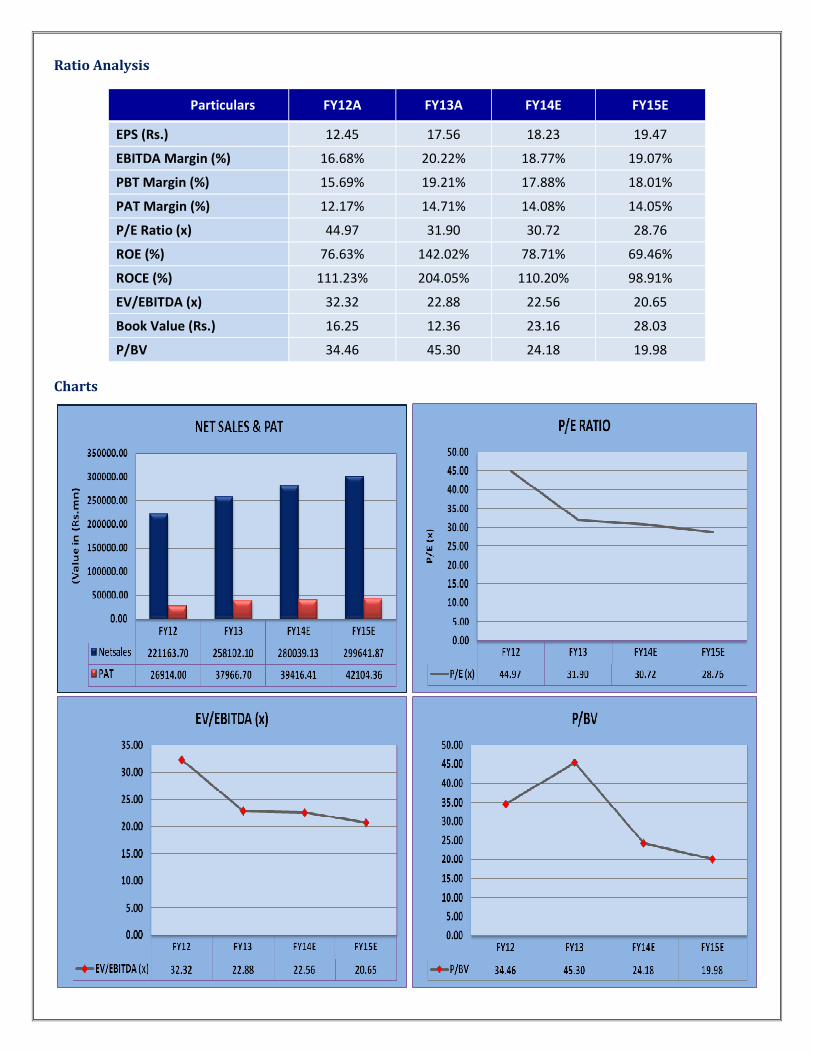
Ratio Analysis
Particulars FY12A FY13A FY14E FY15E
EPS (Rs.) 12.45 17.56 18.23 19.47
EBITDA Margin (%) 16.68% 20.22% 18.77% 19.07%
PBT Margin (%) 15.69% 19.21% 17.88% 18.01%
PAT Margin (%) 12.17% 14.71% 14.08% 14.05%
P/E Ratio (x) 44.97 31.90 30.72 28.76
ROE (%) 76.63% 142.02% 78.71% 69.46%
ROCE (%) 111.23% 204.05% 110.20% 98.91%
EV/EBITDA (x) 32.32 22.88 22.56 20.65
Book Value (Rs.) 16.25 12.36 23.16 28.03
P/BV 34.46 45.30 24.18 19.98
Charts

OUTLOOK AND CONCLUSION
� At the current market price of Rs.560.00, the stock P/E ratio is at 30.72 x FY14E and 28.76 x FY15E
respectively.
� Earning per share (EPS) of the company for the earnings for FY14E and FY15E is seen at Rs.18.23 and
Rs.19.47 respectively.
� Net Sales and PAT of the company are expected to grow at a CAGR of 11% and 16% over 2012 to 2015E
respectively.
� On the basis of EV/EBITDA, the stock trades at 22.56 x for FY14E and 20.65 x for FY15E.
� Price to Book Value of the stock is expected to be at 24.18 x and 19.98 x respectively for FY14E and FY15E.
� We expect that the company surplus scenario is likely to continue for the next three years, will keep its
growth story in the coming quarters also. We recommend ‘BUY’ in this particular scrip with a target price of
Rs.620.00 for Medium to Long term investment.
INDUSTRY OVERVIEW
The Indian Fast Moving Consumer Goods (FMCG) sector is the fourth largest in the Indian economy and has a
market size of $13.1 billion. This industry primarily includes the production, distribution and marketing of
consumer packaged goods, that is those categories of products which are consumed at regular intervals.
The FMCG market is set to treble US$ 33.4 billion in 2015. Penetration level as well as per capita consumption in
most product categories like jams, toothpaste, skin care, hair wash etc in India is low indicating the untapped
market potential.
� The Indian FMCG industry represents nearly 2.5% of the country’s GDP.
� The industry has tripled in size in past 10 years and has grown at ~17%CAGR in the last 5 years driven by
rising income levels, increasing urbanization, strong rural demand and favourable demographic trends.
� The sector accounted for 1.9% of the nation’s total FDI inflows in April 2000- September 2012. Cumulative
FDI inflows into India from April 2000 to April 2013 in the food processing sector stood at Rs. 9,000.3 crore,
accounting for 0.96% of overall FDI inflows while the soaps, cosmetics and toiletries, accounting for 0.32% of
overall FDI at Rs. 3,115.5 crore.
� Food products and personal care together make up two-third of the sector’s revenues.
� Rural India accounts for more than 700 mn consumers or 70% of the Indian population and accounts for
50% of the total FMCG market.
� With changing lifestyle and increasing consumer demand, the Indian FMCG market is expected to cross $80
bn by 2026 in towns with population of up to 10 lakh.
� India's labor cost is amongst the lowest in the world, after China & Indonesia, giving it a competitive
advantage over other countries.
Household care
The fabric wash market size is estimated to be ~USD 1 billion, household cleaners to be USD 239 million, with
the production of synthetic detergents at 2.6 million tonnes. The demand for detergents has been growing at an
annual growth rate of 10 to 11% during the past five years
Personal Care (HPC)
The personal care products (PCP) market in India is estimated to be worth ~USD 4 bn p.a. Personal hygiene
products (including bath and shower products, deodorants etc.), hair care, skin care, colour cosmetics and
fragrances are the key segments of the personal care market.
Food & Beverages
Food processing industry is one of the largest industries in India, ranking fifth in terms of production, growth,
consumption, and export. The total value of Indian food processing industry is expected to touch USD 194 billion
by 2015 from a value of USD 121 billion in 2012, according to Indian Council of Agricultural Research (ICAR).
Expenditure on advertisements by FMCG Companies in 2013
Fast-moving consumer goods (FMCG) companies, a safe haven through most of the slowdown, have felt
consumption blues of late. While the annual revenues of these companies have increased 15-20 per cent, their
advertisement and sales promotions spends have raised 25-30 a year.
ITC, one of the biggest companies in the Indian FMCG space, spent Rs 806.65 crore on advertising in 2012-13,
against Rs 682.69 crore in 2011-12. At Rs 502.37 crore, Dabur India’s ad spends jumped 27 per cent in 2012-13.
In 2012-13, Hindustan Unilever spent Rs 3,231.88 crore on advertising and promotional activities, compared
with Rs 2,634.79 crore the previous financial year, a rise of 22.66 per cent. During the same period, Emami’s
spends rose 21.18 per cent to Rs 253.11 crore.
Government Policies and Regulatory Framework
Goods and Service Tax (GST): GST, which will replace the multiple indirect taxes levied on FMCG sector with a
uniform, simplified and single-pint taxation system, is likely to be implemented soon (the benefits are likely to
come in by the end of FY’14). The rate of GST on services is likely to be 16% and on goods is proposed to be 20%.
A swift move to the proposed GST may reduce prices, bolstering consumption for FMCG products.
Food Security Bill: The food security Bill has been passed recently by the Union Cabinet. As per the Bill, 5Kg of
food grains per person per month will be provided at subsidized prices from State Governments under the
targeted public distribution system.
FDI in retail: The decision to allow 51% FDI in multi brand retail and 100% FDI in single brand retail augers
well for the outlook for the FMCG sector. FMCG sector accounted for 1.9% of the nation’s total FDI inflows in
April 2000- September 2012. Cumulative FDI inflows into India from April 2000 to April 2013 in the food
processing sector stood at Rs. 9,000.33 crore, accounting for 0.96% of overall FDI inflows while that in the soaps,
cosmetics and toiletries was Rs. 3,115.54 crore in, accounting for 0.32%. The food processing sector attracted
FDI inflows of Rs. 6,198 crore during April 2009 to December 2012.
Relaxation of license rules: Industrial licenses are not required for almost all food and agro-processing
industries, barring certain items such as beer, potable alcohol and wines, cane sugar, and hydrogenated animal
fats and oils as well as items reserved for exclusive manufacturing in the small-scale sector.
Conclusion
While the rural market certainly offers a big attraction to marketers, it would be naïve to think that any company
can enter the market without facing any problems and walk away with a sizable share. Distribution is the most
important variable in the marketing plans of most consumer goods manufacturers, because managing such a
massive sales and distribution network is in itself a huge task.
This sector will continue to see growth as it depends on an ever-increasing internal market for consumption, and
demand for these goods remains more or less constant, irrespective of recession or inflation. Hence this sector
will grow, though it may not be a smooth growth path, due to the present world-wide economic slowdown, rising
inflation and fall of the rupee. This sector will see good growth in the long run and hiring will continue to remain
robust.
Disclaimer:
This document prepared by our research analysts does not constitute an offer or solicitation for the purchase or sale
of any financial instrument or as an official confirmation of any transaction. The information contained herein is
from publicly available data or other sources believed to be reliable but do not represent that it is accurate or
complete and it should not be relied on as such. Firstcall India Equity Advisors Pvt. Ltd. or any of it’s affiliates shall
not be in any way responsible for any loss or damage that may arise to any person from any inadvertent error in the
information contained in this report. This document is provide for assistance only and is not intended to be and must
not alone be taken as the basis for an investment decision.

Firstcall India Equity Research: Email – [email protected]
C.V.S.L.Kameswari Pharma
U. Janaki Rao Capital Goods
B. Anil Kumar Diversified
Ashish.Kushwaha IT, Consumer Durable & Banking
Suhani Adilabadkar Diversified
M. Vinayak Rao Diversified
Firstcall India also provides
Firstcall India Equity Advisors Pvt.Ltd focuses on, IPO’s, QIP’s, F.P.O’s,Takeover
Offers, Offer for Sale and Buy Back Offerings.
Corporate Finance Offerings include Foreign Currency Loan Syndications,
Placement of Equity / Debt with multilateral organizations, Short Term Funds
Management Debt & Equity, Working Capital Limits, Equity & Debt
Syndications and Structured Deals.
Corporate Advisory Offerings include Mergers & Acquisitions(domestic and
cross-border), divestitures, spin-offs, valuation of business, corporate
restructuring-Capital and Debt, Turnkey Corporate Revival – Planning &
Execution, Project Financing, Venture capital, Private Equity and Financial
Joint Ventures
Firstcall India also provides Financial Advisory services with respect to raising
of capital through FCCBs, GDRs, ADRs and listing of the same on International
Stock Exchanges namely AIMs, Luxembourg, Singapore Stock Exchanges and
other international stock exchanges.
For Further Details Contact:
3rd Floor,Sankalp,The Bureau,Dr.R.C.Marg,Chembur,Mumbai 400 071
Tel. : 022-2527 2510/2527 6077/25276089 Telefax : 022-25276089
E-mail: [email protected]
www.firstcallindiaequity.com
Related Documents