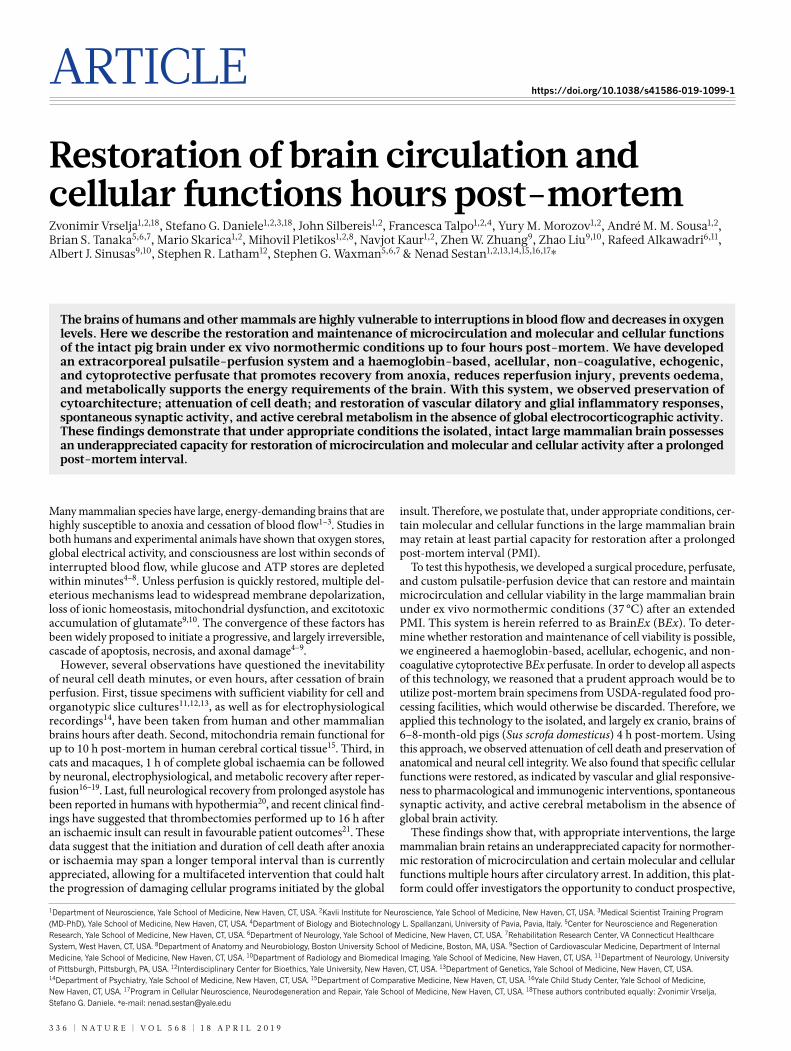
ARTICLE https://doi.org/10.1038/s41586-019-1099-1 Restoration of brain circulation and cellular functions hours post-mortem Zvonimir Vrselja 1,2,18 , Stefano G. Daniele 1,2,3,18 , John Silbereis 1,2 , Francesca Talpo 1,2,4 , Yury M. Morozov 1,2 , André M. M. Sousa 1,2 , Brian S. Tanaka 5,6,7 , Mario Skarica 1,2 , Mihovil Pletikos 1,2,8 , Navjot Kaur 1,2 , Zhen W. Zhuang 9 , Zhao Liu 9,10 , Rafeed Alkawadri 6,11 , Albert J. Sinusas 9,10 , Stephen R. Latham 12 , Stephen G. Waxman 5,6,7 & Nenad Sestan 1,2,13,14,15,16,17 * The brains of humans and other mammals are highly vulnerable to interruptions in blood flow and decreases in oxygen levels. Here we describe the restoration and maintenance of microcirculation and molecular and cellular functions of the intact pig brain under ex vivo normothermic conditions up to four hours post-mortem. We have developed an extracorporeal pulsatile-perfusion system and a haemoglobin-based, acellular, non-coagulative, echogenic, and cytoprotective perfusate that promotes recovery from anoxia, reduces reperfusion injury, prevents oedema, and metabolically supports the energy requirements of the brain. With this system, we observed preservation of cytoarchitecture; attenuation of cell death; and restoration of vascular dilatory and glial inflammatory responses, spontaneous synaptic activity, and active cerebral metabolism in the absence of global electrocorticographic activity. These findings demonstrate that under appropriate conditions the isolated, intact large mammalian brain possesses an underappreciated capacity for restoration of microcirculation and molecular and cellular activity after a prolonged post-mortem interval. Many mammalian species have large, energy-demanding brains that are highly susceptible to anoxia and cessation of blood flow 1–3 . Studies in both humans and experimental animals have shown that oxygen stores, global electrical activity, and consciousness are lost within seconds of interrupted blood flow, while glucose and ATP stores are depleted within minutes 4–8 . Unless perfusion is quickly restored, multiple del- eterious mechanisms lead to widespread membrane depolarization, loss of ionic homeostasis, mitochondrial dysfunction, and excitotoxic accumulation of glutamate 9,10 . The convergence of these factors has been widely proposed to initiate a progressive, and largely irreversible, cascade of apoptosis, necrosis, and axonal damage 4–9 . However, several observations have questioned the inevitability of neural cell death minutes, or even hours, after cessation of brain perfusion. First, tissue specimens with sufficient viability for cell and organotypic slice cultures 11,12,13 , as well as for electrophysiological recordings 14 , have been taken from human and other mammalian brains hours after death. Second, mitochondria remain functional for up to 10 h post-mortem in human cerebral cortical tissue 15 . Third, in cats and macaques, 1 h of complete global ischaemia can be followed by neuronal, electrophysiological, and metabolic recovery after reper- fusion 16–19 . Last, full neurological recovery from prolonged asystole has been reported in humans with hypothermia 20 , and recent clinical find- ings have suggested that thrombectomies performed up to 16 h after an ischaemic insult can result in favourable patient outcomes 21 . These data suggest that the initiation and duration of cell death after anoxia or ischaemia may span a longer temporal interval than is currently appreciated, allowing for a multifaceted intervention that could halt the progression of damaging cellular programs initiated by the global insult. Therefore, we postulate that, under appropriate conditions, cer- tain molecular and cellular functions in the large mammalian brain may retain at least partial capacity for restoration after a prolonged post-mortem interval (PMI). To test this hypothesis, we developed a surgical procedure, perfusate, and custom pulsatile-perfusion device that can restore and maintain microcirculation and cellular viability in the large mammalian brain under ex vivo normothermic conditions (37 °C) after an extended PMI. This system is herein referred to as BrainEx (BEx). To deter- mine whether restoration and maintenance of cell viability is possible, we engineered a haemoglobin-based, acellular, echogenic, and non- coagulative cytoprotective BEx perfusate. In order to develop all aspects of this technology, we reasoned that a prudent approach would be to utilize post-mortem brain specimens from USDA-regulated food pro- cessing facilities, which would otherwise be discarded. Therefore, we applied this technology to the isolated, and largely ex cranio, brains of 6–8-month-old pigs (Sus scrofa domesticus) 4 h post-mortem. Using this approach, we observed attenuation of cell death and preservation of anatomical and neural cell integrity. We also found that specific cellular functions were restored, as indicated by vascular and glial responsive- ness to pharmacological and immunogenic interventions, spontaneous synaptic activity, and active cerebral metabolism in the absence of global brain activity. These findings show that, with appropriate interventions, the large mammalian brain retains an underappreciated capacity for normother- mic restoration of microcirculation and certain molecular and cellular functions multiple hours after circulatory arrest. In addition, this plat- form could offer investigators the opportunity to conduct prospective, 1 Department of Neuroscience, Yale School of Medicine, New Haven, CT, USA. 2 Kavli Institute for Neuroscience, Yale School of Medicine, New Haven, CT, USA. 3 Medical Scientist Training Program (MD-PhD), Yale School of Medicine, New Haven, CT, USA. 4 Department of Biology and Biotechnology L. Spallanzani, University of Pavia, Pavia, Italy. 5 Center for Neuroscience and Regeneration Research, Yale School of Medicine, New Haven, CT, USA. 6 Department of Neurology, Yale School of Medicine, New Haven, CT, USA. 7 Rehabilitation Research Center, VA Connecticut Healthcare System, West Haven, CT, USA. 8 Department of Anatomy and Neurobiology, Boston University School of Medicine, Boston, MA, USA. 9 Section of Cardiovascular Medicine, Department of Internal Medicine, Yale School of Medicine, New Haven, CT, USA. 10 Department of Radiology and Biomedical Imaging, Yale School of Medicine, New Haven, CT, USA. 11 Department of Neurology, University of Pittsburgh, Pittsburgh, PA, USA. 12 Interdisciplinary Center for Bioethics, Yale University, New Haven, CT, USA. 13 Department of Genetics, Yale School of Medicine, New Haven, CT, USA. 14 Department of Psychiatry, Yale School of Medicine, New Haven, CT, USA. 15 Department of Comparative Medicine, New Haven, CT, USA. 16 Yale Child Study Center, Yale School of Medicine, New Haven, CT, USA. 17 Program in Cellular Neuroscience, Neurodegeneration and Repair, Yale School of Medicine, New Haven, CT, USA. 18 These authors contributed equally: Zvonimir Vrselja, Stefano G. Daniele. *e-mail: [email protected] 336 | NATURE | VOL 568 | 18 APRIL 2019

Welcome message from author
This document is posted to help you gain knowledge. Please leave a comment to let me know what you think about it! Share it to your friends and learn new things together.
Transcript
Articlehttps://doi.org/10.1038/s41586-019-1099-1
Restoration of brain circulation and cellular functions hours post-mortemZvonimir Vrselja1,2,18, Stefano G. Daniele1,2,3,18, John Silbereis1,2, Francesca talpo1,2,4, Yury M. Morozov1,2, André M. M. Sousa1,2, Brian S. tanaka5,6,7, Mario Skarica1,2, Mihovil Pletikos1,2,8, Navjot Kaur1,2, Zhen W. Zhuang9, Zhao liu9,10, rafeed Alkawadri6,11, Albert J. Sinusas9,10, Stephen r. latham12, Stephen G. Waxman5,6,7 & Nenad Sestan1,2,13,14,15,16,17*
The brains of humans and other mammals are highly vulnerable to interruptions in blood flow and decreases in oxygen levels. Here we describe the restoration and maintenance of microcirculation and molecular and cellular functions of the intact pig brain under ex vivo normothermic conditions up to four hours post-mortem. We have developed an extracorporeal pulsatile-perfusion system and a haemoglobin-based, acellular, non-coagulative, echogenic, and cytoprotective perfusate that promotes recovery from anoxia, reduces reperfusion injury, prevents oedema, and metabolically supports the energy requirements of the brain. With this system, we observed preservation of cytoarchitecture; attenuation of cell death; and restoration of vascular dilatory and glial inflammatory responses, spontaneous synaptic activity, and active cerebral metabolism in the absence of global electrocorticographic activity. These findings demonstrate that under appropriate conditions the isolated, intact large mammalian brain possesses an underappreciated capacity for restoration of microcirculation and molecular and cellular activity after a prolonged post-mortem interval.
Many mammalian species have large, energy-demanding brains that are highly susceptible to anoxia and cessation of blood flow1–3. Studies in both humans and experimental animals have shown that oxygen stores, global electrical activity, and consciousness are lost within seconds of interrupted blood flow, while glucose and ATP stores are depleted within minutes4–8. Unless perfusion is quickly restored, multiple del-eterious mechanisms lead to widespread membrane depolarization, loss of ionic homeostasis, mitochondrial dysfunction, and excitotoxic accumulation of glutamate9,10. The convergence of these factors has been widely proposed to initiate a progressive, and largely irreversible, cascade of apoptosis, necrosis, and axonal damage4–9.
However, several observations have questioned the inevitability of neural cell death minutes, or even hours, after cessation of brain perfusion. First, tissue specimens with sufficient viability for cell and organotypic slice cultures11,12,13, as well as for electrophysiological recordings14, have been taken from human and other mammalian brains hours after death. Second, mitochondria remain functional for up to 10 h post-mortem in human cerebral cortical tissue15. Third, in cats and macaques, 1 h of complete global ischaemia can be followed by neuronal, electrophysiological, and metabolic recovery after reper-fusion16–19. Last, full neurological recovery from prolonged asystole has been reported in humans with hypothermia20, and recent clinical find-ings have suggested that thrombectomies performed up to 16 h after an ischaemic insult can result in favourable patient outcomes21. These data suggest that the initiation and duration of cell death after anoxia or ischaemia may span a longer temporal interval than is currently appreciated, allowing for a multifaceted intervention that could halt the progression of damaging cellular programs initiated by the global
insult. Therefore, we postulate that, under appropriate conditions, cer-tain molecular and cellular functions in the large mammalian brain may retain at least partial capacity for restoration after a prolonged post-mortem interval (PMI).
To test this hypothesis, we developed a surgical procedure, perfusate, and custom pulsatile-perfusion device that can restore and maintain microcirculation and cellular viability in the large mammalian brain under ex vivo normothermic conditions (37 °C) after an extended PMI. This system is herein referred to as BrainEx (BEx). To deter-mine whether restoration and maintenance of cell viability is possible, we engineered a haemoglobin-based, acellular, echogenic, and non- coagulative cytoprotective BEx perfusate. In order to develop all aspects of this technology, we reasoned that a prudent approach would be to utilize post-mortem brain specimens from USDA-regulated food pro-cessing facilities, which would otherwise be discarded. Therefore, we applied this technology to the isolated, and largely ex cranio, brains of 6–8-month-old pigs (Sus scrofa domesticus) 4 h post-mortem. Using this approach, we observed attenuation of cell death and preservation of anatomical and neural cell integrity. We also found that specific cellular functions were restored, as indicated by vascular and glial responsive-ness to pharmacological and immunogenic interventions, spontaneous synaptic activity, and active cerebral metabolism in the absence of global brain activity.
These findings show that, with appropriate interventions, the large mammalian brain retains an underappreciated capacity for normother-mic restoration of microcirculation and certain molecular and cellular functions multiple hours after circulatory arrest. In addition, this plat-form could offer investigators the opportunity to conduct prospective,
1Department of Neuroscience, Yale School of Medicine, New Haven, CT, USA. 2Kavli Institute for Neuroscience, Yale School of Medicine, New Haven, CT, USA. 3Medical Scientist Training Program (MD-PhD), Yale School of Medicine, New Haven, CT, USA. 4Department of Biology and Biotechnology L. Spallanzani, University of Pavia, Pavia, Italy. 5Center for Neuroscience and Regeneration Research, Yale School of Medicine, New Haven, CT, USA. 6Department of Neurology, Yale School of Medicine, New Haven, CT, USA. 7Rehabilitation Research Center, VA Connecticut Healthcare System, West Haven, CT, USA. 8Department of Anatomy and Neurobiology, Boston University School of Medicine, Boston, MA, USA. 9Section of Cardiovascular Medicine, Department of Internal Medicine, Yale School of Medicine, New Haven, CT, USA. 10Department of Radiology and Biomedical Imaging, Yale School of Medicine, New Haven, CT, USA. 11Department of Neurology, University of Pittsburgh, Pittsburgh, PA, USA. 12Interdisciplinary Center for Bioethics, Yale University, New Haven, CT, USA. 13Department of Genetics, Yale School of Medicine, New Haven, CT, USA. 14Department of Psychiatry, Yale School of Medicine, New Haven, CT, USA. 15Department of Comparative Medicine, New Haven, CT, USA. 16Yale Child Study Center, Yale School of Medicine, New Haven, CT, USA. 17Program in Cellular Neuroscience, Neurodegeneration and Repair, Yale School of Medicine, New Haven, CT, USA. 18These authors contributed equally: Zvonimir Vrselja, Stefano G. Daniele. *e-mail: [email protected]
3 3 6 | N A t U r e | V O l 5 6 8 | 1 8 A P r i l 2 0 1 9
Article reSeArcH
functional ex vivo studies in intact brains that would otherwise be limited to static histological, biochemical, or structural investigation.
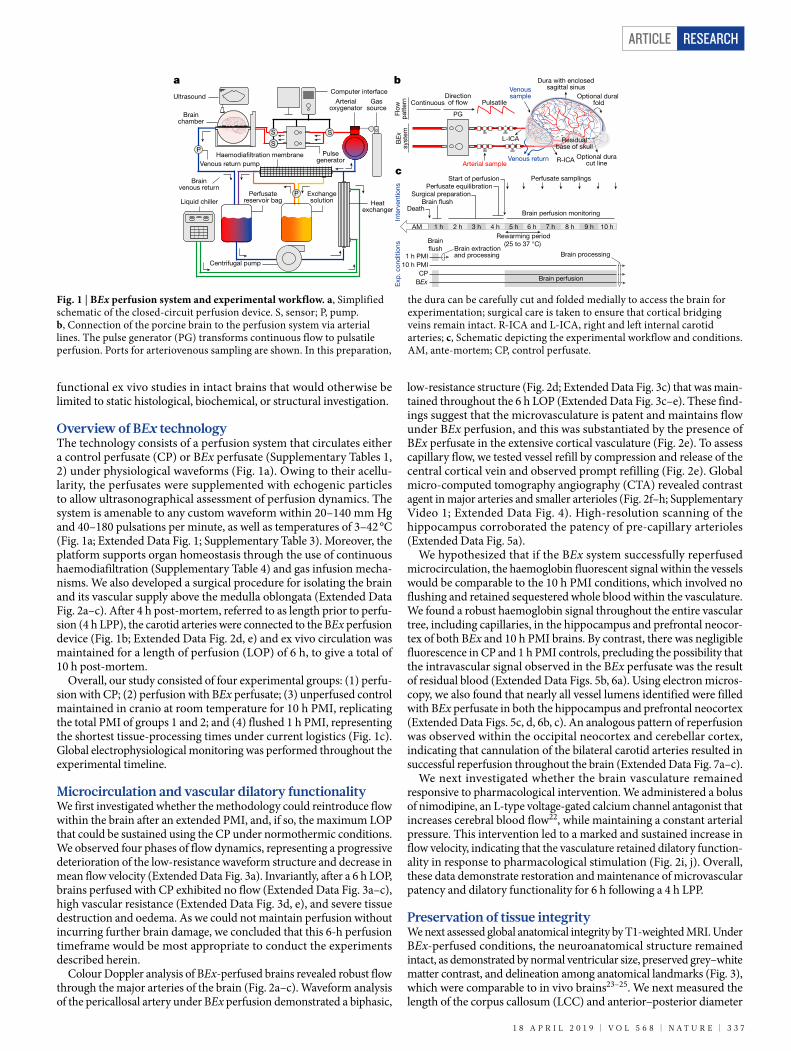
Overview of BEx technologyThe technology consists of a perfusion system that circulates either a control perfusate (CP) or BEx perfusate (Supplementary Tables 1, 2) under physiological waveforms (Fig. 1a). Owing to their acellu-larity, the perfusates were supplemented with echogenic particles to allow ultrasonographical assessment of perfusion dynamics. The system is amenable to any custom waveform within 20–140 mm Hg and 40–180 pulsations per minute, as well as temperatures of 3–42 °C (Fig. 1a; Extended Data Fig. 1; Supplementary Table 3). Moreover, the platform supports organ homeostasis through the use of continuous haemodiafiltration (Supplementary Table 4) and gas infusion mecha-nisms. We also developed a surgical procedure for isolating the brain and its vascular supply above the medulla oblongata (Extended Data Fig. 2a–c). After 4 h post-mortem, referred to as length prior to perfu-sion (4 h LPP), the carotid arteries were connected to the BEx perfusion device (Fig. 1b; Extended Data Fig. 2d, e) and ex vivo circulation was maintained for a length of perfusion (LOP) of 6 h, to give a total of 10 h post-mortem.
Overall, our study consisted of four experimental groups: (1) perfu-sion with CP; (2) perfusion with BEx perfusate; (3) unperfused control maintained in cranio at room temperature for 10 h PMI, replicating the total PMI of groups 1 and 2; and (4) flushed 1 h PMI, representing the shortest tissue-processing times under current logistics (Fig. 1c). Global electrophysiological monitoring was performed throughout the experimental timeline.
Microcirculation and vascular dilatory functionalityWe first investigated whether the methodology could reintroduce flow within the brain after an extended PMI, and, if so, the maximum LOP that could be sustained using the CP under normothermic conditions. We observed four phases of flow dynamics, representing a progressive deterioration of the low-resistance waveform structure and decrease in mean flow velocity (Extended Data Fig. 3a). Invariantly, after a 6 h LOP, brains perfused with CP exhibited no flow (Extended Data Fig. 3a–c), high vascular resistance (Extended Data Fig. 3d, e), and severe tissue destruction and oedema. As we could not maintain perfusion without incurring further brain damage, we concluded that this 6-h perfusion timeframe would be most appropriate to conduct the experiments described herein.
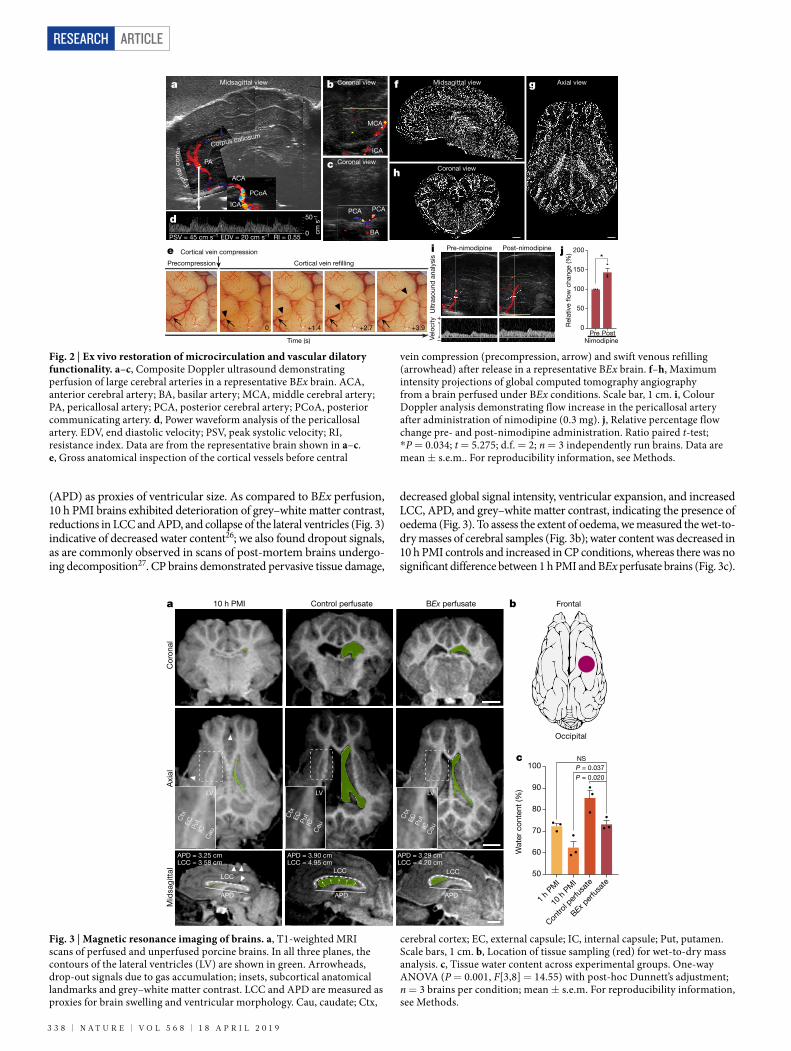
Colour Doppler analysis of BEx-perfused brains revealed robust flow through the major arteries of the brain (Fig. 2a–c). Waveform analysis of the pericallosal artery under BEx perfusion demonstrated a biphasic,
low-resistance structure (Fig. 2d; Extended Data Fig. 3c) that was main-tained throughout the 6 h LOP (Extended Data Fig. 3c–e). These find-ings suggest that the microvasculature is patent and maintains flow under BEx perfusion, and this was substantiated by the presence of BEx perfusate in the extensive cortical vasculature (Fig. 2e). To assess capillary flow, we tested vessel refill by compression and release of the central cortical vein and observed prompt refilling (Fig. 2e). Global micro-computed tomography angiography (CTA) revealed contrast agent in major arteries and smaller arterioles (Fig. 2f–h; Supplementary Video 1; Extended Data Fig. 4). High-resolution scanning of the hippocampus corroborated the patency of pre-capillary arterioles (Extended Data Fig. 5a).
We hypothesized that if the BEx system successfully reperfused microcirculation, the haemoglobin fluorescent signal within the vessels would be comparable to the 10 h PMI conditions, which involved no flushing and retained sequestered whole blood within the vasculature. We found a robust haemoglobin signal throughout the entire vascular tree, including capillaries, in the hippocampus and prefrontal neocor-tex of both BEx and 10 h PMI brains. By contrast, there was negligible fluorescence in CP and 1 h PMI controls, precluding the possibility that the intravascular signal observed in the BEx perfusate was the result of residual blood (Extended Data Figs. 5b, 6a). Using electron micros-copy, we also found that nearly all vessel lumens identified were filled with BEx perfusate in both the hippocampus and prefrontal neocortex (Extended Data Figs. 5c, d, 6b, c). An analogous pattern of reperfusion was observed within the occipital neocortex and cerebellar cortex, indicating that cannulation of the bilateral carotid arteries resulted in successful reperfusion throughout the brain (Extended Data Fig. 7a–c).
We next investigated whether the brain vasculature remained responsive to pharmacological intervention. We administered a bolus of nimodipine, an L-type voltage-gated calcium channel antagonist that increases cerebral blood flow22, while maintaining a constant arterial pressure. This intervention led to a marked and sustained increase in flow velocity, indicating that the vasculature retained dilatory function-ality in response to pharmacological stimulation (Fig. 2i, j). Overall, these data demonstrate restoration and maintenance of microvascular patency and dilatory functionality for 6 h following a 4 h LPP.
Preservation of tissue integrityWe next assessed global anatomical integrity by T1-weighted MRI. Under BEx-perfused conditions, the neuroanatomical structure remained intact, as demonstrated by normal ventricular size, preserved grey–white matter contrast, and delineation among anatomical landmarks (Fig. 3), which were comparable to in vivo brains23–25. We next measured the length of the corpus callosum (LCC) and anterior–posterior diameter
S
P
S
P
Centrifugal pump
Haemodialtration membrane Pulsegenerator
Liquid chiller
Ultrasound
aComputer interface
Brainchamber
Brainvenous return
S
Venous return pump
Arterialoxygenator
Gassource
Perfusatereservoir bag
Exchangesolution Heat
exchanger
b
Inte
rven
tions
Exp
. con
diti
ons
1 h 2 h 3 h 4 h 5 h 6 h 7 h 8 h 9 h 10 hRewarming period
(25 to 37 °C)
1 h PMI10 h PMI
CPBEx
Brainush
Brain perfusion
Brain extractionand processing Brain processing
AM
Death
Surgical preparationBrain ush
Brain perfusion monitoring
Start of perfusion Perfusate samplingsPerfusate equilibration
c
Continuous Pulsatile
BE
xsy
stem
Flow
pat
tern
Venoussample
Arterial sampleR-ICA
L-ICA
Venous return
Directionof ow
Optional dural fold
Dura with enclosedsagittal sinus
Optional duracut line
PG
Residualbase of skull
Fig. 1 | BEx perfusion system and experimental workflow. a, Simplified schematic of the closed-circuit perfusion device. S, sensor; P, pump. b, Connection of the porcine brain to the perfusion system via arterial lines. The pulse generator (PG) transforms continuous flow to pulsatile perfusion. Ports for arteriovenous sampling are shown. In this preparation,
the dura can be carefully cut and folded medially to access the brain for experimentation; surgical care is taken to ensure that cortical bridging veins remain intact. R-ICA and L-ICA, right and left internal carotid arteries; c, Schematic depicting the experimental workflow and conditions. AM, ante-mortem; CP, control perfusate.
1 8 A P r i l 2 0 1 9 | V O l 5 6 8 | N A t U r e | 3 3 7
ArticlereSeArcH
(APD) as proxies of ventricular size. As compared to BEx perfusion, 10 h PMI brains exhibited deterioration of grey–white matter contrast, reductions in LCC and APD, and collapse of the lateral ventricles (Fig. 3) indicative of decreased water content26; we also found dropout signals, as are commonly observed in scans of post-mortem brains undergo-ing decomposition27. CP brains demonstrated pervasive tissue damage,
decreased global signal intensity, ventricular expansion, and increased LCC, APD, and grey–white matter contrast, indicating the presence of oedema (Fig. 3). To assess the extent of oedema, we measured the wet-to-dry masses of cerebral samples (Fig. 3b); water content was decreased in 10 h PMI controls and increased in CP conditions, whereas there was no significant difference between 1 h PMI and BEx perfusate brains (Fig. 3c).
Midsagittal view Coronal viewa b
e
Corpus callosum
MCA
ICA
PA Coronal viewc
PCAPCA
BA
ACA
PCoA
ICA
Time (s)
Cortical vein rellingPrecompression
Midsagittal viewf Axial viewg
Coronal viewh
Cortical vein compression
0 +1.4 +2.7 +3.9
0
50
PSV = 45 cm s–1 EDV = 20 cm s–1 RI = 0.55
d
cm s
–1
j
Nimodipine
Rel
ativ
e o
w c
hang
e (%
)
0
50
100
150
200*
Pre Post
Velo
city
+
–
Ultr
asou
nd a
naly
sis
Pre-nimodipinei Post-nimodipine
Fron
tal c
orte
x
Fig. 2 | Ex vivo restoration of microcirculation and vascular dilatory functionality. a–c, Composite Doppler ultrasound demonstrating perfusion of large cerebral arteries in a representative BEx brain. ACA, anterior cerebral artery; BA, basilar artery; MCA, middle cerebral artery; PA, pericallosal artery; PCA, posterior cerebral artery; PCoA, posterior communicating artery. d, Power waveform analysis of the pericallosal artery. EDV, end diastolic velocity; PSV, peak systolic velocity; RI, resistance index. Data are from the representative brain shown in a–c. e, Gross anatomical inspection of the cortical vessels before central
vein compression (precompression, arrow) and swift venous refilling (arrowhead) after release in a representative BEx brain. f–h, Maximum intensity projections of global computed tomography angiography from a brain perfused under BEx conditions. Scale bar, 1 cm. i, Colour Doppler analysis demonstrating flow increase in the pericallosal artery after administration of nimodipine (0.3 mg). j, Relative percentage flow change pre- and post-nimodipine administration. Ratio paired t-test; *P = 0.034; t = 5.275; d.f. = 2; n = 3 independently run brains. Data are mean ± s.e.m.. For reproducibility information, see Methods.
Cor
onal
Axi
alM
idsa
gitt
al
BEx perfusate
APD
LCC
APD = 3.29 cmLCC = 4.20 cm
Control perfusate
Ctx
EC Put
ICC
au
LV
APD
LCC
APD = 3.90 cmLCC = 4.95 cm
10 h PMI
APD = 3.25 cmLCC = 3.58 cm
APD
LCC
a
Ctx
EC Put
ICC
au
Ctx
EC Put
ICC
au
LV
b Frontal
Occipital
c
1 h
PMI
10 h
PM
I
Contro
l per
fusa
te
BEx per
fusa
te
NS
P = 0.020
P = 0.037
50
60
70
80
90
100
Wat
er c
onte
nt (%
)LV
Fig. 3 | Magnetic resonance imaging of brains. a, T1-weighted MRI scans of perfused and unperfused porcine brains. In all three planes, the contours of the lateral ventricles (LV) are shown in green. Arrowheads, drop-out signals due to gas accumulation; insets, subcortical anatomical landmarks and grey–white matter contrast. LCC and APD are measured as proxies for brain swelling and ventricular morphology. Cau, caudate; Ctx,
cerebral cortex; EC, external capsule; IC, internal capsule; Put, putamen. Scale bars, 1 cm. b, Location of tissue sampling (red) for wet-to-dry mass analysis. c, Tissue water content across experimental groups. One-way ANOVA (P = 0.001, F[3,8] = 14.55) with post-hoc Dunnett’s adjustment; n = 3 brains per condition; mean ± s.e.m. For reproducibility information, see Methods.
3 3 8 | N A t U r e | V O l 5 6 8 | 1 8 A P r i l 2 0 1 9
Article reSeArcH
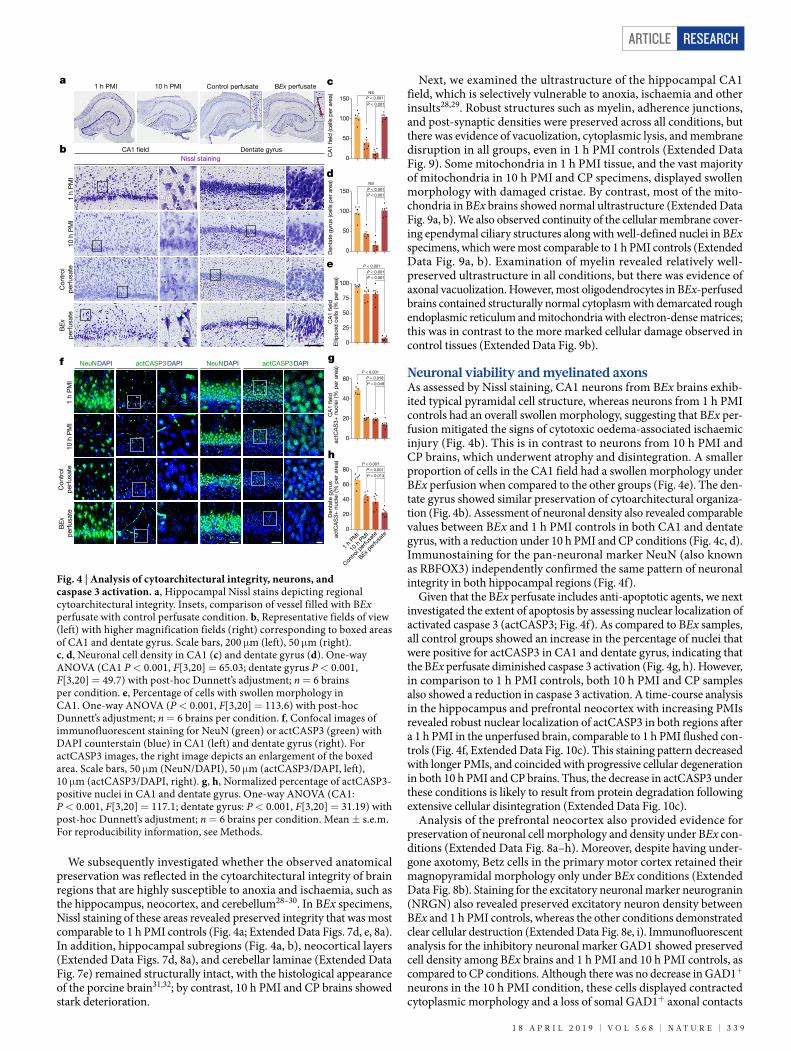
We subsequently investigated whether the observed anatomical preservation was reflected in the cytoarchitectural integrity of brain regions that are highly susceptible to anoxia and ischaemia, such as the hippocampus, neocortex, and cerebellum28–30. In BEx specimens, Nissl staining of these areas revealed preserved integrity that was most comparable to 1 h PMI controls (Fig. 4a; Extended Data Figs. 7d, e, 8a). In addition, hippocampal subregions (Fig. 4a, b), neocortical layers (Extended Data Figs. 7d, 8a), and cerebellar laminae (Extended Data Fig. 7e) remained structurally intact, with the histological appearance of the porcine brain31,32; by contrast, 10 h PMI and CP brains showed stark deterioration.
Next, we examined the ultrastructure of the hippocampal CA1 field, which is selectively vulnerable to anoxia, ischaemia and other insults28,29. Robust structures such as myelin, adherence junctions, and post-synaptic densities were preserved across all conditions, but there was evidence of vacuolization, cytoplasmic lysis, and membrane disruption in all groups, even in 1 h PMI controls (Extended Data Fig. 9). Some mitochondria in 1 h PMI tissue, and the vast majority of mitochondria in 10 h PMI and CP specimens, displayed swollen morphology with damaged cristae. By contrast, most of the mito-chondria in BEx brains showed normal ultrastructure (Extended Data Fig. 9a, b). We also observed continuity of the cellular membrane cover-ing ependymal ciliary structures along with well-defined nuclei in BEx specimens, which were most comparable to 1 h PMI controls (Extended Data Fig. 9a, b). Examination of myelin revealed relatively well- preserved ultrastructure in all conditions, but there was evidence of axonal vacuolization. However, most oligodendrocytes in BEx-perfused brains contained structurally normal cytoplasm with demarcated rough endoplasmic reticulum and mitochondria with electron-dense matrices; this was in contrast to the more marked cellular damage observed in control tissues (Extended Data Fig. 9b).
Neuronal viability and myelinated axonsAs assessed by Nissl staining, CA1 neurons from BEx brains exhib-ited typical pyramidal cell structure, whereas neurons from 1 h PMI controls had an overall swollen morphology, suggesting that BEx per-fusion mitigated the signs of cytotoxic oedema-associated ischaemic injury (Fig. 4b). This is in contrast to neurons from 10 h PMI and CP brains, which underwent atrophy and disintegration. A smaller proportion of cells in the CA1 field had a swollen morphology under BEx perfusion when compared to the other groups (Fig. 4e). The den-tate gyrus showed similar preservation of cytoarchitectural organiza-tion (Fig. 4b). Assessment of neuronal density also revealed comparable values between BEx and 1 h PMI controls in both CA1 and dentate gyrus, with a reduction under 10 h PMI and CP conditions (Fig. 4c, d). Immunostaining for the pan-neuronal marker NeuN (also known as RBFOX3) independently confirmed the same pattern of neuronal integrity in both hippocampal regions (Fig. 4f).
Given that the BEx perfusate includes anti-apoptotic agents, we next investigated the extent of apoptosis by assessing nuclear localization of activated caspase 3 (actCASP3; Fig. 4f). As compared to BEx samples, all control groups showed an increase in the percentage of nuclei that were positive for actCASP3 in CA1 and dentate gyrus, indicating that the BEx perfusate diminished caspase 3 activation (Fig. 4g, h). However, in comparison to 1 h PMI controls, both 10 h PMI and CP samples also showed a reduction in caspase 3 activation. A time-course analysis in the hippocampus and prefrontal neocortex with increasing PMIs revealed robust nuclear localization of actCASP3 in both regions after a 1 h PMI in the unperfused brain, comparable to 1 h PMI flushed con-trols (Fig. 4f, Extended Data Fig. 10c). This staining pattern decreased with longer PMIs, and coincided with progressive cellular degeneration in both 10 h PMI and CP brains. Thus, the decrease in actCASP3 under these conditions is likely to result from protein degradation following extensive cellular disintegration (Extended Data Fig. 10c).
Analysis of the prefrontal neocortex also provided evidence for preservation of neuronal cell morphology and density under BEx con-ditions (Extended Data Fig. 8a–h). Moreover, despite having under-gone axotomy, Betz cells in the primary motor cortex retained their magnopyramidal morphology only under BEx conditions (Extended Data Fig. 8b). Staining for the excitatory neuronal marker neurogranin (NRGN) also revealed preserved excitatory neuron density between BEx and 1 h PMI controls, whereas the other conditions demonstrated clear cellular destruction (Extended Data Fig. 8e, i). Immunofluorescent analysis for the inhibitory neuronal marker GAD1 showed preserved cell density among BEx brains and 1 h PMI and 10 h PMI controls, as compared to CP conditions. Although there was no decrease in GAD1+ neurons in the 10 h PMI condition, these cells displayed contracted cytoplasmic morphology and a loss of somal GAD1+ axonal contacts
1 h PMI 10 h PMI Control perfusate BEx perfusate
f
10 h
PM
IC
ontr
olp
erfu
sate
1 h
PM
I B
Ex
per
fusa
te
a
actCASP3DAPINeuNDAPINeuNDAPI actCASP3DAPI
b CA1 eld Dentate gyrusNissl staining
10 h
PM
IC
ontr
olp
erfu
sate
1 h
PM
I B
Ex
per
fusa
te
e
c
d
g
h
CA
1 e
ld (c
ells
per
are
a)
0
50
100
150NS
P < 0.001
P < 0.001
Den
tate
gyr
us (c
ells
per
are
a)
0
50
100
150NS
P < 0.001P < 0.001
CA
1 e
ldE
llip
soid
cel
ls (%
per
are
a)0
25
50
75
100
P < 0.001P < 0.001
P < 0.001
CA
1 e
ldac
tCA
S3+
nuc
lei (
% p
er a
rea)
0
20
40
60P < 0.001
P = 0.018
P = 0.049
Den
tate
gyr
usac
tCA
S3+
nuc
lei (
% p
er a
rea)
0
20
40
60
80P < 0.001
P < 0.001
P = 0.013
1 h
PMI
10 h
PM
I
Contro
l per
fusa
te
BEx per
fusa
te
Fig. 4 | Analysis of cytoarchitectural integrity, neurons, and caspase 3 activation. a, Hippocampal Nissl stains depicting regional cytoarchitectural integrity. Insets, comparison of vessel filled with BEx perfusate with control perfusate condition. b, Representative fields of view (left) with higher magnification fields (right) corresponding to boxed areas of CA1 and dentate gyrus. Scale bars, 200 μm (left), 50 μm (right). c, d, Neuronal cell density in CA1 (c) and dentate gyrus (d). One-way ANOVA (CA1 P < 0.001, F[3,20] = 65.03; dentate gyrus P < 0.001, F[3,20] = 49.7) with post-hoc Dunnett’s adjustment; n = 6 brains per condition. e, Percentage of cells with swollen morphology in CA1. One-way ANOVA (P < 0.001, F[3,20] = 113.6) with post-hoc Dunnett’s adjustment; n = 6 brains per condition. f, Confocal images of immunofluorescent staining for NeuN (green) or actCASP3 (green) with DAPI counterstain (blue) in CA1 (left) and dentate gyrus (right). For actCASP3 images, the right image depicts an enlargement of the boxed area. Scale bars, 50 μm (NeuN/DAPI), 50 μm (actCASP3/DAPI, left), 10 μm (actCASP3/DAPI, right). g, h, Normalized percentage of actCASP3-positive nuclei in CA1 and dentate gyrus. One-way ANOVA (CA1: P < 0.001, F[3,20] = 117.1; dentate gyrus: P < 0.001, F[3,20] = 31.19) with post-hoc Dunnett’s adjustment; n = 6 brains per condition. Mean ± s.e.m. For reproducibility information, see Methods.
1 8 A P r i l 2 0 1 9 | V O l 5 6 8 | N A t U r e | 3 3 9
ArticlereSeArcH
(Extended Data Fig. 8f, j). Similar to the hippocampus, the prefrontal neocortex also showed greater nuclear localization of actCASP3 in all control conditions than in BEx brains (Extended Data Fig. 10a, b).
We next investigated whether neocortical axons remained intact, by examining the orientation and bundling of single myelinated fibres. Myelinated fibres are normally organized into a rectilinear lattice in which the most prominent fibres are oriented orthogonally to the pial surface, forming bundles33; ischaemic injury disrupts fibre orientation, at least in part through oedema-related displacement34. Analysis of myelin basic protein (MBP) showed that 1 h PMI and CP brains con-tained more fibres at angles of 0–60° to the pial surface as compared to BEx specimens (Extended Data Fig. 11a, b). Given the absence of oedema, we expected and observed no difference in fibre orientation between 10 h PMI and BEx samples (Extended Data Fig. 11a, b). We next examined the number of fibre bundles per unit area in cortical specimens, and found a decrease in bundle density under the 10 h PMI and CP conditions, demonstrating overall deterioration of axonal archi-tecture; by contrast, there was no difference in bundle density between 1 h PMI and BEx samples (Extended Data Fig. 11a, c).
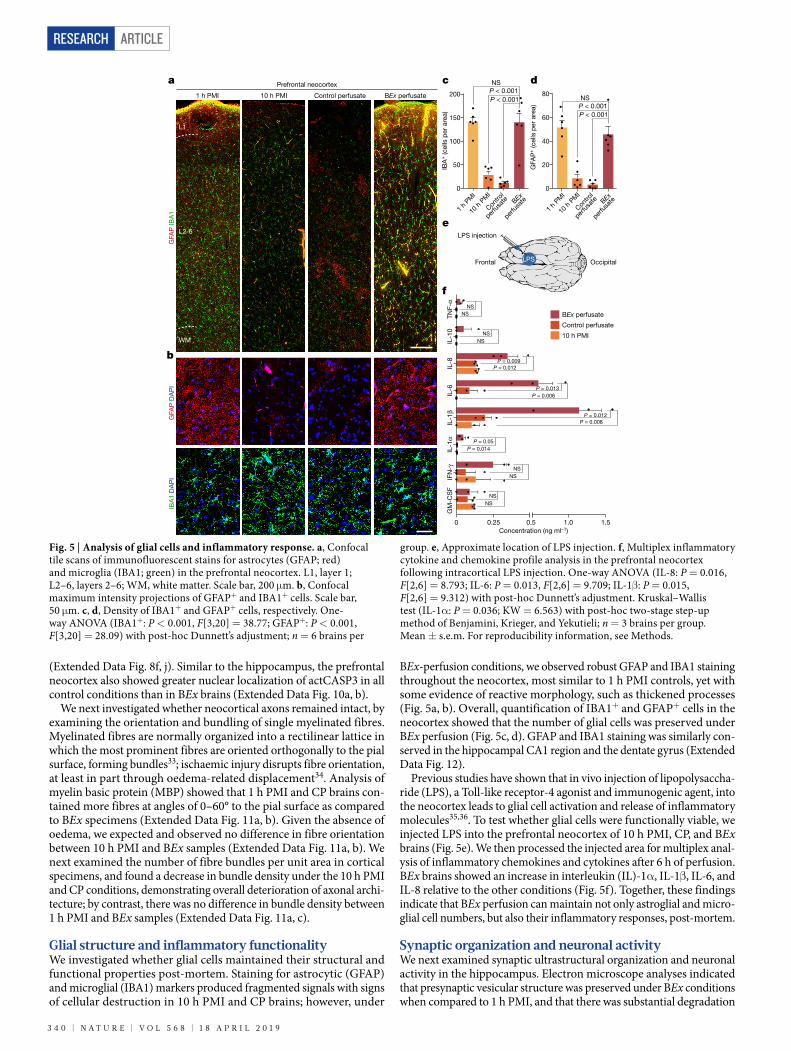
Glial structure and inflammatory functionalityWe investigated whether glial cells maintained their structural and functional properties post-mortem. Staining for astrocytic (GFAP) and microglial (IBA1) markers produced fragmented signals with signs of cellular destruction in 10 h PMI and CP brains; however, under
BEx-perfusion conditions, we observed robust GFAP and IBA1 staining throughout the neocortex, most similar to 1 h PMI controls, yet with some evidence of reactive morphology, such as thickened processes (Fig. 5a, b). Overall, quantification of IBA1+ and GFAP+ cells in the neocortex showed that the number of glial cells was preserved under BEx perfusion (Fig. 5c, d). GFAP and IBA1 staining was similarly con-served in the hippocampal CA1 region and the dentate gyrus (Extended Data Fig. 12).
Previous studies have shown that in vivo injection of lipopolysaccha-ride (LPS), a Toll-like receptor-4 agonist and immunogenic agent, into the neocortex leads to glial cell activation and release of inflammatory molecules35,36. To test whether glial cells were functionally viable, we injected LPS into the prefrontal neocortex of 10 h PMI, CP, and BEx brains (Fig. 5e). We then processed the injected area for multiplex anal-ysis of inflammatory chemokines and cytokines after 6 h of perfusion. BEx brains showed an increase in interleukin (IL)-1α, IL-1β, IL-6, and IL-8 relative to the other conditions (Fig. 5f). Together, these findings indicate that BEx perfusion can maintain not only astroglial and micro-glial cell numbers, but also their inflammatory responses, post-mortem.
Synaptic organization and neuronal activityWe next examined synaptic ultrastructural organization and neuronal activity in the hippocampus. Electron microscope analyses indicated that presynaptic vesicular structure was preserved under BEx conditions when compared to 1 h PMI, and that there was substantial degradation
GFA
P D
AP
I
10 h PMI1 h PMI
a
b
Prefrontal neocortex
f
Control perfusate BEx perfusate
L1
L2-6
WM
IBA
1 D
AP
IG
FAP
IBA
1
e
Frontal Occipital
LPS injection
LPS
NSNS
NSNS
P = 0.012P = 0.008
NSNS
NSNS
P = 0.009P = 0.012
P = 0.013P = 0.006
P = 0.05P = 0.014
0 0.25 0.5 1.0 1.5
GM
-CS
FIF
N-γ
IL-1
0TN
F-α
Concentration (ng ml–1)
IL-8
10 h PMI
Control perfusate
BEx perfusate
IL-6
IL-1β
IL-1α
c
0
50
100
150
200
IBA
+ (c
ells
per
are
a)
1 h
PMI
10 h
PM
I
Contro
l
perfu
sate BEx
perfu
sate
NSP < 0.001P < 0.001
d
0
20
40
60
80
GFA
P+ (c
ells
per
are
a)
NSP < 0.001P < 0.001
1 h
PMI
10 h
PM
I
Contro
l
perfu
sate BEx
perfu
sate
Fig. 5 | Analysis of glial cells and inflammatory response. a, Confocal tile scans of immunofluorescent stains for astrocytes (GFAP; red) and microglia (IBA1; green) in the prefrontal neocortex. L1, layer 1; L2–6, layers 2–6; WM, white matter. Scale bar, 200 μm. b, Confocal maximum intensity projections of GFAP+ and IBA1+ cells. Scale bar, 50 μm. c, d, Density of IBA1+ and GFAP+ cells, respectively. One-way ANOVA (IBA1+: P < 0.001, F[3,20] = 38.77; GFAP+: P < 0.001, F[3,20] = 28.09) with post-hoc Dunnett’s adjustment; n = 6 brains per
group. e, Approximate location of LPS injection. f, Multiplex inflammatory cytokine and chemokine profile analysis in the prefrontal neocortex following intracortical LPS injection. One-way ANOVA (IL-8: P = 0.016, F[2,6] = 8.793; IL-6: P = 0.013, F[2,6] = 9.709; IL-1β: P = 0.015, F[2,6] = 9.312) with post-hoc Dunnett’s adjustment. Kruskal–Wallis test (IL-1α: P = 0.036; KW = 6.563) with post-hoc two-stage step-up method of Benjamini, Krieger, and Yekutieli; n = 3 brains per group. Mean ± s.e.m. For reproducibility information, see Methods.
3 4 0 | N A t U r e | V O l 5 6 8 | 1 8 A P r i l 2 0 1 9
Article reSeArcH
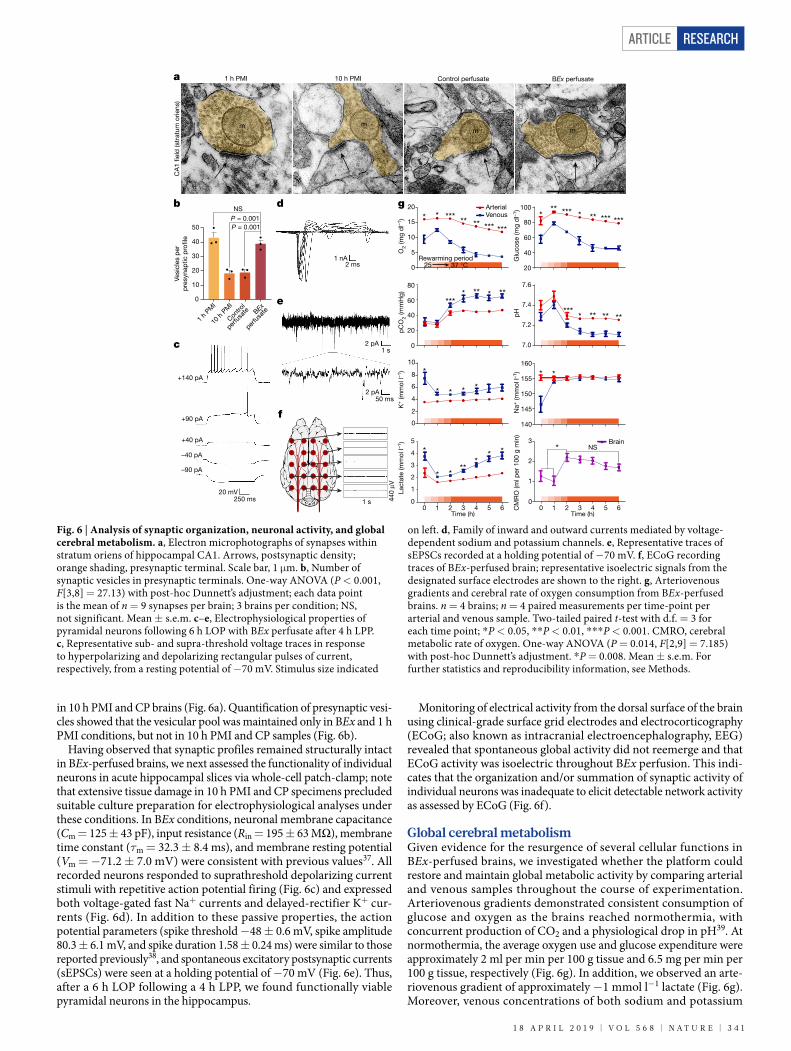
in 10 h PMI and CP brains (Fig. 6a). Quantification of presynaptic vesi-cles showed that the vesicular pool was maintained only in BEx and 1 h PMI conditions, but not in 10 h PMI and CP samples (Fig. 6b).
Having observed that synaptic profiles remained structurally intact in BEx-perfused brains, we next assessed the functionality of individual neurons in acute hippocampal slices via whole-cell patch-clamp; note that extensive tissue damage in 10 h PMI and CP specimens precluded suitable culture preparation for electrophysiological analyses under these conditions. In BEx conditions, neuronal membrane capacitance (Cm = 125 ± 43 pF), input resistance (Rin = 195 ± 63 MΩ), membrane time constant (τm = 32.3 ± 8.4 ms), and membrane resting potential (Vm = −71.2 ± 7.0 mV) were consistent with previous values37. All recorded neurons responded to suprathreshold depolarizing current stimuli with repetitive action potential firing (Fig. 6c) and expressed both voltage-gated fast Na+ currents and delayed-rectifier K+ cur-rents (Fig. 6d). In addition to these passive properties, the action potential parameters (spike threshold −48 ± 0.6 mV, spike amplitude 80.3 ± 6.1 mV, and spike duration 1.58 ± 0.24 ms) were similar to those reported previously38, and spontaneous excitatory postsynaptic currents (sEPSCs) were seen at a holding potential of −70 mV (Fig. 6e). Thus, after a 6 h LOP following a 4 h LPP, we found functionally viable pyramidal neurons in the hippocampus.
Monitoring of electrical activity from the dorsal surface of the brain using clinical-grade surface grid electrodes and electrocorticography (ECoG; also known as intracranial electroencephalography, EEG) revealed that spontaneous global activity did not reemerge and that ECoG activity was isoelectric throughout BEx perfusion. This indi-cates that the organization and/or summation of synaptic activity of individual neurons was inadequate to elicit detectable network activity as assessed by ECoG (Fig. 6f).
Global cerebral metabolismGiven evidence for the resurgence of several cellular functions in BEx-perfused brains, we investigated whether the platform could restore and maintain global metabolic activity by comparing arterial and venous samples throughout the course of experimentation. Arteriovenous gradients demonstrated consistent consumption of glucose and oxygen as the brains reached normothermia, with concurrent production of CO2 and a physiological drop in pH39. At normothermia, the average oxygen use and glucose expenditure were approximately 2 ml per min per 100 g tissue and 6.5 mg per min per 100 g tissue, respectively (Fig. 6g). In addition, we observed an arte-riovenous gradient of approximately −1 mmol l−1 lactate (Fig. 6g). Moreover, venous concentrations of both sodium and potassium
a
m
BEx perfusate
CA
1 e
ld (s
trat
um o
riens
)
20 mV250 ms
c
d
e
f
440 μV
1 s
bNS
Vesi
cles
per
pre
syna
ptic
pro
le
50
0
10
20
30
40
1 h
PMI
10 h
PM
I
Contro
l
perfu
sate BEx
perfu
sate
P = 0.001P = 0.001 ***************
ArterialVenous
O2
(mg
dl–1
)
5
10
15
20
0 37 °C25Rewarming period
* ***** ***
*** ***
Glu
cose
(mg
dl–1
)
20
40
100
60
80
*
*
* * *
0
2
4
6
8
10
K+ (m
mol
l–1)
*** * ** ** **
7.0
7.2
7.4
7.6
pH
**** ****
*
20
40
60
80
pC
O2
(mm
Hg)
0
* *
140
145
150
155
160
Na+
(mm
ol l–1
)
*
* **
* *
**
Lact
ate
(mm
ol l–1
)
0
3
4
5
0 1 2 3 4 5 6
2
1
Time (h)0 1 2 3 4 5 6
0
3
2
1
CM
RO
(ml p
er 1
00 g
min
)
Brain* NS
Time (h)
g
1 h PMI
m
10 h PMI
m
Control perfusate
m
1 nA2 ms
+140 pA
+90 pA
+40 pA
–40 pA
–90 pA
2 pA1 s
2 pA50 ms
Fig. 6 | Analysis of synaptic organization, neuronal activity, and global cerebral metabolism. a, Electron microphotographs of synapses within stratum oriens of hippocampal CA1. Arrows, postsynaptic density; orange shading, presynaptic terminal. Scale bar, 1 μm. b, Number of synaptic vesicles in presynaptic terminals. One-way ANOVA (P < 0.001, F[3,8] = 27.13) with post-hoc Dunnett’s adjustment; each data point is the mean of n = 9 synapses per brain; 3 brains per condition; NS, not significant. Mean ± s.e.m. c–e, Electrophysiological properties of pyramidal neurons following 6 h LOP with BEx perfusate after 4 h LPP. c, Representative sub- and supra-threshold voltage traces in response to hyperpolarizing and depolarizing rectangular pulses of current, respectively, from a resting potential of −70 mV. Stimulus size indicated
on left. d, Family of inward and outward currents mediated by voltage-dependent sodium and potassium channels. e, Representative traces of sEPSCs recorded at a holding potential of −70 mV. f, ECoG recording traces of BEx-perfused brain; representative isoelectric signals from the designated surface electrodes are shown to the right. g, Arteriovenous gradients and cerebral rate of oxygen consumption from BEx-perfused brains. n = 4 brains; n = 4 paired measurements per time-point per arterial and venous sample. Two-tailed paired t-test with d.f. = 3 for each time point; *P < 0.05, **P < 0.01, ***P < 0.001. CMRO, cerebral metabolic rate of oxygen. One-way ANOVA (P = 0.014, F[2,9] = 7.185) with post-hoc Dunnett’s adjustment. *P = 0.008. Mean ± s.e.m. For further statistics and reproducibility information, see Methods.
1 8 A P r i l 2 0 1 9 | V O l 5 6 8 | N A t U r e | 3 4 1
ArticlereSeArcH
normalized into the physiological range after 1 h of perfusion, poten-tially signalling the restoration of active Na+/K+ homeostasis (Fig. 6g). Overall, these data indicate a resurgence of global cerebral metabolism in intact, BEx-perfused post-mortem brains under ex vivo normother-mic conditions.
DiscussionUsing this technology, we have shown that microcirculation and specific molecular and cellular functions in the large mammalian brain can be restored under ex vivo normothermic conditions after an extended PMI (see Supplementary Discussion). These findings indicate that molecular and cellular deterioration in the brain after circulatory arrest seems to follow a protracted process, instead of occurring within a singular, narrowly defined temporal window. Perhaps most impor-tantly, with the appropriate intervention, the mammalian brain retains a greater capacity for metabolic and neurophysiological resilience to anoxic or ischaemic insult than is currently appreciated.
Our findings pertaining to metabolism, pH, and cerebral perfu-sion are consistent with the physiological parameters that have been reported to be important for recovery in non-human primates sub-jected to global ischaemia17. While our data reveal isoelectric global activity after 6 h of perfusion following a 4 h PMI, previous studies have shown a proportional delay between global ischaemia times and the reemergence of global electrical activity in vivo16,40–43. In the absence of longer perfusion studies, it is still unclear whether the technology we describe is capable of restoring global ECoG activity in the isolated brain. However, the inclusion of various antagonists in the BEx per-fusate might exert an overall inhibitory tone within the brain, further dampening global network activity. As previously discussed44, it is important to distinguish between resuscitation of neurophysiological activity and recovery of integrated brain functions (that is, neurological recovery). The observed restoration of molecular and cellular processes following 4 h of global anoxia or ischaemia should not be extrapolated to signify resurgence of normal brain function. Quite the opposite: at no point did we observe the kind of organized global electrical activity associated with awareness, perception, or other higher-order brain functions.
Our technology requires further development, optimization, and implementation, including studies with longer perfusion times. This experimental approach may have broader applications than those described herein, and could potentially help to bridge the gap between basic neuroscience and clinical research, especially as it pertains to the human brain. This possibility raises important ethical considerations that must be addressed by researchers, institutional boards, and fund-ing agencies, requiring the establishment of unambiguous standard operating procedures to preclude the possibility of re-activating and maintaining remnant awareness or brain functions that may result in inadvertent suffering45. Additionally, it is imperative for investigators to procure mammalian brains in an ethical manner consistent with all current and future regulations governing the humane termination of the animal sources (see Supplementary Discussion).
Overall, the ability to utilize this technology to investigate neuro-physiological recovery of the brain following global anoxia or ischaemia provides the basis for a new class of tools. We have found encouraging evidence that brings into question the time-course and cessation of molecular and cellular brain functions following prolonged circulatory arrest. Future studies and considerations will spur further development and implementation of this technology to study broad scientific ques-tions in the large, mammalian brain.
Online contentAny methods, additional references, Nature Research reporting summaries, source data, statements of data availability and associated accession codes are available at https://doi.org/10.1038/s41586-019-1099-1.
Received: 22 February 2018; Accepted: 1 March 2019; Published online 17 April 2019.
1. Kety, S. S. Circulation and metabolism of the human brain. Brain Res. Bull. 50, 415–416 (1999).
2. Dirnagl, U., Iadecola, C. & Moskowitz, M. A. Pathobiology of ischaemic stroke: an integrated view. Trends Neurosci. 22, 391–397 (1999).
3. Kisler, K., Nelson, A. R., Montagne, A. & Zlokovic, B. V. Cerebral blood flow regulation and neurovascular dysfunction in Alzheimer disease. Nat. Rev. Neurosci. 18, 419–434 (2017).
4. Wagner, S. R., IV & Lanier, W. L. Metabolism of glucose, glycogen, and high-energy phosphates during complete cerebral ischemia. A comparison of normoglycemic, chronically hyperglycemic diabetic, and acutely hyperglycemic nondiabetic rats. Anesthesiology 81, 1516–1526 (1994).
5. Hoxworth, J. M., Xu, K., Zhou, Y., Lust, W. D. & LaManna, J. C. Cerebral metabolic profile, selective neuron loss, and survival of acute and chronic hyperglycemic rats following cardiac arrest and resuscitation. Brain Res. 821, 467–479 (1999).
6. Borjigin, J. et al. Surge of neurophysiological coherence and connectivity in the dying brain. Proc. Natl Acad. Sci. USA 110, 14432–14437 (2013).
7. Cole, S. L. & Corday, E. Four-minute limit for cardiac resuscitation. J. Am. Med. Assoc. 161, 1454–1458 (1956).
8. Grenell, R. G. Central nervous system resistance: the effects of temporary arrest of cerebral circulation for periods of two to ten minutes. J. Neuropathol. Exp. Neurol. 5, 131–154 (1946).
9. Greer, D. M. Mechanisms of injury in hypoxic-ischemic encephalopathy: implications to therapy. Semin. Neurol. 26, 373–379 (2006).
10. Stys, P. K., Waxman, S. G. & Ransom, B. R. Na+-Ca2+ exchanger mediates Ca2+ influx during anoxia in mammalian central nervous system white matter. Ann. Neurol. 30, 375–380 (1991).
11. Viel J. J., McManus, D. Q., Cady, C., Evans, M.S. & Brewer, G. J. Temperature and time interval for culture of postmortem neurons from adult rat cortex. J. Neurosci. Res. 64, 311-211 (2001).
12. Verwer, R. W. et al. Cells in human post-mortem brain tissue slices remain alive for several weeks in culture. FASEB J. 16, 54–60 (2002).
13. Onorati, M. et al. Zika virus disrupts phospho-TBK1 localization and mitosis in human neuroepithelial stem cells and radial glia. Cell Rep. 16, 2576-2592 (2016).
14. Charpak, S. & Audinat, E. Cardiac arrest in rodents: maximal duration compatible with a recovery of neuronal activity. Proc. Natl. Acad. Sci. 95, 4748–4753 (1998).
15. Barksdale, K. A. et al. Mitochondrial viability in mouse and human post-mortem brain. FASEB J. 24, 3590–3599 (2010).
16. Hossmann, K. A. & Zimmermann, V. Resuscitation of the monkey brain after 1 h complete ischemia. I. Physiological and morphological observations. Brain Res. 81, 59–74 (1974).
17. Zimmermann, V. & Hossmann, K. A. Resuscitation of the monkey brain after one hour’s complete ischemia. II. Brain water and electrolytes. Brain Res. 85, 1–11 (1975).
18. Kleihues, P., Hossmann, K. A., Pegg, A. E., Kobayashi, K. & Zimmermann, V. Resuscitation of the monkey brain after one hour complete ischemia. III. Indications of metabolic recovery. Brain Res. 95, 61–73 (1975).
19. Hossmann, K. A. & Sato, K. Recovery of neuronal function after prolonged cerebral ischemia. Science 168, 375–376 (1970).
20. Hughes, A., Riou, P. & Day, C. Full neurological recovery from profound (18.0 °C) acute accidental hypothermia: successful resuscitation using active invasive rewarming techniques. Emerg. Med. J. 24, 511–512 (2007).
21. Albers, G. W. et al. Thrombectomy for stroke at 6 to 16 hours with selection by perfusion imaging. N. Engl. J. Med. 378, 708–718 (2018).
22. Haws, C. W., Gourley, J. K. & Heistad, D. D. Effects of nimodipine on cerebral blood flow. J. Pharmacol. Exp. Ther. 225, 24–28 (1983).
23. Schmidt, V. Comparative Anatomy of the Pig Brain: an Integrative Magnetic Resonance Imaging (MRI) Study of the Porcine Brain with Special Emphasis on the External Morphology of the Cerebral Cortex. Thesis, Justus-Liebig-Universität Gießen (2015).
24. Conrad, M. S., Dilger, R. N. & Johnson, R. W. Brain growth of the domestic pig (Sus scrofa) from 2 to 24 weeks of age: a longitudinal MRI study. Dev. Neurosci. 34, 291–298 (2012).
25. Watanabe, H. et al. MR-based statistical atlas of the Göttingen minipig brain. Neuroimage 14, 1089–1096 (2001).
26. Sarwar, M. & McCormick, W. F. Decrease in ventricular and sulcal size after death. Radiology 127, 409–411 (1978).
27. Offiah, C. E. & Dean, J. Post-mortem CT and MRI: appropriate post-mortem imaging appearances and changes related to cardiopulmonary resuscitation. Br. J. Radiol. 89, 20150851 (2016).
28. Schmidt-Kastner, R. & Freund, T. F. Selective vulnerability of the hippocampus in brain ischemia. Neuroscience 40, 599–636 (1991).
29. Crain, B. J., Westerkam, W. D., Harrison, A. H. & Nadler, J. V. Selective neuronal death after transient forebrain ischemia in the Mongolian gerbil: a silver impregnation study. Neuroscience 27, 387–402 (1988).
30. Horn, M. & Schlote, W. Delayed neuronal death and delayed neuronal recovery in the human brain following global ischemia. Acta Neuropathol. 85, 79–87 (1992).
31. Holm, I. E. & West, M. J. Hippocampus of the domestic pig: a stereological study of subdivisional volumes and neuron numbers. Hippocampus 4, 115–125 (1994).
32. Félix, B. et al. Stereotaxic atlas of the pig brain. Brain Res. Bull. 49, 1–137 (1999).
33. Olmos-Serrano, J. L. et al. Down syndrome developmental brain transcriptome reveals defective oligodendrocyte differentiation and myelination. Neuron 89, 1208–1222 (2016).
3 4 2 | N A t U r e | V O l 5 6 8 | 1 8 A P r i l 2 0 1 9
Article reSeArcH
34. Budde, M. D. & Frank, J. A. Neurite beading is sufficient to decrease the apparent diffusion coefficient after ischemic stroke. Proc. Natl Acad. Sci. USA 107, 14472–14477 (2010).
35. Shin, W. H. et al. Microglia expressing interleukin-13 undergo cell death and contribute to neuronal survival in vivo. Glia 46, 142–152 (2004).
36. Park, K. W., Lee, H. G., Jin, B. K. & Lee, Y. B. Interleukin-10 endogenously expressed in microglia prevents lipopolysaccharide-induced neurodegeneration in the rat cerebral cortex in vivo. Exp. Mol. Med. 39, 812–819 (2007).
37. Kowalski, J., Gan, J., Jonas, P. & Pernía-Andrade, A. J. Intrinsic membrane properties determine hippocampal differential firing pattern in vivo in anesthetized rats. Hippocampus 26, 668–682 (2016). https://doi.org/10.1002/hipo.22550.
38. Simkin, D. et al. Aging-related hyperexcitability in CA3 pyramidal neurons is mediated by enhanced A-type K+ channel function and expression. J. Neurosci. 35, 13206–13218 (2015).
39. Lam, T. I. et al. Intracellular pH reduction prevents excitotoxic and ischemic neuronal death by inhibiting NADPH oxidase. Proc. Natl Acad. Sci. USA 110, E4362–E4368 (2013).
40. Hinzen, D. H. et al. Metabolism and function of dog’s brain recovering from longtime ischemia. Am. J. Physiol. 223, 1158–1164 (1972).
41. Hirsch, H., Oberdorster, G., Zimmer, R., Benner, K. U. & Lang, R. The recovery of the electrocorticogram of normothermic canine brains after complete cerebral ischemia. Arch. Psychiatr. Nervenkr. 221, 171–179 (1975).
42. Hirsch, H., Euler, K. H. & Schneider, M. Recovery and resuscitation of the brain after ischemia in normothermia. Pflugers Arch. Gesamte Physiol. Menschen Tiere 265, 281–313 (1957).
43. Hossmann, K. A. & Sato, K. Effect of ischaemia on the function of the sensorimotor cortex in cat. Electroencephalogr. Clin. Neurophysiol. 30, 535–545 (1971).
44. Siesjö, B. K. Cell damage in the brain: a speculative synthesis. J. Cereb. Blood Flow Metab. 1, 155–185 (1981).
45. Farahany, N. A. et al. The ethics of experimenting with human brain tissue. Nature 556, 429–432 (2018).
Acknowledgements We thank HbO2 Therapeutics, specifically J. Baqai, G. Dube, and R. Buskar, for providing the Hemopure product and their input in optimizing oxygen delivery methods; C. Aardema, D. Faulkner and R. Robertson for technical assistance and discussions on the perfusion system; T. Constable and M. Qiu for help with MRI imaging; A. Liu and T. Wing for assisting in ECoG discussions and data acquisition; and various members of our laboratory community for their comments on the manuscript. We thank A. Duque for assistance in using the equipment from the Yale Macaque Brain Resource, supported by NIH MH113257. This work was supported by the NIH BRAIN Initiative MH117064, NIH shared instrument grant OD021845, which
funded purchase of the microSPECT/CT scanner, and NIH/NIGMS Medical Scientist Training Grant T32GM007205.
Reviewer information Nature thanks Insoo Hyun, Costantino Iadecola, Jonathan Moreno and the other anonymous reviewer(s) for their contribution to the peer review of this work.
Author contributions Z.V. and S.G.D contributed equally to this work. Z.V., S.G.D., J.S. and N.S. designed the BEx technology and the research described herein. Z.V. and S.G.D. developed the surgical procedure, performed the perfusion experiments, and collected and processed tissue samples for subsequent analyses. Z.V. and S.G.D. performed the MRI studies and analysed the data. Y.M.M. conducted the EM analysis. Z.V., S.G.D., J. S., N.S. and Y.M.M. analysed the EM data. F.T. and B.S.T. performed electrophysiology studies. F.T., B.S.T. and S.G.W. analysed the electrophysiology data. Z.V., S.G.D., Z.W.Z., Z.L. and A.J.S. performed the CTA studies and analysed the data. S.G.D., J.S., A.M.M.S., M.S., M.P. and N.K. conducted histological analyses. Z.V., S.G.D., J.S. and M.S. analysed and quantified the histological data. R.A. performed the ECoG studies and analysed the data. S.R.L. contributed to the bioethical aspects of the research. N.S. conceived and supervised the project. Z.V., S.G.D. and N.S. wrote the manuscript and prepared figures. All authors discussed and commented on the data.
Competing interests Z.V., S.G.D., J.S. and N.S. have disclosed these findings to the Yale Office of Cooperative Research, which has filed a patent to ensure broad use of the technology. All protocols, methods, perfusate formulations, and components of the BrainEx technology remain freely available for academic and non-profit research. While the Hemopure product was provided in accordance to a material transfer agreement between HbO2 Therapeutics and Yale University via N.S., the Company had no influence on the study design or interpretation of the results. No author has a financial stake in, or receives compensation from, HbO2 Therapeutics. All other authors declare no competing interests.
Additional informationExtended data is available for this paper at https://doi.org/10.1038/s41586-019-1099-1.Supplementary information is available for this paper at https://doi.org/ 10.1038/s41586-019-1099-1.Reprints and permissions information is available at http://www.nature.com/reprints.Correspondence and requests for materials should be addressed to N.S.Publisher’s note: Springer Nature remains neutral with regard to jurisdictional claims in published maps and institutional affiliations.
© The Author(s), under exclusive licence to Springer Nature Limited 2019
1 8 A P r i l 2 0 1 9 | V O l 5 6 8 | N A t U r e | 3 4 3
ArticlereSeArcH
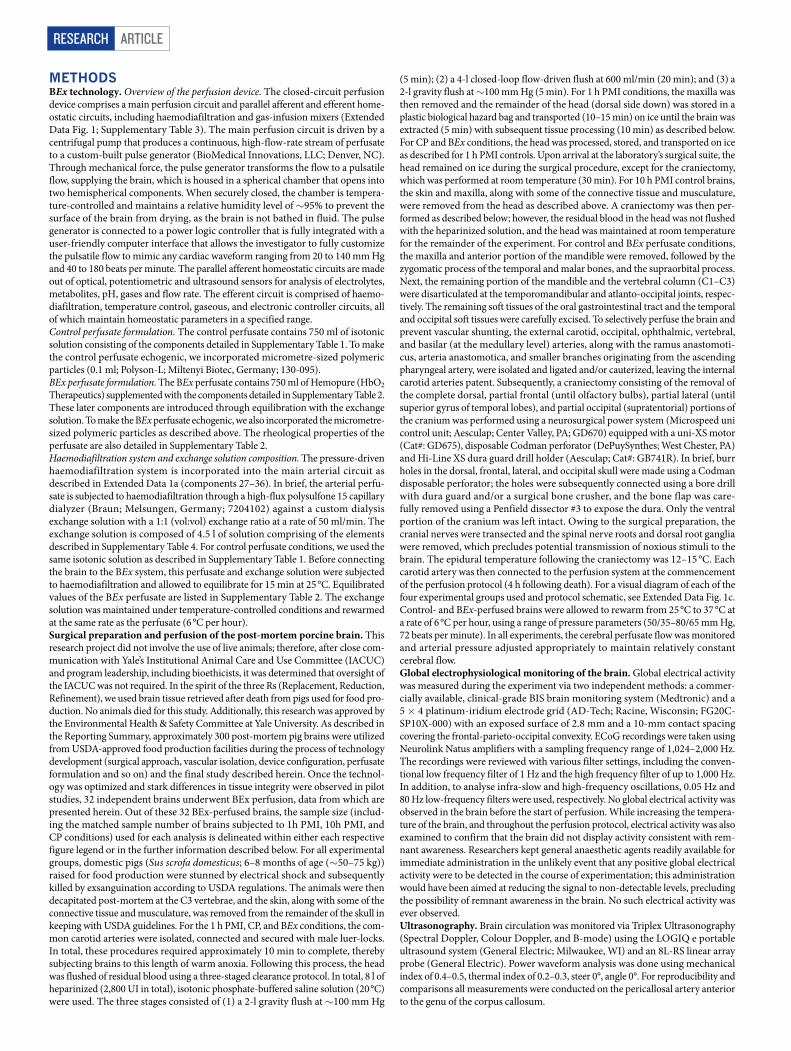
MEthodSBEx technology. Overview of the perfusion device. The closed-circuit perfusion device comprises a main perfusion circuit and parallel afferent and efferent home-ostatic circuits, including haemodiafiltration and gas-infusion mixers (Extended Data Fig. 1; Supplementary Table 3). The main perfusion circuit is driven by a centrifugal pump that produces a continuous, high-flow-rate stream of perfusate to a custom-built pulse generator (BioMedical Innovations, LLC; Denver, NC). Through mechanical force, the pulse generator transforms the flow to a pulsatile flow, supplying the brain, which is housed in a spherical chamber that opens into two hemispherical components. When securely closed, the chamber is tempera-ture-controlled and maintains a relative humidity level of ~95% to prevent the surface of the brain from drying, as the brain is not bathed in fluid. The pulse generator is connected to a power logic controller that is fully integrated with a user-friendly computer interface that allows the investigator to fully customize the pulsatile flow to mimic any cardiac waveform ranging from 20 to 140 mm Hg and 40 to 180 beats per minute. The parallel afferent homeostatic circuits are made out of optical, potentiometric and ultrasound sensors for analysis of electrolytes, metabolites, pH, gases and flow rate. The efferent circuit is comprised of haemo-diafiltration, temperature control, gaseous, and electronic controller circuits, all of which maintain homeostatic parameters in a specified range.Control perfusate formulation. The control perfusate contains 750 ml of isotonic solution consisting of the components detailed in Supplementary Table 1. To make the control perfusate echogenic, we incorporated micrometre-sized polymeric particles (0.1 ml; Polyson-L; Miltenyi Biotec, Germany; 130-095). BEx perfusate formulation. The BEx perfusate contains 750 ml of Hemopure (HbO2 Therapeutics) supplemented with the components detailed in Supplementary Table 2. These later components are introduced through equilibration with the exchange solution. To make the BEx perfusate echogenic, we also incorporated the micrometre- sized polymeric particles as described above. The rheological properties of the perfusate are also detailed in Supplementary Table 2.Haemodiafiltration system and exchange solution composition. The pressure-driven haemodiafiltration system is incorporated into the main arterial circuit as described in Extended Data 1a (components 27–36). In brief, the arterial perfu-sate is subjected to haemodiafiltration through a high-flux polysulfone 15 capillary dialyzer (Braun; Melsungen, Germany; 7204102) against a custom dialysis exchange solution with a 1:1 (vol:vol) exchange ratio at a rate of 50 ml/min. The exchange solution is composed of 4.5 l of solution comprising of the elements described in Supplementary Table 4. For control perfusate conditions, we used the same isotonic solution as described in Supplementary Table 1. Before connecting the brain to the BEx system, this perfusate and exchange solution were subjected to haemodiafiltration and allowed to equilibrate for 15 min at 25 °C. Equilibrated values of the BEx perfusate are listed in Supplementary Table 2. The exchange solution was maintained under temperature-controlled conditions and rewarmed at the same rate as the perfusate (6 °C per hour).Surgical preparation and perfusion of the post-mortem porcine brain. This research project did not involve the use of live animals; therefore, after close com-munication with Yale’s Institutional Animal Care and Use Committee (IACUC) and program leadership, including bioethicists, it was determined that oversight of the IACUC was not required. In the spirit of the three Rs (Replacement, Reduction, Refinement), we used brain tissue retrieved after death from pigs used for food pro-duction. No animals died for this study. Additionally, this research was approved by the Environmental Health & Safety Committee at Yale University. As described in the Reporting Summary, approximately 300 post-mortem pig brains were utilized from USDA-approved food production facilities during the process of technology development (surgical approach, vascular isolation, device configuration, perfusate formulation and so on) and the final study described herein. Once the technol-ogy was optimized and stark differences in tissue integrity were observed in pilot studies, 32 independent brains underwent BEx perfusion, data from which are presented herein. Out of these 32 BEx-perfused brains, the sample size (includ-ing the matched sample number of brains subjected to 1h PMI, 10h PMI, and CP conditions) used for each analysis is delineated within either each respective figure legend or in the further information described below. For all experimental groups, domestic pigs (Sus scrofa domesticus; 6–8 months of age (~50–75 kg)) raised for food production were stunned by electrical shock and subsequently killed by exsanguination according to USDA regulations. The animals were then decapitated post-mortem at the C3 vertebrae, and the skin, along with some of the connective tissue and musculature, was removed from the remainder of the skull in keeping with USDA guidelines. For the 1 h PMI, CP, and BEx conditions, the com-mon carotid arteries were isolated, connected and secured with male luer-locks. In total, these procedures required approximately 10 min to complete, thereby subjecting brains to this length of warm anoxia. Following this process, the head was flushed of residual blood using a three-staged clearance protocol. In total, 8 l of heparinized (2,800 UI in total), isotonic phosphate-buffered saline solution (20 °C) were used. The three stages consisted of (1) a 2-l gravity flush at ~100 mm Hg
(5 min); (2) a 4-l closed-loop flow-driven flush at 600 ml/min (20 min); and (3) a 2-l gravity flush at ~100 mm Hg (5 min). For 1 h PMI conditions, the maxilla was then removed and the remainder of the head (dorsal side down) was stored in a plastic biological hazard bag and transported (10–15 min) on ice until the brain was extracted (5 min) with subsequent tissue processing (10 min) as described below. For CP and BEx conditions, the head was processed, stored, and transported on ice as described for 1 h PMI controls. Upon arrival at the laboratory’s surgical suite, the head remained on ice during the surgical procedure, except for the craniectomy, which was performed at room temperature (30 min). For 10 h PMI control brains, the skin and maxilla, along with some of the connective tissue and musculature, were removed from the head as described above. A craniectomy was then per-formed as described below; however, the residual blood in the head was not flushed with the heparinized solution, and the head was maintained at room temperature for the remainder of the experiment. For control and BEx perfusate conditions, the maxilla and anterior portion of the mandible were removed, followed by the zygomatic process of the temporal and malar bones, and the supraorbital process. Next, the remaining portion of the mandible and the vertebral column (C1–C3) were disarticulated at the temporomandibular and atlanto-occipital joints, respec-tively. The remaining soft tissues of the oral gastrointestinal tract and the temporal and occipital soft tissues were carefully excised. To selectively perfuse the brain and prevent vascular shunting, the external carotid, occipital, ophthalmic, vertebral, and basilar (at the medullary level) arteries, along with the ramus anastomoti-cus, arteria anastomotica, and smaller branches originating from the ascending pharyngeal artery, were isolated and ligated and/or cauterized, leaving the internal carotid arteries patent. Subsequently, a craniectomy consisting of the removal of the complete dorsal, partial frontal (until olfactory bulbs), partial lateral (until superior gyrus of temporal lobes), and partial occipital (supratentorial) portions of the cranium was performed using a neurosurgical power system (Microspeed uni control unit; Aesculap; Center Valley, PA; GD670) equipped with a uni-XS motor (Cat#: GD675), disposable Codman perforator (DePuySynthes; West Chester, PA) and Hi-Line XS dura guard drill holder (Aesculap; Cat#: GB741R). In brief, burr holes in the dorsal, frontal, lateral, and occipital skull were made using a Codman disposable perforator; the holes were subsequently connected using a bore drill with dura guard and/or a surgical bone crusher, and the bone flap was care-fully removed using a Penfield dissector #3 to expose the dura. Only the ventral portion of the cranium was left intact. Owing to the surgical preparation, the cranial nerves were transected and the spinal nerve roots and dorsal root ganglia were removed, which precludes potential transmission of noxious stimuli to the brain. The epidural temperature following the craniectomy was 12–15 °C. Each carotid artery was then connected to the perfusion system at the commencement of the perfusion protocol (4 h following death). For a visual diagram of each of the four experimental groups used and protocol schematic, see Extended Data Fig. 1c. Control- and BEx-perfused brains were allowed to rewarm from 25 °C to 37 °C at a rate of 6 °C per hour, using a range of pressure parameters (50/35–80/65 mm Hg, 72 beats per minute). In all experiments, the cerebral perfusate flow was monitored and arterial pressure adjusted appropriately to maintain relatively constant cerebral flow.Global electrophysiological monitoring of the brain. Global electrical activity was measured during the experiment via two independent methods: a commer-cially available, clinical-grade BIS brain monitoring system (Medtronic) and a 5 × 4 platinum-iridium electrode grid (AD-Tech; Racine, Wisconsin; FG20C-SP10X-000) with an exposed surface of 2.8 mm and a 10-mm contact spacing covering the frontal-parieto-occipital convexity. ECoG recordings were taken using Neurolink Natus amplifiers with a sampling frequency range of 1,024–2,000 Hz. The recordings were reviewed with various filter settings, including the conven-tional low frequency filter of 1 Hz and the high frequency filter of up to 1,000 Hz. In addition, to analyse infra-slow and high-frequency oscillations, 0.05 Hz and 80 Hz low-frequency filters were used, respectively. No global electrical activity was observed in the brain before the start of perfusion. While increasing the tempera-ture of the brain, and throughout the perfusion protocol, electrical activity was also examined to confirm that the brain did not display activity consistent with rem-nant awareness. Researchers kept general anaesthetic agents readily available for immediate administration in the unlikely event that any positive global electrical activity were to be detected in the course of experimentation; this administration would have been aimed at reducing the signal to non-detectable levels, precluding the possibility of remnant awareness in the brain. No such electrical activity was ever observed.Ultrasonography. Brain circulation was monitored via Triplex Ultrasonography (Spectral Doppler, Colour Doppler, and B-mode) using the LOGIQ e portable ultrasound system (General Electric; Milwaukee, WI) and an 8L-RS linear array probe (General Electric). Power waveform analysis was done using mechanical index of 0.4–0.5, thermal index of 0.2–0.3, steer 0°, angle 0°. For reproducibility and comparisons all measurements were conducted on the pericallosal artery anterior to the genu of the corpus callosum.
Article reSeArcH
Micro-CT cerebral angiogram. Approximately 100 ml of 10% bismuth nanopar-ticles (Sigma-Aldrich) in 10% gelatin was made as previously described46 and was injected into the brain following BEx perfusion. This contrast agent was delivered bilaterally via the common carotid arteries by pressurized injection. Next, the brain was immediately immersed in iced water for at least 30 min, and then post-fixed in 10% formalin for 72 h. The residual ventral bone was removed and the whole brain was scanned using a U-SPECT-II/CT scanner (Milabs; Utrecht, The Netherlands). Volumetric micro-CT data were acquired using an X-ray source of 55 kVp tube voltage, 370 μA tube current, 11 × 11 detector binning model, and 40 ms exposure per projection for contrast-enhanced CT acquisitions. A single frame of 720 projections for 5:03 min of continuous X-ray exposure was used. Volumetric micro-CT images were post-processed using PMOD software, version 3.8 (PMOD Technologies; Zurich, Switzerland).
Afterwards, the hippocampus was extracted, and a high-resolution micro-CT scan was performed using a specimen microCT scanner (Trifoil Imaging; Chatsworth, CA). Images were acquired with 2,960 ms exposure time per view, at 60 kV, 100 mA, 360°, 1,200 views, and 1 × 1 binning. The raw micro-CT images with a vff format were initially reconstructed using Microview software, with calibrated attenuation values for air, water, and bone. The reconstructed images were saved in DICOM format and further post-processed using RadiAnt DICOM Viewer software (Medixant; Poznan, Poland) to extract maximum intensity projection images.Magnetic resonance imaging. High-resolution anatomical scans were performed on 10 h PMI brains and on brains perfused with control or BEx perfusate imme-diately after the end of perfusion. Scans were acquired using a Siemens Prisma Fit 3T scanner and 64-channel head/neck coil with MP-RAGE, a three-dimensional, T1-weighted, gradient-echo sequence: FOV = 257 × 257, resolution 0.8 × 0.8 × 0.8 mm, TR = 2,400 ms, TE = 1.35 ms, IT = 1,000, flip angle = 8, averages = 2, number of slices = 112.Measurement of tissue water content. Brain water content was measured as pre-viously described47. In brief, a stereotyped piece of cerebrum was microdissected from the same region of the brain following the termination of each experimental protocol. The mass of the wet tissue was immediately measured and recorded, and the tissue was placed in a non-humidified incubator (37 °C) for 24 h. The dry mass was then measured and recorded. Per cent water content was determined by the following equation: 100 × (wet mass – dry mass)/wet mass.Tissue processing and histology. Tissue preparation. Following the termination of each experimental protocol, the whole brain was extracted from the remaining portion of the ventral cranium and processed as described below.Tissue processing and cresyl violet (Nissl) staining. After extraction, whole brain samples were sectioned into ~0.5-cm-thick slabs and immersion-fixed in a solu-tion containing 4% (w/v) paraformaldehyde for approximately 1 h, after which fixative was removed and fresh fixative was added. Tissue was allowed to fix for 72 h at 4 °C with gentle shaking. Tissue was then washed in 0.1 M PBS (1×) and dropped stepwise into 15% sucrose followed by 30% sucrose supplemented with 0.05% sodium azide. Regions of interest were microdissected from the tissue slabs and sectioned into 40-μm sections under PBS using a vibratome (Leica Biosystems; Buffalo Grove, IL; VT1000S). Sections were mounted on TruBond 380 adhesive slides and allowed to dry overnight at room temperature. Tissue was rehydrated in ddH2O; serially dehydrated through 70%, 95%, and 100% ethyl alcohol; and cleared in histoclear II (National Diagnostics; HS-202) for 3 min in each step. Sections were then rehydrated through ddH2O for 3 min in each solution and stained in 0.1% cresyl violet solution for 5 min. Sections were quickly rinsed in ddH2O and then differentiated in 70%, 95%, and 100% ethyl alcohol and cleared in histoclear II. Sections were coverslipped with EcoMount (Biocar Medical; EM897L). Slides were scanned using the Aperio CS2 Pathology Slide Scanner (Leica) at a mag-nification of 40×. Images were viewed and processed using Aperio Imagescope Software (Leica).Immunohistochemistry. Coronal tissue sections from the appropriate regions of the pig brain were processed as described above. For all staining procedures except for intravascular haemoglobin fluorescence detection, tissue sections from each experimental group were co-stained on the same slide. After mounting, tis-sue sections (except for those used for MBP staining) were subjected to antigen retrieval for 2 h using the Retreiver System (Electron Microscopy Sciences (EMS); Hatfield, PA; 62700-10) and R-Buffer A (EMS; 62706-10; 1×) or R-Buffer AG (EMS; 62707-10; 1×). For DAB staining, sections were incubated in 1% hydrogen peroxide/PBS to quench endogenous peroxidase activity. Afterwards, tissue was blocked and permeabilized in PBS containing 5% (v/v) donkey serum, 3% (w/v) bovine albumin serum, 0.1% (w/v) glycine, and 0.1% (w/v) lysine with 0.2% (v/v) Triton X-100 for 1 h at room temperature with gentle rotation. Tissues were then incubated overnight at 4 °C with gentle rotation with primary antibodies directed against the following antigens: IBA1 (rabbit anti-iba1; 1:1,000; Wako; 019-19741), GFAP (mouse anti-GFAP; 1:500; Sigma; G3893); NeuN (rabbit anti-NeuN; 1:2,000; Abcam; ab177487); cleaved caspase-3 (rabbit anti-actCASP3; 1:200; CST; 9661S);
MBP (rat anti-MBP; 1:200; BioRad; MCA409S); neurogranin (NRGN) (sheep anti-NRGN; 1:50; R&D systems; AF7947); and GAD1 (goat anti-GAD1; 1:50; R&D systems; AF2086). Unbound primary antibodies were removed by washing with PBS containing 0.3% (v/v) Triton X-100 (3 × 10 min); the washing jar was rinsed clean with ddH2O in between washes. Antibody–antigen complexes were visualized after incubation with Alexa Fluor 594 or 488-conjugated donkey or biotinylated secondary antibody anti-rabbit, mouse, sheep, rat, or goat immuno-globulin G secondary antibody (1:500) in blocking solution. Unbound secondary antibodies were removed by washing with PBS containing 0.3% (v/v) Triton X-100 (3 × 5 min); the washing jar was rinsed clean with ddH2O in between washes. Except for in the cleaved caspase-3 time-course analysis, background signal was quenched using the autofluorescence eliminator reagent (2160; Millipore) per the manufacturer’s instructions. Tissue sections were then simultaneously coverslipped and counterstained with Fluoromount-G containing DAPI (Southern Biotech; Birmingham, AL; 0100-01) for immunofluorescence imaging. Alternatively, for DAB staining, sections were incubated with avidin-biotin-peroxidase complex (Vectastain ABC Elite kit; Vector Laboratories) for 1 h at room temperature. Finally, sections were washed in PBS (3 × 15 min) and signals were developed using a DAB peroxidase substrate kit according to the manufacturer’s protocol (Vector Laboratories). Coverslips were mounted with VectaShield (Vector Laboratories; Burlingame, CA;) or Permount (Fischer Scientific) and sealed with nail polish, unless counterstained with Fluoromount-G.Intravascular fluorescence. Sections from regions of interest from each experimental group underwent antigen retrieval as described above, and were blocked and permeabilized in PBS containing 5% (v/v) donkey serum, 3% (w/v) bovine albumin serum, 0.1% (w/v) glycine, and 0.1% (w/v) lysine with 0.3% (v/v) Triton X-100 for 1 h at room temperature with gentle rotation. Subsequently, sections were incu-bated with Alexa Fluor 488–conjugated donkey anti-rabbit antibody (1:500) for 1 h at room temperature with gentle rotation. Unbound secondary antibodies were removed by washing with PBS containing 0.3% (v/v) Triton X-100 (3 × 5 min). Tissue sections were simultaneously coverslipped and counterstained with Fluoromount-G containing DAPI (Southern Biotech; Birmingham, AL; Cat #: 0100-01) for immunofluorescence imaging.Microscopy and image processing. Tissue sections were imaged using an LSM880 confocal microscope (Zeiss; Jena, Germany) equipped with a motorized stage using 10× (0.3 NA) or 20× (0.8 NA) objective lenses with identical settings across all experimental conditions. Lasers used: argon 458, 488, and 514; diode 405; and DPSS 561-10. The DPSS 561-10 laser intensity was increased during imaging of the control perfusate samples for the intravascular haemoglobin fluorescence study in order to obtain a background signal comparable to other groups. Images were acquired at either 1,024 × 1,024 or 2,048 × 2,048 pixel resolution. Images are either representative confocal tile scans, high-magnification maximum intensity Z-stack projections (approximately 7–9-μm stacks; ~1 μm per Z-step), or high- magnification confocal images. Alternatively, histological images were acquired using an Aperio CS2 Pathology Slide Scanner (Leica; Wetzlar, Germany) as described above. Image adjustments were uniformly applied to all experimental conditions in Zeiss Zen. Digitized images were assembled in Zeiss Zen, ImageScope, and Adobe Illustrator.Histological data analysis and quantification. Immunofluorescence (cell analysis and quantification). Confocal tile scans (using the 10× or 20× objectives described above) of tissue sections stained for GFAP, IBA1, NRGN, and GAD1 were normal-ized to identical image surface area, randomized, and subsequently analysed by a blinded observer for the objects of interest. For all cell marker stains, cells were excluded if below a minimum intensity level, exhibiting cellular vacuoles greater than the size of the nucleus, or demonstrating clear cellular destruction.Nuclear localization of actCASP3. Multiple confocal images (10×) were taken per region of interest and processed as described above. A blinded observer manually counted DAPI+ objects and actCASP3+ objects using the cell counter function in ImageJ software (NIH). DAPI+ and actCASP3+ objects were initially normalized to image surface area, and subsequently actCASP3+ objects were normalized to number of DAPI+ objects per image surface area.Cresyl violet staining (cell counts and morphology). A blinded observer processed the images as described above and manually counted objects of interest and morphology using the cell counter function in ImageJ software (NIH). Cells were again excluded if below a minimum intensity level, exhibiting cellular vacuoles greater than the size of the nucleus, or demonstrating clear cellular destruction.Measurement of myelinated fibres. Measurements of myelinated fibre orientation were made from (4×) brightfield images of MBP staining using the measure angle function in ImageJ. Representative images were accumulated from each biological replicate from all experimental groups and randomized. Measurements were made by a blinded observer from the white matter boundary to layer 1, which could be clearly delineated by the presence of dense horizontal fibres. The counting region analysed was selected because fibres can be clearly identified, and are organized
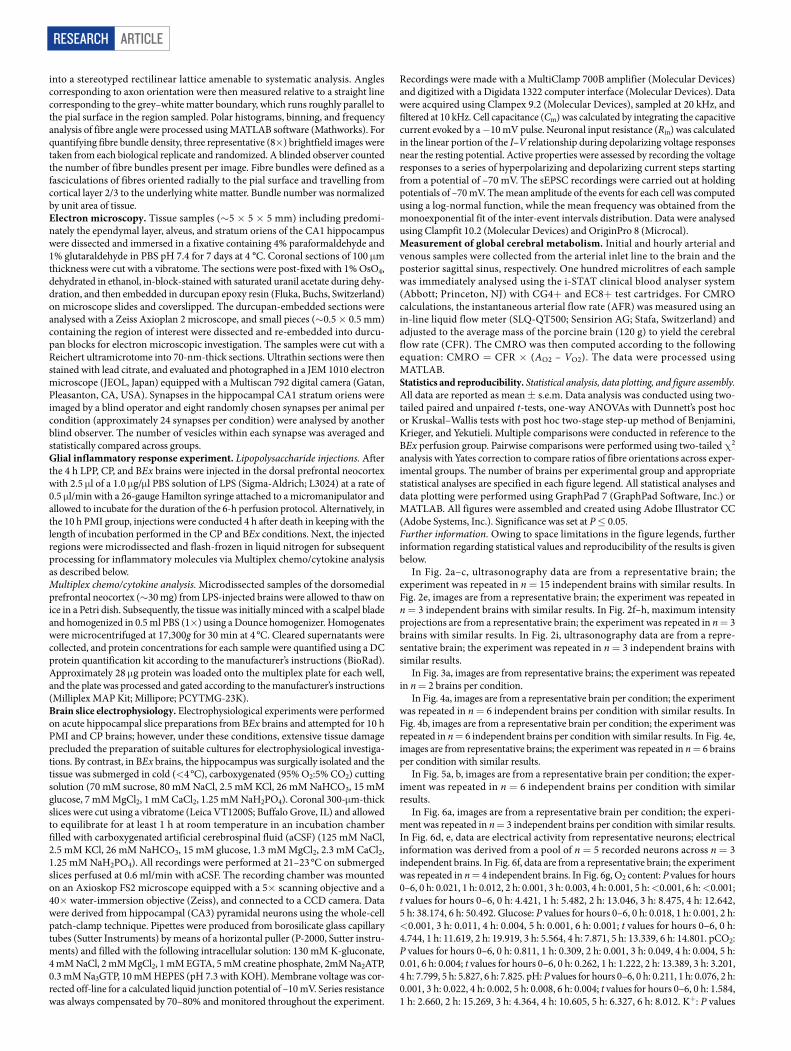
ArticlereSeArcH
into a stereotyped rectilinear lattice amenable to systematic analysis. Angles corresponding to axon orientation were then measured relative to a straight line corresponding to the grey–white matter boundary, which runs roughly parallel to the pial surface in the region sampled. Polar histograms, binning, and frequency analysis of fibre angle were processed using MATLAB software (Mathworks). For quantifying fibre bundle density, three representative (8×) brightfield images were taken from each biological replicate and randomized. A blinded observer counted the number of fibre bundles present per image. Fibre bundles were defined as a fasciculations of fibres oriented radially to the pial surface and travelling from cortical layer 2/3 to the underlying white matter. Bundle number was normalized by unit area of tissue.Electron microscopy. Tissue samples (~5 × 5 × 5 mm) including predomi-nately the ependymal layer, alveus, and stratum oriens of the CA1 hippocampus were dissected and immersed in a fixative containing 4% paraformaldehyde and 1% glutaraldehyde in PBS pH 7.4 for 7 days at 4 °C. Coronal sections of 100 μm thickness were cut with a vibratome. The sections were post-fixed with 1% OsO4, dehydrated in ethanol, in-block-stained with saturated uranil acetate during dehy-dration, and then embedded in durcupan epoxy resin (Fluka, Buchs, Switzerland) on microscope slides and coverslipped. The durcupan-embedded sections were analysed with a Zeiss Axioplan 2 microscope, and small pieces (~0.5 × 0.5 mm) containing the region of interest were dissected and re-embedded into durcu-pan blocks for electron microscopic investigation. The samples were cut with a Reichert ultramicrotome into 70-nm-thick sections. Ultrathin sections were then stained with lead citrate, and evaluated and photographed in a JEM 1010 electron microscope (JEOL, Japan) equipped with a Multiscan 792 digital camera (Gatan, Pleasanton, CA, USA). Synapses in the hippocampal CA1 stratum oriens were imaged by a blind operator and eight randomly chosen synapses per animal per condition (approximately 24 synapses per condition) were analysed by another blind observer. The number of vesicles within each synapse was averaged and statistically compared across groups.Glial inflammatory response experiment. Lipopolysaccharide injections. After the 4 h LPP, CP, and BEx brains were injected in the dorsal prefrontal neocortex with 2.5 μl of a 1.0 μg/μl PBS solution of LPS (Sigma-Aldrich; L3024) at a rate of 0.5 μl/min with a 26-gauge Hamilton syringe attached to a micromanipulator and allowed to incubate for the duration of the 6-h perfusion protocol. Alternatively, in the 10 h PMI group, injections were conducted 4 h after death in keeping with the length of incubation performed in the CP and BEx conditions. Next, the injected regions were microdissected and flash-frozen in liquid nitrogen for subsequent processing for inflammatory molecules via Multiplex chemo/cytokine analysis as described below.Multiplex chemo/cytokine analysis. Microdissected samples of the dorsomedial prefrontal neocortex (~30 mg) from LPS-injected brains were allowed to thaw on ice in a Petri dish. Subsequently, the tissue was initially minced with a scalpel blade and homogenized in 0.5 ml PBS (1×) using a Dounce homogenizer. Homogenates were microcentrifuged at 17,300g for 30 min at 4 °C. Cleared supernatants were collected, and protein concentrations for each sample were quantified using a DC protein quantification kit according to the manufacturer’s instructions (BioRad). Approximately 28 μg protein was loaded onto the multiplex plate for each well, and the plate was processed and gated according to the manufacturer’s instructions (Milliplex MAP Kit; Millipore; PCYTMG-23K).Brain slice electrophysiology. Electrophysiological experiments were performed on acute hippocampal slice preparations from BEx brains and attempted for 10 h PMI and CP brains; however, under these conditions, extensive tissue damage precluded the preparation of suitable cultures for electrophysiological investiga-tions. By contrast, in BEx brains, the hippocampus was surgically isolated and the tissue was submerged in cold (<4 °C), carboxygenated (95% O2:5% CO2) cutting solution (70 mM sucrose, 80 mM NaCl, 2.5 mM KCl, 26 mM NaHCO3, 15 mM glucose, 7 mM MgCl2, 1 mM CaCl2, 1.25 mM NaH2PO4). Coronal 300-μm-thick slices were cut using a vibratome (Leica VT1200S; Buffalo Grove, IL) and allowed to equilibrate for at least 1 h at room temperature in an incubation chamber filled with carboxygenated artificial cerebrospinal fluid (aCSF) (125 mM NaCl, 2.5 mM KCl, 26 mM NaHCO3, 15 mM glucose, 1.3 mM MgCl2, 2.3 mM CaCl2, 1.25 mM NaH2PO4). All recordings were performed at 21–23 °C on submerged slices perfused at 0.6 ml/min with aCSF. The recording chamber was mounted on an Axioskop FS2 microscope equipped with a 5× scanning objective and a 40× water-immersion objective (Zeiss), and connected to a CCD camera. Data were derived from hippocampal (CA3) pyramidal neurons using the whole-cell patch-clamp technique. Pipettes were produced from borosilicate glass capillary tubes (Sutter Instruments) by means of a horizontal puller (P-2000, Sutter instru-ments) and filled with the following intracellular solution: 130 mM K-gluconate, 4 mM NaCl, 2 mM MgCl2, 1 mM EGTA, 5 mM creatine phosphate, 2mM Na2ATP, 0.3 mM Na3GTP, 10 mM HEPES (pH 7.3 with KOH). Membrane voltage was cor-rected off-line for a calculated liquid junction potential of –10 mV. Series resistance was always compensated by 70–80% and monitored throughout the experiment.
Recordings were made with a MultiClamp 700B amplifier (Molecular Devices) and digitized with a Digidata 1322 computer interface (Molecular Devices). Data were acquired using Clampex 9.2 (Molecular Devices), sampled at 20 kHz, and filtered at 10 kHz. Cell capacitance (Cm) was calculated by integrating the capacitive current evoked by a −10 mV pulse. Neuronal input resistance (Rin) was calculated in the linear portion of the I–V relationship during depolarizing voltage responses near the resting potential. Active properties were assessed by recording the voltage responses to a series of hyperpolarizing and depolarizing current steps starting from a potential of –70 mV. The sEPSC recordings were carried out at holding potentials of –70 mV. The mean amplitude of the events for each cell was computed using a log-normal function, while the mean frequency was obtained from the monoexponential fit of the inter-event intervals distribution. Data were analysed using Clampfit 10.2 (Molecular Devices) and OriginPro 8 (Microcal).Measurement of global cerebral metabolism. Initial and hourly arterial and venous samples were collected from the arterial inlet line to the brain and the posterior sagittal sinus, respectively. One hundred microlitres of each sample was immediately analysed using the i-STAT clinical blood analyser system (Abbott; Princeton, NJ) with CG4+ and EC8+ test cartridges. For CMRO calculations, the instantaneous arterial flow rate (AFR) was measured using an in-line liquid flow meter (SLQ-QT500; Sensirion AG; Stafa, Switzerland) and adjusted to the average mass of the porcine brain (120 g) to yield the cerebral flow rate (CFR). The CMRO was then computed according to the following equation: CMRO = CFR × (AO2 – VO2). The data were processed using MATLAB.Statistics and reproducibility. Statistical analysis, data plotting, and figure assembly. All data are reported as mean ± s.e.m. Data analysis was conducted using two-tailed paired and unpaired t-tests, one-way ANOVAs with Dunnett’s post hoc or Kruskal–Wallis tests with post hoc two-stage step-up method of Benjamini, Krieger, and Yekutieli. Multiple comparisons were conducted in reference to the BEx perfusion group. Pairwise comparisons were performed using two-tailed χ2 analysis with Yates correction to compare ratios of fibre orientations across exper-imental groups. The number of brains per experimental group and appropriate statistical analyses are specified in each figure legend. All statistical analyses and data plotting were performed using GraphPad 7 (GraphPad Software, Inc.) or MATLAB. All figures were assembled and created using Adobe Illustrator CC (Adobe Systems, Inc.). Significance was set at P ≤ 0.05.Further information. Owing to space limitations in the figure legends, further information regarding statistical values and reproducibility of the results is given below.
In Fig. 2a–c, ultrasonography data are from a representative brain; the experiment was repeated in n = 15 independent brains with similar results. In Fig. 2e, images are from a representative brain; the experiment was repeated in n = 3 independent brains with similar results. In Fig. 2f–h, maximum intensity projections are from a representative brain; the experiment was repeated in n = 3 brains with similar results. In Fig. 2i, ultrasonography data are from a repre-sentative brain; the experiment was repeated in n = 3 independent brains with similar results.
In Fig. 3a, images are from representative brains; the experiment was repeated in n = 2 brains per condition.
In Fig. 4a, images are from a representative brain per condition; the experiment was repeated in n = 6 independent brains per condition with similar results. In Fig. 4b, images are from a representative brain per condition; the experiment was repeated in n = 6 independent brains per condition with similar results. In Fig. 4e, images are from representative brains; the experiment was repeated in n = 6 brains per condition with similar results.
In Fig. 5a, b, images are from a representative brain per condition; the exper-iment was repeated in n = 6 independent brains per condition with similar results.
In Fig. 6a, images are from a representative brain per condition; the experi-ment was repeated in n = 3 independent brains per condition with similar results. In Fig. 6d, e, data are electrical activity from representative neurons; electrical information was derived from a pool of n = 5 recorded neurons across n = 3 independent brains. In Fig. 6f, data are from a representative brain; the experiment was repeated in n = 4 independent brains. In Fig. 6g, O2 content: P values for hours 0–6, 0 h: 0.021, 1 h: 0.012, 2 h: 0.001, 3 h: 0.003, 4 h: 0.001, 5 h: <0.001, 6 h: <0.001; t values for hours 0–6, 0 h: 4.421, 1 h: 5.482, 2 h: 13.046, 3 h: 8.475, 4 h: 12.642, 5 h: 38.174, 6 h: 50.492. Glucose: P values for hours 0–6, 0 h: 0.018, 1 h: 0.001, 2 h: <0.001, 3 h: 0.011, 4 h: 0.004, 5 h: 0.001, 6 h: 0.001; t values for hours 0–6, 0 h: 4.744, 1 h: 11.619, 2 h: 19.919, 3 h: 5.564, 4 h: 7.871, 5 h: 13.339, 6 h: 14.801. pCO2: P values for hours 0–6, 0 h: 0.811, 1 h: 0.309, 2 h: 0.001, 3 h: 0.049, 4 h: 0.004, 5 h: 0.01, 6 h: 0.004; t values for hours 0–6, 0 h: 0.262, 1 h: 1.222, 2 h: 13.389, 3 h: 3.201, 4 h: 7.799, 5 h: 5.827, 6 h: 7.825. pH: P values for hours 0–6, 0 h: 0.211, 1 h: 0.076, 2 h: 0.001, 3 h: 0.022, 4 h: 0.002, 5 h: 0.008, 6 h: 0.004; t values for hours 0–6, 0 h: 1.584, 1 h: 2.660, 2 h: 15.269, 3 h: 4.364, 4 h: 10.605, 5 h: 6.327, 6 h: 8.012. K+: P values

Article reSeArcH
for hours 0–6, 0 h: 0.030, 1 h: 0.019, 2 h: 0.011, 3 h: 0.015, 4 h: 0.036, 5 h: 0.085, 6 h: 0.051; t values for hours 0–6, 0 h: 3.890, 1 h: 4.587, 2 h: 5.681, 3 h: 5, 4 h: 3.612, 5 h: 2.533, 6 h: 3.150. Na+: P values for hours 0–6, 0 h: 0.039, 1 h: 0.015, 2 h: 0.391, 3 h: 0.215, 4 h: 0.391, 5 h: 0.058, 6 h: 0.423; t values for hours 0–6, 0 h: 3.506, 1 h: 5, 2 h: 1, 3 h: 1.567, 4 h: 1, 5 h: 3, 6 h: 0.926. Lactate: P values for hours 0–6, 0 h: 0.028, 1 h: 0.014, 2 h: 0.021, 3 h: 0.01, 4 h: 0.01, 5 h: 0.015, 6 h: 0.018; t values for hours 0–6, 0 h: 4.027, 1 h: 5.216, 2 h: 4.435, 3 h: 5.913, 4 h: 5.807, 5 h: 5.051, 6 h: 4.744.Reporting summary. Further information on research design is available in the Nature Research Reporting Summary linked to this paper.
Data availabilityAll data sets and/or analyses generated in this study are available from the corre-sponding author upon reasonable request. 46. Stacy, M. R. et al. Multimodality imaging approach for serial assessment of
regional changes in lower extremity arteriogenesis and tissue perfusion in a porcine model of peripheral arterial disease. Circ. Cardiovasc. Imaging 7, 92–99 (2014).
47. Keep, R. F., Hua, Y. & Xi, G. Brain water content. A misunderstood measurement? Transl. Stroke Res. 3, 263–265 (2012).
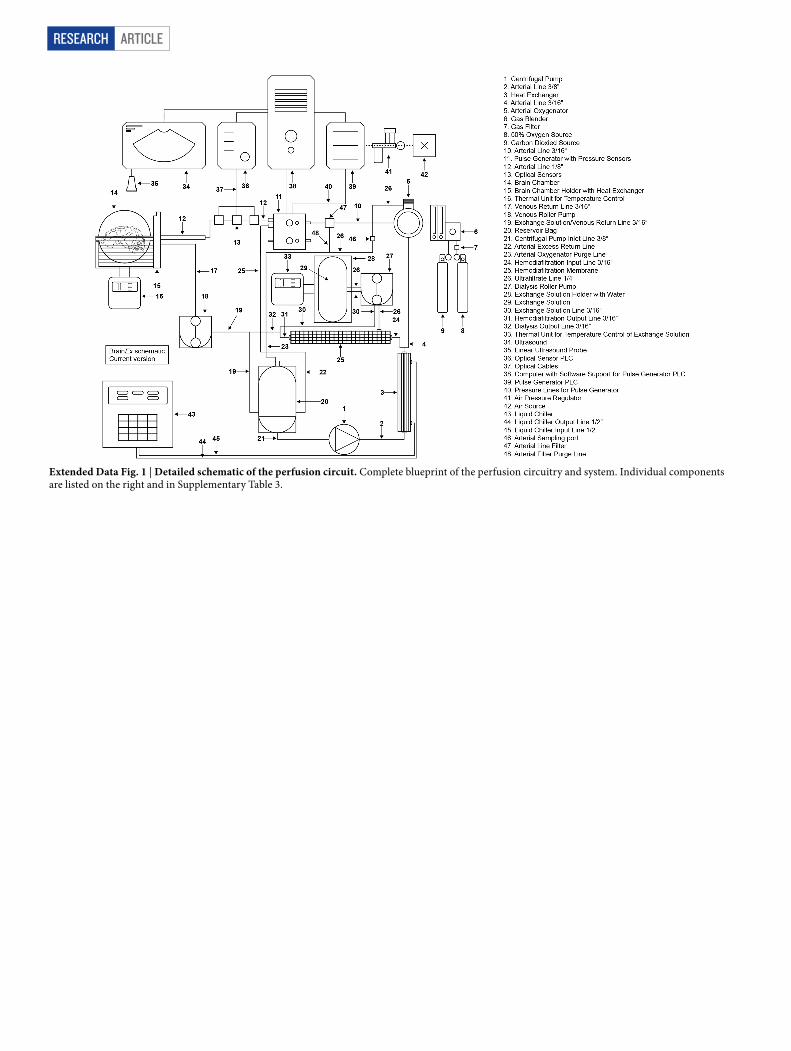
ArticlereSeArcH
Extended Data Fig. 1 | Detailed schematic of the perfusion circuit. Complete blueprint of the perfusion circuitry and system. Individual components are listed on the right and in Supplementary Table 3.
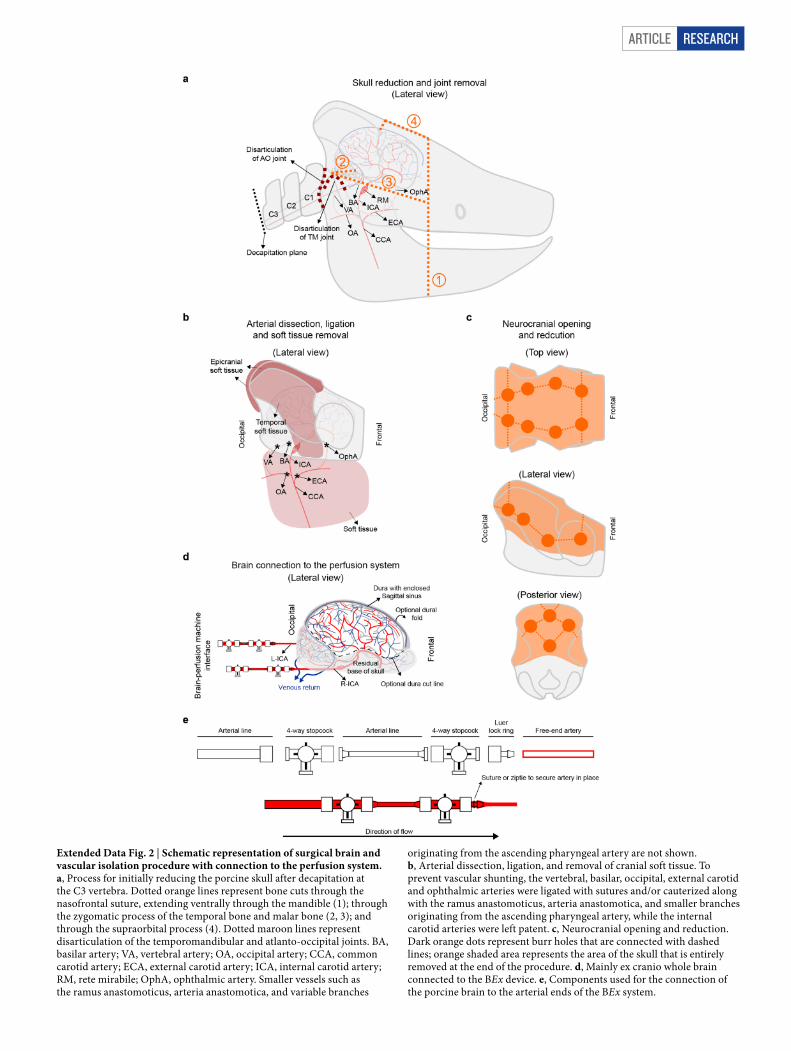
Article reSeArcH
Extended Data Fig. 2 | Schematic representation of surgical brain and vascular isolation procedure with connection to the perfusion system. a, Process for initially reducing the porcine skull after decapitation at the C3 vertebra. Dotted orange lines represent bone cuts through the nasofrontal suture, extending ventrally through the mandible (1); through the zygomatic process of the temporal bone and malar bone (2, 3); and through the supraorbital process (4). Dotted maroon lines represent disarticulation of the temporomandibular and atlanto-occipital joints. BA, basilar artery; VA, vertebral artery; OA, occipital artery; CCA, common carotid artery; ECA, external carotid artery; ICA, internal carotid artery; RM, rete mirabile; OphA, ophthalmic artery. Smaller vessels such as the ramus anastomoticus, arteria anastomotica, and variable branches
originating from the ascending pharyngeal artery are not shown. b, Arterial dissection, ligation, and removal of cranial soft tissue. To prevent vascular shunting, the vertebral, basilar, occipital, external carotid and ophthalmic arteries were ligated with sutures and/or cauterized along with the ramus anastomoticus, arteria anastomotica, and smaller branches originating from the ascending pharyngeal artery, while the internal carotid arteries were left patent. c, Neurocranial opening and reduction. Dark orange dots represent burr holes that are connected with dashed lines; orange shaded area represents the area of the skull that is entirely removed at the end of the procedure. d, Mainly ex cranio whole brain connected to the BEx device. e, Components used for the connection of the porcine brain to the arterial ends of the BEx system.
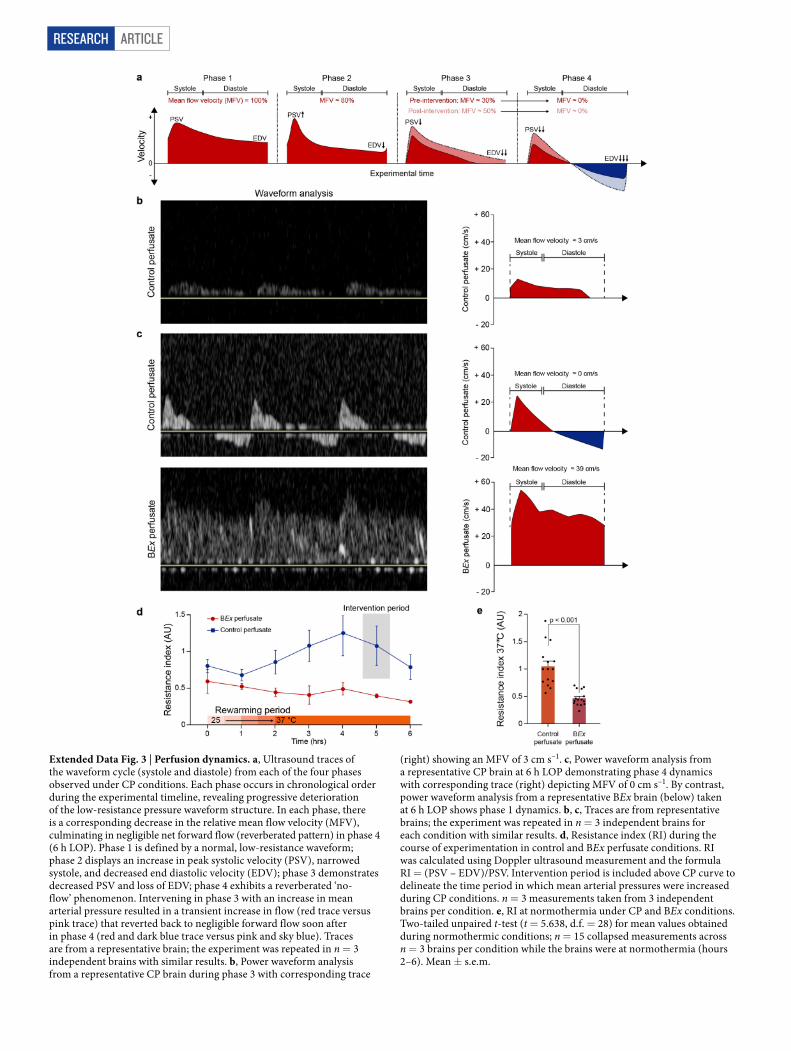
ArticlereSeArcH
Extended Data Fig. 3 | Perfusion dynamics. a, Ultrasound traces of the waveform cycle (systole and diastole) from each of the four phases observed under CP conditions. Each phase occurs in chronological order during the experimental timeline, revealing progressive deterioration of the low-resistance pressure waveform structure. In each phase, there is a corresponding decrease in the relative mean flow velocity (MFV), culminating in negligible net forward flow (reverberated pattern) in phase 4 (6 h LOP). Phase 1 is defined by a normal, low-resistance waveform; phase 2 displays an increase in peak systolic velocity (PSV), narrowed systole, and decreased end diastolic velocity (EDV); phase 3 demonstrates decreased PSV and loss of EDV; phase 4 exhibits a reverberated ‘no-flow’ phenomenon. Intervening in phase 3 with an increase in mean arterial pressure resulted in a transient increase in flow (red trace versus pink trace) that reverted back to negligible forward flow soon after in phase 4 (red and dark blue trace versus pink and sky blue). Traces are from a representative brain; the experiment was repeated in n = 3 independent brains with similar results. b, Power waveform analysis from a representative CP brain during phase 3 with corresponding trace
(right) showing an MFV of 3 cm s–1. c, Power waveform analysis from a representative CP brain at 6 h LOP demonstrating phase 4 dynamics with corresponding trace (right) depicting MFV of 0 cm s–1. By contrast, power waveform analysis from a representative BEx brain (below) taken at 6 h LOP shows phase 1 dynamics. b, c, Traces are from representative brains; the experiment was repeated in n = 3 independent brains for each condition with similar results. d, Resistance index (RI) during the course of experimentation in control and BEx perfusate conditions. RI was calculated using Doppler ultrasound measurement and the formula RI = (PSV – EDV)/PSV. Intervention period is included above CP curve to delineate the time period in which mean arterial pressures were increased during CP conditions. n = 3 measurements taken from 3 independent brains per condition. e, RI at normothermia under CP and BEx conditions. Two-tailed unpaired t-test (t = 5.638, d.f. = 28) for mean values obtained during normothermic conditions; n = 15 collapsed measurements across n = 3 brains per condition while the brains were at normothermia (hours 2–6). Mean ± s.e.m.
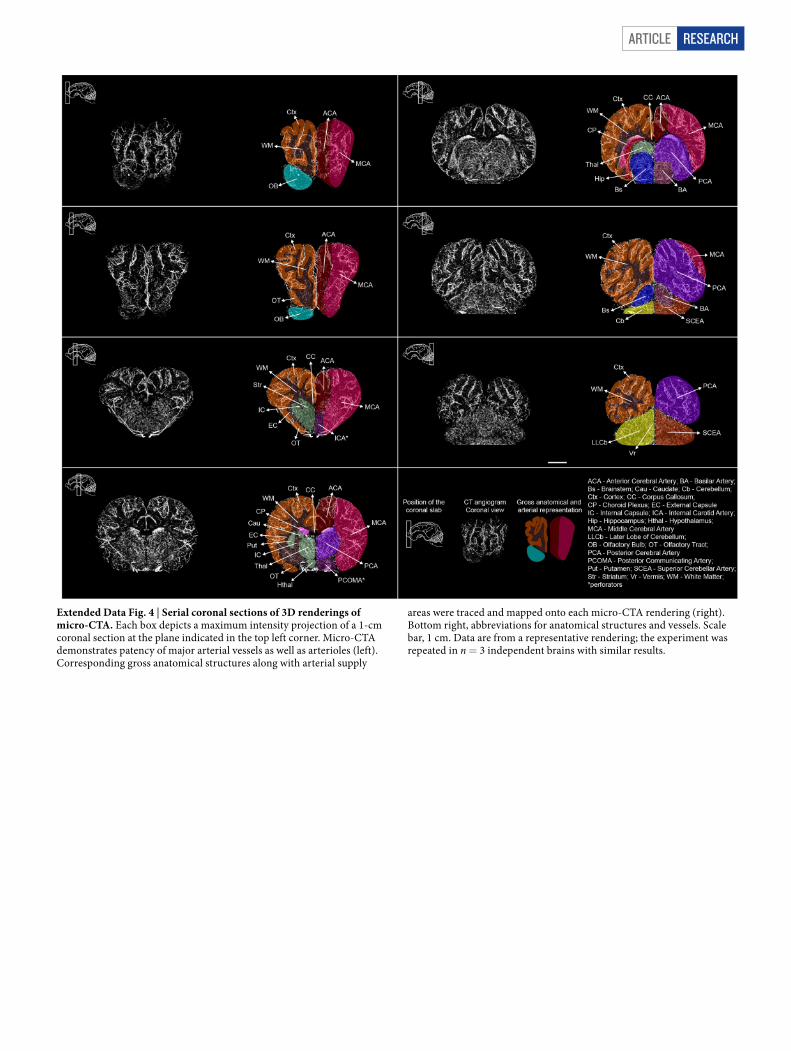
Article reSeArcH
Extended Data Fig. 4 | Serial coronal sections of 3D renderings of micro-CTA. Each box depicts a maximum intensity projection of a 1-cm coronal section at the plane indicated in the top left corner. Micro-CTA demonstrates patency of major arterial vessels as well as arterioles (left). Corresponding gross anatomical structures along with arterial supply
areas were traced and mapped onto each micro-CTA rendering (right). Bottom right, abbreviations for anatomical structures and vessels. Scale bar, 1 cm. Data are from a representative rendering; the experiment was repeated in n = 3 independent brains with similar results.
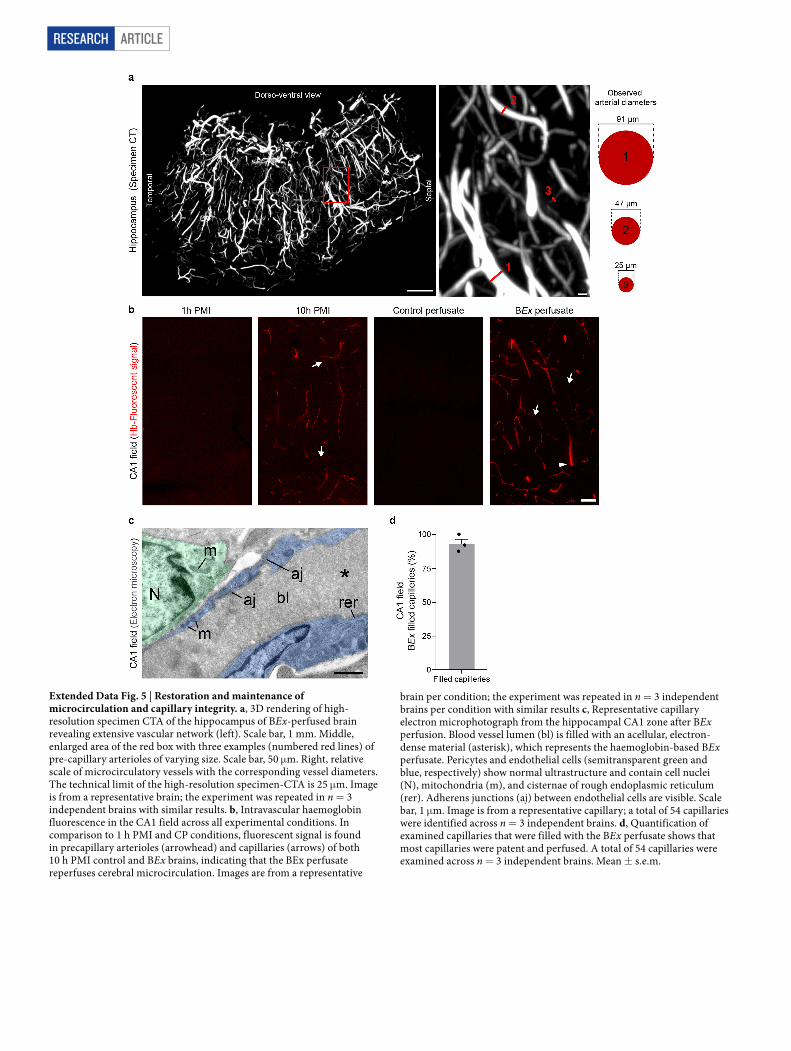
ArticlereSeArcH
Extended Data Fig. 5 | Restoration and maintenance of microcirculation and capillary integrity. a, 3D rendering of high-resolution specimen CTA of the hippocampus of BEx-perfused brain revealing extensive vascular network (left). Scale bar, 1 mm. Middle, enlarged area of the red box with three examples (numbered red lines) of pre-capillary arterioles of varying size. Scale bar, 50 μm. Right, relative scale of microcirculatory vessels with the corresponding vessel diameters. The technical limit of the high-resolution specimen-CTA is 25 μm. Image is from a representative brain; the experiment was repeated in n = 3 independent brains with similar results. b, Intravascular haemoglobin fluorescence in the CA1 field across all experimental conditions. In comparison to 1 h PMI and CP conditions, fluorescent signal is found in precapillary arterioles (arrowhead) and capillaries (arrows) of both 10 h PMI control and BEx brains, indicating that the BEx perfusate reperfuses cerebral microcirculation. Images are from a representative
brain per condition; the experiment was repeated in n = 3 independent brains per condition with similar results c, Representative capillary electron microphotograph from the hippocampal CA1 zone after BEx perfusion. Blood vessel lumen (bl) is filled with an acellular, electron-dense material (asterisk), which represents the haemoglobin-based BEx perfusate. Pericytes and endothelial cells (semitransparent green and blue, respectively) show normal ultrastructure and contain cell nuclei (N), mitochondria (m), and cisternae of rough endoplasmic reticulum (rer). Adherens junctions (aj) between endothelial cells are visible. Scale bar, 1 μm. Image is from a representative capillary; a total of 54 capillaries were identified across n = 3 independent brains. d, Quantification of examined capillaries that were filled with the BEx perfusate shows that most capillaries were patent and perfused. A total of 54 capillaries were examined across n = 3 independent brains. Mean ± s.e.m.
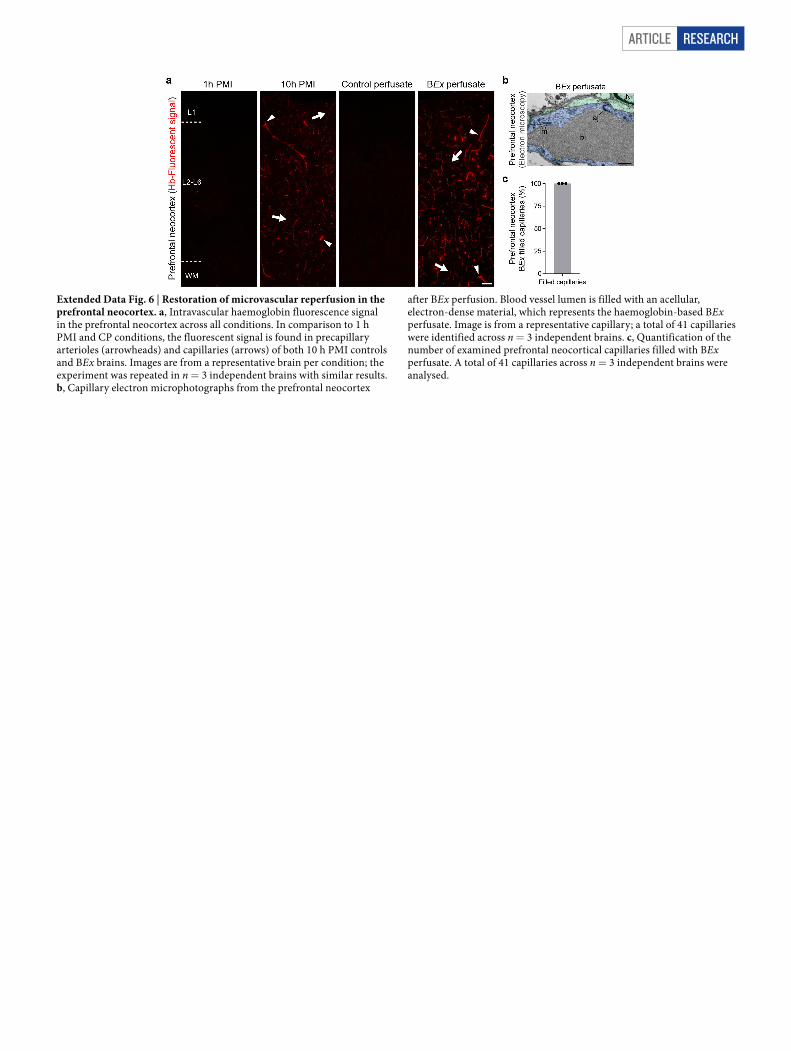
Article reSeArcH
Extended Data Fig. 6 | Restoration of microvascular reperfusion in the prefrontal neocortex. a, Intravascular haemoglobin fluorescence signal in the prefrontal neocortex across all conditions. In comparison to 1 h PMI and CP conditions, the fluorescent signal is found in precapillary arterioles (arrowheads) and capillaries (arrows) of both 10 h PMI controls and BEx brains. Images are from a representative brain per condition; the experiment was repeated in n = 3 independent brains with similar results. b, Capillary electron microphotographs from the prefrontal neocortex
after BEx perfusion. Blood vessel lumen is filled with an acellular, electron-dense material, which represents the haemoglobin-based BEx perfusate. Image is from a representative capillary; a total of 41 capillaries were identified across n = 3 independent brains. c, Quantification of the number of examined prefrontal neocortical capillaries filled with BEx perfusate. A total of 41 capillaries across n = 3 independent brains were analysed.
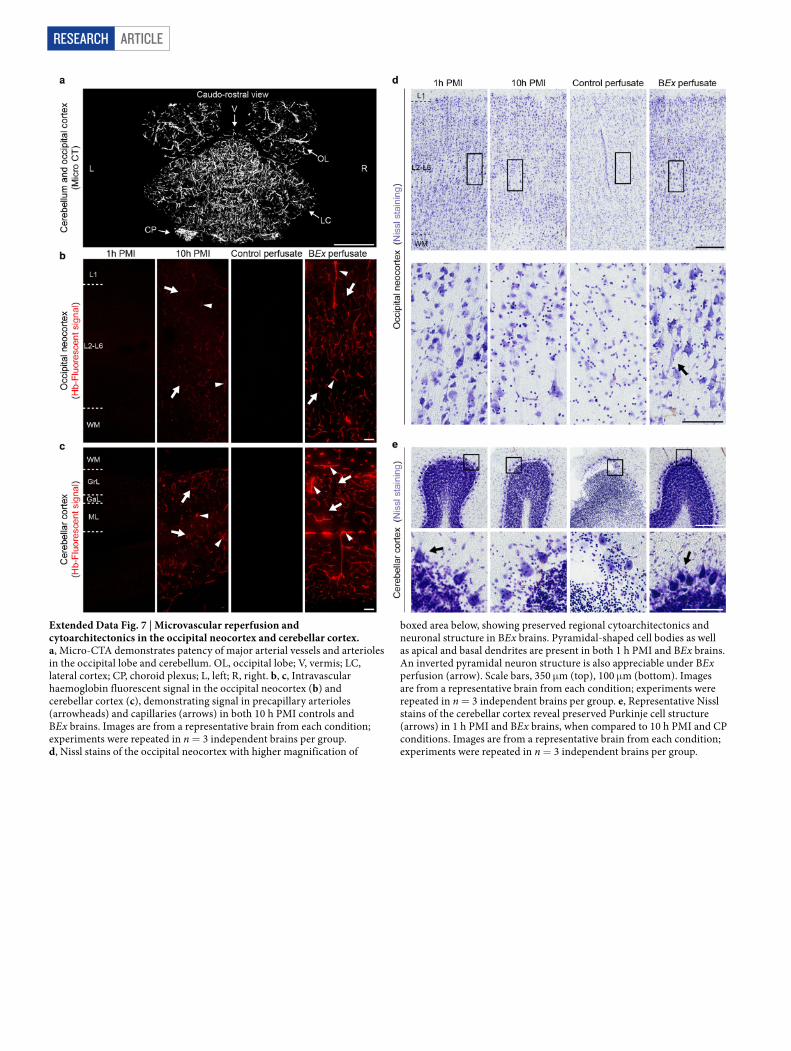
ArticlereSeArcH
Extended Data Fig. 7 | Microvascular reperfusion and cytoarchitectonics in the occipital neocortex and cerebellar cortex. a, Micro-CTA demonstrates patency of major arterial vessels and arterioles in the occipital lobe and cerebellum. OL, occipital lobe; V, vermis; LC, lateral cortex; CP, choroid plexus; L, left; R, right. b, c, Intravascular haemoglobin fluorescent signal in the occipital neocortex (b) and cerebellar cortex (c), demonstrating signal in precapillary arterioles (arrowheads) and capillaries (arrows) in both 10 h PMI controls and BEx brains. Images are from a representative brain from each condition; experiments were repeated in n = 3 independent brains per group. d, Nissl stains of the occipital neocortex with higher magnification of
boxed area below, showing preserved regional cytoarchitectonics and neuronal structure in BEx brains. Pyramidal-shaped cell bodies as well as apical and basal dendrites are present in both 1 h PMI and BEx brains. An inverted pyramidal neuron structure is also appreciable under BEx perfusion (arrow). Scale bars, 350 μm (top), 100 μm (bottom). Images are from a representative brain from each condition; experiments were repeated in n = 3 independent brains per group. e, Representative Nissl stains of the cerebellar cortex reveal preserved Purkinje cell structure (arrows) in 1 h PMI and BEx brains, when compared to 10 h PMI and CP conditions. Images are from a representative brain from each condition; experiments were repeated in n = 3 independent brains per group.
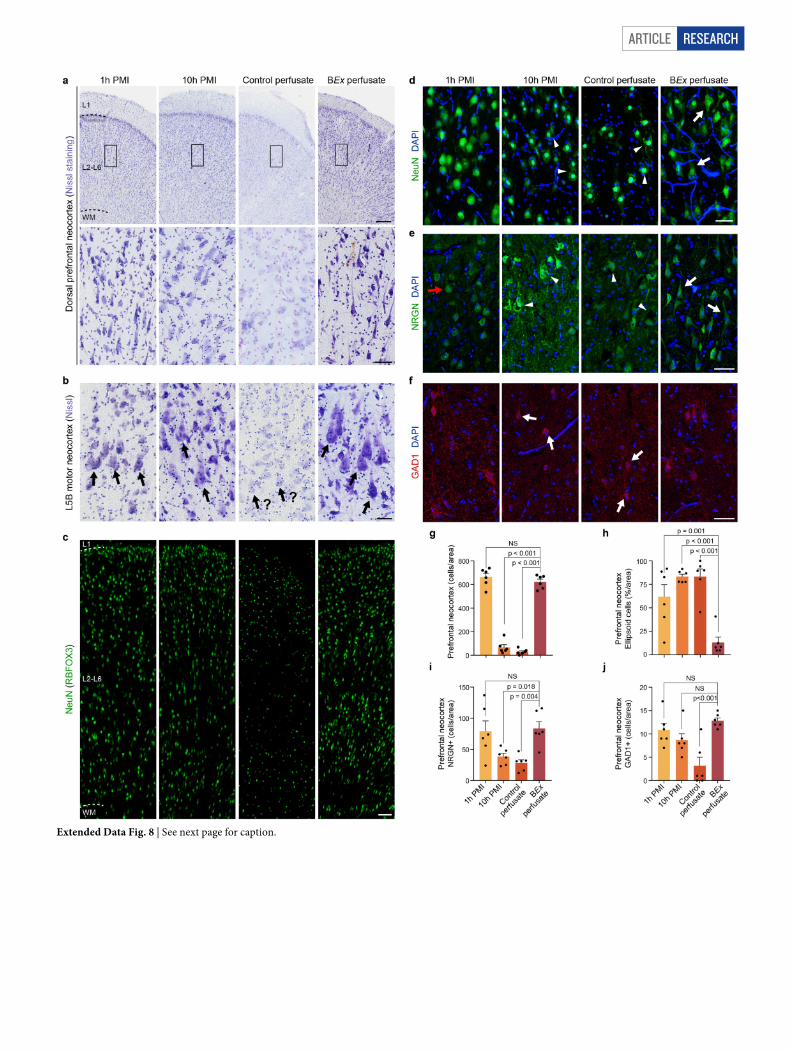
Article reSeArcH
Extended Data Fig. 8 | See next page for caption.
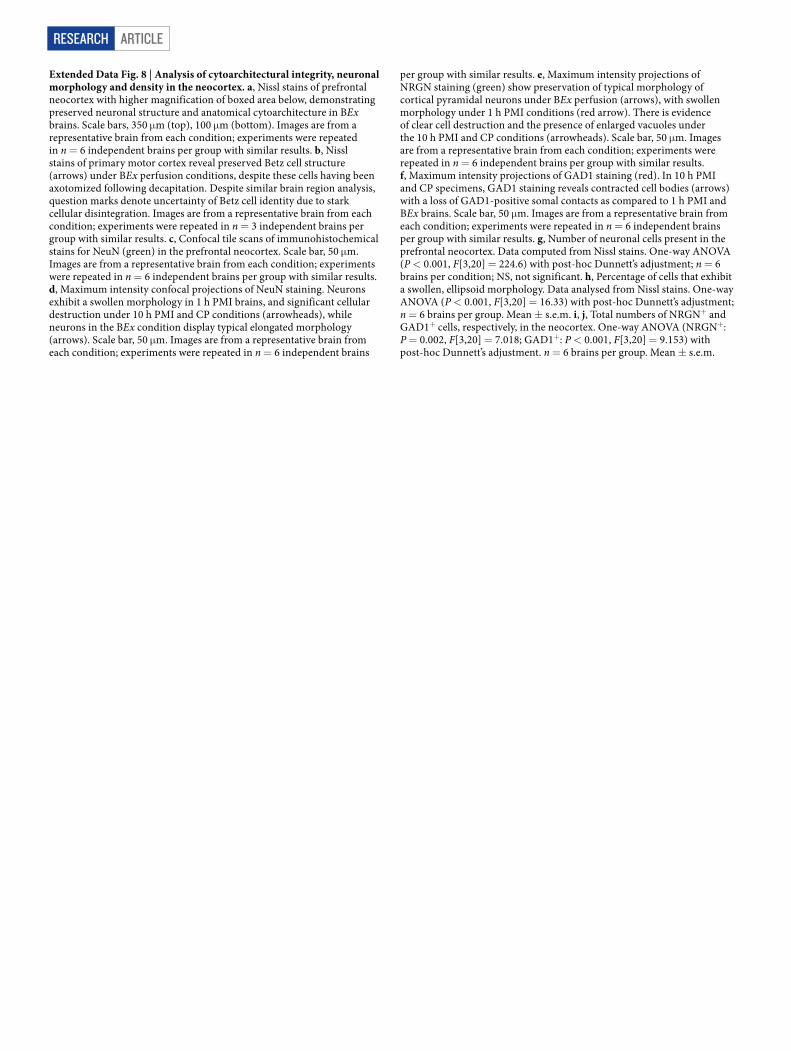
ArticlereSeArcH
Extended Data Fig. 8 | Analysis of cytoarchitectural integrity, neuronal morphology and density in the neocortex. a, Nissl stains of prefrontal neocortex with higher magnification of boxed area below, demonstrating preserved neuronal structure and anatomical cytoarchitecture in BEx brains. Scale bars, 350 μm (top), 100 μm (bottom). Images are from a representative brain from each condition; experiments were repeated in n = 6 independent brains per group with similar results. b, Nissl stains of primary motor cortex reveal preserved Betz cell structure (arrows) under BEx perfusion conditions, despite these cells having been axotomized following decapitation. Despite similar brain region analysis, question marks denote uncertainty of Betz cell identity due to stark cellular disintegration. Images are from a representative brain from each condition; experiments were repeated in n = 3 independent brains per group with similar results. c, Confocal tile scans of immunohistochemical stains for NeuN (green) in the prefrontal neocortex. Scale bar, 50 μm. Images are from a representative brain from each condition; experiments were repeated in n = 6 independent brains per group with similar results. d, Maximum intensity confocal projections of NeuN staining. Neurons exhibit a swollen morphology in 1 h PMI brains, and significant cellular destruction under 10 h PMI and CP conditions (arrowheads), while neurons in the BEx condition display typical elongated morphology (arrows). Scale bar, 50 μm. Images are from a representative brain from each condition; experiments were repeated in n = 6 independent brains
per group with similar results. e, Maximum intensity projections of NRGN staining (green) show preservation of typical morphology of cortical pyramidal neurons under BEx perfusion (arrows), with swollen morphology under 1 h PMI conditions (red arrow). There is evidence of clear cell destruction and the presence of enlarged vacuoles under the 10 h PMI and CP conditions (arrowheads). Scale bar, 50 μm. Images are from a representative brain from each condition; experiments were repeated in n = 6 independent brains per group with similar results. f, Maximum intensity projections of GAD1 staining (red). In 10 h PMI and CP specimens, GAD1 staining reveals contracted cell bodies (arrows) with a loss of GAD1-positive somal contacts as compared to 1 h PMI and BEx brains. Scale bar, 50 μm. Images are from a representative brain from each condition; experiments were repeated in n = 6 independent brains per group with similar results. g, Number of neuronal cells present in the prefrontal neocortex. Data computed from Nissl stains. One-way ANOVA (P < 0.001, F[3,20] = 224.6) with post-hoc Dunnett’s adjustment; n = 6 brains per condition; NS, not significant. h, Percentage of cells that exhibit a swollen, ellipsoid morphology. Data analysed from Nissl stains. One-way ANOVA (P < 0.001, F[3,20] = 16.33) with post-hoc Dunnett’s adjustment; n = 6 brains per group. Mean ± s.e.m. i, j, Total numbers of NRGN+ and GAD1+ cells, respectively, in the neocortex. One-way ANOVA (NRGN+: P = 0.002, F[3,20] = 7.018; GAD1+: P < 0.001, F[3,20] = 9.153) with post-hoc Dunnett’s adjustment. n = 6 brains per group. Mean ± s.e.m.
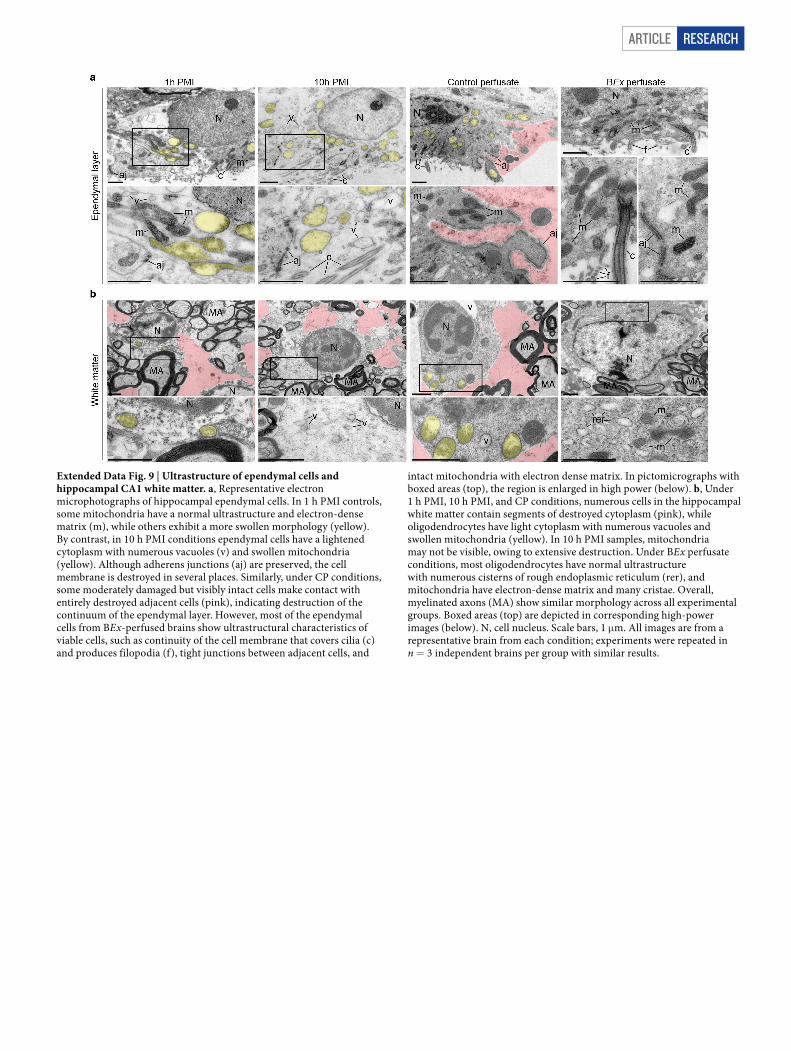
Article reSeArcH
Extended Data Fig. 9 | Ultrastructure of ependymal cells and hippocampal CA1 white matter. a, Representative electron microphotographs of hippocampal ependymal cells. In 1 h PMI controls, some mitochondria have a normal ultrastructure and electron-dense matrix (m), while others exhibit a more swollen morphology (yellow). By contrast, in 10 h PMI conditions ependymal cells have a lightened cytoplasm with numerous vacuoles (v) and swollen mitochondria (yellow). Although adherens junctions (aj) are preserved, the cell membrane is destroyed in several places. Similarly, under CP conditions, some moderately damaged but visibly intact cells make contact with entirely destroyed adjacent cells (pink), indicating destruction of the continuum of the ependymal layer. However, most of the ependymal cells from BEx-perfused brains show ultrastructural characteristics of viable cells, such as continuity of the cell membrane that covers cilia (c) and produces filopodia (f), tight junctions between adjacent cells, and
intact mitochondria with electron dense matrix. In pictomicrographs with boxed areas (top), the region is enlarged in high power (below). b, Under 1 h PMI, 10 h PMI, and CP conditions, numerous cells in the hippocampal white matter contain segments of destroyed cytoplasm (pink), while oligodendrocytes have light cytoplasm with numerous vacuoles and swollen mitochondria (yellow). In 10 h PMI samples, mitochondria may not be visible, owing to extensive destruction. Under BEx perfusate conditions, most oligodendrocytes have normal ultrastructure with numerous cisterns of rough endoplasmic reticulum (rer), and mitochondria have electron-dense matrix and many cristae. Overall, myelinated axons (MA) show similar morphology across all experimental groups. Boxed areas (top) are depicted in corresponding high-power images (below). N, cell nucleus. Scale bars, 1 μm. All images are from a representative brain from each condition; experiments were repeated in n = 3 independent brains per group with similar results.
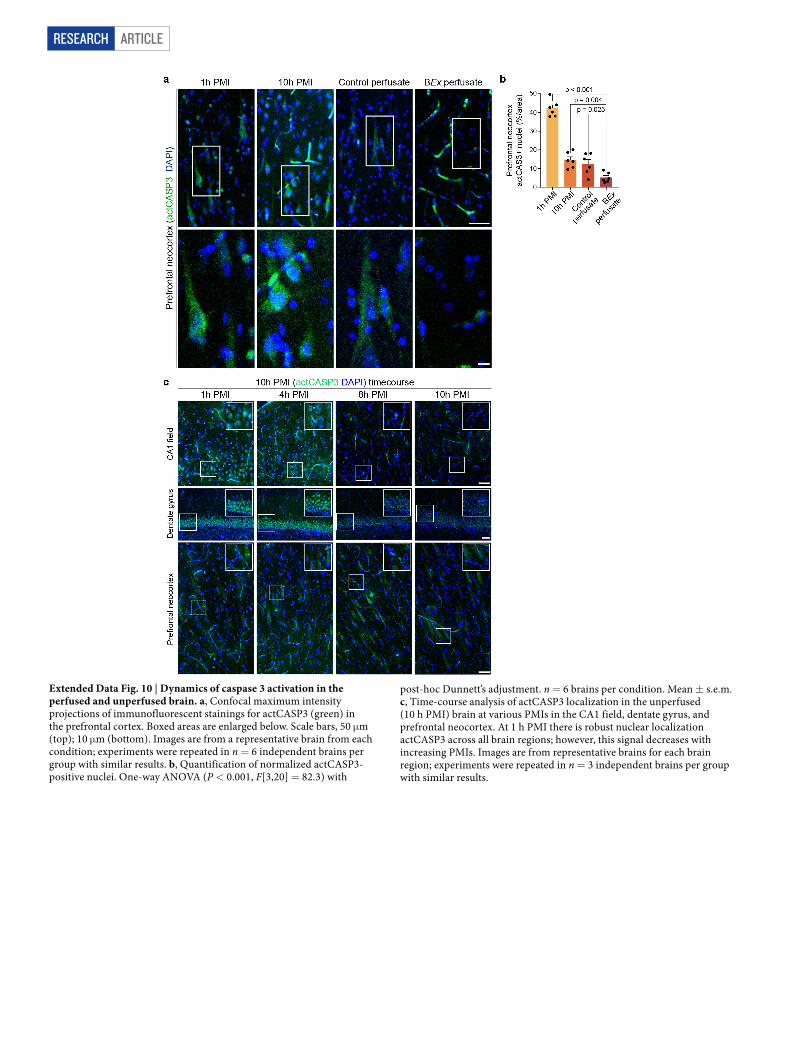
ArticlereSeArcH
Extended Data Fig. 10 | Dynamics of caspase 3 activation in the perfused and unperfused brain. a, Confocal maximum intensity projections of immunofluorescent stainings for actCASP3 (green) in the prefrontal cortex. Boxed areas are enlarged below. Scale bars, 50 μm (top); 10 μm (bottom). Images are from a representative brain from each condition; experiments were repeated in n = 6 independent brains per group with similar results. b, Quantification of normalized actCASP3-positive nuclei. One-way ANOVA (P < 0.001, F[3,20] = 82.3) with
post-hoc Dunnett’s adjustment. n = 6 brains per condition. Mean ± s.e.m. c, Time-course analysis of actCASP3 localization in the unperfused (10 h PMI) brain at various PMIs in the CA1 field, dentate gyrus, and prefrontal neocortex. At 1 h PMI there is robust nuclear localization actCASP3 across all brain regions; however, this signal decreases with increasing PMIs. Images are from representative brains for each brain region; experiments were repeated in n = 3 independent brains per group with similar results.
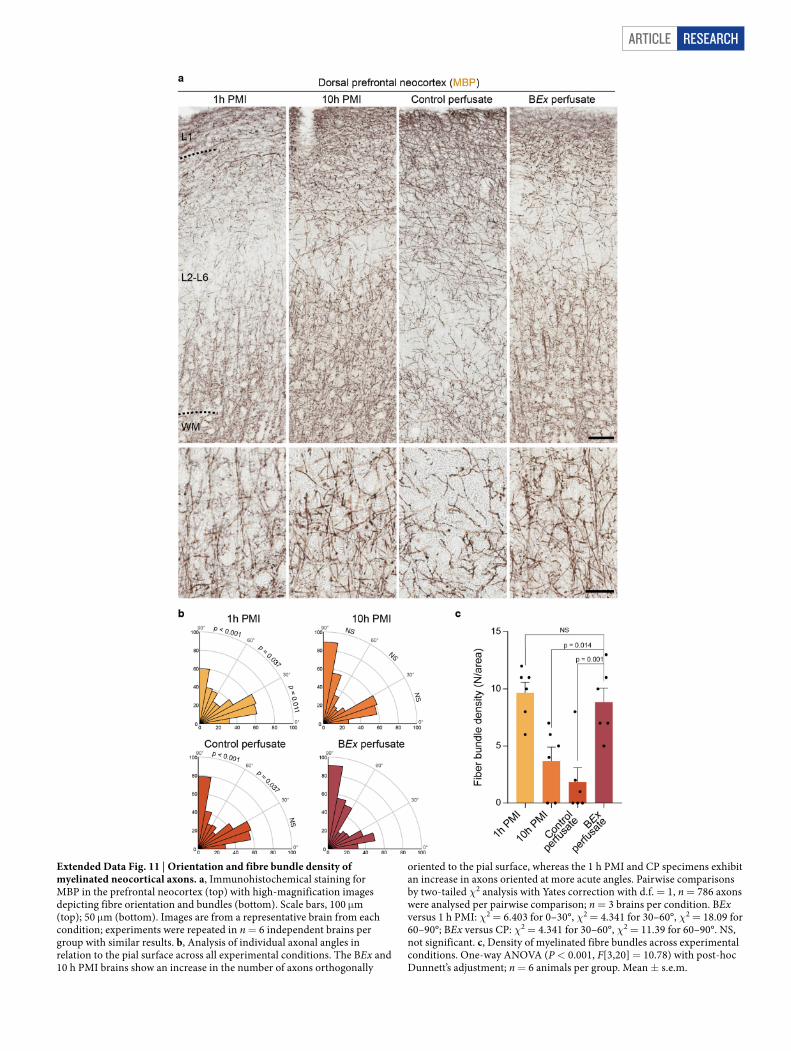
Article reSeArcH
Extended Data Fig. 11 | Orientation and fibre bundle density of myelinated neocortical axons. a, Immunohistochemical staining for MBP in the prefrontal neocortex (top) with high-magnification images depicting fibre orientation and bundles (bottom). Scale bars, 100 μm (top); 50 μm (bottom). Images are from a representative brain from each condition; experiments were repeated in n = 6 independent brains per group with similar results. b, Analysis of individual axonal angles in relation to the pial surface across all experimental conditions. The BEx and 10 h PMI brains show an increase in the number of axons orthogonally
oriented to the pial surface, whereas the 1 h PMI and CP specimens exhibit an increase in axons oriented at more acute angles. Pairwise comparisons by two-tailed χ2 analysis with Yates correction with d.f. = 1, n = 786 axons were analysed per pairwise comparison; n = 3 brains per condition. BEx versus 1 h PMI: χ2 = 6.403 for 0–30°, χ2 = 4.341 for 30–60°, χ2 = 18.09 for 60–90°; BEx versus CP: χ2 = 4.341 for 30–60°, χ2 = 11.39 for 60–90°. NS, not significant. c, Density of myelinated fibre bundles across experimental conditions. One-way ANOVA (P < 0.001, F[3,20] = 10.78) with post-hoc Dunnett’s adjustment; n = 6 animals per group. Mean ± s.e.m.
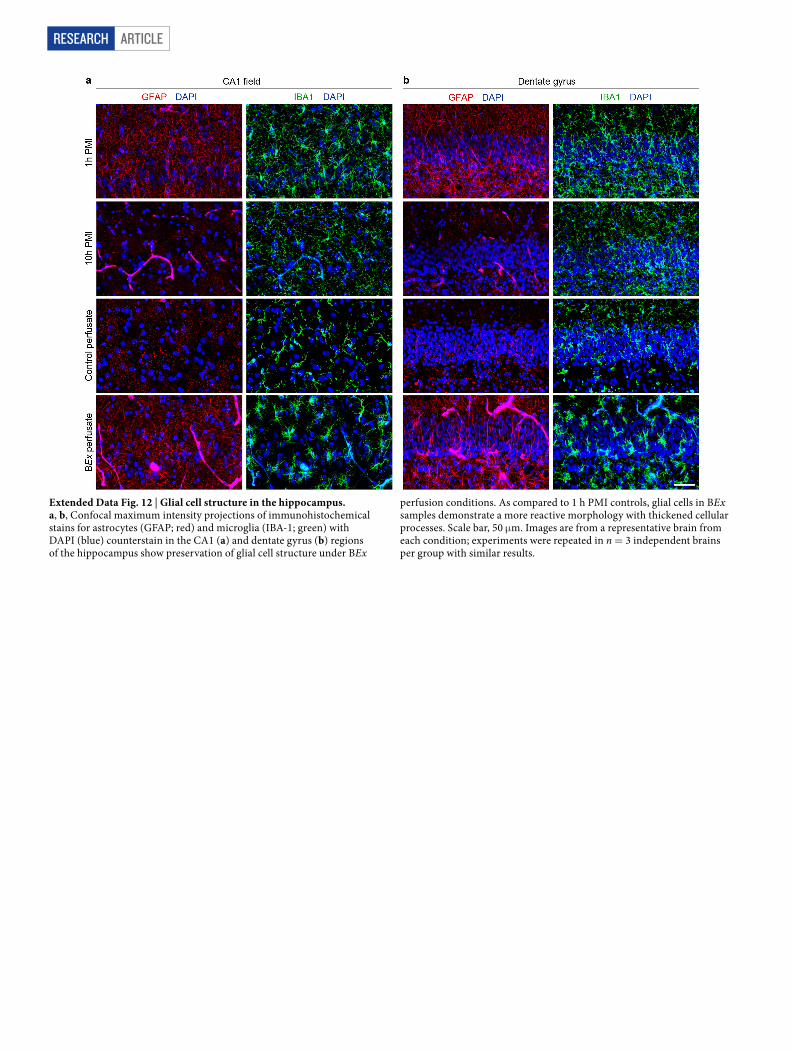
ArticlereSeArcH
Extended Data Fig. 12 | Glial cell structure in the hippocampus. a, b, Confocal maximum intensity projections of immunohistochemical stains for astrocytes (GFAP; red) and microglia (IBA-1; green) with DAPI (blue) counterstain in the CA1 (a) and dentate gyrus (b) regions of the hippocampus show preservation of glial cell structure under BEx
perfusion conditions. As compared to 1 h PMI controls, glial cells in BEx samples demonstrate a more reactive morphology with thickened cellular processes. Scale bar, 50 μm. Images are from a representative brain from each condition; experiments were repeated in n = 3 independent brains per group with similar results.

1
nature research | reporting summ
aryO
ctober 2018
Corresponding author(s): Nenad Sestan
Last updated by author(s): Feb 6, 2019
Reporting SummaryNature Research wishes to improve the reproducibility of the work that we publish. This form provides structure for consistency and transparency in reporting. For further information on Nature Research policies, see Authors & Referees and the Editorial Policy Checklist.
StatisticsFor all statistical analyses, confirm that the following items are present in the figure legend, table legend, main text, or Methods section.
n/a Confirmed
The exact sample size (n) for each experimental group/condition, given as a discrete number and unit of measurement
A statement on whether measurements were taken from distinct samples or whether the same sample was measured repeatedly
The statistical test(s) used AND whether they are one- or two-sided Only common tests should be described solely by name; describe more complex techniques in the Methods section.
A description of all covariates tested
A description of any assumptions or corrections, such as tests of normality and adjustment for multiple comparisons
A full description of the statistical parameters including central tendency (e.g. means) or other basic estimates (e.g. regression coefficient) AND variation (e.g. standard deviation) or associated estimates of uncertainty (e.g. confidence intervals)
For null hypothesis testing, the test statistic (e.g. F, t, r) with confidence intervals, effect sizes, degrees of freedom and P value noted Give P values as exact values whenever suitable.
For Bayesian analysis, information on the choice of priors and Markov chain Monte Carlo settings
For hierarchical and complex designs, identification of the appropriate level for tests and full reporting of outcomes
Estimates of effect sizes (e.g. Cohen's d, Pearson's r), indicating how they were calculated
Our web collection on statistics for biologists contains articles on many of the points above.
Software and codePolicy information about availability of computer code
Data collection No software were used in data collection.
Data analysis ZEN, ImageJ, Aperio ImageScope were used for basic image processing which included normalization by size, magnification, and optical settings. MATLAB v9.5.0.9 was used for metabolic and myelin data analysis. RadiAnt DICOM Viewer, PMOD v3.8, and Microview software were used for CT and MRI image processing. GraphPad Prism v7 were used for statistical analysis. Clampfit 10.2 and OriginPro8 were utilized for electrophysiology data processing.
For manuscripts utilizing custom algorithms or software that are central to the research but not yet described in published literature, software must be made available to editors/reviewers. We strongly encourage code deposition in a community repository (e.g. GitHub). See the Nature Research guidelines for submitting code & software for further information.
DataPolicy information about availability of data
All manuscripts must include a data availability statement. This statement should provide the following information, where applicable: - Accession codes, unique identifiers, or web links for publicly available datasets - A list of figures that have associated raw data - A description of any restrictions on data availability
All data supporting the findings of this study are available from the corresponding author upon request.
2
nature research | reporting summ
aryO
ctober 2018
Field-specific reportingPlease select the one below that is the best fit for your research. If you are not sure, read the appropriate sections before making your selection.
Life sciences Behavioural & social sciences Ecological, evolutionary & environmental sciences
For a reference copy of the document with all sections, see nature.com/documents/nr-reporting-summary-flat.pdf
Life sciences study designAll studies must disclose on these points even when the disclosure is negative.
Sample size During the process of technology development (i.e., surgical approach, vascular isolation, device configuration, perfusate formulation, etc.) and the final study described herein, approximately 300 postmortem pig brains were utilized from USDA-approved food production facilities. Once the technology was optimized and stark differences in tissue integrity were observed in pilot studies, 32 independent brains underwent BEx perfusion, data from which are presented herein. Out of these 32 BEx-perfused brains, the sample size (including the matched sample number of brains subjected to 1h PMI, 10h PMI, and CP conditions) used for each analysis is delineated within either each respective figure legend or in the further information in the Methods. No statistical test was used a priori to determine the sample size. A posteriori power was computed for all group comparisons and resulted in a beta value for all analyses above 0.9.
Data exclusions Data from the postmortem pig brains that were used for the development and optimization of this technology (i.e., surgical approach, vascular isolation, device configuration, perfusate formulation, etc.) were not included in this manuscript. Furthermore, data from surgical and technical errors leading to confounded perfusion parameters were also excluded.
Replication All procedures, drugs, chemicals, compounds and technologies applied to the brains were standardized as best as possible for every step and automated, when possible, for reliable replication.
Randomization All pigs were selected based on a standardized criteria of breed (Yorkshire) and weight (~50-75 kg) and age (6-8 months of age). Experiments were organized (i.e. which experimental condition was going to be performed) several days in advance with the food processing facility to ensure that the personnel reserved animals of the established criteria. At the day of the experiment, animals were randomly selected by the facility personnel, and assigned to each experimental condition.
Blinding Group allocation was conducted as described above. Data collection was performed by independent investigators. Prior to data analysis, immunohistological and histological images were randomized and analyzed by independent, blinded observers as described in the methods section.
Reporting for specific materials, systems and methodsWe require information from authors about some types of materials, experimental systems and methods used in many studies. Here, indicate whether each material, system or method listed is relevant to your study. If you are not sure if a list item applies to your research, read the appropriate section before selecting a response.
Materials & experimental systemsn/a Involved in the study
Antibodies
Eukaryotic cell lines
Palaeontology
Animals and other organisms
Human research participants
Clinical data
Methodsn/a Involved in the study
ChIP-seq
Flow cytometry
MRI-based neuroimaging
AntibodiesAntibodies used The antibodies utilized herein are as follows:
IBA1 (rabbit anti-iba1; 1:1000; Wako; 019-19741; Lot: PTR2404) GFAP (mouse anti-GFAP; 1:500; Sigma; G3893; Clone: G-A-5; Lot: 096M4849V) RBFOX3/NeuN (rabbit anti-NeuN; 1:2000; Abcam; ab177487; Lot: GR249899-56) cleaved Caspase-3 (rabbit anti-actCASP3; 1:200; CST; 9661S; Lot: 45) MBP (rat anti-MBP; 1:200; BioRad; MCA409S; Clone 12; 160223) Neurogranin (NRGN) (sheep anti-NRGN; 1:50; R&D systems; AF7947; Lot: CHRO011) GAD1 (goat anti-GAD1; 1:50; R&D systems; AF2086; Lot: KRD0216081).
3
nature research | reporting summ
aryO
ctober 2018Validation We have extensive experience in validating and utilizing the antibodies described in this study, as previously reported in Sousa,
AMM et al., (Science 2017; PMID: 29170230), Onorati, M. et al., (Cell Reports 2016; PMID: 27568284), Olmos-Serrano, JL. et al., (Neuron 2016; PMID: 26924435), Daniele, SG. et al., (Science Signaling 2015; PMID: 25969543). These antibodies listed below are commonly used by members of our laboratory. Additional information on the specificity cross-reactivity can be found on the manufacturer's website, along with links to key publications. For antibodies that do not come with manufacturers' porcine validation: IBA-1 antibody has been validated in a porcine model of traumatic brain injury (PMID: 28081963). For Neurogranin and GAD1 antibodies, the staining pattern is consistent with our previous laboratory findings and is consistent with the staining pattern in the species validated by the manufacturer.
Animals and other organismsPolicy information about studies involving animals; ARRIVE guidelines recommended for reporting animal research
Laboratory animals No laboratory animals were utilized in this study.
Wild animals No wild animals were utilized in this study.
Field-collected samples No field-collected samples were utilized in this study.
Ethics oversight All of the research was conducted on the post-mortem brains which were procured from a local food production facility as described above. No animal was used strictly for research, but instead animal heads were collected after the animal was sacrificed for food production according to USDA guidelines. For all experimental groups, domestic pigs (S. scrofa domesticus; 6-8 months of age [~50-75 kg]) raised for food production were used. We discussed the experiments detailed within this manuscript with the Institutional Animal Care and Use Committee at Yale University. The Committee concluded that the study was exempt from procedures and protocols pertaining to vertebrate research since the tissues utilized were a product of food production and deemed postmortem.
Note that full information on the approval of the study protocol must also be provided in the manuscript.
Related Documents