Responses of Antarctic pack-ice seals to environmental change and increasing krill fishing Jaume Forcada a,⇑ , Philip N. Trathan a , Peter L. Boveng b , Ian L. Boyd c , Jennifer M. Burns d , Daniel P. Costa e , Michael Fedak c , Tracey L. Rogers f , Colin J. Southwell g a British Antarctic Survey, Natural Environment Research Council, Madingley Road, Cambridge CB3 0ET, UK b National Marine Mammal Laboratory, Alaska Fisheries Science Center, National Marine Fisheries Service, NOAA, 7600 Sand Point Way NE, Seattle, WA 98115, USA c Sea Mammal Research Unit, Scottish Oceans Institute, University of St. Andrews, St. Andrews KY16 8LB, UK d Department of Biological Sciences, University of Alaska, Anchorage, AK 99508, USA e Long Marine Laboratory, University of California, 100 Shaffer Road, Santa Cruz, CA 95060, USA f Evolution and Ecology Research Centre, School of BEES, University of New South Wales, Australia g Australian Antarctic Division, Department of Environment, Water, Heritage and the Arts, 203 Channel Highway, Kingston, Tasmania 7050, Australia article info Article history: Received 11 October 2011 Received in revised form 23 January 2012 Accepted 1 February 2012 Available online 6 April 2012 Keywords: Antarctic pack-ice seals Climate change Fisheries management Habitat change Krill Uncertainty abstract The compound effects of changing habitats, ecosystem interactions, and fishing practices have implica- tions for the management of Antarctic krill and conservation of its predators. For Antarctic pack-ice seals, an important group of krill predators, we estimate the density and krill consumption in the West Antarctic Peninsula (WAP)–Western Weddell Sea area, the main fishery region; and we consider long-term changes in suitable pack-ice habitat, increased fishing pressure and potential krill declines based upon predictions from declines in sea ice cover. More than 3 million crabeater seals consumed over 12 million tonnes of krill each year. This was approximately 17% of the krill standing stock. The highest densities of pack ice seals where found in the WAP, including in its small-scale fishery management areas, where apparently suitable seal habitat has declined by 21–28% over a 30 year period, where krill density is likely to have declined, and fishing has increased. The highest seal density was found in the Marguerite Bay area which is a source of krill for the Antarctic Peninsula and elsewhere. Significant sea-ice loss since 1979 has already occurred, leading to open water and possible expansion for the fishery in the future. These factors may combine to potentially reduce food for pack ice seals. Therefore, high uncertainty in krill and seal stock trends and in their environmental drivers call for a precautionary management of the krill fishery, in the absence of sur- vey data to support management based on specific conservation objectives for pack-ice seals. Ó 2012 Elsevier Ltd. All rights reserved. 1. Introduction Antarctic krill (Euphausia superba) is most abundant in the Sco- tia Sea, Antarctic Peninsula and Western Weddell Sea regions where more than half of the world’s biomass is thought to be pres- ent (Atkinson et al., 2009). It is a keystone species that sustains millions of predators, and a fishery that operates almost exclu- sively in this area but is currently thought to under-exploit the po- tential yield of the stock (Nicol et al., 2011). Increasing habitat deterioration, ecosystem fluctuation and new fishing practices combine to create a high level of uncertainty that needs to be incorporated within fisheries management. In this region, a spe- cific management objective is to prevent irreversible declines in krill-dependent predators and this includes the crabeater seals (Lobodon carcinophaga). In the Scotia Sea–Weddell Sea region, pack-ice seals and specifically crabeater seals have been identified as the major krill consumers (CCAMLR, 2008); over 90% of crabeater seals’ diet is estimated to be krill. Krill is also important for leopard seals (Hydrurga leptonyx), but may be less important for Weddell (Leptonychotes weddelli) and Ross seals (Ommatophoca rossii)(Laws, 1984; Øristland, 1977; Siniff and Stone, 1985). In recent decades, rapid environmental change (Meredith and King, 2005; Parkinson, 2004; Stammerjohn et al., 2008;Whitehouse et al., 2008) is having a significant effect on some populations of different krill predators (Ducklow et al., 2007; Forcada et al., 2006, 2008; Fraser and Hof- mann, 2003; Trivelpece et al., 2011). For pack-ice seals, climate change leads to sea ice loss, which reduces suitable breeding and resting habitat. Sea ice also affords protection from predators (Siniff et al., 2008; Costa et al., 2010), and its loss also increases the dis- tance to areas that concentrate prey (Burns et al., 2004; Southwell et al., 2005). Sea ice loss has also been associated with declines in krill biomass (Atkinson et al., 2004), particularly in the West Antarctic Peninsula region, where predator responses to regional 0006-3207/$ - see front matter Ó 2012 Elsevier Ltd. All rights reserved. http://dx.doi.org/10.1016/j.biocon.2012.02.002 ⇑ Corresponding author. Tel.: +44 (0)1223 221326; fax: +44 (0)1223 221259. E-mail address: [email protected] (J. Forcada). Biological Conservation 149 (2012) 40–50 Contents lists available at SciVerse ScienceDirect Biological Conservation journal homepage: www.elsevier.com/locate/biocon

Welcome message from author
This document is posted to help you gain knowledge. Please leave a comment to let me know what you think about it! Share it to your friends and learn new things together.
Transcript
Biological Conservation 149 (2012) 40–50
Contents lists available at SciVerse ScienceDirect
Biological Conservation
journal homepage: www.elsevier .com/locate /b iocon
Responses of Antarctic pack-ice seals to environmental change and increasingkrill fishing
Jaume Forcada a,⇑, Philip N. Trathan a, Peter L. Boveng b, Ian L. Boyd c, Jennifer M. Burns d,Daniel P. Costa e, Michael Fedak c, Tracey L. Rogers f, Colin J. Southwell g
a British Antarctic Survey, Natural Environment Research Council, Madingley Road, Cambridge CB3 0ET, UKb National Marine Mammal Laboratory, Alaska Fisheries Science Center, National Marine Fisheries Service, NOAA, 7600 Sand Point Way NE, Seattle, WA 98115, USAc Sea Mammal Research Unit, Scottish Oceans Institute, University of St. Andrews, St. Andrews KY16 8LB, UKd Department of Biological Sciences, University of Alaska, Anchorage, AK 99508, USAe Long Marine Laboratory, University of California, 100 Shaffer Road, Santa Cruz, CA 95060, USAf Evolution and Ecology Research Centre, School of BEES, University of New South Wales, Australiag Australian Antarctic Division, Department of Environment, Water, Heritage and the Arts, 203 Channel Highway, Kingston, Tasmania 7050, Australia
a r t i c l e i n f o
Article history:Received 11 October 2011Received in revised form 23 January 2012Accepted 1 February 2012Available online 6 April 2012
Keywords:Antarctic pack-ice sealsClimate changeFisheries managementHabitat changeKrillUncertainty
0006-3207/$ - see front matter � 2012 Elsevier Ltd. Ahttp://dx.doi.org/10.1016/j.biocon.2012.02.002
⇑ Corresponding author. Tel.: +44 (0)1223 221326;E-mail address: [email protected] (J. Forcada).
a b s t r a c t
The compound effects of changing habitats, ecosystem interactions, and fishing practices have implica-tions for the management of Antarctic krill and conservation of its predators. For Antarctic pack-ice seals,an important group of krill predators, we estimate the density and krill consumption in the West AntarcticPeninsula (WAP)–Western Weddell Sea area, the main fishery region; and we consider long-term changesin suitable pack-ice habitat, increased fishing pressure and potential krill declines based upon predictionsfrom declines in sea ice cover. More than 3 million crabeater seals consumed over 12 million tonnes of krilleach year. This was approximately 17% of the krill standing stock. The highest densities of pack ice sealswhere found in the WAP, including in its small-scale fishery management areas, where apparently suitableseal habitat has declined by 21–28% over a 30 year period, where krill density is likely to have declined,and fishing has increased. The highest seal density was found in the Marguerite Bay area which is a sourceof krill for the Antarctic Peninsula and elsewhere. Significant sea-ice loss since 1979 has already occurred,leading to open water and possible expansion for the fishery in the future. These factors may combine topotentially reduce food for pack ice seals. Therefore, high uncertainty in krill and seal stock trends and intheir environmental drivers call for a precautionary management of the krill fishery, in the absence of sur-vey data to support management based on specific conservation objectives for pack-ice seals.
� 2012 Elsevier Ltd. All rights reserved.
1. Introduction
Antarctic krill (Euphausia superba) is most abundant in the Sco-tia Sea, Antarctic Peninsula and Western Weddell Sea regionswhere more than half of the world’s biomass is thought to be pres-ent (Atkinson et al., 2009). It is a keystone species that sustainsmillions of predators, and a fishery that operates almost exclu-sively in this area but is currently thought to under-exploit the po-tential yield of the stock (Nicol et al., 2011). Increasing habitatdeterioration, ecosystem fluctuation and new fishing practicescombine to create a high level of uncertainty that needs to beincorporated within fisheries management. In this region, a spe-cific management objective is to prevent irreversible declines inkrill-dependent predators and this includes the crabeater seals(Lobodon carcinophaga).
ll rights reserved.
fax: +44 (0)1223 221259.
In the Scotia Sea–Weddell Sea region, pack-ice seals andspecifically crabeater seals have been identified as the major krillconsumers (CCAMLR, 2008); over 90% of crabeater seals’ diet isestimated to be krill. Krill is also important for leopard seals(Hydrurga leptonyx), but may be less important for Weddell(Leptonychotes weddelli) and Ross seals (Ommatophoca rossii) (Laws,1984; Øristland, 1977; Siniff and Stone, 1985). In recent decades,rapid environmental change (Meredith and King, 2005; Parkinson,2004; Stammerjohn et al., 2008;Whitehouse et al., 2008) is havinga significant effect on some populations of different krill predators(Ducklow et al., 2007; Forcada et al., 2006, 2008; Fraser and Hof-mann, 2003; Trivelpece et al., 2011). For pack-ice seals, climatechange leads to sea ice loss, which reduces suitable breeding andresting habitat. Sea ice also affords protection from predators (Siniffet al., 2008; Costa et al., 2010), and its loss also increases the dis-tance to areas that concentrate prey (Burns et al., 2004; Southwellet al., 2005). Sea ice loss has also been associated with declines inkrill biomass (Atkinson et al., 2004), particularly in the WestAntarctic Peninsula region, where predator responses to regional
J. Forcada et al. / Biological Conservation 149 (2012) 40–50 41
warming over recent decades suggest a less predictable krill supply(Fraser and Hofmann, 2003; Trivelpece et al., 2011).
The loss of winter sea ice in the Antarctic Peninsula has also al-lowed a temporal and geographical expansion of the krill fishery,coupled with new markets and technologies (Kawaguchi et al.,2009; Nicol et al., 2011). Consequently, total catches and catchrates per vessel have increased significantly over the last decade(CCAMLR, 2011; Nicol et al., 2011), especially in FAO managementArea 48.1 which includes parts of the Scotia Sea, the Western Wed-dell Sea (WWS), and the WAP (Fig. 1). Even though current fishingis thought to be sustainable, because catches are extracted mainlyfrom coastal areas where predators have a limited capacity to shiftdistribution in response to local depletion by a fishery (Trivelpeceet al., 2011), there are concerns about the effects of the fishery onkrill populations and krill predators (e.g. Schiermeier, 2010). Whilea procedure for small-scale area management has been advocated(Hewitt et al., 2004), it does not take into account uncertainty asso-ciated with observed sea ice loss or a potentially declining krill bio-mass and the consequences for predators.
In this paper we consider the consequences of climate changeand increased krill fishing for Antarctic pack-ice seals. We: (1) re-port the density of pack-ice seals in the WAP–WWS area in relationto the sea-ice environment, at a resolution compatible with thekrill fishery small scale management areas; (2) address the long-term change, from 1979 to 2011, in suitable pack-ice seal habitat;(3) relate estimated krill consumption of pack-ice seals to availablebiomass, as estimated in a synoptic survey in 2000, and commer-cial extraction in Area 48.1; and (4) address the regional sensitivityof pack-ice seals to trends in the physical-biological environmentand the fishery operation.
2. Materials and methods
2.1. Study area and data collection
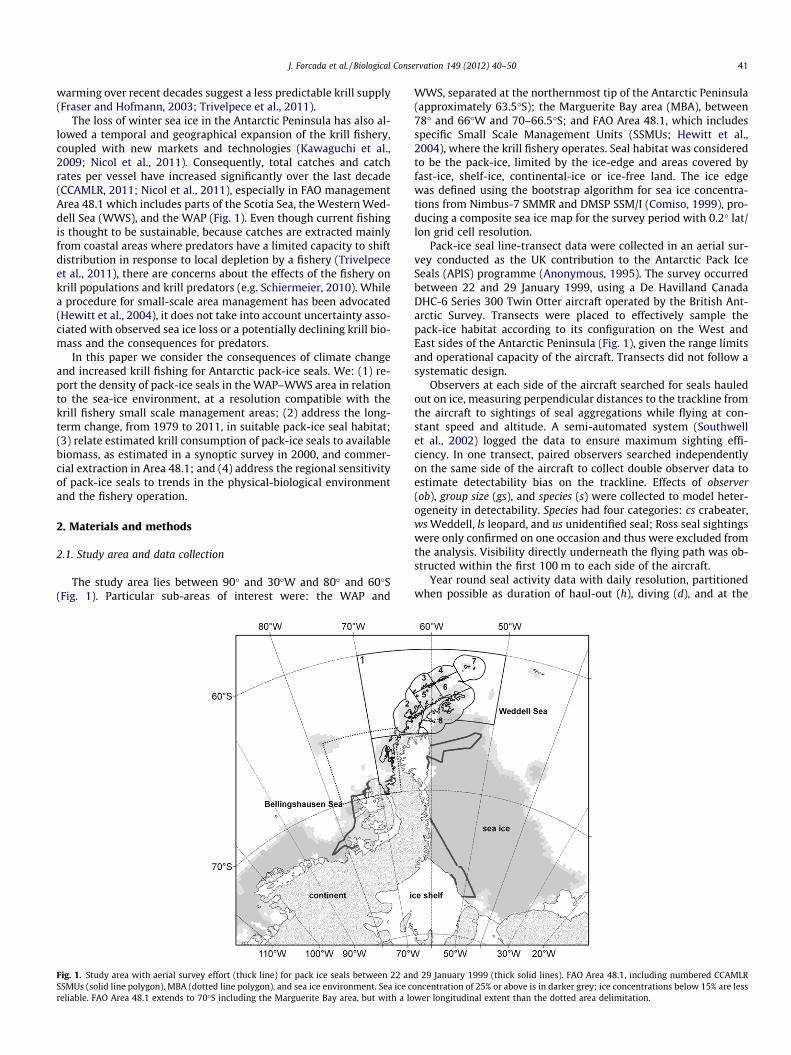
The study area lies between 90� and 30�W and 80� and 60�S(Fig. 1). Particular sub-areas of interest were: the WAP and
Fig. 1. Study area with aerial survey effort (thick line) for pack ice seals between 22 anSSMUs (solid line polygon), MBA (dotted line polygon), and sea ice environment. Sea ice creliable. FAO Area 48.1 extends to 70�S including the Marguerite Bay area, but with a lo
WWS, separated at the northernmost tip of the Antarctic Peninsula(approximately 63.5�S); the Marguerite Bay area (MBA), between78� and 66�W and 70–66.5�S; and FAO Area 48.1, which includesspecific Small Scale Management Units (SSMUs; Hewitt et al.,2004), where the krill fishery operates. Seal habitat was consideredto be the pack-ice, limited by the ice-edge and areas covered byfast-ice, shelf-ice, continental-ice or ice-free land. The ice edgewas defined using the bootstrap algorithm for sea ice concentra-tions from Nimbus-7 SMMR and DMSP SSM/I (Comiso, 1999), pro-ducing a composite sea ice map for the survey period with 0.2� lat/lon grid cell resolution.
Pack-ice seal line-transect data were collected in an aerial sur-vey conducted as the UK contribution to the Antarctic Pack IceSeals (APIS) programme (Anonymous, 1995). The survey occurredbetween 22 and 29 January 1999, using a De Havilland CanadaDHC-6 Series 300 Twin Otter aircraft operated by the British Ant-arctic Survey. Transects were placed to effectively sample thepack-ice habitat according to its configuration on the West andEast sides of the Antarctic Peninsula (Fig. 1), given the range limitsand operational capacity of the aircraft. Transects did not follow asystematic design.
Observers at each side of the aircraft searched for seals hauledout on ice, measuring perpendicular distances to the trackline fromthe aircraft to sightings of seal aggregations while flying at con-stant speed and altitude. A semi-automated system (Southwellet al., 2002) logged the data to ensure maximum sighting effi-ciency. In one transect, paired observers searched independentlyon the same side of the aircraft to collect double observer data toestimate detectability bias on the trackline. Effects of observer(ob), group size (gs), and species (s) were collected to model heter-ogeneity in detectability. Species had four categories: cs crabeater,ws Weddell, ls leopard, and us unidentified seal; Ross seal sightingswere only confirmed on one occasion and thus were excluded fromthe analysis. Visibility directly underneath the flying path was ob-structed within the first 100 m to each side of the aircraft.
Year round seal activity data with daily resolution, partitionedwhen possible as duration of haul-out (h), diving (d), and at the
d 29 January 1999 (thick solid lines). FAO Area 48.1, including numbered CCAMLRoncentration of 25% or above is in darker grey; ice concentrations below 15% are lesswer longitudinal extent than the dotted area delimitation.
42 J. Forcada et al. / Biological Conservation 149 (2012) 40–50
surface (o), were collected to model haul out probability to correcton-ice abundance estimates, and activity budgets to model sealbioenergetics. Satellite-linked dive recorders (SDRs) and satelliterelay data loggers (SRDLs) were attached to seals in different re-search projects: SRDL data from 34 crabeater seals in the Margue-rite Bay area in 2001 and 2002 (Burns et al., 2004; Costa et al.,2010); SDR data from 24 crabeater seals from East Antarctica(Southwell, 2005); and SDR data from 11 leopard seals in East Ant-arctica (Southwell et al., 2008b; Rogers et al., 2005). SRDL datafrom 9 Weddell seals were collected during research cruises ofthe MBA (Costa et al., 2010) and central Southern Weddell Sea in2007 (Nicholls et al., 2008).
2.2. Spatial density and abundance analysis
We estimated absolute seal density and abundance with thecount method for line transect data (Hedley and Buckland, 2004).Transects were divided into approximately 5-km long segmentsand in the ith segment, the number of seals of species s ns
i wasPjn
sij
.ðps
ijhsijÞ, where ns
ij is the number of hauled out seals in groupj of segment i; ps
ij is the probability of detecting hauled-out sealswithin 900 m of the centre of the segment; and hs
ij is the haul-out probability at a specific time and day of the year.
Perpendicular sighting distances (x) were truncated to the range100–900 m, and ps
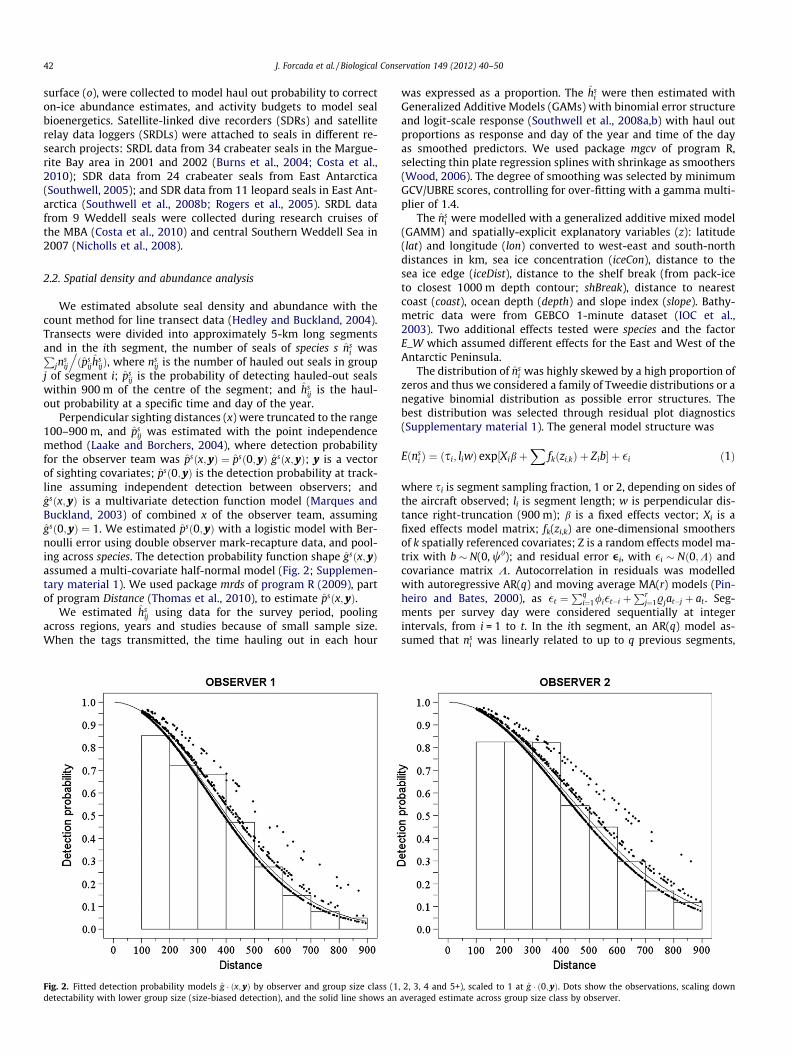
ij was estimated with the point independencemethod (Laake and Borchers, 2004), where detection probabilityfor the observer team was psðx; yÞ ¼ psð0; yÞ gsðx; yÞ; y is a vectorof sighting covariates; psð0; yÞ is the detection probability at track-line assuming independent detection between observers; andgsðx; yÞ is a multivariate detection function model (Marques andBuckland, 2003) of combined x of the observer team, assuminggsð0; yÞ ¼ 1. We estimated psð0; yÞ with a logistic model with Ber-noulli error using double observer mark-recapture data, and pool-ing across species. The detection probability function shape gsðx; yÞassumed a multi-covariate half-normal model (Fig. 2; Supplemen-tary material 1). We used package mrds of program R (2009), partof program Distance (Thomas et al., 2010), to estimate psðx; yÞ.
We estimated hsij using data for the survey period, pooling
across regions, years and studies because of small sample size.When the tags transmitted, the time hauling out in each hour
Fig. 2. Fitted detection probability models g � ðx; yÞ by observer and group size class (1detectability with lower group size (size-biased detection), and the solid line shows an
was expressed as a proportion. The hsi were then estimated with
Generalized Additive Models (GAMs) with binomial error structureand logit-scale response (Southwell et al., 2008a,b) with haul outproportions as response and day of the year and time of the dayas smoothed predictors. We used package mgcv of program R,selecting thin plate regression splines with shrinkage as smoothers(Wood, 2006). The degree of smoothing was selected by minimumGCV/UBRE scores, controlling for over-fitting with a gamma multi-plier of 1.4.
The nsi were modelled with a generalized additive mixed model
(GAMM) and spatially-explicit explanatory variables (z): latitude(lat) and longitude (lon) converted to west-east and south-northdistances in km, sea ice concentration (iceCon), distance to thesea ice edge (iceDist), distance to the shelf break (from pack-iceto closest 1000 m depth contour; shBreak), distance to nearestcoast (coast), ocean depth (depth) and slope index (slope). Bathy-metric data were from GEBCO 1-minute dataset (IOC et al.,2003). Two additional effects tested were species and the factorE_W which assumed different effects for the East and West of theAntarctic Peninsula.
The distribution of nsi was highly skewed by a high proportion of
zeros and thus we considered a family of Tweedie distributions or anegative binomial distribution as possible error structures. Thebest distribution was selected through residual plot diagnostics(Supplementary material 1). The general model structure was
Eðnsi Þ ¼ ðsi; liwÞ exp½Xibþ
Xfkðzi;kÞ þ Zib� þ �i ð1Þ
where si is segment sampling fraction, 1 or 2, depending on sides ofthe aircraft observed; li is segment length; w is perpendicular dis-tance right-truncation (900 m); b is a fixed effects vector; Xi is afixed effects model matrix; fk(zi,k) are one-dimensional smoothersof k spatially referenced covariates; Z is a random effects model ma-trix with b � N(0, wh); and residual error ei, with �i � Nð0;KÞ andcovariance matrix K. Autocorrelation in residuals was modelledwith autoregressive AR(q) and moving average MA(r) models (Pin-heiro and Bates, 2000), as �t ¼
Pqi¼1/i�t�i þ
Prj¼1.jat�j þ at . Seg-
ments per survey day were considered sequentially at integerintervals, from i = 1 to t. In the ith segment, an AR(q) model as-sumed that ns
i was linearly related to up to q previous segments,
, 2, 3, 4 and 5+), scaled to 1 at g � ð0; yÞ. Dots show the observations, scaling downaveraged estimate across group size class by observer.

J. Forcada et al. / Biological Conservation 149 (2012) 40–50 43
and a MA(r) model assumed that the nsi more than r segments apart
were uncorrelated.We used covariate correlation plots and PCA (Supplementary
material 1) to examine spatial covariances, and explored GAMsexcluding combinations of highly correlated covariates for compet-itive model structures. Covariates retained decreased the GCVscore and increased the amount of deviance explained by 1–2%at least. Then, comparable GAMMs, selected with AIC, BIC andautocorrelation plots, were fitted to predict Eðns
i Þ, apportioningunidentified seals by segment Eðnus
i Þ as Eðnsi Þ� ¼ Eðns
i Þþ
Eðnusi Þ
EðnsiÞP
k¼sEðns
iÞ
� �.
Abundance was obtained integrating a density surface pre-dicted with the best GAMM over the pack-ice habitat for areas ofinterest: total pack-ice area (90–30�W and 60–80�S), WAP, WWS,MBA, FAO 48.1, and CCAMLR-SSMUs (Fig. 1).
We estimated variability with a nonparametric bootstrap. Ateach of 999 bootstraps, we combined: a sample with replacementof the entire haul-out records of each seal to obtain hs
ij; a movingblocks sample with replacement (Davison and Hinkley, 1997) ofsegments with double observer data to estimate pð0; yÞ; and amoving blocks sample with replacement of all transects to esti-mate psðx; yÞ and derived parameters. Sampling blocks comprisedfive contiguous segments, approximately 25 km of effort, thus pre-serving the original autocorrelation within survey day. With eachbootstrap a new GAMM was fitted to predict abundance, and con-fidence intervals were obtained with the percentile method.
2.3. Suitable seal habitat analysis
We used a presence-absence model corrected for detectabilitybias as response variable and environmental predictors to investi-gate suitable seal habitat. The Eðns
i Þ were transformed into 1 and 0for segments with and without seals. We used a GAM with a bino-mial error structure allowing for extra-binomial variation, and lo-git-scale response. Model selection followed the same procedureas above. The GAM predicted suitable pack-ice seal habitat basedupon sea ice concentration and cover measured with the satelliterecord (1979–2011), and the habitat selection model of observedsea ice concentration and cover at the time of the survey as predic-tors of seal habitat. We bootstrapped the data as above to estimatevariability. At each bootstrap replicate total suitable habitat waspredicted for the time series, and simple linear and non-linear(GAM) regression models were fitted to investigate long termtrends.
2.4. Krill consumption by pack-ice seals
Krill consumption over a year was modelled with a bioenergeticscheme for phocids (Worthy, 2001) modified as in Forcada et al.(2009) for crabeater, Weddell and leopard seals (Supplementarymaterial 2). Daily ingested energy (Ie) depended on energy require-ments (ej), and processing costs including digestive efficiency (de),urinary loss (ue), and heat increment of feeding (hi). This was ex-pressed as Ie ¼
Pjej½1� ð1� deÞð1� ueÞ � Ijhi��1, where energy
requirements for growth (eg), reproduction (er), resting at haul-out (eh), diving (ed), and other activity (eo) depended on age, bodymass (bm) and sex. Ij was an indicator variable with value 1 ifrequirement r did not account for hi, and 0 otherwise.
Growth energy eg depended on the expected increment of bm atage, with age classes selected according to best available bm at agedata, which corresponded to ages 0–25, 0–18, and 0–12 for cra-beater, Weddell and leopard seals respectively; the highest classesaggregated ages from that value and above (Supplementary mate-rial 2). The interannual bm increment was used to estimate annual
balance in total body gross energy (tbge; Reilly and Fedak, 1991),assuming isometric growth for lipid, protein, and total body water(tbw) increment.
An annual activity cycle for crabeater and Weddell seals withdaily resolution was obtained combining available SDR/SRDL data,aggregating daily activity into times spent hauling out (h), diving(d), and cruising (o). A multinomial logit model estimated the dailyproportion of time at each activity, with a factor with a level foreach activity grouping multinomial observations. We fitted a Pois-son GAM with log-scale response (h, d or o), and as predictors theactivity factor and a smooth of day of the year by each factor level.The GAM predicted daily h, d and o, which were scaled to sum to 1.Variance was obtained by bootstrapping with replacement the en-tire records of instrumented seals. For leopard seals, tracking datawere very limited and we combined published results in Kuhnet al. (2006) with SDR data from Southwell et al. (2008b) to providean annually averaged estimate of h, the complement of which wastime spent diving and cruising combined.
The er in females included production of foetal tissue (pup atbirth and placenta), predicted pregnancy energy increment usingBrody’s (1945) model for mammals, 18.48 bm1.2, and lactationcosts. Costs of activity were selected as multipliers of basal meta-bolic rate (bmr) from Kleiber’s equation (1961), derived from dataon Weddell seals (Castellini et al., 1992) (Supplementary material2).
In what follows, scalars are in italics, in bold and lowercase arecolumn vectors, and in bold and uppercase are matrices. Super-script T stands for transpose and products are scalar except for ma-trix Hadamart product (�).
Annual energy requirements by age of females and males were
eF ¼ ½ðehhT þ eddT þ eooT þ fer þ EgÞ � S�I ð2Þ
and
eM ¼ ½ðehhT þ eddT þ eooT þ EgÞ � S�I ð3Þ
where eh, ed, and eo are age class vectors of costs of hauling out, div-ing and other activity; h, d, and o are vectors of daily predictedactivity budgets; f is a vector of fertility at age; er is a vector of dailyreproductive costs; Eg is a matrix of daily growth costs by age; S is amatrix of daily survival rate by age; and I is column vector of onesand size 365, representing each day of the year.
Ingested energy IeF in females (similarly for males, IeM) wasIeF ¼ eF ½1� ð1� deÞð1� ueÞ � hi��1, where ue was 0.08(SD = 0.009) and hi was 0.16 (SE = 0.01) (Worthy, 2001), and krillde was 0.84 (SE = 0.002) (Mårtensson et al., 1994). Per capita krillconsumption for females (kF) and males (kM) at age waskF ¼ ieF
kdke. The proportion of krill in the diet (kd) was selected as
0.95 (SE = 0.048) for crabeater seals, 0.01 (SD = 0.001) for Weddellseals, and 0.40 (SD = 0. 04) for leopard seals (Laws, 1984; Øristland,1977; Siniff and Stone, 1985; BAS, unpublished). Mean krill energy(ke) was 3.7 MJ kg�1 (SE = 0.36) (Clarke, 1980).
Annual estimated krill consumption ðckcÞwas ½srkF þ ð1� srÞkM�ðnwÞ, where sr is the sex ratio, assumed to be 0.5; n is the abun-dance of seals; and w is the stable age structure vector scaled tosum 1. We obtained w using survival and fecundity rates (Supple-mentary material 2) transformed into fertilities for a post-breedingcensus, in a matrix population model of equal dimensions as themaximum age class for each species. With it we obtained the stableage structure (w) as the right eigenvector (w1) associated to thedominant eigenvalue (k1) (Caswell, 2001).
This Monte Carlo model produced krill consumption estimatesfor pack-ice seals in different areas, assuming that seal and krillstocks were geographically closed because there were no compre-hensive data on seasonal movements of either group. In the MBA,however, we allowed for inter and intra-annual variation (2001–
44 J. Forcada et al. / Biological Conservation 149 (2012) 40–50
2002) in krill density. All estimates were obtained by combiningthe empirical results from the abundance and activity analyseswith estimates of other parameters using 100,000 simulations(Supplementary material 2).
We generated log-normal krill density deviates by area accord-ing to published density estimates for the MBA (Lawson et al.,2008), and for the Scotia Sea and Antarctic Peninsula in 2000(Fielding et al., 2011) at a spatial resolution of the coastal SSMUsin FAO Area 48.1. Krill densities were used to address seal demandswith the uncertainty associated to these levels of resolution, and incomparison with standing stock estimates and reported catches(CCAMLR, 2011).
3. Results
3.1. Pack-ice seal survey
Total survey effort with optimum visibility was 2809 km ofwhich 903 were in the WAP and 1906 in the WWS. It was orga-nized in 561 segments, 178 in the WAP and 383 in the WWS. Thiscorresponded to a prospected area of 24,658 km2, which was 2.1%of the total area, of which 7484 km2 was in the WAP (4.4% of WAP)and 17 174 km2 in the WWS (1.7% of WWS). Total seal groupsightings on effort were 2521, 1648 in WAP and 873 in WWS.The majority of the sightings were identified as crabeater seals(Table 1), with Ross seals only identified in one occasion.
3.1.1. Detection probabilityModel selection of p ðx; yÞ components is summarized in Sup-
plementary material 1. Species effects were discarded becauseleopard seals were only detected on 13 occasions, and unidentifiedseals were detected at distances of 200 m and beyond, precludingaccurate and monotonically decreasing models. The transect with adouble observer platform was 170.5 km long and produced 291sightings, of which 213 were by the 1st observer, 224 by the 2ndand 146 by both. Models of p ð0; yÞ retained observer effects, andthe mean p1ð0Þ was estimated as 0.681 (95% CI: 0.583–0.779),the mean p2ð0Þ as 0.866 (0.804–0.929), and a combined p ð0Þ as0.951 (0.941–0.956). The best model for g ðx; yÞ included observerand group size effects, accounting for size-biased detection in bothobservers (Fig. 2). Observer 1 detected more groups than observer 2(1323 vs. 1198), but observer 2 detected more groups of sizes 3 andabove. Mean �g ðx; yÞ was estimated as 0.400 (0.384–0.416). Com-bining p ð0Þ and g ðx; yÞ, mean �p ðx; yÞwas 0.382 (0.354–0.420). Biascorrected estimates of expected mean group size were obtainedwith these models (Table 1); the sizes of detected crabeater sealgroups ranged from 1 to 17, of Weddell seals from 1 to 10, andall leopard seals were detected as individuals. Regional differencesby species were non-significant.
Most of the survey was conducted between 11:00 and 17:00,which corresponded to a mean haul-out probability ð�hÞ of 0.640
Table 1Numbers of seal groups sighted, by species and region with estimated bias-correctedmean group size Eðcgss Þ, and 95% bootstrap confidence intervals in parentheses.
West AntarcticPeninsula
WesternWeddell Sea
All regions
Crabeater seal 1 338 612 1 9501.71 (1.55–1.89) 1.52 (1.33–1.75) 1.65 (1.51–1.79)
Weddell seal 166 134 3001.36 (1.10–1.69) 1.21 (1.06–1.39) 1.29 (1.13–1.48)
Leopard seal 5 8 131 1 1
Unidentified seal 136 122 2581.21 (1.10–1.37) 1.12 (1.06–1.19) 1.17 (1.10–1.26)
(0.409–0.872) for crabeater seals, 0.648 (0.572–0.725) for Weddellseals, and 0.590 (0.567–0.612) for leopard seals.
3.1.2. Spatial models and pack-ice seal absolute density andabundance
The wide latitudinal and narrow longitudinal configuration ofthe Antarctic Peninsula caused strong correlations between latand lon, and between lat, lon and coast, depth and shBreak. ThePCA (Supplementary material 1) produced a first component withlocation and topographic variables explaining 45% of the varianceamong segments, and a second (22%) and a third (15%) compo-nents with the highest correlations with sea ice variables. This sup-ported a stratification of effort by sub-regions, with subsequentmodels of seal density including E_W, shBreak, lat, lon and icevariables.
GAMs with a Tweedie error distribution and c = 1.2 providedthe best fit, with most of the deviance explained by species andE_W (Supplementary material 1; Fig. S1.5 and Table S1.5). The bestGAMs, with lowest GCV and AIC, included species, the interaction ofspecies and E_W and either shBreak, or lon and lat. Both options ex-plained approximately 68% of the deviance and had comparableAIC, but the non-uniform distribution of survey effort preventedthe effective use of lat-lon two-dimensional smooths for predic-tion. Because lon had a highly variable smoother plot and effectscomparable to E_W we retained models with shBreak instead.
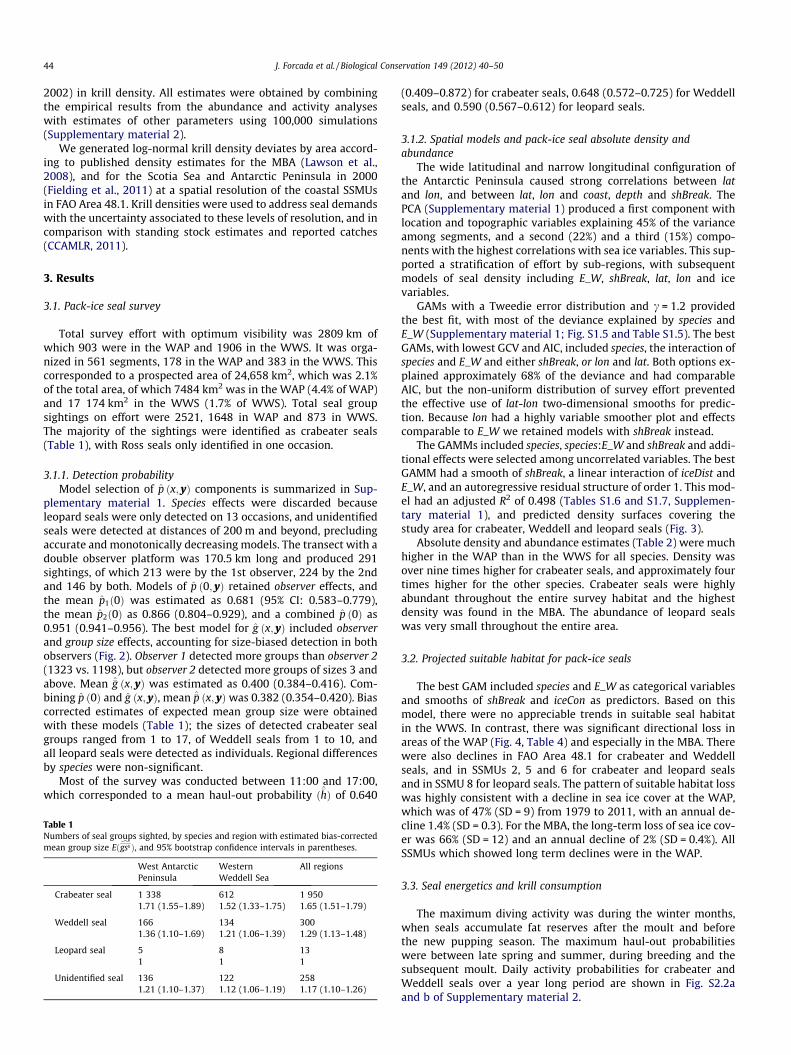
The GAMMs included species, species:E_W and shBreak and addi-tional effects were selected among uncorrelated variables. The bestGAMM had a smooth of shBreak, a linear interaction of iceDist andE_W, and an autoregressive residual structure of order 1. This mod-el had an adjusted R2 of 0.498 (Tables S1.6 and S1.7, Supplemen-tary material 1), and predicted density surfaces covering thestudy area for crabeater, Weddell and leopard seals (Fig. 3).
Absolute density and abundance estimates (Table 2) were muchhigher in the WAP than in the WWS for all species. Density wasover nine times higher for crabeater seals, and approximately fourtimes higher for the other species. Crabeater seals were highlyabundant throughout the entire survey habitat and the highestdensity was found in the MBA. The abundance of leopard sealswas very small throughout the entire area.
3.2. Projected suitable habitat for pack-ice seals
The best GAM included species and E_W as categorical variablesand smooths of shBreak and iceCon as predictors. Based on thismodel, there were no appreciable trends in suitable seal habitatin the WWS. In contrast, there was significant directional loss inareas of the WAP (Fig. 4, Table 4) and especially in the MBA. Therewere also declines in FAO Area 48.1 for crabeater and Weddellseals, and in SSMUs 2, 5 and 6 for crabeater and leopard sealsand in SSMU 8 for leopard seals. The pattern of suitable habitat losswas highly consistent with a decline in sea ice cover at the WAP,which was of 47% (SD = 9) from 1979 to 2011, with an annual de-cline 1.4% (SD = 0.3). For the MBA, the long-term loss of sea ice cov-er was 66% (SD = 12) and an annual decline of 2% (SD = 0.4%). AllSSMUs which showed long term declines were in the WAP.
3.3. Seal energetics and krill consumption
The maximum diving activity was during the winter months,when seals accumulate fat reserves after the moult and beforethe new pupping season. The maximum haul-out probabilitieswere between late spring and summer, during breeding and thesubsequent moult. Daily activity probabilities for crabeater andWeddell seals over a year long period are shown in Fig. S2.2aand b of Supplementary material 2.
Fig. 3. Predicted spatial density surfaces for crabeater (CBE), Weddell (WED) and leopard (LPD) seals using the best GAMM. Densities are in seals per km2. Prediction islimited to the satellite sea ice habitat as defined by the bootstrap algorithm and within the limits of study area.
Table 2Density and abundance for crabeater, Weddell and leopard seals in the study areas. Density for seals/km2 of pack-ice area is shown in the top line of each cell and absoluteabundance underneath, with CV and 95% bootstrap confidence intervals in parentheses. The size in km2 of the polygons (excluding land) defining specific study areas is providedunder the area name, and estimates correspond to the pack-ice area within the polygons. Areas without pack-ice habitat and survey effort at the time of the survey are markedwith symbol ‘–’.
Region Crabeater seal Weddell seal Leopard seal
All 2.563 (0.101; 2.132–3.120) 0.311 (0.193; 0.206–0.447) 0.011 (0.366; 0.005–0.022)3,042,581 (0.101; 2,530,617–3,703,918) 369,174 (0.193; 244,961–530,818) 13,408 (0.366; 5646–25,162)
WAP 10.984 (0.156; 7.967–14.706) 0.897 (0.364; 0.387–1.650) 0.031 (0.408; 0.011–0.063)1,858,201 (0.156; 1,347,730–2,487,783) 151,702 (0.364; 65,515–279,028) 5279 (0.408; 1781–10,556)
WWS 1.163 (0.133; 0.914–1.510) 0.214 (0.196; 0.142–0.303) 0.008 (0.555; 0.001–0.019)1,184,380 (0.133; 930,009–1,537,062) 217,472 (0.196; 144,832–309,279) 8130 (0.555; 1376–19,033)
MBA 13.837 (0.228; 8.428–20.258) 1.130 (0.411; 0.442–2.251) 0.039 (0.441; 0.013–0.082)249694 373,132 (0.228; 227,262–54,627) 30,462 (0.411; 11,915–60,702) 1060 (0.441; 348–2209)
FAO 48.1 5.329 (0.186; 3.641–7.452) 0.514 (0.304; 0.277–0.891) 0.018 (0.342; 0.008–0.033)623974 317,976 (0.186; 217,263–444,622) 30,657 (0.304; 16,498–53,176) 1089 (0.342; 478–1980)
SSMU1 1.416 (0.129; 1.077–1.819) 0.230 (0.191; 0.153–0.325) 0.009 (0.485; 0.002–0.018)422076 14,429 (0.129; 10,973–18,521) 2344 (0.191; 1554–3315) 87 (0.485; 23–185)
SSMU2 14.391 (0.282; 7.353–22.409) 1.175 (0.450; 0.404–2.470) 0.041 (0.474; 0.012–0.088)35060 39,123 (0.282; 19,991–60,918) 3194 (0.450; 1099–6714) 111 (0.474; 33–239)
SSMU3 – – –15068
SSMU4 – – –15584
SSMU5 1.130 (0.174; 0.802–1.593) 0.208 (0.227; 0.132–0.304) 0.008 (0.560; 0.001–0.018)21017 1490 (0.174; 1057–2101) 274 (0.227; 174–400) 10 (0.560; 2–24)
SSMU6 14.287 (0.310; 6.512–22.650) 1.166 (0.471; 0.376–2.477) 0.041 (0.493; 0.011–0.090)27447 29,017 (0.310; 13,225–46,001) 2369 (0.471; 764–5031) 82 (0.493; 22–182)
SSMU7 – – –35322
SSMU8 1.211 (0.205; 0.857–1.812) 1.166 (0.273; 0.376–2.477) 0.008 (0.592; 0.002–0.020)58704 52,265 (0.205; 36,986–78,198) 9267 (0.273; 5697–15,024) 346 (0.592; 67–848)
J. Forcada et al. / Biological Conservation 149 (2012) 40–50 45
Limited data for leopard seals only allowed for minimum esti-mates of survival which were 0.51 (SD = 0.08), 0.74 (0.14), and0.84 (0.10) for pups, juveniles and adults respectively. In compar-ison, mean adult survival for crabeater seals was 0.93 (0.05) and0.90 (0.04) for Weddell seals. Estimates of life history rates atage for each species are shown in Fig. S2.3a–c, Supplementarymaterial 2.
The best model options and parameter estimates for bodymass at age by sex are in Fig. S2.3a–c, Supplementary material 2.The estimated population mean bm, weighted by population struc-ture, was: 175.2 (3.2) and 170.8 (5.6) kg for female and male cra-beater seals; 231.7 (10.5) and 223.6 (8.8) kg for Weddell seals;and 300.8 (14.3) and 251.1 (11.3) kg for leopard seals. Note that
mean values for adult individuals are higher than these averagesfor all species.
Daily mean energy and krill requirements were 34.2 (2.5) and30.1 (2.4) MJ day�1, and 12 (1.8) and 10.5 (1.6) kg of krill for femaleand male crabeater seals respectively; 39.3 (2.6) and 33.1(2.3) MJ day�1, and 0.145 (0.025) and 0.122 (0.021) kg of krill forfemale and male Weddell seals; and 43.2 (3.4) and 35.8(2.9) MJ day�1, and 6.4 (1.1) and 5.3 (0.9) kg of krill for femaleand male leopard seals; daily krill demands are corrected by theproportion of krill in the diet and weighted by age structure. Meanparameter values by sex and age for each species are shown inFig. S2.3a–c, Supplementary material 2. The estimated total tonsof krill consumed by area are in Table 3.
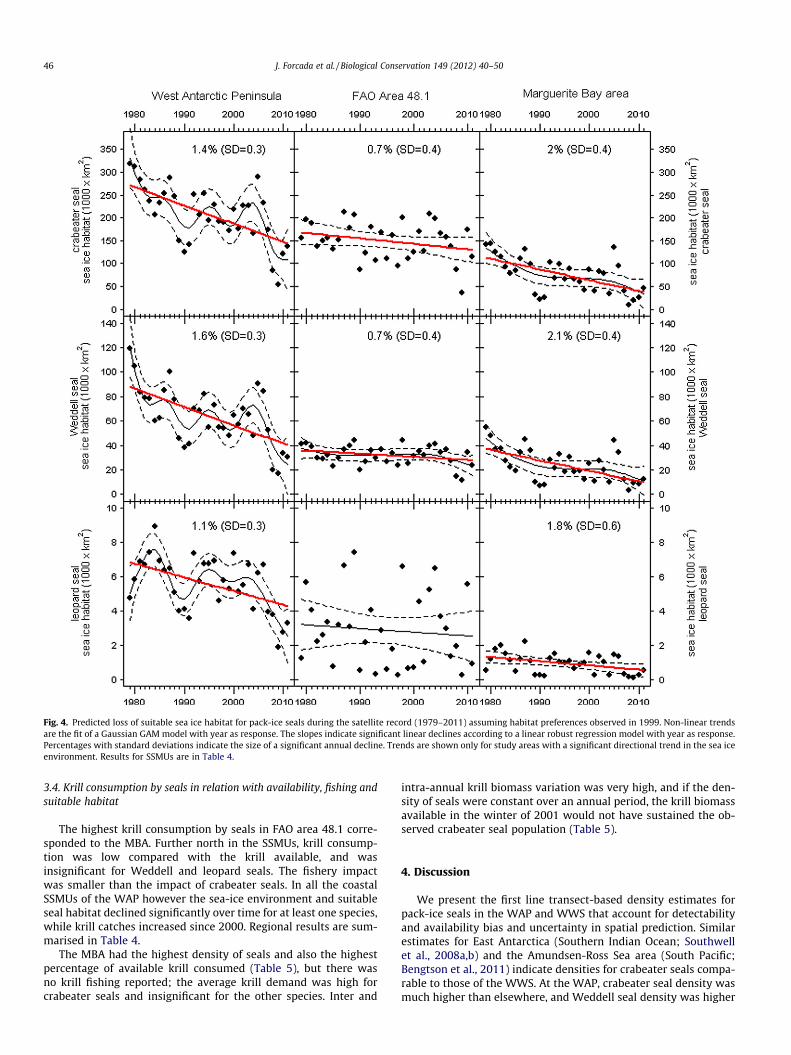
Fig. 4. Predicted loss of suitable sea ice habitat for pack-ice seals during the satellite record (1979–2011) assuming habitat preferences observed in 1999. Non-linear trendsare the fit of a Gaussian GAM model with year as response. The slopes indicate significant linear declines according to a linear robust regression model with year as response.Percentages with standard deviations indicate the size of a significant annual decline. Trends are shown only for study areas with a significant directional trend in the sea iceenvironment. Results for SSMUs are in Table 4.
46 J. Forcada et al. / Biological Conservation 149 (2012) 40–50
3.4. Krill consumption by seals in relation with availability, fishing andsuitable habitat
The highest krill consumption by seals in FAO area 48.1 corre-sponded to the MBA. Further north in the SSMUs, krill consump-tion was low compared with the krill available, and wasinsignificant for Weddell and leopard seals. The fishery impactwas smaller than the impact of crabeater seals. In all the coastalSSMUs of the WAP however the sea-ice environment and suitableseal habitat declined significantly over time for at least one species,while krill catches increased since 2000. Regional results are sum-marised in Table 4.
The MBA had the highest density of seals and also the highestpercentage of available krill consumed (Table 5), but there wasno krill fishing reported; the average krill demand was high forcrabeater seals and insignificant for the other species. Inter and
intra-annual krill biomass variation was very high, and if the den-sity of seals were constant over an annual period, the krill biomassavailable in the winter of 2001 would not have sustained the ob-served crabeater seal population (Table 5).
4. Discussion
We present the first line transect-based density estimates forpack-ice seals in the WAP and WWS that account for detectabilityand availability bias and uncertainty in spatial prediction. Similarestimates for East Antarctica (Southern Indian Ocean; Southwellet al., 2008a,b) and the Amundsen-Ross Sea area (South Pacific;Bengtson et al., 2011) indicate densities for crabeater seals compa-rable to those of the WWS. At the WAP, crabeater seal density wasmuch higher than elsewhere, and Weddell seal density was higher
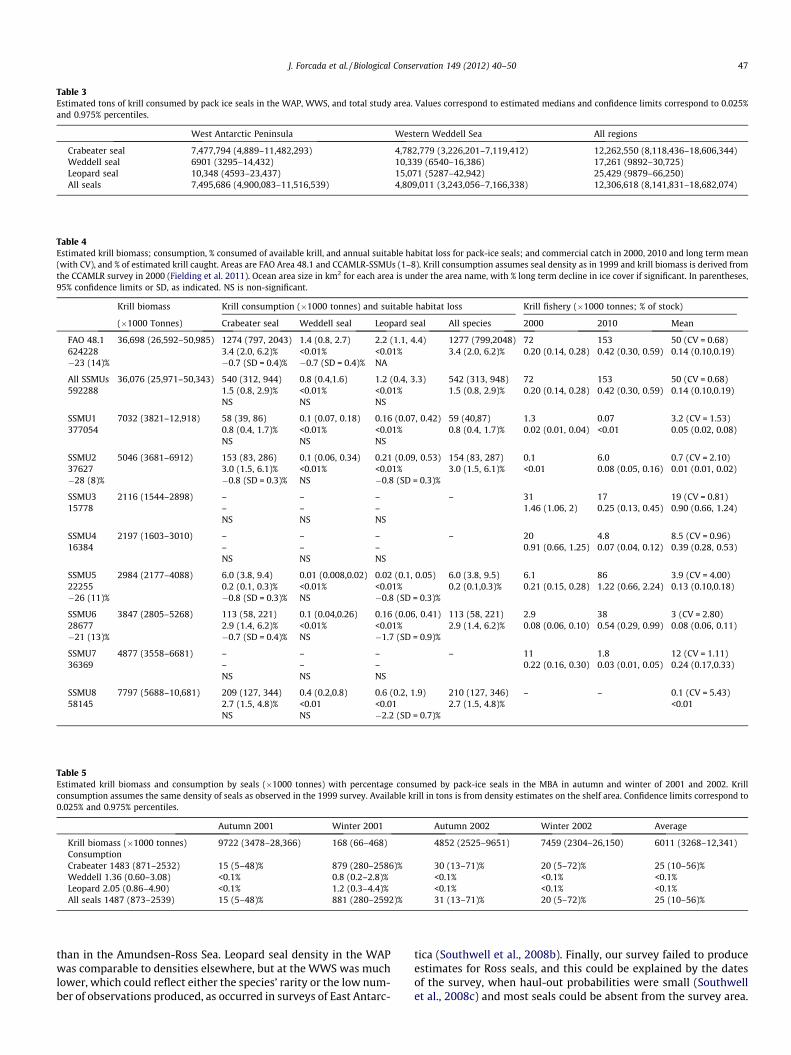
Table 3Estimated tons of krill consumed by pack ice seals in the WAP, WWS, and total study area. Values correspond to estimated medians and confidence limits correspond to 0.025%and 0.975% percentiles.
West Antarctic Peninsula Western Weddell Sea All regions
Crabeater seal 7,477,794 (4,889–11,482,293) 4,782,779 (3,226,201–7,119,412) 12,262,550 (8,118,436–18,606,344)Weddell seal 6901 (3295–14,432) 10,339 (6540–16,386) 17,261 (9892–30,725)Leopard seal 10,348 (4593–23,437) 15,071 (5287–42,942) 25,429 (9879–66,250)All seals 7,495,686 (4,900,083–11,516,539) 4,809,011 (3,243,056–7,166,338) 12,306,618 (8,141,831–18,682,074)
Table 4Estimated krill biomass; consumption, % consumed of available krill, and annual suitable habitat loss for pack-ice seals; and commercial catch in 2000, 2010 and long term mean(with CV), and % of estimated krill caught. Areas are FAO Area 48.1 and CCAMLR-SSMUs (1–8). Krill consumption assumes seal density as in 1999 and krill biomass is derived fromthe CCAMLR survey in 2000 (Fielding et al. 2011). Ocean area size in km2 for each area is under the area name, with % long term decline in ice cover if significant. In parentheses,95% confidence limits or SD, as indicated. NS is non-significant.
Krill biomass Krill consumption (�1000 tonnes) and suitable habitat loss Krill fishery (�1000 tonnes; % of stock)
(�1000 Tonnes) Crabeater seal Weddell seal Leopard seal All species 2000 2010 Mean
FAO 48.1 36,698 (26,592–50,985) 1274 (797, 2043) 1.4 (0.8, 2.7) 2.2 (1.1, 4.4) 1277 (799,2048) 72 153 50 (CV = 0.68)624228 3.4 (2.0, 6.2)% <0.01% <0.01% 3.4 (2.0, 6.2)% 0.20 (0.14, 0.28) 0.42 (0.30, 0.59) 0.14 (0.10,0.19)�23 (14)% �0.7 (SD = 0.4)% �0.7 (SD = 0.4)% NA
All SSMUs 36,076 (25,971–50,343) 540 (312, 944) 0.8 (0.4,1.6) 1.2 (0.4, 3.3) 542 (313, 948) 72 153 50 (CV = 0.68)592288 1.5 (0.8, 2.9)% <0.01% <0.01% 1.5 (0.8, 2.9)% 0.20 (0.14, 0.28) 0.42 (0.30, 0.59) 0.14 (0.10,0.19)
NS NS NS
SSMU1 7032 (3821–12,918) 58 (39, 86) 0.1 (0.07, 0.18) 0.16 (0.07, 0.42) 59 (40,87) 1.3 0.07 3.2 (CV = 1.53)377054 0.8 (0.4, 1.7)% <0.01% <0.01% 0.8 (0.4, 1.7)% 0.02 (0.01, 0.04) <0.01 0.05 (0.02, 0.08)
NS NS NS
SSMU2 5046 (3681–6912) 153 (83, 286) 0.1 (0.06, 0.34) 0.21 (0.09, 0.53) 154 (83, 287) 0.1 6.0 0.7 (CV = 2.10)37627 3.0 (1.5, 6.1)% <0.01% <0.01% 3.0 (1.5, 6.1)% <0.01 0.08 (0.05, 0.16) 0.01 (0.01, 0.02)�28 (8)% �0.8 (SD = 0.3)% NS �0.8 (SD = 0.3)%
SSMU3 2116 (1544–2898) – – – – 31 17 19 (CV = 0.81)15778 – – – 1.46 (1.06, 2) 0.25 (0.13, 0.45) 0.90 (0.66, 1.24)
NS NS NS
SSMU4 2197 (1603–3010) – – – – 20 4.8 8.5 (CV = 0.96)16384 – – – 0.91 (0.66, 1.25) 0.07 (0.04, 0.12) 0.39 (0.28, 0.53)
NS NS NS
SSMU5 2984 (2177–4088) 6.0 (3.8, 9.4) 0.01 (0.008,0.02) 0.02 (0.1, 0.05) 6.0 (3.8, 9.5) 6.1 86 3.9 (CV = 4.00)22255 0.2 (0.1, 0.3)% <0.01% <0.01% 0.2 (0.1,0.3)% 0.21 (0.15, 0.28) 1.22 (0.66, 2.24) 0.13 (0.10,0.18)�26 (11)% �0.8 (SD = 0.3)% NS �0.8 (SD = 0.3)%
SSMU6 3847 (2805–5268) 113 (58, 221) 0.1 (0.04,0.26) 0.16 (0.06, 0.41) 113 (58, 221) 2.9 38 3 (CV = 2.80)28677 2.9 (1.4, 6.2)% <0.01% <0.01% 2.9 (1.4, 6.2)% 0.08 (0.06, 0.10) 0.54 (0.29, 0.99) 0.08 (0.06, 0.11)�21 (13)% �0.7 (SD = 0.4)% NS �1.7 (SD = 0.9)%
SSMU7 4877 (3558–6681) – – – – 11 1.8 12 (CV = 1.11)36369 – – – 0.22 (0.16, 0.30) 0.03 (0.01, 0.05) 0.24 (0.17,0.33)
NS NS NS
SSMU8 7797 (5688–10,681) 209 (127, 344) 0.4 (0.2,0.8) 0.6 (0.2, 1.9) 210 (127, 346) – – 0.1 (CV = 5.43)58145 2.7 (1.5, 4.8)% <0.01 <0.01 2.7 (1.5, 4.8)% <0.01
NS NS �2.2 (SD = 0.7)%
Table 5Estimated krill biomass and consumption by seals (�1000 tonnes) with percentage consumed by pack-ice seals in the MBA in autumn and winter of 2001 and 2002. Krillconsumption assumes the same density of seals as observed in the 1999 survey. Available krill in tons is from density estimates on the shelf area. Confidence limits correspond to0.025% and 0.975% percentiles.
Autumn 2001 Winter 2001 Autumn 2002 Winter 2002 Average
Krill biomass (�1000 tonnes) 9722 (3478–28,366) 168 (66–468) 4852 (2525–9651) 7459 (2304–26,150) 6011 (3268–12,341)ConsumptionCrabeater 1483 (871–2532) 15 (5–48)% 879 (280–2586)% 30 (13–71)% 20 (5–72)% 25 (10–56)%Weddell 1.36 (0.60–3.08) <0.1% 0.8 (0.2–2.8)% <0.1% <0.1% <0.1%Leopard 2.05 (0.86–4.90) <0.1% 1.2 (0.3–4.4)% <0.1% <0.1% <0.1%All seals 1487 (873–2539) 15 (5–48)% 881 (280–2592)% 31 (13–71)% 20 (5–72)% 25 (10–56)%
J. Forcada et al. / Biological Conservation 149 (2012) 40–50 47
than in the Amundsen-Ross Sea. Leopard seal density in the WAPwas comparable to densities elsewhere, but at the WWS was muchlower, which could reflect either the species’ rarity or the low num-ber of observations produced, as occurred in surveys of East Antarc-
tica (Southwell et al., 2008b). Finally, our survey failed to produceestimates for Ross seals, and this could be explained by the datesof the survey, when haul-out probabilities were small (Southwellet al., 2008c) and most seals could be absent from the survey area.

48 J. Forcada et al. / Biological Conservation 149 (2012) 40–50
Erickson and Hanson (1990) provided density estimates for theAmundsen-Bellingshausen Seas and the WWS from the early1970s to early 1980s that were 2.3 and 19 times higher than ourestimates for crabeater seals in overlapping areas, and similarlyhigher for Weddell and leopards seals. They also reported a lowerdensity for Ross seals than for leopard seals, but much higher thanin our survey. Due to fundamental methodological differences be-tween their estimates and ours, population trends in the regionshould be considered with caution. To date, only a long term studyat Anvers Island indicates a verifiable decline for a single Weddellseal colony (Siniff et al., 2008), and there is a need to investigatepopulation trends for all species at a wider scale to understandchange.
Our analysis of suitable habitat indeed suggests long-term de-clines in the WAP which could entail directional changes in distri-bution and density of pack-ice seals. Such changes for instancehave been observed in emperor penguins (Trathan et al., 2011),which are an ice obligate species. Our models made strongassumptions about habitat preferences, and seal habitat projec-tions closely tracked the evident decline of pack-ice at the WAP(Parkinson, 2004; Stammerjohn et al., 2008; Costa et al., 2010;Dinniman et al., 2011). However, it is not clear whether and howthe pack-ice habitat is critical to the seals in the absence of analternative substrate, and understanding the dependence of sealson the pack-ice is important to evaluate how much ice loss is re-quired before seal population declines are likely to occur.
Another important result is that the highest loss of apparentlysuitable habitat would have occurred at the MBA where pack-iceseals are expected to be abundant. The MBA is warming rapidly(Meredith and King, 2005; Vaughan et al., 2003) and shows pro-found biological changes resulting from sea ice loss (Clarke et al.,2007; Ducklow et al., 2007). Changes include possible declines,and increasing interannual variation in krill biomass (Atkinsonet al., 2004). A recent habitat analysis for crabeater seals (Fried-lander et al., 2011) confirms that their distribution in the MBA isnot so much determined by proximity to krill but by sea-ice coverand the preference for shallow coastal areas (Burns et al., 2004,2008; Costa et al., 2010). In addition, our analysis indicates thatcrabeater seals were more abundant where sea ice concentrationwas high, and where the pack-ice was closer to the shelf break.This suggests that sea-ice contraction could potentially modifythe density of seals and the krill and the access of seals to the krill,but if it is the case, the mechanisms underlying these processes re-main unclear.
Given its abundance, the crabeater seal is probably the majorkrill consumer of the Antarctic Peninsula-Scotia Sea-Weddell Searegion. Assuming 95% of krill in the diet, total consumption wouldcompare to approximately 20% of the standing stock estimate forthe Scotia Sea including the northwestern Antarctic Peninsula(Fielding et al., 2011), roughly 17% of the krill stock in the extendedsurvey area. This places the crabeater seal as the top krill con-sumer, even above whales (Reilly et al., 2004), Antarctic fur seals(Boyd, 2002) and other predators (Hill et al., 2007). This also high-lights the extreme dependence of crabeater seals on krill, if thereare no alternative food sources as it has been suggested (Ducklowet al., 2007; Murphy et al. 2007), which could influence crabeaterseal density, as occurs in other predators (e.g. Trivelpece et al.,2011), if krill biomass is declining. The availability of alternativeprey components thus needs further research.
4.1. Caveats and uncertainty
Although this analysis aimed at generating the highest level ofcertainty in estimating population and krill consumption parame-ters for pack-ice seals given the available data, there are a numberof important caveats. First, both the krill and seal population
assessments are now over 10 years old, and constitute only a snap-shot in time for a region demographically open for krill and seals.Second, despite the similarity of our estimates in mean daily krillrequirements with independent estimates (Naumov and Chekuno-va, 1980; Laws 1984), our estimates were limited by incompleteand nonconcurrent biometric, life history, diet composition andother data, which had to be pooled across regions, studies and spe-cies. This is problematic because food consumption estimates aresensitive to population density (e.g. Boyd, 2002) and diet composi-tion (e.g. Forcada et al., 2009), which may vary considerably overspace and time. Third, the spatial resolution of the consumptionestimates assumed a static stock of seals and krill. Crabeater sealsare mobile even if constrained to remain close to the pack-ice(Burns et al., 2004, 2008; Costa et al., 2010), and they move acrosssmall-scale areas in search for food, particularly given the dynam-ics of sea ice and krill; krill is also highly dynamic in space and time(Murphy et al., 2007; Lawson et al., 2008). Fourth, the limited spa-tial resolution of the aerial survey across the fishery area, and thehabitat-based modelling to obtain the best possible seal densityestimates, affected extrapolation of density to SSMUs, especiallyin those with little or no pack-ice. Despite the absence of sea-ice,these areas still constitute an important source of krill advectedby the Antarctic Circumpolar Current that post-moulting sealsare likely exploit. In areas of more intensive fishing, such as inSSMUs 5 and 6, it is thus not clear what fraction of the total avail-able krill biomass is vulnerable to pack-ice seals. Finally, seals eatmuch more krill than is taken by the fishery, and taken togetherthey represent approximately between 11% and 26% of the stand-ing stock. Nevertheless, there is considerable uncertainty aboutthe biomass of krill in the area (Lawson et al., 2008; Nicol et al.,2011) and at a much larger scale (Atkinson et al., 2009), which willgreatly influence estimates of krill consumption and fishing im-pacts in relation to standing stock.
All these caveats indicate a very high level of uncertainty, whichshould reflect in the level of precaution in the management of thekrill fishery in order to take the ecological needs of Antarctic pack-ice seals into account.
4.2. Management implications
One of the CCAMLR management objectives for the SouthernOcean krill fishery is the ‘‘maintenance of the ecological relation-ships between harvested, dependent and related populations ofAntarctic marine resources and the restoration of depleted popula-tions to predefined levels’’. CCAMLR considers the implementationof its ecosystem approach to management through operationalconservation objectives of krill predators (Constable, 2011), whichrequire the assessment of the status of target species and theirdependent predators in order to design management strategies.However, in spite of all our efforts, we still know very little aboutkrill-pack-ice seal-environment dynamics in relation to the fishery.
Antarctic pack-ice seals are numerically important in the WestAntarctic Peninsula, where a considerable part of the fishing oper-ation takes place. Seal densities here are probably much higherthan elsewhere in the Southern Ocean, and the crabeater seal de-mands for krill may comprise up to 15% or more of the standingstock.
Pack-ice seals as a group and especially crabeater seals areprobably sensitive to the loss of sea ice (Siniff et al., 2008; Costaet al., 2010) to some degree, and sea ice contraction is probablyreducing their habitat, resulting in a stress on some populations.Currently, their apparent preferred habitat is contracting fasterwhere the krill biomass is likely to be in decline and fishing has in-creased and is more intensive.
Increasing fishing in the region is thus likely to add stress to thealready stressed krill-seal dynamics. In particular, expanding the
J. Forcada et al. / Biological Conservation 149 (2012) 40–50 49
fishing operation to the MBA which is currently not fished for krill,because is a potentially critical source of krill for the Antarctic Pen-insula and the Scotia Sea, including SSMUs, but also where envi-ronmental change is more significant.
Conserving marine resources requires understanding how com-pounded pressures affect populations and communities. Inter alia,the effects of fisheries with climate and environmental change (De-lord et al., 2008; Rolland et al., 2009; Trebilco et al., 2011), and withmanagement decisions (e.g. Okes et al., 2009; Pichegru et al., inpress). The management of the krill fishery should thus carefullyconsider the large uncertainty associated with the data presentedhere, which calls for a precautionary approach rather than man-agement based on specific conservation objectives for Antarcticpack-ice seals.
Acknowledgments
We thank a large number of people who participated or assistedin the preparation and development of the survey and data colla-tion. We thank Dr. Lesley Thompson and the pilots of the BritishAntarctic Survey (BAS) air unit for their work. The Natural Environ-ment Research Council funded the survey, and this analysis wasfunded as part of the BAS core science programme. Crabeater sealinstrumentation was carried out under permits of the Common-wealth of Australia Antarctic Seals Conservation Regulations andwas approved by the Antarctic Animal Ethics Committee. Leopardseal handling was authorized and endorsed by the Australian Ant-arctic Science Animal Care and Ethics Committee No. 1144. Thiswork was partly supported by the US National Science Foundationunder Grant OPP-9815961, and additional work in the AntarcticPeninsula was supported by the National Science Foundationunder Grants ANT-0440687, ANT-0840375, ANT-0838937, andANT-0440687. This manuscript is contribution No. 716 to the USGLOBEC programme.
Appendix A. Supplementary material
Supplementary data associated with this article can be found, inthe online version, at doi:10.1016/j.biocon.2012.02.002.
References
Anonymous, 1995. Antarctic Pack Ice Seals: An international research program co-ordinated by the SCAR Group of Specialists on Seals. Unpublished Report of the1995 APIS Program Planning Meeting, National Marine Mammal Laboratory,Alaska Fisheries Science Center, Seattle, USA, pp. 1–26.
Atkinson, A.A., Siegel, V., Pakhomov, E.A., Rothery, P., 2004. Long-term decline inkrill stock and increase in salps within the Southern Ocean. Nature 432, 100–103.
Atkinson, A.A., Siegel, V., Pakhomov, E.A., Jessopp, M.J., Loeb, V., 2009. A re-appraisalof the total biomass and annual production of Antarctic krill. Deep-Sea Res. PartI 56, 727–740.
Bengtson, J.L., Laake, J.L., Boveng, P.L., Cameron, M.F., Hanson, B., Stewart, B., 2011.Distribution, density, and abundance of pack-ice seals in the Amundsen andRoss Seas. Antarctica. Deep-Sea Res. Part II 58, 1261–1276.
Boyd, I.L., 2002. Estimating food consumption of marine predators: Antarctic furseals and macaroni penguins. J. Appl. Ecol. 39, 103–119.
Brody, S., 1945. Bioenergetics and Growth with Special Reference to the EfficiencyComplex in Domestic Animals. Hafner Publishing Company Inc., New York.
Burns, J.M., Costa, D.P., Fedak, M.A., Hindell, M.A., Bradshaw, C.J.A., Gales, N.J.,McDonald, B., Trumble, S.J., Crocker, D.E., 2004. Winter habitat use and foragingbehavior of crabeater seals along the Western Antarctic Peninsula. Deep-SeaRes. Part. II 51, 2279–2303.
Burns, J.M., Hindell, M.A., Bradshaw, C.J.A., Costa, D.P., 2008. Fine-scale habitatselection of crabeater seals as determined by diving behavior. Deep-Sea Res.Part. II 55, 500–514.
Castellini, M.A., Kooyman, G.L., Ponganis, P.J., 1992. Metabolic rates of freely divingWeddell seals: correlations with oxygen stores, swim velocity and divingduration. J. Exp. Biol. 165, 181–194.
Caswell, H., 2001. Matrix Population Models: Construction, Analysis andInterpretation, second ed. Sinauer Associates, Sunderland, Massachusetts.
CCAMLR, 2008. Report of the Twenty-Seventh Meeting of the Scientific CommitteeReport. SC-CAMLR-XXVII/Annex 4, Hobart, Australia. <http://www.ccamlr.org>.
CCAMLR (Secretariat), 2011. Krill Fishery Report: 2011 Update. Document WG-EMM-11/5. CCAMLR, Hobart, Australia. <http://www.ccamlr.org/>.
Clarke, A., 1980. The biochemical composition of krill, Euphausia superba Dana, fromSouth Georgia. J. Exp. Mar. Biol. Ecol. 43, 221–236.
Clarke, A., Murphy, E.J., Meredith, M.P., King, J.C., Peck, L.S., Barnes, D.K.A., Smith,R.C., 2007. Climate change and the marine ecosystem of the western AntarcticPeninsula. Philos. Trans. Roy. Soc. B 362, 149–166.
Comiso, J., 1999 (updated 2008). Bootstrap Sea Ice Concentrations from NIMBUS-7SMMR and DMSP SSM/I. National Snow and Ice Data Center. Digital Media.Boulder, Colorado USA. <http://www.nsidc.org/data/nsidc-0079.html> (22–29.01.99).
Constable, A.J., 2011. Lessons from CCAMLR on the implementation of theecosystem approach to managing fisheries. Fish Fish. 12, 138–151.
Costa, D.P., Huckstadt, L.A., Crocker, D.E., McDonald, B.I., Goebel, M.E., Fedak, M.A.,2010. Approaches to studying climatic change and its role on the habitatselection of Antarctic pinnipeds. Integr. Comp. Biol. 50, 1018–1030.
Davison, A.C., Hinkley, D.V., 1997. Bootstrap Methods and Their Application.Cambridge University Press, Cambridge.
Delord, K., Besson, D., Barbraud, C., Weimerskirch, H., 2008. Population trends in acommunity of large Procellariiforms of Indian Ocean: potential effects ofenvironment and fisheries interactions. Biol. Conserv. 141, 1840–1856.
Dinniman, M.S., Klinck, J.M., Smith Jr., W.O., 2011. A model study of circumpolardeep water on the West Antarctic Peninsula and Ross Sea continental shelves.Deep-Sea Res. Part II 58, 1508–1523.
Ducklow, H.W., Baker, K., Martinson, D.G., Quetin, L.B., Ross, R.M., Smith, R.C.,Stammerjohn, S.E., Vernet, M., Fraser, W., 2007. Marine pelagic ecosystems: theWest Antarctic Peninsula. Philos. Trans. Roy. Soc. B 362, 67–94.
Erickson, A.W., Hanson, M.B., 1990. Continental estimates and population trends ofAntarctic seals. In: Kerry, K.E., Hempel, G. (Eds.), Antarctic Ecosystems.Ecological Change and Conservation. Springer-Verlag, Berlin-Heidelberg, pp.253–264.
Fielding, S., Watkins, J., Cossio, A., Reiss, C., Watters, G., Calise, L., Skaret, G., Takao,Y., Zhao, X., Agnew, D., Ramm, D., Reid, K., 2011. The ASAM 2010 Assessment ofKrill Biomass for Area 48 from the Scotia Sea CCAMLR 2000 Synoptic Survey.WG-EMM-CCAMLR-11/20, Hobart, Australia. <http://www.ccamlr.org/>.
Forcada, J., Trathan, P.N., Reid, K., Murphy, E.J., Croxall, J.P., 2006. Contrastingpopulation changes in sympatric penguin species in association with climatewarming. Global Change Biol. 12, 411–423.
Forcada, J., Trathan, P.N., Murphy, E.J., 2008. Life history buffering in Antarcticmammals and birds against changing patterns of climate and environmentalvariation. Global Change Biol. 14, 2473–2488.
Forcada, J., Malone, D., Royle, J.A., Staniland, I.J., 2009. Modelling predation bytransient leopard seals for an ecosystem-based management of Southern Oceanfisheries. Ecol. Mod. 220, 1513–1521.
Fraser, W.R., Hofmann, E.E., 2003. A predator’s perspective on causal links betweenclimate change, physical forcing and ecosystem response. Mar. Ecol. Prog. Ser.265, 1–15.
Friedlander, A.S., Johnston, D.W., Fraser, W.R., Burns, J., Halpin, W.R., Costa, D.P.,2011. Ecological niche modeling of sympatric krill predators around MargueriteBay, Western Antarctic Peninsula. Deep-Sea Res. Part II 58, 1729–1740.
Hedley, S.L., Buckland, S.T., 2004. Spatial models for line transect sampling. J. Agr.Biol. Environ. Stat. 9, 181–199.
Hewitt, R.P., Watters, G., Trathan, P.N., Croxall, J.P., Goebel, M.E., Ramm, D., Reid, K.,Trivelpiece, W.Z., Watkins, J.L., 2004. Options for allocating the precautionarycatch limit of krill among small-scale management units in the Scotia Sea.CCAMLR Sci. 11, 81–97.
Hill, S.L., Reid, K., Thorpe, S.E., Hinke, J., Watters, G.M., 2007. A compilation ofparameters for ecosystem dynamics models of the Scotia Sea-AntarcticPeninsula region. CCAMLR Sci. 14, 1–25.
IOC, IHO, BODC, 2003. Centenary edition of the GEBCO Digital Atlas, Published onCD-rom on Behalf of the Intergovernmental Oceanographic Commission and theInternational Hydrographic Organization as Part of the General BathymetricChart of the Oceans, British Oceanographic Data Centre, Liverpool. <http://www.bodc.ac.uk/products/bodc_products/gebco/>.
Kawaguchi, S., Nicol, S.G., Press, A.J., 2009. Direct effects of climate change on theAntarctic krill fishery. Fish. Manage. Ecol. 16, 424–427.
Kleiber, M., 1961. The Fire of Life. An introduction to animal energetics, Wiley, NewYork.
Kuhn, C.E., McDonald, B., Shaffer, S.A., Barnes, J., Crocker, D.E., Burns, J., Costa, D.P.,2006. Diving physiology and winter foraging behavior of a juvenile leopard seal(Hydrurga leptonyx). Polar Biol. 29, 303–307.
Laake, J.L., Borchers, D.L., 2004. Methods for incomplete detection at distance zero.In: Buckland, S.T., Anderson, D.R., Burnham, K.P., Laake, J.L., Borchers, D.L.,Thomas, L. (Eds.), Advanced Distance Sampling. Oxford University Press, Oxford,pp. 108–189.
Laws, R.M., 1984. Seals. In: Laws, R.M. (Ed.), Antarctic Ecology, vol. 2. AcademicPress, London, pp. 621–715.
Lawson, G.L., Wiebe, P.H., Ashjian, C.J., Stanton, T.K., 2008. Euphausiid distributionalong the Western Antarctic Peninsula-Part B: distribution of euphausiidaggregations and biomass, and associations with environmental features.Deep-Sea Res. Part II 55, 432–454.
Marques, F.F.C., Buckland, S.T., 2003. Incorporating covariates into standard linetransect analyses. Biometrics 59, 924–935.
Mårtensson, P.-E., Nordøy, E.S., Blix, A.S., 1994. Digestibility of krill (Euphausiasuperba and Thysanoessa sp.) in minke whales (Balaenoptera acutorostrata) andcrabeater seals (Lobodon carcinophagus). Br. J. Nutr. 72, 713–716.
50 J. Forcada et al. / Biological Conservation 149 (2012) 40–50
Meredith, M.P., King, J.C., 2005. Rapid climate change in the ocean west of theAntarctic Peninsula during the second half of the 20th century. Geophys. Res.Lett. 32 (L19604), 1–5.
Murphy, E.J., Watkins, J.L., Trathan, P.N., Reid, K., Meredith, M.P., Thorpe, S.E.,Johnston, N.M., Clarke, A., Tarling, G.A., Collins, M.A., Forcada, J., Shreeve, R.S.,Atkinson, A., Korb, R., Whitehouse, M.J., Ward, P., Rodhouse, P.G., Enderlein, P.,Hirst, A.G., Martin, A.R., Hill, S.L., Staniland, I.J., Pond, D.W., Briggs, D.R.,Cunningham, N.J., Fleming, A.H., 2007. Spatial and temporal operation of theScotia Sea ecosystem: a review of large-scale links in a krill centred food web.Philos. Trans. Roy. Soc. B 362, 113–148.
Naumov, A.G., Chekunova, V.I., 1980. Energy requirements of pinnipeds(Pinnipedia). Oceanology 20, 348–350.
Nicol, S., Foster, J., Kawaguchi, S., 2011. The fishery for Antarctic krill-recentdevelopments. Fish Fish. 12. http://dx.doi.org/10.1111/j.1467-2979.2011.00406.x.
Nicholls, K.W., Boehme, L., Biuw, M., Fedak, M.A., 2008. Wintertime Oceanconditions over the southern Weddell Sea continental shelf, Antarctica.Geophys. Res. Lett. 35 (L21605), 1–5.
Okes, N.C., Hockey, P.A.R., Pichegru, L., van der Lingen, C.D., Crawford, R.J.M.,Grémillet, D., 2009. Competition for shifting resources in the southern Benguelaupwelling: seabirds versus purse-seine fisheries. Biol. Conserv. 142, 2361–2368.
Øristland, T., 1977. Food consumption of seals in the Antarctic pack ice. In: Llano,G.A. (Ed.), Adaptations Within Antarctic Ecosystems. Proceedings of the 3rdSCAR Symposium of Antarctic Biology. Smithsonian Institution, Washington,DC, pp. 749–768.
Parkinson, C.L., 2004. Southern Ocean sea ice and its wider linkages: insightsrevealed from models and observations. Antarct. Sci. 16, 387–400.
Pichegru, L., Ryan, P.G., van Eeden, R., Reid, T., Grémillet, D., Wanless, R., 2011.Industrial Fishing, No-take Zones and Endangered Penguins. Biol. Conserv. doi:10.1016/j.biocon.2011.12.013).
Pinheiro, J.C., Bates, D.M., 2000. Mixed-Effects Models in S and S-Plus. Springer-Verlag, New York.
R Development Core Team, 2009. R: A Language and Environment for StatisticalComputing. R Foundation for Statistical Computing, Vienna, Austria. ISBN 3-900051-07-0, URL. <http://www.R-project.org>.
Reilly, J.J., Fedak, M.A., 1991. Measurement of the body composition of living grayseals by hydrogen isotope dilution. J. Appl. Physiol. 69, 885–891.
Reilly, S., Hedley, S., Borberg, J., Hewitt, R., Thiele, D., Watkins, J., Naganobu, M.,2004. Biomass and energy transfer to baleen whales in the South Atlantic sectorof the Southern Ocean. Deep-Sea Res. Part II 51, 1397–1409.
Rogers, T.L., Hogg, C.J., Irvine, A.B., 2005. Spatial movement of adult leopard seals(Hydrurga leptonyx) in Prydz Bay, Eastern Antarctica. Polar Biol. 28, 456–463.
Rolland, V., Barbraud, C., Weimerskirch, H., 2009. Assessing the impact of fisheries,climate and disease on the dynamics of the Indian yellow-nosed Albatross. Biol.Conserv. 142, 1084–1095.
Schiermeier, Q., 2010. Ecologists fear Antarctic krill crisis. Nature 467, 15.Siniff, D.B., Stone, S., 1985. The role of the leopard seal in the tropho-dynamics of the
Antarctic marine ecosystem. In: Siegfried, W.R., Condy, P.R., Laws, R.M. (Eds.),Antarctic nutrient cycles and food webs. Springer-Verlag, Berlin-Heidelberg, pp.555–560.
Siniff, D.B., Garrott, R.A., Rotella, J.J., Fraser, W.R., Ainley, D.J., 2008. Projecting theeffects of environmental change on Antarctic seals. Antarct. Sci. 20, 425–435.
Southwell, C.J., de la Mare, W.K., Underwood, M., Quartararo, F., Cope, K., 2002. Anautomated system to log and process distance sight-resight aerial survey data.Wildlife Soc. Bull. 30, 394–404.
Southwell, C.J., 2005. Optimising the timing of visual surveys of crabeater sealabundance. Haulout behaviour as a consideration. Wildlife Res. 32,333–338.
Southwell, C.J., Kerry, K.R., Ensor, P.H., 2005. Predicting the distribution of crabeaterseals Lobodon carcinophaga off east Antarctica during the breeding season. Mar.Ecol. Prog. Ser. 299, 297–309.
Southwell, C.J., Paxton, C.G.M., Borchers, D.L., Boveng, P.L., de la Mare, W.K., 2008a.Taking account of dependent species in management of the Southern Oceankrill fishery: estimating crabeater seal abundance off east Antarctica. J. Appl.Ecol. 45, 622–631.
Southwell, C.J., Paxton, C.G.M., Borchers, D., Boveng, P., Rogers, T., de la Mare, W.K.,2008b. Uncommon or cryptic? Challenges in estimating leopard seal abundanceby conventional but state-of-the-art methods. Deep-Sea Res. Part II 55, 519–531.
Southwell, C.J., Paxton, C.G.M., Borchers, D., Boveng, P., Nordøy, E.S., Blix, A.S., de laMare, W.K., 2008c. Estimating population status under conditions ofuncertainty: the Ross seal in East Antarctica. Antarct. Sci. 20, 123–133.
Stammerjohn, S.E., Martinson, D.G., Smith, R.C., Yuan, X., Rind, D., 2008. Trends inAntarctic annual sea ice retreat and advance and their relation to El Niño-Southern Oscillation and Southern Annular Mode variability. J. Geophys. Res.113 (C03S90), 1–20.
Thomas, L., Buckland, S.T., Rexstad, E.A., Laake, J.L., Strindberg, S., Hedley, S.L.,Bishop, J.R.B., Marques, T.A., Burnham, K.P., 2010. Distance software: design andanalysis of distance sampling surveys for estimating population size. J. Appl.Ecol. 47, 5–14.
Trathan, P.N., Fretwell, P.T., Stonehouse, B., 2011. First recorded loss of an emperorpenguin colony in the recent period of Antarctic regional warming: implicationsfor other colonies. PLoS ONE 6 (2, 1-11), e14738. http://dx.doi.org/10.1371/journal.pone.0014738.
Trebilco, R., Halpern, B.S., Mills Fleming, J., Field, C., Blanchard, W., Worm, B., 2011.Mapping species richness and human impact drivers to inform global pelagicconservation prioritisation. Biol. Conserv. 144, 1758–1766.
Trivelpece, W.Z., Hinke, J.T., Miller, A.K., Reiss, C.S., Trivelpiece, S.G., Waters, G.M.,2011. Variability in krill biomass links harvesting and climate warming topenguin to penguin population changes in Antarctica. Proc. Natl. Acad. Sci. USA108, 7625–7628.
Vaughan, D.G., Marshall, G.J., Connolley, W.M., Parkinson, C., Mulvaney, R., Hodgson,D.A., King, J.C., Pudsey, C.J., Turner, J., 2003. Recent rapid regional climatewarming on the Antarctic Peninsula. Climatic Change 60, 243–274.
Whitehouse, M.J., Meredith, M.P., Rothery, P., Atkinson, A., Ward, P., Korb, R.E., 2008.Rapid warming of the ocean around South Georgia, Southern Ocean, during the20th century: Forcings, characteristics and implications for lower trophic levels.Deep-Sea Res. Part I 55, 1218–1228.
Wood, S.N., 2006. Generalized Additive Models: An Introduction with R. Chapmanand Hall/CRC.
Worthy, G.A.J., 2001. Nutrition and energetics. In: Dierauf, L.A., Gulland, F.M.D.(Eds.), CRC Handbook of Marine Mammal Medicine, second ed. CRC Press, BocaRaton, Florida, pp. 791–827.
Related Documents