The response of calcareous nannofossil assemblages to the Paleocene Eocene Thermal Maximum at the Walvis Ridge in the South Atlantic Isabella Raffi a, ⁎, Jan Backman b , James C. Zachos c , Appy Sluijs d a Dipartimento di Geotecnologie per l'Ambiente e il Territorio, Università degli Studi “G. d'Annunzio” di Chieti-Pescara, Campus Universitario, via dei Vestini 31, I-66013 Chieti Scalo, Italy b Department of Geology and Geochemistry, Stockholm University, SE-10691 Stockholm, Sweden c Department of Earth and Planetary Sciences, UCSC, Santa Cruz, CA 95064, USA d Palaeoecology, Institute of Environmental Biology, Utrecht University. Laboratory of Palaeobotany and Palynology, Budapestlaan 4, 3584 CD, Utrecht, The Netherlands abstract article info Article history: Received 4 July 2008 Received in revised form 10 December 2008 Accepted 11 December 2008 Keywords: Calcareous nannofossils PETM Uniquely rapid evolution Paleoecology Photic zone environment Compositions and abundances of calcareous nannofossil taxa have been determined in a ca 170 kyrs long time interval across the Paleocene/Eocene boundary at 1-cm to 10-cm resolution from two ODP Sites (1262, 1263) drilled along the flank of the Walvis Ridge in the South Atlantic. The results are compared to published data from ODP Site 690 in the Weddell Sea. The assemblages underwent rapid evolution over a 74 kyrs period, indicating stressed, unstable and/or extreme photic zone environments during the PETM hyperthermal. This rapid evolution, which created 5 distinct stratigraphic horizons, is consistent with the restricted brief occurrences of malformed and/or weakly calcified morphotypes. The production of these aberrant morphotypes is possibly caused by major global scale changes in carbon cycling in the ocean– atmosphere system, affecting also photic zone environments. No marked paleoecologically induced changes are observed in abundances of the genera Discoaster, Fasciculithus and Sphenolithus at the Walvis Ridge sites. Surprisingly, there is no significant correlation in abundance between these three genera, presumed to have had a similar paleoecological preference for warm and oligotrophic conditions. © 2008 Elsevier B.V. All rights reserved. 1. Introduction The Paleocene Eocene Thermal Maximum (PETM) is a brief climate perturbation that is characterized by a global increase in temperature and a massive injection of 13 C-depleted carbon into the ocean– atmosphere system (Kennett and Stott, 1991; Dickens et al., 1995; Zachos et al., 2001, 2005; Sluijs et al., 2006). This injection imprinted a negative carbon isotope excursion (CIE) in sedimentary components that, including onset and recovery, lasted approximately 170 kyrs (Röhl et al., 2007; Sluijs et al., 2007; Abdul Aziz et al., 2008), and which is now used to approximate the Paleocene–Eocene boundary (Aubry et al., 2007). Marine biotic response to the climatic and carbon cycle changes was significant (Sluijs et al., 2007). This includes calcareous nannofossil assemblages which underwent significant change on a global scale. The diversity of the Paleocene genus Fasciculithus decreased substan- tially (Raffi et al., 2005), with only Fasciculithus tympaniformis and Fasciculithus involutus prevailing into the lowermost Eocene. Within the CIE, the genus Rhomboaster evolved rapidly together with members of the genus Tribrachiatus (Romein, 1979), as well as the malformed and short ranged Discoaster araneus and/or Discoaster anartios (Bybell and Self-Trail,1995; Cramer et al., 2000; Monechi et al., 2000; Kahn and Aubry, 2004; Tremolada and Bralower, 2004; Agnini et al., 2007a). The Rhomboaster–D. araneus/anartios association is restricted to the PETM (Aubry, 2001; Kahn and Aubry, 2004; Aubry et al., 2007). This assemblage has been observed in many sections and appears to represent a ubiquitous evolutionary event (Raffi et al., 2005). The abundances of Fasciculithus continue to decrease through the PETM, culminating in its extinction shortly after the PETM. In contrast, the abundance of the genus Zygrhablithus (mainly Z. bijugatus) increases within the PETM. This pattern has been recorded in several deep-sea and land-based sections (Tremolada and Bralower, 2004), but is not a global event. In fact, while the decline and successive demise of Fasciculithus is global, the increase of Zygrhablithus has been recorded in some tropical, mid- and high latitude regions but it is absent in other equatorial and mid-latitude regions (Raffi et al., 2005). All the above nannofossil events are restricted to the PETM interval, and are thought to be related to the unusual transient paleoenviron- mental conditions that occurred in the photic zone that characterizes the PETM/CIE (Bralower, 2002; Agnini et al., 2007a). Only a few open ocean sites with complete Paleocene/Eocene transitions and relatively well-preserved nannofossil assemblages have been studied in detail. These include the high latitude Southern Ocean Drilling Program (ODP) Site 690 in the Weddell Sea (Bralower, 2002), the tropical Pacific Ocean ODP Site 1209 (Gibbs et al., 2006), the tropical Atlantic Ocean ODP Site 1260 (Mutterlose et al., 2007), and the hemipelagic Tethyan Ocean Forada section (Agnini et al., 2007a). Marine Micropaleontology 70 (2009) 201–212 ⁎ Corresponding author. Fax: +39 08713556047. E-mail address: raffi@unich.it (I. Raffi). 0377-8398/$ – see front matter © 2008 Elsevier B.V. All rights reserved. doi:10.1016/j.marmicro.2008.12.005 Contents lists available at ScienceDirect Marine Micropaleontology journal homepage: www.elsevier.com/locate/marmicro

Welcome message from author
This document is posted to help you gain knowledge. Please leave a comment to let me know what you think about it! Share it to your friends and learn new things together.
Transcript
Marine Micropaleontology 70 (2009) 201–212
Contents lists available at ScienceDirect
Marine Micropaleontology
j ourna l homepage: www.e lsev ie r.com/ locate /marmicro
The response of calcareous nannofossil assemblages to the Paleocene Eocene ThermalMaximum at the Walvis Ridge in the South Atlantic
Isabella Raffi a,⁎, Jan Backman b, James C. Zachos c, Appy Sluijs d
a Dipartimento di Geotecnologie per l'Ambiente e il Territorio, Università degli Studi “G. d'Annunzio” di Chieti-Pescara, Campus Universitario, via dei Vestini 31, I-66013 Chieti Scalo, Italyb Department of Geology and Geochemistry, Stockholm University, SE-10691 Stockholm, Swedenc Department of Earth and Planetary Sciences, UCSC, Santa Cruz, CA 95064, USAd Palaeoecology, Institute of Environmental Biology, Utrecht University. Laboratory of Palaeobotany and Palynology, Budapestlaan 4, 3584 CD, Utrecht, The Netherlands
⁎ Corresponding author. Fax: +39 08713556047.E-mail address: [email protected] (I. Raffi).
0377-8398/$ – see front matter © 2008 Elsevier B.V. Aldoi:10.1016/j.marmicro.2008.12.005
a b s t r a c t
a r t i c l e i n f oArticle history:
Compositions and abundan Received 4 July 2008Received in revised form 10 December 2008Accepted 11 December 2008Keywords:Calcareous nannofossilsPETMUniquely rapid evolutionPaleoecologyPhotic zone environment
ces of calcareous nannofossil taxa have been determined in a ca 170 kyrs longtime interval across the Paleocene/Eocene boundary at 1-cm to 10-cm resolution from two ODP Sites (1262,1263) drilled along the flank of the Walvis Ridge in the South Atlantic. The results are compared to publisheddata from ODP Site 690 in the Weddell Sea. The assemblages underwent rapid evolution over a 74 kyrsperiod, indicating stressed, unstable and/or extreme photic zone environments during the PETMhyperthermal. This rapid evolution, which created 5 distinct stratigraphic horizons, is consistent with therestricted brief occurrences of malformed and/or weakly calcified morphotypes. The production of theseaberrant morphotypes is possibly caused by major global scale changes in carbon cycling in the ocean–atmosphere system, affecting also photic zone environments. No marked paleoecologically induced changesare observed in abundances of the genera Discoaster, Fasciculithus and Sphenolithus at the Walvis Ridge sites.Surprisingly, there is no significant correlation in abundance between these three genera, presumed to havehad a similar paleoecological preference for warm and oligotrophic conditions.
© 2008 Elsevier B.V. All rights reserved.
1. Introduction
The Paleocene Eocene Thermal Maximum (PETM) is a brief climateperturbation that is characterized by a global increase in temperatureand a massive injection of 13C-depleted carbon into the ocean–atmosphere system (Kennett and Stott, 1991; Dickens et al., 1995;Zachos et al., 2001, 2005; Sluijs et al., 2006). This injection imprinted anegative carbon isotope excursion (CIE) in sedimentary componentsthat, includingonset and recovery, lasted approximately 170 kyrs (Röhlet al., 2007; Sluijs et al., 2007; Abdul Aziz et al., 2008), andwhich is nowused to approximate the Paleocene–Eocene boundary (Aubry et al.,2007).
Marine biotic response to the climatic and carbon cycle changeswas significant (Sluijs et al., 2007). This includes calcareous nannofossilassemblages which underwent significant change on a global scale.The diversity of the Paleocene genus Fasciculithus decreased substan-tially (Raffi et al., 2005), with only Fasciculithus tympaniformis andFasciculithus involutus prevailing into the lowermost Eocene. Withinthe CIE, the genus Rhomboaster evolved rapidly together withmembers of the genus Tribrachiatus (Romein, 1979), as well as themalformed and short ranged Discoaster araneus and/or Discoasteranartios (Bybell and Self-Trail,1995; Cramer et al., 2000;Monechi et al.,
l rights reserved.
2000; Kahn and Aubry, 2004; Tremolada and Bralower, 2004; Agniniet al., 2007a). The Rhomboaster–D. araneus/anartios association isrestricted to the PETM (Aubry, 2001; Kahn and Aubry, 2004; Aubryet al., 2007). This assemblage has been observed in many sections andappears to represent a ubiquitous evolutionary event (Raffi et al.,2005). The abundances of Fasciculithus continue to decrease throughthe PETM, culminating in its extinction shortly after the PETM. Incontrast, the abundance of the genus Zygrhablithus (mainly Z.bijugatus) increases within the PETM. This pattern has been recordedin several deep-sea and land-based sections (Tremolada and Bralower,2004), but is not a global event. In fact,while the decline and successivedemise of Fasciculithus is global, the increase of Zygrhablithus has beenrecorded in some tropical, mid- and high latitude regions but it isabsent in other equatorial and mid-latitude regions (Raffi et al., 2005).All the above nannofossil events are restricted to the PETM interval,and are thought to be related to the unusual transient paleoenviron-mental conditions that occurred in the photic zone that characterizesthe PETM/CIE (Bralower, 2002; Agnini et al., 2007a).
Only a few open ocean sites with complete Paleocene/Eocenetransitions and relatively well-preserved nannofossil assemblageshave been studied in detail. These include the high latitude SouthernOcean Drilling Program (ODP) Site 690 in the Weddell Sea (Bralower,2002), the tropical Pacific Ocean ODP Site 1209 (Gibbs et al., 2006), thetropical Atlantic Ocean ODP Site 1260 (Mutterlose et al., 2007), and thehemipelagic Tethyan Ocean Forada section (Agnini et al., 2007a).

202 I. Raffi et al. / Marine Micropaleontology 70 (2009) 201–212
Assemblage shifts during the PETM have been interpreted asrepresenting changes in paleoproductivity, from increased eutrophyin neritic-marginal seas to increased oligotrophy in the open ocean(Bralower, 2002; Tremolada and Bralower, 2004; Gibbs et al., 2006;Giusberti et al., 2007). For example, increasing relative abundances ofDiscoaster and Fasciculithus at Site 690, and increasing abundances ofDiscoaster, Fasciculithus and Sphenolithus at Site 1209, have beeninterpreted to represent more oligotrophic, but also warmer environ-ments (Bralower, 2002; Gibbs et al., 2006). The PETM is alsocharacterized by abundance shifts of nannofossil taxa that areconsidered to thrive during colder-water conditions and/or whichwere adapted to mesotrophic–eutrophic environments (Bralower,2002; Tremolada et al., 2007), such as Toweius and Chiasmolithus. Inthe Tethyan Forada section, changes involve an increase of thesupposedly eutrophic Coccolithus and Ericsonia and a concomitantdecrease of the supposedly oligotrophic Octolithus sp.1 and Spheno-lithus. Agnini et al. (2007a) interpreted this as a response to nutrientenhanced conditions induced by increase in weathering and runoffduring the PETM. All the above variations are considered to indicate anunstable photic zone environment. At ODP Site 1260 in the tropicalwestern Atlantic Ocean, the observed nannofossil abundance patternsshow no distinct patterns (Mutterlose et al., 2007). For example, theabundances of various stenotopic taxa such as the “oligotrophic”Discoaster spp., Sphenolithus and Discoaster, and the “eutrophic”Chiasmolithus and Campylosphaera are either invariant across thePETM, or show no covariance.
In addition to changes in photic zone temperatures and nutrientcycling, the plankton assemblages may have been influenced by oceanacidification due to the massive input of carbon dioxide to the watercolumn during the CIE. If the rate of carbon injectionwas rapid enoughto substantially decrease carbonate ion concentrations and pH of thesurface ocean, it should have influenced calcareous nannoplankton.Experiments with modern flora have demonstrated both adverse andpositive effects on nannoplankton in response to higher pCO2 andreduced pH (Riebesell et al., 2000; Zondervan et al., 2001; Rost andRiebesell, 2004; Langer et al., 2006; Iglesias-Rodriguez et al., 2008).
Here, we have studied two pelagic sections spanning thePaleocene/Eocene boundary recovered during ODP Leg 208 in thesubtropical South Atlantic (Fig. 1) (Zachos et al., 2004), in order todetermine compositional and abundance changes in calcareousnannofossil assemblages that are independent of preservation
Fig.1. Location of ODP Sites 1262 and 1263 on theWalvis Ridge in the South Atlantic and the rmap at 55 Ma (http://www.odsn.de/odsn/services/paleomap/paleomap.html).
artifacts. These data will be employed to investigate the response ofcalcareous nannoplankton to photic zone changes in temperature,nutrient concentration and carbon geochemistry across the Paleo-cene/Eocene boundary interval and the PETM. The two sites, 1263 and1262, represent the shallow and deep end members of a depthtransect of sites drilled on the flank of the Walvis Ridge, at 1500 and3500m paleodepth, respectively (Zachos et al., 2004). The onset of thePETM at both the shallow Site 1263 and the deep Site 1262 is markedby clay layers, resulting from CCD rise (Zachos et al., 2005). Correlationof the sites based on ∂13C records has revealed that the carbonatecontent across the recovery interval increases first at shallower andlater at deeper depths, evidencing a gradual deepening of the CCD andlysocline. Because the sites are located so close (150 km) to each other,differences in nannofossil assemblages at any given time likely dependon preservational differences rather than differences in compositionand relative abundances among the plankton communities. Thenannoplankton input signal is hence assumed to have been identicalat the two sites.
2. Material and methods
Samples were collected from the critical PETM interval at Sites1262 (4755 m water depth; 1.3 m investigated) and 1263 (2717 mwater depth; 3 m investigated). Core photos, carbonate concentrationcurves and bulk sediment carbon isotope records from these twointervals are shown by Zachos et al. (2005). Quantitative analyses oncalcareous nannofossil assemblages were carried out on U-channelsample sets. Specifically, 200 samples were analyzed from a 3 minterval at Site 1263, between 333 and 336 mcd (from 1263C-14H-1,31 cm to 1263D-4H-1, 100 cm). This 3 m interval corresponds to about170 kyrs (Röhl et al., 2007). At Site 1262, 79 samples were analyzedfrom a 1.3 m interval between 139 and 140.31 mcd (from 1262B-15H-2, 79 cm to 1262B-15H-3, 89 cm). Age estimates of the investigatednannofossil biostratigraphic events are not provided here, althoughthe relative distance, in terms of timing, between each successiveevent is provided following Röhl et al. (2007) and Westerhold et al.(2007). The samples were processed using standard techniques toprepare smear-slides, and subsequently analyzed with a polarizingmicroscope at 1250× magnification.
The taxa considered in the present paper are listed in Appendix A,and most are referenced in Perch-Nielsen (1985) and Aubry (1984,
eference ODP Site 690 on theMaud Rise in theWeddell Sea shown on a paleogeographic
203I. Raffi et al. / Marine Micropaleontology 70 (2009) 201–212
1988, 1989, 1990). The taxonomy of most taxa are generally wellestablished, except for the much debated genera Rhomboaster andTribrachiatus (Perch-Nielsen, 1985; Bybell and Self-Trail, 1997; Aubryet al., 2000; Wei and Zhong, 1996; von Salis et al., 2000; Raffi et al.,2005). Although some investigators have grouped the two under thegenus Rhomboaster and recombined all species within Tribrachiatusinto Rhomboaster, we prefer to distinguish both genera, onlyrecognizing the following Rhomboaster taxa: Rhomboaster cuspis andthe Rhomboaster calcitrapa group, which includes the speciesRhomboaster intermedia, Rhomboaster bitrifida and Tribrachiatusspineus.
Nannofossil abundance data in the U-channel samples weregenerated by counting specimens in a prefixed area of the slide, in
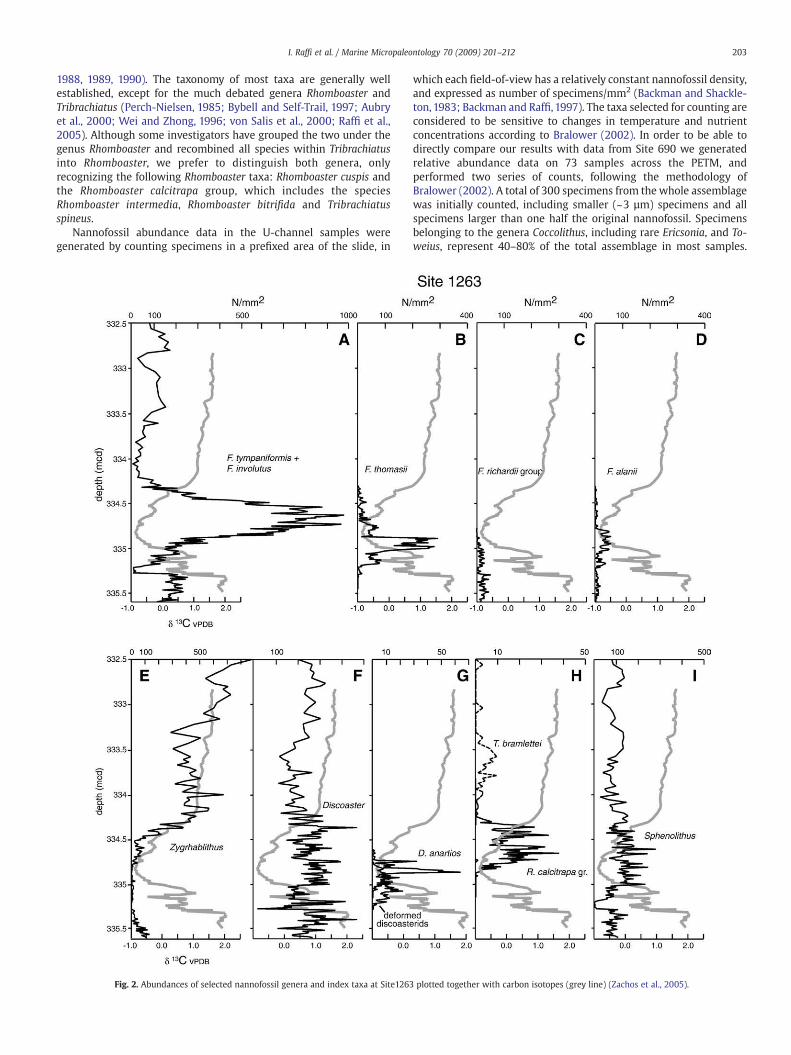
Fig. 2. Abundances of selected nannofossil genera and index taxa at Site1263
which each field-of-view has a relatively constant nannofossil density,and expressed as number of specimens/mm2 (Backman and Shackle-ton, 1983; Backman and Raffi, 1997). The taxa selected for counting areconsidered to be sensitive to changes in temperature and nutrientconcentrations according to Bralower (2002). In order to be able todirectly compare our results with data from Site 690 we generatedrelative abundance data on 73 samples across the PETM, andperformed two series of counts, following the methodology ofBralower (2002). A total of 300 specimens from the whole assemblagewas initially counted, including smaller (~3 µm) specimens and allspecimens larger than one half the original nannofossil. Specimensbelonging to the genera Coccolithus, including rare Ericsonia, and To-weius, represent 40–80% of the total assemblage in most samples.
plotted together with carbon isotopes (grey line) (Zachos et al., 2005).
204 I. Raffi et al. / Marine Micropaleontology 70 (2009) 201–212
These taxa were excluded from the second series of counts, in which atotal of 300 specimens other than Coccolithus and Toweius werecounted in all samples, to obtain percentage variations of the so-callednon-coccolith fraction.
3. Results
3.1. Site 1263
The preservation of calcareous nannofossils is moderate to goodthroughout most of the studied interval at Site 1263. Only in a 6-cminterval from 335.27 to 335.21 mcd, at the base of the CIE, are theeffects of dissolution clearly evident. The results of the counts show astratigraphic succession of changes (Figs. 2–4), which reflect differentphases in the evolving photic zone environment together with thechanging sea-floor carbonate preservation before, during and after
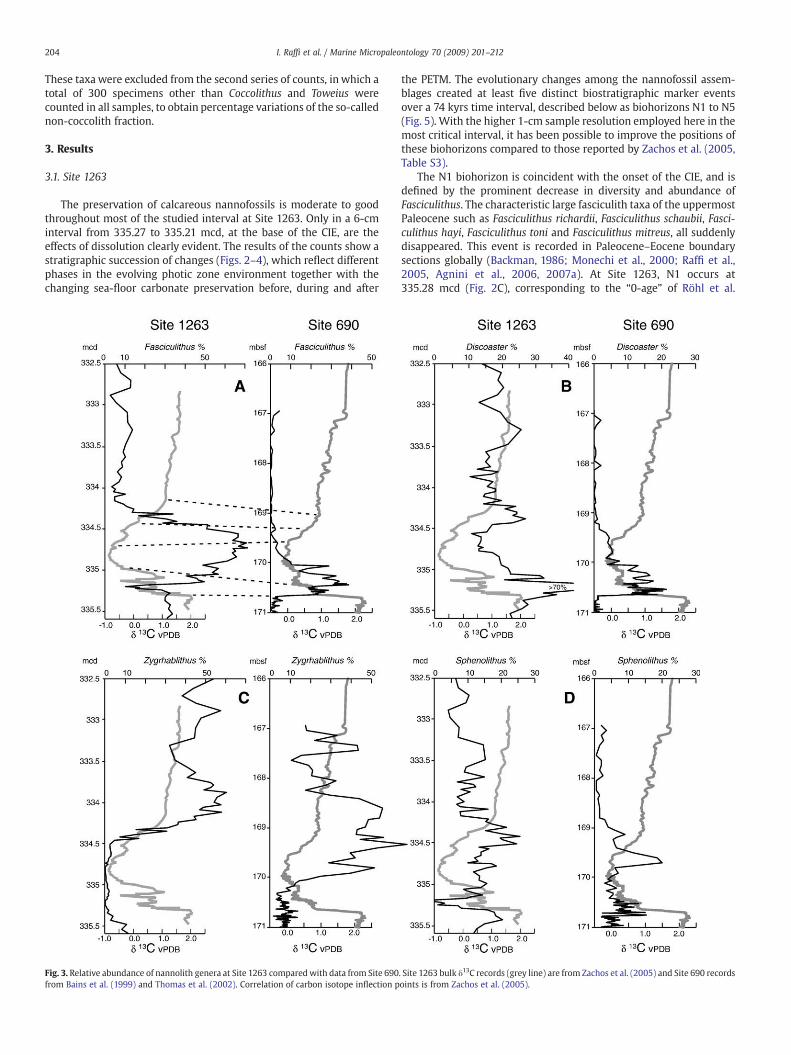
Fig. 3. Relative abundance of nannolith genera at Site 1263 comparedwith data from Site 690from Bains et al. (1999) and Thomas et al. (2002). Correlation of carbon isotope inflection p
the PETM. The evolutionary changes among the nannofossil assem-blages created at least five distinct biostratigraphic marker eventsover a 74 kyrs time interval, described below as biohorizons N1 to N5(Fig. 5). With the higher 1-cm sample resolution employed here in themost critical interval, it has been possible to improve the positions ofthese biohorizons compared to those reported by Zachos et al. (2005,Table S3).
The N1 biohorizon is coincident with the onset of the CIE, and isdefined by the prominent decrease in diversity and abundance ofFasciculithus. The characteristic large fasciculith taxa of the uppermostPaleocene such as Fasciculithus richardii, Fasciculithus schaubii, Fasci-culithus hayi, Fasciculithus toni and Fasciculithus mitreus, all suddenlydisappeared. This event is recorded in Paleocene–Eocene boundarysections globally (Backman, 1986; Monechi et al., 2000; Raffi et al.,2005, Agnini et al., 2006, 2007a). At Site 1263, N1 occurs at335.28 mcd (Fig. 2C), corresponding to the “0-age” of Röhl et al.
. Site 1263 bulk δ13C records (grey line) are from Zachos et al. (2005) and Site 690 recordsoints is from Zachos et al. (2005).
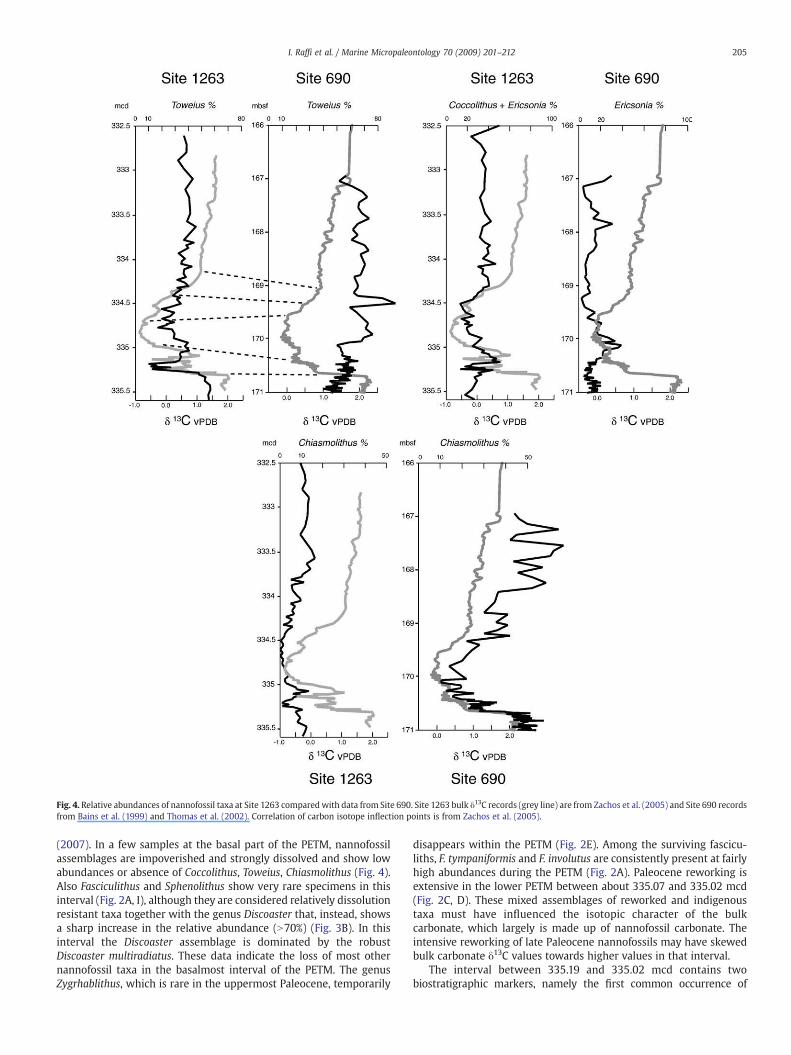
Fig. 4. Relative abundances of nannofossil taxa at Site 1263 comparedwith data from Site 690. Site 1263 bulk δ13C records (grey line) are from Zachos et al. (2005) and Site 690 recordsfrom Bains et al. (1999) and Thomas et al. (2002). Correlation of carbon isotope inflection points is from Zachos et al. (2005).
205I. Raffi et al. / Marine Micropaleontology 70 (2009) 201–212
(2007). In a few samples at the basal part of the PETM, nannofossilassemblages are impoverished and strongly dissolved and show lowabundances or absence of Coccolithus, Toweius, Chiasmolithus (Fig. 4).Also Fasciculithus and Sphenolithus show very rare specimens in thisinterval (Fig. 2A, I), although they are considered relatively dissolutionresistant taxa together with the genus Discoaster that, instead, showsa sharp increase in the relative abundance (N70%) (Fig. 3B). In thisinterval the Discoaster assemblage is dominated by the robustDiscoaster multiradiatus. These data indicate the loss of most othernannofossil taxa in the basalmost interval of the PETM. The genusZygrhablithus, which is rare in the uppermost Paleocene, temporarily
disappears within the PETM (Fig. 2E). Among the surviving fascicu-liths, F. tympaniformis and F. involutus are consistently present at fairlyhigh abundances during the PETM (Fig. 2A). Paleocene reworking isextensive in the lower PETM between about 335.07 and 335.02 mcd(Fig. 2C, D). These mixed assemblages of reworked and indigenoustaxa must have influenced the isotopic character of the bulkcarbonate, which largely is made up of nannofossil carbonate. Theintensive reworking of late Paleocene nannofossils may have skewedbulk carbonate δ13C values towards higher values in that interval.
The interval between 335.19 and 335.02 mcd contains twobiostratigraphic markers, namely the first common occurrence of

206 I. Raffi et al. / Marine Micropaleontology 70 (2009) 201–212
morphotypes that are referable to Fasciculithus thomasii and theevolutionary appearance of peculiar forms of deformed and weaklycalcified discoasterids (Fig. 2B, G). These discoasterids have anasymmetrical radial structure with a prominent irregular central knoband most of them can be referred to D. anartios. Its first occurrence isused to define the N2 biohorizon at Site 1263 (Fig. 5), which occurred47 kyrs after the onset of the CIE (Röhl et al., 2007). Malformation is notrestricted to D. anartios, but appears among specimens of Discoastermediosus, Discoaster nobilis and Discoaster falcatus. These taxa and D.multiradiatus are the major components of discoasterid assemblageswithin the lower Eocene interval (Ypresian). An abundance peak of theshort-lived F. thomasii also begins at the N2 level (Fig. 5). The firstoccurrence of rare, small specimens of Discoaster salisburgensis, and
Fig. 5. Positions of calcareous nannofossil biohorizons N1–N5 from Sites 1263 and 1262 in rrecord in core and recovery intervals, and precession cycle numbers which refer to the lith
sporadic single specimens of Rhomboaster, further characterizes thisinterval. The scattered presence of other rare taxa such as Biantholithus,Markalius and Thoracosphaera, which never exceed 2% of the non-coccolith fraction, is not used in our interpretations of the photic zoneenvironments.
The interval of the ∂13Cminimumbetween 334.95 and 334.75mcd ismarked by increased abundances of F. thomasii and deformeddiscoasterids, just below the lowermost common and continuousoccurrence of the genus Rhomboaster. There is a turnover in abundancebetween Rhomboaster spp. and F. thomasii, and deformed discoasterids(Fig. 5). The consistent occurrence of the spined R. calcitrapa group andR. cuspis is recorded at 334.86mcd,which is used todelineate biohorizonN3 (Fig. 2H). The N3 event occurred 58 kyrs into the PETM according to
elation to the carbon isotope stratigraphy (Zachos et al., 2005). Subdivision of the 1263ological cycles identified in Fe and Ba RXF data records (after Röhl et al., 2007).
207I. Raffi et al. / Marine Micropaleontology 70 (2009) 201–212
the cyclostratigraphic model of Röhl et al. (2007). The appearance ofTribrachiatus bramlettei, with rare overgrown specimens, also coincideswith biohorizon N3 at Site 1263.
The occurrence of the excursion taxa, R. calcitrapa gr., D. anartios,andD. araneus (Cramer et al., 2000; Monechi et al., 2000; Aubry, 2001;Bralower, 2002; Kahn and Aubry, 2004), is unique and apparently aglobal occurrence (Acme) across the PETM interval (Raffi et al., 2005;Agnini et al., 2006, 2007a), although D. araneus is missing at Site 1263.The interval between 335.05 and 334.46 mcd has the lightest carbonisotope values. This interval is also characterized, in terms ofcalcareous nannofossil changes, by (i) high abundances of fasciculiths(≥600 specimens/mm2) (Fig. 2A) comprising 20% of the totalassemblage and 50% of the non-coccolith assemblage (Fig. 4A), (ii) a
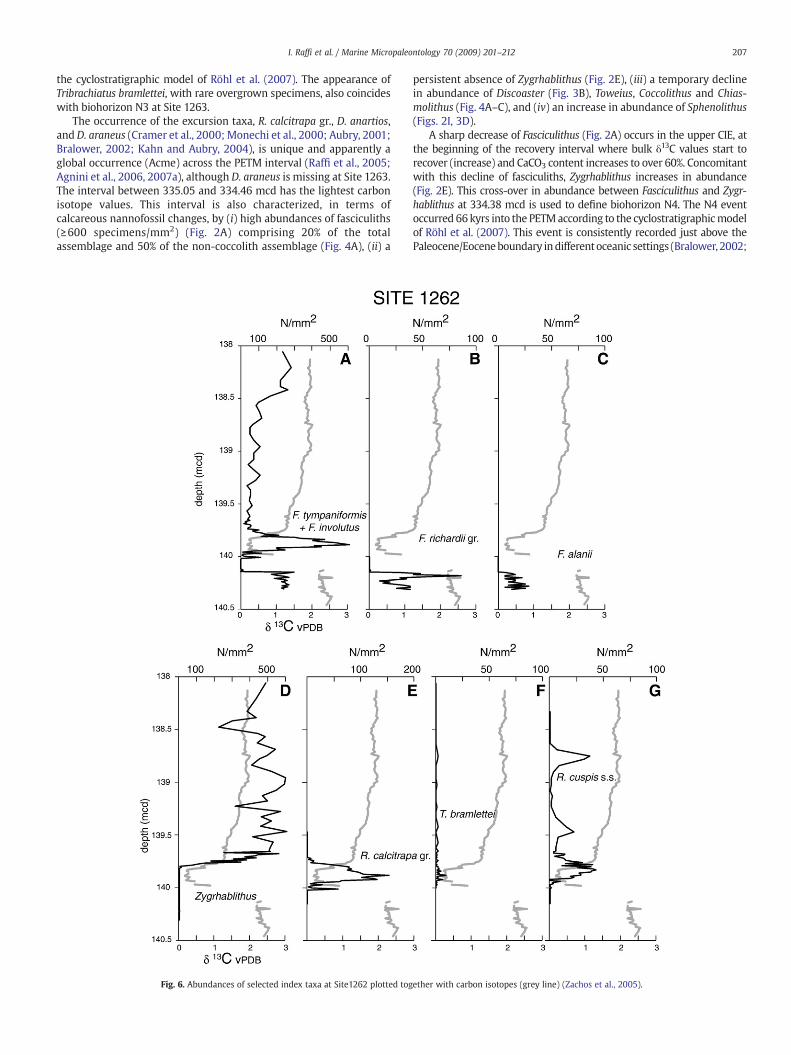
Fig. 6. Abundances of selected index taxa at Site1262 plotted tog
persistent absence of Zygrhablithus (Fig. 2E), (iii) a temporary declinein abundance of Discoaster (Fig. 3B), Toweius, Coccolithus and Chias-molithus (Fig. 4A–C), and (iv) an increase in abundance of Sphenolithus(Figs. 2I, 3D).
A sharp decrease of Fasciculithus (Fig. 2A) occurs in the upper CIE, atthe beginning of the recovery interval where bulk δ13C values start torecover (increase) and CaCO3 content increases to over 60%. Concomitantwith this decline of fasciculiths, Zygrhablithus increases in abundance(Fig. 2E). This cross-over in abundance between Fasciculithus and Zygr-hablithus at 334.38 mcd is used to define biohorizon N4. The N4 eventoccurred 66kyrs into the PETMaccording to the cyclostratigraphicmodelof Röhl et al. (2007). This event is consistently recorded just above thePaleocene/Eoceneboundary indifferentoceanic settings (Bralower, 2002;
ether with carbon isotopes (grey line) (Zachos et al., 2005).
208 I. Raffi et al. / Marine Micropaleontology 70 (2009) 201–212
Tremolada andBralower, 2004;Gibbs et al., 2006; Tremolada et al., 2007).Bralower (2002) suggested that Zygrhablithusmay have simply occupiedthe ecological niche vacated by Fasciculithus.
The highest occurrence of the spined Rhomboaster spp. wasobserved at 334.27 mcd (Fig. 5), which is used to define biohorizonN5. The N5 event occurred 74 kyrs into the PETM, where CaCO3
contents stabilized at around 90% (Zachos et al., 2005). The R. calcitrapagr. thus has a restricted range in the upper part of the PETM at Site1263. The N5 event is coeval with an increase in abundance ofT. bramlettei (Fig. 2H). Rare specimens of Braarudosphaera bigelowiwere observed close to the N5 event. The interval between biohorizonsN4 and N5 is characterized by increasing relative abundance ofDiscoaster and Sphenolithus (Fig. 3B, D).
Some nannofossil taxa show abundance patterns that are similar tothe carbon isotope curve. This is particularly evident for Zygrhablithusin the upper part of the PETM (Figs. 2E, 3C), within the early stages ofthe δ13C recovery interval. Abundances of Coccolithus, Toweius and, toa lesser extent, Chiasmolithus (Fig. 4), are grossly mirrored by the δ13Crecord. In contrast, an inverse relationship is observed between δ13Cand abundances of Fasciculithus (Fig. 2A).
3.2. Site 1262
The interval between 141.14 and 140.02 mcd is largely barren ofnannofossils at Site 1262 (Fig. 6) because of intense carbonatedissolution (Zachos et al., 2005). Biohorizon N1 (Fig. 5) coincideswith the base, at 140.145 mcd, of the 12-cm barren interval (Fig. 6).D. anartios (N2) and the coeval peak abundance F. thomasii are notpreserved at Site 1262. From the beginning of the PETM recoveryinterval and upsection, the distribution of key taxa is similar at Sites1262 and 1263. This interval is marked by the gradual recovery ofcarbonate preservation. At the deep Site 1262, however, thenannofossil assemblages are clearly affected by dissolution through-out the recovery interval, as reflected by high abundances ofdissolution resistant taxa such as Rhomboaster (Fig. 6E). BiohorizonN4 corresponds to the sharp decrease of fasciculiths at 139.79 mcd(Fig. 6A), where Zygrhablithus spp. re-enters the stratigraphic record(Fig. 6D). Biohorizon N5, the highest occurrence of the spinedRhomboaster spp., is observed at 139.72 mcd (Fig. 5).
4. Discussion
Biohorizons N1 to N5 represent five distinct and biostratigraphi-cally useful events among the nannofossil assemblages that occurredover 74 kyrs. This concentration of evolutionary change in a marinephytoplankton group over such a brief geologic time is absolutelyunique. No other 74-kyrs interval shows so many distinct biostrati-graphic events in any part of the Cenozoic Era. It therefore appearsreasonable to conclude that these biostratigraphic events representbiological responses to highly variable and/or extreme conditions inthe photic zone environment. Temperature, nutrient cycling, andcarbon geochemistry are themost obvious underlying factors thatmayhave influenced the observed compositional and abundance variationsamong the calcareous nannoplankton assemblages during the PETM.
The nannofossil assemblages at Sites 1263 and 1262 show trendsthat are both unique and similar to those observed at other localities,providing an opportunity to constrain preservational biases fromprimary environmental signals. To isolate regional from global signals,we compare the Site 1263 recordwith data derived from studies of thewell-preserved specimens of Site 690 (Bralower, 2002; Figs. 3, 4).
4.1. Photic zone environments and preservational biases
Since productivity and calcite export from the photic zone shouldhave been similar at Sites 1263 and 1262, major differences incomposition and abundance among the calcareous nannofossil
assemblages are interpreted to represent preservational artifactscaused by depth dependent dissolution. For example, the peakabundance of the R. calcitrapa gr. between 139.95 and 139.9 mcd(Fig. 6E) at Site 1262 is not present at 1263, and thus likely representsone such artifact.
Other changes, however, presumably reflect variations in the photiczone environments. This interpretation is based on the fact that theevolving calcareous nannofossil assemblages clearly correlate toprecession cycles delineatedwithin the PETMusing X-Ray Fluorescence(XRF) core scanning records (Röhl et al., 2007). The XRF cycles arepartially caused by carbonate dissolution, but in our records eachprecession cycle has its own characteristic assemblage features (Fig. 5).For example, the peak abundance of F. thomasii corresponds to cycle 2,the peak in abundance of D. anartios to cycle 3, the increase ofR. calcitrapa gr. to cycle 3/4 transition, the decline in abundance ofF. thomasii anddeformeddiscoasterids and ‘peak’ of Fasciculithus to cycle4, and the distinct increase of Zygrhablithus to cycle 4/5 transition. Thisseries of biostratigraphic events and intervening assemblages do notprimarily represent carbonate dissolution artifacts, but rather indicatethat the observed variability in composition and abundance among thecalcareous nannofossil assemblages over the brief PETM interval wereinduced by orbitally paced changes in the photic zone environment.
Although carbonate dissolution at Site 1263 was less severe than atthe deep Site 1262, itwas stillmore severe than at Site 690, implying thatdissolution should have affected the ‘moderately to well’ preservednannofossil assemblages at Site 1263. Although the composition of theassemblages as well as the export of biogenic calcite was likely differentbetween the sites, comparison with Site 690 allows us to assess someimpacts of dissolution at Site 1263.Anexample of dissolution relatedbiasat Site 1263 is reflected in relative abundances of Discoaster. At the veryonset of the PETM, nannofossil abundances are strongly reduced in a fewsamples, mainly being represented by a few discoasterids (Fig. 2). Threeof these samples therefore show relative abundances of Discoaster ofN70% (Fig. 3B). It appears reasonable to attribute this brief Discoasterabundance increase at Site 1263 to a shallowing lysocline and carbonatedissolution rather than a change in the input signal, becausemembers ofthis genus are artificially concentrated when the biogenic carbonate atthe sediment–water interface is strongly dissolved (Wise, 1977). Whenthe relative abundances of other taxa decrease due to dissolution,abundance ofDiscoaster increases. These other taxa include Sphenolithusand Fasciculithus at Site 1263 (Fig. 3). The decrease of these genera thusprimarily reflect dissolution, suggesting that it is difficult to interpret theabundance variations in the lowermost PETM as observed at Site 1263 interms of trophic level or temperature because there, the original inputsignals have been masked and biased by carbonate dissolution. Oncecarbonate dissolution begins to severely blur the photic zone inputsignals, it will be difficult to disentangle paleoecologically inducedvariability from preservational effects at any given time.
4.2. Discoaster–Fasciculithus–Sphenolithus abundance variations
At Site 690, Bralower (2002) inferred conditions of increasedoligotrophy during the PETM, based on sharp increases in abundanceof Discoaster and Fasciculithus at its onset (Fig. 3A, B). Subsequently,Tremolada and Bralower (2004), Gibbs et al. (2006) and Tremolada et al.(2007) suggested that similar oligotrophic conditions were extended toall open ocean photic zone environments. The record at Site 1263 doesnot support such an interpretation. A dissolution induced Discoasterabundance spike over 3 cm at the very onset of the PETM at Site 1263 isfollowed, within the lower PETM, by a return to pre-PETM and post-PETM abundance values (Fig. 3B). This stratigraphic development ofrelative abundances ofDiscoasterover the PETMat Site 1263 differs fromthe better-preserved and corresponding interval at Site 690.
In the middle part of the CIE, Discoaster and Fasciculithus do not co-vary at Site 1263 (Fig. 2A, F; Fig. 3A, B), which would be expected ifboth represent warm and oligotrophic conditions (Haq and Lohmann,
209I. Raffi et al. / Marine Micropaleontology 70 (2009) 201–212
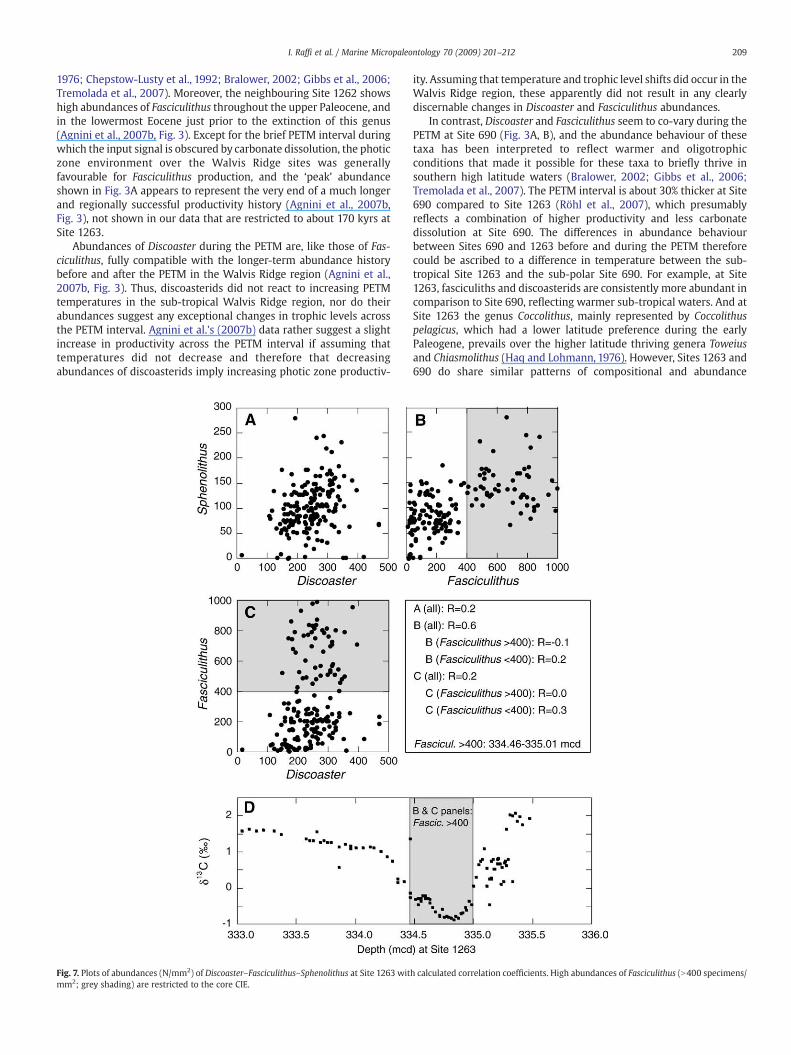
1976; Chepstow-Lusty et al., 1992; Bralower, 2002; Gibbs et al., 2006;Tremolada et al., 2007). Moreover, the neighbouring Site 1262 showshigh abundances of Fasciculithus throughout the upper Paleocene, andin the lowermost Eocene just prior to the extinction of this genus(Agnini et al., 2007b, Fig. 3). Except for the brief PETM interval duringwhich the input signal is obscured by carbonate dissolution, the photiczone environment over the Walvis Ridge sites was generallyfavourable for Fasciculithus production, and the ‘peak’ abundanceshown in Fig. 3A appears to represent the very end of a much longerand regionally successful productivity history (Agnini et al., 2007b,Fig. 3), not shown in our data that are restricted to about 170 kyrs atSite 1263.
Abundances of Discoaster during the PETM are, like those of Fas-ciculithus, fully compatible with the longer-term abundance historybefore and after the PETM in the Walvis Ridge region (Agnini et al.,2007b, Fig. 3). Thus, discoasterids did not react to increasing PETMtemperatures in the sub-tropical Walvis Ridge region, nor do theirabundances suggest any exceptional changes in trophic levels acrossthe PETM interval. Agnini et al.'s (2007b) data rather suggest a slightincrease in productivity across the PETM interval if assuming thattemperatures did not decrease and therefore that decreasingabundances of discoasterids imply increasing photic zone productiv-
Fig. 7. Plots of abundances (N/mm2) of Discoaster–Fasciculithus–Sphenolithus at Site 1263 witmm2; grey shading) are restricted to the core CIE.
ity. Assuming that temperature and trophic level shifts did occur in theWalvis Ridge region, these apparently did not result in any clearlydiscernable changes in Discoaster and Fasciculithus abundances.
In contrast, Discoaster and Fasciculithus seem to co-vary during thePETM at Site 690 (Fig. 3A, B), and the abundance behaviour of thesetaxa has been interpreted to reflect warmer and oligotrophicconditions that made it possible for these taxa to briefly thrive insouthern high latitude waters (Bralower, 2002; Gibbs et al., 2006;Tremolada et al., 2007). The PETM interval is about 30% thicker at Site690 compared to Site 1263 (Röhl et al., 2007), which presumablyreflects a combination of higher productivity and less carbonatedissolution at Site 690. The differences in abundance behaviourbetween Sites 690 and 1263 before and during the PETM thereforecould be ascribed to a difference in temperature between the sub-tropical Site 1263 and the sub-polar Site 690. For example, at Site1263, fasciculiths and discoasterids are consistently more abundant incomparison to Site 690, reflecting warmer sub-tropical waters. And atSite 1263 the genus Coccolithus, mainly represented by Coccolithuspelagicus, which had a lower latitude preference during the earlyPaleogene, prevails over the higher latitude thriving genera Toweiusand Chiasmolithus (Haq and Lohmann, 1976). However, Sites 1263 and690 do share similar patterns of compositional and abundance
h calculated correlation coefficients. High abundances of Fasciculithus (N400 specimens/

210 I. Raffi et al. / Marine Micropaleontology 70 (2009) 201–212
changes, for example the replacement of Fasciculithus by Zygrha-blithus (Fig. 3), even if the Fasciculithus/Zygrhablithus abundancecross-over is time-transgressive, occurring about 30 kyrs later at Site1263. The abundance increase of Zygrhablithus in the lower part of thePETM recovery interval (Fig. 3C) represents the first commonoccurrence of this taxon in the Walvis Ridge region because it is rareor absent in upper Paleocene and lower PETM sediments (Agnini et al.,2007b).
Thus, the warming during the PETM was the major factorcontrolling nannofossil assemblages at the high latitude Site 690,favouring a consistent increase in abundance of Discoaster and Fasci-culithus. In the sub-tropical Walvis Ridge region, however, conditionsdid not become more favourable for these taxa, and the influence ofthe temperature increase was negligible in controlling assemblageabundances. The strong thermal control on distribution is consistentwith observations of modern plankton (Bopp et al., 2001).
Calcareous nannofossil census data in Paleocene/Eocene sectionsfrom Site 690, Wilson Lake at the New Jersey margin, and Site 1209from the Shatsky Rise, have been employed to calculate correlationcoefficients between different genera (Bralower, 2002; Gibbs et al.,2006) in order to facilitate reconstructions of photic zone paleoenvir-onments. These calculations, however, are based on relative abun-dance (%) data, and yield a closed sum problem: when one genusincrease in abundance some other taxonomic component mustdecrease by default. We have plotted abundances of Discoaster, Fas-ciculithus (Fig. 7A) and Sphenolithus (Fig. 7C) against each other andcalculated correlation coefficients on the N/mm2 data (Fig. 7), whichare not affected by the closed sum problem. The Discoaster/Spheno-lithus and Discoaster/Fasciculithus scatter plots do not show anysignificant positive or negative correlations for the Site 1263 data,contrary to the expected result, because nannoplankton havingsimilar ecological preferences (warm and oligotrophic) ought toproduce more coherent responses to changes of temperature andnutrient availability in the photic zone environment. A weak positivecorrelation may be deduced from the Sphenolithus/Fasciculithusrelationship (Fig. 7B) at Site 1263. However, high abundances (N400specimens/mm2) of Fasciculithus are entirely confined to the peakphase of the PETM. And despite the large variation of Fasciculithusabundances in that interval (Fig. 7), there is no significant correlationamong the Sphenolithus/Fasciculithus (R=−0.1; Fig. 7B) or Discoaster/Fasciculithus (R=0.0; Fig. 7C) relationships. It's clear that we stillhave an incomplete understanding of the significance of abundancevariations among different calcareous nannofossil genera in terms ofphotic zone paleoecology, especially give the limited datasets that areavailable.
4.3. Calcareous nannofossil malformation and increased CO2
concentrations in the water column
Deformed and weakly calcified Discoaster specimens (D. anartios,and deformedD. nobilis,D. falcatus andD.mediosus) are common duringthe PETM interval. Similar deformation effects of other Discoaster taxahave been observed in a subsequent early Eocene hyperthermal (ETM2;also referred to as H1 or Elmo) (Raffi and De Bernardi, 2008). Weinterpret the unusual and weakly calcified F. thomasii morphotype,which occur togetherwith the deformed discoasterids during the PETM,to represent a stressed response to unusual photic zone conditionsduring the early Eocene hyperthermals. Scanning electron micrographanalyses of these peculiar nannoliths in the PETM interval providefurther details with respect to their preservation and calcification (Raffiand De Bernardi, 2008). The taxonomic status of discoasterids is unclearvisavi coccolitophorids. Yet, it appears reasonable to assume that thesenannoliths, that show anomalous morphologies in terms of malforma-tion and calcification during the early Eocene hyperthermals, mayrepresent the fossil documentation of a process observed in moderncalcifying phytoplankton species. Several experiments in which nanno-
plankton are exposed to elevated CO2 concentrations have resulted inreduced calcite production and malformation (Riebesell et al., 2000;Zondervan et al., 2001; Rost and Riebesell, 2004; Langer et al., 2006).Consequently, the distinct occurrences of malformed nannofossilsduring two brief early Eocene hyperthermals which are characterizedby massive inputs of CO2 into the oceans, and hence lower pH, imply apossible cause and effect relationship.
4.4. Influence of nannofossil assemblage compositions on bulk sedimentcarbon isotopes
Nannofossils are the dominant component of biogenic carbonatesediments at Walvis Ridge, and therefore dictate the bulk sedimentstable isotopic composition. At Site 1263, major changes in assem-blages correspond to more-or-less pronounced inflection points inbulk δ13C. Both at Site 1263 and Site 690, some of the abundance shiftsin the nannofossil records occur in correspondence with inflections inthe two bulk δ13C records (Figs. 2, 3, 5). However, for inflection pointscorrelated between the two sites (Zachos et al., 2005) (Figs. 3, 4), thecomposition and abundances of the nannofossil assemblages differbetween Sites 1263 and 690. At first glance, this may suggest that theinflection points in the two carbon isotope records are not caused byassemblage changes because they are replicated in two geographicallyseparated sedimentary records, having different nannofossil charac-teristics which reflect differences in paleoenvironments. This isconsistent with findings of an investigation of calcareous nannofossilisotopic distribution across the Paleocene/Eocene boundary whichdemonstrated that the carbon isotopic composition of individualPaleocene genera such as Toweius, Chiasmolithus, Discoaster and Fas-ciculithus are consistently offset through the PETM (Stoll, 2005). Inessence, the trends in bulk nannofossil carbonate,made up of differenttaxa, as well as for the “near-monogeneric” taxa, did not change as afunction of abundances.
5. Conclusions
Our investigation of compositional and abundance variationsamong calcareous nannofossil assemblages at two Walvis Ridge sitesin the South Atlantic across the earliest Eocene PETM interval yieldedthe following findings:
- Five biostratigraphically useful and distinct calcareous nannofossilevents (N1 through N5) occur over a 74 kyrs period in the early partof the PETM, using the floating timescale of Röhl et al. (2007);
- this rapid evolution, partly characterized by the emergence ofmalformed and/or weakly calcified morphotypes, among thecalcareous nannoplankton over such a brief geologic time is uniquein a Cenozoic perspective, and is taken to indicate stressed, unstableand/or extreme photic zone environments;
- the two sites investigated for this study are located less than 50 kmapart in distance, but 2 km apart in terms of water depth, whichmeans any abundance differences are purely preservational inorigin;
- nannofossil assemblage at Site 1263 is strongly biased bydissolution in a 6-cm interval of the basal portions of the PETM.The series of biostratigraphic events and assemblage turnoversrepresent, however, orbitally paced changes in the photic zoneenvironments and hence paleoecological variability;
- increased abundances of the genera Discoaster–Fasciculithus–Sphenolithus during the PETM have been interpreted to representwarm and oligotrophic photic zone environments in open oceansites. At Site1263, however, these genera do not show any marked,paleoecologically induced, abundance variability if compared tobackground abundances before and after the PETM. If anything,Discoaster abundances can be interpreted to represent increasedPETM productivity at the Walvis Ridge sites;

211I. Raffi et al. / Marine Micropaleontology 70 (2009) 201–212
- the Discoaster/Fasciculithus, Discoaster/Sphenolithus and Fascicu-lithus/Sphenolithus relationships show no significant correlation,which is unexpected because these taxa are considered torepresent warm and oligotrophic photic zone environments andshould therefore show relatively coherent abundance responses tochanges in temperature and productivity. This indicates thatmultiple factors may have contributed to the assemblage changesand that further research is required to improve our understandingof the factors that control calcareous nannofossil abundance;
- presence of malformed and/or weakly calcified taxa during two ofthe early Eocene hyperthermals implies a similar cause and effectrelationship. A reasonable explanation may be the hugelyincreased carbon dioxide concentrations in all parts of the watercolumn, including the photic zone, during these hyperthermals;
- comparisons between Sites 1263 and 690 reveal, on one hand,similar shapes and amplitudes of bulk δ13C isotopic records and, onthe other, relevant differences in relative nannofossil assemblagecompositions. This implies that assemblage changes had littleeffect on the inflection points in the nannofossil δ13C records,which is consistent with Stoll's (2005) results that differentPaleocene nannofossil taxa are characterized by virtually uniformcarbon isotope values.
Acknowledgements
Claudia Agnini and Bianca De Bernardi are thanked for support,stimulating discussions and exchange of ideas on nannofossils. Thisresearch used samples provided by the Ocean Drilling Program (ODP)sponsored by the U.S. National Science Foundation and participatingcountries under management of Joint Oceanographic Institutions.Comments by Tim Bralower and Elisabetta Erba on an earlier versionof the manuscript are appreciated. Funding for this research wasprovided from the Italian Murst-PRIN 2006-2007 to IR (nationalcoordinator I. Premoli Silva). JB was supported by the Swedish ResearchCouncil, JCZ by NSF Grant EAR-0628719 and AS by the NetherlandsOrganisation for Scientific Research (NWO) VENI grant 863.07.001.
Appendix A. Taxonomic list of calcareous nannofossils
The list includes all the taxa cited in the paper. The taxonomy andbibliographical references follow Perch-Nielsen (1985) and Aubry(1984, 1988, 1989, 1990).
Biantholithus Bramlette & Martini, 1964B. bigelowi Gran & Braarud, 1935) Deflandre, 1947Chiasmolithus Hay, Mohler & Wade, 1966Coccolithus Schwarz, 1894C. pelagicus Schiller, 1930Discoaster Tan Sin Hok, 1927D. anartios Bybell & Self-Trail, 1995D. araneus Bukry, 1971D. falcatus Bramlette & Sullivan, 1961D. mediosus Bramlette & Sullivan, 1961D. multiradiatus Bramlette & Riedel, 1954D. nobilis Martini, 1961D. salisburgensis Stradner, 1961Ericsonia robusta Perch Nielsen, 1977Fasciculithus Bramlette & Sullivan, 1961Fasciculithus alanii Perch-Nielsen, 1971F. hayi Haq, 1971F. involutus Bramlette & Sullivan, 1961F. mitreus Gartner, 1971F. richardii Perch-Nielsen, 1971F. schaubii Hay & Mohler, 1967F. thomasii Perch-Nielsen, 1971F. toni Perch-Nielsen, 1971
F. tympaniformis Hay & Mohler, 1967Markalius Bramlette & Martini, 1964Octolithus Perch-Nielsen, 1973Rhomboaster Bramlette & Sullivan, 1961R. cuspis Bramlette & Sullivan, 1961R. calcitrapa Gartner, 1971R. spineus (Romein, 1979) Perch-Nielsen, 1984Sphenolithus Deflandre in Grasse, 1952Thoracosphaera Kamptner, 1927Toweius Hay & Mohler, 1967Toweius tovae Perch-Nielsen, 1971T. bramlettei Proto Decima et al., 1975Zygrhablithus Deflandre, 1959Z. bijugatus Deflandre, 1959
Appendix B. Supplementary data
Supplementary data associated with this article can be found, inthe online version, at doi:10.1016/j.marmicro.2008.12.005.
References
Abdul Aziz, H., Hilgen, F.J., van Luijk, G.M., Sluijs, A., Kraus,M.J., Pares, J.M., Gingerich, P.D.,2008. Astronomical climate control on paleosol stacking patterns in the upperPaleocene–lower Eocene Willwood Formation, Bighorn Basin, Wyoming. Geology36, 531–534. doi:510.1130/G24734A.
Agnini, C., Muttoni, G., Kent, D.V., Rio, D., 2006. Eocene biostratigraphy and magneticstratigraphy from Possagno, Italy: the calcareous nannofossil response to climatevariability. Earth Planet. Sci. Lett. 241, 815–830. doi:10.1016/j.epsl.2005.11.005.
Agnini, C., Fornaciari, E., Rio, D., Tateo, F., Backman, J., Giusberti, L., 2007a. Responses ofcalcareous nannofossil assemblages, mineralogy and geochemistry to the environ-mental perturbations across the Paleocene/Eocene boundary in the Venetian Pre-Alps. Mar. Micropaleontol. 63, 19–38. doi:10.1016/j.marmicro.2006.10.002.
Agnini, C., Fornaciari, E., Raffi, I., Rio, D., Röhl, U., Westerhold, T., 2007b. High-resolutionnannofossil biochronology of middle Paleocene to early Eocene at ODP Site 1262:implications for calcareous nannoplankton evolution. Mar. Micropaleontol. 64,215–248. doi:10.1019/j.marmicro.2007.05.003.
Aubry,M.-P.,1984. Handbook of Cenozoic calcareous nannoplankton, book 1, Ortholithae(Discoaster). Micropaleontol. Press, Am. Mus. of Nat. Hist., New York. 263 pp.
Aubry, M.-P., 1988. Handbook of Cenozoic calcareous nannoplankton, book 2,Ortholithae (Holococcoliths, Ceratoliths, Ortholiths and other). Micropaleontol.Press, Am. Mus. of Nat. Hist., New York. 279 pp.
Aubry, M.-P., 1989. Handbook of Cenozoic calcareous nannoplankton, book 3,Ortholithae (Pentaliths and other), Heliolithae (Fasciculiths, Sphenoliths andothers). Micropaleontol. Press, Am. Mus. of Nat. Hist., New York. 279 pp.
Aubry, M.-P., 1990. Handbook of Cenozoic calcareous nannoplankton, book 4,Heliolithae (Helicoliths, Cribriliths, Lopadoliths and other). Micropaleontol. Press,Am. Mus. of Nat. Hist., New York. 381 pp.
Aubry, M.-P., 2001. Provincialism in the photic zone during the LPTM. In: Ash, A., Wing,S. (Eds.), Climate and Biota of the Early Paleogene. International Meeting, Powell,Abstract Volume, Powell, p. 6.
Aubry, M.-P., Requirand, C., Cook, J., 2000. The Rhomboaster–Tribrachiatus lineage: aremarkable succession of events from 55.5 to 53.2 Ma. GFF 122, 15–18.
Aubry, M.-P., Ouda, K., Dupuis, C., Berggren, W.A., Van Couvering, J.A., Members of theWorking Group on the Paleocene/Eocene Boundary, 2007. The Global StandardStratotype-section and Point (GSSP) for the base of the Eocene Series in theDababiya section (Egypt). Episodes 30 (4), 271–286.
Backman, J., 1986. Late Paleocene to middle Eocene calcareous nannofossil biochronol-ogy from the Shatsky Rise, Walvis Ridge and Italy. Palaeogeogr. Palaeoclimatol.Palaeoecol. 57, 43–59.
Backman, J., Shackleton, N.J., 1983. Quantitative biochronology of Pliocene and earlyPleistocene calcareous nannoplankton from the Atlantic, Indian and Pacific Oceans.Mar. Micropaleontol. 8, 141–170.
Backman, J., Raffi, I., 1997. In: Curry,W.B., Shackleton, N.J., Richter, C., Bralower, T.J. (Eds.),Calibration of Miocene Nannofossil Events to Orbitally Tuned Cyclostratigraphiesfrom Ceara Rise. Proc. ODP, Sci. Results, vol. 154. Ocean Drilling Program, CollegeStation, TX, pp. 83–99.
Bains, S., Corfield, R.M., Norris, R.D., 1999. Mechanisms of climate warming at the end ofthe Paleocene. Science 285, 724–727.
Bralower, T.J., 2002. Evidence of surfacewater oligotrophy during the Paleocene–Eocenethermal maximum: nannofossil assemblage data from Ocean Drilling Program Site690, Maud Rise, Weddel Sea. Paleoceanography 17 (2), 1029–1042. doi:10.1029/2001PA000662.
Bopp, L., Monfray, P., Aumont, O., Dufresne, J.-L., Le Treut, H., Madec, G., Terray, L., Orr, J.C.,2001. Potential impact of climate change on marine export production. Glob.Biogeochem. Cycles 15, 81–99.
Bybell, L.M., Self-Trail, J.M., 1995. Evolutionary, biostratigraphic and taxonomic study ofcalcareous nannofossils from a continuous Paleocene–Eocene boundary section inNew Jersey. U.S. Geol. Survey Prof. Pap. 1554 36 pp.

212 I. Raffi et al. / Marine Micropaleontology 70 (2009) 201–212
Bybell, L.M., Self-Trail, J.M., 1997. Late Paleocene and early Eocene calcareousnannofossils from three boreholes in an onshore–offshore transect fromNew Jersey to the Atlantic continental rise. Proc. Ocean Drill. Prog. Sci. Results150X, 91–110.
Chepstow-Lusty, A., Shackleton, N.J., Backman, J., 1992. Upper Pliocene Discoasterabundance variations from the Atlantic, Pacific and Indian oceans: the significanceof productivity pressure at low latitudes. Mem. Sci. Geol. 43, 357–373.
Cramer, B.S., Miller, K.G., Aubry, M.-P., Olsson, R.K., Wright, J.D., Kent, D.V., Browning, J.V.,2000. The Bass River Section: an exceptional record of the LPTM event in a neriticsetting. Bull. Geol. Soc. Fr. 170, 883–897.
Dickens, G.R., O'Neil, J.R., Rea, D.K., Owen, R.M., 1995. Dissociation of oceanic methanehydrate as a cause of the carbon isotope excursion at the end of the Paleocene.Paleoceanography 10, 965–971.
Gibbs, S.J., Bralower, T.J., Bown, P.R., Zachos, J.C., Bybell, L.M., 2006. Shelf and open-oceancalcareous phytoplankton assemblages across the Paleocene–Eocene thermalmaximum: implication for global productivity gradients. Geology 34 (4), 233–236.
Giusberti, L., Rio, D., Agnini, C., Backman, J., Fornaciari, E., Tateo, F., Oddone, M., 2007.Mode and tempo of the Paleocene–Eocene thermal maximum in an expandedsection from the Venetian pre-Alps. Geol. Soc. Am. Bull. 119, 391–412. doi:10.1130/B25994.1.
Haq, B.U., Lohmann, G.P., 1976. Early Cenozoic calcareous nannoplankton biogeographyof the Atlantic Ocean. Mar. Micropaleontol. 1, 119–194.
Iglesias-Rodriguez, M.D., Halloran, P.R., Rickaby, R.E.M., Hall, I.R., Colmenero-Hildago, E.,Gittins, J.R., Green, D.R.H., Tyrrel, T., Gibbs, S.J., vonDassow, P., Rehm, E., Armburst, E.V.,Boessenkool, K.P., 2008. Phytoplankton calcification in a high-CO2 world. Science 320,336–340. doi:10.1126/science.1154122.
Kahn, A., Aubry, M.-P., 2004. Provincialism associated with the Paleocene/Eocenethermal maximum: temporal constraint. Mar. Micropaleontol. 52, 117–131.
Kennett, J.P., Stott, L.D., 1991. Abrupt deep-sea warming, palaeoceanographic changesand benthic extinctions at the end of the Palaeocene. Nature 353, 225–229.
Langer, G., Geisen, M., Baumann, K.-H., Kläs, J., Riebesell, U., Thoms, S., Young, J.R., 2006.Species-specific response of calcifying algae to changing seawater carbonatechemistry. Geochem. Geophys.Geosyst. 7. doi:10.1029/2005GC001227.
Monechi, S., Angori, E., von Salis, K., 2000. Calcareous nannofossil turnover around thePaleocene/Eocene transition at Alamedilla (southern Spain). Bull. Soc. Géol. France171 (4), 477–489.
Mutterlose, J., Linnert, C., Norris, R., 2007. Calcareous nannofossils from the Paleocene–Eocene Thermal maximum of the equatorial Atlantic (ODP Site 1260B): evidence fortropical warming. Mar. Micropaleontol. 65, 13–31.
Perch-Nielsen, K., 1985. Cenozoic calcareous nannofossils. In: Bolli, H.M., et al. (Ed.),Plankton Stratigraphy. Cambridge University Press, New York, pp. 427–554.
Raffi, I., De Bernardi, B., 2008. Response of calcareous nannofossils to the Paleocene–Eocene thermal maximum: observations on composition, preservation andcalcification in sediments from ODP Site 1263 (Walvis Ridge -SW Atlantic). Mar.Micropaleontol. 69, 119–138.
Raffi, I., Backman, J., Pälike, H., 2005. Changes in calcareous nannofossil assemblageacross the Paleocene/Eocene transition from the paleo-equatorial Pacific Ocean.Palaeogeogr. Palaeoclimat. Palaeoc. 226, 93–126.
Riebesell, U., Zondervan, I., Rost, B., Tortell, P.D., Zeebe, R.E., Morel, F.M.M., 2000.Reduced calcification of marine plankton in response to increased atmospheric CO2.Nature 407, 364–367.
Röhl, U., Westerhold, T., Bralower, T.J., Zachos, J.C., 2007. On the duration of thePaleocene–Eocene thermal maximum (PETM). Geochem. Geophys. Geosyst. 8,Q12002. doi:10.1029/2007GC001784.
Romein, A.J.T., 1979. Lineages in early Paleogene calcareous nannoplankton. UtrechtMicropaleont. Bull. 22 231 pp.
Rost, B., Riebesell, U., 2004. Coccolithophores and the biological pump: responses toenvironmental changes. In: Thierstein, H.R., Young, J.R. (Eds.), Coccolithophores,
From Molecular Processes to Global Impact. Springer Verlag, Berlin, Germany,pp. 99–125.
Sluijs, A., Schouten, S., Pagani, M., Woltering, M., Brinkhuis, H., Sinninghe Damsté, J.S.,Dickens, G.R., Huber, M., Reichart, G.-J., Stein, R., Matthiessen, J., Lourens, L.J.,Pedentchouk, N., Backman, J., Moran, K., Expedition 302 Scientists, 2006.Subtropical Arctic Ocean temperatures during the Palaeocene/Eocene thermalmaximum. Nature 441, 610–613.
Sluijs, A., Bowen, G.J., Brinkhuis, H., Lourens, L.J., Thomas, E., 2007. The Palaeocene–Eocene thermal maximum super greenhouse: biotic and geochemical signatures,age models and mechanisms of global change. In: Williams, M., et al. (Ed.), DeepTime Perspectives on Climate Change: Marrying the Signal from Computer Modelsand Biological Proxies. The Micropalaeontological Soc., Special Publ. The GeologicalSociety, London, pp. 323–347.
Stoll, H.M., 2005. Limited range of interspecific vital effects in coccolith stable isotopicrecords during the Paleocene–Eocene thermal maximum. Paleoceanography 20,PA1007. doi:10.1029/2004PA001046.
Thomas, D.J., Zachos, J.C., Bralower, T.J., Thomas, E., Bohaty, S., 2002. Warming the fuelfor the fire: evidence for the thermal dissociation of methane hydrate during thePaleocene–Eocene thermal maximum. Geology 30, 1067–1070.
Tremolada, F., Bralower, T.J., 2004. Nannofossil assemblage fluctuations during thePaleocene–Eocene thermal maximum at Sites 213 (Indian Ocean) and 401 (NorthAtlantic Ocean): palaeoceanographic implications. Mar. Micropaleontol. 52,107–116.
Tremolada, F., Erba, E., Bralower, T.J., 2007. A review of calcareous nannofossil changesduring the early Aptian oceanic anoxic event 1a and the Paleocene–Eocene thermalmaximum: the influence of fertility, temperature, and pCO2. In: Monechi, S., Coccioni,R., Rampino, M.R. (Eds.), Large Ecosystem Perturbations: Causes and Consequences.Geol. Soc. Am. Special Paper, 424, pp. 87–96. doi:10.1130/2007.2424(05).
von Salis, K., Monechi, S., Bybell, L.M., Self-Trail, J., Young, J.R., 2000. Remarks on thecalcareous nannofossil genera Rhomboaster and Tribrachiatus around the Paleo-cene/Eocene boundary. GFF 122, 138–140.
Wei, W., Zhong, S., 1996. Taxonomy and magnetobiochronology of Tribrachiatusbramlettei and Rhomboaster, two genera of calcareous nannofossils. J. Paleontol.70 (1), 7–22.
Westerhold, T., Röhl, U., Laskar, J., Raffi, I., Bowles, J., Lourens, L.J., Zachos, J.C., 2007.On the duration of magnetochrons C24r and C25n and the timing of earlyEocene global warming events: implications from the Ocean Drilling ProgramLeg 208 Walvis Ridge depth transect. Paleoceanography 22 PA2201. doi:10.1029/2006PA001322.
Wise, S.W., 1977. Chalk formation: early diagenesis. In: Anderson, N.R., Malahoff,A. (Eds.), The Fate of Fossil Fuel CO2 in the Oceans. Plenum Press, New York,pp. 717–739.
Zachos, J.C., Pagani, M., Sloan, L.C., Billups, K., Thomas, E., 2001. Trends, rhythms, andaberrations in global climate 65 Ma to present. Science 292, 686–693. doi:10.1126/science.1059412.
Zachos, J.C., Kroon, D., Blum, P., et al., 2004. Early Cenozoic extreme climates: theWalvisRidge transect. Proc. Ocean Drill. Program, Initial Rep 208 http://www odp.tamu.edu/publications/208_IR/208ir.htm.
Zachos, J.C., Röhl, U., Schellenberg, S.A., Sluijs, A., Hodell, D.A., Kelly, D.C., Thomas, E.,Nicolo, M., Raffi, I., Lourens, L.J., McCarren, H., Kroon, D., 2005. Rapid acidification ofthe ocean during the Paleocene–Eocene thermal maximum. Science 308,1611–1615.
Zondervan, I., Zeebe, R.E., Rost, B., Riebesell, U., 2001. Decreasing marine biogeniccalcification: a negative feedback on rising atmispheric pCO2. Global Biogeochem.Cycles 15 (2), 507–516.
Related Documents