Residential mobility and outcome change in deprived areas Evidence from the New Deal for Communities Programme www.communities.gov.uk community, opportunity, prosperity

Welcome message from author
This document is posted to help you gain knowledge. Please leave a comment to let me know what you think about it! Share it to your friends and learn new things together.
Transcript

Residential mobility and outcome change in deprived areasEvidence from the New Deal for Communities Programme
www.communities.gov.ukcommunity, opportunity, prosperity


Residential mobility and outcome change in deprived areasEvidence from the New Deal for Communities Programme
October 2009Christina Beatty, Paul Lawless, Sarah Pearson and Ian Wilson
Centre for Regional Economic and Social Research, Sheffield Hallam University
Department for Communities and Local Government

Department for Communities and Local GovernmentEland HouseBressenden PlaceLondon SW1E 5DUTelephone: 020 7944 4400Website: www.communities.gov.uk
© Queen’s Printer and Controller of Her Majesty’s Stationery Office, 2009
Copyright in the typographical arrangement rests with the Crown.
This publication, excluding logos, may be reproduced free of charge in any format or medium for research, private study or for internal circulation within an organisation. This is subject to it being reproduced accurately and not used in a misleading context. The material must be acknowledged as Crown copyright and the title of the publication specified.
Any other use of the contents of this publication would require a copyright licence. Please apply for a Click-Use Licence for core material at www.opsi.gov.uk/click-use/system/online/pLogin.asp, or by writing to the Office of Public Sector Information, Information Policy Team, Kew, Richmond, Surrey TW9 4DU
e-mail: [email protected]
If you require this publication in an alternative format please email [email protected]
Communities and Local Goverment PublicationsTel: 0300 123 1124Fax: 0300 123 1125Email: [email protected] via the Communities and Local Government website: www.communities.gov.uk
October 2009
Product Code: 09ACST05895
ISBN 978-1-4098-1396-5
The findings and recommendations in this report are those of the authors and do not necessarily represent the views of the Department for Communities and Local Government.

Residential mobility and outcome change in deprived areas | 3
Contents
Acknowledgements 5
Summary 6
1. Introduction 11
Evaluation of the NDC Programme 12
2. Residential mobility and the regeneration of deprived areas: evidence review 14
Deprivation, instability and population turnover 15
Do ABIs fuel selective migration? 17
The impact of residential mobility on services 18
Residential mobility and outcome change 19
3. Dimensions of residential mobility in NDC areas 21
Key indicators of residential mobility 22
Programme level residential mobility 23
How does mobility in NDC areas compare to that in other deprived areas and nationally? 24
NDC area-level mobility 25
Mobility within NDC areas 29
Movement between NDCs and other areas 29
Mobility and aspirations 32
In-movers, out-movers and frequent movers 33
Concluding comments 38
4. Understanding residential mobility in NDC areas 39
Explaining differences in mobility rates 40
What are the effects of residential mobility on NDC neighbourhoods? 47
5. Residential mobility and positive neighbourhood change 52
Outcome change in NDCs classified as ‘high’ ‘medium’ and ‘low’ residential mobility 53
Outcome change and NDC areas with different levels of residential mobility 55
Outcome change for individuals who remain living in NDC areas with different levels of residential mobility 56
Place-based services – environment, housing and crime 58

4 | Residential mobility and outcome change in deprived areas
People-based services – education, employment and health 63
Residential mobility and community cohesion 69
Concluding comments 70
6. Conclusions and policy implications 71
References 73
Appendix 1: Indicators of residential mobility 76
Appendix 2: Household survey design 78
Appendix 3: Logistic regression odds ratios 80
Appendix 4: Socio-demographic profile of case study areas 82
Appendix 5: Variables included in key drivers of area-level residential mobility model 86
Appendix 6: Maps of NDC areas – typology of nature of mobility 87
Appendix 7: Residential mobility classification 89
Residential mobility and outcome change in deprived areas | 5
AcknowledgementsThe authors of this report would like to thank their colleagues in the national evaluation team including:
• CRESR data team members: Mike Foden, and Deborah Platts-Fowler
• researchers who undertook locality based work including Elaine Batty and Rose Ardron (CRESR); Geoff Fordham (GFA); Charlotte Clarke (SQW); Crispian Fuller (University of Warwick) and Richard Meegan (Liverpool John Moores University)
The authors would also like formally to thank evaluation contacts in Communities and Local Government, notably Penny Withers, for advice and guidance.
Thanks are also due to those in the NDC case study Partnerships and their partner agencies who contributed their time and expertise by participating in interviews and meetings and who also supplied additional data and documentation to the evaluation team.

6 | Residential mobility and outcome change in deprived areas
SummaryThis report presents the findings of research which addresses relationships between residential mobility and neighbourhood change in New Deal for Communities (NDC) areas. The research has been carried out by the NDC national evaluation team using data from household surveys in NDC and comparator areas and evidence from seven case studies: Bradford, Knowsley, Lambeth, Newham, Newcastle, Sheffield and Walsall.
There are 39 NDC areas, each accommodating an average of 9,800 people. Local NDC Partnerships are implementing approved delivery plans for an average of £50m investment over a 10 year period. The aim of the NDC Programme is to close the gaps between NDC areas and the rest of the country in the five key outcome areas of health, education, employment, community safety and housing and the environment.
Residential mobility and the regeneration of deprived areas
Residential mobility impacts on neighbourhood renewal in complex ways. On the one hand, mobility amongst individuals may be seen as positive, in that it may reflect access to better housing or employment circumstances. On the other hand, high levels of mobility in deprived areas can be problematic, being often associated with decreasing social capital, increasing problems around social cohesion and increasing demands on local services.
Evidence from other studies suggests that demographics are a key influence on mobility at the area level; higher levels of mobility are particularly associated with younger populations. Analysis of data for NDC areas suggests that those moving out of NDC areas are more likely to be in employment and moving into owner occupation. But analysis of population flows into deprived areas, suggests that area-based initiatives (ABIs) might reduce the impact of segregation arising from residential mobility.
A growing body of evidence is addressing the impacts of mobility on service delivery, particularly in areas of high residential mobility and in relation to economic migrants from EU Accession states. However, there has been little evidence of the impact of residential mobility on outcome change in deprived communities.
Dimensions of residential mobility in NDC areas
There are a number of dimensions to mobility in NDC areas:
• more NDC residents are frequent movers than in similarly deprived areas; in 2006, more than 1 in 10 (12 per cent) households in NDC areas had moved more than three times in the previous five years, compared with 9 per cent in the comparator areas

Residential mobility and outcome change in deprived areas | 7
• there is wide variation across NDC areas in relation to residential mobility; NDC areas with student populations and concentrations of private rented sector housing have the highest levels of mobility
• there has been no fall in the number of people wanting to move in NDC areas; overall the proportion of residents wanting to move in NDC areas in 2006 (40 per cent) remains high compared with the proportion wanting to move in comparator areas (35 per cent) and nationally (25 per cent) in the same period
• compared with people staying in NDC areas, people moving in are more likely to be younger, white (but not British), or from a black and minority ethnic (BME) background, to live in a larger households and to be accommodated in the private rented sector
• between 2002 and 2006 the differences between those moving into and staying within NDC areas have intensified
• more recent in-movers (2004–06) are more likely to be in employment than those moving in between 2002 and 2004 (52 per cent and 48 per cent respectively), although less likely to be in employment than those remaining in NDC areas between 2004 and 2006 (55 per cent)
• the proportion of all NDC residents for whom English is not a first language increased from 16 per cent in 2002 to 21 per cent in 2006; the proportion of residents in 2006 for whom English is not a first language ranges from zero in a number of NDCs to 74 per cent in Tower Hamlets
• people moving out of NDC areas between 2002 and 2004 were more likely to be older than those moving into NDCs during the same period, to be in employment and to be moving into owner-occupied accommodation
• the reasons for moving out of NDC areas were varied, but most often related to access to a better choice and quality of housing and a desire to live in areas with less crime and fewer problems of anti-social behaviour.
Understanding residential mobility in NDC areas
There are significant positive correlations between the level of residential mobility in an area and the proportion of:
• 16–34 year-olds
• households in private rented accommodation
• full-time students
• single-person households
• large adult households.
Differences in rates of mobility are overwhelmingly determined by differences in the characteristics of NDC populations. Eighty-two per cent of the variance is explained by five key demographic differences, the most significant of which is age: nearly three quarters of the variance between different NDC areas can be attributed to the proportion of 16–34 year-olds in the local population.

8 | Residential mobility and outcome change in deprived areas
A number of key socio-demographic characteristics are significantly associated with the likelihood of moving:
• groups most likely to move include younger age groups (16–34); private rented sector households; recent movers; large and single-person households; residents with higher qualifications (NVQ4 or above); males; and white residents
• lone-parent households; couples (with and without dependent children); women; workless households; and Asian residents are less likely than average to move.
Two perceptional variables are significantly associated with an increased likelihood of moving:
• those dissatisfied with their area as a place to live in 2002 were on average 28 per cent more likely to move than those not dissatisfied
• residents dissatisfied with their accommodation in 2002 were on average 69 per cent more likely to have moved compared to those who were not dissatisfied.
NDC areas with high levels of residential mobility tend to be characterised by:
• younger populations
• more single-person households
• fewer owner-occupiers
• fewer people without qualifications
• more workless households
• higher levels of lawlessness and dereliction, and crime
• more people wanting to leave
• fewer people being satisfied with the area or their accommodation
• fewer people thinking neighbours look out for each other.
Residential mobility and positive neighbourhood change
Categorising NDCs into groupings of ‘high’, ‘medium’ and ‘low’ residential mobility reveals no consistent relationships in relation to outcome change for the three groups across the core indicators. However, NDCs with higher levels of mobility have clearly experienced less positive change than the NDC average in relation to housing and physical environment indicators.
Analysis of data at the level of individual NDC areas, using a combined change score which looks at change across groups of indicators (CIRC) reveals some significant relationships between mobility and outcome change in NDC areas:
• change for the education theme is significantly negatively correlated with levels of residential mobility in both 2002 and 2006 at Key Stage 4 (KS4): as rates of residential mobility increase, children’s performance at KS4 decreases

Residential mobility and outcome change in deprived areas | 9
• in both 2002 and 2006, higher levels of mobility are associated with achieving less change across the housing theme; this significant relationship holds for two-thirds of the indicators for this theme including want to move, ‘trapped’ in current accommodation, satisfaction with accommodation, and problems with the local environment
• a combined CIRC score for themes associated with ‘place’-based outcomes (crime, community, and housing and the physical environment) is negatively correlated with levels of residential mobility in both 2002 and 2006.
When analysing outcome change for individuals remaining in NDC areas between 2002 and 2006 who were part of the NDC longitudinal panel it is apparent that those who stayed in areas of low residential mobility were significantly more likely to see improvements in many place-based outcomes. Those who remained in areas of higher mobility perceived fewer improvements in problems associated with the area, crime and environmental degradation.
Conclusions
At the Programme level, NDCs with higher levels of mobility experience poorer place-based outcomes and less positive change in housing. There are also negative associations between higher levels of residential mobility and educational outcomes, with a significant relationship at KS4. The six NDC case studies have supported successful and innovative interventions to improve educational outcomes but there remain issues around capacity and the ability of schools to support pupils staying in NDC areas for short periods of time.
Mobility in NDC areas is overwhelmingly associated with demographics. Younger age groups and those in private rented tenure are most likely to move. But it is important for policy-makers and neighbourhood renewal practitioners to understand the nature, drivers and consequences of residential mobility in each deprived neighbourhood. These are likely to be different in different areas, and for different populations. Mobility will also be shaped by wider processes ranging from the operation of local housing markets through to the impacts of the globalised economy. Responses to residential mobility require detailed, localised intelligence. Gathering such intelligence can be challenging, particularly in areas attracting particularly mobile migrant populations.
There is little evidence from these case studies that higher levels of mobility are associated with ‘higher’ demands or costs; the service needs of younger, more mobile – but generally healthier and employed – populations may simply be different to those arising from more static, but often older households, perhaps with children or more likely to be experiencing ill-health. Again, the exception may be education. There is a growing need for English for speakers of other languages (ESOL) provision in these case study areas. There may also be a need for delivery agencies to be more proactive and innovative in connecting with mobile populations to ensure that the service needs of these populations are being met.

10 | Residential mobility and outcome change in deprived areas
A number of implications for neighbourhood renewal arise from this study:
• housing design and tenure are critical factors influencing mobility; maximising opportunities for existing and new residents to realise their housing preferences locally through the provision of more diverse property types, sizes and designs in all tenures, especially in owner-occupation, is likely to encourage residential stability
• in areas with a large private rented sector higher standards of neighbourhood and property management may improve area satisfaction ratings and attract a more diverse range of tenants
• housing measures need to be complemented by measures to improve the environment; but it should be recognised that large scale developments will in the short term at least, result in higher levels of mobility and additional service demands to meet the needs of displaced populations
• in some areas, especially in London, the characteristics of in-movers are increasingly shaped by economic migration, particularly from EU accession states; NDCs are well placed to offer support to migrant communities but they may have only limited resources so to do
• the impacts of residential mobility and migration are particularly acute for education services; additional resources may be required to support the needs of children in mobile households, but any positive impacts on educational outcomes may be lost if children continue to move schools
• neighbourhood renewal programmes need to consider the balance between place-based measures, encouraging people to stay, and person-based measures, which may stimulate out-migration as project beneficiaries seek economic or educational opportunities beyond the neighbourhood; there may be a case for thinking through the phasing of interventions: if an intensive push is placed on people-based measures before improvements are made to the local environment and its housing market, this may well encourage out-migration.

Residential mobility and outcome change in deprived areas | 11
1. Introduction1.1. This report addresses the issue of residential mobility in New Deal for
Communities (NDC) areas. It utilises household survey data and qualitative evidence from seven case study NDCs to examine the nature, extent and impact of mobility amongst NDC residents.
1.2. The NDC Programme is one of the most important Area-Based Initiatives (ABIs) ever launched in England. Announced in 1998, the Programme’s primary purpose is to reduce the gaps between 39 deprived neighbourhoods and the rest of the country in relation to both ‘people’ (health, worklessness, education) and ‘place’ (housing and the physical environment, crime and community) based outcomes. In these 39 areas, each on average accommodating about 9,800 people, local NDC Partnerships are implementing approved 10 year Delivery Plans. Each Delivery Plan has attracted approximately £50m of NDC Programme investment.
1.3. The nature and extent of residential mobility in NDC areas, and its impact on outcome change, is of considerable interest as it may have implications for the ability of NDCs to ‘narrow the gap’ with less deprived areas. Analysis of the impact of the NDC Programme is based on measuring the changing attitudes and attributes of individuals within these areas. But whereas the boundaries of these areas are fixed, individuals within them are not. Within any given locality there will always be a degree of residential mobility as people move homes both within, and outwith, the area. Individuals will move into these areas through time, whilst others may stay for the entire length of the Programme. The nature of the evidence base available to the NDC national evaluation team provides an opportunity to consider trends and implications arising from the mobility of NDC residents.
1.4. Interest in levels of residential mobility within NDC areas is part of a broader policy agenda focusing more generally on the implications of high and low levels of mobility within deprived areas. On the one hand there have been issues relating to population loss in areas of low demand for housing (see for instance DETR, 1999), which helped lead to the introduction of the Housing Market Renewal Pathfinder Programme in 20021. On the other there have been concerns about high levels of residential mobility (particularly in areas of acute housing shortage) and ensuing financial and practical implications for service delivery (see 2.15–2.20).
1 See www.communities.gov.uk/housing/housingsupply/housingmarketrenewal/

12 | Residential mobility and outcome change in deprived areas
Evaluation of the NDC Programme
1.5. The NDC Programme is being evaluated by a consortium of organisations, led by the Centre for Regional Economic and Social Research (CRESR) at Sheffield Hallam University. The evaluation uses three key sources of evidence2:
• household surveys have been conducted by Ipsos MORI in all 39 NDC neighbourhoods and comparator areas in 2002, 2004 and 2006; a further wave took place in the summer of 20083
• a range of administrative data has also been collated for NDC neighbourhoods and comparators, providing an evidence base through which to track changes over time in benefit claims, recorded crime, educational attainment in NDC areas, etc
• and a stream of locality based work is addressing a range of neighbourhood renewal issues including working with agencies and communities, neighbourhood elections and succession strategies, as well as reviewing NDC strategies and interventions across the five outcome areas of community safety, employment, health, housing and the environment, and education.
1.6. This report draws primarily on analysis of household survey data and additional evidence from seven case study NDC areas: Bradford, Knowsley, Lambeth, Newcastle, Newham, Sheffield and Walsall. Additional administrative and contextual data is included where relevant.
1.7. It should be noted at the outset that analyses presented in Chapters 3 to 5 address residential mobility in its totality, not just population turnover or ‘churn’. Questions in the Ipsos MORI household survey relate to frequency of moves, and do not provide information in relation to moves into, and out of, NDC neighbourhoods, although some information can be gleaned from questions about length of residence within NDC areas. In addition a follow up survey of movers in 2004 identified 330 people who had left NDCs between 2002 and 2004. It is not possible to use Census data to measure turnover in NDC areas as NDC neighbourhoods comprise groupings of LSOAs, and it is possible that residents could move between LSOAs, but remain within the NDC area. Appendix 2 provides a fuller explanation of the survey design and analytical tools employed in this study.
1.8. This report is structured as follows:
• Chapter 2 sets the context for the research by considering the existing evidence base in relation to residential mobility and the regeneration of deprived areas
• Chapter 3 draws on household survey data to examine the nature of residential mobility in NDC areas
2 A fuller explanation of the ways in which the Programme is being evaluated is contained on the NDC national evaluation website https://shu.extra.ac.uk/ndc/
3 2008 survey data is not included in this analysis due to time lag between conduct of the survey and the availability of data.

Residential mobility and outcome change in deprived areas | 13
• Chapter 4 explores associations between mobility and area-level and individual-level data in order to understand differences in rates of residential mobility between NDC areas
• Chapter 5 examines relationships between levels of mobility and outcome change and uses evidence from case studies to understand the impact of residential mobility on service delivery in NDC areas
• Chapter 6 considers policy implications arising from the research findings
• Appendix 1 contains indicators of residential mobility for NDC areas
• Appendix 2 provides a fuller explanation of the survey design employed in this study
• Appendix 3 contains odds ratios for logistic regression models
• Appendix 4 includes socio-demographic profiles of the seven case study areas
• Appendix 5 includes variables included in the residential mobility model
• Appendix 6 contains maps of NDC areas, developed using a classification based on the degree to which those moving into, and out of, NDC areas are coming from, or going to, similarly deprived areas
• Appendix 7 outlines the residential mobility classification.

14 | Residential mobility and outcome change in deprived areas
2. Residential mobility and the regeneration of deprived areas: evidence review
2.1. This chapter outlines the evidence base in relation to residential mobility and the regeneration of deprived areas.
2.2. The impacts, and manifestations, of residential mobility at the neighbourhood level are multiple. Residential mobility is an essential component in understanding the dynamics of any neighbourhood. It shapes a neighbourhood’s identity and its role within the wider geographical context. And mobility also plays a central role in helping explain how neighbourhoods change and respond to external ‘shocks’ (Bailey and Livingstone, 2007; Meen and Nygaard, 2007), including those processes of economic rationalisation and decline which have moulded the trajectories of many NDC areas (CLG, 2008a).
2.3. The degree to which populations move into, out of, and within, deprived areas can have both positive and negative associations. As Livingstone, Bailey and Kearns identify (2007), at the individual level mobility is generally seen in positive terms, often related to improving housing circumstances or opportunities for better employment. But for some individuals, frequent movement may be associated with negative experiences arising from limited choices in the housing market, lack of or insecure employment and the effects of chaotic lifestyles (see Cole et al, 2005).
2.4. Turnover is not of itself necessarily a problem. As Bailey and Livingstone (2007) suggest, high levels of residential mobility may be linked to an area’s function as an entry point to a city, or as a home for mobile populations such as students (see also Robson et al, 2008). But for deprived neighbourhoods a high degree of mobility can be seen as leading to a weakening of social bonds, impacting negatively on cohesion (see Communities and Local Government, 2008c) and incurring additional demands on service providers in housing, education, health, skills and employment (although evidence here is contested see, for instance, Travers et al 2007).
2.5. The remainder of this chapter reviews the existing evidence base in relation to residential mobility and its implications for the regeneration of deprived areas. It addresses four key themes:
• relationships between deprivation, instability and population turnover
• the degree to which evidence suggests that ABIs might promote selective migration
• the impact of residential mobility on the delivery of local services
• relationships between residential mobility and outcome change.

Residential mobility and outcome change in deprived areas | 15
Deprivation, instability and population turnover
2.6. An emerging body of evidence is exploring the predictors of population churn4 in deprived areas. Bailey and Livingstone’s (2007) analysis of flows of populations in neighbourhoods in England and Scotland suggests that deprived communities are not inherently prone to higher levels of mobility. Their work instead points to the importance of demographics, as opposed to levels of deprivation, as predictors of mobility. Specifically, this study suggests that the highest levels of population turnover are observed in areas with concentrations of young adults and households with young children. Key findings from this research include:
• deprived areas in England tend to have significantly higher concentrations of the higher-migration age groups but lower concentrations of other individual characteristics associated with a higher propensity to move (for example higher educational qualifications); differences in the mix of groups leads to different migration rates
• high turnover is not a general feature of deprived areas; there have been modest increases in average turnover for deprived areas in some regions, particularly in the South excluding London; but London has higher turnover rates in non-deprived, rather than deprived, areas
• once compositional factors are taken into account, area deprivation has only a modest impact on turnover
• deprived areas are not necessarily isolated from more robust housing markets; around half of the mobility for these areas consists of moves, from or to, non-deprived areas; however connection rates are much lower in the most highly deprived areas and in city-regions with high levels of deprivation
• whilst net migration tends to reinforce spatial segregation, the scale of the effect is surprisingly small; raising the educational attainment of just two residents per 1000 in deprived areas would prevent the gap widening; there are also regional differences with net migration flows in the North and Midlands increasing segregation whilst in London they reduce segregation.
2.7. Analysis of population movement in areas in receipt of Neighbourhood Renewal Funds (NRF) undertaken for the evaluation of the National Strategy for Neighbourhood Renewal (NSNR) (Robson et al, 2008) has confirmed the importance of compositional factors in predicting churn:
“While the overall level of mobility in Britain is about 11% per year, this percentage varies markedly by age. Older households tend to be relatively immobile while younger households are much more mobile as they grow their families and as they progress through successive stages in their employment careers. Most of the variation in rates of household mobility is therefore simply a function of the age structure of neighbourhoods.
4 Population churn is here assumed to mean the overall rate of turnover for an area.

16 | Residential mobility and outcome change in deprived areas
There is little evidence that deprived neighbourhoods are characterised by unusually high rates of churn” (p4).
2.8. Other studies have addressed relationships between deprived areas and propensity to move. Kearns and Parkes’ (2003, cited in Cole et al, 2005) analysis of English House Condition Survey (1991 to 1996) explores the extent to which poor neighbourhood conditions in deprived communities are associated with expressed intentions to move, and subsequent actual moves, for residents of deprived areas. They found that although dissatisfaction was higher among residents in deprived communities, there was no greater likelihood of this level of dissatisfaction being translated into intention to move than for other areas and that only a proportion of those intending to move act on this intention. The authors suggest that residents in deprived areas respond to negative housing conditions in the same way as the rest of the population, but that these conditions are experienced more frequently in deprived areas.
2.9. In a study of the relationships between attachment to place and deprivation, Livingstone, Bailey and Kearns (2008) conclude that although residents in deprived communities generally exhibit substantially less place attachment than those in more affluent areas, the factors which have the strongest association with place attachment are age, length of stay, and neighbourhood characteristics (specifically levels of social cohesion, safety/crime and trust/values). The differences between deprived and non-deprived communities in relation to attachment are largely a result of the lower ratings for these characteristics found in the responses of people in the deprived neighbourhoods. However, this study also suggests that population turnover has an indirect effect on attachment: in areas of high turnover there are fewer long-term residents, there may be a weakening of social bonds and networks, and consequent concerns about security and uncertainty in deprived communities. The study urges that policy acts to limit high turnover to help avoid rapid social change wherever possible, an objective which is more likely to be attained if a ‘settling in service’ were to be adopted for new arrivals.
2.10. Recent analysis of 2005 Citizenship Survey data (CLG, 2008c) found mixed evidence in relationships between residential mobility and community cohesion. The study found that for most people the number of years lived in a neighbourhood has no effect on perceptions of community cohesion (although for Indian people the effect is negative: the longer they have lived in an area the less likely they are to think it is cohesive). And at the community level, the report asserts that residential turnover/in-migration does not have a significant effect on perceptions of cohesion, unless a large proportion of the in-migrants are non-white and originate from outside the UK (in which case the effect is negative) (p39). The study also concludes that deprivation is a key threat to cohesion (p47).
Residential mobility and outcome change in deprived areas | 17
Do ABIs fuel selective migration?
2.11. There is mixed evidence in relation to the suggestion that ABIs may inadvertently fuel selective migration. Improving life chances, through education, health promotion, training, job mentoring and so on, may help the job prospects and material circumstances of local residents. As a result, more may want, and be able to, leave the regenerated area. If these outmovers are in turn replaced by relatively more disadvantaged households, ABIs may find themselves working with steadily more deprived communities.
2.12. Local evaluations of ABIs have argued that intensive training programmes which lead to jobs can indeed tend to encourage the out-migration of beneficiaries (see, for example, Cheshire et al, 1998). And, as part of the NDC evaluation a ‘Movers Survey’ traced 330 people who left NDC areas between 2002 and 2004. Whilst those leaving NDC areas appeared more likely to be in employment and to be in, or moving into, the owner occupied sector than was true for NDC populations as a whole (CLG, 2007a) there is no evidence to indicate that any of this movement was triggered by specific NDC interventions. And other evidence from the NDC evaluation suggests that those who moved into NDC areas between 2004 and 2006 tended to be younger, healthier and better educated than those who stayed in NDC areas for this two year period (CLG, 2007b).
2.13. Previous reports from the NDC evaluation (CLG, 2006) and from earlier evaluations of ABIs (ODPM, 2005) have argued that there is a need for ABIs to look for a balance between measures which are designed to stabilise local populations by improving local environments and services and those which stimulate out-migration as a result of beneficiaries seeking improved economic or educational opportunities beyond regeneration areas. However, an analysis of the scale and composition of population flows for deprived areas across England and Scotland focusing on educational attainment suggests that, although migration flows do reinforce spatial segregation, the effect may be less than might be imagined5 (Bailey and Livingstone, 2008). Furthermore, although individuals with higher qualifications tend to migrate away from deprived areas, the study also found that selective migration flows in areas with ABIs (in this case NDCs in England and Social Inclusion Partnerships in Scotland) were less likely to reinforce spatial segregation than in similarly deprived areas without ABIs. This study also revealed important variations between English regions: in the North and Midlands, spatial segregation was increasing through migration more rapidly than the national average would suggest; but the South showed no significant relationships, whilst in the London city-region, migration flows were reducing segregation. Regional context is clearly important in determining the impact of population flows, and the role of local housing markets may be crucial in shaping patterns of migration.
5 The paper suggests that the scale of the ‘migration effect’ is relatively small, resulting in an increase of just 0.13 per cent in the gap between the most and least deprived areas in England. This change could be offset by the movement of 1.3 residents per thousand from lower to higher educational groups, or alternatively by the attraction of 1.8 more in-migrants with higher qualifications per thousand residents.

18 | Residential mobility and outcome change in deprived areas
2.14. The need to embed questions surrounding population mobility within wider spatial scales is in turn reflected in the 2007 Review of Sub-National Economic Development and Regeneration (HM Treasury, 2007) and the ensuing framework for regeneration (CLG, 2008d). These documents highlight the need to consider relationships between neighbourhoods and the wider economy, particularly in addressing factors which constrain residents in deprived areas from taking advantage of opportunities in the wider labour market. As the Sub-National Review points out: “economically and socially mobile populations may choose to move to other areas, resulting in a static or higher level of deprivation as the individuals who remain or move into the area are often hardest to help” (p.48).
The impact of residential mobility on services
2.15. A number of reviews have addressed the impact of residential mobility on the delivery of services in deprived areas. Residential mobility is seen as impacting potentially on service delivery in three ways (GLE, 2005): by determining the types of services that have to be provided; by influencing ways in which these services are delivered; and by affecting the ability of public services to meet targets for delivery and outcome change in deprived communities.
2.16. Studies undertaken by GLE (2005) and ODPM (2004) conclude that the impact of residential mobility on services is largely dependent on the characteristics and needs of migrant populations. However, these studies also point out the higher administrative costs incurred in areas of high residential mobility by services which are reliant on address-based registration for access (for example, primary health care services, schools and welfare support).
2.17. This research also highlights in particular the adverse impacts of mobility on the delivery of education, as does a study of pupil mobility in London schools (ALG, 2005) which identifies the additional resources required to address the needs of mobile pupils. This latter study also asserts that in areas of high residential mobility, high pupil turnover impacts on the opportunities for all pupils. Schools with the highest rates of turnover tend to be those already struggling with a complex range of other issues such as poverty, homelessness, and also high numbers of pupils with English as an additional language and with special educational needs. The impact of residential mobility on educational outcomes in NDC areas is discussed at 5.10 and at 5.33 to 5.39.
2.18. Cole et al (2005) highlight the need for services to be sensitive to the needs of vulnerable frequent movers. Particular problems are likely to be experienced in areas which house vulnerable populations who place extra demands on services. Written evidence from Thanet District Council to a parliamentary select committee on Office of the Deputy Prime Minister: Housing, Planning, Local Government and the Regions (Stationery Office, 2006) suggests that:
Residential mobility and outcome change in deprived areas | 19
“The effect of this continual “top up” of vulnerable people into the area is that interventions are not dealing with an established, stable community. The 2001 census found a population turnover in the most deprived areas of over 30%. A local primary school has reported an annual turnover of pupils of 60%. As traditional regeneration interventions are based on working with an establish community the expected impact of projects based in a transient population are different and lasting impact is much harder to achieve” (p14, memorandum CT23).
2.19. More recent research has focused on the impact on service delivery agencies of newly arrived populations, particularly those from EU Accession states. A report on ‘Population mobility and service provision’ undertaken on behalf of the London Councils (LSE, 2007) has identified the potential direct and indirect costs of mobility for different public services. However, as the report points out, it is often not clear whether it is the fact that mobility occurs, the extent of churn, or the nature of the mobile population (or indeed all three) which impacts on service delivery and cohesion.
2.20. Work undertaken by the Institute for Employment Research has assessed the impact of labour migration in the East and West Midlands (Green et al, 2007a, 2007b, Green, 2007) and found that migrants are predominantly young (80 per cent of migrants to the West Midlands were under 35 years of age), working and living in private rented accommodation. The West Midlands study also identified a need for help with English Language skills amongst migrant populations.
Residential mobility and outcome change
2.21. There is, as yet, a dearth of evidence with regard to relationships between residential mobility and outcome change for those in deprived areas; although there is some evidence in relation to health. A number of studies have explored relationships between migration and disparities in health outcomes for deprived and less deprived areas. For instance, Norman et al (2005) using the ONS England and Wales Longitudinal Study 1971–1991 looked to identify the degree to which mobility contributed to area-level relationships between health (long-term limiting illness and mortality) and deprivation. This found that over the 20 year period, the largest absolute flow is by relatively healthy people away from more deprived areas to less deprived areas. The effect is to raise ill-health and mortality rates in the origins and lower them in the destinations. The research found that overall between 1971 and 1991 inequalities in health between the least and the most deprived areas increased, compared with the health-deprivation relationships which would have existed if people’s locations and deprivation patterns had remained geographically constant. The conclusion is that migration, rather than changes in the deprivation of the area within which non-migrants live in, accounts for the large majority of change.

20 | Residential mobility and outcome change in deprived areas
2.22. However, other evidence suggests that the distribution of health outcomes is not significantly affected by migration. One example is a study of general practice records from 40 practices in Northern Ireland carried out by Connolly and Reilly (2007). The authors argue that overall migration within the cohort did not affect the distribution of health through time, in part because those migrating out of both deprived and more affluent areas were replaced by in-migrants with similar levels of health.
2.23. Having reviewed the evidence base in relation to residential mobility and the regeneration of deprived areas, the remainder of this report presents evidence in relation to NDC neighbourhoods. The next chapter considers dimensions of residential mobility in NDC areas.

Residential mobility and outcome change in deprived areas | 21
3. Dimensions of residential mobility in NDC areas
Summary
There are a number of dimensions to mobility:
• more NDC residents are frequent movers than in similarly deprived comparator areas: in 2006, more than 1 in 10 (12 per cent) households in NDC areas had moved more than three times in the last five years, compared to 9 per cent in the comparator areas
• there is wide variation across NDC areas in levels of residential mobility; NDCs with student populations and concentrations of private rented sector housing have the highest levels of mobility
• there has been no fall in the number of NDC residents wanting to move in NDC areas in 2006; overall the proportion of residents wanting to move in NDC areas (40 per cent) remains high compared to the proportion wanting to move in comparator areas (35 per cent) and nationally (25 per cent)
• compared with people staying in NDC areas, people moving in are more likely to be younger, white (but not British), or from a black and minority ethnic (BME) background, to live in a larger household and to be accommodated in the private rented sector
• between 2002 and 2006 the differences between those moving into, and staying in, NDC areas have intensified
• recent in-movers are more likely to be in employment than those moving in 2002
• the proportion of all NDC residents for whom English is not a first language increased from 16 per cent in 2002 to 21 per cent in 2006; the proportion of residents in 2006 for whom English is not a first language ranges from zero in a number of NDCs to 74 per cent in Tower Hamlets
• people moving out of NDC areas between 2002 and 2004 were more likely to be older than those moving in during the same period, more likely to be in employment, and more likely to be moving to owner-occupied accommodation
• the reasons for moving out of NDC areas varied, but most often related to access to a better choice and quality of housing and to live in areas with less crime and fewer problems of anti-social behaviour.
3.1. This chapter explores five dimensions to residential mobility in NDC areas:
• key indicators of residential mobility
• mobility within NDC areas
• mobility between NDCs and other areas

22 | Residential mobility and outcome change in deprived areas
• mobility and desire to move
• in-movers, out-movers and frequent movers.
3.2. Analyses draw on household survey data to explore dimensions of mobility at Programme and individual NDC area-levels. Where relevant, data from similarly deprived comparator areas is also included.
3.3. It should be noted that issues may arise from the design of the household survey which has both panel and also cross-sectional ‘top-up’ elements to it. In 2002 the household survey was based on a random sample of residents. In later years a proportion of the survey sample was panel based: the same residents being interviewed a second, or even a third, time. Through time this may introduce a degree of bias towards longer-term residents. However, the 2004 and 2006 surveys do not consist entirely of panel members, there being in addition a ‘top-up’ cross-sectional component which assists in refreshing the sample as a whole and which helps counteract any potential bias towards panel members.
Key indicators of residential mobility
3.4. This section explores indicators of residential mobility in three ways:
• at the NDC Programme level
• in relation to other deprived areas and national benchmarks
• at the level of individual NDC areas.
3.5. A number of indicators from the Ipsos MORI household survey are used to consider aspects of mobility. These are derived from the following questions6:
• how long residents have lived at their current address?
– short-term residents are identified as those who have lived at their address for less than 1 year
– long-term residents are identified as those who have lived at their address for 10 years or more
• how many times have residents moved in the past 5 years?
– frequent movers are identified as those who have moved three or more times in the past 5 years
– those who have not moved in the past 5 years provide an indication of those with more stable housing histories.
6 This data provides evidence in relation to moves to, and from, current addresses and not necessarily whether the move was from within, or outside, the NDC area. In addition answers reflect the movement of respondents, which may not include entire households. Nevertheless there is no reason to believe that there is any systematic relationship between levels of mobility and the degree to which residents move within, as opposed to from outside, NDC boundaries; these indicators provide a good assessment of the general level of population stability in an area, including the movement of households as well as of individuals.

Residential mobility and outcome change in deprived areas | 23
3.6. A further derived variable is also available for the 2002 sample: ‘moved 2002–04’. These are cases where the follow up interview for the 2004 survey was not carried out because the interviewer was informed the previous respondent had since moved. When combined with information on length of residence at the current address this gives a picture of moves by residents in the year preceding the 2002 survey and also of those occurring between 2002 and 2004. This variable is not currently available for 2006 sample but will be collected as part of the 2008 survey.
Programme level residential mobility
3.7. Indicators of residential mobility discussed in 3.5 and 3.6 suggest that (Table 3.1):
• 16 per cent of residents had been in their current address for less than a year at the beginning of the Programme (14 per cent in 2002); the range across individual NDC areas was 7 to 42 per cent in 2002
• longer-term residents (10 years or more) account for 41 and 42 per cent of residents at 2002 and 2006 respectively; for individual NDC areas, long-term residents ranged from 20 to 58 per cent of the population in 2002
• the proportion of those who had not moved at all in the past five years increased in the two samples from 58 per cent to 63 per cent, with a range of between 30 and 74 per cent for individual NDC areas in 2002.
3.8. However:
• nearly one quarter of those who were sampled in 2002 had moved from the address by 2004
• 12 per cent of residents had moved at least three times in the past five years.
Table 3.1: Key Indicators of residential mobility, all NDC areas 2002–2006
NDCs % Comparators %
2002 2006 2002 2006
Not moved in past 5 years 58 63 62 64
Moved 3+ times in past 5 years 12 12 10 9
Lived at address less than 1 year 16 14 12 12
Lived at address 10 years or more 41 42 47 47
Moved 2002–20041 24 N/A N/A N/A
Source: Ipsos MORI NDC household survey 2002, 2006Base: All: NDC aggregate 2002 (19,574), 2006 (15,792); Comparator 2002 (2,014), 2006 (3,062)1 as a percentage of all 2002 cases that Ipsos MORI could assign an outcome to at the 2004 re-visit (15,973)
24 | Residential mobility and outcome change in deprived areas
How does mobility in NDC areas compare to that in other deprived areas and nationally?
3.9. Table 3.1 also illustrates the extent to which NDCs differ from similarly deprived comparator areas. The latter comprise 39 wards which are not contiguous to NDC areas but are located within the same local authorities7. They were chosen on the basis of the 2000 Indices of Deprivation (DETR, 2000). Although exhibiting similar levels of deprivation they tend not to be quite as deprived as NDC areas. The comparator areas also tend to have slightly higher levels of owner-occupation than do NDC areas.
3.10. In 2002 the comparator areas were generally more stable than NDC areas. A higher proportion of residents in the comparator areas had not moved in the past five years or had lived at their current address for more than 10 years compared to NDC areas. Fewer residents in the comparator areas had moved three or more times in the last five years or had lived at their current address for less than one year compared with NDC areas. There is little change in the mobility indicators for the comparator areas over time.
3.11. The higher concentrations of rented accommodation within NDC areas may in part explain the slightly higher levels of population movement within them compared to the comparator areas. Links between tenure and population movement are included in the analyses at 4.3 to 4.27.
3.12. The Survey of English Housing (SEH) offers national benchmarks in relation to mobility. In general NDC areas tend to show slightly higher levels of population mobility across the Programme than nationally:
• in 2001–02 11 per cent of residents nationally had lived in their current address for less than one year compared with 16 per cent in NDC areas in 2002
• by 2005–06 the percentage of residents who had lived in their current address for less than one year fell by one percentage point nationally; in NDC areas there was a decrease of two percentage points between the 2002 and 2006 surveys
• nationally in 2001–02 47 per cent had lived at their current address for more than 10 years compared with 41 per cent in NDC areas in 2002
• by 2005–06 the national figure for residents in their current address for 10 years or more remained unchanged compared to an increase of one percentage point in the 2002 to 2006 NDC sample.
3.13. Additional evidence is also available from a study carried out in the first phase of the evaluation, which used Labour Force Survey data (Evans and Harkness, 2005). This found that in 1993 and 2003 12 per cent of the population in England had lived at their current address for less than one year. In the most deprived quintile the proportion was higher, at 13.9 per cent in 2003. But
7 For fuller details of this element of the survey see the Ipsos MORI New Deal for Communities 2006 Household Survey Technical Report at: www.data-archive.ac.uk/doc/5299/mrdoc/pdf/5299ndc2006.pdf.

Residential mobility and outcome change in deprived areas | 25
over 15 per cent of NDC residents had been at their current address for less than one year (p20).
NDC area-level mobility
3.14. The NDC Programme-wide evidence masks considerable variation across the 39 NDC areas. This is not surprising. These 39 areas differ considerably in relation to scale and nature of deprivation, policies adopted by NDC Partnerships, socio-demographic characteristics, tenure profile, local labour markets, and so on.
3.15. Appendix 1 provides a full breakdown of the mobility variables for both 2002 and 2006 for each NDC area. The wide range of circumstances between areas of high and low residential mobility is apparent with, on average, nearly a 40 percentage point difference across all the indicators. For example, in 2006 the proportion of short-term residents ranges from 5 per cent in Walsall to 48 per cent in Nottingham and the proportion of long-term residents (10 years or more) from 21 per cent (Nottingham) to 58 per cent (Walsall).
3.16. To illustrate the scale of variation across the 39 NDC areas, those with the highest and lowest levels of population mobility can be seen in Table 3.2. The average for the Programme as a whole is also included:
• the Nottingham NDC area has the least stable population of all 39 areas for all five mobility indicators in both 2002 and 2006. Data at 2002 indicates that nearly three times more residents than average had moved three or more times in the five years up to 2002 or had moved into their current address in the twelve months preceding the survey; less than half the NDC average had lived in the NDC area for 10 years or more and more than twice the average percentage of NDC residents moved between 2002 and 2004.
• the Bristol NDC is an example of an area with increasing levels of population movement which are not linked to high concentrations of students. The area is ranked joint sixth in 2002 on the basis of mobility indicators and third in 2006. It has a slightly lower than average percentage of residents who have not moved in the last five years and is higher than the NDC average for percentage of residents moving three or more times in the five years to 2002. Percentages of residents living at their address for less than one or more than 10 years are however close to NDC averages at the beginning of the Programme but a higher than average percentage of residents moved between 2002 and 2004.
• the Walsall NDC area shows low levels of mobility relative to other NDCs. The area is characterised by low-density local authority and former local authority (‘Right to Buy’) housing stock. It has much higher than NDC average percentages of residents who had not moved in the five years to 2002 or who had been at their address for over 10 years.

26 | Residential mobility and outcome change in deprived areas
3.17. It is useful in this context too to see estimates of the absolute numbers of people involved. These are based on relating the household size for each respondent to the 2002 Mid-Year Population Estimates for these areas. Fully 3,000 (35 per cent) of Nottingham’s total population of 8,700 had lived in the area for less than a year in 2002. But 5,700 (49 per cent) of Walsall’s 11,600 had lived in that NDC for more than 10 years.
3.18. The 2001 Census provides additional contextual information at the local authority level. One question asks “what was your usual address one year ago?” From this it is possible to identify the percentage of residents living at a different address one year previous to completing the Census questionnaire (Table 3.3). In aggregate the 38 NDC parent local authorities had a higher proportion of residents that had moved in the previous year compared with the England-wide figure (14 per cent and 12 per cent respectively). Across these 38 local authorities the proportion ranged from eight per cent in Knowsley to 20 per cent in Hammersmith and Fulham. The five Local Authorities with the lowest proportion of residents that had moved were located in either the North West or the West Midlands. Exploring associations between NDC and local authority level residential mobility shows that there is a significant positive correlation (0.46 sig at 0.01 level) between an NDC’s residential mobility score8 and the proportion of residents that have lived at their address for less than a year within the parent local authority9. This implies that a higher level of residential mobility at a local authority level is associated with a higher level of mobility at an NDC level.
3.19. The full breakdown of the mobility variables for both 2002 and 2006 for each NDC area indicates that in general there was not a great deal of change in the relative levels of residential mobility across NDCs in this four year period (see Appendix 1). Areas with the lowest or highest levels of mobility in 2002 tended to be in this same position by 2006, although there was a little more movement between the mid to high ranging NDCs.
8 See Appendix 3.9 This relationship holds true for all NDCs, and when London NDCs are excluded.

Residential mobility and outcome change in deprived areas | 27
Tab
le 3
.2:
Ind
icat
ors
of
resi
den
tial
mo
bili
ty b
y n
um
ber
s o
f in
div
idu
als,
200
2
N
ott
ing
ham
Bri
sto
lW
alsa
llA
ll N
DC
s
%
re
spo
nd
ents
ho
use
ho
ld
po
pu
lati
on
%
resp
on
den
tsh
ou
seh
old
p
op
ula
tio
n%
re
spo
nd
ents
ho
use
ho
ld
po
pu
lati
on
%
resp
on
den
tsh
ou
seh
old
p
op
ula
tio
n
Tota
l pop
ulat
ion
2002
8,
700
6,20
011
,600
380,
400
Not
mov
ed in
pas
t 5
year
s30
3,00
052
3,20
074
7,90
058
211,
300
Mov
ed 3
+ t
imes
in p
ast
5 ye
ars
352,
500
201,
200
460
012
43,4
00
Live
d at
add
ress
less
tha
n 1
year
423,
000
171,
000
790
016
55,7
00
Live
d at
add
ress
10
year
s or
mor
e20
1,90
038
2,20
058
5,70
041
138,
400
Mov
ed 2
002–
2004
523,
800
332,
100
162,
000
2489
,000
Sour
ce: I
psos
MO
RI N
DC
hou
seho
ld s
urve
y 20
02, S
DRC
Mid
-yea
r Po
pula
tion
Estim
ates
200
2N
otes
: Per
cent
ages
rel
ate
to s
urve
y re
spon
dent
s ag
ed 1
6+. H
ouse
hold
pop
ulat
ion
rela
tes
to a
ll ho
useh
old
mem
bers
with
in t
hese
typ
es o
f re
spon
dent
hou
seho
lds.
Pop
ulat
ion
estim
ates
rou
nded
to
near
est
100.

28 | Residential mobility and outcome change in deprived areas
Table 3.3: Percentage of residents that lived at a different address 12 months ago
NDC LA %
Hammersmith and Fulham 20
Manchester 19
Southampton 19
Nottingham 19
Brighton 18
Lambeth 18
Norwich 17
Islington 17
Haringey 17
Newcastle 17
Tower Hamlets 17
Bristol 16
Southwark 16
Plymouth 15
Leicester 15
Brent 15
Hackney 14
Sheffield 14
Hull 14
Lewisham 14
Coventry 14
Newham 13
Liverpool 13
Salford 13
Derby 12
Birmingham 12
Bradford 12
Hartlepool 12
Luton 12
Middlesbrough 12
Rochdale 11
Sunderland 10
Doncaster 10
Oldham 10
Wolverhampton 10
Sandwell 9
Walsall 9
Knowsley 8
38 NDC Las 14
England 12
Source: 2001 census
Residential mobility and outcome change in deprived areas | 29
Mobility within NDC areas
3.20. One issue running through this analysis is the degree to which moving address might actually reflect individuals moving within, as opposed to beyond, their local NDC area. In 2006 an additional question asked residents how long they had lived in the area. The notion of what constituted the ‘area’ was self defined so is not necessarily an exact reflection of the NDC boundaries. But some 9 per cent in 2006 had lived in the area for less than a year10. The figure for comparator areas is similar: 8 per cent in 2006.
3.21. By comparing 2006 data on how long residents had lived at their current address with how long they have lived in the area, it emerges that 36 per cent of those who had lived at their current address for less than a year had lived in the area for longer than that. Exploring this across NDC areas shows that:
• 66 per cent of respondents in Sandwell who had lived at their current address for less than a year had lived in the area for one year or longer – the highest proportion amongst NDCs
• this proportion was lowest in Bristol (13 per cent)
• 8 of the 10 NDCs where this proportion was lowest were in London.
3.22. Of the 54 per cent of residents who had lived in NDC areas for over 10 years, nearly 74 per cent had been living at the current address for that time. Again these patterns are broadly similar to those seen in comparator areas where the respective figures are 34 per cent and 70 per cent. There is clearly a considerable degree of movement within NDC and other deprived areas.
Movement between NDCs and other areas
3.23. Analysis undertaken for the evaluation of the National Strategy for Neighbourhood Renewal (NSNR) (Robson et al, 2009) has examined patterns of population movement into and out of areas in receipt of Neighbourhood Renewal Funds (NRF) (movement into and out of areas is also referred to as churn). A typology of areas has been developed, according to the degree to which residents entering or leaving NRF areas are moving from, or to, areas similarly deprived areas. This typology suggests four types of deprived neighbourhoods:
Escalator
• in-movers will mostly come from similar or poorer areas; out-movers will move to better areas.
10 At a Partnership level the percentage of residents that state that they have lived in the area for less than a year ranges from 28 per cent in Nottingham to just two per cent in Hull

30 | Residential mobility and outcome change in deprived areas
Gentrifier/Improver
• in-moves will come from better areas; where existing residents are displaced they will move to similar or poorer areas.
Isolates
• in and out moves will largely be restricted to similar or poorer areas.
Transit
• both in-movers and out-movers come from/go to less deprived areas.
3.24. Typologies of NDC areas based on the classification identified at 3.23 have been created using 2001 Census data. Appendix 6 of this report includes maps11 developed on the basis of:
• an overall classification for each NDC area, based on patterns of movement into and out of NDC areas
• the proportional mix of each type of the four neighbourhood types within each NDC area.
3.25. Eighteen NDC areas are classified overall as transits, 16 as isolates, and five as escalator areas. There are no clear associations between these typologies and levels of residential mobility at the NDC area level laid out in Appendix 1. Of the 10 NDCs with the highest proportion of residents having moved three or more times in the five years up to 2006, six are transits, three are isolates and one is an escalator. Of the 10 NDCs with the lowest proportion of residents moving three or more times in the five years to 2006, six are isolates and four are transits.
3.26. Analysis for the evaluation of the NSNR suggests that improved understanding of the functional roles of different types of neighbourhoods can inform policy responses. It may not be just the level of mobility which is relevant in influencing outcomes for these areas, but also the nature of churn and the degree to which deprived neighbourhoods are connected to more robust housing markets.
3.27. However, mapping these classifications within NDC areas reveals an even more complex picture (Appendix 6, Map 2). Few NDC areas consist solely of one neighbourhood type. Only Hull, Liverpool and Southwark are wholly isolate and Bristol, Southampton and Brighton wholly transit. Some NDC areas (Hackney and Leicester, for example) include almost equal proportions of the four different neighbourhood types. This suggests that different responses may be needed, not only at the neighbourhood level, but indeed within deprived neighbourhoods. A key strength apparent within many NDC Partnerships has been their ability to develop detailed understanding of local issues and to target interventions accordingly. For instance, the Newcastle NDC area, which is classified as an overall transit area, demonstrates the
11 Acknowledgement to Brian Robson at Manchester University for supplying the maps (Brian Robson in conjunction with AMION Consulting derived the deprived areas classification)

Residential mobility and outcome change in deprived areas | 31
scale of variation within NDC neighbourhoods. The area has high levels of residential mobility relative to other NDCs, but different conditions apply within different parts of the area. Partnership staff view the area as consisting of four ‘natural’ neighbourhoods. These are distinct in relation to their populations and geographies, but also in terms of residential mobility. 2006 household survey data has been analysed for these four areas and allows the NDC to target interventions according to the needs of different populations:
• area 1 contains the highest levels of owner-occupation and private rented sector property. The area is ethnically diverse, and contains students and young professionals. Over 45 per cent of households contain multiple adults. 40 per cent of residents are aged between 16 and 24 years and over 30 per cent are in full-time education. This area has the highest levels of residential mobility but also scores most highly on quality of life and area satisfaction indicators. Interventions in this area have included security upgrades to property and improvements to private rented sector properties
• area 2 contains a largely BME population. 54 per cent of residents do not have English as their first language. Housing is predominantly terraced and tenure is mixed (approx 25 per cent owner-occupier, 38 per cent social rented, 35 per cent private rented and two per cent other). Mobility in this area is lower but still relatively high: 20 per cent of households have lived at their current address for less than a year and 40 per cent have moved into the area within the last five years. Only 35 per cent of residents who think they will move in the next two years intend to stay in the NDC area. This area scores lower on area satisfaction and quality of life indicators. Household survey data has highlighted environmental problems including rubbish in the streets (nearly 50 per cent of residents think this a serious problem), and vandalism, graffiti and other damage to property (21 per cent think this a serious problem). Extensive neighbourhood improvements in this area have been supported by the NDC, the City Council and Bridging Newcastle Gateshead (the Housing Market Renewal Pathfinder)
• areas 3 and 4 mainly consist of social rented properties: 89 per cent and 91 per cent respectively. These areas have much lower levels of residential mobility (in both areas nearly 50 per cent of residents have lived in the area for more than 20 years). Residents in these areas are overwhelmingly white British (81 per cent and 85 per cent respectively). Area 3 contains a large percentage of lone-parent households (27 per cent) and area 4 houses a large number of single-person households (66 per cent), mostly in the Cruddas Park tower blocks which are currently undergoing redevelopment supported by the NDC and Bridging Newcastle Gateshead. Mobility in these areas is associated with the movement of tenants in the social rented sector (low levels of demand for social housing in this area mean that existing tenants can move easily within the NDC area) and with the decanting of residents from tower blocks due for redevelopment. Household survey data points to high numbers of residents in these areas reporting isolation (not knowing people locally and feeling that people are not friendly) and fear of crime. There are also problems with crime

32 | Residential mobility and outcome change in deprived areas
and anti-social behaviour, including teenagers hanging around in the streets, and damage to property. This is particularly the case in area 3 where 41 per cent of residents think teenagers hanging around in streets, and 31 per cent identify damage to property, as serious problems. This analysis has enabled the NDC and the police to develop a more in-depth understanding of crime issues (when data for the NDC area as a whole indicated an overall levelling off of criminal activity) and to target resources accordingly.
Mobility and aspirations
3.28. The household survey also contains questions relating to residents’ aspirations to move, including the proportion of residents who want to move or intend to move over the next two year period (Table 3.4).
3.29. Whilst there has been a fall in the proportion of people wanting to move in England as a whole, this has not been reflected in NDC areas. There has been little change between 2002 and 2006 at the Programme level in relation to the numbers of residents either wanting, or intending, to move. The gap between wanting to move across all NDC areas and the national benchmark actually widened over this four year period from 10 to 15 percentage points. This may be related to tenure profile. NDC areas have half the national levels of owner occupation. As discussed at 4.5, there are significant associations between tenure profile and propensity to move.
3.30. By combining data on those wanting and intending to move it is also possible to derive an indication of whether individuals are in some senses ‘trapped’ in their current housing situation: they want to move but don’t think they will do so in the following two year period. Between 2002 and 2006, there was a one percentage point fall in those ‘trapped’ in their current housing situation in NDC areas compared with a two percentage point increase in comparator areas over the same time period (Table 3.4).
Table 3.4: Moving: resident aspirations: 2002–2006
Want to move (%)
Intend to move (%)
Trapped (%)
2002 2006 2002 2006 2002 2006
All NDCs 39 40 32 33 14 13
Comparator areas 33 35 29 28 11 13
National 29 25 – – – –
Sources: Ipsos MORI NDC household survey 2002 and 2006, national: MORI Omnibus 2002, MORI Omnibus 2004, Ipsos MORI Social Issues Omnibus 2006Base: All NDC aggregate 2002 (19,574), 2006 (15,792); Comparator 2002 (2,014), 2006 (3,062)
3.31. Again these Programme-wide figures hide considerable variations at the level of individual NDC areas:

Residential mobility and outcome change in deprived areas | 33
• by 2006 there was a 30 percentage points difference between the NDC area with the lowest proportion of residents wanting to move and that with the highest
• in one NDC area there was a 22 percentage points increase in the proportion of residents wanting to move between 2002 and 2006
• by 2006 about one-fifth of residents in several London NDC areas felt trapped, three to four times the proportion in, say, Walsall.
In-movers, out-movers and frequent movers
3.32. As well as considering levels of population movement amongst residents in NDC areas it is also possible to explore the characteristics of residents moving into NDC areas, of households that move frequently, and of those who leave NDC areas. The analysis below is organised around three themes:
• characteristics of in-movers
• frequent-mover households with children
• who leaves NDC areas?
In-movers
3.33. Previous analysis undertaken by the national evaluation team has explored the characteristics of those moving into NDC areas compared with those who stay. The 2006/07 Programme-wide Report (CLG 2007b) explored this issue at length and these findings are not repeated here in any detail. But the overarching conclusions are relevant. For instance it is possible to make comparisons between those who stayed in the 39 areas between 2004 and 2006 with those who moved in during this two year period. Compared with the stayers, in-movers were more likely to be:
• younger
• white not British/Irish, or from a BME background
• live in a larger household
• be accommodated in the private rented sector.
3.34. It is also possible to consider the degree to which the nature of inmovers has changed by comparing those who moved into the 39 areas between 2002 and 2004 with those making the same move during the following two years. Some clear differences emerge, almost certainly driven by international and national forces such as the scale of immigration from EU Accession States, and the marked increase in the ‘buy to rent’ sector. Compared with those who had moved in between 2002–04, the 2004–06 inmovers were more likely to:
• be white but not British/Irish
• live in larger households

34 | Residential mobility and outcome change in deprived areas
• be concentrated in the private rented sector
• be employed
3.35. One implication arising from these processes is the marked increase in the proportion of residents whose first language is not English. Across the Programme this rose from 16 to 21 percentage points in four years. By 2006 English was not the first language for at least 27 per cent of residents in all 10 London NDC areas. This was true for 74 per cent of residents in Tower Hamlets. On the other hand it was difficult to identify anyone whose first language was not English in a number of other areas including Walsall, Knowsley, Derby, Southampton, Birmingham Kings Norton and Hull.
3.36. Table 3.5 considers national insurance number registrations for non-UK nationals. This data illustrates differences in population movement from outside the country by local authority area. It thus provides contextual information in relation to the degree to which individual NDC areas might be experiencing in-migration of non-UK residents. Registrations range from 12 per cent of the population in Newham to 0 per cent in Knowsley. In general in-migration tends to be much higher in the South: of the 10 local authorities in which non-UK Nationals National Insurance Number Registrations make up the highest proportion of the working age population, nine are located in London. Local authorities with the lowest percentages tend to be in 'Northern' localities: Knowsley, Sunderland, Hartlepool, and Oldham.
3.37. It should be noted that this data only relates to original place of registration, it does not necessarily follow that migrants remain in the areas in which they first arrive and some will have left England altogether. However, this rolling figure over two years (2005–07), does give an indication of the scale of in-migration in NDC parent local authorities.

Residential mobility and outcome change in deprived areas | 35
Table 3.5: Non-UK Nationals National Insurance Number Registrations in 2005–06 and 2006–07 by NDC parent local authority
LA 2005–06 2006–07 2005–07 2005–07 as a proportion of the 2006 population
Newham 14,870 15,670 30,540 12
Brent 14,990 15,510 30,500 11
Hammersmith and Fulham 9,390 9,240 18,630 11
Tower Hamlets 10,460 11,570 22,030 10
Haringey 9,560 10,760 20,320 9
Lambeth 10,470 11,040 21,510 8
Hackney 7,650 7,460 15,110 7
Islington 6,780 6,570 13,350 7
Southwark 9,690 9,570 19,260 7
Luton 5,450 5,300 10,750 6
Lewisham 6,760 6,690 13,450 5
Leicester 7,620 7,410 15,030 5
Manchester 10,810 11,300 22,110 5
Southampton 4,620 4,390 9,010 4
Coventry 5,520 6,160 11,680 4
Brighton 5,090 4,410 9,500 4
Nottingham 4,550 5,600 10,150 4
Newcastle 3,860 4,570 8,430 3
Bristol 5,450 7,250 12,700 3
Salford 2,900 3,210 6,110 3
Norwich 1,650 1,950 3,600 3
Birmingham 11,080 14,330 25,410 3
Derby 2,770 3,010 5,780 2
Hull 3,190 2,910 6,100 2
Bradford 4,610 6,530 11,140 2
Wolverhampton 2,540 2,450 4,990 2
Liverpool 4,460 4,730 9,190 2
Sandwell 2,160 3,340 5,500 2
Sheffield 4,380 5,080 9,460 2
Doncaster 2,670 2,050 4,720 2
Plymouth 1,660 2,260 3,920 2
Middlesbrough 850 990 1,840 1
Rochdale 1,180 1,370 2,550 1
Oldham 1,330 1,320 2,650 1
Walsall 1,300 1,360 2,660 1
Sunderland 1,240 1,460 2,700 1
Hartlepool 200 200 400 0
Knowsley 190 260 450 0
All 38 NDC LAs 203,950 219,280 423,230 4
Source: 100% sample at 14 May 2007 from the National Insurance Recording System (NIRS). www.dwp.gov.uk/asd/asd1/niall/nino_allocation.asp

36 | Residential mobility and outcome change in deprived areas
Frequent-mover households with children
3.38. Additional information is available in relation to households containing children. Although areas with higher percentages of households containing school-aged children tend to be associated with lower levels of residential mobility there are significant numbers of schoolchildren living in mobile households in NDC areas. Programme-wide data on frequently-moving households illustrates the size and nature of the problem. Table 3.6 details the percentage of frequent-mover households with a child aged up to 18. Twenty-five per cent of frequent-mover households contain at least one pre-school child and almost 20 per cent a child of primary school age. Frequent movers are more likely to have pre-school age children than non frequent movers, but less likely to have children in any of the three school age groups. The proportion of frequent-mover households with at least one pre-school age child increased by four percentage points between 2002 and 2006; there was no major change in any of the other age groups. Table 3.7 illustrates numbers of children living in frequent-mover households in NDC areas. An estimated 9,900 children under the age of 16 were living in frequent-mover households across the 39 NDC areas in 2002. Over half of these (5,100) were of school age.
Table 3.6: Frequent-mover households containing children
Percentage of households with at least one child in age group
2002 2006
Frequent-mover households
0–3 year-olds 21 25
4–10 year-olds 19 19
11–15 year-olds 10 9
16–18 year-olds 10 10
Non frequent-mover households
0–3 yea-olds 14 15
4–10 year-olds 21 22
11–15 year-olds 18 19
16–18 year-olds 18 19
Source: Ipsos MORI NDC household survey 2002 and 2006Base: Frequent movers 2002 (2210), 2006 (1620); Non frequent movers 2002 (17364), 2006 (14172)Frequent mover = 3 or more moves in past 5 years

Residential mobility and outcome change in deprived areas | 37
Table 3.7: Numbers of children in frequent-mover households
Age group Estimated number of children in age group in frequent-mover households across all NDCs (2002)
0–4 4800
5–9 2900
10–14 1900
15–19 2300
0–15 9900
Source: Ipsos MORI NDC household survey 2002, SDRC population estimates mid-2002Base: All in household 0–4 (4374), 5–9 (4227), 10–14 (4044), 15–19 (3735), 0–15 (13428)Frequent mover = 3 or more moves in past 5 yearsEstimates rounded to the nearest 100
3.39. Frequent movement is often a feature of the lives of pre-school and school-aged children in NDC areas, although it is not known whether these moves are short distance (within NDC areas) or whether they involve moves outside the NDC. But for school-aged children frequent moves may involve disruption to learning. If moves involve a change of school there may be loss of friendships and the need to build new relationships with peers and teachers, all of which may result in additional support needs. There may also be impacts on school rolls and performance. The impact of mobility on educational outcomes in NDC areas is discussed at 5.33 to 5.39.
Who leaves NDC areas?
3.40. In 2007 the NDC national evaluation team presented findings of an analysis into some 330 people who left NDC areas between 2002 and 2004 and who were subsequently traced by Ipsos MORI (CLG 2007a). Headline findings included:
• when compared within inmovers, those leaving the 39 NDC neighbourhoods were more likely to be older, in employment and to move into owner-occupied accommodation
• when compared to within area stayers, those leaving the 39 NDC neighbourhoods were more likely to be younger, white, in employment, have equivalent to NVQ 4 qualifications or higher, in good health, and to have moved into owner or private rented accommodation
• people moved out of NDC areas for a range of area-based, environmental and property-related reasons: the most important specific reasons for leaving were to access a better choice and quality of housing, lower crime rates in non-NDC areas, fewer problems of anti-social behaviour, more policing, and the quality of the local environment; not many leave primarily because of employment-related factors
• one third of those who left between 2002 and 2004 would have been inclined to stay in NDC areas if improvements had taken place in terms of local housing and environmental standards

38 | Residential mobility and outcome change in deprived areas
• considerable changes in tenure occurred for outmovers: whereas 38 per cent were in owner-occupation in 2002, fully 48 per cent were so two years later; moving out of the area is often associated with tenure change.
3.41. The key overarching conclusion to this analysis is that people tend to leave because of perceived shortcomings in NDC areas especially in relation to the type and range of available housing, environment standards and high levels of anti-social behaviour. Once they leave they are unlikely ever to return.
Concluding comments
3.42. This chapter has examined a number of key dimensions to residential mobility. A number of key findings emerge:
• NDC areas have higher levels of mobility than similarly deprived areas, or is the case nationally; but there is huge variation between individual NDCs
• there is a high level of movement within NDC areas
• analysis of movement into and out of NDC areas suggests that NDC areas are mixed between those which predominantly provide low cost housing for people at the start of their housing careers (students, young professionals, and so on); those with higher concentrations of private rented accommodation, and those which are largely isolated from more prosperous housing markets and in which individuals moving into and out of NDC neighbourhoods are coming from, and going to, similarly deprived communities
• there has been no reduction in the numbers of NDC residents wanting to move
• there are differences in the characteristics of those moving into, out of, and staying within, NDC areas.
3.43. The next chapter examines associations between levels of mobility and population characteristics.

Residential mobility and outcome change in deprived areas | 39
4. Understanding residential mobility in NDC areas12
Summary
There are significant positive correlations12 between the level of residential mobility in an area and the proportion of:
• 16–34 year-olds
• households in private rented accommodation
• full-time students
• single-person households
• large adult households.
Differences in rates of mobility are overwhelmingly determined by differences in the characteristics of NDC populations. Eighty two per cent of the variance is explained by five key demographic differences, the most significant of which is age: nearly three quarters of the variance between different NDC areas can be attributed to the proportion of 16–34 year-olds in the local population.
A number of key socio-demographic characteristics are significantly associated with the likelihood of moving:
• younger age groups (16–34); private rented sector households; recent movers; large and single-person households; residents with higher qualifications (NVQ4 or above); males and white residents are more likely than average to move
• lone-parent households; couples (with and without dependent children); women; workless households; and Asian residents are less likely than average to move.
Two perceptional variables are significantly associated with increased likelihood of moving:
• those dissatisfied with their area as a place to live in 2002 were on average 28 per cent more likely to move than those not dissatisfied
• residents dissatisfied with their accommodation in 2002 were on average 69 per cent more likely to have moved compared to those who were not dissatisfied.
12 A correlation (measured by a Pearson’s correlation coefficient) indicates the strength and direction of a linear relationship between two random continuous variables. The correlation is termed significant if statistically the relationship is thought not to have occurred due to chance. A positive correlation implies that a higher value of one variable (e.g. an areas level of mobility increases), on average, will be associated with a higher value of the other variable (e.g. the proportion of 16 – 34 year-olds). A negative correlation implies that, on average, an higher value of one variable (e.g. an areas level of mobility increases) will be associated with a lower value of the other variable (e.g. the proportion of owner occupiers)

40 | Residential mobility and outcome change in deprived areas
NDC areas with high levels of residential mobility tend to be characterised by:
• younger populations
• more single-person households
• and fewer owner-occupiers.
4.1. Chapter 3 presented an overview of residential mobility in NDC areas. This chapter improves our understanding of residential mobility by examining associations between population characteristics and residential mobility and by using exploratory analytical tools to assess the effects of mobility on NDC neighbourhoods. The chapter uses household survey data and evidence from seven case study areas (Bradford, Lambeth, Knowsley, Newcastle, Newham, Sheffield, Walsall). Analysis is based around two key questions:
• how can we explain differences between NDC areas in rates of mobility?
• what are the effects of residential mobility on NDC neighbourhoods?
Explaining differences in mobility rates
4.2. Explaining differences in mobility rates between NDC areas has been approached in two ways:
• through an analysis of area-level data, resulting in a residential mobility ‘score’ for different NDC areas
• through an exploration of individual-level data, using logistic regression modelling to identify the characteristics of NDC populations which are most likely to predict mobility.
Area-level data
4.3. The 2002 and 2006 surveys can be used to explore key differences in rates of mobility between different NDC areas. To facilitate an analysis of area-level data a combined ‘residential mobility’ score has been derived. This standardises, then combines, the five indicators13 of residential mobility used throughout this report (Appendix 7 contains more details of the residential mobility score).
4.4. Analysis of area-level data helps illuminate factors associated with higher levels of residential mobility as measured by this combined score. Both
13 See Table 3.1

Residential mobility and outcome change in deprived areas | 41
correlation coefficients14 and multiple regression15 techniques have been used. It should be remembered that these methods highlight strength of association between factors and not causality.
4.5. Table 4.1 indicates there are significant positive correlations16 between the level of residential mobility in an area and the proportion of:
• 16–34 year-olds
• households in private rented accommodation
• full-time students
• single-person households
• large adult households (2006 only).
4.6. There is significant negative correlation between residential mobility and the proportion of:
• children under 16
• 35–59 year-olds (2006 only)
• over 60s
• households in owner-occupation
• couples with dependent children
• couples without dependent children.
4.7. As would be expected, NDC areas with higher numbers of young adults, full-time students, private renters and single-person or large households tend to experience greater levels of residential mobility. Alternatively, areas with more stable populations are characterised by higher numbers of children, adults aged 35 or over, owner-occupiers and married or co-habiting couples. This analysis confirms trends observed in other research and discussed in Chapter 2. In NDC areas, as in other deprived communities, residential mobility is closely associated with younger populations living in private sector rented accommodation.
14 Correlation coefficients are calculated to give an indication of the level of association between two factors. The coefficients range from –1 to +1. A coefficient of –1 shows a strong negative association, as levels of one factor increases then the other one declines; a coefficient of +1 is a strong positive association as the level of one factor increases so does the other. A coefficient of zero indicates that no linear relationship exists.
15 Multiple linear regression models help to consider the strength of a linear association between a dependent variable – in this case the level of residential mobility in an area – and a number of independent variables such as indicators of the demographic profile of the areas.
16 A correlation (measured by a Pearson’s correlation coefficient) indicates the strength and direction of a linear relationship between two random continuous variables. The correlation is termed significant if statistically the relationship is thought not to have occurred due to chance. A positive correlation implies that a higher value of one variable (e.g. an areas level of mobility increases), on average, will be associated with a higher value of the other variable (e.g. the proportion of 16 – 34 year-olds). A negative correlation implies that, on average, an higher value of one variable (e.g. an areas level of mobility increases) will be associated with a lower value of the other variable (e.g. the proportion of owner occupiers)

42 | Residential mobility and outcome change in deprived areas
Table 4.1: Correlations between combined residential mobility score and possible influences on mobility
Residential mobility score vs. proportion of... Correlation 2002
Correlation 2006
16–34 year-olds 0.67** 0.77**
Households in private rented accommodation 0.62** 0.69**
Full-time students 0.54** 0.67**
Single-person households 0.66** 0.52**
Large adult households 0.22 0.46**
35–59 year-olds –0.23 –0.34*
Households in social rented 0.11 0.07
Black 0.00 0.05
Asian –0.05 0.02
White 0.03 –0.04
Lone-parent Family –0.04 –0.11
English first language –0.06 –0.17
Couples without dependent children –0.48** –0.42**
Children under 16 –0.34* –0.46**
Over 60s –0.46** –0.48**
Households in owner occupation –0.46** –0.50**
Couples with dependent children –0.56** –0.52**
Source: Ipsos MORI NDC household survey 2002 and 2006Base: All NDCs (39)* significant at 0.05 level, **significant at 0.01 level17
4.8. Similarly, a multiple linear regression model confirms the factors which are most related to levels of residential mobility in an area. Figure 4.1 lists five significant factors18 which explain 82 per cent of the variance in levels of residential mobility in NDC areas in 2006. The relative importance of each is given as the percentage of the overall variance each contributes to the model.
4.9. By far the most important factor identified by the model is the age profile of the local population. Nearly three quarters of the overall variance explained by the model is attributed to the proportion of 16–34 year-olds in an area. Additionally, the proportion of older people (aged 60 or over) in an area is also a significant factor but with a negative effect: the greater the number of older residents the lower the levels of residential mobility in an area.
17 These significance levels reflect the probability of rejecting the null hypothesis of no correlation existing when this statement is actually true. Often called a ‘type 1 error’. 0.05 level means there is only a 5 per cent chance and 0.001 a 1 per cent chance that we have wrongly assumed a significant correlation.
18 see Appendix 5 for a list of the variables put forward to be included in the model

Residential mobility and outcome change in deprived areas | 43
Figure 4.1: Key drivers of residential mobility in NDC areas, 2006
Proportion of 16–34 year olds (+72 per cent)
Proportion of single person households(+14 per cent)
Proportion of white residents (+8 per cent) Residential mobility
82% of the variance explained by the model
Source: Ipsos MORI household survey
Proportion of private renters (+3 per cent)
Proportion of over 60 year olds (–3 per cent)
4.10. Table 4.1 suggests that ethnicity is not significantly correlated with levels of residential mobility. However, in the linear regression model, when the proportion of white residents is considered (when controlling for other factors) it does add something to the understanding of levels of residential mobility. In NDC areas, lower levels of ethnic diversity are associated with higher levels of residential mobility (Figure 4.1).
4.11. The role that ethnicity plays over and above the age profile of an area is interesting in the context of the two case study areas with lowest levels of residential mobility: Walsall and Knowsley. Both areas have populations which are almost exclusively white; 97.6 per cent and 99.7 per cent of respondents respectively. Other local factors are therefore likely to outweigh the effect that the ethnic profile may have on residential mobility patterns in these area. These include Walsall having a small private rented sector, the lowest proportion of 16–34 year-olds, and the highest proportion of over 60 year-olds of all NDC areas.
4.12. Other case study areas display characteristics associated with high levels of residential mobility. Newcastle has a high level of residential mobility when measured by the combined score and also has the second highest proportion of 16–34 year-olds of all NDCs, the third lowest level of over 60 year-olds, and the largest private rented sector of all NDCs.
4.13. Variables reflecting other factors were also tried in models but were found to be not significant:
• employment rate amongst working age residents

44 | Residential mobility and outcome change in deprived areas
• concentrations of certain types of worklessness such as claiming Incapacity Benefit or Severe Disablement Allowance
• several variables relating to ‘place-based satisfaction’, for example satisfaction with the area or having a high levels of lawlessness and dereliction
• two indicators of satisfaction with accommodation.
Individual-level data
4.14. Analyses developed immediately above consider relationships between levels of residential mobility at the area level and key socio-economic characteristics of residents in these areas. It is also possible to consider relationships at an individual level by comparing characteristics of residents who moved into NDC areas between 2002 and 2004 with those who stayed in the area for that time.
4.15. Logistic regression models are used for this analysis. These are a useful analytical tool as they allow modelling of dichotomous (binary) outcomes, for example, whether a respondent has moved between 2002 and 2004 or not. Logistic regression modelling attempts to predict the probability of this outcome occurring given some known explanatory values. The results from the models are presented in the form of odds ratios (ORs). ORs reflect the probability of an outcome occurring given the respondent has a given characteristic compared to a base group (all other things being equal). ORs for logistic regression models are developed in Appendix 3.
4.16. Figure 4.2 illustrates results from a model predicting the odds of a resident moving between 2002 and 2004 given their known socio-economic characteristics at 2002. The average OR for each variable is given as one and this is presented as the x-axis on the chart. The bars represent the deviation from the average for each category. So bars to the left of the axis are less likely than the group as a whole to have moved between 2002 and 2004 and bars to the right of the axis are more likely than average to have moved in the period. An OR of two indicates a category is twice as likely as the average to have moved; an OR of 0.5 indicates a category is half as likely as average to have moved. Where the difference from the average is significant at the 5 per cent level the bars have dark shading; light shading indicates the category is not significantly different from the average.
4.17. Results confirm the role that key demographic characteristics play in residential mobility:
• those within younger age groups (16 to 34) are significantly more likely to have moved compared with the population as a whole with odds rising to more than twice the average for the 16 to 24 year-olds; at the other end of the spectrum residents in the two oldest age bands are approximately half as likely to have moved than average
• tenure in 2002 is shown to be a significant predictor of actual mobility between 2002 and 2004; on average private renters are more than twice

Residential mobility and outcome change in deprived areas | 45
as likely to have moved; owner occupiers are the least likely to have moved; social renters are on average significantly less likely than the population average to have moved but, on average, significantly more likely than owner occupiers to have moved
• length of residence at current address is also shown to be a significant predictor of residential mobility; those who had moved more recently were also most likely to have also moved again between 2002 and 2004
– large adult and single-person households are on average significantly more likely to have moved compared to the average; while lone-parent households, couples with dependent children and couples without dependent children are significantly less likely to have moved
– the odds of moving are shown to be significantly higher on average for residents holding qualifications equivalent to NVQ4 or higher
– of other significant variables, males and white respondents are on average significantly more likely to have moved; females, workless households and Asian respondents are on average significantly less likely to have moved.
4.18. In a second logistic regression model a number of variables reflecting residents’ perceptions of areas were introduced in addition to the socio-economic characteristics of individuals. For these variables the ORs are relative to a base category rather than to the average of the group as a whole. For example those feeling dissatisfied are compared to those who are not dissatisfied. The following factors were found to be significant predictors of moving between 2002 and 2004 over and above the effect of the socio-economic variables outlined above:
• those dissatisfied with their area as a place to live in 2002 were on average 28 per cent more likely to move than those not dissatisfied
• residents who were dissatisfied with their accommodation in 2002 were on average 69 per cent more likely to have moved compared with those who were not dissatisfied.
4.19. Three additional variables reflecting residents’ perceptions of problems in the area or state of their accommodation were also added to the model but found not to be significantly related to moving between 2002 and 2004:
• residents’ satisfaction with the state of repair of their current accommodation
• problems in the area relating to crime and lawlessness; this combines questions on burglary, car crime, teenagers hanging around, gangs or hooliganism, drug dealing and use, properties set on fire or harassment
• problems in the area associated with the environment or dereliction; this combines questions on dogs’ nuisance or mess, litter or rubbish on the streets, run down or boarded up properties, abandoned cars, vandalism or graffiti, speed or volume of the traffic, poor quality or lack of open spaces.

46 | Residential mobility and outcome change in deprived areas
Figure 4.2: Odds ratios for a resident moving 2002–04
0 0.5 1 1.5 2 2.5
No
Yes
Owner occupation
Social rented
Private rented
20+
10 to 19
5 to 9
2 to 4
Less than 1 year
Couple,no child(ren)
Couple,with child(ren)
Lone parent
Single person
Large adult
No Qualification
NVQ 1
NVQ 2
NVQ 3
NVQ 4+
Black
‘Asian’
White
65+
50–64
35–49
25–34
16–24
Female
Male
Wor
kles
sho
useh
old
Tenu
reLe
ngth
of r
esid
ence
Hous
ehol
d Co
mpo
sitio
nN
VQ e
quiv
alen
tEt
hnici
tyAg
eSe
x
Odds ratios
likelihood of moving moreless
Base: All wave 1 respondents that could be assigned a mobility outcome in 2004 Source: Ipsos MORI NDC household surveyDarker bars indicate significant at a 0.05 level

Residential mobility and outcome change in deprived areas | 47
4.20. The extent to which levels of social capital may impact on people’s attachment to an area, and in turn translate into reduced levels of residential mobility, was also tested. After controlling for the base characteristics discussed above, the following were found to be significantly related to residents having lower odds of moving:
• those who felt part of the community were 23 per cent less likely to have moved than those who did not (OR 0.81)
• those who thought their area was a place where neighbours look out for each other were 17 per cent less likely to have moved than those who did not (OR 0.85)
• those who had been involved in any activities organised by the local partnership were 18 per cent less likely to have moved than those who had not (OR 0.85)
Whether a respondent felt they could influence decisions in their area was not significantly related to the odds of moving.
4.21. A final model considered the extent to which intentions to move in 2002 actually translated into a move in the following two year period. After the basic socio-economic variables are taken into account, the model indicates that on average a resident who thought in 2002 that s/he would move was 3.4 times more likely to have actually moved by 2004 compared with one who had no intentions of moving over the following two year period.
4.22. A final point is that household survey data will include residents who have been affected or will expect to be affected by proposals in some NDCs for large scale demolition and redevelopment. Such developments might involve decanting residents, either temporarily or permanently, to new addresses. In Newcastle, for instance, the NDC is working with the Housing Market Renewal Pathfinder, to refurbish six tower blocks. This work is currently in progress but has been planned for some time and will ultimately involve the temporary or permanent rehousing of residents. But models cannot assess the degree to which residential mobility is through choice.
What are the effects of residential mobility on NDC neighbourhoods?
Classifying NDC areas
4.23. Having identified predictors of residential mobility, the remainder of this chapter discusses the potential consequences for outcomes in NDC neighbourhoods. In the first instance, NDCs are grouped into areas of high, medium or low levels of residential mobility in order to explore:
• the degree to which residential mobility evident at the beginning of the Programme changed through time

48 | Residential mobility and outcome change in deprived areas
• the extent to which mobility may have a bearing on the trajectories of a range of key outcomes through time.
4.24. NDC areas have been allocated to a three-fold classification using a cluster analysis based on the five indicators of residential mobility in 2002 (see Appendix 7). Table 4.2 shows NDC areas falling within each classification. Case study areas are highlighted and are represented across each of the three groups. Approximately one quarter of areas demonstrate relatively higher rates of residential mobility compared to the NDC average and a further quarter exhibit relatively low rates of mobility.
Table 4.2: Groupings of NDC areas on the basis of residential mobility
High (Total population1 85,100)
Medium (Total population 183,100)
Low (Total population 114,800)
Newcastle Rochdale Middlesbrough
Plymouth Manchester Knowsley
Coventry Sheffield Birmingham A
Sunderland Luton Sandwell
Bristol Hackney Walsall
Lambeth Oldham Norwich
Fulham Tower Hamlets Birmingham KN
Doncaster Islington Southampton
Liverpool Haringey Derby
Nottingham Newham Wolverhampton
Lewisham Southwark
Salford
Bradford
Hartlepool
Brighton
Brent
Leicester
Hull
1 Total population for the three groupings is for 2005.
4.25. Table 4.3 demonstrates relationships between the five residential mobility indicators for both 2002 and 2006 and each group of NDCs:
• as would be expected more long-term residents and fewer short-term residents and frequent movers live in areas classified with low levels of residential mobility; and more short-term residents and frequent movers and fewer long-term residents appear in areas of high residential mobility
• areas of low and medium residential mobility changed little over time but areas of high mobility stabilised slightly: for instance, there was more evidence for a reduction in short-term residents in areas of high residential mobility compared with areas of low mobility; numbers of frequent movers also fell in areas for high residential mobility and remained static in areas of low mobility.

Residential mobility and outcome change in deprived areas | 49
Table 4.3: Residential mobility indicators by grouping of NDC areas; percentage 2002 and 2006
Residential mobility
Not moved in past 5 years
Moved 3+ times in past 5 years
Lived at address less than 1 year
Lived at address 10 years or more
Moved 2002–2004
Low 2002 67 7 9 50 18
2006 71 7 8 51 n/a
change 4 0 –1 1 n/a
Medium 2002 58 10 15 41 23
2006 63 12 13 41 n/a
change 5 2 –2 0 n/a
High 2002 48 19 24 33 34
2006 53 17 21 35 n/a
change 5 –2 –3 2 n/a
All NDCs 2002 58 12 16 41 24
2006 63 12 14 42 n/a
change 5 0 –2 1 n/a
Source: Ipsos MORI NDC household survey 2002 and 2006Base: All: Low 2002 (5,529) 2006 (4,472); Medium 2002 (9,030) 2006 (7,269); High 2002 (5,015) 2006 (4,053); NDC 2002 (19,574) 2006 (15,792)
4.26. The socio-economic profiles of the three groups of NDC areas also differ (as would be expected given the findings of the analysis of drivers of residential mobility presented at 4.8 to 4.10). Compared with low mobility NDC areas, higher mobility neighbourhoods tend to be characterised by (Table 4.4):
• younger populations
• more single-person households
• and fewer owner-occupiers.

50 | Residential mobility and outcome change in deprived areas
Table 4.4: Key characteristics of areas with different levels of mobility (2006)
Low residential mobility (%)
Mid residential mobility (%)
High residential mobility (%)
NDC (%)
Ethnicity
White 76 67 76 72
Age
0–15 26 24 21 24
16–34 32 37 43 37
35–59 30 28 27 28
60+ 13 11 10 11
Household comp
Couple, no dependent children 24 18 18 20
Couple with dependent children 21 18 14 18
Single-person household 28 33 37 33
Tenure
Owner occupier 43 33 27 34
Social sector renter 50 55 55 54
Private renter 6 11 17 11
Source: Ipsos MORI NDC household survey 2006Base: All: Low (4,472); Medium (7,269); High (4,053); NDC (15,792)
4.27. Table 4.5 looks, by the three groups, at absolute levels on 29 core indicators drawn from the 2006 household survey. Compared with NDC areas with low levels of residential mobility, those with higher levels tend to be characterised by:
• fewer people without qualifications
• more workless households
• higher levels of lawlessness and dereliction, and crime
• more people wanting to leave
• fewer people being satisfied with the area or their accommodation
• and fewer people thinking neighbours look out for each other.
4.28. This chapter has highlighted the critical importance of compositional factors in understanding differences between rates of mobility in different NDC areas. The next chapter looks at relationships between residential mobility and outcome change for NDC neighbourhoods.

Residential mobility and outcome change in deprived areas | 51
Table 4.5: Core indicators by NDC residential mobility classification; percentage 2006
Indicator 2006
Low residential mobility (%)
Mid residential mobility (%)
High residential mobility (%)
NDC (%)
Education No qualifications (a) 34 29 29 31Taken part in education or training in the
past year (b)21 28 25 25
Need to improve basic skills 29 34 31 32
Worklessness and finance Receive benefits 47 46 45 46Workless households (c) 36 39 42 39In employment (a) 54 55 52 54Income less than £200 per week 36 38 39 38
Health No physical activity for at least 20 mins 9 9 10 9Smoke 36 36 39 37Health not good 19 21 19 20Health worse than a year ago 19 20 19 19Satisfied with doctor (d) 85 83 85 84SF 36 mental health 73 72 72 72
Crime Lawlessness and dereliction index, high score 14 13 20 15Feel unsafe after dark 46 44 47 45Fear of crime index, high score 21 20 22 21Been a victim of at least one crime 26 29 31 29
Housing and physical environment Satisfied with area 71 72 68 71Trapped 13 12 15 13Want to move 37 38 46 40Satisfied with accommodation 86 82 79 82Think area has improved over last 2 years (e) 40 45 42 43Problems with environment index, high score 11 11 15 12
Community Feel part of the community 42 43 41 42Neighbours look out for each other 65 62 55 61Quality of life good 81 80 80 80Can influence decisions that affect local area 23 27 25 25Involved in NDC activities (f) 19 24 22 22NDC improved area (f) 59 59 53 57
Source: Ipsos MORI NDC household survey 2006Base: All: Low (4,472); Medium (7,269); High (4,053); NDC (15,792) (a) working age Low (3,183); Medium (5,446); High (3,082); NDC (11,711) (b) working age excluding in FT education Low (3,046); Medium (5,136); High (2,809); NDC (10,911) (c) working age households Low (3,418); Medium (5,736); High (3,244); NDC (12,398) (d) seen doctor in the past year Low (3,754); Medium (6,000); High (3,291); NDC (13,045) (e) lived in area for at least 2 years Low (3,966); Medium (6,115); High (3,128); NDC (13,209) (f) heard of local NDC Low (3,723); Medium (5,945); High (3,340); NDC (13,008)

52 | Residential mobility and outcome change in deprived areas
5. Residential mobility and positive neighbourhood change
Summary
Categorising NDCs into groupings of ‘high’, ‘medium’ and ‘low’ residential mobility reveals few consistent relationships in relation to outcome change. However, some relationships emerge including:
• in areas of high mobility there has been more positive change than the NDC average in relation to worklessness and finance indicators
• NDCs with higher levels of mobility have experienced less positive change than the NDC average in relation to housing and physical environment indicators
Analysis of data at the level of individual NDC areas, using a combined change score (CIRC), reveals significant relationships between mobility and outcome change in NDC areas:
• change for the education theme is significantly negatively correlated with levels of residential mobility in both 2002 and 2006 at Key Stage 4 (KS4): as rates of residential mobility increase, children’s performance at KS4 decreases
• in both 2002 and 2006, higher levels of mobility are associated with achieving less change across the housing theme; this significant relationship holds for two-thirds of the core indicators for this outcome theme including want to move, ‘trapped’ in current accommodation, satisfaction with accommodation, problems with the local environment
• a combined CIRC score for themes associated with ‘place’-based outcomes (crime, community, and housing and the physical environment) is negatively correlated with levels of residential mobility in both 2002 and 2006.
When analysing outcome change for individuals remaining in NDC areas between 2002 and 2006 those who stayed in areas of low residential mobility were significantly more likely to see improvements in many place-based outcomes. Those who remained in areas with higher mobility levels perceived fewer improvements in problems associated with the area, crime and environmental degradation.
5.1. This chapter considers relationships between residential mobility and outcome change in NDC areas. It also utilises evidence from case studies to consider the impact of different levels of mobility on the delivery of services to NDC communities.

Residential mobility and outcome change in deprived areas | 53
5.2. Outcome change is analysed in three ways:
• using the threefold classifications of areas into high, medium and low levels of residential mobility
• at the level of the individual NDC area
• amongst individuals staying in NDC areas with different levels of mobility.
Outcome change in NDCs classified as ‘high’ ‘medium’ and ‘low’ residential mobility
5.3. Utilising the three-fold classification developed at 4.24 allows for a consideration of the degree to which there are any systematic differences in rates of change achieved in areas of high, medium or low residential mobility. Table 5.1 presents the average percentage point change between 2002 and 2006 for a range of core indicators.
5.4. There are no consistent messages across these three groups. Each saw significant positive change across a similar number of indicators: in low mobility NDCs there was change across 20 indicators, in mid mobility NDCs there was change across 18 indicators and high mobility NDCs there was change in 21 indicators. However, there are some interesting differences in the rates of change for individual indicators.
5.5. In areas of high mobility there has been more positive change than the NDC average in relation to some worklessness and finance indicators (Table 5.1). Compared to NDCs with low and mid levels of residential mobility, those with high levels of mobility achieved at least two percentage points more positive change in terms of:
• the percentage of residents that claim benefits
• the percentage of households with an income of less than £200 per week.
5.6. And in relation to ‘area’ based indicators the converse appears to be true. NDC areas with higher levels of mobility have experienced less positive change than the NDC average in relation to housing and physical environment indicators, although as the proportion of people in areas of high mobility who think the area has improved over the last two years is similar to the NDC average (see Table 4.5). In contrast low mobility NDCs achieved at least two percentage points more positive change in terms of the proportion of residents who:
• have a high fear of crime score
• have been a victim of crime in the past year
• are satisfied with their accommodation
• think that their area has improved over the last two years.

54 | Residential mobility and outcome change in deprived areas
Table 5.1: Core indicators by NDC residential mobility classification; percentage point change 2002 to 2006 (positive change is ‘good’)
Percentage point change 2002 – 2006
Low mobility Mid mobility High Mobility NDC
Education No qualifications (a) 3 4 1 3Taken part in education or training in the
past year (b)–1 4 –2 1
Need to improve basic skills 3 0 4 2
Worklessness and financeReceive benefits –3 –4 –1 –3Workless households (c) 3 0 4 2In employment (a) 3 1 3 2Income less than £200 per week 8 6 10 8
HealthNo physical activity for at least 20 mins 0 0 –1 0Smoke 1 3 4 3Health not good 4 1 4 3Health worse than a year ago 3 1 3 2Satisfied with doctor (d) 0 –1 2 0SF 36 mental health 3 1 2 2
CrimeLawlessness and dereliction index, high score 15 17 15 16Feel unsafe after dark 11 10 10 10Fear of crime index, high score 14 12 9 12Been a victim of at least one crime 7 5 5 6
Housing and physical environmentSatisfied with area 11 11 10 11Trapped 2 1 –4 0Want to move 0 1 –4 –1Satisfied with accommodation 3 1 –1 1Think area has improved over last 2 years (e) 23 19 16 19Problems with environment index, high score 10 10 6 9
CommunityFeel part of the community 7 6 7 7Neighbours look out for each other 3 2 0 2Quality of life good 5 3 4 4Can influence decisions that affect local area 0 4 2 2Involved in NDC activities (f) 4 8 5 6NDC improved area (f) 27 26 16 24
Source: Ipsos MORI NDC household survey 2002 and 2006Base: All: Low 2002 (5,529) 2006 (4,472); Medium 2002 (9,030) 2006 (7,269); High 2002 (5,015) 2006 (4,053); NDC 2002 (19,574) 2006 (15,792) (a) working age Low 2002 (4,136) 2006 (3,183); Medium 2002 (7,033) 2006 (5,446); High 2002 (3,989) 2006 (3,082); NDC 2002 (15,158) 2006 (11,711) (b) working age excluding in FT education Low 2002 (3,930) 2006 (3,046); Medium 2002 (6,585) 2006 (5,136); High 2002 (3,704) 2006 (2,809); NDC 2002 (14,219) 2006 (10,911) (c) working age households Low 2002 (4,369) 2006 (3,418); Medium 2002 (7,317) 2006 (5,736); High 2002 (4,135) 2006 (3,244); NDC 2002 (15,821) 2006 (12,398) (d) seen doctor in the past year Low 2002 (4,516) 2006 (3,754); Medium 2002 (7,287) 2006 (6,000); High 2002 (3,992) 2006 (3,291); NDC 2002 (15,795) 2006 (13,045) (e) lived in area for at least 2 years Low 2002 (4,913) 2006 (3,966); Medium 2002 (7,717) 2006 (6,115); High 2002 (4,035) 2006 (3,128); NDC 2002 (16,665) 2006 (13,209) (f) heard of local NDC Low 2002 (3,444) 2006 (3,723); Medium 2002 (6,069) 2006 (5,945); High 2002 (3,148) 2006 (3,340); NDC 2002 (12,661) 2006 (13,008)Bold indicates significant change 2002 to 2006 at a 0.05 level

Residential mobility and outcome change in deprived areas | 55
5.7. In both of the NDC case study areas falling into the higher mobility grouping (Newcastle and Lambeth), there was an increase in the percentage of residents thinking the area had improved between 2002 and 2006 (11 per cent in Newcastle and 20 per cent in Lambeth). In 2006 both these areas had slightly higher than NDC aggregate scores on this variable (49 per cent in Newcastle, 47 per cent in Lambeth, compared to 43 percent across all NDC areas). Both these NDCs have invested in environmental improvements and safety. In Lambeth, projects to reduce the prevalence and visibility of street-based sex workers and drug crime were reported by interviewees to have impacted positively on residents’ perceptions of the area. And in Newcastle improvements to the area have been seen as key to long-term regeneration. The NDC focused its early revenue spend on safety and liveability projects, with a view to ‘locking’ into the area benefits arising from other types of investment in outcomes such education, employment and health.
5.8. The broad grouping of areas therefore reveals few consistent relationships between residential mobility and outcomes. The next stage of the analysis explores data at the NDC area level.
Outcome change and NDC areas with different levels of residential mobility
5.9. An NDC ‘residential mobility score’ (based on the combined standardised five mobility indicators) has been assessed against a Composite Index of Relative Change (CIRC) for each of the 39 areas. The CIRC compiles data for NDC neighbourhoods using 36 core indicators spread evenly across all outcome areas. The CIRC standardises, then combines, indicators using Z-scores and relates change in the NDC neighbourhood to the average achieved across the Programme as a whole. It is also possible to consider the CIRC by theme, and by either people or place-based outcomes. This analysis has allowed variations in outcome change at the NDC level to be explored in relation to local levels of residential mobility.
5.10. This analysis points to a number of significant relationships (Table 5.2):
• change for the education theme is significantly negatively correlated with levels of residential mobility in both 2002 and 2006; this is driven by performance on the Key Stage 4 (KS4) indicator within the education theme CIRC score: on average areas with higher rates of residential mobility tend to have poorer results for children’s attainment at Key Stage 4
• there is a significant negative association between the housing and physical environment theme CIRC score and levels of residential mobility in both 2002 and 2006; in both 2002 and 2006 the higher the level of mobility in an area the less change was usually achieved across the housing theme

56 | Residential mobility and outcome change in deprived areas
• a combined CIRC score for themes associated with ‘place’ based outcomes (crime, community and housing and the physical environment) is negatively correlated with levels of residential mobility in both 2002 and 2006; areas with higher levels of residential mobility tended to have less positive change in place- based outcomes than those with lower levels of mobility
• areas with high levels of residential mobility in 2002 were also likely to have high levels of mobility in 2006.
Table 5.2: Residential mobility and the Combined Index of Relative Change 2002 and 2006
Correlation coefficients with level of residential mobility
2002 2006
Education score –0.40 –0.46
Worklessness score 0.29 0.30
Health score 0.09 0.13
Crime Score –0.16 –0.24
Housing and physical environment score –0.51 –0.59
Community Score –0.11 –0.06
Overall Score –0.24 –0.28
People score 0.07 0.08
Place score –0.37 –0.43
Residential mobility score 2002 0.94
Residential mobility score 2006 0.94
Source: Ipsos MORI NDC household survey 2002 and 2006NB: Correlation coefficients range from –1 to +1. Values close to one indicate a very strong linear relationship, values close to zero indicate no linear relationship, negative coefficients indicate as one factor increases the other decreases and visa versa; a positive coefficient indicates that as one factor increases so does the other.Bold indicates significant at least the 0.05 level (2-tailed)
Outcome change for individuals who remain living in NDC areas with different levels of residential mobility
5.11. Household survey data also allows for an exploration of outcomes amongst individuals who stayed in NDC areas through time but who were living in areas with varying degrees of residential mobility. This is possible by using the longitudinal panel element of the survey which collects data on the same individuals as previously interviewed in earlier waves of the survey (see Appendix 2 for a description of survey design).

Residential mobility and outcome change in deprived areas | 57
5.12. Table 5.3 gives coefficients from general linear models based on a sample of residents who stayed in NDC areas from 2002 to 200619 for a range of selected outcomes20. General Linear Modelling (GLM) is an extension of multiple regression modelling techniques. These models use the difference in the levels of given indicators between two points of time as the dependent variable. GLM utilises the full power of the longitudinal nature of panel data by considering changes occurring to individuals through time. These models allow multivariate tests of significance to be employed which indicate which predictor variables are, or are not, significantly related to change.
5.13. These models indicate that those who stayed in areas of low residential mobility were significantly more likely to see improvements in many place-based outcomes than those who remained in areas with higher levels of mobility. This is true after taking into account socio-economic differences and starting position21.
Table 5.3: The NDC Panel: outcomes by level of mobility
Area-level residential mobility
Coefficient for change 2002 to 2006
Fear of crime score Low 0.49Mid 0.45High 0.00
Feel part of the community score Low –0.03Mid 0.00High 0.00
Lawlessness and dereliction score Low 0.63Mid 0.47High 0.00
Problems with the environment score Low 0.23Mid 0.13High 0.00
Satisfaction with area score Low 0.07Mid 0.07High 0.00
SF36 mental health score Low 1.18Mid 0.71High 0.00
Quality of life score Low 0.04Mid 0.01High 0.00
Extent area changed in past two years Low 0.10Mid 0.03High 0.00
Extent NDC improved area score Low 0.30Mid 0.28High 0.00
Source: NDC Longitudinal Survey waves 1-2-3 sample
19 The NDC longitudinal survey20 The outcomes have been selected as they cover a range of place based factors that could conceivably influence residential
mobility and are suitable for general linear modelling.21 This implies that if change in perceptions is compared between a resident in a high mobility area and a resident in a low
mobility area, both with the same socio-economic characteristics and initial level of perception of problems, then on average the high mobility area residents would report statistically fewer improvements in their perceptions

58 | Residential mobility and outcome change in deprived areas
5.14. The remainder of this chapter looks at the impact on service delivery of differing levels of residential mobility in NDC areas, drawing on evidence from case study research. The evidence is organised around three themes:
• place-based services: environment, housing and crime
• people-based services: education, employment and health
• residential mobility and community cohesion.
Place-based services – environment, housing and crime
Environment
5.15. As outlined in 4.18, low levels of area satisfaction are associated with a propensity to move. As such, the case study NDCs have focused on environmental improvements as a means of encouraging residential stability and mitigating the impacts of residential turnover.
5.16. Newham NDC, for instance, has invested time and resources in improving the environment in order to make the area more attractive to current and prospective residents. The Memorial Recreation Ground has been its largest environmental project, a scheme based on improvements to the park and play areas and the building of a new centre to house local services and community groups.
5.17. However, environmental improvements have been as important, if not more so, to NDCs experiencing lower levels of mobility. Knowsley NDC and its partner agencies have been faced with a range of problems associated with population decline including empty properties, dereliction, lack of community facilities, and undersubscribed services. The management of these, combined with a long-term focus on stabilising and redeveloping the neighbourhood, has created a need for increased service delivery entailing, in the interim at least, higher per capita service costs (Box 1).

Residential mobility and outcome change in deprived areas | 59
Box 1: Service delivery in the context of low residential mobility: Knowsley NDC
In the Knowsley NDC area, the importance of stemming population loss and encouraging new residents into the area has created a need for intense service delivery. In the housing and environment theme, this has involved:
• housing clearance: a demolition programme and associated acquisition of owner-occupied properties has accounted for around 27 per cent of theme spend
• external improvements to owner-occupied properties: including improvements to walls and flagging to match Knowsley Housing Trust’s programme for its social housing; this accounts for just over 31 per cent of theme spend
• a Neighbourhood Action Team/Neighbourhood Support Team: accounting for nearly 16 per cent of theme spend
• individual area and street-based housing and environmental work accounting for about 14 per cent of total theme spend
• improved street lighting, accounting for 3 per cent of theme expenditure
• a small interim-heating programme for residents in properties identified as having an uncertain future; this only accounts for 1 per cent of spend to date but it is important in facilitating the wider redevelopment programme.
The Neighbourhood Action Team/Neighbourhood Support Team (NAS/NST) is a good example of extra resources the NDC has put into service delivery. It was set up as a ’one-stop’ shop for tackling environmental and community safety issues associated with the NDC’s overall redevelopment programme. Its activities and method of operation have informed the development of Knowsley Council’s approach to neighbourhood management, in the shape of its neighbourhood-based ‘Pride Teams’. The NAS/NST is now working with the North Huyton Pride Team (which covers an area bigger than the NDC area) to develop a neighbourhood management approach. The NAT/NST is forecast to have cost £2.4m by the end of the NDC Programme. It has contributed to a large extent to:
• improved housing maintenance through a programme of external walls maintenance for owner-occupied properties and complementary heating programme for all properties
• improved maintenance of public spaces, and reduced fly-tipping and rubbish and litter, through environmental clean-ups and use of CCTV/neighbourhood intelligence to identify and tackle incidences of fly tipping and litter
• greater community involvement through attendance at resident group meetings, liaison with local networks and NDC Resident Board Directors and outreach work of area-based officers
• better partnership working with the police and the housing trust on crime and community safety issues and with the local authority’s Environmental and Operational Services on environmental issues.
60 | Residential mobility and outcome change in deprived areas
5.18. Walsall NDC has supported many environmental improvements, including:
• Bloxwich Townscape Heritage Initiative
• Secured by Design
• New Street Signs
• Bloxwich Town Centre improvements
• local environmental improvements.
Housing
5.19. As highlighted at 4.5, housing tenure is a key factor in influencing levels of residential mobility. High levels of mobility are associated with private rented sector accommodation, and lower levels of mobility are associated with owner occupation. Unsurprisingly, therefore, the two case study NDCs with the highest levels of mobility: Lambeth and Newcastle, also have high percentages of households in private rented sector accommodation: 14 per cent in Lambeth and 22 per cent in Newcastle according to 2006 household survey data.
5.20. It can be difficult for NDCs and partner agencies to identify the needs of private sector tenants. In Lambeth there are a number of leasehold (ex local authority) properties where non-resident landlords are renting out their property privately. The number of non-resident landlords is much higher than Clapham Park Homes (a community-led housing association which owns and manages properties on the Clapham Park estates) was led to believe by the local authority prior to stock transfer. When visiting these properties, Clapham Park Homes has found that they are often tenanted by large groups of young people (often migrant workers) living in overcrowded conditions. The poor information held on tenants of social housing and on the leasehold of ex-council properties means that Clapham Park Homes did not have an accurate picture of the make-up of the area prior to the stock transfer. It has now transpired that many families with legitimate tenancies are living in overcrowded conditions and this is impacting on the planning of new housing developments including planning for the building of larger family units to house existing tenants.
5.21. In Newcastle, action has focused on tackling crime and environmental improvements and improved and new housing in order to stabilise local populations by encouraging residents to stay in the area. A substantial private rented sector combined with close proximity to the city centre and further and higher education institutions means that this area will probably always experience a degree of residential mobility. But standards in private rented sector properties had deteriorated, resulting in low rents and a high number of empty properties. The Newcastle Private Rented Project (Box 2) has worked to improve conditions in the private rented sector.

Residential mobility and outcome change in deprived areas | 61
Box 2: The Newcastle Private Rented Project
The Private Rented Project was established to improve standards in the private rented sector in the West End of Newcastle. The project offers free support to tenants, landlords and agencies. It works with landlords, the City Council and agencies to improve the quality of stock and management practices in the private rented sector. In the West End of the city the project has succeeded by offering incentives to landlords, thus reducing the number of boarded up private rented sector dwellings by 82 per cent, including 100 homes in the NDC area. The project received NDC funding for five years and has recently been rolled out city-wide with funding from the Housing Market Renewal Pathfinder, ‘Bridging Newcastle Gateshead’.
5.22. In terms of housing strategy, the case study NDCs have supported improvements to existing stock, alongside proposals for new-build, often of family housing which is in short supply.
5.23. In Newcastle, the NDC has been working in partnership with Your Homes Newcastle and Bridging Newcastle Gateshead (the Housing Market Renewal Pathfinder) to carry out a series of improvements and renovations to housing stock, including the total refurbishment of six tower blocks.
5.24. In Bradford, Newham and Sheffield new housing developments aim to encourage tenure mix and to provide high quality, affordable family accommodation. The Sheffield NDC is a Mixed Communities Demonstration Pilot22 and development proposals have been closely aligned with those of the local authority to focus on the provision of new housing, improvements to existing stock (through Decent Homes investment), public realm improvements and economic investment (for instance, a new Tesco store is being built in the neighbourhood’s retail centre).
5.25. In areas of low residential mobility (case studies are Knowsley and Walsall) approaches have been different.
5.26. In Walsall NDC officers are generally positive about the stability of the local population linking this to positive improvements in the area. Household Survey data indicate a 35 per cent increase between 2004 and 2006 in the number of people thinking the area has improved in the past two years. Local observers consider that housing demolitions undertaken by the registered social landlord (RSL), supported by the NDC, have been important in reducing levels of residential mobility by making the environment more attractive to existing residents, and in reducing the total number of social rented dwellings in the area.
5.27. This Partnership’s housing strategy has focused on the demolition of many void and sub-standard flats and maisonettes, reducing the level of derelict land, and decreasing the number of weeks that void properties remain
22 The Mixed Community Demonstration Pilots – collectively referred to as the Mixed Communities Initiative (MCI) – aim to develop comprehensive approaches to neighbourhood renewal through major changes to the housing stock and tenure / income mix, improvements to the environment and action to reduce worklessness and crime.

62 | Residential mobility and outcome change in deprived areas
empty. The area is benefiting from new housing developments across four sites which were in the ownership of the council and RSL, Walsall Housing Group (WHG). The aim is to create new mixed tenure housing, as well as to improve social housing in the area through demolition and new-builds. The NDC provided funding for the demolition of certain sites. With the re-sell of the land the NDC was reimbursed for the initial capital outlay. To date, over 150 houses have been completed. There are further small-scale private developments within the area, totalling around 30 units. Further developments being undertaken by the local authority and private developers will result in more than 2000 new homes.
5.28. The low levels of residential mobility in Knowsley mask instability as a result of significant population decline in the past fifteen years. In response to this, the NDC adopted a four-stage process of intervention:
• stabilising the area, focusing on the ‘first-order needs’ of residents to provide support and engage them in the process
• the introduction of ‘early/quick win’ interventions to underline the potential for real change offered by the Partnership
• actions focused on addressing economic decline as the basis for longer-term impact on health, education and crime
• addressing longer-term issues through neighbourhood management and improvements to mainstream service delivery
5.29. Stabilising the area was seen as essential in halting population decline and in providing opportunities for bringing in new residents through a redevelopment programme based on a different mix of tenure. New-build housing, together with ongoing clearance of existing housing stock, is central to the NDC’s aim of altering the 80:20 social to private housing tenure balance it inherited to one closer to 50:50. Place-based policies have been crucial in this process:
• housing and environmental services: providing intensive neighbourhood management to reduce the number of empty properties and prevent empty properties contributing to crime and dereliction; purchasing owner-occupied properties for land assembly, providing external improvements for owner-occupied properties and targeted environmental improvements
• crime and community safety: addressing crime and anti-social behaviour problems often associated with empty properties resulting from low demand and abandonment.
5.30. ‘People-based’ policies are also intended to help stabilise population decline and broaden housing tenure, for instance:
• health: identifying and mitigating the health impact of the redevelopment programme on existing residents and supporting the location of a new Primary Care Centre in the neighbourhood

Residential mobility and outcome change in deprived areas | 63
• education: justifying investment in new schools facilities on the basis of the potential population increase from new housing programme, and the need to close the gap between the NDC area and Borough in educational attainment
Crime and community safety
5.31. There is little evidence from the case study NDC areas to suggest that mobility impacts on the delivery of crime and community safety services, although as outlined at 5.10 there are associations between higher levels of mobility and poorer place-based outcomes (crime, community and the physical environment) and crime and community safety issues can arise from abandonment and empty properties. As the recent review of crime and community safety in the case study NDCs demonstrates (CLG 2008), the impact of neighbourhood policing has been critical in allowing police to develop detailed intelligence on local communities and to respond to particular problems as they arise. This has been particularly valuable in communities with rapidly changing populations.
5.32. In Lambeth, the NDC and the police have addressed issues such as drugs and prostitution and people moving into, and out of, the area on a temporary basis. Crack houses and associated prostitution activity were seen as major concerns by local residents when the Programme was launched. A concerted multi-agency approach has meant that this issue has largely disappeared, and where it does crop up, it is dealt with swiftly. Interviewees were of the opinion that this action has contributed to people’s feeling of safety and may have discouraged some from moving outside the area. Feelings of satisfaction with the area have increased: residents who feel the area has improved in the last two years increased by 20 per cent between 2002 and 2006.
People-based services – education, employment and health
Education
5.33. As highlighted at 5.10, there are significant associations between high levels of residential mobility and less favourable change in education outcomes. Additional analysis of movement amongst school-aged pupils in NDC areas has been undertaken as part of the NDC national evaluation23. Some key findings emerge:
• between 50 per cent and 70 per cent of both primary and secondary school cohorts remained resident in their NDC area between 2002 and 2006; but in some NDC areas less than half of the original 2002 cohort remained resident in their NDC area through to 2006
23 The SDRC at the University of Oxford undertakes the collation and analysis of administrative data for the NDC national evaluation. The analysis quoted here is contained in ‘Improving educational attainment in NDC Partnerships: challenges to the implementation and evaluation of area-based policies’, to be published by CLG in 2009.

64 | Residential mobility and outcome change in deprived areas
• in general, many more pupils migrated out of NDC areas than migrated in, resulting in a net reduction in the primary and secondary NDC pupil cohorts between 2002 and 2006; most of these moves were within the parent local authority
• both primary and secondary school cohorts of NDC pupils exhibited lower overall proportions of children receiving free school meals in 2006 than in 2002; the secondary school cohort also exhibited a lower proportion of children registered as having special educational needs in 2006 than in 2002; the primary cohort, on the other hand, registered a slightly higher proportion with special educational needs in 2006 than in 2002; the characteristics of these cohorts were influenced by a combination of changing characteristics amongst those children who remained in the NDC area between 2002 and 2006, plus the net effect of in/out-migration from/to these cohorts over this period
• the changing characteristics of the cohorts were driven primarily by changes to the characteristics of those remaining in NDC areas between 2002 and 2006: both the primary and secondary school-aged ‘stayers’ exhibited lower overall proportions of children receiving free school meals in 2006 than in 2002; the secondary school-aged ‘stayers’ exhibited a lower proportion of children registered as having special educational needs in 2006 than in 2002; and the primary aged ‘stayers’ registered a slightly higher proportion with special educational needs in 2006 than in 2002.
• in general, higher proportions of ‘inmovers’ than ‘out-movers’ had special educational needs or received free school meals; the exception was the roughly equal levels of special educational needs amongst the secondary school-aged inmovers and outmovers
• children who moved into, and out of, NDC areas between 2002 and 2006 tended to move from and to neighbourhoods that were considerably less deprived than their new NDC neighbourhood
5.34. There are also indications that the scale of in-migration by non-UK residents to some NDC areas is impacting on educational outcomes. Tables 5.4 and 5.5 indicate the percentage of frequent movers for whom English is not their first language and the percentage falling into high, mid and low residential mobility groupings of NDCs (see 4.24). There are an estimated 6000 residents in frequent mover households in NDC areas for which English is not their first language. Frequent movers are more likely than non frequent movers to have a first language other than English and the proportion of frequent movers for whom English was not their first language almost doubled between 2002 and 2006, from 17 per cent to 31 per cent24.
24 In 2006, 39 per cent of frequent movers for whom English was not their first language were in households containing at least one dependent child aged under 16

Residential mobility and outcome change in deprived areas | 65
Table 5.4: Percentage of frequent movers in NDC areas for whom English is not their first language 2002 and 2006
Percentage of respondents for whom English is not their first language
2002 2006
Frequent movers 17 31Non frequent movers 15 19
Source: Ipsos MORI NDC household survey 2002 and 2006Base: Frequent movers 2002 (2210), 2006 (1620); Non frequent movers 2002 (17364), 2006 (14172)Frequent mover = 3 or more moves in past 5 years
Table 5.5: English not first language by residential mobility in NDC areas
English not first language (%)
2002 2006
Low mobility 12 14Mid mobility 19 26High mobility 13 20
Max 61 74Min 0 1NDC aggregate 16 21
Source: Ipsos MORI NDC household survey 2002 and 2006Base: All: Low 2002 (5,529) 2006 (4,472); Medium 2002 (9,030) 2006 (7,269); High 2002 (5,015) 2006 (4,053); NDC 2002 (19,574) 2006 (15,792)
5.35. This data is illustrative of a growing number of frequently-moving households for whom English is not the first language. But these households are not necessarily associated with areas with high levels of mobility. As highlighted at 4.10 more ethnically diverse populations are associated with lower levels of mobility. It should not be assumed either that not having English as a first language necessarily results in poor educational attainment. Evidence from the case studies suggests that in some NDC areas the settlement of black and minority ethnic populations has improved educational outcomes. For instance, in Bradford NDC Pakistani boys are achieving better than city average results. Similarly the in-migration of middle-class African families into the Newham NDC area is thought to be impacting positively on the performance measures of local schools. A local evaluation of the education programme in 2005 suggests that the “…community profile in Newham and particularly in the NDC area is changing from predominantly white to a multicultural community with a large African population, the African as well as Indian community are traditionally perceived as having high aspirations and this is reflected in the GCSE results achieved by KS3 pupils”.
5.36. Nevertheless, there was strong evidence from the case study NDCs that many schools were affected by levels of mobility and by increasingly diverse and transient populations. In the Lambeth NDC area local primary schools have been particularly affected by population movement both within, and outside, the area. This neighbourhood has a long history of recent arrivals registering

66 | Residential mobility and outcome change in deprived areas
children in local schools whilst they stay with friends and family in the area in order to get established in the UK. This area particularly attracts Somali and Portuguese arrivals whose children sometimes stay in the area for a short time until parents find employment and then they move away. A further issue is that of extended families and friends living with legitimate social tenants. The head teacher of one of the primary schools has experienced instances of children suddenly leaving and moving to other parts of London. In these cases the head is aware that some children and their families have been living with other family/friends in the area. The school currently has a 12 per cent pupil mobility rate, which may increase during a period of redevelopment. At the same time the school is losing children from long standing groups in the community (white and African Caribbean) where parents who were leaseholders have sold their property to Clapham Park Homes and have moved outside London. New families registering with the school have high support needs. For instance, 65 per cent of children have a first language other than English.
5.37. The case studies in the high and mid residential mobility groups identify instances where new populations have impacted on local schools. In many cases these populations arrived without warning and sometimes in large numbers. This can create capacity issues: in the Bradford NDC area all primary schools are currently over-subscribed. Eight hundred new school places are being planned over the next three years, through the expansion of existing, and the building of new, schools linked to the provision of new-build housing in the area. In the Sheffield NDC area local primary schools are doubling their intake over the next two years in order to cope with increased demand.
5.38. A further issue is support needs. As discussed at 2.17, there is view that it can be difficult for schools and NDCs to target and support more mobile populations. In the Sheffield NDC area 86 per cent of pupils are from BME communities. The Advancing Together project aims to support vulnerable students in a number of different ways:
• family advocacy: a manager and six workers are located in primary schools to identify and support children who are performing less well. They work with families and put interventions in place to help children catch up
• a sports project works both in, and out of, schools to encourage integration
• the Street Works project funds detached youth workers on the streets to connect with young people and to establish a Youth Council
• community-based study support in Somali, Yemeni, Pakistani and African Caribbean communities.
5.39. Tracking individual attainment data for pupils resident in this NDC area has allowed this NDC Partnership to link interventions to improved attainment. Local data suggests that secondary school children benefiting from community-based study support, for instance, have improved GCSE attainment, compared to those not receiving equivalent assistance.

Residential mobility and outcome change in deprived areas | 67
Employment
5.40. Residential mobility is seen locally to impact on the delivery of employment services in a number of ways:
• in areas where populations are more mobile, outreach services have been important in connecting with residents and supporting them into work; in areas where there has been influx of migrant workers, NDCs have been able to offer support to those not eligible for mainstream provision; English for speakers of other languages (ESOL) services have proved especially popular
• in areas of lower mobility there have been concerns about the insularity of populations, which some stakeholders believe may contribute to ‘cultures of worklessness’, and to increasing mismatches between skills amongst local populations and employment opportunities.
5.41. In Lambeth, the NDC funded ‘Shop for Jobs’ has provided a wide range of services to the migrant workers who account for a significant proportion of residential mobility in the area. This has involved supporting individuals not eligible for benefits as recent arrivals from new EU countries, or because their visa stipulates they have no recourse to public funds. These groups tend to have low skills levels and often need support with ESOL. The project has worked with Lambeth College to deliver ESOL provision. High levels of mobility mean that there is an ongoing need for intervention. However, interviewees at the ‘Shop for Jobs’ project report that tracking beneficiaries is extremely difficult as many recent arrivals they are supporting are living in the area on a temporary basis. Once they have found employment they often move on.
5.42. However, in Walsall, core problems identified in the initial Delivery Plan included low aspirations and skill levels, allied to high levels of economic inactivity and worklessness. These problems are still critical to the area. Stakeholders note that employment opportunities in the broader area require far greater skills than generally possessed by local residents.
5.43. A long held strategy of this NDC is to encourage more in-migration of different, and more affluent, residents as a means of breaking a persistent ‘culture of poverty’. The lack of residential mobility within the NDC area is seen as having helped create a stable environment which might help service delivery, but may also be a causal factor in producing an inward-looking community where deprivation and high levels of worklessness persist. New housing developments are introducing owner-occupiers into the area, who may have a strong perceptual influence on existing local residents.
5.44. Walsall has also been active in providing training opportunities for local people, reflecting the NDC’s vision of improving “the economic prosperity of the resident population of the area through training and employment creation”. The focus has been on reducing barriers to employment, which include:
• the structural weaknesses of the local economy
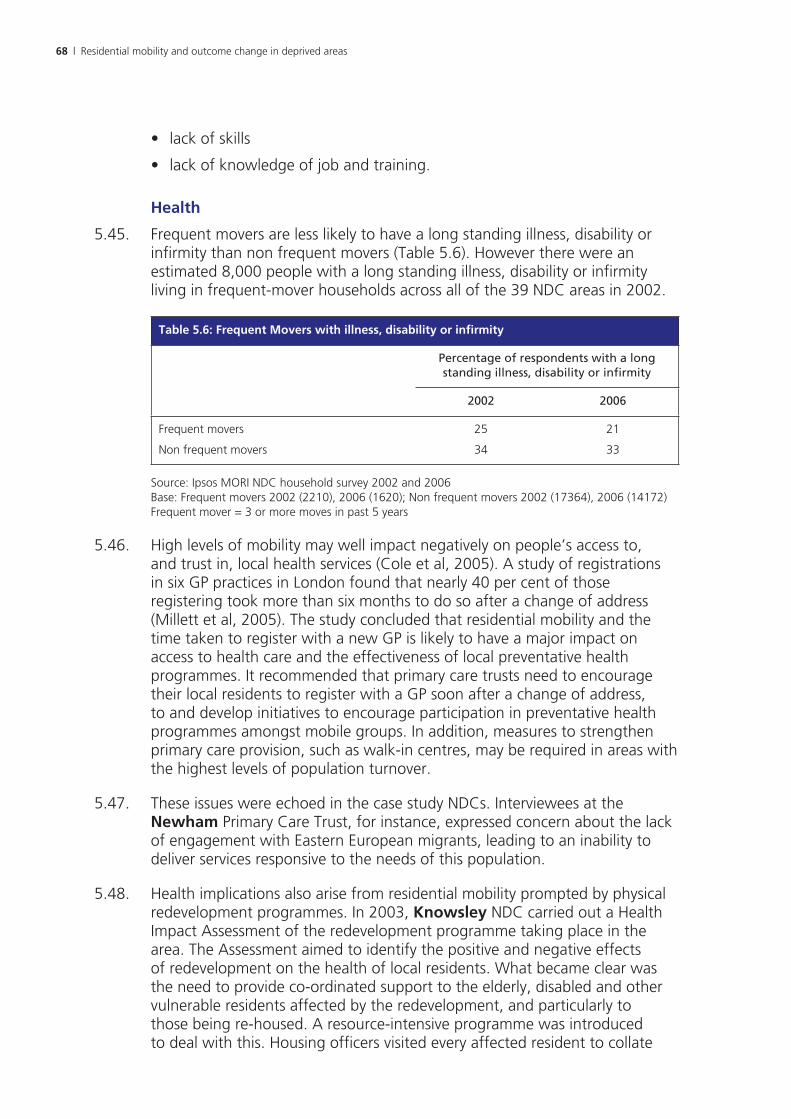
68 | Residential mobility and outcome change in deprived areas
• lack of skills
• lack of knowledge of job and training.
Health
5.45. Frequent movers are less likely to have a long standing illness, disability or infirmity than non frequent movers (Table 5.6). However there were an estimated 8,000 people with a long standing illness, disability or infirmity living in frequent-mover households across all of the 39 NDC areas in 2002.
Table 5.6: Frequent Movers with illness, disability or infirmity
Percentage of respondents with a long standing illness, disability or infirmity
2002 2006
Frequent movers 25 21
Non frequent movers 34 33
Source: Ipsos MORI NDC household survey 2002 and 2006Base: Frequent movers 2002 (2210), 2006 (1620); Non frequent movers 2002 (17364), 2006 (14172)Frequent mover = 3 or more moves in past 5 years
5.46. High levels of mobility may well impact negatively on people’s access to, and trust in, local health services (Cole et al, 2005). A study of registrations in six GP practices in London found that nearly 40 per cent of those registering took more than six months to do so after a change of address (Millett et al, 2005). The study concluded that residential mobility and the time taken to register with a new GP is likely to have a major impact on access to health care and the effectiveness of local preventative health programmes. It recommended that primary care trusts need to encourage their local residents to register with a GP soon after a change of address, to and develop initiatives to encourage participation in preventative health programmes amongst mobile groups. In addition, measures to strengthen primary care provision, such as walk-in centres, may be required in areas with the highest levels of population turnover.
5.47. These issues were echoed in the case study NDCs. Interviewees at the Newham Primary Care Trust, for instance, expressed concern about the lack of engagement with Eastern European migrants, leading to an inability to deliver services responsive to the needs of this population.
5.48. Health implications also arise from residential mobility prompted by physical redevelopment programmes. In 2003, Knowsley NDC carried out a Health Impact Assessment of the redevelopment programme taking place in the area. The Assessment aimed to identify the positive and negative effects of redevelopment on the health of local residents. What became clear was the need to provide co-ordinated support to the elderly, disabled and other vulnerable residents affected by the redevelopment, and particularly to those being re-housed. A resource-intensive programme was introduced to deal with this. Housing officers visited every affected resident to collate

Residential mobility and outcome change in deprived areas | 69
information on the state of their current homes, their heath and services used such as the district nurse or ‘meals on wheels’. This information was shared between the partner agencies: namely, the NDC, Knowsley Housing Trust, Knowsley Primary Care Trust and Knowsley Health and Social Care. A multi-disciplinary team chaired by the NDC Health Project Manager met fortnightly to discuss the needs of residents due to move and to ensure that necessary care packages were in place. In some instances, this resulted in Knowsley Housing Trust building specially adapted new properties for individuals with complex needs.
Residential mobility and community cohesion
5.49. As highlighted at 2.10, there is limited evidence to suggest that length of residence in an area impacts negatively on cohesion. However, as discussed at 4.20, NDC residents exhibiting feelings of community attachment, thinking that neighbours look out for each other and involved in activities organised by NDC Partnerships are less likely to move than those who do not share these views or undertake such activities.
5.50. For the case study NDCs, an emphasis on community engagement and cohesion has been an important factor in addressing issues arising from mobility. In general interviewees are positive about cohesion in these neighbourhoods. Even where populations are diverse and mobility levels are high there is little evidence that this is causing friction or difficulties. But it may be that newer populations are more isolated. In the Newham and Sheffield NDCs interviewees commented that ‘hard to reach’ communities now included newer migrant populations and that it may take time for these communities to establish themselves and to overcome barriers to integration such as language and cultural differences. Until this happens there is a need for NDCs and other agencies to focus on engagement with these communities.
5.51. This is also true for Lambeth NDC. With large numbers of new people coming into the area on a regular basis, it has been essential for the NDC to ensure that community engagement activity is sustained and that they are aware of the needs of new groups of residents. Community engagement was made a cross-thematic activity at an early stage in recognition of the fact that it had an influence across the NDC’s strategy as a whole. In addition, the community chest programme has supported particular groups within the community, including a homework club has been funded for Somali children and their parents.
5.52. This NDC also holds a wide range of community events throughout the year to support community cohesion, and to bring together different sections of the community. This acts also as a tool in promoting the work of the NDC and for engaging local people and understanding their needs. This type of activity was particularly useful in preparing for a recent stock transfer ballot. However, the NDC has had more difficulty in engaging with groups that are in the UK illegally. Whilst it is known these groups exist, they tend to stay

70 | Residential mobility and outcome change in deprived areas
‘hidden’, and do not engage with any activity or service where they might be required to supply personal information.
5.53. In case study areas with low levels of mobility (Walsall and Knowsley) there is often a strong sense of community cohesion. In the Knowsley NDC area, for instance, in 2006 90 per cent of residents feel that the people in the area were very/fairly friendly (compared with 84 per cent for the NDC aggregate and 92 per cent nationally); 34 per cent claimed to know most of the people in the neighbourhood (compared with 19 per cent for the NDC aggregate and 29 per cent nationally); and 68 per cent felt that the neighbourhood was a place where neighbours looked out for each other (compared with 59 per cent for the NDC aggregate and 73 per cent nationally). Both Knowsley and Walsall have a strong community infrastructure, with a range of local organisations and associations providing services. Whilst there had in some instances been tensions in relationships between NDCs and infrastructure organisations, the presence of strong community networks in these areas was felt by interviewees to have been beneficial in providing NDCs with a context in which to harness community support.
5.54. In the case study NDCs which fall in the mid range of residential mobility (Bradford, Newham and Sheffield) there has been a focus on meeting the needs of diverse populations, including newly arrived BME groups. In all three cases this was seen as an extension of existing interventions. In Newham one senior officer commented that the local authority was the second most diverse community in the country and it is generally understood that agencies will always be working with changing populations. NDC and agency staff also made the point that working in an area like Newham is complicated because it is important to ensure that everyone can access services they need.
5.55. These NDCs have supported projects which have aimed to target specific groups. Newham has recently put together a directory of services with a language bar on the back which it is hoped will generate ideas regarding the needs of newcomers. The NDC is also targeting its Communities Fund at East European groups. Interpretation requests show that Bengali is by far the most requested language, followed by Spanish, Polish and Russian. Other East European languages figured in small but consistent numbers: Lithuanian, Romanian and Latvian.
Concluding comments
5.56. This chapter has explored relationships between levels of residential mobility and outcome change in NDC areas, and the impacts that mobility has on the delivery of services by NDCs and partner agencies. In particular, it has highlighted the complex relationships between mobility and place-based outcomes, and the negative impact of high levels of mobility on the delivery of services, particularly in relation to education. The next chapter discusses policy implications arising from the research outlined in this report.

Residential mobility and outcome change in deprived areas | 71
6. Conclusions and policy implications
6.1. This chapter discusses the implications of the research findings for policy-makers and neighbourhood renewal practitioners.
6.2. The evidence outlined in earlier chapters suggests that across the Programme NDC areas experience slightly higher levels of residential mobility than similarly deprived areas and than is the case nationally. But there are huge variations across the 39 areas: in some there is very little residential mobility and in others residential turnover and/or the arrivals of new populations mean that the populations with which NDCs are working are subject to continual change. However, across the Programme there has been little change in rates of mobility between 2002 and 2006.
6.3. Our analysis, confirming that arising from other work, is that socio-economic characteristics and tenure are key determinants of mobility. In NDC areas higher levels of residential mobility are associated with younger populations, with rented accommodation (particularly in the private sector), and with single-person households.
6.4. Across the Programme, NDC areas with higher levels of mobility tend to experience poorer place-based outcomes and less positive change in housing indicators. There are also negative associations for NDCs between higher levels of residential mobility and educational outcomes, with a significant relationship at KS4. There are clear impacts on educational outcomes when schools are dealing with mobile and transient populations, many of whom have additional support needs. The case study NDCs have supported successful and innovative interventions to improve educational outcomes but there remain issues around capacity and the ability of schools to support effectively pupils who stay in NDC areas for short periods of time.
6.5. It is important for policy-makers and neighbourhood renewal practitioners to understand the nature, drivers and consequences of residential mobility in deprived neighbourhoods. These are likely to be different in different areas, and for different populations, and responses need to be informed by detailed, localised intelligence. Mobility will also be shaped by wider processes, from local housing markets at one extreme to the economic impacts of globalised economies, at the other. Gathering localised intelligence can be challenging, particularly in areas which attract especially mobile migrant communities.
6.6. There was little evidence from our case studies that higher levels of mobility are associated with ‘higher’ demands or costs. The service needs of younger, more mobile – but generally healthier and employed populations may simply be different from those of more static, but often older households, perhaps with children or more likely to be experiencing ill-health. Again, the exception
72 | Residential mobility and outcome change in deprived areas
maybe education. There is a growing need for ESOL provision, which NDCs in the case study areas are well placed to provide. There may also be a need for delivery agencies to be more proactive and innovative in connecting with mobile populations to ensure that the service needs of these populations are being met.
6.7. A number of implications for neighbourhood renewal arise from this study, some confirming overarching lessons from earlier studies (see CLG 2007a, 2007b):
• housing design and tenure are critical factors influencing mobility; maximising opportunities for existing and new residents to realise their housing preferences locally through the provision of more diverse property types, sizes and designs in all tenures, but especially in the owner-occupied sector is likely to encourage residential stability
• in areas with a large private rented sector, higher standards of neighbourhood and property management may improve area satisfaction ratings and attract a more diverse range of tenants
• housing measures need to be complemented by interventions designed to improve the environment; but it should be recognised that large scale redevelopment schemes will, in the short term at least, result in higher levels of mobility and additional service demands to meet the needs of displaced populations
• the characteristics of populations moving in to some NDC areas, especially but not exclusively in London, are increasingly shaped by economic in-migration, particularly from EU accession states; NDCs are well placed to offer support to migrant communities but they have only limited resources to do so
• the impacts of residential mobility and migration are particularly acute for education services; additional resources may be required to support the needs of children in mobile households, but the positive impacts of these measures on educational outcomes may be lost if children continue to move schools
• neighbourhood renewal programmes need to consider the balance between place-based measures, encouraging people to stay, and person-based measures, which may stimulate out-migration as project beneficiaries seeking economic or educational opportunities beyond the neighbourhood; there may be a case for thinking through the phasing of interventions: if an intensive push is placed on people-based measures before improvements are made to the local environment and the housing market, this may well simply encourage out-migration.

Residential mobility and outcome change in deprived areas | 73
ReferencesAssociation of London Government (ALG) (2005) Breaking point: examining the disruption caused by pupil mobility. London: ALG. www.londoncouncils.gov.uk/localgovernmentfinance/publications/breakingpoint.htm
Bailey, N. and Livingston, M. (2007) Population Turnover and Area Deprivation. Bristol: Policy Press in association with Joseph Rowntree Foundation. www.jrf.org.uk/publications/population-turnover-and-area-deprivation
Bailey, N. and Livingstone, M. (2008) Selective Migration and Neighbourhood Deprivation, evidence from 2001 Census migration data for England and Scotland. Urban Studies, 45 (4), pp 943–961. Glasgow: Sage Publications.
Cheshire, P., Marlee, I. and Shephard, S. (1998) Harlesden City Challenge Final Evaluation. Harlesden: Harlesden City Challenge.
Cole, I., Robinson, D., Champion, T., Reeve, K., Bennington, J., Coward, S., Goudie, R. and Hickman, P. (2005) A Review of the Evidence Base on Frequent Moving Among Disadvantaged Groups, Report to the Social Exclusion Unit. Sheffield: Sheffield Hallam University. www.cabinetoffice.gov.uk/social_exclusion_task_force/publications.aspx#r
Communities and Local Government (2007a) The Moving Escalator? Patterns of Residential Mobility in NDC areas. London: CLG. www.neighbourhood.gov.uk/publications.asp?did=1899
Communities and Local Government (2007b) New Deal for Communities: A synthesis of New Programme-wide evidence 2006–07. London: CLG. www.neighbourhood.gov.uk/publications.asp?did=1930
Communities and Local Government (2008a) Challenges, Interventions and Change: An Overview of Neighbourhood Renewal in six New Deal for Communities Areas. London: CLG. www.communities.gov.uk/publications/communities/challenges
Communities and Local Government (2008b) Delivering Safer Neighbourhoods: Experiences from the New Deal for Communities Programme. London: CLG. www.communities.gov.uk/publications/communities/deliveringsaferneighbourhoods
Communities and Local Government (2008c) Predictors of community cohesion: multi-level modelling of the 2005 Citizenship Survey. London: CLG. www.communities.gov.uk/publications/communities/predictorscohesion
Communities and Local Government (2008d) Transforming Places; changing lives: A framework for regeneration. London: CLG. www.communities.gov.uk/publications/citiesandregions/transformingplaces

74 | Residential mobility and outcome change in deprived areas
Connolly, S. and O’Reilly, D. (2007) ‘The contribution of migration to changes in the distribution of health over time: Five year follow up study in Northern Ireland’. Social Science and Medicine, Vol. 65, pp 1004–1011. London: Elsevier.
Department of the Environment, Transport and the Regions (DETR) (1999) Report by the Unpopular Housing Action Team. London: DETR.
Department of the Environment, Transport and the Regions (DETR) (2000) Indices of Deprivation 2000. Regeneration Research Summary No 31. London: DETR www.communities.gov.uk/archived/publications/citiesandregions/indicesdeprivation
Evans, M. and Harkness, S. (2005) Estimating the impact of NDC using Labour Force Survey data http://extra.shu.ac.uk/ndc/ndc_reports_01.htm
Greater London Enterprise (GLE) (2005) Building Sustainable Urban Communities. London: GLE. www.gle.co.uk/research.htm
Green, A. (2007) Local Action on Labour Market Integration of New Arrivals: Issue and Dilemmas for Policy. Local Economy, 22 (4), pp. 349–361. London: Routledge.
Green, A., Jones, P. and Owen, D. (2007a) Migrant Workers in the East Midlands Labour Market. Report to the East Midlands Development Agency. Coventry: University of Warwick, Institute for Employment Research.
Green, A., Owen, D., and Jones, P. (2007b) The economic impact of migrant workers in the West Midlands. Coventry: University of Warwick Institute for Employment Research.
HM Treasury/Department for Business Enterprise and Regulatory Reform/ Communities and Local Government (2007) Review of Sub-National Economic Development and Regeneration. London: HM Treasury. www.hm-treasury.gov.uk/sub-national_economic_development_regeneration_review.htm
Kearns, A. and Parkes, A. (2003) Living in and leaving poor neighbourhood conditions in England. Housing Studies, 18 (6): pp. 827–51. Abingdon: Carfax Publishing www.neighbourhoodcentre.org.uk/research/research.html.
Livingston, M., Bailey, N. and Kearns, A. (2008) People’s attachment to place: The influence of neighbourhood deprivation. Coventry: Chartered Institute of Housing in association with Joseph Rowntree Foundation. www.jrf.org.uk/publications/influence-neighbourhood-deprivation-peoples-attachment-places
Meen, G. and Nygaard, C. (2007) Long-Run Neighbourhood Dynamics – London 1881–2001. Reading: University of Reading Business School.
Norman, P., Boyle, P. and Rees, P. (2005) ‘Selective migration, health and deprivation: a longitudinal analysis’. Social Science and Medicine, 60 (12), pp. 2755–2771. London: Elsevier.

Residential mobility and outcome change in deprived areas | 75
Office of the Deputy Prime Minister (2004) Mainstream Public Services and their Impact on Deprived Neighbourhoods. London: ODPM.
Office of the Deputy Prime Minister (2005) City Challenge: final national evaluation. London: ODPM. www.communities.gov.uk/archived/general-content/citiesandregions/citychallengefinal/
Robson, B., Lymperopoulou, K and Rae, A. (2009) A typology of the functional roles of deprived neighbourhoods (National Strategy for Neighbourhood Renewal Evaluation). London: Communities and Local Government www.communities.gov.uk/publications/communities/functionalrolesdeprived
Robson, B., Lymperopoulou, K. and Rae, A. (2008) People on the move: exploring the functional roles of deprived neighbourhoods. Environment and planning A, Vol 40 pp. 2693–2714. London: Pion Ltd.
Stationery Office (2006) Select Committee on Office of the Deputy Prime Minister: Housing, Planning, Local Government and the Regions. Written Evidence Memorandum from Thanet District Council CT23. London: Stationery Office www.parliament.the-stationery-office.com/pa/cm200506/cmselect/cmodpm/1023/1023we24.htm#n12
Travers, T., Tunstall, R., Whitehead, C. and Pruvot, S. (2007) Population mobility and service provision. Report to the London Councils. London: London School of Economics and Political Science. www.londoncouncils.gov.uk/localgovernmentfinance/publications/populationmobilityandserviceprovision.htm

76 | Residential mobility and outcome change in deprived areas
Appendix 1: Indicators of residential mobility
Indicators of residential mobility: individual NDC areas, 2002
Percentage of respondents
Number of moves in past 5 years
Length of residence at address
None Three plus Less than a year
10 years or more
Moved 2002 to 2004
Nottingham 30 35 42 20 52Newcastle 40 20 26 30 40Plymouth 49 17 18 26 34Hammersmith & Fulham 52 17 21 33 35Doncaster 49 17 24 36 32Bristol 52 20 17 38 33Coventry 46 14 20 31 25Liverpool 52 16 23 43 33Sunderland 52 16 25 37 25Lambeth 54 16 18 35 28Lewisham 59 10 17 35 30Salford 57 11 22 43 27Haringey 57 11 17 37 23Hartlepool 58 13 16 45 29Tower Hamlets 58 11 17 40 25Hull 50 10 15 34 16Islington 58 13 15 40 24Bradford 59 7 18 44 29Newham 59 11 11 36 25Brent 54 10 13 37 17Rochdale 58 10 13 43 23Manchester 59 9 14 42 24Sheffield 57 9 14 41 21Leicester 55 9 13 41 17Luton 62 12 13 43 20Hackney 62 10 14 41 21Brighton 64 11 11 44 26Oldham 61 9 15 45 20Norwich 63 9 10 47 22Birmingham Kings Norton 61 8 8 45 19Southampton 63 9 11 45 15Wolverhampton 63 8 12 50 18Southwark 69 4 9 38 19Derby 65 8 9 47 15Middlesbrough 68 7 9 53 23Birmingham Aston 68 5 11 54 16Knowsley 69 7 8 57 19Sandwell 69 5 8 57 12Walsall 74 4 7 58 16
NDC 58 12 16 41 24
Source: Ipsos MORI 2002 NDC Household Survey Red indicates 10 highest mobility’ on indicator. Blue indicates 10 lowest ‘mobility’ on indicator
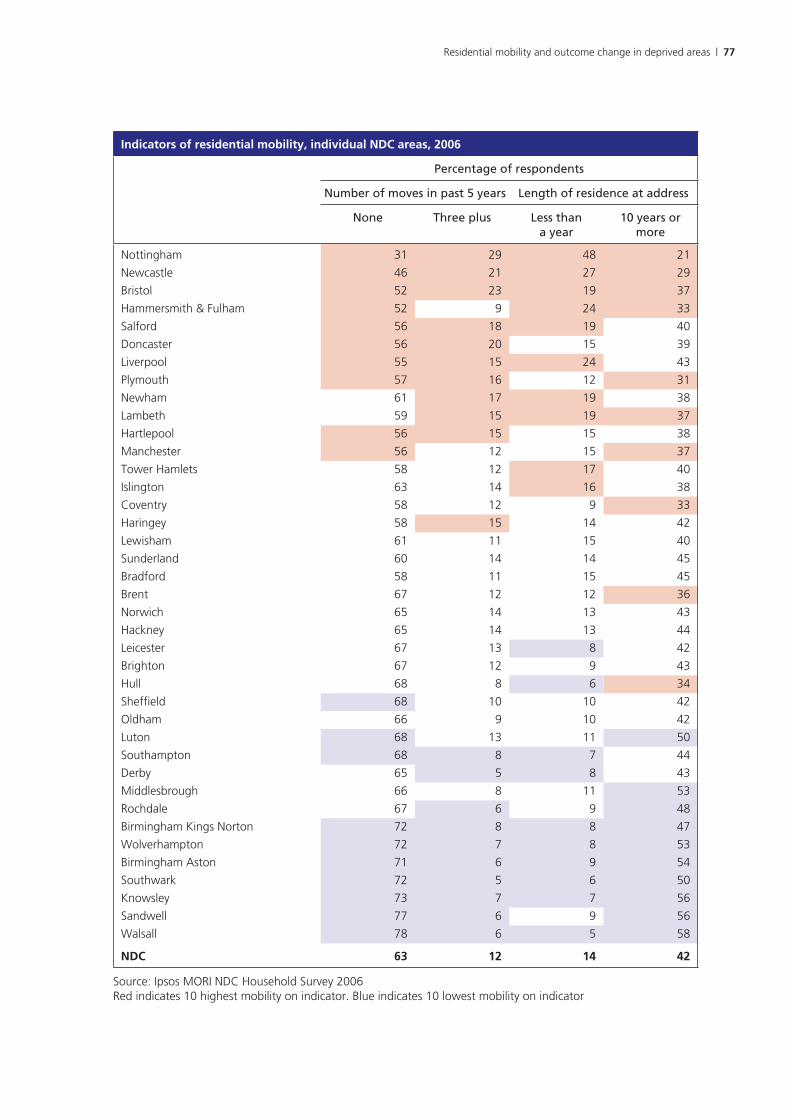
Residential mobility and outcome change in deprived areas | 77
Indicators of residential mobility, individual NDC areas, 2006
Percentage of respondents
Number of moves in past 5 years Length of residence at address
None Three plus Less than a year
10 years or more
Nottingham 31 29 48 21
Newcastle 46 21 27 29
Bristol 52 23 19 37
Hammersmith & Fulham 52 9 24 33
Salford 56 18 19 40
Doncaster 56 20 15 39
Liverpool 55 15 24 43
Plymouth 57 16 12 31
Newham 61 17 19 38
Lambeth 59 15 19 37
Hartlepool 56 15 15 38
Manchester 56 12 15 37
Tower Hamlets 58 12 17 40
Islington 63 14 16 38
Coventry 58 12 9 33
Haringey 58 15 14 42
Lewisham 61 11 15 40
Sunderland 60 14 14 45
Bradford 58 11 15 45
Brent 67 12 12 36
Norwich 65 14 13 43
Hackney 65 14 13 44
Leicester 67 13 8 42
Brighton 67 12 9 43
Hull 68 8 6 34
Sheffield 68 10 10 42
Oldham 66 9 10 42
Luton 68 13 11 50
Southampton 68 8 7 44
Derby 65 5 8 43
Middlesbrough 66 8 11 53
Rochdale 67 6 9 48
Birmingham Kings Norton 72 8 8 47
Wolverhampton 72 7 8 53
Birmingham Aston 71 6 9 54
Southwark 72 5 6 50
Knowsley 73 7 7 56
Sandwell 77 6 9 56
Walsall 78 6 5 58
NDC 63 12 14 42
Source: Ipsos MORI NDC Household Survey 2006Red indicates 10 highest mobility on indicator. Blue indicates 10 lowest mobility on indicator

78 | Residential mobility and outcome change in deprived areas
Appendix 2: Household survey design
Understanding the data: NDC household survey design
Analyses presented in this report draw mainly on data from the household survey of NDC residents aged 16 and over. The survey was carried out by Ipsos MORI in 2002, 2004 and 2006. The resultant datasets provide a consistent set of measures across all 39 Partnership areas for the Programme’s key outcome areas:
• people-based outcomes in health, education and worklessness
• place-based outcomes for crime, housing, the physical environment, attitudes to the community.
The survey comprises a combined panel and cross-sectional ‘top-up’ design. The 2002 survey is a fully representative cross-sectional sample of residents in the area. In later waves of the survey a proportion of the interviews was carried out with the same individuals at the same address as previously. The remainder of the sample is drawn as a fresh cross-sectional sample. Fuller details of the survey design and sampling methods can be found in the Ipsos MORI 2006 Technical Report for the NDC Household Survey25.
This survey design has the benefit of providing both cross-sectional and longitudinal data over time. Cross-sectional data captures change occurring at an area level. This provides a snapshot picture of residents within these 39 areas at each point of time. This sample consists of short and long-term residents, including those within the panel element of the sample, and those who may have moved into the area over the period of the Programme. Area-level data will exclude those who may have benefited from the Programme but have subsequently moved out. Longitudinal data allows the trajectories of individuals who stay in the area to be tracked over time. The data can also be considered for the panel as a whole. This in effect provides information in relation to change occurring to residents who have been ‘exposed to NDC interventions’ for a minimum of two, or a maximum of four, years26.
Analyses presented here are intended to explore issues around population movement in the NDC areas over time. This represents change occurring at the area-level, including that arising from in-movers and out-movers. The entire cross-sectional datasets, which include the longitudinal sub panels, for both the 2002 and 2006 surveys are drawn upon. The sample sizes involved are considerable. In 2002 approximately 500 residents per Partnership area were interviewed resulting in a total
25 www.data-archive.ac.uk/doc/5299/mrdoc/pdf/5299ndc2006.pdf26 There are to date three sub panels available. Those tracked from 2002–2004 but did not complete an interview in 2006
(n=5,139). Those who entered the sample in 2004 and completed another interview in 2006 (n=3,632). There is also a panel of residents who were interviewed for all 3 waves of the survey from 2002 to 2004 to 2006 (n=5499).

Residential mobility and outcome change in deprived areas | 79
sample of 19,574 residents. In 2006 the sample was reduced slightly to 400 residents per area with a total sample size of 15,792 residents.
It is worth noting the possible effect the survey design may have on some indicators relevant to mobility. The inclusion of a longitudinal element in the sample means that length of residence in current address, or in the area, will increase over time for these individuals included for more than one wave of the survey. By 2006 approximately a third of entire sample had been included in all three waves.
However this small bias towards longer-term residents in the panel element of the sample as further waves of the survey are completed, is counteracted by the refreshed top-up sample:
• previously sampled addresses may be re-visited to carry out a repeat interview at the next wave of the survey; but if the original resident has since moved, an interview with the current occupant is completed if possible: a number of in-movers are automatically included in the refreshed sample
• the cross-sectional top-up sample for each wave of the survey is likely to include greater numbers of shorter term residents than the profile of the population as a whole; this is because the top-up sample is taken from available addresses after excluding any previously sampled addresses.

80 | Residential mobility and outcome change in deprived areas
Appendix 3: Logistic regression odds ratios
Logistic regression odds ratios of moving between 2002–2004: base model characteristics
Mover 2002 to 2004
Model 1 Model 2
Gender Male 1.17*** 1.15***
Female 0.86*** 0.87***
Age 16–24 2.15*** 1.92***
25–34 1.60*** 1.49***
35–49 0.96 0.98
50–64 0.56*** 0.60***
65+ 0.54*** 0.59***
Ethnicity White 1.21*** 1.24***
‘Asian’ 0.85** 0.85***
Black 0.97 0.96
NVQ equivalent No Qualification 0.93 1.01
NVQ 1 0.95 0.97
NVQ 2 0.91* 0.92
NVQ 3 1.00 0.96
NVQ 4+ 1.25*** 1.16**
Household Composition Couple, no child(ren) 0.91* 0.90*
Couple, with child(ren) 0.83*** 0.85***
Lone-parent 0.73*** 0.71***
Single-person 1.21*** 1.27***
Large adult 1.50*** 1.44***
Length of residence Less than 1 year 2.09*** 2.15***
2 to 4 1.26*** 1.25***
5 to 9 0.86** 0.86**
10 to 19 0.76*** 0.74***
20+ 0.58*** 0.58***
Workless household No 0.93** 0.92**
Yes 1.07* 1.09**
Tenure Owner occupation 0.61*** 0.66***
Social rented 0.71*** 0.74***
Private rented 2.32*** 2.06***
Source: Ipsos MORI NDC household survey 2002 and 2004Background characteristics are presented as deviation odds ratios. Satisfaction and perception variables are indicator odds ratios with the base category presented first.* significant at 0.05 level, ** significant at 0.01 level and *** significant at 0.001 level

Residential mobility and outcome change in deprived areas | 81
Logistic regression odds ratios of moving between 2002–2004: residents’ perceptions of the area
Mover 2002 to 2004
Model 1 Model 2
Dissatisfied with area Other 1
Dissatisfied 1.28***
Dissatisfied with accommodation Other 1
Dissatisfied 1.69***
Environment and Dereliction score Low 1
Mid 0.97
High 1.03
Crime and Lawlessness score Low 1
Mid 1.04
High 0.96
Dissatisfied with repair of accommodation Other 1
Dissatisfied 0.97
Feel part of the community Other 1
Yes 0.81***
Neighbours look out for each other Other 1
Yes 0.85**
Can influence decisions that affect your local area Other 1
Yes 0.99
Involved in local organisations Other 1
Yes 0.98
Involved in activities organised by NDC Other 1
Yes 0.85*
Intend to move in next 2 years No/DK 1
Yes 3.37***
Base: All wave 1 respondents that could be assigned a mobility outcome in 2004 Source: Ipsos MORI NDC household survey 2002 and 2006Background characteristics are presented as deviation odds ratios. Satisfaction and perception variables are indicator odds ratios with the base category presented first.* significant at 0.05 level, ** significant at 0.01 level and *** significant at 0.001 level

82 | Residential mobility and outcome change in deprived areas
Appendix 4: Socio-demographic profile of case study areas

Residential mobility and outcome change in deprived areas | 83
Perc
enta
ge
of
all h
ou
seh
old
mem
ber
s in
eac
h a
ge
gro
up
20
0220
06C
han
ge
2002
–06
0–15
16–2
425
–49
50–5
9/64
60/6
5+0–
1516
–24
25–4
950
–59/
6460
/65+
0–15
16–2
425
–49
50–5
9/64
60/6
5+
Brad
ford
3017
339
1130
1534
1111
0–2
21
0
Kno
wsl
ey33
1429
1114
3212
2911
15–1
–20
01
Lam
beth
2912
477
628
1440
99
–12
–72
3
New
cast
le25
2135
911
2222
379
10–3
12
0–1
New
ham
2813
399
1128
1439
109
00
10
–2
Shef
field
3013
3410
1331
1332
1113
10
–31
0
Wal
sall
2710
3013
2125
1128
1620
–21
–12
–1
ND
C
aggr
egat
e28
1434
1113
2714
3411
14–1
0–1
01
Com
para
tor
2613
3511
1524
1334
1216
–20
01
1
Nat
iona
l19
(a)
12(b
)36
1518
18(a
)13
(b)
3515
19–1
(a)
1(b)
00
0
Sour
ce: I
psos
MO
RI N
DC
hou
seho
ld s
urve
y 20
02 a
nd 2
006.
Nat
iona
l: M
id-y
ear
popu
latio
n es
timat
es (N
OM
IS) 2
002
and
2006
Base
: All
hous
ehol
d m
embe
rs: B
radf
ord
2002
(146
3), 2
006
(114
4); K
now
sley
200
2 (1
285)
, 200
6 (1
061)
; Lam
beth
200
2 (1
259)
, 200
6 (1
043)
; New
cast
le 2
002
(118
0), 2
006
(101
9);
New
ham
200
2 (1
293)
, 200
6 (1
114)
; She
ffie
ld 2
002
(123
6), 2
006
(108
0); W
alsa
ll 20
02 (1
265)
, 200
6 (1
058)
; ND
C a
ggre
gate
200
2 (4
8096
), 20
06 (3
9864
); C
ompa
rato
r 20
02 (5
093)
, 20
06 (7
639)
Not
es: (
a) A
ge 0
–14;
(b) A
ge 1
5–24

84 | Residential mobility and outcome change in deprived areas
Percentage of all household members in school age groups
2002 2006 Change 2002–06
4–10 11–15 16–18 4–10 11–15 16–18 4–10 11–15 16–18
Bradford 14 7 5 13 9 5 –2 2 –1
Knowsley 15 11 5 14 11 5 0 0 0
Lambeth 13 8 3 13 8 5 0 0 2
Newcastle 11 7 4 9 7 4 –2 1 0
Newham 12 8 5 11 10 5 –1 2 0
Sheffield 13 8 5 14 9 5 2 1 0
Walsall 12 8 5 11 8 5 –1 0 1
NDC aggregate 12 8 5 12 8 5 –1 0 0
Comparator 12 8 5 11 7 4 –1 –1 –1
National 6(a) 7(b) 6(c) 6(a) 6(b) 7(c) 0(a) 0(b) 0(c)
Source: Ipsos MORI NDC household survey 2002 and 2006. National: Mid-year population estimates (NOMIS) 2002, 2006Base: All household members: Bradford 2002 (1463), 2006 (1144); Knowsley 2002 (1285), 2006 (1061); Lambeth 2002 (1259), 2006 (1043); Newcastle 2002 (1180), 2006 (1019); Newham 2002 (1293), 2006 (1114); Sheffield 2002 (1236), 2006 (1080); Walsall 2002 (1265), 2006 (1058); NDC aggregate 2002 (48096), 2006 (39864); Comparator 2002 (5093), 2006 (7639)Notes: (a) Age 5–9; (b) Age 10–14; (c) Age 15–19
Percentage working age
2002 2006 Change 2002–06
Lambeth 65 63 –2
Newcastle 64 68 3
Newham 61 62 1
Bradford 59 60 1
Sheffield 57 56 –2
Knowsley 54 53 –1
Walsall 53 55 2
NDC aggregate 59 59 0
Comparator 59 60 0
National 63(a) 64(a) 1(a)
Source: Ipsos MORI NDC household survey 2002 and 2006. National: Mid-year population estimates (NOMIS) 2002, 2006Base: All household members: Bradford 2002 (1463), 2006 (1144); Knowsley 2002 (1285), 2006 (1061); Lambeth 2002 (1259), 2006 (1043); Newcastle 2002 (1180), 2006 (1019); Newham 2002 (1293), 2006 (1114); Sheffield 2002 (1236), 2006 (1080); Walsall 2002 (1265), 2006 (1058); NDC aggregate 2002 (48096), 2006 (39864); Comparator 2002 (5093), 2006 (7639)Notes: (a) Age 15–59/64

Residential mobility and outcome change in deprived areas | 85
Percentage of respondents in broad ethnic groups
2002 2006 Change 2002–06
White Asian Black White Asian Black White Asian Black
Bradford 39 54 6 31 55 10 –8 0 4
Knowsley 100 0 0 100 0 0 0 0 0
Lambeth 61 4 34 55 6 33 –6 2 0
Newcastle 73 21 2 60 31 5 –13 9 3
Newham 52 14 29 49 17 26 –3 3 –2
Sheffield 49 25 22 46 30 22 –3 4 0
Walsall 98 1 2 98 1 1 1 0 –1
NDC aggregate 75 12 11 71 14 12 –4 2 1
Comparator 77 14 8 74 15 9 –3 1 1
National 91 6 3 N/A N/A N/A N/A N/A N/A
Source: Ipsos MORI NDC household survey 2002 and 2006. National: Mid-year population estimates (NOMIS) 2002, 2006Base: All: Bradford 2002 (517), 2006 (404); Knowsley 2002 (508), 2006 (410); Lambeth 2002 (500), 2006 (403); Newcastle 2002 (501), 2006 (407); Newham 2002 (501), 2006 (400); Sheffield 2002 (502), 2006 (414); Walsall 2002 (500), 2006 (402); NDC aggregate 2002 (19574), 2006 (15792); Comparator 2002 (2014), 2006 (3062)

86 | Residential mobility and outcome change in deprived areas
Appendix 5: Variables included in key drivers of area-level residential mobility modelThe proportion of residents:
• aged 16 to 34
• aged 35 to 59
• aged 60 or older
• in full-time education
• that are white
• that are Asian
• that are black
• for whom English is their first language
• claim IB/SDA
• in employment (working age)
• satisfied with the area as a place to live
• satisfied with their accommodation
• satisfied with the repair of their accommodation
• have a good quality of life
• have a high lawlessness and dereliction score
• have a high environment score
• think the area has improved over the past two years
• think NDC has improved their area.
The proportion of households:
• living in owner occupation
• living in social rented accommodation
• living in private rented accommodation
• that are couples with no dependents
• that are couples with dependents
• that are lone-parent
• that are single-person.
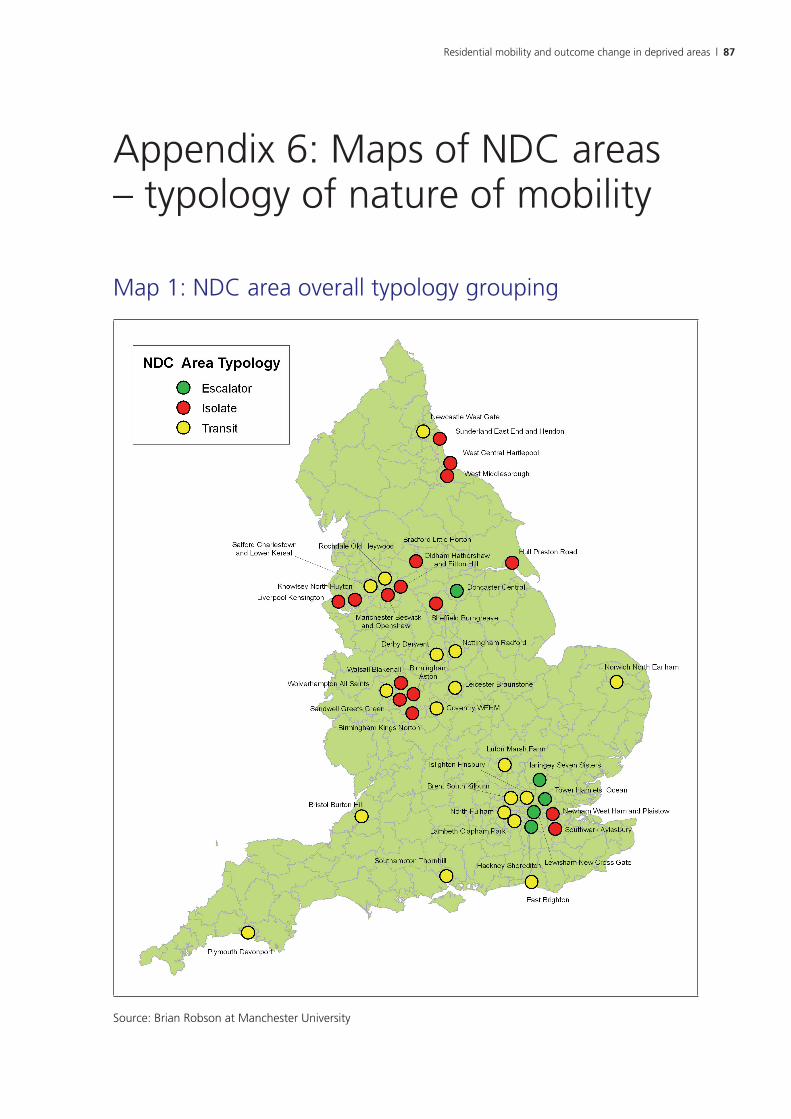
Residential mobility and outcome change in deprived areas | 87
Appendix 6: Maps of NDC areas – typology of nature of mobility
Map 1: NDC area overall typology grouping
Source: Brian Robson at Manchester University

88 | Residential mobility and outcome change in deprived areas
Map 2: NDC area breakdown by typology groups
Source: Brian Robson at Manchester University

Residential mobility and outcome change in deprived areas | 89
Appendix 7: Residential mobility classificationThis note outlines the construction of the three band residential mobility classification:
• low mobility
• mid mobility
• high mobility.
The method involves standardising then combining five indicators of residential mobility taken from the 2002 household survey:
• frequency of moves in the past five years – none (a lower percentage indicating high mobility)
• frequency of moves in the past five years – three plus (a higher percentage indicating high mobility)
• length of residence at address – less than a year (a higher percentage indicating high mobility)
• length of residence at address – 10 plus years (a lower percentage indicating high mobility)
• potential movers (a higher percentage indicating high mobility.
Standardising is a process of converting variables into a standard unit of measurement; from which resulting variables can be summed and will add equal weight. In this research this was done by using standard deviation units (z-scores). The z-scores are calculated by taking an NDCs value for an mobility indicator, subtracting this from the mean across all NDCs, and dividing the result by the standard deviation of all NDC level observations. This creates a new distribution where across the 39 Partnerships each indicator has a mean of 0 and a standard deviation of 1.

£25ISBN 978-1-4098-1396-5 9 7 8 1 4 0 9 8 1 3 9 6 5
ISBN 978-1-4098-1396-5
Related Documents