44 InsuranceNewsNet Magazine April 2012 F or investment advisors, manag- ing the performance expectations of clients can be more challenging than actually managing their investment portfolios. There are at least two impor- tant elements at work here: clients hav- ing reasonable expectations and portfolio performance that tends to be reasonably close to that expectation. Oddly enough, bull market periods are one of the greatest challenges when it comes to developing “reasonable” expec- tations. Unusually high rates of return (for example, the U.S. equity market dur- ing the 1990s) can set expectations that are both unrealistic and unachievable over long time frames. During the exuberant 10-year period from 1989-1998, the S&P 500 Index had an average annualized return of 19.2 per- cent. Unfortunately, the average 10-year rolling return of the S&P 500 Index over the 42-year period from Jan. 1, 1970, to Dec. 31, 2011 (during which there were 33 rolling 10-year returns) was 11.56 percent. The performance of U.S. stocks during the 10-year period from 1989-‘98 was quite a departure from the longer- term reality. Sadly, investor expectations of performance are quickly upwardly mobile—even when such expectations are clearly unrealistic. Here’s the problem: high expecta- tions lead to performance-chasing— and investors late to the game often get burned. Late comers to the tech sector boom of the 1990s got creamed in 2000, 2001 and 2002. During periods of high returns, expectations of the future can become unrealistically high. Likewise, during periods of poor stock performance (2000-‘02 or 2008) investors can become unduly pessimistic and may abandon their portfolio game plan—often at exactly the wrong time. In short, periods of boom or bust have the potential to cre- ate unrealistic expectations on both ends of the performance spectrum. Unrealistic “up-side” expectations are hard to manage going forward, which means that clients face a high probabil- ity of being disappointed even if their portfolio delivers what would otherwise be deemed an acceptable level of perfor- mance. In other words, their portfolio is doing fine, but their expectations are messed up. On the other hand, after a messy bear market, it can be difficult for investors to remember that investments actually do produce positive returns. Unrealistically high performance expec- tations on the one hand, and unrealisti- cally low performance expectations on the other hand, both create problems. The goal is obviously to have realistic performance expectations and build a portfolio that consistently delivers per- formance that is reasonably close to the expectation level. So, what’s a reasonable expectation for an investment portfolio? As previ- ously noted, the average 10-year rolling return of the large US stock (i.e., the S&P 500 Index) since 1970 has been 11.6 per- cent. Let’s use that as a reasonable return expectation. (Even if you don’t feel that figure represents a reasonable perfor- mance expectation, bear with me here). I understand that an investment portfolio that consists solely of large cap US equity is not a diversified portfolio—more on that later. Let’s now examine how often a 100 per- cent equity-based investment portfolio (the S&P 500 Index) delivers performance close to that “reasonable” rolling 10-year return of 11.6 percent. To measure this we can impose upside and downside performance bands of 500 basis points above and below the mean 10-year return of 11.6 percent (the upside and downside performance bands are shown by the red lines in Figure 1). This created an upside performance limit of 16.6 percent (11.6 percent plus 5.0 percent) and a downside performance limit of 6.6 percent (11.6 percent minus 5.0 percent). As shown in Figure 1, an all-equity investment portfolio was outside of the 500 bps limits 39 percent of the time (13 of the 33 rolling 10-year periods). The 500 bps performance bands are shown as red lines. In other words, nearly 40 percent of the time, the all-equity investment port- folio produced returns that were signifi- cantly different from the mean 10-year rolling return. In recent years, the rolling 10-year returns have been dramatically lower than the average 10-year return of 11.6 percent. This is the type of down- side performance volatility that can rattle even the most resolute investor. Now, let’s consider the rolling 10-year performance of a multi-asset portfolio that includes seven equally-weighted por- tions of large cap U.S. equity, small cap U.S. equity, non-U.S. equity, real estate, commodities, U.S. bonds and U.S. cash (see Figure 2). Clearly, this represents a more diversified investment portfolio RESETTING Unreasonable Expectations If Clients are Realistic About Returns They Will be Happier and More Secure BY CRAIG L. ISRAELSEN

Welcome message from author
This document is posted to help you gain knowledge. Please leave a comment to let me know what you think about it! Share it to your friends and learn new things together.
Transcript

44 InsuranceNewsNet Magazine April 2012
For investment advisors, manag-ing the performance expectations of clients can be more challenging
than actually managing their investment portfolios. There are at least two impor-tant elements at work here: clients hav-ing reasonable expectations and portfolio performance that tends to be reasonably close to that expectation.
Oddly enough, bull market periods are one of the greatest challenges when it comes to developing “reasonable” expec-tations. Unusually high rates of return (for example, the U.S. equity market dur-ing the 1990s) can set expectations that are both unrealistic and unachievable over long time frames.
During the exuberant 10-year period from 1989-1998, the S&P 500 Index had an average annualized return of 19.2 per-cent. Unfortunately, the average 10-year rolling return of the S&P 500 Index over the 42-year period from Jan. 1, 1970, to Dec. 31, 2011 (during which there were 33 rolling 10-year returns) was 11.56 percent. The performance of U.S. stocks during the 10-year period from 1989-‘98 was quite a departure from the longer-term reality. Sadly, investor expectations of performance are quickly upwardly mobile—even when such expectations are clearly unrealistic.
Here’s the problem: high expecta-tions lead to performance-chasing—and investors late to the game often get burned. Late comers to the tech sector boom of the 1990s got creamed in 2000, 2001 and 2002. During periods of high returns, expectations of the future can become unrealistically high. Likewise, during periods of poor stock performance
(2000-‘02 or 2008) investors can become unduly pessimistic and may abandon their portfolio game plan—often at exactly the wrong time. In short, periods of boom or bust have the potential to cre-ate unrealistic expectations on both ends of the performance spectrum.
Unrealistic “up-side” expectations are hard to manage going forward, which means that clients face a high probabil-ity of being disappointed even if their portfolio delivers what would otherwise be deemed an acceptable level of perfor-mance. In other words, their portfolio is doing fine, but their expectations are messed up. On the other hand, after a messy bear market, it can be difficult for investors to remember that investments actually do produce positive returns. Unrealistically high performance expec-tations on the one hand, and unrealisti-cally low performance expectations on the other hand, both create problems. The goal is obviously to have realistic performance expectations and build a portfolio that consistently delivers per-formance that is reasonably close to the expectation level.
So, what’s a reasonable expectation for an investment portfolio? As previ-ously noted, the average 10-year rolling return of the large US stock (i.e., the S&P 500 Index) since 1970 has been 11.6 per-cent. Let’s use that as a reasonable return expectation. (Even if you don’t feel that figure represents a reasonable perfor-mance expectation, bear with me here). I understand that an investment portfolio that consists solely of large cap US equity is not a diversified portfolio—more on that later.
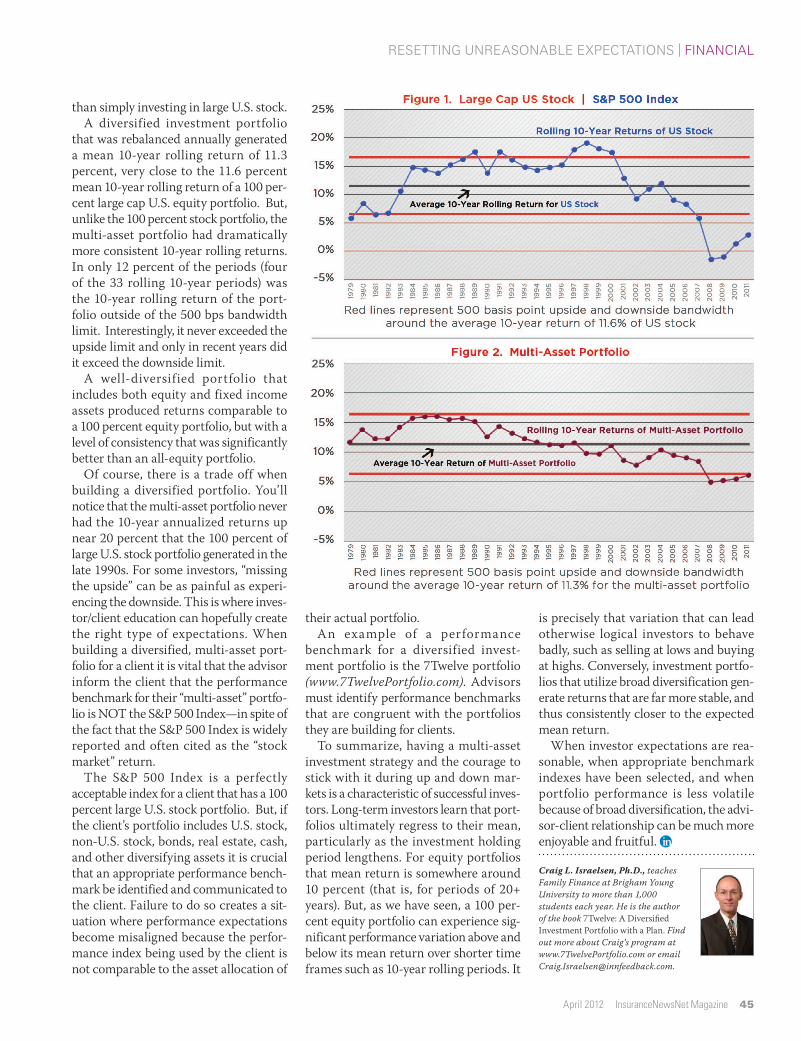
Let’s now examine how often a 100 per-cent equity-based investment portfolio (the S&P 500 Index) delivers performance close to that “reasonable” rolling 10-year return of 11.6 percent. To measure this we can impose upside and downside performance bands of 500 basis points above and below the mean 10-year return of 11.6 percent (the upside and downside performance bands are shown by the red lines in Figure 1). This created an upside performance limit of 16.6 percent (11.6 percent plus 5.0 percent) and a downside performance limit of 6.6 percent (11.6 percent minus 5.0 percent).
As shown in Figure 1, an all-equity investment portfolio was outside of the 500 bps limits 39 percent of the time (13 of the 33 rolling 10-year periods). The 500 bps performance bands are shown as red lines. In other words, nearly 40 percent of the time, the all-equity investment port-folio produced returns that were signifi-cantly different from the mean 10-year rolling return. In recent years, the rolling 10-year returns have been dramatically lower than the average 10-year return of 11.6 percent. This is the type of down-side performance volatility that can rattle even the most resolute investor.
Now, let’s consider the rolling 10-year performance of a multi-asset portfolio that includes seven equally-weighted por-tions of large cap U.S. equity, small cap U.S. equity, non-U.S. equity, real estate, commodities, U.S. bonds and U.S. cash (see Figure 2). Clearly, this represents a more diversified investment portfolio
Resetting Unreasonable expectationsIf Clients are Realistic About Returns They Will be Happier and More Secure
By Craig L. israeLsen
April 2012 InsuranceNewsNet Magazine 45
resetting unreasonable expectations | Financial
than simply investing in large U.S. stock. A diversified investment portfolio
that was rebalanced annually generated a mean 10-year rolling return of 11.3 percent, very close to the 11.6 percent mean 10-year rolling return of a 100 per-cent large cap U.S. equity portfolio. But, unlike the 100 percent stock portfolio, the multi-asset portfolio had dramatically more consistent 10-year rolling returns. In only 12 percent of the periods (four of the 33 rolling 10-year periods) was the 10-year rolling return of the port-folio outside of the 500 bps bandwidth limit. Interestingly, it never exceeded the upside limit and only in recent years did it exceed the downside limit.
A well-diversified portfolio that includes both equity and fixed income assets produced returns comparable to a 100 percent equity portfolio, but with a level of consistency that was significantly better than an all-equity portfolio.
Of course, there is a trade off when building a diversified portfolio. You’ll notice that the multi-asset portfolio never had the 10-year annualized returns up near 20 percent that the 100 percent of large U.S. stock portfolio generated in the late 1990s. For some investors, “missing the upside” can be as painful as experi-encing the downside. This is where inves-tor/client education can hopefully create the right type of expectations. When building a diversified, multi-asset port-folio for a client it is vital that the advisor inform the client that the performance benchmark for their “multi-asset” portfo-lio is NOT the S&P 500 Index—in spite of the fact that the S&P 500 Index is widely reported and often cited as the “stock market” return.
The S&P 500 Index is a perfectly acceptable index for a client that has a 100 percent large U.S. stock portfolio. But, if the client’s portfolio includes U.S. stock, non-U.S. stock, bonds, real estate, cash, and other diversifying assets it is crucial that an appropriate performance bench-mark be identified and communicated to the client. Failure to do so creates a sit-uation where performance expectations become misaligned because the perfor-mance index being used by the client is not comparable to the asset allocation of
their actual portfolio.An example of a performance
benchmark for a diversified invest-ment portfolio is the 7Twelve portfolio (www.7TwelvePortfolio.com). Advisors must identify performance benchmarks that are congruent with the portfolios they are building for clients.
To summarize, having a multi-asset investment strategy and the courage to stick with it during up and down mar-kets is a characteristic of successful inves-tors. Long-term investors learn that port-folios ultimately regress to their mean, particularly as the investment holding period lengthens. For equity portfolios that mean return is somewhere around 10 percent (that is, for periods of 20+ years). But, as we have seen, a 100 per-cent equity portfolio can experience sig-nificant performance variation above and below its mean return over shorter time frames such as 10-year rolling periods. It
is precisely that variation that can lead otherwise logical investors to behave badly, such as selling at lows and buying at highs. Conversely, investment portfo-lios that utilize broad diversification gen-erate returns that are far more stable, and thus consistently closer to the expected mean return.
When investor expectations are rea-sonable, when appropriate benchmark indexes have been selected, and when portfolio performance is less volatile because of broad diversification, the advi-sor-client relationship can be much more enjoyable and fruitful.
Craig L. Israelsen, Ph.D., teaches Family Finance at Brigham Young University to more than 1,000 students each year. He is the author of the book 7Twelve: A Diversified Investment Portfolio with a Plan. Find out more about Craig’s program at www.7TwelvePortfolio.com or email [email protected].
Related Documents