1 The The 7 7 Twelve Twelve Portfolio Portfolio The Benefits of Low Correlation The Benefits of Low Correlation Craig Craig L L . . Israelsen Israelsen , , Ph Ph . . D D . . Brigham Young University Brigham Young University www www . . 7 7 TwelvePortfolio TwelvePortfolio . . com com 41 41 slides slides

Welcome message from author
This document is posted to help you gain knowledge. Please leave a comment to let me know what you think about it! Share it to your friends and learn new things together.
Transcript

1
The The 77TwelveTwelve PortfolioPortfolio The Benefits of Low CorrelationThe Benefits of Low Correlation
Craig Craig LL. . IsraelsenIsraelsen, , PhPh..DD.. Brigham Young UniversityBrigham Young University
wwwwww..77TwelvePortfolioTwelvePortfolio..comcom
41 41 slidesslides

2
This document is a research report presenting portfolio research and analysis.
This document is neither investment advice nor an investment solicitation.
Implementation of the 77TwelveTwelve portfolio is no guarantee of performance.
---------------------------------------------------------------------------------------------
This is a copyrighted document, copying for redistribution is prohibited unless written permission is
obtained from Craig L. Israelsen.
Copyright © 2008 Craig L. Israelsen
All rights reserved

Presentation OverviewPresentation Overview
►►Part One provides a historical context of the Part One provides a historical context of the
benefits of a multibenefits of a multi--assetasset, , low correlation low correlation
portfolioportfolio..
►►Part Two introduces the Part Two introduces the 77TwelveTwelve PortfolioPortfolio, ,
a multia multi--assetasset, , low correlation global low correlation global
portfolioportfolio.. 3

Part OnePart One
4

5
Historical Asset ReturnsHistorical Asset Returns
38-Year Period from 1970-2007
Annualized Return (%)
Std Dev of Annual Returns
Growth of $10,000
REIT 12.38 18.45 843,476
Commodities 12.02 23.93 747,183
US Small Stock 11.74 21.68 678,684
US Large Stock 11.08 16.62 542,040
International Stock 10.86 21.54 503,316
Bonds (Intermediate) 8.10 5.39 193,131
Cash 6.29 3.07 101,701
Inflation 4.62 3.08 55,618

6
DataData
►► LargeLarge--cap US equitycap US equity represented by the Srepresented by the S&&P P 500500 IndexIndex..
►► SmallSmall--cap US equitycap US equity represented by the Ibbotson Small Companies Index represented by the Ibbotson Small Companies Index from from 19701970--19781978, , and the Russell and the Russell 20002000 Index from Index from 19791979--20072007. .
►► NonNon--US equityUS equity represented by the MSCI EAFE Indexrepresented by the MSCI EAFE Index. .
►► Real estateReal estate represented by the NAREIT Index from represented by the NAREIT Index from 19701970--19771977 and the Dow and the Dow Jones Wilshire REIT Index from Jones Wilshire REIT Index from 19781978--20072007..
►► CommoditiesCommodities represented by the Goldman Sachs Commodities Index represented by the Goldman Sachs Commodities Index ((GSCIGSCI). ). As of February As of February 66, , 20072007, , the GSCI became the Sthe GSCI became the S&&P GSCI Commodity IndexP GSCI Commodity Index..
►► UU..SS. . intermediate term bondsintermediate term bonds represented by the Ibbotson Intermediate represented by the Ibbotson Intermediate Term Bond Index from Term Bond Index from 19701970--7373 and the Lehman Brothers Intermediate Term and the Lehman Brothers Intermediate Term Government Bond index from Government Bond index from 19741974--20072007. .
►► CashCash represented by represented by 33--month Treasury Billsmonth Treasury Bills. .

7
Historical Upside and DownsideHistorical Upside and Downside
1970-2007
Largest One-Year Gain (%)
Worst One-Year Loss (%)
Worst 3-Year
Cum Loss (%)
Bonds 25.42 (1.75) 6.43
Cash 15.58 1.05 4.22
Commodities 74.96 (35.75) (26.06)
REIT 48.99 (23.44) (28.30)
US Large Stock 37.58 (26.47) (37.61)
US Small Stock 57.40 (30.90) (42.22)
International Stock 69.44 (23.45) (43.32)

8

Benefit Benefit #1#1
When built correctlyWhen built correctly, ,
multimulti--asset portfolios achieve asset portfolios achieve
low aggregate correlation low aggregate correlation
among the internal assetsamong the internal assets..
9

10
Correlation of Correlation of Major Asset ClassesMajor Asset Classes ((19701970--20072007))
Large US Equity
Small US Equity
Non-US Equity
US Bonds
Cash REIT
Small US Equity .74
Non-US Equity .59 .47
US Bonds .21 .05 -.11
Cash .05 .01 -.12 .42
REIT .39 .71 .25 .00 -.05
Commodities -.28 -.32 -.14 -.20 .00 -.24
Aggregate (Average) Correlation in Equal-Weighted 7-Asset Portfolio = 0.12

11
Correlation Correlation MattersMatters Commodities and small US stock had a similar Commodities and small US stock had a similar 3838--year returnyear return——but blending commodities with large US stock was far more benefibut blending commodities with large US stock was far more beneficial cial
because commodities has a lower correlation to large US stock because commodities has a lower correlation to large US stock ((--00..2828) ) than does small US stock than does small US stock ((00..7474).). Growth of $10,000 1970-2007
$0
$100,000
$200,000
$300,000
$400,000
$500,000
$600,000
$700,000
$800,000
$900,000
$1,000,000
S&P 500 50% S&P 500/50% Small US 50% S&P 500/50% GSCI
38-Year Returns:
S&P 500 11.08%
Small US 11.74%
GSCI 12.02%
Correlation:
S&P 500/Small US = 0.74
S&P 500/Commodities = -0.28

12
Performance Performance During During
Accumulation Accumulation PhasePhase
Individual Assets Individual Assets
vsvs. .
Typical PortfoliosTypical Portfolios
vsvs. .
MultiMulti--Asset Asset PortfolioPortfolio

13
Year
Large US Equity
Small US Equity
Non-US Equity
Intermediate Term US Bonds
Cash Real Estate Commodities Equally
Weighted Multi-Asset Portfolio
1970 3.92 (17.40) (11.66) 16.90 6.80 (4.00) 15.17 1.39
1971 14.30 16.50 29.59 8.70 4.53 15.52 21.08 15.75
1972 19.00 4.40 36.35 5.20 4.24 8.01 42.43 17.09
1973197319731973 (14.69) (30.90) (14.92) 4.60 7.46 (15.52) 74.96 1.57
1974197419741974 (26.47) (19.90) (23.16) 7.03 8.35 (21.42) 39.51 (5.15)
1975 37.23 52.80 35.39 8.33 6.08 19.29 (17.22) 20.27
1976 23.93 57.40 2.54 11.74 5.23 47.56 (11.92) 19.50
1977 (7.16) 25.40 18.06 3.00 5.52 22.43 10.37 11.09
1978 6.57 23.50 32.62 2.23 7.67 10.98 31.61 16.45
1979 18.61 43.07 4.75 6.59 10.86 48.99 33.81 23.81
1980 32.50 38.60 22.58 6.65 12.71 33.12 11.08 22.46
1981 (4.92) 2.03 (2.28) 10.79 15.58 17.88 (23.01) 2.30
1982 21.55 24.95 (1.86) 25.42 11.66 20.91 11.56 16.31
1983 22.56 29.13 23.69 8.22 9.24 32.17 16.26 20.18
1984 6.27 (7.30) 7.38 14.29 10.33 21.89 1.05 7.70
1985 31.73 31.05 56.16 18.00 7.97 6.50 10.01 23.06
1986 18.67 5.68 69.44 13.06 6.29 19.75 2.05 19.28
1987 5.25 (8.80) 24.63 3.61 6.13 (6.59) 23.77 6.86
1988 16.61 25.02 28.27 6.40 7.06 17.48 27.94 18.40
1989 31.69 16.26 10.54 12.68 8.67 2.72 38.28 17.26
1990 (3.10) (19.48) (23.45) 9.56 7.99 (23.44) 29.08 (3.26)

14
Year Large US
Equity Small US
Equity Non-US Equity
Intermediate Term US
Govt Bonds Cash Real Estate Commodities
Equally Weighted Multi-Asset Portfolio
1991 30.47 46.04 12.13 14.11 5.68 23.84 (6.13) 18.02
1992 7.62 18.41 (12.17) 6.93 3.59 15.13 4.42 6.28
1993 10.08 18.88 32.56 8.17 3.12 15.14 (12.33) 10.80
1994 1.32 (1.82) 7.78 (1.75) 4.45 2.66 5.29 2.56
1995 37.58 28.45 11.21 14.41 5.79 12.24 20.33 18.57
1996 22.96 16.49 6.05 4.06 5.26 37.05 33.92 17.97
1997 33.36 22.36 1.78 7.72 5.31 19.66 (14.07) 10.87
1998 28.58 (2.55) 19.93 8.49 5.02 (17.01) (35.75) 0.96
1999 21.04 21.26 27.03 0.49 4.87 (2.58) 40.92 16.15
2000200020002000 (9.10) (3.02) (14.17) 10.47 6.32 31.04 49.74 10.18
2001200120012001 (11.89) 2.49 (21.44) 8.42 3.67 12.35 (31.93) (5.48)
2002200220022002 (22.10) (20.48) (15.94) 9.64 1.68 3.58 32.07 (1.65)
2003 28.69 47.25 38.59 2.29 1.05 36.18 20.72 24.97
2004 10.88 18.33 20.25 2.33 1.43 33.16 17.28 14.81
2005 4.91 4.55 13.54 1.68 3.34 13.82 25.55 9.63
2006 15.79 18.37 26.34 3.84 5.07 35.97 (15.09) 12.90
2007 5.49 (1.57) 11.17 8.47 4.77 (17.56) 32.67 6.21

Benefit Benefit #2#2
When built correctlyWhen built correctly, ,
multimulti--asset portfolios asset portfolios
achieve achieve equityequity--like returns like returns
with with bondbond--like risklike risk..
15

16
MultiMulti--Asset Portfolio vsAsset Portfolio vs. . Single AssetsSingle Assets
1970-2007
Large US Equity
Small US Equity
Non-US Equity
US Bonds
Cash Real Estate
Commodities
Equally Weighted 7-Asset Portfolio
38-Year Average Annualized %
Return 11.08 11.74 10.86 8.10 6.29 12.38 12.02 11.41
38-Year Standard Deviation of
Annual Returns 16.62 21.68 21.54 5.39 3.07 18.45 23.93 8.60
Number of Years with Negative
Returns 8 11 10 1 0 8 9 4
Worst One-Year % Return (26.47) (30.90) (23.45) (1.75) 1.05 (23.44) (35.75) (5.48)
Worst Three-Year Cumulative %
Return (37.61) (42.22) (43.32) 6.43 4.22 (28.30) (26.06) 2.43

WhatWhat’’s Different in s Different in 20082008? ? Commodities and real estate are not helping as much as in prior Commodities and real estate are not helping as much as in prior downturnsdownturns..
17
Year
Large US Equity
Small US Equity
Non-US Equity
Intermediate US Govt Bonds
Cash Real
Estate Commodities
Equally Weighted
Multi-Asset Portfolio
1973197319731973 (14.69) (30.90) (14.92) 4.60 7.46 (15.52) 74.96 1.57
1974197419741974 (26.47) (19.90) (23.16) 7.03 8.35 (21.42) 39.51 (5.15)
2000200020002000 (9.10) (3.02) (14.17) 10.47 6.32 31.04 49.74 10.18
2001200120012001 (11.89) 2.49 (21.44) 8.42 3.67 12.35 (31.93) (5.48)
2002200220022002 (22.10) (20.48) (15.94) 9.64 1.68 3.58 32.07 (1.65)
YTD YTD YTD YTD
Oct Oct Oct Oct 31313131
2008200820082008
(32.9) (29.1) (42.0) 4.8 1.5 (30.5) (28.3) (22.34)

18
Portfolio (Equity/
Fixed Income)
Large US Stock
Small US Stock
Non-US Stock
Bonds
Cash
60/4060/40
30%30%
15%15%
15%15%
30%30%
10%10%
40/6040/60
20%20%
10%10%
10%10%
50%50%
10%10%
Typical Typical MultiMulti--Asset PortfoliosAsset Portfolios
19

20
Performance in Performance in PostPost--RetirementRetirement
Distribution Distribution PhasePhase
Various Portfolios Various Portfolios
vsvs. .
MultiMulti--Asset PortfolioAsset Portfolio

Benefit Benefit #3#3
When built correctlyWhen built correctly, , multimulti--asset asset
portfolios are portfolios are durabledurable during the during the
postpost--retirement distribution phaseretirement distribution phase..
DurableDurable = = Growth Growth + + Downside ResistanceDownside Resistance
21

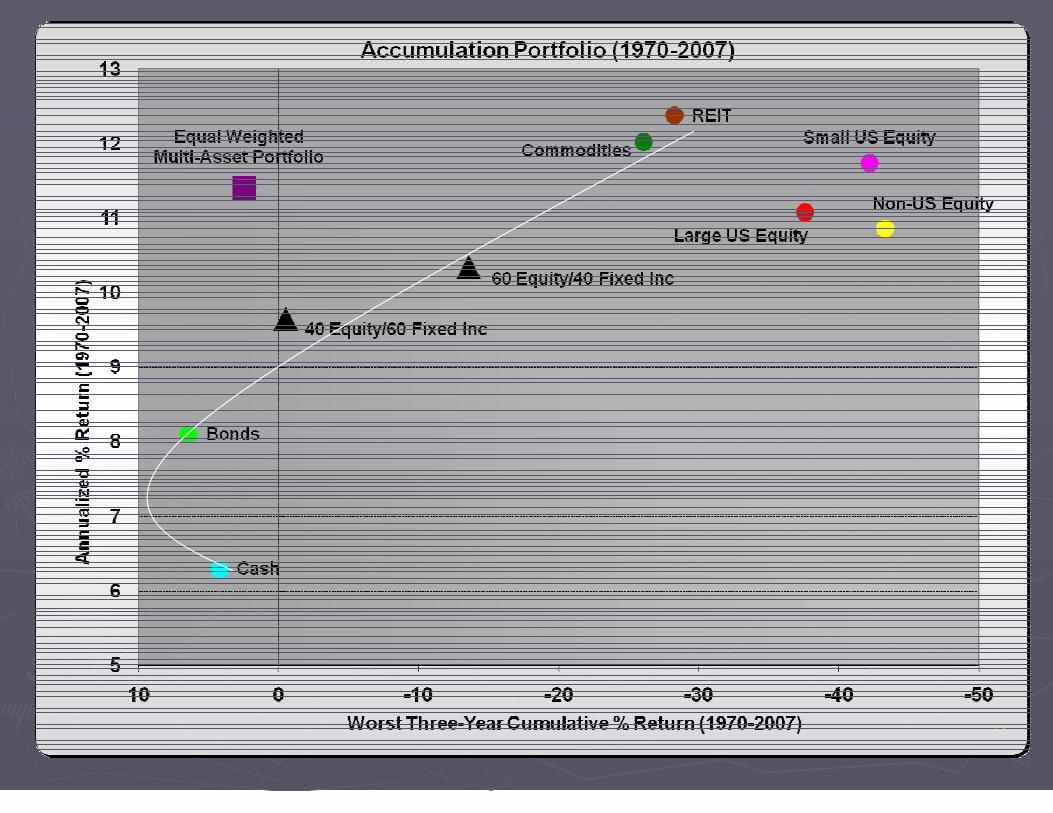
22
Distribution Portfolio (1970-2007)
1
2
3
4
5
6
EW
CW
40/60
60/40
6%
7%
8%
9%
10%
11%
12%
10% 15% 20% 25% 30% 35% 40% 45% 50% 55%
Frequency of Loss (as measured by % Change in Year-to-Year Account Value)
Inte
rnal R
ate
of R
etu
rn (
1970-2
007)
1 = One-asset portfolio (100% Cash) 2 = Two-asset portfolio (50% each Bonds, Cash) 3 = Three-asset portfolio (33% each Cash, Bonds, Large US Stock) 4 = Four-asset portfolio (25% each Cash, Bonds, Large US Stock, Small US Stock) 5 = Five-asset portfolio (20% each Cash, Bonds, Large US Stock, Small US Stock, Non-US Stock) 6 = Six-asset portfolio (16.7% each Cash, Bonds, Large US Stock, Small US Stock, Non-US Stock, REIT) EW = Seven-asset equal-weighted portfolio (14.3% each Cash, Bonds, Large US Stock, Small US Stock, Non-US Stock, REIT, Commodities) CW = Seven-asset custom-weighted portfolio (12% Large US, 8% Small US, 10% Non-US, 5% REIT, 5% Commodities, 40% Bond, 20% Cash) 60/40 = 30% Large US, 15% Small US, 15% Non-US, 30% Bond, 10% Cash 40/60 = 20% Large US, 10% Small US, 10% Non-US, 50% Bond, 10% Cash
$500,000 Initial Portfolio Value 5% withdraw rate 3% inflation rate of annual withdrawal

23
►►Minimizing Minimizing frequency of lossfrequency of loss and and size of size of
portfolio lossportfolio loss while generating robust while generating robust
performance are distinct benefits of low performance are distinct benefits of low
correlation portfolioscorrelation portfolios——provided that each provided that each
asset is assigned a asset is assigned a meaningful allocationmeaningful allocation..
►►Recovering from large losses is more Recovering from large losses is more
difficult in distribution portfoliosdifficult in distribution portfolios----when when
money is being systematically withdrawnmoney is being systematically withdrawn..

24
Portfolio Loss
Needed Average Annual % Return to Restore Original Portfolio Balance
WITHDRAWAL Portfolio First Year Withdrawal of 5% of initial balance, 3% increase of annual withdrawal
Within Within 1 1 YearYear
Within Within 2 2 YearsYears
Within Within 3 3 YearsYears
Within Within 4 4 YearsYears
Within Within 5 5 YearsYears
-5% 16.8% 11.1% 9.3% 8.4% 8.0%
-10% 23.7% 14.4% 11.5% 10.1% 9.4%
-15% 31.4% 18.0% 13.9% 12.0% 10.9%
-20% 40.2% 22.0% 16.5% 14.0% 12.5%
-25% 50.2% 26.4% 19.4% 16.1% 14.3%
Portfolio Loss
BUY-and-HOLD Portfolio
Within 1 Year
Within 2 Years
Within 3 Years
Within 4 Years
Within 5 Years
-5% 5.3% 2.6% 1.7% 1.3% 1.0%
-10% 11.1% 5.4% 3.6% 2.7% 2.1%
-15% 17.6% 8.5% 5.6% 4.1% 3.3%
-20% 25.0% 11.8% 7.7% 5.7% 4.6%
-25% 33.3% 15.5% 10.1% 7.5% 5.9%

25
Portfolio (Equity/
Fixed Income)
Large US Stock
Small US Stock
Non-US Stock
Bonds Cash
60/4060/40 30%30% 15%15% 15%15% 30%30% 10%10%
40/6040/60 20%20% 10%10% 10%10% 50%50% 10%10%
20/8020/80 10%10% 5%5% 5%5% 60%60% 20%20%
0/1000/100 0%0% 0%0% 0%0% 70%70% 30%30%
Example Distribution Example Distribution PortfoliosPortfolios

26
Final Outcomes Final Outcomes Are Very Are Very Dependent on Timing of ReturnsDependent on Timing of Returns
Final Account Value During Each 20-Year Period
$0
$500,000
$1,000,000
$1,500,000
$2,000,000
$2,500,000
$3,000,000
$3,500,000
$4,000,000
$4,500,000
1979 1980 1981 1982 1983 1984 1985 1986 1987 1988 1989 1990 1991 1992 1993 1994 1995 1996 1997 1998 1999 2000 2001 2002 2003 2004 2005 2006 2007
20-Year Period Ending in...
60% Equity/40% Fixed Income 40% Equity/60% Fixed Income 20% Equity/80% Fixed Income 100% Fixed Income
60/40
40/60
20/80
0/100
DISTRIBUTION PORTFOLIO $500,000 Initial Portfolio Value 5% withdraw rate 3% inflation rate of annual withdrawal
1975-1994

27
Distribution Portfolio GoalsDistribution Portfolio Goals Stabilize Returns to Minimize Timing DependenceStabilize Returns to Minimize Timing Dependence
Maintain Robust Performance to Increase Portfolio LongevityMaintain Robust Performance to Increase Portfolio Longevity
(5)
0
5
10
15
20
25
1972
1973
1974
1975
1976
1977
1978
1979
1980
1981
1982
1983
1984
1985
1986
1987
1988
1989
1990
1991
1992
1993
1994
1995
1996
1997
1998
1999
2000
2001
2002
2003
2004
2005
2006
2007
40/60 Equal-Weighted 7 Asset Portfolio
3-Year Annualized Rolling Returns
1970-2007
Ave. 3-Yr Return Ave. 3-Yr Std Dev
40 Equity/60 Fixed Income 9.8% 4.3% 7-Asset EW Portfolio 11.7% 4.4%

Part TwoPart Two
28

29
Building Building a a MultipleMultiple--Asset Asset
Low Low Correlation Correlation PortfolioPortfolio
The The 77TwelveTwelve PortfolioPortfolio
►►77 Core Asset ClassesCore Asset Classes
withwith
►►1212 Underlying FundsUnderlying Funds

30
TheThe 7Twelve PortfolioPortfolio A A MultipleMultiple--Asset Asset Global PortfolioGlobal Portfolio
Approximately 60% of the Portfolio Allocation in Equity and Diversifying Assets
Approximately 40% of the Portfolio Allocation in Bonds and Cash
US Equity
Non-US Equity
Real Estate
Resources US
Bonds Non-US Bonds
Cash
Large
Companies Developed
Markets Global
Real Estate Natural
Resources US Aggregate
Bonds International
Bonds US Money
Market
Medium-sized
Companies Emerging
Markets Commodities
Inflation
Protected
Bonds
Small
Companies

31
Large US
Mid US
Small US
Non-US Developed
Non-US
Emerging
Global
Real Estate
Natural
Resources Commodities
US
Aggregate Bonds
Inflation
Protected Bonds
Non-US
Bonds
Mid US 0.58
Small US 0.88 0.38
Non-US Developed 0.65 0.16 0.48
Non-US Emerging 0.50 (0.18) 0.50 0.74
Global Real Estate 0.70 0.46 0.74 0.19 0.17
Natural Resources 0.47 0.37 0.48 0.53 0.69 0.35
Commodities 0.14 0.25 0.12 0.09 0.34 0.35 0.59
US Aggregate Bonds (0.39) 0.05 (0.17) (0.68) (0.83) 0.05 (0.61) (0.24)
Inflation Protected Bonds
(0.47) 0.01 (0.27) (0.54) (0.42) (0.02) (0.08) 0.38 0.63
Non-US Bonds (0.20) (0.20) (0.10) 0.25 (0.09) (0.11) (0.17) (0.09) 0.36 0.42
US Money Market (0.13) 0.29 (0.24) (0.35) (0.32) (0.35) (0.15) (0.22) 0.08 (0.22) (0.50)
7Twelve CorrelationCorrelation Aggregate Correlation = 0.09 Using annual returns from 1998-2007

32
7Twelve Portfolio
-30%
-20%
-10%
0%
10%
20%
30%
40%
0% 20% 40% 60% 80% 100% 120%
10-Year Standard Deviation of Return
10-Y
ear
An
nu
alized
Retu
rn
1,979 distinct mutual funds with at least 10 years of performance as of December 31, 2007
Red dot is 7Twelve portfolio

33
Calendar Year Total % Return
7Twelve Portfolio
American Funds Capital Income Builder
Fidelity Global Balanced
S&P 500 Index
1998 0.10 17.75 13.90 28.62
1999 15.47 23.03 7.96 21.07
2000 12.26 (5.97) 5.60 (9.06)
2001 2.17 (8.15) (2.49) (12.02)
2002 2.31 (6.15) (7.74) (22.15)
2003 28.61 29.90 24.38 28.50
2004 17.46 13.67 12.55 10.74
2005 12.31 9.00 6.44 4.77
2006 15.13 13.70 11.92 15.64
2007 12.46 13.77 7.70 5.39
10-Year Annualized Return
11.54 9.35 7.69 5.83
Correlation to S&P 500 Index
.50 .94 .89 1.00

34
Accumulation 7Twelve Portfolio

35
Distribution 7Twelve Portfolio $100,000 Initial Account Value, 5% Initial Withdrawal, 3% Annual Increase in Withdrawal

Age of Investor ���� Under Age 50
Age 50-60
Age 60-70
Over Age 70
Comparison Funds
Portfolio Mix ����
100% 7Twelve
80% 7Twelve 10% TIPS 10% Cash
60% 7Twelve 20% TIPS 20% Cash
40% 7Twelve 30% TIPS 30% Cash
American Funds Capital Income
Builder A (CAIBX)
Fidelity Global
Balanced (FGBLX)
Accumulation Portfolio (1998 – 2007)
10-Year Average Annualized Return (%)
11.54 10.40 9.23 8.03
10.06 9.35
Worst One-Year % Loss 0.10 0.99 1.88 2.77
(2.78) (8.15)
Distribution Portfolio (1998 – 2007) ($100,000 initial value, 5% annual withdrawal, 3% annual increase in withdrawal)
Internal Rate of Return (%) 10.24 9.28 8.30 7.29
8.90 8.46
Worst One-Year Portfolio Loss
($4,899) ($4,010) ($3,122) ($2,233)
($8,118) ($15,267)
Correlation (1998 – 2007)
Correlation to S&P 500 0.50 0.45 0.37 0.19 0.44 0.94 36

As of October As of October 3131, , 20082008
37
Master 7TwelveTM Portfolios Year-to-Date
Total % Return as of October 31, 2008
10-Year Annualized % Return as of
October 31, 2008
100% 7Twelve (27.72) 8.19
80% 7Twelve, 10% TIPS, 10% Cash (22.72) 7.69
60% 7Twelve, 20% TIPS, 20% Cash (17.73) 7.08
40% 7Twelve, 30% TIPS, 30% Cash (12.74) 6.39
Comparison Funds
American Funds Capital Income Builder (CAIBX)
(30.15) 5.48
Fidelity Global Balanced (FGBLX)
(24.57) 5.38
T. Rowe Price Personal Strategy Balanced (TRPBX)
(27.77) 3.57
Vanguard Balanced (VBINX)
(21.37) 2.98
Vanguard 500 Index (VFINX)
(32.87) 0.32

38

DJIA hit allDJIA hit all--time high on Oct time high on Oct 99, , 20072007
365 days later…(Thursday Oct 9, 2008)
Trailing 1-year Return as of Oct 9, 2008
►DJIA -39.4%
►S&P 500 -40.6%
►100% 7Twelve -25.9%
►40/30/30 7Twelve* -10.4% * 40% 7Twelve, 30% TIPS, 30% Cash
39

40
11) ) Portfolio logistics are very straightPortfolio logistics are very straight--forwardforward::
�� EquallyEqually--weightedweighted, , annually rebalancedannually rebalanced. .
�� Using cash flows to accomplish rebalance increases tax efficiencUsing cash flows to accomplish rebalance increases tax efficiencyy..
22) ) No reliance upon tactical skill or No reliance upon tactical skill or timingtiming. .
33)) Represents the core Represents the core ““modulemodule”” of any portfolio pre or post retirementof any portfolio pre or post retirement..
ExamplesExamples: : 80%80% 77TwelveTwelve, , 20%20% individual stocksindividual stocks 60%60% 77TwelveTwelve, , 20%20% TIPSTIPS, , 20%20% cashcash 50%50% 77TwelveTwelve, , 30%30% fixed annuityfixed annuity, , 20%20% cashcash
44) ) Can be built using actively managed fundsCan be built using actively managed funds, , passively managed index passively managed index
fundsfunds, , ETFsETFs, , ETNsETNs, , or CTFs or CTFs ((collective trust fundscollective trust funds).).
55) ) Sets upper and lower boundaries for number of portfolio holdingsSets upper and lower boundaries for number of portfolio holdings::
�� ((77 asset classes employing asset classes employing 1212 underlying fundsunderlying funds) )
7Twelve Portfolio

41
The The 77TwelveTwelve PortfolioPortfolio The Benefits of Low CorrelationThe Benefits of Low Correlation
Craig Craig LL. . IsraelsenIsraelsen, , PhPh..DD.. Brigham Young UniversityBrigham Young University
EmailEmail:: craigcraig@@77TwelvePortfolioTwelvePortfolio..comcom
WebWeb:: wwwwww..77TwelvePortfolioTwelvePortfolio..comcom
Related Documents