Geothermics 37 (2008) 332–346 Available online at www.sciencedirect.com Reservoir management at Awibengkok geothermal field, West Java, Indonesia Jorge A. Acu˜ na ∗ , James Stimac, Lutfhie Sirad-Azwar, Riza Glorius Pasikki Chevron Geothermal Salak Ltd., 11th Floor Senayan I, Jalan Asia Afrika, Jakarta, Indonesia Received 8 October 2007; accepted 5 February 2008 Available online 2 April 2008 Abstract The Awibengkok geothermal field, also known as Salak, is the largest developed geothermal resource in Indonesia, currently sustaining 377 MW of electrical generation. It is a water-dominated, naturally fractured reservoir with benign fluid chemistry. A very large amount of produced brine is injected along the margins of the proven reservoir. After 13 years of continuous operation, production levels have been maintained at or above nominal turbine capacity through periodic make-up drilling and field management. The two main chal- lenges have been taking advantage of the changing reservoir thermodynamic conditions and managing injec- tion. Some innovations in well design and drilling procedures include sizing up the production casing from 9 5 8 in. to 13 3 8 in. with 13 3 8 in. and 16 in. tie-backs, and drilling shallow, relatively high-angle (55–60 ◦ inclina- tion) wells to maximize production from the steam cap. Well deliverability predictions have been improved by combining well production history and downhole measurements to construct wellbore hydraulic models. Changes in injection strategy were made periodically to optimize heat recovery based on well perfor- mance and trends in well chloride concentration and enthalpy. Thermally stable tracers have been used to better understand inter-well connectivity. Make-up drilling has been managed to take advantage of evolving thermodynamic conditions in different parts of the field. Reservoir management has required continuously adapting production and injection strategies in response to reservoir evolution. This is only possible through maintaining robust data gathering and monitoring programs. Efforts are currently underway to evaluate expanding the area of production by moving injection deeper or to more distal locations. © 2008 Elsevier Ltd. All rights reserved. Keywords: Salak; Awibengkok; Indonesia; Reservoir management; Injection management; Tracer testing; Chloride monitoring; Well targeting and design; Drilling practices ∗ Corresponding author. Tel.: +62 21 5798 4579; fax: +62 21 5730 981. E-mail address: [email protected] (J.A. Acu˜ na). 0375-6505/$30.00 © 2008 Elsevier Ltd. All rights reserved. doi:10.1016/j.geothermics.2008.02.005

Welcome message from author
This document is posted to help you gain knowledge. Please leave a comment to let me know what you think about it! Share it to your friends and learn new things together.
Transcript
Geothermics 37 (2008) 332–346
Available online at www.sciencedirect.com
Reservoir management at Awibengkok geothermalfield, West Java, Indonesia
Jorge A. Acuna ∗, James Stimac,Lutfhie Sirad-Azwar, Riza Glorius Pasikki
Chevron Geothermal Salak Ltd., 11th Floor Senayan I, Jalan Asia Afrika, Jakarta, Indonesia
Received 8 October 2007; accepted 5 February 2008Available online 2 April 2008
Abstract
The Awibengkok geothermal field, also known as Salak, is the largest developed geothermal resource inIndonesia, currently sustaining 377 MW of electrical generation. It is a water-dominated, naturally fracturedreservoir with benign fluid chemistry. A very large amount of produced brine is injected along the marginsof the proven reservoir. After 13 years of continuous operation, production levels have been maintained at orabove nominal turbine capacity through periodic make-up drilling and field management. The two main chal-lenges have been taking advantage of the changing reservoir thermodynamic conditions and managing injec-tion. Some innovations in well design and drilling procedures include sizing up the production casing from9 5
8 in. to 13 38 in. with 13 3
8 in. and 16 in. tie-backs, and drilling shallow, relatively high-angle (55–60◦ inclina-tion) wells to maximize production from the steam cap. Well deliverability predictions have been improvedby combining well production history and downhole measurements to construct wellbore hydraulic models.
Changes in injection strategy were made periodically to optimize heat recovery based on well perfor-mance and trends in well chloride concentration and enthalpy. Thermally stable tracers have been used tobetter understand inter-well connectivity. Make-up drilling has been managed to take advantage of evolvingthermodynamic conditions in different parts of the field. Reservoir management has required continuouslyadapting production and injection strategies in response to reservoir evolution. This is only possible throughmaintaining robust data gathering and monitoring programs. Efforts are currently underway to evaluateexpanding the area of production by moving injection deeper or to more distal locations.© 2008 Elsevier Ltd. All rights reserved.
Keywords: Salak; Awibengkok; Indonesia; Reservoir management; Injection management; Tracer testing; Chloridemonitoring; Well targeting and design; Drilling practices
∗ Corresponding author. Tel.: +62 21 5798 4579; fax: +62 21 5730 981.E-mail address: [email protected] (J.A. Acuna).
0375-6505/$30.00 © 2008 Elsevier Ltd. All rights reserved.doi:10.1016/j.geothermics.2008.02.005
J.A. Acuna et al. / Geothermics 37 (2008) 332–346 333
1. Introduction
The Awibengkok geothermal field is located in West Java, 60 km south of Jakarta in Indonesia.A map of the field location is shown in companion paper by Stimac et al. in this issue. It is thelargest developed geothermal field in the country and together with the Darajat field (Hoang etal., 2005) constitutes the geothermal capacity operated by Chevron in Indonesia. The combinedcapacity of these two projects makes the company the largest geothermal operator in the country.
Awibengkok, also called Salak, was originally discovered in the early 1980s by Unocal and thewestern portion was developed to supply 110 MWe of generating capacity in 1994 (Murray et al.,1995). Production was increased to a nominal capacity of 330 MWe in late 1997 (Soeparjadi et al.,1998) by expanding production to the eastern portion of the proven reservoir. After the economiccrisis that hit Indonesia in 1997–99, the operating contract with the government of Indonesiacalled for increased production from Awibengkok. As a result the field has operated at a target of377 MWe since late 2002. The only periods of significant decreased production have been due tomaintenance of the generating facilities and landslides that destroyed part of the pipeline systemin March 2003. Full recovery from this event took approximately 5 months.
Here we describe major changes that have occurred in reservoir production during the first 13years of operation and highlights resource management challenges that were overcome to maintainfull steam supply. The geologic framework and conceptual model of the field are described byStimac et al. (2008).
2. Reservoir configuration and characteristics
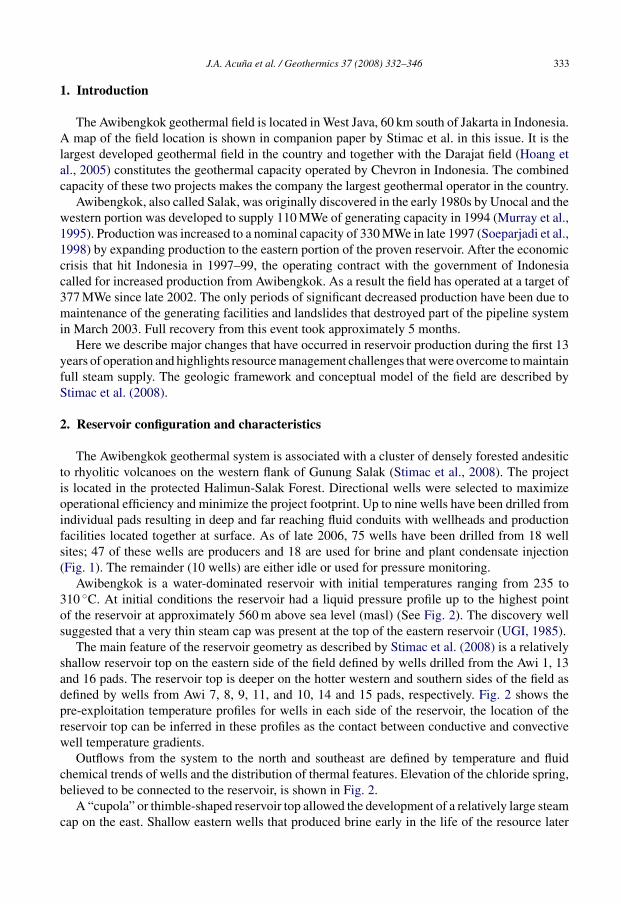
The Awibengkok geothermal system is associated with a cluster of densely forested andesiticto rhyolitic volcanoes on the western flank of Gunung Salak (Stimac et al., 2008). The projectis located in the protected Halimun-Salak Forest. Directional wells were selected to maximizeoperational efficiency and minimize the project footprint. Up to nine wells have been drilled fromindividual pads resulting in deep and far reaching fluid conduits with wellheads and productionfacilities located together at surface. As of late 2006, 75 wells have been drilled from 18 wellsites; 47 of these wells are producers and 18 are used for brine and plant condensate injection(Fig. 1). The remainder (10 wells) are either idle or used for pressure monitoring.
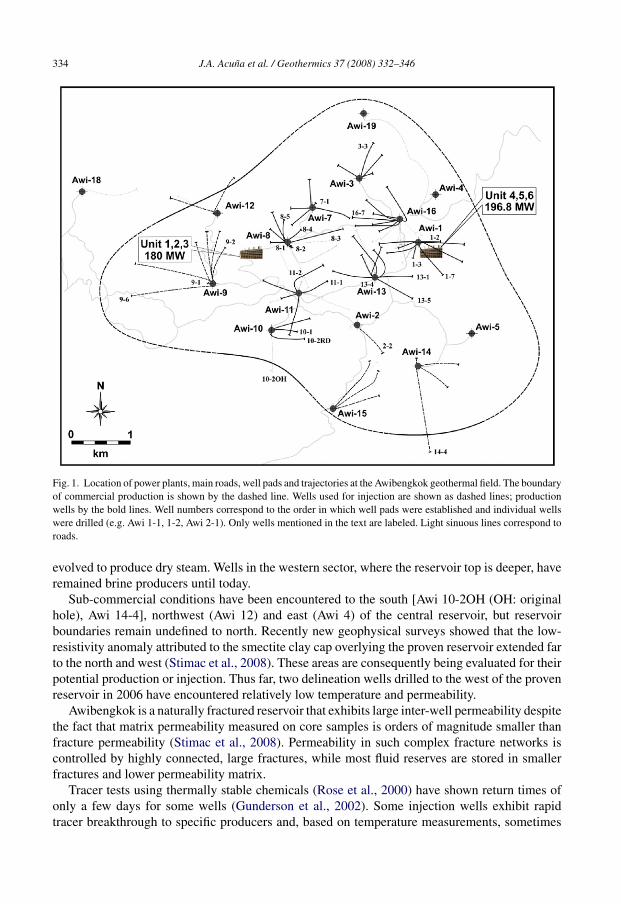
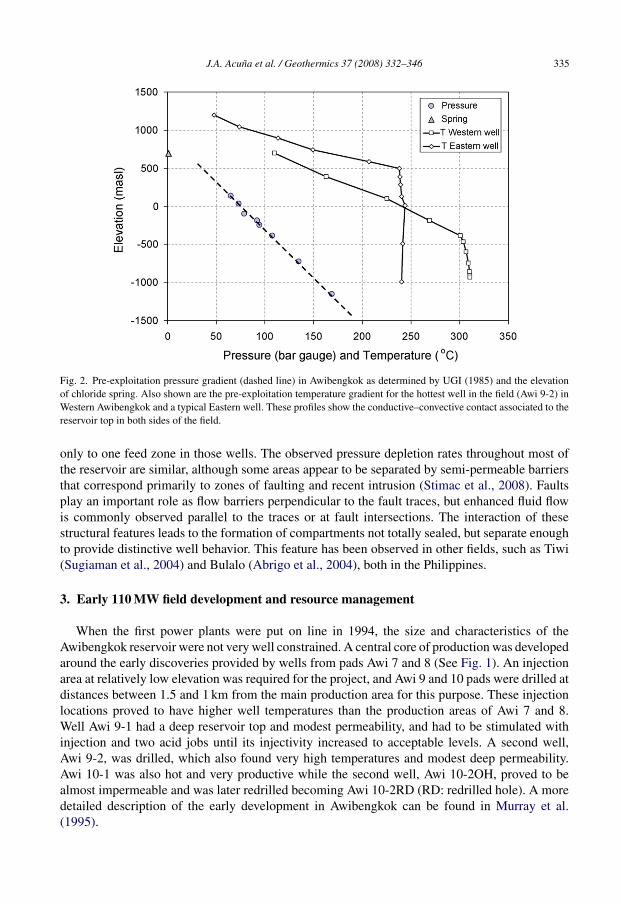
Awibengkok is a water-dominated reservoir with initial temperatures ranging from 235 to310 ◦C. At initial conditions the reservoir had a liquid pressure profile up to the highest pointof the reservoir at approximately 560 m above sea level (masl) (See Fig. 2). The discovery wellsuggested that a very thin steam cap was present at the top of the eastern reservoir (UGI, 1985).
The main feature of the reservoir geometry as described by Stimac et al. (2008) is a relativelyshallow reservoir top on the eastern side of the field defined by wells drilled from the Awi 1, 13and 16 pads. The reservoir top is deeper on the hotter western and southern sides of the field asdefined by wells from Awi 7, 8, 9, 11, and 10, 14 and 15 pads, respectively. Fig. 2 shows thepre-exploitation temperature profiles for wells in each side of the reservoir, the location of thereservoir top can be inferred in these profiles as the contact between conductive and convectivewell temperature gradients.
Outflows from the system to the north and southeast are defined by temperature and fluidchemical trends of wells and the distribution of thermal features. Elevation of the chloride spring,believed to be connected to the reservoir, is shown in Fig. 2.
A “cupola” or thimble-shaped reservoir top allowed the development of a relatively large steamcap on the east. Shallow eastern wells that produced brine early in the life of the resource later
334 J.A. Acuna et al. / Geothermics 37 (2008) 332–346
Fig. 1. Location of power plants, main roads, well pads and trajectories at the Awibengkok geothermal field. The boundaryof commercial production is shown by the dashed line. Wells used for injection are shown as dashed lines; productionwells by the bold lines. Well numbers correspond to the order in which well pads were established and individual wellswere drilled (e.g. Awi 1-1, 1-2, Awi 2-1). Only wells mentioned in the text are labeled. Light sinuous lines correspond toroads.
evolved to produce dry steam. Wells in the western sector, where the reservoir top is deeper, haveremained brine producers until today.
Sub-commercial conditions have been encountered to the south [Awi 10-2OH (OH: originalhole), Awi 14-4], northwest (Awi 12) and east (Awi 4) of the central reservoir, but reservoirboundaries remain undefined to north. Recently new geophysical surveys showed that the low-resistivity anomaly attributed to the smectite clay cap overlying the proven reservoir extended farto the north and west (Stimac et al., 2008). These areas are consequently being evaluated for theirpotential production or injection. Thus far, two delineation wells drilled to the west of the provenreservoir in 2006 have encountered relatively low temperature and permeability.
Awibengkok is a naturally fractured reservoir that exhibits large inter-well permeability despitethe fact that matrix permeability measured on core samples is orders of magnitude smaller thanfracture permeability (Stimac et al., 2008). Permeability in such complex fracture networks iscontrolled by highly connected, large fractures, while most fluid reserves are stored in smallerfractures and lower permeability matrix.
Tracer tests using thermally stable chemicals (Rose et al., 2000) have shown return times ofonly a few days for some wells (Gunderson et al., 2002). Some injection wells exhibit rapidtracer breakthrough to specific producers and, based on temperature measurements, sometimes
J.A. Acuna et al. / Geothermics 37 (2008) 332–346 335
Fig. 2. Pre-exploitation pressure gradient (dashed line) in Awibengkok as determined by UGI (1985) and the elevationof chloride spring. Also shown are the pre-exploitation temperature gradient for the hottest well in the field (Awi 9-2) inWestern Awibengkok and a typical Eastern well. These profiles show the conductive–convective contact associated to thereservoir top in both sides of the field.
only to one feed zone in those wells. The observed pressure depletion rates throughout most ofthe reservoir are similar, although some areas appear to be separated by semi-permeable barriersthat correspond primarily to zones of faulting and recent intrusion (Stimac et al., 2008). Faultsplay an important role as flow barriers perpendicular to the fault traces, but enhanced fluid flowis commonly observed parallel to the traces or at fault intersections. The interaction of thesestructural features leads to the formation of compartments not totally sealed, but separate enoughto provide distinctive well behavior. This feature has been observed in other fields, such as Tiwi(Sugiaman et al., 2004) and Bulalo (Abrigo et al., 2004), both in the Philippines.
3. Early 110 MW field development and resource management
When the first power plants were put on line in 1994, the size and characteristics of theAwibengkok reservoir were not very well constrained. A central core of production was developedaround the early discoveries provided by wells from pads Awi 7 and 8 (See Fig. 1). An injectionarea at relatively low elevation was required for the project, and Awi 9 and 10 pads were drilled atdistances between 1.5 and 1 km from the main production area for this purpose. These injectionlocations proved to have higher well temperatures than the production areas of Awi 7 and 8.Well Awi 9-1 had a deep reservoir top and modest permeability, and had to be stimulated withinjection and two acid jobs until its injectivity increased to acceptable levels. A second well,Awi 9-2, was drilled, which also found very high temperatures and modest deep permeability.Awi 10-1 was also hot and very productive while the second well, Awi 10-2OH, proved to bealmost impermeable and was later redrilled becoming Awi 10-2RD (RD: redrilled hole). A moredetailed description of the early development in Awibengkok can be found in Murray et al.(1995).
336 J.A. Acuna et al. / Geothermics 37 (2008) 332–346
Before the field started operation it was debated whether to use wells Awi 9 and 10 as producers(Murray et al., 1995), but it was decided to proceed with the original plan of utilizing them asinjectors due to financial and scheduling constraints on the project. The decision was basedprimarily on their lower elevation and deep permeability. Although it was a difficult decision asno operator would choose to inject into productive wells, it was made knowing that the effects ofinjection can often be reversed by transforming injection wells into producers later in the life ofthe resource.
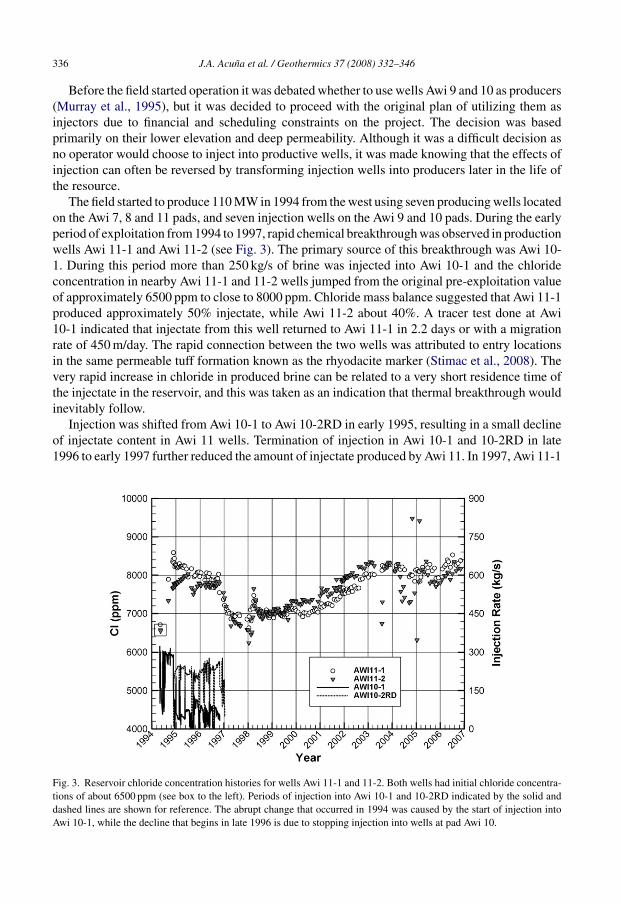
The field started to produce 110 MW in 1994 from the west using seven producing wells locatedon the Awi 7, 8 and 11 pads, and seven injection wells on the Awi 9 and 10 pads. During the earlyperiod of exploitation from 1994 to 1997, rapid chemical breakthrough was observed in productionwells Awi 11-1 and Awi 11-2 (see Fig. 3). The primary source of this breakthrough was Awi 10-1. During this period more than 250 kg/s of brine was injected into Awi 10-1 and the chlorideconcentration in nearby Awi 11-1 and 11-2 wells jumped from the original pre-exploitation valueof approximately 6500 ppm to close to 8000 ppm. Chloride mass balance suggested that Awi 11-1produced approximately 50% injectate, while Awi 11-2 about 40%. A tracer test done at Awi10-1 indicated that injectate from this well returned to Awi 11-1 in 2.2 days or with a migrationrate of 450 m/day. The rapid connection between the two wells was attributed to entry locationsin the same permeable tuff formation known as the rhyodacite marker (Stimac et al., 2008). Thevery rapid increase in chloride in produced brine can be related to a very short residence time ofthe injectate in the reservoir, and this was taken as an indication that thermal breakthrough wouldinevitably follow.
Injection was shifted from Awi 10-1 to Awi 10-2RD in early 1995, resulting in a small declineof injectate content in Awi 11 wells. Termination of injection in Awi 10-1 and 10-2RD in late1996 to early 1997 further reduced the amount of injectate produced by Awi 11. In 1997, Awi 11-1
Fig. 3. Reservoir chloride concentration histories for wells Awi 11-1 and 11-2. Both wells had initial chloride concentra-tions of about 6500 ppm (see box to the left). Periods of injection into Awi 10-1 and 10-2RD indicated by the solid anddashed lines are shown for reference. The abrupt change that occurred in 1994 was caused by the start of injection intoAwi 10-1, while the decline that begins in late 1996 is due to stopping injection into wells at pad Awi 10.
J.A. Acuna et al. / Geothermics 37 (2008) 332–346 337
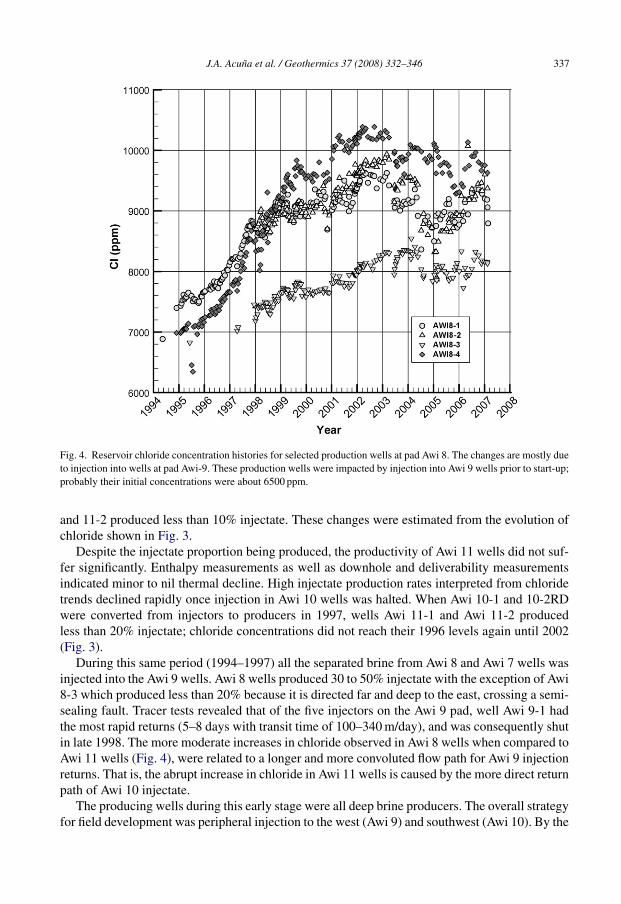
Fig. 4. Reservoir chloride concentration histories for selected production wells at pad Awi 8. The changes are mostly dueto injection into wells at pad Awi-9. These production wells were impacted by injection into Awi 9 wells prior to start-up;probably their initial concentrations were about 6500 ppm.
and 11-2 produced less than 10% injectate. These changes were estimated from the evolution ofchloride shown in Fig. 3.
Despite the injectate proportion being produced, the productivity of Awi 11 wells did not suf-fer significantly. Enthalpy measurements as well as downhole and deliverability measurementsindicated minor to nil thermal decline. High injectate production rates interpreted from chloridetrends declined rapidly once injection in Awi 10 wells was halted. When Awi 10-1 and 10-2RDwere converted from injectors to producers in 1997, wells Awi 11-1 and Awi 11-2 producedless than 20% injectate; chloride concentrations did not reach their 1996 levels again until 2002(Fig. 3).
During this same period (1994–1997) all the separated brine from Awi 8 and Awi 7 wells wasinjected into the Awi 9 wells. Awi 8 wells produced 30 to 50% injectate with the exception of Awi8-3 which produced less than 20% because it is directed far and deep to the east, crossing a semi-sealing fault. Tracer tests revealed that of the five injectors on the Awi 9 pad, well Awi 9-1 hadthe most rapid returns (5–8 days with transit time of 100–340 m/day), and was consequently shutin late 1998. The more moderate increases in chloride observed in Awi 8 wells when compared toAwi 11 wells (Fig. 4), were related to a longer and more convoluted flow path for Awi 9 injectionreturns. That is, the abrupt increase in chloride in Awi 11 wells is caused by the more direct returnpath of Awi 10 injectate.
The producing wells during this early stage were all deep brine producers. The overall strategyfor field development was peripheral injection to the west (Awi 9) and southwest (Awi 10). By the
338 J.A. Acuna et al. / Geothermics 37 (2008) 332–346
end of 1997 the deep producers at Awi 7 and 8 had not shown any sign of thermal deteriorationdue to injection into Awi 9 wells, even though the percentage of injectate they produced washigh based on chloride mass balance calculations. Since a major field expansion to the east wasunderway, it was decided not to invest in reconfiguring the western injection system at that time.In retrospect it seems that injecting in the hottest portion of the reservoir, albeit not planned inthis case, provided some benefits from the point of view of heat recovery as it allowed the colderinjectate to extract additional heat from the reservoir rocks as compared to injecting into a coldermarginal area.
Microseismic monitoring showed that a dense cloud of remarkably deep events was related toAwi 9 injection (Stimac et al., 2008). These events suggest pressure communication extendedwell below the drilled depth. Whether this implies that some limited volume of injectatecirculates and extracts heat along deep flowpaths is still open to debate. In spite of this uncer-tainty, there was a keen awareness that the area of production could be expanded significantlyif alternative injection locations could be identified and developed. However, as describedbelow, shuttling injection among the available edge-field locations to minimize its impactsproved to be the prevailing short-term injection management strategy as field expansion wasimplemented.
4. Field expansion and development of steam cap
By late 1997 the installed capacity of Awibengkok was expanded to 330 MWe by drilling 24production and 12 injection wells in 28 months. The additional steam capacity was developedfrom three well pads (Awi 1, 13 and 16) in the eastern part of the field that were sited to exploitthe shallow reservoir top there. Injection was accommodated with two new pads (Awi 14 and 15),and the use of Awi 2, 3, and 4 on the field edges. More details regarding field expansion and thenew operating configuration can be found in Soeparjadi et al. (1998).
The field was only operated in this new configuration for a short time before a financial crisisrocked Indonesia, forcing several new geothermal projects to halt development due to reducedpower consumption. As economic conditions slowly returned to normal, renegotiation of theSalak operating contract with the government of Indonesia allowed for an increase in electricitygeneration from the existing plants. As a result of the new contract terms, the field has beenoperated at a target of 377 MWe since 2002, taking advantage of the larger capacity of the unitsalready installed. Obtaining and maintaining steam supply for the higher generation capacityrequired make-up drilling campaigns in 2002, 2004 and 2006.
Some innovations were incorporated into the expansion and make-up drilling programs thatultimately reduced the cost of steam produced. It was recognized from testing of the early wellscompleted with 9 5
8 in. production casing that larger wellbore diameters would result in higherflowrates (Noor et al., 1992; Murray et al., 1995). Consequently wells drilled from Awi 10-1onward were completed with 13 3
8 in. production casings and 13 38 in. or 16 in. tie-backs, and this
resulted in initial production rates of up to 30 MWe for some wells.Unstable formations containing swelling clays proved to be a problem in the shallow reservoir,
resulting in a high number of stuck pipe incidents in early wells (Stimac et al., 2008). Mapping andcorrelation of the clayey units based on drill-cuttings and wellbore image logs allowed drillingprograms to be tailored to case off the most problematic layers shortly after they were drilled.Drilling with aerated polymer mud rather than brine reduced fluid losses, the need to cementshallow loss zones, and formation exposure time and reactivity, thus further alleviating the severityof formation sloughing and collapse.
J.A. Acuna et al. / Geothermics 37 (2008) 332–346 339
Well design technology also evolved with changing well targeting requirements. Long-reachwells, with bottomhole locations up to 1.6 km from the wellhead were used to delineate reservoirmargins (Awi 9-6 and 14-4). More recently low-angle trajectories were successfully implementedon several wells in order to maximize the number of fractures encountered within the shallowsteam cap. Awi 16-7 drilled in 2006 reached a deviation angle of ∼60◦. This well produces morethan 40 kg/s of steam without penetrating beneath the liquid level of the reservoir.
Reservoir permeability has proven to be quite variable, resulting in a relatively high rate ofnon-commercial penetrations within the proven reservoir area. Many penetrations have beenplugged and redrilled to more permeable zones. This has led to an increasing effort to improvethe methodology to target wells.
4.1. Well deliverability trends
Due to the shallower reservoir top in the eastern part of the Awibengkok field, it was expecteda steam cap would develop and wells in that area would have high steam rates and lower brinere-injection requirements similar to what was experienced in the western Tiwi field (Sugiamanet al., 2004). Reservoir pressure and enthalpy monitoring has confirmed that the steam cap hassteadily expanded with time. Starting in 1994 the steam–water interface dropped from 560 mabove sea level to sea level. The rate of descent increased dramatically after late 1997–early 1998when Units 4–6 started operation. As the water level has declined, the area of the steam cap hasexpanded to include some well-feed zones in the Awi 3, 7, 8, 10 and 11 locations.
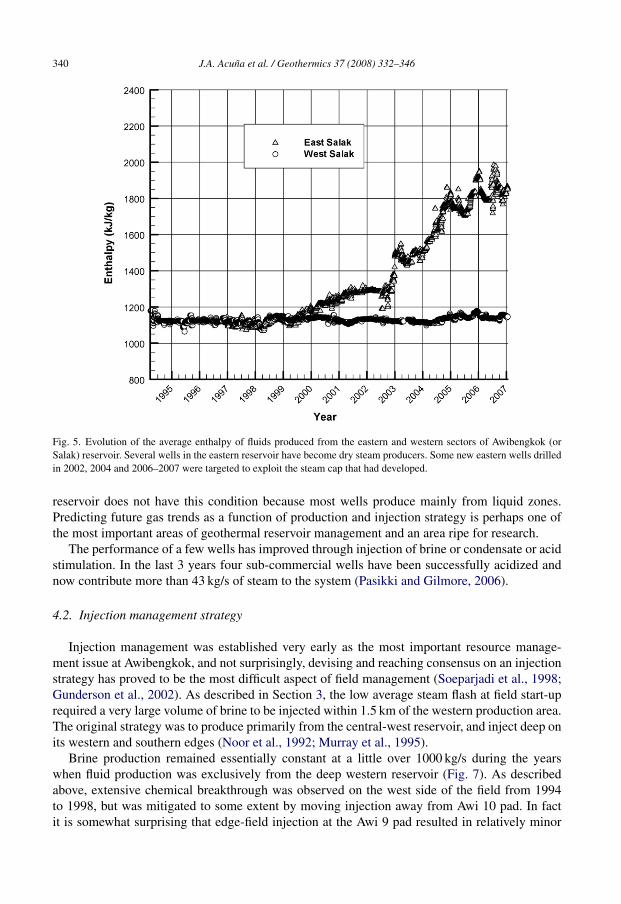
The evolution of the average enthalpy for eastern and western wells is shown in Fig. 5. As thesteam cap expanded to include shallow feed zones of wells that were initially producing liquid,excess steam increased and dry steam production expanded. By 2002 the eastern side of the fieldhad three dry steam producers and many more wells producing fluids with enthalpies intermediatebetween liquid and steam.
Predicting the timing of enthalpy and deliverability changes of wells transitioning from liquidto steam proved to be a challenging task. Many wells did not evolve entirely into dry steam butshowed an increased enthalpy due to steam production in their shallow feed zones, while theirdeep zones remained liquid. This typically resulted in a net productivity increase for these wells,rendering conventional decline-curve analysis inappropriate.
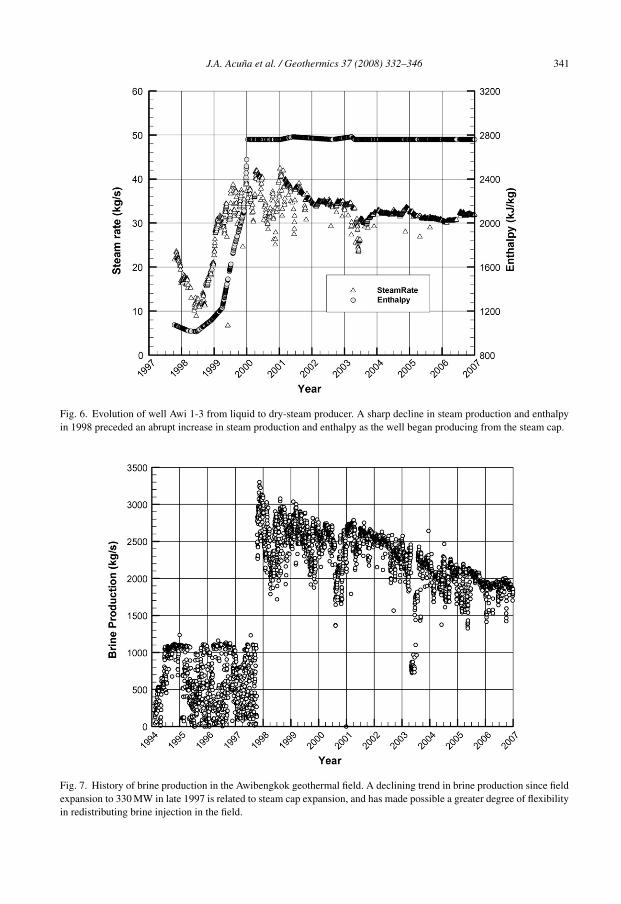
A technique was developed to combine reservoir pressure and enthalpy of individual feedzones, with wellbore simulation to construct hydraulic models for each well. The techniquemade it possible to calibrate individual wells to their historic deliverability changes and then usethe calibrated models to predict the change in well deliverability for given reservoir pressure andenthalpy trends (Acuna, 2003). This technique is currently used to match historic well performanceand make short-term steam predictions. Fig. 6 shows the steam production and enthalpy evolutionof Awi 1-3, which is typical of wells that evolve into dry-steam producers.
As a consequence of the development of the steam cap in the eastern reservoir, several newmake up wells were targeted to shallow depths in that part of the Awibengkok field in order toexploit this new thermodynamic condition. This resulted in prolific dry steam wells drilled at arelatively low cost. The average enthalpy of the eastern reservoir has continued to increase throughdrilling campaigns in 2002, 2004, and 2006–2007 as shown in Fig. 5.
Increased production from the shallow steam zone has led to an increase in non-condensablegas (NCG) concentration in the steam. The concentration of NCG in the produced steam has risenwith time and has periodically exceeded plant-handling capabilities on the eastern side of thefield. Units 4–6 have therefore been upgraded to handle larger NGC concentrations. The western
340 J.A. Acuna et al. / Geothermics 37 (2008) 332–346
Fig. 5. Evolution of the average enthalpy of fluids produced from the eastern and western sectors of Awibengkok (orSalak) reservoir. Several wells in the eastern reservoir have become dry steam producers. Some new eastern wells drilledin 2002, 2004 and 2006–2007 were targeted to exploit the steam cap that had developed.
reservoir does not have this condition because most wells produce mainly from liquid zones.Predicting future gas trends as a function of production and injection strategy is perhaps one ofthe most important areas of geothermal reservoir management and an area ripe for research.
The performance of a few wells has improved through injection of brine or condensate or acidstimulation. In the last 3 years four sub-commercial wells have been successfully acidized andnow contribute more than 43 kg/s of steam to the system (Pasikki and Gilmore, 2006).
4.2. Injection management strategy
Injection management was established very early as the most important resource manage-ment issue at Awibengkok, and not surprisingly, devising and reaching consensus on an injectionstrategy has proved to be the most difficult aspect of field management (Soeparjadi et al., 1998;Gunderson et al., 2002). As described in Section 3, the low average steam flash at field start-uprequired a very large volume of brine to be injected within 1.5 km of the western production area.The original strategy was to produce primarily from the central-west reservoir, and inject deep onits western and southern edges (Noor et al., 1992; Murray et al., 1995).
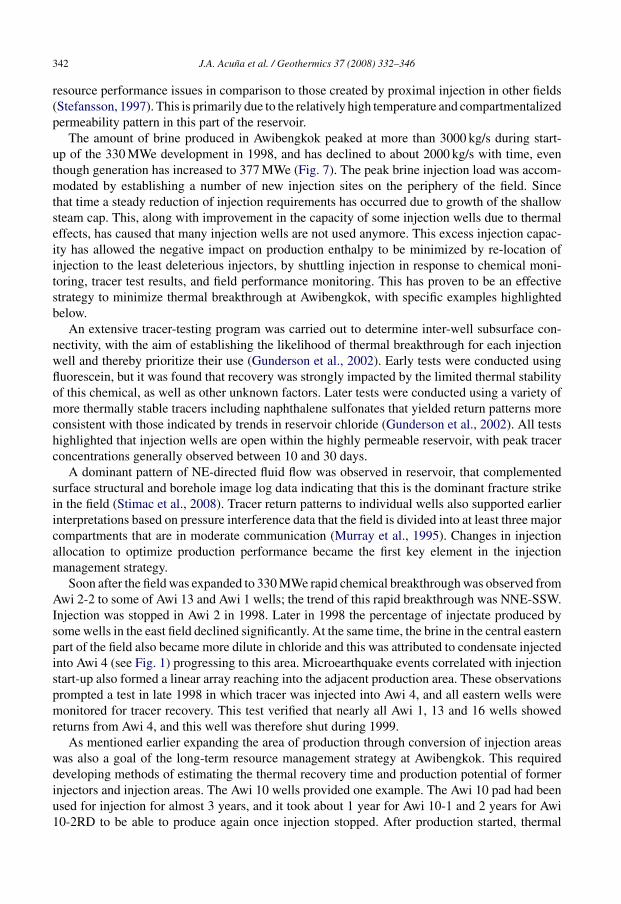
Brine production remained essentially constant at a little over 1000 kg/s during the yearswhen fluid production was exclusively from the deep western reservoir (Fig. 7). As describedabove, extensive chemical breakthrough was observed on the west side of the field from 1994to 1998, but was mitigated to some extent by moving injection away from Awi 10 pad. In factit is somewhat surprising that edge-field injection at the Awi 9 pad resulted in relatively minor
J.A. Acuna et al. / Geothermics 37 (2008) 332–346 341
Fig. 6. Evolution of well Awi 1-3 from liquid to dry-steam producer. A sharp decline in steam production and enthalpyin 1998 preceded an abrupt increase in steam production and enthalpy as the well began producing from the steam cap.
Fig. 7. History of brine production in the Awibengkok geothermal field. A declining trend in brine production since fieldexpansion to 330 MW in late 1997 is related to steam cap expansion, and has made possible a greater degree of flexibilityin redistributing brine injection in the field.
342 J.A. Acuna et al. / Geothermics 37 (2008) 332–346
resource performance issues in comparison to those created by proximal injection in other fields(Stefansson, 1997). This is primarily due to the relatively high temperature and compartmentalizedpermeability pattern in this part of the reservoir.
The amount of brine produced in Awibengkok peaked at more than 3000 kg/s during start-up of the 330 MWe development in 1998, and has declined to about 2000 kg/s with time, eventhough generation has increased to 377 MWe (Fig. 7). The peak brine injection load was accom-modated by establishing a number of new injection sites on the periphery of the field. Sincethat time a steady reduction of injection requirements has occurred due to growth of the shallowsteam cap. This, along with improvement in the capacity of some injection wells due to thermaleffects, has caused that many injection wells are not used anymore. This excess injection capac-ity has allowed the negative impact on production enthalpy to be minimized by re-location ofinjection to the least deleterious injectors, by shuttling injection in response to chemical moni-toring, tracer test results, and field performance monitoring. This has proven to be an effectivestrategy to minimize thermal breakthrough at Awibengkok, with specific examples highlightedbelow.
An extensive tracer-testing program was carried out to determine inter-well subsurface con-nectivity, with the aim of establishing the likelihood of thermal breakthrough for each injectionwell and thereby prioritize their use (Gunderson et al., 2002). Early tests were conducted usingfluorescein, but it was found that recovery was strongly impacted by the limited thermal stabilityof this chemical, as well as other unknown factors. Later tests were conducted using a variety ofmore thermally stable tracers including naphthalene sulfonates that yielded return patterns moreconsistent with those indicated by trends in reservoir chloride (Gunderson et al., 2002). All testshighlighted that injection wells are open within the highly permeable reservoir, with peak tracerconcentrations generally observed between 10 and 30 days.
A dominant pattern of NE-directed fluid flow was observed in reservoir, that complementedsurface structural and borehole image log data indicating that this is the dominant fracture strikein the field (Stimac et al., 2008). Tracer return patterns to individual wells also supported earlierinterpretations based on pressure interference data that the field is divided into at least three majorcompartments that are in moderate communication (Murray et al., 1995). Changes in injectionallocation to optimize production performance became the first key element in the injectionmanagement strategy.
Soon after the field was expanded to 330 MWe rapid chemical breakthrough was observed fromAwi 2-2 to some of Awi 13 and Awi 1 wells; the trend of this rapid breakthrough was NNE-SSW.Injection was stopped in Awi 2 in 1998. Later in 1998 the percentage of injectate produced bysome wells in the east field declined significantly. At the same time, the brine in the central easternpart of the field also became more dilute in chloride and this was attributed to condensate injectedinto Awi 4 (see Fig. 1) progressing to this area. Microearthquake events correlated with injectionstart-up also formed a linear array reaching into the adjacent production area. These observationsprompted a test in late 1998 in which tracer was injected into Awi 4, and all eastern wells weremonitored for tracer recovery. This test verified that nearly all Awi 1, 13 and 16 wells showedreturns from Awi 4, and this well was therefore shut during 1999.
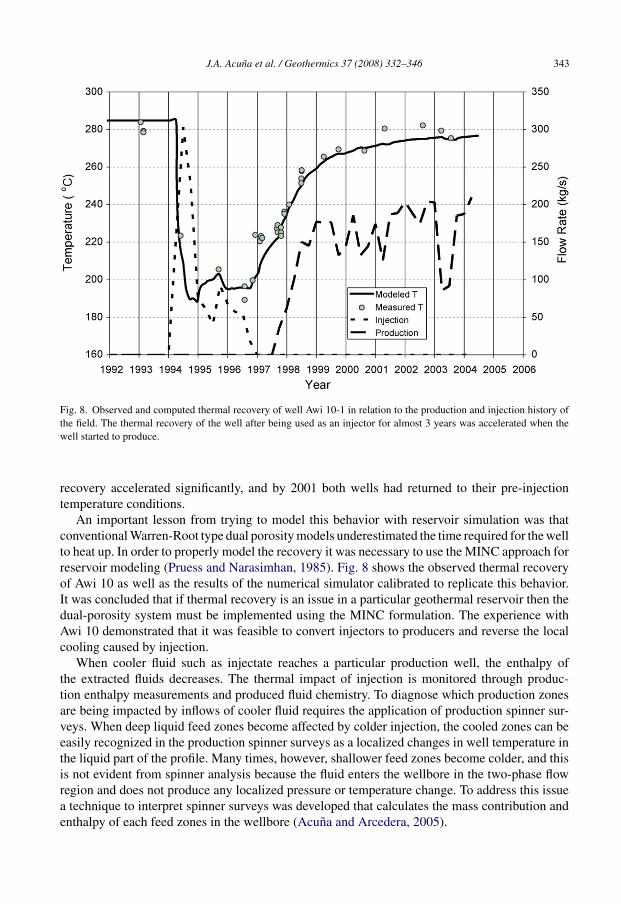
As mentioned earlier expanding the area of production through conversion of injection areaswas also a goal of the long-term resource management strategy at Awibengkok. This requireddeveloping methods of estimating the thermal recovery time and production potential of formerinjectors and injection areas. The Awi 10 wells provided one example. The Awi 10 pad had beenused for injection for almost 3 years, and it took about 1 year for Awi 10-1 and 2 years for Awi10-2RD to be able to produce again once injection stopped. After production started, thermal
J.A. Acuna et al. / Geothermics 37 (2008) 332–346 343
Fig. 8. Observed and computed thermal recovery of well Awi 10-1 in relation to the production and injection history ofthe field. The thermal recovery of the well after being used as an injector for almost 3 years was accelerated when thewell started to produce.
recovery accelerated significantly, and by 2001 both wells had returned to their pre-injectiontemperature conditions.
An important lesson from trying to model this behavior with reservoir simulation was thatconventional Warren-Root type dual porosity models underestimated the time required for the wellto heat up. In order to properly model the recovery it was necessary to use the MINC approach forreservoir modeling (Pruess and Narasimhan, 1985). Fig. 8 shows the observed thermal recoveryof Awi 10 as well as the results of the numerical simulator calibrated to replicate this behavior.It was concluded that if thermal recovery is an issue in a particular geothermal reservoir then thedual-porosity system must be implemented using the MINC formulation. The experience withAwi 10 demonstrated that it was feasible to convert injectors to producers and reverse the localcooling caused by injection.
When cooler fluid such as injectate reaches a particular production well, the enthalpy ofthe extracted fluids decreases. The thermal impact of injection is monitored through produc-tion enthalpy measurements and produced fluid chemistry. To diagnose which production zonesare being impacted by inflows of cooler fluid requires the application of production spinner sur-veys. When deep liquid feed zones become affected by colder injection, the cooled zones can beeasily recognized in the production spinner surveys as a localized changes in well temperature inthe liquid part of the profile. Many times, however, shallower feed zones become colder, and thisis not evident from spinner analysis because the fluid enters the wellbore in the two-phase flowregion and does not produce any localized pressure or temperature change. To address this issuea technique to interpret spinner surveys was developed that calculates the mass contribution andenthalpy of each feed zones in the wellbore (Acuna and Arcedera, 2005).
344 J.A. Acuna et al. / Geothermics 37 (2008) 332–346
The presence of a liquid zone under saturated conditions that separates the steam cap from theliquid reservoir has been documented at Awibengkok (Acuna, 2005). Feed zones located in thisboiling region decline in temperature and enthalpy when there is reservoir pressure drawdownas long as they are below the steam–liquid contact at the top of the boiling zone. These zoneseventually evolved into dry steam zones when the steam–liquid contact gets below them as itdrops with time. In the past few years, however, as the steam–liquid contact moved closer to thelevel of brine injection, this process was suppressed by the dominance of cooler injectate in themajor fractures. In this case the feed zone does not evolve to dry steam but continues decliningin temperature and enthalpy due to the prevalence of cooler injectate. The steam–liquid contactdrops very slowly or nor at all. The presence of colder fluids at the boiling level can sometimesbe seen in temperature profiles as a departure from boiling conditions at a depth close to thesteam–liquid interface. Flowing spinner logs and the technique described above can also be usedto detect these colder feed zones.
Despite significant effort to minimize the negative impacts of injection, chemical and thermalbreakthrough still threaten numerous production wells and reduce make-up drilling options. WellsAwi 1-2, 13-5 and 1-7 continue to produce a high percentage of injectate due to injection at the Awi14 pad based on correlations between changes in produced chloride and injection rates. Injectionat the Awi 15 pad could have been keeping the percent injectate at Awi 13-4 and 13-1 high aftertermination of injection into Awi 2-2. This prompted the idea of reducing injection at this pad, achange that was implemented gradually between 2005 and 2006.
In the western reservoir, wells Awi 10 and 11 seem to be the least affected by injection (i.e.they produce between 0 and 20% injectate) even though they are flanked by injectors Awi 9 and15. Here, higher reservoir pressure drawdown has been observed which is consistent with morelimited pressure support from injection than in surrounding areas. This counterintuitive behavioris attributed to the compartmentalized nature of the reservoir.
Awi 7-1, 8-1, 8-2, 8-4 and 8-5 have produced between 40 and 55% injectate from Awi 9 wellssince early production. Thermal degradation in these deep wells is clearly taking place althoughproduction declines have been minimal due to the high-pressure support they receive. Phasingout injection at Awi 9 therefore has remained a high long-term priority due to its proximity tothese wells and its own production potential, but awaits results of ongoing efforts to identify aneconomically viable alternative (Stimac et al., 2008).
5. Recovery of injection areas for production
The capacity of most Awibengkok injection wells has increased with time as a result of reservoirpressure drawdown as well as permeability increases attributed to thermal effects due to coolingof near wellbore area. After having reduced the adverse impacts of injection as much as possible,and recognizing that significant thermal decline is still occurring through use of the currentlyavailable injection sites, efforts are shifting to evaluate the far western and southeastern marginsof the field for deeper or more distant injection zones (Stimac et al., 2008).
The recovery of injection areas for production offers the promise of improving the performanceof nearby producers and obtaining additional steam at very low cost by using converted injectionwells for production. The feasibility of changing former injectors into producers was proven withwells Awi 10-1 and 10-2RD in 1998. This success was followed by the conversion of Awi 3injectors in 2004; these wells were clearly connected to the steam cap, and therefore capableof production immediately after stopping injection at this location. Awi 3-3 has been one of thelargest steam producers in the field since then. Phasing out injection at Awi 15 by moving virtually
J.A. Acuna et al. / Geothermics 37 (2008) 332–346 345
all remaining eastern injection to Awi 14 in 2006, has led to improved performance in some nearbywells with deep feed zones. An increase in the temperature of Awi 2 sufficient to make the wellproductive may be due the result of stopping nearby injection.
A reduction in the injection flow rate at the Awi 9 pad and shifting of a significant fractionof the total injection to Awi 9-6, a deep well drilled to the far west, has led to some temperaturerecovery in Awi 9-1. During late 2006, Awi 9-1 was tested and shown to sustain production atcommercial rates, providing additional evidence that thermal recovery of the area is possible.
6. Discussion and conclusions
Awibengkok is a geothermal field that was developed in stages with incomplete knowledgeof the resource size and characteristics. Extensive drilling, reservoir monitoring and field testinghave gradually led to a clearer understanding of the reservoir and its response to production, andof critical resource management issues. Numerical simulation has been used by integrating most-likely, pessimistic and optimistic models (Acuna et al., 2002) to evaluate alternative developmentopportunities and injection and production scenarios. Monitoring programs and reservoir simula-tion have been used successfully to improve and refine the initial reservoir exploitation strategy,while making the best of the well configuration available at any given time. Improvements inprediction of field performance and drilling efficiency have been driven by technical innovationand process improvement.
Maintaining a balance between pressure support and thermal breakthrough has been, and willcontinue to be critical to the successful management of the Awibengkok field. Current efforts arefocused on the long-term plan of relocating injection to deeper or more distal locations along thefield margins, in order to expand the current area of commercial production and stimulate steamcap expansion. This strategy has been determined to be the most economic means of maintainingthe current generation capacity as it will expand the area available for production, lead to growthof the steam cap and lower overall steam capacity decline rates. Challenges remain in identifyingalternative injection locations, anticipating changes in the production field that major changes inthe injection configuration will create, and modifying the current field facilities at an acceptablecost.
Acknowledgements
We thank Chevron Geothermal Indonesia for permitting us to publish this work. We are gratefulto Dave Rohrs of Chevron for providing helpful comments on the preliminary manuscript. SabodhGarg and Keshav Goyal are thanked for reviews that substantially improved the final paper.
References
Abrigo, M.F., Molling, P., Acuna, J.A., 2004. Determination of recharge and cooling rates using geochemical constraintsat the Mak-Ban (Bulalo) geothermal reservoir, Philippines. Geothermics 33, 11–36.
Acuna, J., Parini, M., Urmeneta, N., 2002. Using a Large Reservoir Model in the Probabilistic Assessment of Field Man-agement Strategies. In: Proceedings of the 27th Workshop on Geothermal Reservoir Engineering, Stanford University,Stanford, CA, USA, pp. 8–13.
Acuna, J., 2003. Integrating wellbore modeling and production history to understand well behavior. In: Proceedings ofthe 28th Workshop on Geothermal Reservoir Engineering, Stanford University, Stanford, CA, USA, pp. 16–20.
Acuna, J., 2005. Salak Engineering Studies. Part 2. Awibengkok Cooling and Boiling Zone Behavior. Unpublished Unocalreport, August 2005, 21 pp.
346 J.A. Acuna et al. / Geothermics 37 (2008) 332–346
Acuna, J., Arcedera, B., 2005. Two-phase flow behavior and spinner data analysis in geothermal wells. In: Proceedings2005 World Geothermal Congress, Antalya, Turkey, p. 6 (paper 1152).
Gunderson, R., Parini, M., Sirad-Azwar, L., 2002. Fluorescein and naphthalene sulfonate liquid tracer results at theAwibengkok geothermal field, Indonesia. In: Proceedings of the 27th Workshop on Geothermal Reservoir Engineering,Stanford University, Stanford, CA, USA, pp. 53–58.
Hoang, V., Alamsyah, O., Roberts, J.W., 2005. Darajat geothermal field expansion—A probabilistic forecast. In: Proceed-ings World Geothermal Congress 2005, Antalya, Turkey, (paper 1153).
Murray, L.E., Rohrs, D.T., Rossknecht, T.G., Aryawijaya, R., Pudyastuti, K., 1995. Resource evaluation and developmentstrategy, Awibengkok field. In: Proceedings 1995 World Geothermal Congress, Florence, Italy, pp. 1525–1529.
Noor, A.J., Rossknect, T.G., Ginting, A., 1992. An overview of the Awibengkok geothermal field. In: Proceedings of the21st Annual Convention of the Indonesian Petroleum Association, pp. 597–604.
Pasikki, R.G., Gilmore, T.G., 2006. Coiled tubing acid stimulation: the case of Awi 8-7 production well in Salak geothermalfield, Indonesia. In: Proceedings of the 31st Workshop on Geothermal Reservoir Engineering, Stanford University,Stanford, CA, USA, pp. 308–314.
Pruess, K., Narasimhan, T.N., 1985. A practical method for modeling fluid and heat flow in fractured porous media. Soc.Pet. Eng. J. 25, 14–26.
Rose, P., Benoit, D., Goo Lee, S., Tandia, B., Kilbourn, P., 2000. Testing the naphthalene sulfonates as geothermal tracers atDixie Valley, Ohaaki, and Awibengkok. In: Proceedings of the 25th Workshop on Geothermal Reservoir Engineering,Stanford University, Stanford, CA, USA, pp. 36–42.
Soeparjadi, R., Horton, G.D., Wendt, B.E., 1998. A review of the Gunung Salak geothermal expansion project. In:Proceedings of the 20th New Zealand Geothermal Workshop, University of Auckland, Auckland, New Zealand, pp.153–158.
Stefansson, V., 1997. Geothermal reinjection experience. Geothermics 26, 99–139.Stimac, J., Nordquist, G., Suminar, A., Sirad-Azwar, L., 2008. An overview of the Awibengkok geothermal system,
Indonesia. Geothermics, this issue.Sugiaman, F., Sunio, E., Molling, P., Stimac, J., 2004. Geochemical response to production of the Tiwi geothermal field,
Philippines. Geothermics 33, 57–86.UGI Union Geothermal of Indonesia, Ltd., 1985. Awibengkok Project Resource Feasibility Report. Unpublished Unocal
report, February 1985, 265 pp.
Related Documents