Kumar et al. Geosci. Lett. (2017) 4:13 DOI 10.1186/s40562-017-0079-2 RESEARCH LETTER A meteor shockwave event recorded at seismic and infrasound stations in northern Taiwan Utpal Kumar 1,2,3* , Benjamin F. Chao 2 , Yikai Hsieh 2,4 and Emmy T. Y. Chang 5 Abstract Three mysterious explosion sounds were heard in the coastal towns of Tamsui, west of Taipei in northern Taiwan, in the early evening of December 5, 2013. The event left clear signals that are identified in the recordings of 12 regional seismometers and 3 infrasound sensors and processed by means of travel time analysis. The apparent velocity of ~330 m/s of the signals confirms that the energy transmission was through the atmosphere, and the characteristics of the waveforms suggest the meteor-generated shockwaves. We use the graphical method as well as the Genetic Algorithm optimization approach to constrain the trajectory of the meteor and to locate its projected intercept with the ground—(25.33 N, 121.26 E), approximately 20 km off the coast of Tamsui. The trajectory has azimuth (measured from north in a map view in the clockwise direction) of 303° and (near-vertical) elevation angle of 70°. From the observed period of 1.3 s at the maximum amplitude of the infrasound signal, we estimate by conventional scaling law that the meteor in question had impact energy on the order of 5 × 10 10 J (equivalent to an earthquake of local magnitude 4) or roughly a size of ~0.5 m across. Keywords: Meteor, Shockwave, Seismogram, Infrasound, Trajectory, Genetic Algorithm © The Author(s) 2017. This article is distributed under the terms of the Creative Commons Attribution 4.0 International License (http://creativecommons.org/licenses/by/4.0/), which permits unrestricted use, distribution, and reproduction in any medium, provided you give appropriate credit to the original author(s) and the source, provide a link to the Creative Commons license, and indicate if changes were made. Background e people of Tamsui, a town along the western coast of Taipei city in northern Taiwan, heard up to three thun- derous explosion sounds in quick succession on the evening of December 5, 2013. e source of the sounds remained unidentified, despite hours of search and inspection by the local officials; no military exercise was taken according to the news media. No investigation— or otherwise—has been reported since then. e event, thus, remained unexplained. We propose a scenario of an incoming train of mete- ors moving at supersonic speed through the atmosphere, consequently creating a succession of loud sonic booms. We based our deduction of the meteoric manifesta- tion on the similar scenario reported in numerous past works, studied with distinct instrument-based approach: ground-based video cameras (Spurný 1994; Kinoshita et al. 1999; Borovička et al. 2003), seismic and infrasound records (Brown et al. 2002, 2003; Ishihara et al. 2003, 2004; Pujol et al. 2005, 2006; Yamada and Mori 2012), and satellite-based optical instruments (Nemtchinov et al. 1997; Brown et al. 2002). Incoming meteor events are incessant, but it is inci- dental to capture one with the adequate amount of sci- entific data, which, if happens, offer a rare opportunity to reconstruct and better understand the event. In this study, we utilize the arrival time data from dense and diverse geophysical monitoring instruments deployed in Taiwan to estimate the trajectory of the meteor. We apply a graphical scheme based on Pujol et al. (2005), as well as an optimization by means of a highly effective and reli- able Genetic Algorithm (Houck et al. 1996; Sexton and Dorsey 2000) to invert for the 3D meteor trajectory. Methods Data characteristics e broadband seismograms are obtained from the Broadband Array in Taiwan for Seismology (BATS; Kao Open Access *Correspondence: [email protected] 2 Institute of Earth Sciences, Academia Sinica, 128, Sec. 2, Academia Road, Nangang, Taipei 11529, Taiwan Full list of author information is available at the end of the article

Welcome message from author
This document is posted to help you gain knowledge. Please leave a comment to let me know what you think about it! Share it to your friends and learn new things together.
Transcript
Kumar et al. Geosci. Lett. (2017) 4:13 DOI 10.1186/s40562-017-0079-2
RESEARCH LETTER
A meteor shockwave event recorded at seismic and infrasound stations in northern TaiwanUtpal Kumar1,2,3* , Benjamin F. Chao2, Yikai Hsieh2,4 and Emmy T. Y. Chang5
Abstract
Three mysterious explosion sounds were heard in the coastal towns of Tamsui, west of Taipei in northern Taiwan, in the early evening of December 5, 2013. The event left clear signals that are identified in the recordings of 12 regional seismometers and 3 infrasound sensors and processed by means of travel time analysis. The apparent velocity of ~330 m/s of the signals confirms that the energy transmission was through the atmosphere, and the characteristics of the waveforms suggest the meteor-generated shockwaves. We use the graphical method as well as the Genetic Algorithm optimization approach to constrain the trajectory of the meteor and to locate its projected intercept with the ground—(25.33 N, 121.26 E), approximately 20 km off the coast of Tamsui. The trajectory has azimuth (measured from north in a map view in the clockwise direction) of 303° and (near-vertical) elevation angle of 70°. From the observed period of 1.3 s at the maximum amplitude of the infrasound signal, we estimate by conventional scaling law that the meteor in question had impact energy on the order of 5 × 10¹⁰ J (equivalent to an earthquake of local magnitude 4) or roughly a size of ~0.5 m across.
Keywords: Meteor, Shockwave, Seismogram, Infrasound, Trajectory, Genetic Algorithm
© The Author(s) 2017. This article is distributed under the terms of the Creative Commons Attribution 4.0 International License (http://creativecommons.org/licenses/by/4.0/), which permits unrestricted use, distribution, and reproduction in any medium, provided you give appropriate credit to the original author(s) and the source, provide a link to the Creative Commons license, and indicate if changes were made.
BackgroundThe people of Tamsui, a town along the western coast of Taipei city in northern Taiwan, heard up to three thun-derous explosion sounds in quick succession on the evening of December 5, 2013. The source of the sounds remained unidentified, despite hours of search and inspection by the local officials; no military exercise was taken according to the news media. No investigation—or otherwise—has been reported since then. The event, thus, remained unexplained.
We propose a scenario of an incoming train of mete-ors moving at supersonic speed through the atmosphere, consequently creating a succession of loud sonic booms. We based our deduction of the meteoric manifesta-tion on the similar scenario reported in numerous past works, studied with distinct instrument-based approach: ground-based video cameras (Spurný 1994; Kinoshita
et al. 1999; Borovička et al. 2003), seismic and infrasound records (Brown et al. 2002, 2003; Ishihara et al. 2003, 2004; Pujol et al. 2005, 2006; Yamada and Mori 2012), and satellite-based optical instruments (Nemtchinov et al. 1997; Brown et al. 2002).
Incoming meteor events are incessant, but it is inci-dental to capture one with the adequate amount of sci-entific data, which, if happens, offer a rare opportunity to reconstruct and better understand the event. In this study, we utilize the arrival time data from dense and diverse geophysical monitoring instruments deployed in Taiwan to estimate the trajectory of the meteor. We apply a graphical scheme based on Pujol et al. (2005), as well as an optimization by means of a highly effective and reli-able Genetic Algorithm (Houck et al. 1996; Sexton and Dorsey 2000) to invert for the 3D meteor trajectory.
MethodsData characteristicsThe broadband seismograms are obtained from the Broadband Array in Taiwan for Seismology (BATS; Kao
Open Access
*Correspondence: [email protected] 2 Institute of Earth Sciences, Academia Sinica, 128, Sec. 2, Academia Road, Nangang, Taipei 11529, TaiwanFull list of author information is available at the end of the article

Page 2 of 8Kumar et al. Geosci. Lett. (2017) 4:13
and Jian 2001)—an island-wide seismic network deployed by the Institute of Earth Sciences (IES) of the Academia Sinica and the Central Weather Bureau (CWB; Shin et al. 2013) of Taiwan. The infrasound records are obtained from the three sensors (Model 21 Chaparral Physics1), deployed in a campaign mode by IES during the relevant time. Figure 1 shows the location of the used seismic and infrasound stations; only those of high signal-to-noise ratio (SNR) are adopted in this study.
The broadband seismometers, equipped with a sym-metric triaxial force feedback sensor designed with a flat sensitivity to ground velocity from 0.02 to 100 Hz, can efficiently detect ground motions. The infrasound instru-ment, with the nominal sensitivity of 0.4–2.0 volts/Pa at 1 Hz (90–18 Pa full-scale range) and frequency response between 0.1 and 200 Hz, records signals that span the low audio/infrasound boundary ranging from explosions to avalanches.
The shockwave records, retrieved from 12 seismic and 3 infrasound stations in northernmost Taiwan (Fig. 1), have the sufficiently high signal-to-noise ratio (SNR > 4) as judged from the records within the windows of 4-s length after and before the first emergence. In other parts of the island, seismic stations of the array have relatively low shockwave signal strengths and hence were not used.
Data processing and event recognitionWe produce the time–frequency wavelet spectrograms (using the real-valued Morlet wavelet; Morlet et al. 1982; Chao et al. 2014) of all our seismograms for the frequency range of 0.1–25 Hz. The wavelet spectrogram is effec-tive and robust for detecting and characterizing moder-ate to high-SNR signals in a time series and capable of revealing non-stationary periodicities (Chao et al. 2014). We filter the data within a band-pass frequency range of 5–25 Hz to reduce the acausal peak signals along the time series. Figure 2a, c shows the record (filtered as well as unfiltered) of co-located seismic and infrasound sta-tion SXI1, and Fig. 2b, d plots the corresponding wavelet spectrogram.
The filtered time series waveforms at all the stations are plotted in Fig. 3 lined up with the distances from the intercept of the protracted trajectory with the ground surface (hereafter called termination point; calculated below using the inversion). The shockwave signal mani-fests the characteristic “N” shape in infrasound records and reversed “N” shape in seismic records (Ishihara et al. 2003; Langston 2004; Pujol et al. 2005), which we identify in dilated waveform record at each station in Fig. 4.
1 http://www.chaparralphysics.com/manuals/model21manual.pdf.
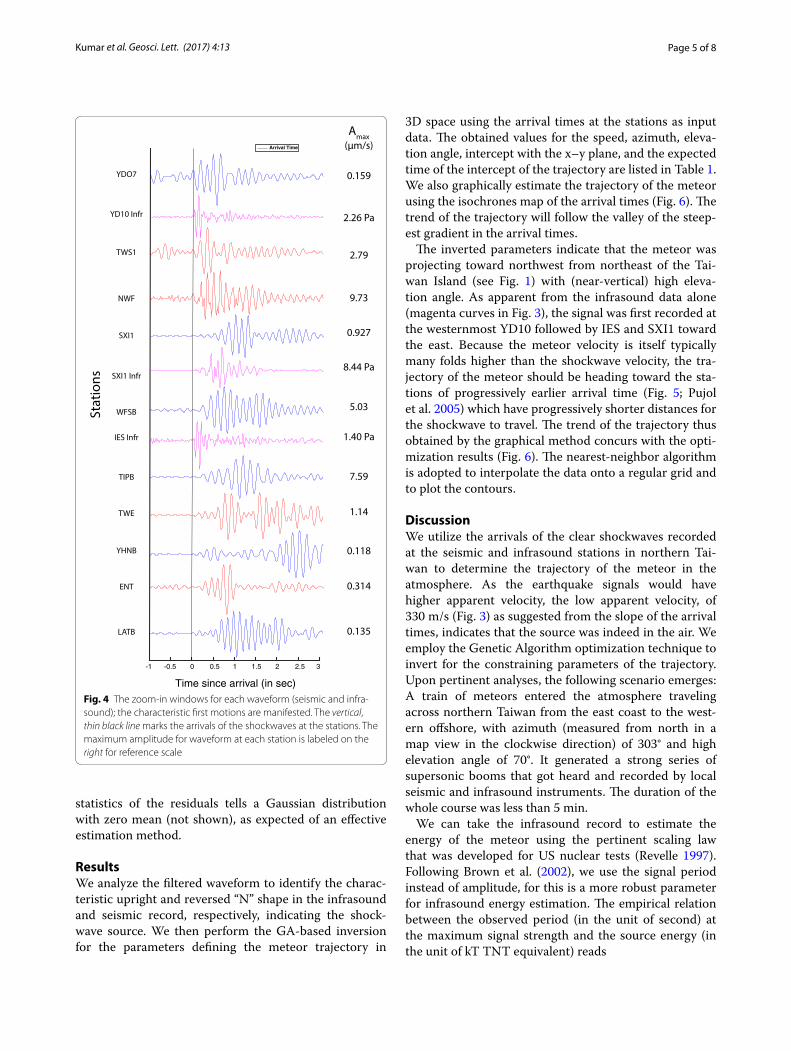
Inversion for trajectory parametersWe make two assumptions, following Ishihara et al. (2003), to invert for the trajectory parameters: the meteor penetrates linearly through the atmosphere with a con-stant velocity, and the shockwave speed of 320 m/s is uniform in the atmosphere. The linear trajectory assump-tion is reasonable because the meteor’s high propagation speed implies negligible effects of gravity (Tatum 1999) and the nearly constant velocity in the upper atmosphere prior to its termination (Halliday et al. 1996; Brown et al. 2002).
We define two rectangular coordinate systems (Fig. 5), describing the geographical coordinates (x, y, z) and the meteoric trajectory (X, Y, Z); its respective origins are taken at—(25.16 N, 121.44 E, 0), the location of Tamsui town center, and the intercept point of the meteoric tra-jectory with the x–y plane (termination point). The x–y plane is the tangential plane to the Earth’s surface at the origin. We constrain the meteoric trajectory by six perti-nent parameters, namely the speed (v; constant), azimuth (γ), elevation angle (δ), the termination point (x0, y0 ), and the expected time at the termination point (t0). The two coordinate systems and the trajectory parameters are related by the following set of non-linear equations (Eq. 1; Ishihara et al. 2003):
Fig. 1 Distribution of the seismic and infrasound stations that recorded the clear shockwave signals on December 5, 2013. The stations are presented in red (Seismic; CWB), blue (Seismic; BATS), and magenta (Infrasound; IES) triangles. The size of the triangle represents the SNR. The location of Tamsui township is marked with a bold “T.” The arrow indicates the solved trajectory of the meteor; the tip of the arrow points to the estimated intercept point of the protracted meteor trajectory with the ground surface (Additional file 1: Table S1)

Page 3 of 8Kumar et al. Geosci. Lett. (2017) 4:13
(1a)sinβ =c
v
(1b)
XYZ
=
cos γ sin β sin γ sin δ − cos δ− sin γ cos γ 0
cos γ cos δ sin γ cos δ sin δ
x − x0y− y0
z
(1c)
√X2 + Y 2
tan β− Z = v
(
tpre − t0)
(2)F(
v, γ , δ, x0, y0, t0)
=
√
1/(N − 6)∑
(
tobs − tpre)2
400 410 420 430 440 450 460 470 480 490 500Am
plit
ud
e (i
n P
a)
-20
0
20
Time (in sec)400 410 420 430 440 450 460 470 480 490 500
Fre
qu
ency
(in
Hz)
0
5
10
15
20
25
30
35
40
45
50-10
-5
0
5
10
400 410 420 430 440 450 460 470 480 490 500Am
plitu
de (i
n m
/s) × 10-6
-4
-2
0
2
4
Time (in sec)400 410 420 430 440 450 460 470 480 490 500
Freq
uenc
y (in
Hz)
0
5
10
15
20
25
30
35
40
45
50
× 10-6
-3
-2
-1
0
1
2
3
a
b
c
d
Fig. 2 Unfiltered and filtered time series for seismic and infrasound records and their corresponding wavelet spectrograms. a Broadband seismo-gram of station SXI1: magenta and blue curves are the unfiltered and filtered time series, respectively. b Wavelet spectrogram for the seismogram (a). c, d Same as (a, b) but for the infrasound record (Station SXI1). Here the time axis is referenced to 2013.12.05 10:10:00 UTC (arbitrarily chosen)
Page 4 of 8Kumar et al. Geosci. Lett. (2017) 4:13
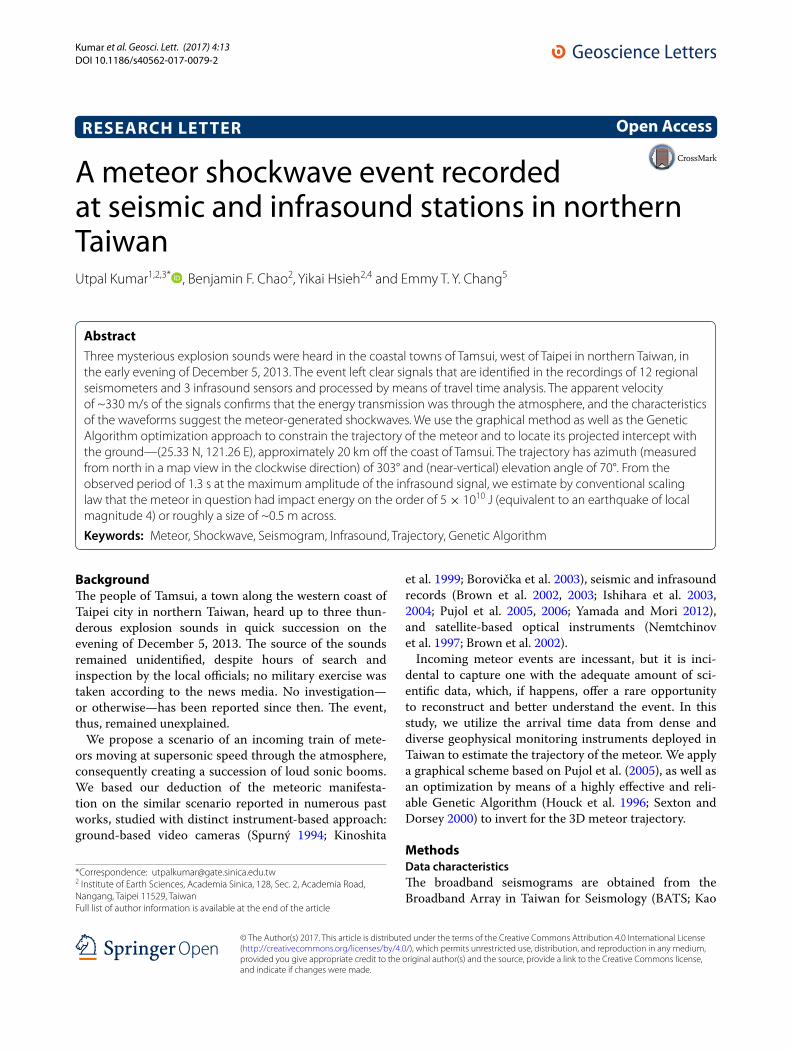
We can solve using the least-squares method for the best set of the six parameters by minimizing the objec-tive function in Eq. 2 (where N is the number of stations). However, minimizing the objective function—a non-linear problem with a large number of local minima in 6-parameter space—by any gradient-based method runs a likely risk of the solution to get trapped in a local mini-mum. To circumvent this risk and to seek a trustworthy solution, we conduct a non-linear iterative direct search of the model space using the global optimization tech-nique of the Genetic Algorithm or GA (Sen and Stoffa 1995; Yamanaka and Ishida 1996). Computationally less demanding than the grid search method, the GA inver-sion is capable of efficiently search a very large model space, where the model parameters can be freely defined with a few assumptions and restrictions.
The GA works, on a user-defined set of values including the search space and the size of the population, to gener-ate stochastic population in the successive generation such that the objective function value decreases progressively. The initial population of model parameters is randomly chosen within the given search range. The simple GA undergoes a set of operations on the model population to produce the next generation: selection, coding, crossover, and mutation. In the selection scheme, the model param-eters exhibiting the higher fitness value (lower objec-tive function value relative to others) are selected and replicated with the given probability such that the total
population size remains constant; then the population members are randomly paired among themselves. In the coding scheme, the decimal values associated with each population is converted to binary system forming a long bit string (analogous to a chromosome). In the crossover scheme, some part of the long bit string of binary model parameters is exchanged with their corresponding pair to produce a new population. In the mutation scheme, some randomly selected sites (with given probability) of the new set of the binary model population are switched. These sets of operations will continue until some pre-defined ter-mination criteria for the technique are satisfied.
Specifically, the total population size for GA is chosen to be 100, guided by the number of parameters in our model. We decide the selection and mutation probabil-ity (0.7 each) by experimentation. In each generation, the new population is created with two elite members (indi-viduals giving better fitness value), which replaces the worst two members of the next generation. The termi-nation criterion of the GA process was taken to be the tolerance value (difference of objective function value between successive generations), which was 1E − 6. We set up the GA to leap all the greedy traps of a local mini-mum in the path toward the optimum value and then we opt for the gradient-based Quasi-Newton method to converge quickly for the best parameters possible.
We tested the reliability of our 6-parameter inversion procedure through 10,000 Monte Carlo simulations. The
Fig. 3 The waveforms record at the seismic (Red CWB; Blue BATS) and infrasound (Magenta IES) stations used in the study. The amplitudes are normalized to facilitate the visualization. The inverted triangles denote the arrival times of the shock waves. The slope of the arrival times is 0.33 km/s as determined using the least squares method (Additional file 1: Table S1)
Page 5 of 8Kumar et al. Geosci. Lett. (2017) 4:13
statistics of the residuals tells a Gaussian distribution with zero mean (not shown), as expected of an effective estimation method.
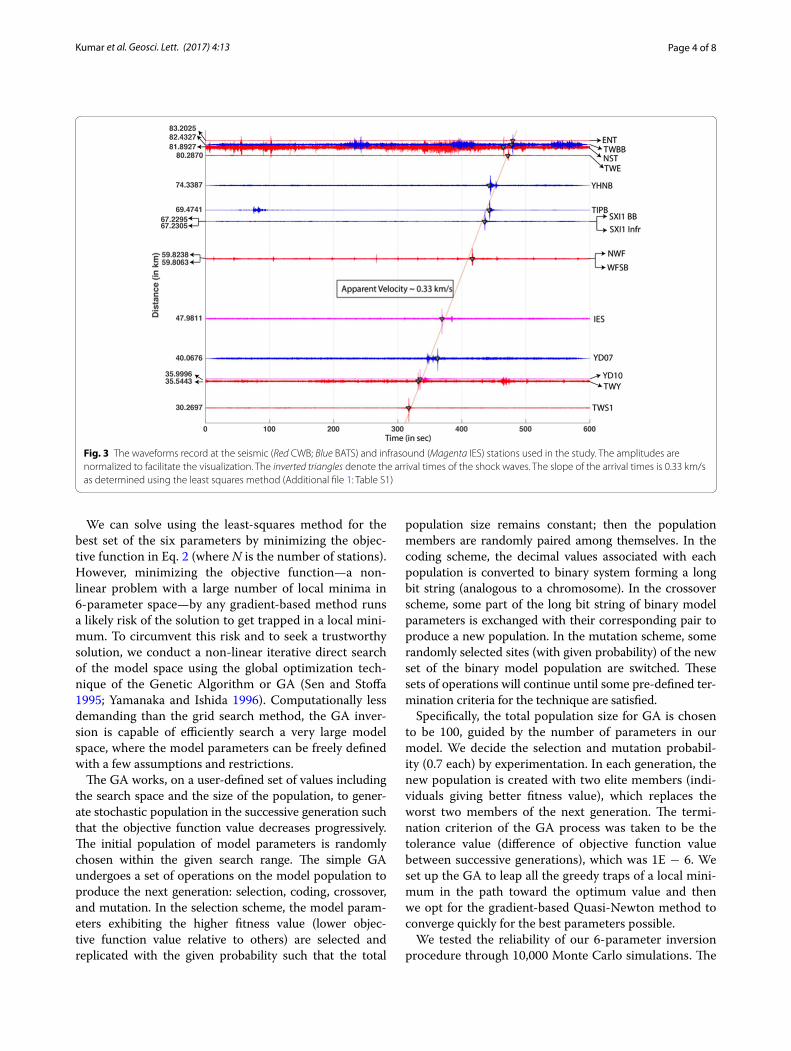
ResultsWe analyze the filtered waveform to identify the charac-teristic upright and reversed “N” shape in the infrasound and seismic record, respectively, indicating the shock-wave source. We then perform the GA-based inversion for the parameters defining the meteor trajectory in
3D space using the arrival times at the stations as input data. The obtained values for the speed, azimuth, eleva-tion angle, intercept with the x–y plane, and the expected time of the intercept of the trajectory are listed in Table 1. We also graphically estimate the trajectory of the meteor using the isochrones map of the arrival times (Fig. 6). The trend of the trajectory will follow the valley of the steep-est gradient in the arrival times.
The inverted parameters indicate that the meteor was projecting toward northwest from northeast of the Tai-wan Island (see Fig. 1) with (near-vertical) high eleva-tion angle. As apparent from the infrasound data alone (magenta curves in Fig. 3), the signal was first recorded at the westernmost YD10 followed by IES and SXI1 toward the east. Because the meteor velocity is itself typically many folds higher than the shockwave velocity, the tra-jectory of the meteor should be heading toward the sta-tions of progressively earlier arrival time (Fig. 5; Pujol et al. 2005) which have progressively shorter distances for the shockwave to travel. The trend of the trajectory thus obtained by the graphical method concurs with the opti-mization results (Fig. 6). The nearest-neighbor algorithm is adopted to interpolate the data onto a regular grid and to plot the contours.
DiscussionWe utilize the arrivals of the clear shockwaves recorded at the seismic and infrasound stations in northern Tai-wan to determine the trajectory of the meteor in the atmosphere. As the earthquake signals would have higher apparent velocity, the low apparent velocity, of 330 m/s (Fig. 3) as suggested from the slope of the arrival times, indicates that the source was indeed in the air. We employ the Genetic Algorithm optimization technique to invert for the constraining parameters of the trajectory. Upon pertinent analyses, the following scenario emerges: A train of meteors entered the atmosphere traveling across northern Taiwan from the east coast to the west-ern offshore, with azimuth (measured from north in a map view in the clockwise direction) of 303° and high elevation angle of 70°. It generated a strong series of supersonic booms that got heard and recorded by local seismic and infrasound instruments. The duration of the whole course was less than 5 min.
We can take the infrasound record to estimate the energy of the meteor using the pertinent scaling law that was developed for US nuclear tests (Revelle 1997). Following Brown et al. (2002), we use the signal period instead of amplitude, for this is a more robust parameter for infrasound energy estimation. The empirical relation between the observed period (in the unit of second) at the maximum signal strength and the source energy (in the unit of kT TNT equivalent) reads
Arrival Time
YDO7
YD10 Infr
TWS1
NWF
SXI1
SXI1 Infr
WFSB
IES Infr
TIPB
TWE
YHNB
ENT
LATB
Stat
ions
Amax(μm/s)
0.135
0.314
0.118
1.14
7.59
5.03
0.927
9.73
2.79
0.159
1.40 Pa
8.44 Pa
2.26 Pa
-1 -0.5 0 0.5 1 1.5 2 2.5 3
Time since arrival (in sec)
Fig. 4 The zoom-in windows for each waveform (seismic and infra-sound); the characteristic first motions are manifested. The vertical, thin black line marks the arrivals of the shockwaves at the stations. The maximum amplitude for waveform at each station is labeled on the right for reference scale

Page 6 of 8Kumar et al. Geosci. Lett. (2017) 4:13
Using the observed period of 1.3 s at the maximum amplitude signal obtained from the wavelet spectra, the energy of the event is then on the order of ~0.012 kT of TNT equivalent or 5 × 10¹⁰ J (1kTTNT = 4.184 × 10¹²J ), equivalent to an earthquake of the local magnitude of about 4. Taking a bulk density of 3 g/cm3 and an ini-tial velocity of 20 km/s for the meteor in question, this kinetic energy nominally means a pre-atmospheric mass of ~250 kg and a size of ~0.5 m across. Only moderate in
(3)log10
(
E
2
)
= 3.34 log10(P)− 2.58, E/
2 ≤ 100 kT
size compared to previously studied events (Brown et al. 2002; Le Pichon et al. 2013; Caudron et al. 2016), such meteors impinge upon the Earth at the rate of a few tens every year (Silber et al. 2009). We should note that our estimation of the pre-atmospheric source energy is rather crude and utterly contingent upon the uncertainty in the measurement of periods at the variable recording sites. The empirical scaling law between the period and energy is itself a crude relation, incorporating several assump-tions (ReVelle 1976). The mass and size estimate can be further improved with appropriate constraints on the density and velocity parameters.
The object creating the supersonic sounds and the shockwave signals could arguably be some sort of artifi-cial object. The same reversed “N”-shaped seismic wave-form, and high elevation angle trajectory is possible for a supersonic object launched from the earth’s surface rather than an extra-terrestrial one. However, that can be safely ruled out because the lower value of the typi-cal velocity of an artificial supersonic object (much lower than the escape velocity of the Earth) results in a much higher misfit of our GA objective function. Further, there was no report of any evidence of falling object around the estimated termination point of the trajectory (including water splashes).
The local newspaper reported three loud explosion sounds, which could be because of the fragmentation of the original meteor body into multiple pieces, hence mul-tiple shockwaves. Conceivably, there may be relatively minor debris that quickly loses their speeds by friction and did not create sonic booms loud enough to be heard.
We minimize our GA objective function (Eq. 2) itera-tively to obtain the best set of constraining parameters of the meteor trajectory. The solution of the first set of parameters, consisting the azimuth, the elevation angle, the expected longitude, and the latitude of the trajectory,
Fig. 5 The time-compressed schematic of the meteor trajectory. The two rectangular coordinate system (x, y, z) and (X, Y, Z; Z indicates the direction of approaching meteor) constrains the geographical and meteoric trajectory location in space, respectively. The dashed, thin, and bold red line segments represent the plane shockwaves location at time t1, t2, and t3, respectively (t3 > t2 > t1). The light and bold red-dashed ellipses approximately demarcate the region having relatively higher signal amplitude at time t2, and t3, respectively. The stations closer to the intercept of the protracted trajectory with the ground (termination point; O) encounter earlier shockwave arrival. δ,β, and γ are the elevation angle, the Mach angle, and the azimuth of the trajectory, respectively. The azimuth (γ ) is the angle measured from the geographic north to the horizontal projection of the Z-axis in the x–y plane, in the clockwise direction. The elevation angle (δ) is the minimum angle between the Z-axis (direction of approaching meteor) and the x–y plane
Table 1 List of the best parameters constraining the tra-jectory of the meteor, inverted using the Genetic Algo-rithm scheme
The search range is unbounded for all parameters except for the one mentioneda Shows the values which are unconstrainedb The search range is (30, 75)
Parameter Optimum value
Velocity (fixed)a 20 km/s
Azimuth (measured from north in a map view in the clockwise direction)
303 degrees
Elevation angleb 70 degrees
Expected longitude 121 degrees
Expected latitude 25 degrees
Expected timea 2013/12/05 10 h 10 min 225.1 s

Page 7 of 8Kumar et al. Geosci. Lett. (2017) 4:13
are reliable. Their relative change with the unconstrained parameter such as velocity is small. However, the sec-ond set of parameters, consisting of the velocity and the expected arrival time at the termination point are less reliable because of the assumed fixed velocity model. The solution of the expected arrival time of the meteor trades off with the velocity value.
We have assumed a constant shockwave velocity model and the fixed meteor velocity, as has been the case for many previous studies (Ishihara et al. 2003, 2004; Langston 2004; Pujol et al. 2006; Edwards et al. 2008). The assumption does not consider several factors such as temperatures and pressures change, atmospheric winds perturbation with altitude, etc. The precise deter-mination of the predicted arrival time is possible only by accounting for the detailed knowledge of these condi-tions in a three-dimensional meteorological modeling of the lower atmosphere.
ConclusionsBy means of numerical solutions to fit the recorded seis-mic and infrasound data, we manage to trace the signal source of an event of incoming meteor traveling super-sonically through the atmosphere creating sonic booms. As such, we provide a scientifically sound explanation for the origin of the explosion sounds heard by townspeople of Tamsui on Dec. 5, 2013. We maintain that our study may provide insightful exemplification for other simi-lar cases of “mysterious” explosion-sound incidences as reported in the news media over the years.
AbbreviationsBATS: Broadband Array in Taiwan for Seismology; CWB: Central Weather Bureau; IES: Institute of Earth Sciences; GA: Genetic Algorithm.
Authors’ contributionsUK conducted the data analysis and solutions, and wrote the major portion of the manuscript. BFC initiated the problem and supervised the proceed-ing of the analysis, and helped writing the manuscript. ETC directed the data analysis methods and software applications. YKH prepared the data and conducted the first tests of the feasibility of the data in the application. All have substantial contributions to the completion of the study. All authors read and approved the final manuscript.
Author details1 Taiwan International Graduate Program (TIGP), Earth System Science (ESS) Program, Academia Sinica, Taipei, Taiwan. 2 Institute of Earth Sciences, Academia Sinica, 128, Sec. 2, Academia Road, Nangang, Taipei 11529, Taiwan. 3 Department of Earth Sciences, National Central University, Jhongli, Taiwan. 4 Present Address: Research Institute for Sustainable Humanosphere, Kyoto University, Kyoto, Japan. 5 Institute of Oceanography, National Taiwan Univer-sity, Taipei, Taiwan.
AcknowledgementsThe seismic data used in this work are available from the Geophysical Database Management System website (http://gdms.cwb.gov.tw/index.php) of the Central Weather Bureau of Taiwan, and the BATS website (http://bats.earth.sinica.edu.tw/) of Academia Sinica. We thank Chun-Chi Liu and Chin-Jen Lin for providing and preparing the infrasound data used here, which can be obtained from the corresponding author [email protected]. We have also benefitted from information provided by Cheng-Horng Lin and Anantz Apirujee Nakpathom.
Competing interestsThe authors declare that they have no competing interests.
Additional file
Additional file 1. Table S1. Additional table.
Fig. 6 Isochrones map for the observed (left) and the predicted shockwave arrival times (right) at seismic and infrasound stations of northern Tai-wan. The color bar (right of each map) shows the arrival time in seconds (from an arbitrary reference time). The red arrow indicates the approximate 2D trajectory of the meteor

Page 8 of 8Kumar et al. Geosci. Lett. (2017) 4:13
FundingThis work is partially supported by the Ministry of Science and Technology of Taiwan through Grants #103-2611-M-002-004, #103-2811-M-001-049, #104-2611-M-002-013, and #105-2116-M-001-016.
Publisher’s NoteSpringer Nature remains neutral with regard to jurisdictional claims in pub-lished maps and institutional affiliations.
Received: 31 August 2016 Accepted: 6 May 2017
ReferencesBorovička J, Spurný P, Kalenda P, Tagliaferri E (2003) The Morávka meteor-
ite fall: 1. Description of the events and determination of the fireball trajectory and orbit from video records. Meteorit Planet Sci 38:975–987. doi:10.1111/j.1945-5100.2003.tb00293.x
Brown PG, Revelle DO, Tagliaferri E, Hildebrand A (2002) An entry model for the Tagish Lake fireball using seismic, satellite and infrasound records. Meteorit Planet Sci 37:661–676. doi:10.1111/j.1945-5100.2002.tb00846.x
Brown PG, Kalenda P, ReVelle DO, Borovička J (2003) The Morávka meteorite fall: 2. Interpretation of infrasonic and seismic data. Meteorit Planet Sci 38:989–1003. doi:10.1111/j.1945-5100.2003.tb00294.x
Caudron C, Taisne B, Perttu A et al (2016) Infrasound and seismic detections associated with the 7 September 2015 Bangkok fireball. Geosci Lett 3:26. doi:10.1186/s40562-016-0058-z
Chao BF, Chung W, Shih Z, Hsieh Y (2014) Earth’s rotation variations: a wavelet analysis. Terra Nova 26:260–264. doi:10.1111/ter.12094
Edwards WN, Eaton DW, Brown PG (2008) Seismic observations of meteors: coupling theory and observations. doi:10.1029/2007RG000253.1.INTRO-DUCTION
Halliday I, Griffin AA, Blackwell AT (1996) Detailed data for 259 fireballs from the Canadian camera network and inferences concern-ing the influx of large meteoroids. Meteorit Planet Sci 31:185–217. doi:10.1111/j.1945-5100.1996.tb02014.x
Houck CR, Joines JA, Kay MG (1996) Comparison of genetic algo-rithms, random restart and two-opt switching for solving large location-allocation problems. Comput Oper Res 23:587–596. doi:10.1016/0305-0548(95)00063-1
Ishihara Y, Tsukada S, Sakai S et al (2003) The 1998 Miyako fireball’s trajectory determined from shock wave records of a dense seismic array. Earth Planet Space 55:e9–e12
Ishihara Y, Furumoto M, Sakai S, Tsukada S (2004) The 2003 Kanto large bolide’s trajectory determined from shockwaves recorded by a seismic network and images taken by a video camera. Geophys Res Lett 31:2–5. doi:10.1029/2004GL020287
Kao H, Jian P-R (2001) Seismogenic patterns in the Taiwan region: insights from source parameter inversion of BATS data. Tectonophysics 333:179–198. doi:10.1016/S0040-1951(00)00274-2
Kinoshita M, Maruyama T, Sagayama T (1999) Preliminary activity of Leonid meteor storm observed with a video camera in 1997. Geophys Res Lett 26:41–44. doi:10.1029/1998GL900241
Langston CA (2004) Seismic ground motions from a bolide shock wave. J Geophys Res 109:B12309. doi:10.1029/2004JB003167
Le Pichon A, Ceranna L, Pilger C et al (2013) The 2013 Russian fireball largest ever detected by CTBTO infrasound sensors. Geophys Res Lett 40:3732–3737. doi:10.1002/grl.50619
Morlet J, Arens G, Fourgeau E, Glard D (1982) Wave propagation and sampling theory—Part I: complex signal and scattering in multilayered media. Geophysics 47:203–221. doi:10.1190/1.1441328
Nemtchinov IV, Svetsov VV, Kosarev IB et al (1997) Assessment of kinetic energy of meteoroids detected by satellite-based light sensors. Icarus 130:259–274. doi:10.1006/icar.1997.5821
Pujol J, Rydelek P, Bohlen T (2005) Determination of the trajectory of a fireball using seismic network data. Bull Seismol Soc Am 95:1495–1509. doi:10.1785/0120040155
Pujol J, Rydelek P, Ishihara Y (2006) Analytical and graphical determination of the trajectory of a fireball using seismic data. Planet Space Sci 54:78–86. doi:10.1016/j.pss.2005.08.003
ReVelle DO (1976) On meteor-generated infrasound. J Geophys Res 81:1217–1230. doi:10.1029/JA081i007p01217
Revelle DO (1997) Historical detection of atmospheric impacts by large bolides using acoustic-gravity waves. Ann NY Acad Sci 822:284–302. doi:10.1111/j.1749-6632.1997.tb48347.x
Sen M, Stoffa PL (1995) Global optimization methods in geophysical inversion. Elsevier, Amsterdam
Sexton RS, Dorsey RE (2000) Reliable classification using neural networks: a genetic algorithm and backpropagation comparison. Decis Support Syst 30:11–22. doi:10.1016/S0167-9236(00)00086-5
Shin TC, Chang CH, Pu HC et al (2013) The geophysical database manage-ment system in Taiwan. Terr Atmos Ocean Sci 24:11–18. doi:10.3319/TAO.2012.09.20.01(T)
Silber EA, Revelle DO, Brown PG, Edwards WN (2009) An estimate of the terres-trial influx of large meteoroids from infrasonic measurements. J Geophys Res E Planets 114:1–8. doi:10.1029/2009JE003334
Spurný P (1994) Recent fireballs photographed in central Europe. Planet Space Sci 42:157–162. doi:10.1016/0032-0633(94)90027-2
Tatum JB (1999) Fireballs: interpretation of airblast data. Meteorit Planet Sci 585:571–585
Yamada M, Mori J (2012) Trajectory of the August 7, 2010 Biwako fireball determined from seismic recordings. Earth Planets Space 64:27–35. doi:10.5047/eps.2011.08.021
Yamanaka H, Ishida H (1996) Application of genetic algorithms to an inversion of surface wave dispersion data. Bull Seism Soc Am 86:436–444
Related Documents