RESEARCH ARTICLE Open Access Stress degradation studies and stability-indicating TLC-densitometric method of glycyrrhetic acid Syed Ghulam Musharraf * , Nayab Kanwal and Qamar ul Arfeen Abstract Background: Glycyrrhetic acid, a pentacyclic triterpenoid, possesses a broad range of pharmacological activities and serves as template to synthesize many bioactive drugs. This paper describes a simple, accurate, and sensitive stability-indicating TLC densitometric method for the determination of glycyrrhetic acid and its degradation product as per the ICH guidelines. Results: Separation was carried out on TLC aluminium sheet pre-coated with silica gel 60F254 using chloroform, methanol and formic acid (9:0.9:0.1, v/v). Compact spot for glycyrrhetic acid was found at R f value of 0.42 ± 0.03. Densitometric analysis was carried out in the absorbance mode at λ max 254 nm. Glycyrrhetic acid was found to be stable to the exposure of base, neutral, oxidation, dry heating treatment and wet heating treatment, but showed degradation under acidic and photochemical conditions. Moreover, fragmentation pattern of glycyrrhetic acid was developed by using a positive ion electrospray ionization quadrupole time-of-flight mass spectrometry (ESI-QqTOF- MS/MS) hybrid instrument. A photo-degraded product was characterized through comparison of mass spectrometric studies with glycyrrhetic acid. Conclusion: The developed stability-indicating TLC-densitometric method can be applied for routine analysis of glycyrrhetic acid in the presence of its degradation products. Keywords: Glycyrrhetic acid, Stress degradation, Electrospray ionization quadrupole time-of-flight mass spectrometry Background Glycyrrhiza glabra Linn (Fabaceae) commonly known as Licorice, used worldwide as a natural sweetener and in certain cases, used as a flavor additive in the preparative of candies and foods. Moreover, powdered Licorice root is widely used in herbal drugs in the formulation of Ayurvedic and Chinese medicines. This herb has been reported with various biological activities including antitu- mour [1], anti-inflamatory [2], antiulcer [3], immunomodu- latory [4], antimalarial [5], and anti-hypercholesterolmic [6]. The major constitute of Licorice is glycyrrhizin, which is potassium or calcium salt of glycyrrhizic acid. Glycyrrhizin is a pentacyclic triterpenoid glycoside, which is hydrolyzed to form aglycone glycyrrhetic acid [7]. Glycyrrhetic acid has shown antimicrobial [8] and anti-tumor activities [9]. Indi- vidual and simultaneously quantification of glycyrrhizin, 18α-glycyrrhetic acid, and 18β-glycyrrhetic acid in Licorice root and confectionary products have been developed with the help of various analytical tools including HPTLC [10-12], HPLC [13,14], microemulsion thin layer chromatography [15] and LC-ESI/MS/MS [16]. Majority of plants contain multiple compounds as active ingredients, which are frequently used in drugs. These active ingredients degraded and may alter their biological activities, therefore extensive study is required for estima- tion of their stability-indicating properties. The parent drug stability test guidelines (Q1AR) issued by International Conference on Harmonization (ICH) requires the stress testing to elucidate the inherent stability characteristics of the active substance. This guideline emphasizes the testing of those features which are susceptible to change during the storage under the influence of various environmental factors (temperature, light, humidity, oxidizing agent etc.). Quality, safety and efficacy must also be checked with validated stability-indicating testing methods [17,18]. A considerable attention is being paid to the develop- ment of stability-indicating TLC-densitometric method * Correspondence: [email protected] H.E.J. Research Institute of Chemistry, International Center for Chemical and Biological Sciences, University of Karachi, Karachi 75270, Pakistan © 2013 Musharraf et al.; licensee Chemistry Central Ltd. This is an Open Access article distributed under the terms of the Creative Commons Attribution License (http://creativecommons.org/licenses/by/2.0), which permits unrestricted use, distribution, and reproduction in any medium, provided the original work is properly cited. Musharraf et al. Chemistry Central Journal 2013, 7:9 http://journal.chemistrycentral.com/content/7/1/9

Welcome message from author
This document is posted to help you gain knowledge. Please leave a comment to let me know what you think about it! Share it to your friends and learn new things together.
Transcript

Musharraf et al. Chemistry Central Journal 2013, 7:9http://journal.chemistrycentral.com/content/7/1/9
RESEARCH ARTICLE Open Access
Stress degradation studies and stability-indicatingTLC-densitometric method of glycyrrhetic acidSyed Ghulam Musharraf*, Nayab Kanwal and Qamar ul Arfeen
Abstract
Background: Glycyrrhetic acid, a pentacyclic triterpenoid, possesses a broad range of pharmacological activitiesand serves as template to synthesize many bioactive drugs. This paper describes a simple, accurate, and sensitivestability-indicating TLC densitometric method for the determination of glycyrrhetic acid and its degradation productas per the ICH guidelines.
Results: Separation was carried out on TLC aluminium sheet pre-coated with silica gel 60F254 using chloroform,methanol and formic acid (9:0.9:0.1, v/v). Compact spot for glycyrrhetic acid was found at Rf value of 0.42 ± 0.03.Densitometric analysis was carried out in the absorbance mode at λmax 254 nm. Glycyrrhetic acid was found to bestable to the exposure of base, neutral, oxidation, dry heating treatment and wet heating treatment, but showeddegradation under acidic and photochemical conditions. Moreover, fragmentation pattern of glycyrrhetic acid wasdeveloped by using a positive ion electrospray ionization quadrupole time-of-flight mass spectrometry (ESI-QqTOF-MS/MS) hybrid instrument. A photo-degraded product was characterized through comparison of massspectrometric studies with glycyrrhetic acid.
Conclusion: The developed stability-indicating TLC-densitometric method can be applied for routine analysis ofglycyrrhetic acid in the presence of its degradation products.
Keywords: Glycyrrhetic acid, Stress degradation, Electrospray ionization quadrupole time-of-flight massspectrometry
BackgroundGlycyrrhiza glabra Linn (Fabaceae) commonly known asLicorice, used worldwide as a natural sweetener and incertain cases, used as a flavor additive in the preparativeof candies and foods. Moreover, powdered Licorice root iswidely used in herbal drugs in the formulation ofAyurvedic and Chinese medicines. This herb has beenreported with various biological activities including antitu-mour [1], anti-inflamatory [2], antiulcer [3], immunomodu-latory [4], antimalarial [5], and anti-hypercholesterolmic [6].The major constitute of Licorice is glycyrrhizin, which ispotassium or calcium salt of glycyrrhizic acid. Glycyrrhizinis a pentacyclic triterpenoid glycoside, which is hydrolyzedto form aglycone glycyrrhetic acid [7]. Glycyrrhetic acid hasshown antimicrobial [8] and anti-tumor activities [9]. Indi-vidual and simultaneously quantification of glycyrrhizin,18α-glycyrrhetic acid, and 18β-glycyrrhetic acid in Licorice
* Correspondence: [email protected]. Research Institute of Chemistry, International Center for Chemical andBiological Sciences, University of Karachi, Karachi 75270, Pakistan
© 2013 Musharraf et al.; licensee Chemistry CeCreative Commons Attribution License (http:/distribution, and reproduction in any medium
root and confectionary products have been developedwith the help of various analytical tools includingHPTLC [10-12], HPLC [13,14], microemulsion thinlayer chromatography [15] and LC-ESI/MS/MS [16].Majority of plants contain multiple compounds as active
ingredients, which are frequently used in drugs. Theseactive ingredients degraded and may alter their biologicalactivities, therefore extensive study is required for estima-tion of their stability-indicating properties. The parentdrug stability test guidelines (Q1AR) issued by InternationalConference on Harmonization (ICH) requires the stresstesting to elucidate the inherent stability characteristics ofthe active substance. This guideline emphasizes the testingof those features which are susceptible to change duringthe storage under the influence of various environmentalfactors (temperature, light, humidity, oxidizing agent etc.).Quality, safety and efficacy must also be checked withvalidated stability-indicating testing methods [17,18].A considerable attention is being paid to the develop-
ment of stability-indicating TLC-densitometric method
ntral Ltd. This is an Open Access article distributed under the terms of the/creativecommons.org/licenses/by/2.0), which permits unrestricted use,, provided the original work is properly cited.
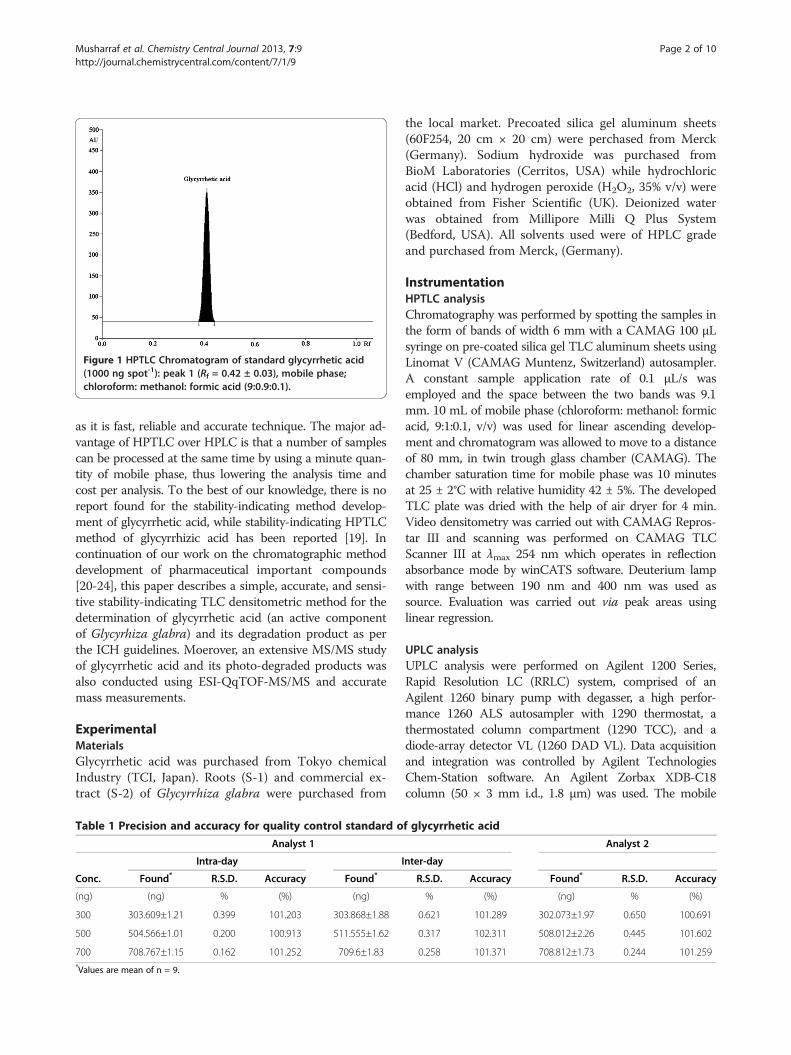
Figure 1 HPTLC Chromatogram of standard glycyrrhetic acid(1000 ng spot-1): peak 1 (Rf = 0.42 ± 0.03), mobile phase;chloroform: methanol: formic acid (9:0.9:0.1).
Musharraf et al. Chemistry Central Journal 2013, 7:9 Page 2 of 10http://journal.chemistrycentral.com/content/7/1/9
as it is fast, reliable and accurate technique. The major ad-vantage of HPTLC over HPLC is that a number of samplescan be processed at the same time by using a minute quan-tity of mobile phase, thus lowering the analysis time andcost per analysis. To the best of our knowledge, there is noreport found for the stability-indicating method develop-ment of glycyrrhetic acid, while stability-indicating HPTLCmethod of glycyrrhizic acid has been reported [19]. Incontinuation of our work on the chromatographic methoddevelopment of pharmaceutical important compounds[20-24], this paper describes a simple, accurate, and sensi-tive stability-indicating TLC densitometric method for thedetermination of glycyrrhetic acid (an active componentof Glycyrhiza glabra) and its degradation product as perthe ICH guidelines. Moerover, an extensive MS/MS studyof glycyrrhetic acid and its photo-degraded products wasalso conducted using ESI-QqTOF-MS/MS and accuratemass measurements.
ExperimentalMaterialsGlycyrrhetic acid was purchased from Tokyo chemicalIndustry (TCI, Japan). Roots (S-1) and commercial ex-tract (S-2) of Glycyrrhiza glabra were purchased from
Table 1 Precision and accuracy for quality control standard o
Analyst 1
Intra-day I
Conc. Found* R.S.D. Accuracy Found*
(ng) (ng) % (%) (ng)
300 303.609±1.21 0.399 101.203 303.868±1.88
500 504.566±1.01 0.200 100.913 511.555±1.62
700 708.767±1.15 0.162 101.252 709.6±1.83*Values are mean of n = 9.
the local market. Precoated silica gel aluminum sheets(60F254, 20 cm × 20 cm) were perchased from Merck(Germany). Sodium hydroxide was purchased fromBioM Laboratories (Cerritos, USA) while hydrochloricacid (HCl) and hydrogen peroxide (H2O2, 35% v/v) wereobtained from Fisher Scientific (UK). Deionized waterwas obtained from Millipore Milli Q Plus System(Bedford, USA). All solvents used were of HPLC gradeand purchased from Merck, (Germany).
InstrumentationHPTLC analysisChromatography was performed by spotting the samples inthe form of bands of width 6 mm with a CAMAG 100 μLsyringe on pre-coated silica gel TLC aluminum sheets usingLinomat V (CAMAG Muntenz, Switzerland) autosampler.A constant sample application rate of 0.1 μL/s wasemployed and the space between the two bands was 9.1mm. 10 mL of mobile phase (chloroform: methanol: formicacid, 9:1:0.1, v/v) was used for linear ascending develop-ment and chromatogram was allowed to move to a distanceof 80 mm, in twin trough glass chamber (CAMAG). Thechamber saturation time for mobile phase was 10 minutesat 25 ± 2°C with relative humidity 42 ± 5%. The developedTLC plate was dried with the help of air dryer for 4 min.Video densitometry was carried out with CAMAG Repros-tar III and scanning was performed on CAMAG TLCScanner III at λmax 254 nm which operates in reflectionabsorbance mode by winCATS software. Deuterium lampwith range between 190 nm and 400 nm was used assource. Evaluation was carried out via peak areas usinglinear regression.
UPLC analysisUPLC analysis were performed on Agilent 1200 Series,Rapid Resolution LC (RRLC) system, comprised of anAgilent 1260 binary pump with degasser, a high perfor-mance 1260 ALS autosampler with 1290 thermostat, athermostated column compartment (1290 TCC), and adiode-array detector VL (1260 DAD VL). Data acquisitionand integration was controlled by Agilent TechnologiesChem-Station software. An Agilent Zorbax XDB-C18column (50 × 3 mm i.d., 1.8 μm) was used. The mobile
f glycyrrhetic acid
Analyst 2
nter-day
R.S.D. Accuracy Found* R.S.D. Accuracy
% (%) (ng) % (%)
0.621 101.289 302.073±1.97 0.650 100.691
0.317 102.311 508.012±2.26 0.445 101.602
0.258 101.371 708.812±1.73 0.244 101.259
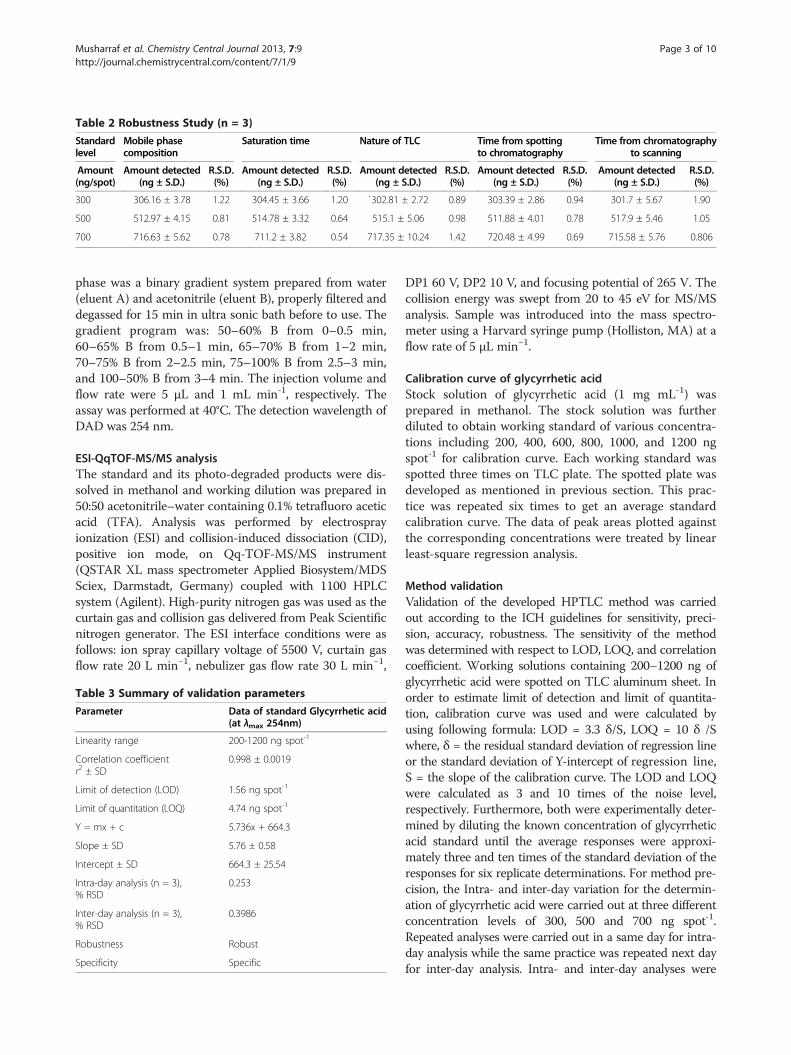
Table 2 Robustness Study (n = 3)
Standardlevel
Mobile phasecomposition
Saturation time Nature of TLC Time from spottingto chromatography
Time from chromatographyto scanning
Amount(ng/spot)
Amount detected(ng ± S.D.)
R.S.D.(%)
Amount detected(ng ± S.D.)
R.S.D.(%)
Amount detected(ng ± S.D.)
R.S.D.(%)
Amount detected(ng ± S.D.)
R.S.D.(%)
Amount detected(ng ± S.D.)
R.S.D.(%)
300 306.16 ± 3.78 1.22 304.45 ± 3.66 1.20 `302.81 ± 2.72 0.89 303.39 ± 2.86 0.94 301.7 ± 5.67 1.90
500 512.97 ± 4.15 0.81 514.78 ± 3.32 0.64 515.1 ± 5.06 0.98 511.88 ± 4.01 0.78 517.9 ± 5.46 1.05
700 716.63 ± 5.62 0.78 711.2 ± 3.82 0.54 717.35 ± 10.24 1.42 720.48 ± 4.99 0.69 715.58 ± 5.76 0.806
Musharraf et al. Chemistry Central Journal 2013, 7:9 Page 3 of 10http://journal.chemistrycentral.com/content/7/1/9
phase was a binary gradient system prepared from water(eluent A) and acetonitrile (eluent B), properly filtered anddegassed for 15 min in ultra sonic bath before to use. Thegradient program was: 50–60% B from 0–0.5 min,60–65% B from 0.5–1 min, 65–70% B from 1–2 min,70–75% B from 2–2.5 min, 75–100% B from 2.5–3 min,and 100–50% B from 3–4 min. The injection volume andflow rate were 5 μL and 1 mL min-1, respectively. Theassay was performed at 40°C. The detection wavelength ofDAD was 254 nm.
ESI-QqTOF-MS/MS analysisThe standard and its photo-degraded products were dis-solved in methanol and working dilution was prepared in50:50 acetonitrile–water containing 0.1% tetrafluoro aceticacid (TFA). Analysis was performed by electrosprayionization (ESI) and collision-induced dissociation (CID),positive ion mode, on Qq-TOF-MS/MS instrument(QSTAR XL mass spectrometer Applied Biosystem/MDSSciex, Darmstadt, Germany) coupled with 1100 HPLCsystem (Agilent). High-purity nitrogen gas was used as thecurtain gas and collision gas delivered from Peak Scientificnitrogen generator. The ESI interface conditions were asfollows: ion spray capillary voltage of 5500 V, curtain gasflow rate 20 L min−1, nebulizer gas flow rate 30 L min−1,
Table 3 Summary of validation parameters
Parameter Data of standard Glycyrrhetic acid(at λmax 254nm)
Linearity range 200-1200 ng spot-1
Correlation coefficientr2 ± SD
0.998 ± 0.0019
Limit of detection (LOD) 1.56 ng spot-1
Limit of quantitation (LOQ) 4.74 ng spot-1
Y = mx + c 5.736x + 664.3
Slope ± SD 5.76 ± 0.58
Intercept ± SD 664.3 ± 25.54
Intra-day analysis (n = 3),% RSD
0.253
Inter-day analysis (n = 3),% RSD
0.3986
Robustness Robust
Specificity Specific
DP1 60 V, DP2 10 V, and focusing potential of 265 V. Thecollision energy was swept from 20 to 45 eV for MS/MSanalysis. Sample was introduced into the mass spectro-meter using a Harvard syringe pump (Holliston, MA) at aflow rate of 5 μL min−1.
Calibration curve of glycyrrhetic acidStock solution of glycyrrhetic acid (1 mg mL-1) wasprepared in methanol. The stock solution was furtherdiluted to obtain working standard of various concentra-tions including 200, 400, 600, 800, 1000, and 1200 ngspot-1 for calibration curve. Each working standard wasspotted three times on TLC plate. The spotted plate wasdeveloped as mentioned in previous section. This prac-tice was repeated six times to get an average standardcalibration curve. The data of peak areas plotted againstthe corresponding concentrations were treated by linearleast-square regression analysis.
Method validationValidation of the developed HPTLC method was carriedout according to the ICH guidelines for sensitivity, preci-sion, accuracy, robustness. The sensitivity of the methodwas determined with respect to LOD, LOQ, and correlationcoefficient. Working solutions containing 200–1200 ng ofglycyrrhetic acid were spotted on TLC aluminum sheet. Inorder to estimate limit of detection and limit of quantita-tion, calibration curve was used and were calculated byusing following formula: LOD = 3.3 δ/S, LOQ = 10 δ /Swhere, δ = the residual standard deviation of regression lineor the standard deviation of Y-intercept of regression line,S = the slope of the calibration curve. The LOD and LOQwere calculated as 3 and 10 times of the noise level,respectively. Furthermore, both were experimentally deter-mined by diluting the known concentration of glycyrrheticacid standard until the average responses were approxi-mately three and ten times of the standard deviation of theresponses for six replicate determinations. For method pre-cision, the Intra- and inter-day variation for the determin-ation of glycyrrhetic acid were carried out at three differentconcentration levels of 300, 500 and 700 ng spot-1.Repeated analyses were carried out in a same day for intra-day analysis while the same practice was repeated next dayfor inter-day analysis. Intra- and inter-day analyses were

Figure 2 HPTLC Chromatogram of acid (5N HCl, reflux for 2h at80°C) treated glycyrrhetic acid: peak 1, degradant (Rf = 0.08);peak 2, degradant (Rf = 0.1); peak 3, degradant (Rf = 0.12); peak4, glycyrrhetic acid (Rf = 0.42); peak 5, degradant (Rf = 0.64).
Figure 3 HPTLC Chromatogram (A) and UPLC chromatogram(B) of photo-degraded standard glycyrrhetic acid kept insunlight for 24hr (1000 ng/spot): peak 1, degradant (Rf = 0.35and Rt = 1.687); peak 2, degradant (Rf = 0.38 and Rt = 2.142);peak 3, glycyrrhetic acid (Rf = 0.42 and Rt = 2.531); peak 4,degradant ( Rf = 0.49 and Rt = 2.916).
Musharraf et al. Chemistry Central Journal 2013, 7:9 Page 4 of 10http://journal.chemistrycentral.com/content/7/1/9
performed to check the repeatability and reproducibility ofthe method, respectively and results were statistically eva-luated in terms of % R.S.D. In order to check the robust-ness, following parameters were intentionally changedwithin the range of ± 5% at three different concentrationlevels (300, 500 and 700 ng); mobile phase composition,time from spotting to chromatography, time from chroma-tography to scanning and chamber saturation time andusing different type of TLC plates. Licorice root extractwas prepared according to Cui Shufen et al. [15]. Allsamples were spotted on TLC plate and developed asmentioned in previous section. The accuracy of themethod was assessed by performing recovery study at threedifferent levels of glycyrrhetic acid (50%, 100%, and 150%).
Preparation of forced degradation productsStress degradation studies were performed using parallelsynthesizer (Smart Start Synthesizer, Chem Speed Ltd.,Switzerland) with sixteen reaction vessels. Stock solutioncontaining 100 mg of glycyrrhetic acid in 100 mL ofmethanol was prepared. This stock solution (1 mg mL-1)was used for forced degradation studies in parallelsynthesizer by refluxing the reaction mixtures for twohours at 80°C. After the reactions were completed, all thesolutions were preserved at −20°C. Average peak areas ofactive components were analyzed after triplicate analysis.For acidic hydrolysis, 3 mL of methanolic stock solution
of glycyrrhetic acid (1 mg mL-1) were mixed with 3 mL ofeach 1N and 5N HCl separately and the resultant mixturesolutions were refluxed for two hours at 80°C in the dark, inorder to prohibit the possible degradative effects of light. 2μL (1000 ng spot-1) of 1N and 5N HCl treated solutions ofglycyrrhetic acid were applied on TLC sheet in triplicate anddensitogram were developed. For alkaline hydrolysis, 3 mLof methanolic stock solution of glycyrrhetic acid (1 mg mL-1) were mixed with 3 mL of each 0.1N, 1N and 5N NaOHseparately and the resultant mixture solutions were refluxedfor two hours at 80°C in the dark. 2 μL (1000 ng spot-1) of0.1N, 1N and 5N NaOH treated solutions of glycyrrheticacid were applied on TLC sheet in triplicate and densito-gram were developed. For neutral hydrolytic condition, 3mL of methanolic stock solution of glycyrrhetic acid (1 mgmL-1) were mixed with 3 mL of milli Q water and the result-ant solution was refluxed for two hours at 80°C in the dark.2 μL (1000 ng spot-1) of treated solution of glycyrrhetic acidwas applied on TLC sheet in triplicate and densitogramwere developed. For wet heating, 3 mL of methanolic stocksolution of glycyrhhetic acid was refluxed for two hours at80°C in the dark. 1 μL (1000 ng spot-1) of resultant solutionswere applied on TLC sheet in triplicate and densitogramwere developed. Oxidative degradation was carried out bytaken 3 mL stock solutions of glycyrrhetic acid mixed with 3mL of H2O2 (35% v/v) and the resultant solutions wererefluxed for two hours at 80°C in the dark and 2 μL (1000

Table 4 Summary of stress degradation studies of glycyrrhetic acid
Degradation conditions Time (hour) Rf of degraded products Compound remained (ng /1000ng±S.D., n=3) % Recovery
Acidic hydrolysis a
1N HCl 2 0.08, 0.1,0.64 362.19±7.7 36.21
5N HCl 2 0.08,0.1, 0.12, 0.64 253.83±1.5 25.38
Basic hydrolysis a
0.1N NaOH 2 Not detected 999.9±5.2 99.9
1N NaOH 2 Not detected 892.9±11 89.2
5N NaOH 2 Not detected - 100b
Oxidation
35%v/v H2O2a 2 Not detected 993.07±5.5 99.3
Oxidation at room temp 24 Not detected 987.8±6.4 98.7
Neutral hydrolysis a 2 Not detected 997.09±7.7 99.7
Wet heating a 2 Not detected 999.47±9.5 99.9
Dry heating 4 Not detected 999.58±6.2 99.9
Photostability- daylight 24 0.35,0.38,0.49 663.74±5.1 66.3aReflux in parallel synthesizer at 80°C.bRecover in salt form.
Figure 4 Video densitogram showing spots of (1) standardglycyrrhetic acid, (2) photo-degradation mixture of glycyrrheticacid, (3) MeOH extract of Glycyrrhiza glabra root (S-1), (4)commercial extract of Glycyrrhiza glabra (S-2).
Musharraf et al. Chemistry Central Journal 2013, 7:9 Page 5 of 10http://journal.chemistrycentral.com/content/7/1/9
ng spot-1) of resultant solutions were applied on TLC sheetin triplicate and densitogram were developed.Photo-degradation studies were carried out by the expo-
sure of stock solution of glycyrrhetic acid to direct sunlightfor three days from 8 to 18 hrs at 30 ± 2°C. 1 μL (1000 ngspot-1) of resultant solutions were applied on TLC sheet intriplicate and densitogram were developed. Dry heatingwas performed by keeping standard glycyrrhetic acid inoven at 90°C for 4 hrs. 1 mg of treated standard was dis-solved in 2 mL of methanol and 2 μL (1000 ng spot-1) ofresultant solution of glycyrrhetic acid was applied on TLCplate in triplicate and densitogram were developed. Foroxidation reaction at room temperature, 3 mL stock solu-tion of glycyrrhetic acid was mixed with 3 mL of H2O2
(35% v/v) and the resultant solutions was kept for 24hours at room temperature. 2 μL (1000 ng spot-1) of re-sultant solutions were applied on TLC sheet in triplicateand densitogram were developed.
Results and discussionMethod optimizationThe TLC procedure was optimized with a view to developstability-indicating assay method. Both the standard anddegraded products were spotted on the TLC plates anddeveloped in different solvent systems. Different mobilephases were tried to resolve glycyrrhetic acid from itsdegraded product. Different compositions of mobile phaseand resulting Rf values of standards are summarized in(see Additional file 1: Table S1). Suitable separation withbest resolution was achieved with chloroform: methanol:formic acid in the ratio of (9:0.9:0.1, v/v) which showedsharp and symmetrical peaks with Rf value of glycyrrheticacid at 0.42 ± 0.03 (Figure 1). Well defined spots were
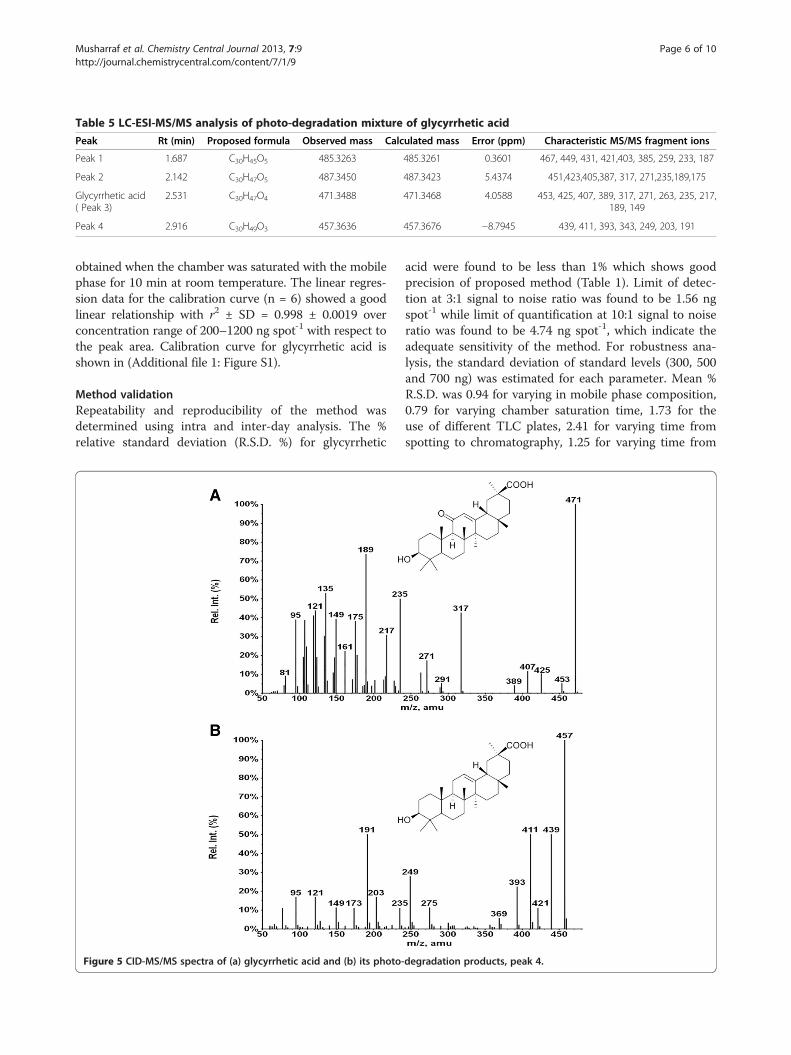
Table 5 LC-ESI-MS/MS analysis of photo-degradation mixture of glycyrrhetic acid
Peak Rt (min) Proposed formula Observed mass Calculated mass Error (ppm) Characteristic MS/MS fragment ions
Peak 1 1.687 C30H45O5 485.3263 485.3261 0.3601 467, 449, 431, 421,403, 385, 259, 233, 187
Peak 2 2.142 C30H47O5 487.3450 487.3423 5.4374 451,423,405,387, 317, 271,235,189,175
Glycyrrhetic acid( Peak 3)
2.531 C30H47O4 471.3488 471.3468 4.0588 453, 425, 407, 389, 317, 271, 263, 235, 217,189, 149
Peak 4 2.916 C30H49O3 457.3636 457.3676 −8.7945 439, 411, 393, 343, 249, 203, 191
Musharraf et al. Chemistry Central Journal 2013, 7:9 Page 6 of 10http://journal.chemistrycentral.com/content/7/1/9
obtained when the chamber was saturated with the mobilephase for 10 min at room temperature. The linear regres-sion data for the calibration curve (n = 6) showed a goodlinear relationship with r2 ± SD = 0.998 ± 0.0019 overconcentration range of 200–1200 ng spot-1 with respect tothe peak area. Calibration curve for glycyrrhetic acid isshown in (Additional file 1: Figure S1).
Method validationRepeatability and reproducibility of the method wasdetermined using intra and inter-day analysis. The %relative standard deviation (R.S.D. %) for glycyrrhetic
Figure 5 CID-MS/MS spectra of (a) glycyrrhetic acid and (b) its photo-
acid were found to be less than 1% which shows goodprecision of proposed method (Table 1). Limit of detec-tion at 3:1 signal to noise ratio was found to be 1.56 ngspot-1 while limit of quantification at 10:1 signal to noiseratio was found to be 4.74 ng spot-1, which indicate theadequate sensitivity of the method. For robustness ana-lysis, the standard deviation of standard levels (300, 500and 700 ng) was estimated for each parameter. Mean %R.S.D. was 0.94 for varying in mobile phase composition,0.79 for varying chamber saturation time, 1.73 for theuse of different TLC plates, 2.41 for varying time fromspotting to chromatography, 1.25 for varying time from
degradation products, peak 4.
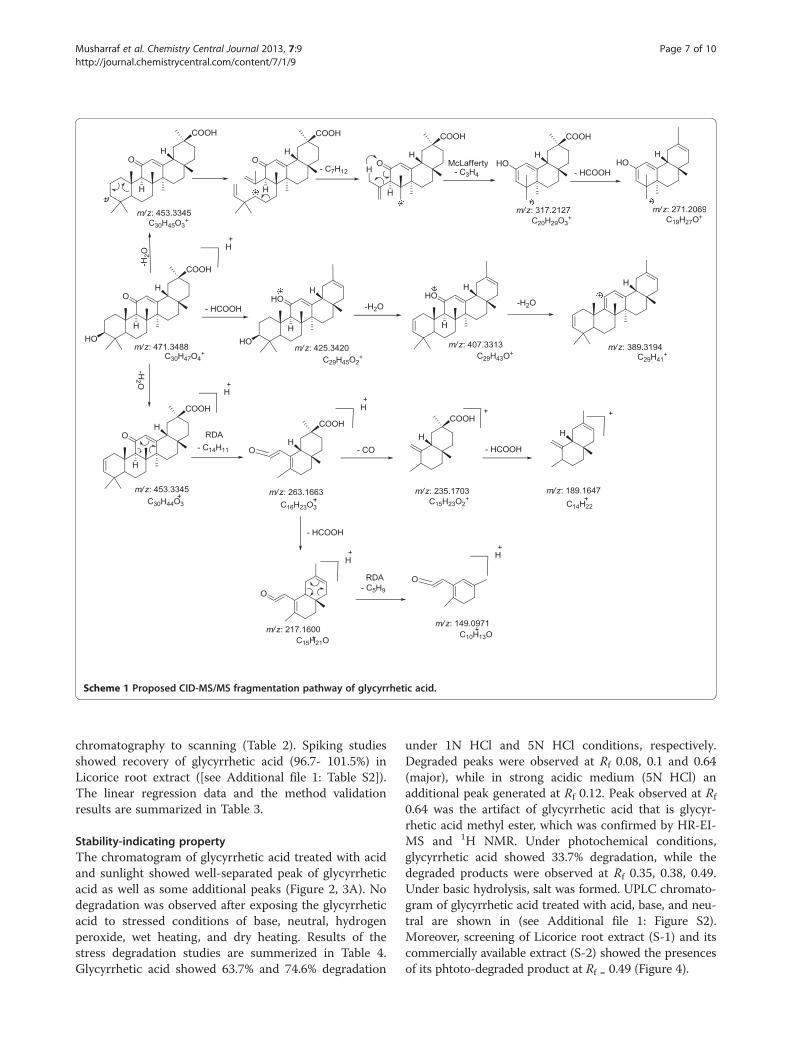
Scheme 1 Proposed CID-MS/MS fragmentation pathway of glycyrrhetic acid.
Musharraf et al. Chemistry Central Journal 2013, 7:9 Page 7 of 10http://journal.chemistrycentral.com/content/7/1/9
chromatography to scanning (Table 2). Spiking studiesshowed recovery of glycyrrhetic acid (96.7- 101.5%) inLicorice root extract ([see Additional file 1: Table S2]).The linear regression data and the method validationresults are summarized in Table 3.
Stability-indicating propertyThe chromatogram of glycyrrhetic acid treated with acidand sunlight showed well-separated peak of glycyrrheticacid as well as some additional peaks (Figure 2, 3A). Nodegradation was observed after exposing the glycyrrheticacid to stressed conditions of base, neutral, hydrogenperoxide, wet heating, and dry heating. Results of thestress degradation studies are summerized in Table 4.Glycyrrhetic acid showed 63.7% and 74.6% degradation
under 1N HCl and 5N HCl conditions, respectively.Degraded peaks were observed at Rf 0.08, 0.1 and 0.64(major), while in strong acidic medium (5N HCl) anadditional peak generated at Rf 0.12. Peak observed at Rf
0.64 was the artifact of glycyrrhetic acid that is glycyr-rhetic acid methyl ester, which was confirmed by HR-EI-MS and 1H NMR. Under photochemical conditions,glycyrrhetic acid showed 33.7% degradation, while thedegraded products were observed at Rf 0.35, 0.38, 0.49.Under basic hydrolysis, salt was formed. UPLC chromato-gram of glycyrrhetic acid treated with acid, base, and neu-tral are shown in (see Additional file 1: Figure S2).Moreover, screening of Licorice root extract (S-1) and itscommercially available extract (S-2) showed the presencesof its phtoto-degraded product at Rf = 0.49 (Figure 4).

Scheme 2 Proposed CID-MS/MS fragmentation pathway of photo-degradation product of glycyrrhetic acid (Peak 4).
Musharraf et al. Chemistry Central Journal 2013, 7:9 Page 8 of 10http://journal.chemistrycentral.com/content/7/1/9
MS/MS analysis of glycyrrhetic acid and itsphoto-degradation productsUPLC analysis of photo-degradation reaction mixture ofglycyrrhetic acid showed the elution of degraded pro-ducts within 3 min (Figure 3B). The retention times (Rt)and proposed formula of all the peaks are shown inTable 5. ESI-QqTOF-MS (positive mode) scan of gly-cyrrhetic acid and its degradation products showedpeak [M+H]+ at m/z 471.3488, 485.3263, 487.3450,and 457.3636, corresponding to the molecular formulaeC30H47O4 (calc. 471.3468), C30H45O5 (calc. 485.3263),C30H47O5 (calc. 487.3423) and C30H49O3 (calc. 457.3676),respectively.The ESI-MS/MS spectrum of [M+H]+ ions (m/z 471) of
glycyrrhetic acid (Peak 3), showed neutral loses of H2Oand HCOOH from [M+H]+ at m/z 453 [M+H - H2O]+,m/z 425 [M+H - HCOOH]+, m/z 407 [M+H - HCOOH -H2O]+, m/z 389 [M+H- HCOOH- 2H2O]+. Fragment atm/z 263 was supposed to be generated from m/z 453 byretro Diel-Alder cleavage of ring C, and fragment at m/z
235 was observed by the loss of CO from m/z 263. Subse-quent neutral loss of formic acid from m/z 235 formedthe product ion at m/z 189. Fragment at m/z 317 was sup-posed to be formed from m/z 453 by the loss of C10H16
moiety. Subsequent neutral loss of formic acid from m/z317 formed the product ion at m/z 271. The MS/MS spec-tra and mechanistic fragmentation pathway of glycyrrheticacid are shown in Figure 5a and Scheme 1, respectively.The ESI-MS/MS spectrum of [M+H]+ ions of m/z 485
(Peak 1) and m/z 487 (Peak 2) , showed only 14 and 16amu increase from glycyrrhetic acid, respectively. Charac-teristic MS/MS fragments are summarized in Table 5.These compounds were not isolated due to further degrad-ation during chromatographic processing, and theirstructures were not characterized due to missmatched fragmentation pattern with the available struc-ture according to the molecular formula in Dictionary ofNatural Products.The ESI-MS/MS spectrum of [M+H]+ ions (m/z 457) of
peak 4, eluting at retention time (Rt) 2.916 in UPLC,

Musharraf et al. Chemistry Central Journal 2013, 7:9 Page 9 of 10http://journal.chemistrycentral.com/content/7/1/9
showed neutral loss of H2O and HCOOH from [M+H]+
generated ions at m/z 439 [M+H - H2O]+, m/z 411 [M+H -HCOOH]+, m/z 393 [M+H – HCOOH - H2O]+ respec-tively. Fragment due to retro Diel-Alder cleavage of ringC was observed at m/z 249, m/z 203, and m/z 191 fromfragment m/z 439, m/z 393, and m/z 439, respectively.The MS/MS spectra and mechanistic fragmentation path-way are shown in Figure 5b and Scheme 2, respectively.Degradant (peak 4) showed only 14 amu difference incomparison to glycyrrhetic acid, while MS/MS spectrashowed similar fragmentation pattern as observed in gly-cyrrhetic acid. The structure of peak 4 was proposed as11-deoxy-glycyrrhetic acid. Isolation of this degradedproduct was carried out and the structure was also con-firmed by 1H and 13C NMR techniques.All proposed fragmentation pathways have been con-
firmed by accurate mass measurements, which are sum-marized in (Additional file 1: Table S3). Degraded productwas identified through comparative MS/MS studies withglycyrrhetic acid with the help of data base (Dictionary ofNatural products). Degradation product was searched inthe update Dictionary of Natural Products (DNP, version20.2) on the basis of deprotonated molecular mass and re-spective formulae for the identification of compound. Inthe case of more than one match, the search was nar-rowed down to the plant species (Glycyrrhiza glabra) andto the other species of Glycyrrhiza.
ConclusionThe developed and validated TLC-densitometric method isprecise, accurate, and stability-indicating for the quantifica-tion of glycyrrhetic acid in the presences of its degradationproducts. Glycyrrhetic acid showed extensive degradationin acidic and photochemical stress conditions, while stableto alkaline, neutral, oxidative, dry heating and wet heatingstress conditions. A photo-degradation product was alsocharacterized with the help of the ESI-QqTOF-MS/MSexperiments combined with accurate mass measurementsof precursor and fragment ions. The results showed theimportance of appropriate light protection during the drugdevelopment process, storage and handling.
Additional file
Additional file 1: Figure S1. Calibration curve for glycyrrhetic acid (200-1200 ng spot-1) at 254 nm. Figure S2. UPLC Chromatogram of (A) acidichydrolysis: peak 1, degradant (Rt = 0.21); peak 2, degradant (Rt = 0.278); peak 3,degradant (Rt = 0.441); peak 4, glycyrrhetic acid (Rt = 2.531); peak 5, degradant(Rt = 3.776), (B) basic hydrolysis (C) neutral hydrolysis. Table S1. Rf values ofglycyrrhetic acid in different mobile phases. Table S2. Recovery studies ofglycyrrhetic acid (n=3). Table S3. Elemental composition of daughter ions ofglycyrrhetic acid (m/z 471), and Peak 4 (m/z 457).
Competing interestsAuthors declare that they have no competing interests.
Authors’ contributionsSGM: Participated in the experimental designing and method optimization.NK: Performed the experiments and wrote the manuscript. QA: Involved inthe useful discussion and also participated in experimental work. All authorsread and approved the final manuscript.
Received: 24 October 2012 Accepted: 14 January 2013Published: 17 January 2013
References1. Rafi MM, Vastano BC, Zhu N, Ho CT, Ghai G, Rosen RT, Gallo A, Dipaola RS:
Novel polyphenol molecule Isolated from Licorice Root (Glycrrhizaglabra) Induces Apoptosis, G2/M Cell Cycle Arrest, and Bcl-2Phosphorylation in Tumor Cell Lines. J Agric Food Chem 2002, 50:677–684.
2. Han BH, Chi HJ, Han YM, Ryu KS: Screening on the antiinflammatoryactivity of crude drugs. Korean J Pharmacog 1972, 4:205–209.
3. Dehpour AR, Zolfaghari ME, Samadian T, Vahedi Y: The protective effect ofliquorice components and their derivatives against gastric ulcer inducedby aspirin in rats. J Pharm Pharmacol 1994, 46:148–149.
4. Inada Y, Watanabe K, Kamiyama M, Kanemitsu T, Clark WS, Lange M: In-vitroimmunomodulatory effects of traditional Kampo medicine (Sho-saiko-to:SST) on peripheral mononuclear cells in patients with AIDS. BiomedPharmacother 1990, 44:17–19.
5. Misra P, Pal NL, Guru PY, Katiyar JC, Tandon JS: Antimalarial activity oftraditional plants against erythrocytic stages of Plasmodium berghei. Int JPharmacog 1991, 29:19–23.
6. Sitohy MZ, El-Massary RA, El-Saadany SS, Labib SM: Metabolic effects ofLicorice roots (Glycyrrhiza glabra) on lipid distribution pattern, liver andrenal functions of albino rats. Mol Nutr Food Res 1991, 35:799–806.
7. Evans WC: Trease and Evans Pharmacognosy. 15th edition. London:Saunders; 2008:300–302.
8. Kim HK, Park Y, Kim HN, Choi BH, Jeong HG, Lee DG, Hahm K: Antimicrobialmechanism of β-glycyrrhetinic acid isolated from Licorice. Glycyrrhizaglabra. Biotechnol Lett 2002, 24:1899–1902.
9. Feng J, Chen W, Zhao Y, Ju X: Anti-tumor activity of oleanolic, ursolic andglycyrrhetinic acid. Open Nat Prod J 2009, 2:48–52.
10. Argekar AP, Kunjir SS: Quantitative estimation of 18-beta-glycyrrhetinicacid by HPTLC for standardization of polyherbal preparations of Licorice.J Planar Chromatogr 1996, 9:220–223.
11. Rathee P, Ratheeb S, Ahuja D: Simultaneous quantification ofglycyrrhetinic acid and apigenin using HPTLC from Glycyrrhiza glabraLinn. Eurasian J Anal Chem 2010, 5:95–103.
12. Singh B, Mungara P, Nivsarkar M, Anandjiwala S: HPTLC DensitometricQuantification of glycyrrhizin, glycyrrhetinic Acid, apigenin, kaempferoland quercetin from Glycyrrhiza glabra. Chromatographia 2009,70:1665–1672.
13. Sabbionia C, Ferrantia A, Bugamellia F, Fortib GC, Raggi MA: SimultaneousHPLC analysis, with isocratic elution, of glycyrrhizin and glycyrrhetic acidin Liquorice roots and confectionery products. Phytochem Analysis 2006,17:25–31.
14. Esmaeili S, Naghibi F, Mosaddegh M, Nader N: Determination of 18β-Glycyrrhetinic acid in glycyrrhiza glabra L. Extract by HPLC. Iran J PharmRes 2006, 2:137–141.
15. Cui S, Fu B, Lee FS, Wang X: Application of microemulsion thin layerchromatography for the fingerprinting of Licorice (Glycyrrhiza spp.).J Chromatogr B 2005, 828:33–40.
16. Montoroa P, Maldinia M, Russo M, Postorinoc S, Piacentea S, Pizza C:Metabolic profiling of roots of Liquorice (Glycyrrhiza glabra) fromdifferent geographical areas by ESI/MS/MS and determination of majormetabolites by LC-ESI/MS and LC-ESI/MS/MS. J Pharmaceut Biomed Anal2011, 54:535–544.
17. ICH, Q1A: Stability Testing of New Drug Substances and Products, Proceedingsof the International Conference on Harmonization. Geneva: IFPMA; 2000.
18. ICH Q1A (R2): Stability testing of new drug substances and products,proceedings of the International Conference on Harmonization. 2003.http://www.ich.org/fileadmin/Public_Web_Site/ICH_Products/Guidelines/Quality/Q1A_R2/Step4/Q1A_R2__Guideline.pdf.
19. Khera D, Kohli K, Parmar N: Development and validation of stability-indicating HPTLC method for determination of glycyrrhizic acid in bulkdrug and pharmaceutical formulations. J Liq Chrom Rel Technol 2011,34:1502–1517.

Musharraf et al. Chemistry Central Journal 2013, 7:9 Page 10 of 10http://journal.chemistrycentral.com/content/7/1/9
20. Musharraf SG, Iqbal N, Gulzar U, Ali A, Choudhary MA, Rahman Au: Effectiveseparation and analysis of E- and Z-guggulsterones in Commiphoramukul resin, guggulipid and their pharmaceutical product by highperformance thin-layer chromatography-densitometric method. J PharmBiomed Anal 2011, 56:240–245.
21. Musharraf SG, Iqbal N, Ahmed MA, Mazhar S, Choudhary MA: Screening ofE- and Z-guggulsterones in the gum-resin exudates of some commonplants and method validation in raw, extracted, and pharmaceuticalformulations of Commiphora mukul by HPLC. J Liq Chromatogra 2011,34:2103–2117.
22. Musharraf SG, Ul Arfeen Q, Shoaib M: Development and validation of TLC-densitometric method for the quantification of a steroidal drug, danazolin its pharmaceutical formulations. J Planar Chromatogr - Mod TLC 2012,25:331–337.
23. Musharraf SG, Fatima U, Sultana R: Stress degradation studies anddevelopment of stability-indicating TLC-densitometry method fordetermination of prednisolone acetate and chloramphenicol in theirindividual and combined pharmaceutical formulations. Chem Cent J 2012,6:7. doi:10.1186/1752-153X-6-7.
24. Musharraf SG, Gulzar U: Effective separation and simultaneous analysis ofanabolic androgenic steroids (AAS) in their pharmaceutical formulationsby a validated TLC-densitometry method. Chem Cent J 2012, 6:54.doi:10.1186/1752-153X-6-54.
doi:10.1186/1752-153X-7-9Cite this article as: Musharraf et al.: Stress degradation studies andstability-indicating TLC-densitometric method of glycyrrhetic acid.Chemistry Central Journal 2013 7:9.
Open access provides opportunities to our colleagues in other parts of the globe, by allowing
anyone to view the content free of charge.
Publish with ChemistryCentral and everyscientist can read your work free of charge
W. Jeffery Hurst, The Hershey Company.
available free of charge to the entire scientific communitypeer reviewed and published immediately upon acceptancecited in PubMed and archived on PubMed Centralyours you keep the copyright
Submit your manuscript here:http://www.chemistrycentral.com/manuscript/
Related Documents
![Polymer Degradation and Stability · Polymer Degradation and Stability 98 (2013) 1439e1449. temperature [7e9]. Another drawback of using NFC is the difficulty in dispersing them](https://static.cupdf.com/doc/110x72/5f1fa3935ae3113fa263fe87/polymer-degradation-and-stability-polymer-degradation-and-stability-98-2013-1439e1449.jpg)


![Polymer Degradation and Stability · 2019-04-11 · Polymer Degradation and Stability 95 (2010) 2126e2146. ... improved characteristics compared to their individual components [12].Asamatteroffact,naturalbonematrixisanorganic/inorganic](https://static.cupdf.com/doc/110x72/5f1202493849b60c8e74f2d6/polymer-degradation-and-2019-04-11-polymer-degradation-and-stability-95-2010.jpg)