RESEARCH AND TE C H N 0 L 0 G Y H I G H L I G H T S National Aeronautics and Space Administration langley Research Center Hampton, Virginia 23681-0001 i i_ _i_ i i_ i!_ _i_ _!_!._ _!i_i_ i_iiii_i i_ i_ iiii _ii_ _ii_ii I I_:_ iIII_: _I Langley Research Center NASA Technical Memoranclum 4575

Welcome message from author
This document is posted to help you gain knowledge. Please leave a comment to let me know what you think about it! Share it to your friends and learn new things together.
Transcript

RESEARCH AND
TE C H N 0 L 0 G Y
H I G H L I G H T S
National Aeronautics andSpace Administration
langley Research CenterHampton, Virginia 23681-0001
i i_ _i_ i i_ i!_ _i_ _!_!._ _!i_i_ i_iiii_ii_ i_ iii i _ii_ _ii_iiI I_:_ iIII_:_I
Langley Research CenterNASA Technical
Memoranclum 4575


FOREWORD
The mission of the NASA Langley Research Center is to increase the knowledge
and capability of the United States in a full range of aeronautics disciplines and in
selected space disciplines. This mission will be accomplished by performing
innovative research relevant to national needs and Agency goals, transferring tech-nology to users in a timely manner, and providing development support to other
United States Government agencies, industry, and other NASA centers. This report
contains highlights of the major accomplishments and applications that have been
made by Langley researchers and by our university and industry colleagues during
the past year. The highlights illustrate both the broad range of research and tech-
nology (R&T) activities supported by NASA Langley Research Center and the con-
tributions of this work toward maintaining United States leadership in aeronauticsand space research. Tile report also describes some of the Center's most important
research and testing facilities. For further information concerning the report, con-
tact Dr. Michael F. Card, Chief Scientist, Mail Stop 110, NASA Langley Research
Center, Hampton, Virginia 23681, (804) 864-8985.
Paul F. HollowayDirector
111
PAGE _ I_OT FILMED

AVAILABILITY INFORMATION
The NASA program office and the corresponding Agency-wide Research and
Technology Objectives and Plans (RTOP's) work breakdown structures are listed inthe Contents for each research and technology accomplishment. OA designates the
Office of Aeronautics; OACT designates the Office of Ac vanced Concepts and
Technology; OSSA designates the Office of Space Science and Applications; OSSD
designates the Office of Space Systems Development; and AA designates the Asso-ciate Administrator.
The accomplishments are grouped in 10 strategic thrusts including contributions
in Critical Technologies, Subsonic Aircraft, High-Speed Civil Transport, High-
Performance Military Aircraft, Hypersonic and Transatmospheric Vehicles, Space
Transportation, Space Platforms, Space Science, Facilities, and Technology Transferand Commercial Development. In addition, descriptiol_s are included of some of
the most important Aerospace Test Facilities at the NAS.\ Langley Research Center.The use of these facilities in the research described hereto is noted in the Contents.
For additional information on any summary, contact the individual identified
with the highlight. This individual is generally either a member or a leader of the
research group submitting the highlight. Commercial t.:lephone users may dial the
listed extension preceded by (804) 86.
iv
CONTENTS
Foreword ........................................................................................................................................................................................ iii
Availability Infl_rmation ................................................................................................................................................................ iv
Technology Transfer Activities--FY 1993 ................................................................................................................................. xix
Critical Technologies
Analysis of Implicit Second-Order Upwind-Biased Stencils ......................................................................................................... 1
(OA 505-53-59): Thomas W. Roberts and Gary P. Warren
Hot-Film Probe for Use m Hypersonic Flow. ................................................................................................................................. I
(OA 505-59-50): Mark Sheplak, Catherine B. McGinley, Eric F. Spma, James E. Bartlett, and Ralph M. Stephens
Localized Transition and Turbulent Spot Fom_alion on a Flat Plate .............................................................................................. 2
(OA 505-59-50): Bart A. Singer and Ronald D. Joslin
Numerical Simulation of Variable-Density Compressible Shear Layers ....................................................................................... 3
(OA 505-59-50): Christopher A. Kennedy and Thomas B. Gatski
Noise Generation By Flow' Over Capacity ..................................................................................................................................... 4
(OA 505-59-52): J. C. Hardin
Algorithm Development fi)r Multielement Airfoil Computations .................................................................................................. 4
(OA 505-59-53: Low-Turbulence Pressure Tunnel): Daryl L. Bonhaus and W. Kyle Anderson
Efficient Time-Accurate Navier-Stokes Calculations .................................................................................................................... 5
IOA 505-59-53): N. Duane Melson, Harold L. Atkins, and Mark D. Sanetrik
Multiblock CFD Codes--A New Paradigm ................................................................................................................................... 6
(OA 505-59-53): Veer N. Vatsa and Christopher L. Rumsey
Sensitivity Derivatives for Mullidisciplinary Design Optimization Via Automatic Differentiation .............................................. 7
(OA 505-59-53): L. L. Green. A. Carle, C. H. Bischof, K. J. Haigler, and P. A. Newman
L!nstructured Viscous Grid Generation by Ad_,ancing-Layers Method ......................................................................................... 8
{OA 505-59-53): Shahyar Pirzadeh
Vortex-Flow _Prediction With Unstructured-Grid Euler Methodology. .......................................................................................... 9
(OA 5(/5-59-53): Farhad Ghaffari
Boundary-Layer Heat-Transfer Measurements on a Swept Semispan Wing ................................................................................. 9
IOA 505-59-53: f,-Ft_ot Transonic Pressure Tunnel): Cuyler Brooks and Charles Harris
Volumetric Three-Dimensional Velocily-Field Measurements Using Holographic Particle Image Velocimetry. ...................... 10
(OA 505-59-53 I: William M. Humphreys, Jr., James L. Blackshire, and Scott M. Bartram
Velocity Measurements of Unsteady Flo'_ Using Particle hnage Velocimetry. .......................................................................... 10
{OA505-59-53): William M. Humphreys, Jr., and Scott M. Bartram
Determination of Measurement Llncertainties of Wind-Tunnel Balances .................................................................................... I 1
(OA 5()5-5-541: John S, Tripp, Ping Tcheng, and Alice T, Ferris
Video Luminescent hnaging ......................................................................................................................................................... 13
(OA 505-59-54: 7- by 10-Foot High-Speed Tunnel): Lorelei Gibson and Michael Mitchell

SupersonicFlow-FieldInvestigationsUsingDopplerGlobalVelocimetry................................................................................13(OA505-59-54:UnitaryPlanWindTunnel):JamesF.Meyers
EffectsofType!1De-leerFluidonAircraftTireFrictionDeterminedinALDFTests..............................................................14(OA505-63-10:AircraftLandingDynamicsFacility): Thomas J. Yager, Sandy M. Stubbs,
Granville L. Webb, and William E. Howell
New Tire-Contact-Friction Algorithm Correlated With Shuttle Nose-Gear Tire Experimental Results ..................................... 15
(OA 505-63-10): John A. Tanner
Stochastic and Nonlinear Response and Acoustic Radiation From a Panel-Stringer Structure Near a Supersonic Jet ............... 15
(OA 505-63-401: Lucio Maestrello
Composite Scaling Studies Provide Better Understanding of Composite Laminates .................................................................. 16
(OA 505-63-50): Karen E. Jackson
Transonic Aeroelastic Phenomena Investigated lk_r Transport Model in TDT ............................................................................. 17
(OA 505-63-50: Transonic Dynamics Tunnel): Donald F. Keller and Stanley R. Cole
Micromechanics-Based Computer Code for Composites Stress Analysis ................................................................................... 18
(OA 505-63-5(1: Materials Research Laboratory): Rajiv A. Naik and J. H. Crews, Jr.
Flutter Study of Simple Business-Jet Wing Conducted in TDT ................................................................................................... 19
_()A 505-63-50: Transonic Dynamics Tunnel): Donald F. Keller
Gridless Solution Algorithm for Euler/Navier-Stokes Equations ................................................................................................. 19
(OA 505-63-50): John T. Batina
Tail Buffet of a Delta-Wing/Vertical-Tail Configuration ............................................................................................................ 21
(()A 505-63-50t: Samuel R. Bland, Osama A. Kandil, and Steven J. Masse}
Flexible Sv+ept Vertical-Surface Capability Added to CAP-TSD Aeroelasticity (ade ............................................................... 21
(OA 5()5-('t3-50): John T. Batina and Elizabeth M. Lee-Rausch
Multidisciplmary Design Optimization To bnpmve Aircraft Perlk_nnance ................................................................................ 22
(OA 505-63-5{)): Jarosla,,v Sobieski, Eric R. Unger, and Peter G. Coen
Calculation of Wing Flutter Characteristics Using a Navier-Stokes Aerodynamic Method ........................................................ 23
(OA 505-63 50: Transonic Dynamics Tunnel): Elizabeth M. gee-Rausch md John T. Batina
Implicit Shear Defommtion Model lk)r Rotor-Blade Analysis .................................................................................................... 23
(OA505-b3-50): MarkW. Nixon
Hypersonic Aeroelastic Analysis Method Using Steady CFD Aerodynamics ............................................................................ 24
t()A505-63-50): Robert C. Scott
Boeing 777 Flutter Model Test Completed in TDT ..................................................................................................................... 25
+,OA 505-b3-5(1: Transonic D+'+namics Tunnel}: Moscs G. Farmer and Jame! R. Florance
Cessna (2itation X Flutter-Clearance Test ..................................................................................................................................... 26
(OA 505-63-50, Transonic Dynamics Tunllelk Jost5 A. Rivera, Jr.. and ."+lo_es G. Farmer
Laser-Beam Welding o[ Alutninun>Lithium Structures ............................................................................................................. 26
(OA 5115-63-50k Cynthia L. Lath and Dick M. Royster
Methods for Detecting Objects Using Restricted Visibility Sensors ........................................................................................... 27
1OA5//5-64-131: Randall l.. Harris, Sr..andRangacharKasturi
Effects of ]tistorical and Predictive hlformation on the Ability to Predict Time tt, an Alert ....................................................... 28
tOAS05-64-13): AnnaC. Trujilh+
Pilot Cognitive Acti,.ilies for Flight Deck lnfornmtion Management ......................................................................................... 29
<.OA 505-64-13): Jon E. Jonsson and Michael T. Pahner
Pilot's Cogniti',e Representations of Flight Deck hlR+rmation Categories and Prinrities ............................................................ 30
(OA 505-64-13): Jon E. Jom,_,on and Wendell R. Ricks
vi

Methodfl_rExploringlnlbnnationRequirementsAssociatedwithCognitiveProcesses............................................................32(OA505-64-/3):WendellR.Ricks,CarlFeehrer,WilliamH.Rogers,andJohnS,Barry
CompilerandRun-TimeTechniquesforEfficientConcurrentObject-OrientedProgramming..................................................33(OA505-64-50):KathrynA.Smith
PARADIGMCompilerforDistributedMemoLvMulticomputers...............................................................................................33(OA505-64-50):KathrynA.Smith
Prototyping Environment for Real-Time Systems (PERTS) ........................................................................................................ 34
(OA 505-64-501: Kathryn A. Smith
System for Automated Learning of Heuristics ............................................................................................................................. 35
(OA 505-64-50): Kathryn A. Smith
Extended Cooperative Control Synthesis Methodology. .............................................................................................................. 35
(OA 505-64-52): John B. Davidson
Total Reliability Modeling Interface for Fault-Tolerant Architeclures ........................................................................................ 36
(OA 505-64-10): Sally C. Johnson
Nonlinear Modeling Using Multivariate Orthogonal Functions ................................................................................................... 37
(OA 505-64-52): Eugene A. Morelli
Pad-Abort-to-Runway Maneuvers for Lifting Reentry' Vehicles .................................................................................................. 38
(OA 505-64-52): E. Bruce Jackson and Robert A. Rivers
Elucidation of Phosphorescence Quenching in Photomagnetic Molecules by' Positron Annihilation Spectroscopy. .................. 3g
(OACT 506-43-1 I): Jag J. Singh, Abe Eftekhari, and S. V. N. Naidu
Frequency' Domain State-Space Identification Tools ................................................................................................................... 39
(OACT 506-43-5 [ ): Lucas G. Horta and Jer-Nan Juang
Trajectory Optimization Based on Differential Inclusion ............................................................................................................ 40
(OACT 232-01-04): Daniel D. Moerder
Advanced Inlk)nnation Processing System ................................................................................................................................... 41
OACT 506-59-61): FelixL. Pitts
Nondescent Technique for Conslrained Minimization ................................................................................................................. 41
()ACT 506-59-66): Daniel D. Moerder
Autonlatic Adaptive Finite-Element Mesh Refinement ............................................................................................................... 42
()ACT 506-63-53): Jerrold M. Housner
BVI Noise Prediction From Computed Rotor Aerodynamics ...................................................................................................... 43
(OA 532-06-36): C. L. Burley
Upper Atmosphere Research Satellite (UARS) Disturbance Experiment .................................................................................... 44
OACT 585-03-I 1): Stanley E. Woodard and William L. Grantham
Flexible Spacecraft Jitter Simulation and Analysis Tools ............................................................................................................ 46
OACT 585-03-11): W. KeilhBelvin
Subsonic Aircraft
Desulfurization of Ni-Based Superalloy Turbine Blades ............................................................................................................. 49
(AA307-51-13): R,A, Outlaw
Boeing 737 Pressure-lnslrnmented Wing ..................................................................................................................................... 50
(OA 505-59-I0: 14- by 22-I:ool Subsonic Tunnel): Brenda E. Gile
vii
Computational Aerodynanlics Applied m Transport High-Lift Flight Research ........................................................................ 50
tOA 505-5t? -10: Transport Systems Research Vehicle): Long P. Yip', Jay D. Flardin, and Julia H. Whitehead
Subsonic Flow Transition Detection Using an Infrared Imaging System .................................................................................... 51
IOA 505-59-50: Low-Turbulence Pressure Tunnel): Stephen E. Borg anti Ral_h D. Wtttson
Advanced Rotor-Blade Technology Evaluated in TDT ............................................................................................................... 52
(OA 505-63-3fl: Transonic Dynamics Tunnel): William T. Yeager. Jr., Kevin W. Noonan,
Mathew L. Wilbur, Paul H. Mirick, and Jeffrey D. Singlelon
Combined Tension and Bending Testing of Tapered Laminates .................................................................................................. 53
(OA 505-63-50: Materials Research Laboratory): T. K. O'Brien
Wind-Shear l)etection Performance of an Airborne Doppler Radar ............................................................................................ 54
(OA 505-64-12): Steven Harrah
Vertical-Wind Estimation Technique Evaluated From Radar Simulation and Flight-Test Data ................................................. 55
{OA 505-64-12): Dan D. Vicroy
Wind-Shear Data Sets Delivered for Certification of Airborne Forward-Look Sen:,ors .............................................................. 56
_,OA 505-64-121: David A. Himon
Feasibility of Airborne Use of Data Link of Terminal Doppler Weather Radar lnf:wmation ...................................................... 57
(OA 505-64-12): David A. Hinton
Wake-Vortex Research ................................................................................................................................................................. 5g
tOA 505-64-13k George C, Greene
Organizing Principles lbr Presenting Systems Fault Information to Commercial/drcraft Flight Crews .................................... 59
(()A 505-64-13): Bill Rogers and Paul C. Schulle
Reduction of Spurious Symptoms in Aircraft Subsystems Fault Monitoring .............................................................................. 60
(OA 505-64-13): William D. Shontz, Roger M. Records, and Paul C. Scbulte
Formal Methods Applied to the Reliable Computing Platform .................................................................................................... 61
tOA 505-64-50): Rick), W. Butler
Pictorial Flight Displays Provide Increased Traffic-Situation Awareness .................................................................................. 62
{OA 505-64-53): Anthony M. Busquets, Russell V, Parrish, Steven P. Will ares, and Dean E. Nold
Flight-Deck Funclinnal Requirements for 2005 High-Speed Transport ...................................................................................... 63
_OA 505-64-53).' K. W. Alter, D. M. Regal, and Terence S. Abbott
Development of Transonic Area-Rule Methodology .................................................................................................................. 64
(OA 505-69-10): Wawle D. Carlsen
Interface Technology for Structural Design and Analysis ........................................................................................................... 65
(OA 51(I-02-12): Jonathan B. Ransom
Transition Elements for Laminaled Composite Analysis ............................................................................................................. 66
(OA 510-(t2-12): Alexaqder Tessler
Tesl and Analysis of Stitched-RTM Wing Access-Door Panel ................................................................................................... 67
(OA 5 [0-02-12i Dawn C. Jegley
Analysis of Textile Preform Composites ..................................................................................................................................... 6_
_OA 510-02-12; Materials Research Laboratory): Rajiv A. Naik and C. C Poe
Cooperative NASA/Boeing/Pratt & Whimey Advanced Darted Propeller Inve ,tigation ............................................................ 69
(OA 535-03-10: 14- by 22-Foot Subsonic Tunnel): Zachary, T. Applin
Optimization of Actuator Arrays for Aircraft Interior Noise Control .......................................................................................... 69
{OA 535-03-11 ): Harold C. Lester
Finite-Element Algorithm l\_r Optimizing Noise Suppression of Lined Ejector,_ ........................................................................ 7 I
IOA 535-03-11): Willie Wtltson
viii

ShroudLengthEffectforDuctedPropellers................................................................................................................................7I(OA535-03-1l): OdilynL.SantaMaria,CarlH.Gerhold,andWilliamNuckolls
Mixer/EjectorLinerPerformance.................................................................................................................................................72(OA537-02-22):TonyL.Parrott
NonlinearAnalysisofStiffenedAluminumFuselageShellsWithLongitudinalCracks............................................................73(OA538-01-10):VickieO.Britt
Fatigue-LifePredictionMethodology...........................................................................................................................................73(OA 538-02-10; Materials Research Laboratory): J. C. Newman, Jr.
Verification of a Fracture Criterion for Multiple-Site Damage .................................................................................................... 74
(OA 538-02-10; Materials Research Laboratory): J. C. Newman, Jr., and D. S. Dawicke
Self-Nulling Electromagnetic Flaw Detector ................................................................................................................................ 75
(OA 538-02-11 ): John Simpson, Buzz Wincheski, Min Namkung, Jim Fulton, Shridhar Nath.
Ron Todhunter, and Jerry Clendenin
Portable Ultrasonic Instrument for Disbond and Corrosion Characterization in Aircraft ............................................................ 76
(OA 538-02-11 ): P. H. Johnston, N. M. Abedin, D. R. Prabhu, and N. Nathan
Thermal Bond Inspection System tbr Aircraft Structural Integrity .............................................................................................. 77
(OA 538-02-11): K. Elliott Cramer
Stress Imaging Via Differential Thermography ........................................................................................................................... 77
(OA 538-02-11 ): K. Elliott Cramer
Tilt-Rotor Fountain Flow Noise .................................................................................................................................................... 78
(O,A 538-07-13): David Conner, Ken Rutledge, and Mike Marcolini
High-Speed Civil Transport
Supersonic Laminar Flow Control Swept Cylindrical Model ...................................................................................................... 81
(AA 307-50-13; Supersonic Low-Disturbance Tunnel): William M. Kimmel
Detemaination of Flow Quality in Unitary Plan Wind Tunnel ..................................................................................................... 81
(OA 505-59-20: Unitary Plan Wind Tunnel): Jeffrey D. Flamm, Peter F. Covell, and Gregory S. Jones
Supersonic Wind-Tunnel Tests of Reference H Configuration .................................................................................................... 82
(OA 505-59-20: Unitary Plan Wind Tunnel): Gloria Hernandez and Peter F. Covell
A Modular, Remotely Actuated Missile Model System for Wind-Tunnel Testing ...................................................................... 83
(OA 505-59-30:. Unitary Plan Wind Tunnel): Jerry M. Allen
Part-Span Natural Laminar Flow High-Speed Civil Transport Concept ...................................................................................... 84(OA 505-69-20): Henri D. Fuhrmann
Automated Surface-Geometry Definition tbr a Complete High-Speed Civil Transport .............................................................. 85
(OA 509-10-11): Raymond L. Barger and Mary S. Adams
Assessment of High-Order-Accurate, Essentially Nonoscillatory Schemes ................................................................................ 85(OA 537-02-02): Harold Atkins
Application of Micromanipulators for Suppression of Supersonic Jet Noise ............................................................................... 86
[OA 537-02-22: Jet-Noise Laboratory): John M. Seiner, Michael K. Ponton, and Henry H. Haskin
Noise Reduction Through Acoustic Shielding By Multiple Jet Arrays ........................................................................................ 87
(OA 537-02-22): John M. Seiner, Bernard J. Jansen: and Michael K. Ponton
Flight Effects on Jet Shock Noise ................................................................................................................................................. 88
(OA 537-03-20): Thomas D. Norum
ix

Subjective Response to Recorded Sonic Booms .......................................................................................................................... 89
(OA 537-03-21: Acoustics Research Laboratory): Jack D. Leatherwood _md Brenda M. Sullivan
Absorption Theory Improves Prediction of Sonic-Boom Rise Time .......................................................................................... 90
(OA537-03-21): GerryMcAnmch
High-Speed Civil Transport Planlk)rm Tests ................................................................................................................................. 91
IOA 537-03-22: 14- by 22-Foot Subsonic Tunnel): Kevin J. Kjerstad
Low-Speed Tests of High-Speed Civil Transport ......................................................................................................................... 91
(OA 537-03-22: 14- by 22-Foot Subsonic Tunnel): Guy T. Kemmerly
F-16XL High-Lift Flight Experiments .......................................................................................................................................... 92
(OA 537-03-22: 16- by 24-Inch Water Tunnel): Clifford J. Obara and Susan J. Rickard
Low-Speed Wind-Tunnel Evaluation of Pressure-Sensitive Paint ............................................................................................... 93
(OA 537-03-22: Basic Aerodynamic Research Tunnel): Susan J. Rickarc,
Anthony E. Washbum, and Cliffi)rd J. Obara
Piloted Simulation Study of Airport/Community Noise ............................................................................................................... 94
(OA 537-03-22: Visual/Motion Simulator): Louis J. Glaab, Donald R. Riley, and Robert A. Golub
CFD Inviscid Analysis of F-16XL Configuration ........................................................................................................................ 94
(OA 537-03-22: 30- by 60-Foot Tunnel): Wendy B. Lessard
Correlation of Computed N-Factors and Experimental Transition Data on a Swept-Wing Leading Edge
m Math 3.5 Quiet Tunnel ..................................................................................................................................................... 95
IOA 537-03-23: Math 3.5 Quiet Tunnel): Venkit Iyer, Jama[ A. Masad, md Louis N. Cattafesta, III
A New NASA LaRC Multipurpose Prepregging Unit ................................................................................................................ 96
(OA 537-06-20: Pol)lneric Materials Laboratory): R. Baucom and S. W Ikinson
High-Performance Military Aircraft
Missile Base Pressure Drag ......................................................................................................................................................... 99
(OA 505-59-30: Unitary Plan Wind Tunnel): Floyd J. Wilcox, Jr.
Supersonic Aerodynamic Characteristics of Sidewinder Missile Variant Configurations ........................................................... 99
OA 505-59-30: Unitary Phm Wind Tunnel): A. B. Blair, Jr.
Supersonic Characteristics of an Outboard Control-Surface Wing Concept ............................................................................. 100
OA 505-59-30: Unitary Plan Wind Tunnel): Gaudy M. Bezos-O'Conn_ r and Peter F. Covell
Passive Shock/Boundary-Layer Interaction Control in Exhaust Nozzles .................................................................................. 101
(OA 505-59-30; 16-Foot Transonic Tunnel): Craig A. Hunter
Thrust-Vectoring Axisymmetric Ejector Nozzles ..................................................................................................................... 102
(OA 505-59-30, 16-Foot Transonic Tunnel): Milton Lamb
Tumbling Research .................................................................................................................................................................... 102
(OA 505-59-30: 20-Foot Vertical Spin Tunnel, 3(7- by 60-Foot Tunnel): C. Michael Fremaux
Canard-Rotor-Wing ................................................................................................................................................................... 103
(OA 505-59-36; 14- by 22-Foot Subsonic Tunnel): W. Todd Hodges
Commercial Turbofan Engine Exhaust Nozzle Flow ................................................................................................................. 104
(OA 505-62-30): Khaled S. AbdoI-Hamid and John R. Carlson
Computational Prediction of Isolated Perfonnance of an Axisymmetric Nozzle at Mach 1.2 ................................................... 105
(OA 505-62-30): John R. Carlson and Kristina Alexander
Supersonic Secondary Flows Using Nonlinear k-c Model ......................................................................................................... 105
(OA 505-62-30): Balakrishnan Lakshmanan

FluidicThrustVectoringofaJet-EngineExhaustStream.........................................................................................................(OA505-62-30:16-FootTransonicTunnel):DavidJ.Wing
F/A-tBE/FStabilityandControlDesignStudies........................................................................................................................(OA505-68-30:30-by60-FootHigh-SpeedTunnel):GautamH.Shah,SueB.Graflon.andDanielG.Murri
SurfacePorosityEffectsonVortexInteractions.........................................................................................................................(OA 505-68-30; 7- by 10-Foot High-Speed Tunnel}: Gary E. Erickson
Actuated Nose Strakes fl)r Enhanced Rolling (ANSER) Flight Experiment ..............................................................................
(OA 505-68-30): Daniel J. Dicarlo, Mark T. Lord, and Daniel G. Murri
106
I O7
108
109
Hypersonic and Transatmospheric Vehicles
Numerical Simulation of Shock-lnduced Combustion Past Blunt Projectiles Using Shock-Fitting Technique ........................ 11
OA 505-62-40): J. K. Ahuja, A. Kumar, D. J. Singh, and S. N. Tiwari
Interpretation of Waverider Performance Data Using Computational Fluid Dynamics ............................................................. 12
(OA 505-70-59): Charles E. Cockrell, Jr.
Scramjet Exhaust Simulation Modeling ..................................................................................................................................... 13
(OA 505-70-59): Kenneth E. Tatum and Lawrence D. Huebner
Large-Eddy Simulation of High-Speed Transitional Boundary Layers ..................................................................................... 14
(OA 505-70-62t: Nabil M. El-ttady
Ramjet Perlommnce hnprovement Through Use of Bodyside Compression ............................................................................ 14
(OA 505-70-62: Math 4 Blowdown Facility): Patrick E. Rodi and Grifl'in Y. Anderson
Scramjel Fuel-Mixing Estimates in HYPULSE Expansion Tube Facility Using Mie Imaging ................................................. 15
OA 505-70-62: Scram jet Test Complex): R. Clayton Rogers, Elizabeth H. Weidner, and Robert D. Binner
High-Speed Scramjet Injector Design ........................................................................................................................................ 16
(OA 505-70-62): Charles R. McClinton and David W. Riggins
Visualization of Math 2 Vitiated Air Using Planar Laser-Induced Fluorescence ...................................................................... 17
_OA 505-70-62): R. Jeffrey Balla
Carborane-Based Oxidation lnhibitors for Carbon-Carbon Composites .................................................................................... 18
(OA 505-70-63: Structures and Materials Research Laboratory): Wallace L. Vaughn
Multilayer Lightweight Coating for Titanium-Based Materials ................................................................................................. 18
(OA 505-70-63): R. K. Clark and K. E. Wiedemann
Effect of Aeropropulsive-Elastic Interactions on Hypersonic Vehicles ..................................................................................... 19
(OA 505-70-64): D. L. Raney, J. D. McMinn, and A. S. Pototzky
Hypersonic Airbreathing Vehicle Design/Optimization Code ................................................................................................... 120
(OA 505-70-69): John G. Martin and James L. Hunt
Vibrational Relaxation in Hypersonic Flow Fields .................................................................................................................... 121
()ACT 51)6-4{)-62): W. E. Meador, M. D. Williams, and G. A. Miner
Aerolhermodynamics of a MESUR Mars Entry ......................................................................................................................... 122
OACT 506-40-91): Robert A. Mitcheltree
Nonequilibriuf,_ Flow Code Developed for Prediction of Flight Shock-Shock Interference Aerothem'ml Loads ..................... 122
(OACT 506-43-31 ): Allan R. Wieting
New Wing Concept for Reducing Supersonic lnviscid Drag ..................................................................................................... 123
(OACT 506-43-3 I): James L. Pittman
xi

CFDEvaluationofBase-PressurizationMethods.....................................................................................................................124(OA7(O-OI-e,l): Chat'los R. McClinl,,,n and Pa,ul H. Viii
Structural Amtlvsis of H.\ pcrstmic Vehicles .............................................................................................................................. 125
(OA 763-01-61): Craig S. Collier and James L. Hunt
Symmetric Scram.iel Free-Flight E',,.l',crimct_t ............................................................................................................................ 126
(()A 763-t0-_1 ): C. R. McClinton, A. D. Dilley. and R. W. Ha',vkins
ttypersonic Slender-Body Boundar)-l_ayer Transition .............................................................................................................. 127
(OA 763-23-35: 31-1nch Math I0 Tunnel, 22-Inch Math 20 Helium Tunnel I: Scott AI Berry
Hypersonic Shock-Shock Interactions ....................................................................................................................................... 128
(OA 763-23-35: Scramjet Text Complex): Scott A. Berry
Fatigue of 1()/c}012s SCS-¢_/Ti-15-3 Composite Under Generic H_pcrsonic Vehicle Flight Simulation .................................... 12 t)
(OA 7(_3-23-45: Materials Research Laboratory): M. Mirdamadi and W. b;. Johllson
Mea',urc,_ent and Prediction of High-Temperature Cyclic Deformation in Tila fium Matrix Composiles ............................... 13(1
_()A 763-23-45: Materials Research Labor;.ttor} ): M. Mirdamadi and W. S. Johllson
Nonlinear Thermoacouslic Response Method lot MSC/NASTRAN ......................................................................................... 13 I
IOA 703-23-45): J:-o H. Robinson
Flutter Characteristics of a NASP Model Determined in TDT .................................................................................................. 131
(OA 763-23-45: "['ransonic D\ namics Tunnel): Stanley R. Cole
Space Transporlalion
Development of a Green's Function Code for Cosmic Radiation Protection ............................................................................. 35
OSSA 19t)-45-16): J. L. Shinn
Ground Facilip, Simulations of Shuttle Orbiter Hypersonic Aerodynamics ............................................................................. 36
()ACT 5Ob-40-41: Hypcrstmic Facilities Complex): JohnW. Paulson. J ., and Gregory J. Brauckmann
()rbiter Experiments (OEX) Aerothermodynamics Symposium ............................................................................................... 36
()ACT 506-40-01): David A. Throckmorton
A Multiblock Analysis for Shuttle Orbiter Reentry Heating From Mach 24 to Math 12 .......................................................... 37
(OA('T 5(16-40-t) 1): Peter A. Gnoflo and K. James Weihnuenster
Navier-Stokes Analysis of Shuttle Orbiter Pitching-Moment Anomaly. .................................................................................. 38
()ACT 506-40-91 ): K. James Weihnuenster
An Engineerirlg Method lot Calcuktting Heating on General Three-Dimensiotml Flight Vehicles ........................................... 39
(OACT 50(_-40-t) 1): H. Harris Hamilton II and Francis A. Greene
Blunt-Body Wake Flmvs ............................................................................................................................................................ 40
()ACT 506-40-91): James N. Moss, Richard G, Wihnolh, Robert A. M tcheltree, and V irendra K. Dogra
Aerodynamics of Shuttle Orbiter at High Altitudes ................................................................................................................... 141
OACT 506-40-911: Didier F. G. Rault
Flight Results of Orbital Acceleration Research Experiment (()ARE) ..................................................................................... 141
()ACT 506-48-I I): Robert C. Blanchard
Entry-Vehicle Configuration Optimization Using Response-Surfitce Methods ......................................................................... 142
(()ACT 506-49-1 I): Douglas Stanley
Fuschv,ee Internal Structural Modeling ....................................................................................................................................... 143
(()ACT 5(16-49-11t: Mark L. McMillin
xii

Dual-FuelRocketPropulsion['orSingle-StageVehicles............................................................................................................(OACT506-49-1I): RogerA.Lepsch,Jr.
Single-Stage-to-OrbitAdvancedMannedLaunchSystemConcept..........................................................................................(OACT506-49-11andOSSD906-I1-01t: DougiasO.Stanley
DataflowDesignToolforMultiprocessingSystems..................................................................................................................(OACT586-03-I): RobertL.JonesandPaulJ.Hayes
144
145
145
Space Platforms
Design and Fabrication of an Ultrastable Composite Optical Bench .......................................................................................... 149
(AA 307-51 - 13: Polymeric Materials Laboratory): Timothy W. Towell
Space Station Berthing ................................................................................................................................................................ 150
IOSSD 476-14): Richard A. Russell and Michael Heck
Design Reference Mission Specifications for European Space Agency, Automated Transfer Vehicle ...................................... 150
(OSSD 476-14-061: William M. Cirillo
Accommodation of a Soyuz TM as an Assured Crew Return Vehicle ....................................................................................... 151
(OSSD 476-14-06): Jonathan Cruz, Marston Gould, and Eric Dahlstrom
Configuration Analysis for Space Station Redesign ................................................................................................................... 15[
OSSD 476-14-151: Patrick A. Troutman
Space Station Assembly and Operations at High Orbital Inclinations ....................................................................................... 152
OSSD 470,-14-15): Patrick A. Troutman
Spacecraft Contamination Investigation by Direct-Simulation Monte Carlo Analysis--Application to UARS/HALOE ........ 152
OACT 506-40-91): Didier F. G. Rault and Michael Woronowicz
Rapid Processing of Carbon-Carbon Composite Materials ........................................................................................................ 153OACT 51)6-43-1 I ): Howard G. Maahs
Low Earth Orbit Environmental Effects on Materials ................................................................................................................ 153
OACT 5(t6-43-61 ): J. G. Funk
Improved Near-Earth Meteoroid Environment Model ............................................................................................................... 154
OACT 506-43-61 ): Donald H. Humes
New Postlaunch Satellite Calibration Technique ....................................................................................................................... 155
OSSA 578-12-23): Charles H. Whitlock
EOSSIM: A Linear-Simulation and Jilter-Analysis Package .................................................................................................... 156
OACT 585-03-11): Peiman G. Maghami, Sean P. Kenny, and Daniel P. Giesy
Fluid Dynamics of Chemical Vapor Deposition ......................................................................................................................... 157
OSSA 674-24-06: Velocimetry Laboratory): Ivan O. Clark
Automated Structural Assembly Research Completed ............................................................................................................... [58
OACT 586-02- I I ): Ralph W. Will
Hydraulic Manipulator Testbed Controlled Remotely from JSC ............................................................................................... 158
OACT 586-1)2- I I ): Plesenl W. Goode IV
Semiconductor Laser for Free-Space Optical Communications ................................................................................................. 159
OACT 590-31 - 1 I): Herbert D. Hendricks
Radar and Antenna Tests of End-Mass Payload 1or Small Expandable Deployer Systems ....................................................... 159
OSSD 906-30-04; Low-Frequency Antenna Test Facility): Robin L. Cravey,
Melvin Gilreath, and Erik Vedeler
xiii

SpaceScience
ESTAR Mission Analyses .......................................................................................................................................................... 163
OSSA 422-20-01 ): J. W. Johnson and W. A. Sasamoto
Gravity and Magnetic Earth Surveyor Subsatellite .................................................................................................................... 163
tOSSA 422-20-01 t: J. W. Johnson. M. L. Heck, R. R. Kumar, and D. D. Iklazanek
E vesalk" Ho:YAG Lidar for Cloud Monitoring .......................................................................................................................... 164
(OSSA 460-41-41 I: David M. Winker
Remote Sensing of Muhi[eve[ Clouds ....................................................................................................................................... 164
OSSA 460-43-49): Bryan A. Baum
First Measurements of Biogenic Emissions of Nitrogen Oxides Obtained From African Soils ................................................ 165
OSSA 463-67-07): Joe[ S. Levine, Wesley R. Coter lit, and Donald R. ('ahoon. Jr.
Measurements of Pressure Broadening and Shifts of Ozone Infrared Lines Near 3 ,urn ............................................................ 166
/OSSA 464-23-1)8): Mary Ann H. Smith
Rapid Computation of Earth-Limb Emission in Non-LTE Environment ................................................................................... 167
OSSA 464-23-22): Martin G. Mlynczak
TRACE-A ................................................................................................................................................................................... 167
OSSA 464-54-[)7): Jack Fishman and James M. Hoell, Jr.
Airborne Measurements of Trace-Gas Emission/Deposition Rates ........................................................................................... 168
OSSA 464-54-13): John A. Ritter, John D. W. Barrick. and Catherine Watson
Airborne Lidar Measurements of Ozone and Aerosols Over Tropical Atlantic ........................................................................ [69
OSSA 464-54-16): Edward V. Browell
Global Surface Albedos Estimated From ERBE Dale ................................................................................................................ 170
OSSA 578-12-24): W. Frank Staylor
Effects of Mount Pinatub_ Eruption on Earth's Radiation Budget ........................................................................................... 171
OSSA 578-[2-70): Patrick Minnis
E_,rlh Radiation Budget Experiment Observations t_t Recent ENSO Events ............................................................................. 171
(OSSA 578-12-70): Edwin F. Harrison
Nonlocal Thermodynamical Equilibrium in Upper Atmosphere Carbon Dioxide ..................................................................... 172
OSSA 618-21-001: Curtis P. Rins[and
Global Effects of Mounl Pinatubo Eruption .............................................................................................................................. 173
OSSA 665-45-53): Lamont R. Poole
Antarctic Polar Vortex Processes ............................................................................................................................................... 174
OSSA 665-45-53): L. W. Thomason
Heterogeneous Chcnfislry on Stratospheric Aerosols ................................................................................................................. 174
{OSSA 665-45-55): Joseph M. Zawodny
SEI)S End Mass lnslrumenlalion ............................................................................................................................................... 175
IOSSA 967-30-30): John K. Quinn
Facilities
Thermoelectric Devices for Thennal Instrumentation Enclosures ............................................................................................. 179
(OA 505-59-30: National Transonic Facility): Mark Hutchinson
New Technique Used for Wing-Twist Measurements ............................................................................................................... 179
(OA 5t)5-59-54: National Transonic Facility): A. W. Burner and L. R. Owens
xiv

Fuzzy-LogicControlofWind-TunnelTemperature...................................................................................................................180(OA505-70-59;HypersonicBlowdownTunnels):DavidA.GwaltneyandGregoryL.Humphreys
HypersonicWind-TunnelNozzleDesign...................................................................................................................................181(OACT506-40-41;22-InchMach20HeliumTunnel):JeffreyS.HodgeandJohnJ.Korte
Flow-QualityImprovement Hardware for 8-Foot High-Temperature Tunnel ........................................................................... 181
(OACT 506-43-31; 8-Foot High-Temperature Tunnel): Peyton B. Gregory
Expansion of the Research Aircraft Ground Station Facility ..................................................................................................... 182
(OACT 506-48-11): Herbert R. Kowitz
Optical Measurement System ..................................................................................................................................................... 183
(OACT 506-59-61): Sharon S. Welch
Technology Transfer and Commercial Development
Surgical Force Detection Probe .................................................................................................................................................. 187
(OACT 141-20-40): Ping Tcheng, Paul Roberts, Regina Courts, and Taumi Daniels
Remote-Data-Logging Groundwater Seepage Meter ................................................................................................................. 187
(OACT 141-30-10): Harry G. Walthall
Design of Low-Thermal-Conductance Cryogenic Support ........................................................................................................ 188
(OACT 142-20-14): Ruth M. Amundsen and Jill M. Marlowe
Evaluative Testing of Adhesives for Cryogenic Applications .................................................................................................... 188
(OACT 142-20-14): Ruth M. Amundsen and Charles E. Jenkins, Jr.
A Novel Multiphase Fluid Monitor ............................................................................................................................................ 190
(AA 307-50-12): Jag J. Singh, Danny R. Sprinkle, S. V. N. Naidu, and Abe Eftekhari
Interactive Surface Grid Quality Analysis .................................................................................................................................. 190
(OA 505-59-53): P. A. Kerr
Proposed Design for Carriage Wheels of Aircraft Landing Dynamics Facility ......................................................................... 192
(OA 505-63-10; Aircraft Landing Dynamics Facility): Regina L. Spellman
Structural Modeling and Analysis of Aortic Aneurysm From CAT Scan Data ......................................................................... 192
(OA 505-63-50): Stephen J. Scotti
Externally Accessible Pressure Instrumentation Insert ............................................................................................................... 193
(OA 505-63-50): Christopher M. Cagle
Wing-Tip Boom for Flight Application on OV-10A Research Aircraft ..................................................................................... 194
(OA 505-64-13): William D. Lupton
Vibratory Stress Relief Welding Technology ............................................................................................................................. 195
(OACT 506-43-31 ; 8-Foot High-Temperature Tunnel): Gerald Miller
Boresight--A Two-Axis Alignment System for Lidar In-Space Technology Experiment (LITE) ........................................... 195
(OACT 506-48-01): Ruben G. Remus, James E. Wells, and Clayton P. Turner
A Space-Qualified Laser Transmitter ......................................................................................................................................... 196
(OACT 506-48-01 ): Christopher L. Moore
Damage Tolerance of Braided Composites ................................................................................................................................ 197
(OACT 510-02-12; Materials Research Laboratory): C. C. Poe, Jr., W. C. Jackson,
M. A. Portanova, and John E. Masters
Experimental Methods and Stress-Analysis Models for Time- and Temperature-Dependent
Behavior of Polymer Composites ....................................................................................................................................... 198
(OA 537-06-20; Materials Research Laboratory): Tom Gates
XV

FRANC: FRacture ANalysis Code ........................................................................................................................................... 198
(OA 538-02-10: Materials Research Laboratory): C. E. Harris, A. R. lngraffea,
D. V. Swenson, and D. S. Dawicke
Quantitative Experimental Stress Tomography ......................................................................................................................... 199
(OA 538-02-1 I): William P. Winfree
Electronic Shearography. ........................................................................................................................................................... 200
(OA 538-02-1 I): Robert S. Rogowski, Leland D. Melvin, and John B. Deaton
High-Temperature Fiber-Optic Microphone .............................................................................................................................. 200
(OA 763-01-51 ): William E. Robbins and Allan J. Zuckerwar
NASSTAR: An Instructional Link Between MSC/NASTRAN and STAR ............................................................................. 201
(OSSD 967-30-30): Jill M. Marlowe
Aerospace Test Facilities
30- by 60-Foot Tunnel ................................................................................................................................................................ 205
(Contact: Frank Jordan, 411361
Low-Turbulence Pressure Tunnel ............................................................................................................................................... 205
(Contact: Michael J. Walsh, 45542)
20-Foot Vcrtical Spin Tunnel ..................................................................................................................................................... 206
(Contact: Raymond D. Whipple, 411941
14- by 22-Foot Subsonic Tunnel ................................................................................................................................................. 206
(Contact: Harry L. Morgan, Jr., 41069)
g-Foot Transonic Pressure Tunnel .............................................................................................................................................. 207
(Contact: James M. Luckring, 42869)
Transonic Dynamics Tunnel ...................................................................................................................................................... 207
Contact: Bryce M. Kepley, 41244)
16-Foot Transonic Tunnel ........................................................................................................................................................... 208
Contact: Bobby L. Berrier, 43001 )
National Transonic Facility ........................................................................................................................................................ 209
Contact: Dennis E. Fuller, 45129)
0.3-Meier lransonic Cryogenic Tunnel ..................................................................................................................................... 209
Contact: Stuart G. Flechner, 46360)
Unitary Plan Wind Tunnel ......................................................................................................................................................... 210
Contact: William A. Corlelt, 45911)
Hypersonic Facilities Complex .................................................................................................................................................. 210
Contact: C.G. Miller, 452211
Scramjet Test Complex .............................................................................................................................................................. 211
Contact: R. Wayne Guy, 46272)
Aerothemml Loads Complex ..................................................................................................................................................... 212
Contact: Allan R. Wieting, 41359)
Acoustics Research Laboratory .................................................................................................................................................. 213
Contact: Lorenzo R. Clark, 43637)
Avionics Integration Research Laboratory (AIRLAB) ............................................................................................................... 213
Contact: Charles W. Meissner, Jr., 46218)
xvi

AerospaceControlsResearchLaboratory..................................................................................................................................214(Contact:DouglasPrice,46605)
TransportSystemsResearchVehicle(TSRV)andTSRVSimulator.........................................................................................215(Contact:GeorgeSteinmetz,43842,BillyAshworth,andJacobA.Houck)
Enhanced/SyntheticVision& SpatialDisplaysLaboratory.......................................................................................................216(Contact:JackHatfield,42012)
HumanEngineeringMethodsResearchLaboratory...................................................................................................................216(Contact:AlanPope,46642)
GeneralAviation Simulator ........................................................................................................................................................ 217
(Contact: Lemuel E. Meetze, 46452)
Differential Maneuvering Simulator ........................................................................................................................................... 217
(Contact: Lemuel E. Meetze, 46452)
Visual/Motion Simulator ............................................................................................................................................................ 218
(Contact: John D. Rollins, 46448)
Space Simulation and Environmental Test Complex ................................................................................................................. 219
(Contact: Thomas J. Lash, 45644)
Space Environmental Effects Laboratory ................................................................................................................................... 220
(Contact: Wayne S. Slemp, 41334)
Advanced Technology Research Laboratory .............................................................................................................................. 220
(Contact: E. J. Conway, 41435)
Spacecraft Dynamics Laboratory ................................................................................................................................................ 221
(Contact: Robert Miserentino, 44318)
lntravehicular Automation and Robotics (IVAR) Laboratory .................................................................................................... 222
(Contact: Ralph W. Will, 46672)
Materials Research Laboratory ................................................................................................................................................... 223
(Contact: Charles E. Harris, 43449)
Structures and Materials Research Laboratory ........................................................................................................................... 223
(Contact: James H. Statues, 43168)
Polymeric Materials Laboratory ................................................................................................................................................. 224
(Contact: R. Baucom, 44252)
Low-Frequency Antenna Test Facility ....................................................................................................................................... 225
(Contact: Thomas Campbell, 41772)
Compact Range Facility .............................................................................................................................................................. 225
(Contact: Thomas Campbell, 41772)
Experimental Test Range ............................................................................................................................................................ 226
(Contact: Thomas Campbell, 41772)
Impact Dynamics Research Facility ........................................................................................................................................... 226
(Contact: Granville Webb, 41303)
Aircraft Landing Dynamics Facility ........................................................................................................................................... 227
(Contact: Granville Webb, 41303)
Flight Research Facility .............................................................................................................................................................. 228
(Contact: Harry Verstynen, 43875)
16- by 24-Inch Water Tunnel ...................................................................................................................................................... 228
(Contact: Bobby L. Berrier, 43001)
xvii

ScientificVisualizationSystem.................................................................................................................................................229(Contact:BillvonOfenheim,46712)
GeometryLaboratory(GEOLAB)..............................................................................................................................................230(Contact:EricL.Everton,45778)
SupersonicLow-DisturbancePilotTunnel.................................................................................................................................231(Contact:MichaelJ.Walsh,45542)
PyrotechnicTestFacility............................................................................................................................................................23I(Contact:LaurenceJ.Bement,47084)
ProbeCalibrationTunnel............................................................................................................................................................232IContact:GregoryS.Jones,41065)
ContributingOrganizations
Aeronautics Directorate ............................................................................................................................................................. 235
Electronics Directorate .............................................................................................................................................................. 236
Flight Systems Directorate ......................................................................................................................................................... 236
National Aero-Space Plane Office ............................................................................................................................................. 237
Space Directorate ....................................................................................................................................................................... 237
Structures Directorate ................................................................................................................................................................ 238
Systems Engineering and Operations Directorate ..................................................................................................................... 239
Technology [hilization and Applications Office ....................................................................................................................... 239
xviii

TECHNOLOGY TRANSFER
ACTIVITIES---FY 1993
The development of new aeronautical technologies and their transfer to
American commercial markets have been the major goals of NASA dating back to
the founding of its predecessor NACA and the Langley Laboratory in 1917. In that
year, the United States had only 23 airplanes, compared to France's 1400,Germany's 1000, Russia's 800, and the United Kingdom's 400. Working with the
aviation community in this country to develop and commercialize innovative
aircraft designs and technologies through a variety of experimental and theoreticalresearch studies, NACA played a crucial role in the rise of the American aero-
nautics industry from "worst to first" in the world. Aeronautics exports now pro-vide by far the largest net positive contributor ($30 billion) to our overall balance of
payments posture in world trade. Well over half of allworld aerospace products
are presently manufactured in the United States, providing productive jobs for overa million Americans and sales of about $100 billion.
Despite the strength of our position in this global industry, it cannot be taken for
granted. Since the 1970's, America's share of the world aerospace market has fallen
by approximately 20 percent because of aggressive competitors in Europe and the
Pacific Rim. In response to these challenges, NASA Langley Research Center has
dedicated itself to a renewed focus on the transfer of its innovative aerospace
technologies to the aeronautical and non-aeronautical commercial marketplaces.
Langley is presently undergoing a major reorganization specifically to enhance andstreamline its focus on advanced technology and the processes for the transfer of
technology to industry for the commercialization of Langley research and technolo-
gy products. As a visible sign of this renewed focus, the highly successful TOPS(Technology Opportunities Showcase) was held with over 800 attendees from
industry, government, and academia on October 19-21, 1993, at Langley. Nearlytwo hundred Center-developed or Center-supported technologies with commercial
potential were exhibited.
Langley Research Center's technology transfer processes are many and varied;
often, they begin as a result of personal relationships or initiatives by Langleypersonnel at technical meetings or through cooperative exchanges. Langley Space
Act Agreements involve Boeing, Lockheed, and many other companies, both large
and small. These Agreements are similar to the CRADA's used by other govern-
ment agencies. Under Space Act Agreements, NASA can protect industry resultsand data from public disclosure for up to 5 years. The Small Business Innovative
Research (SBIR) program at Langley funds approximately 50 small businesses
across the country each year to show the feasibility of a technology concept; major
funding is provided for approximately half of those to go on to prototype construc-
tion, a crucial step before commercialization. There were 22 SBIR-developed tech-nologies displayed at TOPS. Langley has always been one of the most active NASA
Centers in applying for and acquiring patents for its technology products. In 1993,
there were 44 patents awarded at the Center. Langley's Technology Utilization
(TU) Office has had a long history of assisting the transfer of hardware and soft-
ware technology applications through the issuance of Technical Briefs (40 in 1993)
and spinoffs, by developing sources of funding support for commercializable
developments, and by transferring industry-ready computer codes to the Comput-er Software Management and Information Center (COSMIC) ®. In 1993, Langley
published 146 formal NASA reports and 185 journal articles and other publications;there were over 670 presentations by Langley personnel at technical meetings.
xix

There are numerous descriptions throughout this report of technology transfer
activities at Langley. This summary presents some of the most interesting
examples. One of Langley's collaborative relationships that has high commercial
potential involves the Digiray Corporation of San Rarnon, California. To improvethe resolution of standard dental X-ray photos, Digiray developed a device that
shoots through an object with a narrow X-ray, which then registers on a small
detector. This innovative approach eliminates most of the scattering that impairsthe resolution of standard X-ray photos, but the system is small enough to fit into
hard-to-reach places such as the inside of an airplane wing. At a national confer-ence, the head of Langley's Nondestructive Evaluation Sciences Branch saw sample
imagery and recognized the potential of the device as a simple and rapid means of
detecting aircraft structural fatigue or corrosion, or Space Shuttle material corro-
sion, fatigue, or erosion. Digiray and Langley have formed a partnership that is
expected to lead to the aerospace commercialization of the technology, with
possible extra applications such as the X-ray equivalent of a fiber-optic probe forinsertion into the body to get stereoscopic X-ray imaging without surgery.
A computational fluid dynamics (CFD) code developed at Langley was used to
redesign the engine pylon for the Douglas MD-11 airplane. This cooperative effortresulted in approximately a 0.8-percent reduction in airplane drag, which would
translate to a yearly per plane savings in fuel of about $48,000. Verified in Douglas'
flight tests, the modifications have been incorporated into the MD-11 aircraft; for
the anticipated fleet size (including both new and retrofitted aircraft), the modifica-tions are expected to constitute axi annual savings in Juel of about $8,000,000 per
year. Douglas has also been working recently with Langley to reduce the drag on
the C-17 airplane. Using wind-tunnel tests in the 0.3-Meter Transonic CryogenicTunnel, modifications to the wing trailing edge redu(ed the total drag. The range
increase afforded by the drag reduction will be quantified through flight tests. At
the same time, National Transonic Facility tests found drag reductions by modify-
ing the design of a previous Langley-developed techrology called "winglets". Both
of these results will be flight-tested with a C-17. Win_lets, wingtip devices mount-
ed at right angles to the wing to reduce drag produced by 3-D effects at the wing'send, have now been incorporated into a number of major transports, including the
Boeing 747-400, the McDonnell Douglas C-17, the MD-11, and the Airbus Industries
A-330 and A-340. Three new business jets also use wi nglet technology--the Cessna
Citation III, the Gulfstream IV, and the Canadair Challenger.
Developing a technology for mapping waste storal;e areas and closed nuclear
plants has been an important goal in waste-site analy_ds and cleanup operations. Athree-dimensional mapper using coherent laser radal technology has been
developed for such inspections; this mapper has higl- accuracy (better than 0.5
mm), is eye-safe, is immune to lightning effects, and .vorks remotely (up to 15 m).
Although it was originally developed for such NASA applications as topographical
inspections of the Space Station or the Shuttle therma I protection system, DOE has
now requested that the mapper be used in waste-site cleanup studies as well.Another application of coherent laser radar (CLR) te( hnology was developed
under a Langley SBIR by Coleman Research Corporation. The CLR Measurement
System has the potential to rapidly scan a bridge to determine whether unusualstatic deflections or rotations have occurred that could be symptomatic of damage
or distress. A demonstration was conducted in late 1993 of the system in which a
25-ft beam span was measured under a 200 000-1b load and was compared with theno-load condition to determine the profile change in the girder. The Federal High-
way Administration (FHWA) used a standard dial gr uge to measure the deflection
and compare it with the result from the CLR Measur,_ment System. The center-
point deflections were measured at 6.86 mm by the dial and 6.54 mm by the CLR;
XX
very good agreement was also obtained at various points along the girder. TheFHWA is interested in the system to assist their research in bridge inspection,
repair, and construction techniques.
A microburst is a meteorological phenomenon that occurs in or near thunder-
storms involving a blast of high-speed air from above that is often responsible for apotentially dangerous form of wind shear. Large and small aircraft can lose control
and crash with little or no warning. Between 1964 and 1985, there were over 26
U.S. airline accidents caused by such wind shears, with 626 fatalities and 200
injuries. The FAA mandated that airlines install some type of wind-shear detection,
warning device, or avoidance system by the end of 1993. NASA Langley Research
Center has worked with several avionics and airline companies, such as AlliedSignal Bendix, Rockwell International, Collins Air Transport Division, and
Westinghouse, to develop such predictive systems and has flight-tested prototypesof microwave, infrared, and laser-based devices to detect microburst-induced windshears. The FAA has extended until 1995 the deadline for airlines to install such
equipment because of their cooperative efforts with NASA. Boeing and Airbus are
already developing the interfaces and specifications for factory installation of wind-shear radars.
Laboratory simulations of the flux and kinetic energy of atomic oxygen bom-
bardment in low earth orbit have become critically important since the recognition
of the major corrosive effect this species has on satellite materials in space. Perhaps
the best high-speed atomic oxygen "gun" for spacecraft materials studies wasdesigned and constructed as a Langley Director's Discretionary Fund project. The
technology, which uses hot silver foil to dissociate molecular oxygen and an elec-
tron source to desorb satellite-speed atomic oxygen from the silver, received an
R&D 100 Award for 1993 and is being commercialized by Daco Technologies, Inc.
of Florida. One gun has been sold and there are a number of other interestedcustomers.
Some other examples of Langley technology transfer include the SUPRA
Scanner, a high-frequency ultrasonic scanner for diagnosing skin conditions and
disorders such as burn depth, wound healing progress, and precancerous lesion
measurements. The Langley-developed technology was commercialized byTOPOX, Inc. of Pennsylvania. In the area of polymer chemistry, IMITEC has been
a very active small business in commercializing Langley-developed polyimides.
Other companies that have found commercial applications for Langley polyimides
ill composites, fibers, optics, bar codes, spin coatings, wires, gaskets, and electronics
include DuPont, Lockheed, Northrop, Martin Marietta, IBM, Delco Remy-GM,
Barcel, Ford, Motorola, and Cytec (BASF).
The System/Observer/Controller/Identification Toolbox (SOCIT) was deve-
loped at NASA Langley Research Center for problems involving spacecraft dynam-
ics, but has now been distributed to over 40 companies, universities, and other
government agencies because of such applications as analysis of acoustic data fromsubmarines (Atlantic Aerospace Electronics Corporation), identification of models
for control design (Harris Corporation), and system identification of model
validation and control (Boeing).
xxi

RESEARCH AND
TECHNOLOGY
Critical Technologies
!
Pioneer the developmen_ of
innovative concepts and provide
the physical understanding and
the theoretical, experim,,ntal, and
computational tools required for
the efficient design and operation
of advanced aerospace sE/stems

RESEARCH AND TECHNOLOGY HIGHLIGHTS
Critical Technologies
Analysis of Implicit
Second-Order
Upwind-Biased Stencils
Implicit-difference schemes are
desirable when solving the Euler
and Navier-Stokes equationsbecause of their unconditional
stability. However, standard-
difference stencils developed for
structured grids do not easily gen-
eralize to unstructured grids, and
in practice there are time-step limi-
tations that slow the convergenceof implicit schemes. To understand
this problem, tools for the stability
analysis of numerical methods for
the Euler and Navier-Stokes equa-
tions have been developed and ap-
plied to several commonly usedupwind-difference stencils.
A Fourier analysis is applied to
upwind-difference approximationsfor the two-dimensional linearized
Euler equations. This differs fromconventional analysis methods,
which are generally applied to a
simpler scalar model equation,and allows the examination of the
performance of the difference
schemes under a wide variety of
flow conditions and grid distor-tions. Codes to perform the Fouri-
er analysis were written in C and
using the computer algebra system
Mathematica. The analysis is veri-
fied by numerical experiments
with a recently developed two-dimensional Euler solver.
Several standard structured-griddifference stencils have been
examined, as well as a new stencil
that is easily generalized to un-
Standard Stencil New Stencil
IGI
_-n 10-4_..__ o l
I0-6 I_',k_ /
Residual,0"8 t _k_kX /
10-12l . , _, .0 80 160 240
Iterations
Improved stability of new difference stencil and its effect on convergence ofnumerical code.
structured grids. It was found thatthe choice of difference stencil has
a dramatic effect on the asymptotic
stability of the implicit schemes.
One of the most popular of thestructured-grid difference stencils
performs particularly poorly. Onthe other hand, the new stencil has
outstanding stability properties
and is less sensitive to high grid
aspect ratios. These propertiesmake it well suited for viscous cal-
culations and for multigrid accele-
ration techniques. The analysis
methods developed in this work
are general and can be extended to
a wide variety of difference stencils
and time-marching schemes.(Thomas W. Roberts, 46804,
and Gary P. Warren)Aeronautics Directorate
Hot-Film Probe for Use in
Hypersonic Flow
Turbulence instrumentation
has been developed for hypersonicflows in a collaboration between
the Syracuse University Center for
Hypersonics and Langley ResearchCenter. The robust microsensor
hot-film probe has exhibited an ex-
tremely high bandwidth in moder-
ately severe hypersonic flows.
Such measurements are importantfor high-speed civil transport(HSCT) noise reduction efforts,
hypersonic facility validation,
hypersonic flow physics, and com-
putational fluid dynamics (CFD)
validation purposes. Existing

......... i ti i !iiiiiii!iiiiii!'
IOrnm
Hot-flint probe.
\
plalinum sensor
(5000A x 12.5pm x 0.25mm)
"-. , gold leadwires
sapphire
substrale
/
that of existing probes (130 kHz).
This is significant since turbulent
spectra in hypersonic flows
typically exceed 500 kHz. Future
work includes the development ofseveral dynamic calibration tech-
niques and detailed flow physicsmeasurements in turbulent bound-
ary layers in the 12-inch Mach 6
High Reynolds Number Tunneland the 31-inch Mach 10 Tunnel.
(Mark Sheplak, 44178,
Catherine B. McGinley,
Eric F. Spina, James E. Bartlett,
and Ralph M. Stephens)Aeronautics Directorate
Localized Transition and
Turbulent Spot Formationon a Flat Plate
measurement techniques (e.g.,
hot-wires, laser Doppler velocime-ter (LDV)) are insufficient to meet
the requirements of high-enthalpyflows, which include elevated
stagnation temperatures and high
dynamic pressures.
In this newly developed probe,
the fragile sensing element of the
hot wires is replaced with a thinplatinum film (5,000/_ x 12.5 lam x
0.25 mm) deposited along the stag-
nation line of a wedge-shaped sap-
phire substrate. This probe repre-
sents a significant advancement of
an existing concept with optimiza-
tion through the use of advancedmaterials and state-of-the-art con-
struction techniques. Microphoto-
lithographic techniques have
produced sensor volumes that are
2 orders of magnitude smaller than
existing probes. Preliminary testsat Mach 6 indicate excellent dura-
bility characteristics. Constant
temperature compensation of the
probe has produced a typical fre-quency response of about 750 kH,,
which is about 5 times greater than
Flows that are undergoing tran-sition from laminar to turbulent
are notoriously difficult to predict,
Plan view
Side view
Plat: view and side view of yet'tic al vorticity magnitude. Side view includes
long horizontal line that represe,lts wall location. Short horizontal lineshows location of plan view.

RESEARCH AND TECHNOLOGY HIGHLIGHTS
Critica I Tech n o logies
even though a knowledge of thelocation and extent of the transition
region is essential for the accuratecalculation of skin friction on air-
craft wings, engine nacelles, and
gas-turbine blades. Most previousstudies of laminar-to-turbulent
transition have concentrated on
the breakdown of periodic wavesin the flow. In contrast, the presentresearch focuses on the evolution
of a local disturbance into a turbu-
lent spot. An understanding of the
mechanisms involved in this par-ticular transition scenario will
enable better transition modeling
for a broader range of flow
conditions than is presentlyavailable.
The nonlinear evolution of the
disturbance that was created by
fluid injected through a wall slit
into a flat-plate boundary layer is
computed by direct numerical
simulation. All important scales ofmotion are resolved in the
computations.
The injected pulse of fluid
initiates the development of a
hairpin-shaped vortex. This vor-
tex elongates and then spawnsmultiple secondary vortices; some
of these are aligned with the origi-
nal vortex, and others are displaced
in the spanwise direction. Similarvortices have been observed in thedetailed flow-visualization studies
done in a water channel at Lehigh
University under similar condi-tions. The direct numerical simula-
tion data provide the necessarydetails of the instantaneous veloci-
ty and the pressure fields to sup-
port an earlier hypothesis of vortexformation.
As more vortices form and
interact, they develop into a regionof highly disturbed flow that
resembles a turbulent spot. In the
figure, shaded contours of vertical
vorticity magnitude illustrate the
typical turbulent-spot shape: adownstream pointed arrowhead
in the plan view and an overhang
region in the side view. Locally
averaged skin-friction traces and
velocity profiles are neither
laminar nor fully turbulent.(Bart A. Singer, 42316,
and Rona|d D. Joslin)Aeronautics Directorate
Numerical Simulation of
Variable-Density
Compressible Shear
Layers
Compressible shear layers play
an essential role in the fluid dyna-
mics involved in supersonic com-bustion. Because of this, the
understanding of compressible
shear layers plays an importantrole in the development of scramjet
engines used in proposed hyper-sonic vehicles. Most of the current
research has focused on the effect
of compressibility alone. It has
been found experimentally, as
well as theoretically and computa-
tionally, that compressibility
reduces shear-layer growth rate
and mixing efficiency. Relativelylittle effort has gone into under-
standing the effect of disparate-
mass gas-mixture effects that
occur in nitrogen/hydrogen and
air/hydrogen shear layers.
The essential difference between
compressible and incompressible
flows is the ability of pressure gra-
dients arising in high-speed flows
to be strong enough to locally com-
press the fluid. The most simplemeasure of this compression is thedilatation, or V • u, where u is the
velocity. Its magnitude is propor-
tional to the rate of change ofvolume of a local fluid element.
Dilatation dynamics play an inte-
gral part in the acoustic aspects ofhigh-speed shear layers.
2nd order MacCormack / 4th order Pade
&0250
ft.:,-_ 0.0200:s
0.0150
_IL
6000
5000
40{_0
3000
20O0
1000
10_)0
2000
3000
-4000
5000
6000
00800 00850 00900 00950
Meters
Contours of dilatation field of a nitrogen (lower stream)/hydrogen (upper
stream) compressible shear layer at convective Mach number of 0.45.

A representative example of the
effect of variable density due to
disparate-mass gas mixtures is
shown in the figure. This figure
shows the outlines of a large span-
wise vortex core generated from atwo-dimensional Navier-Stokes
code developed at NASA Langley.
Two features are immediately
apparent. First, there appears to
be a quadruple-like dilatation
structure surrounding the span-wise vortex. The second feature is
the striated dilatation pattern
found in the braid region that con-
nects successive spanwise vortexcores. This is the effect of variable
density. An additional and poten-
tially important effect of this
variable density is the fact that thevorticity that mixes the two gases
is progressively displaced into the
hydrogen stream with increasing
density ratio. The lower right dila-tation strand is at the species inter-
face. Th6 upper left strand corre-
sponds to a finger of nitrogen
being entrained into the predomi-
nately hydrogen spanwise vortexcor_ _.
(Christopher A. Kennedy, 47968,and Thomas B. Gatski)Aeronautics Directorate
Noise Generation by Flow
Over Cavity
The new field of computationalaeroacoustics (CAA) in which the
generation of sound by and propa-
gation of sound through a flow
field is calculated from first princi-
ples is being developed. The tech-niques necessary have been
demonstrated and validated by
comparison of numerical solutions
with linear analytic and nonlinear
multiple-scale analyses of classical
acoustic problems.
t= 16.0
AcousticDensity
Contours
Acoustic radiation by aircraftwheel well.
As an example of the application
of CAA techniques to configurations
of aerodynamic interest, the d_ nsi-
ty field produced by flow ovel acavity, such as a wheel well in anaircraft, is shown. This densit¢
field was computed from the
governing Navier-Stokes equations
using an acoustic/viscous spli_ting
technique. Lighter areas are
regions where the density is hi gherthan the ambient (compressions),while darker areas indicate that
the density is lower than the e mbi-ent (rarefications). This instanta-
neous field shows the intense
acoustic waves that are prodL ced
by this geometry. Further analysis
of the time-dependent radiat: on
reveals spectra and directivit ¢ pat-
terns that agree with experin Lentaldata.
This new capability provi_tes a
much better understanding _,f the
sound generated by flows as wellas means for its reduction ar d has
important applications, not _mly
for aircraft sources, but also for rail
and automotive configurations.
Large Eddy Simulation (LES) mod-els are now being incorporated to
increase the Reynolds number atwhich such calculations can be
accomplished.(J. C. Hardin, 43622)Structures Directorate
Algorithm Developmentfor Multielement Airfoil
Computations
The objective of this work is to
develop efficient and accuratecomputational tools for use in ana-
lyzing multielement airfoil config-
urations using the Navier-Stokes
equations. The area of high-lift
aerodynamics is an important areawhere advances in technology and
better understanding of the rele-
vant flow physics could yield
significant improvements in thedesign and cost effectiveness of fu-
ture aircraft. The computational
analysis of high-lift, multielement
devices is difficult, due in part to
the complex nature of the geometry
and the large number of gridpoints necessary to adequatelyresolve the flow field.
An unstructured-grid methodol-
ogy is employed because of the
relative ease with which very com-
plex geometries can be represented.The flow solver is an implicit,
upwind-biased algorithm that
gains efficiency through multigrid
acceleration applied to the flow
equations and the turbulencemodel.
The flow solver has been imple-mented and tested for various con-
figurations. Extensive comparisons

RESEARCHANDTECHNOLOGYHIGHLIGHTS
Critical Technologies
with experimental data have beenconducted for a three-element geo-
metry tested in the Low-TurbulencePressure Tunnel (LTPT) at NASA
Langley Research Center and have
been reported in a recent AIAA
paper. The results indicated thattrends due to variations in
Reynolds number as well as slightvariations in geometry are well
¢--lO
_ 8
O
cJ -6
o
't2
-- Computation
_k o Experiment
, 1 L _ I I , i ,02 00 02 04 06 08 1.0 12
Chordwise position, x/c
_ 6
O_0 3o
g,
_ 0
Original scheme- Multigrid
tj_ 0.0 0.5 10 t5 xlO4
CRAY-YMP CPU time, seconds
Surface pressure distribution and convergence of section lift coefficient for
Douglas three-element airfoil. Free-stream Mach number is 0.2, angle ofattack is 16.24 °, and Reynolds number is 9 x 10⁶.
C1
2.0. , I l I i I ,
'- -- First order in time , :,1.0 ,-- ---- Second order in time t_. i" _:',
...... Third order in time I,k , _, ,[_ ',
0.0 _ ' '' '- _ I ',
-I .0 ,,; ,;
-2.0 , ' I , I , I =0.0 20.0 40.0 60.0
t*
,i
ip .
80.0
3.0
2.0
1.0
Cdp 0.0
-1.0
-2.00.0
I ' I i I i
-- First order in time
.... Second order in time ,, .,,,,,.,,,, ,,,o
...... Third order in time .... _
i I I I i I L
20.0 40.0 60.0
t*
80.0
Lift (top) and drag (bottom) histories for impulsively started cylinder.
predicted. A sample pressuredistribution and a view of the con-
figuration are shown in the figure.Also shown is the convergence ofthe lift coefficient for the scheme
with and without multigrid accele-
ration. On a grid of 97,000 nodes,
the multigrid scheme achieves
steady lift in approximately onehour of CPU time on a CRAY-YMP,
while the unaccelerated scheme
requires approximately 3.5 hours.
As a result of this work, the
time required to obtain a Navier-Stokes solution over a multielement
airfoil configuration has been
significantly reduced.(Daryl L. Bonhaus, 42293,
and W. Kyle Anderson)Aeronautics Directorate
Efficient Time-Accurate
Navier-Stokes Calculations
Although significant progress
has been made in the last twenty
years in numerically modeling
many physical situations with
computational fluid dynamics(CFD), most numerical schemes
are limited to the prediction of
steady flows. However, many
physical phenomena (such as
separated flows, wake flows, andbuffet) are intrinsically unsteady.
The present work describes an
efficient method for calculating
unsteady flows modeled by the
unsteady Navier-Stokes equations.
In the present work, the
approach taken was to write the
unsteady Navier-Stokes equations
in a form that is fully implicit intime. The multiblock version of
the steady, three-dimensional,thin-layer Navier-Stokes solver,TLNS3D, was modified to iterative-

ly solvetheresultingimplicitequationsateachtimestep.Dis-creteoperatorsrepresentingthetemporalderivativescanbefoundthatareunconditionallystablewhenthetimeoperatorisapproxi-matedtoeitherfirstorsecondorder.Thisstabilityallowsthetime-stepsizetobechosenbasedonthetemporalresolutionneededin thesolutionratherthanlimitedbynumericalstabilityrequirementsaswithmostotherunsteadyflowmethods.
Todemonstratethecapabilityofthepresentmethod,theun-steadyflowoveranimpulsivelystarted,two-dimensionalcircularcylinder(withaReynoldsnumberof1,200andaMachnumberof0.3)wascalculated.Theflowis initial-ly symmetricwithzerolift asthewakebehindthecylinderbeginstogrow.Asthewakecontinuestogrow,it becomesunstableandbeginstoshedfromalternatesidesofthecylinder.Timehistoriesofthelift coefficient(CI)andthedragcoefficientbasedonintegratedpressures(Cdp) are shown in theaccompanying figure. From exper-imental data and the results of
previous global minimum time
stepping (GMTS) calculations, the
period of the oscillation of Cdp is
known to be approximately 4 interms of the nondimensional time
t*. To give 40 time steps perperiod, a time step of A t* = 0.1 was
used. A calculation using a first-
order discretization of the physical
time derivative predicted aStrouhal number of 0.21. Second-
and third-order discretizations
predicted a Strouhal number of
0.24 compared with the experimen-tally obtained value of 0.21.
A GMTS calculation required
4,600 steps to reach At* = 2.4. The
present scheme required only 24
physical time steps to reachAt* = 2.4, and a maximum of 20
multigrid cycles at each time step
were required to converge Cdp to
six digits. Therefore, the present
scheme required only about 10percent of the computer time
required by GMTS.(N. Duane Melson, 42227, Harold
L. Atkins, and Mark D. Sanetrik)Aeronautics Directorate
Multiblock CFD Codes--
A New Paradigm
Significant progress has been
made in recent years towards the
development of computationalfluid dynamics (CFD) codes
capable of solving high Reynolds
number flows over complex aero-
-8-
Cp
-4 -
I Spalart-AIImaras
............ Baldwin-Lomax
o Experiment
I 0t,4 _ _¢, .¢,-¢_" ..._..._..---._r-_ _
2 [ I I q I I
-0.2 0 0.2 0.4 0.6 0.8 1.0
x/c
Multiblock computations fvr Douglas three-element airfoil configuration.
Top is partial view of 20-block grid; bottom contains pressure comparisons(M_ = 0.2; a = 8.1°; Rec = 9.0 x 10⁶).

RESEARCH AND TECHNOLOGY HIGHLIGHTS
Critical Technologies
dynamic configurations using
multiblock structured grids. How-
ever, such codes are not beingused to their full potential because
of the difficulty associated with
generating suitable grids in a time-
ly and automatic manner. In order
to reduce the total time required
for obtaining flow solutions
starting from surface definition, arecently developed automatic
blocking procedure, funded underthe small business innovative
research (SBIR) program at NASALewis, is used. One of the mostuseful features of this new auto-
matic-block structured-grid gener-
ation procedure is its ability to
generate high-quality computation-
al grids in a batch environment. Inaddition, small differences in
geometry can be accommodated
through minor changes in input
files developed for geometrically
similar configurations.
All essential elements to auto-
mate the process of simulating
aerodynamic flows over complex
configurations have been assem-
bled and applied to a three-
dimensional high-lift configuration
to demonstrate the feasibility ofthe entire process. A partial view
of the grid employed in these com-
putations is shown in the attached
figure. The grids generated by this
procedure maintain point continu-ity and vary smoothly across block
interfaces. In addition, grid points
are used efficiently through com-
pact grid enrichment by confining
the denser grids in high gradient
regions of interest. The input files
for the multiblock solver are pre-pared automatically by using the
connectivity and grid files created
by the grid generator. A field-
equation type of turbulent model,
namely the Spalart-Allmaras mod-el, is found to give more accurate
solutions than the algebraic modelof Baldwin-Lomax.
The procedure outlined here is
a new paradigm for employingmultiblock structured grids, inthat it avoids the laborious interac-
tive construction of field grids and
allows efficient local clustering of
grid points near regions of interest.
Such procedures are expected toplay a significant role in parametric
studies in the aerodynamic design
process.(Veer N. Vatsa, 42236,
and Christopher L. Rumsey)Aeronautics Directorate
Sensitivity Derivatives
for Multidisciplinary
Design Optimization Via
Automatic Differentiation
Computer models of diversesystems may be characterized byfour traits: tlle models admit free
parameters and produce measures
of goodness about a product or
process; the system is required to
simultaneously satisfy a number
of constraints; the product or pro-cess consists of subsystems that
can be modeled individually; and
the measures of goodness are
related in complex ways to param-eters within the system. The
effects of these parameters on the
measures of goodness can be
quantified by a matrix of terms
known as sensitivity derivatives
(SD). These derivatives can be ap-
proximated by divided differences,obtained exactly by hand differen-
tiation of analytic relationships, or
through symbolic manipulators.
However, as the size and complex-
ity of the computer models in-
crease, problems arise in obtaining
tlle desired SD matrix; the compu-
tational technique of automaticdifferentiation (AD) addresses
these shortcomings.
The AD technique is a powerful
computational method for obtain-
ing exact SD from existing comput-
er programs. Argonne National
Laboratory and Rice Universityhave developed a precompiler AD
tool applicable to FORTRAN
programs called ADIFOR. This
tool has been easily and quickly
applied by NASA Langley resear-
chers to assess its feasibility and
computational impact in sensitivityanalysis and multidisciplinary
design optimization for several
different codes: a 3-D multigridNavier-Stokes flow solver; a struc-
tural analysis code; an aircraft per-
formance program; and a potential-flow wing-design code. The
ADIFOR tool works quickly and
robustly with minimal user inter-
vention; the resulting AD codeshave been verified to compute theexact SD in about the same time as
that required for other methods orfaster. Moreover, the AD codes
have been shown to provide relia-ble SD in cases for which divided
differences failed and to offer
benefits for parallel problem
implementation on distributed-
memory machines or networks ofworkstations.
A recent, highly successful
ADIFOR User Training workshop
was hosted by NASA Langley and
staffed by local, Argonne National
Laboratory, and Rice Universityresearchers. It was attended by 49
potential users: 17 industrial, 17
university, and 15 government.
Many (29 to date) of the attendees
have indicated an interest in using

thistechnologyin theirresearchorapplications.(L. L. Green, 42228, A. Carle,
C. H. Bischof, K. J. Haigler,and P. A. Newman)Aeronautics Directorate
Unstructured Viscous
Grid Generation by
Advancing-Layers
Method
The objective of this research isto formulate a new automated
approach for generating unstruc-
tured triangular and tetrahedralgrids with high-aspect-ratio cellsfor viscous flow calculation. The
approach is based on a new grid-
marching strategy referred to as
"advancing layers" for constructinghighly stretched cells in the
boundary-layer region and the
"advancing-front" technique for
generating equilateral cells in the
remaining inviscid-flow region.The new method is conceptually
simple but powerful and capable
of producing high-quality viscous
unstructured grids for complexconfigurations with ease. The
present approach is divided intothree separate stages: 1) surface
grid generation, 2) construction of
high-aspect-ratio cells in the
viscous region, and 3) generationof regular (isotropic) cells in the
inviscid-flow region. Steps 1 and 3
utilize established methodology
encompassed in an existing
advancing-front inviscid grid
generation code VGRID. The
second step proceeds by intro-
ducing new grid points in the field
along predetermined surfacevectors and connecting them to
the corresponding faces on thefront. The viscous cells are
Cp
-12
-10
-8
-6
-4
-2
0
2-0.2
.....
0.0
q i
ComputationExperimentM_=0.2(z=16.2 °Re=9 × 10⁶
0.2 0.4 0.6 0.8 1.0X/C
.2
Unstructured viscous grill m_:t flow solution around a multielement airfoil.
advanced into the field one layerat a time, in contrast to the co :wen-tional method in which cells are
added in no systematic sequt,nce.
The layers continue to advarce in
the field, while growing in tl_ick-ness, until a new criterion based
on a "spring" analogy determines
that two approaching fronts are
about to cross or that spacing crite-
ria from a user-prescribed back-
ground grid trigger a switch to the
conventional advancing-fro_tmethod. The transition betv'een
the two types of grid is bothsmooth and fully automatic. The
fidelity of the new method i_,dem-
onstrated by generating a viscous
grid around a multielement airfoil,
shown in the figure, and comput-
ing a flow solution. This grid con-
tains 34,987 triangular cells with a
first-layer spacing of approximate-ly 7 x 10 -_ of the main airfoil chord
length. The flow solution wasobtained with an available node-
centered flow solver using aBaldwin-Barth turbulence model
at a Mach number of 0.2, an angle
of attack of 16.2 °, and a Reynoldsnumber of 9 x 10⁶. Excellent agree-
ment with experimental data is
shown in the figure for the surfacepressure distributions.
(Shahyar Pirzadeh, 42245)Aeronautics Directorate

RESEARCHANDTECHNOLOGYHIGHLIGHTS
Critical Technologies
Vortex-Flow Prediction
With Unstructured-Grid
Euler Methodology
The objective of this investigation
was to assess the capability of aninviscid unstructured-grid method
to predict flow fields with vortical-
flow structures emanating from
sharp edges. To accomplish the
goal, the results from the
unstructured-grid method were
compared with results from anestablished structured-gridmethod. Both the structured- and
unstructured-grid flow solvers
employed in ._his investigation,known as CFL3D and USM3D
respectively, were developed at
NASA Langley Research Center.
The configuration used for this
study, the isolated fuselage of theModular Transonic Vortex Interac-
tion (MTVI) model, was selected
because it is representative of
future military aircraft fuselages
and it has simple, analytically
defined geometry. The structuredand unstructured grids were
generated to provide near-
comparable resolution of the
computational domain in order to
minimize the effect of grid type on
the solution. Computationalresults are shown for both inviscid
methods at 19.8 ° angle of attackand a Mach number of 0.4. Turbu-
lent, thin-layer, Navier-Stokes
computations on the structured
grid are also shown for reference.The figure presents the crossflow
normalized total-pressure contoursat three selected stations with an
isometric view of the inviscid solu-
tions and the corresponding sur-
face grids. The crossflow total-pressure contours demonstrate ex-cellent correlation between the
structured- and unstructured-gridinviscid solutions. Additional
analysis has also shown goodcorrelations for the surface
USM3DUnstructured-Grid
InviscidI
FS 3, ×=14 50" I-q
Comparison of structured-and unstructured-grid results.
pressure distributions and totalforces and moments.
(Farhad Ghaffari, 42856)Aeronautics Directorate
Boundary-Layer Heat-Transfer Measurements
on a Swept Semispan
Wing
In a recent cooperative program
with the Northrop Corporation,aerodynamic heat-transfermeasurements were made on a
swept semispan wing-body at var-
ious skin-temperature ratios andflow conditions. Also, the effects
of skin heating and cooling on theextent of natural laminar flow
were measured. The wing (semi-
span 36 in., tip chord 18 in.) and
fuselage fairing were tested in the8-Foot Transonic Pressure Tunnel.
The model was mounted to a split-
ter plate located 8 in. from the tun-nel wall to avoid tunnel-wall
boundary-layer effects and the
separated flow around the model
support hardware. The wing
upper-surface skin could beheated electrically, and the lower-surface skin could be heated or
cooled with water from a closed-
loop system. The model was
instrumented with static pressure
orifices, skin thermocouples,hot-film gauges, and heat-flux
gauges. Mach number was variedfrom 0.20 to 0.80, Reynolds number
from 1.1 to 3.8 x 10_'per foot,
tunnel stagnation temperature
from 75 to 100°F, and angle ofattack from 0° to 6°. The ratio of
model skin temperature to the adi-
abatic skin temperature wasvaried from 0.85 to 1.10. The data
will be used to validate computa-
tional fluid dynamics (CFD) meth-
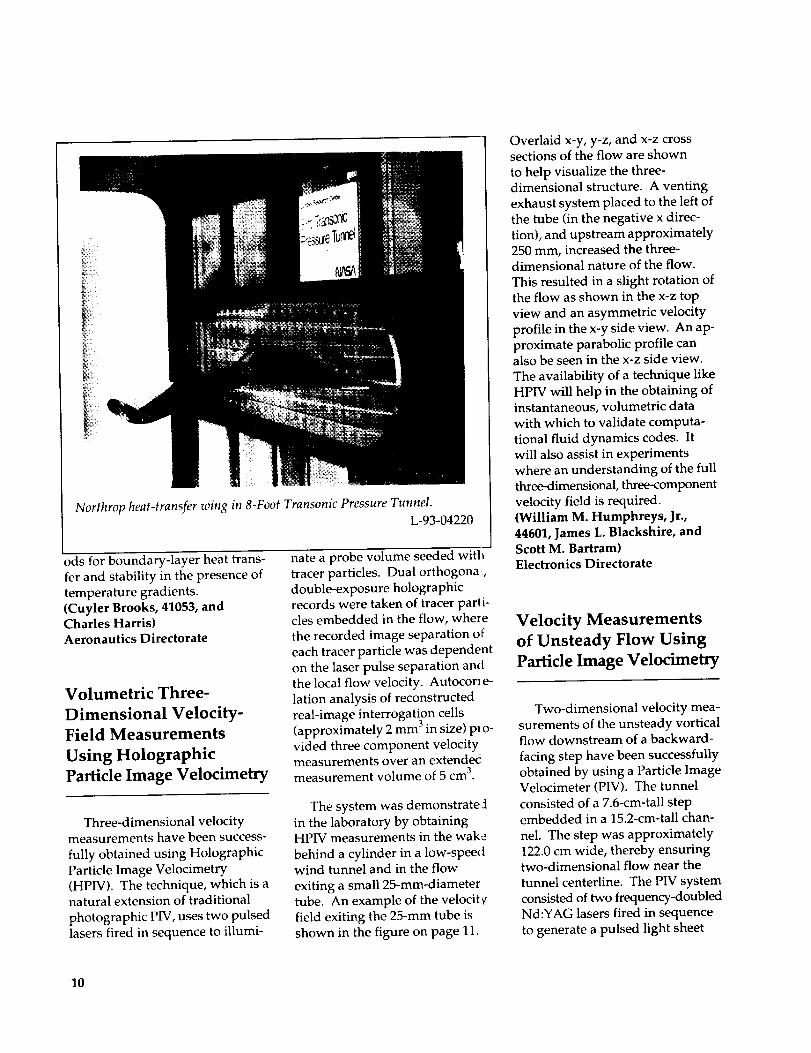
Northrop heat-transferwing in8-Foot Transonic Pressu_ Tunnel.
L-93-04220
ods for boundary-layer heat trans-
fer and stability in the presence oftemperature gradients.
(Cuyler Brooks, 41053, andCharles Harris)
Aeronautics Directorate
Volumetric Three-
Dimensional Velocity-Field Measurements
Using Holographic
Particle Image Velocimetry
Three-dimensional velocitymeasurements have been success-
fully obtained using HolographicParticle Image Velocimetry
(HPIV). The technique, which is anatural extension of traditional
photographic PIV, uses two pulsed
lasers fired in sequence to illumi-
nate a probe volume seeded withtracer particles• Dual orthogona:,
double-exposure holographic
records were taken of tracer part i-cles embedded in the flow, where
the recorded image separation of
each tracer particle was dependent
on the laser pulse separation andthe local flow velocity. Autocorle-
lation analysis of reconstructed
real-image interrogation cells
(approximately 2 mm _m size) pl o-
vided three component velocitymeasurements over an extendecmeasurement volume of 5 cm3•
The system was demonstrated
in the laboratory by obtainingHPIV measurements in the wak_
behind a cylinder in a low-speedwind tunnel and in the flow
exiting a small 25-ram-diameter
tube. An example of the velocity
field exiting the 25-mm tube is
shown in the figure on page 11.
Overlaid x-y, y-z, and x-z crosssections of the flow are shown
to help visualize the three-
dimensional structure. A venting
exhaust system placed to the left ofthe tube (in the negative x direc-
tion), and upstream approximately250 mm, increased the three-dimensional nature of the flow.
This resulted in a slight rotation of
the flow as shown in the x-z top
view and an asymmetric velocity
profile in the x-y side view. An ap-proximate parabolic profile canalso be seen in the x-z side view.
The availability of a technique like
HPIV will help in the obtaining ofinstantaneous, volumetric data
with which to validate computa-
tional fluid dynamics codes. It
will also assist in experiments
where an understanding of the fullthree-dimensional, three-component
velocity field is required•
(William M. Humphreys, Jr.,44601, James L. Blackshire, andScott M. Bartram)Electronics Directorate
Velocity Measurements
of Unsteady Flow Using
Particle Image Velocimetry
Two-dimensional velocity mea-
surements of the unsteady vorticalflow downstream of a backward-
facing step have been successfullyobtained by using a Particle ImageVelocimeter (PIV). The tunnel
consisted of a 7.6-cm-tall stepembedded in a 15.2-cm-tall chan-
nel. The step was approximately
122.0 cm wide, thereby ensuringtwo-dimensional flow near the
tunnel centerline. The PIV systemconsisted of two frequency-doubled
Nd:YAG lasers fired in sequence
to generate a pulsed light sheet
10

RESEARCHANDTECHNOLOGYHIGHL1GHTS
Critical Technologies
iI
II}
,,,tilt
,T ttlt
,, IIlttl,,,II ttr,,,tI,tlt
z xTt
3-D Orthoscopic View x-y Side-View Cuts
,, Irtttt,
,,lt ft,
.. _ll
X Z
y-z Side-View Cuts x-z Top-View Cuts
3-D velocity field of flow exiting a 25-ram-diameter tube obtained via dual
holographic recordings.
100.0 mm wide and 1.0 m thick.
This light sheet bisected the tunnel
along its centerline immediately
downstream of the step. A high-
speed photographic camera wasoriented normal to the plane of the
light sheet and imaged 1.0-_tm
mineral-oil droplets in the airflowonto 70-mm film. The camera was
coupled to the laser system to
allow sequences of up to 55 frames
of data to be taken with a maxi-
mum data-acquisition time of 3.5
sec and a frame-to-frame time sep-aration of 66.7 msec. An electro-
optical image shifter was attachedto the camera to enable flow direc-
tionality to be obtained. Each
double-exposure photograph was
interrogated to track the movement
of seed particles in adjacent 1.5- by
1.5-mm regions using auto-
correlation analysis and resultingin the creation of two-dimensional
velocity maps.
An investigation of the unsteadyflow in the bottom comer of the
step along the tunnel centerline
was conducted by generating a
sequence of 52 photographs takenat a sampling rate of 15 Hz. Exam-
ination of the individual velocity
fields obtained from this sequence
revealed fluctuating secondary
and tertiary vortical structures.
An example of a single frame ofdata is shown in the figure. Crea-
tion, dissipation, and movement ofthe vortical structures were evi-
dent. By averaging the sequence
of photographs together, mean-flow structures were derived
which agreed with Laser Doppler
Velocimeter (LDV) surveys con-
ducted in the facility. This test
represents the first use of a time-
resolved PIV system at Langley to
examine the evolution of unsteadyflow structures and shows the
power of global velocity techniquesto augment data obtained from
traditional point measurement
techniques such as LDV.(William M. Humphreys, Jr.,44601, and Scott M. Bartram)Electronics Directorate
Determination of
Measurement Uncertainties
of Wind-Tunnel Balances
The multicomponent strain-gagebalance is the standard transducer
used to precisely measure aero-
dynamic force-and-moment loadson aircraft models during wind-tunnel tests. Prior to wind-tunnel
application, each balance under-goes a rigorous calibration proce-
11

o?_
i ;!
' 20 30 aO
_imm)
V,=
Region of|ntcrest
Velocity field obtained via PIV measurements downstream of
backward-facing steps.
Balance =IUT61 B
0_
Error Bounds from Total Estimated Outpul Etrot
o.tsl
i • • • . .
. , . .. -oo_ " . , . : ... . .-u. • . . . • . . . • . : -
.......... ......_, .... :...., . , :." .... ;. ....... -.,._,, -,,. _ . • . _ , • ' .'_-: _- ,'. . ... ,,'._;. s...:.
: ,. .. .,,. :.,. : . -. .. . ...-... , • , "
.oo_ " ", , " _" "" ".: "'"""" ", . . . ,.. : . .,
-Or5
02
025100 200 300 400 500 600 700
CaSbtalion Point Numblr
Predicted residuals and error bounds of force balance.
dure from which its calibration co-
efficients are determined and its
performance accuracy is verified.
Balance accuracy has been cu.,.-
tomarily cited either as a worst-
case proof load error or as a per-
centage of the full-scale balanceload computed from calibrationdata. A method has now been
developed to determine the 6 by28 balance coefficient matrix, its
uncertainty matrix, and the uncer-tainties of measured forces and
moments as functions of the
applied loads. A multivariate
regression technique utilizes the
28 by 729 design matrix formedfrom the calibration data to obtain
a minimum-variance estimate of
the balance sensitivities, the inter-action coefficients, and their unce-
rtainties. Theses uncertainties are
then employed to infer the uncer-tainties of forces and moments
computed from observed balance
outputs obtained during tests. Itwas shown that calibration coeffi-
cient uncertainties depend on both
the measurement uncertainty and
the structure of the experimentaldesign.
During wind-tunnel testing, the
total uncertainty of a single force-moment measurement inferred
from the balance output voltagesdepends on both the coefficient
uncertainty and the facility
measurement uncertainty. With
this new procedure, accuracies can
be cited for each computed forceand moment as functions of the ac-
tual balance output readings. Thecalibration uncertainties are bias
errors, computed as functions ofload, that-are combined with
random facility measurement
precision errors to determine thetotal uncertainty during wind-tunnel tests. The new method has
been verified using data obtainedfrom balance calibrations.
(John S. Tripp, 44711,
Ping Tcheng, and Alice T. Ferris)Electronics Directorate
12

RESEARCHANDTECHNOLOGYHIGHLIGHTS
Critical Technologies
Video Luminescent
Imaging
Video luminescent imaging is a
new technology based on the mea-
sured phosphorescence of an
excited, aerodynamic surface coat-ed with luminescent materials.
Pressure sensitive paint (PSP) is a
coating that, when excited with a
wavelength-specific light source,
luminesces. A linear relationshipexists between the emission inten-
sity of the excited luminophor andthe pressure incident on the sur-
face. The use of PSP is relatively
nonintrusive, affecting the test by
only the 25-mil-thickness coatingon the model surface. Intensities
are then sensed by an accurate
camera and digitally stored by a
personal computer. The processed
PSP data provide accurate global
mapping of surface pressure dis-tributions and locations of shock,
boundary-layer transition, and
separation on the models for vari-
ous aerodynamic configurations.
Langley Research Center andAmes Research Center conducted
a cooperative test of a Navy double
delta wing model in the Langley
7- by 10-Foot High-Speed Tunnel.
The PSP used was a porphyrincompound, newly developed by
the University of Washington, and
was illuminated by UV lamps (365
nm). Langley researchers deve-
loped a separate data acquisition
system consisting of a monochromecharged-coupled device (CCD)
camera with a 650-nm band-pass
filter, videocassette recorder/player
(VCR), and a 486 personal comput-
er with frame grabber and demon-strated real-time, color-enhanced,
Global surface pressure distributions using PSP at Mach numbers (M) of
0.3, 0.5, and 0.7 and angle of attack (ct) of 16 °.
global surface flow visualization.
The figure shows uncorrected
graylevel mapping over the model
surface during two test conditions.
Data analysis consists of color-
enhancing gray levels to aid visualinterpretation, computationalcorrection for model movement/
deformation, and image processing
to provide measurements of
pressure distribution data.(Lorelei Gibson, 44643, and
Michael Mitchell)Electronics Directorate
Supersonic Flow-Field
Investigations Using
Doppler Global
Velocimetry
The first use of Doppler global
velocimetry to measure supersonicflows about wind-tunnel models
was conducted in the Unitary Plan
Wind Tunnel. The investigationincluded measurements of the
flow about an oblique shock gener-ated by an inclined flat plate andmeasurements of the vortical flow
above a 75 ° delta wing at various
angles of attack. The measurement
image, shown in the figure, of the
oblique shock represents theaverage of ten frames of videodata. These measurements of the
vertical velocity component show
a lag of 2 mm for the water conden-
sation to match the gas velocitydownstream of the shock. This ex-
ceptional measurement perfor-
mance is primarily due to the abil-
ity of the technique to utilize seedparticles far smaller than classic
laser velocimetry techniques.
This new nonintrusive measure-
ment technique uses the edge of an
iodine absorption line as an optical
13

12.0
Contribution ofstreamwise velocity
remains invertical velocity _ E 8.0
component _"ocConh ibution originates £
from the change in _opropagation angle _=
of the scanned _ _ 4.0laser beam _,',
cO
-8|_® o
0 3.0 6.0 9.0
Streornwise distance, cm
DGV measurements at Mach 2.5 about a fiat plate inclined to -15 °.
frequency-to-amplitude converterto determine the Doppler shifted
frequency of scattered light from
particles passing through a laser
light sheet. The simplicity of the
method is carried through to its
implementation, requiring only abeam splitter, mirror, and two vid-eo cameras in addition to the
iodine cell per measured velocity
component. Using ordinary
analog video electronics, three-component velocity images can be
monitored during wind-tunnel
operation as easily as standard
light-sheet flow visualization.(James F. Meyers, 44598)Electronics Directorate
Effects of Type II De-icer
Fluid on Aircraft Tire
Friction Determined in
ALDF Tests
an existing Memorandum of
Agreement. A conventional,
40 x 14 transport-aircraft main-geartire was tested at speeds up to
160 knots ground speed on a non-
grooved concrete test surface. Sur-
face test conditions included dry,
wet (water only), Type II chemical/water mixture, and 100 percent
Type II chemical. Test tire opera-tional modes included anti-ski:l
controlled braking at zero yaw an-
gle and yawed rolling at fixed 6°yaw angle. Initial ALDF tests to
determine the variation of tire cor-
nering friction performance with
speed and surface condition have
been completed. A typicalexample of the variation of tire/
pavement side-force friction coeffi-
cient (Its) is shown in the figure forfour different surface conditions---
dry concrete, water-wet concrete,
3-parts water to 1-part de-icer wetconcrete, and 100-percent de-icerwet concrete. These data were ob-
tained during the same 100-knot
test run. A section of dry concrete
was provided between the liquidcontaminated surfaces. The
results indicate that for the 3-to-1
mixture the friction values are
similar to the water-wet condition.
The friction coefficient for
100-percent de-icer was about 30
percent lower than the water-wet
value. The 3-to-1 mixture is proba-
bly more representative than the100-percent mixture of what might
be found in normal aircraft opera-
tions. Therefore, these results sug-
gest that, in practice, the de-icereffects on friction will be similar to
those of water. The information
such as that shown in the figure
will assist in establishing a national
database on effects of aircraft Type
II chemical de-icer depositions on
Tests were conducted at the
Aircraft Landing Dynamics
Facility (ALDF) with financial sup-port provided by the FAA under
.8 -
.6 -
SIDE-FORCE _jFRICTION .4COEFFICIENT,
Its.2 --
DRY WET DRY 3 TO 1I MIXTURE
Its = 0.33
0 '2 4
TIME, SEC
Aircraft de-icer fluid frictional _roperties. 40 x I4 tire; speed = 1O0 knots;
yaw angle = 6 °.
DRY 100%DE-ICER
its = 0.14
I6 8
14
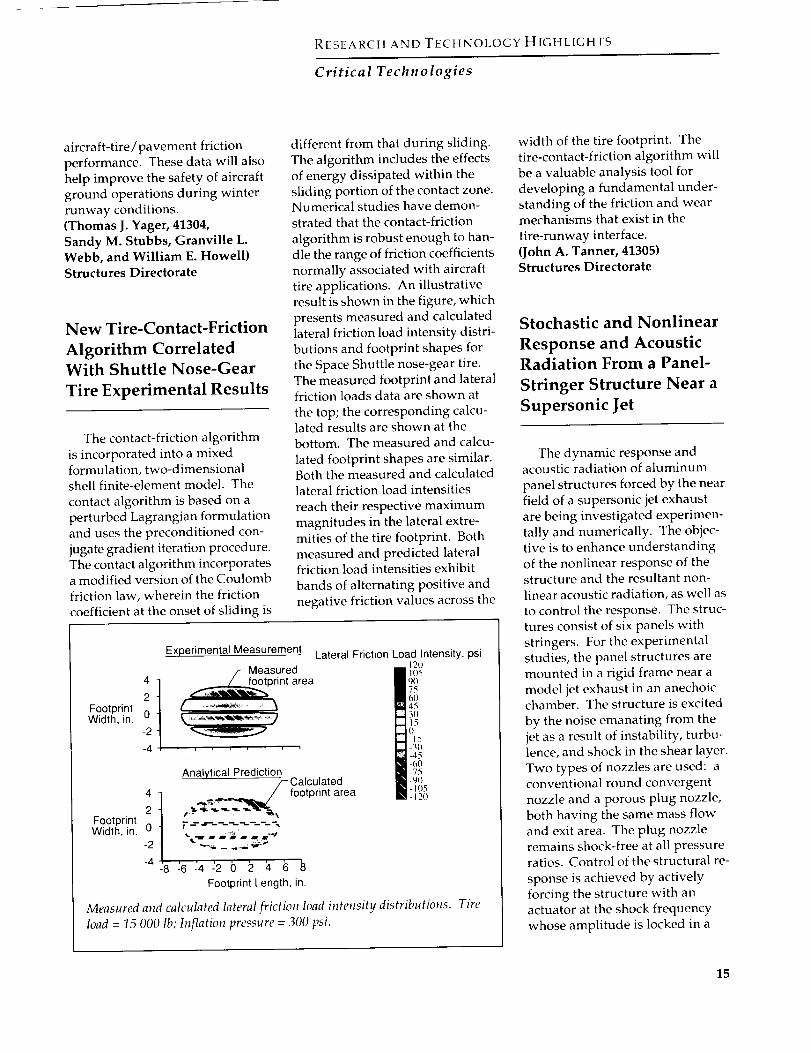
RESEARCH AND TECHNOLOGY HIGHLIGHTS
Critical Tech no logies
aircraft-tire/pavement friction
performance. These data will also
help improve the safety of aircraft
ground operations during winter
runway conditions.(Thomas J. Yager, 41304,
Sandy M. Stubbs, Granville L.Webb, and William E. Howell)
Structures Directorate
New Tire-Contact-Friction
Algorithm Correlated
With Shuttle Nose-Gear
Tire Experimental Results
The contact-friction algorithm
is incorporated into a mixedformulation, two-dimensionalshell finite-element model. The
contact algorithm is based on a
perturbed Lagrangian formulation
and uses the preconditioned con-
jugate gradient iteration procedure.
The contact algorithm incorporatesa modified version of the Coulomb
friction law, wherein the friction
coefficient at the onset of sliding is
different from that during sliding.
The algorithm includes the effects
of energy dissipated within the
sliding portion of the contact zone.Numerical studies have demon-
strated that the contact-friction
algorithm is robust enough to han-
dle the range of friction coefficients
normally associated with aircraft
tire applications. An illustrative
result is shown in the figure, which
presents measured and calculated
lateral friction load intensity distri-
butions and footprint shapes for
the Space Shuttle nose-gear tire.The measured footprint and lateralfriction loads data are shown at
the top; the corresponding calcu-lated results are shown at the
bottom. The measured and calcu-
lated footprint shapes are similar.Both the measured and calculatedlateral friction load intensities
reach their respective maximum
magnitudes in the lateral extre-
mities of the tire footprint. Both
measured and predicted lateralfriction load intensities exhibit
bands of alternating positive and
negative friction values across the
4
2FootprintWidth, in. 0
-2
-4
4
2FootprintWidth, in. 0
-2
-4
Experimental MeasurementLateral Friction Load Intensity, psi
Measured 12o105
print area 9o"75
'%'wr m _ii_ m mK ¸_'_
-8-'6 "4-'2 () 2 _, 6
Footprint Length, in.
Measured and calculated lateral friction load intensity distributions. Tire
load = 15 000 lb; Inflation pressure = 300 psi.
width of the tire footprint. The
tire-contact-friction algorithm will
be a valuable analysis tool for
developing a fundamental under-
standing of the friction and wearmechanisms that exist in the
tire-runway interface.
(John A. Tanner, 41305)Structures Directorate
Stochastic and Nonlinear
Response and Acoustic
Radiation From a Panel-
Stringer Structure Near a
Supersonic Jet
The dynamic response andacoustic radiation of aluminum
panel structures forced by the nearfield of a supersonic jet exhaust
are being investigated experimen-
tally and numerically. The objec-
tive is to enhance understanding
of the nonlinear response of thestructure and the resultant non-
linear acoustic radiation, as well as
to control the response. The struc-
tures consist of six panels with
stringers. For the experimental
studies, the panel structures are
mounted in a rigid frame near a
model jet exhaust in an anechoicchamber. The structure is excited
by the noise emanating from the
jet as a result of instability, turbu-
lence, and shock in the shear layer.
Two types of nozzles are used: aconventional round convergent
nozzle and a porous plug nozzle,
both having the same mass flow
and exit area. The plug nozzle
remains shock-free at all pressureratios. Control of the structural re-
sponse is achieved by activelyforcing the structure with an
actuator at the shock frequency
whose amplitude is locked in a
15

Panel-stringer structure excited acoustically by a high-speed jet.
L-91-13393
self-control cycle. Preliminarystudies are made on the effects of
jet noise and structural response at
accelerated or decelerated speeds.
Experimental results of the
standard jet at a pressure ratio of 3
indicate that the strain response ofthe structure is nonlinear and non-
stationary, with periodic, chaotic,or random behavior. The time his-
tory of the pressure indicates rota-
tion and flapping of the shockstructure in the jet column, and the
radiated acoustic pressure from
the structure contains shock, and
the formation of harmonics.Results from the active control of
the structure show that the peaklevel of the vibration in the s:ruc-
ture is reduced by the factor 9f 63,
corresponding to a power-le,.,elreduction of 18 dB.
A significant reduction in
response and radiation from thestructure is also achieved with a
newly developed high-perforn.ance-
plug nozzle suppressor. At a :cele-
rated and decelerated speeds data
show that the pressure exhibits a
variety of behaviors different from
those observed at constant speed(Lucio Maestrello, 41067)Structures Directorate
Composite ScalingStudies Provide Better
Understanding of
Composite Laminates
The size of a composite laminate
can significantly influence the first
ply failure stress and ultimate
strength under tensile loading
conditions with the magnitude of
the size effect depending on sever-al factors including laminate stack-
ing sequence (blocked or dispersed
plies), laminate type (fiber or ma-trix dominated), and the material
itself. In one study, tensile testswere conducted on geometrically
scaled angle ply laminates which
were fabricated using two different
scaling approaches. In the first
approach plies of similar orienta-tion were blocked together. In the
second approach the ply orienta-tions were distributed throughoutthe laminate thickness. Stress/
strain data from scaled angle ply
coupons loaded in tension to
failure are shown in the upperfigure. All scaled specimensexhibit the same initial modulus.
However, a significant scale effect
in strength is observed as size
increases; the scaled coupons con-
taining blocked plies exhibit a
trend of decreasing strength.Thus, the baseline, or smallest
specimen, appears twice as strong
as the comparable full-scale
specimen. For the distributed ply
specimens, the trend is increasing
strength with increasing specimen
size. Also, the distributed ply
16

RESEARCH AND TECHNOLOGY HIGHLIGHTS
Critical Technologies
280
AppliedStress,MPa
140
Full-scale _
__Baseline
i Full-scale
Blocked
. . I . . I = . II . . I . . I . . | a • II
0 2 4 6 8 10 12 14Strain %
Mechanical properties
1.8 [ Delamination F""''"-
Normalized iCritical t °nset __" -- -- "--a/_f-_
Strain } /_ _ _"_Theory + exp. 1st
j- p,ycrac.k....
1 " cracking onset
I 2 3 4
Specimen Scale Size, n
Failure theory evaluation.
lay-ups have a plastic, yielding be-havior, while the blocked lay-ups
exhibit a brittle response prior tofailure. As a result of these find-
ings, the ASTM D-3518 standardtest method for determination of
shear modulus and shear strengthwas changed to specify a minimum
thickness and lay-up for the test
specimens. A second study was
conducted to investigate the effectof specimen size on the tensile
response and ultimate failure inblocked and distributed scaled
composite coupons. All lay-upscontained a core of 90 ° plies, which
tend to develop transverse matrix
cracks under tensile loading.These cracks act as stress risers in
neighboring plies leading to pre-mature fiber failure, or serve assites of delamination initiation.
The data in the lower figure showcritical strains at the onset of trans-
verse matrix cracking in the 90 °plies and at the onset of delamina-
tion for quasi-isotropic laminates
as a function of increasing size.
Also shown are analysis results for
delamination onset using a strain
energy release rate approachwhich predicts a highly conserva-
tive failure strain magnitude
compared to the experimental
data. As a first approximation to
account for matrix cracking, theexperimental data for onset of
transverse cracking were added to
the delamination analysis. This re-
sponse appears to more accuratelyrepresent strain at delamination
onset with specimen sizo, These
results are being used to develop
accurate scaling laws for composite
structures and to challenge currentfailure theories to account for size
effects and the importance of
transverse cracking in delaminationonset.
(Karen E. Jackson, 44147)Structures Directorate
Transonic Aeroelastic
Phenomena Investigated
for Transport Model in
TDT
Modern high-speed transport
aircraft operate near, and some-
times in, the transonic speed
regime, where the aircraft's perfor-
mance can be adversely affectedby various aeroelastic phenomena
such as flutter, limit cycle oscilla-tions (LCO), and transonic buffet.
Flutter is a diverging oscillationcaused by interactions between
the structural dynamic and aero-
dynamic characteristics of theaircraft. LCO, which is related to
flutter, is a limited-amplitude,
self-sustaining oscillation possibly
17

L-92-12102
No Fuel, No Winglet, Nominal Nacelle Spring
200 - Experiment-_
\0 Unstable
Analysis _ \ O150- \ o /
Dynamic \ _._/pressure, Stablepsf
100 High response -1st wing
bending mode _"_iii_;ii
50.6 I I I I.7 .8 .9 1.0
Mach number
Experimental and predicted flutter boundary of a large transport aircraft.
caused by "classical" shock
boundary-layer interactions ornonlinear engine nacelle strutstiffness. Transonic buffet is an
irregular oscillation caused by
shock-induced boundary-layer
separation at transonic speeds.
The study was a cooperative effortbetween NASA and Boeing to
investigate and understand thevarious aeroelastic phenomena as-
sociated with advanced high-speed
transport configurations and to
provide a database to evaluate lin-
ear state-of-the-art and CFD
unsteady aerodynamic andaeroelastic methods.
An aeroelastic model of a hi_h-
speed transport was tested in the
Transonic Dynamics Tunnel
(TDT). A photograph of the modelmounted in the tunnel test secti,m
is presented in the figure. The
wing had a supercritical airfoil, aremovable winglet, and a flow-
through engine nacelle. The rigid
fuselage half-body provided
realistic flow over the wing and
removed the wing from the wind-tunnel wall boundary layer. In
addition, wing internal fuel wassimulated and could be varied
remotely.
The aircraft parameters thatwere varied included fuel load,
nacelle spring stiffness, nacelleflow blockage, winglet (on/off),
and angle of attack. For each
configuration tested, high buf-
feting response of the first wing
bending mode was encountered ina narrow portion of the transonic
region. Flutter boundaries obtain-
ed for several of the configurations
tested were compared with 2-D
strip theory (with corrections)
predictions.(Donald F. Keller, 41259, and
Stanley R. Cole)Structures Directorate
Micromechanics-Based
Computer Code for
Composites Stress
Analysis
Microcracks in composites can
grow to produce ply cracks anddelaminations that seriously
degrade these materials. Stressanalyses of such microcracks mustaccount for the local fiber-matrix
configuration and material proper-
ties. The present micromechanics-
based computer code (MICSTRAN)
was developed for this purpose.
Airy's stress functions from the
literature provided the analytical
basis for this user-friendly comput-
er code that runs on a personal
computer. After a diamond or
square arrangement is selected forthe fibers, input involves elastic
18
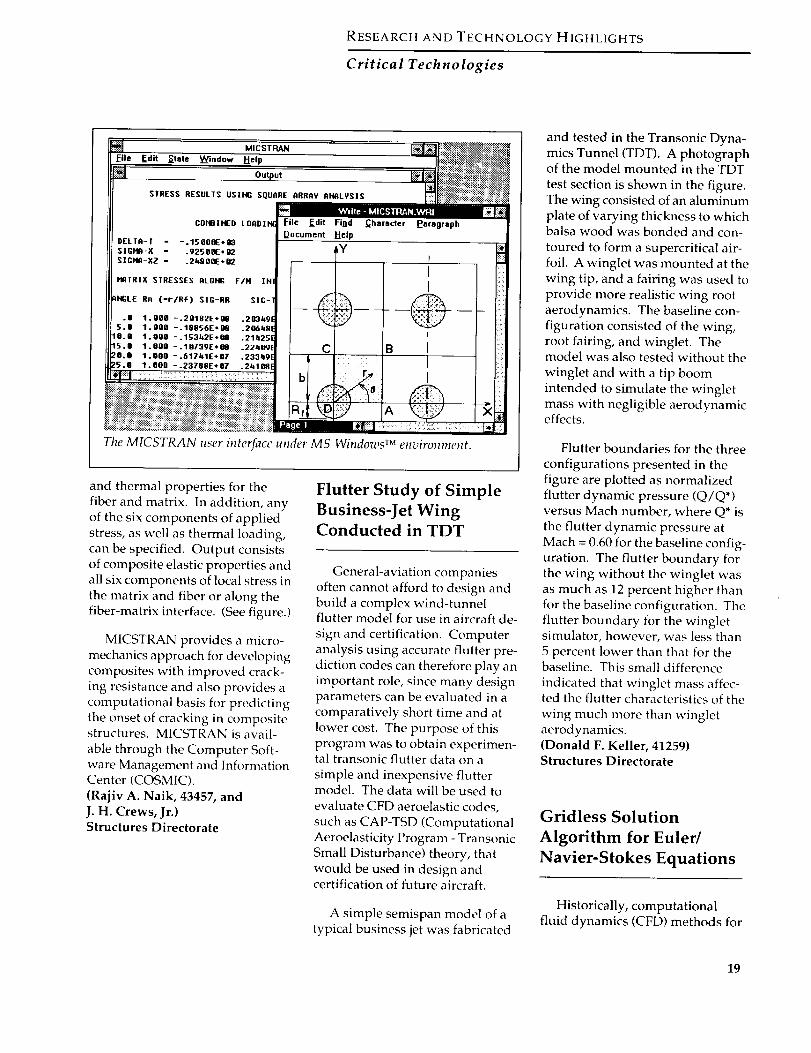
RESEARCH AND TECHNOLOGY HIGHLIGHTS
Critica I Tech n o logies
CST_N :_:__ tK_File Edit _tate _indow Help I[__,_
Output tt_:j._ :|li_.............._ .........._......
STRESS RESULTS USIHG SQUnRE RRRflV RHflLVSIS _!i::_#i_!i,i:_i_%_j
COHBIHED LO_DIH
.lit
FIH IH
.203_91
.206_81
.21_25i
.22_!
.233qgE
.2qli_tE
[ilc Edit Find Character Paragraph
[_ocumcnt Help
The MICSTRAN user interface under MS Windozos TM environment.
and thermal properties for the
fiber and matrix. In addition, any
of the six components of applied
stress, as well as thermal loading,can be specified. Output consists
of composite elastic properties andall six components of local stress in
the matrix and fiber or along the
fiber-matrix interface. (See figure.)
MICSTRAN provides a micro-
mechanics approach for developingcomposites with improved crack-
ing resistance and also provides a
computational basis for predictingthe onset of cracking in compositestructures. MICSTRAN is avail-
able through the Computer Soft-ware Management and InformationCenter (COSMIC).
(Rajiv A. Naik, 43457, and
J. H. Crews, Jr.)Structures Directorate
Flutter Study of Simple
Business-Jet Wing
Conducted in TDT
General-aviation companies
often cannot afford to design andbuild a complex wind-tunnelflutter model for use in aircraft de-
sign and certification. Computer
analysis using accurate flutter pre-
diction codes can therefore play an
important role, since many designparameters can be evaluated in a
comparatively short time and at
lower cost. The purpose of this
program was to obtain experimen-tal transonic flutter data on a
simple and inexpensive fluttermodel. The data will be used to
evaluate CFD aeroelastic codes,
such as CAP-TSD (Computational
Aeroelasticity Program - Transonic
Small Disturbance) theory, that
would be used in design andcertification of future aircraft.
A simple semispan model of a
typical business jet was fabricated
and tested in the Transonic Dyna-
mics Tunnel (TDT). A photographof the model mounted in the TDT
test section is shown in the figure.The wing consisted of an aluminum
plate of varying thickness to whichbalsa wood was bonded and con-
toured to form a supercritical air-
foil. A winglet was mounted at the
wing tip, and a fairing was used to
provide more realistic wing rootaerodynamics. The baseline con-
figuration consisted of the wing,root fairing, and winglet. Themodel was also tested without the
winglet and with a tip boom
intended to simulate the wingletmass with negligible aerodynamiceffects.
Flutter boundaries for the three
configurations presented in the
figure are plotted as normalized
flutter dynamic pressure (Q/Q*)versus Mach number, where Q* is
the flutter dynamic pressure at
Mach = 0.60 for the baseline config-uration. The flutter boundary for
the wing without the winglet was
as much as 12 percent higher thanfor the baseline configuration. The
flutter boundary for the wingletsimulator, however, was less than
5 percent lower than that for thebaseline. This small difference
indicated that winglet mass affec-ted the flutter characteristics of the
wing much more than wingletaerodynamics.(Donald F. Keller, 41259)Structures Directorate
Gridless Solution
Algorithm for Euler/
Navier-Stokes Equations
Historically, computationalfluid dynamics (CFD) methods for
19

• i
L-93-1966
1.2
Normalizedflutter
dynamicpressure,
Q/Q*
1.1
1.0
.9
.8
.7
-6.5
EK _, Unstable13
i I i I i.6 .7 .8 .9 1.0
Mach number
Effect ot wingh'ts on flutter characteristics of a transport wing.
Gridless
5
-Cp o
-10 .
-1 5 _1 I '
0 2 4- .5 3 1 3
X/C
Unstructured Grid
-Cp
1.6
1.2
0.8
0.4
0.0
-0.4
-0.8
+ Upper Surface
x Lower Surface
Navier-Stokes solutions forNACA 0012 airfoil. M_ = 0.5;ot = 0°; Re = 5000.
soMng the Euler and Navier-Stokesequations have used either struc-
tured or unstructured grids. Since
either type of grid has its advantag-es, no method has emerged superi-or to the other. A method that
uses only clouds of points and
does not require that the points beconnected to form a grid was
developed. The advantage of the
gridless approach is that the pointscan be more appropriately located
and clustered, leading to far fewer
points being required to solve a
given problem. The method can
be used to analyze general geome-tries in a single-block computation-
al domain and allows direct imple-
mentation of spatial adaptation•
The governing partial differential
equations (PDE's) are solved
directly by first performing local
least-squares curve fits in eachcloud of points and then analytic al-
ly differentiating the resulting
curve-fit equations to approxim _tethe derivatives of the PDE's. Since
differences, metrics, lengths, areas,
and volumes are not computedthe method is neither a finite-
difference nor a finite-volume t}pe
approach. The gridless CFD
approach has the potential to
resolve the problems and ineffi.ciencies associated with methods
that require grid points to be cc n-
nected. Consequently, it offers
great potential for accurately and
efficiently solving viscous flows
about complex flight vehicleconfigurations.
Steady pressure coefficients
(Cp) on the NACA 0012 airfoilwere calculated using the Navier-
Stokes equations for M_ = 0.5,
= 0 °, and Re = 5000. A compari-
son of gridless and published un-
structured grid calculations shows
very good agreement.(John T. Batina, 42268)Structures Directorate
2O
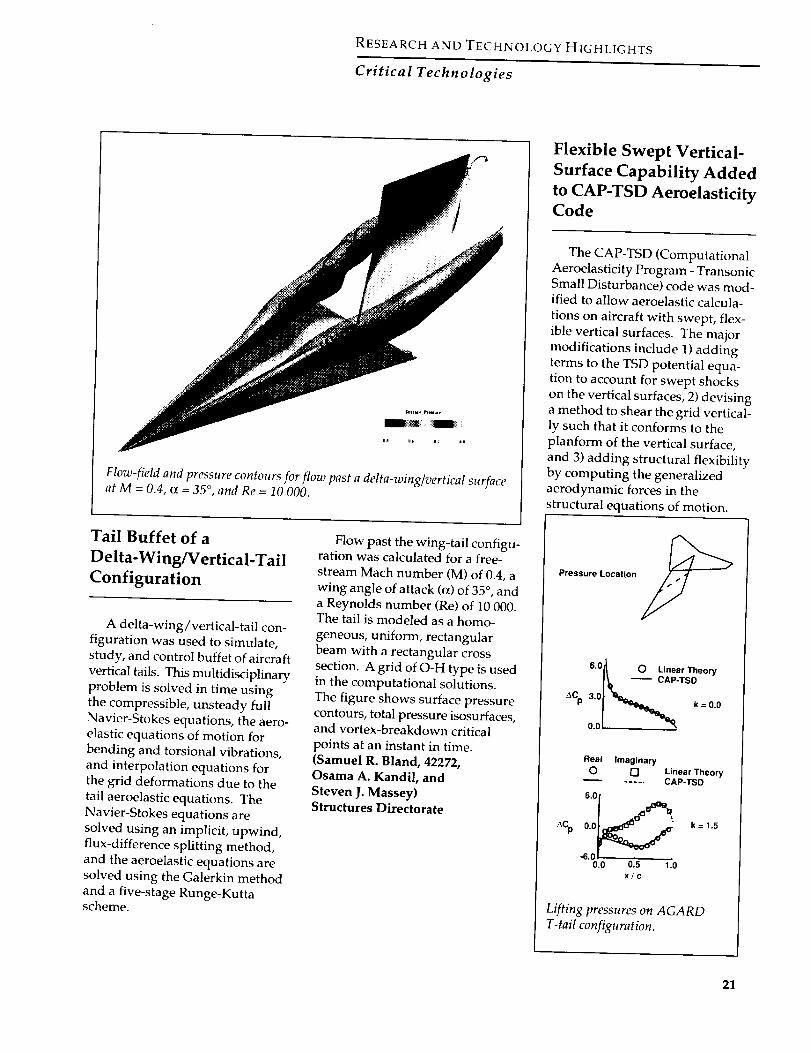
RESEARCH AND TECHNOLOGY HIGHLIGHTS
Critica I Tech n o logies
Flow-field and pressure contours for flow past a delta-wing�vertical surfaceat M = 0.4, o_ = 35 °, and Re = 10 000.
Tail Buffet of a
Delta-Wing/Vertical-Tail
Configuration
A delta-wing/vertical-tail con-figuration was used to simulate,
study, and control buffet of aircraft
vertical tails. This multidisciplinary
problem is solved in time using
the compressible, unsteady full
Navier-Stokes equations, the aero-elastic equations of motion for
bending and torsional vibrations,
and interpolation equations for
the grid deformations due to the
tail aeroelastic equations. TheNavier-Stokes equations are
solved using an implicit, upwind,
flux-difference splitting method,
and the aeroelastic equations are
solved using the Galerkin methodand a five-stage Runge-Kuttascheme.
Flow past the wing-tail configu-ration was calculated for a free-
stream Mach number (M) of 0.4, a
wing angle of attack ((x) of 35 °, anda Reynolds number (Re) of 10 000.The tail is modeled as a homo-
geneous, uniform, rectangularbeam with a rectangular cross
section. A grid of O-H type is used
in the computational solutions.
The figure shows surface pressure
contours, total pressure isosurfaces,and vortex-breakdown critical
points at an instant in time.(Samuel R. Bland, 42272,
Osama A. Kandil, and
Steven J. Massey)Structures Directorate
Flexible Swept Vertical-
Surface Capability Added
to CAP-TSD AeroelasticityCode
The CAP-TSD (ComputationalAeroelasticity Program - TransonicSmall Disturbance) code was mod-ified to allow aeroelastic calcula-
tions on aircraft with swept, flex-
ible vertical surfaces. The majormodifications include 1) adding
terms to the TSD potential equa-
tion to account for swept shocks
on the vertical surfaces, 2) devising
a method to shear the grid vertical-
ly such that it conforms to the
planform of the vertical surface,and 3) adding structural flexibility
by computing the generalized
aerodynamic forces in the
structural equations of motion.
Pressure Location
6.0_ 0 Linear Theory
I_ _ CAP-TSD
0.01 5
aCp
Real Imaginary
0 [] Linear Theory
...... CAP-TSD
6.0_
0.0 k = 1.5
-6.0_
0.0 0.5 1.0
X/C
Lifting pressures on AGARD
T-tail configuration.
21

To demonstrate the accuracy ofthe modifications, calculations
were performed on an AGARD
T-tail configuration shown at the
top of the figure. The jump in sur-
face pressure coefficient (ACp) ver-sus fraction of local chord (x/c) is
shown for a fin twist mode shape
at M = 0.8 and at reduced frequen-
cies (k) of 0.0 (center of figure) and
1.5 (bottom of figure) near themidspan of the vertical fin. The
unsteady results were computed
by oscillating the vertical fin
harmonically in twist for severalcycles of motion. In order to com-
pare the CAP-TSD results with lin-
ear aerodynamic theory, the linear
equation coefficients were used.Comparisons show that for both
the steady and unsteady cases,CAP-TSD is in excellent agreement
with linear theory.(John T. Batina, 42268, and
Elizabeth M. Lee-Rausch)Structures Directorate
Multidisciplinary Design
Optimization To Improve
Aircraft Performance
The goal of multidisciplinary
design optimization is to integrate
the design of aircraft such that
effects from various disciplines areaccounted for simultaneously. In
a design study, an optimizer is
coupled to the analysis system,
which consists of linear-theory
aerodynamics codes, parametric
weight analysis, and a completemission evaluation that utilizes
the rigid-wing drag polars. Theoptimization is a sequence of
approximate problems where cost-
ly constraints and objectives are
linearized with respect to the para-
metric description of the design
• Wei ht Minimization
Range Maximization
• Initial Baseline n
1.2
1.1
1.0
0.9
0.8
0.7
0.6
0.5
• Initial Final • initial I Final
Range/Ri TOGW/Wi
Range Optimization
Range/Ri TOGW/Wi
Weight Optimization
Effects of wing plan form chang,'s on performance characteristics of
High-Speed Civil Transport.
_roblem. Since simple lineari;:a-
tions are generally valid only near
the point at which they are calcu-
lated, limits are placed on the
changes that can be made to the
design parameters during a c) cle.
The resulting integrated aer _dy-
namic and performance desig
system was applied to the wing
planform of the Langley High-
Speed Civil Transport 2.4e config-
uration. Shape was optimized for
either a maximum range objective
or a minimum weight objective.
Initial and final planforms are
shown at the top of the figure, and
aircraft performance is shown atthe bottom. In the range maximiza-
tion problem, the aircraft range
was increased with a negligible
change in take-off gross weight.
For the weight minimization prob-
lem, take-off gross weight was
22

RESEARCH AND TECHNOLOGY HIGHLIGHTS
Critical Technologies
decreased with a negligible change
in aircraft range.(Jaroslaw Sobieski, 42799, Eric R.
Unger, and Peter G. Coen)Structures Directorate
Calculation of Wing
Flutter Characteristics
Using a Navier-Stokes
Aerodynamic Method
The transonic speed range has
been a main focus of recent compu-
tational developments, because
flutter dynamic pressures are typi-
cally lower in this speed range. Tomeet the challenge of analyzing
aeroelastic responses at transonic
speeds, methods that use Euler
and Navier-Stokes aerodynamics
are being developed and validated.
To allow for aeroelastic analysis,
the structural dynamics equations
of motion and a dynamic mesh ca-pability were added to the CFL3D
Euler/Navier-Stokes computation-
al aerodynamics code. That code
was developed in the NASA
Langley Computational Aero-
dynamics Branch, Fluid DynamicsDivision. The flow equations were
integrated simultaneously with
the structural dynamics equations,
and the dynamic mesh was used
to model wing motion. The result-
ing method was applied to astandard aeroelastic wing that was
tested for dynamic response in the
Langley Transonic Dynamics Tun-
nel (TDT). Flutter analyses were
previously performed using Euleraerodynamics. The results in the
figure show that at subsonic free-stream Mach numbers, the flutter
speed index that was computed
using Euler aerodynamics agrees
0.7
0.6
I-I
O
ExperimentEuler
Navier-Stokes
[3
Flutter 0.5
Speed
Index 0.4
0.3 -
<>
0.2 I I I I I I J
0.0 0.2 0.4 0.6 0.8 1.0 1.2 1.4
Mach Number
Comparison of computed flutter predictions with experimental data for 45 °
swept-back wing.
well with the experimental values.
However, at speeds above Mach
one, the computed flutter boun-
dary indicates an earlier rise thanwhat was measured. The flutter
characteristics were then recomput-ed at free-stream Mach numbers of
0.96 and 1.141 using Navier-Stokes
aerodynamics. These results,
which are included in the figure,indicate that the effect of including
fluid viscosity on the flutter charac-
teristics is to delay the rise in the
flutter boundary for supersonicfree-stream Mach numbers.
(Elizabeth M. Lee-Rausch, 42269,
and John T. Batina)Structures Directorate
Implicit Shear
Deformation Model for
Rotor-Blade Analysis
Analytical modeling of rotor
blades as beams is an important
part of comprehensive aeroelasticrotorcraft analyses. The intro-
duction of composite materials
and elastic couplings into rotor-blade design, however, reduces
the accuracy of beam-based analy-ses, because classical beam model-
ing assumptions are violated.
Improvements in beam modeling
for these types of structures are
gained by accounting for local
cross-section deformations (warp-ing) and shear-mode deformations.
A beam was recently studiedthat was both extension-twist and
bending-shear coupled. The bend-
ing in one principal direction pro-
duced shear in the orthogonaldirection; thus, the shear deforma-
tion had a significant effect on the
beam bending stiffness. By includ-
ing additional shear-related
23

4O
• Classical Beam, 15 DOF/Element
[] Explicit Shear Deformation, 19 DOF/Element
Implicit Shear Deformation, 15 DOF/Element
[] Advanced Cross Section with
Implicit Shear Deformation, 15 DOF/Element
01St Flap 1 st Lag 2nd Flap
Rotating Beam Modes
Frequency predictions of four beam models.
degrees of freedom (DOF) in abeam model, the effect of the shear
deformation may be captured as
shown in the figure (classical and
explicit models). An implicit sheardeformation model was developed
in which the explicit shear-related
degrees of freedom are staticallycondensed from the solution. The
results show that the response
obtained with the implicit model isidentical to that obtained with the
explicit model. Further, the impli-
cit model decouples the localcross-section degrees of freedom
from the global (spanwise) degreesof freedom, so that advanced
cross-section analyses may be used
in unison with the implicit beammodel. The advanced cross-section
analyses are generally finite-element based and account for
nonclassical warping influenceson cross-section stiffness proper-
ties. The improved results associ-
ated with coupling an advanced
cross-section analysis with the
implicit beam model are also illus-
trated in the figure. The implicit
beam model has been successfullyimplemented in a rotorcraft .zom-
prehensive analysis known as
UMARC (University of Mar glandAdvanced Rotor Code), which is
available to and used by the
rotorcraft industry.(Mark W. Nixon, 41231)Structures Directorate
Hypersonic Aeroela,;tic
Analysis Method Using
Steady CFD Aerodynamics
Computational fluid dynamics
(CFD) methods offer the advantage
of more accurate prediction of sur-
face pressures compared with themore conventional linear aero-
dynamic methods, but at the
expense of a significantly higher
computational burden than the
linear methods. For example, thecomputational burden increases
when unsteady pressures are
required for flutter analyses.
For very high-speed flight (typi-
cally Mach numbers at and above
5), a quasi-steady approximationmay be made. This approximation
assumes that the reduced frequen-
cies associated with the importantstructural vibration modes that
contribute to flutter are very muchless than 1. Under these conditions,
time constants of the unsteadyflow are so small that the aero-
dynamics acting on the vehicle canbe assumed to have "no memory,"
and certain steady CFD calculations
should closely approximate the
real and imaginary parts of certainother unsteady CFD calculations.
If this is the case, then, for very
high-speed flight, flutter analyses
OuasbStoady¢FD
UnsteadyCFO
Comparison of imaginary parts of
pressures obtained with
quasi-steady and unsteady CFDmethods.
24

shows the boundary defined by
flutter points that were obtained
with the tip mass. The measured
flutter boundary agreed fairly well
with preliminary analytical predic-tions for this configuration. The
experimental flutter data obtainedwill be beneficial for validation of
the analytical flutter codes that are
used to define requirements neces-
sary to verify that the aircraft willbe free of flutter.
(Moses G. Farmer, 41263, and
James R. Florance)Structures Directorate
Cessna Citation X
Flutter-Clearance Tests
Business-jet aircraft must be de-
signed so that flutter will not occur
within the flight envelope with a
20-percent safety margin. Tradi-
tionally, wind-tunnel model testshave played an important role in
the flutter certification process of
new designs. The objective of the
present cooperative study withCessna Aircraft was to providewind-tunnel flutter data for use in
ensuring that the wing of the Cita-tion X will be safe from flutter.
A 1/4-scale semispan aeroelasticmodel of the Citation X wing was
tested in the Transonic Dynamics
Tunnel (TDT). A photo of themodel mounted in the TDT test
section is shown in the figure. The
rigid fuselage half-body and flow-through nacelle simulated the
effect that the aircraft fuselage had
on the flow over the wing. The
wing model included an aileronthat could be tested undeflected or
at a deflection angle of 4°.
Eight configurations weretested to obtain data to correlate
1.2!i
1.01
.8
Dynamicpressure .6
ratio
.4
L-93-01432
I -- Analytical flutter Io Experimental flutter_PNo flutter (low damping)
\
.2 .4 .6 .8 1.0Mach number
Scaled flightenvelopewith 20%
margin
I0 1.2
Flutter boundary for Cessna Citation X aircraft.
with flutter and aileron-reversal
analyses. A wing-tip-mounted
aerodynamic exciter was used
extensively during the test to trackfrequencies and estimate dampingas the flutter boundaries were
approached. Flutter results are
shown in the figure for the configu-ration with nominal aileron actua-
tor stiffness. The flutter analysis
(represented by the dashed line)
predicted the flutter boundary tobe outside of the scaled flight enve-
lope with a 20-percent margin.The experimental flutter points
(circular symbols) obtained for
this configuration correlated well
with the analysis and indicatedthat the Citation X wing will besafe from flutter.
Tests of this type ensure that
flutter or aileron-reversal problems
that may exist for a new design are
identified early enough in the
design/development cycle that asolution (fix) can be effected in a
timely manner with minimum
impact on cost and schedule. Inaddition, wind-tunnel tests suchas those described here reduce the
number of more costly flightflutter tests.
(Jos4 A. Rivera, Jr., 41207, andMoses G. Farmer)
Structures Directorate
Laser-Beam Welding ofAluminum-Lithium
Structures
Significant cost and weight sav-
ings can be realized through theuse of advanced materials and
26

RESEARCHAND"IECHNOLOGYHIGHLIGHTS
Critical Technologies
employing this quasi-steadyapproximation would have the ad-
vantage of the accuracy associated
with unsteady CFD calculationsbut without the associated disad-
vantage of increased computation-al burden.
Two calculations were perform-
ed for a cantilevered hypersonic
wing. Imaginary surface pressure
contours associated with the pitch
mode are shown in the figure. Thecontour on the top was obtained
with the quasi-steady method; thecontour on the bottom was obtain-
ed with unsteady CFD calculations.
These pressures compared very fa-
vorably and confirm the success ofthe method. These more accurate
quasi-steady aerodynamics willresult in a more realistic flutter siz-
ing of hypersonic vehicles and
could result in lighter structural
weights.(Robert C. Scott, 42838)Structures Directorate
Boeing 777 Flutter Model
Test Completed in TDT
Commercial transport aircraft
must be designed so that flutter
will not occur within the flight
envelope that includes all condi-tions the aircraft may encounter.
The objective of this program was
to verify that the Boeing 777 wings
will have the required flutter
margin of safety throughout theaircraft flight envelope.
A dynamically scaled semispan
aeroelastic model of the Boeing
777 wing was tested in the Langley
Transonic Dynamics Tunnel (TDT)
as part of the flutter clearance pro-
gram. A photograph of the modelinstalled in the TDT is shown in
L-92-08248
1,2 r-
.8-Dynamicpressure
ratio.4
0
Unstable
Stable
l J I , I , I , ]
.2 .4 .6 .8 1.0
Mach number
Configuration with wing-tip mass.
the figure. The rigid fuselage half-
body simulated the effect fiat the
aircraft fuselage will have on theflow over the wing. The model en-
gine nacelle was designed t(, simu-
late air mass flow through tae
aircraft engine. The model was
designed so that the amouw: of
simulated fuel in the wing and the
stiffness of the engine pylon could
be changed remotely.
Ten configurations were tested
throughout the simulated flight
envelope of the aircraft without
obtaining flutter. Parameters that
were varied included wing fuel,
engine pylon stiffness, and thestiffness of the structure that
attached the wing to the fuselage.To create a configuration for whichflutter would occur, a mass was in-
stalled in the wing tip. The figure
25

Detected edges: runway, taxiway, horizon, and buildings (lower portiwz of
figure); from frames 1, 16, a_Jd3_) m the sequence of simulated images
(upper portion of figure).
sors or replacement of a poor-
resolution image with onboard
high-resolution computer-generated
imagery (CGI) to provide a muchmore effective "synthetic vision"
display. The objective of this
study was to develop methods for
the analysis of images from passivemillimeter wave (PMMW) imaging
systems to delineate objects of
interest. A sequence of simulated
images as seen from an aircraft as
it approaches a runway was
obtained from a model of a passivemillimeter wave sensor. Thirty
frames from this sequence of imag-
es (200 x 200 pixels) were analyzed
to identify and track objects in the
image using the Cantata imageprocessing package within the
visual programming environment
provided by the Khoros software
system. An image analysis and
object tracking system was imple-mented in Khoros and tested on
the sequence of digitized images.
A number of different algo-
rithms were evaluated and appro-
priate parameters were selected
during the design of this analysis/tracking system. The final system
consisted of the following stages:
smoothing using a spatial averag-
ing filter for noise reduction; de-tecting edge pixels using a recur-
sire filter; bridging discontinuities
in detected edges using an edge-
linking operator; labeling objects
in each image in this sequence;and comparing them with objects
in subsequent frames to locate cor-
responding objects. The figure
shows three of the thirty imagesand the corresponding detected
edges of objects.
The preliminary results present-
ed here using thirty simulated
images clearly demonstrate the
potential of image analysismethods for detection and tracking
of objects in a dynamic scene.
Analysis of real images is well-
known to be a much more difficult
task, particularly in real time. Torealize a practical system, new
vision algorithms for analyzing
sensor-captured images and for
fusing information from varioussensors will be studied under an
existing grant with Penn StateUniversity.(Randall L. Harris, Sr., 46641, and
Rangachar Kasturi)
Flight Systems Directorate
Effects of Historical and
Predictive Information on
the Ability To Predict
Time to an Alert
The early detection of a sub-
system problem that is developing
during flight is potentially impo_
tant, especially for twin-engineaircraft used in extended opera-tions over water, because the extra
time may allow the flight crew to
consider and/or try more options
for dealing with the failure. Some
faults have the potential for suchearly detection, which may lessen
the severity of the problem and
thus enhance the safety of the
flight. However, current automat-ed monitoring systems do not alert
the flight crew of a failure until a
parameter value has exceeded analert limit. To detect a failure
before this limit is exceeded, the
flight crew must monitor sub-system parameters and make pre-dictions of their behavior. Recent
parameter history or near-term
parameter prediction may help the
flight crew make long-term pre-
dictions. To analyze the benefitsof such information, an experimentwas conducted that evaluated the
effects of recent historical and
near-term predictive information
28

RESEARCH AND TECHNOLOGY HIGHLIGHTS
Critical Technologies
"Jc_'n
i _I _ ! .....
Laser welding of AI-Li built-up structures.
innovative processing methods.The addition of lithium to alumi-
num alloys decreases the density
and increases the strength andelastic modulus; aluminum-lithium
(AI-Li) alloys are therefore ideal
candidates for aerospace struc-
tures. Laser welding is a candidate
joining process for fabricating
A1-Li built-up structures with
applications in airframe compo-
nents and cryogenic tanks and dry
bay structures for space transporta-
tion systems. Studies on the SpaceShuttle external tank have shown
that using advanced materials anc
manufacturing methods yields a
20- to 30-percent structural weighl
savings and a 20- to 40-percentreduction in manufacturing costs.
An interagency agreement wasestablished between NASA
Langley Research Center and the
Department of the Navy, Spaceand Warfare Systems Command
(SPAWAR) to investigate the feasi-
bility of laser-beam welding of
A1-Li structural components at the
Applied Research Laboratory of
Pennsylvania State University.Initial results concluded that laser-
beam welding was a feasible pro-
cess to join A1-Li alloys using thebuilt-up structure approach for
aircraft structures. The figure
shows a superplastically formed
AI-Li stiffener being laser welded
to a thin-gage sheet to form a skin-
stiffened component. Because the
laser-beam welding process exhib-
its very localized heating, struc-tures can be welded so as to mini-
mize the thermal distortions and
the heat-effected zone; joint effi-
ciencies are thereby increased.Laser-beam welding of AI-Li
alloys compared with conventional
welding processes offers signifi-
cantly higher processing speeds(i.e., 200 in.Train), elimination of
the need for weld lands (facilitating
the use of thin-sheet product), and
the ability to automate.
(Cynthia L. Lach, 43133, and
Dick M. Royster)Structures Directorate
Methods for Detecting
Objects Using Restricted
Visibility Sensors
As part of the Advanced SenSor
and Imaging _Systems _Technology
(ASSIST) effort, imaging systems
and display interface concepts are
being evaluated to enhance apilot's view of the outside environ-
ment under restricted visibility
conditions. During the landing
maneuver (the most critical phase
of flight), a method of identifying
important features (such as
runways, taxiways, buildings, andother aircraft) within an imaging
sensor's display is required. Such
a capability could enable the
"fusing" of multiple imaging sen-
27

RESEARCH AND TECHNOLOGY HIGHLIGHTS
Critical Technologies
_st=
! Standard
ConstVel
History
Decel
Redictive
Acc &Decel
Riots preferred thepredictive dial.
BUT
The complexity of the
time profile had thegreatest influence onthe estimates of thelime to on alert The
dial type _as not asignificant factor.
10
_=0
5 -sec
we_ng time
/_ND
11qe longer the dial v_s
studied, the quicker ananswer was chosen
Again, the dial typev_s not a significantfact(x,
Displays attd results from use of historical and predictive information in
estimating the time to an alert.
on the pilot's ability to make
long-term predictions of when a
parameter will reach an alert
range.
Eighteen current transport-line
pilots participated as test subjects
in a workstation study. Each sub-
ject estimated the time it would
take for a parameter value to enter
the alert range, that is, the amber
or red area marked on a dial, using
each of the three displays depicted
in the figure. The history dial
showed the parameter's value
5 seconds ago, and the predictive
dial showed the parameter's value
5 seconds into the future. The sub-
jects watched the dials in motion
for either 5 or 10 seconds with a
time profile that had either con-
stant velocity, deceleration, or
acceleration followed by decele-
ration. They then estimated the
time that would be required for
the parameter to reach an alert
range. The experiment was
designed so that neither the actual
value nor the predictive bug
entered an alert range during the
evaluation time. Results were
evaluated based on accuracy of re-
sponse, time to respond, and pilot
subjective ratings.
The primary results indicated
that although pilots preferred the
near-term predictive information,
the predictive dial did not improve
their ability to make long-term
predictions. Instead, the time pro-
files greatly affected the pilots'
estimate of the time to an alert (see
figure). The constant-velocity time
profiles had the least error. The pi-
lots seemed to have difficulty
accounting for the acceleration
and the deceleration in the other
two time profiles. Also, as the
time to study the dial increased,
pilots required less time to estimate
the time to an alert; that is, perfor-
mance with the 10-second viewing
time was better than with the
5-second viewing time.
These results indicate that the
simple solution of showing near-
term predictive information in the
history or predictive dial format
does not necessarily improve a
pilot's ability to make long-term
predictions.
(Anna C. Trujillo, 48047)
Flight Systems Directorate
Pilot Cognitive Activities
for Flight Deck
Information Management
Increasing automation on
modern commercial flight decks
has resulted in flight tasks becom-
ing less physically intensive and
more cognitive in nature. This hasfocused attention on the need to
consider the pilot's cognitive pro-
cessing capabilities as part of the
human engineering evaluation
process. To accomplish this, tech-
niques designed to examine the
cognitive processes that indivi-
duals utilize in accomplishing
tasks must be employed. One
such method is "protocol analysis,"
requiring subjects to verbalize
their thoughts while performing a
task. To analyze such data, it is es-
sential to have a taxonomy of cog-
nitive terms, operationally defined
and nonredundant, that an experi-
menter can use in scoring pilot
protocols. The objective of the cur-
rent project was to identify a
concise listing of such cognitive
activities regularly engaged in by
individuals. All terms related to
cognitive processes were identified
29

I_edlctAnticipate
Calculate
SolveComprehend
InferDeliberate
Interpret Diagnose
Modify
Develop
Integrate
Decide
Plan Review
AimsEvaluate
Identify
Recognize
Associate
CompareCategorize Recall
Revise Prloritize
Organize Select
Schedule
Multidimensional scaling analysis of cognitive activities.
Search
through a dictionary search.
Those items that were (1) synony-
mous or (2) of insufficient specific-
ity for analysis (for example, "tothink") were eliminated. This
refined list consisted of 30 words.
Seven subjects rated the similarity
of each pair of terms (but not theterm with itself). These data were
analyzed using multidimensional
scaling, a statistical technique thatprovides a visual representation of
how subjects perceive items to berelated. Terms located close to one
another in the space are judged by
subjects to be related, while terms
lying far apart in the space areperceived to be unrelated.
Three important findings
emerged from the results. First,"decide" was central to all other
terms describing cognitive activi-
ties, underscoring the ubiquitous
nature of decision making in the
cognitive domain and the impor-
tance of the other cognitive pro-
cesses in supporting decisionmaking. Second, "diagnose" and
"plan" occupied opposite ends of
the spatial plot; each had different
cognitive processes associated
with it. This provides emairical
evidence that planning and diag-
nosis represent fundamentally dis-
tinct cognitive activities, with each
supported by different cognitiveactivities (i.e., those terms clustered
around "plan" and "diagn,_)sis"). A
third finding concerns red undan-
cies found in the original :Jet of 30
terms. That is, subjects perceived
several terms as being so similar to
one another as to be virtuallyindistinguishable; for example, the
words "analyze," "evaluate," and"assess" could be consolid 1ted into
a single term. These results consti-
tute a taxonomy of cognit ve
processes that provide importantinformation for use in flight deck
experimentation and in under-
standing flight deck activi ties.
Identification of the cognitive
processes associated with 91anning
and diagnostic tasks will aid
researchers by focusing tl_eirefforts on examining how these
processes are affected by design
factors. The utility of these results
was recently demonstrated in an
experiment designed to examine
how pilots make planninf; deci-
sions related to in-flight weatherdiversions.
(Jon E. Jonsson, 42001, andMichael T. Palmer)
Flight Systems Directorate
Pilots' Cognitive
Representations of FlightDeck Information
Categories and Priorities
Increasing automation onmodern commercial aircraft has
made it more challenging for flight
deck designers to determine what
flight crews need to safely and
efficiently perform their functions.Recent developments in cognitiveresearch have shown the useful-
ness of psychological scaling tech-
niques for representing human
knowledge and processing struc-tures. In applying these techniques
to cognitive processes as they
pertain to the flight deck, processes
that are regularly engaged in by
flight crews and which mostdirectly affect the proper and safe
use of flight deck systems should
be targeted. Two such activities
are information categorization
and prioritization. The specific
objective of this study was to
establish, in an empirical fashion,
how pilots categorize flight deckinformation and how they judge
the relative importance of that
information as they act upon it.
Two 20-element sets of experi-
mental stimuli were randomlygenerated from a list of informationelements enumerated in an infor-
mation analysis of the Boeing747-400. Each element in the list
represented a piece or type of
information found on the flight
deck. Fifty-eight pilots then partic-
3O

RESEARCtl ANDTECttNOL()GY HIGtfI. IGHTS
Critical Technologies
frequent
Sample Rate
infrequent
aviate
navigate Flight Action
Flight Functionadministrate tactical
Spatial solution amf i,tcrl,'etation _!f set A similarity rati,_.
lpated in the experiment. Each
pilot used one of the two stimuli
sets and did pairwise-comparison
and rank-ordering tasks using
their set of information elements.
For the pairwise-comparison task,
pilots rated the similarity of each
pair of elements on a scale of one
to nine. For the rank-ordering
task, they ordered the information
elements from most to least impor
tant. These prioritizations were
performed under two separate
conditions. The pilots first prior-
itized the elements independent of
any context and then assumed the
takeoff phase of flight. Under both
of these conditions, the pilots were
told to assume that all systems
were operating re)finally. The
data were analyzed using statistical
methods that revealed common
underlying groupings and
dimensions of the data.
Analyses of the similarity data
suggest that pilots mentally
organize flight deck information
along three dimensions (as shown
in the figure). These three dimen-
sions appeared to be related to the
flight function (aviate, navigate,
and communicate) that the infor-
mation supports, the flight action
(tactical and strategic) to which the
information relates, and the sam-
pie rate (infrequent to frequent) at
which the information is acquired.
_lhe rank-ordering analysis reveal-
ed that the pilots prioritize accord-
ing to distinct clusters or care-
gories. Based on the member
elements of these clusters, the
prioritization categories (in order
of relative priority) were interpret-
ed as flight control information,
reference/navigation information,
system information, communica-
tions information, and emergency
reformation.
Results from this study provide
a basis for understanding how
pilots manage information. These
results show how pilots categorize
and prioritize the information with
which they work. The dimensions
resulting from both analyses can
be used in a predictive fashion
(during the design process) to
evaluate a pilot's cognitive pro-
cessing under different situations
31

and flight deck configurations.
That is, the designer could infer
cognitive loadings based upon
each dimension, given the informa-tion that the pilot uses to perform
a given task.
(Jon E. Jonsson, 42001, andWendell R. Ricks)
Flight Systems Directorate
Method for Exploring
Information Requirements
Associated With Cognitive
Processes
For a system to support humansin achieving the objectives for
which they are responsible, it is
necessary to first determine what
information is required to supporttheir tasks. Because of advanced
automation, many operator tasks
are becoming less physical and
more cognitive. Recent develop-
ments in cognitive research have
shown the utility of psychometricscaling techniques (e.g., multi-
dimensional similarity scaling and
multidimensional preference
scaling) for determining human
cognition and processing struc-
tures (e.g., categorization and
prioritization). The data acqui-sition associated with these tech-
niques is usually done in "sterile"environments (i.e., not in the
domain). Using only a laboratory
environment leaves questionable
the applicability of the resultingcognitive models to the domain
setting. The objective of the work
described here was to develop a
nonintrusive method for obtaining
psychometric scaling data within
the context of the task beinganalyzed and to assess the ability
to compare the cognitive represen-
tations resulting from the "sterile"
Pilot with information acquisition interface.
environment with those from the
"context" environment.
The approach taken for thiswork was to combine existing psy-
chometric scaling techniques with
a new domain-specific, real-time
method of assessing information
use. With this approach, domainsubjects participate in several labo-
ratory psychometric scaling tasks
that yield information regarding
how the subjects perceive the
information similarity (e.g., how
they categorize information) end
what criteria they use to deter:nine
the relative importance of theinformation. The domain-specific
task then requires subjects to
explicitly select items from the
L-92-09570
same set of information elements
to perform a set of operationaltasks in real time.
Data acquired during thedomain tasks are then enhanced
by retrospective verbal descriptions
of why the subjects acquired the
information. The domain-specificdata acquisition was to require
pilots to explicitly "select" informa-
tion elements from an approach
plate while flying various simulat-
ed approaches (as shown in the
figure). Items on the approach
plate were made illegible by a
computer program, and the pilotmade them legible in real time
using the track ball to point at the
target information and clicking the
32

RESEARCH AND TECHNOLOGYHI(;I!LI(;HTS
Critical Technologies
track ball button. Multiple items
could be selected at a time. Any
item could be selected multipletimes, and each time an item was
selected it remained legible for 10seconds. Acquisition data were
formatted for analysis of what
type of information was selected,when information was selected,
how often it was selected, andwith what it was selected.
The domain task for obtaininginformation in real time was
demonstrated to be feasible and
nonintrusive. The task was easy toadminister, and the data collected
allowed the examination of the
relationship of cognitive processes
identified by the laboratory tests
(e.g., categorization and prioritiza-tion) and how information was
acquired to support the domaintask.
(Wendell R. Ricks, 46733,
Carl Feehrer, William H. Rogers,
and John S, Barry)Flight Systems Directorate
Compiler and Run-Time
Techniques for Efficient
Concurrent Object-Oriented
Programming
The introduction of concurrencycomplicates the task of large-scale
programming. Concurrent object-
oriented languages provide a
mechanism for managing the
increased complexity of large-scaleconcurrent programs. Fine-grained
object-oriented approaches pro-
vide modularity through encapsu-
lation while exposing large de-
grees of concurrency (i.e., exposing
objects that can execute in parallel).
The goal of the University ofIllinois Concert project is to
Applications: Modularity, Portability, Performance
1Concert System
Compile time
Optrmization
Speculative
Transfo;mation
and
Optimization
Compiler
Guided
Rumtime
Optimization
Hrgh
Performance
Run-time
System
Better Static Analysis
Levels of optimization in Concert system.
r
Higher cost
develop portable, efficient imple-
mentations of fine-grained concur-
rent object-oriented languages
based on automatic grain-sizetuning. A prototype Concert sys-
tem has been developed, and it
has been in operation on both
sequential and parallel platforms.The system includes an optimizing
compiler for an extended version
of Concurrent Aggregates and a
high-performance run-time systemthat runs on both Sun workstations
and the Thinking Machine CM-5.
Concert provides a framework for
systematically extracting and
exploiting the necessary informa-
tion for grain-size tuning. The
Concert system has four basictechniques for increasing execution
grain size: compile-time optimiza-
tion, speculative transformation
and optimization, compiler-guided
run-time optimization, and high-performance run-time systems.
This work was performed at the
University of Illinois Urbana-
Champaign, and it was funded in
part by the Illinois ComputerLaboratory for Aerospace Software
and Systems block grant with the
Langley Research Center.(Kathryn A. Smith, 41699)
Flight Systems Directorate
PARADIGM Compiler
for Distributed Memory
Multicomputers
Distributed memory multi-
processors are increasingly being
used to provide high levels of
performance for scientific applica-
tions by connecting several thou-
sand off-the-shelf microprocessorsthrough simple low-cost inter-connection networks. Distributed
memory machines offer significant
33

f J PARADIGM
FORTRAN 77
Or High-
Perlormance
FORTRAN
(HPF)
Preprocessor )
I UniformRepresentation
Analys)s
ransformations I
Optim}zalions)
I Generic Litbrary
]nlerface
iPSC ,PiCL,
E xpress, p4
Application of PARADIGM compiler.
Target systems
_' Inte_ iPSC,_2 iP$C/860
f CM-5
. Inte_ Paragon
Ib- Network of Workstations
iBM Power Parat{el SP-1
advantages over the shared
memory multiprocessors, but they
are more difficult to program. The
goal of the PARADIGM project at
the University of Illinois is to auto-
mate the mapping of sequentialFORTRAN 77 and High-
Performance FORTRAN programs
to distributed memory multi-
computers with little or no user
intervention. A prototypePARADIGM compiler has been
developed and evaluated. The
PARADIGM compiler performs
automated data partitioning usinga constraint-based approach. Its
capabilities include parallelization
of sequential programs into Single
Processor Multiple Data stream
(SPMD) parallel programs, auto-
mated data partitioning, synthesis
of high-level collective communica-tion, multithreaded execution, and
simultaneous exploitation of func-
tional and data parallelism. The
compiler currently outputs code
for the Intel iPSC hypercube, the
Intel Paragon, the Connection
Machine CM-5, the IBM Power
Parallel SP-1 systems, and thenetwork of workstations.
This work was performed izt the
Coordinated Science Laboratory at
the University of Illinois Urbana-
Champaign, and it was funded bythe Illinois Computer Laboratory
for Aerospace Software and Sys-
tems block grant with the LangleyResearch Center, the NationaiScience Foundation, the Office of
Naval Research, and the Semi-
conductor Research Corpora'ion.
(Kathryn A. Smith, 41699)
Flight Systems Directorate
Prototyping Environment
for Real-Time Systems(PERTS)
Traditionally, real-time systems
are built by first developing the
application software and then by
tuning the operating system andvalidating timing constraints
using ad-hoc exhaustive techni-
ques. This approach is time con-
suming. Exhaustive simulation
and testing are reliable and feasible
only for systems that use clock-driven or cyclic scheduling strate-
gies. Consequently, almost all
real-time systems that support
critical applications are clockdriven. Such a system is difficultto maintain and extend. The
Prototyping Environment for Real-
Time Systems (PERTS) is built onrecent theoretical advances in real-
time scheduling and validation,
and it will facilitate new approach-
es in building real-time systems,
thus resulting in systems that areresponsive and robust and easy to
modify and validate. The PERTS
system has reusable software
modules and tools for the design
and development of time-critical
systems. These software modulesimplement well-known and
emerging real-time scheduling
and resource management strate-gies that lead to robust and easy-
to-maintain systems. The user canselect and use a subset of them,
and together with an operating
system kernel that allows external
schedulers and resource managers,assemble an effective run-time
support system. The PERTS tools
support reliable and efficientmethods for the validation and
performance profiling of systems
built on these strategies.
This work was performed at the
University of Illinois Urbana-
Champaign, and it was funded in
part by the Illinois Computer
Laboratory for Aerospace Software
and Systems block grant with theLangley Research Center.
(Kathryn A. Smith, 41699)
Flight Systems Directorate
34

RESEARCH AND TECHNOLOGY HIGHLIGHTS
Critical Technologies
Instrumented
Source Code
Reqirements
Design
System Abstract Concrete
Resource Description DescriptionDescription
i
i Description Library (Model Base)
................... i
i
I'
Schedufability Analysis System
Compiler _ Instrumented --
Objecl Code
Execution Time
Teethed Measurement Tool
r IF
i
_ Timing
i _'_ Analysis
iI _ Tools
Synlhelic
Work{oad
Generator
PERTS system architecture.
System for Automated
Learning of Heuristics
Many application problems inreal-time environments are con-
trolled by heuristics that are diffi-
cult to adjust a priori. A prototype
learning system, TEACHER, has
been developed and evaluated.
The goal of the TEACHER systemis to automate the adaptation ofthese heuristics to the environment
in real time with little user inter-
vention. The system has been
applied to learn better load migra-
tion policies in a distributed net-work of computers, new placement
policies for tasks in massively par-
allel computing systems (these
results can be applied to placing
computational fluid dynamics
computations on such systems),
more accurate stereo vision algo-
rithms for depth perception (theseresults can be applied in image
recognition and understanding),
faster search algorithms for sched-
uling and optimization, and circuit
testing and logic synthesis.
This work was performed in the
Coordinated Science Laboratory at
the University of Illinois Urbana-
Champaign, and it was funded inpart by the Illinois Computer
Laboratory for Aerospace Software
and Systems block grant with the
Langley Research Center.
(Kathryn A. Smith, 41699)
Flight Systems Directorate
Extended Cooperative
Control Synthesis
Methodology
Cooperative Control Synthesisaddresses the problem of how to
design control laws for piloted,
high-order multivariate systems
and/or nonconventional dynamic
configurations in the absence of
flying qualities specifications. Thisis accomplished by the simulta-
neous solution of two coupled
optimal control problems. One
optimal controller can be thought
of as representing a pilot's control
dynamics, and the other representsa vehicle's augmentation control
law dynamics. This research
focused on improving the process
of Cooperative Control Synthesis
by incorporating a more accurate
representation of the pilot's control
dynamics. The simplified pilotmodel in the original Cooperative
Control Synthesis was superseded
by the Modified Optimal Control
Model. This model is based upon
an optimal control model of ahuman operator as developed byKleinman, Baron, and Levison
(Bolt, Beranak, and Newman, Inc.).
The improved process is primarily
a result of enhancing representationof the pilot's dynamics through in-
clusion of the delay inherent in
information acquisition and pro-
cessing by the pilot. This delay is
placed at each of the pilot's out-puts, and it is treated as part of the
plant dynamics for determination
of pilot regulation and filter gains
(as shown in the figure). The goal
of this improved methodology, re-
ferred to as Extended Cooperative
Control Synthesis, was to providecontrol laws with better pilot
tracking performance and
improved subjective rating.
35

_ HEURISTICS MANAGER_
4i
/
/
sc. oUL \
/
/
CFD
Computations
IFEEDBACKMANAGEMENT
Credit assignmentPerformance database
\
\
\
IAPPLOATOSYSTEM1Test case generator
Application problem solver
t
I \/
I \
I \
Computer MassivelyVision Parallel
Processing
\
\
Distributed
Computing
System
Overview qf TEACHER system.
1
Control Law
Conlroller
Inputs _ - -:- . .
Pnlot
Commands
Feedback
Measurements
I Sensors]
AircraftResponses
-i
Pilot
Observation5
p
p -- Neuro-molor Estimator and
L DeJayd | Dynamics I I Gains
i
q Motor Observalion
i Noise Noise
__ _Modjfied _OpUm_al_Co_ntr_ol ModeJ .......................
Extended Cooperative Control Synthesis block diagram.
Control laws were synthesized
using the extended methodology
for an acceleration command sys-
tem in a compensatory tracking
task. This design was then analy-
zed and compared with similar
designs using the original metho-
dology. Analysis results obtainedwith the extended method show
more than a 20-percent reduction
in predicted root mean square
tracking error, and they significant-
ly improved predicted Cooper-
Harper ratings over those obtainedfrom the original formulation.
(John B. Davidson, 44010)
Flight Systems Directorate
Total Reliability Modeling
Interface for Fault-Tolerant
Architectures
The Table-Oriented Translator
to the ASSIST Language (TOTAL)
is a computer program that enables
the practicing design engineer to
access the sophisticated mathemat-
ics of reliability analysis from ahigh-level system description
without sacrificing the mathemati-
cal rigor that is vital for meaningful
results. The TOTAL program, as
its name implies, uses a spread-
sheet style for system input. Thesystem is described in terms of
commonly used elements for fault-
tolerant systems (such as proces-
sors, input/output devices, or sen-
sors) and the strategies used to
obtain high reliability (such as rep-
licated redundancy, passive oractive sparing, and pooled spares).
The TOTAL program constructs
a more detailed reliability model
in the Abstract Semi-Markov Spec-ification Interface to the SURE
Tool (ASSIST) language by enume-rating the failure modes that are
inherent in the high-level descrip-
tion. System failure criteria must
also be supplied by the designer.
36

RESEARCH AND TECHNOLOGY HIGHLIGHTS
Critical Technologies
System Description (TOTAL V1.0'
OeOeNOsNc=es;IcondlElon: cause -> effect
r'--'_Lt--------- --'----_(pr-76"b_scessor_It]) ->R_Cmemor_s[iI I ]'9I Edit I/ REM(processors[2] ) -> R_'M(memoctes [2] I Fill
I_1 / REM(p ......... (3]) -> ,EM( .... tes[3]l I
Svsmm Fa,,ure D_ t_J, Ip_,ors) ) i_
C_naltions: ]_DEA._ !_ti_J _!y_e_'zes)) _l
System description panel of example system.
The ASSIST model is then automat-
ically solved by the Semi-Markov
Unreliability Range Evaluator
(SURE) program using designer-supplied component failure rates.
Since a design-level description
can result in reliability models that
are far too large to be solved, the
process includes model reductiontechniques to enable many com-
plex systems to be evaluated while
providing the designer with rig-orous error bounds on the results.
The TOTAL program also includes
a menu-driven input to guideinfrequent users to correct system
description. These menus are sim-
ilar in concept to input forms for
database data entry. The menu
program was written using theTransportable Applications Envi-
ronment (TAE). The TOTAL pro-
gram is written in ANSI-standard
"C". The entire package will rununder DEC-Windows Motif on
VAX/VMS systems and under
Motif windows on Sun
SPARCstations.
(Sally C. Johnson, 46204)
Flight Systems Directorate
Nonlinear Modeling
Using Multivariate
Orthogonal Functions
Aerodynamic forces and
moments acting on aircraft at high
angles of attack depend nonlinear-
ly on the aircraft motion and con-
trol surface deflections. High-fidelity modeling of this multivari-
ate dependence is required for
studying the dynamics and the
control of aircraft in this flight
regime. Generally, determiningwhich nonlinear terms should
make up the model is very difficult,and current methods amount to
sophisticated trial and error. The
objective of this research was to
develop a technique for accurately
identifying nonlinear models,
based only on experimental data.
The model must include appropri-ate terms, have accurate values for
the parameters multiplying each
term, and possess good predictive
capability.
The developed technique first
generates multivariate orthogonal
modeling functions from the data.
Because of orthogonality, a modelof the true multivariate nonlinear
relationship can be found preciselyand efficiently using an expansion
of orthogonal modeling functions
selected so as to minimize predic-
tion error. Each included orthogo-
nal modeling function is then de-
composed into an exact expansion
of ordinary polynomials, so thatthe final model can be interpreted
as selectively retained terms from
a multivariable power series
expansion.
The approach was demonstrated
by modeling a subsonic windtunnel database for the F-18 air-
craft. In the figure, aircraft motionvariables and control surface de-
flections from a push-over pull-upflight test maneuver were input toboth the wind tunnel database and
the polynomial model for the verti-
cal aerodynamic force Cz. The
polynomial model successfullycaptured the multivariate non-
linear relationship embodied inthe wind tunnel database. The
small mismatch from 16 to 22 sec
was due to extrapolation by the
polynomial model for unmodeled
unsteady effects at high angles ofattack in the wind tunnel data.
The technique described here is
capable of generating an accurate
polynomial representation of amultivariate nonlinear relationship
based on experimental data alone.
The resulting model has smooth
derivatives, exhibits good predic-
37

angleof
attack
(deg)
angleofattack L...J -- windtunnel 1
"/OIL ..... I 'l ......... polynomialmodel r_60_.......................................:......................................._; ................................I
50,L..............................:._...............................L./................2.....,N .....................
o i i i I 1o
o
i-0..'..
-1
-1.5
-2
-2.55 1o 15 20 25 30
time (see)
F-18 vertical aerodynamic force during
rive capability, and provides in-
sight into the underlyipg nonlineardependence. The method is gener-al, and it can be used for other
applications requiring accurate
modeling of multivariate nonlinearrelationships, such as biomedical
modeling or economic forecasting.
(Eugene A. Morelli, 44078)
Flight Systems Directorate
Pad-Abort-to-Runway
Maneuvers for Lifting
Reentry Vehicles
In parallel with the development
of low-cost vertically launched,horizontally landed manned
spacecraft concepts, the feasibility
of performing an abort from the
launch pad to a landing at a nearby
runway was investigated using
engineering analysis, real-time
piloted simulations, and maneuveroptimization software tools. Based
upon the HL-20 lifting-body simu-lation model, the effects of various
abort motors, maneuver strategies,
c Z
push-over pull-up maneuver.
and thrust-vectoring capabilitieswere studied. Combinat{ons of
vehicle weight, lift-to-dr;ig ratio,
steady winds, and launch pad/
abort runway orientatior_s wereevaluated to develop manual and
automatic control strategies forsuccessful launch site aborts.
Worst-case abort geometries (pad
to runway) were identifi.zd, and
necessary thrust levels _ere de-termined. Optimized maneuvers
were generated.
Initial proposals for tile launch
_ad abort scenario of these reentry
vehicles included parachute
descent to an ocean recovery; these
"wet" aborts would necessarily
require considerable rescueresources, and reuse of the vehicle
would be questionable. The
demonstrated capability of a "dry"abort makes these vehicles a more
attractive and lower risk candidate
for next-generation access to space.(E. Bruce Jackson, 44060, andRobert A. Rivers)
Flight Systems Directorate
Elucidation of
Phosphorescence
Quenching in
Photomagnetic Molecules
by Positron Annihilation
Spectroscopy
Platinum octaethyl porphyrin(Pt-OEP) is an efficient, room tem-
perature phosphor under ultravio-
let excitation. The phosphorescent
triplet state (T:) is readily quench-
ed by oxygen (02). This phenome-
non is being utilized as the basisfor global air pressure measure-
ments in aerodynamic facilities atvarious laboratories. The exact
¢!¢'_ " _ Suslainer
Pad 39A
Typical pad-abort-to-runway maneuvers for lifting body vehicles with
thrust-vectoring controls and sustainer rockets.
38
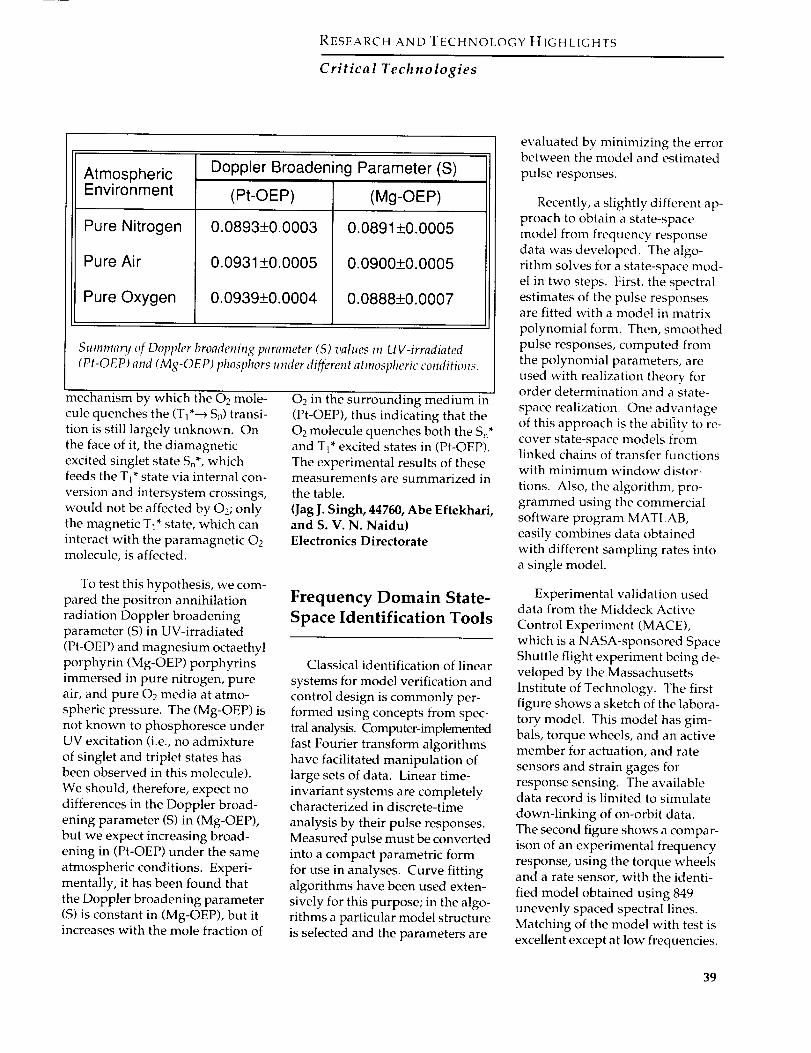
RESEARCH AND TECHNOLOGY HIGHLIGHTS
Critical Technologies
AtmosphericEnvironment
Pure Nitrogen
Pure Air
Pure Oxygen
Doppler Broadening Parameter (S)
(Pt-OEP)
0.0893±0.0003
0.0931±0.0005
0.0939±0.0004
(Mg-OEP)
0.0891±0.0005
0.0900±0.0005
0.0888±0.0007
Summary of Doppler broadening parameter (S) values in UV-irradiated
(Pt-OEP) and (Mg-OEP) phosphors under different atmospheric conditions.
mechanism by which the 02 mole-
cule quenches the (TI*---_ So) transi-
tion is still largely unknown. On
the face of it, the diamagnetic
excited singlet state Sn*, whichfeeds the TI* state via internal con-
version and intersystem crossings,
would not be affected by 02; onlythe magnetic T1* state, which can
interact with the paramagnetic 02molecule, is affected.
To test this hypothesis, we com-pared the positron annihilation
radiation Doppler broadening
parameter (S) in UV-irradiated
(Pt-OEP) and magnesium octaethyl
porphyrin (Mg-OEP) porphyrins
immersed in pure nitrogen, pureair, and pure 02 media at atmo-
spheric pressure. The (Mg-OEP) is
not known to phosphoresce underUV excitation (i.e., no admixture
of singlet and triplet states hasbeen observed in this molecule).
We should, therefore, expect no
differences in the Doppler broad-
ening parameter (S) in (Mg-OEP),
but we expect increasing broad-ening in (Pt-OEP) under the same
atmospheric conditions. Experi-mentally, it has been found that
the Doppler broadening parameter
(S) is constant in (Mg-OEP), but itincreases with the mole fraction of
02 in the surrounding medium in
(Pt-OEP), thus indicating that the0 2 molecule quenches both the Sn*and T1* excited states in (Pt-OEP).
The experimental results of thesemeasurements are summarized inthe table.
(Jag J. Singh, 44760, Abe Eftekhari,and S. V. N. Naidu)Electronics Directorate
Frequency Domain State-
Space Identification Tools
Classical identification of linear
systems for model verification and
control design is commonly per-
formed using concepts from spec-
tral analysis. Computer-implemented
fast Fourier transform algorithmshave facilitated manipulation of
large sets of data. Linear time-
invariant systems are completelycharacterized in discrete-time
analysis by their pulse responses.
Measured pulse must be converted
into a compact parametric form
for use in analyses. Curve fittingalgorithms have been used exten-
sively for this purpose; in the algo-rithms a particular model structure
is selected and the parameters are
evaluated by minimizing the errorbetween the model and estimated
pulse responses.
Recently, a slightly different ap-proach to obtain a state-space
model from frequency response
data was developed. The algo-
rithm solves for a state-space mod-
el in two steps. First, the spectral
estimates of the pulse responsesare fitted with a model ill matrix
polynomial form. Then, smoothed
pulse responses, computed from
the polynomial parameters, are
used with realization theory fororder determination and a state-
space realization. One advantage
of this approach is the ability to re-cover state-space models fromlinked chains of transfer functionswith minimum window distor-
tions. Also, the algorithm, pro-
grammed using the commercialsoftware program MATLAB,
easily combines data obtained
with different sampling rates into
a single model.
Experimental validation useddata from the Middeck Active
Control Experiment (MACE),
which is a NASA-sponsored Space
Shuttle flight experiment being de-
veloped by the Massachusetts
Institute of Technology. The firstfigure shows a sketch of the labora-
tory model. This model has gim-
bals, torque wheels, and an activemember for actuation, and rate
sensors and strain gages for
response sensing. The availabledata record is limited to simulate
down-linking of on-orbit data.
The second figure shows a compar-
ison of an experimental frequency
response, using the torque wheelsand a rate sensor, with the identi-
fied model obtained using 849unevenly spaced spectral lines.
Matching of the model with test is
excellent except at low frequencies.
39

SUSPENSION
CABLES
TORQUE
WHEELS
x
z RATE SENSORS
Middeck Active Control Experiment (MACE) laboratory model.
10
Sensor
(Mag) O. 1
0.01
0.001
--TEST
Comparison of identified MACE model with test.
The low-frequency matching can
be improved by performing sepa-rate tests that target the low fre-
quency, patch the frequency
response function, and compute aunified model using this new
approach.(Lucas G. Horta, 44352, and
Jer-Nan Juang)Structures Directorate
Trajectory OptimizationBased on Differential
Inclusion
Methods for trajectory optimiza-tion can be divided into two differ-
ent categories, namely direct and
indirect approaches. Indirect
approaches are based on the
Pontryagin Minimum Principle.
Their merits lie in high precision
and the ability to identify subtle
details of the trajectory. Majordrawbacks are the involvement of
artificial costates and the necessity
to guess the optimal switching
structure a priori. Direct approach-
es rely on a discretization of theinfinite-dimensional optimal
control problem into a finite-
dimensional nonlinear program-
ming problem. In practice, these
approaches are very popularbecause of their usually robust
convergence, even from bad initial
guesses, and of the low level of ex-
pertise required by the use. A ma-
jor stumbling block in the turnkeyapplication of these approaches to
general optimal control problems
encountered in aerospace engi-
neering is the convergence difficul-
ty sometimes encountered forsingular optimal control problems.
The achievement of the presentwork is to introduce a new discret-
ization technique for optimal con-
trol problems. By employing a de-
scription of the dynamical systemin terms of its attainable sets in
favor of using differential equa-
tions, the controls are completely
eliminated from the system model.Besides reducing the dimensionali-
ty of the discretized problem com-
pared with state-of-the-art colloca-
tion methods, this approach alsoalleviates the search for initial
guesses from where standard
gradient search methods are able
to converge. The new discretizationshows robust convergence
behavior, even for singular optimal
control problems.
The figure gives a schematic
representation of the differential
inclusion concept. The equations
of motion of the dynamical systemare not enforced directly. Instead,
for every i greater than 1, the states
4O

RESEARCHANDTECHNOLOGYHIGHLIGHTS
Critical Technologies
S t_ept
at any node number i + 1 are pre-scribed to lie within the set of
states that are attainable from the
states at node i.
(Daniel D. Moerder, 46495)
Flight Systems Directorate)
Advanced Information
Processing System
The Advanced Information Pro-
cessing System (AIPS) is the result
of a 10-year effort led by NASA
with significant funding from the
U. S. Army, the U. S. Air Force,
and the Strategic Defense Office.
The purpose of this effort was todevelop digital systems that can
support high-performance andcritical real-time control tasks.
The AIPS development was per-
formed by Charles Stark Draper
Laboratory under contract toNASA. The AIPS is not a single
system. It is a group of buildingblocks and models from which a
wide variety of systems can be
designed to match applicationsthat range from small undersea
systems to the largest heavy space
launch systems.
The AIPS building blocks are a
set of fault-tolerant processors that
can provide reliable computing
power at distributed sites, with
each site computer tailored to the
performance and reliability
requirements of that site. The sites
can be connected through differenttypes of networks, such as mesh,
ring, and bus. Once a network is
selected to provide, for example,the lowest cost alternative, theselected network can then be
tailored to provide the requiredperformance and reliability. An
important feature of the AIPS is
that the fault-handling mechanisms
consume relatively little of the sys-
tem throughput, and they are
largely transparent to the user.
Another important feature of theAIPS is that models are available
that allow the designer to accurate-ly assess the characteristics of a
proposed AIPS configuration for a
given requirement. The AIPS has
been used by the U. S. Navy in itsUnmanned Undersea Vehicle, and
it has been selected for the ship
control system on the Sea Wolfsubmarine.
(Felix L. Pitts, 46186)
Flight Systems Directorate
Nondescent Techniquefor Constrained
Minimization
Practical systems are defined by
systems of constraints. Techniques
for optimizing these systems must,
to be reasonably effective, be capa-ble of accounting for these con-
straints in the optimization pro-
cess. Another feature of practical
FTPP L[ I/O NETWORKS
I I I _ _ "----_ I 1
FEATURES: APPROPRIATE FUNCTION RELIABILITY
LOW FAULT TOLERANCE OVERHEAD
GROWTH CAPABILITY
Ada OPERATING SYSTEM
REDUNDANCY TRANSPARENT TO USER
AIPS example configuration.
41

2o- Frequencies from 100 Runs
15-
10-
S-
o
10 .2
Enhanced Approach Gives lOOx Improvement
Enhanced
J
10"
itlI I 11111 I I I I I I111 1
10 ° 10'
Optimality Error
Enhanced algorithm performance from nondescent technique for constrainedminimization.
systems is complexity. Very often,this results in the system's perfor-
mance response to parameter
selection being characterized bynumerous local minima. Unfor-
unately, optimization procedures
capable of rigorously treating con-straints are typically based on local
expansion theory, and they can get
"caught" at local minima. These
local minima, in turn, might yieldsignificantly worse performance
than the global optimum or other
better local minima. Optimization
algorithms based on local expan-sions are referred to as "descent al-
gorithms" because they operate bycalculating a sequence of searchvalues, each of which returns
increasingly good performance.
Nondescent algorithms are an
alternate approach to optimizingfunctions. These methods are not
typically vulnerable to local mini-
ma, but they have not been capable
of treating constraints, except
through rather poor approximatemeans (such as penalty functions).
The achievement of thL, work
was to reformulate a generic differ-
entiable constrained optimization
problem as an unconstrained prob-
lem, so that it could be solved byrobust nondescent methods. Thesolution of the unconstrained
problem solved by such methods
satisfies the necessary con _itions
for optimality in the originalconstrained problem.
The figure shows the enhance-
ment in algorithm performance
from the use of this approach by
displaying the distribution of opti-
mality error (e.g., nonzero norm ofthe Kuhn-Tucker conditions) for
the new approach and a s andardpenalty-based approach. ,\ genetic
algorithm was employed as a non-
descent optimization engine in ob-
taining energy-optimal control set-
tings for an aerospace plaJle model
at a particular operating system.
Trim, vertical acceleration, and dy-
namic pressure constrainl s werepresent. One hundred Monte Car-
lo experiments were conducted
using the new approach. Resultsfrom these experiments were com-
pared with a like number of runs
for a number of penalty-basedschemes, and then the best were
chosen for comparison.(Daniel D. Moerder, 46495)
Flight Systems Directorate)
Automatic AdaptiveFinite-Element Mesh
Refinement
The creation of adequate finite-
element models for complex struc-
tural configurations is a time-
consuming aspect of designtrade-off studies and design
optimization. To reduce engineer-
ing time expended in model
development, automatic adaptivefinite-element mesh capabilities
have been developed. This capa-
bility continuously refines the
mesh to improve accuracy where
it is required.
Although considerable researchon automatic adaptive mesh
refinement techniques for in-planetwo-dimensional and three-
dimensional structural applications
has been carried out, comparative-
ly less research has been done forbuilt-up shell structures, such asthose found in aircraft, rockets,and automobile bodies. Automatic
adaptive meshing involves whento remesh, where to remesh, and
how to remesh. Error measures
have been developed to indicate
when solutions need improved ac-
curacy and hence a finer mesh.
Refinement indicators point to
those regions that need finer mesh.
Rule-based algorithms determinehow the mesh is to be redivided.
User-controlled options, with the
42

RESEARCH AND TECHNOLOGY HIGHLIGHTS
Critical Technologies
Automatic adaptive mesh superposition demonstrated on stiffened
compression panel.
engineer in the loop, can be uti-
lized for semiautomatic adaptivity.
The figure illustrates an auto-
matic adaptive refinement using a
superposition technique for re-
meshing an aluminum panel with
discontinuous blade stiffeners.
Such stiffener terminations are
often required in practice, but their
presence generates stress concen-trations that can lead to failures.
Because adaptive meshing tech-
niques may lead to distorted finite-
element meshes that introduce un-
desirable modeling error, a mesh
superposition method has been
developed and demonstrated.
This method introduces little or no
element distortion, provided the
initial mesh is regular in shape. As
depicted in the figure, refinement
is done by superimposing a second
(and subsequent) regular mesh
over the first. (Here the total re-
sponse is the sum of the responses
of the superimposed meshes.)
Refinement indicators identify the
regions at the stiffener terminations
as requiring fine-mesh super-
position. Using this technique, the
superposition-based meshes
remain regular in shape.
(Jerrold M. Housner, 42907)
Structures Directorate
BVI Noise Prediction
From Computed Rotor
Aerodynamics
Blade-vortex interaction (BVI)
noise is a highly impulsive helicop-
ter noise source that occurs when
rotor blades strike, or pass very
close to, tip vortices previously
shed into the rotor's wake. This
noise occurs most often when the
rotor is in descent.
A numerical prediction proce-
dure, linking three independent
prediction codes, was developed
to predict the aerodynamics and
acoustics of three-dimensional
rotor BVI. The first code in the
series is the Comprehensive
Analytical Model of Rotorcraft
Aerodynamics and Dynamics
(CAMRAD/JA) code, which pre-
dicts the rotor performance,
dynamics, and tip vortex wake tra-
jectories and strengths. These pre-
dictions are utilized by the second
code, the Full Potential Rotor code
(FPRBVI), to predict the unsteady
blade surface pressures. The
FPRBVI code is an improved
version of the NASA Ames Full
Potential Rotor code (FPR). This
improved version was developed
by McDonnell Douglas Helicopter
Company under a NASA Langley
Model Rotor
o
Forward
Flight
2O
10Soun_
Pressure,Pascals 0
-10
M_p_red Noise
.5 1.0
Time/Rotor Revo_Lraon
2O
10
0
-10
Predicted Noise
.5 1.0
Time/Rotor Revolu'oon
Comparison of measured and predicted noise for descent rotor condition.
43

UARS global probe of Earth's upper atmosphere. L-91-07474
contract to include the entire tip
vortex wake for a specified numberof rotor revolutions. Previously,
the code required the user to make
a judgment on which vortex ele-ments to include or exclude. This
improvement has eliminated thisdecision, and it allows for all the
wake to be included. The predicted
unsteady blade surface pressuresfrom the FPRBVI code are then
input to the noise code, WOPWOP,
to predict the noise.
The figure shows a comparisonof acoustic predictions with themeasured data for a 65-knot
forward-speed case at an observerdownstream and below the rotor
disk. The measured acoustic data
are from a model rotor test per-
formed in 1989 by Sikorsky Air-craft, the United TechnologiesResearch Center (UTRC), the
NASA Langley and Ames Research
Centers, and the U. S. Army Aero-
flightdynamics Directorate(AFDD) in the German Dutch
Wind Tunnel (DNW). The com-
parison is considered quite good
in both amplitude and overall
signal shape. The additional hi_h-
frequency "noise" in the predictedsignal is partly caused by the
numerics and interpolation algo-
rithms used in the computations.
This prediction procedure,
which uses publicly available
codes, is compatible with theROTONET system and will be
available for industry or univers tyuse.
(C. L. Burley, 43659)Structures Directorate
Upper Atmosphere
Research Satellite (UARS)
Disturbance Experiment
In space science platforms in
which pointing of instruments is
required, jitter can result fromflexible appendages (such as solar
arrays and booms) being excited
by one or more disturbance
sources. The Upper AtmosphereResearch Satellite (UARS) has five
gimballed instruments and a gim-balled solar array that contribute
to the spacecraft overall dynamics.
The accuracy of methods used to
predict UARS jitter during designand of other candidate methods is
not well established. The UARS
Disturbance Experiment was con-ducted to obtain data for evalu-
ating methods and accuracy of
ground analyses.
44

RESEARCHANDTECHNOLOGYHIGttLIGHTS
Critical Technologies
The on-orbit experiment was
conducted to ascertain the pointing
jitter contribution of each individu-
al gimballed instrument. The con-
trolled disturbance experiment onUARS was conducted during a
spacecraft yaw attitude adjustment
period when most instrument
teams do not take atmospheric sci-
ence data. To successfully isolatethe effects of different disturbances,
the normal continuous scanning
operations of two instrumentswere altered. The Microwave
Limb Sounder (MLS) Team at the
Jet Propulsion Laboratory sentcommands to their instrument,
thus regulating the scan profiles of
its 1.6-m antenna and switchingmirror. The commands consisted
of on/off sequences for its gimbal-led antenna and switching mirror.
The High Resolution Doppler
Images (HRDI) Team at the
University of Michigan also altered
their normal sequence of opera-
tions scheduled for the yaw adjust-ment period. The HRDI Team
interrupted its calibration at the
beginning of the experiment and
began its normal scanningsequence such that it served as asecond isolated disturbance
source. The scan schedules of the
MLS and HRDI instruments were
interwoven with other routine dis-
turbance sources, thus making it
possible to have each instrument'sdisturbance both isolated and in
combination with other
disturbances.
The disturbance sequences
were successfully executed on-
board the UARS spacecraft. The
experiment provided 13 isolated
disturbance events, 24 multipledisturbance events, 3 sunrise solar
array thermal snaps, 2 sunset solar
array thermal snaps, and 33 min
with all major disturbances
removed. Every gimballed instru-ment onboard the satellite was
moved both individually and with
other instruments during the
experiment. One of the first obser-vations was an unexpected distur-
bance from the solar array drivemechanism, which causes nearcontinuous excitation of a 0.23- to
0.26-Hz solar array elastic mode.Because of that, additional data
were obtained in a later experiment
for the "no disturbance" case taken
when the solar array motor was
off. The spacecraft developer is in
the process of including the solar
array drive as a disturbance sourcein the model.
(Stanley E. Woodard, 44346, andWilliam L. Grantham)
Structures Directorate
EOS-AM spacecraft.
_ . _ ]
! Disturbance IModule )
_-,._ LinearClosed-loopI Simulation
i Jitter -I AnalysisL
It.Directives Ii
f[ -
I EOS Dynamicst ModuleI (Sparse Formulation)t
1
1
EOS simulation flow diagram.
( Attitude LControl
L Module
Documentation
45

Flexible Spacecraft Jitter
Simulation and AnalysisTools
An efficient simulation and
analysis software system has beendeveloped for jitter simulation on
flexible spacecraft, and it has been
applied to the preliminary design
of the EOS-AM spacecraft, shown
in the first figure. Simulation ofthe spacecraft's open-loop/closed-
loop response to both transient
and steady-state disturbances can
be performed in numerous ways.For this study, an efficient method
is required because more than 500
flexible-body modes of vibrationswere to be included in the closed-
loop simulation. In addition, use
of the MATLAB program wasdesired for ease of documentation
and transfer of the results to
Goddard Space Flight Center andMartin Marietta. An efficient
MATLAB-based code was
developed to meet these goals.
The second figure shows an EOS
simulation flow diagram for code(referred to as EOSSIM).
A sparse matrix formulationhas been used to assemble the
dynamic equations in first-orderform. It is assumed that the atti-
rude control system is implementedin a discrete form. Hence, the con-
trol torque computations are effec-
tively treated as external forces onthe right-hand side of the structur-
al dynamics equations. This leads
to a very sparse (tri-diagonal)
structure for the plant equations.
For the spacecraft dynamicsmodel, it is only necessary to store
and operate on N 2 x 2 blocks,
where N is the number of rigid
and flexible body modes includedin the simulation. Once the time
histories for the responses of inter-
est have been computed, jitter
analysis is performed. It would be
prohibitively expensive to com-
pute jitter using repeated "max"
and "min" analyses withinMATLAB because the number of
time steps within the time historyis usually of the order 105 . Hence,an efficient code has been deve-
loped to compute jitter for multipletime windows. The code is written
in FORTRAN, and it is linked toMATLAB with "mex" files.
(W. Keith Belvin, 44319)Structures Directorate
46

RESEARCH AND TECHNOLOGY HIGHLIGHTS
Critical Technologies
47

RESEARCH AND
TECHNOLOGY
Subsonic Aircraft
Develop technologies t{, ensure
the cornpetitiveness of U.S.
subsonic aircraft and tv enhance
the safety and capacity of our
national airspace syste n
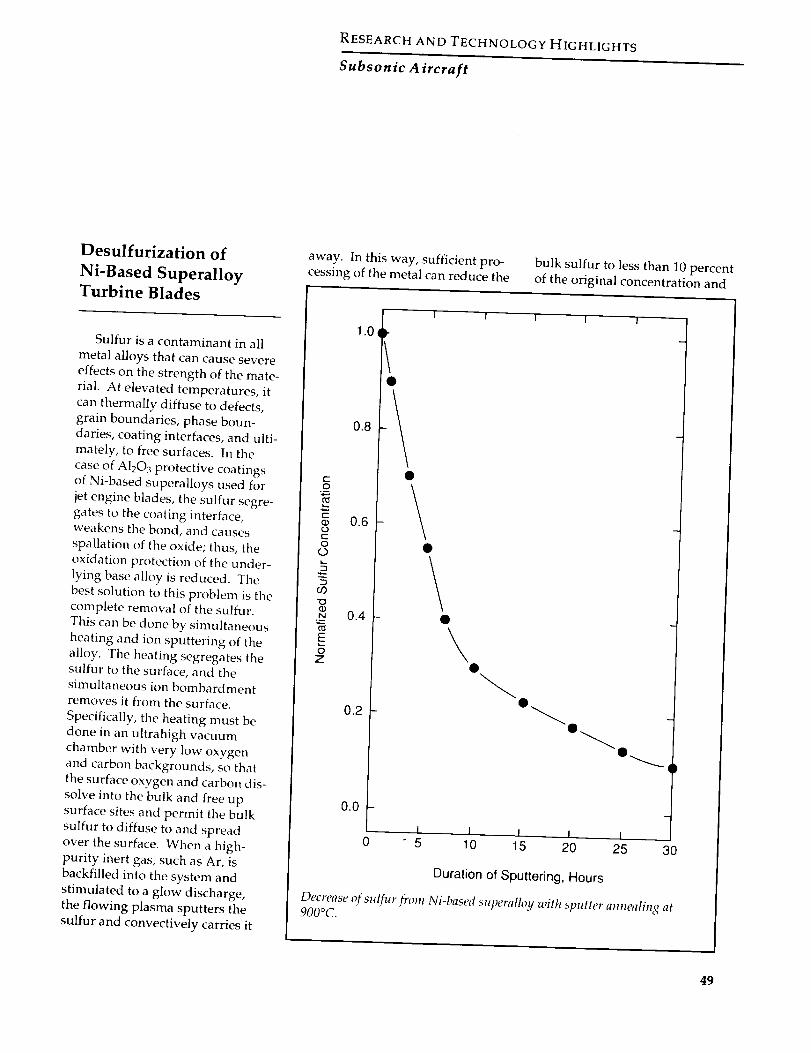
RESEARCH AND TECHNOLOGY HIGHLIGHTS
Subsonic A ircraft
Desulfurization of
Ni-Based SuperalloyTurbine Blades
Sulfur is a contaminant in all
metal alloys that can cause severe
effects on the strength of the mate-
rial. At elevated temperatures, it
can thermally diffuse to defects,
grain boundaries, phase boun-
daries, coating interfaces, and ulti-mately, to free surfaces. In the
case of A1203 protective coatings
of Ni-based superalloys used for
jet engine blades, the sulfur segre-
gates to the coating interface,weakens the bond, and causes
spallation of the oxide; thus, the
oxidation protection of the under-
lying base alloy is reduced. The
best solution to this problem is thecomplete removal of the sulfur.
This can be done by simultaneous
heating and ion sputtering of the
alloy. The heating segregates thesulfur to the surface, and the
simultaneous ion bombardmentremoves it from the surface.
Specifically, the heating must be
done in an ultrahigh vacuumchamber with very low oxygen
and carbon backgrounds, so that
the surface oxygen and carbon dis-
solve into the bulk and free up
surface sites and permit the bulk
sulfur to diffuse to and spread
over the surface. When a high-
purity inert gas, such as Ar, isbackfilled into the system and
stimulated to a glow discharge,
the flowing plasma sputters the
sulfur and convectively carries it
away. In this way, sufficient pro-
cessing of the metal can reduce the
bulk sulfur to less than 10 percent
of the original concentration and
c-O
Oc-Oo
0
z
1.0q
0.8
0.6
0.4
0.2
0.0
D-
-/I ! I i I
@
\
e_
I I i I I0 5 10 15 20 25 30
Duration of Sputtering, Hours
Decrease of sulfur from Ni-based superalloy with sputter annealing at900°C.
49

%
-1!
-5
-3
0 J 1.0
x/c a x/c,, X/Cn'
Typical pressure distribution results. "+" inside symbols indicates Ioz_,er surface pressures.
thus substantially minimize the
undesired spalling of the oxide
coating. A proof-of-concept exper-
iment for this process is shown inthe figure.(R. A. Outlaw, 41433)
Space Directorate
Boeing 737
Pressure-Instrumented
Wing
A wind-tunnel investigation
was performed in the Langley14- by 22-Foot Subsonic Tunnel on
a 1/8-scale Boeing 737-100 model
instrumented with over 700 wing
pressure orifices. The orifices were
placed in chordwise rows at seven
spanwise locations on the right-hand wing. An extensive pressure
database was obtained for compar-
ison with flight measurements and
for verification of several computa-
tional fluid dynamic codes. Thefigure presents a typical pressure
profile of the high-lift multielement
wing. The contribution to the
understanding of flow physics on
a multielement wing could helpindustry manufacturers in their ef-
forts to simplify flap system'._ with-
out a decrease in performance.
Additional objectives of lhisinvestigation were to find rite
effect of a Gurney flap on tte air-
craft lift and drag and to oblain the
effect of wing and tail leadiNg-edge
icing on the aerodynamic perform-ance. Data for four various shapes
of Gurney flaps were obtained andwill be used to determine the cost
effectiveness of employing a
Gurney flap on a full-scale aircraft.
Through coordination _ithNASA Lewis Research Cer ter,
simulated ice was placed on theleading edges of the wing and tailto determine the effect on aero-
dynamic performance. Th _se data
will allow three-dimensior_al icing
effects to be added to the existing
Lewis two-dimensional B737 icingdatabase.
(Brenda E. Gile, 45002)Aeronautics Directorate
Computational
Aerodynamics Applied
to Transport High-Lift
Flight Research
Computational aerodynamic
codes are being used in support ofNASA's Subsonic Transport High-
Lift Flight Research Program. The
current generation of multielement,
high-lift codes offers capabilities
not previously available to high-lift-system designers and research-
ers. These codes are relatively
simple and fast, and are practical
for engineering use. Flight data
are being used to assess where
these codes are applicable using
"real-world" operating conditions.
A computational investigation
of the NASA Transport SystemsResearch Vehicle (TSRV) B737-100
aircraft was conducted using pro-duction, two-dimensional, multi-
element computational methods.
MCARF (Multi-Component Air-
foil) uses a classical panel method
along with an integral, confluent
boundaryqayer model to obtain a
5O

RESEARCH AND TECHNOLOGY HIGHLIGHTS
Subsonic Aircraft
-8
-7
-6
-5
.2
.1
Z/Co--.1
-.20 .1 .2
×/c
Experimentalo Upper Surface[] Lower Surface
MSES........ MCARF
)
/
I 1 I I I I I 1
0 .1 .2 .3 .4 .5 .6 .7 .8
x/c
J I I
.9 0 .1 .2
x/c
I I 1 1 I
0 .1 .2 .3 0 .1 .2
x/c x/c
Compariso, between flight data and computed pressure distributions for the takeoff configuration. 58 percentsemispan station; o_= 9.4°; Rc = 11.85 x 10°; M = 0.17.
viscous solution over multielement
high-lift systems, but does not pre-
dict the effects of flow separation.MSES (Multi-Surface Euler)
couples an advanced Euler codewith an integral, confluent
boundary-layer model, allowing
for the analysis of flows containingregions of locally supersonic flow
as well as regions of limited flow
separation. Both codes were mod-
ified using simple-sweep theory toaccount for three-dimensional
inviscid flow effects on the TSRV
high-lift system.
Comparisons between MCARF,MSES, and the three-dimensional
flight-test results obtained fromthe TSRV five-element high-lift
system were made for two high-lift
configuration,,_--one represents a
takeoff configuration and one
represents an approach configura-
tion. Reasonable agreement withflight data was obtained with bothcodes under attached-flow condi-
tions. Sensitivity studies perform-
ed using the MSES code showed a
strong influence of the flap gaps
and deflection angles on the aero-
dynamic loads. The sensitivity of
the loads to relatively small chang-
es in the flap system geometryindicated the importance of deter-
mining the in-flight structural
deformation under high-liftconditions.
(Long P. Yip, 43866, Jay D. Hardin,
and Julia H. Whitehead)Aeronautics Directorate
Subsonic Flow Transition
Detection Using an
Infrared Imaging System
Infrared imaging is a nonintru-
sive, diagnostic technique that is
capable of making quantitative,
global temperature measurements.
51

£
x
4O
60
8O
100
120
140
160
180
40
R c =5x10⁶ 5=8 ° At=80 sec
AT' F
I 3
-3 5
-4
-4 5
-5
60 80 100 120 140 160 180 200 220 240 260 280 300 320 340
pixel column
Boundary-layer transition on flap q( 3-eh'ment airfoil by infrared
thermography.
surface emissivity of tile modelto about 0.9.
As a result, the location of the
transition region on this airfoilwas successfully detected at anglesof attack of 0 °, 4 °, 8 °, 12 °, and 16 °.These results indicate that infrared
thermography is an acceptable
global-temperature measurementtechnique that can detect the
region of flow transition in low-
speed, subsonic test conditions.
(Stephen E. Borg, 44747, andRalph D. Watson)Electronics Directorate
For this experiment, a commercial-ly available infrared thermography
system was used in a comparative
study of techniques capable of
detecting low-speed flow transi-tion. This study was conducted in
Langley's Low-Turbulence Pres-
sure Tunnel on a multiple-element,
stainless-steel, McDonnell Douglas
airfoil in a Mach 0.2 flow with Rey-nolds numbers of 5 x 10" and9 x 10h.
The imaging system used in
this experiment detected infrared
radiation in the 8- to 12-.um region
of the spectrum and generatedreal-time video data at 30 frames
per second. The scanner was
motmted in a pressurized canister
and had optical access into the test
section through a pair of antireflec-tion coated zinc-sulfide windows.
During testing, the imaging system
provided a video signal of the
small temperature gradient presenton the surface of the airfoil as seen
in the figure. This temperature
gradient resulted from the changein heat-transfer coefficient caused
by the transition from laminar toturbulent flow.
Temperature gradients as small
as 0.2°C were detected by thesystem in this configuration, l o
preserve the small temperature
gradients expected at these low
Mach numbers and to improve the
radiometric properties of thestainless-steel airfoil, the model
was coated with a thin layer of
black Kapton film. This insulming
layer of film prevented the stail-
less steel from conducting awa esmall surface-temperature gra-dients and increased the
Advanced Rotor-Blade
Technology Evaluated
in TDT
In the fall of 1986, a Westland
Helicopters, Ltd. Lynx, equipped
with main rotor blades developed
under the British ExperimentalRotor Program (BERP), claimed
the Class E-1 (helicopters without
payload) speed record. Westland
Rotortorque
coefficient
.0008
.0006
.0004
.0002.004
Growth Blackhawk --_
J I i I i I i I.006 .008 .010 .012
Rotor lift coefficient
Comparison of rotor-blade perfo_ mance.
52

RESEARCH AND TECHNOLOGY HIGHLIGHTS
Subson ic A ircraft
has claimed that the BERP rotor
blades can provide either an in-
crease in aircraft speed for a con-stant thrust or an increase in load
factor for a constant aircraft speed.For the next generation of U.S.
Army helicopters, it is imperative
that all rotor-blade design technol-
ogy be evaluated as possibleenhancements to current U.S.
industry rotor design methods.Therefore, a test was conducted in
the Langley Transonic Dynamics
Tunnel (TDT) to acquire data to
evaluate the BERP planform.
The test was conducted usingbaseline BERP-type model rotorblades mounted on a four-bladed
articulated hub. The term "BERP-
type" is used because of the differ-ence in airfoil sections between the
full-scale BERP blades and the
model BERP-type blades. The per-
formance improvements claimed
for the BERP planform were evalu-
ated by cross-plotting data to anominal design condition of 4000ft altitude and 95°F ambient tem-
perature for a rotor task representa-
tive of the Army UG-60 Blackhawk
helicopter at a gross weight of18 500 lb. The data indicate that
the BERP-type planform, compared
with a baseline rectangular plan-
form, provides increases in speedfor a fixed rotor thrust (not shown).
The figure is a plot of rotor torquecoefficient, a measure of rotor
power required, versus rotor liftcoefficient, and it shows that the
BERP-type blade also provides an
increased load factor capability ata constant advance ratio of 0.30. In
addition, data obtained from a
previous TDT test are plotted for
comparison purposes. These data
indicate that a Langley-designed
Growth Blackhawk tapered-blade
planform provides performanceimprovements over the BERP
planform in terms of power
requirements and lifting capability.
(William T. Yeager, Jr., 41271,Kevin W. Noonan, Matthew L.
Wilbur, Paul H. Mirick, and
Jeffrey D. Singleton)Structures Directorate
Combined Tension and
Bending Testing of
Tapered Laminates
Composite flexbeams in bear-
ingless and hingeless rotor hubsare subjected to a combination of
axial tension and bending loads.
In order to study the durability of
these flexbeam structures, taperedlaminate coupons were designedand tested. A nonlinear beam
element used at Bell Helicopter to
evaluate composite flexbeam
designs was incorporated in thecomputational mechanics testbed(COMET) code. This beam ele-ment includes additional terms in
the element stiffness matrix to
incorporate the nonlinear effectsof a constant internal force on the
flexural stiffness. Various tapered
laminate configurations were
modeled using the boundary con-
ditions in an axial tension bending
(ATB) testing machine that was
designed and built at LangleyResearch Center.
The nonlinear-beam finite-
element analysis yields the
moment distribution in a tapered-
beam configuration that is subject-ed to a combined axial load and
bending load. Laminated platetheory was used to calculate the
stresses and corresponding surfacestrains on the tapered laminate.
The figure compares measuredand predicted surface strains for
an $2/E773 Glass/epoxy laminatewith a nonlinear taper. Tapered
laminate coupon tests will be con-ducted in the ATB test machine at
Langley to evaluate composite
rotor-hub flexbeam designs. This
unique combination of testing andanalysis will allow assessment offlexbeam failure modes, identifica-
tion of optimum taper designs,
and development of realistic
accept/reject criteria for flexbeams
with manufacturing flaws. Fur-thermore, because tile tapered
laminates tested are small coupons,
0.015
0.01
£x 0.005
_Analysis _
0 1 2 3 4 5
V = 1072 lb.i
Tension side
Compression side
_, , I, ,,,I .... I
6 7 8
Surface strain distribution in $2/E773 nonlinear tapered laminate.
53
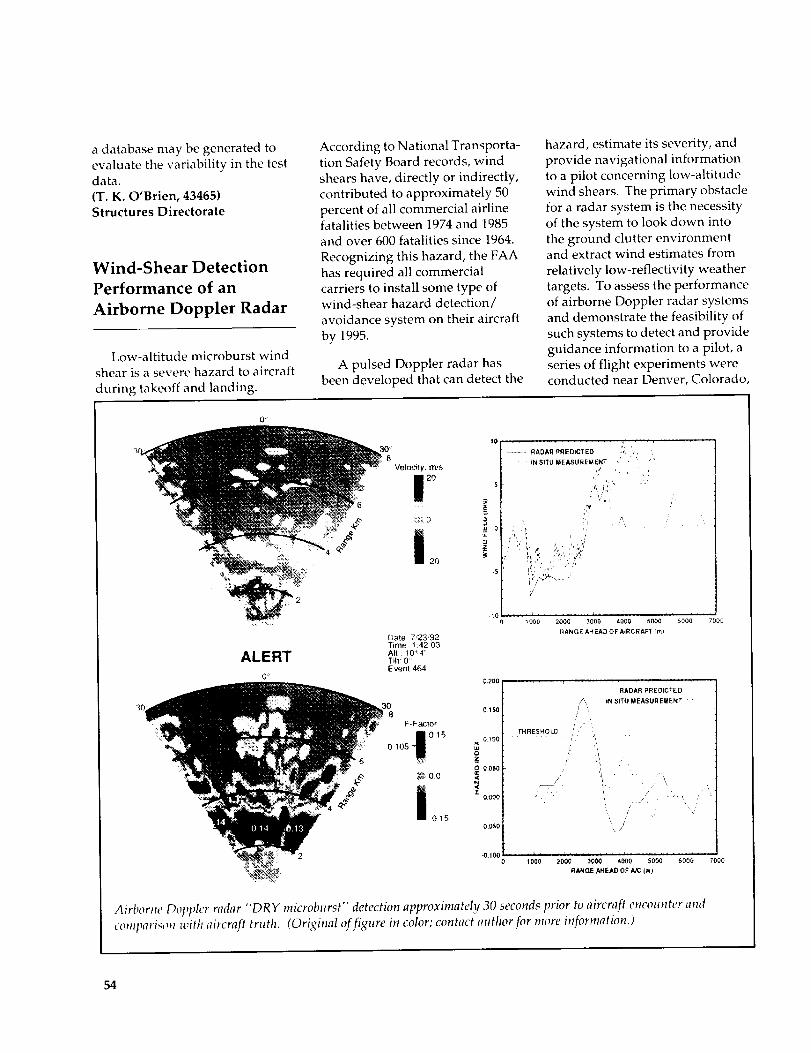
a database may be generated to
evaluate the variability in the testdata.
(T. K. O'Brien, 43465)Structures Directorate
Wind-Shear Detection
Performance of an
Airborne Doppler Radar
Low-altitude microburst wind
shear is a severe hazard to aircraft
during takeoff and landing.
According to National Transporta-
tion Safety Board records, windshears have, directly or indirectly,
contributed to approximately 50
percent of all commercial airlinefatalities between 1974 and 1985
and over 600 fatalities since 1964.
Recognizing this hazard, the FAA
has required all commercialcarriers to install some type ofwind-shear hazard detection/
avoidance system on their aircraft
by 1995.
A pulsed Doppler radar hasbeen developed that can detect the
hazard, estimate its severity, andprovide navigational information
to a pilot concerning low-altitude
wind shears. The primary obstacle
for a radar system is the necessity
of the system to look down into
the ground clutter environmentand extract wind estimates from
relatively low-reflectivity weather
targets. To assess the performance
of airborne Doppler radar systems
and demonstrate the feasibility ofsuch systems to detect and provide
guidance information to a pilot, a
series of flight experiments wereconducted near Denver, Colorado,
0 ,¸
ALERT
09
/
Date 7/23/92
Time 1:4203
AIt: 1014'Tilt: 0
E vent 4£>4
30 _
8
F-Factor
_20(
....... RADAR PREDICTED ,,, ,,,
tN StTU MEASUREMENT ,,! ' "' ....,
!, . : r/'
i/
......... , . , ,, , , , , , , , ,1000 2000 3000 4000 5D0_ 6000
RANGE AH EAD OF A_RCRAFT rn
7000
015[
0t5 o_oo0105
o.o$0
-015
-0,050
RADAR PREDICTED
/" IN SITU MEASUREMENTi'\,
THRESHOLD ,,: / i',,
/ 'L
\,
-0,10o - • , _ ........ , , , , h , , , _:0 1000 21000 3000 4000 5000
RANGE AHEAD OF A/C ira)
6000 7000
Airborne Dopph, r radar "DRY microburst" detection approximately 30 seconds prior to aircraft encounter and
comparison with aircraft truth. (Original of figure in color; contact author for more information.)
54

RESEARCH AND TECHNOLOGY HIGHLIGHTS
Subsonic Aircraft
and Orlando, Florida, during the
summers of 1991 and 1992.
Over 100 microburst events
were observed by the airborne
radar, from which approximately
75, of varying degrees of severity,
were penetrated by NASA's
Boeing 737-100 research aircraft.
The airborne radar predicted these
encounters 15 to 90 seconds prior
to the aircraft's penetration and
showed excellent agreement with
the onboard reactive system's
measurements. The figure shows
airborne radar PPI (planned posi-
tion indicator) displays (and line
plots that compare radar-predicted
and aircraft in situ measurements)
of the wind field and the associated
wind-shear hazard index (F-factor)
for a dry microburst encounter
(the most stressing for the radar).
Accurate and timely alerts were
given when the hazardous thre-
shold was exceeded. The ground
clutter suppression techniques
employed in the NASA-designed
system eliminated the potential
false/nuisance alerts produced by
interfering ground clutter. The
airborne radar's predictive capabil-
ity was assessed by correlating the
radar's predicted hazard index
with that experienced by the
aircraft. This analysis produced a
92-percent correlation coefficient.
The excellent agreement and
near-perfect correlation of the
airborne radar with the wind fields
experienced by the aircraft demon-
strate capability of the airborne
Doppler radar to reliably detect
and provide advance warning of
hazardous wind shear, in the pres-
ence of severe ground clutter, even
for low-reflectivity weather targets.
The NASA wind-shear radar has
been proven to be the primary
instrument for providing detection,
threat estimation, and navigation
information associated with wind-
shear microburst avoidance.
Throughout this research program,
NASA has transferred this tech-
nology directly to the aerospace
industry, and specifically to avion-ics manufacturers interested in de-
veloping a next-generation air-
borne Doppler radar commercial
product. NASA continues to pro-
vide technical guidance to the FAA
on certification of airborne predic-
tive wind-shear systems. A direct
measure of this program's success
and its ability to transfer this tech-
nology is the rapid development
of the commercial product. Only
2 years after the first flight tests,
three radar manufacturers are
seeking certification and expect
their product to be or_ commercial
airlines by 1995.
(Steven Harrah, 418 _5)
Flight Systems Directorate
Vertical-Wind Estimation
Technique EvaluatedFrom Radar Simulation
and Flight-Test Data
Doppler radar and lidar were
two of the forward-looking sensor
technologies for detecting hazar-
dous wind shear that were flight-
tested in the NASA Wind-Shear
Program. An inherent limitation
of these technologies is their
inability to measure velocities per-
pendicular to the line of sight.
Although these systems can detect
the presence of a wind shear by
measuring the divergence of the
horizontal-wind profile, their
inability to measure the vertical
wind can result in a significant un-
derestimation of the magnitude of
the hazard. One method of over-
coming this limitation is to esti-
mate the vertical wind from the
measured horizontal-wind profile
through theoretical or empirical
>
ku
rr
0.06,
0.04
0.02
I,: : Linear Model !
IEmpirical Model
-0.02 69 ,
-0.04 x> <" ,,o'
-0.06 I L i-0.06 -0.04 -0.02 0.02 0.04 0.06
In Situ Measured Fv
Comparison of the estimated and in situ measured vertical-hazard factors.
55

CaseNo,
SimulationDescription
DFW Accident Case-Wet MicroburstRain and Hail
36/20/91 Orlando, Flodd_
NASA Research FlightWet Microburst
_/11/88 Denver, Colorado
Incident Case,Multiple Microburst
07/14/82 Denver,Colorado -
Temperature InversionMicroburst
5 7/8/89 Denver, Colorado
Very Dry Microburst
6 Derived Florida Soundinl;Highly Asymmetric
Microburst
7 8/2/81 AdjustedKnowlton,
Montana Sounding,Gust Front
ModelSimulation
TimeSlice
(minutes)
11
37
49
51
36
40
45
14
27
-Iorizontal GricSpacing in
meters
ApproximatePeak
1-kilometerFBAR
@ 150 kts
ApproximateDiameter ofOutflow @
Peak ,_V (km)
ApproximateMicroburst
CoreReflectivity
(dBZ)
50 0.2 3.5 55
100 0.19 3.5 50
100 0.08 3 35
100 0.2 1.5 - 3 20 - 40
50 0.29 1.0 27
100 0.18 3 17 - 20
100 0.16 3 5
100 0.16 1 50
100 0.14 N/A20
(in area oflargestFBAR)
Intervening Temp.Rain in LapseModel Rate
NO Adiabatic
YES Adiabatic
LIGHTAdiabatic
YES
StableNO Layer
NO Adiabatic
LIGHT Adiabatic
NO Adiabatic
Symmetry
Axisymmetric
RoughSymmetry
Variesbetween
Microbursts
Axisymmetric
RoughSymmetry
Asymmetric
Asymmetric
Asymmetric
Characteristics of wind-shear data sets.
microburst models. The objectiveof this research was to evaluate the
performance of a vertical-wind
estimation technique with simulat-
ed radar and flight-test measure-ments. A high-fidelity, three-
dimensional, asymmetric, micro-
burst model was employed in
conjunction with a Doppler radarsimulation program to generatesimulated radar measurements
and to estimate the vertical wind
and vertical component of thewind-shear hazard index Fv. Twomicroburst downdraft models
("linear" and "empirical") wereevaluated within the vertical-wind
estimation routine. The radar sim-
ulation was used to study theeffect of measurement error due to
signal noise and ground clutter.The vertical-hazard estimates
derived from radar flight-test mea-
surements at a point 2 km in front
of the airplane were comparedwith the onboard in situ measure-
ments of that airspace. The perfor-mance of a vertical-wind estima-
tion technique to complement
Doppler based sensor measure-ments of hazardous wind shear
has been evaluated and compared
with flight-test measurements.
Shown in the figure is the correla-tion between the estimated Fv
derived from radar flight-test m_ a-surements and the onboard in situ
measurements recorded as the t_'st
vehicle traversed the radar-sampl, _tairspace. The results of this
research can be directly applied toairborne Doppler based airborne
forward-look systems to enhano:their estimation of the wind-she_r
hazard potential and can provid 2a foundation for the developmentof new vertical-wind estimation
techniques.
(Dan D. Vicroy, 42022)Flight Systems Directorate
Wind-Shear Data Sets
Delivered for Certification
of Airborne Forward-Look
Sensors
Federal Aviation Administration(FAA) certification of airborne
forward-look wind-shear sensors
will rely heavily on simulatedwind-shear encounters. Simulation
is required since the necessaryrange of environmental conditions
would not likely be found within a
feasible period of flight testingand because certain encounter sce-
narios would be too hazardous for
flight testing. At the request of the
FAA and industry, NASA deve-
loped and provided the required
wind-shear models. Workingmeetings between NASA and FAA
certification personnel were held
to establish the certification objec-
tives to be satisfied by simulation.
56
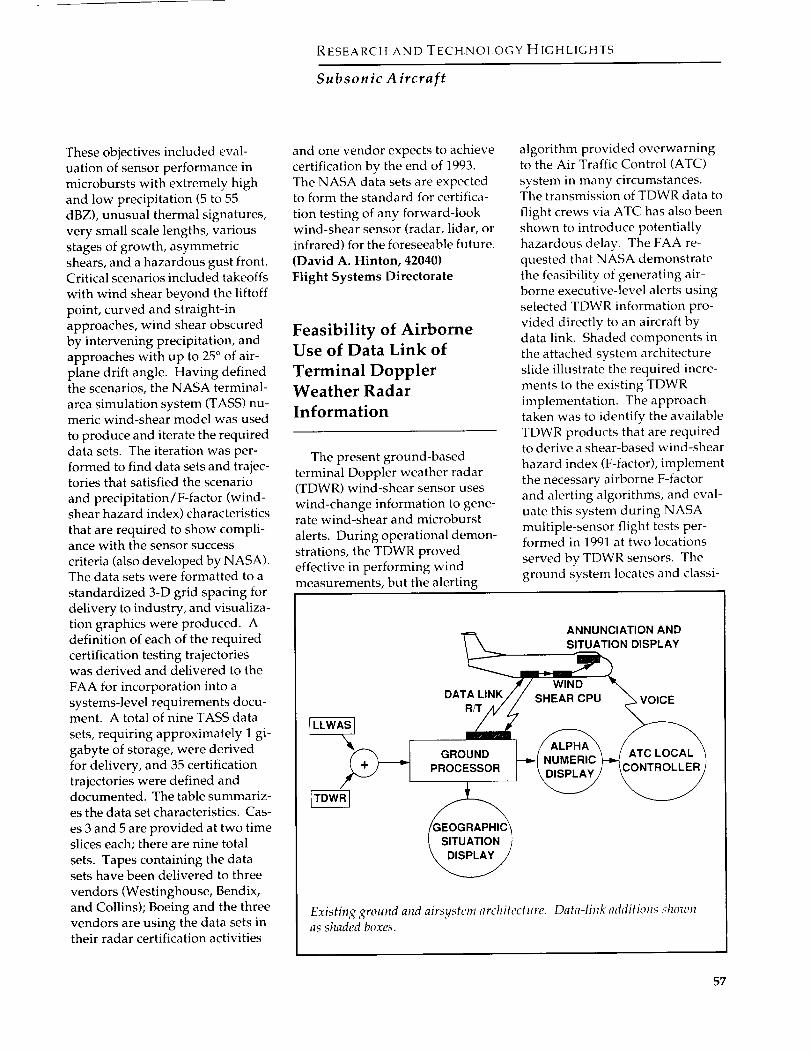
RESEARCH AND TECHNOLOGY HIGHLIGHTS
Subsonic A &craft
These objectives included eval-
uation of sensor performance in
microbursts with extremely high
and low precipitation (5 to 55dBZ), unusual thermal signatures,
very small scale lengths, various
stages of growth, asymmetricshears, and a hazardous gust front.Critical scenarios included takeoffs
with wind shear beyond the liftoff
point, curved and straight-in
approaches, wind shear obscured
by intervening precipitation, andapproaches with up to 25 ° of air-
plane drift angle. Having definedthe scenarios, the NASA terminal-
area simulation system (TASS) nu-meric wind-shear model was used
to produce and iterate the required
data sets. The iteration was per-formed to find data sets and trajec-tories that satisfied the scenario
and precipitation/F-factor (wind-shear hazard index) characteristics
that are required to show compli-ance with the sensor success
criteria (also developed by NASA).The data sets were formatted to a
standardized 3-D grid spacing for
delivery to industry, and visualiza-tion graphics were produced. A
definition of each of the required
certification testing trajectorieswas derived and delivered to the
FAA for incorporation into a
systems-level requirements docu-ment. A total of nine TASS data
sets, requiring approximately I gi-
gabyte of storage, were derived
for delivery, and 35 certificationtrajectories were defined anddocumented. The table summariz-
es the data set characteristics. Cas-
es 3 and 5 are provided at two timeslices each; there are nine total
sets. Tapes containing the datasets have been delivered to three
vendors (Westinghouse, Bendix,
and Collins); Boeing and the three
vendors are using the data sets intheir radar certification activities
and one vendor expects to achieve
certification by the end of 1993.The NASA data sets are expectedto form the standard for certifica-
tion testing of any forward-lookwind-shear sensor (radar, lidar, or
infrared) for the foreseeable future.
(David A. Hinton, 42040)
Flight Systems Directorate
Feasibility of Airborne
Use of Data Link of
Terminal Doppler
Weather Radar
Information
The present ground-based
terminal Doppler weather radar(TDWR) wind-shear sensor uses
wind-change information to gene-rate wind-shear and microburst
alerts. During operational demon-
strations, the TDWR proved
effective in performing windmeasurements, but the alerting
algorithm provided overwarningto the Air Traffic Control (ATC)
system in many circumstances.The transmission of TDWR data to
flight crews via ATC has also been
shown to introduce potentially
hazardous delay. The FAA re-
quested that NASA demonstrate
the feasibility of generating air-borne executive-level alerts using
selected TDWR information pro-
vided directly to an aircraft by
data link. Shaded components in
the attached system architecture
slide illustrate the required incre-ments to the existing TDWR
implementation. The approachtaken was to identify the available
TDWR products that are requiredto derive a shear-based wind-shear
hazard index (F-factor), implement
the necessary airborne F-factorand alerting algorithms, and eval-
uate this system during NASA
multiple-sensor flight tests per-formed in 1991 at two locations
served by TDWR sensors. The
ground system locates and classi-
ANNUNCIATION AND
N DISPLAY
PROCESSOR |
Existing ground and airsystem architecture. Data-link additions shownas shaded boxes.
57

2.5
v., 2
Z
ae[-
1.5
N
[.,.<
l_e
0.5
--'-- 0 NM
---o-- 3 NM
--'-- 5 NM
STANDARD LAPSE RATETURBULENCE LEVEL
1.5 FT / SEC
./,/
i._l /
/
i
I I
0 100 200 300 400 500 600 700 800
MAXIMUM TAKEOFF (;ROSS WEIGHT, LB/1000
Predicted effects of atmospheric turbulence on wake strength decay as a function of generating aircraft weight anddistance behind the generating aircraft.
fies weather events and providesthe data to the aircraft. The air-
borne system quantifies the wind-
shear threat, displays microburst
locations on a cockpit moving-mapdisplay, and annunciates an alert
if required. The practicality of air-borne use of TDWR information
was demonstrated, and the air-
borne display of microburst loca-tion and magnitude was used
operationally to maneuver the
aircraft for microburst penetrationsand to ensure that microburst in-
tensity did not violate flight safetycriteria. Results indicate that the
TDWR-produced microburst iconsoverestimate the areal extent of
the wind-shear hazard; however,
in the limited number of cases (5)
where the aircraft penetrated the
core of a microburst, the averageabsolute altitude-corrected F-factor
error (TDWR predicted vers _ls in
situ measured) was only 0.0 8, or
about 17 percent of the alertthreshold of 0.105. This work has
demonstrated the feasibility ofproviding ground-based TDWRinformation to aircraft via d;,ta
link, adding value to that data
through F-factor estimation, andproviding situational information
and alerts to the flight crew.
Implementation of a data-link
capability could provide forward-
look wind-shear protection t)those fleet aircraft that will not be
equipped with airborne forward-
look wind-shear systems.(David A. Hinton, 42040)
Flight Systems Directorate
Wake-Vortex Research
The aircraft trailing-wake
hazard is a primary factor in deter-
mining the minimum spacing thatthe FAA allows between aircraft
operating from either single orclosely spaced parallel runways.
FAA experience has shown that
current wake-vortex-imposed
spacings are unduly conservative
most of the time. Since spacing be-tween aircraft has a direct effect on
airport capacity, a cooperativeresearch effort was initiated
between NASA and the FAA to
develop requirements for mini-
mum safe spacings for bothcurrent and future aircraft. As
part of that effort, an analyticalstudy was undertaken to deter-
58

RESEARCH AND TECHNOLOGY HIGHLIGHTS
Subsonic Aircraft
mine how weather conditions
affect wake decay.
A representative sample of thecommercial aircraft fleet was cho-
sen for the study. The maximum
range of takeoff gross weight for
these aircraft included both Large
(12 500 to 300 000 lb) and Heavy
(>300 000 lb) category aircraft.Aircraft characteristics were taken
from standard published sources,
and calculations were performedfor a wide range of atmospheric
conditions. A key result of the
study was the extremely strong ef-
fect that atmospheric turbulence
was predicted to have on wakedecay. For typical levels of atmo-
spheric turbulence, wake decayoccurred within a few miles behind
the aircraft. For "light" turbulence,
the vortices persisted much farther,especially for Heavy category air-craft. Thus, the vortices from
Heavy category aircraft are stron-
ger initially and last longer thanthose from smaller aircraft. In
addition, there was a wide varia-
tion in wake strength within the
Large category, and there was no
obvious reason for using 300 000 lbas the dividing line between the
Large and Heavy categories.
(George C. Greene, 45545)Aeronautics Directorate
Organizing Principles for
Presenting Systems Fault
Information to Commercial
Aircraft Flight Crews
Accident and incident reports
indicate that flight crews occasion-
ally mismanage or respond
inappropriately to systems faultsor do not understand how the
automation manages these faults.Therefore, for automated fault-
management aids to be effective,their design should account for
how pilots think about and per-
form fault management. One way
to accomplish this is to organize
information for display to pilots
based on their cognitive organiza-tion of that information. One
dimension is based on high-level
functional categories, such as
flight control, flight guidance, and
systems management. A seconddimension is based on information-
processing (IP) tasks (e.g., detec-tion, identification, diagnosis, and
response). There is some uncer-
tainty concerning how pilots orga-nize tasks within the IP dimension:
IP models suggest tasks are
ordered by logical processing
dependencies (order of computa-
tion); a previous study suggested
that pilots organize informationby the order in which it is used (or-
der of use). The objectives of this
study were to determine whetherthe functional or IP task dimension
is superordinate in the pilots' men-tal models and to assess how |P
tasks are ordered within the pilots'models.
A workstation experiment was
conducted that required each of
40 commercial pilots to perform an
information retrieval task usingone of four hierarchical menus.
The menus were designed to corre-
spond to hypothesized pilot cogni-
tive organizations of systems fault
information. Functional categoriesand IP tasks were represented in
the top two tiers of these menus.Two of the menus contained func-
tional categories as menu choices
in the top tier and IP tasks as menuchoices in the second tier, and theother two menus reversed the
order of these tiers. One menu
from each of these conditions had
the IP task menu choices in the
order in which information is com-
puted and the other had them inthe order in which information is
typically used by pilots. Subjects'
speed and accuracy of navigatingthrough a menu to find specifiedinformation were measured. The
Menu 1
Flight Control Flight Planning Systems_. II I I I i ,0e,ec,deo*o,a I °t P,ogRe // / \ \\ oe,oc,0eo,Io'ag P,o -Re
Detec-Ident- Dia 9- _n I Prog- Re-
I*'°° Imen,-I I"p° 'el
Example menu evaluated to determine pilot cognitive organization of fault-management information.
59

underlying assumption was that
the closer the correspondencebetween a menu's structure and
pilots' cognitive organization of
systems fault information, the
better pilots would perform.
There was evidence that pilots
performed best with the menu
with high-level functions as the
top level and IP tasks in the order
of computation (see figure),
although the evidence was weak.
The guarded conclusion drawn is
that pilots' cognitive organizationof fault-management information
corresponds to the organization ofthis menu. Based on the assump-
tion that pilots will more effective-
ly use an automated aid if it orga-nizes its information in a manner
that corresponds to the way that
pilots mentally organize the infor-
mation, these results support an
important design guideline: if a
new aiding system that providesinformatioh relevant to several
high-level functions is introduced
on the flight deck, the information
should either be distributed amongexisting function-based displays
or, if a new display is required, it
should be organized primarily byfunctional areas.
(Bill Rogers, 42045, andPaul C. Schutte)
Flight Systems Directorate
Reduction of Spurious
Symptoms in Aircraft
Subsystems Fault
Monitoring
Advanced aircraft fault-
monitoring systems, such asMONITAUR, depend on computersimulation models of the sub-
systems they are monitoring to
ControlInputs
a/t,roach,
throttle
Aircraft 1
I Expected = 1.0
Simulationexpected = f(alt,
roach,
throttle).
MONITAUR architecture.
Sensor is t Sensor isabnormally Rule-based t norma/
Assessment ] low I Filter I I
Ifsensoris{ {
Criteria abnormally lowII deviation < O, and conditions are {then sensor is spool-up,
abnormally low, then sensor is
normal
In this example, the sensor noise levelIs 0.05. The simulation does not account for
engine spool-up. The rule-based filterrecognizes spool-up after It has occurred.
The conditions for spool-up have been simplified.
)rovide reliable data on how the
subsystem should be behaving, ifthe models cannot produce
accurate expectations of subsystem
behavior, then the fault-monitoring
system could produce spurious
symptoms. From the pilot's per-spective, spurious symptoms ca:_manifest themselves as false
alarms. This can lead to inappn_-
priate actions and lack of trust iathe monitoring system. An earlier
study by Boeing demonstrated
that MONITAUR would produce
spurious symptoms when using
"off-the-shelf" engine models. Theobjective of this research was to as-
sess ways to reduce the number of
spurious symptoms produced as a
result of modeling errors.
MONITAUR was designed :ouse a rule-based filter to filter c,ut
spurious symptoms (see figure).
In the previous Boeing study men-tioned above, the rules for this
filter were both sparse and pri mi-
tire. One approach used in thecurrent study was to examine the
categories of symptoms produced
and to develop a more robust set
of rules. Another approach that
was explored was the use of neural
networks to enhance the engine
models used by MONITAUR.
Finally, a hybrid approach wasused that combined the rule-based
filter approach with the neural
network approach. Both approach-es were developed using one set of
healthy engine data and were eval-
uated using a different set. Therule-based filter was also evaluated
against fault data. The neural net-
work approach could not be evalu-
ated using fault data, because it is
specific to an engine serial numberand there was no fault data for the
serial number used. The rule-based
filter is specific only to engine
type, and there was fault data for
that type.
The enhanced knowledge inMONITAUR's rule-based filter
was able to reduce spurious symp-toms from 256 (unfiltered) to 35, a
70-percent reduction. The neural
network approach was able toreduce the same number to 96, a
40-percent reduction. The hybridapproach reduced the number to
23, a 90-percent reduction. In the
fault-data analysis, the rule-based
filter approach did not miss any
real symptoms; however, it did
6O
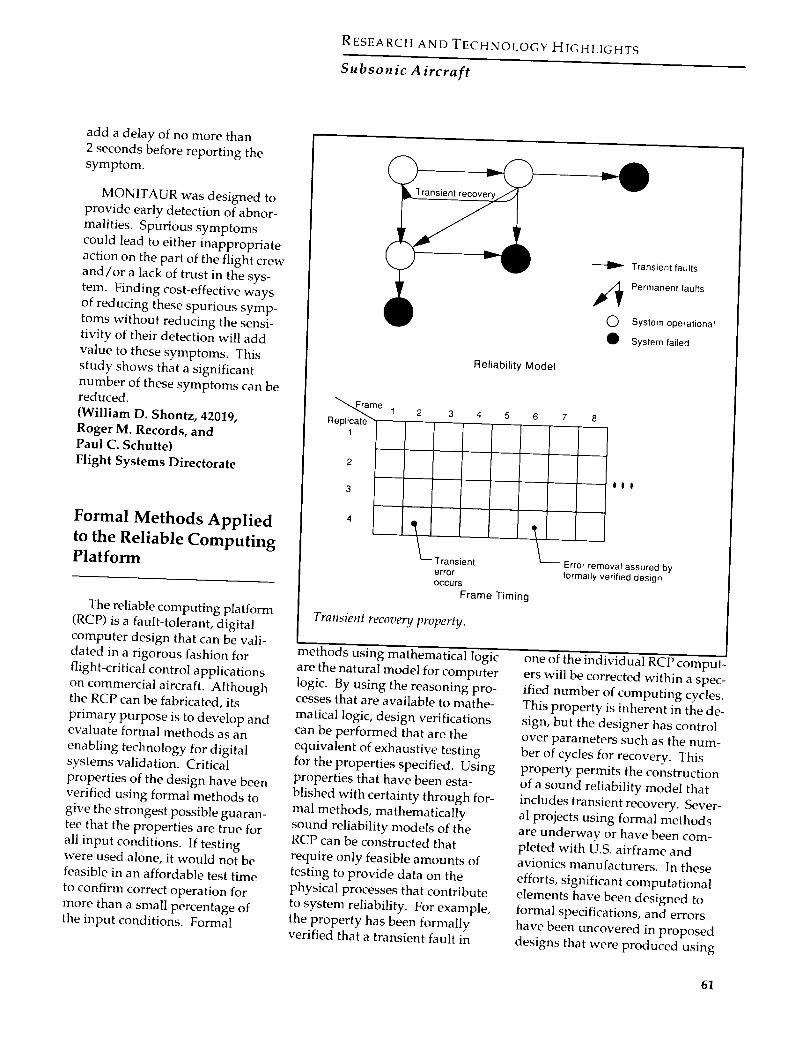
RESEARCH AND TECHNOLOGY HIGHLIGHTS
Subsonic Aircraft
add a delay of no more than
2 seconds before reporting the
symptom.
MONITAUR was designed to
provide early detection of abnor-
malities. Spurious symptoms
could lead to either inappropriate
action on the part of the flight crew
and/or a lack of trust in the sys-tem. Finding cost-effective ways
of reducing these spurious symp-
toms without reducing the sensi-
tivity of their detection will add
value to these symptoms. Thisstudy shows that a significant
number of these symptoms can bereduced.
(William D. Shontz, 42019,
Roger M. Records, andPaul C. Schutte)
Flight Systems Directorate
Formal Methods Applied
to the Reliable Computing
Platform
The reliable computing platform
(RCP) is a fault-tolerant, digitalcomputer design that can be vali-
dated in a rigorous fashion for
flight-critical control applications
on commercial aircraft. Althoughthe RCP can be fabricated, its
primary purpose is to develop andevaluate formal methods as an
enabling technology for digital
systems validation. Critical
properties of the design have been
verified using formal methods togive the strongest possible guaran-
tee that the properties are true for
all input conditions. If testingwere used alone, it would not befeasible in an affordable test time
to confirm correct operation for
more than a small percentage ofthe input conditions. Formal
Reliability Model
Transient faults
Permanent faults
C) System operational
• System failed
"'N_m e 1
Replicate "1
2
3
4
3 4 5 6 7 8
el I
L Transient _- Error removal assured by
error formally verified designoccurs
Frame Timing
Transient recovery prowrty.
methods using mathematical logic
are the natural model for computer
logic. By using the reasoning pro-cesses that are available to mathe-
matical logic, design verifications
can be performed that are the
equivalent of exhaustive testing
for the properties specified. Usingproperties that have been esta-
blished with certainty through for-
mal methods, mathematically
sound reliability models of theRCP can be constructed that
require only feasible amounts of
testing to provide data on thephysical processes that contribute
to system reliability. For example,
the property has been formallyverified that a transient fault in
one of the individual RCP comput-
ers will be corrected within a spec-
ified number of computing cycles.This property is inherent in the de-
sign, but the designer has control
over parameters such as the num-
ber of cycles for recovery. This
property permits the construction
of a sound reliability model thatincludes transient recovery. Sever-
al projects using formal methods
are underway or have been com-
pleted with U.S. airframe andavionics manufacturers. In these
efforts, significant computationalelements have been designed to
formal specifications, and errors
have been uncovered in proposed
designs that were produced using
61

traditionaldesigntechniques.Asformalmethodsandsupportingtoolscontinuetoevolve,theywillprovideanaffordablemeanstoproducedigitalsystemsthatcanbetrustedin life-criticalapplica-tions.(Ricky W. Butler, 46198)
Flight Systems Directorate
Pictorial Flight Displays
Provide Increased Traffic-
Situation Awareness
Although modern flight decks
have become more sophisticated
in terms of computer-generated
electronic displays, the display
formats in use are largely electron-ic renditions of earlier electro-
mechanical instruments. New
computer-graphics capabilities
make possible large-screen, inte-
grated pictorial formats to provide
gains in pilots' situation awareness,pilot/vehicle performance, and
aircraft safety, with potential for
significant operational benefits.
The purpose of this research was
to compare the spatial awarenessof commercial airline pilots when
flying simulated landing approach-
es with conventional flight dis-
plays to their awareness whenflying advanced pictorial,
"pathway-in-the-sky" displays.
The specific aspects of spatialawareness addressed herein con-
cern conflicting traffic assessments.
A simulation study was con-ducted that used sixteen commer-
cial airline pilots repeatedly flying
complex MLS-type approaches to
closely spaced parallel runwayswith an extremely short final seg-
ment. Four separate display con-
figurations were utilized in thesimulated flights: (1) a convention-
l i"l Maneuvered]B Detected
I,
c0
c
3
c v o - o __o • o_ Oo
c_ u u
u _
DISPLAY
80-
60_
i!
i
40_I
1
zo!
J
AA
a
,ao....S,d.O,v.iWean 5td. Dev.
- o • _ °o o
c_ u u
u
DISPLAY
Traffic scenario results.
al primary flight and navigation
display with raw guidance dataand TCAS (Traffic Alert and Colli-
sion Avoidance System) II; (2) thesame conventional instruments
with an active flight directoz; (3) a
40 ° field of view (FOV), inte_.,rated,
pictorial pathway format with
TCAS II symbology; and (4) a
large-screen (70 ° FOV) version ofthe pictorial display.
Within any one of the nine
approaches each pilot flew with
each display, a single conflictingtraffic scenario was encountered.
TCAS II symbologies in each con-
cept alerted the pilot to the conflictif he had not already detected the
situation. The pictorial for:hatsused the conventional resolution
symbology set for traffic represen-
tation, but a resolution path was
not indicated or required, as was
the case with the conventional dis-
plays (climb or dive resolutions).As shown in the left portion of the
figure, all the pilots detected eachtraffic incursion, and if a resolution
path was indicated, it was initiated.
However, with the pictorial for-
mats, the pilots detected the con-flict situation 8 or 9 seconds earlier
(right portion of figure) than with
the conventional displays, and the
pilots often decided that no avoid-
ance maneuver was required withthe increased situation awareness
reportedly available with the pic-torial formats. No differences
were detectable statisticallybetween the two conventional
displays or between the two
pictorial concepts.
(Anthony M. Busquets, 46652,Russell V. Parrish, Steven P.
Williams, and Dean E. Nold)
Flight Systems Directorate
62

Rt!SEARCH AND TECHNOLOGYH1GtlL1GHTS
Subsonic Aircraft
Flight-Deck Functional
Requirements for 2005
High-Speed Transport
In order to accommodate the
rapid growth in commercial avia-tion throughout the remainder of
this century, the Federal AviationAdministration (FAA) is faced
with a major challenge to upgradeand modernize the National Air-
space System (NAS) without com-promising safety or efficiency. Re-
curring themes in both the FAA
Aviation System Capital Invest-ment Plan and the FAA Plan for
Research, Engineering, and Devel-
opment are reliance on the applica-tion of new technologies and a
greater use of automation. In
addition, high-speed civil trans-
port (HSCT) requirements may
lead to flight-deck design and
NAS-aircraft interactions that will
be unique to this class of vehicle.
Identifying the high-level function-al and system impacts of future
civil transport operational require-
ments, particularly in terms of
HSCT flight-deck functionality
and information requirements,was the objective of this stud}' by
the Boeing Commercial Airplane
Group and NASA. A high-level
analysis was conducted to identifyand define the functions that must
be accomplished to complete a
high-speed commercial transportmission in a modernized NAS of
the 2005 era. These required capa-
bilities were then used to develop
functional descriptions for the ma-
jor aircraft systems, includingsystem characterization, informa-tion sources and destinations, and
intersystem relationships. A struc-
tured analysis of the functional
requirements was defined based
on aircraft flight phase (see figure
for an example). The results of
this analysis were documented asa comprehensively defined aircraftmission with both normal and
non-normal components broken
down into their associated flight-
crew functions. The product ofthis study, documented in NASA
CR-4479, was an initial step toward
providing a requirements-driven
approach, at a global level, to theefficient and effective transfer of
information between the NAS
operational environment and theadvanced flight deck. Without an
integrated and coherent under-
standing of these requirements,
future design and development ef-forts for "human centered" auto-
mation will not be realized to their
full potential.
(K. W. Alter, 42009, D. M. Regal,and Terence S. Abbott)
Flight Systems Directorate
FUNCTION ANALYSIS FOR NORMAL FLIGHT
Functions _ndlcated in boldface type are specific to supersonic flight
The functio_ analysis is organized by flight phase These phases are from a representative flight profile
shown be{ow
C1imblsu
Oescer
Missed approach
Taxi Out Taxl back
FLIGHT PHASE: DESCENTPLAN APPROACH
• Determine arrival airport conditions,procedures/effects on fhght
- Weather
Traffic
Airpor_terminal area conditions
Altitude restrictions
High terrain
- Noise abatement procedures
• Preview critical areas of arnval
• Determine supersonic to subsonic transition point
:)etermine predicted point of boom degeneration
)roblem:
Reeompute top of descent
Adjust arrival route
High Terrain
Heavy Traffic
Weather
CONTROL FLIGHT PATH (See CLIMB for details and flight
control modes)
• Follow lateral flight path
-Determine mode of lateral navigation
Optimize efficiency
Determine limitations due to speed (e.g. turn radius)
Linkec_ to longitudinal contro_
- Track this path
Small errors: correct error
Large errors: select new mode
Limit bank angle to avoid boom focusing
Mach number<l before boom track enters sensitive
areas
- Continued
An example of the flight-deck functional requircmet#s for HSCT operations.
63

Development ofTransonic Area-Rule
Methodology
The limiting subsonic speed at
which high-performance transportand business jet aircraft fly is often
set by drag rise due to compressibil-
ity effects. Delaying this transonic
drag rise will potentially allow the
design of more efficient and fastersubsonic aircraft.
In the early 1950's, Dr. Richard
T. Whitcomb showed that drag
rise could be delayed using thesonic area rule. In sonic flow,
changes in pressure are commu-
nicated with negligible dissipation
between the fuselage and its exter-
nal parts along Mach planes. As a
result, drag becomes a strong func-tion of the cross-sectional area of
the aircraft, and this is the founda-tion of sonic area rule. When an
aircraft is sonic area ruled, the
fuselage is shaped to an optimalarea distribution. The result is the
well-known "Coke bottle" shaped
fuselage. The sonic area-rule ideas
were then expanded and validated
for supersonic speeds, but little re-finement has occurred in the tran-
sonic regime.
Transonic flow has the added
complexity of mixed subsonic and
supersonic regions. In this flow,the communication between the
aircraft fuselage and its external
parts has dissipation due to the
subsonic regions. Therefore, the
sonic area rule no longer strictly
applies. The new transonic area-
rule methodology utilizes a
weighting function (WF) thataccounts for the mixed flow. For
example, WF equal to 1.0 corre-sponds to uniform sonic flow. The
WF = 1.0
0.0125 -
0.0100
0.0075Delta
C_0.0050
0.0025
0.0000
WF = 0.5 WF = 0.0
Theory Without Area-Rule -.__
_ Experiment Without Area-Rule .... - - ",,'/_ca-" ....
Theory WF = 0.0 ............... J'" ..... _._,,_
Theory WF = 0,5 ......... / ...... ; .--___Theory WF = 1.0 ,_ _ _.,,.v-,,
Experirr ent WF = 1.0--- _;_----,_"
.,;/ .z-;..9, ......
"--'-----A .... --: ..... -
0.850 0900 0.950 1.000Mach Number
Drag-rise comparison of delta-wing�body geometries.
initial investigation has used ar.
unstructured-grid Euler algorithm
developed at Langley Research
Center. This algorithm was com-
pared with Whitcomb's originalexperimental work and showec
good agreement for both the nc n-area-rule and sonic area-rule ca_e
(see figure). The sonic area-rule
model was then theoretically re-area ruled with the new transordc
technique (WF = 0.5 and 0.0). The
numerical results showed equal or
increased drag-rise delay (see
figure). Also, the fuselage shapingmethods used in this new techni-
que are much less severe than the
standard sonic area-ruling method.The combination of increased
delay in drag rise and decreased
body modification should lead to
increased efficiency for transonicaircraft.
(Wayne D. Carlsen, 47741)Aeronautics Directorate
64

RESEARCHANDTECHNOLOGYHIGHLIGHTS
Subsonic Aircraft
Interface Technology for
Structural Design and
Analysis
Many industries are rapidly
moving toward a concurrentengineering environment. A
critical requirement of that envi-
ronment is the ability to avoid
costly design changes by exami-
ning the impact of design details
concurrently with conceptual/preliminary design. Computation-al tools that allow detail to be con-
sidered early in design are neededbecause so-called "details" are
often failure-initiation sites and
can become costly items if not
addressed early in the design pro-
cess. Interface technology pro-
vides a new set of computational
tools for treating design detailswithin the framework of finite-
element codes now extensively
used in industry. The full potentialof these codes to treat detail at an
early stage of the design process is
unleashed by significantly reduc-ing the engineering effort to treat
details. Interface technology pro-
vides the insertion modeling com-
putational tools to accomplish
this. For example, the effect ofdamage on residual strength, or
the effect of the integrity of a
repaired area on the component's
performance can be easily studied
using insertion modeling tools
that were developed from interface
technology. These tools allow
easy insertion of local models in
the global models used for early
design. Because they eliminate theneed for coincidence of model grid
points, no transition mesh is
required to go from the fine local
mesh to the global mesh. Instead,the inserted model attaches to the
global model through interfaceelements that are derived from hy-
brid variational principles of
mechanics and are employed by
the user like any other finite ele-
ment. Remarkably, these elementsresult in accurate prediction ofstresses even at the interface. In
the example shown in the figure,
the local stress intensity at the tip
Interface
_rack
Interface technology used to insert crack in fuselage window panel model.
65

NormalizedStress
0.015
0.010
0.005
0.000
exact
Interlaminar Normal Stress
0.2 0.4 0.6 0.8
Transverse Coordinate
Transition-element technology verified in predicting edge delamination stresses.
free
edge
of a crack emanating from a
window in a curved composite
fuselage panel is easily modeled
by inserting a local crack model
into a coarser model that may have
been used in early design. Crack
growth can be tracked by movingthe local model within the global
mesh. Computational tools based
on interface technology have been
developed within the COMET
(COmputational MEchanics Test-bed) research code and are avail-
able for technology transfer.
(Jonathan B. Ransom, 429241Structures Directorate
Transition Elements for
Laminated Composite
Analysis
The strength of laminated com-
posite structures is strongly influ-
enced by local interlaminar normaland transverse shear stresses. Fail-
ure and life prediction of cor_posite
structural designs requires theaccurate calculation of thesestresses. Such calculations can be
very expensive, because 3121brick
finite-element modeling is often
required. To enhance computation-
al efficiency, it is desirable to use3D finite elements only where they
are necessary for modeling inter-laminar behavior; 2D elements
should be used everywhere else.
To accomplish this goal, an inter-
face technology-based computa-tional tool has been developed to
accurately join 2D and 3D regions
together. To fit in the framework
of conventional structural-analysissoftware, this tool takes the formof a transition element. The transi-
tion elements have two types of
edges: edges that connect to a
stack of brick elements and edges
that connect to a plate or shell
element. The edge(s) connected to
plate or shell elements are con-strained so that their membrane
and bending deformations are
66

RESEARCH AND TECHNOLOGY HIGHLIGHTS
Subsonic Aircraft
consistent with 2D plate and shell
theory. Until recently, such ele-
ments tended to yield inaccurate
interlaminar stresses in the vicinityof the transition element as the
result of a boundary-layer pinch-
ing effect. Basing the transitionelement on a higher-order theory,
the boundary effect is eliminated,
thus providing accurate transitionfrom 2D to 3D elements. The
significant classical case of edge
delamination in symmetricallylaminated composite plates underuniaxial tension is used to demon-
strate the performance of the
higher-order transition element.
The plate has laminae with fibersoriented in axial and transverse
directions. Edge delamination can
occur in such a plate because of theinterlaminar stresses that arise
near the plate edges as a result of
the large stiffness-property differ-ences between the laminae. Thefinite-element model uses a stack
of 3D brick elements in the region
of high interlaminar stress. Transi-
tion elements are placed on the
three sides of the stack that join the
3D brick elements to the 2D plateelements. The results reveal that
accurate interlaminar stresses are
predicted throughout the plate,even within the transition
elements.
(Alexander Tessler, 43178)Structures Directorate
Test and Analysis of
Stitched-RTM WingAccess-Door Panel
Advanced structural concepts
for wing and fuselage structuresare being developed to exploit the
benefits of advanced composite
materials. One structural concept
under development for transport
applications is a blade-stiffened
panel made from layers of graphitematerials that have been stitched
together before the resin is applied
to the part. Once the layers of gra-phite material are stitched together
in the desired shape, the structural
part is placed into fabrication tool-
ing and epoxy resin is injected by
using a resin transfer molding
(RTM) procedure. The part is then
cured by following the resin man-ufacturer's specifications. One
advantage offered by stitching the
graphite layers together is that the
low-speed impact damage toler-
ance is improved.
To evaluate the stitched-RTM
panel concept, a wing panel was
designed and fabricated by
Douglas Aircraft Company and
was tested and analyzed atLangley Research Center. The
panel design includes an access
Unstiffened side of
access door panel
Load,Ib
Geometrically nonlinear STAGS analyses
Linear material properties...... Nonlinear material properties
o ExperimentLocation of strain
700 000 o. ,, gages (on"C_.._ unstiffenedJ ( I (Jl
C_..N side) _
500 000
300 000
100 000 -
0 I-.010 -.O05 0
Axial strain at edge ofaccess door cutout
Comparison of test data with analysis for a stitched-RTM wing access-door panel.
67

doorforassembly,inspection,andmaintenance.Thepanelwassub-jectedtolow-speedimpactdamageandwastestedtofailuretodeter-minetheresidualstrengthof theimpact-damagedpanel.Failureofthispanelwascausedbythestressconcentrationsatthefastenerholesthatwereusedtoattachtheaccessdoorto thestiffenedpanel,andnotbytheimpactdamage.Theseresultsindicatethatthisstitched-RTMdesignandstructuralconceptismoresensitivetolocaldesigndetailfeaturesthanit isto low-speedimpactdamage;theresultsalsoindicatethathighly-loadedgraphite-epoxywingpanelscanbedesignedforhigherstrainappli-cationsandcanbedamagetolerant.
ThepanelwasanalyzedbyusingtileSTAGSnonlinearstruc-turalanalysiscode,andtheresultsindicatethatbothgeometricandmaterialnonlineareffectsmustbeincludedin theanalysisforthean-alyticalresultstocorrelate with
the test results. The geometricnonlinear effects are a result of tlle
eccentricities associated with theaccess-door cutout and a stiffener
that is !nterrupted by the accessdoor cutout. The material non-
linear effects are a result of the
nonlinear characteristics of the
material properties of this stitched-RTM material form.
(Dawn C. Jegley, 431851Structures Directorate
Analysis of Textile
Preform Composites
A general-purpose micro-mechanics analvsis tool to predictoverall, three-dimensional (3-D),
TEXCA0- lu.i, "1 I__]Eile _dit _Stale _ndow !t_elp
THIS PROGRRH AItRLYZES 2D RHD lID COlIPOSITES
ENTER IVPE OF COMPOSITE FOR FRESEHT AHALYSIS
1 - 2D (LI'tHIltATED) COI'IPGSITE2 - :3D $PRTIRLLY ORIEHTEO COi4POSITE
3 - 2[I M4EI_UES (PLfIIH. S/8-HRI_IHE$$ SATIH
k_ 2D BRAIDS (PLAIH. 5__$ 2D 2x2 TRIAXIflL BR_ .6 20 lxl TRIaXIRL eRa Eile [dit Find .Gherscter paragraph Document
7 3D HLILTI-IHTERLOCR _ Help
8- C,_;TOHIZED TEXTILE (_)- Yarn ]]::) _ _I'=id ar_l,
I .._ _,"['h=t.aAx ial.yam ._.L_..I._.E_
TEXCAD program graphicol user interface under MS Windows TM
_'tlzffro/It/le/It.
thermal and mechanical properties
for a variety of fabric-reinforced
composite materials was de'.,e-
loped.
A simple 3-D geometric
modeling technique was used to
model the undulating yarn paths
within each repeating unit o'11(RUC) of the textile composim.
Each yarn was modeled disceetely.
The yarns were assumed to have aconstant cross section in the form
of a flattened lenticular shape.Yarn undulations were assumed
to follow sinusoidal paths. A
stress-averaging scheme thaiassumed an iso-strain state v'as
used to compute effective th,,rmo-
mechanical properties and internalstresses in the RUC. The calo flated
overall stiffnesses correlated well
with available 3-D finite-element
results and also with test results
for a variety of textile preforms.
This analysis was implementedin the Textile Composites Analysis
for Design (TEXCAD) program.
Input to the TEXCAD program
consists of architecture type (such
as plain weave or braid), braid
angle, yarn filament counts, yarn
spacing, yarn fiber content, fila-ment diameter, overall fiber vol-
ume fraction, and impregnated
yarn and resin material properties.
Output from the TEXCAD pro-
gram consists of calculated yarn
geometry, volume content, andyarn paths along with thermo-
mechanical stiffness propertiesand thermal and mechanical
stresses at locations along the yarn
paths.
The TEXCAD program runs on
a personal computer under the
multitasking Microsoft (MS)Windows TM environment (shown
in the figure). This program is
capable of analyzing two-
68

t-ISt-'-"-'_\[<_ft ANDTECHNOLOGYHIGHLIGHTSubson ic Aircraft
dimensional (2-D) and 3-D com-
posites, including tape laminates;
spatially oriented composites;plain, 5-, and 8-harness satinweaves; 2-D braids; 2 x 2 triaxial
braids; 1 x 1 triaxial braids; 3-D in-
terlock braids; and even customtextile architectures. As shown in
the figure, a generic graphicalrepresentation of each textile RUC
is also included, and it may beviewed or printed at any time.
Copies of the TEXCAD programhave been distributed to users in
industry and universities.(Rajiv A. Naik, 43471, andC. C. Poe)Structures Directorate
Cooperative NASA/
Boeing/Pratt & Whitney
Advanced Ducted
Propeller Investigation
The advanced ducted propeller(ADP) offers significant perform-
ance and noise benefits (compared
with current turbofan engines) for
use on commercial transports.
The large diameter of an ADP pre-sents a challenge for aerodynamical-
ly efficient wing-mounted config-urations. Ground clearance
requirements force the engine
nacelle closer to the wing, whichmakes physical integration of the
engine and wing more difficult.Another benefit of the ADP is that
it uses blade pitch changes to
provide reverse thrust for airplane
deceleration, thereby avoiding theweight penalties associated withcurrent mechanisms in use on
turbofan engines (such as cascadesand buckets). However, as deve-
loped thus far, the ADP offers no
mechanism/or tailoring thereverse thrust flow field. Determi-
\
Boeing 7J7 with Pratt & Whitney advanced ducted propeller engine mount-ed in Langley 14- by 22-Foot Subsonic Tunnel. L-92-11358
nation of the effects of the inter-
action of the ADP reverse flow
field with the wing and the
airframe, therefore, is of greatimportance to the development
of the ADP as a viable engine for
subsonic transports.
A cooperative research programwas initiated between NASA, Boe-
ing, and Pratt & Whitney to enable
testing of a large, semispan Boeingsubsonic transport model and a
Pratt & Whitney 17-in-diameter
ADP in the Langley 14- by 22-FootSubsonic Tunnel. A low-cost, tem-
porary vertical wall was fabricatedand installed in the tunnel for
ground-effects testing.
Data were acquired for a rangeof ADP power settings and free-
stream velocity conditions. The
flow field created by the ADPoperating in reverse thrust shield-
ed a portion of the wing, and itresulted in an effective reduction
in wing lift and drag for the config-
uration out-of-ground effect.Ground effect measurements were
obtained, and they indicated no
significant problems. There was a
beneficial increase in drag and
only a slight, undesirable liftincrease in ground effect.
(Zachary T. Applin, 45062)Aeronautics Directorate
Optimization of Actuator
Arrays for Aircraft Interior
Noise Control
Recent investigation of con-
trolling noise from vibrating struc-
tures has demonstrated the poten-tial of active structural acoustic
control (ASAC) for effectively
reducing aircraft interior noise.
The ASAC relies on force inputs
applied directly to a vibratingstructure, instead of acoustic
sources inside the structure, to
69

t
McDonnell Douglas Fuselage Acoustic Research Facility. L-87-2442
attenuate interior noise. As the
ASAC concepts are integrated into
practical aircraft noise control sys-
tems, some important issues arise.
For example, an actuator that pro-duces a localized force input to a
structure, such as a small piezo-electric actuator, tends to excite a
broad spectrum of structuralmodes. This behavior can signifi-
cantly increase structural vibration
levels, although the interior noise
may still be reduced. Also, interior
acoustic modes that are not present
in the primary noise field may be
excited. This spillover of control
energy can limit the performanceof a noise reduction system, and it
can have possible fatigue implica-
tions for the fuselage structure.
One approach to overcome these
difficulties is through closely
grouped actuators.
In an ongoing joint effort
between Langley Research Centerand McDonnell Douglas Aero-
space, this actuator grouping con-
cept was evaluated for a large
number of piezoelectric actuators
bonded to the exterior panels ofthe aft section of a DC-9 fuselage
installed in the McDonnell Douglas
Fuselage Acoustic Research Facilz-
ty (shown in the figure). Measureddata included the transfer func-
tions between 34 piezoelectricactuators and 29 interior micro-
phones, as well as the interior
microphone responses caused bythe primary noise produced by ex-
ternal speakers. These data were
utilized to demonstrate a proce-
dure for grouping the actuatorssuch that their effectiveness in
reducing the overall interior noisewas enhanced while limiting the
number of control degrees of free-
dom. This grouping procedurecreated actuator groups that im-
proved overall interior noise re-ductions at four discrete frequen-
cies by 5.3 to 15 dB compared with
the baseline experimental config-
uration. The present work is thefirst evaluation of this grouping/
clustering technique usingexperimental data from an actual
aircraft fuselage.(Harold C. Lester, 43592)Structures Directorate
15.0
12.5
10.0
.c_
7.5
5.0
2.5
0
,-,_-'- Oot mized Uniform Liner, _ (Tuned at 2.5 kHz)
i _ {- Segmented Liner/
!I /I ,/ _ l_
i _ _...._-_. _--Ootlmlzed Uniform Liner/ / //", "_-_N/' (Tuned at 5 kHz)
/// ',,.., I / ,,, -..__
; ,'/ "-...
I I I i I I I I I I I i ] [ J i i i I
2.5 5.0 7.5 10.0
Frequency (kHz)
Improved broadband performance of two-segmented liner (unoptimized).
7O

RESEARCH AND TECHNOLOGY HIGHLIGHTS
Subson ic A ircraft
Finite-Element Algorithm
for Optimizing Noise
Suppression of Lined
Ejectors
One component of the noise
suppression system for the exhaust
jet of a high-speed civil transport(HSCT) aircraft is expected to be a
lined ejector. The liner of the
ejector must provide significantbroadband attenuation before the
radiated noise will be within
acceptable levels. A major chal-
lenge of HSCT technology isdesigning a broadband acousticliner. An efficient finite-element
model for predicting and opti-
mizing the acoustic performance
of a lined ejector with arbitrary
flow and variable wall impedance
properties has been developed.This finite-element model leads to
a large matrix equation (consistingof several hundred thousand de-
grees of freedom), which is solved
efficiently on one of Langley's
supercomputers.
Results of a study on three
different lining configurations at aMach number of 1.5 are shown in
the figure on the previous page.
Two optimum uniform liners
designed to achieve maximum
suppression at 2.5 kHz and 5 kHzare compared with a two-segmented
liner. Both optimized uniform lin-
ers perform well at their design
frequencies, but their performance
falls off rapidly to one side of their
design frequencies. Although the
segmented liner has not been opti-
mized, it suppresses more broad-band sound. These results show
that an unoptimized lined ejector
with variable impedance propertiescan attenuate more broadband
sound than that of the optimized
100
95
9O
8O
750 10 20 30 40 50 60 70
(deg)
Angle
L/a =-e-0.O _0.2 _0.4 i2.0
= Calculated peak Mdek_e(m,n) angle for the _,_ mode
Variation of directivity with source location in duct.
&l
_m
N i
8O 90
uniform liners. This gives credence
to the variable wall impedanceconcept as a candidate for achiev-
ing broadband attenuation in
HSCT. The finite-element algo-rithm allows even more innovative
lining designs to be explored.(Willie Watson, 45290)Structures Directorate
Shroud Length Effect for
Ducted Propellers
The ultra-high-bypass ratio pro-
pulsion system for future subsonicaircraft will have a fan diameter of
approximately 12 ft and a nacelle
length on the order of I diameter.
This "short" nacelle design has ledto studies into the effect of duct
length on sound propagation and
radiation. An acoustically long
duct radiates only well-definedcut-on modes with characteristic
lobes, while the radiation from a
71
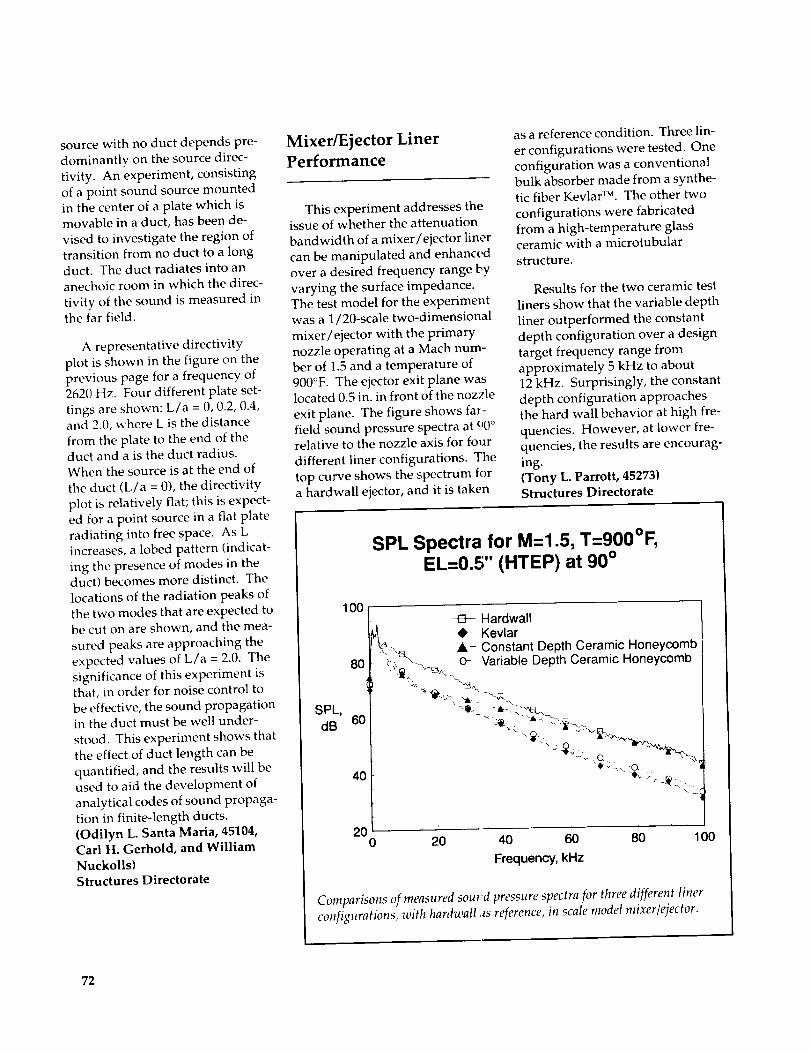
source with no duct depends pre-
dominantly on the source direc-
tivity. An experiment, consisting
of a point sound source mounted
in the center of a plate which ismovable in a duct, has been de-
vised to investigate the region of
transition from no duct to a longduct. The duct radiates into an
anechoic room in which the direc-
tivity of the sound is measured inthe far field.
A representative directivity
plot is shown in the figure on the
previous page for a frequency of2620 Hz. Four different plate set-
tings are shown: L/a = 0, 0.2, 0.4,and 2.0, where L is the distance
from the plate to the end of theduct and a is the duct radius.When the source is at the end of
the duct (L/a = 0), the directivity
plot is relatively flat; this is expect-
ed for a point source in a flat plate
radiating into free space. As Lincreases, a lobed pattern (indicat-
ing the presence of modes in theduct) becomes more distinct. The
locations of the radiation peaks of
the two modes that are expected tobe cut on are shown, and the mea-
sured peaks are approaching the
expected values of L/a = 2.0. The
significance of this experiment isthai, in order for noise control to
be effective, the sound propagationin the duct must be well under-
stood. This experiment shows that
the effect of duct length can be
quantified, and the results will be
used to aid the development of
analytical codes of sound propaga-
tion in finite-length ducts.(Odilyn L. Santa Maria, 45104,Carl H. Gerhold, and WilliamNuckolls)
Structures Directorate
Mixer/Ejector LinerPerformance
This experiment addresses theissue of whether the attenuation
bandwidth of a mixer/ejector liner
can be manipulated and enhanced
over a desired frequency range by
varying the surface impedance.
The test model for the experimentwas a 1/20-scale two-dimensional
mixer/ejector with the primary
nozzle operating at a Mach num-
ber of 1.5 and a temperature of
900°F. The ejector exit plane waslocated 0.5 in. in front of the nozzle
exit plane. The figure shows far-
field sound pressure spectra at 90 °relative to the nozzle axis for four
different liner configurations. The
top curve shows the spectrum fora hardwall ejector, and it is taken
as a reference condition. Three lin-
er configurations were tested. One
configuration was a conventional
bulk absorber made from a synthe-tic fiber Kevlar TM. The other two
configurations were fabricated
from a high-temperature glassceramic with a microtubular
structure.
Results for the two ceramic test
liners show that the variable depth
liner outperformed the constant
depth configuration over a design
target frequency range fromapproximately 5 kHz to about
12 kHz. Surprisingly, the constant
depth configuration approaches
the hard wall behavior at high fre-quencies. However, at lower fre-
quencies, the results are encourag-
ing.
(Tony L. Parrott, 45273)Structures Directorate
SPL Spectra for M=1.5, T=9OO°F,EL=0.5" (HTEP) at 90 °
1O0 [t, -El-- Hardwall_ 4, Kevlari _\_-_. - •- Constant Depth Ceramic Honeycomb
80[ (_,\ "-_ - o- Variable Depth Ceramic Honeycomb
SPL, _.dB 60 -_ ,_-_.,_
40 .c:,<.o
200 20 40 60 80
_equency, kHz
100
Comparisons of measured sou_!d pressure spectra for three different liner
configurations, with hardwall ._s reference, in scale model mixer�ejector.
72

RESEARCHANDTECHNOLOGYHIGffLIGHTS
Subsonic Aircraft
Nonlinear Analysis ofStiffened Aluminum
Fuselage Shells With
Longitudinal Cracks
A number of aircraft in current
service are nearing or exceedingtheir design service life. To ensure
the structural integrity of these air-
craft with a large number of servicehours, a reliable and accurate
structural analysis method isneeded to determine the residual
strength of aircraft with cracks in
the fuselage skin, as well as otherstructural elements.
A hierarchical modeling stra-
tegy has been developed to analyzea stiffened fuselage shell that is
subjected to an internal pressure
loading and has a skin crack.
Three levels of finite-element mod-
els are analyzed using the STAGS
(STructural Analysis of General
Shells) computer code.
The analysis is nonlinear toensure that local stress and deflec-
tion gradients at the crack are
predicted accurately. The analysis
strategy includes a nonlinearanalysis of a large stiffened fuse-
lage section that is subjected to an
internal pressure and bending mo-
ment loading. The model includessuch structural details as frames,
stringers, tear straps, shear clips,floor beams, and stanchions. In
the crown of the fuselage, there is a
longitudinal skin crack located
midway between two stringers
and two frames. The crack length
is extended using a load relaxation
technique while the shell is in a
nonlinear equilibrium state. Dis-
placements obtained from the
Fearstraps ips
Stringers
6-bay x 6-bay local model subjected to internal pressure and bendin_
moment loads. (Original qf figure in color; contact author fi_r more
information.)
analysis of this model with varying
crack lengths are applied as boun-
dary conditions to the second levelof modeling, which represents a
&bay x 6-bay crown _ection. Thismodel is referred to as a local mod-
el, and it has a higher level of mesh
refinement than the global model
to characterize more accurately the
structural response, l'_Lsplacements
obtained from the (>l-,a\ ,_ (_-baymodel are applied as boundary
conditions to a 2-bay x 2-bav mod-el that is localized around t[_e
crack. This local model has an
even higher level of mesh refine-
ment to represent the behavior ofthe crack region.
This nonlinear structural analy-
sis capability allows for an in-
depth analysis of the stress and de-
flection gradients near a crack in a
pressurized fuselage shell. Proper-ties such as stress intensity factors
at a crack tip can be determined by
this analytical method, which canbe used to determine the residual
strength of the fuselage structure.{Vickie O. Britt, 48030)Structures Directorate
Fatigue-Life Prediction
Methodology
Damage-tolerance design con-cepts based on fatigue-crack
growth in aircraft structures arewell established. The safe-life
approach, using standard fatigue
analyses, is also widely used in
many designs. Fatigue analyses
are slowly being replaced by dura-bility analyses using smaller crack
sizes than those used in damage-
tolerant analyses. Studies onsmall-crack behavior have led to
the realization that fatigue life of
73

Maximumflight
stress,ksi
50-
40-
30-
20-
10-
0
104
O_ID a_,._WlST
FALSTAFF o_
2024-T3 Bare _ ,, ^ oo_3433o
B = 0.09 in. GausZ,-_e_._ ..sian zz_:-t_o[3zx Test
-- Analysis
ai = 6 I_m
I I
105 106
Cycles, Nf
I
107
Fatigue lives for notched alumimmt alloy under aircraft spectrum loading.
many materials is primarily "crack
growth" from microstructural fea-tures, such as inclusion particles,
voids, or slip-band formation.However, small cracks have been
observed to grow much faster than
large cracks. The improved
fracture-mechanics analyses ofsome of the crack-tip shielding
mechanisms, such as plasticity-
and roughness-induced crack
closure, and analyses of surface-
or corner-crack configurationshave led to more accurate crack-
growth analysis methods for smalland large cracks.
A typical comparison of experi-
mental and predicted fatigue lives
of notched specimens made of2024-T3 aluminum alloy and test-
ed under three aircraft spectrum
load sequences is shown in the
figure. The tests, conducted byseveral different laboratories, used
a fighter wing spectrum
(FALSTAFF), a transport wing
spectrum (TWIST), or a Gaussianrandom (tension/compression)
spectrum. The predictions were
made using a crack-closure modelwith an initial defect size (ai = 0
Hm) that was based on an average
inclusion particle or void size that
initiated cracks. The predictions
agreed well with the test data.(J. C. Newman, Jr., 43487)Structures Directorate
Verification of Fracture
Criterion for Multiple-Site
Damage
Structural integrity of aging
commercial transport airplanes
may be reduced by widespread fa-tigue damage (WFD) (i.e., cracks
developing at several adjacent
locations). The WFD problem is of
concern because residual strengthof a structure with a long lead
crack may be greatly reduced by
the existence of adjacent smaller
cracks. Tests conducted by theFederal Aviation Administration
(FAA) on panels with long leadcracks and multiple-site damage
(MSD) are showing that residual
strengths are strongly degraded(as shown in the figure) from
single (lead) crack behavior. Oneof the objectives in the NASA Air-
frame Structural Integrity Program
is to develop the methodology to
predict failure of structures in the
presence of MSD or multiple-
element damage (MED). The
approach is to use a finite-element(FE) analysis with adaptive mesh
50 [- 2024-T3 Clad _ Test (FAA)
h B = 0.04 in. _ FE Analysis (CTOA)
40 _ Yield-zone model
Applied 30stress,
20
10
0
Single MSD 1 MSD 2 MSD 3crack Three Three Five
cracks cracks cracks
Comparison of failure stresses from tests and analyses of multiple-site dam-
age (MSD) crack configuratio_ls.
74

RESEARC}t AND TECHNOLOGY H IGHLIGHTS
Subsonic Aircraft
capabilities and local fracture crite-
ria to predict progressive failure in
complex structures.
The critical crack-tip-openingangle (CTOA) fracture criterion
has been verified for cracks tearingin thin-sheet 2024-T3 aluminum
alloy material. An elastic-plastic
FE analysis has also been success-fully used to model the fracture
process. Typical MSD crack con-
figurations tested had a long leadcrack with a various number ofsmaller MSD cracks near the lead
crack. The simple plastic yield-
zone linkup model greatly under-predicted the failure stresses in the
presence of MSD, but the FE analy-
sis using the CTOA criterion pre-dicted failure stresses that agreedwell with the tests.
(J. C. Newman, Jr., 43487, andD. S. Dawicke)
Structures Directorate
Self-Nulling
Electromagnetic Flaw
Detector
The Self-Nulling Electromagnet-ic Flaw Detector has been deve-
loped for the inspection of con-
ducting materials for fatigue crackdamage. It uses a ferromagnetic
lens placed between concentric
drive and pick-up coils to focus
the flux of the probe. The unique
coil configuration results in a zero,
or null, voltage output whenunflawed material is inspected.
Changes in the path of the eddy-
current flow caused by the pre-sence of flaws in the material
generate a time-varying magnetic
field at the pick-up coil location.
This magnetic field, in turn, pro-duces an electromotive force
01_3 ...........
2 4 6
Lift-Off Distance (mm)
Faligue Crack Signal
In Air Signal
r_ r_- }N-qe'd -b+- "111111
In Adr Probe Response
5 0 _LS ally 2 0 V,,'dlv
Unflawed Matenal Response
Fatigue Crack Response
Flaw detection characteristics. Measurements are taken at 100 kHz with
l-ram-thick A1 6061 sample.
Portable field unit. L-93-07811
across the pick-up coil leads,which is measured with an ac
voltmeter. The first figure displays
the flaw detection capabilities ofthe probe. This figure shows the
relative insensitivity of the probe
to lift-off changes and the large
output of the probe in the presence
of a fatigue crack. The device is
extremely sensitive to fatigue
cracks and small changes in
material thickness caused by
factors such as corrosion damage.
The simplicity of the design ofthe probe greatly reduces instru-
mentation requirements, and theunambiguous flaw signals can
eliminate training time and opera-
tor errors. The device is extremely
portable, and commercialized pro-duction is expected to produce alow-cost instrument. A portable
C_- C_ - 75

fieldunithasbeenconstructed,asdisplayedin thesecondfigure.Thisfigureshowsanoperatorinspectinganairframelap-jointsample.(John Simpson, 44716, Buzz
Wincheski, Min Namkung, JimFulton, Shridhar Nath, Ron
Todhunter, and Jerry Clendenin)Electronics Directorate
Portable Ultrasonic
Instrument for Disbond
and Corrosion
Characterization in
Aircraft
High-frequency mechanicalvibrations, known as ultrasound,
can penetrate into solid materials,interact with the internal structure,
and carry information about thatstructure to a sensor. Langley
researchers have been exploiting
these phenomena to develop
instrumentation for detecting and
characterizing disbonds, corrosion,and cracks in aluminum aircraft
structures. A number of ultrasonic
approaches have been developed(normal-incidence compressional
waves, angled shear waves, and
plate or Lamb waves); these
approaches exercise the stiffness
properties of the material in differ-ent manners, thus allowing theinstrumentation to access varied
information about the material
and exhibit sensitivity to different
flaw types.
Through a combination of phy-
sical analysis and modeling, the
science of the system tells us how
to design the measurement probesand instrumentation. Artificial
neural networks are trained using
both actual measured signals and
Bond
Ultrasonic determination o] bond, disbond, and thinning caused by
corrosion. Neural network :nterpretation hlentifies two bonded regions m
upper and lower ri@t of pro,el, and spectral analysis yiehts thickness of two
electrochemically corroded patches on unbonded skin.
synthesized signals from physical
modeling to provide robust inter-
pretation of a wide range o! possi-
ble conditions. Incorporation of
arrays of multiple sensors canallow more rapid inspection and
provide flexibility for multiple
measurement approaches. Fhiscombination of modern technolo-
gies has great potential for aero-
space and other engineering andindustrial applications.
A portable PC-based inst cumenthas been assembled using commer-
cial board-level components and
manual scanner. The systeJn cur-
rently employs normal-incidenceultrasound, and it uses a trained
software neural network to inter-
pret the no-bond/bond cordition
and spectral analysis to determinethe thickness. The results are
expressed as an image in real time.
Excellent accuracy has beenachieved within the scope of the
network training set. The figureshows the ultrasonic determination
of bond, disbond, and thinning
caused by corrosion in a test
sample. Neural network interpre-tation identifies two bonded
regions in the upper and lower
right of the panel, and spectral
analysis yields the thickness of
two electrochemically corroded
patches on the unbonded skin.(P. H. Johnston, 44966,N. M. Abedin, D. R. Prabhu,and N. Nathan)
Electronics Directorate
76

RESEARCH AND TECHNOLOGY HIGHLIGHTS
Subsonic Aircraft
Original Extent of Lap JointDisbonds
3 m ..............
DisbondsL
i
z:
Bonded Region
Application of thermal bond inspection system to commercial aircraft, which results in ability to image disbonding
between two skins at lap joint.
Thermal Bond Inspection
System for Aircraft
Structural Integrity
The thermal bond inspection
system (TBIS) uses thermal energy
and infrared imaging to character-ize the state of a bonded structure.
A small amount of heat is appliedto the surface of the structure; thetime evolution of the surface tem-
perature is then recorded using an
infrared camera and a digital
image processor. Various methods
of data analysis then can be per-formed to transform the tempera-
ture images into images represen-tative of physical features of the
measured structure. By quantita-
tively analyzing the digitized
images, the TBIS provides great
improvements over simply mea-
suring the surface temperature.This technology has the additional
advantage of being completely
noninvasive, noncontacting, and
geometry insensitive, and rapid,
large-area, archivable imaging ispossible.
This technology, which has
been successfully applied to
characterizing both disbonding
and material loss caused by corro-sion in commercial aircraft skins,
has a strong commercial potential
for application to aging aircraftissues and numerous commercial
applications outside the aerospace
community.(K. Elliott Cramer, 47945)Electronics Directorate
Stress Imaging Via
Differential Thermography
Dynamic stress imaging is a
technology that has application
and impact for a broad range ofcommercial needs. The commercial
uses include stress imaging for
aerospace materials and structures,
industrial equipment and pro-ducts, and civil structures, non-
destructive material damage
77

ALUMINUM PLATEWITH HOLE
1.5 in.
@
1-SECOND ARRAYCAMERA IMAGE
VERTICALUNIAXIAL LOADING
Stress field produced by tensile loading of aluminum plate with circullrhole.
appraisal, and product and materi-
al development. Langley's Non-destructive Evaluation Sciences
Branch has contracted Stress
Photonics of Madison, Wisconsin,in a Phase II Small Business Inno-
vation Research award to proto-
type an infrared camera optimized
for differential thermography,stress imaging, and nondestructiveevaluation.
The prototype instrument relies
on the thermoelastic effect to per-mit direct observation of strains in
materials that are being stressed.The thermoelastic effect produces
small temperature changes when
the structure is elastically loaded
(i.e., a stress of 60 psi in aluminum
produces 0.001°C temperature
change). The technique imagesthese small temperature changes
with an infrared focal plan,_' array
(FPA) and sophisticated di.,_ital
signal processing. The systemproduces an image of near-surface
stresses by rapidly sampling the
FPA and statistically correl:_ting
pixel data to the loading ir£:posed
on t,he target structure. Recent im-
provements in digital sampling,
signal processing, and infrared de-
tector array fabrication are com-bined into the portable, high-speed
imager. The camera is cap_ble of
imaging the dynamic stresses in astructure in as little as 1 sec. The
figure represents the stress field
produced by tensile loading of an
aluminum plate with a circularhole.
(K. Elliott Cramer, 47945)Electronics Directorate
Tilt-Rotor Fountain Flow
Noise
Studies have indicated that a
civil tilt-rotor aircraft is a possible
solution to the air capacity pro-blem in the U.S., and it has a strong
market potential by the year 2000.However, the reduction of noise
levels in a vertiport environment
can be a critical enabling technolo-
gy for its development. Hoverflight operations present the com-
munity with very severe noise
signatures. The most dominantnoise mechanism for the tilt rotor
is a phenomenon called "fountaineffect." Fountain-effect noise is
generated when the rotors passthrough the turbulent fountainflow created as the rotor down-
wash impacts the wing and is
recirculated through the rotorsover the inboard portion of the
wing.
Langley and Ames Research
Centers conducted a joint programof acoustic hover tests on the
XV-15 tilt-rotor research aircraft.
The flight experiment consisted of
hovering the aircraft over a 500-ft-
radius semicircular array of 12
ground plane microphones. Each
flight condition was repeated for
two reciprocal aircraft headings toprovide a full 360 ° acoustic
coverage. The figure presentsA-weighted overall sound pressure
78

RESEARCH AND TECHNOLOGY HIGHLIGHTS
Subsonic Aircraft
_=180 _
• =270:9 _=90 °
_=0 °
Rotor Tip Speed
645 fps
................. 677 fps
............. 708 fps
....... 740 fps
-- 771 fps
A-weighted overall sound pressure levels.
levels as a function of directivityangle for the 5 rotor tip speedstested. Because of the aft direction-
ality characteristics of "fountain
effect" noise, A-weighted overall
sound pressure levels measuredaft of the aircraft (hu = 0°) were
approximately 10 dB higher thanthe levels measured forward of the
aircraft (h° = 180°). In addition,
there is only a very weak correla-
tion of noise level with rotor tip
speed. (Noise levels typically
decrease with decreasing rotor tipspeed.) With improved under-
standing, it will be possible to
model aerodynamically derived
improvements to evaluate their
noise reduction potential.(David Conner, 45276, Ken
Rufledge, and Mike Marcolini)Structures Directorate
79

RESEARCH AND
TECHNOLOGY
High-Speed Civil Transport
Resolve the critical
environmental issue_ and
provide the technolos y base for
fi#ure high-speed air
transportation

RESEARCH AND TECHNOLOGY HIGHLIGHTS
High-Speed Civil Transport
Supersonic Laminar Flow
Control Swept Cylindrical
Model
A cylindrical model was
designed and fabricated for super-sonic laminar flow control research
that had adopted an unconvention-al approach to solve the challenging
design criteria. The model was to
have microperforated skin throughwhich a nonuniform controlled
level of suction would be applied.The variation in suction was pro-
vided by nine axial plenums under
the porous skin, and each was con-
trolled by metering holes through
three primary plenums. The suc-
tion surface of the cylinder extend-ed through 180 ° of circumference.
Flow passages were designed to
meet suction requirements by
careful sizing of tile perforated
skin and the metering-hole dia-meters.
Multistaged electroforming wasan approach employed in specific
rocket-motor designs in the 1960's
and appeared promising for this
application. A machined core of
high-strength stainless steel wasfilled with a conductive wax con-
taining a fine dispersion of silver.
Upon this filled core, electrodepos-
ited nickel was applied and post-
machined into nine axial plenums
and drilled for metering holes intothe three main chambers. Another
layer of wax was laid, and the final
skin of nickel was depositedaround the entire circumference of
the model. This layer was groundto a surface finish of 4 RMS. The
model was then laser drilled to mi-
croperforate the outer skin and
immersed in a hot-vapor degreas-
ing bath to remove plating wax
SECOND ELECTROF((0.020 THICK)
STEELCORE
LASER DRILLEDHOLES 0.003 DIA
FIRST ELECTROFORM(0.120 THICK)
Supersonic swept cylimtrical model. (Dimensions in inches.)
from the plenums. The model was
completed by attaching connecting
tubes to the base of the cylinder
and through the support fixturefor testing at the Supersonic Low-
Disturbance Tunnel, building
1247D. The key fabrication ele-
ments of postmachining of electro-
deposited nickel and wax removal
were validated using trial speci-mens to identify potential diffic-
ulties. The model skin was perfo-rated with 0.003-in-diameter holes
whose shape and spacing wereclosely machined to meet the tight
tolerances of the research objec-
tives. Laser drilling samples using
electrodeposited nickel weresolicited from several vendors,
and the best sample was selected.The final research article success-
fully validated a multistaged
electroforming technique and has
permitted design and fabrication
of a more complex two-dimensional
swept-wing model for relatedresearch.
(William M. Kimmel, 47136)
Systems Engineering and
Operations Directorate
Determination of Flow
Quality in Unitary PlanWind Tunnel
The effect of wind-tunnel flow
quality on viscous flow characteris-tics, such as boundary-layer transi-
tion location, can have a significant
impact on the aerodynamic perfor-
81

AEDC lO-degree transition cone mounted in Unitary Plan WindTunnel. L-91-14593
mance of slender supersonic con-
figurations (e.g., the High-Speed
Civil Transport). The ArnoldEngineering and Development
Center (AEDC) 10-degree transi-
tion cone has been tested in flightand in numerous wind tunnels
around the world. The model
provides a common reference to
cc,mpare tunnel flow qualitybetween facilities and was last
tested in the Unitary Plan WindTunnel (UPWT) in 1974.
The AEDC 10-degree transitioncone was tested in both UPWT test
sections to determine any changes
in cone transition Reynolds num-
ber that resulted from changes in
tunnel flow quality since 1974. Inaddition, the tunnel free-stream
turbulence levels were determined.
Cone transition Reynolds numberswere obtained from transition
location measurements by using
boundary-layer pitot and hot-wire
probes that translated longih idinal-ly on the cone surface. Free-_treamturbulence levels were mea_,ured
by using a dynamic pitot-pressuretransducer and a three-wire hot-
wire probe. Static and unsteadydata were obtained at Mach num-
bers from 1.6 to 4.6 over a Re Jnolds
number range of 1.0 x 10" to
5.0 x 10" per foot. The results indi-
cate a reduction of up to 28 Fercent
in cone transition Reynolds mm-ber relative to the results obtainedin 1974. This decrease in trm_sition
Reynolds number indicates l hat ei-ther the tunnel turbulence levels
have increased, the model g_,o-
metry has been altered, or tr msi-
tion location was interpretecdifferently since the 1974 test. In
addition, the steady-state transition
location indicated from pitot-probe
results occurred significantlydownstream of the location deter-
mined by the hot-wire probe. Thisdatabase will'provide information
necessary to assess the effectivenessof future tunnel improvements.
(Jeffrey D. Flamm, 45955, Peter F.
Covell, and Gregory S. Jones)Aeronautics Directorate
Supersonic Wind-TunnelTests of Reference H
Configuration
The Reference H high-speed
civil transport (HSCT) configura-tion has been established as the
baseline geometry for High-SpeedResearch (HSR) Program studies.
This configuration was originally
developed by the Boeing Aircraft
Company and is representative ofcurrent state-of-the-art HSCT tech-
nology. Numerous experimentalstudies are being conducted to
provide information necessary for
design, code, and facility/test-
technique verification. In addition,the Reference H will serve as a
basis for evaluating aerodynamictechnologies such as advanced
wing and propulsion integration
design methodologies.
Wind-tunnel tests were con-
ducted in the Langley UnitaryPlan Wind Tunnel on a 1.675-
percent scale model of the
Reference H configuration at Mach
numbers ranging from 1.65 to 2.7.
The objective of these studies was
to determine the supersonic aero-dynamic characteristics of the
Reference H configuration andevaluate various nacelle diverter
geometries. Because of the sensi-
tivity of HSCT performance to
drag, studies of the repeatability
accuracy of the test measurements
and detailed boundary-layer tripdrag were also conducted. Force-
82

Thistestprovidedtilefirstextensivelow-speeddatasetfortheIndustryReferenceConfigura-tion. Thedatathatwereobtainedarebeingusedtoevaluatethisconfigurationandtoidentifyareasthatrequireadditionaltesting.Thedataarealsobeingusedinflightsimulationtodevelopadvancedtakeoffproceduresaimedatreducingthenoiseneartheairport.(GuyT.Kemmerly,45070)AeronauticsDirectorate
F-16XL High-Lift Flight
Experiments
As part of a research program
to reduce the risk of high-lift meth-
ods and concepts developed to
improve performance of the high-
speed civil transport, flight experi-ments are being conducted on an
F-16XL aircraft. The objectives are
to obtain detailed flow physics
and performance measurementson the basic aircraft as well as a
6-percent HSCT model mounted in Lan_h'y 14- by 22-Foot Subso_licTumtel. L-93-04908
high-lift configuration. To opti-mize the flight instrumentation,several wind-tunnel and water-
tunnel experiments have beenconducted. The first test was
conducted in the Langley Basic
Aerodynamics Research Tunnel
(BART) on a 4-percent scale modelof the F-16XL. The primary
objective of these tests was toobtain basic flow-field measure-
ments using surface and off-surfaceflow visualization. A titanium-
dioxide and kerosene mixture was
used to determine the streamlines
on the upper surface of the wing,
while an upstream smoker and
variable laser light sheet were used
to visualize the vortex patterns inthe flow field around the aircraft
model. The tests were conducted
at a dynamic pressure of 5 lb/ft 2,
which yielded a unit Reynolds
number of 400 000 per ft. Results
showed a strong primary vorticalflow field on the aircraft as well as
secondary and crank vortices over
the range of angle of attack (8 '_:to20 °) of interest.
A second test was conducted in
the Langley 16- by 24-Inch Water
Tunnel using a 2.5-percent scale
model and colored-dye injection
for visualization of the wing vor-tices. The objective of these tests
was to provide information on
where to locate smoker exit ports
on the flight vehicle. The model
was tested at a speed of 0.25 ft/sec,a unit Reynolds number of 23 000
per ft, and a range of angle of
attack of 5 ° to 20 °. Several dye-
injection ports were distributed
along the fuselage and wing
leading edge. The figure shows
the vortex patterns at an angle ofattack of 10°. Much of the dye
from the fuselage and forward
wing ports has entrained in the
primary vortex. Ports farther
92

RESEARCttANDTECHN[LOGYHIGHI_IGDITS
High-Speed Civil Transport
High-Speed Civil
Transport Planform Tests
A series of flat-plate planform
models were tested in the Langley
14- by 22-Foot Subsonic Tunnel todetermine the effect of planform
variations on promising high-
speed civil transport technologies.
These models vary in inboard
leading-edge sweep from 68 ° to74 ° and in outboard leading-edge
sweep from 48 ° to 60 °. A set of
leading-edge w}rtex flaps were de-
signed for the various planformsusing a vortex-lattice design
method. Although the vortex flap
did not perform in the optimalmanner with the vortex flow
reattaching along the hinge line,the test results indicate that their
effectiveness was only slightly
influenced by leading-edge sweep
for the range tested. It was also
flmnd that large increases in liftover drag were obtained when an
attached-flow leading-edge flap
was installed on the outer panel.
Although the flap did not corn-pletely eliminate leading-edge
separation on the outer panel,attached flow could be achieved
by slotting the attact3ed-flow flap.
Euler solutions oi3 unstructured
grids have been obtained for the
planform models with deflected
leading-edge vortex flaps and
trailing-edge flaps. The grids were
generated using an unstructuredgrid generator, VGRID3D, and c:ll-
culations were obtained by using
the unstructured grid Euler solver,
USM3D. A typical surface-grid
pattern and corresponding Eulersolutions are shown in the figure.
Initial comparisons between the
computational and experimentalresults indicate reasonable correia-
tion between the two near the
design angle of attack but poorcorrelation at low angles of attack.
Much of this discrepancy is
HSR phmh;rm study (USM3D). 68/48 plan form with 6_,!= 30.0 °,
_r = 15.0°, Math = 0.22, and ¢_= 12.0 °.
because the Euler code overpredicts
the expansion of the flow at the
beveled trailing edge of the con-
figurations. Although Eulersolvers cannot model the secon-
dary vortices that are typically
present on these configurations,
good agreement was obtained for
the location of the primary vortexreattachment line.
(Kevin J. Kjerstad, 45022)Aeronautics Directorate
Low-Speed Tests of High-
Speed Civil Transport
In an effort to generate a high-quality data set of the low-speed
stability-and-control and ground-
effect characteristics of the High-
Speed Civil Transport (HSCT)Program's Industry Reference
Configuration, a 6-percent scale
model of the configuration was
tested in the Langley 14- by 22-FootSubsonic Tunnel. The model was
configured with various leading-and trailing-edge high-lift systems.
The primary customers of the
results are the aircraft companies
that work in the program and the
NASA research team that compilesthe simulator database.
The model was mounted on a
blade-type support strut that was
designed to enter the fuselagefrom both above and below. As
shown in the figure, the modelwas first assembled with the blade
penetrating the belly of the model.
In this configuration, stability and
control testing occurred with mini-mal interference to the flow into
the vertical tail. To allow for
ground-effect testing, the support
was then inverted and penetrated
the model from the top, justforward of the vertical tail.
91

distortedbypropagationthroughtheatmosphere.Thestudyinclud-edidealizedN-wavesandsigna-turesrepresentingseveraldistinctmeasuredboomshapes.Thesewere:N-waves,peakedwaves,rounded waves, and U-shapedwaves. Examples of measured
N-waves, peaked waves, and
U-shaped waves are shown on the
right of the figure. Results aresummarized on the left of the
figure and show the linear regres-
sion lines relating the subjects'
scores (the logarithm of the geo-metric means) to PL for each boom
shape. The tight grouping of theregression lines indicates that no
differences in subjective responses,
for a given PL value, were obser-
ved. Thus, PL successfullyaccounted for loudness effects of
both measured and idealized
booms. This confirmed the pre-vious recommendation of I'L as
the metric of choice for predicting
loudness and/or annoyance ofsonic booms.
(Jack D. Leatherwood, 43591, andBrenda M. Sullivan}Structures Directorate
Absorption Theory
Improves Prediction of
Sonic-Boom Rise Time
A goal of the NASA High-Speed
Research I}rogram is supersonic
overland flight. A major stepping-stone to that goal is understanding
the role played by the atmospherein the distortion of the sonic-boom
waveform. In general, the sonic-
boom waveform has the shape of a
letter N; that is, the pressure first
rises, quite rapidly, from ambient
atmospheric pressure to a peak
value. This rapid rise is followed
Rise time
(sec)
10 °
10"
10""
10 -_
10 .4
10 -5
10 -_10 _
EMPIRICAl, MODEL
• _ FLYOVER DATA
MOLECULAR • "_..•
ABSORPTION g" _,...__
THEORY _
ASSIC PREDICTION
10' 10: 10 _
Shock overpressure (Pa)
Prediction of sonic-boom rise' time.
by a decrease in pressure to a value
nearly as much below ambient asthe initial rise was above ambient.
This decrease in pressure occurson a time scale that is on the order
of several thousand times that of
the initial pressure rise. Finally,
the pressure is returned to ambient
through another rapid pressure
increase. The time span requiredfor the initial pressure increase isreferred to as the rise time, and
this parameter is an important
measure of the annoyance of the
sonic-boom waveform. Ideally,this initial pressure rise should
occur over as long a period of time
as possible. However, the factors
determining this rise time are not
all at the disposal of the aircraft
designer. The rise time is deter-
mined primarily by the totalincrease in pressure across theshock front. This increase is
governed by the aircraft weight,
Mach number, and shape, and abalance between the nonlinear
propagation effects and the dis-
sipation of the atmosphere. The
tools initially available for predic-tion of sonic-boom rise time were
based on nonlinear propagation ofviscous and heat-conduction
losses, plus an empirical fit to mea-
sured rise times. These two pre-dictions are given in the figure,
and they differ by several ordersof magnitude. In an attempt to im-
prove the prediction of rise time, a
model was developed that incor-
porated absorption due to molecu-lar relaxation effects of the various
gases in the air. The predicted rise
time of this improved model is
displayed in the figure, and there
is much better agreement than that
obtained with the classical-theory
prediction model.(Gerry McAninch, 45269)Structures Directorate
90
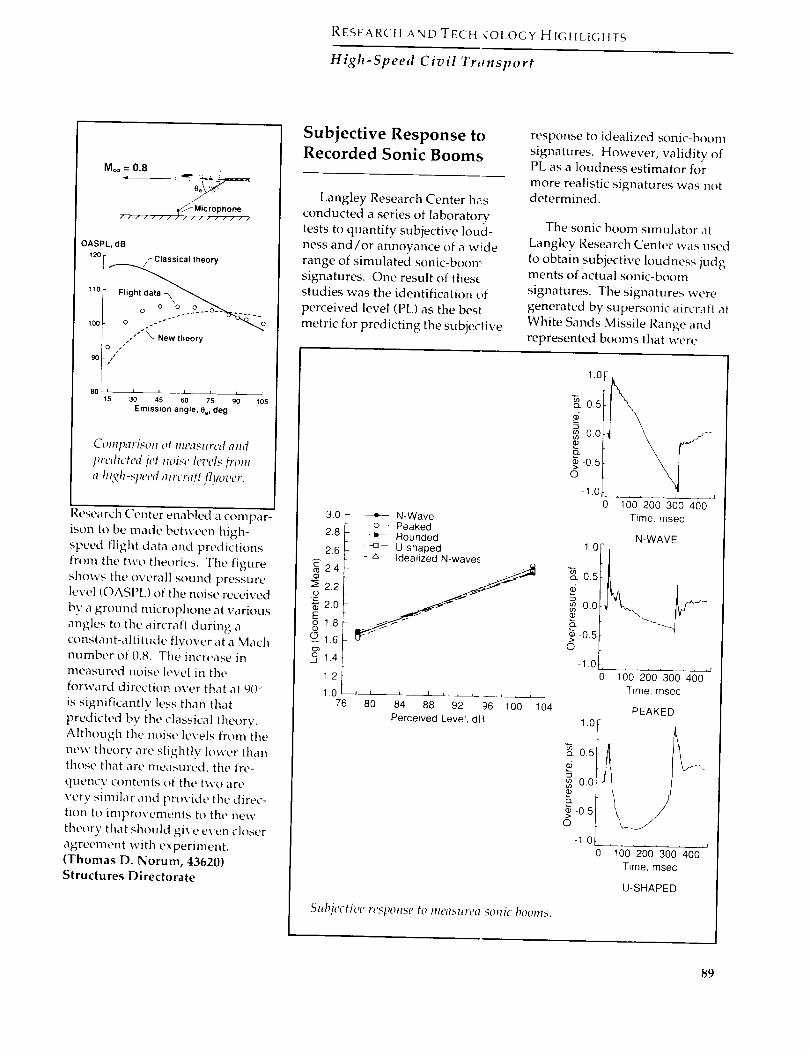
RESEARCtt ANDTECH qOLOGY HIGHLIGHTS
High-Speed Civil Transport
Moo= 0.8
/
Microphone/i/////.f///#i//i
OASPL, dB
120 - /- Classical theory
110
0 0 0
/''_- New theory
,/t
90 -/"
80 - I _ I L I I I15 30 45 60 75 90 105
Emission angle, Oe, deg
Co??lpariso?? of ???Pasllrcd a?ld
predicted jet noise h,vels from
a tzixh-speed airtra.ft f[llOz,er.
Research Center enabled a compar-
ison to be made between high-
speed flight data and predictions
from the two theories. The figure
shows the overall sound pressure
level {OASPL) ot the noise received
by a ground microphone at various
angles to the aircraft during a
constant-altitude flyover at a Mach
number of (/.8. The increase in
measured noise level in the
R}rward direction over that at 9{Y:
is significantly less than that
predicted bv the classical theory.
Although tl:te noise levels from the
new theory are slightly lower than
those that are measured, the fre-
quency contents of the two are
very similar and provide the direc-
tion to impr{}vements t{} the new
theory that should give even closer
agreement with experiment.
(Thomas D. Norum, 43620}
Structures Directorate
Subjective Response toRecorded Sonic Booms
Langley Research Center has
conducted a series of laboratory
tests to quantify subjective loud-
ness and/or annoyance of a wide
range of simulated sonic-boorr
signatures. One result of thest
studies was the identification of
perceived level (PL) as the besl
metric for predicting the subjective
response to idealized sonic-boom
signatures. However, validity of
PL as a loudness estimator for
more realistic signatures was not
determined.
The sonic boom simulator at
Langley Research Center was used
to obtain subjective loudness judg-
ments of actual sonic-boom
signatures. The signatures were
generated by supersonic aircraft at
White Sands Missile Range and
represented booms that were
30I2.8
2.6
2.4
2.2.o_2.0
1.8
_.6
3 1.4
1.2
1076
N-Wave-o - Peaked. i--- Rounded43- U-shaped
-_,_ Idealized N-wave_
80 84 88 92 _6 100 104
Percewed Level, dB
Subjective response to measured sonic booms.
1.0
0.5
0.0P
-0.5o
-1.0
1.0
_0.5
o.o
>_-o5o
-1 o0
.......... J
100 200 300 400
Time, msec
N-WAVE
'16o'26o'36o'46o"Time, msec
PEAKED
0.5
oa
O0m
•>-o.5o
-I 0 .......... i0 100 200 300 400
Time, msec
U-SHAPED
89

q)ID
ID
Coordinate System
Mj = 0.832, To = 894°F, Vj = 1400 ft/sec., CASE 5, St = 3.83290 Relative
1,,3 Oct B L
(dB)
7Oi _ -1L4 -2
--4 -a
i 4_ -5
50 _--1-6
10
-1130 -12.13
14
15
16
10 .17-18
L
60 80 100 120 140 160
,,u, Degrees
Relative acoustic levels in dB between fottr in-line e_tlim's and four
equivalent mmintemcting.l'ets. (Original qf lower fiik,urc i_l color; coHtact
art thor fi_r more information.)
9lanform configuration as thebaseline, four nozzles were located
in 13 alternate configurations to
assess the importance of engine
horizontal and vertical stagger,
engine spacing, and outboard
engine power setting on observed
ground-based noise. The tests
were designed to study the influ-
ence of shielding by using five jetexhaust velocities between 1000
and 1600 ft/sec at subsonic jetexhaust Mach numbers. These
conditions are expected at the exit
of a fully mixed HSCT-type ejectornozzle. One example of the results
of this study is shown in the figure
for the jet exhaust velocity of 1400ft/sec. Relative acoustic levels,
determined by the difference
between four nozzles at equal
power settings with a spacing of2.5 jet exit diameters and no hori-
zontal or vertical stagger from that
of four equivalent noninteracting
jets of equal power, are shown on
a contour map in the figure. The
angle Q is the azimuthal direction;
¢ = 0° is the sideline. The angle
is the longitudinal direction;
= 0° is the engine inlet axis. Thedata are compared with thoselevels associated with the acoustic
frequency that is expected to be
most important to the ground-
based observer in the perceivednoise-level metric. As can be seen
from the contour levels, significantreduction of noise can be achieved
with this engine-airframe integra-
tion scheme. The most significant
noise shielding is observed with
25 ° vertical stagger, where the out-board engine plume, operating
with 10-percent power reduction,
directly blocks noise radiation
from inboard engines that are
operating with a 10-percentincrease in power setting.
(John M. Seiner, 46276, Bernard J.
Jansen, and Michael K. Ponton)Structures Directorate
Flight Effects on Jet Shock
Noise
The dominant forward-
propagating noise from the High-
Speed Civil Transport during its
climb to cruise is projected to bethe broadband shock noise that is
produced by its supersonic exhaustjets. Classical acoustics theory
predicts this noise to increase
dramatically as the aircraft acceler-
ates to high subsonic speed.
A newly developed theory ofbroadband shock noise predicts
trends in flight that are radically,different from those of the classical
theory. Acoustic flyover measure-ments of an F-18A aircraft obtained
during the 1991 climb-to-cruise ex-
periments at NASA Dryden Flight
88

RESEARCHANDTECtNOLOGY1-11GtILIGHTS
High-Speed Civil Transport
Lan_h'y Jet-Noise Laboratory 1/lOth-scah' hi_h-tempcraturv commular s qwrscmic jet nozzle with micromanipulators
in primary stream. L-93-1917
A novel approach to reducingnoise through enhanced superson-
ic turbulent mixing was examined
in the Langley Jet-Noise Laboratory
(JNL) by using small turbulence-generating devices that would
have a minimum impact on pro-
pulsion performance. These devic-
es, termed micromanipulators, are
designed to introduce small-scale
vorticity at the nozzle-exit lip at
angles to the jet axis from stream-wise to transverse. The injected
vorticity, often introduced in
counter-rotating pairs, is designedto have a scale (i.e., size) that
matches the most highly amplifiedturbulent structure of the unforced
jet mixing layer. Impressive noise
reduction was observed with, me
class of micromanipulator, the.
wedge-shaped tab. Evaluation of
this device was accomplished by
operating the l /10th-scale coa mu-lar jet nozzle shown in the figl_re
over the entire engine-cycle
operating line. In a subsequer t
study at Boeing, with a simila_
nozzle designed and construcled
by NASA Langley, this device also
showed good noise reduction ' vith
minimum impact on nozzle
performance.(John M. Seiner, 46276,Michael K. Ponton, and
Henry H. Haskin)Structures Directorate
Noise Reduction Through
Acoustic Shielding by
Multiple Jet Arrays
Research was conducted using
multiple jet nozzle arrays to deter-mine how to best take advantageof the reduction of observed
ground-based noise through
jet-by-jet shielding. Jet acoustic
shielding is expected to providenoise benefit due to refraction or
absorption of sound waves from
one jet by a nearby jet or by interac-
tion of the jet flow fields. Using
the Boeing standard HSCT (high-speed civil transport) engine
87

10-3
10-5
Error
10-7
Method
O-I FDA--- FV-TR1:3- -- FV-PR
Convergence on C 1 grid
P/ /D
//
- .a/4-----4.98 (observed order)
10 -9 3" I
10-3 A._- 10 -2
Relative cost (estimated 3D)CPU Storage
1.0 1.03.5 4.0-- 4.0
Convergence on C6 grid
ErrorY304,"f Jj10-7 .
1-'. /_,I_ 4.6910-9 1_3"
10 -3 &r 10-2
Grid-refinement study for fourth-order ENO schemes.
are relevant to problems in aero-
acoustics and high-speed noiseresearch. This work is performedin collaboration with Professor
S'hu of Brown University and Dr.
Casper of ViGYAN, Inc.
The finite-difference method
and two forms of the finite-volume
method were tested on simple
problems that isolated weaknesses.These weaknesses include gridsthat have a low order of smooth-
ness, boundary contours that arenot smooth, and flow discontinuities
that are not aligned with the grid.
Although the numerical test casesinvolved one- or two-dimensional
cases, the cost assessments have
been estimated where possible for
three-dimensional computations.
All methods tested were accu-
rate for smooth problems and freeof oscillations near shocks and
geometric discontinuities as
expected. The finite-volume
approach using a physical recon-struction (FV-PR) was the least
sensitive to irregularities in the
grid. However, this approach is
prohibitively expensive whenextended to three dimensions. A
less expensive version of the finite-volume method, which uses atransformational reconstruction
(FV-TR), was more sensitive to
grid irregularities than FV-PR andless robust than either the finite-
difference or FV-PR methods. The
method failed entirely for a case in
which the grid contained large dis-continuities in the second deriva-
tives. However, for grids with
mild irregularities, the FV-TR
method performed better than thefinite-difference method in the
sense of formal order properties.
The finite-difference (FD) approachis the most cost-effective method;
this method required only one-third to one-fourth of the computa-tion time of FV-TR (the cost of
FV-PR could not be reliably pre-
dicted). Although the finite-difference method was robust, its
formal order property was moresensitive to the smoothness of the
problem than either of the finite-volume methods. The figure illus-
trates the convergence properties
just described for grids with con-tinuity of the first derivatives (C 1)
and with continuity of the sixthderivatives (C_).
Current comparisons indicate
that practical ENO-based high-order methods do well for smooth
problems that contain isolatedshocks but may not be suitable for
problems that cannot be represent-
ed on a smooth grid. Further work
is needed to improve the efficiencyof schemes such as the FV-PR or to
improve the accuracy and general-
ity of the finite-difference method.(Harold Atkins, 42308)
Aeronautics Directorate
Application of
Micromanipulators
for Suppression of
Supersonic Jet Noise
For high-temperature superson-
ic jets, typical of those being inves-
tigated under the NASA High-
Speed Research Program, the
principal source of noise is asso-ciated with jet turbulent plume
structures that convect super-
sonically relative to the ambient
sound speed. This noise is termededdy Mach wave emission. Reduc-tion of this noise can be accom-
plished by minimizing the regionof flow where turbulence is con-
vected with these supersonic
speeds. To achieve lower convec-
tion speeds requires application ofa method that would enhance the
mixing of the supersonic jet flowwith ambient air or often a coflow-
ing subsonic airstream.
86

RESEARCHANDTECHNt)LOGYHIGHLIGHTS
High-Speed Civil Tra_sport
study of the aerodynamic, structur-al, and packaging issues concern-
ing the part-span NLF HSCT
concept.(Henri D. Fuhrmann, 45254)Aeronautics Directorate
Automated Surface-
Geometry Definition for
a Complete High-Speed
Civil Transport
The design and optimization of
an aerospace vehicle using nonlin-
ear Computational Fluid Dynamics(CFD) codes (Euler or Navier-
Stokes) require the ability to gener-ate smooth surface definitions and
volume grids automatically as thedesign variables are changed from
a baseline configuration. At thepresent time this process is time-
consuming and is generally done
interactively. The objective of the
present work was to develop, for a
complete high-speed civil trans-port (HSCT) class vehicle, an au:o-
mated surface-geometry definitionthat is suitable for nonlinear CFD
computations. The automated
surface-geometry tool described
herein is a prerequisite for imbed-
ding an automated geometry/grid
module in a design and optimiza-tion system for an HSCT.
The process starts with the
Harris wave-drag geometry for-mat, which is a familiar basic
geometry description employed inpreliminary design. Semianalyt cmethods are used to resolve the
surface-to-surface intersections.
The surface-geometry redefinition
Four views of automated surface-geometry definition for a high-speedcivil transport class vehicle.
tools have been applied to super-
sonic transport configurations thatconsist of a wing, a fuselage, a hor-
izontal tail, a vertical tail, a canard,
a pylon, and a nacelle. The figure
illustrates the complexity of theconfiguration that can now be
handled. It shows bottom and topperspectives of the vehicle as well
as close-up views of the wing-
pylon-nacelle and the aft portion
of the vehicle. Options that havebeen demonstrated include the
insertion of fillets and adjustmentof the fuselage area to maintain the
original wave drag of the vehicle.
The output surface-geometrydefinition is available in PLOT3D
and Hess formats. The proceduresrun comfortably on workstations.
Related efforts are underway tolink this module with automated
procedures for changing the geom-etry as design variables are
changed and for generating a
multiblock CFD grid.
(Raymond L. Barger, 42315, andMary S. Adams)Aeronautics Directorate
Assessment of High-Order-
Accurate, Essentially
Nonoscillatory Schemes
Numerical simulations in the
fields of aeroacoustics and high-speed noise research demand a
high degree of accuracy, but the
capabilities to treat general geome-tries, capture shocks, and minimize
costs are also important. To meet
these requirements, the essentially
nonoscillatory (ENO) approachhas been implemented with bothfinite-difference and finite-volume
interpretations. The purpose of
this work is to compare the two
approaches by using test cases that
85

the ease of changing fin angles,
data can be obtained over a rangeof fin-deflection combinations that
would be impractical if manual
fin-angle changes were required.
The actual aerodynamic surfaceof the test model can be made of a
thin shell that fits around the
joined modular componentsshown in the figure. The system
has been successfully used in two
wind-tunnel tests recently con-
ducted in the UPWT. During thesetests, data were measured at rates
that would have been impossiblewith the conventional discrete-
fin-block-setting technique.
This model system was jointly
funded by LaRC and several
Department of Defense agencies.The versatility of the system allows
it to be used for both point-design
studies, of primary interest to the
Department of Defense, and for
exploration of missile technologyissues, of primary interest to LaRC.
(Jerry M. Allen, 45592)Aeronautics Directorate
Part-Span Natural
Laminar Flow High-Speed
Civil Transport Concept
Current high-speed civil trans-
port (HSCT) research includes theapplication of supersonic laminarflow to otherwise turbulent flow
wings via active laminar flow con-trol (LFC) devices. This method
significantly reduces skin-frictiondrag but not without additional
complexity and cost. Another
method of obtaining laminar flow
supersonic drag reduction is that
of supersonic natural laminar flow(NLF). NLF, unlike LFC, uses no
1ooArrow-Wing
i
0.95
TOGW.LFWI.G
TOGWARROWW_NG
0.90
0.85
0.80" ' ' '0
Laminar Flow Outer Panel"
M =2.0
I _ J _ _ I _ J , _ I 6
10 20 30x10
Transition Reynolds Number
Supersonic nat u ral lam ina r flow HSCT concept.
active means of boundary-layer
control but rather, through airfoil
geometry, creates a favorable pres-sure gradient that passively serves
to prolong the extent of laminar
flow on the wing. In this way, thebenefits of laminar flow areobtained without the use of the
suction devices that LFC requires.
To investigate the possibleadvantages of NLF for HSCT's, a
study was conducted of a planform
with leading-edge sweeps of 70 °on the inboard section and 20 ° on
the outboard low-sweep portion of
the wing. Reducing the outboard
wing sweep on what is typicallyreferred to as a cranked arrow
wing helps to attenuate the cross-
flow instability, which, in addition
to airfoil geometries tailored for a
favorable pressure gradient,results in increased laminar flow.
Flight experiments in 1958 dem-
onstrated supersonic NLF at a
transition Reynolds number of
9 x 10⁶ on a wing with a leading-
edge sweep of 26 °. Based on this
information and linear stability
theory, the benefits associated
with a range of NLF wetted areas
thought to be attainable on theoutboard wing panel were
examined. The preliminary sizing
and performance results shown in
the figure demonstrate the possi-bility of improved efficiency and
reduced takeoff gross weight
when compared with a more con-ventional HSCT cranked arrow-
wing design. Although somehigh-speed performance penaltiesdo result from the reduction in
wing sweep, overall the NLF
HSCT shows both fuel savings and
structural weight reductions thatresult from supersonic skin-friction
drag reduction, subsonic aero-
dynamic performance, and a more
efficient structural arrangement.
Currently, the Lockheed Aero-
nautical Systems Company is
undertaking a more extensive
84

RESEARCHANDTE( HNOLOGY HIGHLIGHTS
High-Speed Civil Transport
and-moment, pressure, and flow-
visualization (laser vapor screensand mini tufts) data were obtained
in the tests. The results of these
studies have been compared withdata obtained in the Boeing Super-
sonic Wind Tunnel and show very
good agreement.(Gloria Hernandez, 45572,and Peter F. Covell)
Aeronautics Directorate
A Modular, Remotely
Actuated Missile Model
System for Wind-Tunnel
Testing
A new remote-control missile
model system has been developed
and experimentally tested. Thisnew system evolved from an earli-er version that has been used
extensively for missile aerodynam-
ic testing in the NASA Langley
Research Center's (LaRC) UnitaryPlan Wind Tunnel (UPWT) andother facilities. The self-contained
modular components, shown inthe figure, can be assembled in
various ways to form the basis for
the desired test configuration.
When these components are
connected, the resulting strong
back model can be actuated by a
small computer that allows veryrapid positioning of the fin and
model roll angles during testing.
The unique remote-actuation
feature of this system allows up toeight fins to be deflected simultan-
eously. In addition, separate finbalances are used, so that individu-al loads on the fins can be mea-
sured simultaneously with the
overall configuration loads thatare measured by a conventional
internally mounted balance. With
Reference H model installed in Unitary Plan Wind Tunnel.
FIN At3TUATION UNITS
Modular components of r_mote-control missile model.
L-92-6360
L-93-06150
83

RESEARCH AND TECHNOLOGY HIGHLIGHTS
High-Speed Civil Transport
downstream on the wing are
entrained in the secondary vortex.Based on the results from the tests,three exit locations were selected
for the full-scale aircraft. These
simple, low-cost wind-tunnel test
techniques maximize the efficiency
of flight tests by optimizing instru-mentation location.
(Clifford J. Obara, 43941,and Susan J. Rickard)Aeronautics Directorate
Low-Speed Wind-Tunnel
Evaluation of
Pressure-Sensitive Paint
Pressure-sensitive paints (PSP),previously only successful at high-
subsonic, transonic, and superson-
ic speed regimes, were used to de-
tect surface pressures at very low"
speeds in the Basic AerodynamicsResearch Tunnel (BART). The
tests were conducted to explore
the use of PSP's for future applica-
tion to low-speed ground and
flight experiments. PSP's can pro-vide a global quantitative pressure
map over an entire aircraft surface
with no modification to the geo-
metry. Models are typically builtwith hundreds of flush pressure
taps, or large arrays of pressurebelts are installed on the aircraft
wing to obtain the pressure mea-surements. This usually results in
costly models or disturbed flow
fields from the pressure belts.
The tests were conducted at a
tunnel speed of 185 ft/sec, whichresulted in a Mach number of0.165. A PSP team from McDonnell
Douglas Aerospace East used their
patent-pending formula and tech-
niques to make measurements
over a 4-percent scale model of anF-16XL, a 76 ° delta wing, and a 76 °
Vortex patterns on an F-16XL model in Langley 16- by 24-hlch WaterTumlel.
('
13.98t3
- l. 533
-I. 72_'
-I,9211
-2, 113
-2. 307
-2, G93
Pressure distribution on an F-16XL model in the Basic AerodynamicsResearch Tunnel.
93

double delta wing. The figure
shows a false-colored image of the
pressure map over the upper wingof the F-16XL model. Initial results
indicate that pressure differencesgreater than 0.1 psi could be
resolved in atmospheric conditions.
The results showed very good
agreement with flush pressure
taps located on the model surfaces.Maturity of the PSP technique will
significantly enhance the ability to
gather both ground and flight
global pressure-distribution data
through quantitative flow visual-ization.
(Susan J. Rickard, 48474,
Anthony E. Washburn, andClifford J. Obara)Aeronautics Directorate
Piloted Simulation Study
of Airport/Community
Noise
The high-speed civil transport
(HSCT) simulation is part of an
ongoing project designed toaddress critical issues involvingFederal Aviation Administration
(FAA) noise certification and
public/industry acceptance of
HSCT-type aircraft. The configura-tion simulated is the AST-105-1,
which was designed to cruise at a
Mach number of 2.62. Initially
equipped with variable-stream
control engines (VSCE), thesimulation package was modified
to incorporate turbine bypass
engines (TBE), which are candidate
engine cycles for the HSCT. The
Langley-developed aircraft noise
prediction program (ANOPP) esti-
mates resulting ground noise
levels for piloted takeoff trajec-
tories that are performed in theVisual/Motion Simulator (VMS).
Visual/Motion Simulator cockpit and display panel. L-90-13683
The piloted simulation wa,,,
retrieved from NASA Langleyarchives and updated to work
with current system hardware. Asa result, it was available for
research work in a very short peri-od of time.
To date, the piloted sin-ulation
has produced data that de _ine ben-
efits resulting from improved low-
speed high-lift aerodynamic per-formance and advanced takeoff
procedures for reducing tiae
airport/community noise problem.
The High-Speed Researcl _ (HSR)
Program has been activel : work-
ing towards developing aero-dynamic concepts that w_uld
attain levels of performal_ce
simulated in this project. Ad-
vanced takeoff procedurvs that
minimize airport/comm_ mity
noise have been develop_d and in-
volve engine thrust level _under
direct computer control. Combin-
ing improved low-speed high-lift
aerodynamic performance withadvanced operating procedures
reduced the level of jet-engine
noise suppression that was
required by as much as 12 EPNdB(effective perceived noise in
decibels) compared with full-thrust
maximum-performance takeoffs
with baseline aerodynamics.(Louis J. Glaab, 41159, Donald R.
Riley, and Robert A. Golub)Aeronautics Directorate
CFD Inviscid Analysis of
F-16XL Configuration
Recently a comprehensive pro-
gram for using state-of-the-artcomputational fluid dynamic(CFD) methods has been initiated
to aid in the design and analysis ofcomplex aircraft configurations at
94
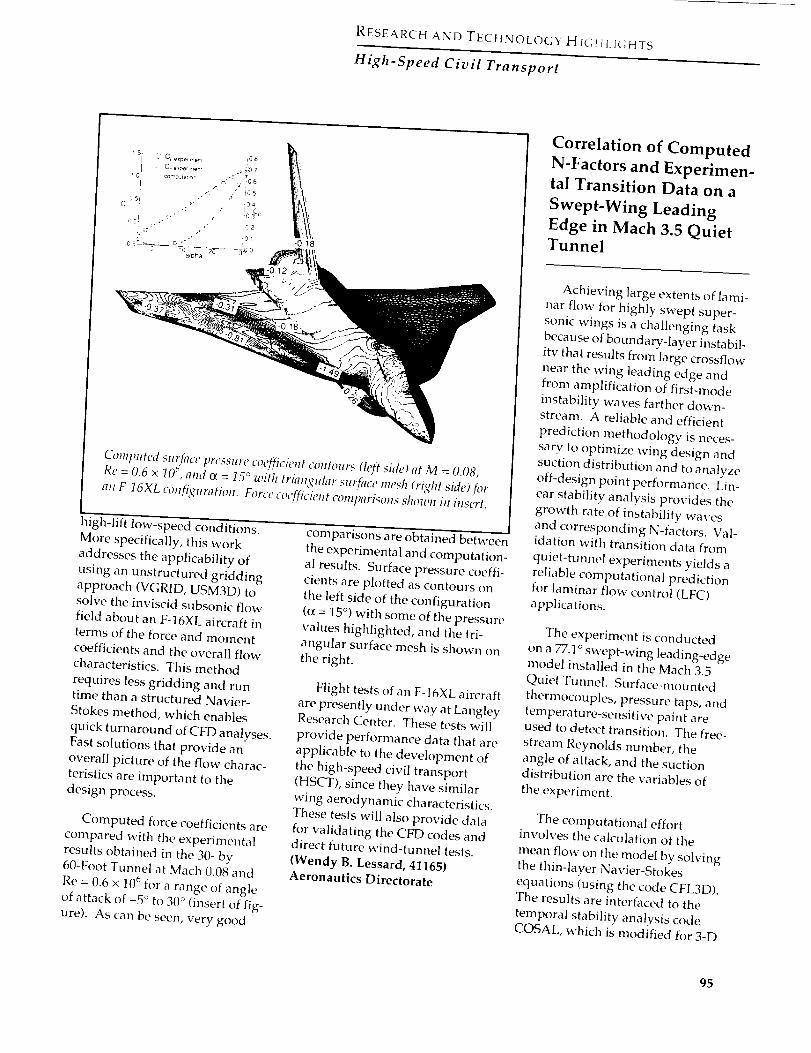
RESEARCH AND TECHNOLOGYHIGIil. I(,ttTS
High-Speed Civil Transport
Computed sut_fiace pressure coefficient contours (h'fl side) at M = 0.(]8,
Re = 0.6 x 10_',and o_= 15 ° with trian_Idar surface mesh (right side)&r
an F-16XL configuration. Force coefficient comparisons shown in insert.
high-lift low-speed conditions.
More specifically, this work
addresses the applicability of
using an unstructured griddingapproach (VGRID, USM3D) tosolve the inviscid subsonic flow
field about an F-16XL aircraft in
terms of the force and moment
coefficients and the overall flow
characteristics. This method
requires less gridding and runtime than a structured Navier-
Stokes method, which enables
quick turnaround of CFD analyses.
Fast solutions that provide anoverall picture of the flow charac-
teristics are important to the
design process.
Computed force coefficients are
compared with the experimental
results obtained in the 30- by60-Foot Tunnel at Mach 0.08 and
Re = 0.6 x 10_ for a range of angle
of attack of -5 ° to 30 ° (insert of fig-
ure). As can be seen, very good
comparisons are obtained between
the experimental and computation-al results. Surface pressure coeffi-
cients are plotted as contours on
the left side of the configuration
(_ = 15 °) with some of the pressurevalues highlighted, and the tri-
angular surface mesh is shown on
the right.
Flight tests of an F-16XL aircraft
are presently under way at LangleyResearch Center. These tests will
provide performance data that are
applicable to the development of
the high-speed civil transport
(HSCT), since they have similar
wing aerodynamic characteristics.These tests will also provide data
for validating the CFD codes anddirect future wind-tunnel tests•
(Wendy B. Lessard, 41165)Aeronautics Directorate
Correlation of Computed
N-Factors and Experimen-
tal Transition Data on a
Swept-Wing Leading
Edge in Mach 3.5 Quiet
Tunnel
Achieving large extents of lami-nar flow for highly swept super-
sonic wings is a challenging task
because of boundary-layer instabil-
ity that results from large crossflow
near the wing leading edge andfrom amplification of first-mode
instability waves farther down-stream. A reliable and efficient
prediction methodology is neces-
sary to optimize wing design and
suction distribution and to analyzeoff-design point performance. Lin-
ear stability analysis provides the
growth rate of instability waves
and corresponding N-factors. Val-idation with transition data from
quiet-tunnel experiments yields areliable computational predictionfor laminar flow control (LFC)
applications.
The experiment is conductedon a 77.1 ° swept-wing leading-edgemodel installed in the Mach 3.5
Quiet Tunnel. Surface-mounted
thermocouples, pressure taps, and
temperature-sensitive paint areused to detect transition. The free-
stream Reynolds number, the
angle of attack, and the suctiondistribution are the variables of
the experiment.
The computational effortinvolves the calculation of the
mean flow on the model by solving
the thin-layer Navier-Stokes
equations (using the code CFL3D).The results are interfaced to the
temporal stability analysis codeCOSAL, which is modified for 3-D
95
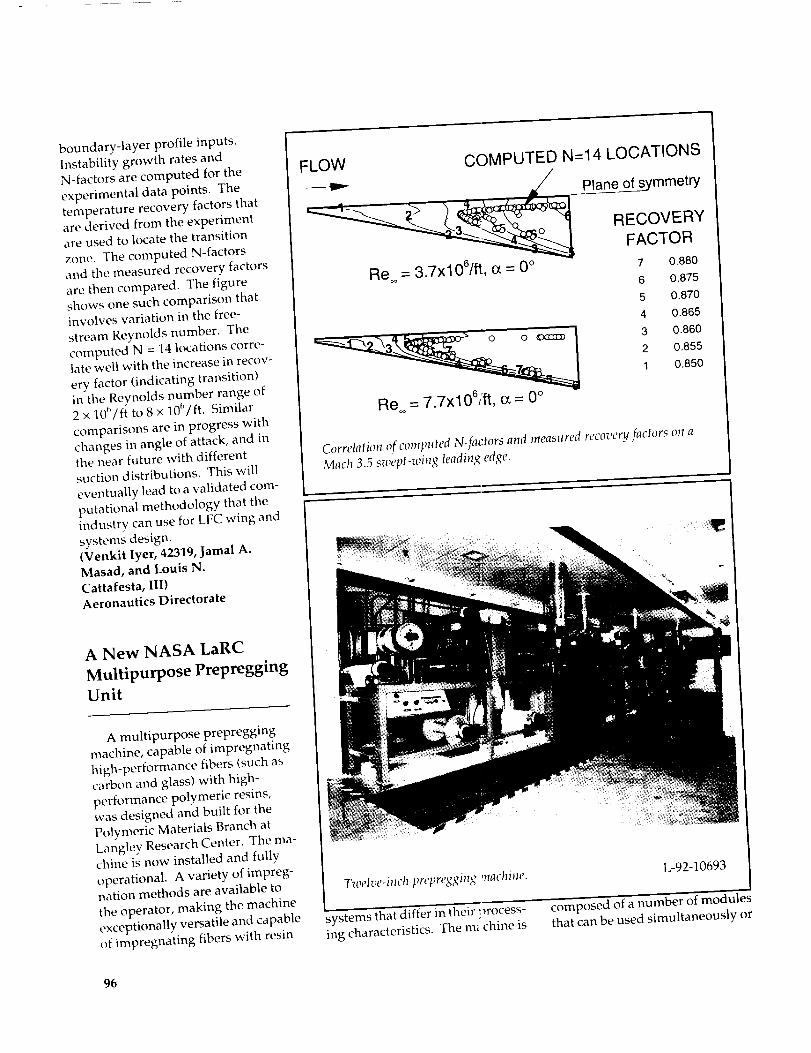
boundary-layer profile inputs.
Instability growth rates andN-factors are computed for the
experimental data points. The
temperature recovery factors that
are derived from the experimentare used to locate the transition
zone. The computed N-factors
and the measured recovery factors
are then compared. The figure
shows one such comparison thatinvolves variation in the free-
stream Reynolds number. Thecomputed N = 14 locations corre-late well with the increase in recov-
ery factor (indicating transition)
in the Reynolds number range of2 x 106/ft to 8 x 10⁶/ft. Similar
comparisons are in progress with
changes in angle of attack, and inthe near future with different
suction distributions. This will
eventually lead to a validated com-putational methodology that the
industry can use for LFC wing and
systems design.(Venkit Iyer, 42319, Jamal A.Masad, and Louis N.
Cattafesta, [II)Aeronautics Directorate
A New NASA LaRC
Multipurpose PrepreggingUnit
A multipurpose prepregging
machine, capable of impregnating
high-performance fibers (such as
carbon and glass) with high-perh)rmance polymeric resins,
was designed and built for the
Polymeric Materials Branch at
Langley Research Center. The ma-chine is now installed and fully
operational. A variety of impreg-nation methods are available to
the operator, making the machineexceptionally versatile and capable
of impregnating fibers with resin
FLOW
Re = 3.7xl 06/it, 0_= 0 °
COMPUTED N=14 LOCATIONS
Plane of symmetry
RECOVERY
FACTOR
Re = 7.7x10⁶/ft, c_= 0 °
7 0.880
6 0.875
5 0.870
4 0.865
3 0.860
2 0.855
1 0.850
Correlation of computed N-factors and measured recovery factors on aMach 3.5 swept-wing leading edge.
Twelve-inch prepregging ,nachine. L-92-10693
systems that differ in their process-
ing characteristics. The m_ chine is
composed of a number of modulesthat can be used simultaneously or
96
RESEARCHANDTECHNOLOGYHIGHLIGHTS
High-Speed Civil Transport
in a variety of combinations. The
fiber creel can hold 144 spools,which ensures that the prepreg
product can be made in widths
that range from 1 to 12 inches. The
impregnation module contains areverse roll coater and a solution
dip tank with metering bars. The
reverse roll coater is used to pre-pare precast films that are thenused to form a sandwich with the
dry-fiber web to make prepreg.
Alternatively, the impregnation
can be performed directly at thecoater gap if the fibers are drawndown between the rollers. The so-
lution dip tank impregnates dry
fibers with resins that have highmelt viscosities but can be dis-
solved into a low-viscosity solu-tion. Subsequent processing mod-
ules include two hot plates, four
nip stations, a high-temperatureoven, and a hot sled roller in the
second hot plate. The nip rollerscan be heated to a maximum tem-
perature of 450°F; the hot platesand oven have a maximum tem-
perature of 800°F. To date, a wide
variety of polymers have been
processed into prepreg material.
Four NASA-developed polymers,LaRC CPI-2, LaRC IAX-10a, LaRC
IAX-20b, and LaRC PETI have
been scaled up and prepregged for
Northrop Aircraft Corporation as
part of the High-Speed Research(HSR) Program.(R. Baucom, 44252, andS. Wilkinson)
Structures Directorate
97

RESEARCH AND
TECHNOLOGY
High-PerformanceMilitary Aircraft
Provide technohNy o, _tions for
revolutionalq/ new capabilities in
filture high-pelforma,lce militm3/
aircraft
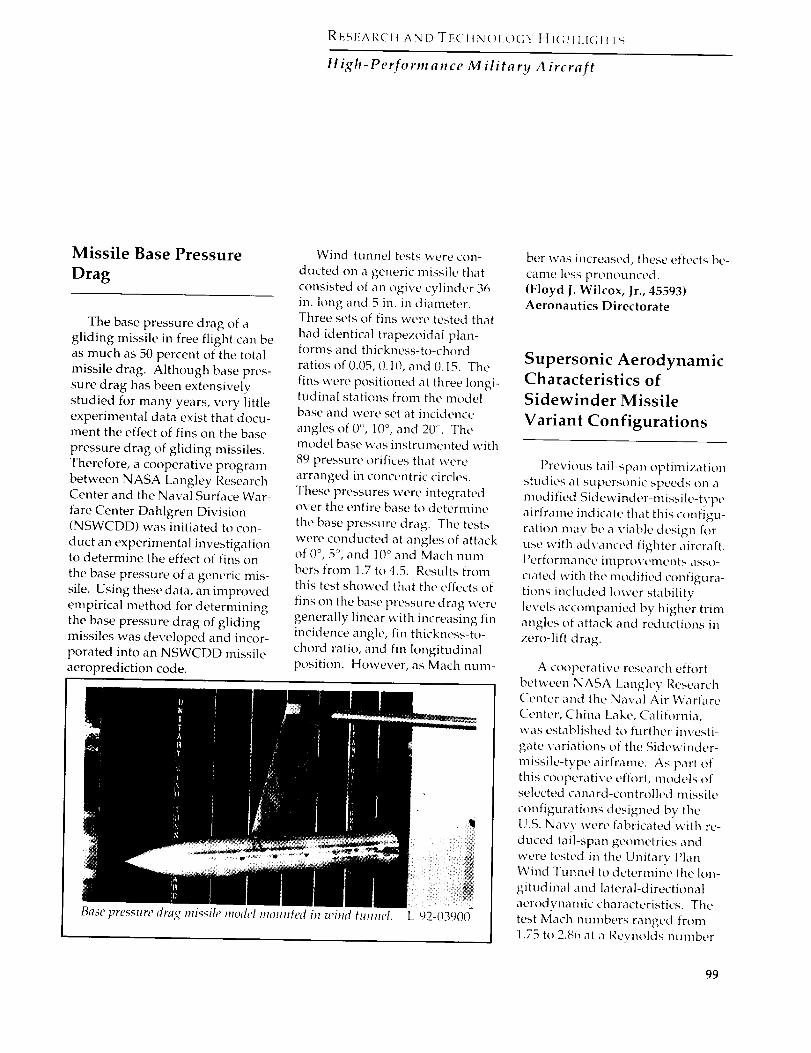
RESEARCH AND TECHN(31,OGY H I(;tt I_I(;tITS
High-Perform ance M ilita ry A ircraft
Missile Base Pressure
Drag
The base pressure drag of a
gliding missile in free flight can be
as much as 50 percent of the total
missile drag. Although base pres-
sure drag has been extensively
studied for many years, very littleexperimental data exist that docu-ment tile effect of fins on the base
pressure drag of gliding missiles.
Therefore, a cooperative program
between NASA Langley ResearchCenter and the Naval Surface War-
fare Center Dahlgren Division(NSWCDD) was initiated to con-
duct an experimental investigationto determine the effect of fins on
the base pressure of a generic mis-
sile. Using these data, an improved
empirical method for determining
the base pressure drag of gliding
missiles was developed and incor-porated into an NSWCDD missile
aeroprediction code.
Wind-tunnel tests were con-
ducted on a generic missile that
consisted of an ogive cylinder 36
in. long and 5 in. in diameter.Three sets of fins were tested that
had identical trapezoidal plan-forms and thickness-to<hord
ratios of 0.05, 0.10, and 0.15. The
fins were positioned at three kmgi-tudinal stations from tile model
base and were set at incidence
angles of 0°, 10 °, and 20 ¢'. Tilemodel base was instrumented with
89 pressure orifices that were
arranged in concentric circles.
These pressures were integratedover the entire base to determine
the base pressure drag. The testswere conducted at angles of attackof 0 '_, 5 °, and 10 Uand Mach num-bers from 1.7 to 4.5. Results from
this test showed that the effects of
fins on the base pressure drag were
generally linear with increasing finincidence angle, fin thickness-to-
chord ratio, and fin longitudinal
position. However, as Mach num-
Base pressure drag missih" model mounted in wind tunnel. L-92-03900 _
ber was increased, these effects be-
came less pronounced.
(Floyd I. Wilcox, Jr., 45593}Aeronautics Directorate
Supersonic AerodynamicCharacteristics of
Sidewinder Missile
Variant Configurations
Previous tail-span optimization
studies at supersonic speeds on a
modified Sidewinder-missile-type
airframe indicate that this configu-
ration may be a viable design foruse with advanced fighter aircraft.
Performance improvements asso-
ciated with the modified configura-
tions included ]ower stability
levels accompanied by higher trimangles of attack and reductions in
zero-lift drag.
A cooperative research effortbetween NASA Langley ResearchCenter and the Naval Air Warfare
Center, China Lake, California,was established to further investi-
gate variations of the Sidewinder-
missile-type airframe. As part ofthis cooperative effort, models ofselected canard-controlled missile
configurations designed by the
U.S. Navy were fabricated with re-
duced tail-span geometries and
were tested in the Unitary l'lanWind Tunnel to determine the lon-
gitudinal and lateral-directional
aerodynamic characteristics. Thetest Mach numbers ranged from
1.75 to 2.86 at a Reynolds number
99

4Cm 8
2
Cn 6 4
2
0
!ICl8
",10
M--- 1.75
.... 2.50
- 3.50
....... L_._'Compromise range that
may meet stability and
i_ control goals
__ Current
SidewinderI I I I I
.6 .8 1.0 1.2 1.4
bt/b c
Variation of catmrd pitch, yaw, and roll-control cfl?ctivrness with
tail-spau/camu'd-st_an ratio for seh'ch'd h'st Math utmtbers.
Supersonic Characteristics
of an Outboard Control-
Surface Wing Concept
Experimental supersonicstudies were conducted in the
of 2.0 x 10" per foot. Angles of
attack ranged from -4 ° to 28 '_at
model roll angles from 0 '_to 18(YL
Results show that the reduced
tail-span configurations exhibit
favorable supersonic aerodynamic
characteristics. Canards typically
provide good pitch control (Cma)and yaw control (C,,a) but adverse
roll control (CI,0. A separate
aileron-type control svstem is
usually required for roll control.
The summary figure shows that
a range of tail-span/canard-spanratios is possible that gives near-
maximum canard pitch control
and yaw control and allows canard
roll control at zero angle of attack.
It appears that careful selection of
tail-span/canard-span ratio can
result in a canard aerodynamic
control svstem that provides pitch,
yaw, and roll/roll-rate control.(A. B. Blair, Jr., 45735)Aeronautics Directorate
Langley Unitary Plan Wind Tunnel
on a generic aircraft configurationwith a modified trapezoidal wing
planform that featured horizontal
control surfaces integrated with
the outboard region of the wing-
tips. The wing arrangement isreferred to as the outboard control-
surface (OCS) wing planform. The
investigation was a cooperative re-search effort between NASA and
Northrop Corporation to identify
potential aerodynamic technologies
that can be incorporated intofuture high-performance aircraft.
The performance benefits of the
OCS wing-planfl)rm concept weredetermined by comparison with a
conventional trapezoidal wing
planform that had the identicalmodified N ACA 65-A004 airfoil
section, exposed wing area, and
leading-edge sweep angle (50°).
Longitudinal and lateral-directionaldata were obtained over a Mach
number range of 1J+(] to 2.t6 at aReynolds number of 2 x l(f' perfoot.
A comparison of the untrimmed
hmgitudinal aerodynamic _harac-teristics indicated that the OCS
wing planform has higher zero-lift
Outboard control-sur(ace wm[_ model in Unitar)t Plan Wimt Tuma'l.
L-gl-165[)0
100

RESEAR('ItANDTECHN(31_OGYHI(;III_IGIITS
High-Perform ance M ilita ry Aircraft
drag and drag due to lift than thetrapezoidal wing planforrn. How-
ever, the OCS wing planform has
very small values of trim drag atcruise lift conditions and no trim
drag at maneuver lift conditions.
Thus, at trimmed flight conditions,
the OCS and trapezoidal wingshave essentially the same dragbecause of favorable OCS trimmed
drag characteristics. These results
indicate that the upwash field at
the wingtip efficiently loaded the
deflected OCS panel to produce a
thrust component that significantlyreduced the drag due to lift of the
OCS wing planform at trimmed
conditions. Both wing planforms
had good kmgitudinal and later-
directional stability characteristics.
This investigation showed that
the integration of an OCS to the
tips of a wing is a viable conceptthat is competitive with more con-
ventional control-surface integra-
tion concepts.
(Gaudy M. Bezos-O'Connor,45083, and Peter F. Covell)Aeronautics Directorate
Passive Shcr.k/lknmdauc-LayerInteraction Control in
Exhaust Nozzles
Current high-performance
aircraft use variable-geometry
exhaust nozzles for operation over
an extended flight regime. These
systems configure the exhaust
nozzle such that maximurn propul-sive efficiency can be obtained for
any given flight condition or throt-
fie setting. While effective in this
respect, variable-geometry exhaust
nozzles can be heavy, mechanically
complex, and difficult to integrate
into aerodynamic aircraft a fterbod-ies with low-observable exhaust
Focl;si_; schlierc;l flow vism_lizatio_ showi_s_ passive shock/bomalary-h_yer
itltcractiopl control 1;5cd tbr thrlcst vectoriH),, in exhaust uozzh's.
i
systems and other multiftmction exhaust nozzles. Concepts includ-capabilities such as thrust vector-
ing and reversing. Thus, there is a
tremendous potel:tial for improv-
ing integrated aircraft systemperformance by developing an
efficient fixed-geometry exhaustIlOZZle.
An experimental investigationwas conducted at the static test
facility of the Langley 16-FootTransonic Tunnel through a grant
with The George Washington
University, In this study, novel
concepts for passive shock/
boundary-layer interaction (SBLI)control were tested in an effort to
improve the off-design perfor-mance and extend the efficient
operating range of fixed-geometry
ed multidimensional convoluted
contouring, which provides
boundary-laver relief and gene-
rates streamwise vorticity, and a
passive porous cavity.
Test results indicate that both
concepts were highly successful
for passive SBLI control. Convolut-
ed configurations effectively alle-
viated shock-induced separation
at off-design conditions. Depend-ing on porous geometry, passive
porous cavity configurations
showed the ability to alternatelyalleviate or control shock-induced
separation. This resulted in
increases in off-design static-thrust
efficiency by as much as 3 percent
and allowed passive flow control
101

within the test nozzle. Through
asymmetric application of this
mechanism, thrust-vectoring
angles of up to 11 ° were realized.
(Craig A. Hunter, 430201Aeronautics Directorate
Thrust-Vectoring
Axisymmetric Ejector
Nozzles
Tile renewed interest in ejectornozzles for commercial (reduced
noise) and military applications
(cooling air) was the driving forcebehind this investigation. Industry
has extensive experience in the use
of ejectors for cooling of nozzle
parts; however, no data existed on
ejector nozzles with thrust-vectoring
capability. The purpose of thisinvestigation was to provide a
database for vectoring ejectornozzles.
A series of 24 unvectored and
vectored axisymmetric ejector noz-zles were designed and experimen-
tally tested for internal performanceand pumping characteristics atstatic (wind off) conditions. The
model geometric variables investi-
gated were primary nozzle throatarea (At), primary nozzle expan-
sion ratio (Ai/At), effective ejector
expansion ratio (A_,/At), ratio of
minimum ejector area to primary
nozzle throat area (A_.i/At), and
geometric thrust-vector angle (_p).The primary nozzle pressure ratio(NPR) was varied from 2.0 to 10.0.
The cx}rrected ejector-to-pfimary-nozzJe
weight-flow ratio was varied from0 (no secondary flow) to approxi-
mately (L2I (21 percent of primary
weight-flow rate).
Results indicated that with no
secondary flow, a discontinuity
/rimary nozzle
_ Ejector flow (Ws)
Primary flow (Wp)
18 ¸¸
Sketches of axisymmetric eje( tor nozzles.
occurred in the gross thrust c _rve
at NPR values well below de_, ign.
Small amounts of secondary Ilowincreased the gross thrust rat oand tended to eliminate the discon-
tinuity in the thrust ratio. Ac di-
tional secondary air did not
necessarily improve the thru_,,tratio. It did tend to reduce tl*e
effective expansion ratio of the pri-mary flow, which resulted in a
shift in the NPR at which peal< per-
formance occurs. The pumpingcharacteristics were similar fi_r the
unvectored and vectored con fig-
urations. Without secondary flow,
resultant thrust-vector angle_ were
greater than geometric turning
angles. Adding secondary flowreduced measured thrust-vector
angle; however, even at the highest
secondary flow rate, measured
thrust-vector angles were generally
equal to geometric turning angles.(Milton Lamb, 43021)
Aerodynamics Directorate
Tumbling Research
Contemporary aerodynamic
design trends that incorporate
high levels of relaxed static sta-
102
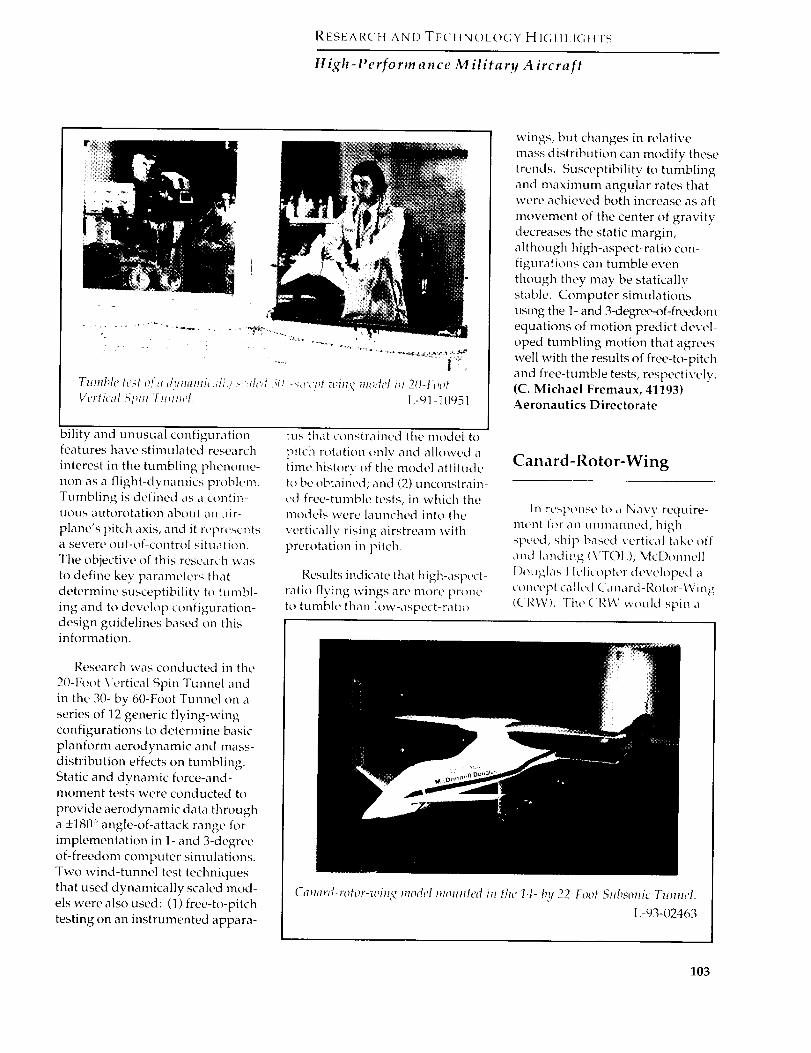
RESEARCH ANDTECttNOLO(;Y HIGttLIGttTS
High-Perform ance Military Aircraft
Tznnbh" test _ga dyna,lJ,,di!., ,_nlcd ]tl q_ivl# win%, modd ili 20-t'_ot
Vertical Spin "lumwl. I_-91-1 f)951
bility and unusual configuration
features have stimulated research
interest in the tumbling phenome-
non as a flight-dynamics problem.
Tumbling is defined as a contin-
uous autorotation about an air-
plane's pitch axis, and it repre_'nts
a severe out-of-control situation.
The objective of this research was
to define key parameters that
determine susceptibility to tumbl-
ing and to develop configuration-
design guidelines based on this
information.
Research was conducted in the
20-Foot Vertical Spin Tunnel and
in the 30- by 60-Foot Tunnel on a
series of 12 generic flying-wing
configurations to determine basic
p]anform aerodynamic and mass-
distribution effects on tumbling.
Static and dynamic force-and-
moment tests were conducted to
provide aerodynamic data through
a _+180 ° angle-of-attack range for
implementation in 1- and 3-degree-
of-freedom computer simulations.
Two wind-tunnel test techniques
that used dynamically scaled mod-
els were also used: (1) free-to-pitch
testing on an instrumented appara-
tus that constrained the model to
pitch rotation only and allowed a
time history of the model attitude
to be obtained; and (2) unconstrain-
ed free-tumble tests, in which the
models were launched into the
vertically rising airstream with
prerotation in pitch.
Results indicate that high-aspect-
ratio flying wings are more prone
to tumble than low-aspect-ratio
wings, but changes in relative
mass distribution can modify these
trends. Susceptibility to tumbling
and maximum angular rates that
were achieved both increase as aft
movement of the center of gravity
decreases the static margin,
although high-aspect-ratio con-
figurations can tumble even
though they may be statically
stable. Computer simulations
using the 1- and 3-degree-of-fr____<lom
equations of motion predict devel-
oped tumbling motion that agrees
well with the results of free-to-pitch
and free-tumble tests, respectively.
(C. Michael Fremaux, 41193)
Aeronautics Directorate
Canard-Rotor-Wing
In response to a Navy require-
ment for an unmanned, high-
_peed, ship-based vertical take off
and landing (\;TOL), McDonnell
l)otGlas t teli_opter devel{}ped a
concept called Canard-Rotor-Wing
(CRW). The (RW would spin a
Cammt-rotor-wing model mounted in the 14- by 22-Foot Subsonic Tunm,l.
L-93-02463
103

center wing to take off like a heli-
copter. The vehicle would then ac-celerate to about 120 knots when
flaps would deploy from the front
and rear wings. Flap deployment
would off load the spinning center
wing, which could then stop rota-tion and be locked into a position
across the fuselage to perform as a
third wing. The flaps on the other
two wings would then be retracedand all three wings would share
the lift loads in a fixed wing flightmode. A reverse of these events
would transition the CRW back to
its rotary wing--VTOL mode for
landing on small landing areas.
Aerodynamic performance tests
of tile CRW configuration wereconducted in the 14- by 22-FootSubsonic Tunnel with the model
controls in both symmetric and
asymmetric positions• A drag
buildup study was also performed,
developing the resulting polar dia-
grams for the fixed wing mode.(W. Todd Hodges, 44238)Aeronautics Directorate
Commercial Turbofan
Engine Exhaust Nozzle
Flow
Achieving an aerodynamic con-
tour design that meets performance
specifications for turbofan engineinstallations involves complex,
time-consuming, and expensive
analysis and testing. The goal of
the present investigation is toaccurately predict static-pressuredistributions, mass flow, and
thrust quantities by using the re-cently developed three-dimensionalNavier-Stokes code (PAB3D). The
program is a cooperative et fortwith General Electric Aircraft
Engines.
A relatively large number of an-
alytical and computational
methods for predicting the flow
surrounding a turbofan en};ine
exhaust system have beendeveloped. Most of these methods
use simple algebraic turbulencemodels. Because of the complexity
of the exhaust flow field, a higherlevel turbulence model would
improve the quality of flow and
performance predictions. In the
present investigation an improvedversion of the PAB3D code is
tested and validated utilizing a k-eturbulence model. In addition, a
nozzle performance package isused within the PAB3D code to
estimate nozzle performance.
The figure shows exhaust aero-
dynamic components for a typicalcommercial turbofan engine. The
k-¢ solutions accurately predicted
the core and fan discharge coeffi-cient (Cd) and thrust coefficient
(CT_) within 0.2 percent of the
experimental data. Tile computedsolutions provided significant
insight into flow details, surface
pressure distributions, and perfor-
mance predictions by using a com-mercial turbofan engine exhaust
nozzle as an example.(Khaled S. Abdol-Hamid, 43049,
and John R. Carlson)Aeronautics Directorate
Lower --bifurcator
Core
Pylontrailingedge
_helf
Validation Validation
of Cd of CTXPrediction Prediction
nIJ
With k-_' turbulence
1.2 o_
1.0 "_x _
0.8
0.6 _ o
0.4 x'l_ =
[02 o =00
-O2 _
Exhaust aerodynamic compollet#s and comparisons betweeu measur "d arid predicted en_ipte pe(formance (separate
flow configuration).
104

RESEARCtl ANI) TE('ttNOI,O(;Y HIGtlI.I(;IITS
High-Performance Military Aircraft
Computational Prediction
of Isolated Performance
of an Axisymmetric
Nozzle at Mach 1.2
Accurate prediction of propul-
sion effects is an important factor
of any aerodvnanlic design effort.
A nozzle-perfc_rmance module has
been developed and incorporated
into the Navier-Stokes method
PAB3D for calculation of aero-
dynamic forces and moments.
The present investigation demon-
strates the accurate accounting of
external aerodynamic effects, skin
friction, and pressure drag on an
axisvmmetric nozzle at Math 1.2
in tllrust-minus-d rag performance
predictions.
The nozzle was a high-expansion-
ratio axisvmmetric convergent-
divergent nozzle with an internal
expansion ratio of 3.0 and a design
nozzle pressure ratio (NPR) of
21.23. Experimental data could
not be obtained above NPR = 10
because of limitations of the exper-
imental apparatus. A 2-D wedge
grid was used, and internal and
external flow field regions were
computed by using a two-equation
k-t' turbulence viscous stress
model.
Thrust-minus-drag ratios,
(F D,0/Fi, were within 0.2 percent
of the absolute level of experimen-
tal data, and the trends of data
were predicted accurately. The
predicted peak performance level
was similar to the peak levels of
other lower expansion ratio noz-
zles tested. I'AB3I) is an effective
tool for the analysis of propulsion-
system perfl_rmance and has been
used to extrapolate data beyond
the experimental test results.
(John R. Carlson, 43047, and
Kristina Alexander)
Aeronautics Directorate
Supersonic Secondary
Flows Using Nonlinear
k-_ Model
A nonlinear k-e model is used
for investigating Reynolds-stress-
driven secondary flows.
Development of the nonlinear k-c
model is carried out by modifying
a time-dependent three-dimensional
Navier-Stokes code that employs
the standard k-e model. Since the
additional nonlinear terms in the
Reynolds stresses are not very
large, they are treated as added-
source terms in the original code.
Supersonic flow through a
square duct is used as a model
problem to show the improvements
with the nonlinear k-c model.
Since the flow is symmetrical, only
one-half of the duct flow was com-
puted. The computations were
carried out by using a 41 x41 mesh
il'l the crossflow direction and 251
points in the streamwise direction.
1,00
0.95
(g-Dn)" 0.90I
0.85
080
0.75
--C)-- Configuration 2 (NASA TP-1953)
• PAB3D - Turbulent
0 5 10 15 20
NPR
,4:tist./mmchi_ <upvrs_mic crui..v n(rz/c _,cdici,'_,T1 ,# isol_tcd ),cltbrmam c.
25
M= 1.2(z=0
3O
105

cf x 103
1.20 - - -
1.00
0.80 r[#' -_- Nonilnear model
0.60 tl I" O Experiment (Gessner)
70.40
0.20
0.00 i i i i i i0 0.2 0.4 0.6 0.8 1.0
y/a
_11 x ............ , .......
lit I ,-'1t ......... _, , , _ , , .........
///I \\\_ I I t t III ll/_l ....
fI;;; .... ,,,,,,,,,,,,, .......t -" _ I I I I Itlt111111/t .....
t l " ' _ I t I 1 111t//11tl/" .....I I , , _ 1 1 11//////111/ / .....
,,//////////,////z_-___ _ iI I''',,.:'//////ZX///////S --__.] I __ "/////7///////"" - - - - " "- S////X ////_ _ - - - . ,
LI \.- //,/////////////"_--., \,_\_j///,/////////////_ - _... _
//////// //" " "_ i. , , , _ i
iI\ I"//'/'/" / I I \ ", ". "-'- f////
Spauwisc skin-friction distribution and computed cmssflow velocity
vectors usht<_/lollli/loar I#loddl.
The top figure shows the com-
puted skin-friction distributionwith the linear and nonlinear k-e
models and comparison with the
experimental data as a function of
the spanwise coordinate, where"a" is one-half duct width. The
result obtained by using the non-
linear model is in excellent agree-
ment with the data and clearly
captures the undulations ubserved
in the experiment. These _mdula-
tions represent the convectiveinfluence of the secondar), flow,which cannot be simulated with
linear models. The bottom figure
shows the computed crossflow
velocity vectors with the nonlinear
model. Computations wilh the
linear model predict a unicirection-
al flow, while the nonlinear model
clearly shows the two vortices
symmetrical about the diagonal,which is in agreement with the
experimental observations.
Highly accurate numerical vali-dation of the nonlinear model was
carried out in separated crossflows.
This new model will improve the
predictive capabilities of the com-
putational fluid dynamics codesthat are used for propulsion air-
frame integration.(Balakrishnan Lakshmanan,
48057)Aeronautics Directorate
Fluidic Thrust Vectoring
of a Jet-Engine Exhaust
Stream
Fluidic thrust vectoring is thedeflection of the exhaust thrust
vector of a jet engine through the
influence of a secondary fluid
stream. Advantages of this vector-
ing technique over mechanicalthrust-vectoring systems are the
reduction in nozzle weight and
complexity from the eliminationof mechanical actuators that are
used in conventional thrust
vectoring.
One such fluidic thrust-vectoring
technique for convergent-divergentnozzles, known as shock-vector
control, is the injection of a sheet of
secondary air into the supersonic
primary jet stream through a slotin the nozzle divergent flap. This
injected flow presents an obstruc-
tion to the primary jet and results
in the formation of an oblique
shock in the primary jet flow field.
The jet exhaust is then turned by
the oblique shock, and the exhaust
106

RESEARCH AND TECHNOLOGY HIGHLIGHTS
High-Performance Military Aircraft
Injection slot in
_divergent flap
_X Injected secondary airPrimary jet .1_
ted exhaust
Oblique shock
Fluidic thrust vectoriug usin_ shock-vector control.
thrust vector is deflected away
from the slotted divergent flap.
A static test (no external flow)
of this concept was conducted in
tile static test facility of the 16-Foot
Transonic Tunnel. Results indicate
that useful levels of thrust vector-
ing are produced (greater than
15 '_')by this technique. The amount
of thrust vectoring is controlled by
varying the weight flow rate of the
secondary airstream. Moderate
thrust losses at all but highly over-
expanded primary jet conditions
are incurred as a result of losses
through the oblique shock,
although the level of thrust pro-
duced is probably adequate for
transitory vectoring operation.
(David J. Wing, 43006)
Aeronautics Directorate
F/A-18. The photograph shows a
15-percent-scale model mounted
for static force tests in the 30- by
60-Foot Tunnel. The LEX modifica-
tions were designed to allow the
aircraft to maintain a specified lev-
el of maximum lift while improving
the lateral stability (dihedral
effect) and nose-down pitch-control
capability at high angles of attack.
Such characteristics are vital for
good air-to-air combat effective-
hess. The current tests were
intended to study several LEX
geometry concepts that were
suggested bv Langley researchers.
In exploratory tests by McDonnell
Douglas that preceded the Langley
tests, some of these concepts
F/A-18E/F Stability and
Control Design Studies
Static wind-tunnel tests have
been conducted in the 30- by
00-Foot Tunnel to determine the
effect of leading-edge extension
(LEX) geometry modifications to
the McDonnell Douglas F/A-18E/F
aircraft, which is currently under
design as the latest version of the
appeared to have potential for
improving the performancecharacteristics.
The results of the 30- by 00-Foot
Tunnel tests showed the large pos-
itive impact of certain geometry
parameters on the stability and
\
|
Model of F/A-I 8E/F desi,\,pt co;;fi,k, uratio;1 m0uutcd for static force tests m
30- by oO-Foot Tuma,I. L-93-01944
107

control characteristics. The most
significant impact was the additionof a slot that allows airflow
between the LEX and the leading
edge of the wing. This modification
was then refined by McDonnell
Douglas and incorporated into thefinal LEX design• In summary, the
results of these tests helped vali-
date concepts for performanceenhancements to the F/A-18E/F
and aided in design efforts to pro-vide acceptable levels of maximum
lift, lateral stability, and nose-down
control capability.(Gautam H. Shah, 41163, Sue B.
Grafton, and Daniel G. Murri)Aeronautics Directorate
Surface Porosity Effectson Vortex Interactioas
Experimental investigationswere conducted in the Langley
7- by 10-Foot High-Speed Tunnel
of the effects of surface porosity onvortex-vortex and vortex/vertical-
tail interactions on a 65°-cropped
delta-wing model. The modelplanform is sketched in the figure.Porous surfaces that were tested
included the wing leading--edgeextension (LEX) and the wing
leading-edge flaps. Laser vaporscreen (LVS) flow visualizations,
wing upper surface static pressure
distributions, and six-corn l_onentforces and moments were _btained
at Mach numbers of 0.2 to ;).5,
angles of attack of 0 ° to 45 °, side-slip angles of -5 °, 0 °, and 5 °, and
Reynolds numbers (based onchord) of 2.8 to 5.9 x 10⁶. The LEX
and wing flaps were flat plate withbeveled leading edges and fea-tured a uniform distribution of
0.05-in. diameter through holes.
This hole arrangement provided a
maximum porosity by area of 12
percent. The level of porosity was
manually varied from 0 to 12 per-cent during the testing by covering
selected regions of the LEX and
flaps. Twin wing-mounted verticaltails and a centerline vertical tail
were tested in the presence of all
combinations of porous and non-
porous LEX and wing flaps and
with the LEX and flaps removed.The test data showed that surface
LEX LE FLtp &,._ a,a_
AI o Solid Solid 0 20.28_/ __._ t3 S,,lid Porous 0 20.25
// \_ 0 Porous Solid 0 20•14
// _,.o L _o 2o.L
"/"_ 10 Cp'u .^ q-2.0
-" .,:o t° _
• _. _ _-_-_'_ _._
rdc=O80 "-.I } I I t I I I I_T ''_ .50 .1 .2 .3 .4 .5 .6 .7 .8 .9 1.0
y/s
Porosity effect on wi,g surhlce pressures at Mach 0.50 and 8t,,= 0 °.
C_,tl
108

RESEARCtt ANDTECttNOLOGY HIGHLIGHTS
High-Performance Military Aircraft
porosity was effective in suppress-
ing vortex interactions by signi-
ficantly reducing the vortex
strengths. This effect could be
achieved by applying porosity to
the LEX or flaps or in combination.
The surface pressure distributions
on the right half of the model
shown in the figure indicate that
the location and magnitude of the
wing leading-edge vortex pressure
signature are highly sensitive to
surface porosity• Tile LVS flow vi-
sualizations revealed a significant
effect of porosity on the global
flow field, including reduced
interaction of the LEX and wing
vortex flows and diminished
vortex-tail interactions. The six-
component force and moment
data indicated that porosity de-
creased the longitudinal instability
at high angles of attack at the ex-
pense of decreasing the maximum
lift. Lateral-directional stability
levels were sensitive to porosity
and the tail arrangement, and themost favorable trends were
obtained with the centerline tail.
{Gary E. Erickson, 42886)
Aeronautics Directorate
Actuated Nose Strakes for
Enhanced Rolling
(ANSER) Flight
Experiment
Rudder control for a convention-
al aircraft is markedly reduced as
a result of the blanketing effect ot
the stalled-wing wake on the verti-
cal tail as angle of attack is
increased. As part of NASA's
High-Angle-of-Attack Technology
Program, extensive experimental
and computational studies have
indicated that the use of deployable
nose strakes can favorably alter
i
i _ • i_i i _
ANSER radomc attached to f'- 18 forcbody tot static-loads tcstiJlg.
L-93-07491
the basic aerodynamics and
improve maneuverability of
fighter-type aircraft at such flight
conditions. Following exploratory
and developmental testing, such a
strake concept has been designed
and fabricated at Langley Research
Center. The flight hardware con-
sists of a new radome that houses
the hydraulically actuated strakes
and is to be incorporated on the
F-I 8 High-Alpha Research Vehicle
(HARV). The design that provided
the most practical aerodynamic
benefit was a pair of conformal
strakes, each capable of being
deflected 90:: and located at the
120:' radial position from the
bottom of the forebody. The term
conforma] refers to the configura-
tion shape when both strakes are
retracted, whereby the normal
F-I 8 forebody contour is retMned.
Static-loads tests were con-
ducted after the radome was
assembled (see figure). These tests
established that the new design
was able to meet and exceed tile
anticipated maximum flight loads.
Further, the effect of these loads on
the fuselage of the F-18 was
analyzed bv the airframe manu-
facturer and indicated that the
resultant loads would not cause
any structural limits to be
exceeded.
(Daniel J. DiCarlo, 43870, Mark T.
Lord, and Daniel G. Murri)
Aeronautics Directorate
109

RESEARCH AND
TECHNOLOGY
Hypersonic andTransatmospheric Vehicles
Improved analysis Traditional analysis
Da,elop the critical te, :hnolo_ies
ti,r h4ture hypersonic ,rod
transatmospheric veh, ch's

RESEAI?,CH ANDTt!CttNOI.OG'_ HI(;Itl_I(;tlI5
Hyperson ic and Transa tm ospheric Vehich, s
Numerical Simulation of
Shock-Induced
Combustion Past Blunt
Projectiles Using
Shock-Fitting Technique
For successful design of the
hypersonic airbreathilxg propul-sion system, it is essential to have
a clear understanding of the phy-
sics of mixing and combustion at
high speeds. Shock-induced com-bustion is one of the methods that
is being investigated for hyper-
velocity propulsion where a shock
is employed to initiate ignition in apremixed fuel-air mixture.
In the present study, a numerical
investigation is being conducted toisolate and analyze the instabilities
of shock-induced combustion in a
hydrogen-air reacting system.Two-d imensional axisymmetric
Navier-Stokes equations in con-
junction with a detailed hydrogen-air reaction mechanisn_ arc used to
simulate the ballistic range experi-
ment in which blunt projectiles
were fired in a premixed hydrogen-
air mixture. Ashock-fittingtech-
nique has been used here because
previous stud ies of the same prob-lem have shown that shock-
capturing methods are overly
dissipative.
Solutions have been obtained atMach 5.11and Mach6.46. Mach
5.1 I corresponds to the Chapman-
lougel veh*citv of the hydrogen-air
mixture that is being considered
here. l)cpellding upon the projec-
SHOCK CAPTURING
GRID 197 X 152
SHOCK FITTING
GRID 101 X 101Reflected Compression Wave
Compression
Wave
WaveComp.
Wave
(moving
towards
body)
Time
Bow Shock Projectile Body:--X
Contom" plot fi_r prcssmc ahm_ stagnatio?l streamline for Math 5.11 with shock-capt_;ri_zg mid dmck titt mN methods,
111

tile velocity,steadyorunsteadyflow fieldwasobserved.TilefigureshowsthecontourplotforpressureahmgthestagnationstreamlineforMach5.11asafunc-tionof time.Theunsteadyflowfieldshowedperiodicoscillationsofthereactionfront•Acomparisonoftheresultsshowsthattheshock-fittingtechniquehasbeenabletocapturetheflowphysicsandtheintrinsicdetailsoftheflowfieldmoreaccuratelythantheshock-capturingmethod.
Theresultsfromtilepresentstudyshowthatwhenthepro-jectilevelocityisclosetotheChapman-Jougetvelocity,theshock-inducedreactionfrontisttnstable.However,withsufficientoverdrive(additionalvelocity),itwaspossibletostabilizethereactionfront.(l. K. Ahuja, 42285, A. Kumar,
D. J. Singh, and S. N. Tiwari)Aeronautics Directorate
Interpretation of
Waverider Performance
Data Using
Computational Fluid
Dynamics
A computational study was
conducted to interpret wind-tunneldata from tests of a Mach 4.0 wave-
rider model and a comparative
reference model with a fiat-topsurface. The data indicated that
the aerodynamic performance of
the reference model was slightlybetter than that of the waverider
model. These results contradict
waverider design theory, whichsuggests that a waverider that is
optimized for maximum lift-drag
ratio should provide better perfor-
I' P ('mlliJtlr _, :+ll ("t'lltel'lhlt
_+_ al_,t'l'+(ll.'l ` ill I+ :- 1,0"
P ]_ (_Hlh+llI'_ '.tl ]{il',_'
XXaxcridcral_+ 131
Z
...... Z '\
X "t
Comparison of waverMer mid refi, rence-model flow-field solutions at annie
of attack (¢z) where maximu +nl(fi-drag ratio occurs for each confi%uration at
Mach 4.0 and Retlnolds llttl_lbt'r of 2.0 x 1(1t' per [_)ot.
mance than any other nonwaverid-
er configuration at a given Jesign
point, especially at hypers_ nic
speeds. It is important to de :erminethe nature of this performance
advantage, since the primary inter-
est in waverider-derived config-
urations is their high lift-drag
ratios, which are generated by an
attached leading-edge sho_k at thedesign Mach number.
Computational fluid dynamic(CFD) solutions were obtained for
each model at the design/_lachnumber of 4.0 and at selected off-
design Mach numbers. The solu-tions show that the lower ,.urface-
pressure values, and integrated
lift and drag coefficients are muchless for the reference model than
for the waverider, because thereference-model lower surface is
an expansion surface, in contrast
to the waverider compression
surface. The figure shows static-
pressure contours that are non-dimensionalized by free-stream
pressure (P/P_,,). The darker
shades represent higher pressure
values. The lift-drag ratios of the
reference model are higher because
of a relatively low drag for a given
amount of lift. A comparison ofthe base views of both modelsshows that the reference model ex-
hibits the same shock-attachment
properties as the waverider,
because the planform shapes areidentical. Therefore, the same
effect that gives the waverider its
high lift-drag ratio is present in thereference-model flow field. This
suggests that the plan form shape
is the most important design
parameter and that altering thelower surface of a waverider does
112

RESEARCH AND TECHNOLOGY HIGHLIGHTS
Hypersonic and Transatmospheric Vehicles
not cause significant performance
degradation. The highly uniform
flow field shown in the base view
of the waverider model indicates
that this configuration has much
better propulsion/airframe inte-
gration (PAl) characteristics. This
work shows that the waverider
concept remains a viable candidate
for various hypersonic vehicle
designs, including hypersonic
cruise and single-stage-to-orbit
concepts.
{Charles E. Coekrell, Jr., 45576)
Aeronautics Directorate
Scramjet Exhaust
Simulation Modeling
It is impractical to test powered
hypersonic configurations with
actual combusting (hot) scramjet
exhausts in most current wind
tunnels. Instead, the "powered"
effects are modeled by routing a
cold simulant exhaust gas out the
combustor nozzle. The simulant
gas mixture is selected such that
its thermodynamic properties at
"cold" wind-tunnel temperatures
are similar to the thermodynan_ic
properties of "hot" scram jet com-
bustion products. However, the
simulant gases cannot completely
model all the properties of the hot
combustion products, and the
resulting modeling errors need to
be quantified.
A viscous computational study
was performed to compare the
forces and moments on the after-
body of a powered model for vari-
ous simulant exhaust gases at both
wind-tunnel and scramjet exhaust
temperatures. The figure shows
afterbody forces and moments for
three exhaust gases across a range
J
¢1
.N
EO
z
1.50
1.25
1.00
0.75
i
0.80
Cold T
Hot r_
L i i i i L i i0.60 1.;0 1.q0
c-F-
"D
N
EO
z
2.25
2.00
1.75
1 50
1.25
1.00
0.75
0.80 ' o.;o .... 1'oo.....
E -.50
EO
-.75
.9.0-1.0013_
-_ .25
E__.500
z 0.80
[] Air Nozzle/Exhaust
o CF4-Ar Nozzle/Exhaust (Cold)
• H20-N 2 Nozzle/Exhaust (Hot)
Cold I
.... .....O. 1. 1.10
Normalized SNPR
Computational afterbody fi_rce mtd moment comparisons versus SNPR fin.
Math 10 powered simulations.
of static nozzle pressure ratio
(SNPR) values. The combustor
nozzle geometries were varied
with the gases to produce consis-
tent nozzle-exit Mach numbers.
All forces and moments and
SNPR's are normalized by the
absolute values of results obtained
by employing a hot simulant gas
of steam (H20) and nitrogen at
nominal Mach 10 conditions.
These gases represent approximate-
ly 96 percent of the scramjet corn-
bustion products. The cold tetra-
fluoromethane-argon (CF4-Ar)
simulation agrees much better
with that of the hot combustion
products than does the cold-air ex-
haust simulation. Heating the air
exhaust improves the simulation,
but testing with hot air is no more
practical than with hot steam. The
hot steam and nitrogen results
compare very well with the cold
CF4-Ar results for lift and pitching
moment. The thrust values show a
113
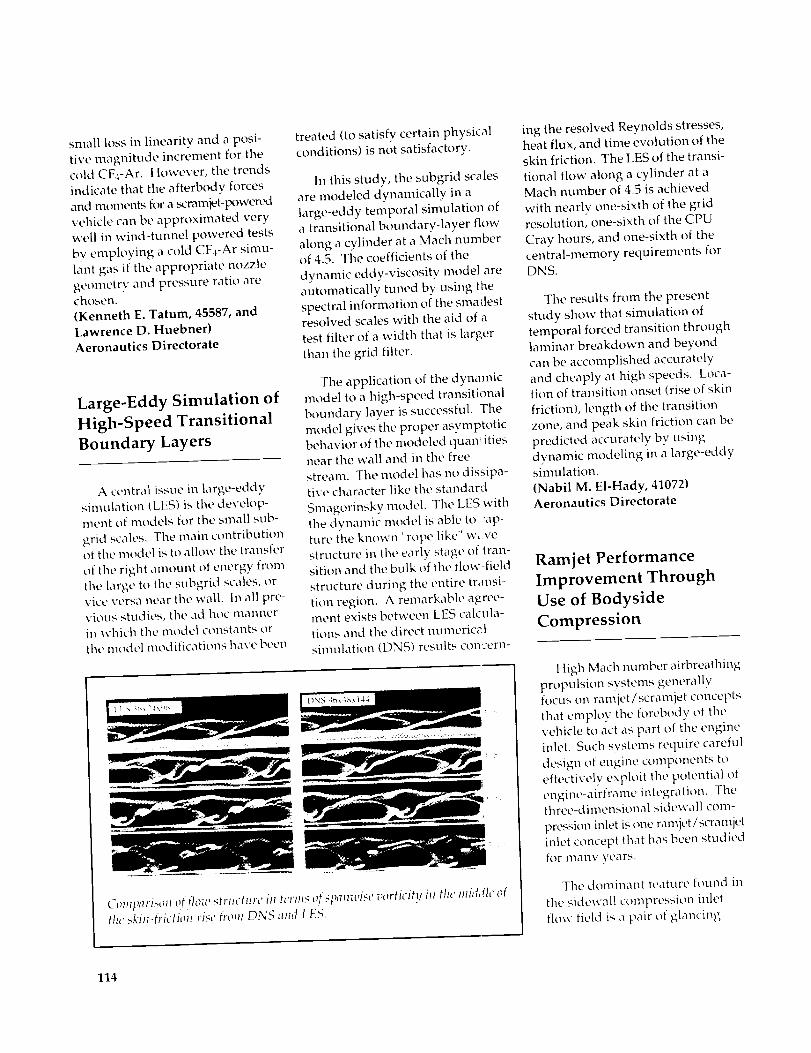
small loss in linearity and a posi-tive magnitude increment for thecold CF4-Ar. However, the trends
indicate that the afterbody forces
and moments for a _Tamjet-_)wered
vehicle can be approximated verywell in wind-tnnne! powered tests
bv employing a cold CF4-Ar simu-
lant gas if the appropriate nozzle
geometry and pressure ratio arechosen.
(Kenneth E. Tatum, 45587, and
Lawrence D. Huebner)Aeronautics Directorate
Large-Eddy Simulation of
High-Speed Transitional
Boundary Layers
A central issue in large-eddy
simulation (LES) is the develop-ment of models for tile small sub-
grid scales. The main contributionof the model is to allow the transfer
of the right amount of energy from
the large to the subgrid scales, or
vice versa near tile wall. In all pre-vious studies, the ad hoc mannerin which the model constants or
the model modifications have been
treated (to satisfy certain physical
conditions) is not satisfactory.
In this study, the subgrid scales
are modeled dynamically in alarge-eddy temporal simulation of
a transitional boundary-layer flow
along a cylinder at a Mach numberof 4.5. The coefficients of the
dynamic eddy-viscosity model areautomatically tuned by using the
spectral information of the smatlestresolved scales with the aid of a
test filter of a width that is larger
than the grid filter.
The application of the dynamic
model to a high-speed transitional
boundary layer is successful. The
model gives the proper asymptoticbehavior of the modeled quamitiesnear the wall and in the free
stream. Tile model has no dissipa-tive character like the standard
Smagormsky model. The LES withthe dw_amic model is able to ap-
ture tile known "rope like" w,_ve
structure in the early stage of tran-sition and the bulk of the flow-field
structure during the entire transi-
tion region. A remarkable agree-ment exists between LES calcula-tions and the direct nunlerical
simulation (DNS) results concern-
Compmisolz o( flow structure itz h'rms (!f spmm,isc vorticity iu the middle ofthe ski_1#)'ictioll rise t)'o_ll DNS and LES.
ing the resolved Reynolds stresses,heat flux, and time evolution of theskin friction. The LES of the transi-
tional flow along a cylinder at aMach number of 4.5 is achieved
with nearly one-sixth of the gridresolution, one-sixth of the CPU
Cray hours, and one-sixth of the
central-memory requirements forDNS.
Tile results from the present
study show that simulation of
temporal forced transition through
laminar breakdown and beyondcan be accomplished accurately
and cheaply at high speeds. Loca-tion of transition onset (rise of skin
friction), length of the transition
zone, and peak skin friction can be
predicted accurately by usingdynamic modeling in a large-eddysimulation.
{Nabil M. EI-Hady, 41072)Aeronautics Directorate
Ramjet Performance
Improvement Through
Use of Bodyside
Compression
High Mach lmmber airbreathing
propulsion systems generally
focus on ramjet/scram jet conceptsthat employ the forebodv of the
vehicle to act as part of the engine
inlet. Such svstems require careful
design of engine components to
effectively exploit the potential ofengine-airframe integration. Thethree-dimensional sidewall com-
pression inlet is one ramjet/scramjet
inlet concept that has been studiedfor lllallV voars.
The dominant feature found in
the sidewall compression inlet
flow field is a pair of glancing
114

RESEARCH ANDTECIINOLOGY HIGHLIGIITS
Hypersonic and Transatmospheric Vehicles
Section 8-B'
^ ,,NN_."_-BOUndary Iayer'hN"'_Fuse,agexNN._.x'_ RampNN.GN"NN
Section A-A'
35-
P/P1
30-
25-
20
15
10
5
0
i_ Case C
Case B
Case A
Streamwise dislance
hflet bodysidc ce;;terli;;c wall-pressure distributious.
shock-wave/boundary-layer inter-
actions caused by the sweeping of
sidewall-induced shock waves
across the incoming forebody
boundary laver. A major result of
these interactions is that the
incoming boundary laver usually
separates and rolls up into a strong
streamwise vortex that is located
near the root of each sidewall. As
these vortices grow and reach the
centerline, they interact with one
another. In this vortex-vortex
interaction, the vortices lift off of
the surface and create a large core
of low total-pressure fluid near the
middle of the cross plane. Such a
feature can inhibit inlet perfor-
mance by limiting the amount of
combustion-induced pressure
increase that the inlet can tolerate
(commonly referred to as the back-
pressure).
Compression surfaces (i.e.,
ramps) were placed on the body-side between the sidewalls of the
inlet. These ramps can be used to
influence the local pressure field
and to thereby modify the vortex-
vortex interaction. The figure
shows wind-tunnel data of the
centerline wall-pressure distribu-
tion, nornlalized by the upstream
static pressure (PI), on the vehicle
surface of a sidewall compression
inlet with swept forward leading
edges. The results from three inlet
configurations are shown. The
inlet without a ramp, case A, can
achieve a backpressure of approxi-
matelv 24.5 I'1. A straight ramp,
case B, can increase this back-
pressure to 26.7 Pl, while a compa-
rable convex ramp, case C, can
permit the backpressure to reach
31.3 Pr. The convex ramp geometry
is designed to reduce the stream-
wise pressure gradient in the
region of the vortex-vortex inter-
action and to delav the vortex
lift-off phenon3enon. The result
is a significant increase in inlet
backpressure performance.
(Patrick E. Rodi, 46259, and
Griffin Y. Anderson)
Aeronautics Directorate
Scramjet Fuel-Mixing
Estimates in HYPULSE
Expansion Tube Facility
Using Mie Imaging
A series of generic scramjet fuel
injectors were tested in the NASA
l tYPULSE facility at the General
Applied Science Laboratories, Inc.
(GASL). Test conditions at the fuel
injectors are typical of what would
be encountered at the entrance to a
scram jet combustor on a single-
stage-to-orbit (SSTO) vehicle fly-
ing at Mach 14. The prime objec-
tive of these tests was to measure
the fuel-injector performance as
indicated by the accomplished
mixing and combustion of the
hydrogen fuel. Typically, such
information has been inferred
from wall-pressure distributions
or instream measurements of the
fuel species concentrations. How-
ever, the short test times and
severe flow conditions (low pres-
sure and high temperature) of the
HYPULSE facility at the hyper-
velocity flow simulations make
mixing estimates difficult. There-
fore, a technique was needed to ac-
115

Compariso, of ha'l-plmm" hnax, iug by laser li_,,ht scatteri,g with comlmtedresult.
quire time-mean, spatial distribu-
tions of the injected fuel plume
during the short (0.30 reset)facility run time from which the
integral mixing could be deduced.
The concept was to illuminate
the injected fuel by scattering alaser sheet from solid silicon
dioxide (SiO2) particles that werecontained in the fuel jet. The parti-
cles were produced in situ by
burning a small amount of silane(Sill4), which had been mixed with
the hydrogen fuel, in the plenumof the fuel injector with enough ox-
ygen to stoichiometrically react
with the silane. The resulting fuel
contained about 94 percent H2 and
6 percent water in the gas phase,
and had SiO2 particles that wereabout 0.2 _.ml in scale. The laser
sheet was generated from a flash-
lamp pumped-dye laser with a
pulse width of 50 J.Lsec, which wassufficient to obtain time-mean
images of the fuel plume. The
images were collected with a CCDvideo camera and were corrected
for background intensity, laser-beam variation, and view angle.
The average image of two ft el
plumes from a pair of swept-ramp
injectors m scramjet model tests
in HYPULSE is given on the right
side of the figure. The imageon the left was derived from aNavier-Stokes CFD solutior of the
combustor/injector flow fie_d that
considered only the gaseotr* part
of the fuel jet. A procedure to ana-
lyze the images has been fo_ mulat-ed and used to determine the fuel
mixing. The analysis procedure
is based on the flux of particles
through the plane of the la_er k)r
the data image and the gric planefor the CFD solution, and cn the
assumption that this partice flux
is proportional to the fuel lt_ass
flow. Both images in the figure
have been scaled by the re._pective
total particle flux. The CFI) image
appears to underpredict the dataimage, as is evident from the high-
er peak and narrower spre _ding.
This observation is supported by
the estimates of mixing efficiency,which were determined to be 52
and 46 percent for the data and
CFD images, respectively. Thecomputed mixing efficiency from
the CFD solution is 44 percent.
The use of this promising technique
is continuing in hypervelocitytests of scramjet fuel injectors in
HYPULSE. Improvements in the
particle formation and imaging
optics are under way.
(R. Clayton Rogers, 46239,Elizabeth H. Weidner, andRobert D. Bittner)Aeronautics Directorate
High-Speed Scramjet
Injector Design
Scramjet designers must under-
stand cornplicated fuel-mixing
processes to achieve useful engine
thrust at flight Mach numbersabove 10. Mixing control/enhancement mechanisms include
fuel distribution, turbulent diffu-
sion, axial vorticity, shock-wave
interaction, and baroclinic torque.
Computational fluid dynamics(CFD) is a useful tool for determin-
ing the relative contributions ofthe various mechanisms to tire
mixing process. As part of a para-
metric study of ramp, flush-wall,
and strut fuel injectors, CFD wasused to evaluate the relative
impact of these mixing phenomena.
The figure illustrates the relative
importance of two of the major
drivers of the scramjet fuel-mixing
process: turbulent diffusion andaxial vorticity. This solution was
performed for the swept-ramp
geometry illustrated at flight Mach
14 conditions. The impact of axial
vorticity generated by the ramp
(evaluated by removal of all cross-
flow from the ramp base plane) is
less than the impact of turbulentdiffusion (difference between lam-
inar and turbulent solutions) on
116

RESEARCtt ANDTECttNOI_OGY HIGttLI(iItTS
Hypersonic and Transatmospheric Vetlicles
1.0
Mixing 0.(5
Efficiency
Effect of ramp-induced Swept-Ramp Injector
distortion: Swirl, Shocks,
Shear ayers
-:--i .... -_--- 0 Turbulent) Tur;uien; L[ Etfectof I
uniform _] turbulent ]
-- flow lJ diffusion I
...._[- r] Laminar
I I I
0 0.1 0.2 0.3
Axial Vorticity index
Contributions Of turbulence and axhd vorticity to scramjct fuel mixiu,k',
mixing efficiency. Similar results
h)r the three classes of fuel injectors
are being evaluated and will
enhance our understanding of the
scramjet fuel-mixing process and
lead to improved injector strate-
gies.
This work was done in part
under grant with the University of
Missouri at Rolla.
(Charles R. McClinton, 46253, and
David W. Riggins)
National Aero-Space Plane Office
Visualization of Mach 2
Vitiated Air Using PlanarLaser-Induced
Fluorescence
The nonintrusive optical diag-
nostic technique known as planar
laser-induced fluorescence (PLIF)
was used to study the vitiated-air
component of a Mach 2 jet flame.
Signals were obtained by probing
the hydroxyl radical (OH)bv
using a tunable excimer laser near
32 441.8 cm -r. Time O1f species is a
chemical intermediate in all com-
bustion flows and a convenient
molecule for generating PLIF.
The laser is formed into a sheet
that is 25 mm high and 0.08 mm
thick and is parallel to the flow
(X-axis in the figure). The resulting
images are viewed at 90 ° to the
direction of the laser sheet (Y-axis
in the figure). Since the laser pulse
duration is 20 nsec, the images
represent "frozen" snapshots of time
flow. Three instantaneous and
temporally uncorrelated images
are shown in the figure. The imag-
es show striation patterns or alter-
nating regions of high and low OH
signal along the Y-axis. This
means that OH is being ejected
0
0'v !!-,--I
]llSt(ttltalldOILq phHlar
"snapshots" of vitiated-air
compom'nt of a Math 2 rcactiu X
flow ot_taincd by usin\, t_hmar
laser-imha'cd fluoresceme.
Flow direction is ahmg X-axis.
nonuniformly from time vitiated-air
injector. Time images also show
vortical patterns in the vitiated air.
Both results indicate that the flow
117
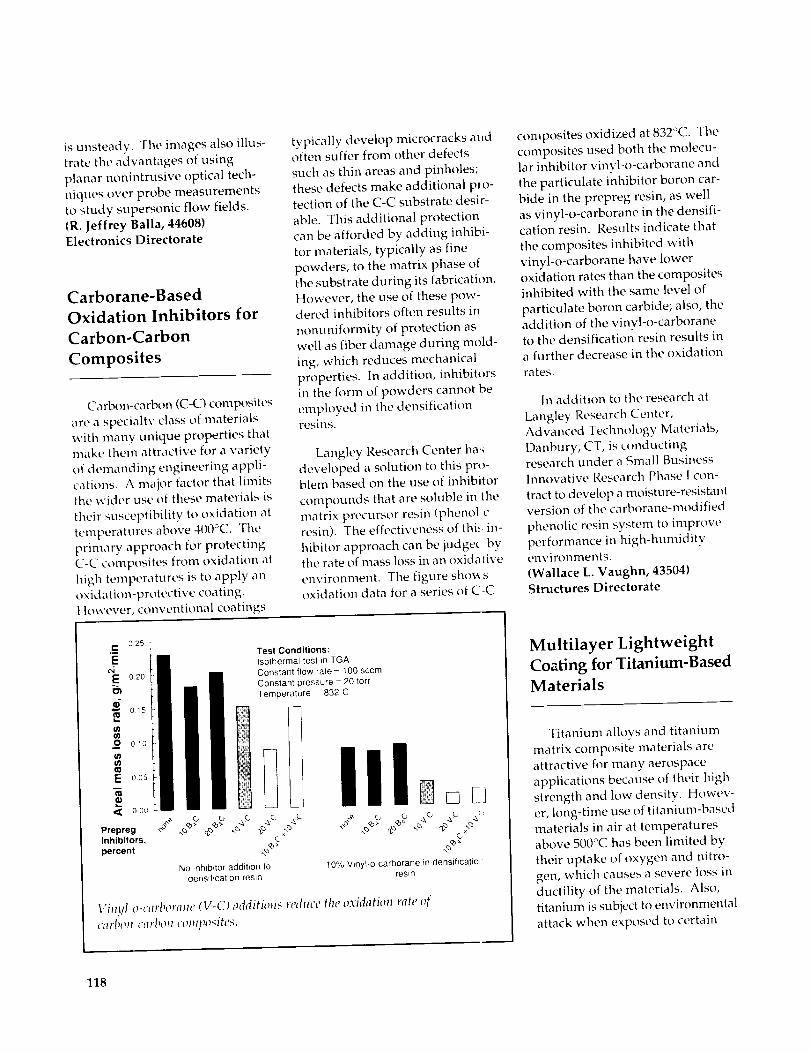
is unsteady. Tile images also illus-trate the advantages of using
planar nonintrusive optical tech-
niques over probe measurements
to study supersonic flow fields.
(R. Jeffrey Balla, 446081Electronics Directorate
Carborane-Based
Oxidation Inhibitors for
Carbon-Carbon
Composites
Carbon-carbon (C-O composites
are a specialty class of materials
with many unique properties thatmake them attractive for a variety
of demanding engineering appli-
cations. A major factor that limitsthe wider use of these materials is
their susceptibility to oxidation attemperatures above 41)0°C. The
primary approach for protecting
C-C composites from oxidation at
high temperatures is to apply anoxidation-protective coating.
t hnvever, conventional coatings
typically develop microcracks m_doften suffer from other defects
such as thin areas and pinholes;
these defects make additional pro-tection of the C-C substrate desir-
able. This additional protection
can be afforded by adding inhibi-tor materials, typically as fine
powders, to the matrix phase of
the substrate during its fabrication.
However, the use of these pow-dered inhibitors often results in
nonuniformity of protection as
well as fiber damage during mold-ing, which reduces mechanical
properties. In addition, inhibitors
in the form of powders cannot be
employed in the densificationresins.
Langley Research Center ha.',
developed a solution to this pro-blem based on the use of inhibitor
compounds that are soluble in the
matrix precursor resin (phenol cresin). The effectiveness of this in-
hibitor approach can be judgec bytile rate of mass loss in an oxidative
environment. The figure show soxidation data for a series of C-C
composites oxidized at 832°C. Thecomposites used both the molecu-
lar inhibitor vinyl-o-carborane and
the particulate inhibitor boron car-
bide in the prepreg resin, as well
as vinyl-o-carborane in the densifi-cation resin. Results indicate that
the composites inhibited with
vinyl-o-carborane have lower
oxidation rates than the compositesinhibited with the same level of
particulate boron carbide; also, the
addition of the vinyl-o-carboraneto the densification resin results in
a further decrease in the oxidation
rates.
In addition to tile research at
Langley Research Center,
Advanced Technology Materials,
Danbury, CT, is conductingresearch under a Small Business
Innovative Research Phase 1 con-
tract to develop a moisture-resistantversion of the carborane-modified
phenolic resin system to improve
performance in high-humidityenvironnlents.
(Wallace L. Vaughn, 43504)Structures Directorate
¢. 025
_,_ Test Conditions:Isothermal test in TGA
Constan! flow rate- 100020 sccm
O) Constant pressure - 20 torrTemperature - 832 C
_o 0,0
oQs I
40 4_; 4_ _.e, c_ o 40 40 4!,
Inhibitors, 0 _ 0 _
percent O_ _ 0_"
No inh*b_tor addition to 10% Vinyl-o-carborane in densificatio=_densification resin resin
Vinyl-o-carboram' (V-C)additions reduce the oxidation rate Of
CflFJ_OH-Ctl'F[rOH composites.
Multilayer Lightweight
Coating for Titanium-Based
Materials
Titanium alloys and titanium
matrix composite materials are
attractive for many aerospace
applications because of their high
strength and low density. Howev-
er, long-time use of titanium-based
materials in air at temperaturesabove 500°C has been limited by
their uptake of oxygen and nitro-
gen, which causes a severe loss in
ductility of tile materials. Also,
titanium is subject to environmental
attack when exposed to certain
118

RESEARCH ANDTECItNOLOGY HIGttI,[GttTS
Hypersonic and Transatmospheric Vehicles
UncoatedMount
Oxide Layer
(TiO::')
Crack (filled
with "TiO_)
15o.m Coated
i,_Ttanium
_ IZ!I
90 ° f ber
Microstructure Of coated and uncoated SCS-6 silicou carbide fiber�Beta-21S
titanium matrix composite samph's after cydic oxidation (144 cych's:
5 m/n, 800°C; I rain, -196_'C).
hydrocarbon-containing fluids at
lower temperatures.
The multilayer lightweight
coating is an effective means of
shielding titaniunl-based materials
from the environment and thus
enabling their use at much higher
temperatures. The coating is about
5 #m thick. It consists of an inter-
metallic reaction-barrier layer that
separates the titanium from a two-
phase glass layer. The two-phase
glass is prepared by using sol-gel
chemistry methods and functions
as a diffuskm barrier layer to block
transport of oxygen and nitrogen
to the titanium substrate. The two-
phase glass consists of a silica-rich
matrix plus a lower softening-point
glass that is tailored to be soft at
the use temperature. The soft
phase promotes self-healing of
defects and microcracks that may
form in the coating.
The figure shows micrographs
of coated and uncoated titanium
matrix composite (SCS-6 silicon
carbide fibers in Beta-2 IS titanium
matrix) samples after 144 thermal
cycles from 800°C to -196':C with
12 hours accumulated time at
peak temperature. The uncoated
sample has cracks from the surface
to the first layer of fibers. Those
cracks would cause failure in a
structural application. The coated
sample has no cracks.
The coating is currently being
evaluated by Rohr, Inc. and NASA
for coating the nozzle mixer of an
advanced jet engine. Success will
make production of the part possi-
ble from titanium with a weight
savings of 25 percent and a cost
savings of 10 percent. Other
potential applications include the
coating of valves and springs in
automotive applications.
(R. K. Clark, 43513, and
K. E. Wiedemann)
Structures Directorate
Effect of Aeropropulsive-
Elastic Interactions on
Hypersonic Vehicles
Current airbreathing
hypersojlic-vehicle configura-
tions use an elongated fuselage
forebody as the aerodynamic
compression surface for the
propulsion system. This type of
airframe-integrated propulsion
system results in an unprecedented
form of aeropropulsive-elastic
interaction, m which deflections of
the fuselage produce propulsive
force and moment perturbatkms
that may appreciably impact the
performance and control of the
vehicle. The objectives of this
research are to quantify the magni-
tudes of elastically induced pro-
pulsive perturbations for a repre-
sentative hypersonic vehicle and
to provide estimates of the impact
of these perturbations on the vehi-
cle's rigid-body flight dynamics.
Elastic mode shapes and in vac-
uo frequencies for a representative
hypersonic configuration are
shown in the portion of the figure
entitled "Aeroelastic Model."
From this model, fuselage deflec-
tions and angle-of-attack variations
were obtained in response to atmo-
spheric turbulence and aerodynam-
ic control effector pulses. The
fuselage deflections and angle-of-
attack variations were used as
inputs to a hypersonic propulsion
code that analyzed the entire
propulsion-system flow path,
consisting of the undersurface of
the fuselage forebody, the combus-
tor module, and the undersurface
of the fuselage afterbod.v. The
code predicted variations in
vehicle lift and pitching moment
with angle-of-attack and fuselage
deflection. Typical results are
119

Turbulence
Control
Deflections
PropulsivePerturbations
Aeroelastic Model
29Hz 3.8Hz 55Hz 57Hz
7.7 HZ 89 HZ _09 Hz
%%%Nonlinear Propulsion Model
6
2
xl05
½1
2 o 2 4
Angle of attack, deg
x106
0 -! ...........-4
2 0 2 4
Angle of atlack. 0e 9
Block diawaln or components used to model aeropropulsive-elasticmteractiom
shown in the portion of the figureentitled "Nonlinear Propulsion
Model." The symbols on these
graphs indicate the data for the
undeflected vehicle geometry, andthe brackets indicate the magnitude
of perturbations introduced by de-formation of the fuselage forebody
and afterbody. These perturbatkms
were subsequently fed back intothe aeroelastic model to assess
their impact on the dynamics ofthe combined system. Inclusion of
this effect significantly altered the
frequency and damping of the
vehicle's rigid-body modes. Non-
linearity of the propulsion-systemsensitivities also introduced uncer-
tainty into the prediction of the
vehicle's rigid-body flight dyna-mics.
The analytical results show that
significant propulsive lift, thrust,
FuselageDeflections
Angle ofAttack
I
i
i,91--
and moment perturbations may be
produced by elastic deformat on
of the fuselage for this type ol
vehicle. These perturbationsimpact the vehicle's rigid-boo y
flight dynamics and must be
accounted for to accurately predictthese modes. Furthermore, the
results provide quantitative esti-
mates of the sensitivity of thepropulsion system to fuselage
deflections and angle-of-attack
variations for use in designing a
robust control system for an air-
breathing hypersonic vehicle.(D. L. Raney, 44033, J. D. McMinn,
and A. S. Pototzky)
Flight Systems Directorate
Hypersonic Airbreathing
Vehide Design/OptimizationCode
A process for hypersonic vehi-
cle design/optimization has beenintegrated into a workstation-based
synthesis system on the Silicon
Grapb ic,; 1RIS workstation.
Airbreathing hypersonic vehi-
cles require the airframe to behighly integrated with the main
propulsion system. Interesting de-
sign trades result when attemptingto find the combination of vehicle
The OM is linked
with OptdesX to forman executable invokedfrom Executive.
OptdesX
From Executive
• New input ,/alue_
OMOptimizer Module
Coordinates the
Discipline Analyses
• Old input values
• Output function values
n
Weights
Aero
Prop
Performance
OptdesX drives optilnizatiol loop.
120
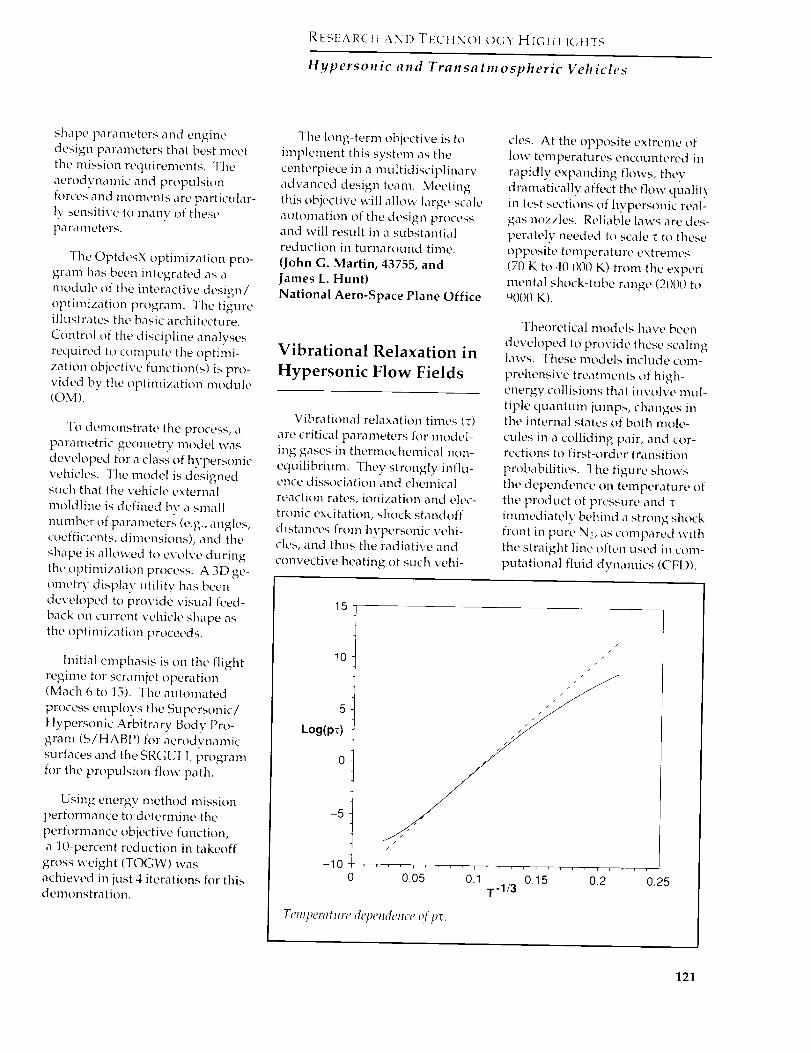
RESEARCtt ANI) TECt]NOI.OGY HIGHI.I(;t]TS
Hypersonic and Transatmospheric Vehicles
shape parameters and engine
design parameters that best meet
tile mission requirements. Tile
aerodynamic and propulsion
forces and mon]ents art' particular-lv sensitive to many of these
parameters.
The OptdesX optimization pro-
gram has been integrated as a
module of the interactive design/
optimization program. The figureillustrates the basic architecture.
Control of the discipline analyses
required to compute the optimi-
zation objective function(s) is pro-
vided by the optimization module(OM).
To demonstrate the process, a
parametric-geometry model was
developed for a class of hypersonic
vehicles. The model is designedsuch that tile vehicle external
moldline is defined by a smallnumber of parameters (e.g., angles,coefficients, dimensions), and the
shape is allowed to evolve during
the optimization process. A 3D ge-
ometry display utility has beendeveloped to provide visual feed-
back on current vehicle shape as
the optimization proceeds.
Initial emphasis is on tile flightregime for scramjet operation(Mach 6 to 15). The automated
process employs the Supersonic/
Hypersonic Arbitrary Body Pro-
gram (S/HABP) for aerodynamic
surfaces and the SRGULL programfor the propulsion flow path.
Using energy method mission
performance to determine tile
performance objective function,
a 10-percent reduction in takeoff
gross weight (TOGW) wasachieved in just 4 iterations for thisdemonstration.
The long-term objective is to
implement this system as the
centerpiece in a multidisciplinary
advanced design team. Meeting
this objective will allow large-scale
automation of the design processand will result in a substantial
reduction in turnaround time.
(John G. Martin, 43755, and
James L. Hunt)
National Aero-Space Plane Office
Vibrational Relaxation in
Hypersonic Flow Fields
Vibrational relaxation times (T)
are critical parameters for model-
ing gases in thermochenlical non-
equilibrium. They strongly influ-ence dissociation and chemical
reaction rates, ionization and elec-
tronic excitation, shock standoff
distances from hypersonic vehi-cles, and thus the radiative and
convective heating of such vehi-
cles. At the opposite extreme of
low temperatnres encountered in
rapidly expanding flows, they
dramatically affect the flow quality
in test sections of hypersonic real-gas nozzles. Reliable laws are des-
perately needed to scale "r to these
opposite temperature extremes
(70 K to 40 000 K) from the experi-
mental shock-tube range (2000 to9000 K).
Theoretical models have been
developed to provide these scalinglaws. These models include con>
prehensive treatments of high-
energy collisions that involve mul-
tiple quantum iumps, changes intile internal states of both mole-
cules in a colliding pair, and cor-rections to first-order transition
probabilities. The figure shows
tile dependence on temperature of
the product of pressure andimmediately behind a strong shock
front in pure N2, as compared with
the straight line often used in ctm_-
putatkmal fluid dynamics (CFD).
15
10
5
Log(pO
-5
-10
/
, , , i , , T l , , r
0 0.05 0.1 0.15T-1/3
Temperature dt'pemh'nce Of pv.
121

Fartherdownstream,asvibrationalexcitationincreases,*rbecomesafunctionalsoofthevibrationaltemperaturetoindicateabreak-downof theconventionalassump-tionofa linearrelationbetweencause(nonequilibrium)andeffect(relaxation).CurrentCFDcodesarebeingcorrectedfortheseandotherdeficienciesthatrelateto therelaxationprocessinhighlynon-equilibriumgasmixtures.Theresultwill beanimprovedcapabil-ity ofCFDcodesforpredictingaerodynamicperformancesandheatloadsofhypersonicvehicledesigns.Commercial applications
abound in the rapidly emerging
fields of nonequilibrium chemistry
and chemical synthesis, plasma,and laser technologies.(W. E. Meador, 41434,
M. D. Williams, and G. A. Miner)
Space Directorate
Aerothermodynamics of a
MESUR Mars Entry
The Mars Environmental Sur-
vey (MESUR) I'athfinder Mission
proposes the landing of a probe
on Mars to observe the planet'ssurface and atmosphere. TheMESUR entry vehicle is envisioned
to have a Viking-style forebodv
(7@' sphere cone), 2.65 in in diame-ter, with a nose radius of 0.6625 m
and a conical afterbody. Design of
the thermal protection system forthe MESUR vehicle requires an
accurate definition of the entryaerothermal environment.
The computational code
LAURA (Langley Aerothermo-
dynamic Upwind Relaxation Algo-
rithm) was modified to predictthermochemical nonequilibrium
Flow-field strcamlim's about MESUR entry vehich'.
entry flows in Mars' Co2-N2 atmo-
sphere. Flow fields have been
computed for the MESUI; trajecto-ry',, maximum stagnatioi_ heating
point. These flow fields reveal the
surface pressures and heating onthe vehicle as well as the wake
flow structure.
The figure displays streamlinesabout the vehicle for a z_ ro-angle-of-attack case at 37 km altitude
and 6,5 kin/see velocity, l_he wake
is characterized by a system of
recirculating vortices, th,_' largest
and strongest of which impingeson the vehicle's aftmost corner.
This impingement results in aheat-transfer rate at that corner of
7 W/cm 2, which is three times
greater than the predictim_ for the
rest of the afterbody. Th, _ forebody
stagnation-point heat-transfer rate,assuming a full}, catalyt c wall, is118 W/cm:.
(Robert A. Mitcheltree, 44382)
Space Directorate
Nonequilibrium Flow
Code Developed for
Prediction of Flight
Shock-Shock Interference
Aerothermal Loads
A nonequilibrium llow code
was developed for industry to pre-dict shock-shock interference aero-
thermal loads for flight condition>.
A second objective was to deter-
mine aerothermal heating on a
0.1-in-radius cylindrical body that
represents a blunt leading edgecaused by a type IV shock-shockinterference at Mach 15 and a
dynamic pressure of 2000 psf in
chemical and thermal nonequili-brium flow.
The solver part of LARCNESS
(Langley Adaptive RemeshingCode and NaviEr-Stokes Solver)was modified to account for chem-
ical and thermal nonequilibrium
flows typical of hypersonic flight.Air was modeled as a mixture of
five chemical species (O2, N2, O,
122

RESEARCtt AND TECHNOLOGY HIGttLIGHTS
Hypersonic and Transatmospheric Vehicles
U-Velocity Contours
15
10
P/Po
5
0-20
60 000
40 000
q,Btu/ft2-sec
20 000
0-20
Po = Free-stream Pitot Pressure
-18 -16 -140, deg
........... Fully Catalytic Wall
Noncatalytic Wall
-18 -16 -140, deg
U-velocity contours and pressure amt heat_filux distributions for a O. l-in-radius cylimh'r in Mach 15 nonequilibrium
flOW.
NO, and N) and with two tempera-
tures (translational and vibra-
tional). Unstructured meshes of
triangular and quadrilateral ele-
ments are used as they lend them-
selves to adaptation. The final
mesh had over 155 000 elements
with a spacing of about 0.05 ° on
the body where the heat flux
reached peak values. The mesh
of quadrilateral elements on the
body had a minimum thickness
of 1.0E-7 in.
The type IV, supersonic-jet,
shock-shock interference flow field
is complex; it has two triple points,
two shear layers, and a supersonic
jet that undergoes repeated expan-
sions and compressions before ter-
minating in a normal shock close
to the body. The supersonic jet,
the surrounding shear layers, and
the terminating normal shock are
very clearly illustrated by the velo-
city contours. The pressure on
the body behind the terminating
normal shock is uniform over a 1 °
interval; the heat-flux distribution
shows two peaks. The peak heat
flux is about 48 00f) Btu/ft2-sec for
a fullycatalytic wall and 38 000
Btu/ft--sec for a noncatalytic wall
(see figure). The code has been
validated on existing equilibrium
test data.
Such information is critical in
the design of leading edges for hy-
personic vehicles. The present
study also demonstrates the need
for highly refined meshes to cap-
ture the details of the flow features
in this type of problem.
(Allan R. Wieting, 41359)
St_'uctures Directorate
New Wing Concept for
Reducing Supersonic
Inviscid Drag
Aircraft that are designed to fly
at supersonic speeds, such as
advanced tactical fighters and the
high-speed civil transport, gene-
rate a complex sequence of shocks
that increase the drag of the air-
craft. These shocks are unavoid-
able, but the drag they create can
be reduced by modifying the geo-
metry of the aircraft. One type of
geometry modification to obtain
drag reduction is the recontouring
of the wing airfoil.
A new airfoil concept has been
developed that takes advantage of
the shocks that occur at supersonic
speeds. For this new concept, the
123
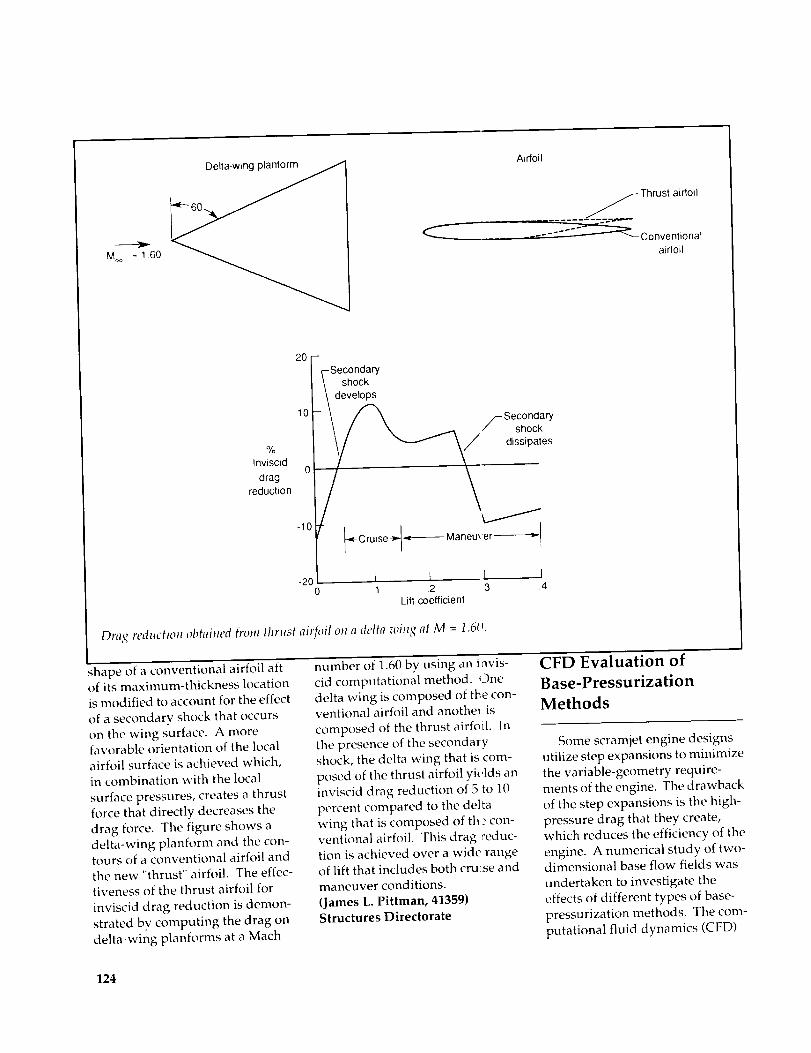
M = 1.60
Airfoil
_ Thrust aidoil
...... Conventional
aidoil
%
Inviscid
drag
reduction
20 [-_-Secondary
|\ shock
I0 /- Secondaryshock
dissipates
0
Cr ise -_------Maneuver---------_
-20 I l I0 .1 .2 3 .4
Lift coefficient
Drag reduction oblaim'd (rom thrust ait_h_il on a delta wing at M = 1.60.
shape of a conventional airfoil aftof its maximum-thickness location
is modified to account for the effect
of a secondary shock that occurson the wing surface. A morefavorable orientation of the local
airfoil surface is achieved which,in combination with the local
surface pressures, creates a thrust
force that directly decreases the
drag force. The figure shows adelta-wing planform and the con-tours of a conventional airfoil and
the new "thrust" airfoil. The effec-
tiveness of the thrust airfoil for
inviscid drag reduction is demon-
strated by computing the drag on
delta-wing planforms at a Mach
number of 1.60 by using an invis-
cid computational method. One
delta wing is composed of the con-ventional airfoil and anothel is
composed of the thrust airfoil. In
the presence of the secondary
shock, the delta wing that is com-
posed of the thrust airfoil yMds an
inviscid drag reduction of 5 to 10
percent compared to the deltawing that is composed of the con-
ventional airfoil. This drag reduc-
tion is achieved over a wide rangeof lift that includes both cruse and
maneuver conditions.
(James L. Pittman, 41359)Structures Directorate
CFD Evaluation of
Base-Pressurization
Methods
Some scramjet engine designs
utilize step expansions to minimize
the variable-geometry require-
ments of the engine. The drawback
of the step expansions is the high-
pressure drag that they create,
which reduces the efficiency of the
engine. A numerical study of two-dimensional base flow fields was
undertaken to investigate the
effects of different types of base-
pressurization methods. The com-
putational fluid dynamics (CFD)
124

RESEARCH AND TECHNOLOGY HIGHLIGHTS
Hypersonic and Transatmospheric Vehicles
f
1 2 _- Fuehng Designs
L_ No Base Fueling
1.0
b"0.8O
UJ
g•_ 0 6
rf
_ 0,1
E3
0.2
Verllcal Blee_
_, _-_. A×,al Bleed
iBase Drag= 0_-_-_--_ _
j- ,
o.o_0.000 0.050 0 100 0150 0.200
BaseFueling Rate
Computed base-pressurization results fi_r various modes of fuel injection.
Arrows indicate effect of adding jet thrust of supersonic slot injectors.
code used for this study was the
General Aerodynamic SimulationProgram (GASP) that was deve-
loped by Aerosoft, Inc.
Hydrogen fuel was injectedfrom the base to add mass and
heat (through combustion) to the
flow in the low-pressure recircula-
tion region that sets up just down-
stream of the step. With proper
design, these additions can in-
crease the pressure in the baseregion and reduce the overall base-
pressure drag. The three different
methods of injecting fuel into the
base are illustrated in the figure:
vertical subsonic transpiration, ax-ial subsonic transpiration, and
supersonic slots or ports. Theresults for these cases are sum-
marized in the figure in terms of a
drag-reduction efficiency, whichis the ratio of the effective base
pressure to throat pressure. Thevertical-bleed cases, because diffu-sion of oxidizer down into the base
region causes combustion in thelow-Mach-number recirculation
region, did not generate a large in-
crease in the base pressure. The
axial-bleed cases proved to have
the best pressurization ability ofthe three designs, because the com-
bustion region was confined to the
high-Mach-number shear layer
and because the large-total pres-sure losses that resulted increased
the pressure in the base region
considerably. The supersonic slot
injection cases tended to scavenge
mass from the base region, andthese designs produced little base
pressurization. However, the
supersonic slots have significantstreamwise momentum, which
adds considerable thrust force;when this is factored in, the overall
drag-reduction efficiencies of the
axial-bleed and supersonic-injection
methods become approximately
equivalent. This work was done
under contract with AnalyticalServices & Materials, lnc.(Charles R. McClinton, 46253, and
Paul H. Vitt)
National Aero-Space Plane Office
Structural Analysis of
Hypersonic Vehicles
Analyses of a hypersonic vehi-
cle demonstrate the improvement
of a new structural panel formu-lation. The formulation is for
airframe and engine surfaces
designed as composite stiffened
panels. Analyses of a hypersonic
vehicle using this improved for-
mulation and using traditionalformulations were performed for
Mach 10 in-plane and through-the-
thickness temperature gradients.
Visible in the figure are the differ-
ences between the correct analysis
of the improved formulation andincorrect traditional analysis.
Although not shown, comparable
differences occur for computed
thermal forces and computedmechanical forces and moments.
High-speed aircraft are fre-
quently designed with fiber-
reinforced composite-stiffened
panels. Such panels are highly
unsymmetric and orthotropic,therefore, the formulation of stiff-
ness, thermal expansion, and
thermal bending is complex. Ahat-stiffened, fiber-reinforced,
metal-matrix composite is used in
this design. Metal-matrix compos-ites are chosen for their high-
temperature capability; some have
a service use up to 1300°F. When
allowing a stiffened panel to reach
these high temperatures, its largemembrane, bending, and
membrane-bending coupling
thermal response must be
analytically quantified.
Differences in the displayedthermal moments are due to dis-similarities in the formulations of
panel-stiffness terms and thermalcoefficients. Traditional methods
that are currently being practiced
125

Improved Analysis
MOMENTS
Ill 900700
-. 500l__&'y_ w High moment _ 300
'_- Low moment _ 100
Traditional Analysis
Moment is uniformover area
Panel membrane--bending
coupling causes a moment
variation across the surface.
Calculatiou o( thermal momeHt for a hypersottic vehicle flying at Mach 10. (Orig, inal of fig, ure in color; contact attthor
h_r more informatiom)
omit panel orthotropic compatibil-
ity, membrane-bending coupling
of unsymmetric stiffness, andmembrane-bending coupling of
unsymmetric thermal expansion
and bending. The improved for-
mulation includes this data by
extending classical lamination
theory to the stiffened cross sec-tion and introducing additionalthermal coefficients. It is robust
enough to handle panels with gen-
eral cross-sectional shapes. Special
terms in the equations represent
the actual shape of the stiffening
member. By implernenting this
capability with a single plane ofshell finite elements using the
MSC / N ASTRAN TM analysis
program, the vehicle model can
accurately solve thermal forcesand moments.
(Craig S. Collier, 43767, and JamesL. Hunt)
National Aero-Space Plane Office
Symmetric Scramjet
Free-Flight Experiment
The objective of this work was
to design a "low cost," low-risk
Mach-15 scramjet flight exf,eri-ment as a candidate for the ',,Iation-
al Aero-Space Plane (NASI')
HYFLITE program. The resultantconfiguration was a rocket-t,oosted,
free-flying fin-stabilized syJnmetri-
cal engine as depicted in tl',e fig-
ure. Cycle analysis indicated that
this configuration could p_oducesufficient thrust to accelerg re, thus
demonstrating scramjet p_ rfor-mance at very high speeds Several
potential problems associa l:ed withthe small scale were addr_ ssed
more rigorously. These includedinlet combustor and nozzle
heating, inlet mass capture, inlet
boundary-layer transition, fuel
mixing and finite-rate chemical ki-
netics, and scramjet nozzle flowinteraction on the circular stabi-
lizer fin. The design of the sym-
metric flight vehicle involved
several component trade studies.The forebody trade study, using a
viscous blunt-body flow solver,
CFL3DE, with an engineeringtransition criterion for Gortler vor-
tices, encompassed several vehiclescales, nose radii, and an inlet
compression ramp radius of cur-vature to determine forebody con-
tour shape requirements for pro-riding turbulent flow at the inlet
entrance. From this study, a suit-
able forebody contour shape wasselected for a three-dimensional
analysis to assess spanwise flow
spillage along the compression-rampsurface and at the inlet shoulder.
Results from that analysis indicate
an acceptable mass capture of
79 percent for a full-span inlet
126

RESEARCHANDTECHNOLOGYHIGHLIGHTS
Hypersonic and Transatmospheric Vehicles
rnfet throat
Symmetric scran(jet h'ce-flyc'r concept.
Inlet compression ramps
Stabilizing fins
at the shoulder. The combustor,
nozzle, and fin interaction studies
were performed using a three-dimensional, parabolized Navier-Stokes solver, SHIP, and a one-
dimensional (three temperature),
finite-rate chemical kinetics analy-
sis tool, SCRAM3. Analysis indi-
cated a small positive effect ofreduced combustor scale on mix-
ing and combustion efficiencies.
At the smaller scale, the mixing ef-
ficiencies actually increased slight-
ly because of Reynolds numbereffects. Because the finite-rate
chemical kinetics are fast at these
high flight Mach numbers, the
combustion efficiency alsoincreased.
Etlt_'ct of trip size oJ1thermal maplfin_,,. (OrG, inal of figure in color: contact_HIt]IoF foF 111012' Mfor,tatio_i.)
This work was done under con-
tract with Analytical Services &Materials, Inc.
(C. R. McClinton, 46253, A. D.
Dilley, and R. W. Hawkins}
National Aero-Space Plane Office
Hypersonic Slender-Body
Boundary-Layer
Transition
Wind-tunnel tests have been
conducted to determine the surface
roughness criteria for hypersonicslender-body boundary-layer tran-
sition in the presence of a three-
dimensional adverse pressure gra-
dient in support of the Hypersonic
Flight Test Experiment (HYFLITE),
a proposed study within the
National Aero-Space Plane (NASP)
Program. HYFLITE representsthe testing of subscale, unman-
ned flight vehicles to examine
boundary-layer transition and
scramjet performance at hyper-
sonic speeds. The proposed ther-
mal protection system (TPS) for
the flight vehicles incorporatestiles similar to those used on the
Space Shuttle orbiter, with the
127

associatedroughnessdueto tilegapsandsteps.Theobjectiveofthesubjectwind-tunneltestsis todeterminetheeffectsofvariousroughnessheights,shapes,andlocationsrelativeto theleadingedgeonthetransitionprocesstoassessthefeasibilityofusingsuchaTPSsystem.
Phase[ testswereperformedin theLangley31-1nchMach10and22-InchMach20HeliumTunnelswithexistingmodelstoobtaininitialestimates.A NASPconfiguration202forebody(o_=5°,ReL= 3x 10_'),a two-dimensionalisentropiccompressionramp,andatwo-dimensionalflatrampwereusedwithvarioustransitiontrips
toestimatethecombinedeffectofroughness,adversepressuregradient,andthree-dimensionalboundary-layersontransition.Globaltemperaturedistributionsweremeasuredusinginfraredthermographytodetermineregionsthatpossiblycorrespondtoboundary-layertransitiontoturbulence;heat-transferdatacalculatedfromthethermalimagesfortheseregionswereusedtobetterdefinetheonsetof transi-tionandthenatureofthetransitionfrontasmodifiedbythevarioustransitionstrips.Hence,aviabletestingtechniquewasdevelopedanddemonstratedtostudyboundary-layertransitionathypersonicspeeds.Phase! testing
hasbeencompleted,andadetailedanalysisoftheextensivedatabase,includingcomparisontocomputa-tions,isunderway. Preliminaryfindingsindicateanunexpectedsensitivitytosmallroughnessthatmaylimit theroughnesscriteriafortheflightvehicle.(Scott A. Berry, 45231)
Space Directorate
Hypersonic Shock-ShockInteractions
Experiments were perforrned toexamine the effects of flow chemis-
try, geometry, and boundary-layer
i
Objective: Example of Type-IV Interaction• Investigate effect of fin leading-edge sweep and M = 6 air
radius on hypersonic shock interaction Bowshock
, .....
'shock i':i }
• Determine shock inclination angles required toavoid "Type-IV" interactions (very high heating)
Approach:
• Use diagnostic tools to examine interactionsbetween incident and bow shocks
• Schlieren
• Relative intensity phosphor and infrared thermography
° Surface streamline oil-flow visualization
° Thin-film heat-transfer gages
Experimental Setuo in 15-InchMach 6 High-Tempef'ature Tunnel
Interchangeablefin-_•"_ rBow\
Interaction_ _s_-_
F_._II_ Incident \ _ []
nerato Diffuser,
E frared Thermostat, by Results at 2£_ S,,*,eep i_ 15" Math _, TL,_r_elRun ._9, 9 ' Sho_k Ger_rator, 0,25 inch Radius, Re 4x 10⁵/11 I
I . 'i' Ii
NASP government work packages---shock-shock interactions. (Or:ginal of fi_,ure in color; contact author for moreinformation.)
128
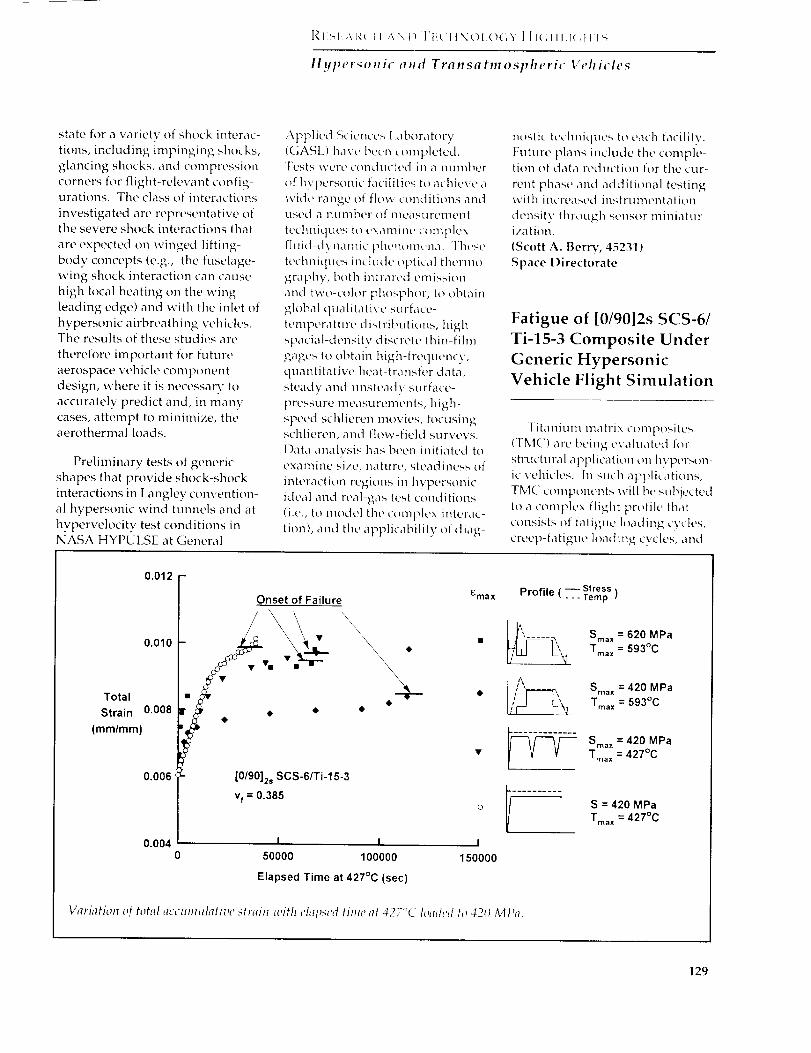
Rt_l,Ab:_ t l \\:I_'FE(IINOIA_(;Y U[(;lll.[(;ltl_.
ttypersottic and Transatmospheric Vehicles
state for a variety of shock interac-
tions, including impinging shocks,
glancing shocks, and compression
corners for flight-relevant colffig-
urations. The class of interactions
investigated are representative of
the severe shock interactions that
are expected on winged lifting-
body concepts (e.g., the fuselage-
wing shock interaction can cause
high local heating on the wing
leading edge) and with the inlet of
hypersonic airbreathing vehicles.
The restilts of these studies are
therefore important for future
aerospace vehicle component
design, where it is necessary to
accurately predict and, in many
cases, attempt to minimize, the
aerothermal loads.
Preliminary tests of generic
shapes that provide shock-shock
interactions in Langley convention-
al hypersonic wind tunnels and at
hypervelocity test conditions in
NASA HYPULSE at General
Applied Sciences I,aboratory
(GAS13 have been completed.
Tests were conducted in a number
of hypersonic facilities to achieve a
wide range of flow conditions and
LIsed a l]Lll]lbel- el l]leaStlrel-l]ellt
techniques to t'xallliilc' complex
fluid-dvllami¢ t_hemm_cna. These
techniques include optical thernlt>
graphy, both inlrared emissi,<m
and two-color phospilor, to obtaiI1
global qualitative stirface-
lernpera ttl re d iMribu lions, high
spaciat-density discrete thin-film
gages to obtain high-freqtiency,
quantitative heat-transfer data,
steady and unsteady surface-
pressure nleasurements, high-
speed schlieren movies, focusing
schlieren, and flow-field surveys.
Data analysis has been initiated to
examine size, nature, steadiness of
interaction regions in hypersonic
ideal and real-gas test conditions
(i.e., to model the complex interac-
tion), and the applicability of diag-
m_stic technique<; to each facility.
Future plans include the comple-tion of data reduction for the cur-
rent phase and additional testingwith increased iilstrumentation
density through sensor miniatur-ization.
(Scott A. Berry, 45231)
Space Directorate
Fatigue of [0/9012s SCS-6/
Ti-15-3 Composite Under
Generic Hypersonic
Vehicle Flight Simulation
Titanium matrix ctmlposites
(TMC) are being evahlated fi,r
structural application on hypers<m-
ic vehicles. In such applications,
TMC compolwnts will be subjected
to a complex tlight profile th<tt
consists of fatigue loacling cycles,
creep-fatigue loading cycles, and
Total
Strain 0.008
(mm/mm)
0.012
Onset of Failure Emax
\\
0.010 v _ •\ .
v v" • ,,,,\
_,X_ .@
@ • •
0.006 ' [0/9012s SCS-6/Ti-15-3
vf = 0.385©
0.004 I I I
0 50000 100000 150000
Elapsed Time at 427°C (sec)
Profile ( -- Stress- - - Temp )
Smax = 620 MPa
Tma x = 593°C
Smax = 420 MPa
Tmax = 593°C
Sma= = 420 MPaTma x = 427°C
I .........
S = 420 MPa
Tmax = 427°C
Variation _!f total accumulative strain with elapsed lime at 427<'C loaded to 420 MPa.
129

thernlomechanical fatigue (TMF)
loading at various elevated tem-
peratures. It is essential that the
life-limiting mechanisms be identi-
fied and incorporated into a life-
prediction methodology. The
objective of this research was toevaluate fatigue behavior of the
10/9Oh_, SCS-6/Ti-I 5-3 compositeunder a combination of load, time,
and temperature that may occur
during a generic hypersonic flight.
Several different load-
temperature profiles were applied
to the composite as illustrated in
the figure. All profiles had thesame sustained stress of 420 MPa
applied at the sustained tempera-ture of 427_C. The accumulative
strain (both mechanical and ther-mal) for each test was recorded
and plotted against elapsed time at
427"C (see figure). Somewhat
surprisingly, the sustained-load /
sustained-temperature test (the
open circles) accumt_lated strain atthe fastest rate and failed in the
least time. This occurred in spite
of the fact that the other profiles
had cyclic loads and temperatures.The test data also indicate that the
total strain to failure decreases
with increased time at tempera-
ture under load. This implies anenvironmental attack on the fiber
that reduces the fiber strength
over time. For the flight profilestested, the results indicate that
holding load under elevated tem-
peratures nlav be the most detri-
mental condition to apply to a tita-
nium matrix composite. A failurecriterion based on the failure strain
in the t)_' fiber can be used if it
accounts for the appropriate envi-
ronment degradation of the fiber
strength.(M. Mirdamadi, 43463, and
W. S. Johnson)Structures Directorate
Measurement and
Prediction of
High-Temperature Cyclic
Deformation in Titanium
Matrix Composites
Titanium matrix composites(TMC) reinforced with continuous
silicon fibers are being consideredas structural materials for elevated-
temperature applications in
future-generation hypersonic
vehicles. The objective of this
research is to experimentallydetermine the global stress-strain
response of a [0/9012s SCS-6/Timetal-21S (current NASP base-
line material) composite that is
subjected to a portion of a generic
hypersonic flight profile and to an-alytically predict the lami_;ate
stress-strain response. The analy-sis will also include fiber-matrix
interface failure.
A thermomechanical fatigue
(TMF) test capability was deve-
loped to conduct a generic hyper-
sonic flight profile (as shown in
figure insert). A liquid-nitrogen
cooling system and an induction
heating system were required to
achieve precise control of the cool-
ing and heating rates. A two-dirnensional micromechanical
model (VISCOPLY) was used to
predict the global stress-strain
response of the composite sub-
jected to the TMF flight profile.The VISCOPLY code is based on
constituent properties and uses
the vanishing fiber diameter (VFD)
model to calculate the orthotropic
properties of a ply. The ply pro-perties are then used in a laminate
analysis to predict the overall lam-
inate stress-strain response. Thefiber and the matrix can both be
modeled as viscoplastic with tem-
perature dependency. In thecurrent analysis, the fibers wereassumed to remain elastic with
temperature-dependent properties,and the matrix was modeled as a
thermoviscoplastic material. Testswere conducted on the Timetal-21S
matrix at various temperatures(21 C to 760°C) to determine the
500 8oo VISCOPL._Y_,. 400_ I f • = -- -- Temp I 0 1 2 3 4&5
300 1 /1 " _"---'-SIress]600 _
400 t , boo /o°//Z8,0: ' 1 000- /oTde
o ,o'o.oo, o,ooo300 Time (Sec) _ //_
StresS(MPa) //pda ta cyctes 2-S200
0 _ i I A I , I
0.000 0.002 0.004 0.006 0.008
Total Strain {ram/ram)
Mt'astlt'¢d alid predicted s!rt'ss-strain rt'sponst' off titaniunl nlatFix
composite.
130

RESEARCH AND TECHNOLOGY H IGHL1GttTS
Hypersonic and Transatmospheric Vehicles
viscoplastic matrix material con-
stants required by the material
model in VISCOPLY. Temperature-dependent elastic material proper-ties of the SCS-6 fibers were found
in the literature. Fiber-matrix
interface failure was accounted for
in the analysis by multiplying thefiber transverse modulus of the 90 °
plies by 0.1. The measured and
predicted responses of the compos-ite when subjected to a portion of
the TMF flight profile are shown in
the figure. As seen in the figure,
the experimental stress-strain
response and tile VISCOPLY pre-diction stabilized to tile same
stress-strain state (tile prediction
took four cycles to stabilize; tile
actual test took two cycles).(M. Mirdamadi, 43463, and
W. S. Johnson)Structures Directorate
Nonlinear Thermoacoustic
Response Method for
MSC/NASTRAN
The equivalent linearization
method of predicting the nonlinear
response of structures was incor-porated into the MSC/NASTRAN
finite-element program. This
method has been developed, veri-
fied, and enhanced over the past
20 years for combined thermo-acoustic mechanical loads, but it
has not been widely used outsidethe research community.
The procedure was implemented
as an iterative-solution sequence
by the Direct Matrix Abstraction
Programming (DMAP) language.The use of MSC/NASTRAN
allowed the implementation of
this method to be very general;
hence, it is applicable not only to
7400
68OO
62_0
56O0
5000
44O0
3800
32O0
26OO
!-' 0_3
_10,3
Deflected shape mtd stress contours for a typical TPS concept.
textbook-type problems, but also
to complex structural configura-
tions. The implementation of the
equivalent linearization solution
procedure has been verified with
respect to a host of previouslypublished textbook-type examples.
Tile figure depicts a hexagonal-
shaped thermal-acoustic protection
system (TPS) that covers an area ofapproximately 3.5 ft 2 and is 2.5 in.
thick. This TPS concept is con-structed from a carbon/carbon
panel that is connected to a honey-
comb backup structure with sixtitanium satellite posts around
a center post. The figure shows
the principal root-mean-squarestresses on the carbon/carbon
panel and backup structure for
the anticipated thermoacousticloads. The figure shows significant
stress concentrations at the post-
attachment locations and relativelylower stresses elsewhere. The
reduction of these stress concentra-
tions in the area of tile post attach-
ments has already been identified
as a priority in the design of this
type of thermal protection system.
Tile high levels of stress in the
backup structure arise from the
high thermal expansion coefficient
of the material and the rigid boun-
dary condition that is imposed on
the backup structure. The non-
linear dynamic analysis of this
structure differs from linear dyna-
mic analysis primarily in the fre-quency content of the response.
The nonlinear analysis predicts
higher frequencies in the response
and subsequently shorter fatiguelife.
This new capability will allow
design engineers to predict thenonlinear thermoacoustic mechan-
ical response of complicated struc-tures. The immediate significance
of the program is that it will assistin the evaluation of candidate ther-
mal protection systems for hyper-sonic vehicles.
(Jay H. Robinson, 436011Structures Directorate
Flutter Characteristics of
a NASP Model Determined
in TDT
The proposed National Aero-
space Plane (NASP) consists of a
long, flexible, lifting-body fuselage
131

Wing-Pivot Flutter ResultsStiffness Experiment Linear Analysis
Baseline •
Increased •
1.6
1.4
Normalized 1.2flutter
dynamic 1.0pressure,
q/q* .8
.6
m
, , I , I , I , I , I , IA
"".2 .3 .4 .5 .6 .7 .8
Mach Number
Comparison of wimt-tunnel and flutter analysis results for NASP aeroela,_tic model. L-92-12800
and relatively small, highly swept,
all-movable, clipped-delta wings.
The fuselage flexibility and the all-
movable feature of the clipped-delta wings may make the vehicle
susceptible to aeroelastic instabili-
ties throughout the flight envelope.A wind-tunnel test of a NASP
model was conducted to meet
three objectives: to measure theflutter mechanism inherent to this
type of vehicle; to examine the
effect of parametric variations onthe flutter behavior of the model;
and to correlate the experimental
data with analysis.
A 1/10-scale representation ofan unclassified version of the
NASP vehicle was flutter tested in
the Transonic Dynamics Tunnel(TDT). The model had all-movable,
clipped-delta wings and canti-
levered, clipped-delta vertical ins.
A photo of the model mountec inthe wind tunnel is shown in fine
figure. A flutter analysis of th,
model was performed using c; lcu-
lated linear, lifting-surface aer _-
dynamics.
Analytical and experimenh I re-
suits for two configurations ot themodel are shown in the figure
The first configuration was th,'
baseline model. The parametlic
variation for the second confif ura-tion involved an increase in tl e
wing-pivot stiffness. The prirlary
flutter mechanism was body-freedom flutter that involved the
fuselage-pitch mode and the v:ing-
pivot mode. The figure shows the
experimental and analytical rt suits
in terms of normalized dvnamic
pressure versus Mach number.
The wind-tunnel test of this
model showed that NASP-type ve-
hicles that employ single-pivot,
all-movable wings are susceptible
to body-freedom flutter. The test
results show that increasing the
wing-actuator-pitch stiffness canmake the body-freedom flu tter
instability less critical. The correla-
tion of flutter analysis to the exper-imental data indicates that the
mathematical tools used in this
study were sufficient to predict the
body-freedom flutter encounteredin the wind tunnel.
(Stanley R. Cole, 41267}Structures Directorate
132

RESEAI?,CH ANDTECHNOLO(;Y HIGttLIGItTS
Hypersonic and Transatmospheric Vehicles
133

RESEARCH AND
TECHNOLOGY
Space Transportation
Provide technolo,_! for the
current and evohttionan! S 1,ace
Transportation System (STIr)
and establish the technolo_/ base
for h#mv tr,msportation sy:,tem
de_vlop_nents

RESEARCH AND TECHNOLOGY HIGHLIGHTS
Space Transportation
Development of a Green's
Function Code for Cosmic
Radiation Protection
Astronauts and the crews of
high-altitude aircraft are exposed
to heavy-ion cosmic radiation that
originates from the Sun and galac-
tic sources. The shielding and
exposure of these people are con-
trolled by the transport of radia-tion through matter. Efficient
space-radiation transport codes
have been developed and applied
to a wide range of missions, butthe results of these codes could not
be accurately validated in laborato-ry experiments. Now, the use of
Green's function techniques has
led to an efficient laboratory code(GRNTRN), which will be further
developed for space-radiation
transport calculations and will bevalidated with high-energy heavy-
ion beam experiments.
Recent iron-beam transportmeasurements made at the
Lawrence Berkeley LaboratoryBevalac accelerator by a team from
the University of San Francisco
provide an opportunity to validatethe Green's function code. The
iron beam had been accelerated to
10 0
10 1 _ GRNTRNX
-_ o Expt.
10-2==
_- 10-3
II' °Y°a.°o10 4 o'o ,.
0 50 1O0 150 200 250 300
LET, keViu.m
Comparison of GRNTRN results with iron-beam experiment.
135

600 million electron volts per
atomic mass unit and passed
through a series of beam transport
elements, triggering devices, and a2.24 g/cm 2 lead foil beam spreader
prior to emerging from the beam
tube and striking a layer of alumi-num or polyethylene targets. The
linear-energy transfer spectra of
the degraded beam through the
targets was measured by plasticnuclear track detectors. The data
were compared with GRNTRN re-
sults as shown in the figure for a4.6 g/cm 2 polyethylene target.
The agreement was achieved onlyafter accounting for effects due
primarily to the lead foil for sub-
stantial beam-energy loss and ion
fragmentation before striking the
target.(J. L. Shinn, 41427)
Space Directorate
Ground Facility
Simulations of Shuttle
Orbiter Hypersonic
Aerodynamics
During the first flight of the
Space Shuttle orbiter (STS-1), tile
body-flap deflection required for
hypersonic trim was approximate-ly two and one-half times that esti-mated from extensive wind-tunnel
testing prior to the flight. This
so-called "pitch-up anomaly",
believed to be caused by mispre-dieting compressibility, viscous,
and/or real-gas effects, was easily
handled on subsequent flights byutilization of the elevons. Because
the cause of the pitch-up anomaly
was never really resolved, two
existing high-fidelity orbitermodels were refurbished and
retested. These two orbiter models
(0.004 and 0.0075 scale) were
0.00
-0.04
Cm
-0.08 _o":_G_,_=, ,_1 "__--_
+ Air 7__16.3 o
+ 16.3 0 CF4
-0.12 ..........0 20 30 40 50
o_, deg
Effect Of change in gamma :m pitching-moment characteristics of O.OO4-scale
Space Shuttle orbiter obtained in 15-Inch Mach 6 Hiy, h-TemperatureTunnel and 20-1rich Mach 6 CF4 Tunnel. M_= 6: 8m = 0 ° and I6.3 °.Moment center at 65%.
tested in five separate Langleyfacilities at Mach numben,, from 6
to 18.5, at Reynolds numl_ers from0.5 to 8 x 10⁶ per foot, and most im-
portantly, at ratios of specific heats(y) of 1.22, 1.4, and 1.67.
This effort, though not complete
to date, has provided significant
insight into the cause of the anoma-ly by effectively eliminating sever-
al potential causes while 'ocusing
in on one specific cause. ]'40 signif-
icant support interfereno, effects,which could be construed as hav-
ing contributed to the an,)maly,
were observed h)r the raJ_ge of
models, supports, and te.4 condi-
tions investigated. The _rbiter
basic aerodynamics that were mea-sured in the ideal-gas facilities
agreed well with the 19T" Aerody-
namic Design Data Book (ADDB),
which was also based o_ ideal-gas
results. Body-flap effectiveness in-
creased with increasing _eynolds
number as expected and agreed
reasonably well with tht 1977ADDB. In addition, at low
Reynolds numbers, the body-flap
effectiveness did not ch_nge witheither Mach number or 7. These
results indicate that the cause of
the anomaly was not a poor esti-
mate of the body-flap effectiveness;
real-gas effects caused the ano-maly. As shown in the figure, test-
ing in a heavy gas, in this case CF4,
to simulate the low-3' aspect of a
real gas very closely approximates
the nose-up increment in pitchingmoment of 0.03 that occurred dur-
ing flight on STS-I. Lowering 7
within the shock layer causes the
flow to expand on the aft portion
of the body to lower than ideal gaspressure levels and produces a
loss in normal force and a signifi-
cant nose-up increment in pitchingmoment.
(John W. Paulson, Jr., 45071, and
Gregory J. Brauckmann)Space Directorate
Orbiter Experiments
(OEX) Aerothermo-
dynamics Symposium
The Orbiter Experiments (OEX)
Program, initiated in the mid-
136

RESEARCIt AND TECHNOLOGY HIGHI.IGIITS
Space Transportation
1970's, provided a mechanism forutilization of the shuttle orbiter as
an entry aerothermodynamic
flight-research vehicle as an
adjunct to its normal operational
missions. Under the auspices of
the OEX Program, elements of aer-othermodw_amic research instru-mentation flew aboard the orbiters
Columbia and Challenger. These
OEX experiment instrumentation
packages obtained in-flight mea-
surements of the requisite para-meters for: (l) determination of
orbiter aerodynamic characteristics
(both static and dynamic) over the
entire entry flight regime, and(2) determination of the aerodyna-
mic heating rates imposed upon
the vehicle's thermal protection
system during the hypersonic por-
tion of atmospheric entry.
The data derived from the OEX
complement of experiments repre-
sent benchmark hypersonic flightdata heretofore unavailable for a
lifting entry vehicle. These dataare being used in a continual pro-cess of validation of state-of-the-art
methods, both experimental and
computational, for simulating/
predicting the aerothermodynamic
characteristics of advanced spacetransportation vehicles.
The Orbiter Experime;Its (OEX)
Aerothermodynamics Symposium,
held in April 1993, provided aforum for dissemination of OEX
experiment flight data and fordemonstration of the manner in
which these data are being usedfor validation of advanced vehicle
aerothermodynamic design tools.
The Symposium's invited speakers
included OEX experiment princi-
pal investigators and other resear-chers who have been active users
and analysts of the orbiter entry
flight data. Proceedings of this
syn3posium are being prepared for
publication as NASA CP-3248.(David A. Throckmorton, 44406)
Space Directorate
A Multiblock Analysisfor Shuttle Orbiter
Reentry Heating FromMach 24 to Mach 12
The Space Transportation Sys-
tem (STS) was designed in an era
LAURA-comp;;tcd su;]hwe heat-transfer results _," complete orbiter confi_uration at Mach 18.
137

in which large-scale, computational
fluid dynamic (CFD) analyseswere unavailable to assist in the
design process. Supercomputertechnology has now progressed to
the point where CFD has the re-
sot, rces (speed and memory) tomake substantial contributions to
future hypersonic vehicle design
projects by providing flow-fieldsolutions over complete, winged
configurations. The solutions
provide surface-pressure and heat-
ing predictions at selected design
points; more importantly, theyalso provide insight into the flowstructure about the vehicle, with
powerful graphical analysis toolsthat show streamline traces, vortic-
ity distributions, profile informa-ti_m, etc.
The capabilities and limitations
of CFD simulations for hypersonic
flow over winged vehicles must beperiodically reevaluated to account
for advances in algorithms and
computational power, and to in-
clude updates to the database for
code validation. The data providedby instrt, mentation that was flown
onboard the shuttle orbiter
Columt_ia comprise a crucial bench-mark for such evaluations. The
objective of this study was to
perform this evaluation for theLangley Aerothermodynamic
Upwind Relaxation Algorithm
(LAURA) using the benchmark
flight heat-transfer data from
STS-2. A sample heating distribu-
tion at Mach 18, including the
effects of thermochemical nonequi-librium, finite-rate wall catalysis,
and a radiative-equilibrium
boundary condition, is presented
in the figure on the next page.
This work has demonstrated
that a proven methodology is
ready to be applied to the designof next-generation space transpor-
ration systems such as the single-
stage-to-orbit vehicle.(Peter A. Gnoffo, 44380, and
K. James Weilmuenster)
Space Directorate
Navier-Stokes Analysis
of Shuttle Orbiter
Pitching-Moment
Anomaly
On the entry phase of its first
flight, STS-1, the hypersonic
pitching-moment characteristics
exhibited by the Shuttle orbiter
were significantly different thanpre-flight predictions. The body-
flap deflection that was required
to maintain vehicle longitudinal
trim hypersonically was more than
double that predicted prior t_. theflight. Although ample control
power had been built into th_
system to overcome the undt r-
prediction of body-flap defle,:tion
requirements, the magnitude of
the required deflection raised
concerns about the structural and
thermal integrity of the body flap.This "pitching moment anomaly"
has been variously attributed to
any one (or a combination) of
several phenomena includingviscous effects, diminished
body-flap effectiveness, Machnumber, and real-gas effects.
While this question has been
subjected to approximate analysis,
there has been no previous defini-
tive analysis of the pitching-moment
anomaly.
A stud}, was undertaken to ana-
lyze the hypersonic longitudinal
aerodynamic characteristics of theShuttle orbiter, and the phenomenathat define those characteristics,
through the application of state-of-
the-art computational fluid dyna-mics. State-of-the-art flow solvers
and computer hardware allow forNavier-Stokes solutions that
employ complete gas chemistry
models tor complex configurationssuch as the Shuttle orbiter. The
study consisted of defining theflow field about the orbiter at
several points akmg the entry tra-
0.00 F-
O
-0.10 I "-" ..........
i .......... uncertain':y band ""pre-flight prediction
i @ computed
t 0 measured flight
-0.15 ..... L ............. I5 10 15 20 25
M_
Comparison of computed N,,z,ier-Stokes orbiter pitchi,_,,-momeltt results
with preflight predictions a_rdfli@t data.
138
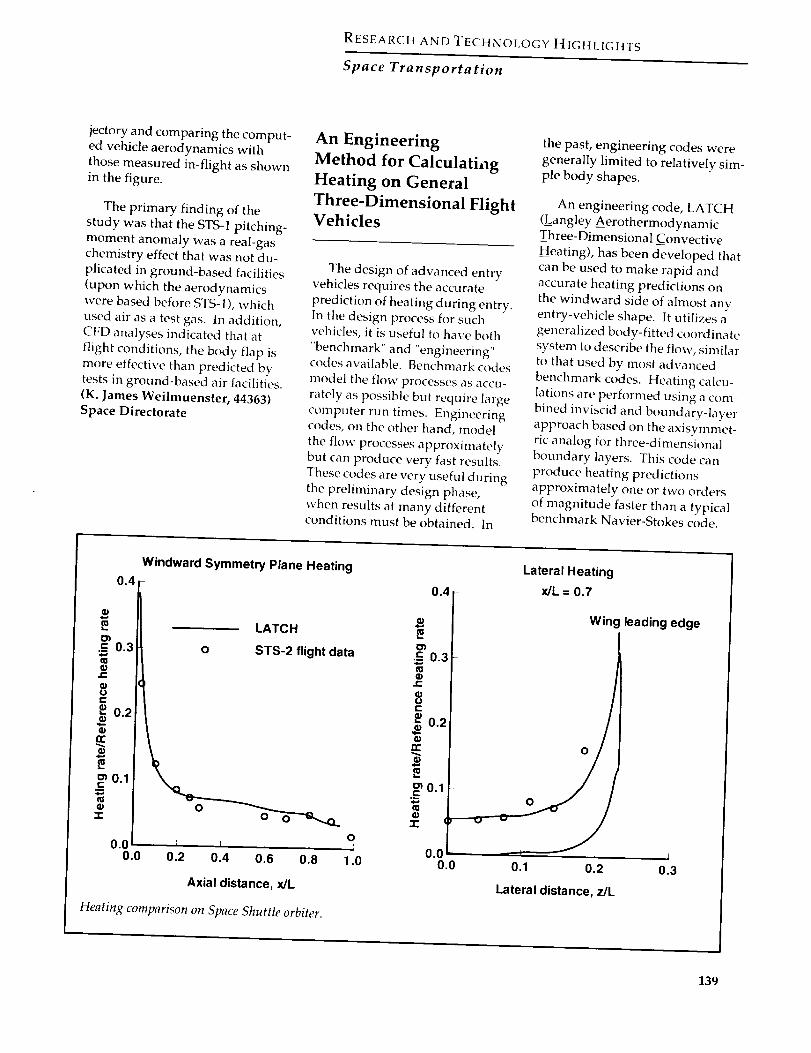
RESEARCH AND TECHNOLOGY HIGHLIGHTS
Space Transportation
jectory and comparing the comput-
ed vehicle aerodynamics with
those measured in-flight as shown
in the figure.
The primary finding of the
study was that the STS-1 pitching-
moment anomaly was a real-gas
chemistry effect that was not du-
plicated in ground-based facilities
(upon which the aerodynamics
were based before STS-I), which
used air as a test gas. In addition,
CFD analyses indicated that at
flight conditions, the body flap is
more effective than predicted by
tests in ground-based air facilities.
(K. James Weilmuenster, 44363)
Space Directorate
An Engineering
Method for Calculating
Heating on General
Three-Dimensional Flight
Vehicles
The design of advanced entry
vehicles requires the accurate
prediction of heating during entry.
In the design process for such
vehicles, it is useful to have both
"benchmark" and "engineering"
codes available. Benchmark codes
model the flow processes as accu-
rately as possible but require large
computer run times. Engineering
codes, on the other hand, model
the flow processes approximately
but can produce very fast results.
These codes are very useful during
the preliminary design phase,
when results at many different
conditions must be obtained. In
the past, engineering codes were
generally limited to relatively sim-
ple body shapes.
An engineering code, LATCH
(_Langley Aerothermodynamic
Three-Dimensional C_onvective
Heating), has been developed that
can be used to make rapid and
accurate heating predictions on
the windward side of almost any
entry-vehicle shape. It utilizes a
generalized body-fitted coordinate
system to describe the flow, similar
to that used by most advanced
benchmark codes. Heating calcu-
lations are performed using a com-
bined inviscid and boundary-layer
approach based on the axisymmet-
ric analog for three-dimensional
boundary layers. This code can
produce heating predictions
approximately one or two orders
of magnitude faster than a typical
benchmark Navier-Stokes code.
Windward Symmetry Plane Heating
0.4
0
m
0.3
0J::
OO¢-
•¢ 0.2
n-
==0.1
0.0
LATCH
o STS-2 flight data
o
I I r ]
0
0.0 0.2 0.4 0.6 0.8
Axial distance, x/L
Heating comparison on Space Shuttle orbiter.
1.0
¢ 0.4j_ 0.:3
e-
U
e-
_ o.2
_ 0.1
O.C0.0
Lateral Heating
x/L = 0.7
Wing leading edge
0.1 0.2
Lateral distance, z/L
0.3
139

A study has been performed to
assess the ability of the LATCH
code to predict heating on complexvehicles in flight. Heating predic-tions on the Shuttle orbiter are
shown compared with flight dataat free-stream conditions of Machnumber = 9.2 at an altitude of 46.7
km and at an angle of attackof 34.8 ° . The calculated results are
in good agreement with the flightdata. These and other similar com-
parisons demonstrate that theLATCH code can be used to
accurately predict flight heatingrates on the windward surface of
winged entry vehicles such as theShuttle orbiter.
(H. Harris Hamilton II, 44365, and
Francis A. Greene)
Space Directorate
Blunt-Body Wake Flows
Determination of wake closure
is a critical issue for aerobrakes,
since the low lift-drag ratio aero-shell designs impose constraints
on payload configuration/spacecraft
design. The issue is that the pay-load should fit into the wake in
such a manner as to avoid the
shear-layer impingement and thus
minimize heating. Rarefaction
effects are one phenomenon that
can significantly influence thefeatures and development of aero-brake waves. Furthermore, if the
rarefaction is significant (largeKnudsen number), then continuum
analyses become inadequate for
describing the near-wake condi-tions.
A study has been conducted
to provide an improved under-
standing of the effects of rarefaction
on blunt-body wake structure and
to clarify the boundaries for realis-
tic application of the Navier-Stokesalgorithms with respect to rarefac-tion effects. Calculations were
made using a direct simulation
Monte Carlo (DSMC) approach,
the Navier-Stokes approach, and arecently developed zonally
decoupled approach, for a 70 °
blunted-cone forebody with and
without a sting/afterbody atwind-tunnel conditions. The free-
stream was Mach 20 nitrogen atthree levels of rarefaction (free-
stream Knudsen numbers (Kn_) of
0.03, 0.01, and 0.001). This range ofconditions includes both contin-
uum (small Kn_) and transitional
forebody flows. The zonally de-
101
10 0
10 "1q,
W/cm2 10 .2
10 .3
10 .4
DSMC
......... N.S., No slip
_; ................ N.S., Slip
2
l_l . -.-.-_ .... .3
.. ",, ,:._,.;"_'_"----_'_. "i, .'1"'
_ ,'6 /,,'6,.I 2.___ ---- 2 a,4
10-5 i,,lllllllll,lllililllilll0 2 4 6 8 10 12
s/R n
Comparison of DSMC and Navier-Stokes solutions for blunt-body surface heating. Kn_ = 0.03.
, L
14
140

RESEARCH AND TECHNOLOGY HIGHLIGHTS
Space Transporta tion
coupled methodology, wherebythe forebody and wake regions are
solved separately with no iterativefeedback, was validated for these
conditions by comparison with
fully coupled solutions.
Rarefaction effects in the near
wake persist to very low Knudsennumbers. Results of the calcula-
tions show that the location of
maximum convective heating rate
along the sting/afterbody is notcoincident with the wake stagna-
tion point but can be a considerabledistance downstream of the wake
stagnation point (larger payload
volume). Including slip boundaryconditions in the Navier-Stokes
calculation provided improved
agreement with the DSMC results.
The zonally decoupled approach
proved to be computationallyefficient.
(James N. Moss, 44379, Richard G.Wilmoth, Robert A. Mitcheltree,
and Virendra K. Dogra)
Space Directorate
Aerodynamics of Shuttle
Orbiter at High Altitudes
The aerodynamic characteristics
of a spacecraft in orbit and/or the
early phase of atmospheric entry
cannot be adequately studied inground-based wind tunnelsbecause of the low ambient den-
sity, low Reynolds number, highKnudsen number conditions
prevailing at high altitudes. In
recent years, computer simulationmethods based on free molecular
and direct simulation Monte Carlo
algorithms have progressed to a
point where high Knudsen numberflow fields around vehicles of com-
plex geometry can be simulated on
Lift-dragratio
1.0(
0.75
0.50
Newtonian
O DSMC
I Flight dataA Navier Stokes
0.25
O040 60 80 lO0 12o 14o 160 18o
Altitude, krn
Comparison of hiy, h-altitude lift-drag ratio data for Shuttle orbiter.
200
engineering workstations, in three
dimensions, and with relativelyshort turnaround times. This
capability has been used to evalu-
ate the aerodynamic forces and
moments acting on the Shuttle
orbiter in orbit and during atmo-spheric entry to 100-kin altitude.Numerical simulation results have
yielded values of the lift-drag andnormal- to axial-force ratios that
are comparable to those derivedfrom accelerometer measurements
made in flight. The simulations
also revealed an unexpectedcharacteristic of the normal-force
coefficient variation with altitude,
namely a nonmonotonic behaviorwith a maximum value at 110 km.
The present results have further
validated the computer codes andsimulation methods that will be
used in the future to study
advanced space transportation
systems.(Didier F. G. Rault, 44388)
Space Directorate
Flight Results of Orbital
Acceleration Research
Experiment (OARE)
The Orbital Acceleration
Research Experiment (OARE)obtains measurements, in absolute
terms, of the Shuttle orbiter's low-
frequency, low-g acceleration
environment in orbit and duringreentry. OARE flight operations
include in-flight instrument cali-
brations, and post-flight data pro-
cessing enables identification of
the steady-state aerodynamic con-tribution to the acceleration envi-
ronment. The OARE is a jointendeaw)r of two NASA Centers:
the OARE was conceived, and the
principal investigator resides, at
Langley Research Center; project
and integration management arethe responsibility of Johnson SpaceCenter. The vendor for the sensor
was Bell Aerospace, the vendor for
the calibration table was Speed-
ring, and Canopus Systems is
141

Ax _g
1.5
°I-1.5 [ . I | I I J
Ay p.g
-1 .,5 i i i i i
1.5
Az Pg 0 • :
-1 .S i I I I I30 40 50 60 70 80
MET, h
Three-axis orbiter acceleration measurements obtained on STS-50.
J
90
responsible for maintaining theflight equipment, the instrument
simulator, and the ground support
equipment.
The OARE has flown on two
flights of the orbiter Columbia.Data from STS-40 confirmed the
nano-g sensitivity of the system,and orbital acceleration variations
were measured which correspondwell with density models. Data
from STS-50 were collected during
the entire 14-day orbital segment
of the flight and are of excellent
quality. The sensor exhibitedsmall biases on all three axes,while bias and scale-factor sensitiv-
ities to temperature were minimal.The OARE in situ calibrations pro-vided the first set of absolute accel-
eration measurements of the orbit-
er on-orbit environment. & 60-
hour portion of the flight data fromSTS-50 is shown on the figure.
Analyses have been requested by
and supplied to the microgravity
community to support cD stal
growth experiments and other
microgravity-dedicated accelerom-
etry experiments. Small (but signi-ficant) forces were observ 2d that
will possibly impact the operationof future on-orbit experiments.
Preparations are being made for
the next OARE flight, whch is on
STS-58. This flight will include
three separate sets of pitc i, yaw,
and roll maneuvers to verify theon-orbit calibrations.
(Robert C. Blanchard, 44391)
Space Directorate
Entry-Vehicle
Configuration
Optimization Using
Response-SurfaceMethods
Reusable, rocket-powered,
single-stage vehicles (SSV) arebeing studied because of their
potential to greatly reduce Earth-
to-orbit transportation costs.
Advanced multidisciplinary
design optimization methods arebeing used to obtain minimum-
weight configurations with robust
aerodynamic characteristics dur-
ing entry. A response surfacemethod (RSM) was utilized to
determine the optimum values of
the five configuration parameters
shown in the figure for a circular-fuselage SSV to minimize the vehi-
cle dry weight and maximize the
aerosurface control margin during
entry. A central composite design
was utilized to efficiently deter-
mine the dry-weight responsesurface. The process required 27
configuration point designs, as op-posed to 243 (35) required for a
full-factorial analysis. A second-order regression fit was then per-
formed, and an equation was
obtained to relate dry weight to
each of the five configuration
variables. Constraint equations
were also derived for landing
speed and hypersonic, supersonic,and subsonic trim and stability
levels. The dry-weight equation
was then utilized as the objective
function in a nonlinear optimizer
that was subject to the seven
constraint equations.
The dry weight of the SSV wasreduced by 10 percent, and a
robust aerodynamic entry configu-ration was obtained. The vehicle
142

RESEARCtt AND TECHNOLOGY HIGttL1GHTS
Space Transportation
TTS L 'l
OptimumVariables Range valuesFineness ratio = L,/2R 4-6 5.02Nose ratio = NIL 02-0.4 02
Nose droop = D/R 0-100% 26.9%
Wing area =A;Aref 75 100% 70.1%Wing location =B/L 85-105% 103%
Initial dry weight = 227,000 IbOptimized dry weight = 205,000 Ib
Sin@'-sta<_e vehich' confiyuration parameters.
was constrained to land at a speed
of 205 knots. The resulting vehicle
was also capable of being trimmed
in the pitch plane at a subsonic, a
supersonic, and a hypersonic entry
condition at both payload-in and
payload-out center-of-gravity
(c.g.) conditions with minimal
aerosurface deflections. The
elevons and body flaps are only
required to be deflected at a maxi-
mum of _+6°. Hence, large aerosur-
face margins are available to con-
trol the vehicle during off-nominal
entry conditions. The RSM was
also used to constrain the vehicle
to be stable or neutrally stable in
the pitch plane at a subsonic, a
supersonic, and a hypersonic entry
condition at both payload-in and
payload-out c.g. conditions.
In this analysis and in previous
applications, RSM has proven to
be an efficient, flexible tool for
multidisciplinary optimization
and has the potential for broad
application to industrial design
and production.
(Douglas O. Stanley, 44518)
Space Directorate
Fuselage Internal
Structural Modeling
Optimization of aerospace vehi-
cle transportation systems requires
the use of finite-element analysis
(FEA) methods to investigate the
impact of fuselage construction
predefined wing structure fuselage crown region
\
aft bulkhead
carry-through spars
keel beam and floor elements
forward bulkhead
Fuselay>e internal structural modelin<_.
ringframe webs
143

parameters, such as ringframe
spacing, on total vehicle weight.
Existing modeling practices are
too labor intensive when design
modifications, such as relocating a
wing relative to the fuselage, pro-
duce topological changes in theanalysis mesh. Tile purpose of
this research was to provide inter-
hal fuselage structural modeling
software to enable greater use, atan earlier stage, of FEA methods in
the design process.
The development approach tak-
en provides an appropriate mix ofinteractive and automated proce-
dures. For example, a design engi-
neer can graphically lay out struc-
tural arrangements of advanced
vehicle concepts in an intuitivemanner, while automated proce-
dures simultaneously ensure that
proper wing/fuselage integrationconstraints are met.
Internal structural elements
that were generated include
variable-width ringframes, longe-tons, bulkheads, keel beams,
floors, and wing-box carry-through
ribs and spars. The root rib ofstructurally modeled lifting surfac-
es, such as wings and tails, is auto-
matically extruded through the
fuselage, and ringframes are
placed in the fuselage at the corre-
sponding wing spar locations.
The figure shows tile wing-bodyintersection of a typical supersonic
transport design. The midsection
of the outer fuselage surface wasdivided into crown, side, and sub-
floor regions. Additional ring-frames were placed within the sec-
tion by specifying the desired
spacing. Keel-beam and floor
structures were added by usingthe generic cutting-plane interface.
The integrated wing carry-throughand vehicle outer skin were auto-.
matically created in a manner con-sistent with FEA mesh-generation
connectivity constraints.
This software has been inter-
faced to commercial FEA software,
with mapped mesh areas and bo_hmembrane and bar- or rod-type
elements. Initial testing has de-
monstrated a geometry modeling-time reduction factor of 10 to 20
over previous methods.(Mark L. McMillin, 44521)
Space Directorate
Dual-Fuel Rocket
Propulsion for
Single-Stage Vehicles
For rocket-propelled, single-
stage vehicles (SSV), tile use of
hydrocarbon fuel in addition to
hydrogen fuel reduces vehicle sizeand empty weight by increasing
propellant bulk density and
propulsion-system thrust-to-weight
ratio at the expense of overall
propulsion-system specificimpulse. For the same level of
technical complexity, a reduction
in vehicle empty weight potentiallytranslates into a reduction in both
development and productioncosts. Several dual-fuel propul-
sion options were investigated
for a near-term technology SSV.
Conceptual-level analysis methodswere utilized to determine vehicle
weight and size characteristics.
To obtain the minimum empty
weight, optimization of select
propulsion-system and vehicle-
design parameters was performed
using a response surface metho-dology. With a four-parameter
optimization, this process required
25 vehicle point designs, as
Reference SSV DuaI-Fu(,IRD-701 SSV
LO2 t%L_nk(,_j_.._ 1_ I LO2 tank__LH 2 tank
_..-7SSME- _ 1 3derivative R_-1 tank"/_"_ _" eRgDn701engines
Body length, ft 173 145
Wing span, ft 95 79
Empty weight, Ib 244 000 1(1 000
Gross weight,Ib 2 470000 I 9;'0 000
Effect of utilizing Russian RD-701 dual-fuel engine.
144
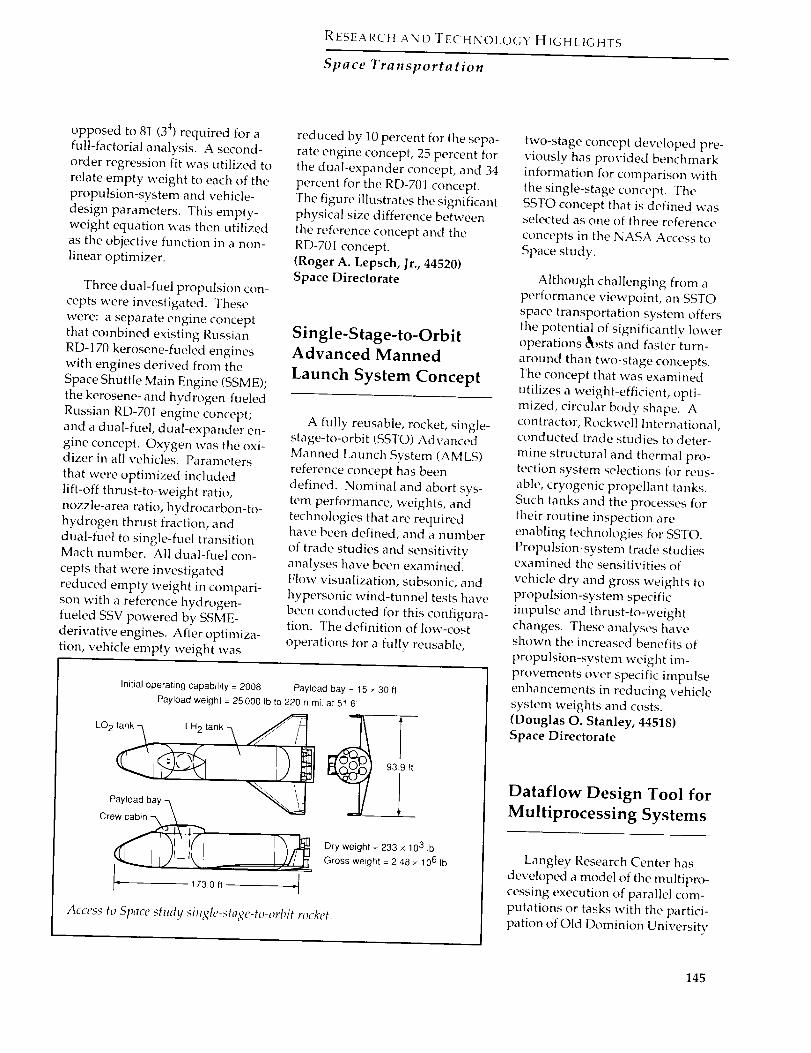
RESEARCH AND TECHNOLOGY HIGHLIGttTS
Space Transportation
opposed to 81 (34) required for a
full-factorial analysis. A second-
order regression fit was utilized to
relate empty weight to each of the
propulsion-system and vehicle-
design parameters. This empty-
weight equation was then utilized
as the objective function in a non-
linear optimizer.
Three dual-fuel propulsion con-
cepts were investigated. These
were: a separate engine concept
that combined existing Russian
RD-170 kerosene-fueled engines
with engines derived from the
Space Shuttle Main Engine (SSME);
the kerosene- and hydrogen-fueled
Russian RD-701 engine concept;
and a dual-fuel, dual-expander en-
gine concept. Oxygen was the oxi-
dizer in all vehicles. Parameters
that were optimized included
lift-off thrust-to-weight ratio,
nozzle-area ratio, hydrocarbon-to-
hydrogen thrust fraction, and
dual-fuel to single-fuel transition
Mach number. All dual-fuel con-
cepts that were investigated
reduced empty weight in compari-
son with a reference hydrogen-
fueled SSV powered by SSME-
derivative engines. After optimiza-
tion, vehicle empty weight was
reduced by 10 percent for the sepa-
rate engine concept, 25 percent for
the dual-expander concept, and 34
percent for the RD-701 concept.
The figure illustrates the significant
physical size difference between
the reference concept and the
RD-701 concept.
(Roger A. Lepsch, Jr., 44520)
Space Directorate
Single-Stage-to-Orbit
Advanced Manned
Launch System Concept
A fully reusable, rocket, single-
stage-to-orbit (SSTO) Advanced
Manned Launch System (AMLS)
reference concept has been
defined. Nominal and abort sys-
tem performance, weights, and
technologies that are required
have been defined, and a number
of trade studies and sensitivity
analyses have been examined.
Flow visualization, subsonic, and
hypersonic wind-tunnel tests have
been conducted for this configura-
tion. The definition of low-cost
operations for a fully reusable,
initial operating capability = 2008 Payload bay = 15 × 30 ItPayload weight = 25000 Ib to 220 n.rnL at 51.6'
I 93.9 ft\ 1Payload bay 2
Crew cabin _
Access to Space study single-stage-to-orbit r{}cket.
two-stage concept developed pre-
viously has provided benchmark
information for comparison with
the single-stage concept. The
SSTO concept that is defined was
selected as one of three reference
concepts in the NASA Access to
Space study.
Although challenging from a
performance viewpoint, an SSTO
space transportation system offers
the potential of significantly lower
operations &_sts and faster turn-
around than two-stage concepts.
The concept that was examined
utilizes a weight-efficient, opti-
mized, circular body shape. A
contractor, Rockwell International,
conducted trade studies to deter-
mine structural and thermal pro-
tection system selections for reus-
able, cryogenic propellant tanks.
Such tanks and the processes for
their routine inspection are
enabling technologies for SSTO.
Propulsion-system trade studies
examined the sensitivities of
vehicle dry and gross weights to
propulsion-system specific
impulse and thrust-to-weight
changes. These analyses have
shown the increased benefits of
propulsion-system weight im-
provements over specific impulse
enhancements in reducing vehicle
system weights and costs.
(Douglas O. Stanley, 44518)
Space Directorate
Dataflow Design Tool for
Multiprocessing Systems
Langley Research Center has
developed a model of the multipro-
cessing execution of parallel com-
putations or tasks with the partici-
pation of Old Dominkm University
145
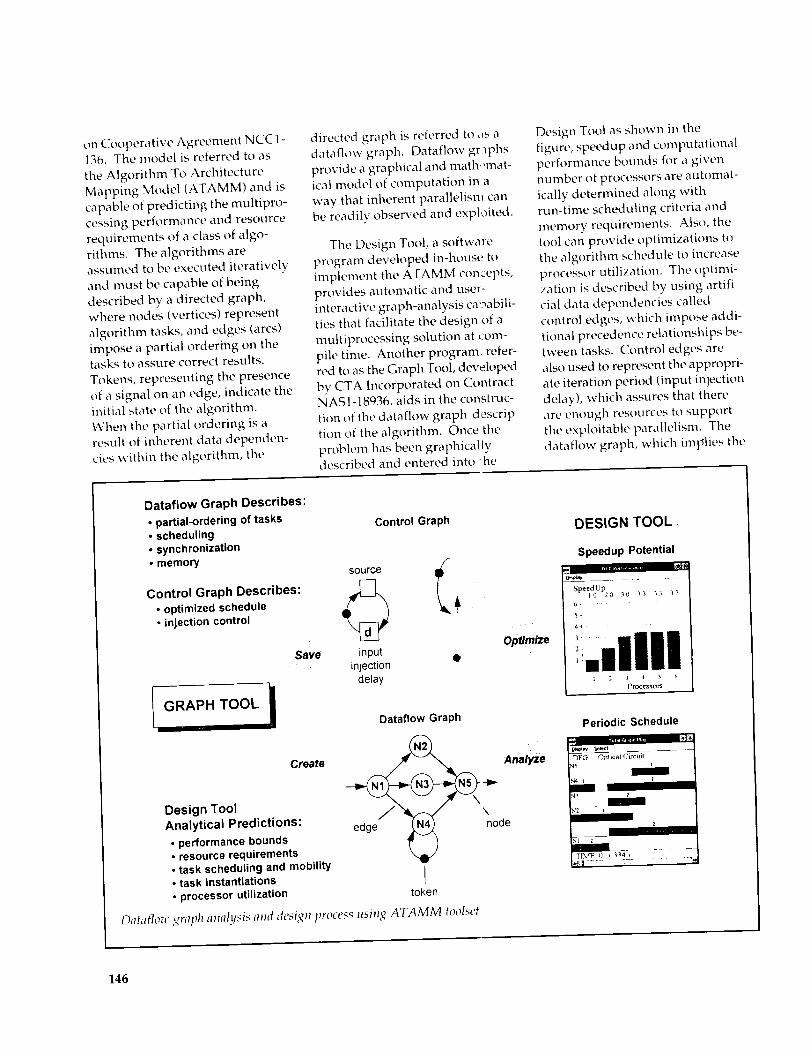
on Cooperative Agreement NCCI-136. The model is referred to as
tile Algorithm To Architecture
Mapping Model (ATAMM) and is
capable of predicting the multipro-
cessing performance and resource
requirements of a class of algo-rithms. The algorithms are
assumed to be executed iteratively
and must be capable of being
described by a directed graph,where nodes (vertices) represent
algorithm tasks, and edges (arcs)impose a partial ordering oll thetasks to assure correct results.
Tokens, representing the presence
of a signal on an edge, indicate theinitial state of the algorithm.
When the partial ordering is aresult of inherent data dependen-
cies within the algorithm, the
directed graph is referred to ,_s a
dataflow graph. Dataflow graphs
provide a graphical and math.m_at-ical model of computation in a
way that inherent parallelism can
be readily observed and exploited.
The Design Tool, a software
program developed in-house to
implement tile ATAMM concepts,
provides automatic and user-
interactive graph-analysis ca!gabili-ties that facilitate the design of a
multiprocessing solution at com-
pile time. Another program refer-
red to as tile Graph Tool, developed
by CTA Incorporated on ContractNAS1-18936, aids in the construc-
tion of the dataflow graph descrip-
tion of tile algorithm. Once the
problem has been graphicallydescribed and entered into Ihe
Design Tool as shown in tile
figure, speedup and computational
performance bounds for a givennumber of processors are automat-
ically determined along with
run-time scheduling criteria and
memory requirements. Also, the
tool can provide optimizations to
the algorithm schedule to increaseprocessor utilization. The optimi-
zation is described by using artifi-
cial data dependencies called
control edges, which impose addi-tional precedence relationships be-
tween tasks. Control edges are
also used to represent the appropri-
ate iteration period (input injection
delay), which assures that thereare enough resources to support
tile exploitable parallelism. The
dataflow graph, which implies the
Dataflow Graph Describes:
• partial-ordering of tasks• scheduling• synchronization• memory
Control Graph Describes:• optimized schedule• injection control
Save
I GRAPH TOOL 1
Create
Design ToolAnalytical Predictions:
• performance bounds• resource requirements• task scheduling and mobility• task instantiations• processor utilization
Control Graph
source
inputinjection ll_
delay
Optimize
Dataflow Graph
__ Analyze
edg/_ \_ode
token
l)ataflow ,Waph mm/ysis am� design process using ATAMM too�set
DESIGN TOOL.
Speedup Potential
._-. _ _tl
SpeedUp --I0 20 30 33 _,_ 33
5.
:.,till1 2 } 4 6
Processors
Periodic Schedule
DFG Critical Circu0
I
m
_I21 "=- " ......... "1_
146

RESEARCH AND TECHNOLOGY HIGHLIGHTS
Space Transportation
scheduling solution as well as the
memory requirements of shared
data, is superimposed with the
control graph and is automaticallyreconstructed for the user in the
Graph Tool. Potential commercial
uses include task scheduling of
signal processing, control law,
scientific, and medical applications.
The dataflow/control-flow graph
that is generated by the DesignTool also conveys the run-time cri-
teria that are required of commer-
cially developed real-time operat-
ing systems to assure predictable
performance.(Robert L. Jones, 41492, and
Paul J. Hayes)
Flight Systems Directorate
147

RESEARCH AND
TECHNOLOGY
Space Platforms
Provide technolo_t for the
current and evolutionat3! '.;pace
Station and space pla(for,_s and
provide tire technolo_,u! base for
fl#ure developments

RESEARCtt ANDTECflNOLOGY HIGtiLIGttTS
Space Platforms
Design and Fabrication of
an Ultrastable Composite
Optical Bench
Optical bench structures pro-
vide stable platforms on which to
mount sensitive optical compo-
nents with critical alignment
tolerances. Future flight projectsin astrophysics and atmospheric
sensing place increasingly strin-
gent demands on optical benchstabilities under both thermal and
mechanical loads. High-stability
optical bench structures with low
weight can be attained throughthe use of carbon-fiber reinforced
composite materials. The advance-
ment of composite optical benchtechnologies to meet future mis-
sion needs is currently under wayat NASA.
Amoco's P75/ERL1962
graphite/epoxy composite prepreg
was utilized because it provides a"near zero" coefficient of thermal
expansion (CTE) in a quasi-isotropiclaminate and because data existed
that demonstrated resistance to
microcracking under thermal cyc-
ling for this material. The bench
design was based on a composite
"egg crate" core sandwich concept.
This design is superior to conven-tional honeycomb sand wich con-struction in that the core material
is identical to the facesheet materi-
al and therefore gives greater ther-
mal/dimensional stability. Also,
Composite optical bench prior to installation of facesheet (56 cmx 25 cm x6 cm). L-93-8211
this concept allows optical mount-ing inserts to be installed into therib structure with minimal use of
potting compounds.
Processing conditions weredetermined for producing lami-
nates with the proper fiber volume
fraction required for a near-zero
(+_0.2 ppm/°C) CTE. A 56-cm x25-cm x 6-cm demonstration bench
incorporating several inserts wasfabricated and is shown in the
figure prior to installation of the
facesheeL A chromium and gold
moisture barrier was vapor depos-ited on the outside of the com-
pleted bench to avoid dimensional
changes associated with the
adsorption of ambient moisture by
the graphite/epoxy composite.
The completed bench weight was3.3 kg.
Novel insert designs were
develope d for attaching heavilyloaded or lightly loaded optical
mounts. The high-load inserts
were fabricated from composite
and metallic components andbond directly into the optical
bench core structure. They weigh
only 45 grams, yet can withstandaxial loads of 22 kN. In addition,threaded metallic inserts (not
shown) have been developed thatare capable of being installed in
the optical bench after assembly
by a single-side-access-onlymethod. These inserts contain a
double-locking mechanism and
provide a threaded attachment
point to the bench's compositefacesheet.
(Timothy W. ToweU, 44258)Structures Directorate
149

Space Station Berthing
An analysis of nominal SpaceShuttle berthing operations with
tile permanently crewed configura-
tion (PCC) of Space Station Freedom
was conducted. The end productwas a 9-minute video animation
spanning tile entire 5-hour berth-ing scenario. All motions depicted
represent the results of modeled
dynamic forces and torques actingbetween the orbiter and station, as
well as environmental perturba-
tions acting on both vehicles.
Prior to berthing initialization,
the PMC steady-state attitude, atti-tude rates, and control-moment
gyro (CMG) angular momentumrequirements were depicted. The
following nine phases of the berth-
ing operation were then simulated
according to the nominal timeline
sequence of events: 1) station re-orientation from torque equilibriumattitude (TEA) to local vertical atti-
tude, 2) solar-array rotation to aminimum plume impingementorientation, 3) orbiter remote
manipulator system (RMS) grapple
operation with both the stationand orbiter in free drift, 4) RMS
commanded rate null procedureand joint locking, 5) RMS vibration
damping, 6) reaction control sys- •
tern (RCS) jet maneuver of com-
bined stack to "parked" TEA atti-tude, 7) RCS to CMG control
handover, 8) RMS retraction,
whereby the orbiter and station
are pulled together for mating,
and 9) mating and subsequent
CMG control steady-state opera-tions.
RCS propellant usage, CMGcontrol torque and momentum
requirements, and RMS joint force
and torque loads were computed
RingStabilizers(also requiresstrengthenedmain ring)
--NN_J_- , ,ILHm
lllll I lIlll# Adapter Ring
ATV
ESA automated transfer _,vhich' with attached pressurized pro/load.
throughout the nine mission phas-
es as appropriate. Fuel require-ments to hold local vertical-attitude
pre-grapple were minimal Thestation attitude was detern_ined to
drift only a few degrees during the
free-drift grapple operation. Therate null operation did nol impose
any excessive loads on tht RMS
joints for the berthing scel_ario
simulated. Maximunl joiid loads
occurred during the park_ d TEA
maneuver phase.(Richard A. Russell, 41935, and
Michael Heck)
Space Directorate
Design Reference Mission
Specifications for
European Space AgencyAutomated Transfer
Vehicle
The European Space Agencyautomated transfer vehicle (ATV)
is a proposed orbital transfer stage
that would provide automatedrendezvous capability for theAriane 5 launch vehicle. The
primary Ariane 5/ATV missionunder consideration is unmanned
delivery of logistics resupply
cargo to the space station. NASA
has undertaken a feasibility assess-
ment to define specific design and
operational requirements for theATV. The NASA LaRC portion of
this study includes identifying,
150

RESEARCI_tANDTECHNOLOGYHIGHLIGHTS
Space Platforms
evaluating, and prioritizing spacestation cargo options for ATV deli-
very. The space station resupplycargo options and associated deli-
very operations are referred to asATV design reference missions.
Preliminary prioritization of the
ATV design reference missions
was based on an unweighted set ofevaluation criteria that consider
Space Shuttle and Ariane 5/ATV
flight operations, space station
cargo-to-ATV integration require-
ments, and ground processingissues. Initial study results show
that a single Ariane 5/ATV flight
per year is an optimal flight rate
for mixed-fleet transportation sup-
port as a result of shuttle cargo
return limitations. For this singleAriane 5/ATV flight per year, the
space station pressurized logistics
module (PLM) is potentially the
most desirable ATV cargo because
of tile resulting savings of a spaceshuttle flight needed for PLM
delivery, minimal PLM modifica-
tions required for ATV compatibil-
ity, and minimal pre-flight cargo
processing required at the Ariane5 launch site in Kourou, French
Guyana.
(William M. Cirillo, 41938)
Space Directorate
Accommodation of a
Soyuz TM as an Assured
Crew Return Vehicle
A study was conducted to
determine the implications of
accommodating two Soyuz TMspacecraft as assured crew return
vehicles (ACRV) on the Space
Station Freedom (SSF) at the perma-
nently crewed capability stage.
Operational as well as systemissues associated with the accom-
modation of the Soyuz for several
potential configuration options
were examined. Operational
issues considered include physicalhardware clearances, worst-case
Soyuz departure paths, and im-
pacts to baseline operations suchas pressurized logistics module
exchange, space station remote
manipulator system attachment,
extravehicular activity (EVA), andautonomous rendezvous and
docking. Systems analysisincluded the determinations of
differences between Soyuz inter-
face requirements and SSF capa-
bilities for the electrical power sys-
tem, thermal control system,
communications and tracking,audio-video subsystem, data man-
agement system, and environmen-
tal control and life support system.
Significant findings of this studyhave indicated that the current AV
(difference in velocity between
space station and Soyuz TM) capa-bility of the Soyuz will need to be
increased to provide adequatedeparture clearances for a worst-
case escape from an uncontrolledSSF and that an interface element
will be required to mate the Soyuz
vehicles to station, to provide forautonomous rendezvous and
docking structural loads, and to
house Soyuz-to-SSF system inter-
faces. Of the options considered,
the placement of the pair of Soyuz
vehicles on the nadir port of node
1 and the zenith port of node 2 or
on the nadir and zenith port of
node 1 will have the fewest systeminterface modifications required
for the SSF and the Soyuz and canprovide for the autonomous ren-
dezvous and docking and simulta-
neous departure of the Soyuz vehi-
cles. However, since the option touse the nadir port of node 2 will
impact elements currently under
critical design review, the recom-
mended configuration is to placethe Soyuz vehicles on the nadir
and zenith ports of node 1.
(Jonathan Cruz, 41951, MarstonGould, and Eric Dahlstrom)
Space Directorate
Configuration Analysis
for Space Station Redesign
The Advanced Space Concepts
Division provided configurationanalysis for several space station
redesign concepts. The configura-tion concepts (option A, option B,
and a Russian participation config-
uration) were analyzed at some or
all assembly sequence stages for
flight characteristics. The configu-ration flight characteristics include
attitude history, control momentgyro (CMG) and reaction control
system sizing, orbit lifetime, fuel
requirements, and microgravityenvironment determination.
Option A represented a signifi-cant departure from the baseline
Space Station Freedom program. Ithad a shorter repackaged main-truss structure and a new radial
pressurized module pattern. A
new "arrow" flight mode was
required in order to generate suffi-cient electrical power. Tile arrow
flight mode aligns the main truss
structure along the station velocityvector. Analysis determined thatthis flight mode was difficult to
control and that it had a negative
impact on the microgravityenvironment.
Option B incorporated some
minor configuration and systemchanges from the baseline Freedom
program. A small truss sectionwas eliminated, and the third
solar-power module was relocated
151

to tile port side. These configura-
tion changes resulted in slightlylower control requirements and a
better microgravity environmentthan Freednm.
The Russian participation con-
figuration incorporated some sys-
tem changes from option A intothe option B configuration. Rus-
sian pressurized elements wereadded to form a new module
pattern. Each stage of the assembly
buildup could be controlled witheither the Russian complement ofCMG's (15 000 N-m-see) or the
U.S. complement of CMG's (18 980
N-m-see) for steady-state opera-
tions that assume partial featheringof one of the U.S. solar arrays insome cases.
(Patrick A. Troutman, 41954)
Space Directorate
Space Station Assembly
and Operations at High
Orbital Inclinations
This study examined the impli-
cations of assembling and operat-
ing the space station at a 51.6 °
inclination orbit utilizing an
enhanced-lift space shuttle. Stationassembly is currently baselined at
a 220-n.nai-high, 28,W inclination
orbit. This study assumed that the
shuttle is used exclusively for
delivering the station to orbit, and
that it can gain additional payload
capability from design changes(e.g., a lighter external tank).
The high-inclination assembly
manifest requires 19 flights to
reach a permanently crewed capa-bilitv (I'CC) and one additional
flight for the centrifuge accommo-dation node. PCC is achieved in
September of the year 2000, a
3-month delay compared to the
baseline sequence. Five advancedsolid rocket motor (ASRM) flights
are used during the later phase of
the assembly sequence. An in-
crease in the number of assembly
flights and the use of more ASRM'sare required, since the enhancedshuttle has almost 5000 lb less
payload-to-orbit capability to a
51.6 ° inclination orbit compared
with the baseline shuttle payload
capability to a 28.8 ° inclination
orbit. Design changes includeaccommodating the unpressurized
berthing adapter and mobile trans-
porter on the second assembly
flight instead of the first, develop-ing new carriers for off-loaded
components, and modifying the
first propulskm module and any
associated software to providereboost and attitude-control capa-
bility on the second assembly
flight. Operational changes
include restructuring extravehicular
activity timelines on the firm three
assembly flights and grapplingand berthing the first assembly
flight with the $2 segment ,vhile
attached to the unpressurized
docking adapter.(Patrick A. Troulman, 4195,4)
Space Directorate
Spacecraft Contamination
Investigation by Direct-
Simulation Monte Carlo
Analysis--Application to
UARS/HALOE
Space platforms and satellitescreate their own local artificial
atmosphere, with gases emanatingfrom surface outgassing, venting,
and the operation of attitude-control
thrusters. The Upper AtmosphereResearch Satellite (UARS), whichwas launched into low-Earth orbit
to study upper atmospheric chem-
istry, is equipped with severaloptical telescopes (including the
Flalogen Occultation Experiment,or HALOE) and other sensitive in-
struments that must remain free of
contaminants. To ascertain the
probable levels of contamination
at the HALOE aperture, a three-dimensional direct-simulation
Monte Carlo (DSMC) analysis isbeing performed for the complete
satellite. The complex geometry ofthe 10-m UARS is modeled at a
5-cm spatial resolution, and each
known source of contaminant gas-es is accounted for. The DSMC
LIARS coufigtmttion definition h_r DSMC analysis.
152

RESEARCt!ANDTECHNOLOGYHIGHLIGHTS
Space Platforms
simulation is performed with two
computer processors working in
parallel to simulate both tile nearand far fields of the satellite.
Results obtained for a series of sat-
ellite orientations and configura-tions, and several HALOE tele-
scope pointing directions, indicate
that contamination levels may be
much lower than predicted from
pre-flight design methodology.
This study, which is being run
oil engineering workstations, has
also demonstrated the capability
of the present 3D DSMC methodto simulate flow fields about
bodies of extremely complex geo-
metry, in a parallel processing
environment, with relatively shortturnaround times.
(Didier F. G. Rault, 44388, andMichael Woronowicz)
Space Directorate
Rapid Processing of
Carbon-Carbon CompositeMaterials
Carbon-carbon composites
afford many engineering benefitsas spacecraft structural materials.
These benefits include low weight,high specific strength and modu-
lus, zero moisture expansion, no
outgassing, and insusceptibility to
natural space radiation. Carbon-
carbon composites are also attrac-
tive for a wide variety of high-temperature aerospace structural
applications, including thermal-
protection systems and hot struc-ture. However, traditional fabrica-
tion methods are lengthy and thecosts are high for parts. Under
NASA sponsorship, Lockheed
Missiles and Space Company and
Textron Specialty Materials are
• 7-in. long x 1.5-in. i.d. tubes
• Wall thickness: 0.031 in.
• Density: 1.75 g/cm _
• Densification time: 4 hours
• Compression strength: 28 ksi
• Compression modulus: 46 Msi
Carbon-carbon composite tubes fabricated by rapM densification process.
developing an innovative liquid-
phase chemical vapor infiltration
process for densifying carbon-
carbon composites; this process
has a very high potential for reduc-ing densification times from the
weeks or months to only severalhours. Fabrication costs are also
expected to decrease markedly.
The liquid-phase densificationprocess under development pro-
ceeds rapidly because of the vir-
tually unlimited source of reactant
(hydrocarbon liquid) and veryhigh mass transport rates that arenot achievable with conventional
gas-phase processes. Four repre-
sentative generic spacecraft com-
ponents have been selected for
demonstrating the potential of therapid densification process: struc-
tural tubes, radiator panels, reflec-
tor panels, and aerobrake struc-
tural panels. Each of these four
components poses a special
geometry-related processing issuethat must be addressed.
The figure illustrates theremarkable success that has been
achieved in fabricating structuraltubes. Excellent tube densities and
mechanical properties were
achieved in only 4 hours of densifi-
cation time. Flat panels 6 in. by 12in., not shown, have also been suc-
cessfully densified. In addition,
the process has been successfully
modified to deposit silicon carbideoxidation protective coatings.
Coating deposition rates approach-
ing 1 mil/hr have been shown to
be possible. Potential commercialapplications for this new process
include aircraft brakes, high-
performance automotive pistons,
and jet-engine exhaust-nozzle
flaps and seals.{Howard G. Maahs, 43084}Structures Directorate
Low Earth Orbit
Environmental Effects on
Materials
The Long Duration Exposure
Facility (LDEF) is an unmannedschool-bus-sized satellite that
accommodated a wide variety of
technology and science experi-
ments that require long-term expo-sure to a known low Earth orbit
153

Datat,ases for h)w Earth orbit environmental effects on materials.
,nvironment. The LDEF was
deployed by the Space Shuttle
Challenger on April 7, 1984, in a
nearly circular 257-n.mi. orbit witha 28.4 _ inclination. On January 29,
1990, after nearly 69 months in
space, the LDEF was retrieved and
returned to Earth by the Space
Shuttle Columbia. The 57 experi-ments on LDEF involved over 300
U.S. and foreign investigators
from private industry, universities,
and government laboratories. The
experiments, as well as the LDEFstructure itself, provided an un-
precedented opportunity to
investigate the effects of the lowEarth orbit environment on
spacecraft.
To ensure that the materials
and systems data from LDEF areavailable to current and future
spacecraft designers, a set of data-
bases, shown in the figure, have
been developed. Initially, to pro-vide the maximum amount of
information to users in the shortest
time possible, a series of mini-databases that run on Claris Cor-
poration's Filemaker Pro® soft-ware for both IBM and Macintosh
corn pu ter formats were developed
under contract by Boeing Defense
& Space Group. The databases
have been developed on the
following specific subjects: opticMmaterials, silverized Tefkm ther-
mal blankets, treated aluminum
hardware, thermal control paint,,,,
and the LDEF spacecraft enviror-merits. However, to capture all
LDEF materials, including the datain the mini-databases, and in some
cases, system data, LangleyResearch Center and Marshal]
Space Flight Center have jointly
developed the LDEF MaterialsData Base. The database is avail-able in two versions. The first w'r-
sion utilizes a preexisting global-
access database system, the Mat( ri-als and Processes Technical
Information System (MAPTIS),and can be accessed via a modeqn
and an 800 phone number, or viatelnet. The MAPTIS verskm of_he
database allows the user to sear :h
and retrieve tabular data. The sec-
ond version of the database runs
on PDA Engineering's M/VISIOI%_
software. Although this software
system requires more sophistica ;ed
computer equipment, it has pm_ er-ful query, spreadsheet, and gra-:41-
ical capabilities. All the databa:;es
are available free of charge to the
user community.
To meet the needs of spacecraft
designers, value is being added tothe data collection, and "rules ofthumb" based on the data are be-
ing devek)ped. The rules of thumb
are currently being developed
under contract by TRW Inc. and
will be compiled in handbookform and made available to the
user community.(J. G. Funk, 43092)Structures Directorate
Improved Near-Earth
Meteoroid Environment
Model
Examination of 26 m 2of alumi-
num that covered the surface of
the Long Duration Exposure Facil-
ity (LDEF) during its 5.8 years inorbit about the Earth has revealed
over 9000 craters that were caused
by meteoroids and man-madeorbital debris.
It was possible to determine therelative number of meteoroid im-
pacts and man-made orbital-debris
impacts on each of the 14 sides ofthe LDEF because of the unique,
three-axis, gravity-gradient orien-
tation of the LDEF. The huge dif-ference between the number of
craters on the space-facing end
and the Earth-facing end provided
the key by showing that essentiallyall the impacts on the space-facingend were from meteoroids. The
meteoroid flux on the other 12
sides of the LDEF was then calcu-
lated, and the man-made orbitaldebris flux was obtained from the
difference between the observed
crater flux and the calculated mete-oroid flux.
Some of the LDEF crater-flux
data are shown in the figure. The
154

RESEARCH ANDTECttNOLOGY HIGtlI.I(,ItTS
Space Platforms
10-5
10 -6
FLUX,
no./m2sec
10-7
10-8
I i
100 pm
200 pm
500 _tm
I I I I I I I I I I I I I I I I I I0 20 40 60 80 100 120 140 160 180
ANGLE FROM VELOCITY VECTOR. degrees
Distribution _!f craters around LDEF amt meteoroid comFoucnt _!f crater
fllIX.
curves are the calculated meteoroid
component. Essentially all the
500-#m craters were caused by
meteoroids, while 25 to 30 percent
of the smaller craters were caused
by man-made orbital debris. There
is evidence that man-made orbital
debris dominates the impact flux
both at much larger and much
smaller particle sizes.
The improved near-Earth mete-
oroid environment model can be
valuable in calculating the meteor-
oid hazard to commercial space-
craft, especially for spacecraft that
are at an altitude above 2000 kin.
Radar observations suggest that
the man-made debris hazard is not
significant at these altitudes and
that meteoroids therefore present
the only impact hazard.
(Donald H. Humes, 41484)
Space Directorate
New Postlaunch Satellite
Calibration Technique
It is well established that satel-
lite instrument calibrations often
shift as a result of launch vibrations
and sometimes drift over their life-
times because of sensor or optics
degradation. It is generally agreed
that absolute-calibration measure-
ments from the NASA ER-2 air-
craft are the most accurate method
(_+3 to 5 percent) of determining
postlaunch calibration coefficients
for narrowband satellite instru-
ments at visible wavelengths. His-
torically, 1 to 3 ER-2 calibration
experiments are conducted each
year for only a few satellites
because of high cost and operation-
al complexities.
As a result of its support of the
World Climate Research Program's
(WCRP) Surface Radiation Budget
_'_"0.020CO
0.018_o
0.016
"," 0.014U0
_:_ 0.012
)= O.OLO
0.008O
__0.o0sh,O
o 0.004ZO
0.002n,-
m 0.000.,:r¢.2
0 - NASA/LARC WSMR PILOT-STUDY METHOD
- NASA/GSFC ER-2 AIRCRAFT METHOD
' 260 ' 460 ' 660 ' $60 'lObO'12'00'1400', 6'00'18'00'20'00DAYSS'NCELAUNCH(FEBRUARY26,19873
Laugh,y Research Center pilot-stl¢dy results for calibration qt GOES-7
satellite visible channel compared with Goddard Space Flisht Ccnh'r
(GSFC) ER-2 aircraft mid ISCCP values.
155

(SRB) activity, Langley Research
Center has jointly completed a
3-year pilot study of a simplified
absolute-calibration techniquewith the U.S. Army at the White
Sands Missile Range (WSMR).
Objectives of the new techniquewere (1) low cost relative to other
methods, (2) 50 to 80 calibration
measurements per year, (3) capa-
bility for calibration of any overfly-
ing satellite with pixel sizes less
than 2 km, (4) accuracy within +7
percent, and (5) verification oferratic behavior for the GOESinstruments as had been observed
by the WCRP International Satel-
lite Cloud Climatology Project(ISCCP). The technique is based
on unmanned ground sites atWSMR with remote transmission
of data back to Langley twice
daily. For a yearly cost of $75,000
plus 1 man-year, all the aboveobjectives were satisfied. Visible-
wavelength instruments on theGOES-6, GOES-7, NOAA-9,NOAA-11, SPOT-l, and SPOT-2satellites were calibrated and com-
pared with values from othermethods. In addition, it was deter-mined that ISCCP values were low
compared with both pilot-studyand ER-2 results as shown in the
figure. The pilot-study calibration
results explain artifacts in ISCCPsatellite cloud retrievals that have
been detected by University of
Washington scientists.
The pilot-study technique is
useful for postlaunch cross calibra-tion of narrowband instruments
on the various EOS platforms. Itis also useful for calibration of
visible-wavelength instruments
on foreign satellites and
commercial instruments that may
be launched on small platforms.
Most importantly, it may be useful
in detecting unstable instruments
and the precise time of instrumentdeterioration.
(Charles H. Whitlock, 456?5)
Space Directorate
EOSSIM: A Linear-
Simulation and
Jitter-Analysis Package
The EOSSIM software package
is a linear-simulation and jitter-
analysis tool that was developed
to assess pointing performance of
the Earth Observing System (EOS)AM-1 spacecraft. The package is
written in MATLAB script lan-
guage, with optional exte _nalinterfaces to FORTRAN fl _r some
of the more computationally inten-
sive operations. The software
package is module based to
enhance its versatility and porta-
bility. The five main modules thatmake up the basic packa_;e are as
follows: the plant-definition mod-
ule, the attitude-control-_',ystemmodule, the disturbance module,
the simulation module, and the
jitter-analysis module.
EOSSIM uses a sparse-matrix
formulation for the spacecraft
EOS AM-1 baseline jitter--phase 1.
dynamics model which makes the
discrete time simulations quiteefficient, particularly when a large
number of modes are required to
capture the true dynamics of the
spacecraft. Typically, EOS AM-1
jitter analysis is performed withmore than 500 structural modes
used to describe the spacecraft
dynamics. EOSSIM requires finite-
element-generated structural
mode shape vectors and frequencydata to form the open-loop plant
models. In the development of
EOSSIM, an efficient jitter-analysis
procedure that determines jitterand stability values from time sim-
ulations in a very efficient manner
was devised. The resulting jitter-
analysis algorithms produced a
speedup of more than 1600 over
the brute-force approach of sweep-ing minima and maxima.
A graphical user interface (GUI)is also included in the EOSSIM
software package. This interface
uses MATLAB's Handle graphicsto form a user-friendly environ-
ment that permits a convenient
and intuitive way to set simulationparameters. The current versionof the GU! allows the user to
156

RESEARCHANDTECHNOLOGYHIGHLIGHTS
Space Platforms
interactively select the following
jitter-analysis and simulation
parameters: simulation type,
problem size, disturbance model
selection, performance outputselection, and various levels of
simulation and jitter-analysisdocumentation.
The EOSSIM software packagehas been transferred to and used
by several aerospace corporations.EOSSIM will continue to be used
by industry for jitter analysis andsimulation of future EOS missions
as well as in other missions that re-
quire simulation and jitter analysis
for large-order systems.
(Peiman G. Maghami, 44039, Sean
P. Kenny, and Daniel P. Giesy)Flight Systems Directorate
Fluid Dynamics of Chem-
ical Vapor Deposition
Chemical Vapor Deposition(CVD) is an important industrial
_rocess for the production of semi-
conductors, thin films, optical and
corrosion-resistant coatings, paint
pigments, drawing stock for opti-
cal fibers, and many other pro-
ducts. The quality of the finished
product depends critically on thefluid dynamics of the process,
However, it is difficult to quantify
the fluid dynamics of CVD because
of the complicated interaction of
the fluid dynamics, heat transfer,
nonequilibrium chemistry, andinternal geometry that are normal-
ly involved. The mission of the
Chemical Vapor Deposition Facili-
ty (CVDF) is to improve the under-
standing of the CVD processthrough development of laboratoryinstrumentation and numerical
modeling tools that can be applied
by NASA and coinvestigators inindustry and academia.
A collaboration between CVDF
personnel and University of
Virginia (UVA) coinvestigators
has produced a data set of three-dimensional flow-field measure-
ments, growth-thickness experi-ments, and a three-dimensionalnumeric model of both the fluid
dynamics and reactive chemistryassociated with a horizontal CVD
reactor. Correlations between the
model and the experiments wereused to validate the model, identifyfeatures of the reactor that were
critical to its fluid-dynamic perfor-
mance, and optimize the operating
parameters for this process. Theflow-field measurements and
numeric model were performed
on-site, while the growth datawere obtained in UVA facilities.
Laser velocimetry (LV) techniques,adapted from wind-tunnel applica-tions, were used to measure the
flow field inside the reactor (see
figure). A CFD code, enhanced
through the SBIR process specifi-cally for CVD modeling, was used
to develop the numeric model ofthis CVD reactor.
lIvan O. Clark, 41500}
Flight Systems Directorate
Chemical vapor deposition reactor installed in laser velocimeh\v lab.
157

Automated Structural
Assembly Research
Completed
In 1993, the Automated Struc-
tural Assembly Laboratory (ASAL)operations were concluded after
successfully demonstrating robotic
assembly of a 102-element tetrahe-dral truss structure and the instal-
lation of 7-foot-diameter panels on
the planar surface of the truss
structure. ASAL has been a joint
program of the Structures and
Flight Systems Directorates andhas been the most autonomous tel-
erobotic program in the agency.
Automated structural assemblyhas been proposed for future mis-
sions, such as large spacecraft and
planetary habitats. ASAL has
demonstrated the ability to roboti-
cally assemble large structuresunder supervised autonomy.
Technok_gy that has been deve-
loped and integrated into the
robotic assembly includes auto-
mated sequence planning for
determining the optimum
sequence for installation/removal
of struts; automated path planning
for determining collision-free
trajectories for the robot arm andpayload; interchangeable special-
purpose end effectors with inte-
grated sensors and microprocessorsfor monitoring and error detection;
active compliance and load balanc-
ing using a wrist force/torque sen-
sor; computer vision-based gui-
dance for final alignment and
closure; and an expert system-based executive for monitoring
and replanning.
(Ralph W. Will, 46672)
Flight Systems Directorate
Hydraulic Manipulator
Testbed Controlled
Remotely From JSC
Following the cancellation of
the Flight Telerobotic Servio_r
Truss structure assembh'd by robotic system. L-93- )9366
(FTS) program, Langley Research
Center (LaRC) and Johnson Space
Center (JSC) have worked together
to capture the telerobotics technol-ogy generated under the FTS pro-
gram. The FTS Hydraulic Manipu-lator Testbed (HMTB) has been
installed and placed in operationat LaRC, and one flight-qualifiable
arm has been delivered to JSC.
HMTB includes a hydraulically
driven dexterous 7 degree-of-
freedom robot arm, kinematically
similar to the flight arm, and usesthe FTS flight software, sensors,
and control system. LaRC engi-
neers have developed an inter-
active operator control station forHMTB that enables selection of
control modes, control-system
gains, motion commands, and sen-
sor feedback. In August 1993, thesoftware was installed on a
workstation at JSC, and JSC per-
sonnel remotely controlled the
HMTB in Cartesian and joint posi-tion moves. Commands from JSCand data from LaRC were transmit-
ted over the lnternet network, andvideo between the Centers was
carried over the NASA telecon-
ferencing network. Subsequenttests will use joysticks and rate
control to simultaneously drive all
seven joints of HMTB and will em-
ploy compu ter-genera ted graphics
simulations to compensate for
transmission time delays.(Plesent W. Goode IV, 46685)
Flight Systems Directorate
158

RESEARCtt ANDTt!CltN('JIX)GY HI(;ttI,IGttT$
Space Platforms
!>!!
Hydraulic Manipulator Testbed for FTS pro<¢nun. L-93-00921
Semiconductor Laser for
Free-Space Optical
Communications
NASA Langley Research Center
has been developing, for the Ballis-
tic Missile Defense Organization, a
high-power and high-modulation-
rate semiconductor laser for free-
space optical-communication
applications. Current specific
objectives call for a 1 W and 1 GHz
modulation-rate laser.
A Monolithic Flared Amplifier-
Master Oscillator Power Amplifier
(MFA-MOPA) semiconductor
laser has been fabricated for NASA
Langley by Spectra Diode Labora-
tory and has been demonstrated in
a laser transmitter design by
NASA Langley. The MFA-MOPA
semiconductor laser has been dem-
onstrated to operate up to 3 W of
power with direct modulation
rates greater than 1 GHz. Current-
ly, a 1-W version of the MFA-
MOPA semiconductor laser is
being offered for sale commercially
by Spectra Diode Laboratory for
optical communication, printing,
recording, and medical applica-
tions.
(Herbert D. Hendricks, 41536}
Flight Systems Directorate
Radar and Antenna Tests
of End-Mass Payload for
Small Expendable
Deployer Systems
The first Small Expendable
Deployer System (SEDS) was a
NASA experiment that flew as a
secondary payload on a U.S. Air
Force Delta 11 rocket on March 29,
l _)q3. The SEDS- ] successfully
deployed an instrunlented end-
mass payload (EMP) on a 20-kin
nonconducting tether from the
second stage of the Delta II. The
instrument measurements on-
board the SEDS EMP were tele-
metered to U.S. Air Force and
NASA ground stations using
LaRC-developed antennas that
were mounted on opposite sides
of the EMIL The antennas were
designed, fabricated, and tested at
NASA Langley Research Center
(LaRC). The antenna pattern and
gain measurements for the EMP
flight units were completed in the
Langley Low-Frequency Antenna
Test Facility. Volumetric pattern
data were collected in 1 ° incre-
ments of theta ((V to 180 °) and phi
(()_ to 360°). These data were used
to calculate critical signal margins
to ensure that all mission data
would be received uncorrupted.
Postmission analvsi_ of the
received signal strength at the
ground stations indicated that the
antennas and RF subsystem of the
EMP exceeded all performance
expectations. Data were collected
that related to the rigid-body
dynamics of the EMP, beginning
at separation from the Delta 11 sec-
ond stage through reentry and
burnout by several onboard sen-
sors. The EMP was also tracked
by several ground-based radar
and optical sensors.
In support of the experimental
radar study of the EMP, volumetric
radar cross-section nleastlrelllellts
era full-scale EMP model at 6 GHz
were made in NASA Langley's Ex-
perimental Test Range (ETR). The
ETR facility is a compact range
that is designed for microwave
scattering measurements in the
2- to 18-(;tt/range. The SEI)S
EMP model was placed near the
center of a _-ft by B-ft test zone that
provides a uniform plane wave to
159

Radar measurements of end-mass payload (EMP) in ExperimeJ_tal T, st
Range. L-92-( 6742
simulate the necessary far-fieldconditions. A low-cross-section
pylon supported the model and
included a computer-controlled
36(} ° azimuth rotator for patternmeasurements. A foam cradle was
developed that allowed the modelto be supported at various tilt
angles while the 360 ° azimuth
sweeps were performed (see fig-
ure). The tilt angles were changedin 5 "_increments. This resulted in a
set of volumetric RCS data, with
each tilt angle corresponding to agreat-circ]e cut. These results pro-
vided verification, prior to launch,of the ability to track the EMP with
a ground-based radar.(Robin L. Cravey, 41819, MelvinGilreath, and Erik Vedeler)
Flight Systems Directorate
160

RESEARCH AND TECHNOLOGY HIGHLIGHTS
Space Platforms
161

RESEARCH AND
TECHNOLOGY
Space Science
Provide teclmolo_/ for l'r°grams
focused on Earth, the Solar
System, and the Universe, and
use the data as the basis for
national and internatioJlal poli_
making _vlating to chin, ges to the
_lobal system

RESEARCH AND TECHNOLOGY HIGHLIGHTS
Space Science
ESTAR Mission Analyses
Studies to design mission con-
cepts for remote-sensing applica-tions in Earth sciences using the
Electronically Scanned Thinned
Array Radiometer, ESTAR, havebeen conducted. Particular
applications are the measurementof soil moisture over land, the
measurement of sea surface salini-
ty over the oceans, and measure-
ments over the polar ice caps. Mis-
sion designs include spacecraft
design, launch-vehicle configura-tion, and orbit analysis. A four-
frequency ESTAR that implements
one-dimensional aperture syn-thesis and a "small, low cost"
single-frequency ESTAR that
implements two-dimensional
aperture synthesis have beenstudied.
Use of aperture synthesis meth-ods in microwave radiometry is
one approach to minimizingantenna mass and stowed volume
in high-spatial-resolution measure-ments of soil moisture. Two-
dimensional synthesis has been
proposed as optimal in terms ofthese requirements. The objective
of the Langley two-dimensional
ESTAR study was to assess the fea-
sibility of a soil moisture missionwith a small spacecraft and to esti-mate the cost. An antenna in a
symmetric cross configurationmade up of two arms 8.75 m longand 0.30 m wide with 145 individu-
al patch antenna elements was
designed along with all other sen-
sor hardware. A 535-kg spacecraftthat delivers 177 W in payload
power and is configured for a Tau-rus launch was designed. The sys-
tem provided 10 km of spatial re-solution at 1.4 GHz from a 400-km
polar orbit with a 3-day revisit
time. A 378-kg, Pegasus compati-
ble, reduced-performance versionthat included a 4.5-m antenna was
also defined. This system provided
19 km of spatial resolution, a 60 °orbit inclination, and a reducedmission lifetime.
The four-frequency ESTAR was
designed to provide measurementsover land, oceans, and ice at 1.4,
6.8, 18.7, and 37 GHz. The design
was driven by the 1.4-GHz anten-na, which was a 9 m x 9 m array
made up of 14 slotted waveguide
"stick" elements. A 2500-kg space-craft that delivers 670 W of payload
power was designed and config-ured for a Titan II S-10 launch
vehicle.
(J. W. Johnson, 41963, and W. A.Sasamoto)
Space Directorate
Gravity and Magnetic
Earth Surveyor
Subsatellite
The Gravity And Magnetic
Earth Surveyor (GAMES) is a
mission-to-planet-Earth spaceflight
experiment with a projected 1998
launch. The experiment objective
is to map the Earth's gravity and
magnetic fields. The technique
used to measure the high-order
harmonics in the gravity field
requires two co-orbiting satellites,
a primary satellite and a passive,
aerodynamically stabilized "sub-satellite." The primary satellite
carries a laser-ranging instrument
that, when pointed at a cornercube reflector on the subsatellite,
measures velocity variationsbetween the two satellites. This
relative velocity is a function of
the spatial variation of the gravity
field. The aerodynamically stabi-lized subsatellite is a new concept,
and its flight characteristics arecritical to the success of the
GAMES mission. Langley was
asked to conduct a performance
analysis on the subsatellite as a
part of the phase A study.
The objectives of the perform-
ance analysis were to define the
deployment-rate damping timefor the subsatellite, determine the
magnitude of its steady-state oscil-lations, and estimate its orbit life-
time. The modeling approach
required for the analysis included
a high-fidelity aerodynamic modelthat simulated free molecular flow
in the 250-km to 450-kin altitude
range and accounted for air-molecule accommodation,
reemittance, and reflection effects.A surface finite-element mesh
model of the subsatellite, with
approximately 5000 elements, was
developed for high-fidelity simula-
tion of surface geometry, blockage,and shadowing. A solar-radiation
pressure model and a global-winds
163

model were also included in the
analysis. Magnetic hysteresis rods
were used to provide deployment-
rate damping for the subsatellite.
Analysis results show acceptable
deployment-rate damping timesand orbit lifetimes. Further, it was
found that steady-state oscillationsfor 250 to 325 km in altitude were
between 5° and 7°, respectively.(J. W. Johnson, 41963, M. L. Heck,R. R. Kumar, and D. D. Mazanek)
Space Directorate
Eyesafe Ho:YAG Lidar
for Cloud Monitoring
Although it is recognized that
clouds play an important role in
climate, reliable climatologies of
even simple cloud properties suchas base height are not yet available.
Small, autonomous lidar systems
(ceilometers) are currently used
for continuous cloud base height
monitoring at many airports.These systems must be inexpensive
and eyesafe and, therefore, use
very low-power visible-wavelengthlaser sources. Because of tb.eir low
power, they have limited range
and can detect only low-altitudeclouds, so measurements by these
systems are not useful for develop-ing general cloud climatologies.
Many high-power research lidarsare available, but because of the la-
ser power levels used, they are noteyesafe and require that an observ-
er be present. This requirement
makes it impractical to operate
these systems on a continuousbasis as required for climateresearch.
The human eye is much less
susceptible to damage from, laserradiation at near-infrared wave-
lengths in the 1.5- to 2.3-1arc= range.
This allows operation at much
higher pulse energies in sit_lationswhere accidental human exposureto the transmitted laser beam is a
safety concern. Until now, howev-
er, a high-power laser source thatis suitable for lidar use has not
been available in this spectral
range. Schwartz Electrooptics and
the University of South Ftoiidahave collaborated under Small
P(R)
Cloud
I I I I I I I I I
0.8 8.9 1.9 2.8 3.? 4.7 5.6 6.5 ?.4 8.4 c.3(_1)
Sample 2.1-tim lidar return signal from a low-altitude cloud.
Business Innovative Research
(SBIR) contract NAS1-19300 to
develop an eyesafe laser that issuitable for use in a cloud lidar
system. The investigation showedthat a Ho:YAG solid-state medium
lasing at 2.1 IJm was best able to
produce the short, high-power
pulses that are required for lidar.
The laser produces 150 mJ in a
1-psec Q-switched pulse at a 2-Hzrepetition rate. This is about an or-
der of magnitude more energythan has been obtained from exist-
ing lasers operating around 2 pm.
The laser is now being integratedinto an existing lidar system and
will be used to explore application
as an autonomous cloud-monitoringlidar.
{David M. Winker, 46747)
Space Directorate
Remote Sensing of
Multilevel Clouds
A multispectral, multiresolution
(MSMR) method was developed
to analyze complex cloud scenes
that contain both single-layeredand multilayered cloud decks.
The MSMR method provides a
framework for collocating AVHRR
(Advanced Very High Resolution
Radiometer) and HIRS/2 (HighResolution Infrared Radiometer
Sounder) data and incorporatescloud-retrieval algorithms such as
CO2 slicing and spatial coherence.
Automated atmospheric param-eterization schemes were deve-
loped that were based upon rawin-
sonde profiles and analysis pro-
ducts such as ECMWF (EuropeanCenter for Medium Range Weather
Forecasting). The automated pro-cedures were used to derive tem-
perature and humidity profiles for
164

RESEARCHANDTECftNOLOGYHIGHLIGHTS
Space Science
each HIRS/2 field of view, to
estimate clear-sky and low-cloud
radiances, and to dynamically
determine the tropopause height.
A unique new feature of the
MSMR method was the develop-
ment and implementation of an
automated fuzzy-logic cloud-classification expert system. The
expert system was trained and
tested using AVHRR imagery that
was collected during the FIRE
(First ISCCP Regional Experiment;ISCCP refers to the International
Satellite Cloud Climatology
Program) Cirrus Intensive Field
Operation fiFO II) held in Kansas
during the fall of 1991. The expert
system classifies the scene within a
32 x 32 AVHRR array (approximate-ly 35 km x 35 km) as being com-
posed of land, ocean, low cloud,
middle cloud, or high cloud, either
singly or in combination.
The MSMR method was appliedto two daytime scenes fromNovember 28, 1991, that were
collected during the FIRE IFO II.The two cloud scenes consisted
primarily of a cirrus veil overlyinga stratus deck. Through tile analy-sis of collocated AVHRR data,
each HIRS/2 pixel was classifiedas being clear of clouds or contain-
ing up to two cloud layers. Cloudtop heights for each layer present
were determined by using a combi-
nation of the spatial coherence andCO2 slicing algorithms. The cloud
heights retrieved from satellite
data compared well (within 1 kin)with coincident lidar, radar, and
aircraft data. Cloud analysis was
performed for an ISCCP 2.5 ° grid
cell that encompasses the FIREIFO II experimental region. For
both satellite overpasses, more
than half the HIRS/2 pixels thatfell within the ISCCP cell showed
evidence of overlapping cloud
layers. Overlapping cloud layers
are not provided for ill the 1SCCPalgorithm.
(Bryan A. Baum, 45670)
Space Directorate
First Measurements of
Biogenic Emissions of
Nitrogen Oxides Obtained
From African Soils
Recent satellite measurementsindicate that the continent of
Africa is the world's center of
burning. To assess tile impact of
African burning on the composition
and chemistry of tile global atmo-sphere and planetary climate, over100 scientists from more than a
dozen countries participated in
the South African Fire-Atmosphere
Research Initiative (SAFARI) in
September and October 1992. As
part of the Langley participationin SAFARI, we obtained measure-ments of emissions of oxides of ni-
trogen---nitric oxide and nitrous
oxide---produced by microbialactivities in African soils. Micro-
bial activity is the major globalsource for both of these environ-
mentally significant gases, which
impact the chemistry of both the
lower atmosphere (the tropo-
sphere) and the upper atmosphere
(the stratosphere). Tile Langley
measurements represent the firstsuch measurements ever obtained
for soils in Africa. Several years
ago, Langley researchers dis-
covered that burning significantly
enhances the microbial productionof these gases. We also obtainedmeasurements of the emissions of
these gases before and after
Distribution Offburning in Africa in 1987 based on measurements obtainedwith Defense Meteorological Satellite Program. (Original qf fi_,,ure in color;
contact author for more information.)
165

burning in Africa and found that
burning has a very significant
impact on the production of nitric
oxide in soils. Following burning,the emissions of nitric oxide were
much higher than they were beforeburning. Emissions of nitrousoxide were not detected, either be-
fore or after burning. We attributethe lack of nitrous oxide emissions
to the severe and long-term
drought in Africa.(Joel S. Levine, 45692,
Wesley R. Cofer III, andDonald R. Cahoon, Jr.)
Space Directorate
Measurements of Pressure
Broadening and Shifts of
Ozone Infrared Lines
Near 3 _m
Knowledge of pressure broa-dening and line-shift coefficients
for spectral lines of ozone is impor-
tant for atmospheric remote-sensing
studies. Accurate parameters are
needed not only in the 9- to ll-pm
region, which is usually used forozone retrievals from passiveinfrared measurements, but also
in other spectral regions, where
ozone absorptions overlap thespectra of other trace gases such as
methane. NASA Langley research-ers, in collaboration with research-
ers at the College of William and
Mary and a NASA Langley ASEE
Summer Faculty Fellow, have con-
ducted laboratory studies to deter-mine room-temperature air-, N2-,
and O_-broadening and shiftcoefficients for over 270 ozone
lines in two absorption bands in
the 3-1am spectral region.
The infrared absorption spectraof mixtures of ozone with the
0.10 1
,"-', 0.09TE*_ 0.080
TEu 0.07
C3
-o_ 0.06
0.05
0.005
0 1,,' • _1+_2+_/3 • 3v 3
.......HITRAN92
l I I
l-.i ,,{
{ o" , m,,|,§
n i i i I i _ , L I , , , , I 1 , , , t
0 15 20 25 30 35
..... ]-- I I I
0.000
I
E-_ -0.0050
I
E -0.010L.;'
o
_.o -0.015
o o (]
........ o}oO0- .>-00 OoO .....1
-0.020 _ , , , _ .... _ ......... ___L,_,_._10 15 20 25 30 35
Ull
Observed air-broadening (l'L_j) and shift (tJ_) coefficients at 296 K for ozone
lines with the same lower s._ate rotational quantum nUnlbers hi the 3-pro
and 9-Bnl bands. Error bms indicate standard error qf each measu red [_tl[|l£.
broadening gases at variot_s pres-
sures were recorded by using the
high-resolution Fourier tn nsform
spectrometer at the McMal h-Piercetelescope facility of the National
Solar Observatory on Kitt Peak
near Tucson, Arizona. The a naly-
sis was performed on micn,comput-
ers by using a nonlinear kast-
squares spectral-fitting techniquedeveloped at NASA Langley.
The results of this study showsome evidence for a small vibra-
tional dependence of the broaden-
ing coefficients. The N2- and air-
broadening coefficients determinedin the 3-pro ozone bands are, on
average, 5 to 6 percent larger than
the corresponding values mea-sured in the 4.8-/am and 9Jam
regions. For O2-broadening coeffi-
cients, the differences are greater--
166

RESEARCH AND TECHNOLOGY HIGHLIGfITS
Space Science
about 8 to 10 percent. The mea-
sured pressure-induced line shifts
in tile 3-_tm region are significantly
larger than those measured in the
9-l.tm and 4.8-btm regions; this
difference indicates that the shifts
depend on the upper vibrational
level of the transition.
(Mary Ann H. Smith, 427011
Space Directorate
Rapid Computation ofEarth-Limb Emission in
Non-LTE Environment
The capability to rapidly and
accurately evaluate the equation
of radiative transfer is essential to
the interpretation of measurements
of infrared Earth-limb emission in
terms of the temperature and
minor constituent concentrations
in the middle atmosphere (10 to
100 kin). In particular, many of
the observable emissions from car-
bon dioxide, ozone, molecular
oxygen, the hydroxyl radical,
water vapor, and nitric oxide orig-
inate from radiative transitions
that depart significantly from local
thermodynamic equilibrium (LTE)
in the mesosphere and lower
thermosphere (50 to 100 km).
Analysis of emission measurements
from this region of the atmosphere
must account for the nonequili-
brium populations of the emitting
species in both the radiation
source term and the transmission
term, which make up the equation
of transfer. In principle, accurate
calculations under the nonequilibri-
um conditions require time-
consuming line-by-line calculations
in which the properties of each
spectral line are modeled at high
spectral resolution.
Techniques that provide line-
byqine accuracy with only a frac-
tion of the computer time necessary
to do the exact line-by-line calcula-
tion have been developed to eval-
uate the radiative-transfer equation
under nonequilibrium conditions.
The new technique involves rede-
fining the absorption cross section
and optical mass terms in the eval-
uation of the atmospheric opacity
and is an extension of techniques
used previously to analyze emis-
sion measurements in the LTE
regime. Calculated radiances that
employ the new technique and
radiances that are calculated by
using the exact line-by-line calcula-
tions agree to better than 0.5 per-
cent. Less than 1 second of com-
puter time on readily available
desktop computer hardware is
required to evaluate the limb radi-
ance from 100 to 50 km, accounting
for radiative transfer in over 1200
atmospheric layers. The time that
is required is almost 3 orders of
magnitude faster than needed for
the line-by-line calculations. The
new radiative-transfer techniques
will be applied in the analysis of
nonequilibrium emission to be
measured by kangley's sounding
of the atmosphere using broadband
emission radiometry (SABER)
experiment, which has recently
been accepted for the definition
phase by the NASA Office of Space
Science for the thermosphere iono-
sphere mesosphere energetics and
dynamics (TIMED) mission.
(Martin G. Mlynczak, 45695)
Space Directorate
TRACE-A
The TRACE-A(TRansport and
A_tmospheric Chemistry near the
_Equator--Atlantic) n_ission ob-
tained more than 140 flight hours
of data, which mapped the extent
of high concentrations of tropo-
spheric ozone that had previouslybeen observed from satellite
measurements and then confirmed
from ozonesonde measurements
in 1990 and 1991. The DC-8
measurements found very high
levels of carbon monoxide hydro-
Flight tracks of DC-8 during TRACE-A fieht mission, September amt
October 1992.
167

carbons, peroxides, and reactive
nitrogen species in support of an
in situ source of troposphericozone formation. The precursors
for this ozone generation are most
likely the result of widespread bio-
mass burning in southern Africaand in Brazil. More than 200 scien-
tists and support personnel
deployed in both continents to
characterize the regional emissions
of both source regions. During the
measurement time period, Septem-ber to October 1992, considerably
higher emissions were found toemanate from southern Africa (in
particular, northern Zambia) thanfrom central Brazil. Preliminary
analysis suggests that these highlevels ot ozone are correlated withthe satellite observations of total
ozone in this region. Measurementsfrom the DC-8 also showed that
the south tropical Atlantic is aregion of strong subsidence, whichwould be conducive to downward
transport of ozone from the upper
troposphere and lower strato-
sphere. A special issue of theJournal of Gcophysical Research will
be devoted to the findings ofTRACE-A.
{Jack Fishman, 42720, and James
M. Hoell, Jr.)
Space Directorate
Airborne Measurements
of Trace-Gas
Emission/Deposition
Rates
Uncertainties it] the surface/
atmosphere exchange rate of CH4
and other climatically important
trace species (e.g., O:_ and CO)
severely impact the accuracy withwhich the global budgets of these
species can be estimated. One
JamesBayKinosheoTower Site.
_ " _ | 25 _ 10
10_ _,,___-- " ¢ _lO _
_ a0..... _ Z_._ - *'-:_ - _ ,.k_-- - sI _, : 40 -_ -/ ..... _,,.-..,_._'-'-_"_,,,__ • ,
Airborne measurements of vertical flux (emission rate) o( carbon monoxideand methaltc obtained during NASA ABLE-3B experiment over fJudson
Bay Lowlands ofCanada.
SOtlrce of uncertainty in CLH'rc H os-
timates of the CH4 budget is thc
extrapolation of ground-enck .suremeasurements (with a measu re-
ment scale of =1 m 2) to repre_,ent
large-scale CH4 emission rate s for
entire ecosystems. Since largevariations in methane flux have
been observed over a very litnited
spatial domain, extrapolatitn _s of
these flux measurements to l trgerscales make the resulting un, er-
tainty in the large-scale flux ,_sti-
mate difficult to quantify.
Airborne regional measurementsof 03, CO, and CHa emissior /
deposition rates were obtain.:dover the Hudson Bay Lowla _ds(HBL) and northern boreal f, _rest
regions of Canada during Ju!y and
August 1990 as a result of the
National Aeronautics and S],aceAdministration (NASA) Atr _o-
spheric Boundary Layer Experi-
ment (ABLE-3B) program. Sincethe relative error of the airborne
CH4 flux measurernents can be
estimated, these data provide an
excellent basis for estimatin 4 the
associated uncertainty in large-
scale flux estimates obtained from
extrapolation procedures.
Regional n]casurements of thesurface flux of C() and CH4
obtainc_J over the t{BI during the
ABLE-3B experiment are provided
it] the figure (units of the CO and-2
Ctti flux contours are mg mday _). The data indicate that
more productive CH4 regions arelocated near the shore of the James
Bay. Serendipitously, large COfluxes were observed in the inland
regions of the same study area in
the HBL, as indicated in the figure.
The explanation for these large CO
fluxes is not currently well under-stood, but may be a result of eitherdirect emission from the under-
lying vegetation or a product of
the oxidation of naturally emitted
hydrocarbons. Based on theresults of this work and an exten-
sive ground sampling network
throughout the HBL, the role ofthe HBL in the global CH4 budgethad to be reassessed. Previous
estimates, which were based on an
extrapolation of CH4 flux measure-
168

RESEARCHANI)TECtlN()I_O(;Y]-|I(;III_I(;tlTS
Space Science
ments made in the peat fields of
Minnesota, placed the contribution
of the HBL to the global CH4budget at =7.5 Tg yr -I, Current es-timates indicate that the contribu-
tion is =0.5 Tg yr -1. These resultsindicate that in situ airborne flux
measurements provide valuableinformation oll scales that are
directly applicable for large-scale
global climate change models.(John A. Rifler, 45693, John D. W.
Barriek, and Catherine Watson)
Space Directorate
Airborne LidarMeasurements of Ozone
and Aerosols Over
Tropical Atlantic
Tile Langley Research Center
airborne differential absorptionlidar (DIAL) system was operatedfrom the Ames Research Center
DC-8 aircraft to obtain distributions
of ozone and aerosols in the tropo-
sphere over the tropical Atlanticduring September and October
1992. This investigation was
conducted as part of the NASA
Global Tropospheric Experiment(GTE)/Transport and Atmospheric
Chemistry near the Equator--Aria-
ntic (TRACE-A) field experiment
to determine the source of high
ozone that occurs in the tropicalAtlantic between Africa and Brazil
during the burning season, which
is primarily from June to October.
The airborne DIAL system madesimultaneous measurements of
ozone and aerosol profiles above
and below the DC-8 along the
flight tracks. The DIAL-derivedatmospheric cross sections ofozone and aerosol distributions
from the surface to the tropopause
level were used to provide the
AFRICAN OUTFLOW - WEST (DAY 1)
TRACE A FLIGHT 13 14 OCT 92
...a 10-
8q
RELATIVE AEROSOL SCATTERING X 1000 (IR)0 I0 2O 3O 4O 50
9:20 9:40 10:00 I0:20
PT5 PT6
UT
_8
0 - _-0
-12.82 -10,17 -7.47 -5.76
.... ,_ .- ..... + 4 +_q--+---+ ....... _--_+ + ..... -+ ...... H-
9.00 9,00 9,00 8,63
N LAT
E LON
OZONE(PPBV)0 20 40 60 80 100<._ .....
9:20 9:40 10:00 10:20
PT5 PT6
UT
2 4-_ i4
0_ ........ 0.12.83 -10.18 °7.47 -5.77 N LAT
........... +-q.-..+-_+.._ _._+ ..._ .... _.-._ +-_--_ ._ -_-+ +
9,00 9.00 9.00 8.63 E LON
Airborm" h'dar mcaslm'nycnts of aerosol (top) and ozom' (bottonl)
distributioJls over the tropical Atlantic west of Anyola o_l October 14, 1992.
(Origimd of fisure i_i color; contact author for more information.)
large-scale perspective on the state
of the atmosphere and its composi-tion.
During TRACE-A, the airflow
over the tropical Atlantic in the
Southern Hemisphere was pre-
dominantly from the east (Africa)
in the lower troposphere (below=8 km altitude) and from the west
(Brazil) in the upper troposphere.The convective storms in Brazil
transported gases in the extensive
fire plumes from near the surface
to the upper troposphere, where
ozone was photochemically pro-duced and advected eastward over
the Atlantic. In central Africa, the
fires were widespread, and in theabsence of convective storms, tile
fire plumes were advected at lowaltitudes (below =6 kin) over the
Atlantic. Airborne DIAL measure-
ments showed considerable vari-
ability in ozone and aerosol distri-
butions and a strong dependence
on the transport of air masses from
169

regionsassociatedwithbiomassburning.Therewasapositivecor-relationbetweenozoneandaero-solsfounddownwindofbiomassburningregionsthatwerenotinvolvedinconvection.Thedegreeof photochemicalozoneproductionintheplumesappearedtobedependentontheageoftheplume.Highozone(>75ppbv)wasobservedin theplumesbelow6kin,andin theuppertroposphere,ozonefrequentlyexceeded100ppbvfromphotochemicalozoneproductioninoutflowsfromBrazilandfromstratosphericairtrans-portedintothetroposphereinintrusionevents.TheairborneDIALdatawereusedtohelpdeterminetherelativecontributionof thevariousprocessesto thebuildupofhighozoneoverthetropicalsouthernAtlantic.(EdwardV.Browell,41273)Space Directorate
Global Surface Albedos
Estimated From ERBE
Data
Knowledge of the surfacealbedo and its changes has impor-
tant applications in the study ofclimate, ecology, land use, and
agriculture. The only practical
method for obtaining surface albe-
dos at desired spatial and temporalscales over the entire globe is toestimate them from satellite mea-
surements. Scattering and ab-
sorption by the intervening atmo-
sphere can cause large differencesbetween albedos at the surface
and those measured at the top of
the atmosphere by satellites; thus,
atmospheric conditions must beaccounted for as accurately as pos-
sible to convert top_f-the-atmtrsphere
alb,_<tos to tx_ttom_ff-the-atmosphere
_S
1.0
.8 I--
.6
.4
.2
0
90°N
f_
AS,G 1rl
li/liZ7-85 --_.124
10-85 _--_.1221-86 _'--.132
[[]/tT -
_
I I I I 16[)° 30° 0° _30° -60° -90°S
LATITUDE
Zonal surface albedos.
surface) albedos. Four atnlospher-
lc parameters were needeli for thisconversion. Water vapor md()zone burdens were obtained from
the NOAA-9 Tiros OperationalVertical Sounder (TOVS), surface
pressures were annual me an
values (primarily a functi, m of
surface height), and aerosol pro-perties were obtained from the
World Climate Research l'rogram(WCRP) estimates.
The Earth Radiation Bl_dget Ex-
periment (ERBE) provide t clear-
sky, monthly averaged, broadbandalbedos for each of 10 368 global
regions (2.5 ° latitude x 2.!; ° longi-tude). These albedos were convert-
ed into surface albedos, and the
zonally averaged values l:or the
midseason months are given in the
figure. The north polar zones
clearly illustrated the effect thatseasonal ice/snow coverage hason surface albedos with winter-to-
summer differences as large as 0.5at 60 ° to 70°N latitudes. There is
only a small seasonal effect from40°N to 40°S. The "hump" at 15 °
to 35°N is caused by the high albe-dos of the Sahara and Arabian
Deserts, and the one at 15 ° to 30°S
is caused by deserts in Australiaand southern Africa. Globally
averaged surface albedos, shown
in the figure, vary from 0.12to 0.14, and the annual average isabout 0.13.
(W. Frank Staylor, 456801
Space Directorate
170

RESEARCH AND TECHNOLOGY HIGHLIGHTS
Space Science
Effects of Mount Pinatubo
Eruption on Earth's
Radiation Budget
Measurements from the NASA
Langley Research Center Earth
Radiation Budget Experiment
(ERBE) were analyzed to deter-
mine the radiative impact of the
stratospheric aerosols produced
by the Mount Pinatubo eruption
during June 1991. Normal c(mcen-
trations of stratospheric aerosols
have little effect on tile Earth's
radiation balance. Increased levels
can reduce the amount of sunlight
that enters the Earth-atmosphere
system, which leads to a cooling of
the surface and diminished photo-
synthetically active radiation.
Thus, large volcanic eruptions
may affect power and fuel con-
sumption and agriculture over
many areas of the globe.
The wide-field-of-view radiom-
eters on the Earth Radiation Bud-
get Satellite (ERBS) have been
monitoring reflected shortwave
(solar), emitted longwave, and net
radiative fluxes over the Tropics
and midlatitudes since November
1984. Five-year averages of these
quantities for 1985 to 1989 over the
area between 40°S and 40°N define
the normal or background condi-
tions. The interannual variability
of the monthly mean fluxes is
approximately 1.5 Wm -2 for
this zone. Following the Mount
l'inatubo eruption, the reflected
shortwave flux increased by
almost 5 Wm _ during August and
September 1991 before gradually
returning to background values by
February 1993. Longwave fluxes
diminished by, approximately
I Wm 2, while the net flux, tile
amount of radiation absorbed by
the planet, decreased by over
4 Wm _. The net flux was back
at normal levels by March 1993.
These flux anomalies are well
correlated with aerosol measure-
ments taken by National Oceano-
graphic and Atmospheric Adminis-
tration researchers. The ERBE
data were used to validate climate
5
, ,,--_ A [% ^
_Ol- _ _,.
-1 ' r.-_^ / /
-4
1985 1986 1987 1988 1989 19910 1991
YEAR
VE
1992 1993 1994
Smoothed monthly mean radiatiw" flux anomalies over 40°S to 40°N from
ERBS relative to 1985 to I989 monthly averages.
model estimates of the radiative
forcing caused by Mount Pinatubo.
Additional analyses of the post-
eruption flux anomalies indicated
that during reentry into the tropo-
sphere, tile volcanic aerosols alter
the microphysical characteristics
of cirrus clouds; this altering of
characteristics induces a secondaryradiative effect.
(Patrick Minnis, 45671)
Space Directorate
Earth Radiation Budget
Experiment Observations
of Recent ENSO Events
The El Nifio/Southern Oscilla-
tion (ENSO) is the most prominent
large-scale climatological phenom-
enon on Earth. The region of pri-
mary interest in studying tile
ENSO is in the Tropics, extending
from Indonesia to South America;
the near-equatorial areas are the
most important. ENSO events are
associated with abnormal warming
of the equatorial Pacific and are
accompanied by significant chang-
es in cloudiness and the Earth's
radiation fields. ENSO events can
cause dramatic climate changes,
such as floods and droughts, in the
United States and in other areas
around the world. The Earth Radi-
ation Budget Experiment (ERBE)
solar-reflected and Earth-emitted
radiation data were used to study
the radiative characteristics of the
1987 and 1992 ENSO events.
The figure presents a time-series
plot of the solar-reflected radiative
anomaly in the equatorial Pacific
relative to a 5-year (1985 to 1989)
mean for each month. These data
clearly show the strong radiative
anomalies associated with both
171

the 1987 and 1992 El Nifios as well
as a large negative anomaly associ-
ated with the 1988 La Nifia (cooling
episode) event. Radiative features
and variability are closely related
to changes in the amount, type,
and optical depth of clouds. Stronganomalies in Earth emitted radia-
tion were also observed during the
mature phase of the ENSO events.
The Mount Pinatubo eruption in1991 may have affected the
1993
1992
1991
(9 1989>..
1900 _'_'"< ..... -.:
1987 " -- _'5"¢'_
1986
1985 ;i;_;:._::._i;:.i:i::_i _i_ii? _i;i;...........
_3oE _6OE _7ow _4ow _ow _w
Longitude, deg
Time series of solar-reflected radiative anomaly from ERBE for 5°N h, 5°Slatitude. Crosshatched areas are greater than 5 Win-2; stippled areas _re
_?
less than -5 Wm _.
development stages of the 1992
ENSO, but the major radiativeeffects of the volcanic aerosols
were greatly diminished by May1992 and should not interfere with
the ERBE observations. The 1992
E1 Nifio is similar in many respects
to the 1987 event, but importantdifferences are also evident. The
1992 El Nifio is somewhat broader
in its temporal extent (possiblybecause of the effects of volcanic
aerosols), and there are indications
that smaller anomaly patterns
actually began in the previousyear but then diminished and did
not fully develop until 1992.(Edwin F. Harrison, 45663)
Space Directorate
Nonlocal Thermo-
dynamical Equilibrium
in Upper Atmosphere
Carbon Dioxide
0 OOO01
ce_
E 0.0001 - i /' J__
j/" J- fJ
10 0 10 20 30 40 60 70 80 90 100
o 30°N Average
• 48°S Average
1._ -L_ I 1 L _
50
110
100
9O
Kinetic Temperature-Vibrational Temperature (K)
"U
"13"n
O
ga_e_
7;r_¢2.
CD
Difference between measured kinetic temperature and measured COd_)2)
vibrational temperature plotted versus atmospheric pressure.
A knowledge of the mechanismsresponsible for populating the
bending mode (_2) vibration of
carbon dioxide (CO2) in the upper
atmospheric regions is important
in several respects. First, infraredinstruments flown on space plat-
forms observe the 15-1am emissionfrom this level in order to retrieve
the atmospheric thermal structure.
Therefore, departures of its popu-lation from that dictated from
Boltzmann statistics should be
known accurately to retrieve the
kinetic temperature. Second, since
CO2 is a major species of not only
the Earth's atmosphere, but also of
Venus and Mars, determining theradiative cooling by the CO2
15-1am bands is very important forunderstanding the energy balance
and temperature structure of these
terrestrial atmospheres.

RESEARCH AN D TECtt NOLOGY H IG I! LIGIITS
Space Science
The kinetic and CO2 bending-
mode vibrational temperatures
shown in the figure have been
deduced from analysis of high-
resolution infrared solar-absorption
spectra of the Earth's upper atmo-
sphere. The spectra were recorded
by tile Jet Propulsion Laboratory
Atmospheric Trace Molecule Spec-
troscopy (ATMOS) experiment
onboard tile Spacelab 3 shuttle
mission in the spring of 1985. No
evidence of deviations from local
thermodynamic equilibrium (LTE)
are found below 100 km. At higher
altitudes, departures from IXE are
observable, and the diflerence
between the kinetic and C02 (u2)
vibrational temperature increase>
to 40 K (48°S) and 70 K G0°N)
at 112 km.
These results, obtained in
collaboration with members of
the ATMOS Science Team from
JPL and the University of Libgc,
Belgium, have been interpreted
with a non-LTE radiative-transfer
model at the lnstituto de Astro-
fisica de Andalucia, Granada,
Spain. The calculations show that
the observations can be explained
by using a large value for thedeactivation-rate constant of
CO2(D 2) by atomic oxygen. The
ATMOS observations lead to CO2
15-fm_-band cooling rates that are
larger by a factor of 5 to 10 than
those generally accepted until very
recently.
(Curtis P. Rinsland, 42699)
Space Directorate
Global Effects of Mount
Pinatubo Eruption
After some six centuries of
dormancy, Motmt Pinatubo in the
Post-Mt. Pinatubo Aerosol Loading
40L ' ' ' , ' _- ' : '
t) ....................... ]
0 3 (_ q 12 15 18 21 24 27 30
>,,hmfl>,atter Eruptum
Evolution of Nlobal stratospheric aerosol mass (ill mcwtoHs_ following lure'
1991 eruptio, of Philippim' voh'ano Molnlt Piuatubo.
l'hilippines (15"_N, 121°E) erupted
violently in mid-June 1991, result-
ing in perhaps the largest volcanic
perturbation of the Eartlfs atmo-
sphere since the 1883 eruption of
Krakatau. The Pinatubo eruption
produced a large quantity of
micrometer-sized sulfuric acid
aerosol particles m the stratosphere,
particles which eventually dis-
persed over the globe. These parti-
cles had a significant impact on
the global radiation budget and on
stratospheric chemical cycles. For
example, tropical stratospheric
temperatures soon after the erup-
tion were more than 3 standard
deviations warmer than the
30-year mean, and global average
surface temperatures decreased
by about 1 K during the 18-month
period after the eruption. Hetero-
geneous chemical reactkms that
were catalyzed by these volcanic
aerosols have also been cited as
the cause of unusually low ozone
levels and high active chlorine
le\'els that were recorded over
,.\ntarctica during 1991 and 1992.
The evolution of the Mount
Pinatubo aerosol layer has been
monitored globally by the SAGE Ii
(Stratospheric Aerosol and Gas
Experiment I1) instrument aboard
the Earth Radiation Budget Satel-
lite. A quantity that succinctly
captures the impact of the eruption
is global stratospheric aerosol
mass, which can be estimated by
combining SAGE II aerosol extinc-
tion measurements at several
wavelengths. The figure shows
that global aerosol mass reached
a peak near 30 megatons after the
Pinatubo eruption and started to
decline (with an e-folding time of
approximately I year) by mid-1992
as significant numbers of particles
began to sediment into the tropo-
sphere. By mid-19q3, global mass
had fallen to about 12 megatons,
173

which was the peak value observed
h)llowing the 1982 eruption of theMexican volcano E1 Chichon. Bar-
ring another major eruption, it is
anticipated that the pre-Pinatubo
level (less than 1 megaton) will be
reached by late 1995 or early 1996.(Lamont R. Poole, 426891
Space Directorate
Antarctic Polar Vortex
Processes
Field measurements in andtheoretical studies of the Antarctic
stratosphere have demonstrated
that processes that occur in the
wintertime polar vortex, such asthe formation of polar strato-
spheric clouds (PSC's), engenderchemical transformations that lead
to the formation of the springtimeozone hole over the Antarctic
continent. Recent analyses of
Stratospheric Aerosol and Gas
Experiment lI (SAGE IT) aerosolextinction data show that these
same processes have significanteffects on the global stratospheric
sulfate aerosol budget and on ratesat which these sulfate aerosols
catalvze ozone destruction.
SAGE II data obtained over the
Antarctic show an irreversible
downward redistribution of aero-
sol inside the wintertime polarvortex through a combination of
large-scale subsidence and thegravitational sedimentation of
polar stratospheric cloud (PSC)
particles. The figure compares
average aerosol mass mixing-ratio
profiles from the austral late sum-
mer and following spring periods
of 1987. The peak in the springtime
profile inside the vortex appears ata potential temperature about 80 K
lower than that of the peak during
a_
¢-d
ID
GI
O
¢1.,
700
600
50O
40O
300
Inside Vortex, Spring 1087
..... Outside Vortex. Spring 1987
200
0 I 2 3 4
Mixing Ratio (ppb)
Average mass mixing-ratio !)rofiles qf Antarctic aerosol derived from SAGEI1 extinction measurements in late summer and following spring of 1987.
the previous summer. This change
corresponds to about a 5-kin dropin altitude over the winter. On a
yearly basis, it is estimated that
some 5 to 7 percent of the t__tal
stratospheric aerosol mass s
transported downward acr:)ss the400-K isentropic surface wi :hin theAntarctic vortex. Once beh_w this
level, the material can be fr,,ely ad-vected to lower latitudes, bince
some of the aerosol is transported
to levels near the tropopause, ex-
change processes such as tropo-pause folds can then move the
aerosol irreversibly into the tropo-
sphere. The Antarctic polar vortex
thus plays a significant role in
cleansing the stratosphere of parti-
cles during both ambient and
postvolcanic periods.(L. W. Thomason, 46842)
Space Directorate
Heterogeneous Chemistry
on Stratospheric Aerosols
Eight years of nitrogen dioxide
(NO2) data collected by the space-
borne SAGE II (Stratospheric
Aerosol and Gas Experiment II)
174

RESEARCH AND TECHNOLOGY HIGttLIGHTS
Space Science
E
Amtual cych" of NO,_ as observed by SAGE II expressed as a percentaNe of
the mean as a flmction of latitude and altitude.
are being used to test the accuracy
of photochemical models. Two-
dimensional photochemical
models are used worldwide in
the assessment of man's impact on
the chemistry of the atmosphere
and Earth's climate. Recently,
modelers under the auspices of
the NASA High Speed Research
Program were brought together to
test the accuracy of their models
against each other and actual
observations. The SAGE II NO2
data played a prominent role in
this intercomparison and led to
improvements in the models.
SAGE II provides the only long-
term set of measurements of NO-,
in the stratosphere. These data
were used to produce a seasonal
climatology of stratospheric NO>
The figure shows the amplitude of
the annual cycle of NO. expressed
as a percentage of the mean as a
function of latitude and altitude.
The hemispheric asymmetry near
the equator in the 30- to 40-km
region is due primarily to dyna-
mics in this region. The large-
amplitude seasonal variations in
the lower high-latitude stratosphere
are caused by seasonal changes
in the photochemistry. Of the
10 models in the intercomparison,
only 3 reproduced the observed
hemispheric asymmetry, indicating
that they have captured the subtle-
ties of the dynamics in this region.
All the models underestimated byabout a factor of 2 the observed
high-latitude amplitudes when
only the normal-gas phase chemis-
try was included. However, when
the models included heterogeneous-
phase chemical reactions on strato-
spheric aerosols, the models and
observations agreed well in the
high-latitude lower stratosphere.
The aerosol climatology used in
the models was also based upon
SAGE lI data that were represen-
tative of a relatively clean strato-
sphere that was unenhanced by
volcanic eruptions. This inclusion
of heterogeneous chemistry also
improved the model's agreement
with nitric acid measurements.
These heterogeneous reactions
transformed the active nitrogen
species, such as NO2, into relatively
inert species and were thought
only to be important in the chemis-
try of the Antarctic ozone hole.
This study demonstrated that
these reactions are important and
occur globally on the background
stratospheric sulfate aerosols.
(Joseph M. Zawodny, 42681)
Space Directorate
SEDS End Mass
Instrumentation
In March 1993, the Small Ex-
pendable Deployer System (SEDS)
successfully deployed an instru-
mented End Mass at the end of
a 20-km long tether. The End
Mass instrumentation was a self-
contained data system that was
designed to measure the End Mass
orbital dynamics, process and
store these measurements, and
transmit them to global receiving
sites throughout the SEDS mission.
This mission, which lasted about 1
1/2 orbits, included tether deploy-
ment, swing of the End Mass to
local vertical, tether cut, and re-
entry into the Earth's atmosphere.
A three-axis load cell, three-axis
accelerometer package, and three-
axis magnetometer were incorpo-
rated as the primary sensors to
measure tether tension, End Mass
accelerations, and End Mass orien-
tation with respect to the Earth's
magnetic field. Circuits were de-
veloped to condition these sensor
outputs to obtain the high-quality
signals. This included electronic
filtering and amplification (up to a
gain factor of 40 000) of the sensor
175

TETHER ATTACHMENT POINT
i I
i I
; • •
, _ 'ti
_:) ==J
'., .:' "';.%t
SEDS End Mass payload.
,'iANTENNA (2)
outputs with stability and linear
response to within 0.004 percent
of the full range. Firmware was
developed for the onboard com-
puter to sample these measure-ments, build data frames, and
implement a pulse code modula-tion (PCM) stream for transmissionof the data. The End Mass con-
tained an S-Band transmitter and
omnidirectional antennas for
transmission of the I'CM stream.
The data-transmission scheme
was developed to store the
acquired flight data for periods of6630 seconds before loss. These
data were continuously sampled
and retransmitted in a fashit,n that
assured reception of all mis,qon
data, even though the End blass
telemetry signal was only in :ermit-
tently received during the rr ission.
High-quality mission data werecollected for 7791 seconds aad are
being analyzed. These data. com-
bined with ground-based aJld
deployer-derived data, will give a
complete picture of the tether and
the tethered End Mass dynamics.A second mission is scheduled for
the spring of 1994.
{John K. Quinn, 41678)Electronics Directorate
176

RESEARCHANDTECHNOLOGYHIGHLIGHTS
Space Science
177
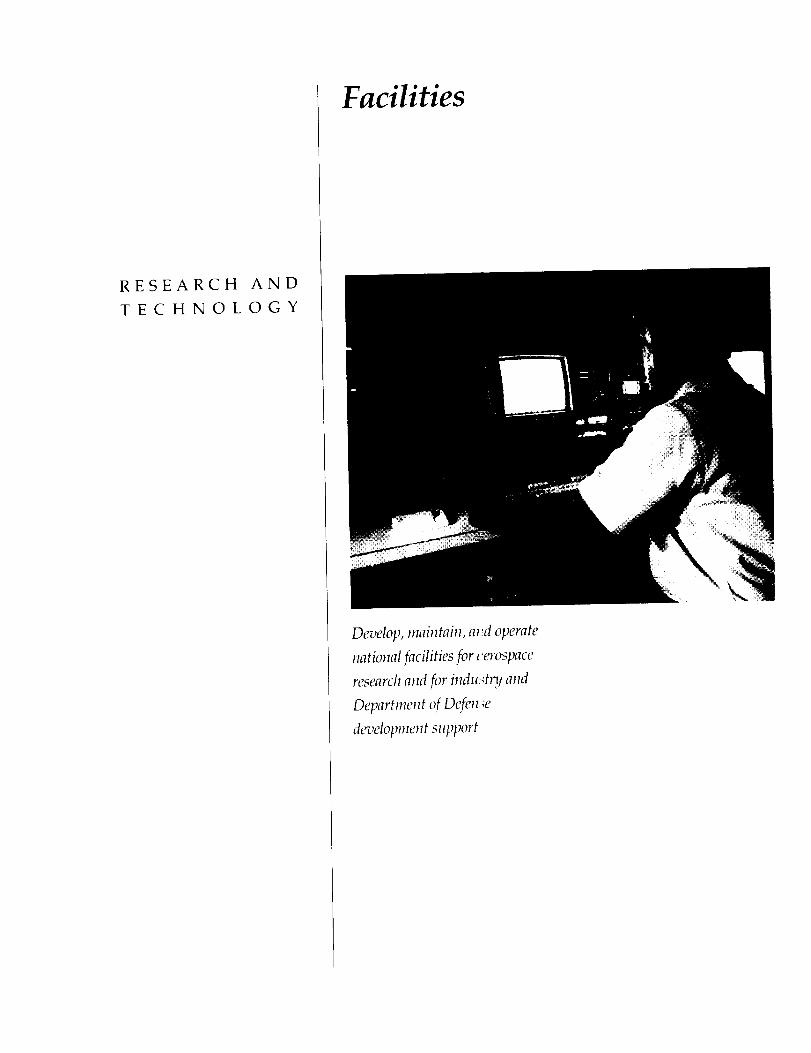
Facilities
RESEARCH AND
TECHNOLOGY
Develop, maintain, a_d operate
national facilities for _erospace
research and for indu:#ny and
Department qf Defen:;e
development support
RESEARCH AND TECHNOLOGY HIGHLIGHTS
Facilities
Thermoelectric Devices
for Thermal
Instrumentation
Enclosures
Electronically scanned pressure(ESP) sensors are used throughout
NASA Langley Research Center in
various wind tunnels to provide
fast, reliable, and accurate pressuremeasurement. The ESP sensors
have a thermal sensitivity of 0.04percent FS/°C; therefore, a stable
thermal environment is required
for optimum performance. The
National Transonic Facility (NTF)
imposes unique temperature con-trol challenges for the ESP sensorsbecause of the tunnel's -150°C
to 60°C and 9 atmospheres operat-
ing environment. No method cur-
rently in use provides for sensorcooling when tunnel conditions
are above ambient temperature;
they only provide for heating
capabilities during the below-ambient tunnel runs. Because of
these shortcomings, a thermalinstrumentation enclosure to
house an ESP sensor was designed
using thermoelectric (TE) devices
as heat pumps. The enclosureconsists of an aluminum box
encased in LAST-A-FOAM 9515
high-density insulation foam. To
provide heat removal during the
cooling function of the thermoelec-trics, a finned aluminum heat sink
was placed on the bottom of the
packages. The thermoelectric
device is a semiconductor-based
electronic component that func-
tions as a small heat pump. By
applying a low-voltage dc power
source, heat will be moved throughthe module from one side to the
other. The phenomenon, knownas the Peltier effect, is reversible; a
change in polarity of the applied
dc voltage causes heat to move in
the opposite direction. Therefore,the device can be used for both
heating and cooling. During cold
runs, when tile TE device operatesas a heater, the 12R effect of the cur-
rent that is used to drive the TE
elements adds to their ability to
generate a temperature gradient.The added current causes the TE
device to behave like a resistance
heater and allows the TE elements
to compensate for a temperaturegradient of 180°C or more whenthe cold side is secured to a
cryogenic surface. Extensive
laboratory testing was conducted
along a temperature range of
-185°C to 60°C; this testing showsthat the prototype enclosure pro-
vides ESP sensor thermal stabilityto within +_0.3°C and reduces ther-
mal error to a negligible level. Theprototype was installed into the
existing NTF wall-pressure system
and successfully operated for 5weeks over the entire tunnel
temperature and pressure range.Using TE devices for thermal-instrumentation-enclosure heat
pumps will decrease the require-
ment for repeated re-zero calibra-tions of the ESP sensor; this
decreased requirement will resultin reduced tunnel operating costs
and increased data accuracy.(Mark Hutchinson, 44642)Electronics Directorate
New Technique Used for
Wing-Twist Measurements
A new single-camera techniquehas been used at the National
Transonic Facility to measure the
wing twist of a high-speed civil-transport model. An extensive
series of wing-twist measurements
were made at temperatures from
-258°F to 120°F and at pressures
from 15 psia to 101 psia. The Mach
numbers for these tests rangedfrom 0.2 to 1.1. Measurements
were made on both the baseline
and high-lift configurations.
This new single-camera tech-
nique uses photogrammetry on
digital images to determine 2-D
object coordinates in the plane oftwist. A 2-D conformal transforma-
tion between flow and no-flow
object coordinates is then used to
determine angle and displacement
at various semispan stations.
Compared with the previouslyused two-camera technique, the
single-camera technique has less
lighting requirements, has a
shorter computation time, does
not require precise timing synch-ronization, and is better suited to
179

0_JWingtwist, -1
deg.
-2
Increasingdynamic
pressure
V
-3-4 0 4 8 12 16 20 24
Alpha, deg.
Example of wing twist versus angle of attack for runs at various dynamic
_lr('sstt rt's.
data reduction in a "semiautomated"
mode. Laboratory and tunnel tests
have shown that the uncertainty of
the single-camera technique is
comparable to the two-camera
technique.(A. W. Burner, 44635, andL. R. Owens)
Electronics Directorate andAeronautics Directorate
Fuzzy-Logic Control of
Wind-Tunnel Temperature
The high pressure air distribu-
tion system control room providescontrol of airflow to six research
tunnels in the Hypersonic Blow-down Tunnels building. The air is
supplied by a high-pressure bottle
field, through a series of valvesand an electric heater, to the tunnel
in operation. A fuzzy-logic con-
troller (FLC) has been developed
and applied to the control of
temperature processes during the
operation of the air distrib_ation
system.
The FLC is a rule-based algo-
rithm that provides control of
designated temperature processes
by using the error between a speci-fied temperature setpoint and the
process to be controlled and by
using the rate of the controlled
process. The feedback signalsused by the FLC are processed
based on their degree of member-
ship in fuzzy sets. The control
objective is to provide desired
temperatures in a tunnel settlingchamber or in an exhaust trench.The controller must also monitor
temperature points between the
heater and the settling-chamber
temperature, or trench temperature.
The temperature at these inter-mediate points must be kept with-
in prescribed system constraints.
The FLC accomplishes this by
using feedback from the tempera-ture points and rules that maintain
the temperature within the con-straints.
The FLC has been successfully
applied to the control of tempera-ture processes in the Mach 6
12-1nch High Reynolds NumberTunnel and the nozzle test cham-
ber. Ultimately, it is desired tohave the FLC control temperature
11 1011 200 31111 400 51111 61X)
Time, _e¢
FLC of settling chamber _nd trench temperatures.
180

RESEAI,?,CH ANDTECttNOLOGY HIGHI,IGttTS
Facilities
processes for all the tunnels in the
Hypersonic Blowdown Tunnels
building.
{David A. Gwaltney, 46977, and
Gregory L. Humphreys)Systems Engineering and
Operations Directorate
Hypersonic Wind-Tunnel
Nozzle Design
The flow quality of most hyper-
sonic nozzles designed by usingthe classical method of characteris-
tics (MOC)/boundaryqayer tech-
nique deteriorates as the boundary
layer becomes large relative to tile
inviscid core, which is typically atfree-stream Mach numbers (M_)
greater than 6 to 8. This necessi-
tates using full Navier-Stokes
and/or parabolized Navier-Stokes
(PNS) computational fluid dynam-ics (CFD) solvers to determine if
the flow uniformity of a MOC/BLdesigned nozzle is acceptable
for performing experimental
aerodynamic/aerothermodynamicbenchmark studies. Such an
approach was used to design anozzle for the Langley 22-InchMach 20 Helium Tunnel that was
precision machined, installed, and
calibrated over a wide range of
reserw)ir conditions by using apitot-probe survey rake with pre-
viously unheard of resolution; the
pitot-probe spacing was 0.125 in.
over a 20-in. span to provide the
details that were required to cali-brate the PNS code. Once calibrat-
ed, by refining the grid and modi-
fying the turbulent boundary-layer
model, agreement between the
PNS solutions and experimental
data was excellent throughout the
range of conditions analyzed. Thefigure represents the total pressure
0.005
-go 0.00409
og. o.oo30
rr
0.002
fl_
o.ool0t--
p = 3022 psiao
T = 496_'Ro
o jc_ °_c_
o Experimental Data
-- PNS Solution
0.000 L J L 1 , _ i I L _ L I _ = , 1 , k , I
-6 -4 -2 0 2 4 6
Distance from Nozzle Centerline, in.
Comparison oficxperimental and computational data.
ratio across tile shock at an axial date the CFD-based design proce-
location slightly downstream ofthe nozzle exit plane and shows
excellent agreement between the
experimental and computational
results at a representative condi-
tion. The flow uniformity provid-
ed by this new nozzle was a drasticimprovement over tile previous
nozzle, which was designed andbuilt in the late fifties; however,even more uniform flow is
required to perform benchmarkexperimental studies in the facility.
Dr. J. Korte (from Langley's
Theoretical Flow Physics Branch)
and others recently developed a
nonlinear least-squares optimiza-tion procedure, coupled with aCFD PNS flow solver, that is used
to develop an optimum design of
the complete nozzle flow field.
This new method was used to pre-
dict aerodynamic contours for twonew nozzles (Mach 14.6 and 20)
that are being fabricated for thehelium tunnel. The new nozzles
will be calibrated in early 1994 to
provide tile measurements to vali-
dure. The PNS predictions for the
two new nozzles show improvedexpansion characteristics through-
out the nozzle, which provides amore uniform flow field at the
nozzle exit. If the predictions are
proven to be accurate bv tileupcoming nozzle calibration, the
CFD-based optimum design pro-
cedure will represent a quantum
leap in the design of nozzles for
hypersonic wind tunnels.{Jeffrey S. Hodge, 45237, and
John J. Korte)
Space Directorate
Flow-Quality Improvement
Hardware for 8-Foot
High-Temperature
Tunnel
Tile 8-Foot High-Temperature
Tunnel at NASA Langley ResearchCenter (LaRC) is a combustion-driven blowdown wind tunnel.
181

Internal components of 8-Foot Hi_h-Temperature Tunnel combustor.
The 8-ft-diameter by 12-ft-long
free-jet section is designed toachieve Mach 4, 5, and 7 with true
temperature simulation. The com-
bustor has two primary modes ofoperation: (1) methane and air,and (2) methane and air with
oxygen enrichment to raise the
combustion-products oxygencontent to 21 percent. The first
mode of operation is used for aero-
thermal loads testing and flight
weight structural concept verifica-tion. The second mode is used to
test air-breathing scramjet and
ramjet engines.
During checkout, to prepare for
the testing of the concept demon-
stration engine, it was determined
that temporal and spatial fluctua-
tions of temperatures and pressure
were unacceptable for testing
hypersonic air-breathing propul-sion systems. A flow-quality
improvement team was organizedthat included members from LaRC
and industry. The goal was to oro-
vide temperature and pressurevariations within 5 percent of the
mean flow. The two major recom-mendations from the team were tt,
install a baffle plate and a resonator
plate within the combustor
The main goal for the t,atflt
plate is to provide a more uniform
flow of oxygen-enriched air to the
spray bar by providing a pres_,ure
drop approximately 2 ft upstr_,am
of the spray bar. A secondary goalfor the baffle plate in combination
with the resonator plate is to act asa Helmholtz resonator to absorb
temporal oscillations. The goal of
the resonator plate is to act as aHelmholtz resonator and dan- pen
out oscillations in the air feed sys-
tem that are currently at appr, _xi-
mately 30 Hz. By removing theseoscillations, the combustion pro-cess should become stabilized.
A team was then established
across Division levels to desif;n,
analyze, fabricate, and install the
baffle plate and resonator less than
4 months from when they were
conceptualized. Concurrent
engineering was used to meet the
tight schedule. The baffle plateand resonator were delivered
within budget and on schedule.
After several adjustments to the
baffle plate and spray bar, the tlo_x
quality fell within acceptablelimits.
(Peyton B. Gregory, 47242)
Systems Engineering and
Operations Directorate
Expansion of Research
Aircraft Ground Station
Facility
The need arose for near-real-time
processing of data taken by theOrbital Acceleration Research
Experiment (OARE) instrumentluring shuttle flight STS-58 to
enable Langley's principal investi-
gator to determine instrumentmodes, success of on-orbit calibra-
tions, and the general health of the
instrument. Timely assessment ofspecific instrument parametersallows modifications to the mis-
sion timeline to enhance the plan-ned measurements (or make them
possible).
Two additions/modificationswere made to the Research Aircraft
Ground Station (RAGS) facility tomake near-real-time OARE data
processing possible. (1) Inter-face circuits that can handle the
required pulse code modulation(PCM) format and bit rates
between the flight control center
(which receives the tracking and
data relay satellite system (TDRSS)downlink from the White Sands
182

RESEARCIf AND TECHNOLOGY HIGHLIGHTS
Facilities
RAGS enhancements in use during STS-58. L-93-12054
Optical measurement system (OMS) showing laboratory setup for measur-
ing point-tracking accuracy.
Missile Range via satellite) and theRAGS were designed, fabricated,installed, and tested. (2) A
PC-based system was developedto read the PCM bit stream and
process the data in accordancewith OARE formats. This capabili-
ty enhancement was tested end-to-
end in premission validation teststo demonstrate the near-real-time
processing capability and provide
valuable personnel training priorto the mission. In addition, opera-
tional procedures were established
that facilitate STS-58 operationsand enhance OARE mission
success. This capability is a step
toward achieving a capability atLangley that could be used for
real-time monitoring and con-
trol of a broad range of shuttle
experiments and space station
payloads. This work was done inpart under contract with Lockheed
Engineering & Sciences Co.(Herbert R. Kowitz, 41962)(Electronics Directorate
Optical Measurement
System
An optical measurement system(OMS) based on linear charge-
coupled-device (CCD) sensors hasbeen designed to determine the
position and attitude of a levitated
cylinder in six degrees of freedom
and to supply this information to
the control system of a large gap
magnetic suspension system(LGMSS). In the LGMSS, several
large electromagnets arranged in a
planar configuration levitate a
cylindrically shaped element that
contains a permanent magnet core.The cylinder is levitated at a dis-tance of 91 mm (36 in.) above the
magnets. In order to stabilize levi-
183

tationandcontrolmotioninsixdegreesof freedom,informationonthepositionandattitudeofthesuspendedelementisrequired.IntheOMS,multipleone-dimensionalimagingsensorsarcusedtodetectsmall infrared light-emitting diode
(LED) targets that are embeddedin the surface of the levitated ele-
ment (see figure). The position
and attitude of the cylindrical ele-ment are determined from the
measured locations of the imagesin the sensors and transformation
equations, which relate the coordi-nates of the target images in thereference frames of the sensors to
the position and orientation of the
levitated element in the laboratory
reference frame. Rigid bodymotion has been assumed.
The OMS has been calibrated
and experiments have been
conducted on the system to
evaluate its accuracy. Experi-
ments designed to determine the
accuracy of point tracking revealed
that the system is capable of deter-mining the x, y, and z location of
an individual target within avolume of 1(/.16 cmx 10.16 cm x
5.08 cm to better than 0.001 cm
(0.0005 in.). Results of initial
experiments using a model of thelevitated cylinder showed the
accuracy of the. system with a
l°/second yaw rate to be 0.002 cm
([1.0(11in.) in x_m, ycm, 0.001 cm
((I.0005 in.) in zc,,, 0.005 ° in pitchand yaw, and 0.I ° in roll. The
decreased accuracy of the roll mea-surement results from the short
moment arm or diameter of the
cylindrical element. The final
system configuration has beendesigned to operate at a sample
rate of 40 samples/second.(Sharon S. Welch, 466II1
Flight Systems Directorate
184

RESEARCHANDTECHNOLOGYHIGHLIGHTS
Facilities
185

RESEARCH AND
TECHNOLOGY
Technology Transferand Commercial Development
Facilitate tile transfi" Of
aerospace-y, enerated _echnology
to the public domain

RESEARCH AND TECHNOLOGY HIGHLIGHTS
Technology Transfer and Commercial Development
Surgical Force Detection
Probe
A wind-tunnel balance is not
the kind of instrument a patientwould expect to find in the hands
of his or her surgeon ill an operat-
ing room. Dr. Richard Prass, M.D.,
of Eastern Virginia Medical School,however, may soon add new
meaning to cutting-edge technolo-
gy. Dr. Prass desired to measurethe amount of force that he was
applying to human tissue during
surgery. A balance is an electrome-chanical transducer that converts
applied forces and moments into
electrical signals. A small light-
weight balance was designed and
fabricated and was then placed
within a hand-held cylindrical
housing. Various surgical imple-ments can be attached to the
balance through one end of the
probe housing. The probe is1/2 inch in diameter and 6 inches
in length. Like its wind-tunnel
counterparts, this balance is instru-mented with standard strain
gages.
The strain-gage signals are
electrically isolated by signal-
conditioning electronics, which
also amplify each of the signals.Tile user is able to perform gain
and offset adjustments via front-
panel controls, and bar-graph dis-
plays provide amplitude informa-tion for each of four channels. A
personal computer is incorporated
SignabConditiomng Chassis PC FM Recorder
Surgical force detection probe system.
into the system for data acquisition,
display, and storage.
This instrument would allow
the documentation of the usual
forces that are applied d uring rou-
tine surgical procedures. This
type of documentation has never
been reported. A comparison
among experienced surgeons andthose in training would {hen be
possible. Such data may provide
feedback that may be effectively
used during residency training.When used in conjunction with
interoperative neurological moni-
toring, tile instrument would allow
correlation of specifically appliedforces to monitored nerves that are
responsible for nerve injury. Thesedata may lead to new concepts in
nerve dissection that will improve
surgical outcome.
(Ping Tcheng, 44717, Paul Roberts,Regina Courts, and TaumiDaniels)Electronics Directorate
Remote-Data-Logging
Groundwater Seepage
Meter
The Coastal Groundwater
Research Program at Virginia
Polytechnic Institute and State
University (VPI&SU) is investigat-ing the importance of groundwater
discharge and its associated soluteload to estuarine and marine
environments. Research suggests
that groundwater transport of
187

Instrument sampling locations.
contaminants is significant in
many cohstal regions. Ongoingresearch for the Environmental
Protection Agency Chesapeake
Bay Program is aimed at defin-
ing and reducing contaminant
loadings from groundwater to
the Chesapeake Bay system. Inorder to more accurately measure
groundwater discharge volumesand temporal patterns, new meth-
odology was required. Researchersat VPI&SU requested support in
the design and fabrication of a
remote-sensing instrument to
directly measure subaqueous
groundwater discharge.
The remote groundwater seep-
age meter incorporates an onboarddata logger and a developed flow-
metering and control system. This
instrun_ent provides greater time-series data collection and analysis
and minimizes problems associ-ated with manual methods, while
remaining cost effective. Presently,
the remote seepage meter is beingutilized bv researchers at VPI&SU
to investigate groundwater dis-
charge rates in relation to uplandand tidal surface water hydr_ -
dynamics.
(Harry G. Walthall, 45194)Systems Engineering and
Operations Directorate
Design of Low-Thermal-
Conductance Cryoger_ic
Support
A common problem in mgny
designs that are concerned _ iththermal transfer is limiting thethermal conductance of a stn'cture
while maintaining structural inte-
grit},. A recent project desig md a
thermally critical support by using
the following methodology. Theintent was to design a struct_re to
bridge a 200°C thermal grad entwith minimum thermal tran:,fer
but adequate structural properties.
First, materials were ranked by
plotting the ratio of thermal con-
ductivitv to strength as afm ction
of temperature (75 to 300 K) The
best materials from this ranking
were evaluated for availability,
cost, and tow-temperature fracture
properties. The material selected
was an Epon 828 epoxy with abalanced-weave glass-fiber cloth.
Several shape concepts were
developed, with the purpose being
a long thermal path length and asmall cross-sectional area. Six
shapes were evaluated, four ofwhich are shown in the figure on
the next page. These were ana-
lyzed by designing them to be
thermally equivalent and evalu-
ating failure stress due to staticloads, critical buckling stress, andnormal modes.
The shape chosen was a tapered
circular cone. This shape was then
optimized by using NASTRAN to
adjust the wall and flange thick-nesses to their ideal values. The
cone was laid up, and the methods
for curing with a machined metal
mold were perfected. The fabricat-
ed part has survived a thermalsoak to 77 K.
This same methodology could
be used to design any commercial
part that must meet both thermaland structural criteria.
(Ruth M. Amundsen, 47044, and
Jill M. Marlowe)
Systems Engineering and
Operations Directorate
Evaluative Testing of
Adhesives for Cryogenic
Applications
Bonding materials for cryo-
genic use is difficult when the two
materials have highly differentcoefficients of thermal expansion(CTE's). On the Material in
188

RESEARCH AND TECHNOLOGY HIGHLIGHTS
Technology Transfer and Commercial Development
Folded Tube
TaperedTrapezoidalCone
, Final Concept:
_i _ Tapered Circular Cone:--4
./
. , " f ' . "
Tapered Triangular Cone
Candidate support designs.
Sample test fixture h)r epoxy evaluation. L-93-4384
Devices as Superconductors
(MIDAS) project, thin ceramicboards are to be bonded to a metal
fixture. There are superconductorsamples on the boards, thus the
fixture must withstand cryogenic
temperatures (80 K) without
damaging the boards. Evaluation
testing was performed on several
adhesives to assess their perfor-mance in bonding ceramic boardsto two different metals. Silicon
dioxide (SiO2), with a CTE of0.5 x 10-"/K, and Yttria Stabilized
Zirconia (YSZ), with a higher CTE,were bonded to aluminum 6061
(CTE = 23 x 10 "/K) and copper(CTE = 17 x 10-"/K). Seven
189
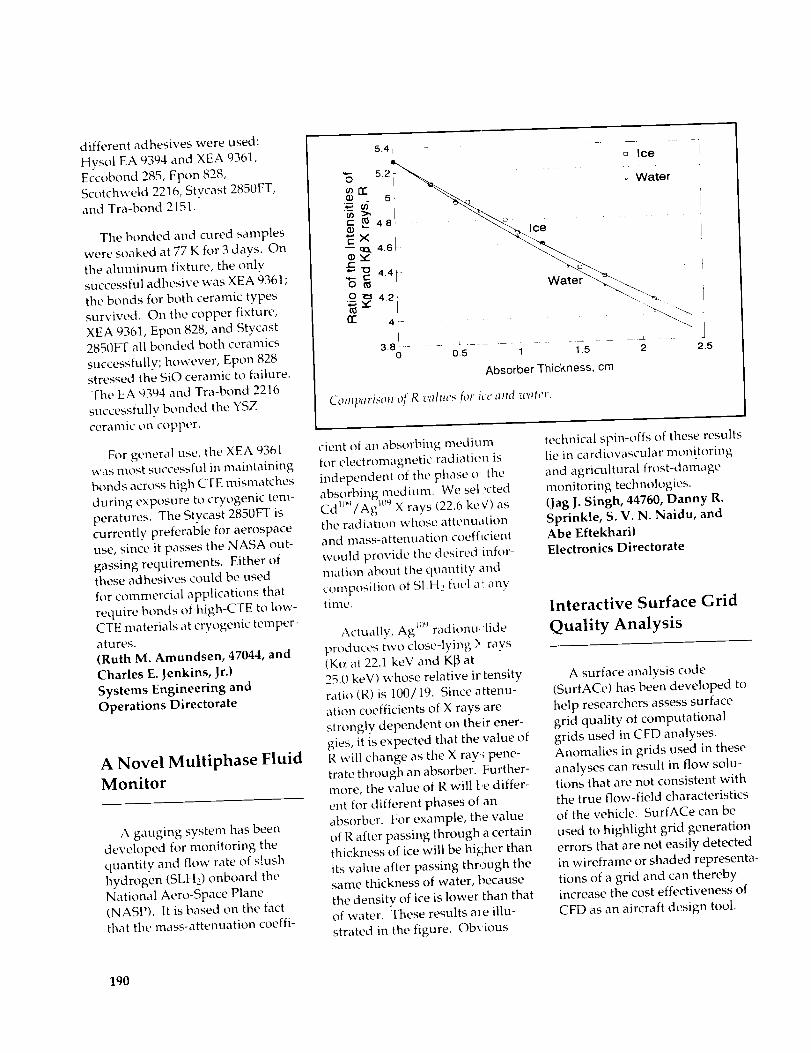
differentadhesiveswereused:HysolEA9394andXEA9361,Eccobond285,Epon828,Scotchweld2216,Stycast2850FT,andTra-bond215l.
Thebondedandcuredsamplesweresoakedat77Kfor3days.Ontilealuminumfixture,theonlysuccessful adhesive was XEA 9361;
tile bonds for both ceramic types
survived. On the copper fixture,XEA 9361, Epon 828, and Stycast2850FT all bonded both ceramics
successfully; however, Epon 828stressed the SiO ceramic to failure.
The EA 9394 and Tra-bond 2216
successfully bonded the YSZ
ceramic on copper.
For general use, the XEA 9361
was most successful in maintainingbonds across high CTE mismatches
during exposure to cryogenic tem-
peratures. The Stycast 2850FF is
currently preferable for aerospace
use, since it passes the NASA out-
gassing requirements. Either ofthese adhesives could be used
for commercial applications that
require bonds of high-CTE to Iow-
CTE materials at cryogenic temper-atures.
(Ruth M. Amundsen, 47044, and
Charles E. Jenkins, Jr.)
Systems Engineering and
Operations Directorate
A Novel Multiphase Fluid
Monitor
A gauging system has been
developed for monitoring the
quantity and flow rate of slush
hydrogen (SLH2) onboard the
National Aero-Space Plane(NASP). It is based on the fact
that the mass-attenuation coeffi-
Ex
_o
O_
rr
5.4_ ........
5 2 _,,_ ...... _ Ice
• J _ o Water
3.8 .... _ .... • -- _± ....... _ ....0 0.5 1 1.5 2 2.5
Absorber Thickness, cm
Comparison 01:R values h_r ice and water.
cient of an absorbing medium
for electromagnetic radiation is
independent of the phase o _ the
absorbing medium. We sel :ctedCdl¢_/Agm'_ X rays (22.6 keY) asthe radiation whose attenuationand mass-attenuation coefficient
would provide the desired infor-
mation about the quantity and
composition of SLH2 fue] at: anytime.
Actually, Ag m_'radionu,'lide
produces two close-lying J_ rays(K(z at 22.1 keV and K]3 at
25.(I keV) whose relative ir tensityratio (R) is 100/19. Since attenu-
ation coefficients of X rays are
strongly dependent on their ener-
gies, it is expected that the value of
R will change as the X ray_ pene-
trate through an absorber. Further-more, the value of R will be differ-
ent for different phases of an
absorber. For example, the value
of R after passing through a certain
thickness of ice will be higher than
its value after passing through thesame thickness of water, because
the density of ice is lower than thatof water. These results are illu-
strated in the figure. Obvious
technical spin-offs of these results
lie in cardiovascular monitoring
and agricultural frost-damage
monitoring technologies.(Jag J. Singh, 44760, Danny R.
Sprinkle, S. V. N. Naidu, andAbe Eftekhari)
Electronics Directorate
Interactive Surface Grid
Quality Analysis
A surface analysis code
(SurfACe) has been developed to
help researchers assess surface
grid quality of computational
grids used in CFD analyses.Anomalies in grids used in these
analyses can result in flow solu-tions that are not consistent with
the true flow-field characteristics
of the vehicle. SurfACe can be
used to highlight grid generation
errors that are not easily detectedin wireframe or shaded representa-
tions of a grid and can therebyincrease the cost effectiveness of
CFD as an aircraft design tool.
190
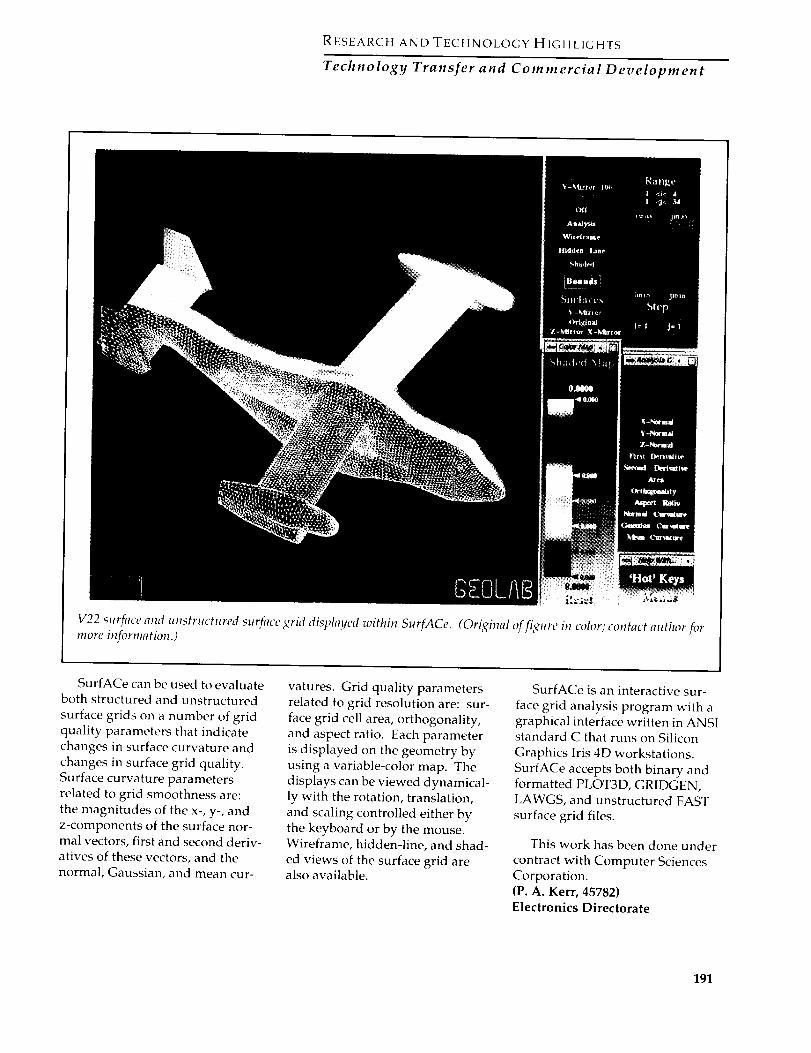
RESEARCH AND TECHNOLOGY HIGHLIGHTS
Technology Transfer and Commercial Development
V22 surface and unstructured surface grid displayed within SurfACe. (Original of figure in color; contact author for
more in&rmation.)
SurfACe can be used to evaluateboth structured and unstructured
surface grids on a number of grid
quality parameters that indicatechanges in surface curvature and
changes in surface grid quality.
Surface curvature parameters
related to grid smoothness are:
the magnitudes of the x-, y-, and
z-components of the surface nor-mal vectors, first and second deriv-atives of these vectors, and the
normal, Gaussian, and mean cur-
vatures. Grid quality parameters
related to grid resolution are: sur-
face grid cell area, orthogonality,
and aspect ratio. Each parameter
is displayed on the geometry byusing a variable-color map. The
displays can be viewed dynamical-
ly with the rotation, translation,
and scaling controlled either by
the keyboard or by the mouse.Wireframe, hidden-line, and shad-
ed views of the surface grid arealso available.
SurfACe is an interactive sur-
face grid analysis program with a
graphical interface written in ANSIstandard C that runs on Silicon
Graphics Iris 4D workstations.
SurfACe accepts both binary andformatted PLOT3D, GRIDGEN,
LAWGS, and unstructured FAST
surface grid files.
This work has been done under
contract with Computer Sciences
Corporation.(P. A. Kerr, 45782)Electronics Directorate
191

Proposed Design for
Carriage Wheels of
Aircraft Landing
Dynamics Facility
The existing wheels of the high-
speed carriage at the Aircraft
Landing Dynamics Facility (ALDF)contain a rubber insert in the outer
rim. After considerable use, the
rubber tends to squeeze out of the
sides of the wheel, increasing theeffort needed to maintain the
wheels at operational levels. To
eliminate this problem, a new solid
wheel design was proposed by the
ALDF Project Office. The objective
of this analysis was to compare theperformance of the existing car-
riage wheel with the proposed
design.
The basic approach of the study
was to analyze both wheels undersimilar loading conditions. The
results were then compared to
evaluate the relative performance
of tile new design. Finite-element
modeling (FEM) techniques wereused to construct detailed analyti-
cal models of both wheel designs.Closed-form solutions were used
to verify the analytical methods.Because some closed-form
methods cannot be applied t_,
complex cross sections, a sire pleannular disk was also modeDd
and was used to help interpret theFEM results.
The load cases were selected to
represent the various loadingconditions that the actual wheel
can experience during a carriagerun. These conditions included
spin loading, static and dynamicloading, slipping during launch,
and misalignments from the rails
or bearings. A modified Goodman
diagram was used to address
fatigue. The analysis showed thatthe proposed new design meets allcriteria.
The driving factor behinc the
rubber insert in the existing wheelsis the flexibility. A rigid wheel,
such as the proposed desigc,
develops contact stresses that
exceed the ultimate strength of the
material when misaligned. How-
ever, this stress is quantified by thesurface strength of the material,which is based on the Brinell hard-
ness. Allowable contact stn.ss cal-
culations predicted the life _riteriawould be met.
From the analysis, it was con-cluded that the wheels can }_e
EXISTING WHEEL PROPOSED DESIGN
19" O.D.
Rubber Insert
Existing amt proposed designs of ALDF carriage wheel.
fabricated from the proposed
design. Experiments should be
performed to assess the amountof vibration that is transferred to
the carriage by each of the wheels
and to confirm that the change indesign does not interfere with the
research being performed on the
carriage.
(Regina L. Spellman, 47244}Systems Engineering and
Operations Directorate
Structural Modeling and
Analysis of Aortic
Aneurysm From CAT
Scan Data
The feasibility of utilizing
patient CAT scan data to generatestructural finite-element models
with which to predict the stresses,and potential failure sites, within
aortic aneurysms was studied.
Aortic aneurysms arc abnormally
enlarged areas of the main blood
vessel that supplies blood to the
body and legs. Medical-communityinterest in this research is moti-
vated by the fact that rupture of
aortic aneurysms is the 13th lead-
ing cause of death in the United
States---_ver 15 000 deaths per
year. Because even corrective
surgery entails risk to patients, adiagnostic tool that would predict
the risk of uncorrected aneurysms
is desired. In the present study, a
margin-of-safety indicator that
was developed from the k)cally
computed, maximum principlestress and the failure stress of
typical aortic tissue is investigatedas a possible risk indicator for an
uncorrected aneurysm.
The CAT scan data of a patient
who was examined prior to a suc-
192

RESEARCH AND TECHNOLOGY HIGHLIGHTS
Technology Transfer and Commercial Development
Structural Grid STAGS Results3.751
oiMARGIN
OFSAFETY
Aorta in CAT scan data
Color-enhanced CAT scan data
Stress analysis of an aortic am'urysm usin x CAT scan ,_enerated su(face
xeometry.
cessful repair of an aortic aneurysm
were obtained as a series of imageslices through the patient's body at5-mm intervals. The contents of
each slice is a representation of the
local density within the patient's
body. Because the structure of theaorta is only identified by its con-
trasting density with neighboring
tissue, image processing techniques
were utilized to detect the edges of
the aorta cross sections. To help
assure the accuracy of the data, a
medical doctor helped identify thestructures within the CAT scans.
The cross-section data generated
were then used to develop a struc-
tural model grid. The grid wasutilized within a finite-element
structural-analysis computer code
to determine the stresses due to
internal pressurization in a geo-metrically nonlinear manner. The
margin of safety indicated in the
figure shows the computed results
where zero margin corresponds to
predicted failure. Because of thesparseness of CAT scan data in the
region, the area with the low mar-
gin of safety near the branching ofthe two iliac arteries is not consi-
dered significant. However, the
areas with the smallest margin onthe upper left side of the aneurysm
are probable failure sites.
(Stephen J. S¢otli, 45431)Structures Directorate
Externally AccessiblePressure Instrumentation
Insert
The purpose of this device isto provide a means of installing a
dynamic pressure measurement
sensor into a closed compositestructure with external accessi-
bility. This design producesminimal surface disturbance and
requires a small internal volume.
The designated application is for
wind-tunnel testing of a dynamical-
ly scaled wing. Current methods
of installing this sensor requireinternal accessibility. Since the
pressure sensors may get damaged
during testing or handling, they
should be easily replaceable with-
out disassembly of a complex
structure. For many applications,it may be impossible to disassemblethe structure without modification
of dynamic characteristics. This
new design provides a means ofreplacing defective sensors with
no structural disassembly and
with minimal aerodynamic surfacedisturbance.
Excluding the transducer, thereare four components to this assem-
bly. The encapsulated disk (-1)
is captured in the composite lay-
up. After the composite is cured,
the skin is through drilled and
counter-bored using a predrilledhole in the disk for location. The
1/4-turn holder (-2) is permanent-
ly bonded into (-1) with epoxy in
the desired orientation. The pres-sure sensor (-5) is bonded into the
Kulite holder (-4) with room-
temperature-vulcanizing (RTV)
rubber. This assembly is inserted
into (-2), passing lead wires and a
calibration tube through preexist-
ing conduit under the aerodynam-ic surface. The 1/4-turn orifice
193

,-3
__ ? - O-RZNG-4 - -- _.. V .- __ RTV AERO SURF ACE
- I -2 UL-sT:'
l .5
INCH
Instrumentation insert assembly.
(-3) is installed and rotated 90 °
into position by using a spanner-
type tool. A commercial O-ring
seal between (-3) and (-4) pre-
vents leakage at this interface.Item (-3) is locally contoured tothe external surface.
Replacement of damaged sen-
sors will consist of removing (-3)
with the installation tool, installinga working sensor into (-4), and re-
installation of the parts as before.Little or no additional work will be
required to return the apparatus to"as new" condition.
(Christopher M. Cagle, 47140)
Systems Engineering and
Operations Directorate
Wing-Tip Boom for FlightApplication on OV-10AResearch Aircraft
Win k,-tip boom for OV-IOA research aircraft. L-93-01272
The Research Aircraft Support
Section at Langley Research Cen-
ter required a lightweight, high-
strength, wing-tip boom for flight
application on the OV-10A re-search aircraft. The boom's geom-
etry and stiffness had to be such
that it did not cause amplification
of any aircraft- or velocity-generatedvibrations, since it was to be used
in the study of aircraft-wake vor-tices. The Composites and Models
Development Section constructeda hollow graphite-epoxy boom,
approximately 8-ft long, with anoutside diameter of 4.5 in. that
tapered down to 2.25 in. The
boom was laid up on an aluminum
mandrel by using 36 plies ofgraphite-epoxy material that was
precut to conform to each ply
geometry. The geometry was a 0%
+60 ° layup with a vacuum debulk-
ing process between each second
194

RESEARCH AND TECHNOLOGY HIGHLIGHTS
Technology Transfer and Commercial Development
ply. This process netted a smooth
outside diameter with no post-cure
machine work. After the prepreg
layup operation was completed, ashrink tape was applied circumfer-
entially to increase molding pres-
sure to the vacuum-bag autoclave
pressure cure cycle. The process
that was developed by the tech-
nician allowed for producing atapered structure with unique
variations on accepted layup
techniques.
(William D. Lupton, 45484)
Systems Engineering andOperations Directorate
Vibratory Stress Relief
Welding Technology
Vibratory stress relief welding
technology was used when doing
extensive full-penetration weldingof 1.5-in-thick reinforcement bars
for the model injection system of
the 8-Foot High-Temperature Tun-
nel (8-Foot HTT) test facility. Crit-
ical alignment of support rails inthe tunnel mandated that a retrofit
be accomplished that would main-
tain the critical straightness with-
out having the real system remov-
ed for welding or stress-relieving
processes.
The use of strategically placed
welds during assembly helped to
provide accurate alignment and
integrity. Vibratory weld condi-tioning and subsequent stress
relief of all parts provided forsound structural members
throughout the fabrication pro-
cess. The vibratory conditioning
as weld metal was depositedenhanced the bead contour and
eliminated porosity, resulting in areduction of residual weld stresses.
Vibratory relief welding technology used on 8-Foot HTT components.
L-93-01815
A tolerance of _+0.020 from the
original shape was maintainedover a length of 96 in. throughout
the retrofitting of the tunnel.(Gerald Miller, 44536)
Systems Engineering and
Operations Directorate
Boresight--A Two-Axis
Alignment System for
Lidar In-Space
Technology Experiment
(LITE)
The boresight is a two-axis gim-
baled alignment system that is
used on LITE to maintain colinear-
ity between the instrument's out-
going laser beam and the telescopethat is used to collect the return
energy. This is accomplished by
moving a prism that is positioned
in the path of the outgoing laser
beam. The boresight provides anadjustment range of +1 ° in bothaxes, can be commanded to move
in steps as small as 1.54 arc sec-
onds, and is mechanically stiffened
through zero-backlash couplings
to maintain its position duringshuttle launch.
During the mission, the bore-
sight can be commanded to checkthe instrument's alignment and, if
necessary, to automatically reposi-
195

LITE boresight two-axis alignment system during subsystem functionaltesting. L-92-08672
tion the prism so that the instru-ment is aligned. This check is
accomplished by using a beam
splitter in the telescope aft optics
to redirect 5 percent of the laserreturn energy from the instrument's
science channels to a quad detec-
tor. The output signals from the
quad detector are used by the
boresight to calculate the correction
that is required to maintain instru-ment alignment. If the instrument
is not aligned properly, the bore-
sight calculates the direction and
magnitude of the correction that is
required to align the instrument
and moves accordingly. Once this
adjustment has been completed,
the boresight reports to the instru-ment controller that the instrument
is aligned. If the instrument is
grossly misaligned and the return
signal does not fall on the quad
detector, the boresight can be com-
manded to go into a search mode.
In this mode of operation, the bore-
sight will search for the return,
starting at the current position, i1_
an outward squared spiral patter ::.
Once the return signal has been
LITE laser transmitter module.
detected, the boresight can be com-
manded to align the instrument.
The boresight subsystem has
successfully completed functional,
environmental, integration, and
instrument-level testing.(Ruben G. Remus, 47106, James E.
Wells, and Clayton P. Turner)
Systems Engineering and
Operations Directorate
A Space-Qualified LaserTransmitter
A high-energy, space-qualified
laser transmitter was developed
for the Lidar In-space Technology
Experiment (LITE). The LITEinstrument will be launched on
the Space Shuttle in 1994 to study
aerosols in the Earth's upper
atmosphere.
L-92-06143
196

RESEARCHANDTECHNOLOGYHIGHLIGHTS
Technology Transfer and Commercial Development
The Laser Transmitter Module
(LTM) contains two independentNd:YAG laser oscillators and their
associated optics and electron-
ics. The flashlamp-pumped,
Q-switched oscillator generates a
fundamental wavelength of 1064
nm. The fundamental wavelengthis frequency doubled and tripled
to obtain wavelengths of 532 nm
and 355 nm. All three wavelengths
are output simultaneously. The la-
ser beam is amplified twice to pro-
duce a total energy output of 1100mJ per pulse. The pulse rate is 10
Hz, and the pulse width is 30 nsec.
The LTM is enclosed in an
aluminum canister that is pres-
surized with dry nitrogen. Thecanister is 60-in. long and 24 in. in
diameter. The LTM weighs 590 lb
and requires 2.2 kW of electrical
power. A thermal control system
maintains a constant operatingtemperature inside the canister. A
deionized water-coolant loopremoves excess heat from the laser
oscillators and various electronic
components. Heat from the LTM'swater-coolant loop is rejected to
the shuttle's Freon coolant loop
through an external heat exchan-
ger.
The LTM was subjected toextensive environmental testing
to qualify for spaceflight. Athermal-vacuum test demonstrated
that the LTM can maintain con-
stant laser energy output when it
is exposed to the temperatureextremes that it will experience in
orbit. A vibration test proved thatthe LTM will survive lift-off acce-
lerations up to 10 g's. An electro-
magnetic interference test verified
that the LTM will not adverselyaffect shuttle operations with radi-ated or conducted emissions. The
optical performance of the LTM
was characterized in atmospheric
testing of the LITE instrument.
The LTM successfully met all
mission and science requirements.(Christopher L. Moore, 47172)
Systems Engineering and
Operations Directorate
Damage Tolerance of
Braided Composites
Impacts from hail, debris, tools,
etc. can delaminate conventionally
laminated composites because of
the relatively weak resin interface
between laminae. The through-the-
thickness, or interlacing, reinforce-
ment in textile composites has thepotential to eliminate delaminationsor reduce their size and thus elimi-
nate or reduce strength degrada-
tion due to accidental damage.
Thus, an investigation was con-
ducted to compare the damage
tolerance of braided compositesand laminates made conventional-
ly with prepreg tapes. Accordingly,
1/4"-thick carbon/epoxy compo-
site plates made of 2D and 3D
braided preforms and prepreg
tapes were impacted by fallingweights, were then C-scanned to
measure damage size, and were
finally loaded in compression to
measure residual strengths. The
prepreg tapes were AS4/3501-6and IM7/8551-7. The modified
8551-7 epoxy is much tougherthan all the other epoxies.
Values of damage resistance
and postimpact failing strain for
equal damage size are plotted
in the figure for each material.Damage resistance is the trans-
verse shear stress per unit length
to advance the impact damage,
which consists primarily of matrixcracks and disbonds between
yarns or laminae. The results are
normalized by those for theAS4/3501-6 laminates made from
prepreg tape. Both damage resis-
tance and postimpact failing strain
for the braiJs were essentiallyequal to those for the AS4/3501-6
2.5
1.5Results
normalized
byAS4/3501-6 1
taperesults
0.5
Failing Weight Impact Tests
*Transverse shear stress per unit width*'1.5"-dia. impact damage in C-scans
"1o lo Q "o
i r_ r, _ a _. r, r, q
& & & o_ & &, t,_ ,
_,,_ m m _ _
*Damage resistance **Postimpact failing strain
Damage tolerance of composites made from prepreg tape and braided
preforms.
197

tape laminates. Postimpact failingstrains for the AS4/3501-6 and
IM7/8551-7 tape laminates were
also nearly equal, but damageresistance for the 1M7/8551-7 tapelaminates was more than twice
that of the AS4/3501-6 tape lami-
nates. Thus, the damage tolerancesof laminates and braids made with
conventional epoxies were essen-
tially equal. However, damage re-sistance increased remarkably
with increasing resin toughness,
but postimpact failing strains didnot increase.
(C. C. Poe, Jr., 43467,
W. C. Jackson, M. A. Portanova,
and John E. Masters)Structures Directorate
Experimental Methods
and Stress-Analysis
Models for Time- and
Temperature-Dependent
Behavior of Polymer
Composites
A potential difficulty associated
with using polymeric compositesin supersonic aircraft is the task of
predicting the changes in materialproperties due to aging of the com-
posite after long-term exposure at
elevated temperatures. These
changes in the composite-material
strength and stiffness will be pri-marily caused by changes in the
mechanical properties of the poly-
mer matrix material alone. Physi-
cal aging, considered to be a ther-
moreversible process, will cause
changes in a polymer's mechanical
properties that are brought about
by the volume recovery upon cool-
ing from above the glass transition
temperature (T_). During aging,the polymer moves towards a state
I.E+00 1.E+OI IE+02 IE+03 I.E+04 1.E+05 1.E+06 IE+O7 IE+0g I,E+09
Aglng Ttme (sec.) 3.2 years
Effects of tern pe ra tu re on 1orig- term co mplia n ce of a qua st- iso tropic lamina teunder constant load.
of equilibrium. This state of equili-
brium is defined as the point ofminimum volume change and is
approached asymptotically.
To address this problem, st veral
complimentary studies have oeen
performed to determine the effectsof stress and physical aging on the
matrix-dominated time-dependent
properties of a high-temperature,continuous-carbon-fiber-reinf, _rced,
thermoplastic composite. Se_'eralof these studies utilized isothermal
tensile creep/aging test and analy-sis techniques that were deve loped
for polymers and adapted for the
composite material. From tl-e test
results, the time-dependent lrans-
verse ($22) and shear (S¢_) compli-
ances for an orthotropic plat,, were
found from short-term creel: com-
pliance measurements at constant
temperatures below Tg. These
compliance terms were shown tobe affected by physical agin:;.
Time-temperature superpos_tion
was employed to generate m omen-
tary isothermal master curv( s fromthe short-term test data. The asso-
ciated aging time-shift factors andshift rates were found to be 3 func-
tion of temperature and applied
stress. These test parameters were
then used in conjunction with the
effective time theory and classical
lamination theory to predict the
long-term changes in compliance
of general laminates under con-stant in-plane loads and isothermal
conditions. The figure shows a
prediction of long-term compliance
changes (normalized against theinitial value) for a quasi-isotropiclaminate at two different test tem-
peratures and with a constant axialload. Results such as those shown
in the figure imply that the effects
of physical aging over extended
periods may have a significant im-
pact on the durability and thelong-term effective stiffness of the
composite.(Tom Gates, 43400)Structures Directorate
FRANC: FRacture
ANalysis Code
FRANC is a workstation-based,
two-dimensional, finite-element
analysis code that was designed
specifically for analyzing crackedstructures. The program was
developed by Cornell University
and Kansas State University under
sponsorship of the NASA Langley
198

RESEARCH AND TECHNOLOGY HIGHLIGHTS
Technology Transfer and Commercial Development
i_! _ii!ii!iil_
Stress analysis of crack extendin_ from rivet in lap-splice joint.
Research Center (user's manual
published as NASA CR-4572). The
program is developed around
"user friendly" window concepts,
allowing a structural analyst to
efficiently create a finite-elementmesh, analyze the problern, andvisualize the results. The code is
unique in the ability to interactive-
ly introduce cracks into a structure,
predict the direction of crackgrowth, and automatically remesh
to model a growing crack.
The FRANC system consists of
a preprocessor, a solver, and a
postprocessor. The preprocessoris used to create the uncracked
finite-element mesh. The struc-
tural analyst interactively defines
the geometric boundaries and
the mesh gradient, and FRANCautomatically creates a mesh of
8-noded quadrilateral and 6-noded
triangular elements. The boundary
and loading conditions can then be
defined graphically.
The solver is an elastic, two-
dimensional, finite-element analy-sis code that calculates the local
stresses and displacements. The
postprocessor will graphically
display contour stress plots, stress-
es along a line or circle, and dis-
placements. The stress contourplot can be used to determine
regions of high local stresses,
where cracks are likely to develop.The structural analyst can then
interactively introduce a crack (or
multiple cracks) into the model,
and FRANC automatically per-
forms the remeshing, calculates
the crack-tip stress intensity factor,
and predicts the direction of crack
propagation. The crack (or cracks)can be grown with FRANC per-
forming the automatic remeshing.
The FRANC system is uniquely
suited to analyzing complicatedcracked structures. The automatic
mesh generation, crack-growth
direction prediction, and crack-tip
remeshing capabilities allow for
efficient modeling of nearly anytwo-dimensional configuration.
The FRANC system has recently
been expanded to include the abili-
ty to model layered structures and
contact problems. Using these
new capabilities, the code has been
experimentally verified for cracks
that propagate from interference-fitrivets in thin-sheet, lap-splice
joints.(C. E. Harris, 43449,
A. R. Ingraffea, D. V. Swenson,and D. S. Dawicke)
Structures Directorate
Quantitative Experimental
Stress Tomography
QUEST (Quantitative Experi-
mental Stress Tomography) is theworld's first microfocus X-ray
tomography system capable of im-aging a specimen during mechani-
cal loading. QUEST permits imag-
ing of variations in the internalstructure as a function of stress.
Analysis of the images obtainedfrom QUEST can provide precise
measurements of object shapes
and how they change under stress.
This system has been applied tothe characterization of a wide vari-
ety of specimens. Typical of theseis a measurement of the expansion
of a rivet hole following riveting.
The extent of expansion signifi-
cantly affects the fatigue life of a
riveted panel. The microfocustomography system enabled
measurement of the expansion to
within 2 p_m at different positions
along the rivet. This informationis used to confirm destructive
methods for determining the hole
expansion.
199
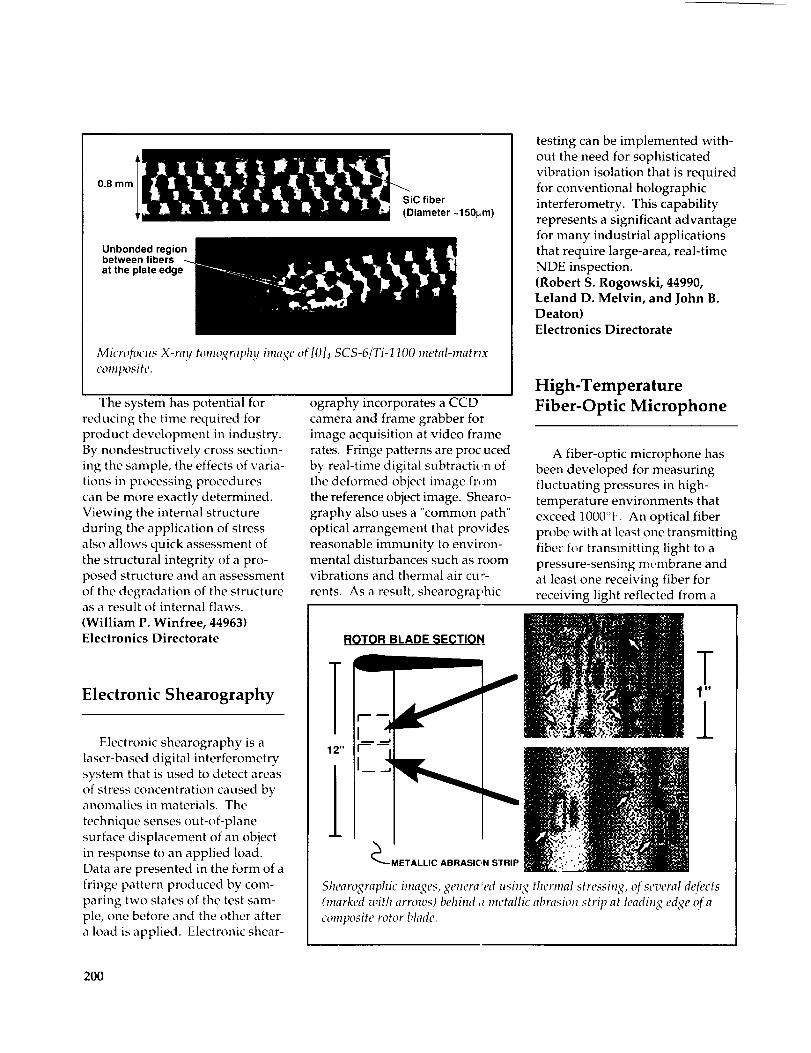
0.8 mm
I _D?afibe_rer ~150pm)
Unbonded regionbetween fibers
at the plate edge
Microfocus X-ray tomo_raphy image q( [O]4 SCS-6/Ti-1100 metal-matrixcomposite.
The system has potential for
reducing the time required for
product development in industry.By nondestructively cross section-
ing ttle sample, the effects of varia-
tions in processing procedures
can be more exactly determined.Viewing the internal structure
during the application of stress
also allows quick assessment of
the structural integrity of a pro-
posed structure and an assessment
of the degradation of the structureas a result of internal flaws.
(William P. Winfree, 44963)Electronics Directorate
testing can be implemented with-
out the need for sophisticated
vibration isolation that is required
for conventional holographicinterferometry. This capability
represents a significant advantage
for many industrial applications
that require large-area, real-time
NDE inspection.(Robert S. Rogowski, 44990,
Electronic Shearography
ography incorporates a CCD
camera and frame grabber for
image acquisition at video framerates. Fringe patterns are proc uced
by real-time digital subtracti(,n of
the deformed object image fr,_m
the reference object image. Shearo-
graphy also uses a "common path"
optical arrangement that providesreasonable immunity to environ-mental disturbances such as room
vibrations and thermal air cur-
rents. As a result, shearographic
Leland D. Melvin, and John B.Deaton)Electronics Directorate
High-Temperature
Fiber-Optic Microphone
A fiber-optic microphone has
been developed for measuring
fluctuating pressures in high-
temperature environments thatexceed 1000°F. An optical fiber
probe with at least one transmitting
fiber for transmitting light to a
pressure-sensing m,:mbrane and
at least one receiving fiber for
receiving light reflected from a
ROTOR BLADE SECTION
TElectronic shearography is a
laser-based digital interferometry
system that is used to detect areas
of stress concentration caused byanomalies in materials. The
technique senses out-of-plane
surface displacement of an objectin response to an applied load.
Data are presented in the form of a
fringe pattern produced by com-
paring two states of the test sam-
ple, one before and the other after
a load is applied. Electronic shear-
I
el', P"
.J
,¢_ • -
METALLIC ABRASIC_N STRIP
Shearographic images, genera'ed usin_ thermal stressing, of several defects(marked with arrows) behind a metallic abrasion strip at leading edge of a
composite rotor blade.
200

RESEARCH ANDTECttNOLOGY HIGHLIGHTS
Technology Transfer and Commercial Development
High-temperature fiber-optic microphone.
stretched membrane is provided.
The pressure-sensing membrane
may be stretched for high-frequency
response. Further, a reflecting sur-face of the pressure-sensing mem-
brane may have dimensions that
substantially correspond to dimen-
sions of a cross section of the opti-cal fiber probe. U. S. PatentNo. 5,146,083 has been issued to
the inventors. A fiber-optic probe
is also provided with a backplatefor damping membrane motion.
The backplate also provides ameans for on-line calibration of
the microphone.(William E. Robbins, 42733, and
Allan J. Zuckerwar)
Systems Engineering andOperations Directorate
L-92-10050
NASSTAR: An
Instructional Link
Between MSC/NASTRAN
and STAR
Correlating structural models
with modal survey test data hasbecome an increasingly more com-
plicated and computationallyintensive task for the structural
analyst working on any type ofstructure. NASSTAR is a menu-
driven FORTRAN77 program thatwas written to answer the need
for simplifying the data manipula-
tion in the correlation process.NASSTAR automates the modal-
survey-test/analysis-correlation
process by providing a translatorbetween MSC/NASTRAN V66,
the structural analyst's finite-element code, and STAR V3.0, the
test engineer's data-processingcode. It is an aid to the structural
analyst who must supply a test-
verified finite-element model; spe-
cifically, the program addressescorrelations that use a cross-
orthogonality criterion.
As shown in the figure,
NASSTAR is organized into three
main sections, which correspond
to the three main parts of a testing
program: test-procedure support,pre-test support, and post-test
support. The test-procedure sup-
port section of NASSTAR helps
the analyst determine acceptable
accelerometer locations by usingthe pre-test finite-element model.
The pre-test support section auto-
mates translation of pre-test resultsfrom MSC/NASTRAN into STAR.
The last section, post-test correla-tion, automates the transference
of test results from STAR into
MSC/NASTRAN for the cross-
orthogonality check, or into
PATRAN pre-processing or
post-processing software for view-
ing test-mode shapes. NASSTAR
provides tutorial messages that
guide the analyst for all phases ofthe testing process. The usefulness
of the program has been demon-
strated through a case history of a
modal survey test program thatused NASSTAR.
(Jill M. Marlowe, 47027)
Systems Engineering andOperations Directorate
201

IN_SSTAR Main Menu 1
TEST PROCEDURE
SUPPORT:
Analytically SelectAccelerometer
Locations
Create Analysis/ ]
I Test Cross- JL Reference Table
PRE-TEST SUPPORT:
Translate AnalyticalResults into STAR
for Pre-Test Study
Translate Analysis Model& Results into STAR
Universal Files
POST-TESTSUPPORT:
CorrelationActivities
Prepare Test &Analysis Results
for Cross-Orthogonality Check
NASSTAR program menus and organization.
Translate TestModel intoPATRAN
Translate Test &
Analysis Resultsinto PATRAN
202

RESEARCH AND TECHNOLOGY HIGHLIGHTS
Technology Transfer and Commercial Development
203

RESEARCH AND
TECHNOLOGY
Aerospace Test Facilities
This section includes brief
descriptions of many _f Langley's
major aerospace test J:_cilities; for
more detailed inform_tion,
including availabili_, please
contact the individua r identified
after each description

RESEARCH AND TECHNOLOGY HIGHLIGHTS
Aerospace Test Facilities
30- by 60-Foot Tunnel
The Langley 30- by 60-Foot
Tunnel is a continuous-flow, open-throat, double-return tunnel
powered by two 4000-hp electric
motors, each driving a four-blade35.5-ft-diameter fan. The tunnel
test section is 30 ft high and 60 ftwide and is capable of speeds to
100 mph. The tunnel was first put
into operation in 1931 and has
been used continuously since then
to study the low-speed aerodynam-ics of commercial and military
aircraft. The large open-throat test
section lends itself readily to tests
of large-scale models and to
unique test methods with small-scale models. Large-scale and full-
scale aircraft tests are conducted
with the strut mounting system.This test method can handle
airplanes to the size of present-day
light twin-engine airplanes. Such
tests provide static aerodynamicperformance and stability and
control data, including the
measurement of power effects,
wing pressure distributions, andflow visualization.
Small-scale models can be
tested to determine b_,th static and
dynamic aerodynamics. The cap-tive test methods include conven-
tional static tests for stability and
control, performance, and forced-oscillation tests for aerodynamic
damping. Dynamically scaled
subscale models, properly instru-
L-79-7344
mented, are also freely flown in
the large test section with a simple
tether to study their dynamic sta-
bility characteristics at low speeds
and at high angles of attack.(Frank L. Jordan, 41136)
Low-Turbulence Pressure
Tunnel
The Langley Low-Turbulence
Pressure Tunnel (LTPT) is a single-return, closed-circuit tunnel that
can be operated at pressures fromnear vacuum to 10 atm. The test
section is rectangular (3 ft wide
and 7.5 ft high and long), and thecontraction ratio is 17.6:1. The
LTPT is capable of testing at Machnumbers from 0.05 to 0.50 and
Reynolds numbers from 0.1 x 10⁶to 15 x 106 per foot. The chord
length for a typical two-dimensionalmultielement airfoil tested in the
facility is approximately 2 ft. A
high-lift model support and force
balance system is provided tohandle both single-element and
multiple-element airfoils. Recent
flow-quality measurements in the
LTPT indicate that the velocityfluctuations in the test section
range from 0.025 percent at Mach0.05 to 0.30 percent at Mach 0.20.
The LTPT is a unique facility that
provides flight Reynolds number
testing capability for airfoil testingand a low turbulence environment
for laminar flow control and
transition studies.
(Michael J. Walsh, 45541)
205

LTPT L-86-6751
L-85-35c0
20-Foot Vertical SpinTunnel
The Langley 20-Foot Vertical
Spin Tunnel is the only opera-tional spin tunnel in the Western
Hemisphere. The present facilitywas built in 1941 and has beer_ in
essentially continuous operation
since that time. All U.S. military
fighters, attack airplanes, primary
trainers, bombers, and most exper-imental airplanes are tested.
General-aviation airplanes and
many foreign designs are alsoevaluated when required.
The tunnel, which is used to
conduct spin research and tumbl-
ing research on aerospace vehicles,is a vertical tunnel with a closed-
circuit annular return passage.The test section has 12 sides and is
20 ft across by 25 ft high.
Dynamically scaled models are
used to investigate the spinningand tumbling characteristics of
airplane configurations. Spin
recovery is studied by remote actu-
ation of the models' aerodynamic
controls to predetermined posi-tions. Tests are recorded on high-
resolution color video. A rotary
balance apparatus supported by aswinging boom is used to conduct
force-and-moment testing and
pressure testing of models under
spinning conditions.
(Raymond D. Whipple, 41194)
14-.by 22-Foot SubsonicTunnel
The Langley 14- by 22-FootSubsonic Tunnel is used for low-
speed testing of powered andunpowered models of various
fixed- and rotary-wing civil and
military aircraft. The tunnel can
reach a maximum speed of 318ft/sec and has a test section 14.5 ft
high, 21.75 ft wide, and 50 ft long.
The tunnel can be operated as aclosed test section with slotted
walls or as one or more open con-
figurations when the sidewalls
and ceiling are removed to allow
extra test capabilities, such as flow
visualization and acoustics testing.
Boundary-layer suction on thefloor at the entrance to the test sec-
206

RESEARCH AND TECHNOLOGY HIGHLIGHTS
Aerospace Test Facilities
tion and a moving-belt ground
board for operation at test-sectionflow velocities of 111 ft/sec can be
installed for ground-effects testing.The tunnel is equipped with a
three-component laser velocimeter
for laser-light-sheet flow visualiza-tion and detailed flow-field veloci-
ty measurements.
(Harry L. Morgan, Jr., 41069)
L-85-10002
are axially slotted to permit contin-
uous operation through the tran-
sonic speed range.
The Mach number range of the
facility is from 0.2 to 1.2, and the
stagnation-pressure range is from
0.25 to 2.0 atmospheres. Tempera-
ture is controlled by water circulat-
ing through cooling coils, and thetunnel air is dried to prevent con-densation in the flow.
The 8-Foot TPT is a very versa-
tile wind tunnel capable of sup-
porting basic fluid-dynamicsresearch as well as a wide range
of applied aerodynamics research.
With screens and honeycomb in
the upstream settling chamber, the
quality of the flow in the test sec-
tion is suitable for performing reli-able code-validation experimentsand laminar-flow research.
(James M. Luckring, 42847)
Transonic Dynamics
Tunnel
The Transonic Dynamics Tun-nel (TDT) is a continuous-flow
variable-pressure wind tunnel
with a 16-ft by 16-ft test section; it
normally uses air or a heavy gas asthe test medium. The maximum
8-Foot Transonic Pressure
Tunnel
The Langley 8-Foot TransonicPressure Tunnel (8-Foot TPT) is a
variable-pressure slotted-throatwind tunnel with controls that
permit independent variations of
Mach number, stagnation pressure
and temperature, and dew point.
The test section is square, withfilleted corners, and has a cross-
sectional area equivalent to that ofan 8-ft-diameter circle. The floor
and the ceiling of the test sectionL-71-3976
207

L-86-6183
Mach number is 1.2, and the maxi-
mum Reynolds number obtainableis approximately 10 x 106 ft -1 in
heavy gas and 3 x 106 ft 1 in air.
The TDT is a unique "national"facility that is used almost exclu-
sively for testing of aeroelastic
phenomena. Semispan sidewall-
mounted models and full-span
sting-mounted or cable-mountedmodels are used for aeroelastic
studies of fixed-wing aircraft. Inaddition, the Aeroelastic Rotor
Experimental System (ARES) teststand is used in the TDT to studythe aeroelastic characteristics of
rotor systems. The HelicopterHover Facility (HHF), located in
an adjacent building, is used to set
up the ARES test stand in prepara-
tion for entry into the TDT and forrotorcraft studies in hover. The
TDT Data Acquisition System is
capable of simultaneous supportof tunnel tests, HHF tests, and
model checkout in the Calibration
Lab. A major facility upgrade to
replace the present heavy gas is
planned in the spring of 1995, at
which time the tunnel will be
unavailable for about 1 year.
(Bryce M. Kepley, 41244)
16-Foot Transonic Tunnel
The Langley 16-Foot TransonicTunnel is a closed-circuit, single-return, continuous-flow, atmo-
spheric tunnel with a Mach num-
ber capability from 0.20 to 1.30.
The slotted octagonal test sectionmeasures 15.5 ft across the flats.
The tunnel is equipped with an air
exchanger with adjustable intake
and exit vanes to provide some
temperature control. This facility
has a main-drive power systemconsisting of two 30 000-hp motors
driving counter-rotating fans. A
36 000-hp compressor provides
test-section plenum suction.
The tunnel is used for force,
moment, pressure, flow visualiza-
tion, and propulsion-airframe inte-
gration studies. Model mounting
consists of sting, sting-strut, and
semispan support arrangements;propulsion simulation studies are
made with dry, cold, high-pressure
L-86-4496
208

RESEARCH AND TECHNOLOGY HIGHLIGHTS
Aerospace Test Facilities
air or with turbine-powered
engine simulators.
(Bobby L. Berrier, 43001)
National Transonic
Facility
The National Transonic Facility(NTF) is a fan-driven, closed-
circuit, continuous-flow, pressur-ized wind tunnel. The test section
is 8.2 ft by 8.2 ft and approximately
25 ft long, with a slotted-wall con-figuration. The test gas may be
dry air or nitrogen. For the air
mode of operation, heat removal is
by a water-cooled heat exchanger
(cooling coil) located at the up-stream end of the settling chamber.
For the cryogenic mode of opera-
tion, heat removal is by evapora-
tion of liquid nitrogen, which is
sprayed into the circuit upstreamof the fan. The tunnel design Mach
number range is from 0.2 to 1.2,
and the test-temperature range is
from 150°F to -320°F. The design
total pressure range for the NTF isfrom 15 to 130 psia.
The combination of pressure
and cold test gas can provide a
maximum Reynolds number of120 x 10 _ at a Mach number of 1.0
based on a chord length of 9.75 in.
By using the cryogenic approach
to generate high Reynolds num-
bers, the NTF achieves its perfor-mance of near-full-scale conditions
at lower cost and at lower model
loads than concepts based on
ambient temperature operation.
In addition, with both temperature
and pressure as test variables,
three types of investigations are
possible; these include Reynoldsnumber effects at constant Mach
number and dynamic pressure,
L-90-6542
model aeroelastic effects at con-
stant Reynolds number and Machnumber, and Mach number effects
at constant dynamic pressure and
Reynolds number.(Dennis E. Fuller, 45129)
0.3-Meter Transonic
Cryogenic Tunnel
The 0.3-Meter Transonic Cryo-
genic Tunnel (0.3-m TCT) is used
for testing two-dimensional airfoil
L-85-09893
209

sections and other models at high
Reynolds numbers. The tunnel
can operate continuously over a
range of Mach numbers fromabout 0.1 to above 1.2, with a stag-
nation pressure from 14.7 to 88.0
psia (1 to 6 atmospheres) and a
stagnation temperature from-320°F to 130°F (78 K to 328 K).This results in a maximum
Reynolds number capability in
excess of 100 x 106 per foot. The
adaptive walls, floor, and ceiling
in the 13-in. by 13-in. (33-cm by33-cm) test section can be moved
to the free-stream streamline
shape, eliminating or reducing thewall effects on the model. The
combination of flight Reynoldsnumber capability and minimalwall interference makes the 0.3-m
TCT a powerful tool for aero-nautical research at transonic
speeds. The Math number, pres-
sure, temperature, and adaptivewall shape are automaticallycontrolled. The test section has
computer-controlled angle of
attack and traversing wake survey-probe systems. A heat exchanger
and alternate gas supply unit have
recently been added to the facility,
adding the capability of using
alternate test media---a heavy gas,sulfur hexafluoride (SF6), or air.
(Stuart G. Flechner, 46360)
Unitary Plan WindTunnel
Immediately following World
War II, the need for supersonic
wind-tunnel facilities to developadvanced airplanes and missiles
was recognized. The Departmentof Defense and the National Advi-
sory Committee for Aeronautics
(NACA) developed a plan for a
L-90-07397
series of facilities that was
approved by the United Sta_esCongress in the Unitary Plar Wind
Tunnel Act of 1949. This planincluded five wind-tunnel facili-
ties, three at NACA laborat, _ries
and two at the Arnold Engi _eer-ing Development Center. _[he
Langley Unitary Plan Wind Funnel(UPWT) was one of the three built
by NACA. The UPWT is a closed-circuit, continuous-flow, variable-
density tunnel with two 4-f_ by 4-ftby 7-ft test sections. One tc st sec-
tion has a design Mach nu_nber
range from 1.5 to 2.9, and tl_e other
has a Mach number range trom 2.3
to 4.6. The tunnel has slidin:g-block-
type nozzles that allow continuousvariation in Mach number while
the facility is in operation. The
maximum Reynolds numker perfoot varies from 6 x 10⁶ to 11 x 106,
depending on Mach numker.
Types of tests include force andmoment, pressure distribution, jet
effects, dynamic stability, and heat
transfer. Flow visualization capa-bilities in both test sections include
schlieren, oil flow, vapor screen,and mini tufts.
(William A. Corlett, 45911)
Hypersonic Facilities
Complex
The Hypersonic Facilities Com-
plex consists of nine hypersonicwind tunnels located at three
Langley sites. These facilities are
considered a complex because
together they represent a major
unique national resource for wind-
tunnel testing. The complexcurrently includes the following:
15-Inch Mach 6 High-Tempera ture
Tunnel, 12-Inch Mach 6 High
Reynolds Number Tunnel, 20-1nchMach 6 Tunnel, 20-Inch Mach 6
CF4 Tunnel, 18-Inch Mach 8
Tunnel, 31-Inch Mach 10 Tunnel,
20-Inch Mach 17 N2 Tunnel,60-Inch Mach 18 Helium Tunnel,and 22-Inch Mach 20 Helium
Tunnel. These facilities are used
to study and to assess the aero-
210

Rt!SEARClt ANDTECtINOLOGYHIGI4LIGHTS
Aerospace Test Facilities
dynamic, aerothernlodynamic,
and fluid dynamic phenumena
associated with advanced manned
space transportation systems, such
as Personnel Launch System
vehicles, Assured Crew Return
Vehicle concepts, and Advanced
Manned Launch System concepts;
to support the development of the
National Aero-Space Plane tech-
nology, lunar return and Mars
entry and return vehicles, and
hypersonic missiles and transports;
to perform basic fluid dynamics
studies of complex flow phenome-
na such as shock-shock interactions
and shock impingements; to estab-
lish data bases for calibration of
computational fluid dynamics
(CFD) codes; and to develop
measurement and testing tech-
niques.
hypersonic simulation parameters,
namely Mach number, Reynolds
number, density ratio or ratio
of specific heats, and thermal
driver potential (wall-temperature
ratio). Several modifications have
recently been made and are con-
tinuing to be made to the facilities
to improve their flow quality,
reliability, productivity, and
capability.
(C. G. Miller, 45221)
Scramjet Test Complex
The Langley Scramjet Test
Complex consists of five test facili-
ties and a diagnostics laboratory
that offer a complete spectrum of
supersonic combustion ramjet
(scramjet) test capabilities. The
complex includes the Direct-
Connect Supersonic Combustion
Test Facility (DCSCTF), the
HYPULSE expansion tube, the
Combustion-Heated Scram jet Test
Facility (CHSTF), the Arc-Heated
Scramjet Test Facility (AHSTF),
the 8-Foot kt igh-Tem pera tu re Tun -
nel (8-Foot HTT), and the Non-
intrusive Diagnostics Laboratory
(NDL). Scramjet inlet models are
tested in air or nitrogen from Mach
1.6 to 17 in various Langley aero-
This complex of facilities pro-
rides an unparalleled capability at
a single installation to studv aero-
dynamic, aerothermodynamic,
and fluid dynamic phenomena for
advanced aerospace vehicle
concepts over wide ranges of
L-92-12685
211

dynamic wind tunnels to study
inlet flow phenomena and to vali-
date computational fluid dynamics
codes. Scramjet combustors aretested in the DCSCTF and the
HYPULSE expansion tube to pro-vide basic research data on fuel-air
mixing and combustion processes.
The hydrogen-air-oxygen combus-tion heater of the DCSCTF suppliessimulated air to the combustor
entrance at total enthalpy levels
up to Mach 8 flight speeds (total
temperatures to 5000°R). The
HYPULSE expansion tube, a pulsefacility with a 500-_sec test time, is
located at the General Applied Sci-
ences Laboratory in Ronkonkoma,
New York. HYPULSE providesclean, undissociated air to the com-
bustor entrance at total enthalpy
levels dup!icating Mach 13.5, 15,
and 17 flight (total temperatures to
15 000°R). Designs from the indi-
vidual scramjet component tests
are assembled to form componentintegration engines that are tested
in two subscale engine test facili-ties, the CHSTF and the AHSTF. A
hydrogen-air-oxygen combustionheater in the CHSTF produces
simulated air that duplicates Mach
3.4 to 6 flight total enthalpies, andan electric arc in the AHSTF heats
air to total enthalpy levels corre-
sponding to flight speeds up toMach 8. Scramjet model size in
both of these facilities is approxi-
mately 6 in. by 8 in. in frontal area
by 6 ft in length. The 8-Foot HTT
is capable of testing injectablescramjet models up to 12 ft in
length. These models can be single
or multiple engines of the size test-ed in the subscale facilities mount-
ed on aircraft-type forebody-
afterbody structures or larger scalesingle scramjets with frontal areas
of approximately 20 in. by 28 in.Test gases with total enthalpy
levels duplicating Mach 4, 5, and 7
flight are produced in the 8-Fo,_t
HTT by methane-air-oxygencombustion. The NDL is used to
develop various optical diagnostic
techniques for supersonic reacting
flow. Laboratory-scale combustion
devices provide air total tempera-
tures to 4000°R and a speed rangeto Mach 2. This laboratory has
been used to develop the hardenedCoherent Antistokes Raman
Spectroscopy (CARS) system, to
demonstrate the application of
ultraviolet Raman scattering tomeasure temperature and 02, N2,
H2, H20, and OH mole fractions
simultaneously, and to developlaser-induced fluorescence of OH
in supersonic reacting flow. A
velocity measurement techniquebased on molecular tagging of
oxygen is currently being deve-
loped in the NDL. These facilities
comprise a Scramjet Test C; mplex
unequaled in its capability 1oinvestigate engine flow fiehts,
scale effects, speed effects, vnd
engine-airframe integratiov.
(R. Wayne Guy, 46272)
Aerothermal Loads
Complex
The Aerothermal Loads Com-
plex consists of four facilities that
are used to carry out research in
aerothermal loads, propulsion,
high-temperature structures, and
thermal protection systems. The8-Foot High-Temperature Tunnel(8-Foot HTT) is a Mach 5, 6, and 7
blowdown-type facility in which
methane is burned in oxygen-
enriched air under pressure; the
resulting combustion products areused as the test medium, with a
maximum stagnation temperature
of approximately 3800°R available
in order to reach the required ener-
gy level for flight simulation. Thenozzle is an axisymmetrical conical
contoured design with an exit
diameter of 8 ft. Model mounting
is semispan or sting, with insertionafter the tunnel is started. The
Reynolds number ranges from 0.3to 2.2 x 10_ ft -_, with nominal Mach
numbers of 5, 6, and 7, and the run
L-ql-3594
212

RESEARCH AND TECHNOLOGY H1GHLIGIITS
Aerospace Test Facilities
time ranges from 20 to 180 sec.
The tunnel is used for studying
detailed thermal-loads flow phe-nomena as well as for evaluating
the performance of air-breathing
propulsion systems and high-
speed and entry-vehicle structural
components. A major effort was
recently completed to providealternate Mach number capabilityas well as 02 enrichment for the
test medium. This was done pri-
marily to allow models that have
hypersonic air-breathing propul-sion applications to be tested.
The three oilier facilities area smaller scale HTT and two
arc tunnels. The 7-1nch High-
Temperature Tunnel (7-Inch HTT)is a 1/12-scale version of the 8-Foot
HTT wifl_ basically the same capa-
bilities as the larger tunnel. It is
used primarily as an aid in the
design of larger models for the8-Foot HTT and for aerothermalloads tests on subscale models.
The 20-MW and 5-MW Aero-
thermal Arc Tunnels are used to
test models in an environment that
simulates the flight reentry enve-lope for high-speed vehicles such
as the Space Shuttle. The arc
tunnels are currently on standbystatus.
{Allan R. Wieting, 41359)
Acoustics Research
Laboratory
The Langley Acoustics Research
Laboratory (ARL) provides theprincipal focus for acoustics re-
search at Langley Research Center.The ARL consists of the anechoic
quiet flow facility, the reverberation
chamber, the transmission loss ap-
paratus, and the human-rc_I.xmse-to-
L-80-03126
noise laboratories. The human-
response laboratories consist ofthe exterior effects room, the ane-
choic listening room, and the sonicboom simulator. The ARL is used
to conduct aeroacoustic studies of
aircraft components and models
as well as subjective acoustic stud-
ies involving actual test subjects.(Lorenzo R. Clark, 43637)
Avionics Integration
Research Laboratory
(AIRLAB)
AIRLAB is an environmentallycontrolled structure located in the
high-bay area at 1 South WrightStreet. AIRLAB houses several
specialized resources for testing
avionics systems response to highintensity radiated fields (HIRF).
One such resource is a Gigahertz
Transverse Electromagnetic cellthat can be used for anechoic test-
ing. Three mode-stirred reverbe-
rating chambers are also available.
Radio frequency sources, measure-ment devices, and data collection
and storage equipment comple-
ment the test cells to support vari-
ous tests and experiments. Testspecimens such as flight-control
computers and specialized fault-
tolerant digital systems are avail-
able for experimental use. Alterna-tively, experimenters can provide
their own systems as test speci-
mens. In support of the test faci-
lity, there are workstations where
highly reliable digital avionics sys-tems can be modeled to assess
upset response, reliability, perfor-mance, and other system character-
istics that are important to systemvalidation. Modeling and experi-
mental capabilities are developed
by in-house staff based on in-houseresearch. AIRLAB addresses
issues in the conception, design,and assessment of systems that
can dramatically improve perfor-
mance and lower production and
maintenance costs while providing
a high, measurable level of safety
213

AIRLAB L-92,-01972
for passengers and flight crews.It serves as a focal point for U.S.
Government, industry, and univer-
sity, personnel to identify and
develop methods for systema-
tically validating and evaluatinghighly reliable digital control and
guidance systems for aerospacevehicles.
(Charles W. Meissner, Jr., 462181
with facilities on which the perfor-
mance of competing control laws
may be compared.
An example of a test lacility in
the ACRL is a large-angle magneticsuspension test fixture (_AMSTF).
The LAMSTF (shown in figure)
consists of a planar arrav of five
room-temperature electromagnets
arranged in a circular configurationwith associated sensors, control
electronics, and power amplifiers.The LAMSTF levitates and controls
a cylindrical suspended elementthat contains a core composed of
neodymium-iron-boron permanent
magnet material that is magnetized
along the long axis of the cylin-der. The core is controlled in five
degrees of freedom, with roll beingthe uncontrolled axis.
The LAMSTF can be used in the
development of the technology for
future large-gap magnetic suspen-
sion systems by providing the
experimental validation of design
concepts in the areas of electromag-nets, control, sensing, and electron-
ics as well as by providing insight
into the requirements and chal-
lenges introduced by large-scale
systems.
The ACRL also includes
advanced sensor and processor
facilities that support research in
control-system components for
Aerospace Controls
Research Laboratory
Tile purpose of the Aerospace
Controls Research Laboratory(ACRL) is to conduct research and
testing of spacecraft control sys-
tems. The ACRL is equipped withmodern microcomputer facilities
for simulations, data acquisition,
and real-time control-system test-
ing. Both control-law testing using
experimental test articles and
advanced control-system compo-
nent development are supported
by the laboratory. The ACRLprovides the controls community
L-92-05956
214

RESEARCIf AND TECHNOLOGY HI(;tILIGHTS
Aerospace Test Facilities
space systems. Component deve-
lopment currently focuses on opti-
cal sensing and computing devices.Two different photogrammetric
position tracking systems and an
optical processor for a controls
experiment are being developed.
The facility includes equipmentfor performing experiments in
optics, two stable tables, optical
mounts, lenses, mirrors, polarizers,
beam splitters, photomultiplier
tubes, acousto-optic modulators,
HeNe and Ar lasers, computer-controlled precision stages, and
laser-beam steering systems.
(Douglas Price, 46605)
Transport Systems
Research Vehicle (TSRV)
and TSRV Simulator
The Transport Systems ResearchVehicle (TSRV) and TSRV Simula-
tor are primary research tools used
by the Terminal Area Productivity
(TAP) program. The goal of the
TAP program is to increase capaci-ty during instrument weather con-
ditions for the National Airspace
System. The TSRV has two flight
decks: a conventional Boeing 737
flight deck provides operationalsupport and safety backup, and
the fully operational research
flight deck, positioned in the air-
craft cabin, provides the capabilityto explore innovations in advanc-
ing technologies, including avio-
nics, displays, and systems integra-tion.
The TSRV simulator provides
the means for ground-based
simulation in support of the TAPresearch program. Four out-the-
window display systems (driven
by an Evans and Sutherland CT-6
Computer-Generated Imagery
515
L-85-827
L-93-505
S 7stem) allow realistic real-world
scenes to be presented to the crew.
The simulator has recently beenupgraded to a full complement of
eight electronic displays and two
side-arm controllers representative
of the technology available in corn-
mercial transports of the 1990's.
The simulator is fully integratedwith a realistic air traffic control
facility to provide an environment
for systems-level studies.(George Steinmetz, 43842, Billy
Ashworth, and Jacob A. Houck)
215

Enhanced/Synthetic
Vision & Spatial Displays
Laboratory
The Enhanced/Synthetic Vision
& Spatial Displays Laboratory
(ESVSDL) serves as a primary
testing facility for the candidate
flight display concepts, systems-
subsystems, and devices emergingfrom the Crew Station Technology
and Low-Visibility Landing/Surface
Operations research efforts. Thelaboratory provides a unique capa-
bility to conduct iterative develop-
ment and pilot-vehicle experi-mental evaluation research for
advanced cockpit technologies ina highly realistic flight simulation
environment. Major elements ofthe ESVSDL are the following:
(1) the Advanced Display Evalua-
tion Cockpit (ADEC), which is a
reconfigurable transport aircraftresearch cab; (2) the Aircraft
Cockpit Ambient Lighting andSolar Simulator (ACALSS), which
provides real-world ambient and
solar lighting conditions to the
ADEC; (3) the Visual Imaging Sim-ulator for Transport Aircraft Sys-
tems (VISTAS), which is a highly
flexible, rapidly reconfigurable,
large-screen flight display work-station for evaluation of a wide
variety of enhanced/syntheticvision and spatial display formats;
and (4) the Collimated Flight Dis-
play Workstation (CFDWS), which
provides the capability for pilotevaluation of collimated flight
displays. Other major elements
include a general-purpose digital
processor, which handles system
input/output and vehicle mathmodel simulation; three high-
performance raster graphics dis-play generators, which provide
sophisticated graphics formats (in
2-D, 3-D, and stereo 3-D m, _des)
to the displays within the f_ci-lity; and a fiber-optic link tJ the
Langley central computing faci-
lity for research requiring more
complex vehicle simulation.(Jack Hattield, 42012)
Human Engineering
Methods Research
Laboratory
The Human EngineeringMethods (HEM) Research Labora-
L-92-07389
216

RESEARCH AND TECHNOLOGY HIGHLIGHTS
Aerospace Test Facilities
tory is utilized for the developmentof human-response measurement
technologies to assess the effects of
advanced crew station concepts
on the crew's ability to perform
flight-management tasks effec-
tively. Behavioral response andpsychophysiological response
measurement systems have been
developed to assess mental load-
ing, stress, task engagement, andsituation awareness. Measurement
capabilities include topographic
brainmapping (EEG and evoked
responses), monitoring of pulse,
heart and muscle electrical activity
(EKG and EMG), skin temperature
and conductance, respiration, and
tracking of eye lookpoint (oculom-etry) and overt behavior (video
analysis). A real-time multi-
attribute task (MAT) battery has
been developed to recreate flight-
management task conditions inthe laboratory setting for initial
testing of advanced human-
response measurement concepts.
Mobile physiological monitoring
and behavioral response capture-stations are located at simulatorsites to refine these measurement
concepts for flight-managementresearch.
(Alan Pope, 46642)
General Aviation
Simulator
The General Aviation Simula-
tor (GAS) consists of a general-
aviation aircraft cockpit mountedon a three-degree-of-freedom
motion platform. The cockpit is
a reproduction of a twin-engine,
propeller-driven, general-aviation
aircraft with a full complementof instruments, controls, and
switches, including radio naviga-
tion equipment. Programmable
L-83-4,586
control-force feel is provided by a
"through-the-panel" two-axis con-troller that can be removed and
replaced with a two-axis side-armcontroller that can be mounted in
the pilot's left-hand, center, or
right-hand position. A variable-force-feel system is also provided
for the rudder pedals. The pilot's
instrument panel can be configuredwith various combinations of
cathode-ray tube (CRT) displaysand conventional instruments to
represent aircraft such as theCessna 172, Cherokee 180, and
Cessna 402B. A collimated-image
visual system provides a nominal
40 ° horizontal-view by 23 ° vertical-view out-the-window color
display. The visual system
accepts inputs from a Computer-
Generated Image (CGI) system. A
Calligraphic-Raster Display Sys-tem (CRDS) is used to generate the
head-down displays and to mix
with the CGI for the head-up dis-
play. The simulator is flown in
real time, and a host computer
simulates aircraft dynamics.
Research has been conducted
to improve the ride quality of
general-aviation aircraft by deve-
oping gust-alleviation control lawsto reduce the aircraft response to
turbulence while generally good
flying characteristics are main-
rained. A research study recentlycompleted is the General Aviation
E-Z Fly, a program to investigate
ways of making general-aviation
airplanes easier to fly, especially
for low-time pilots or nonpilots.(Lemuel E. Meetze, 46452)
Differential ManeuveringSimulator
The Langley Differential
Maneuvering Simulator (DMS)provides a means of simulating
two piloted aircraft operating in adifferential mode with a realistic
cockpit environment and a wide-
angle external visual scene for
each of the two pilots. The system
217

L-90-10308
consistsoftwoidenticalfixed-basedcockpitsandprojectionsys-tems,eachbasedina40-ft-diameterprojectionsphere.Eachprojectionsystemconsistsoftwoterrainpro-jectorstoprovidearealisticterrainscene,atargetimagegeneratorandprojector,alasertargetprojec-tor,andanarea-of-interestprojec-tor. Theterrainscene,drivenbyaComputer-GeneratedImage(CGI)system, provides reference in allsix degrees of freedom in a mannerthat allows unrestricted aircraft
motions. The resulting sky-Earth
scene provides full translationaland rotational cues. The internal
visual scene also provides continu-ous rotational and bounded (300 ft
to 45 000 ft) translational reference
to the other (target) vehicle in six
degrees of freedom. The targetimage, a computer-generated
model, is presented to each pilot
and represents the aircraft being
flown by the other pilot. This dualsimulator can be tied to a third
dome (the General Purpose FighterSimulator) and thus providethree-aircraft interactions when
required. The image for the
second aircraft is genen_ted by a
digital laser projector, for a higherresolution visual scene, an area-of-
interest projector systera is avail-
able in each sphere to Frovide a
30 ° vertical by 40 ° hori::ontal
display.
Each cockpit provides three col-
or displays with a 6.5-i _-squareviewing area and a wi(te-angle
head-up display. Kinesthetic cues
in the form of a g-suit pl essurization
system, helmet loader :;ystem,g-seat system, cockpit _uffet, and
programmable control forces are
provided to the pilots _:onsistentwith the motions of th, _ir aircraft.
Other controls include a side-arm
controller, dual throttles, and arotorcraft collective. Simulated
engine sounds and wind noise addrealism.
Research applications includestudies of advanced flight control
laws, helmetomounted display
concepts, and performance evalua-
tion of new aircraft design con-
cepts for development programssuch as F-18 E/F, AX, and F-22.
(Lemuel E. Meetze, 46452)
Visual/Motion Simulator
The Visual/Motion Simulator
(VMS) is a general-purpose simu-
lator consisting of a two-personcockpit mounted on a six-degree-of-
freedom synergistic motion base.
Four collimated visual displays,
compatible with the Computer-Generated Image (CGI) system,
provide out-the-window scenes
for the left- and right-seat frontand side windows. Six electronic
displays mounted on the left- andright-side instrument panels pro-
vide for displays generated by a
graphics computer. A program-
mable hydraulic-controlled two-
axis side arm and rudder pedals
provide for roll, pitch, and yawcontrols in the left seat. Another
programmable hydraulic-controlled
loading system for the right seat
provides roll and pitch controls for
either a fighter-type control stickor a helicopter cyclic controller.
Right-side rudder control is anextension of the left-side rudder
control system. A friction-typecollective control is provided for
both the left and right seats. An
observer's seat allows a third per-
son to be in the cockpit during
motion operation.
A realistic center control stand,
in addition to providing transport-
type control features, provides
autothrottle capability for both theforward and reverse thrust mode.
A cockpit display unit (CDU) is
provided in the forward electronics
panel of the center control stand.Motion cues are provided in the
simulator by the relative extension
218
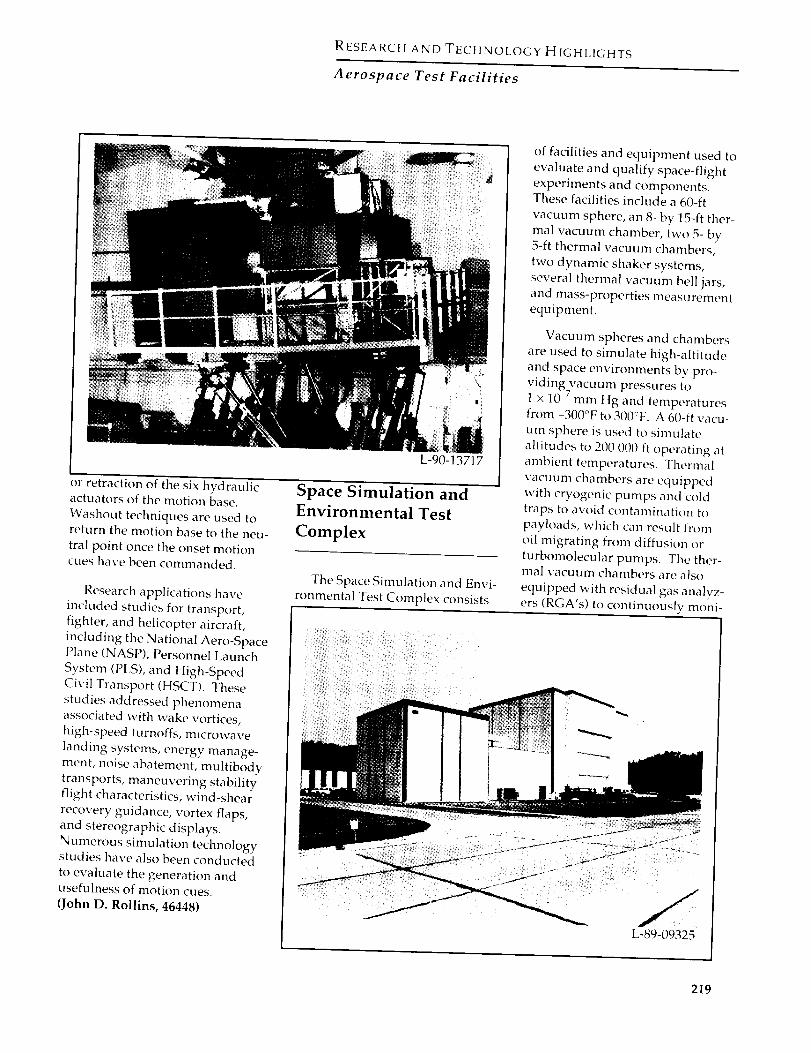
RESEARCH AND TECHNOLOGYH1GHLIGHTS
Aerospace Test Facilities
or retraction of the six hydraulic
actuators of the motion base.
Washout techniques are used to
return the motion base to the neu-
tral point once the onset motion
cues have been commanded.
Research applications have
included studies for transport,
fighter, and helicopter aircraft,
including tile National Aero-Space
Plane (NASP), Personnel Launch
System (PLS), and High-Speed
Civil Transport (HSCT). These
studies addressed phenomena
associated with wake vortices,
high-speed turnoffs, microwave
landing systems, energy manage-
ment, noise abatement, multibody
transports, maneuvering stability
flight characteristics, wind-shear
recovery guidance, w_rtex flaps,
and stereographic displays.
Numerous simulation technology
studies have also been conducted
to evaluate the generation and
usefulness of motion cues.
{John D. Rollins, 46448)
L-90-13717
Space Simulation andEnvironmental Test
Complex
The Space Simulation and Envi-
ronmental Test Complex consists
of facilities and equipment used to
evaluate and qualify space-flight
experiments and components.
These facilities include a 60-ft
vacuum sphere, an 8- by 15-ft ther-
mal vacuum chamber, two 5- by
5-ft thermal vacuum chambers,
two dynamic shaker systems,
several thermal vacuum bell jars,
and mass-properties measurement
equipment.
Vacuum spheres and chambers
are used to simulate high-altitude
and space environments by pro-
viding vacuum pressures to-7
1 x 10 mm Hg and temperatures
from -300°F to 300°F. A 60-ft vacu-
um sphere is used to simulate
altitudes to 200 000 ft operating at
ambient temperatures. Thermal
vacuum chambers are equipped
with cryogenic pumps and cold
traps to avoid contamination to
payloads, which can result from
oil migrating from diffusion or
turbomolecular pumps. The ther-
mal vacuum chambers are also
equipped with residual gas analyz-
ers (RGA's) to continuously moni-
L-89-09325
219

tor and identify molecular contam-ination within the chambers.
The vibration test facility is
equipped to perform vibration
testing, modal analysis, and center-
of-gravity and moment-of-inertiacharacterization of aerospace com-
ponents, subsystems, and small
payloads. Vibration capability
consists of three dynamic shakersthat share a common control and
data-acquisition system. Dynarnicshakers (2000, 17 000, and 24 000
force-lb) are used to verify payload
performance by simulating expect-ed mission acceleration forces.
(Thomas I. Lash, 45644)
Space Environmental
Effects Laboratory
The Space Environmental
Effects Laboratory houses state-
of-the-art research equipment to
simulate the effects of the space
environment on spacecraft mater-ials and coatings. The research
conducted in this laboratory
includes studies of the durability
of materials and coatings for
specific space missions, studies ofspace environmental damage
mechanisms, and techniques for
improved laboratory simulation of
the space environment for morereliable materials testing. The
laboratory features a space-
radiation simulation capabilitywith 1-MeV electrons, 2-MeV
protons, and solar ultraviolet radi-
ation independently or simulta-
neously projected upon a 10-in-diameter target area in a clean,
ultrahigh vacuum chamber. The
target area can be maintained at
any temperature from -100°C tolt}ff'C or cycled over this tempera-
ture range during irradiati, m.These electron, proton, and ultravi-
olet radiation sources are uniquely
designed for unattended, 24-hr-
per-day continuous operation to
provide cost-effective long-term
testing.
Another ultrahigh vacuum
chamber is equipped to exposematerials to simulated solar ultra-
violet (UV) radiation with two UVsources. A xenon source with
quartz optics covers the _ ave-
length range of 180 to 4(/0 nrn, andthe second source is a det: terium
lamp with a magnesium fluoridewindow to cover the vact um
UV and near-UV ranges _f 115 to400 nm. The test materials can be
exposed at any temperatttre from-150°C to 100°C. This laboratory
also has an atomic oxyge i simula-tion system with a 2-in. × 3-in.
exposure area and a vacuum ultra-violet radiation source. Another
test facility is a specially Jesigned
ultraviolet exposure syst,:._nl that
allows the simultaneous exposureof six coating specimens in individ-
ual ion-pumped vacuum chambers.These chambers mate to a spectro-
photometer to allow in situ mea-
surement of the solar absorptance
under conditions simulating the
high vacuum of space.{Wayne S. Slemp, 41334)
Advanced Technology
Research Laboratory
The Advanced TechnologyResearch Laboratory was dedica-
ted in 1989 in support of the Space
Research and Technology Pro-
gram. The laboratory has facilities
that are used to perform a widerange of research activities to fur-
ther both space and aeronautics
technologies. The Aerothermo-
dynamic Physics Laboratory pro-
rides the capability to understand
the thermal radiation process of
hypervelocity gases interactingwith spacecraft and aircraft. The
Low Pressure Physics Research
Laboratory supports the study of
220

RESEARCH AND TECHNOLOGYHIGttI.IGHTS
Aerospace Test Facilities
gas-surface interactions critical to
space and aeronautical vehicles.
The Radiation Physics ComputerLaboratory is used to performworld-class theoretical research
dealing with human radiation
exposure and shielding in high-
flying aircraft as well as researchon advanced space missions. The
Micrometeoroid Analysis Labora-
tory contains equipment to analyze
panels returned from space tomodel the micrometeoroid-debrisenvironment of the Earth and the
effects of that environment on
NASA and commercial spacecraft.
Ultrahigll-vacuLml and other
equipment simulate the space
environment and specialized con-ditions associated with advanced
spacecraft. The focus is on the
study of reaction cross sections at
kinetic energies between 0.5 and 5
electron volts; the transport ofhydrogen through National Aero-
Space Plane surfaces; the establish-
ment of high-purity, high-energy
atomic oxygen beams; the develop-
L-91-3852
ment of high-purity molecular
oxygen for medical purposes; and
the development of methods to
extract oxygen from the Martian
atmosphere or from other gases.
Laboratory equipment includes:
(1) the latest computer technology,
which is fully integrated into the
Center's high-speed data network;
(2) a large bank of capacitors;
(3) solar simulators; (4) opticalspectrometers; (5) an 85-m 3
vacuum tank with a high-capacity
vacuum pump; and (6) surfaceanalysis equipment.
(E. J. Conway, 41435)
Spacecraft Dynamics
Laboratory
The Spacecraft Dwlamics
Laboratory is a group of facilities
designed for structural dynamics,
vibration isolation, and pointingcontrols research Oil aerospace
structures and equipment. Testing
at low frequencies, 0 to 300 Hz, is
emphasized for characterizing
structural systems and high-gainpointing control systems. Theindividual laboratories are
described herein.
L-87-4626
221

The16-mThermalVacuumChamberhasa55-ftdiametercylinder,a64-ft-highhemispher-icaldomepeak,aflatfloor,andarotationoptionofacentrifugearmor table.Thecentrifugeisratedat20000lb to100gwitha50000force-lbcapacityandamaximumallowablespecimenweightof 2000lb. Accessisbytwodoors;onedooris20x 20ft.A vacuumof 100gmHgcanbeachievedin160minutes.Tempera-turegradientsof 100°Fcanbeobtainedfromportableradiantheatersandliquid-nitrogen-cooledplates.Thelaboratoryisservicedbyacontrolroomthatfeaturesvideomonitoringand138channelsofdataacquisition.
TheSpaceStructuresResearchLaboratoryisanopenroomwithanareaof5200ft2.Thereisaworkplatform73ftabovethefloorwith removable decking, a
20- x 30- x 40-ft freestanding gan-
try for isolated suspension, and avertical 12- x 12-ft backstop. The
laboratory is serviced by a control
room that can support several
simultaneous test setups. The con-trol room features video monitor-
ing, 784 channels of data acquisi-tion, a 384-channel structural test
and analysis system, a distributed
control system, and an environmen-
tal monitoring system.
The Structural Dynamics
Research Laboratory is dominated
by a 38-ft-high backstop. Test
areas around this backstop are15 x35 x 38 ft and 12 x 12 x 95 ft
with spiral stairs, ladders, andplatforms for high access. The lab-
oratory is supported by a controlroom that features videc monitor-
ing and 416 channels of data acqui-sition.
A variety of dynamic test and
signal processing equipment is
available to support these labor-
atories, including 10-in-strokeshakers, near-zero sprir g-rate
suspension systems, an t an arc-
second attitude and jitt_ r measure-
ment system.(Robert Miserentino, 44318)
Intravehicular Automation
and Robotics (IVAR)
Laboratory
The Intravehicular ._utomation
and Robotics (WAR) I ,aboratory
contains a full-size mock-up of a
space laboratory module, whichhouses simulated space science
and materials processing experi-ments, with remote control and
monitoring capabilities for princi-
pal investigators. Full-size mock-
ups of flight-qualifiable systemscan be installed in laboratory
racks, and simulated microgravity
experiments can be controlled
remotely by using supervised
autonomy. A mobile telerobotic
logistics system will support sam-
ple changing and resource sharingfor multiple experiments. Expert
system-based executive software
supports automated planning and
error detection. Computer gra-phics supports task planning and
operator interface development.Increased automatic functions,
dedicated experiment robotics,and resource sharing using an
onboard logistics system are being
investigated. Currently, the labor-
atory contains a full-size mock-up
of a microgravity protein crystal
growth experiment, a vapor
deposit furnace experiment,and a logistics support system.
(Ralph W. Will, 46672}
IVAR
222

RESEARCH AND TECHNOLOGY HIGHLIGHTS
Aerospace Test Facilities
Materials Research
Laboratory
The Materials Research Labora-
tory houses experimental facilitiesfor conducting a wide range ofresearch to characterize ttle
behavior of advanced structural
materials under the application ofmechanical and thermal loads.
This research encompasses tile
study of deformation characteristics
and damage mechanisms leading
to the development of nonlinear
constitutive models, strength crite-
ria, and durability and damagetolerance criteria. A high-bay area
surrounded by 8 enclosed labora-
tories houses 49 servohydraulic
testing systems (1 kip to 400 kips),
a scanning electron microscope,
3 X-ray radiography systems,
13 high-temperature creep frames,
and 3 multiparameter test facilities.The multiparameter facility per-
mits the simultaneous testing of
up to six coupons under combined
temperature (to 3000°F), cyclic
mechanical loads, and partial pres-
sures. An environmental fatigue
laboratory has dedicated test facil-
ities for aqueous environments,
inert gases, and ultrahigh vacuum.A long-term durability facility has
20 load frames and temperature
chambers for testing composite
panels under synchronized cyclicthermal and mechanical loads to
simulate supersonic flight condi-tions.
The new light-alloy laboratory
complex is also part of the Mater-
ials Research Laboratory. This
laboratory provides integrated
research facilities to conduct alloysynthesis and development, inno-
vative processing and joining,
coatings technology, and complex
characterization using electron
optics and surface analysis tech-iques. Equipment and instrumenta-tion are available to conduct sur-
face analysis, thermal analysis,
metallurgy, microscopy, X-ray,
and dimensional stability studies.
The complex is divided into sepa-
L-93-4414
rate and enclosed discipline-oriented
laboratories. Each laboratory has
an independent environmental
control and a distribution system
for laboratory gases and liquidnitrogen. A separate laboratory
is also available for the develop-
ment of thin-gage metal-matrixmaterials.
(Charles E. Harris, 43449)
Structures and Materials
Research Laboratory
Built in 1939 to contribute to the
development and validation of
aircraft structural designs during
World War II, this laboratory cur-
rently supports a broad range ofstructural and materials develop-ment activities for advanced air-
craft, aerospace vehicles, and
space platform and antenna struc-tures. Research includes the devel-
opment, fabrication, and character-ization of advanced materials and
the development of novel structur-
al concepts. Static testing, environ-mental testing, and material fabri-
cation and analysis are performed.
Emphasis is on the development
of structural mechanics technology
and advanced structural concepts
enabling the verified design ofefficient, cost-effective, damage-
tolerant, advanced-composite
airframe structural components
subjected to complex loading and
demanding environmental condi-
tions. This research also emphasiz-es advanced space-durable materi-
als and structural designs for
future large space systems that
afford significant improvements
in performance and economy.
A significant feature of the labora-
tory is its static testing equip-ment, which has capabilities up
223

to 1 200 000 lb (specimens 6 ft
wide by 18 ft long) and down to
10 000 lb (smaller specimens).
This complex also houses theLangley state-of-the-art analytical
and metallurgical laboratory,
which features all aspects of
material specimen preparation
and examination. Complete auto-
mated metallographic preparationequipment is available for research
on light alloys as well as metal-
matrix and resin-matrix compo-
sites. Optical microscopy includes
quantitative image analysis and
regular microscopy. Current-technology electron microscopy is
available, including scanning
electron microscopy, scanning
transmission electron microscopy,
and electron microprobe X-rayanalysis. Also included in the
laboratory complex is the Carbon-Carbon Research Laboratory. This
laboratory is dedicated to the
development, fabrication, testing,
and analysis of carbon-carbon and
refractory composite materials for
L-87-01200
use as thermal protection and hotstructural materials for advanced
hypersonic vehicles to temperatures
up to 3000°F.(James H. Starnes, 43168)
Polymeric Materials
Laboratory
The Polymeric Materials Labor-
atory complex provides 25 000 ft 2
of floor space for the synthesis
and characterization of high-
performance polymers as well as
the development of processingtechnology and composite fabri-
cation. The complex contains
seven synthesis laboratories and a
bench-scale laboratory designed
for synthesis of large batches ofpolymeric materials. The facility
also contains a film-casting labora-
tory with environmentally control-led film-casting boxes and a chem-
ical storage area that is protected
by an automatic CO2 extinguisher
system.
Much of the work of this labora-
tory is directed toward the synthe-sis of processible, tough, durable,
high-performance matrices and
the development of relationshipsbetween molecular structure, neat
L-86-8407
224

RESEARCIt AND TECHNOLOGY HIGHLIGHTS
Aerospace Test Facilities
resin properties, and composite
properties. Classes of polymers
being analyzed include amorphous,
semi-crystalline, and lightly cross-linked thermoplastics; semi-
interpenetrating networks; tough-
ened thermosets; and piezoelectric
polymers. Extensive characteriza-
tion equipment is housed in theinstrument laboratories and is
used for performing chromato-
graphy; thermal analyses; X-ray,
rheological, rheometric, and
spectroscopic characterizations;
and mechanical strength determi-nations of adhesives, polymer
moldings, films, fibers, and compo-sites.
The Composites Processing
Laboratory is the focal point atLangley for research and develop-
ment of advanced polymer compo-
site systems. Its primary function
is to determine the potential of
new polymers for use as matrix
systems for the fabrication ofadvanced fiber-reinforced com-
posites. Unique dry-powder-
coating-melt-fusion equipment is
employed to fabricate prepreg
from advanced, difficult-to-processpolymer matrix materials. A new
modular tape prepreg machine
that is capable of making high-
quality prepreg by solution coat-
ing, film casting, and direct fiberimpregnation is now in operation.(R. Baucom, 44252)
Low-Frequency Antenna
Test Facility
The Low-Frequency AntennaTest Facility is an indoor far-field
measurement facility that provides
a simulated free-space environment
for performing antenna measure-
L-91-00627
ments to support the analysis and
design of advanced antenna sys-tems for NASA's current and
future research programs.
Antenna measurements can be
conducted over the 0.10- to 4{)-Gtfz
frequency range. Test models or
antennas up to 12 ft in length and2000 lb or less in weight can be
measured as long as the far-fieldcriteria are satisfied. Instrumenta-
tion includes a Hewlett Packard
(HP) Model 85301B antenna
measurement systern, a Flare andRussell Model FR959 workstation,an HI } Model 872{1C network ana-
lyzer, and a Scientific Atlanta pre-
cision antenna/model positioning
system, l_est-ctlamber size is 30 ft
high by 32 ft wide by 105 ft long.Measured data stored on disk can
be processed to prove antenna
directivity, polar or rectangular
plots of the radiation patterns,and three-dimensional contour
plots of the antenna radiationcharacteristics.
{Thomas Campbell, 41772)
Compact Range Facility
The Compact Range Facility is
an indoor facility that utilizes a
commercially available reflector
that was modified by adding an
elliptical rolled edge to improve
the quality and size of the quietzone. The facility provides a simu-
lated free-space environment for
performing antenna and electro-
magnetic scattering measurements
in support of NASA aerospaceresearch programs.
Antenna or scattering measure-ments can be conducted over the
2- to 18-GHz frequency range. Thequiet zone is approximately 4 ft
high by 8 ft wide by 8 ft long.
Model handling is accomplished
with a 200(}-Ib-capacity bridge
crane. Model supports include
metal pylons and foam columns.Instrumentation is a Hewlett Pack-
ard Model 8530 network-analyzer-based system. The test chamber
225

L-8 c-6234
is 30 ft high by 28 ft wide by 65 ft
long.(Thomas Campbell, 41772)
Experimental Test Range
The Experimental Test Range
(ETR) is an indoor radio-frequency
(RF) anechoic test facility that
utilizes a dual Gregorian compact-
range, blended-edge reflector
system to perform antenna andelectromagnetic scattering mea-
surements. The facility providesan RF shielded, simulated free-
space environment for performing
electromagnetic measurementsin support of NASA aerospace
research programs and compact-range technology advancement.
Antenna or scattering measure-ments can be conducted over the
2- to 18-GHz frequency range. The
quiet zone is approximately 6 ft
high by 8 ft wide by 8 ft long.Model handling is accomplished
with a 4000-1b-capacity bridgecrane. Instrumentation includes a
pulsed/CW radar and a TektronixXD 88/30 workstation for data
processing. The test chamber is
40 ft high by 40 ft wide by 65 ft
long.Thomas Campbell, 41772)
Impact Dynamics
Research Facility
The Impact Dynamics ResearchFacility (IDRF) is used to conduct
crash testing of full-scale aircraftunder controlled conditions. The
aircraft are swung by cables froman A-frame structure that is
approximately 400 ft long and
230 ft high. The impact runwaycan be modified to simulate other
ground crash environments, such
as packed dirt, to meet a specific
test requirement.
Each aircraft is suspended by
cables from two pivot points 217 ft
off the ground and allowed to
swing pendulum-style into theground. The swing cables are sep-
arated from the aircraft by pyro-
technics just prior to impact. The
length of the swing cables regu-
lates the aircraft impact angle from0° (level) to approximately 60 °.
Impact velocity can be varied to
approximately 65 mph (governed
226

RESEARClt AND TECHNOLOGY H1GHL1GtITS
Aerospace Test Facilities
by tile pullback height). Variations
of aircraft pitch, roll, and yaw can
be obtained by changing the air-
craft suspension harness attachedto the swing cables. Onboardinstrumentation data are obtained
through an umbilical cable that ishard wired to tile control room at
the base of the A-frame. Photo-
graphic data are obtained by
onboard, ground-mounted, andA-frame-mounted cameras. Maxi-
mum allowable weight of the air-craft is 30 000 lb.
(Granville Webb, 41303)
L-74-2505
ahmg the 2800-ft track. The
propulsion system consists of
an L-shaped vessel that holds
28 000 gal of water pressurized up
to 3150 lb/in 2 by an air-supply
system. A timed quick-opening
shutter valve is mounted on the
end of the L-shaped vessel and
releases a high-energy water jet,
which catapults the carriage to the
desired speed. The propulsion
system produces a thrust in excessof 2 000 000 lb, which is capable of
accelerating the 54-ton test carriageto 220 knots within 400 ft. This
thrust creates a peak acceleration
of approximately 20g. The carriage
coasts through the 1800-ft test sec-
tion and decelerates to a velocityof 175 knots or less before it inter-
cepts the five arresting cables that
span the track at the end of the test
section. The arresting system
brings the test carriage to a stop in
600 ft or less. Essentially, anylanding gear can be mounted on
the test carriage, including those
exhibiting new or novel concepts,
and virtually any runway surfaceand weather condition can be
duplicated on the track.{Granville Webb, 41303)
Aircraft Landing
Dynamics Facility
The Aircraft Landing DynamicsFacility (ALDF) is a test track
primarily used for landing-gearresearch activities. The ALDF
uses a high-pressure water-jet
system to propel the test carriage L-85-5341
227

Flight Research Facility
The hangar is the centerpiece of
the Flight Research Facility. It pro-
vides a clear floor space of approx-imately 87 000 ft 2. Door dimensions
will allow entry of a Boeing 747 or
any other non-T-tail, commercial
or military transport-class aircraft.Features such as floor air and elec-
trical power services, radiant floorheating to minimize corrosion-
causing moisture, a deluge fire-
suppression system, energy-saving
lighting, modern maintenancefacilities, and entry doors and taxi-
ways on either side of tile buildingmake this structure an effective
and versatile facility. Surrounding
the hangar are ramp areas and a
high-power engine run-up standwith load-bearing capabilities suf-
ficient to handle a wide variety ofaircraft. Extensive and modern
maintenance equipment makes it
possible to repair, maintain, andmodify a wide range of aircraft
including modern metal and corn-
posite airliners and business-class
aircraft, fighters, and helicopters.
The inventory of research and
program support aircraft enables
research to be performed over a
wide range of flight conditions,from hover to supersonic speed_
and from ground level to altitudesover 50 000 ft. The current research
fleet includes a B-737-100, anF-16XL, an OV-10A, an LR-28, and
a UH-1H. Present research topicsinclude terminal-area traffic-flow
studies, microwave-landing-system
(MLS) approach optimization,
global-positioning-system (GPS)navigation and approach optimiza-
tion, handling qualities, aircraft
performance, engine noise, wake-
vortex detection and quantification,
and high-lift performance defini-tion and optimization, all of which
make use of the fixed-wing am raft.The UH-1H has been modifieJ
with the addition of tall skids to
create a centerline drop capability
for powered and unpowered
remotely controlled scale models
L-90-'7025
of high-performance airplanes.These research activities are con-
ducted at the Radio-Controlled
Drop Model Facility, which islocated remotely from the primary
Flight Research Facility. This com-
plex is used to study the low-speed
dynamic behavior of aerospace ve-
hicles, with particular emphasis on
high angle-of-attack characteristicsof combat aircraft.
Some Langley aeronautical
research experiments are flight-
tested at Dryden Flight Research
Facility and Wallops Flight Faci-
lity. Within the (Langley) FlightResearch Facility, a Flight ControlCenter has been created to allow
the full monitoring of flight tests at
any NASA site and to allow thecontrol of flights originating at
Langley on a real-time basis. Via
satellite or the Langley tracking
antenna system, these facilities
enable researchers at Langley toreceive test data, voice transmis-
sions, and video and allow theresearchers to assess the effective-
ness of a particular maneuver, to
review the quality of data acquired,
and to evaluate experiments in
near real time. This system usesthe satellite-based NASA Commu-
nications System (NASCOM) Time
Division Multiple Access (TDMA)
System and the Langley multi-
frequency tracking antenna system(MTAS).
(Harry Verstynen, 43875)
16- by 24-Inch WaterTunnel
The Langley 16- by 24-InchWater Tunnel is used for flow-
visualization studies at low
Reynolds numbers. The tunnel
228

RESEARCH AND TECHNOLOGYHIGIII,I(,tITS
Aerospace Test Facilities
has a vertical test section with
an effective working length ofapproximately 4.5 ft. The test
section is 16 in. high by 24 in. wide.
All four sidewalls are Plexiglas to
provide optical access. A pumptransfers the water from the test-
section exit to the reservoir up-stream of the test section. The test-
section velocity can be varied from0 ft/sec to 0.75 ft/sec. The unit
Reynolds number range for waterat 78°F for this velocity range is0 to 7.7 x 104 ft -_. The normal test
velocity that produces smoothflow is 0.25 ft/sec.
L-87-3479
more quantitative flow informa-tion.
(Bobby L. Berrier, 43001)
Scientific Visualization
System
A Scientific Visualization Sys-
tem has been brought on-line in
the Analysis and Computation
Division's Animation Laboratory
to support videotape recording ofcomputer graphics generated on
the Supercomputing Network
Subsystem or on high-performance
graphics workstations. Dynamic
video displays are essential foraccessing, understanding, analyz-
ing, documenting, and displayingthe vast numerical databases
resulting from computer simula-
tions of time-dependent physicalphenomena or from detailed
measurements in ground-based or
in-flight experimental facilities.
The central component of the
system is the DF/X Composium, adigital-component video-editing
suite. The Composium menu-
driven software offers a fully
A sting-type model supportsystem positions the model. Themodel attitude can be varied in
two planes over angle ranges of
about 33 ° and 15 ° . Ordinary food
coloring is used as a dye to visu-alize the flow. Dye may be ejectedfrom small orifices on the model
surface or injected upstream of thetest section. A laser fluorescence
anemometer is available to provide L-92-08444
229

featured video-processing and
special-effects capability, including
three-dimensional fonts, paint
box, layering, and compositing.
The Composium provides centra-
lized control of all ancillary equip-ment, including the ability to han-
dle multiple video sources. Two
Abekas real-time digital video
disk recorders provide on-linestorage for a total of 75 secondsof video. One Abekas is on the
Langley Ethernet network and can
accept raster image files in multiple
formats directly from a remoteworkstation. Two digital video-
tape recorders are used for archive
storage and as high-capacity work-
ing stores. A Silicon GraphicsIRIS 4D/340 high-performance
graphics workstation runningthe FAST data visualizer and
WAVEFRONT modeling-animationsoftware is also available. The
system includes analog taperecorders in VHS, S/VHS, Umatic,
Umatic/SP, BetaCam, and
BetaCam/SP formats that may beused as either sources of video
input or as a means of recording acompleted video for distribution.
This system makes it possible to
create professional, self-contained
video technical reports to docu-
ment and explain the results ofLangley's theoretical or experimen-
tal research. Two representative
videos that use the system are the"Visualization of Earth Radiation
Budget Experiment (ERBE) Data"and "HL-20 as a Personnel Launch
System", which demonstrate thesystem's advanced capabilities.(Bill yon Ofenheim, 46712)
Geometry Laboratory(GEOLAB)
A geometry laboratory,GEOLAB, has been established
in the Analysis and ComputationDivision to provide advanced
capabilities to support research
applications that require surfaces
and grids for numerical simulations
in computational fluid dynamics(CFD) and computational structur-al mechanics (CSM). The laborato-
ry consists of high-speed work-
stations, advanced software geom-etry tools, and a staff skilled in the
production of surface representa-
tions and computational grids for
complex aerospace configurations.
The GEOLAB hardware
includes nine Silicon Graphics,
Inc., high-performance work-stations, four X-terminals, and a
Cyberware color 3D laser digitizer.
The software includes comput2r-aided design (CAD), grid gen_ ra-
tion, and visualization tools that
have been developed or acquired
to facilitate the generation and
analysis of surface representations,
surface grids, and volume gridsfor both structured and unstruc-
tured techniques. Among the
tools currently being used inthe GEOLAB are: GRIDGEN,
ICEM-CFD, VGRID, GridTool,SurfACe, and Volume.
The GEOLAB staff is available
to assist researchers to develop the
necessary skills to use the hard-
ware and software or to performspecific tasks when requested.
Surfaces and grids have been
generated for configurations such
as the Space Shuttle, HSCT, F-18,and the F-16XL. The digitizer hasbeen used to scan the X-15, F-22,and Waverider to create surface
grids. Office space is available for
guest researchers to temporarily
colocate, on a space-availablebasis, in GEOLAB while using the
laboratory.(Eric L. Everton, 45778)
L-91-14599
230

RESEARCH AND TECHNOLOGY HIGHLIGHTS
Aerospace Test Facilities
Supersonic Low-
Disturbance Pilot Tunnel
The Supersonic Low-DisturbancePilot Tunnel, which has been in
operation since 1981, uses high-
pressure air from a 4200-psia tank
field dehydrated to a dew-pointtemperature of -52°F. The air, fil-
tered to remove all particles larger
than 1 _m in size, is reduced in
pressure by control valves located
upstream of the settling chamber.The tunnel flow exhausts to a
vacuum sphere complex that pro-
rides run times up to approximate-
ly 1 hour for stagnation pres-
sures from 25 psia to 100 psia and
Reynolds numbers from 1.8 to18 x 10" per ft at a free-stream
Mach number of 3.5. The settlingchamber contains seven antiturbu-
lence screens along with a number
of dense, porous plates that func-tion as acoustic baffles to attenuate
incoming pressure fluctuations
from approximately 0.2 percent of
stagnation pressure to approxi-
mately 0.01 percent. In addition,
the radiated noise is reduced bymaking the nozzle wall boundary
layers laminar through the use of
boundary-layer removal slots just
upstream of the nozzle throat anda properly tailored expansion noz-
zle with highly polished walls.
The quiet test core is approximate-
ly 6 in. long, 2 in. wide, and 4 in.
high.
The low-disturbance environ-ment of this tunnel makes the
tunnel a unique facility for high-
speed transition research thatcannot be done in conventional
tunnels.
(Michael J. Walsh, 45542)
L-81-4419
Pyrotechnic Test Facility
The Pyrotechnic Test Facility
contains the Langley Research
Center aerospace environmental
and functional simulation equip-
ment used for the handling and
testing of small-scale potentially
hazardous materials, including
explosive and pyrotechnic mater-
ials, devices, and systems. The
facility contains three 12- by 18-fttest cells, which are used for
assembly and checkout, environ-
mental testing, and test firing. A
30- by 60-ft general-purpose, high-
bay, open work area is used for
L-80-5749
231

system testing and contains con-
trol systems for environmental
and functional testing. These test
capabilities include remotely oper-ated vibration, mechanical-shock,constant-acceleration, thermal,
thermal vacuum, electrostatic-
discharge systems, and electrical
and mechanical firing systems.
t ]igh-speed measurements ofacceleration, force, pressure, tem-
perature, and explosive perfor-mance monitoring systems arealso available.
(Laurence J. Bement, 47084)
Probe Calibration Tunnel
The Langley l'robe CalibrationTunnel (['CT) is an open-jet pres-
sure tunnel witl,_ a capability to
independently control velocity,
density, and total temperatur, _.
The primary purpose of this
unique facility is to economically
calibrate probes for the majorNASA aerospace test facilities.
Typical operational cost for the
PCT is 1 percent of the cost to oper-
ate a major facility. The PC_ has
two interchangeable nozzles thatgive it a continuous-flow capability
over a Mach number range of 0.05
to 1.0. The operational envelope
shown in the figure illustrates the
PCT mass-flow requirements for
an equivalent stream tube forseveral of NASA Langley's majorresearch facilities. The subsonic
nozzle and transonic nozzh, both
maintain a 15:1 ratio of pro_:)ediameter to nozzle-exit diameter
to assure flow uniformity. The
combination of the staged Fressure
system and the low mass-f.ow
requirements of the PCT enableseconomic and accurate pr(be
calibration for hot-wire probes,
flow-angularity probes, thermo-
couples, and other miscellaneousaerodynamic probes. Tunnel stag-
nation pressure and temperaturecan be varied from a minimum of
0.20 atm to a maximum of 10 atm
and from 500°R to 600°R, respec-tively. This corresponds to a
Reynolds number range of 1 x 10_
to 51 x 106 per foot for a Machnumber of 1.
(Gregory S. Jones, 41065)
0 0l 02 03 04
Math Numl:_r
0.5 0 0.2 0.4 0._. O.B 1 1.2
M_Ch Number
232

RESEARCHANDTECHNOLOGYHIGHLIGHTSAerospace Test Facilities
233

Contributing Organizations
RESEARCH AND
TECHNOLOGY
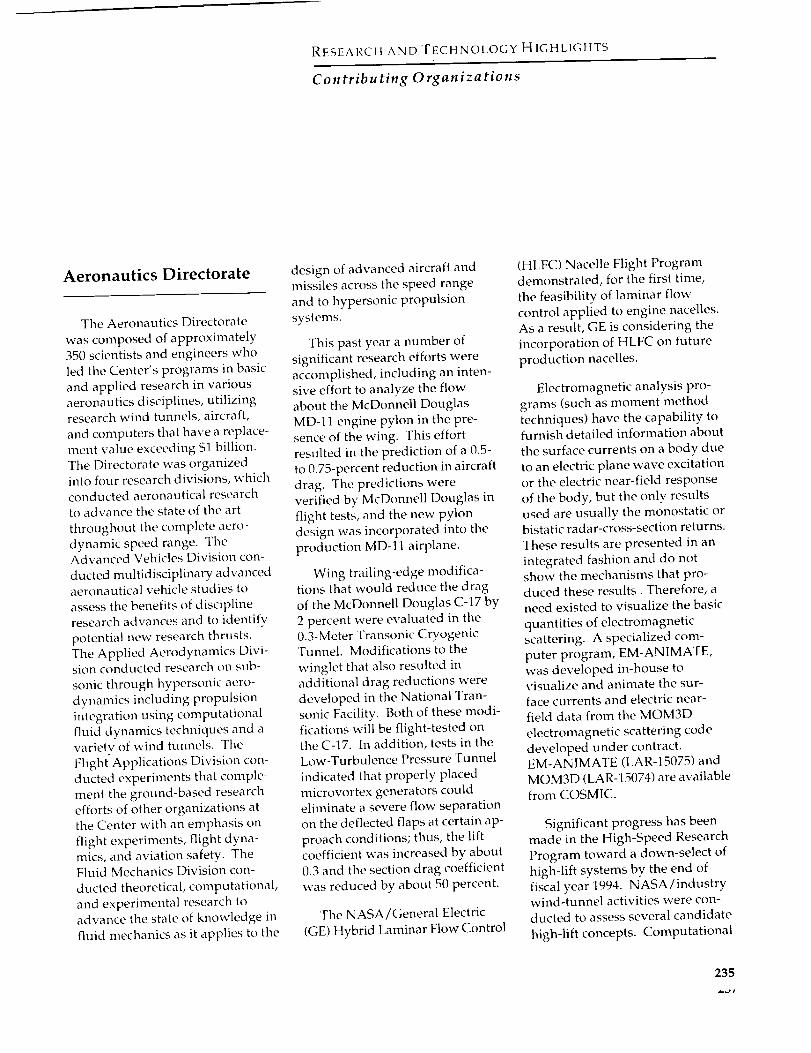
RESEARCH AND TECHNOLOGY HIGHLIGHTS
Contributing Organizations
Aeronautics Directorate
The Aeronautics Directorate
was composed of approximately350 scientists and engineers who
led the Center's programs in basic
and applied research in various
aeronautics disciplines, utilizingresearch wind tunnels, aircraft,
and computers that have a replace-
ment value exceeding $1 billion.
The Directorate was organizedinto four research divisions, whichconducted aeronautical research
to advance the state of the art
throughout the complete aero-
dynamic speed range. TheAdvanced Vehicles Division con-
ducted multidisciplinary advancedaeronautical vehicle studies to
assess the benefits of discipline
research advances and to identify
potential new research thrusts.
The Applied Aerodynamics Divi-sion conducted research on sub-
sonic through hypersonic aero-
dynamics including propulsion
integration using computationalfluid dynamics techniques and a
variety of wind tunnels. The
Flight Applications Division con-
ducted experiments that comple-ment the ground-based research
efforts of other organizations at
the Center with an emphasis on
flight experiments, flight dyna-mics, and aviation safety. TheFluid Mechanics Division con-
ducted theoretical, computational,
and experimental research toadvance the state of knowledge in
fluid mechanics as it applies to the
design of advanced aircraft andmissiles across the speed range
and to hypersonic propulsion
systems.
This past year a number of
significant research efforts wereaccomplished, including an inten-
sive effort to analyze the flow
about the McDonnell Douglas
MD-11 engine pylon in the pre-sence of the wing. This effort
resulted in the prediction of a 0.5-
to 0.75-percent reduction in aircraft
drag. The predictions were
verified by McDonnell Douglas in
flight tests, and the new pylondesign was incorporated into the
production MD-11 airplane.
Wing trailing-edge modifica-
tions that would reduce the dragof the McDonnell Douglas C-17 by
2 percent were evaluated in the
0.3-Meter Transonic CryogenicTunnel. Modifications to the
winglet that also resulted in
additional drag reductions were
developed in the National Tran-
sonic Facility. Both of these modi-fications will be flight-tested onthe C-17. In addition, tests in theLow-Turbulence Pressure Tunnel
indicated that properly placed
microvortex generators couldeliminate a severe flow separation
on the deflected flaps at certain ap-
proach conditions; thus, the liftcoefficient was increased by about
0.3 and the section drag coefficient
was reduced by about 50 percent.
The NASA/General Electric
(GE) Hybrid Laminar Flow Control
(HLFC) Nacelle Flight Programdemonstrated, for the first time,
the feasibility of laminar flow
control applied to engine nacelles.
As a result, GE is considering theincorporation of HLFC on future
production nacelles.
Electromagnetic analysis pro-
grams (such as moment method
techniques) have the capability tofurnish detailed information about
the surface currents on a body due
to an electric plane wave excitation
or the electric near-field responseof the body, but the only results
used are usually the monostatic orbistatic radar-cross-section returns.
These results are presented in an
integrated fashion and do notshow the mechanisms that pro-duced these results. Therefore, aneed existed to visualize the basic
quantities of electromagneticscattering. A specialized com-
puter program, EM-ANIMATE,
was developed in-house tovisualize and animate the sur-
face currents and electric near-field data from the MOM3D
electromagnetic scattering code
developed under contract.EM-ANIMATE (LARd 5075) and
MOM3D (LAR-15074) are availablefrom COSMIC.
Significant progress has been
made in the High-Speed Research
Program toward a down-select of
high-lift systems by the end of
fiscal year 1994. NASA/industrywind-tunnel activities were con-
ducted to assess several candidate
high-lift concepts. Computational
235
a,.Ji

REPORT DOCUMENTATION PAGE|
Public reporting burden for lhls collection of reformation is estimated to average I hour per response mt ludtng the time for reviewing
Fortr_ Approved
OMB No 0704 0188
mstructlotls searchm_ eKisting data sources
gathering add mavltalmog the dat_ needed and completing aild rev{ewmg the collectioll o( mformat_oll SeI_d cot_'_merlts regarding this burden estmlate o_ all,, othe{ aspect ot this
collection of reformation including sL_gge!,tions for _edLiClng this btlrden to k._ashmgton Headqtlarters Se'vices [)irectorate for In(ormation Operatrons and t_eports 1215 Jetferson
Dav_s HigI%_a_ Suite 1204 Arlington VA 22202 4302 aad to the Office ot IAa_agemei_t a_d Budget, [ aperwork tRed_Ktion ProF{I (0704 01881 Waskm_3_m DC 2@50]i
1. AGENCY USE ONLY{Leave btanA) 2. REPORT DATE 3. REPORT TYPE AND DATES COVERED
AuKust 19!)4 q_'chnical ._Ieuioranttuni
4. TITLE AND SUBTITLE 5. FUNDING NUMBERS
I{esearc}l and Technology lliKldi_zhls 1!)93
6. AUTHOR(S)
7. PERFORMING ORGANIZATION NAME(S) AND ADDRESS(ES)
NASA [,augley P,e.',('arch ('emer
HaIliI)loll, VA 236_1-0001
9, SPONSORING/MONITORING AGENCY NAME(S) AND ADDRESS(ES)
National Aeronaut its and Space A(lniini_t ral ion
Washingttm. D(' 20546-0001
Ii. SUPPLEMENTARY NOTES
8. PERFORMING ORGANIZATION
REPORT NUMBER
L- 17397
10. SPONSORING/MONITORINGAGENCY REPORT NUMBER
NA_:\ TXI 1,575
12a. DISTRIBUTION/AVAILABILITY STATEMENT
U n('lassiticd Utdiniit(,d
Su|lject ('i_Aegtwy 99
12b. DISTRIBUTION CODE
13. ABSTRACT (Maximum 200 words)
The uiissi(,ii ,)f the NASA Lalig|t'y Re.'-;t'._ircll ('elliOt is it) hlcieas(' tiic knt,wh,(lg(, and ('al)al)ility of the
United Slates h_. it full r;tli!/_t' 'c)f;/t'rOllalltics discipliues illld in _elected space disciplines, This llli,B:--;i(.lll will
lie acconiplished by t)crl'orniing innovative re,,loar(']i rt'lt,vant if) national need._ mid AI4('ncy goals, lratisJ'tTriil_4
tecinlology 1o ilsers in a tiniely nialiner, and providhi_ dev(qopnl(,i 1 ._til)])(si'I l(i oliier Uniled _Iale_ (',over]lineilI
agencies, induslry, and other NASJ (!elli(w_. This rt'pori el)Ilia tlS hightigtiis or the niaior acconiplislilnenl_
_t11(1 al)llli('aliolls lhal have })fen lnadc by Lang|t,y llDst,itlX'}iOl-5 al_tt })y ollr nlliversily alld ilidli,'-;lry Ctl|]('itgll(',',4
duriug the past year. "Flit' highlight._ illustrate both the broad lange of tit(' l'(,sOltlC}l alld technolu;4y (I{&'T)
activities Slti)liorted by NASA ].allgley [{ug('ai'('h (]eilter and tilt> ('OlitritHIti(.lllS of tills work ltJV¢llrd lllahllaiilhlR
[Tliiletl States h'adersliip in ;tl,r{ilialltiCs all(t space r('st,ar('ll. Tile r( port also (h>scril)t,,,, st)nit, (ff t tic (!(,hi t,r's ItiosI
ililI)ortalll lt'sear(']l illid lest ill_ facilities. For. fill'liter ill[})rlilatiol (!()llc(!rlihlg the rpl)t)rl. ('Olil;.l('t Dr.._.li('halq
F. ('artl. ('hief Scit,altisl. Mail Strip 110. NASA Lanlth'y l/esoal,'h Celiter. Halll]doli, \"h'ginia 236Sl. (S01)
S(i.l-89SS.
14. SUBJECT TERMS
|if'search anti technology; Aeronautics: Space; Structures: Mate-iaL_: Elt'ctronics:
l:ligiil By.sit'ins: TeciinoloKv trallsfer: q]whnology connnercializalioil: l_n_in(!erint4;
A(TO(tyilalnit's: \Vind tlinllels: Facilities: Tests
17. SECURITY CLASSIFICATION 18, SECURITY CLASSIFICATION 19. SECURITY CLASSIFICATION
OF REPORT OF THIS PAGE OF ABSTRACT
Unclassitiod I TuciasBitied
NSN 7540-01-280-5S00
1S. NUMBER OF PAGES
26'./
16, PRICE CODE
A 12
20. LIMITATION
OF ABSTRACT
Standard Form 298(Rev. 2-89)Prescribed b< ANSI Std Z3g 18
298 102
RESEARCH AND TECHNOLOGY HIGttLIGHTS
Contributing Organizations
functions and what type of infor-
mation should be provided to
crews in advanced aircraft flightdecks.
The FSD space-related research
accomplishments include tilefollowing: the development and
validation of an optical measure-
ment system that determines tile
position and attitude of a magneti-
cally levitated cylinder and pro-vides this information to the con-
trol system of a large-gap magnetic
suspension system; the develop-
ment of a linear simulation and jit-
ter analysis tool to assess pointing
performance of the EOS AM-1spacecraft; the successful design,
fabrication, and laboratory testing
of antennas for the End Mass Pay-
load on the first Small ExpendableDeployer System (SEDS)--the
antennae worked better than pre-dicted in the SEDS flight; and the
development and operation of an
interactive operator control station
for the Flight Telerobotic Servicer
Program's Hydraulic ManipulatorTestbed (HMTB). The HMTB now
resides at LaRC and was recently
controlled remotely from JSC byusing the LaRC control stationsoftware.
National Aero-Space
Plane Office
The National Aero-Space Plane(NASP) Office oversees all NASP
technical activity in NASA as a
part of Langley's duties as NASALead Center for NASP. The office
also coordinates a broad-scope hy-
personic vehicle research and
technology program at Langleyand conducts vehicle systems
analyses for airbreathing space
launch vehicles and hypersonicaircraft. The NASP Office is made
up of the Systems Analysis Office,the Flight Research Office, the
NASP Technology Office, and the
Numerical Applications Office.
Significant accomplishments
for the NASP Office over the past
year include the following: (1) metall requirements for the NASP
Government Work Packages,
including performance, cost,
schedule, reporting, and documen-
tation; (2) investigated high-speed
scramjet mixing processes to bene-fit mixer designs; (3) developed
the first version of a hypersonic
airbreathing vehicle design-
optimization code that will greatly
shorten the design cycle for thisclass of vehicle; (4) evaluated
methods to minimize base-pressure
drag in scramjet combustors;
(5) developed a new, more accurate
method for the structural analysis
of vehicles constructed of compos-ite stiffened panels; and (6) contrib-
uted significantly to the design ofvehicles and instrumentation for
the proposed NASP HYFLITE
flight experiments.
Space Directorate
The Space Directorate had pri-
mary responsibility for Langley'sresearch programs in aerothermo-
dynamics, advanced transportation,
atmospheric sciences, and systemsanalysis. The directorate was
organized into the Advanced
Space Concepts Division, the
Atmospheric Sciences Division,
the Space Systems Division, and
the Space Technology InitiativesOffice.
The Advanced Space Concepts
Division (ASCD) conducted sys-
tems analysis of advanced space-
craft and instrument analysis ofadvanced remote sensors for the
Mission to Planet Earth program.The analyses included the identifi-
cation of critical technologies, mis-sion architecture studies, and tech-
nology assessments. The ASCD
provided independent systems
analysis for the Microgravity
Science and Applications Program
and provided technical support tothe Office of Advanced Concepts
and Technology (OACT) in SpaceStation Freedom utilization and
in-space technology experiment
development (e.g., Middeck
0-Gravity Dynamics Experimentand Modal Identification Experi-
ment). ASCD also supported the
Space Station Freedom program
with independent systems analysisand advanced studies and contrib-
uted substantially to the redesign
of the Space Station Freedom and
the transition of the program to thehost Center.
The Atmospheric Sciences Divi-sion (ASD) was involved in pro-
grams focused on global-change
issues with particular emphasison climatic effects of radiation
balance, clouds, and aerosols and
on understanding middle and low-
er atmospheric chemistry. Effortsincluded research in Earth
radiation sciences, stratosphericsciences, and tropospheric
sciences; remote sensing from
space for global-scale examination
of the Earth; modeling and data
analysis to provide a conceptualand predictive understanding of
Earth as a system; and advanced
technology development in
remote-sensing systems. Research
highlights included techniques for
remote sensing of multilevelclouds, measurements of ozone
and aerosols over the tropicalAtlantic, determination of the
global effects of the Mt. Pinatubo
eruption, determination of global
surface albedo values, and study
237

of polar vortex processes. Sixoperational space instruments
continued to provide key data on
radiation processes and strato-
spheric chemistry. These instru-ments included three Earth Radia-
tion Budget Experiment (ERBE)instruments, the StratosphericAerosol Measurements (SAM II)
experiment, the Stratospheric
Aerosol and Gas Experiment
(SAGE IIL and the Halogen Occul-
tation Experiment (HALOE).Preparations continued for the
third shuttle flight of the Measure-ment of Air Pollution from Satel-
lites (MAPS) experiment and an
initial flight of the Lidar In-spaceTechnology Experiment (LITE).
The ASD was involved in develop-
ment of the Earth Observing
System with the Clouds and the
Earth's Radiant Energy System(CERES) and SAGE II experiments,
interdisciplinary investigations
focusing on the radiant energy
system and stratospheric modeling,and a Distributed Active Archive
Center for Earth science data.
Management of the Global Tropo-
spheric Experiment to examine
tropospheric chemistry focused onimplementation of the Transport
and Atmospheric Chemistry near
the Equator-Atlantic experiment.
The division continued manage-
ment of the First ISCCP Regional
Experiment for improved param-eterization of clouds and radiation
for use in climate models.
The Space Systems Division
(SSD) continued to provide
systems analyses and configuration
assessments for the Agency Access
to Space study. Previously com-pleted work on the HL-20 Person-
nel Launch System was used
as a point of departure for an
expendable-launch-vehicle-based
personnel and small logistics
transport for Space StationFreedom. This concept, designated
HL-42 (42 percent larger than theHL-20), was included in the recom-mended architecture for the
expendable-based system. Most ofthe effort devoted to Access to
Space has focused on the rocket
SSV (single-stage vehicle). The
previous SSD work on the single-
stage-to-orbit concept has pro-
vided a unique SSV design that
has shown the viability of a cosf-effective single-stage-to-orbit
(SSTO) vehicle design with the ap-
propriate investment in technology.
Space Systems Division studieshave shown that a rocket SSTO ve-
hicle is a realistic option with
maturation of lightweight struc-
ture, reusable cryogenic tanks, md
advanced rocket-propulsion te:h-nologies.
The Space Exploration Initi_ tire
Office completed the design ot a
unique teleoperated lunar rover
and developed a process fortechnology development and
transfer. A pilot program wit!_John Deere, Inc., was initiated to
evaluate this process.
Structures Directorate
The Structures Directorate led
the Center's research prograit_s inthe technical areas of materials,
structures, and acoustics. Bo :h ap-plied research and technology
development programs wer_
conducted, with emphasis on
advanced aircraft, spacecraft, and
launch-vehicle systems. The direc-torate had more than 250 scientists
and engineers in four divisic,nsthat performed research in t!letechnical areas of materials, struc-
tural mechanics, structural d ynam-ics, and acoustics. Each division
maintained a complement of mod-ern research facilities as well as
technical support functions. In
addition, each division had a coop-
erative, university, and industry
research program to assure thatthe best talents were available to
solve today's research challenges.
Recent technical accomplishmentsin the materials area include the
development of a new crack-tipopening-angle fracture criterion
that accurately predicts stable
crack growth in thin-gage alumi-
num alloys typical of aircraft struc-
tures, the development anddemonstration of a new sol-gel
coating for titanium alloys that
provides oxidation protection up
to 1200°F, and the further develop-ment of textile composites made
from powder-coated towpreg that
show an outstanding balance of
mechanical properties. For thestructural mechanics area, recent
technical accomplishments includethe successful shakedown at Mach
7 of the 8-Foot High-Temperature
Tunnel following a major facility
renovation, testing and analyses of
the first Advanced Composites
Technology (ACT) stiffened fuse-lage panels, and the development
of interfacing techniques for struc-
tural finite-element analysis codes.
In the structural dynamics area, re-
cent technical accomplishments
include the completion in the Tran-sonic Dynamics Tunnel (TDT) of aseries of wind-tunnel tests on
transport and business jet aero-
elastic models and the developmentand astronaut evaluation of an
Active Damping Augmentation
(ADA) system for the Space
Shuttle Remote Manipulator Sys-tem (RMS); in the CFD area, the
accomplishments include the
initial development and reporting
on a gridless solution algorithm
238

RESEARCH AND TECHNOLOGY HIGHLIGHTS
Contributing Organizations
2D N/S. In the acoustics area,
recent technical accomplishmentsinclude noise reduction for HSR
through shielding by multiple jet
arrays, application of micromanip-
ulators for suppression of super-sonic jet noise, and completion of
tests to determine subjective
responses to a range of simulated
sonic-boom signatures.
Systems Engineering and
Operations Directorate
The Systems Engineering andOperations Directorate's prime
function was to provide engineer-
ing and technical support for theinstitutional and research needs of
the Center's ongoing aeronautic
and space programs. Its 1013-person complement provided a
wide variety of engineering and
technical disciplines to design and
fabricate hardware components
and develop software codes for
the unique experimental systems
requested by the researchers. Itsfive divisions and two offices had
specific support functions. The
Systems Engineering Division
was responsible for the design,development, analysis, and testing
of aerospace hardware and wind-tunnel models; the Facilities
Engineering Division was respons-ible for the design, construction,and modification of facilities and
hardware; the Fabrication Division
produced hardware, components,
and systems for aerospace projects
and research facilities; the Opera-
tions Support Division provided
maintenance services and supportfor tile operation of the windtunnels, facilities, and research
equipment; the Systems Safety,
Quality, and Reliability Division
managed safety, quality assurance,
and environmental compatibility
programs; the Facilities Program
Development Office coordinated
the Langley Construction of Facili-
ties Program with NASA Head-
quarters; and the 8-Foot High-
Temperature Tunnel ShakedownProject Office managed perfor-
mance verification testing for this
recently modified high-performance
facility.
This year the Directorate mademajor strides in utilizing con-
current engineering and fabricationtechniques to develop flow-quality-
improvement hardware for the
8-Foot High-Temperature Tunnel.
The Lidar In-space Technology Ex-
periment (LITE) completed all
space-qualification testing and isawaiting shipment to the Kennedy
Space Center. Several devices
were designed and fabricated to
assist in the collection of fluctuatingpressures in high-temperature
environments, dynamic pressuresin wind-tunnel models, and
groundwater seepage rates for
contaminant discharge studies. A
methodology to optimize thedesign of low-conductance cryo-
genic supports was utilized, and
evaluative testing of adhesives
for cryogenic applications was
performed. An analytical assess-ment of a new solid wheel design
for the Aircraft Landing Dynamics
Facility carriage was completed. A
multistaged electroforming
technique has permitted the design
and fabrication of complex porous-skin wind-tunnel models. A
fuzzy-logic controller has been de-
veloped and applied to the control
of temperature processes in the
Hypersonic Blowdown Tunnels
Complex. An instructional
computer program linking MSC/NASTRAN and STAR to aid in the
test correlation of finite-element
models was successfully demon-strafed.
Technology Utilization
and Applications Office
One of the responsibilities of
NASA, mandated by Congress, is
to promote economic and produc-
tivity benefits to the nation by fa-cilitating the transfer of aerospace-
generated technology to the public
domain. NASA meets this objec-
tive through its Technology
Utilization Program, which pro-
vides a link between the developersof aerospace technology and those
in either the public or private sec-
tors who might be able to employ
the technology productively. The
NASA Tech Briefs ]ournal, whichhas more than 200 000 subscribers,has been an effective method of
announcing new technology
generated by NASA. The Technol-
ogy Utilization and Applications
Office assisted industry by provid-
ing available technology that canmeet their needs, arranging visitsto the Center to discuss NASA
technology with the developers,
coordinating a Space Act Agree-
ment that allows for joint
development of technology for thecompany needs, and assisted in
arrangements for the use of NASAfacilities.
Another important facet of theNASA Technology Utilization Pro-
gram is its applications engineering
projects, which involve the use of
NASA expertise to redesign and
reengineer aerospace technology
to solve the problems delineated
by Federal agencies or otherpublic-sector institutions. Applica-
tions engineering projects originate
in various ways; some stem from
requests for NASA assistance from
other government agencies, and
some are generated by NASAengineers and scientists who
239

perceivepossiblesolutionstopublic-sectorproblemsthroughtheadaptationof NASAtech-nology.Additionally,NASAemploysamultidisciplinaryappli-cationsteamthatmaintainsaliaisonwithpublic-sectoragencies,medicalandpublic-healthinsti-tutions,professionalorganizations,andacademiatouncoversignifi-cantproblemsindiversefieldssuchashealthcare,publicsafety,transportation,environmentalprotection,andindustrialpro-cessesthatmightbeamenabletosolutionbytheapplicationofNASAtechnology.A Technology
Utilization applications engineering
project is considered to be success-ful when the technology developed
under the project is used or is man-ufactured for the market.
To help obtain secondary uses
of Langley technology, public
awareness of Langley innovationswas promoted by the Technology
Utilization and ApplicationsOffice. Two such methods are the
submission of Langley candidateitems for induction into the SpaceFoundation Hall of Fame and thesubmission of candidate items to
tile Research and Development
(R&D) 100 Award competition.
Awards are presented annually to
the 100 most significant technolog-ical advancements selected fromcandidate items received world-
wide. Langley received two R&D100 Awards in 1993, one for theAirborne In Situ Wind-Shear
Detection Algorithm and one for
the Hyperthermal Oxygen AtomGenerator (HOAG). The wind-
shear detection algorithm was
developed as a measurement stan-
dard for evaluation of predictive(forward look) wind-shear detec-
tion systems in actual researchmicroburst encounters and as an
advancement over available in situ
wind-shear detection algorithms
The HOAG is a small, ultrahigh-vacuum-compatible, hyperthermal,
atomic-oxygen generator that
provides a flux of pure, energetic,
ground-state oxygen atoms. In
1993, the Space Foundation induct-
ed NASA-developed cooling
garments into the Hall of Fame.Langley was instrumental in
getting children with hypohidrotic
ectodermal dysplasia (HED) to (,b-
tain access to cooling garmentsand assisted in the establishmentof the HED Foundation.
240

RESEARCH AND TECHNOLOGY HIGHI. IGttTS
Contributing Organizations
241

REPORT DOCUMENTATION PAGEi
Public reporting burden for thl_ culiectlon oJ mfc,rmatiol, is estmPated to a_erage 1 hour per response mCiL_dmg t _etime for
Form 4pproved
OMB No 0704 0188i
re_le_,mj4 mst_uct_ons seJrchmp, existm_ data sourcesgaO_ermg and mamtammg the data needed and compietmg and revlewmg the collection of reformation Send cc nments re_,ardm_ this burden e_hmate or anw oilier a_pcct ot th_collection of ,t_formabol_ inc/udmg suggestions fo_ reducing th,s bufder7 to Washing[or_ HeadquarCet_ Services { frectorate 1cothlforrnation Qper,lllof_ a_ld f,Pepor(_ 1215 Jet_er_uitDaws Higkwa'_ Suite 1204 Arhn_ton VA 22202-4302 and to the Ofhce of Management and Budp, et PapeTwo k Reduction Project (0704-0188) _\_ashm_,ton DC 205(3_
1. AGENCY USE ONLY/Leave blank) 2. REPORT DATE 3. REPORT TYPE AND DATES COVERED
AH_nsT 1!)94 Te('}mira Mem(namlmH
4, TITLE AND SUBTITLE 5. FUNDING NUMBERS
lh,scan'h _md ]'eHmology t]ig}lli<'Kilts 1993
6. AUTHOR(S)
7. PERFORMING ORGANIZATION NAME(S) AND ADDRESS(ES)
NASA I.anl4h'y Re._ear('h ('('lilt'l
t|alllpIlin, VA 236X1-()0l)]
9. SPONSORING/MONI'I_ORING AGENCY NAME(S) AND ADDRESS(ES)
Nat ional Ai.,rolianl it's and St)a('t' A(hninist rat i(tIi
'Qt,'ashill_tOli, 1)(' 2054(;-11()(11
8. PERFORMING ORGANIZATION
REPORT NUMBER
I= 17:197
10. SPONSORING/MONITORING
AGENCY REPORT NUMBER
NASA TXI- 1575
11. SUPPLEMENTARY NOTES
12a. DISTRIBUTION/AVAILABILITY STATEMENT
[T/l('la_sified Unlhnit_'d
SIIbjt'('l ('H[I'_iH'V !)9
I
13. ABSTRACT (Ma',m]um 200 words)
12b. DISTRIBUTION CODE
The inissi(ni of the NASA I.anp;l(,,v lh,search Center is to iil('l_,:.l,_(, the knowlc(ll4(' all(l ('at)al)ility of tilt'
United States in a full raIlp_(' ()t' _l('rollallti('_ discilflincs and in s(,(,(:te(t _,pil('(, (tis('iI)lin('s. This niissi()n will
be avcolnl)lisll('d t)y t)('rforniin_ hmovativ(' r('s('ar('h relev.;tni t(> naliunal nf'e(ls and Agency p;oals, Ir;-ln,sfl,rrJll_
t(,('lillology to ii,_l.'l_ in i_ tinitqy llllillll(,l', and t)ri)vi(|hlt_ (](,','('lol)ni(,nI 4Hl)l)ort t()olh(T []liil('(l _IaI(',_ (]liv(q'lllll(qll
_tgi,tl('i(,s, ill(.[llstry, arid ()t}ll.?l NASA ('ellters. This r(.,l)ort ('olltaill4 highlil4his (ff 1[IO llli/jlJl' ncc()illl)lishlll('lllS
and nptili('ations that have been I11;-[([(' })y Lallg]ey l'os(_trcllers _/11([ l)y {)ill' illlivorsi(v an(t induslry ('(;dI('a_il(,,,4
dill'hl_ the pant year. The ]lil4[llights ilhlstrate both the ))road l'_llg(' of the l-(!,',4oilr('h if+lift tt'('llnt>lop>y (]{&'T)
activities SUpl)ort(,d by NASA L_tilgi('y Rosl'_tl'ch (_(!ll{(,r ._tli(l the co ltril)uti(nis ()(" this work t(IWill'd lllililiiitillill_
1.Tliite(t States h'a(tersliip ill aeroll_.tlltios _/ll(l Sl)_tco l'(!Nl'._l,I't:}).. The rel4)rt also describes some of 1}1(, ('l.,lit(,l"S lilt)st
iill[)olt_lllt res(,ttl('}l it]l(t Iestill_ fat')lilies, [:or.[lirilll, r ili[Ol'lilltt, ioli r.!()ll(:(.'rllillpj lift' report, ('oliltl('l I)r. Mi(qiael
t:. ('ar(l, ('hi<q S('i('zitist. Mail SIt)I) 110. N':\S:% Langicv _os(,._irlti (J(,nier, [tllllli)tull. Virginia 2:i6_1, (,4()j)
14. SUBJECT TERMS
Research alid te('illlO|OlZLY; A0ronautics: Space; St,rtl(.:ttli'(_,s: Materials: l':le(qronics:
Fiil4tit sysl('liiS: "l]'('huulol4y traii:-;[t!r; Te('hnolo_y Colliln(q(!iaiizal Oil: t_ii_ili{4ThiX:
A('r()dynltini('s: \Vinci tniint,Ls: Facilities: 31!sl._
17. SECURITY CLASSIFICATION 18. SECURITY CLASSIFICATION 19. SECURITY CLASSIFICATION
OF REPORT OF THIS PAGE Of ABSTRACT
Unclassified Unclassified
NSN 7540-01-280-5500
15. NUMBER OF PAGES
263
16. PRICE CODE
A 1220, LIMITATION
OF ABSTRACT
Standard Form 298(Rev, 2-89)Prescribed by ANSI Std Z39 18298 102
Related Documents