Stem Cell Reports Ar ticle Reprogramming to Pluripotency Using Designer TALE Transcription Factors Targeting Enhancers Xuefei Gao, 1 Jian Yang, 1 Jason C.H. Tsang, 1 Jolene Ooi, 1 Donghai Wu, 2 and Pentao Liu 1, * 1 Wellcome Trust Sanger Institute, Hinxton, Cambridge CB10 1HH, UK 2 Key Laboratory of Regenerative Biology, Guangzhou Institute of Biomedicine and Health, Chinese Academy of Sciences, Guangzhou 510530, China *Correspondence: [email protected] http://dx.doi.org/10.1016/j.stemcr.2013.06.002 This is an open-access article distributed under the terms of the Creative Commons Attribution License, which permits unrestricted use, distribution, and reproduction in any medium, provided the original author and source are credited. SUMMARY The modular DNA recognition code of the transcription-activator-like effectors (TALEs) from plant pathogenic bacterial genus Xanthomonas provides a powerful genetic tool to create designer transcription factors (dTFs) targeting specific DNA sequences for manipulating gene expression. Previous studies have suggested critical roles of enhancers in gene regulation and reprogramming. Here, we report dTF activator targeting the distal enhancer of the Pou5f1 (Oct4) locus induces epigenetic changes, reactivates its expres- sion, and substitutes exogenous OCT4 in reprogramming mouse embryonic fibroblast cells (MEFs) to induced pluripotent stem cells (iPSCs). Similarly, dTF activator targeting a Nanog enhancer activates Nanog expression and reprograms epiblast stem cells (EpiSCs) to iPSCs. Conversely, dTF repressors targeting the same genetic elements inhibit expression of these loci, and effectively block reprogram- ming. This study indicates that dTFs targeting specific enhancers can be used to study other biological processes such as transdifferentia- tion or directed differentiation of stem cells. INTRODUCTION Proper gene expression is a central part of development and a key to cellular homeostasis. Transcription factors (TFs) control gene expression, and a subset of them are regarded as master regulators for lineage development and/or iden- tity maintenance (Spitz and Furlong, 2012). Master regula- tors often modulate gene expression through enhancers, which are important genetic elements that control the spatial and temporal expression of specific sets of genes (Levine, 2010). Epigenetic patterning of enhancers by the intricate interplay between DNA methylation, specific TFs binding, and histone modifications has been demonstrated to occur before cell-fate decisions (Spitz and Furlong, 2012). Therefore, we hypothesized that a more effective and physiologically relevant regulation of gene expression can be achieved by direct manipulation of specific enhancers. Transcriptional-activator-like effectors (TALEs) are natu- ral effector proteins secreted by plant pathogenic bacteria to modulate gene expression in host plants and to facilitate bacterial infection. TALEs contain a modular DNA binding domain consisting of highly similar tandem repeats of 33–35 amino acids. The specificity of nucleotide recogni- tion of each repeat is determined by two hypervariable amino acids at positions 12 and 13 (Boch et al., 2009; Cong et al., 2012; Moscou and Bogdanove, 2009; Streubel et al., 2012). The simple coding rule makes TALEs a unique tool to generate programmable effectors targeting a genomic region (Bogdanove and Voytas, 2011). TALE- based designer transcription activators (A-dTF) or repres- sors (R-dTF) have been constructed by linking TALEs to activation or repression domains, respectively. These dTFs target specific promoters based on the assumption that the close proximity of the dTFs to the transcription start site (TSS) would modulate transcription (Bultmann et al., 2012; Geissler et al., 2011; Morbitzer et al., 2010; Zhang et al., 2011). Attempts were made to use A-dTFs to activate endogenous pluripotency loci such as Sox2, Klf4, Oct4, and c-Myc (Bartsevich et al., 2003; Bultmann et al., 2012; Jua ´rez-Moreno et al., 2013; Zhang et al., 2011). For the Oct4 locus, these experiments achieved modest activation but failed to demonstrate any physiological impact in reprogramming or other cellular processes. In this study, we chose the Oct4 and Nanog loci to investigate whether dTFs could regulate gene expression via their specific enhancers and whether the activation or repression could impact reprogramming to induced pluripotent stem cells (iPSCs) or affect embryonic stem (ES) cell differentiation. We report here that direct regulation of the endogenous pluripotency loci by dTFs targeting enhancers enables reprogramming of mouse embryonic fibroblast cells (MEFs)or epiblast stem cells (EpiSCs) to iPSCs in the absence of exogenous repro- gramming factors OCT4 or NANOG. Therefore, dTFs targeting enhancers of genomic loci encoding key regula- tors can provide an effective approach for reprogramming to pluripotency and potentially for other applications such as transdifferentiation and directed differentiation of stem cells. Stem Cell Reports j Vol. 1 j 183–197 j August 6, 2013 j ª2013 The Authors 183

Welcome message from author
This document is posted to help you gain knowledge. Please leave a comment to let me know what you think about it! Share it to your friends and learn new things together.
Transcript
Stem Cell Reports
ArticleReprogramming to Pluripotency Using Designer TALE Transcription FactorsTargeting Enhancers
Xuefei Gao,1 Jian Yang,1 Jason C.H. Tsang,1 Jolene Ooi,1 Donghai Wu,2 and Pentao Liu1,*1Wellcome Trust Sanger Institute, Hinxton, Cambridge CB10 1HH, UK2Key Laboratory of Regenerative Biology, Guangzhou Institute of Biomedicine and Health, Chinese Academy of Sciences, Guangzhou 510530, China
*Correspondence: [email protected]
http://dx.doi.org/10.1016/j.stemcr.2013.06.002
This is an open-access article distributed under the terms of the Creative Commons Attribution License, which permits unrestricted use, distribution,
and reproduction in any medium, provided the original author and source are credited.
SUMMARY
The modular DNA recognition code of the transcription-activator-like effectors (TALEs) from plant pathogenic bacterial genus
Xanthomonas provides a powerful genetic tool to create designer transcription factors (dTFs) targeting specific DNA sequences for
manipulating gene expression. Previous studies have suggested critical roles of enhancers in gene regulation and reprogramming.
Here, we report dTF activator targeting the distal enhancer of the Pou5f1 (Oct4) locus induces epigenetic changes, reactivates its expres-
sion, and substitutes exogenous OCT4 in reprogramming mouse embryonic fibroblast cells (MEFs) to induced pluripotent stem cells
(iPSCs). Similarly, dTF activator targeting a Nanog enhancer activates Nanog expression and reprograms epiblast stem cells (EpiSCs) to
iPSCs. Conversely, dTF repressors targeting the same genetic elements inhibit expression of these loci, and effectively block reprogram-
ming. This study indicates that dTFs targeting specific enhancers can be used to study other biological processes such as transdifferentia-
tion or directed differentiation of stem cells.
INTRODUCTION
Proper gene expression is a central part of development and
a key to cellular homeostasis. Transcription factors (TFs)
control gene expression, and a subset of them are regarded
as master regulators for lineage development and/or iden-
tity maintenance (Spitz and Furlong, 2012). Master regula-
tors often modulate gene expression through enhancers,
which are important genetic elements that control the
spatial and temporal expression of specific sets of genes
(Levine, 2010). Epigenetic patterning of enhancers by the
intricate interplay between DNA methylation, specific TFs
binding, and histonemodifications has been demonstrated
to occur before cell-fate decisions (Spitz and Furlong,
2012). Therefore, we hypothesized that a more effective
and physiologically relevant regulation of gene expression
can be achieved by direct manipulation of specific
enhancers.
Transcriptional-activator-like effectors (TALEs) are natu-
ral effector proteins secreted by plant pathogenic bacteria
tomodulate gene expression in host plants and to facilitate
bacterial infection. TALEs contain a modular DNA binding
domain consisting of highly similar tandem repeats of
33–35 amino acids. The specificity of nucleotide recogni-
tion of each repeat is determined by two hypervariable
amino acids at positions 12 and 13 (Boch et al., 2009;
Cong et al., 2012; Moscou and Bogdanove, 2009; Streubel
et al., 2012). The simple coding rule makes TALEs a unique
tool to generate programmable effectors targeting a
genomic region (Bogdanove and Voytas, 2011). TALE-
Stem C
based designer transcription activators (A-dTF) or repres-
sors (R-dTF) have been constructed by linking TALEs to
activation or repression domains, respectively. These dTFs
target specific promoters based on the assumption that
the close proximity of the dTFs to the transcription start
site (TSS) would modulate transcription (Bultmann et al.,
2012; Geissler et al., 2011; Morbitzer et al., 2010; Zhang
et al., 2011). Attempts were made to use A-dTFs to activate
endogenous pluripotency loci such as Sox2, Klf4, Oct4, and
c-Myc (Bartsevich et al., 2003; Bultmann et al., 2012;
Juarez-Moreno et al., 2013; Zhang et al., 2011). For the
Oct4 locus, these experiments achieved modest activation
but failed to demonstrate any physiological impact in
reprogramming or other cellular processes.
In this study, we chose the Oct4 and Nanog loci to
investigate whether dTFs could regulate gene expression
via their specific enhancers and whether the activation
or repression could impact reprogramming to induced
pluripotent stem cells (iPSCs) or affect embryonic stem
(ES) cell differentiation. We report here that direct
regulation of the endogenous pluripotency loci by dTFs
targeting enhancers enables reprogramming of mouse
embryonic fibroblast cells (MEFs)or epiblast stem cells
(EpiSCs) to iPSCs in the absence of exogenous repro-
gramming factors OCT4 or NANOG. Therefore, dTFs
targeting enhancers of genomic loci encoding key regula-
tors can provide an effective approach for reprogramming
to pluripotency and potentially for other applications
such as transdifferentiation and directed differentiation
of stem cells.
ell Reports j Vol. 1 j 183–197 j August 6, 2013 j ª2013 The Authors 183

A
B
C D
E F
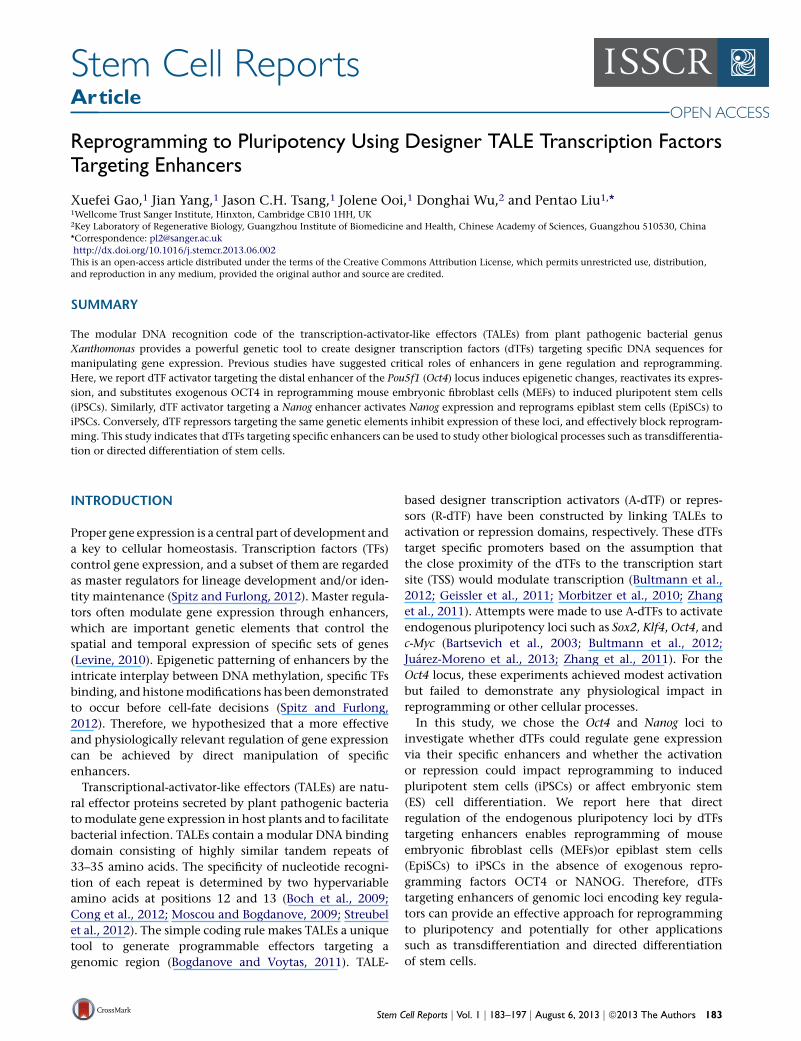
Figure 1. Reactivation of the Oct4 Locusby dTFs(A) The schematic diagram of TALE proteinsand their binding sites at the Oct4 distalenhancer (DE). Color code for the aminoacid positions 12 and 13 in a TALE repeatand the corresponding nucleotide in DNA:black NI for A, blue NG for T, red HD for C,and green NN for G. TALE proteins OD2, OD3,and OD4 bind inside the DE region, whereasOD1 and OD5 bind outside the DE.(B) Cloning of TALE protein coding DNA ordTFs into the PB vector. For ChIP analysistesting binding of TALEs to their targetsequences, 3 3 HA tag was added at the Cterminus of TALE proteins (upper panel). Foractivator dTFs (A-dTFs), the VP64 was added(lower panel). In all cases, mCherry wascoexpressed with TALE proteins or dTFs viathe T2A.N andC are theN andC termini of theTALE protein. CAG: the CAGpromoter. PB-5TRand PB-3TR are the two ends of the PBtransposon. NLS, nuclear localization signal.(C) Validation of TALE binding to the Oct4locus in ChIP assay using an antibody to HAtag followed by qPCR amplifying the corre-sponding genomic DNAs. IgG was used asthe control.(D) Luciferase assays to measure dTF activ-ities. The 2.4 kb-Luc reporter has the DE, PE,and PP of the Oct4 locus, whereas the DDEconstruct lacks the DE.(E) qRT-PCR analysis of Oct4 mRNA levels inMEFs expressing the activator dTFs (A-dTFs)alone or plus CKS. All gene expression valuesare normalized to the expression of Gapdh.(F) Comparison of three dTFs, OD3, OD3-25,and OD3-37, on DNA binding, luciferaseactivities, and Oct4 mRNA levels induced bythem in MEFs.Results are representative of three inde-pendent experiments and are mean± SD, n =3. *p < 0.01. See also Figure S1 and Table S1.
Stem Cell ReportsDesigner Transcription Factors Reprograms Cells
RESULTS
A-dTFs Targeting theOct4Distal Enhancer Activate the
Locus
We chose themouseOct4 locus to test functionality of dTFs
because it is an essential pluripotency factor (Nichols et al.,
1998), and reactivation of the locus is a critical step in
reprogramming of somatic cells to iPSCs (Polo et al.,
2012; Takahashi and Yamanaka, 2006). Specific genetic
elements are shown to regulate proper Oct4 expression in
stem cells of distinct pluripotent states (Bao et al., 2009;
Minucci et al., 1996; Okazawa et al., 1991; Yeom et al.,
184 Stem Cell Reports j Vol. 1 j 183–197 j August 6, 2013 j ª2013 The Auth
1996), namely, the distal enhancer (DE) in murine ES cells
and germ cells, the proximal enhancer (PE) in EpiSCs, and
the proximal promoter (PP). Because the DE is active specif-
ically in ES cells, we constructed five dTFs to target five
19 bp sequences (OD1–OD5) inside or outside the DE (Fig-
ure 1A; Table S1 available online). OD3 is on the 50 side of
the multiple transcription factor binding sites of STAT3,
TCF3, OCT4, SOX2, and NANOG in the DE (Chen et al.,
2008; Young, 2011) (Figure 1A). We also targeted four
19 bp sequences (PP1–PP4) in the Oct4 promoter as con-
trols (Figure S1A). The TALE DNA binding domains were
constructed using a modified Golden Gate cloning system
ors
Stem Cell ReportsDesigner Transcription Factors Reprograms Cells
(Sanjana et al., 2012) (Figure S1B). We next evaluated the
DNA-binding property of these TALE proteins. To provide
quantitation of binding, we fused 3 3 hemagglutinin
(HA) tags with the C terminus of each TALEs (Figure 1B,
upper panel). Chromatin immunoprecipitation (ChIP)
quantitative real-time PCR analysis of ES cells after expres-
sion of the HA-tagged TALEs for 2 days showed all nine
TALE proteins bound their intended sequences as indicated
by the 7- to 12-fold enrichment compared to the immuno-
globulin (Ig) G control (Figure 1C).
We next investigated the ability of A-dTFs to activate the
Oct4 locus. To make A-dTFs, we fused VP64 (Beerli et al.,
1998) to the C terminus of the TALE proteins in a piggyBac
delivery vector (Wang et al., 2008). The fusion protein is
linked to mCherry by T2A peptide for convenient tracking
of TALE protein expression (Figure 1B, lower panel). We
first examined the ability of A-dTFs to activate Oct4 expres-
sion in luciferase assay. MEFs were cotransfected with vec-
tors expressing dTFs and a luciferase construct containing
the 2.4 kb region covering all three upstream regulatory
elements of the Oct4 locus (Figure S1A). Two days after
transfection, three A-dTFs targeting the DE (A-OD2,
A-OD3, and A-OD4) and three A-dTFs targeting the pro-
moter (A-PP1–A-PP3) substantially enhanced luciferase
activities compared to the control construct (Figures 1D
and S1C). Once the DE was deleted in the luciferase re-
porter (DDE in Figure S1A), none of the A-dTFs targeting
the DE was able to activate the luciferase reporter indi-
cating specificity of A-dTFs for the DE (Figure 1D). On the
contrary, A-PP1, A-PP2, and A-PP3 still activated the re-
porter carrying only theOct4 promoter region (Figure S1C).
Consistent with the luciferase assay, expression of A-OD2,
A-OD3, and A-OD4 in MEFs for 48 hr increased the Oct4
mRNA by 3- to 4-fold measured by quantitative RT-PCR
(qRT-PCR) (Figure 1E), whereas all four dTFs targeting the
promoter achieved lower mRNA levels, in contrast to the
luciferase assay (Figure S1D). The Oct4 locus is silenced in
MEFs through repressor complexes, chromatin modifica-
tions, and DNA methylation. Three of the four transcrip-
tion factors for reprogramming somatic cells to iPSCs,
C-MYC, KLF4, and SOX2, are suggested to have roles in
chromatin remodeling or bind the DE of the Oct4 locus
(Yamanaka, 2008; Young, 2011). Coexpressing A-OD2/3/4
with C-MYC, KLF4, and SOX2 (CKS) in MEFs for 48 hr
caused 10- to 20-fold increase of Oct4 mRNA with A-OD3
being the most potent (Figure 1E), indicating a synergistic
interaction of dTFs with these transcription factors. In
contrast, coexpressing A-PP1–A-PP4 with CKS failed to sub-
stantially increase Oct4 mRNA levels (Figure S1D), high-
lighting the significance of targeting the enhancer, rather
than the promoter, in regulating gene expression by dTFs.
In an attempt to further improve the potency of A-OD3,
we made two new dTFs (A-OD3-25 and A-OD-37) recog-
Stem C
nizing 25 and 37 bp sequences encompassing the sequence
bound by A-OD3 (Figure 1A and Table S1). A-OD3-25
showed the similar DNA binding ability and promoted
Oct4 mRNA expression and higher luciferase activities as
compared to A-OD3, whereas A-OD3-37 was not compe-
tent in both assays (Figure 1F), suggesting that excessive
peptide repeats may cause unnatural protein structure
because naturally found TALEs have around 20 peptide
repeats (Boch et al., 2009; Moscou and Bogdanove, 2009).
To exclude the possibility that expression of the endoge-
nous Oct4 in MEFs was due to general chromatin remodel-
ing in the Oct4 genomic region by the VP64 domain, we
examined expression of several neighboring genomic loci
on the mouse chromosome 17, including Tcf19, Cchcr1,
and H2Q-10 (Figure S1E), as well as Kcnk18, which has a
stretch of DNA sequence (ACCCTGCCCCTCC) that is
similar to the 19 bp region targeted by A-OD3 as shown
in Figure 1A. The expression of these four loci were not
substantially altered either by expression of A-OD3 alone
or in combination with CKS (Figure S1F).
Activation of theOct4 Locus by dTFs ReprogramsMEFs
to iPSCs in Concert with C-MYC, KLF4, and SOX2
We next explored whether the endogenous Oct4 activation
induced by dTFs has functional consequences and attemp-
ted reprogramming MEFs to iPSCs in the absence of
exogenous OCT4. The PB (piggyBac) vectors containing
doxcycline (Dox)-inducible dTFs and CKS were delivered
to Oct4-GFP reporter MEFs via the piggyBac transposition
(Figure S2A) (Wang et al., 2011). Expression of the reprog-
ramming factors was induced by adding Dox in the
medium (Figure 2A). PB transposition is efficient in
mammalian cells (Wang et al., 2011); approximately 4%
of MEFs survived electroporation and expressed the trans-
genes in the genome. As early as 5 days after transfection
and Dox induction, microscopic GFP+ colonies (also
mCherry+) were visually identifiable in the combination
of A-OD3 plus CKS or A-CKS (Figure 2B), whereas no GFP+
colonies were found in the control combination of exoge-
nous OCT4 plus CKS (or OCKS) or A-PPs plus CKS, until
day 11. We thus chose A-OD3 in the subsequent character-
ization of its function in reprogramming and in ES cells.
Despite the rapid reactivation of endogenous Oct4
expression, A-OD3 was not sufficient to substantially
enhance the reprogramming process compared to exoge-
nous OCT4 because the combination OCKS caught up in
terms of GFP+ colonies number at the late stage of reprog-
ramming. On day 13, there were on average 68 GFP+ col-
onies in A-CKS dish compared to 141 colonies in the
OCKS combination in three independent experiments
(Figure 2C), consistent with the notion that high exoge-
nous OCT4 levels facilitate late stages of reprogramming
(Carey et al., 2011). On the other hand, although none of
ell Reports j Vol. 1 j 183–197 j August 6, 2013 j ª2013 The Authors 185

A
B C D
E F
G H I
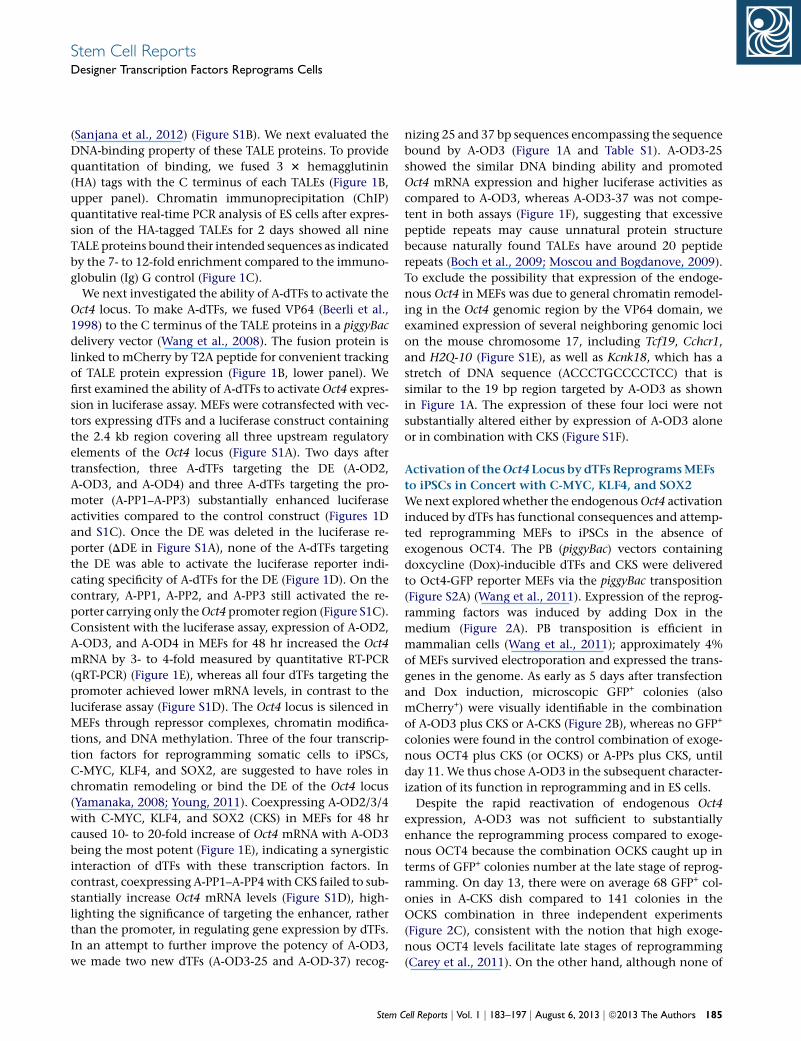
Figure 2. A-OD3 Replaces Exogenous OCT4 in Reprogramming Oct4-GFP MEFs to iPSCs(A) The time line for reprogramming MEFs to iPSCs using dTFs. MEFs under reprogramming were analyzed at several time points for variousassay. The iPSC colonies were scored and picked on day 23 or 25.(B) Activation of the endogenous Oct4 locus detected by GFP expression. mCherry+ cells were imaged on day 5 after transfection. Scale bar:200 mm.
(legend continued on next page)
186 Stem Cell Reports j Vol. 1 j 183–197 j August 6, 2013 j ª2013 The Authors
Stem Cell ReportsDesigner Transcription Factors Reprograms Cells
Stem Cell ReportsDesigner Transcription Factors Reprograms Cells
A-PPs in combination with CKS caused rapid Oct4 locus
reactivation, they eventually produced GFP+ colonies,
with a reprogramming pattern similar to OCKS but with
fewer colonies (Figure 2C; Table S2). The result suggested
that A-PPs were also capable of inducing endogenous
Oct4 reactivation in cooperation with CKS despite of a
slower kinetics, potentially due to lower OCT4 expression.
On day 5 and 11, 40% and 78% mCherry+ cells expressing
A-CKS became GFP+. Expression of the endogenous OCT4
was confirmed inmCherry+MEFs by immunostaining (Fig-
ure S2B). In contrast, noGFP+ cells were detected in cells ex-
pressing OCKS on day 5 and only 48% mCherry+ cells
became GFP+ on day 11 (Figure 2D).
To further investigate reactivation of the Oct4 locus by A-
OD3, the GFP+ cells fromOct4-GFPMEFs were harvested by
fluorescence-activated cell sorting (FACS) and analyzed as
soon as they appeared. In the day 5 GFP+ cells reprog-
rammed by A-CKS, the Oct4 promoter started to be deme-
thylated, but the locus was the only one activated among
several pluripotency loci examined include Nanog, Zfp42
(Rex1), and Dppa3 (Stella) (Figures 2E and 2F). On the other
hand, on day 11, GFP+ cells of both A-CKS and OCKS ex-
pressed low levels of key pluripotent genes besides the
endogenous Oct4 (Figure 2F). Moreover, DNA demethyla-
tion was detected in the promoters of both the Oct4 and
Nanog (Figure 2E). Therefore, rapid reactivation of the
Oct4 locus facilitated by A-OD3 represents a necessary yet
insufficient step in reprogramming. Additional epigenetic
barriers at other key pluripotency loci still need to be over-
come at the late stage of reprogramming (Plath and Lowry,
2011).
Nevertheless, reactivation of the endogenous Oct4 locus
by A-OD3 in MEFs under reprogramming marked the cells
thatwere destined to become iPSCs.Weflow-sorted cells ex-
pressing either A-CKS or OCKS (mCherry+) into three cell
populations, GFPhigh, GFPlow, and GFP�, on day 11. Cells
were collected, counted, and replated (600 cells) on feeder
cells to allow them to continue reprogramming (Figures
2A and 2G). qRT-PCR analysis confirmed the correlation
between GFP expression and the endogenous Oct4 mRNA
(C) Quantitation of GFP+ colonies from MEFs expressing dTFs targetinreprogramming.(D) mCherry+ cells were analyzed for GFP expression in flow cytometr(E and F) The GFP+ cells were harvested by flow sorting and analyzed foexpression. The percentages in (E) are the demethylated CpG in the p(G) The reprogramming potential of MEFs with a reactivated Oct4 lopopulations based on GFP intensity on day 11. Six hundreds cells offormation.(H) Endogenous Oct4 expression in the three cell populations measu(I) AP+ colony numbers from the replated cells scored on day 25.All gene expression levels are normalized to Gapdh. Results are represen*p < 0.01. yp < 0.05 A-CKS compared to OCKS. See also Figure S2 and
Stem C
level (Figure 2H). Interestingly, in cells expressing A-CKS,
the GFPhigh cells formed 53 AP+ colonies (70% of the total
colonies), and the rest (about 20 AP+ colonies) originated
fromGFPlow cells (Figure 2I). TheGFP� cells didnotproduce
any colonies. On the other hand, AP+ colonies were formed
from all the three cell populations expressing OCKS, with
48% (72) from GFPhigh, 45% (67) from GFPlow, and 7%
(10) fromGFP� cells (Figure 2I). These results demonstrated
that the levels of the endogenous Oct4 expression induced
by the dTF were more predictive for successful reprogram-
ming compared to expressing exogenous Oct4.
Endogenous Oct4 activation is a critical and major
limiting step in somatic cell reprogramming (Boiani et al.,
2002; Hochedlinger and Plath, 2009). To investigate
whether the reactivation of the endogenous Oct4 locus by
A-OD3 could enhance reprogramming of somatic cells by
the standard four Yamanaka factors OCKS, we cotrans-
fected Oct4-GFP reporter MEFs with Dox-inducible expres-
sion vectors of OCKS and A-OD3 (A-OCKS). Coexpression
of these factors produced GFP+ cells as early as 3 days after
Dox induction (Figure S2C), indicating an even faster reac-
tivation of the Oct4 locus comparing to A-CKS. Addition-
ally, A-OCKS also producedmore AP+ colonies (Figure S2D).
Rex1 is expressed in mouse ES cells but not in EpiSCs and
represents a better marker for ground-state pluripotency or
for monitoring late stages of reprogramming (Brons et al.,
2007; Tesar et al., 2007; Toyooka et al., 2008). To further
demonstrate A-OD3’s function in reprogramming, we
repeated the experiments using the Rex1-GFP reporter
MEFs where the GFP-IRES-Puro cassette was inserted into
the Rex1 locus (Guo et al., 2011). iPSCs from these MEFs
would be both GFP+ and Puror. In contrast to the rapid re-
activation of the Oct4 locus in the aforementioned experi-
ments, A-CKS only slightly accelerated reactivation of the
Rex1 locus in the reporterMEFs, withGFP+ colonies appear-
ing on day 20 compared to day 22 for the OCKS control
(Figure 3A), again demonstrating that rapid reactivation
of the Oct4 locus alone by A-OD3 is an early event in re-
programming. Dox was subsequently withdrawn after
14 days to select for Dox- or exogenous-factor-independent
g the DE (A-OD3) or the promoter (A-PP1) at various time points of
y on days 5 and 11.r DNA demethylation in the Oct4 and Nanog promoters and for generomoters.cus. Oct4-GFP MEFs under reprogramming were sorted into threeeach population were replated into a 6-well plate to allow colony
red by qRT-PCR.
tatives of three independent experiments and are mean ± SD. n = 3.Tables S2, S3, and S4.
ell Reports j Vol. 1 j 183–197 j August 6, 2013 j ª2013 The Authors 187

A B C
D E
F
G
H
Figure 3. Characterization of iPSCs Reprogrammed by A-CKS(A) GFP+ colonies from Rex1-GFP MEFs by A-CKS or OCKS at several time points during reprogramming.(B and C) Reprogramming of Rex1-GFP MEFs using various combinations of A-OD3 and the Yamanaka factors. Dox-independent Puro+
colonies were scored 25 days after transfection.(D) Detection of leaky expression in iPSC lines reprogrammed using Dox-inducible A-CKS. Primers specific for the exogenous CKS or forA-OD3 were used in RT-PCR. The three lines shown have no detectable exogenous factor expression in the absence of Dox.(E) Immunostaining of iPSC colonies for NANOG and SSEA1. DNA was stained with propidium iodide. Scale bars: 200.0 mm.(F) qRT-PCR analysis of expression of several pluripotency genes in iPSC line #3 and #5 reprogrammed by A-CKS.(G) iPSCs reprogrammed by A-CKS are able to differentiate to cells of all three germ layers in vitro. Antibodies used are as follows: neuron-specific class III b-tubulin; SMA (smooth muscle a-actin) and AFP (a-fetoprotein). Scale bars: 200.0 mm.(H) Chimera mouse generated using iPSC line #3 expression of Gapdh was used as the control in RT-PCR.Results are representatives of three independent experiments and are mean ± SD. n = 3. *p < 0.01. yp < 0.05 A-CKS compared to OCKS. Seealso Figure S3 and Tables S3 and S4.
188 Stem Cell Reports j Vol. 1 j 183–197 j August 6, 2013 j ª2013 The Authors
Stem Cell ReportsDesigner Transcription Factors Reprograms Cells
A
B C
D E
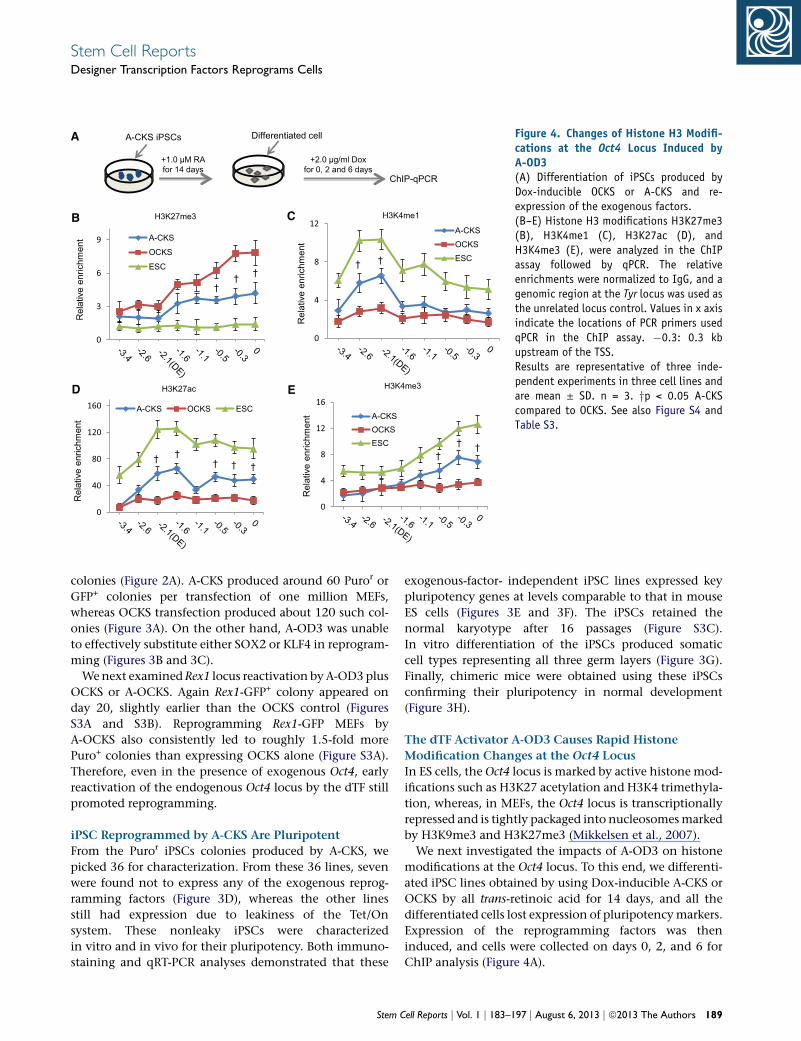
Figure 4. Changes of Histone H3 Modifi-cations at the Oct4 Locus Induced byA-OD3(A) Differentiation of iPSCs produced byDox-inducible OCKS or A-CKS and re-expression of the exogenous factors.(B–E) Histone H3 modifications H3K27me3(B), H3K4me1 (C), H3K27ac (D), andH3K4me3 (E), were analyzed in the ChIPassay followed by qPCR. The relativeenrichments were normalized to IgG, and agenomic region at the Tyr locus was used asthe unrelated locus control. Values in x axisindicate the locations of PCR primers usedqPCR in the ChIP assay. �0.3: 0.3 kbupstream of the TSS.Results are representative of three inde-pendent experiments in three cell lines andare mean ± SD. n = 3. yp < 0.05 A-CKScompared to OCKS. See also Figure S4 andTable S3.
Stem Cell ReportsDesigner Transcription Factors Reprograms Cells
colonies (Figure 2A). A-CKS produced around 60 Puror or
GFP+ colonies per transfection of one million MEFs,
whereas OCKS transfection produced about 120 such col-
onies (Figure 3A). On the other hand, A-OD3 was unable
to effectively substitute either SOX2 or KLF4 in reprogram-
ming (Figures 3B and 3C).
Wenext examined Rex1 locus reactivation byA-OD3 plus
OCKS or A-OCKS. Again Rex1-GFP+ colony appeared on
day 20, slightly earlier than the OCKS control (Figures
S3A and S3B). Reprogramming Rex1-GFP MEFs by
A-OCKS also consistently led to roughly 1.5-fold more
Puro+ colonies than expressing OCKS alone (Figure S3A).
Therefore, even in the presence of exogenous Oct4, early
reactivation of the endogenous Oct4 locus by the dTF still
promoted reprogramming.
iPSC Reprogrammed by A-CKS Are Pluripotent
From the Puror iPSCs colonies produced by A-CKS, we
picked 36 for characterization. From these 36 lines, seven
were found not to express any of the exogenous reprog-
ramming factors (Figure 3D), whereas the other lines
still had expression due to leakiness of the Tet/On
system. These nonleaky iPSCs were characterized
in vitro and in vivo for their pluripotency. Both immuno-
staining and qRT-PCR analyses demonstrated that these
Stem C
exogenous-factor- independent iPSC lines expressed key
pluripotency genes at levels comparable to that in mouse
ES cells (Figures 3E and 3F). The iPSCs retained the
normal karyotype after 16 passages (Figure S3C).
In vitro differentiation of the iPSCs produced somatic
cell types representing all three germ layers (Figure 3G).
Finally, chimeric mice were obtained using these iPSCs
confirming their pluripotency in normal development
(Figure 3H).
The dTF Activator A-OD3 Causes Rapid Histone
Modification Changes at the Oct4 Locus
In ES cells, the Oct4 locus is marked by active histone mod-
ifications such as H3K27 acetylation and H3K4 trimethyla-
tion, whereas, in MEFs, the Oct4 locus is transcriptionally
repressed and is tightly packaged into nucleosomesmarked
by H3K9me3 and H3K27me3 (Mikkelsen et al., 2007).
We next investigated the impacts of A-OD3 on histone
modifications at the Oct4 locus. To this end, we differenti-
ated iPSC lines obtained by using Dox-inducible A-CKS or
OCKS by all trans-retinoic acid for 14 days, and all the
differentiated cells lost expression of pluripotencymarkers.
Expression of the reprogramming factors was then
induced, and cells were collected on days 0, 2, and 6 for
ChIP analysis (Figure 4A).
ell Reports j Vol. 1 j 183–197 j August 6, 2013 j ª2013 The Authors 189
A B
C D
E
F G
(legend on next page)
190 Stem Cell Reports j Vol. 1 j 183–197 j August 6, 2013 j ª2013 The Authors
Stem Cell ReportsDesigner Transcription Factors Reprograms Cells
Stem Cell ReportsDesigner Transcription Factors Reprograms Cells
Many putative enhancer elements have been mapped in
the genomes by their association with specific histone
modifications (Ong and Corces, 2011). We examined
H3K4me1, H3K4me3, H3K27me3, and H3K27ac at eight
specific sites in the 3.4 kb region upstream of theOct4 locus
TSS by ChIP assay. This genomic region encompasses the
DE, PE, and PP. Compared to the OCKS, expression of
A-CKS rapidly reduced H3K27me3 levels (Figure 4B)
concomitant with increased levels of the active markers
H3K4me1 (Figure 4C), H3K27ac (Figure 4D), and
H3K4me3 (Figure 4E), as early as 2 days after Dox induc-
tion. In contrast, OCKS only induced similar changes six
days after Dox induction (Figures S4A–S4D).
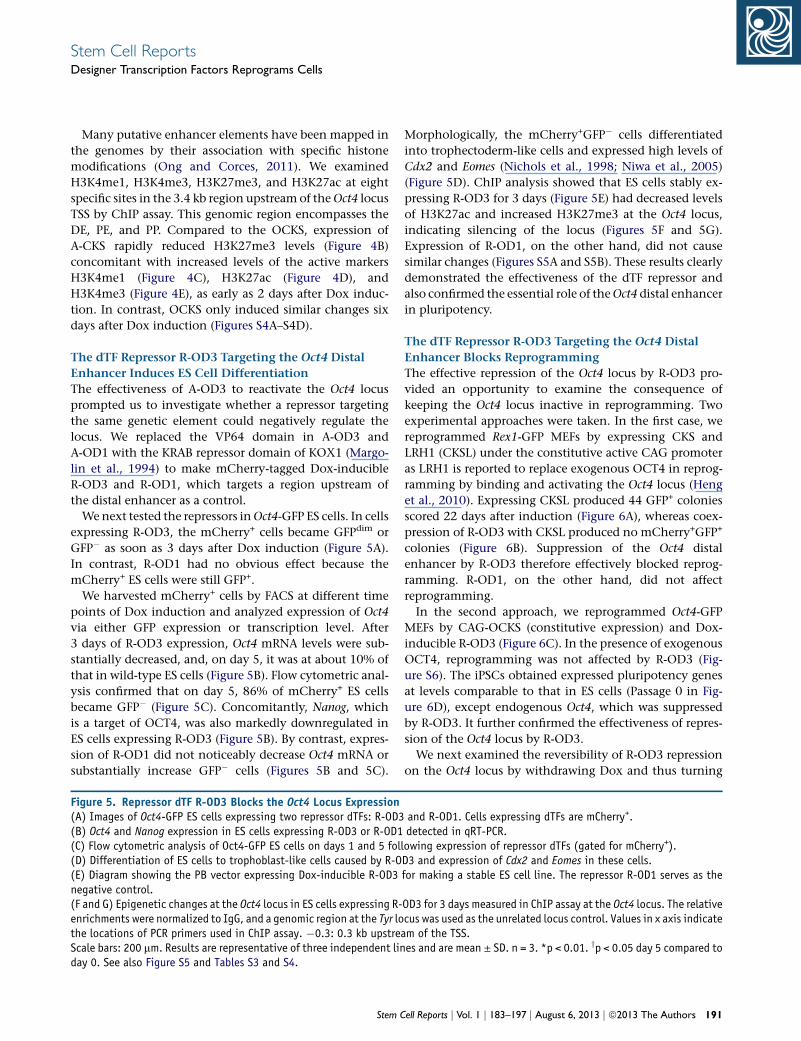
The dTF Repressor R-OD3 Targeting the Oct4 Distal
Enhancer Induces ES Cell Differentiation
The effectiveness of A-OD3 to reactivate the Oct4 locus
prompted us to investigate whether a repressor targeting
the same genetic element could negatively regulate the
locus. We replaced the VP64 domain in A-OD3 and
A-OD1 with the KRAB repressor domain of KOX1 (Margo-
lin et al., 1994) to make mCherry-tagged Dox-inducible
R-OD3 and R-OD1, which targets a region upstream of
the distal enhancer as a control.
We next tested the repressors inOct4-GFP ES cells. In cells
expressing R-OD3, the mCherry+ cells became GFPdim or
GFP� as soon as 3 days after Dox induction (Figure 5A).
In contrast, R-OD1 had no obvious effect because the
mCherry+ ES cells were still GFP+.
We harvested mCherry+ cells by FACS at different time
points of Dox induction and analyzed expression of Oct4
via either GFP expression or transcription level. After
3 days of R-OD3 expression, Oct4 mRNA levels were sub-
stantially decreased, and, on day 5, it was at about 10% of
that in wild-type ES cells (Figure 5B). Flow cytometric anal-
ysis confirmed that on day 5, 86% of mCherry+ ES cells
became GFP� (Figure 5C). Concomitantly, Nanog, which
is a target of OCT4, was also markedly downregulated in
ES cells expressing R-OD3 (Figure 5B). By contrast, expres-
sion of R-OD1 did not noticeably decrease Oct4 mRNA or
substantially increase GFP� cells (Figures 5B and 5C).
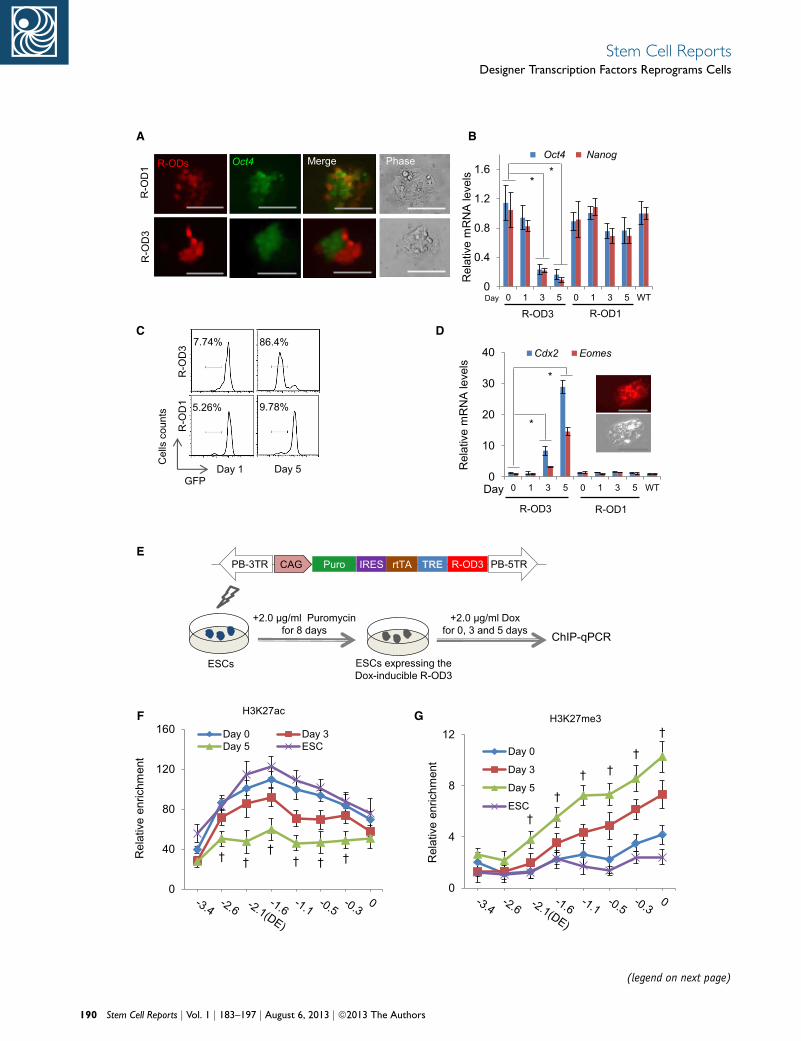
Figure 5. Repressor dTF R-OD3 Blocks the Oct4 Locus Expression(A) Images of Oct4-GFP ES cells expressing two repressor dTFs: R-OD3(B) Oct4 and Nanog expression in ES cells expressing R-OD3 or R-OD1(C) Flow cytometric analysis of Oct4-GFP ES cells on days 1 and 5 fol(D) Differentiation of ES cells to trophoblast-like cells caused by R-O(E) Diagram showing the PB vector expressing Dox-inducible R-OD3negative control.(F and G) Epigenetic changes at the Oct4 locus in ES cells expressing R-enrichments were normalized to IgG, and a genomic region at the Tyr lothe locations of PCR primers used in ChIP assay. �0.3: 0.3 kb upstreScale bars: 200 mm. Results are representative of three independent linday 0. See also Figure S5 and Tables S3 and S4.
Stem C
Morphologically, the mCherry+GFP� cells differentiated
into trophectoderm-like cells and expressed high levels of
Cdx2 and Eomes (Nichols et al., 1998; Niwa et al., 2005)
(Figure 5D). ChIP analysis showed that ES cells stably ex-
pressing R-OD3 for 3 days (Figure 5E) had decreased levels
of H3K27ac and increased H3K27me3 at the Oct4 locus,
indicating silencing of the locus (Figures 5F and 5G).
Expression of R-OD1, on the other hand, did not cause
similar changes (Figures S5A and S5B). These results clearly
demonstrated the effectiveness of the dTF repressor and
also confirmed the essential role of theOct4 distal enhancer
in pluripotency.
The dTF Repressor R-OD3 Targeting the Oct4 Distal
Enhancer Blocks Reprogramming
The effective repression of the Oct4 locus by R-OD3 pro-
vided an opportunity to examine the consequence of
keeping the Oct4 locus inactive in reprogramming. Two
experimental approaches were taken. In the first case, we
reprogrammed Rex1-GFP MEFs by expressing CKS and
LRH1 (CKSL) under the constitutive active CAG promoter
as LRH1 is reported to replace exogenous OCT4 in reprog-
ramming by binding and activating the Oct4 locus (Heng
et al., 2010). Expressing CKSL produced 44 GFP+ colonies
scored 22 days after induction (Figure 6A), whereas coex-
pression of R-OD3 with CKSL produced no mCherry+GFP+
colonies (Figure 6B). Suppression of the Oct4 distal
enhancer by R-OD3 therefore effectively blocked reprog-
ramming. R-OD1, on the other hand, did not affect
reprogramming.
In the second approach, we reprogrammed Oct4-GFP
MEFs by CAG-OCKS (constitutive expression) and Dox-
inducible R-OD3 (Figure 6C). In the presence of exogenous
OCT4, reprogramming was not affected by R-OD3 (Fig-
ure S6). The iPSCs obtained expressed pluripotency genes
at levels comparable to that in ES cells (Passage 0 in Fig-
ure 6D), except endogenous Oct4, which was suppressed
by R-OD3. It further confirmed the effectiveness of repres-
sion of the Oct4 locus by R-OD3.
We next examined the reversibility of R-OD3 repression
on the Oct4 locus by withdrawing Dox and thus turning
and R-OD1. Cells expressing dTFs are mCherry+.detected in qRT-PCR.lowing expression of repressor dTFs (gated for mCherry+).D3 and expression of Cdx2 and Eomes in these cells.for making a stable ES cell line. The repressor R-OD1 serves as the
OD3 for 3 days measured in ChIP assay at the Oct4 locus. The relativecus was used as the unrelated locus control. Values in x axis indicateam of the TSS.es and are mean ± SD. n = 3. *p < 0.01. yp < 0.05 day 5 compared to
ell Reports j Vol. 1 j 183–197 j August 6, 2013 j ª2013 The Authors 191

CKSL/R-OD3
Phase Rex1 R-ODsCKSL/R-OD1
A
D
Oct4R-OD3 Phase P0
P3
E
B
C
0
20
40
60
GFP
+ co
lony
#
Rel
ativ
e m
RN
A le
vels
Passage0
0.5
1
1.5
2
2.5
0 1 2 3 ESC
Nanog Oct4 (endo) Zfp42
PB-3TR c-Myc PB-5TR2AOct4 Klf42A Sox22ACAG
PB-3TR PB-5TRR-OD3TRE
PB-3TR PB-5TRrt-TACAG
Oct4-GFP MEFsDay 0
Electroporation
Day 23-25
+Dox
Passaging initially in Dox medium
Picking mCherry+ colonies
*
**
*
Figure 6. R-OD3 Suppresses the Oct4Locus and Blocks Reprogramming(A) Reprogramming of Rex1-GFP MEFs toiPSCs by CKS plus LRH1 (CKSL) in the pres-ence of repressor dTF R-OD3 or R-OD1.(B) The small number of coloniesreprogrammed by CKSL in the presence ofR-OD3 (mCherry+) were all GFP�, indicatingblocking of reprogramming.(C) Reprogramming of Oct4-GFP MEFs usingCAG-OCKS and Dox-inducible R-ODs.mCherry+ iPSC colonies were picked andexpanded in the presence of Dox.(D) Analysis of expression of endogenousOct4, Nanog, and Zfp42 (Rex1) in iPSCs re-programmed in (C) in either the presence(passage 0) or absence of Dox (passages1–3). Expression in ES cells was used as thecontrol.(E) Reactivation of the Oct4 locus moni-tored by GFP expression in iPSCs obtained in(C) once Dox was withdrawn. iPSCs becamemCherry� and GFP+ within three passages.All gene expression values are normalized tothe expression of Gapdh. Scale bars:200 mm. Results are representative of threeindependent experiments and are mean ±SD. n = 3. *p < 0.01. See also Figure S6 andTable S4.
Stem Cell ReportsDesigner Transcription Factors Reprograms Cells
off R-OD3 expression in iPSCs obtained above. The endog-
enousOct4mRNA gradually reached 30% of that in ES cells
at passage 2 and reached similar levels at passage 3 (Fig-
ure 6D) as the cells switched from mCherry+/GFP� to
mCherry�/GFP+ (Figure 6E). However, it should be noted
that the continuous expression of exogenous factors in
these iPSCs could influence the repression reversibility in
this experiment.
Regulation of theNanog Locus by dTFs Targeting the 5
kb Enhancer
We next extended our findings of enhancer regulation by
dTFs to the Nanog locus. Studies of Nanog expression regu-
lation have revealed an enhancer located at approximately
5.0 kb upstream of its TSS, which is a DNase I-hypersensi-
192 Stem Cell Reports j Vol. 1 j 183–197 j August 6, 2013 j ª2013 The Auth
tive site and bound by OCT4, NANOG, SOX2, and
ZFP281 (Levasseur et al., 2008; Loh et al., 2006). We first
made three A-dTFs (A-ND1, A-ND2, and A–ND3) targeting
the respective 19 bp sequences inside or outside the 5 kb
enhancer region (Figure S7A; Table S1). Luciferase assay in
MEFs showed that A-ND2 could increase luciferase activ-
ities by more than 3-fold compared to the control
(Figure S7B).
EpiSCs are pluripotent cells established from developing
epiblasts and express lower levels of NANOG (Guo et al.,
2009; Silva et al., 2009). Exogenous Nanog transgene repro-
grams EpiSCs to naive iPSCs (Silva et al., 2009). To examine
whether A-NDs were able to increase Nanog expression in
EpiSCs and perhaps also to reprogram EpiSCs to iPSC, we
transfected EpiSCs by lipofection with a PB construct
ors
A
B
D
G
C
E F
H I
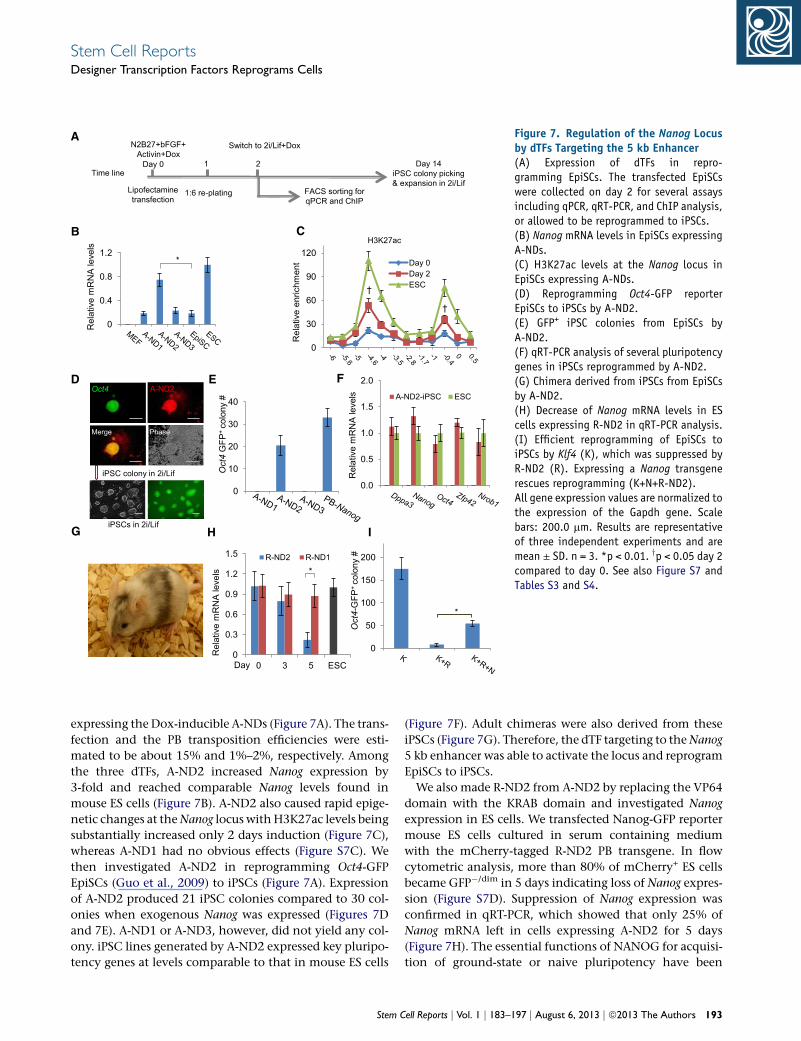
Figure 7. Regulation of the Nanog Locusby dTFs Targeting the 5 kb Enhancer(A) Expression of dTFs in repro-gramming EpiSCs. The transfected EpiSCswere collected on day 2 for several assaysincluding qPCR, qRT-PCR, and ChIP analysis,or allowed to be reprogrammed to iPSCs.(B) Nanog mRNA levels in EpiSCs expressingA-NDs.(C) H3K27ac levels at the Nanog locus inEpiSCs expressing A-NDs.(D) Reprogramming Oct4-GFP reporterEpiSCs to iPSCs by A-ND2.(E) GFP+ iPSC colonies from EpiSCs byA-ND2.(F) qRT-PCR analysis of several pluripotencygenes in iPSCs reprogrammed by A-ND2.(G) Chimera derived from iPSCs from EpiSCsby A-ND2.(H) Decrease of Nanog mRNA levels in EScells expressing R-ND2 in qRT-PCR analysis.(I) Efficient reprogramming of EpiSCs toiPSCs by Klf4 (K), which was suppressed byR-ND2 (R). Expressing a Nanog transgenerescues reprogramming (K+N+R-ND2).All gene expression values are normalized tothe expression of the Gapdh gene. Scalebars: 200.0 mm. Results are representativeof three independent experiments and aremean ± SD. n = 3. *p < 0.01. yp < 0.05 day 2compared to day 0. See also Figure S7 andTables S3 and S4.
Stem Cell ReportsDesigner Transcription Factors Reprograms Cells
expressing the Dox-inducible A-NDs (Figure 7A). The trans-
fection and the PB transposition efficiencies were esti-
mated to be about 15% and 1%–2%, respectively. Among
the three dTFs, A-ND2 increased Nanog expression by
3-fold and reached comparable Nanog levels found in
mouse ES cells (Figure 7B). A-ND2 also caused rapid epige-
netic changes at theNanog locus withH3K27ac levels being
substantially increased only 2 days induction (Figure 7C),
whereas A-ND1 had no obvious effects (Figure S7C). We
then investigated A-ND2 in reprogramming Oct4-GFP
EpiSCs (Guo et al., 2009) to iPSCs (Figure 7A). Expression
of A-ND2 produced 21 iPSC colonies compared to 30 col-
onies when exogenous Nanog was expressed (Figures 7D
and 7E). A-ND1 or A-ND3, however, did not yield any col-
ony. iPSC lines generated by A-ND2 expressed key pluripo-
tency genes at levels comparable to that in mouse ES cells
Stem C
(Figure 7F). Adult chimeras were also derived from these
iPSCs (Figure 7G). Therefore, the dTF targeting to theNanog
5 kb enhancer was able to activate the locus and reprogram
EpiSCs to iPSCs.
We also made R-ND2 from A-ND2 by replacing the VP64
domain with the KRAB domain and investigated Nanog
expression in ES cells. We transfected Nanog-GFP reporter
mouse ES cells cultured in serum containing medium
with the mCherry-tagged R-ND2 PB transgene. In flow
cytometric analysis, more than 80% of mCherry+ ES cells
became GFP�/dim in 5 days indicating loss of Nanog expres-
sion (Figure S7D). Suppression of Nanog expression was
confirmed in qRT-PCR, which showed that only 25% of
Nanog mRNA left in cells expressing A-ND2 for 5 days
(Figure 7H). The essential functions of NANOG for acquisi-
tion of ground-state or naive pluripotency have been
ell Reports j Vol. 1 j 183–197 j August 6, 2013 j ª2013 The Authors 193

Stem Cell ReportsDesigner Transcription Factors Reprograms Cells
demonstrated in Nanog-deficient ES cells (Silva et al., 2006,
2009). EpiSCs express little KLF4. Exogenous KLF4 repro-
grams EpiSCs to naive iPSCs (Guo et al., 2009).We re-exam-
ined the requirement of NANOG in KLF4-mediated EpiSCs
reprogramming to iPSCs using R-ND2.We introduced a PB-
CAG-Klf4 transgene to EpiSCs via the PB transposition,
which produced around 170 iPSC colonies scored on day
14 (Figure 7I). By contrast, if R-ND2 was coexpressed with
the Klf4 transgene (Klf4 plus R-ND2 or K+R), fewer than
ten colonies were obtained (Figure 7I), and none of them
were mCherry+GFP+. Repressing Nanog by R-ND2 in
KLF4-mediated EpiSC reprogrammingwas partially rescued
using a Nanog transgene (K+R+N) (Figure 7I), confirming
the essential function of NANOG in reprogramming
EpiSCs to iPSCs.
In summary, targeting the Nanog 5 kb enhancer by dTFs
also enabled manipulation of the endogenous locus for
reprogramming to pluripotency.
DISCUSSION
Regulation of gene expression is central in development
and in homeostasis and is achieved by both cis- and
trans-elements. Enhancers dictate the spatial and temporal
patterns of gene expression during development and can
drive progenitor cells to distinct cell fates. Recent studies
have shown that cell-fate decisions and lineage commit-
ment are regulated by epigenetic patterning at enhancers
(Ong and Corces, 2011). One of the best-characterized en-
hancers in ES cells is the distal enhancer of the Oct4 locus,
which controls Oct4 expression in ES cells and PGCs (Bao
et al., 2009; Minucci et al., 1996; Yeom et al., 1996) and
is marked by active histone modifications and bound by
multiple key pluripotency transcription factors (Chen
et al., 2008; Young, 2011). We decided to target the Oct4
distal enhancer as a proof of principle for dTFs to regulate
a key pluripotency locus. Previous attempts to activate the
Oct4 expression were focused on targeting dTFs to the pro-
moter, which only activated its expression in reporter
assays but not effectively in MEFs or other somatic cells
(Bultmann et al., 2012; Zhang et al., 2011), an observation
that we were able to reproduce in this study. In contrast,
A-OD3, which targets the region close to the binding sites
of OCT4, SOX2, and NANOG at the distal enhancer,
induces rapid histone modification changes and efficiently
reactivates the locus in MEFs. These results are consistent
with a recent study that, in reprogramming, OCT4,
SOX2, and KLF4 act as pioneer factors at enhancers of
genes that promote reprogramming (Soufi et al., 2012).
Indeed, A-OD3, working together with SOX2, KLF4, and
C-MYC, reprograms MEFs to bona fide iPSCs, bypassing
the need of exogenous OCT4. Furthermore, the rapid reac-
194 Stem Cell Reports j Vol. 1 j 183–197 j August 6, 2013 j ª2013 The Auth
tivation of endogenous OCT4 by A-OD3 enhances reprog-
ramming in the context of exogenous OCT4, SOX2, KLF4,
and C-MYC. Besides replacing exogenous OCT4, using
A-OD3 has helped reveal new insight in reprogramming.
Endogenous Oct4 reactivation is believed to be an essential
landmark and a bottleneck step for reacquisition of
pluripotency (Kim et al., 2009) and being the only
reprogramming factor recalcitrant to substitution by
a family member (Nakagawa et al., 2008). Yet, we show
here that early reactivation of the Oct4 locus alone by
dTFs is not sufficient to complete reprogramming.
Additional epigenetic changes in other pluripotency loci
are still required despite robust reactivation of endogenous
Oct4 in MEF cells.
We used the VP64 transactivation domain to generate
dTF activators. VP64 at theOct4 distal enhancer would pre-
sumably recruit and interact with histone acetyltransferase
p300 and transcriptional activation complexes (Ito et al.,
2000; Milbradt et al., 2011) and induce epigenetic changes
that facilitate binding of additional factors such as OCT4
itself at the distal enhancer. Replacing VP64 with the
KRAB domain in the dTFs produces repressor dTFs.
R-OD3 suppresses the Oct4 locus and induces ES cell differ-
entiation and blocks reprogramming. The repression by
R-OD3 could be reversed by coexpressing exogenous
OCT4, SOX2, KLF4, and C-MYC in iPSCs. In addition to
the Oct4 locus, a dTF targeting to the 5 kb Nanog enhancer
also allows efficient regulation of this locus. The activator
alone reprograms EpiSCs to iPSCs, whereas the repressor
suppresses Nanog expression and permits dissection of
NANOG requirements in reprogramming.
This proof-of-principle study demonstrates that target-
ing key regulatory elements such as enhancers of key
genes is an effective way to regulate their expression.
dTFs could mimic the complicated transcription regula-
tion by recruiting physiologically relevant factors to a
specific locus. Reprogramming somatic cells to iPSCs is
an inefficient process. Using dTFs rather than native tran-
scription factors could eventually prove to be an alterna-
tive or even more efficient reprogramming approach. It
can be envisioned that in the future a combination of
dTFs (activators and repressors) targeting loci encoding
master regulators could enable cellular transdifferentiation
or direct stem cells to a specific cell lineage as master reg-
ulators for a number of lineages have been extensively
studied. Two recent studies reported that one could
achieve tunable gene activation by combinations of dTFs
targeting the promoters (Maeder et al., 2013; Perez-Pinera
et al., 2013); a similar approach may also be feasible to
regulate enhancers.
With the advances of next-generation sequencing tech-
nologies, genome-wide mapping of regulatory elements
have identified thousands of enhancers and other elements
ors
Stem Cell ReportsDesigner Transcription Factors Reprograms Cells
(Shen et al., 2012). Functional validation of these
enhancers to investigate their roles in specific cell types
or developmental stages presents a challenge. Advances
in TALE cloning technologies now enable high-throughput
assembly of dTFs at low cost (Reyon et al., 2012). dTFs may
therefore provide a solution to functionally dissect the
newly identified enhancers, including the recently
reported ‘‘super-enhancers’’ (Whyte et al., 2013), in vitro
or in vivo.
EXPERIMENTAL PROCEDURES
MiceHousing and breeding of mice and experimental procedures using
mice were according to the UK 1986 Animals Scientific Procedure
Act and local institute ethics committee regulations.
Mouse ES and iPSC CultureMouse ES cells and iPSCs were normally cultured in M15medium:
knockout DMEM, 15% FBS (HyClone), 1 3 glutamine-penicillin-
streptomycin (Invitrogen), 1 3 Nonessential Amino Acids
(NEAA; Invitrogen), 0.1 mM b-mercaptoethanol (b-ME; Sigma),
and 106 U/ml LIF (Millipore). We also cultured iPSCs in the chem-
ically defined medium N2B27/2i/LIF.
Transfection of MEFs and Reprogramming to iPSCsMEFswere prepared from13.5 day postcoitummouse embryos and
were cultured in M10 (knockout DMEM plus 10% of fetal calf
serum). MEFs were transfected by Amaxa Nucleofector (Lonza)
program A-023 and were seeded on STO feeder cells for
reprogramming.
EpiSC Culture and ReprogrammingEstablished Oct4-GFP reporter EpiSCs (Guo et al., 2009) were
cultured in N2B27/Activin/bFGF at the density of 6 3 105 cells
per well in a 6-well plate coated with human fibronectin for
Lipofectamine 2000 (Invitrogen) transfection. Twenty-four hours
after transfection, EpiSCs were split at 1:6 in 6-well plate and
cultured in EpiSC culture medium containing Dox (2 mg/ml) for
1 day before the culture medium was changed to N2B27/2i/LIF
and Dox (2 mg/ml). The medium was changed every 2 days. The
GFP+ iPSC colonies were counted on day 14 posttransfection.
Transfection and PB transposition efficiencies were calculated
similar to in MEFs.
ChIP AnalysisIgG and antibodies for theHA tag, H3K4me3, H3K4me1,H3K27ac,
and H3K27me3 were used for ChIP analysis.
Statistical AnalysisStatistical significance was determined using a Student’s t test with
two-tailed distribution. p values < 0.05 were considered as signifi-
cant. Data are shown as mean ± SD.
Supplemental Information and Tables S1–S5 include further
details of materials and methods.
Stem C
SUPPLEMENTAL INFORMATION
Supplemental Information includes Supplemental Experimental
Procedures, seven figures, and five tables and can be found
with this article online at http://dx.doi.org/10.1016/j.stemcr.
2013.06.002.
ACKNOWLEDGMENTS
We thank the Sanger Institute RSF (James Bussell, Andrea Kirton,
Michael Robinson, Robert Ellis, Sophie Jolley, andMarie Hitcham),
Cytogenetic core (Fengtang Yang and Beiyun Fu), flow cytometry
core facility (Bee-Ling Ng and William Cheng), Rebecka Kiff for
technical assistance, Dr. Feng Zhang (Broad Institute of MIT and
Harvard) for providing TALE repeat plasmids, and Professor Austin
Smith, Dr. Jennifer Nichols, and Dr. Ge Guo for Oct4-GFP EpiSCs
and Nanog-GFP ES cells. Dr. David Ryan critically read the manu-
script. This work is supported by Wellcome Trust (grant number
098051). X.G. designed and didmost of the experiments, analyzed
and interpreted data, made all figures, and contributed to the
writing of the manuscript; J.Y., J.T., J.O., and D.W. (supported by
National Basic Research Program of China 2010CB945500 and
the Strategic Exploration Grant of Stem Cells XDA01020303) did
experiments, provided reagents, or provided intellectual input;
and P.L. designed the experiments, supervised the research, and
wrote the manuscript.
Received: March 23, 2013
Revised: June 4, 2013
Accepted: June 5, 2013
Published: July 11, 2013
REFERENCES
Bao, S., Tang, F., Li, X., Hayashi, K., Gillich, A., Lao, K., and Surani,
M.A. (2009). Epigenetic reversion of post-implantation epiblast to
pluripotent embryonic stem cells. Nature 461, 1292–1295.
Bartsevich, V.V., Miller, J.C., Case, C.C., and Pabo, C.O. (2003).
Engineered zinc finger proteins for controlling stem cell fate.
Stem Cells 21, 632–637.
Beerli, R.R., Segal, D.J., Dreier, B., and Barbas, C.F., 3rd. (1998).
Toward controlling gene expression at will: specific regulation of
the erbB-2/HER-2 promoter by using polydactyl zinc finger pro-
teins constructed from modular building blocks. Proc. Natl.
Acad. Sci. USA 95, 14628–14633.
Boch, J., Scholze, H., Schornack, S., Landgraf, A., Hahn, S., Kay, S.,
Lahaye, T., Nickstadt, A., and Bonas, U. (2009). Breaking the code
of DNA binding specificity of TAL-type III effectors. Science 326,
1509–1512.
Bogdanove, A.J., and Voytas, D.F. (2011). TAL effectors: customiz-
able proteins for DNA targeting. Science 333, 1843–1846.
Boiani, M., Eckardt, S., Scholer, H.R., and McLaughlin, K.J. (2002).
Oct4 distribution and level in mouse clones: consequences for
pluripotency. Genes Dev. 16, 1209–1219.
Brons, I.G., Smithers, L.E., Trotter, M.W., Rugg-Gunn, P., Sun, B.,
Chuva de Sousa Lopes, S.M., Howlett, S.K., Clarkson, A., Ahrlund-
Richter, L., Pedersen, R.A., and Vallier, L. (2007). Derivation of
ell Reports j Vol. 1 j 183–197 j August 6, 2013 j ª2013 The Authors 195
Stem Cell ReportsDesigner Transcription Factors Reprograms Cells
pluripotent epiblast stem cells from mammalian embryos. Nature
448, 191–195.
Bultmann, S., Morbitzer, R., Schmidt, C.S., Thanisch, K., Spada, F.,
Elsaesser, J., Lahaye, T., and Leonhardt, H. (2012). Targeted tran-
scriptional activation of silent oct4 pluripotency gene by
combining designer TALEs and inhibition of epigenetic modifiers.
Nucleic Acids Res. 40, 5368–5377.
Carey, B.W., Markoulaki, S., Hanna, J.H., Faddah, D.A., Buganim,
Y., Kim, J., Ganz, K., Steine, E.J., Cassady, J.P., Creyghton, M.P.,
et al. (2011). Reprogramming factor stoichiometry influences the
epigenetic state and biological properties of induced pluripotent
stem cells. Cell Stem Cell 9, 588–598.
Chen, X., Xu, H., Yuan, P., Fang, F., Huss, M., Vega, V.B., Wong, E.,
Orlov, Y.L., Zhang,W., Jiang, J., et al. (2008). Integration of external
signaling pathways with the core transcriptional network in
embryonic stem cells. Cell 133, 1106–1117.
Cong, L., Zhou, R., Kuo, Y.C., Cunniff, M., and Zhang, F. (2012).
Comprehensive interrogation of natural TALE DNA-binding
modules and transcriptional repressor domains. Nat. Commun.
3, 968.
Geissler, R., Scholze, H., Hahn, S., Streubel, J., Bonas, U., Behrens,
S.E., and Boch, J. (2011). Transcriptional activators of humangenes
with programmable DNA-specificity. PLoS ONE 6, e19509.
Guo, G., Yang, J., Nichols, J., Hall, J.S., Eyres, I., Mansfield, W., and
Smith, A. (2009). Klf4 reverts developmentally programmed re-
striction of ground state pluripotency. Development 136, 1063–
1069.
Guo,G., Huang, Y., Humphreys, P.,Wang, X., and Smith, A. (2011).
A PiggyBac-based recessive screening method to identify pluripo-
tency regulators. PLoS ONE 6, e18189.
Heng, J.C., Feng, B., Han, J., Jiang, J., Kraus, P., Ng, J.H., Orlov, Y.L.,
Huss, M., Yang, L., Lufkin, T., et al. (2010). The nuclear receptor
Nr5a2 can replace Oct4 in the reprogramming of murine somatic
cells to pluripotent cells. Cell Stem Cell 6, 167–174.
Hochedlinger, K., and Plath, K. (2009). Epigenetic reprogramming
and induced pluripotency. Development 136, 509–523.
Ito, T., Ikehara, T., Nakagawa, T., Kraus, W.L., and Muramatsu, M.
(2000). p300-mediated acetylation facilitates the transfer of his-
tone H2A-H2B dimers from nucleosomes to a histone chaperone.
Genes Dev. 14, 1899–1907.
Juarez-Moreno, K., Erices, R., Beltran, A.S., Stolzenburg, S., Cuello-
Fredes, M., Owen, G.I., Qian, H., and Blancafort, P. (2013).
Breaking through an epigenetic wall: re-activation of Oct4 by
KRAB-containing designer zinc finger transcription factors. Epige-
netics 8, 164–176.
Kim, J.B., Greber, B., Arauzo-Bravo, M.J., Meyer, J., Park, K.I.,
Zaehres, H., and Scholer, H.R. (2009). Direct reprogramming of hu-
man neural stem cells by OCT4. Nature 461, 649–653.
Levasseur, D.N., Wang, J., Dorschner, M.O., Stamatoyannopoulos,
J.A., and Orkin, S.H. (2008). Oct4 dependence of chromatin struc-
ture within the extended Nanog locus in ES cells. Genes Dev. 22,
575–580.
Levine, M. (2010). Transcriptional enhancers in animal develop-
ment and evolution. Curr. Biol. 20, R754–R763.
196 Stem Cell Reports j Vol. 1 j 183–197 j August 6, 2013 j ª2013 The Auth
Loh, Y.H., Wu, Q., Chew, J.L., Vega, V.B., Zhang, W., Chen, X.,
Bourque, G., George, J., Leong, B., Liu, J., et al. (2006). The Oct4
and Nanog transcription network regulates pluripotency inmouse
embryonic stem cells. Nat. Genet. 38, 431–440.
Maeder, M.L., Linder, S.J., Reyon, D., Angstman, J.F., Fu, Y., Sander,
J.D., and Joung, J.K. (2013). Robust, synergistic regulation of
human gene expression using TALE activators. Nat. Methods 10,
243–245.
Margolin, J.F., Friedman, J.R., Meyer, W.K., Vissing, H., Thiesen,
H.J., and Rauscher, F.J., 3rd. (1994). Kruppel-associated boxes are
potent transcriptional repression domains. Proc. Natl. Acad. Sci.
USA 91, 4509–4513.
Mikkelsen, T.S., Ku, M., Jaffe, D.B., Issac, B., Lieberman, E., Gian-
noukos, G., Alvarez, P., Brockman, W., Kim, T.K., Koche, R.P.,
et al. (2007). Genome-widemaps of chromatin state in pluripotent
and lineage-committed cells. Nature 448, 553–560.
Milbradt, A.G., Kulkarni, M., Yi, T., Takeuchi, K., Sun, Z.Y., Luna,
R.E., Selenko, P., Naar, A.M., and Wagner, G. (2011). Structure of
the VP16 transactivator target in the Mediator. Nat. Struct. Mol.
Biol. 18, 410–415.
Minucci, S., Botquin, V., Yeom, Y.I., Dey, A., Sylvester, I., Zand, D.J.,
Ohbo, K., Ozato, K., and Scholer, H.R. (1996). Retinoic acid-
mediated down-regulation of Oct3/4 coincides with the loss of
promoter occupancy in vivo. EMBO J. 15, 888–899.
Morbitzer, R., Romer, P., Boch, J., and Lahaye, T. (2010). Regulation
of selected genome loci using de novo-engineered transcription
activator-like effector (TALE)-type transcription factors. Proc.
Natl. Acad. Sci. USA 107, 21617–21622.
Moscou, M.J., and Bogdanove, A.J. (2009). A simple cipher governs
DNA recognition by TAL effectors. Science 326, 1501.
Nakagawa, M., Koyanagi, M., Tanabe, K., Takahashi, K., Ichisaka,
T., Aoi, T., Okita, K., Mochiduki, Y., Takizawa, N., and Yamanaka,
S. (2008). Generation of induced pluripotent stem cells without
Myc from mouse and human fibroblasts. Nat. Biotechnol. 26,
101–106.
Nichols, J., Zevnik, B., Anastassiadis, K., Niwa, H., Klewe-Nebenius,
D., Chambers, I., Scholer, H., and Smith, A. (1998). Formation of
pluripotent stem cells in the mammalian embryo depends on
the POU transcription factor Oct4. Cell 95, 379–391.
Niwa, H., Toyooka, Y., Shimosato, D., Strumpf, D., Takahashi, K.,
Yagi, R., and Rossant, J. (2005). Interaction between Oct3/4
and Cdx2 determines trophectoderm differentiation. Cell 123,
917–929.
Okazawa, H., Okamoto, K., Ishino, F., Ishino-Kaneko, T., Takeda, S.,
Toyoda, Y.,Muramatsu,M., andHamada,H. (1991). The oct3 gene,
a gene for an embryonic transcription factor, is controlled by a ret-
inoic acid repressible enhancer. EMBO J. 10, 2997–3005.
Ong, C.T., and Corces, V.G. (2011). Enhancer function: new
insights into the regulation of tissue-specific gene expression.
Nat. Rev. Genet. 12, 283–293.
Perez-Pinera, P., Ousterout, D.G., Brunger, J.M., Farin, A.M., Glass,
K.A., Guilak, F., Crawford, G.E., Hartemink, A.J., and Gersbach,
C.A. (2013). Synergistic and tunable human gene activation by
combinations of synthetic transcription factors. Nat. Methods
10, 239–242.
ors

Stem Cell ReportsDesigner Transcription Factors Reprograms Cells
Plath, K., and Lowry, W.E. (2011). Progress in understanding
reprogramming to the induced pluripotent state. Nat. Rev. Genet.
12, 253–265.
Polo, J.M., Anderssen, E., Walsh, R.M., Schwarz, B.A., Nefzger,
C.M., Lim, S.M., Borkent, M., Apostolou, E., Alaei, S., Cloutier, J.,
et al. (2012). Amolecular roadmap of reprogramming somatic cells
into iPS cells. Cell 151, 1617–1632.
Reyon, D., Tsai, S.Q., Khayter, C., Foden, J.A., Sander, J.D., and
Joung, J.K. (2012). FLASH assembly of TALENs for high-
throughput genome editing. Nat. Biotechnol. 30, 460–465.
Sanjana, N.E., Cong, L., Zhou, Y., Cunniff, M.M., Feng, G., and
Zhang, F. (2012). A transcription activator-like effector toolbox
for genome engineering. Nat. Protoc. 7, 171–192.
Shen, Y., Yue, F., McCleary, D.F., Ye, Z., Edsall, L., Kuan, S., Wagner,
U., Dixon, J., Lee, L., Lobanenkov, V.V., and Ren, B. (2012). A map
of the cis-regulatory sequences in the mouse genome. Nature 488,
116–120.
Silva, J., Chambers, I., Pollard, S., and Smith, A. (2006). Nanog
promotes transfer of pluripotency after cell fusion. Nature 441,
997–1001.
Silva, J., Nichols, J., Theunissen, T.W., Guo, G., van Oosten, A.L.,
Barrandon, O., Wray, J., Yamanaka, S., Chambers, I., and Smith,
A. (2009). Nanog is the gateway to the pluripotent ground state.
Cell 138, 722–737.
Soufi, A., Donahue, G., and Zaret, K.S. (2012). Facilitators and
impediments of the pluripotency reprogramming factors’ initial
engagement with the genome. Cell 151, 994–1004.
Spitz, F., and Furlong, E.E. (2012). Transcription factors: from
enhancer binding to developmental control. Nat. Rev. Genet. 13,
613–626.
Streubel, J., Blucher, C., Landgraf, A., and Boch, J. (2012). TAL
effector RVD specificities and efficiencies. Nat. Biotechnol. 30,
593–595.
Takahashi, K., and Yamanaka, S. (2006). Induction of pluripotent
stem cells from mouse embryonic and adult fibroblast cultures
by defined factors. Cell 126, 663–676.
Stem C
Tesar, P.J., Chenoweth, J.G., Brook, F.A., Davies, T.J., Evans, E.P.,
Mack, D.L., Gardner, R.L., and McKay, R.D. (2007). New cell lines
from mouse epiblast share defining features with human embry-
onic stem cells. Nature 448, 196–199.
Toyooka, Y., Shimosato, D., Murakami, K., Takahashi, K., and
Niwa, H. (2008). Identification and characterization of sub-
populations in undifferentiated ES cell culture. Development
135, 909–918.
Wang, W., Lin, C., Lu, D., Ning, Z., Cox, T., Melvin, D., Wang, X.,
Bradley, A., and Liu, P. (2008). Chromosomal transposition of Pig-
gyBac in mouse embryonic stem cells. Proc. Natl. Acad. Sci. USA
105, 9290–9295.
Wang, W., Yang, J., Liu, H., Lu, D., Chen, X., Zenonos, Z., Campos,
L.S., Rad, R., Guo, G., Zhang, S., et al. (2011). Rapid and
efficient reprogramming of somatic cells to induced pluri-
potent stem cells by retinoic acid receptor gamma and
liver receptor homolog 1. Proc. Natl. Acad. Sci. USA 108, 18283–
18288.
Whyte, W.A., Orlando, D.A., Hnisz, D., Abraham, B.J., Lin, C.Y.,
Kagey, M.H., Rahl, P.B., Lee, T.I., and Young, R.A. (2013). Master
transcription factors and mediator establish super-enhancers at
key cell identity genes. Cell 153, 307–319.
Yamanaka, S. (2008). Pluripotency and nuclear reprogramming.
Philos. Trans. R. Soc. Lond. B Biol. Sci. 363, 2079–2087.
Yeom, Y.I., Fuhrmann, G., Ovitt, C.E., Brehm, A., Ohbo, K., Gross,
M., Hubner, K., and Scholer, H.R. (1996). Germline regulatory
element of Oct-4 specific for the totipotent cycle of embryonal
cells. Development 122, 881–894.
Young, R.A. (2011). Control of the embryonic stem cell state. Cell
144, 940–954.
Zhang, F., Cong, L., Lodato, S., Kosuri, S., Church, G.M., and
Arlotta, P. (2011). Efficient construction of sequence-specific TAL
effectors for modulating mammalian transcription. Nat. Bio-
technol. 29, 149–153.
ell Reports j Vol. 1 j 183–197 j August 6, 2013 j ª2013 The Authors 197
Related Documents