Magnetic Resonance Equipment (MRI) - Study on the potential for environmental im- provement by the aspect of energy efficiency DRAFT VERSION FOR DISCUSSION WITH THE ECODESIGN CONSULTATION FORUM Report

Welcome message from author
This document is posted to help you gain knowledge. Please leave a comment to let me know what you think about it! Share it to your friends and learn new things together.
Transcript
Magnetic Resonance Equipment (MRI) - Study on the potential for environmental im-
provement by the aspect of energy efficiency
DRAFT VERSION FOR DISCUSSION WITH THE ECODESIGN CONSULTATION FORUM
Report
2 / 30
Title of the Study: Magnetic resonance Equipment (MRI) - Study on the po-
tential for environmental improvement by the aspect of energy efficiency
Client: COCIR
March 2012
Authors:
Dr Constantin Herrmann Annekristin Rock
PE INTERNATIONAL AG Hauptstraße 111 – 113 70771 Leinfelden – Echterdingen
Phone +49 711 341817 – 0 Fax +49 711 341817 – 25
E-Mail [email protected] [email protected]
Internet www.pe-international.com
List of Contents
3 / 30
List of Contents
List of Contents .................................................................................................................. 3
Nomenclature .................................................................................................................... 4
1 Introduction ...................................................................................................... 5
2 Executive Summary ......................................................................................... 6
3 Overview COCIR and PE INTERNATIONAL ................................................... 7
4 COCIR SRI ...................................................................................................... 8
4.1 The SRI Methodology for Target Setting for MRI ............................................. 8
4.2 Goal and Scope of the Project ......................................................................... 8
5 Methodology for Defining the Potential for Improvement ................................ 10
5.1 Description of Product Group MRI ................................................................. 10
5.1.1 The Functional Unit........................................................................................ 10
5.1.2 Modules ......................................................................................................... 11
5.1.3 Application ..................................................................................................... 12
5.1.4 Examination of Patients ................................................................................. 12
5.1.5 Modes............................................................................................................ 13
5.1.6 Reason for Need of Increasing Energy Usage ............................................... 13
5.1.7 Bore Size ....................................................................................................... 13
5.2 Description of the Approach ........................................................................... 13
5.2.1 General Considerations for Energy Improvements of MRIs ........................... 13
5.2.2 MRI Categories .............................................................................................. 15
5.2.3 Specification of Typical Patient Examination Routines ................................... 16
5.2.4 Data Collection .............................................................................................. 16
5.2.5 Innovation cycle ............................................................................................. 16
5.2.6 Identification of Improvement Potentials ........................................................ 16
5.3 Reasons and Advantages of this Approach ................................................... 17
6 MRI Potential for Improvement ...................................................................... 18
6.1 Assessment of Data ....................................................................................... 18
6.2 Results from Data Collection ......................................................................... 19
6.2.1 Summary of Results for Category B MRI ....................................................... 19
6.2.2 Improvement Potentials per Module and per Mode ........................................ 21
6.3 Expected BAU and Improvement Scenarios .................................................. 26
6.3.1 Increased Number of Patients per Day .......................................................... 28
6.3.2 Summary of the Findings ............................................................................... 29
Nomenclature
4 / 30
Nomenclature
BAU Business as Usual
BAT Best Available Technology
BNAT Best not yet Available Technology
MFD multi function devices
MRI Magnetic Resonance Imaging
RF radio frequency
SRI Self-Regulatory Initiative
VA Voluntary Agreement
Introduction
5 / 30
1 Introduction
The motivation of this report is to define a methodology and to estimate the potential for
environmental improvements for Magnetic Resonance Imaging equipment (MRI). The
identified improvement potentials in total and per Company are used by COCIR in the
Self-regulatory Initiative (SRI) for medical imaging equipment to define ecodesign targets
for MRI. As investigations in earlier phases of the SRI of COCIR showed, the use phase
dominates and provides the highest potential for environmental improvements by energy
efficiency.
It is in the nature of the product group to be extremely complex and provide manifold func-
tions. This leads to the fact, that improvement aspects are not easy to be identified while
at the same time ensuring availability of established and new functions, providing physi-
cally and technically required performances and new developments.
The document is the result of a continuous accompaniment of COCIR and its members
from August 2011 until March 2012. In this time data had been collected and calculations
had been taken place to proof the applicability of the method. The given calculations are
therefore a theoretical potential and serve as support to COCIR to calculate their request-
ed target.
The method shows how the improvement potential goes beyond Business as Usual (BAU)
and that it is proofed to be ambitious independently from the resulting percentages of effi-
ciency increase or absolute reduction of power. It also serves hints and potentials how
individual companies can improve and what it means for the market, if improved devices
will be delivered, motivated and initiated from the SRI and its underlying method.
Executive Summary
6 / 30
2 Executive Summary
The document is structured into three sections;
The first one introduces to the product group of magnetic resonance, the scope of the
COCIR SRI and its intention of implementing ecodesign, in order to provide a solid infor-
mation base and to allow understanding the complexity.
The second section provides a description of the method that has been applied in order to
quantify the improvement potentials in a meaningful, realistic and comparable way to the
constant increase of functions. Only this ensures freedom and leveraging in all develop-
ments (innovation through ecodesign), whilst ensuring that the environmental impacts are
reduced through best applied energy efficiency.
Finally the third section provides data and information how the method was applied in or-
der to provide the data required by the SRI target setting methodology. The identified im-
provement potential has to be considered as the maximum improvement that could be
achieved under the unrealistic assumption that all the different technological solutions are
applied at the same time. As shown in the report, the technical possibilities to reduce the
energy use depend on the specific technology of the MRI and are limited by the required
performances of the equipment that cannot be compromised under any circumstance.
The study also concluded that due to the technological complexity of MRI and the con-
stant trend towards higher performances and functionalities a single efficiency factor is not
applicable. For this reason the analysis focused on single modules and single operating
modes.
The results from the applications of the identified improvements show that the technical
developments towards MRI with more and improved functions have an impact on the pos-
sible environmental improvements. It changes the reference, i.e. functional unit, for com-
parisons of power consumption. However, many modules in each mode have options for
technical improvement which lead to lower power consumption. But some modules clearly
have to follow physical constraints in order to provide the intended functions appropriately.
The highest improvement potentials are buried in modules and modes, in which in princi-
ple no function is provided, i.e. off mode and partly ready-to-scan mode. A combination of
increased efficiencies and smart switching off functions are therefore considered. Also,
the more the modules are investigated separately and understood as individual sub-
products or parts with individual improvement options the higher is the probability to reap
the potential.
Overall there are two scenarios presented for category B products, in which an increase of
power consumption is expected in case of BAU. The improvement potentials initiated from
the SRI can lower these increases, but due to more functions and better examinations a
low increase of the level of power consumption in absolute terms might occur. However
the measures and improvement potentials are all proven to be ambitious and that the
scenarios reflect the best possible situation. This is supported from action items, which
would not work without the SRI for example the influence on the supplier of the cryo-
cooler because of combined market power.
Overview COCIR and PE INTERNATIONAL
7 / 30
3 Overview COCIR and PE INTERNATIONAL
COCIR is the voice of the European Radiological, Electromedical and Healthcare IT In-
dustry. COCIR is a non-profit trade association, founded in 1959, representing the medical
technology industry in Europe. COCIR’s members play a driving role in developing the
future of healthcare in Europe and worldwide.
COCIR's aim is to represent the interests and activities of its members at European level,
and to communicate with policymakers on economic, regulatory and technical issues re-
lated to healthcare. COCIR also cooperates with international organizations on issues of
common interest.
COCIR seeks to promote the development of harmonized international standards and
regulatory control respecting the quality and effectiveness of medical devices and
healthcare IT systems, without compromising the safety of patients and users. COCIR's
key objectives include promoting free worldwide trade of medical devices and maintaining
the competitiveness of the European imaging, electromedical and healthcare IT industry.
COCIR encourages the use of advanced medical technology to support healthcare deliv-
ery worldwide, through cost-efficient and state-of-the art healthcare systems.
PE INTERNATIONAL provides companies with cutting-edge tools, in-depth knowledge
and an unparalleled spectrum of experience in making both corporate operations and
products more sustainable. Applied methods include implementing management systems,
developing sustainability indicators, life cycle assessment (LCA), carbon footprint, design
for environment (DfE) and environmental product declarations (EPD), technology bench-
marking, or eco-efficiency analysis, emissions management, clean development mecha-
nism projects and strategic CSR consulting. PE INTERNATIONAL uses its broad range of
expertise to jointly find solutions with our clients to meet their varied needs in the above
areas of Sustainability. We run workshops, provide training, manage full projects and offer
standard and customized software solutions complete with data bases. By ensuring a
thorough understanding of the client’s needs, we can focus our services on what matters.
We take pride in our efficiency and effectiveness and we ensure that our clients will reap
the benefit of a cost effective investment in their sustainability needs.
COCIR SRI
8 / 30
4 COCIR SRI
The Self-Regulatory Initiative (SRI) for medical imaging device is a voluntary agreement
between Companies under the framework of the ecodesign Directive (2009/125/EC).
Participating Companies commit to improve the environmental performances of medical
imaging equipment through a transparent and open process with the involvement of the
European Commission and stakeholders.
The most significant environmental aspects are identified and quantified. A specific meth-
odology is developed to measure them and to evaluate the improvement potentials. Re-
duction targets are set and improvements are tracked and yearly communicated to the
European Commission and to stakeholders.
The initiative and a first pilot project on Ultrasound equipment was firstly presented to the
Consultation Forum in 2009. The comments received during and after the meeting were
used to refine the proposal that has been submitted for official endorsement to the Euro-
pean Commission end of January 2012.
4.1 The SRI Methodology for Target Setting for MRI
The SRI adopts the “fleet approach” regarding to ecodesign targets. Targets are defined
as the average performance of all model placed on the market in the year under consider-
ation, not as specific threshold levels on product performances.
The SRI defines a methodology for setting targets on the identified environmental aspects
which requires the knowledge of the performances of all the models on the market and an
estimation of the potential for improvement for the selected aspect.
The methodology defines 3 scenarios (baseline today, business-as-usual BAU, best not
yet available technologies BNAT). Under certain assumption a fourth one is calculated
(beyond BAU) and the market average for this scenario is used as industry target to be
achieved in a period of time equal to the innovation cycle of the equipment under consid-
eration. The methodology also defines company targets that are used as tools to monitor
the achievement of the industry target and to plan corrective actions.
4.2 Goal and Scope of the Project
Main goal of this project is the evaluation of the expected product improvements in order
to provide the data required by the SRI methodology for the definition of a reduction target
for identified environmental aspects for the product group of MRIs.
In particular PE INTERNATIONAL has been required to provide the following information
as a result of the study:
1. Definition of a realistic Business as usual scenario for year 2017 based on the cur-
rent and expected trend in the MRI technology and market
2. Estimation of the maximum potential for improvement for MRI based on best avail-
able technologies and technologies now under development (best not yet availa-
ble technologies)
3. Realistic estimation of the potential for improvement per company required by
COCIR SRI for the target setting process
COCIR SRI
9 / 30
To achieve this goal, companies participating to the SRI provide information about the
improvement potentials of their products. PE INTERNATIONAL evaluates data and infor-
mation and delivers the main results to COCIR.
Data and information referred to in points 1 and 2 above are provided in this report. Indi-
vidual company improvement potentials are extremely confidential and cannot be dis-
closed. Data have been submitted to COCIR only according to the SRI methodology re-
quirements.
Challenges of the project are the continuous development of new functions and examina-
tion options, the difficulties to measure power consumption per module and the definition
of the functional unit.
Methodology for Defining the Potential for Improvement
10 / 30
5 Methodology for Defining the Potential for Improvement
This chapter introduces MRI equipment to provide a better understanding of the products
and their related functions. This is a key element to realise the provided method as a logi-
cal solution to motivate for environmental improvements whilst allowing all freedom in de-
sign and in developing new options and functions with the goal. It is important to bear in
mind that the medical Industry is committed to develop lifesaving equipment to provide
better diagnostic tools and better healthcare to patients. Any solution that would reduce
environmental impacts while reducing performances at the same time cannot be adopted.
Moreover any restriction to innovation capability could have negative consequence on
healthcare that must be avoided.
5.1 Description of Product Group MRI
5.1.1 The Functional Unit
The functional unit is the reference ensuring the comparability of power consumption of
different products and their developments over time.
In general, the underlying functional unit is the number of patients that can be examined
per day. Such number is not fixed a priori but depends on the needs of patients, the na-
ture of examinations, the required quality and functionality and furthermore the power and
performance of the machine. Last but not least the way a user, typically a medical expert,
conducts the examination has influence on the time it need, taking into consideration for
example the conditions and provided options given by the device how to run examinations
or drive variations of examinations for better information gain.
For a specific MRI the number of patients examined per day is derived by dividing the
working time in a hospital1 per the number of examination that could be performed by the
equipment. As people are investigated because of different diseases, the most common
examinations (head, spine, abdomen, knee, angio) and sequences for each examination
have been defined as basis for the functional unit. Basis of this approach is the “2007 MRI
Market Summary Report”, page II-2, May 2008, IMV Medical Information Division, Des
Plaines, IL USA: www.imvinfo.com.
The duration of each examination (measured) and the distribution in a given time frame
(10h) allow for the calculation of the number of examinations per day.
Measurements of MRI model showed that there is a direct relationship between the num-
ber of patients that can be examined by an MRI and the energy consumption. MRIs with
higher patient per day ratio use more energy. As the patient per day ratio can be consid-
ered as the “productivity“of the equipment, it seems appropriate to refer the energy con-
sumption (per day) to the number of patient (per day): kWh/patient
Thus in principle, to reduce the energy consumption per patient (kWh/p), there is the op-
tion to reduce the time per examination which increases the number of examined patients
per day. This is not a linear calculation, e.g. in the sense of higher performance level
leads to shorter investigation cycles. This reduction could be achieved only by changing
the defined sequences with new ones that could produce the same images in shorter
1 12h off-mode, 2h servicing, 10h for examination. For additional information see “Magnetic resonance equipment (MRI) – Measuring the energy consumption” report available at www.cocir.org
Methodology for Defining the Potential for Improvement
11 / 30
time. This would result in the loss of comparability of power consumptions due to a differ-
ent functional unit.
5.1.2 Modules
Magnetic Resonance Imaging (MRI) is based on the magnetic resonance phenomenon.
The basic hardware components of all MRI systems are the magnet, producing a stable
and very intense magnetic field, the gradient coils, creating a variable field and radio fre-
quency (RF) coils which are used to transmit energy and to encode spatial positioning. A
computer controls the MRI scanning operation and processes the information.
Due to the high complexity of the system, the definition of the most important modules is
needed to simplify by separation into single functions (out of the entire product functionali-
ty) and to figure out the modules with the highest power consumption.
The most important power consuming modules of the entire MRI system have been identi-
fied.
Gradient amplifier
RF unit
Reconstruction unit
Console, Computer
All required electronics
Patient table
Cryogen compressor
Water heat exchanger (facility cooled water is supposed)
Magnet
Helium-conservation equipment (ZBO)
Due to the high technical complexity of the system and the difficulty to allocate the power
consumption to the right module, PE INTERNATIONAL suggested to minimize the num-
ber of investigated modules and to summarize certain modules.
Therefore, the following modules had been analysed by companies with respect to the
individual power consumption and their improvement potential:
Gradient Amplifier
RF Sender
RF Receiver
Water heat exchanger
Computation
Magnet
Patient table
In addition to those modules, several companies suggested to take another module into
account: the cryo-cooling device. Different experts stated out the significant reduction po-
tential of this module. According to these insights of experts, PE INTERNATIONAL advis-
es to consider this as option for target setting.
As conclusion from the conducted interviews the following aggregation of modules had
been chosen, because the improvement mechanisms follow similar principles:
Gradient Amplifier (RF Sender, RF Receiver and water heat exchanger)
Methodology for Defining the Potential for Improvement
12 / 30
Magnet (including cryo-cooling)
Computation
Others, mainly patient table
5.1.3 Application
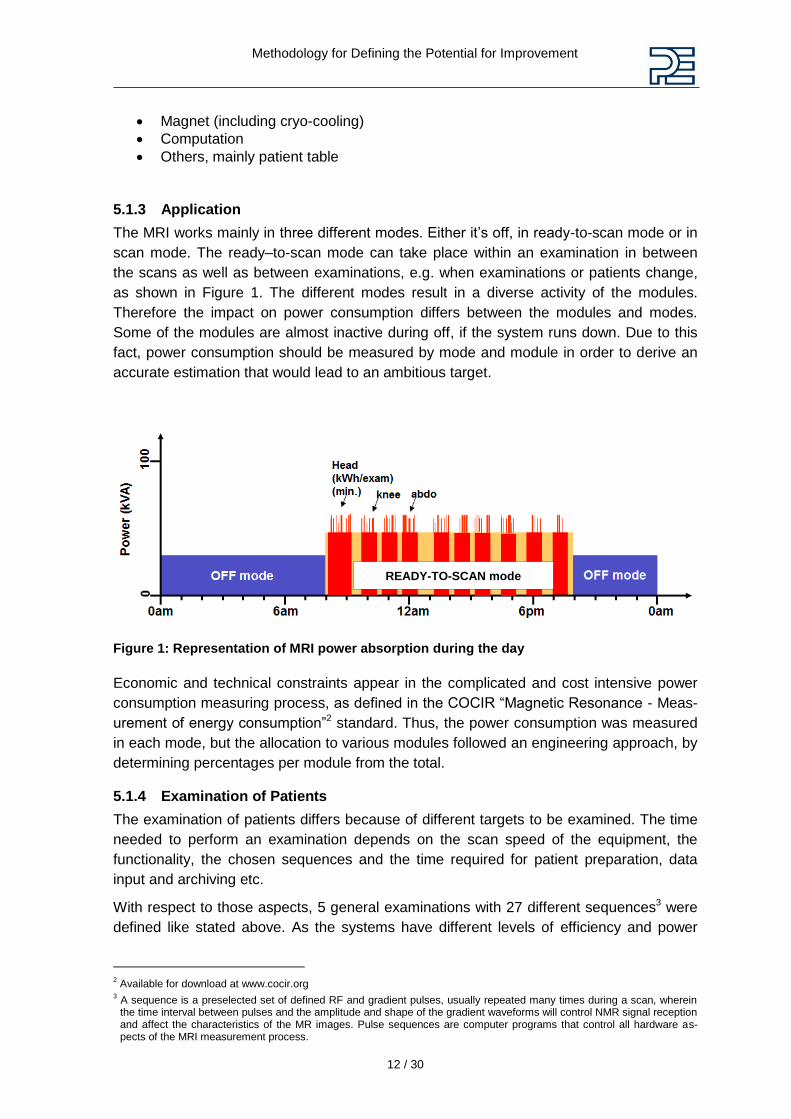
The MRI works mainly in three different modes. Either it’s off, in ready-to-scan mode or in
scan mode. The ready–to-scan mode can take place within an examination in between
the scans as well as between examinations, e.g. when examinations or patients change,
as shown in Figure 1. The different modes result in a diverse activity of the modules.
Therefore the impact on power consumption differs between the modules and modes.
Some of the modules are almost inactive during off, if the system runs down. Due to this
fact, power consumption should be measured by mode and module in order to derive an
accurate estimation that would lead to an ambitious target.
Figure 1: Representation of MRI power absorption during the day
Economic and technical constraints appear in the complicated and cost intensive power
consumption measuring process, as defined in the COCIR “Magnetic Resonance - Meas-
urement of energy consumption”2 standard. Thus, the power consumption was measured
in each mode, but the allocation to various modules followed an engineering approach, by
determining percentages per module from the total.
5.1.4 Examination of Patients
The examination of patients differs because of different targets to be examined. The time
needed to perform an examination depends on the scan speed of the equipment, the
functionality, the chosen sequences and the time required for patient preparation, data
input and archiving etc.
With respect to those aspects, 5 general examinations with 27 different sequences3 were
defined like stated above. As the systems have different levels of efficiency and power
2 Available for download at www.cocir.org
3 A sequence is a preselected set of defined RF and gradient pulses, usually repeated many times during a scan, wherein the time interval between pulses and the amplitude and shape of the gradient waveforms will control NMR signal reception and affect the characteristics of the MR images. Pulse sequences are computer programs that control all hardware as-pects of the MRI measurement process.
READY-TO-SCAN mode
Methodology for Defining the Potential for Improvement
13 / 30
use, improvements can be either achieved by reducing the time needed for examination
or minimizing the power consumption.
Though assuming a continuous improvement of efficiency, the increasing level of func-
tionality and performance could lead to a higher energy demand. This again leads to a
change of the reference for the energy consumption, i.e. the functional unit.
5.1.5 Modes
The three modes are off, ready-to-scan and scan. The devices are used for different kind
of examinations, which cause different intensities of power usage. Depending on the type
of examination, the time for different modes and thus, the power consumption intensity
varies. Therefore the different modes were measured individually.
5.1.6 Reason for Need of Increasing Energy Usage
The quality of the images generated by a MR is directly related with the strength of the
magnetic field aligning the spins of the atom nuclei and the power of the gradient and RF
amplifiers. More powerful magnetic fields and amplifiers allow to obtain images with less
noise and higher resolutions. Therefore an increase in the energy usage is expected in
the next years.
5.1.7 Bore Size
Another aspect that has to be considered is the increase of the bore size. Larger bores
allow higher patient comfort during examination (claustrophobia) and also the possibility to
examine “larger” patients (e.g. patients suffering from obesity). As the magnetic field de-
crease exponentially with the distance, additional energy is required.
5.2 Description of the Approach
5.2.1 General Considerations for Energy Improvements of MRIs
Influence on the potential for improvement can either be exerted on decrease of power
consumption, on the increase of speed of examination per patient or on the combination
of existing functions and adding new functions into one product in order to avoid several
independent devices. Examples for these mechanisms showing the complexity and chal-
lenge of single targets are:
- A decrease of power consumption typically derives from increase of efficiency.
However, the product MRI consists of numerous individual modules, functional de-
vices and separate individual, highly complex sub-products, that a common effi-
ciency factor is not applicable. Also the sum of all individual efficiency factors to an
average efficiency factor is not feasible, since devices such as computing, power
transforming, converting, inverting, cooling, moving, magnetising etc. do not follow
a general efficiency pattern, which would make sense to aggregate.
Examples from other products show that typically one main function allows the target set-
ting for higher efficiency, e.g. external power supply units, electric motors, transformers or
TV sets. Though TV sets already showed the challenge that watching TV is not necessari-
ly a feasible functional unit the efficiency can refer to. Performance aspects such as
screen size, quality of picture, number of pixels, contrast range are influencing the effi-
Methodology for Defining the Potential for Improvement
14 / 30
ciency but are difficult to get reflected quantitatively by a changing functional unit. Thus, it
can be seen that the complexity of functions to be delivered and the constant change and
increase of functions through innovation and development on MRI devices make the ap-
plication of one single factor impossible.
- A faster examination of patients while increasing the energy consumption per day,
would lead to less power per examination. However, time on its own is not the full
story that makes MRIs so precious for medical investigations. The true value is in
the amount of information that can be given to medical experts. The information is
based on imaging of things which cannot be seen from outside but depends on the
type, quality, perspective, resolution, static or dynamic visuals, material and con-
centration and many aspects more. Different investigations need different time and
the shorter the good, but the investigation options rule typically the timing. Thus, it
is impossible to compare and track timing of the numerous options theoretically
possible and the numerous combinations of all possible scenarios. Consequential-
ly at this stage of the SRI it is yet impossible to realize and measure shorter inves-
tigation times within the constraints of the defined and fixed investigation sequenc-
es, which is necessary to fix in order to have a solid and fixed reference point for
comparison.
Examples from other products show that increased performance resulting into fulfilling
function in shorter time works, if the reference or functional unit is clearly quantified.
Those products are dishwashers, washing machines or dryers, which have a clear, singu-
lar, quantifiable function and the environmental impacts can be decreased in case the run
time is shorter.
- The combination of existing functions and adding new functions into one product
avoids several independent devices to fulfil respective functions. Typically such
combinations can use many synergies and therefore result into less environmental
impacts. However, the MRIs increase the functions of providing images constantly
by innovations and new developments as well as by combination with other medi-
cal examination disciplines. This leads into an even more complex set of perfor-
mance requirements, an extension by additional devices, modules and sub-
modules as well as to entirely new functions and is still identified as a MRI product.
In order to identify the synergies quantitatively an allocation could take place that
identifies the power consumption per each function, which is not possible with
MRI, because of missing clear boundary conditions or system boundaries for ap-
plying allocation.
Examples from other products can be given on the so called multi-function devices (MFD)
from printing and imaging market. They combine clearly identifiable functions such as
printing, faxing and scanning, for which discrete products also exist. Thus a comparison
between discrete products and MFDs can take place and the allocated shares of the MFD
typically are lower than the discrete products. This approach is not applicable to MRIs,
because of either missing discrete products for comparison or unclear allocation options.
As consequence from the above identified challenges and in order to provide a quantifia-
ble functional unit, sequences had been defined being representative for typical examina-
tions of representative MRIs. This serves as reference for measurements as well as for
Methodology for Defining the Potential for Improvement
15 / 30
quantifying the power consumption. An examination is composed of sequences (scan
time) and time in between sequences (ready-to-scan time). Scan time is mostly fixed due
to physical constraints. The increase of speed is only possible in-between the sequences.
A possible option relating to future developments could be to change sequences with oth-
er that could provide the same quality information but in shorter time, which would be a
proof of “innovation through ecodesign”. However, in this phase of the SRI for MRIs a
change of the functional unit is not appropriate.
5.2.2 MRI Categories
Due to big differences in design and therefore power consumption, the MRI need to be
grouped into categories in order to have a slightly similar basis of equipment from different
companies. A categorization method based on scoring has been developed in the COCIR
SRI.
Three categories have been defined according to many features of MRIs4. The 3 catego-
ries could be summarized in a simplified way as following:
Category A: Clinical models. Normally open or cylindrical superconductive mag-
nets with field strength up to 1.5 Tesla.
Category B: Hospital models. Cylindrical superconductive magnets with field
strength from 1.5 to 3 Tesla. Most of MRI models fall into this category.
Category C: Research models. Cylindrical superconductive magnets high end
models with magnetic fields of 3 Tesla or more.
The power consumption of the MRI of each category has been assessed.
The SRI Steering Committee, on the basis of the measured data and the available market
data decided to exclude category A and category C products from the scope of the SRI for
the following reasons (from “Ecodesign target for Magnetic resonance Equipment:
2012/201” report).
Exclusion of category A
Category A products represents a small percentage of the whole sales in EU. Most of cat-
egory A MRIs are open models, equipped with permanent magnets that normally do not
require power to generate the magnetic field (cryo-cooling system). Therefore contribution
of category A to the total energy consumption of MRI is very limited and the absence of
the cryo-cooled magnet reduces also the potential for improvement.
Exclusion of category C
Category C models accounts for ca. 30% of all EU sales. Category C represents high-end
models, with increased functionality, mostly used for research purposes. Only a few mod-
els are actually commercialized by only 3 companies. If applied, the methodology would
open critical issues related to the confidentiality of delivered results and could harm com-
petitiveness and innovation.
Moreover the required high level performances reduce the potential for improvement.
Possible technical solutions to reduce the energy consumption, such as the ones identi-
4 For additional information refer to the “Ecodesign target for MRIs” report available for download at www.cocir.org
Methodology for Defining the Potential for Improvement
16 / 30
fied for category B equipment, should be investigated with extreme care to avoid that the
performances could be compromised or reduced.
Given the above mentioned reasons, only Category B equipment is taken into account in
this study.
5.2.3 Specification of Typical Patient Examination Routines
The specification of a typical patient examination routine is important to have a similar
examination basis for every company’s measurements. As the chosen patient examina-
tions represent a combination of the most common examinations, the scope of the meas-
urements represents a typical day in hospital. As products and functions -even though
belonging to the same category- differ, this similar approach for measurements is the ba-
sis for comparable results for the data evaluation. Due to the fact that a target will be de-
fined for the whole industry, comparable data is the basis for this industry-wide approach.
5.2.4 Data Collection
According to the functional unit and the scope and regulations for data collection that was
agreed between the partners, measurements of models were provided by industry. The
measurement provides scan time and ready-to-scan time (while off time has been set as
fixed) as well as power consumption to the different modes. The power consumption of
each mode is then allocated and divided to the module accountable for the power con-
sumption. Because of the above mentioned economic and technical constraints for meas-
uring the power consumption of different modalities, the percentage of the power con-
sumption was provided through an engineering approach.
PE INTERNATIONAL collected the data from each company to calculate an average of
the market and discussed and verified the provided data with the individual companies
and COCIR in a confidential manner.
5.2.5 Innovation cycle
The innovation cycle is defined as the time needed to develop new or enhanced products
and place them on the market. It could vary from 3 years to 7, depending on the complex-
ity of the innovation being brought to market.
The below listed activities for MRI requires on the average:
Research and development - 1 year
Verification and Validation - 3 years
Regulatory Approvals - 1 year
This study therefore estimates the improvements that could be achieved in the period
2012/2017 according to the technologies available today or still under development.
5.2.6 Identification of Improvement Potentials
According to the scope of this analysis and the common agreement to focus on category
B modalities, companies were asked in individual interviews to provide not only infor-
mation about the power consumption of the different modules but also about their as-
sumptions of improvement potentials per module with a 5 years horizon. In addition to
Methodology for Defining the Potential for Improvement
17 / 30
quantified improvement potentials, companies provided also an outlook of possible tech-
nical developments. To summarize the assumptions, the trend goes towards modalities
with more functions and better quality. Therefore, the power consumption of the modality
might increase.
Thus, to achieve a power reduction that is beyond BAU, three main options were identi-
fied:
1) Reduction of power consumption during 24 hours usage time due to an increase of
efficiency
2) Switching off or allowing modules/parts to drop to a lower energy consumption
mode in times these modules/parts are not needed
3) Increase of number of patients to decrease the kWh/patient.
For the first option, the assessment of reduction potentials resulted in an estimation that
the potential is rather low because MRI are highly improved machines that already work
on an extended efficiency level.
With respect to expected developments of IT systems towards smarter switches between
off, ready-to-scan and scan mode, the second option offers possibilities to achieve lower
power consumption.
To get a lower kWh rate per patient, a higher efficiency and/or speed rate of examinations
have to be reached.
5.3 Reasons and Advantages of this Approach
- Complexity of products regarded, by categorisation and modularisation
- Functional unit quantified as much as possible
- Quantitative base for reference and comparison created
- Market importance identified and scope reduced to significant aspects
- Communication about ecodesign motivated and in between partners established
- Moderation as objective third party enabling open discussion about improvements
- Improvement potentials identified and quantified
- Incentives in each organisation to implement improvement potentials into the com-
pany design processes
- Provide profound base for calculating the SRI target
MRI Potential for Improvement
18 / 30
6 MRI Potential for Improvement
This chapter presents the results of the data collection and represents a summary of the
information exchanged between companies and PE INTERNATIONAL regarding the ac-
tual situation of the technology and the expected developments and improvements of the
MRI sector. As information about technical improvements is highly confidential, the sum-
mary tries to provide an overview of possible improvements by respecting the agreement
not to provide any details of individual improvements of a company. PE INTERNATION-
AL’s role in this process was characterized by being an independent third party operator.
Thus, PE INTERNATIONAL got information about individual developments and improve-
ments and advised COCIR on the target setting.
6.1 Assessment of Data
Basis of the results is the measured data that was provided by the following companies:
GE Healthcare
Hitachi Medical Systems Europe
Philips Healthcare
Siemens Healthcare
Toshiba Medical Systems Europe.
Data have been collected taking into account:
Differentiation between three modes:
i. Off
ii. Ready to scan
iii. Scan mode
Differentiation between 4 modules:
i. Gradient amplifier, RF Sender, RF Receiver, Water heat exchanger as one
module
ii. Computation
iii. Magnet (including cryo-cooler)
iv. Patient table
MRI Potential for Improvement
19 / 30
6.2 Results from Data Collection
6.2.1 Summary of Results for Category B MRI
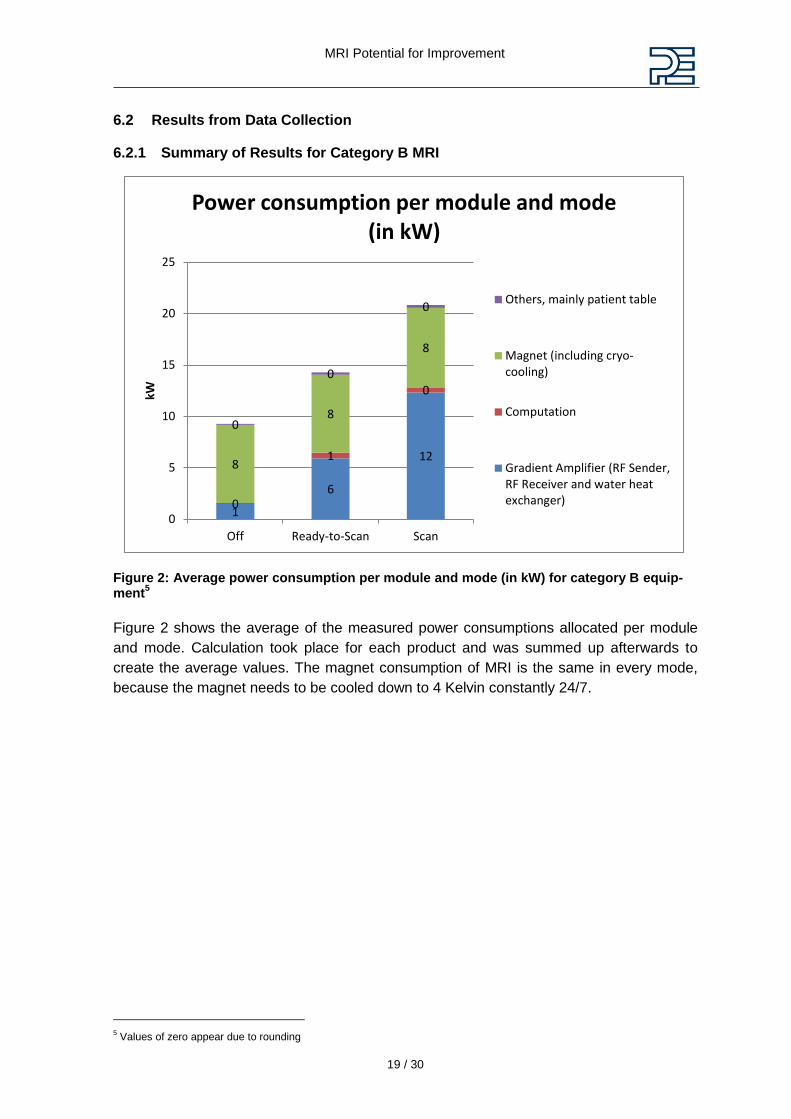
Figure 2: Average power consumption per module and mode (in kW) for category B equip-ment
5
Figure 2 shows the average of the measured power consumptions allocated per module
and mode. Calculation took place for each product and was summed up afterwards to
create the average values. The magnet consumption of MRI is the same in every mode,
because the magnet needs to be cooled down to 4 Kelvin constantly 24/7.
5 Values of zero appear due to rounding
1
6
12
0
1
0
8
8
8
0
0
0
0
5
10
15
20
25
Off Ready-to-Scan Scan
kW
Power consumption per module and mode (in kW)
Others, mainly patient table
Magnet (including cryo-cooling)
Computation
Gradient Amplifier (RF Sender,RF Receiver and water heatexchanger)
MRI Potential for Improvement
20 / 30
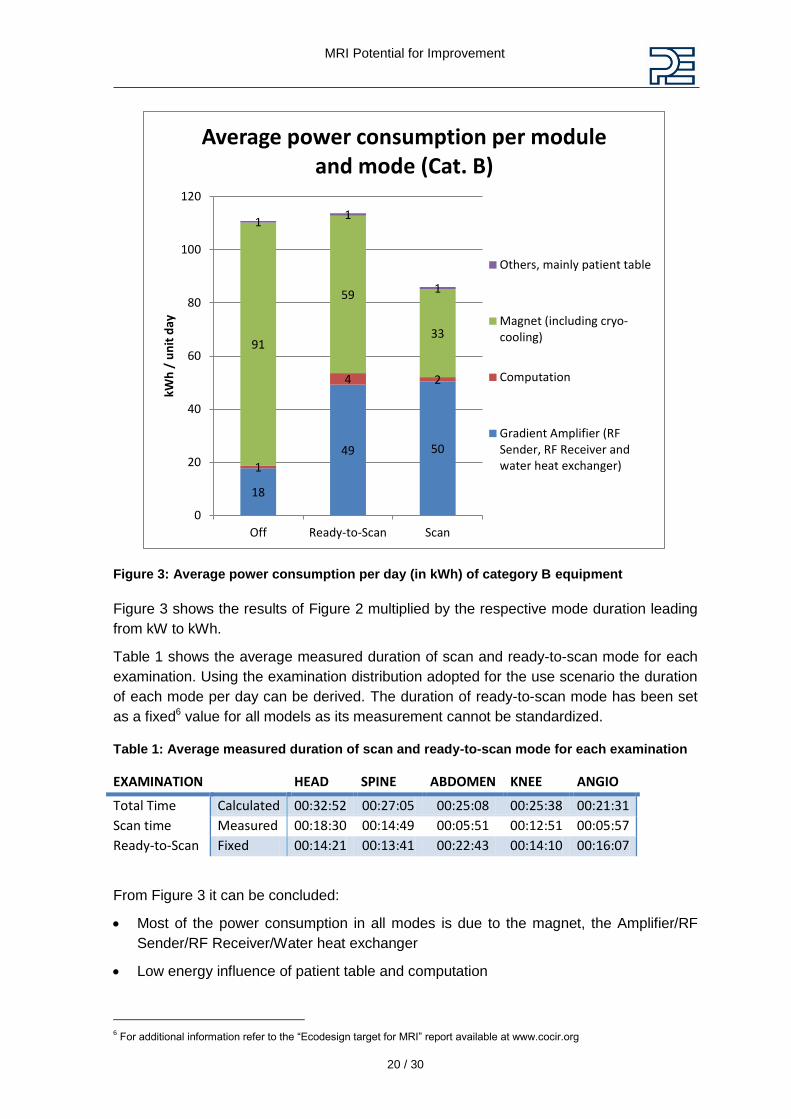
Figure 3: Average power consumption per day (in kWh) of category B equipment
Figure 3 shows the results of Figure 2 multiplied by the respective mode duration leading
from kW to kWh.
Table 1 shows the average measured duration of scan and ready-to-scan mode for each
examination. Using the examination distribution adopted for the use scenario the duration
of each mode per day can be derived. The duration of ready-to-scan mode has been set
as a fixed6 value for all models as its measurement cannot be standardized.
Table 1: Average measured duration of scan and ready-to-scan mode for each examination
EXAMINATION HEAD SPINE ABDOMEN KNEE ANGIO
Total Time Calculated 00:32:52 00:27:05 00:25:08 00:25:38 00:21:31
Scan time Measured 00:18:30 00:14:49 00:05:51 00:12:51 00:05:57
Ready-to-Scan Fixed 00:14:21 00:13:41 00:22:43 00:14:10 00:16:07
From Figure 3 it can be concluded:
Most of the power consumption in all modes is due to the magnet, the Amplifier/RF
Sender/RF Receiver/Water heat exchanger
Low energy influence of patient table and computation
6 For additional information refer to the “Ecodesign target for MRI” report available at www.cocir.org
18
49 50
1
4 2
91
59
33
1 1
1
0
20
40
60
80
100
120
Off Ready-to-Scan Scan
kWh
/ u
nit
day
Average power consumption per module and mode (Cat. B)
Others, mainly patient table
Magnet (including cryo-cooling)
Computation
Gradient Amplifier (RFSender, RF Receiver andwater heat exchanger)
MRI Potential for Improvement
21 / 30
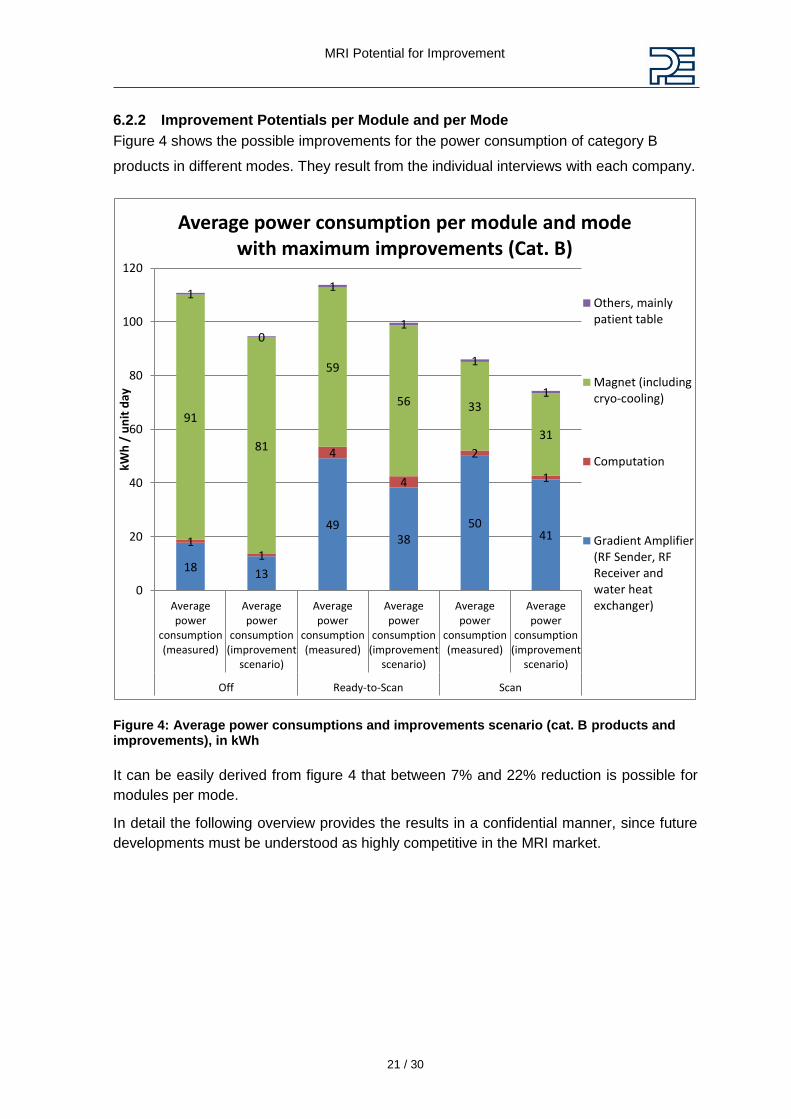
6.2.2 Improvement Potentials per Module and per Mode
Figure 4 shows the possible improvements for the power consumption of category B
products in different modes. They result from the individual interviews with each company.
Figure 4: Average power consumptions and improvements scenario (cat. B products and improvements), in kWh
It can be easily derived from figure 4 that between 7% and 22% reduction is possible for
modules per mode.
In detail the following overview provides the results in a confidential manner, since future
developments must be understood as highly competitive in the MRI market.
18 13
49 38
50 41 1
1
4
4
2
1
91
81
59
56 33
31
1
0
1
1
1
1
0
20
40
60
80
100
120
Averagepower
consumption(measured)
Averagepower
consumption(improvement
scenario)
Averagepower
consumption(measured)
Averagepower
consumption(improvement
scenario)
Averagepower
consumption(measured)
Averagepower
consumption(improvement
scenario)
Off Ready-to-Scan Scan
kWh
/ u
nit
day
Average power consumption per module and mode with maximum improvements (Cat. B)
Others, mainlypatient table
Magnet (includingcryo-cooling)
Computation
Gradient Amplifier(RF Sender, RFReceiver andwater heatexchanger)
MRI Potential for Improvement
22 / 30
Improvement potentials of MRI with respect to kWh
The percentages expressed in the chapter below are referred to the energy consumption
of the module, not to the energy consumption of the whole equipment.
Off Mode
Gradient am-plifier, RF Re-ceiver, RF Sender, Water heat exchang-er
20-25% Possible BAT/BNAT
Technical measures:
measures as given in ready-to-Scan mode and which refer to switch off technologies are also applicable for this module in off mode leading to given percentages of im-provement
5%: Improvement of the frequency converter of the water heat exchanger
Computation 20-40% Possible BAT and applied BAU from IT market
40%: Switch off while not used (e.g. at nights, weekends, depends on the hospi-tal)
Magnet (cryo-cooler)
20-25% Possible BAT/BNAT and influence on supplier due to combined market power
Technical measures:
20%: Cryo-coolers are mostly bought by all Companies from one supplier from Japan, Sumitomo Corporation. On the efficiency of the module the healthcare sector can take influence to some degree (e.g. through the SRI as a concrete action).
The efficiency of the cryo-cooler system decreases over time. Therefore a surplus of performance towards a still reliable performance level after about 3 years life time could be compensated by e.g. speed controlled motor system, which adapts the power demand to the efficiency change over time. In other words: low speed at fresh system and performance level controlled by an increase of speed to compensate decreased efficiency over time. Power saving level potentially 20% (acc. to Sumito-mo). If the market put pressure on the supplier of cryo-coolers, the whole product would be more efficient.
Starting and stopping the cryo-cooler is not a viable option as this will wear out the system. It must be guaranteed that the magnet is PROPERLY cooled. If the cooler stops working the helium boils off and the MRI system is lost.
25%: such reduction level could be achieved if technical measures could be de-veloped which allow to switch the cryo-cooler off for certain times during 24h
20%: a control loop taking into consideration the liquefying demand could lower cryo-cooling demand mostly in the time when MRI is off (less heat development, on-ly cryo-cooling demand due to losses through isolation); gains take place continu-
MRI Potential for Improvement
23 / 30
ously since system works less in average, but the percentage refers only to off times.
Helium condensation plays a priority role in the functioning of MRI systems. The evapo-rated helium during the scan phases has to be re-condensed during the ready-to-scan and off time. Energy consumption can be reduced by not re-condensing the helium and refilling it when necessary (old models) but that would imply a greater energy consumption as the helium would need to be condensed and transported anyway. Moreover helium is a very limited resource and when released in the atmosphere it gets dispersed into outer space. Ready-to-Scan Mode
Gradient am-plifier, RF Re-ceiver, RF Sender, Water heat ex-changer
5-50% Possible BAT/BNAT
Technical measures:
20-25% (RF Receiver and RF Sender): smart shutdown. Improvements in power supply (from analogue to digital power supply). RF senders and receiver are very sensible devices therefore the stability of the systems would be compromised by switching on and off. Feasibility of this measure is actually under investigation.
15-20% (Gradient amplifier): Efficiency of power supply. The introduction of switch mode power supplies is subject to certain restrictions, e.g. introduction of additional noise. This measure would probably not be applicable for the next 5 years.
10-15% (water heat exchanger): Smart switching of cooling system down to lower consumption during times of less cooling demand. Saving could be considerably lower according to how the MR is used. Intense use would require the heat ex-changer to fully work in ready-to-scan mode to eliminate the excess heat generated during scan.
30% (power supplies): fast switch to off outside of scan sequences. The feasibility of this measure is under investigation as at the moment, switching off power supplies affects system stability.
5% (Water heat exchanger): Improvement of the frequency converter.
Computation 20% Applied BAU from IT market
Technical measures:
20%: Improvement, innovation and efficiency of computation depends to 100% on BAU and the given developments in their sector. Healthcare devices cannot take influence due to a non-significant market share.
MRI Potential for Improvement
24 / 30
Magnet 10-20%
Possible BAT and influence on supplier due to combined market power
Technical measures:
10-20%: Cryo-coolers are bought by all Companies from one supplier from Japan, Sumitomo. On the efficiency of the module the healthcare sector can take influence to some degree (e.g. through the SRI as a concrete action).
The efficiency of the cryo-cooler system decreases over time. Therefore a surplus of performance towards a still reliable performance level after about 3 years life time could be compensated by e.g. speed controlled motor system, which adapts the power demand to the efficiency change over time. In other words: low speed at fresh system and performance level controlled by an increase of speed to compensate decreased efficiency over time. Power saving level potentially 20% (acc. to Sumito-mo). If the market put pressure on the supplier of cryo-coolers, the whole product would be more efficient.
Starting and stopping the cryo-cooler is not a viable option as this will wear out the system. It must be guaranteed that the magnet is PROPERLY cooled. If the cooler stops working the helium boils off and the MRI system is lost.
25%: such reduction level could be achieved if technical measures could be de-veloped which allow to switch the cryo-cooler off for certain times during 24h
The savings deriving from the above mentioned measures are strongly dependent on the use of the MR. Intensive use, as assumed in the SRI use scenario implies that the cry-cooler has to work most of the time in ready-to-scan and off mode to re-condense the he-lium evaporated during scan. In such cases the saving deriving from a variable speed motor are far lower. Nonetheless the re-condensation of helium is a top priority in MRI systems.
Patient Table 2-5%
Applied BAU from e-motor market
Technical measures:
2-5% improved efficiency of table motors
Scan Mode
Gradient am-plifier, RF Re-ceiver, RF Sender, Water heat ex-changer
2-25% Possible BAT/BNAT
Technical measures:
2% (Gradient amplifier, RF sender): Increased efficiency. Absolut energy use might increase because the amplifier will have more technical elements than before, so it will be more efficient but at the same time more total energy will be consumed. The power amplifiers are already highly optimized therefore very limited improvement is expected in the next 5 years.
MRI Potential for Improvement
25 / 30
Computation 20% Applied BAU from IT market
Technical measures:
20%: Improvement, innovation and efficiency of computation depends to 100% on BAU and the given developments in their sector. Healthcare devices cannot take in-fluence due to a non-significant market share.
Magnet 2-20%
Possible BAT and influence on supplier due to combined market power
Technical measures:
2-20%: Cryo-coolers are bought by all Companies from one supplier from Japan, Sumitomo. On the efficiency of the module the healthcare sector can take influence to some degree (e.g. through the SRI as a concrete action).
The efficiency of the cryo-cooler system decreases over time. Therefore a surplus of performance towards a still reliable performance level after about 3 years life time could be compensated by e.g. speed controlled motor system, which adapts the power demand to the efficiency change over time. In other words: low speed at fresh system and performance level controlled by an increase of speed to compensate decreased efficiency over time. Power saving level potentially 20% (acc. to Sumito-mo). If the market put pressure on the supplier of cryo-coolers, the whole product would be more efficient.
Starting and stopping the cryo-cooler is not a viable option as this will wear out the system. It must be guaranteed that the magnet is PROPERLY cooled. If the cooler stops working the helium boils off and the MRI system is lost.
2-25%: such reduction level could be achieved if technical measures could be de-veloped which allow to switch the cryo-cooler off for certain times during 24h
The savings deriving from the above mentioned measures are strongly dependent on the
use of the MR. Intensive use, as assumed in the SRI use scenario implies that the cry-
cooler has to work most of the time in ready-to-scan and off mode to re-condense the he-
lium evaporated during scan. In particular during scan the cryo-cooler could be assumed
to be working without any interruption, therefore the savings could be far lower than theo-
retically expected.
Patient Table 2-5%
Applied BAU from e-motor market
Technical measures:
2-5% improved efficiency of table motors
Summary
Summarizing from all the technical interviews and investigations it can be stated that the
most important and most feasible improvements can be seen in a smarter switching to off
mode of several modules. As the technology of MRI is highly matured, there are physical
boundaries of improvements regarding the power consumption of the modules.
MRI Potential for Improvement
26 / 30
Moreover the applicability of most of the identified technical solutions depends on the
specific technology and would need to be deeply investigated, whether it fits into the envi-
ronment of the MRI technology and its specific technological requirements. For instance
substituting the analog power supply with a switched one could cause disturbances during
scan increasing the noise level in the generated image. A deep redesign of the whole
technology would be required.
6.3 Expected BAU and Improvement Scenarios
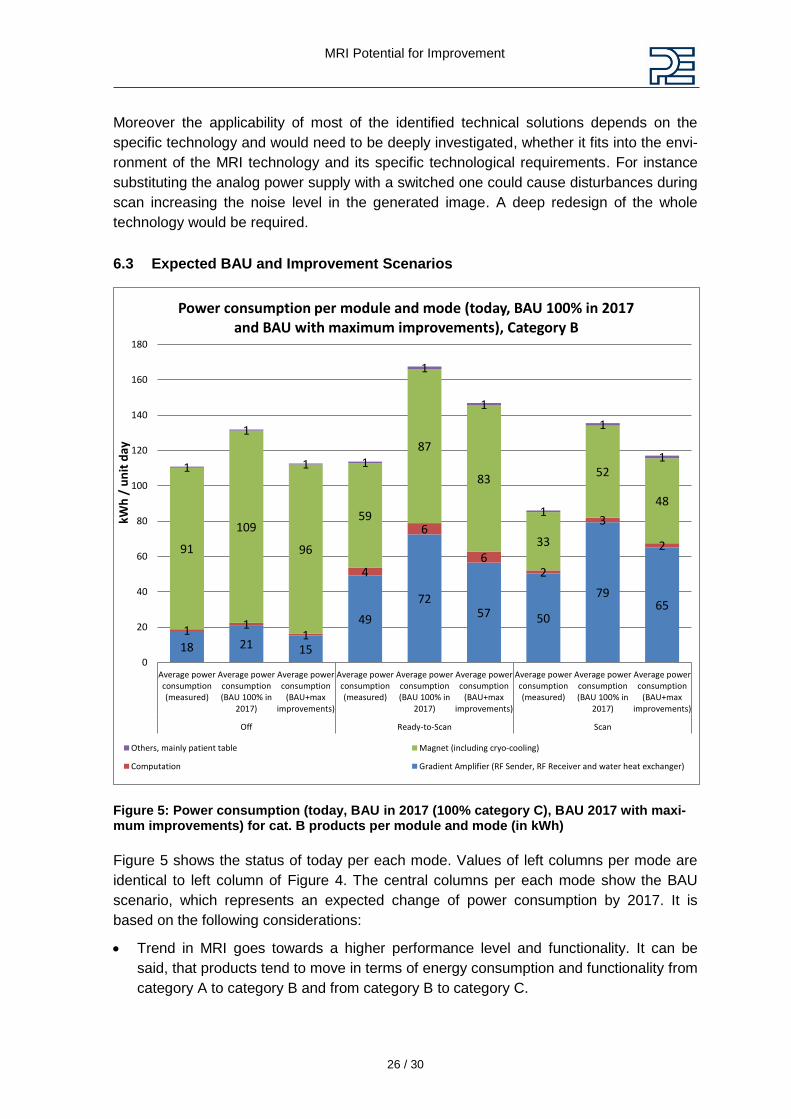
Figure 5: Power consumption (today, BAU in 2017 (100% category C), BAU 2017 with maxi-mum improvements) for cat. B products per module and mode (in kWh)
Figure 5 shows the status of today per each mode. Values of left columns per mode are
identical to left column of Figure 4. The central columns per each mode show the BAU
scenario, which represents an expected change of power consumption by 2017. It is
based on the following considerations:
Trend in MRI goes towards a higher performance level and functionality. It can be
said, that products tend to move in terms of energy consumption and functionality from
category A to category B and from category B to category C.
18 21 15
49
72 57 50
79 65
1 1 1
4
6
6 2
3
2 91
109
96
59
87
83
33
52
48
1
1
1 1
1
1
1
1
1
0
20
40
60
80
100
120
140
160
180
Average powerconsumption(measured)
Average powerconsumption(BAU 100% in
2017)
Average powerconsumption
(BAU+maximprovements)
Average powerconsumption(measured)
Average powerconsumption(BAU 100% in
2017)
Average powerconsumption
(BAU+maximprovements)
Average powerconsumption(measured)
Average powerconsumption(BAU 100% in
2017)
Average powerconsumption
(BAU+maximprovements)
Off Ready-to-Scan Scan
kWh
/ u
nit
day
Power consumption per module and mode (today, BAU 100% in 2017 and BAU with maximum improvements), Category B
Others, mainly patient table Magnet (including cryo-cooling)
Computation Gradient Amplifier (RF Sender, RF Receiver and water heat exchanger)
MRI Potential for Improvement
27 / 30
The development of MRI products will improve the functions and the performances
and therefore an increase of the magnetic field strength and gradient and RF amplifi-
ers is expected. For simplification and in order to apply a worst case scenario it is as-
sumed that all category B products move by 2017 into category C products and thus
the level of power consumption increases respectively according to the today meas-
ured data of category C products. For this reason the scenario is named “BAU 100%
category C” meaning that all category B equipment sold in 2017 will have the same
performances of category C today.
Many predictions or scenarios are thinkable, how much more the BAU scenario will
increase the power consumption or in other words how much more power the new
performance and functions will require. There is no historical consumption data availa-
ble to build a trend that can be interpolated to provide forecasts. The only solid refer-
ence is given by the measurements of products from the three categories during this
project.
The right columns of Figure 5 per mode show the identified maximum improvement poten-
tials, which represents the mix of a Best Available Technology (BAT) and Best not yet
Available Technology (BNAT), since the improvement options partly refer to ideas and
approaches, which are not yet fully developed. The improved power consumption is ap-
plied to the BAU scenario (central columns).
The power reduction used to generate the right columns follows the highest level of ambi-
tiousness since all identified improvements mechanisms are applied at once to each
module in each mode to all models, an assumption that would prove un-realistic due to
technical feasibility as already presented. However, even in this scenario it seems not
avoidable that an increase of power consumption takes place due to the newly and addi-
tionally integrated functions to and within MRIs.
MRI Potential for Improvement
28 / 30
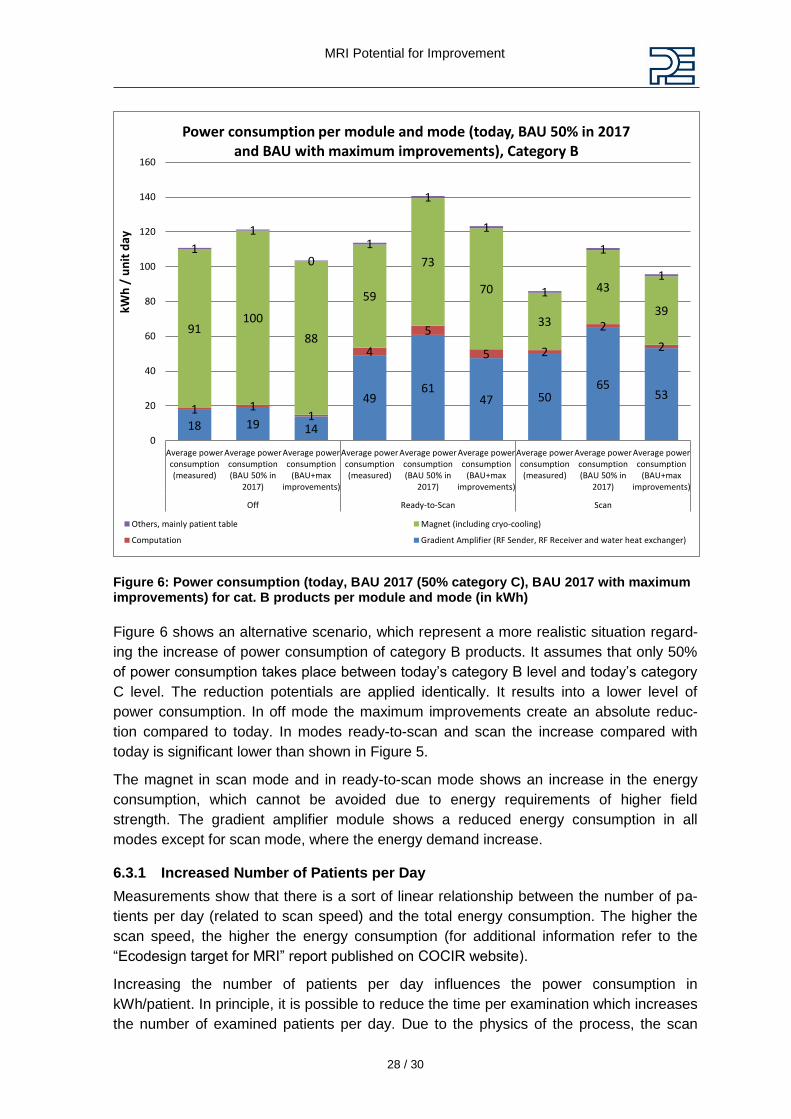
Figure 6: Power consumption (today, BAU 2017 (50% category C), BAU 2017 with maximum improvements) for cat. B products per module and mode (in kWh)
Figure 6 shows an alternative scenario, which represent a more realistic situation regard-
ing the increase of power consumption of category B products. It assumes that only 50%
of power consumption takes place between today’s category B level and today’s category
C level. The reduction potentials are applied identically. It results into a lower level of
power consumption. In off mode the maximum improvements create an absolute reduc-
tion compared to today. In modes ready-to-scan and scan the increase compared with
today is significant lower than shown in Figure 5.
The magnet in scan mode and in ready-to-scan mode shows an increase in the energy
consumption, which cannot be avoided due to energy requirements of higher field
strength. The gradient amplifier module shows a reduced energy consumption in all
modes except for scan mode, where the energy demand increase.
6.3.1 Increased Number of Patients per Day
Measurements show that there is a sort of linear relationship between the number of pa-
tients per day (related to scan speed) and the total energy consumption. The higher the
scan speed, the higher the energy consumption (for additional information refer to the
“Ecodesign target for MRI” report published on COCIR website).
Increasing the number of patients per day influences the power consumption in
kWh/patient. In principle, it is possible to reduce the time per examination which increases
the number of examined patients per day. Due to the physics of the process, the scan
18 19 14
49 61
47 50 65
53 1 1
1
4
5
5 2
2
2
91 100
88
59
73
70
33
43
39
1
1
0
1
1
1
1
1
1
0
20
40
60
80
100
120
140
160
Average powerconsumption(measured)
Average powerconsumption(BAU 50% in
2017)
Average powerconsumption
(BAU+maximprovements)
Average powerconsumption(measured)
Average powerconsumption(BAU 50% in
2017)
Average powerconsumption
(BAU+maximprovements)
Average powerconsumption(measured)
Average powerconsumption(BAU 50% in
2017)
Average powerconsumption
(BAU+maximprovements)
Off Ready-to-Scan Scan
kWh
/ u
nit
day
Power consumption per module and mode (today, BAU 50% in 2017
and BAU with maximum improvements), Category B
Others, mainly patient table Magnet (including cryo-cooling)
Computation Gradient Amplifier (RF Sender, RF Receiver and water heat exchanger)
MRI Potential for Improvement
29 / 30
speed cannot be increased as such, but new sequences have to be developed which
could produce the same results in a shorter time. This would result in the loss of compa-
rability of power consumptions due to different functional unit. The reduction of the dura-
tion of the examination could also be achieved by reducing the “administrative time” i.e.
patient preparation, data input and archiving etc. Such improvement is highly depending
on the kind of use in the respective hospital and related circumstances from persons and
examinations, therefore is not under the control of the manufacturer. For this reason an
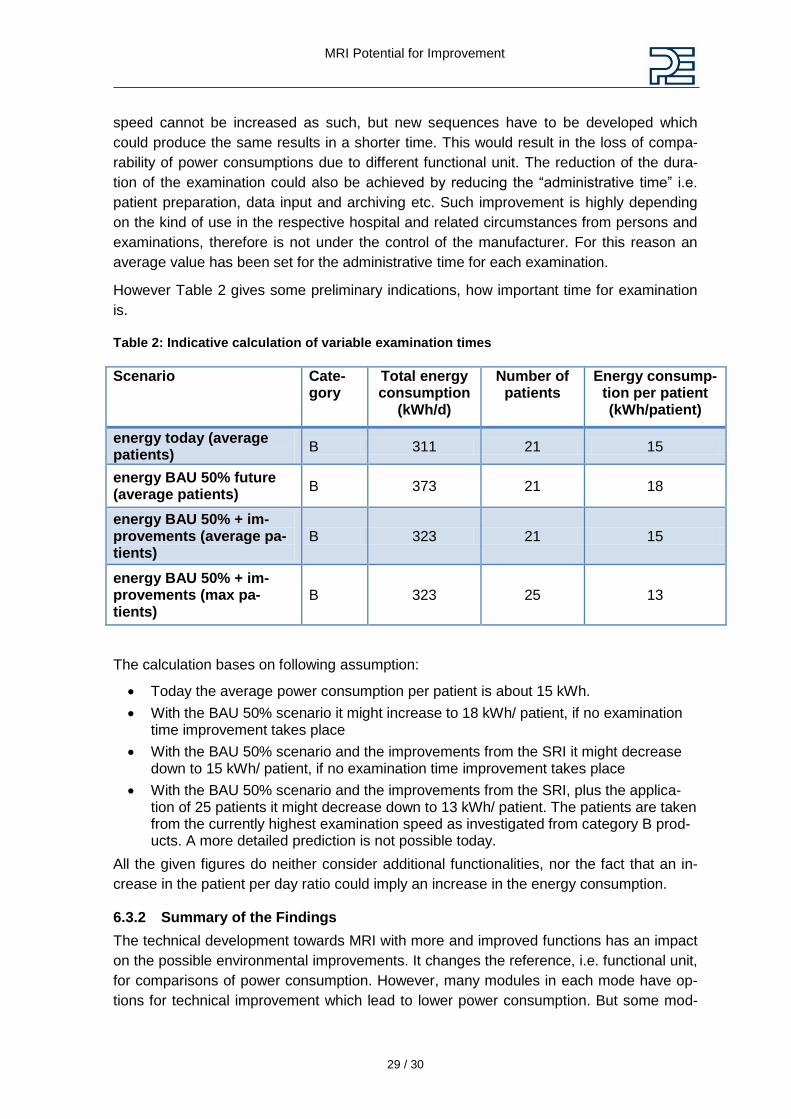
average value has been set for the administrative time for each examination.
However Table 2 gives some preliminary indications, how important time for examination
is.
Table 2: Indicative calculation of variable examination times
Scenario Cate-gory
Total energy consumption
(kWh/d)
Number of patients
Energy consump-tion per patient (kWh/patient)
energy today (average patients)
B 311 21 15
energy BAU 50% future (average patients)
B 373 21 18
energy BAU 50% + im-provements (average pa-tients)
B 323 21 15
energy BAU 50% + im-provements (max pa-tients)
B 323 25 13
The calculation bases on following assumption:
Today the average power consumption per patient is about 15 kWh.
With the BAU 50% scenario it might increase to 18 kWh/ patient, if no examination time improvement takes place
With the BAU 50% scenario and the improvements from the SRI it might decrease down to 15 kWh/ patient, if no examination time improvement takes place
With the BAU 50% scenario and the improvements from the SRI, plus the applica-tion of 25 patients it might decrease down to 13 kWh/ patient. The patients are taken from the currently highest examination speed as investigated from category B prod-ucts. A more detailed prediction is not possible today.
All the given figures do neither consider additional functionalities, nor the fact that an in-
crease in the patient per day ratio could imply an increase in the energy consumption.
6.3.2 Summary of the Findings
The technical development towards MRI with more and improved functions has an impact
on the possible environmental improvements. It changes the reference, i.e. functional unit,
for comparisons of power consumption. However, many modules in each mode have op-
tions for technical improvement which lead to lower power consumption. But some mod-
MRI Potential for Improvement
30 / 30
ules clearly have to follow physical constraints in order to provide the intended functions
appropriately.
The highest improvement potentials are buried in modules and modes, in which in princi-
ple no function is provided, i.e. off mode and partly ready-to-scan mode. A combination of
increased efficiencies and smart switching off functions are therefore considered. Also,
the more the modules are investigated separately and understood as individual sub-
products or parts with individual improvement options the higher is the probability to reap
the potential.
Overall there are two scenarios presented for category B products, in which an increase of
power consumption is expected in case of BAU. The improvement potentials initiated from
the SRI can lower these increases, but due to more functions and better examinations a
low increase of the level of power consumption in absolute terms might occur. However
the measures and improvement potentials are all proven to be ambitious and that the
scenarios reflect the best possible situation. This is supported from action items, which
would not work without the SRI for example the influence on the supplier of the cryo-
cooler because of combined market power.
Related Documents