Report on World Tourism Economy Trends (2018) Song Rui Tourism Research Center, Chinese Academy of Social Sciences March 7, 2018, Berlin

Welcome message from author
This document is posted to help you gain knowledge. Please leave a comment to let me know what you think about it! Share it to your friends and learn new things together.
Transcript

Report on World Tourism Economy Trends (2018)
Song Rui
Tourism Research Center, Chinese Academy of Social Sciences
March 7, 2018, Berlin
TREND I Fast and comprehensive growth of the global tourism economy
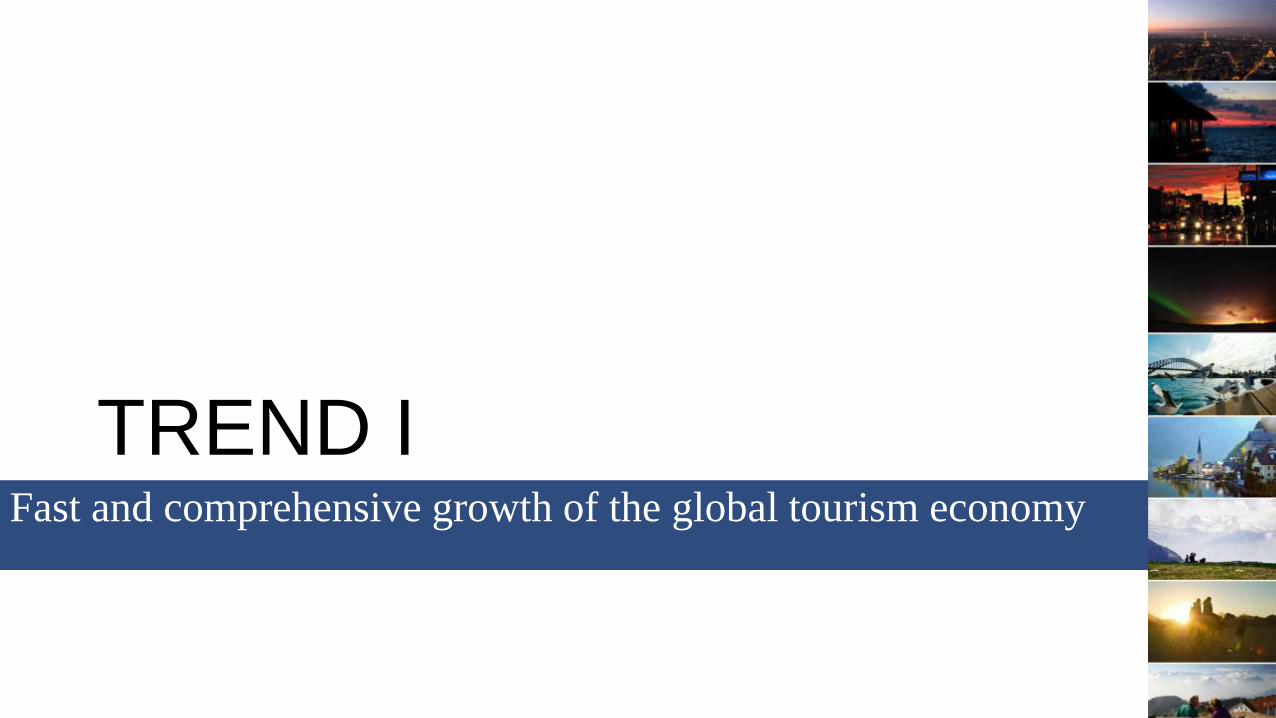
The total global tourist arrivals reached nearly 11.9 billion in 2017,
1.6 times as many as the total global population
Global Total Tourist Arrivals (2015-2018)
2015 2016 2017 2018F
Total global tourist arrivals (trillion) 10.45 11.12 11.88 12.67
Ratio of global tourist arrivals to global population ( 100%) 1.4 1.5 1.6 1.7
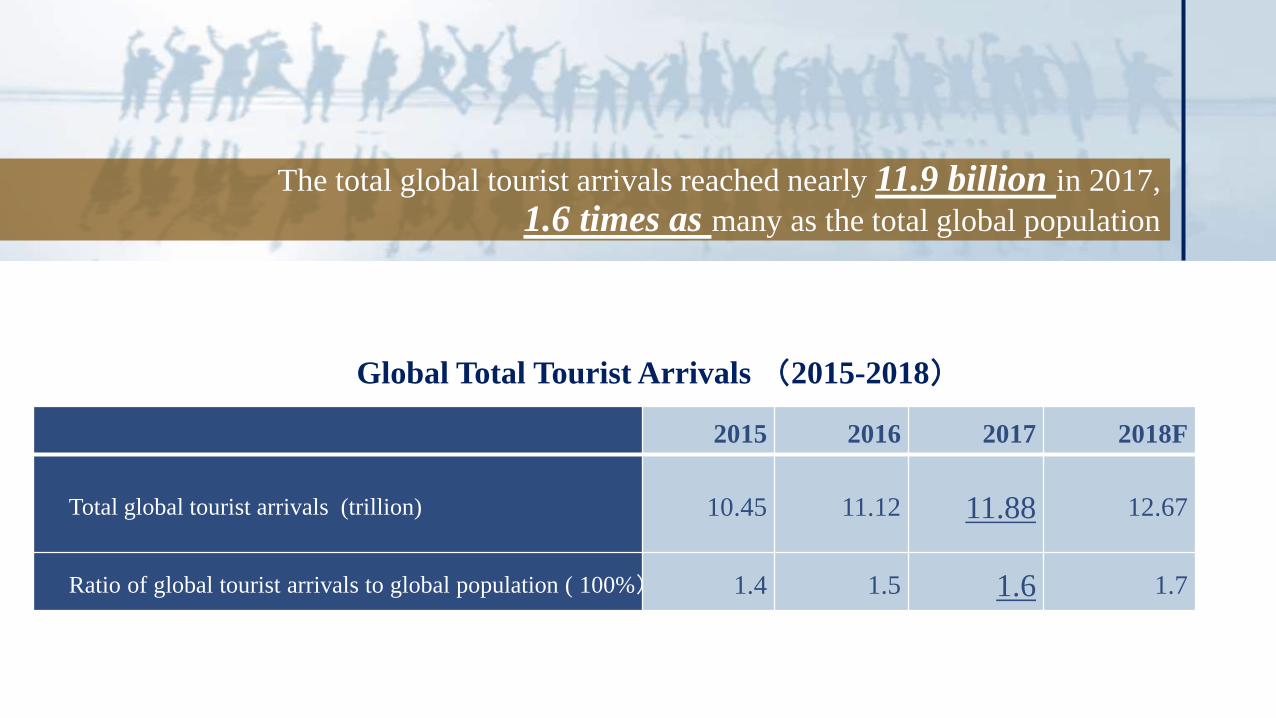
Global tourist revenue amounted USD 5.3 trillion, around 6.7% of GDP in 2017
Global Total Tourist Revenue (2015-2018)
2015 2016 2017 2018F
Total global tourist revenue (USD trillion) 4.9 5.0 5.3 5.6
Percentage to global GDP (%) 6.6 6.7 6.7 6.8

Global tourism growth rate kept increasing in 2017
Global tourism economy growth rates (2016-2018)
2016 2017 2018F
Growth rate of global tourist arrivals (%) 6.4 6.8 6.7
Growth rate of total global tourist revenue (%) 2.6 4.3 5.9
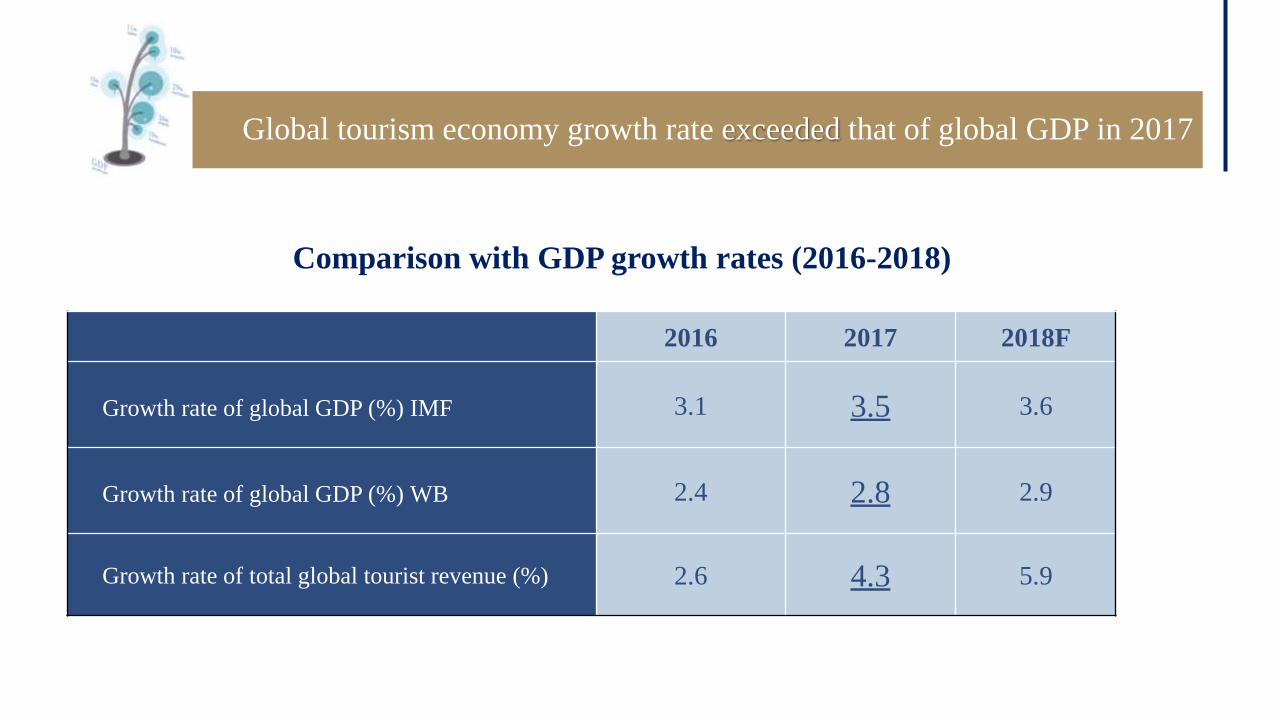
Global tourism economy growth rate exceeded that of global GDP in 2017
Comparison with GDP growth rates (2016-2018)
2016 2017 2018F
Growth rate of global GDP (%) IMF 3.1 3.5 3.6
Growth rate of global GDP (%) WB 2.4 2.8 2.9
Growth rate of total global tourist revenue (%) 2.6 4.3 5.9

Global tourism economy grew comprehensively
Tourism growth rates of five regions in 2017
Europe America
Asia-Pacific
Middle
East Africa
Growth rate of
total tourist
arrivals
2.1% 1.9% 9.4% 0.9% 1.0%
Growth rate of
total tourist
revenue
1.1% 4.9% 6.9% 4.8% 3.5%

The global tourism growth will still be higher than the global economy growth in 2018
global tourism economy in 2018 (forecast)
High growth
situation Ordinary situation
Low growth
situation
Total global tourist arrivals(billion) 12.88 12.67 12.45
Growth rate of total tourist arrivals 7.8% 6.7% 5.5%
Total global tourist revenue (USD 1 trillion) 5.66 5.57 5.48
Growth rate of total global tourist revenue 6.7% 5.9% 5.0%
TREND II The evolving balance of the global tourism tripartite pattern
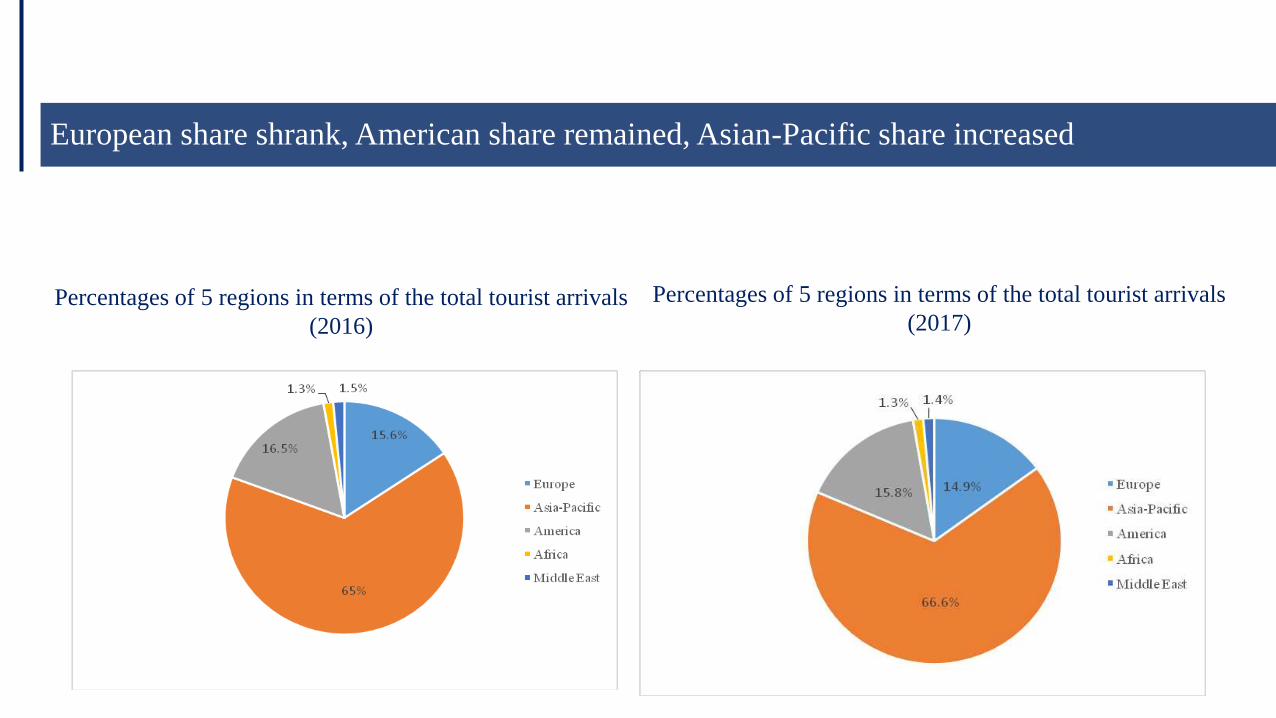
European share shrank, American share remained, Asian-Pacific share increased
Percentages of 5 regions in terms of the total tourist arrivals
(2016)
Percentages of 5 regions in terms of the total tourist arrivals
(2017)
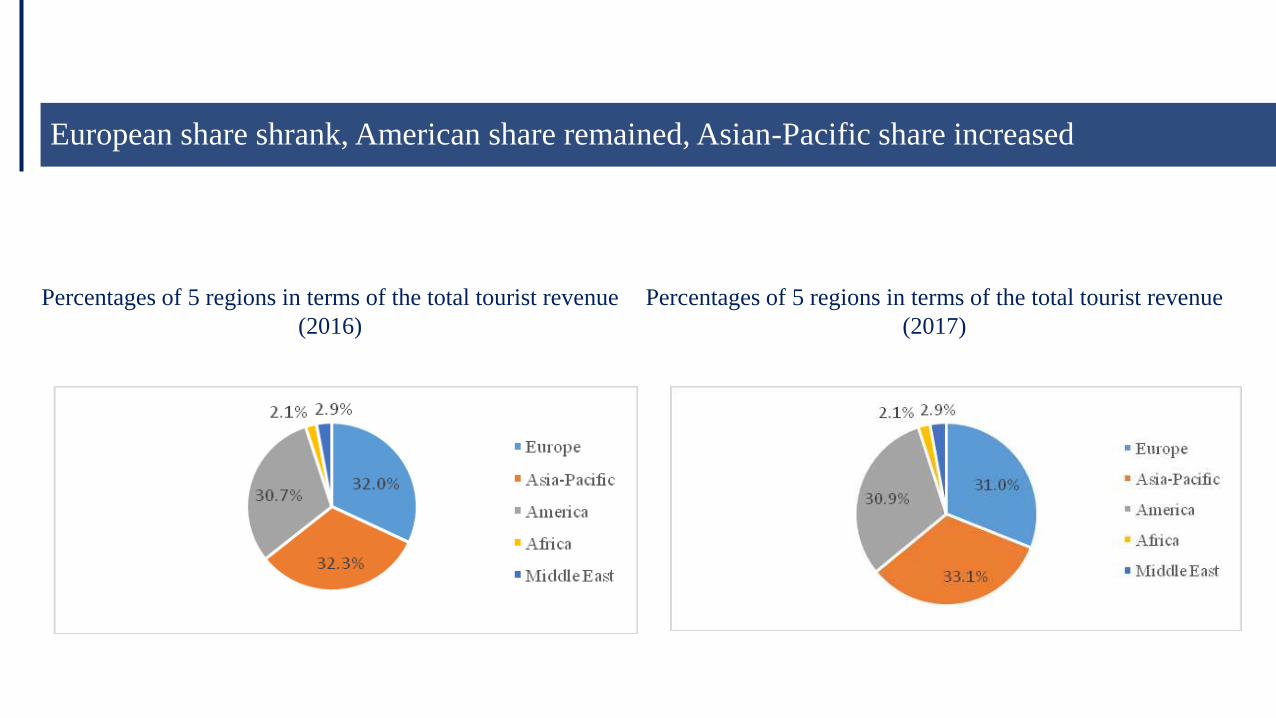
European share shrank, American share remained, Asian-Pacific share increased
Percentages of 5 regions in terms of the total tourist revenue
(2016)
Percentages of 5 regions in terms of the total tourist revenue
(2017)
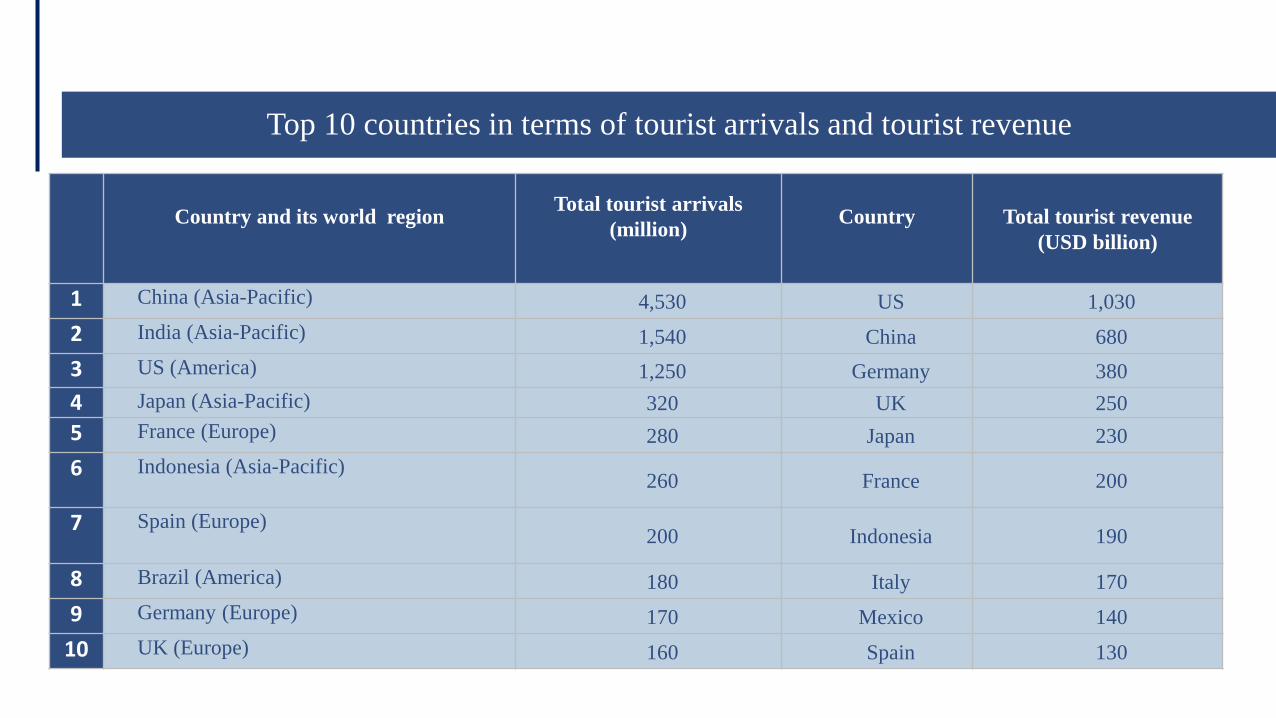
Top 10 countries in terms of tourist arrivals and tourist revenue
Country and its world region
Total tourist arrivals
(million)
Country
Total tourist revenue
(USD billion)
1 China (Asia-Pacific) 4,530 US 1,030
2 India (Asia-Pacific) 1,540 China 680
3 US (America) 1,250 Germany 380
4 Japan (Asia-Pacific) 320 UK 250
5 France (Europe) 280 Japan 230
6 Indonesia (Asia-Pacific) 260 France 200
7 Spain (Europe) 200 Indonesia 190
8 Brazil (America) 180 Italy 170
9 Germany (Europe) 170 Mexico 140
10 UK (Europe) 160 Spain 130

This pattern will be more evident in 2018
Asia-Pacific
America
Europe
Middle East
Africa
Total tourist arrivals 68.0% 15.1% 14.3% 1.4% 1.2%
Total tourist revenue 34.0% 31.0% 30.1% 2.9% 2.0%
Percentages of 5 regions in global tourism in 2018 (prediction)

TREND III The faster growth of tourism in emerging economies
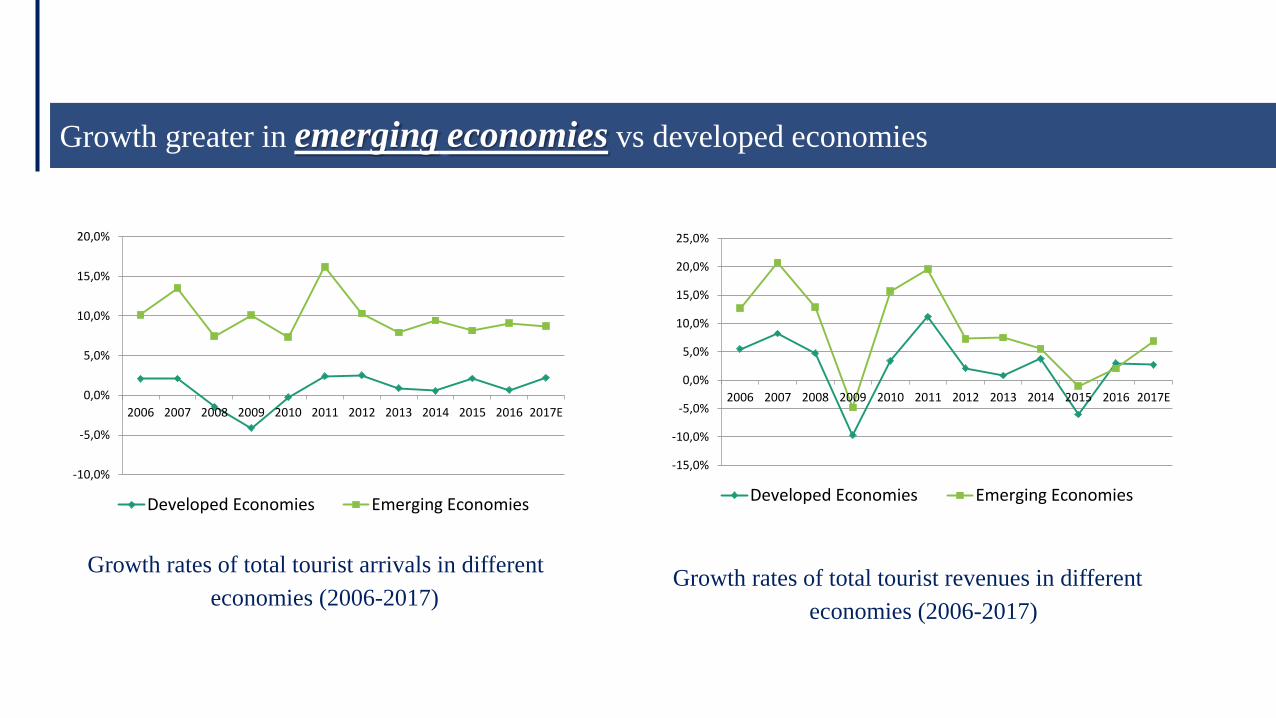
Growth greater in emerging economies vs developed economies
-15,0%
-10,0%
-5,0%
0,0%
5,0%
10,0%
15,0%
20,0%
25,0%
2006 2007 2008 2009 2010 2011 2012 2013 2014 2015 2016 2017E
Developed Economies Emerging Economies-10,0%
-5,0%
0,0%
5,0%
10,0%
15,0%
20,0%
2006 2007 2008 2009 2010 2011 2012 2013 2014 2015 2016 2017E
Developed Economies Emerging Economies
Growth rates of total tourist arrivals in different
economies (2006-2017)
Growth rates of total tourist revenues in different
economies (2006-2017)
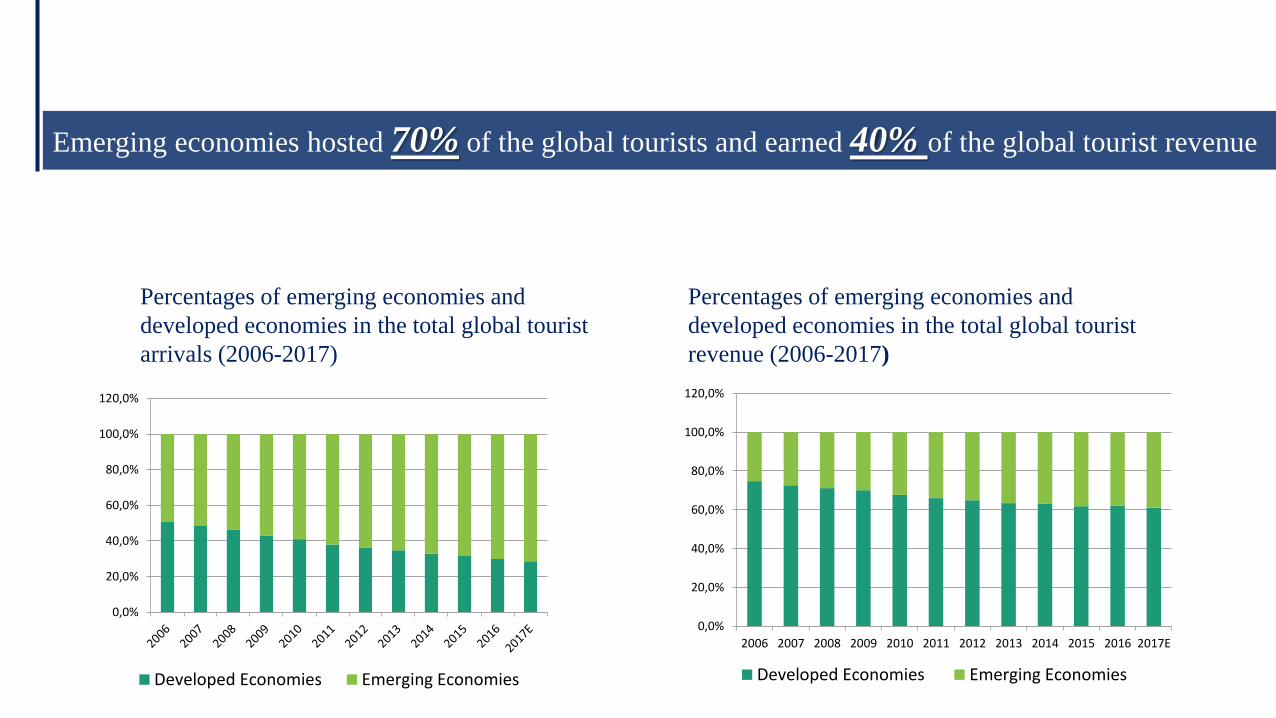
Emerging economies hosted 70% of the global tourists and earned 40% of the global tourist revenue
Percentages of emerging economies and
developed economies in the total global tourist
arrivals (2006-2017)
Percentages of emerging economies and
developed economies in the total global tourist
revenue (2006-2017)
0,0%
20,0%
40,0%
60,0%
80,0%
100,0%
120,0%
Developed Economies Emerging Economies
0,0%
20,0%
40,0%
60,0%
80,0%
100,0%
120,0%
2006 2007 2008 2009 2010 2011 2012 2013 2014 2015 2016 2017E
Developed Economies Emerging Economies

In 2018, both tourist arrivals and tourist revenue of emerging economies will grow faster than those of developed countries
Growth rates of the total tourist revenues of emerging economies and developed countries in 2018 (forecast)
Developed countries Emerging economies
Growth rate of tourist arrivals 1.8% 8.7%
Growth rate of total tourist revenue
3.7% 9.3%
TREND IV The outstanding tourism development of BRICS countries
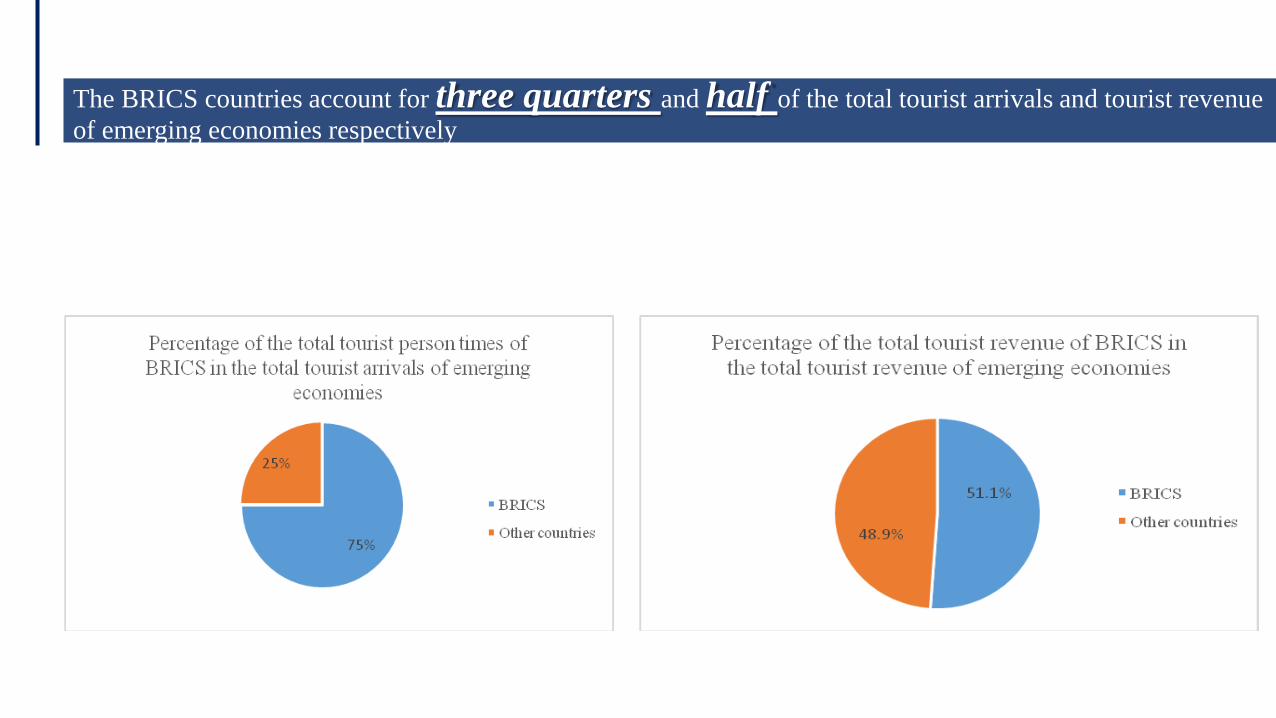
The BRICS countries account for three quarters and half of the total tourist arrivals and tourist revenue
of emerging economies respectively

TREND V Tourism growth’s contribution to global trade

The growth rate of the global international tourism was higher than that of the global international trade
Growth rates of global trade and global tourism trade (2006-2017)
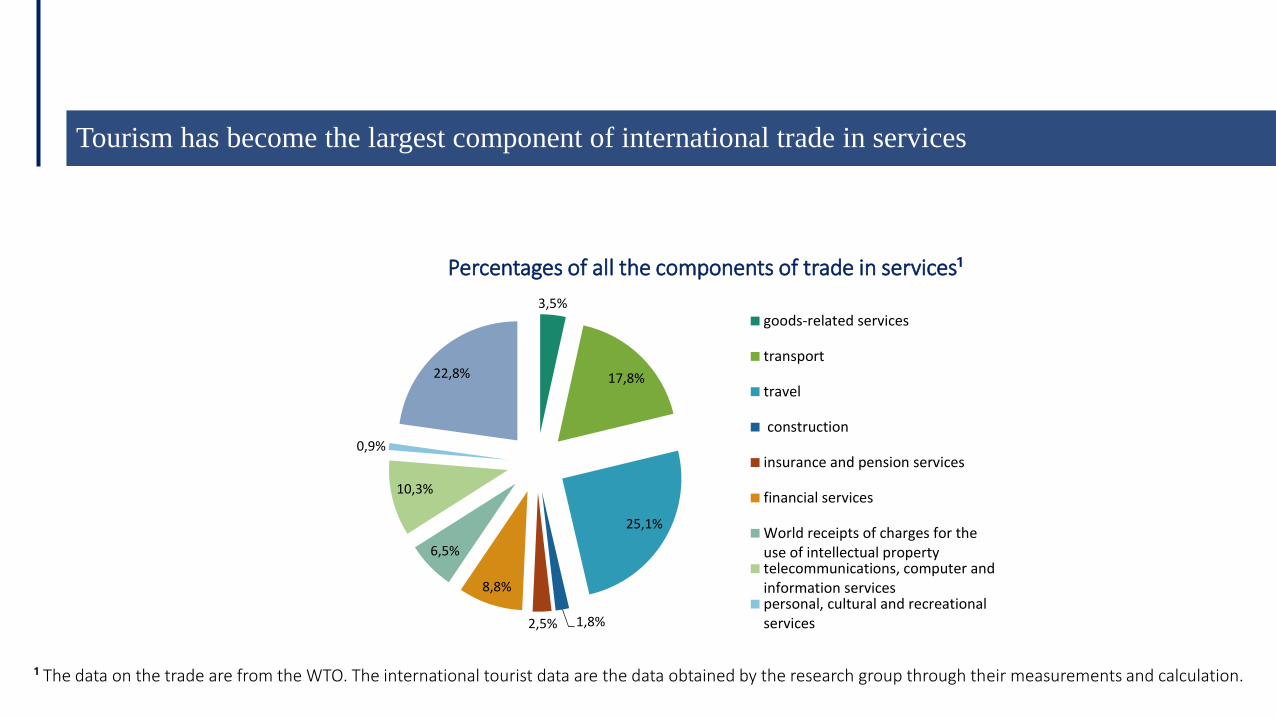
Tourism has become the largest component of international trade in services
Percentages of all the components of trade in services¹
¹ The data on the trade are from the WTO. The international tourist data are the data obtained by the research group through their measurements and calculation.
3,5%
17,8%
25,1%
1,8% 2,5%
8,8%
6,5%
10,3%
0,9%
22,8%
goods-related services
transport
travel
construction
insurance and pension services
financial services
World receipts of charges for theuse of intellectual propertytelecommunications, computer andinformation servicespersonal, cultural and recreationalservices
TREND VI Rapid growth in global tourism investment

Global tourism investment grew by 4.1%
0
100
200
300
400
500
600
700
800
900
2008 2009 2010 2011 2012 2013 2014 2015 2016 2017
Global Tourism Investment amounts from 2008 to 2017
(USD Billion )
Source: WTTC
The tourism investment includes the inputs of the industries directly related to tourism.
-10,0%
-8,0%
-6,0%
-4,0%
-2,0%
0,0%
2,0%
4,0%
6,0%
8,0%
10,0%
2008 2009 2010 2011 2012 2013 2014 2015 2016 2017
Growth Rate of Global Tourism Investment in 2008-2017

Tourism investment in Asia-Pacific was the largest and the growth rate was the fastest
Annual average tourism investment growth rates of the five great regions (2008-2017)
Tourism investment percentages of five great regions (2017)

TREND VII Cities important roles in the global tourism economy

2/3 of the WTCF member cities have received more than ¼ of the global inbound tourists
Percentage of the inbound tourists received by 87 of the WTCF city members
WTCF has 128 city members
Percentage of 87 WTCF City Members
Percentage of others
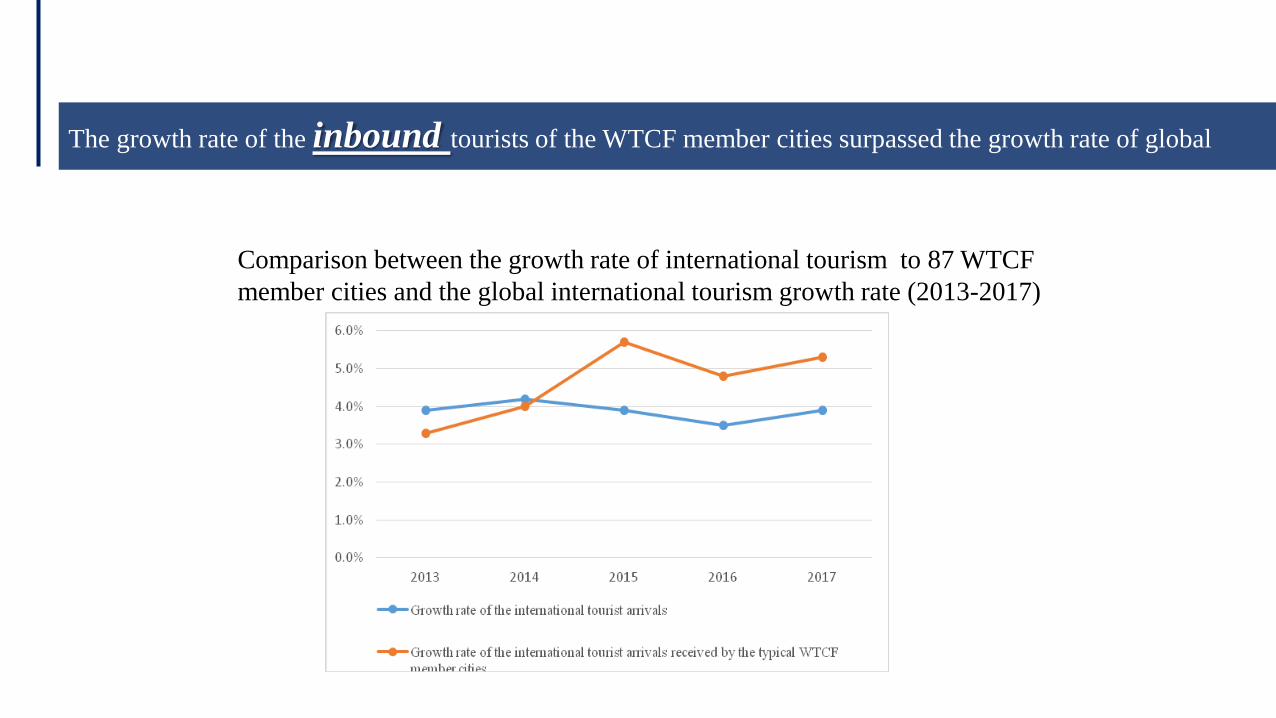
The growth rate of the inbound tourists of the WTCF member cities surpassed the growth rate of global
Comparison between the growth rate of international tourism to 87 WTCF
member cities and the global international tourism growth rate (2013-2017)

The domestic tourism growth rate of the WTCF member cities is higher than the global
The domestic tourism growth rate of the 44 WTCF member cities and
the growth rate of the total global domestic tourist arrivals (2012-2016)
TREND VIII Good growth momentum of listed tourism companies
Data source: Wind Data
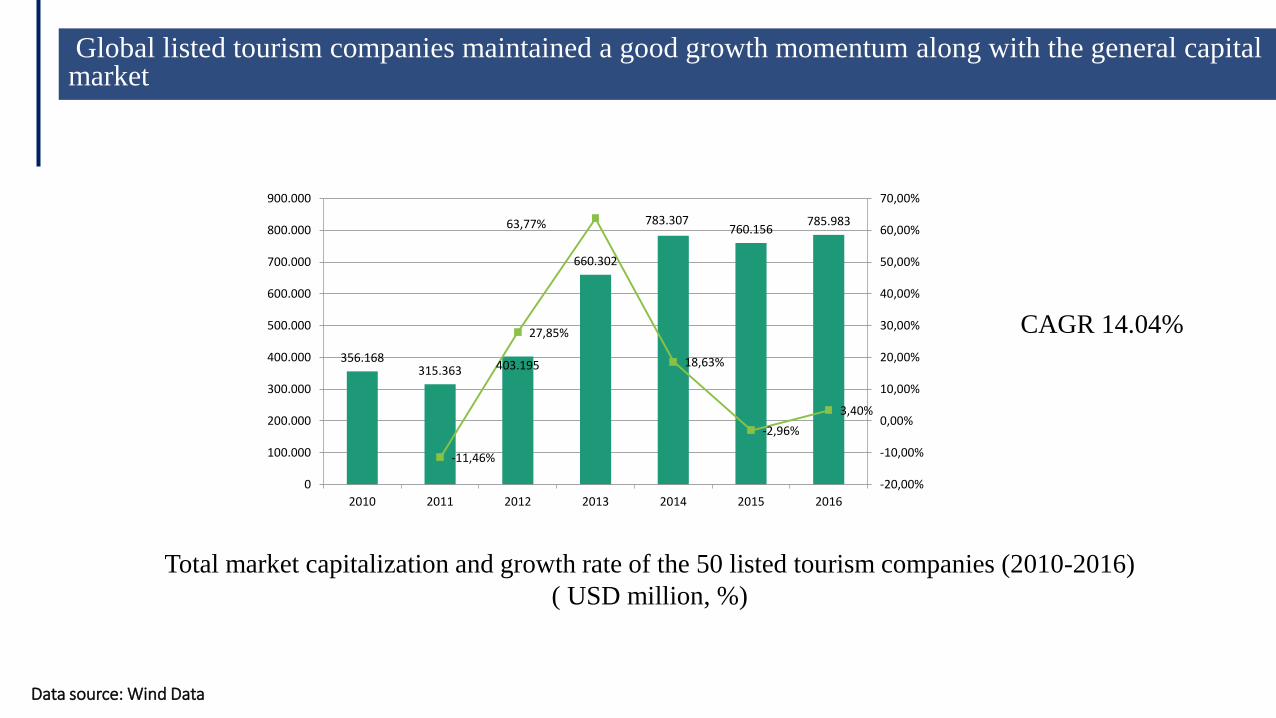
Total market capitalization and growth rate of the 50 listed tourism companies (2010-2016)
( USD million, %)
Global listed tourism companies maintained a good growth momentum along with the general capital market
356.168 315.363 403.195
660.302
783.307 760.156
785.983
-11,46%
27,85%
63,77%
18,63%
-2,96%
3,40%
-20,00%
-10,00%
0,00%
10,00%
20,00%
30,00%
40,00%
50,00%
60,00%
70,00%
0
100.000
200.000
300.000
400.000
500.000
600.000
700.000
800.000
900.000
2010 2011 2012 2013 2014 2015 2016
CAGR 14.04%
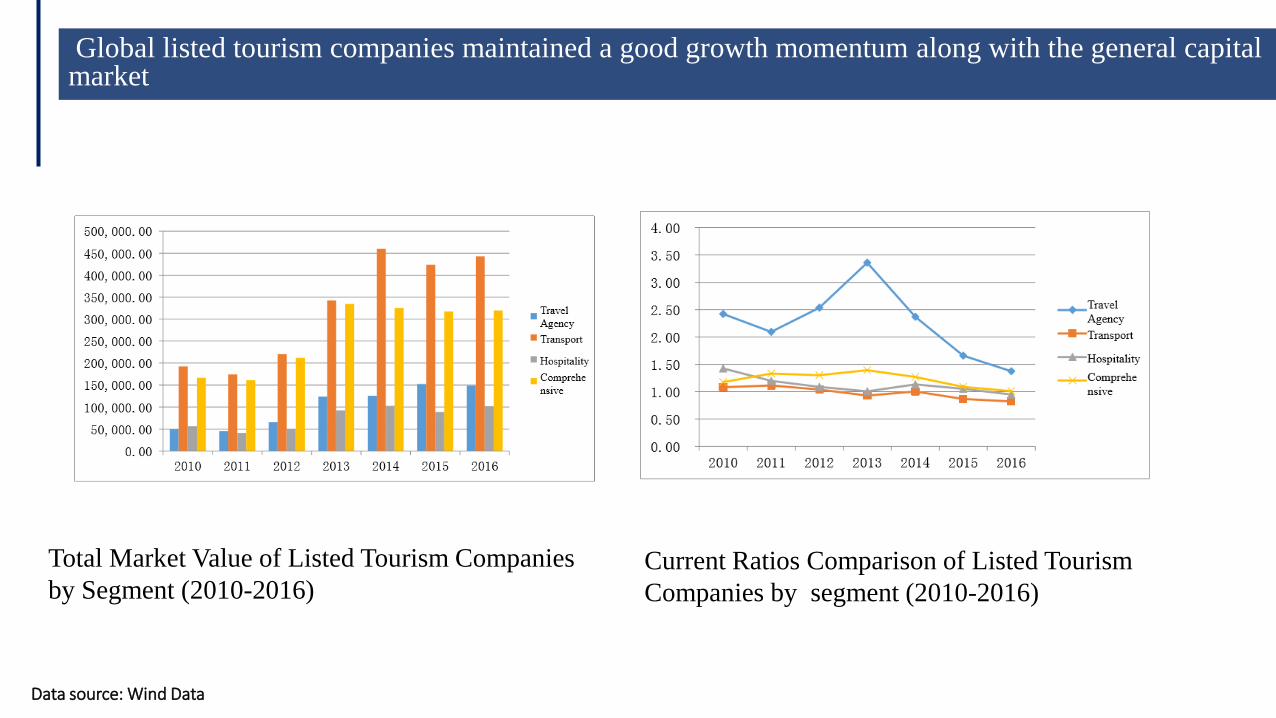
Data source: Wind Data
Current Ratios Comparison of Listed Tourism
Companies by segment (2010-2016)
Total Market Value of Listed Tourism Companies
by Segment (2010-2016)
Global listed tourism companies maintained a good growth momentum along with the general capital market
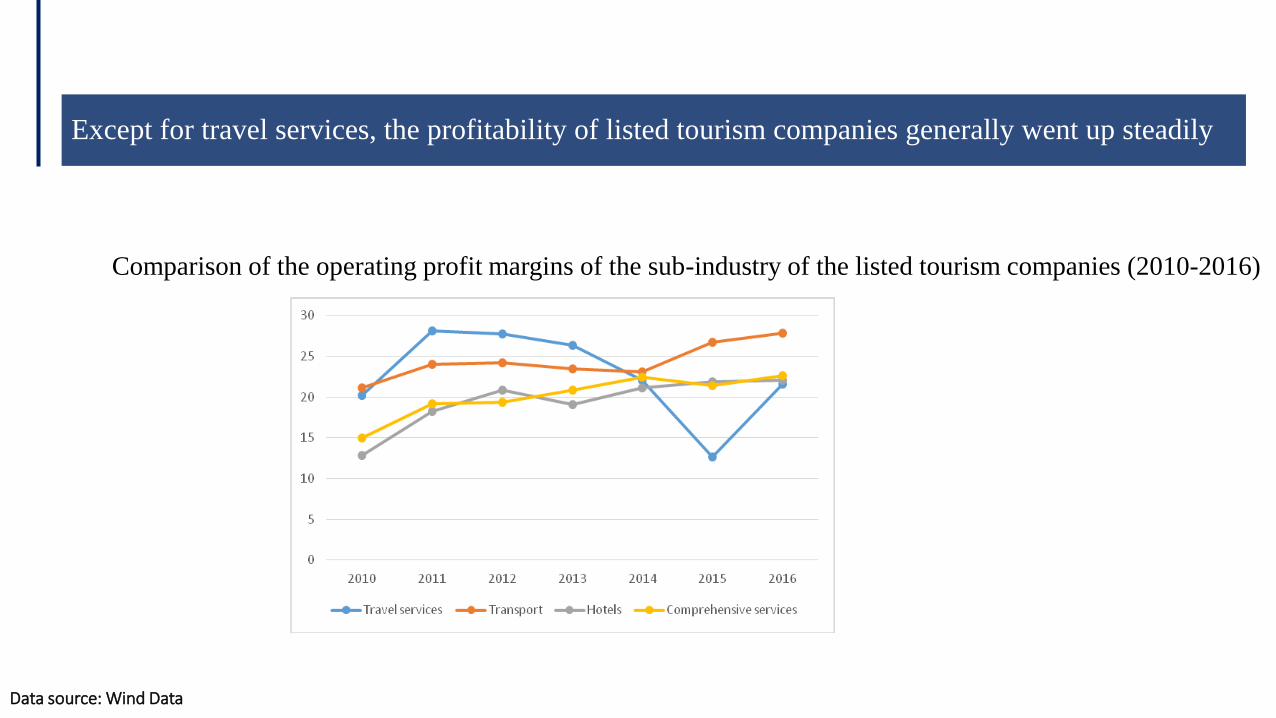
Except for travel services, the profitability of listed tourism companies generally went up steadily
Comparison of the operating profit margins of the sub-industry of the listed tourism companies (2010-2016)
Data source: Wind Data

TREND IX Eight new technologies changing global tourism development
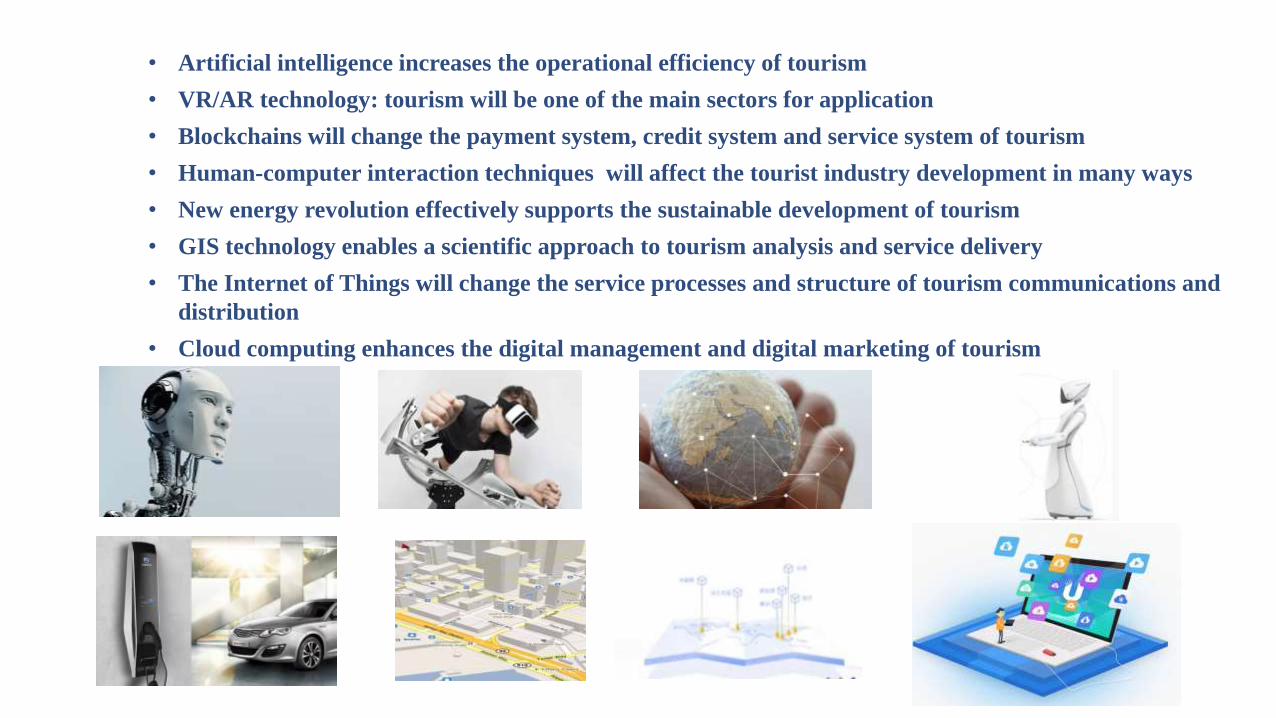
• Artificial intelligence increases the operational efficiency of tourism
• VR/AR technology: tourism will be one of the main sectors for application
• Blockchains will change the payment system, credit system and service system of tourism
• Human-computer interaction techniques will affect the tourist industry development in many ways
• New energy revolution effectively supports the sustainable development of tourism
• GIS technology enables a scientific approach to tourism analysis and service delivery
• The Internet of Things will change the service processes and structure of tourism communications and
distribution
• Cloud computing enhances the digital management and digital marketing of tourism
TREND X Tourism faces challenges of human capital

The gap of tourism in human capital is large
Data source: TRAVEL & TOURISM ECONOMIC IMPACT 2017 WORLD, WTTC
Trend of the ratio of the created direct jobs in the tourist industry to the total jobs
Among 46 countries, 37 of them
would encounter shortage of
human capital in tourism
industry, while only 6 countries
would have this problem in
national economy.
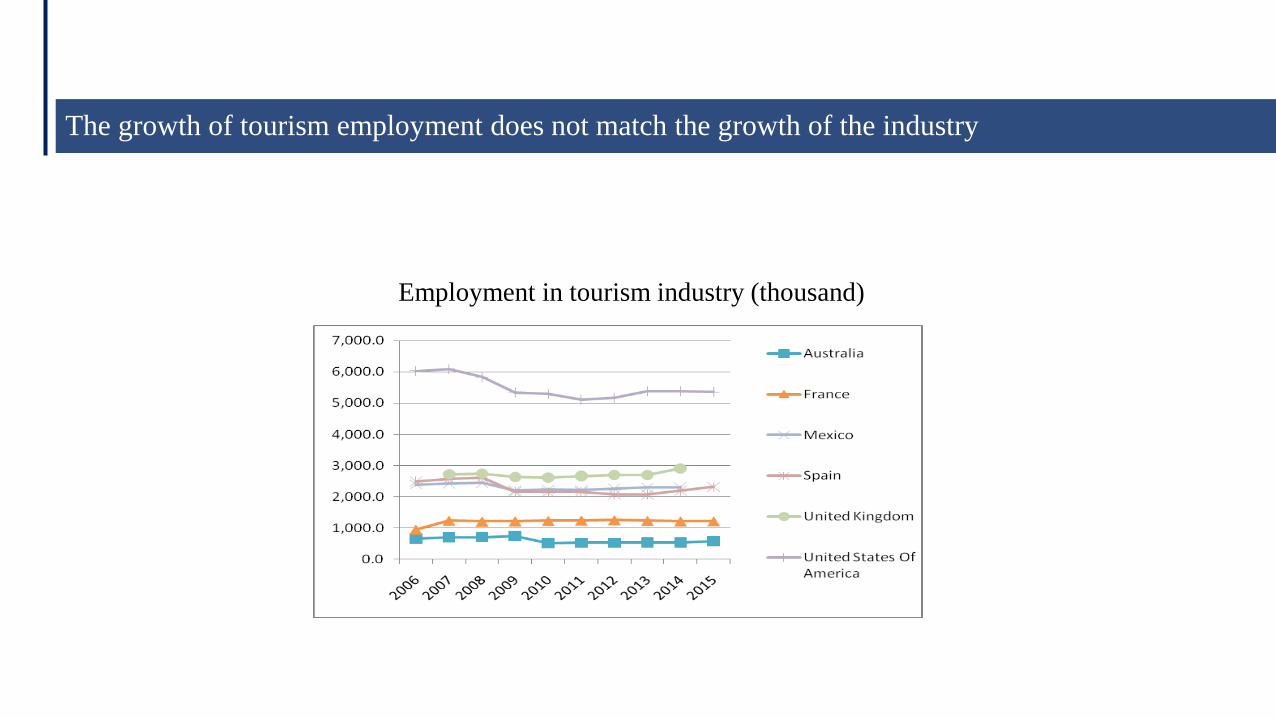
The growth of tourism employment does not match the growth of the industry
Employment in tourism industry (thousand)

High-end management and technology talents are insufficient
• Tourism has started to change from a labor-intensive industry into a capital-intensive and technology-intensive tourism. The transformation needs high-end management and technology talents with high-level skills and new thinking.
• As new technologies appear and they penetrate the tourist industry, the demand of tourism for high-end technical talents will be very high and the gap in this aspect will be large
• Because the demands of customers for tourist services are increasingly diversified and customized, the future tourist management personnel need more extensive management abilities and business liability.
• The global tourism industry is facing the problems of high staff turnover rate and the talents moving toward other industries. WTTC data suggests that the employee turnover rate of the tourism industry is between 3-36% p.a. with average of 18%. The turnover rates of the non-technical workers, salespersons and customer service staff are the highest.
High mobilities of tourism employment
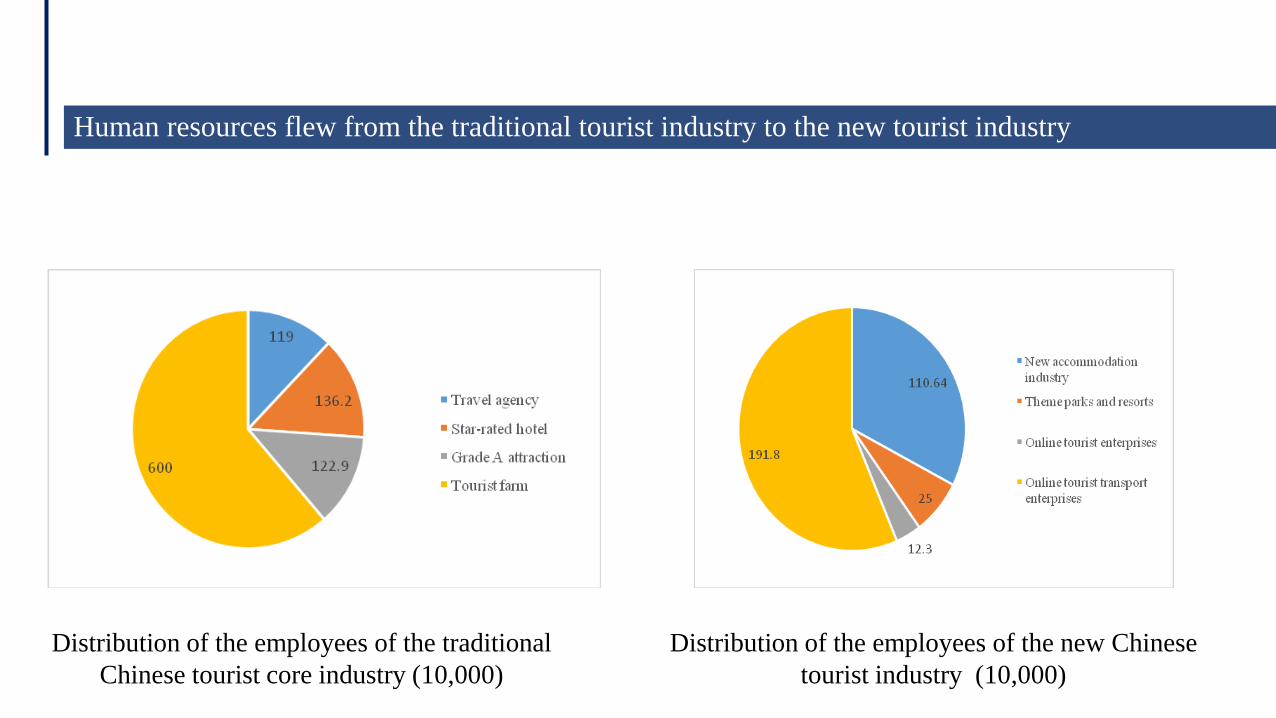
Human resources flew from the traditional tourist industry to the new tourist industry
Distribution of the employees of the traditional
Chinese tourist core industry (10,000)
Distribution of the employees of the new Chinese
tourist industry (10,000)
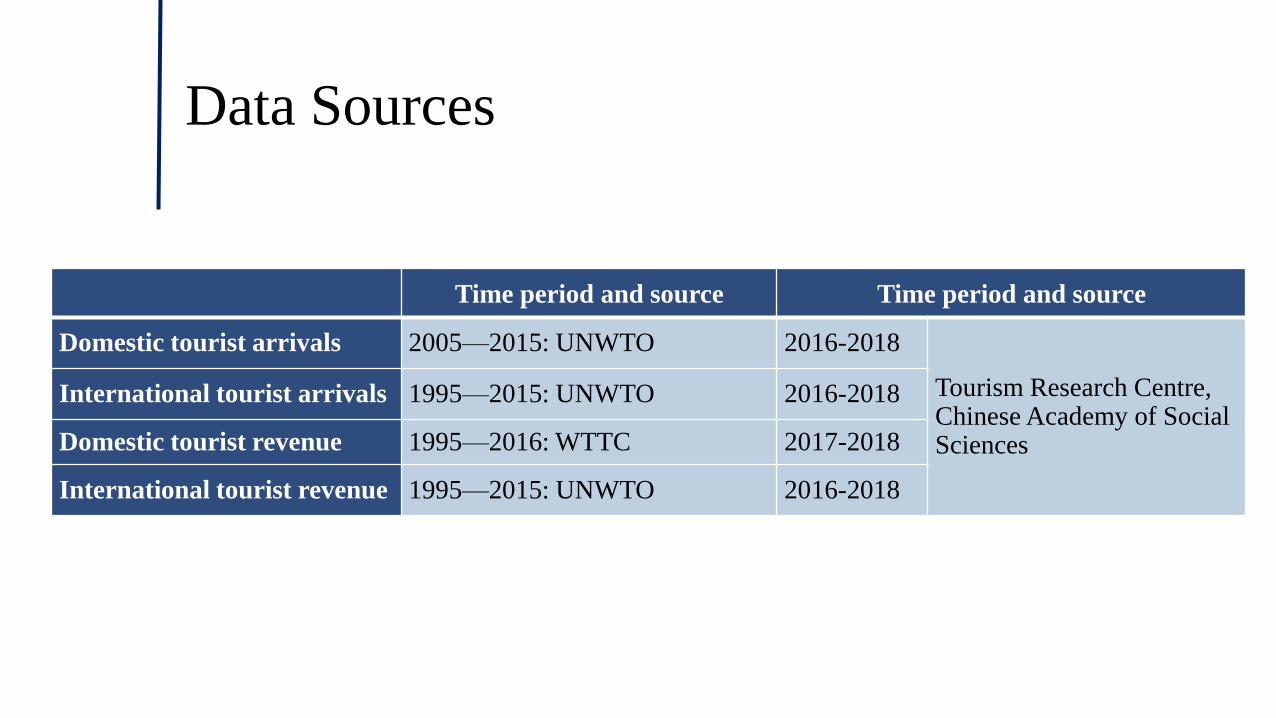
Data Sources
Time period and source Time period and source
Domestic tourist arrivals 2005—2015: UNWTO 2016-2018
Tourism Research Centre, Chinese Academy of Social Sciences
International tourist arrivals 1995—2015: UNWTO 2016-2018
Domestic tourist revenue 1995—2016: WTTC 2017-2018
International tourist revenue 1995—2015: UNWTO 2016-2018

II
III
Growth of tourism in relation to global trade

THANKS FOR YOUR ATTENTION
Related Documents