Report on Texas Bridges As of September 2014

Welcome message from author
This document is posted to help you gain knowledge. Please leave a comment to let me know what you think about it! Share it to your friends and learn new things together.
Transcript
Report on Texas Bridges
As of September 2014

2014 Report on Texas Bridges
Report on Texas Bridges
As of September 2014
Prepared by the Bridge Division
Texas Department of Transportation
Current Edition Available Electronically – Hard Copies Not Published

2014 Report on Texas Bridges
ii
Page Intentionally Left Blank
2014 Report on Texas Bridges
iii
Contents
Executive Summary ...................................................................................................... 1
Chapter 1 – Overview .................................................................................................. 3
Introduction ............................................................................................................ 3
Purpose ................................................................................................................... 4
Data Sources .......................................................................................................... 4
Chapter 2 – Characteristics of Texas Bridges ..................................................... 5
Terms ...................................................................................................................... 5
On- and Off-System Bridges .................................................................................. 5
Age .......................................................................................................................... 5
Chapter 3 – Condition of Texas Bridges ................................................................ 7
Terms ...................................................................................................................... 7
Bridge Conditions ................................................................................................... 8
Change in Bridge Conditions Over Time ............................................................... 9
Load-Posted and Closed Bridges ........................................................................ 10
Land-Locking Bridges .......................................................................................... 11
Chapter 4 – Funding .................................................................................................. 12
MAP-21 ................................................................................................................. 12
Unified Transportation Program .......................................................................... 12
Terms .................................................................................................................... 12
Highway Bridge Program Funding ....................................................................... 13
On-System Bridge Projects Authorized to Be Awarded Contracts .................... 13
Off-System Bridge Projects Authorized to Be Awarded Contracts .................... 14
PWP/EMP Program .............................................................................................. 14
Other Funding Resources for Off-System Bridge Work ..................................... 14
Summary of FY 2014 Funds Spent on On- and Off-System Bridges ................ 14
Chapter 5 – Meeting the Challenges.................................................................... 16
Bridge Condition Success .................................................................................... 16
Current Challenges .............................................................................................. 16
Looking Ahead ...................................................................................................... 18
Appendices .................................................................................................................... 19
A. Map of Texas Counties and TxDOT Districts ................................................ 19
B. Condition of On-System Bridges by TxDOT District and County as
of September 2014 ....................................................................................... 20
C. Condition of Off-System Bridges by TxDOT District and County as
of September 2014 ....................................................................................... 29
2014 Report on Texas Bridges
iv
Figures
Figure ES-1. Percentage of “Good or Better” Texas Bridges, 2004 – 2014 ............... 1
Figure ES-2. Condition of Texas Bridges, 2004 -- 2014 ............................................... 2
Figure 3-1. Percentage of “Good or Better” Texas Bridges, 2004 -- 2014 ............... 8
Figure 3-2. Condition of Texas Bridges, 2004 -- 2014 ............................................... 8
Figure 3-3. Total Count of On- and Off-System Texas Bridges, 2004 -- 2014 .......... 9
Figure 3-4. SD, FO, and SSLO Bridges, 2004 -- 2014 .............................................. 10
Figure 4-1. Distribution of Funds Spent on On-System Bridges in FY 2014 ........... 15
Figure 4-2. Distribution of Funds Spent on Off-System Bridges in FY 2014 ........... 15
Figure A-1. Map of Texas Counties with TxDOT Districts .......................................... 19

2014 Report on Texas Bridges
v
Tables
Table 2-1. Age of On- and Off-System Texas Bridges, 2004 ..................................... 6
Table 2-2. Age of On- and Off-System Texas Bridges, 2014 ..................................... 6
Table 2-3. Changes in Age of On- and Off-System Texas Bridges, 2004 -- 2014 .... 6
Table 3-1. SD, FO, and SSLO Bridges, 2004 -- 2014 ................................................ 9
Table 3-2. Number of Bridges Load-Posted, Closed, or Recommended
for Closure as of September 2014 ......................................................... 10
Table B-1. Condition of On-System Bridges by TxDOT District and County
as of September 2014 ............................................................................ 20
Table C-1. Condition of Off-System Bridges by TxDOT District and County
as of September 2014 ............................................................................ 29
2014 Report on Texas Bridges Executive Summary
1
Executive Summary This report describes Texas’ publicly owned vehicular bridges and their condition as of
September 2014. It describes bridges categorized by location either on or off the state
highway system. It also describes the condition of Texas bridges in terms of sufficiency:
bridges in good or better condition, structurally deficient bridges, functionally obsolete
bridges, and substandard-for-load-only bridges.
This report outlines the funding sources and eligibility requirements of the Highway Bridge
Program for on- and off-system bridges. It also illustrates TxDOT strategies to plan, build,
use, maintain, and manage key state resources to ensure that Texas bridges are of high
quality, cost-efficient, and safe.
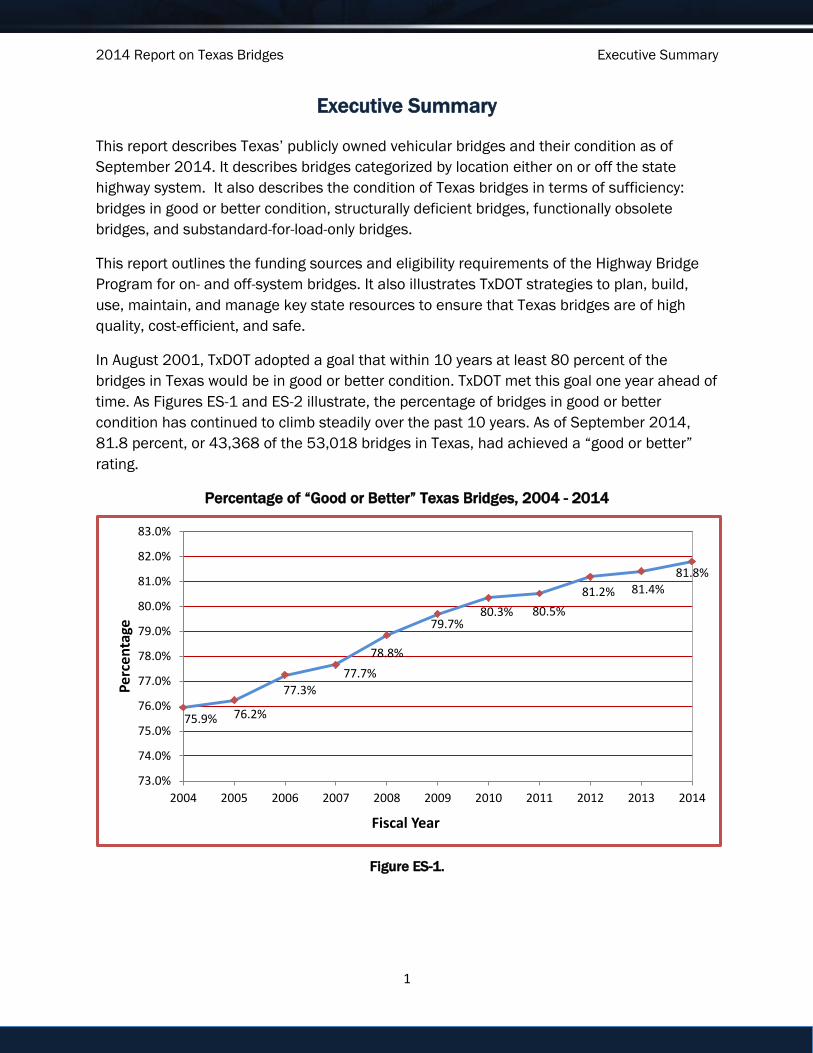
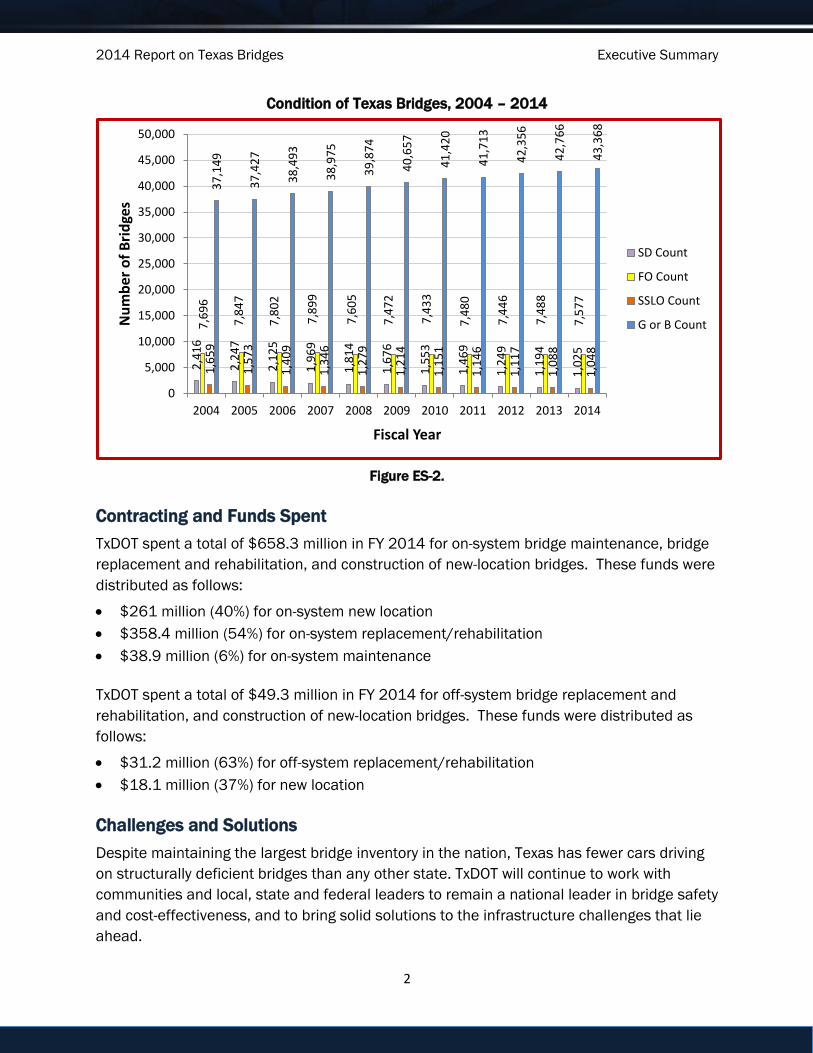
In August 2001, TxDOT adopted a goal that within 10 years at least 80 percent of the
bridges in Texas would be in good or better condition. TxDOT met this goal one year ahead of
time. As Figures ES-1 and ES-2 illustrate, the percentage of bridges in good or better
condition has continued to climb steadily over the past 10 years. As of September 2014,
81.8 percent, or 43,368 of the 53,018 bridges in Texas, had achieved a “good or better”
rating.
Percentage of “Good or Better” Texas Bridges, 2004 - 2014
Figure ES-1.
75.9% 76.2%
77.3%
77.7%
78.8%
79.7% 80.3% 80.5%
81.2% 81.4% 81.8%
73.0%
74.0%
75.0%
76.0%
77.0%
78.0%
79.0%
80.0%
81.0%
82.0%
83.0%
2004 2005 2006 2007 2008 2009 2010 2011 2012 2013 2014
Per
cen
tage
Fiscal Year
2014 Report on Texas Bridges Executive Summary
2
Condition of Texas Bridges, 2004 – 2014
Figure ES-2.
Contracting and Funds Spent
TxDOT spent a total of $658.3 million in FY 2014 for on-system bridge maintenance, bridge
replacement and rehabilitation, and construction of new-location bridges. These funds were
distributed as follows:
$261 million (40%) for on-system new location
$358.4 million (54%) for on-system replacement/rehabilitation
$38.9 million (6%) for on-system maintenance
TxDOT spent a total of $49.3 million in FY 2014 for off-system bridge replacement and
rehabilitation, and construction of new-location bridges. These funds were distributed as
follows:
$31.2 million (63%) for off-system replacement/rehabilitation
$18.1 million (37%) for new location
Challenges and Solutions
Despite maintaining the largest bridge inventory in the nation, Texas has fewer cars driving
on structurally deficient bridges than any other state. TxDOT will continue to work with
communities and local, state and federal leaders to remain a national leader in bridge safety
and cost-effectiveness, and to bring solid solutions to the infrastructure challenges that lie
ahead.
2,4
16
2,2
47
2,1
25
1,9
69
1,8
14
1,6
76
1,5
53
1,4
69
1,2
49
1,1
94
1,0
25
7,6
96
7,8
47
7,8
02
7,8
99
7,6
05
7,4
72
7,4
33
7,4
80
7,4
46
7,4
88
7,5
77
1,6
59
1,5
73
1,4
09
1,3
46
1,2
79
1,2
14
1,1
51
1,1
46
1,1
17
1,0
88
1,0
48
37
,14
9
37
,42
7
38
,49
3
38
,97
5
39
,87
4
40
,65
7
41
,42
0
41
,71
3
42
,35
6
42
,76
6
43
,36
8
0
5,000
10,000
15,000
20,000
25,000
30,000
35,000
40,000
45,000
50,000
2004 2005 2006 2007 2008 2009 2010 2011 2012 2013 2014
Nu
mb
er o
f B
rid
ges
Fiscal Year
SD Count
FO Count
SSLO Count
G or B Count

2014 Report on Texas Bridges Chapter 1 -- Overview
3
Chapter 1 – Overview
Introduction
The safety of the traveling public is the Texas Department of Transportation’s (TxDOT’s)
number one priority. Texas enjoys a reputation as a national leader in bridge safety. Our
state’s bridge system connects communities and allows citizens to experience a quality of
life unique to Texas.
Despite maintaining the largest U.S. bridge inventory, with over 53,018 bridges for public
vehicular traffic,1 Texas has the third-lowest percentage of structurally deficient bridges in
the nation.2 This success is due, in part, to the Highway Bridge Program (HBP), which
ensures that bridges are funded, designed, and maintained at the highest level of quality
and as cost-effectively as possible.
Texas faces unprecedented mobility demands as the state’s population continues to grow at
a rapid pace. At the same time, new developments in the energy economy have caused
large-truck traffic to increase. These factors have tremendous impact on the state’s
infrastructure and funding needs. TxDOT stands ready to take on these challenges. We are
committed to developing innovative solutions and exploring new and more efficient
technologies to make sure that Texas bridges are not only safe, but also best in class.
The Texas Transportation Commission has developed a plan to meet these challenges. On
June 26, 2014, the Commission adopted the TxDOT 2015 – 2019 Strategic Plan. It outlines
the agency’s mission, values, goals, objectives, budgetary performance measures, strategies
and planning information that will direct the department over the next five years.
Mission
Work with others to provide safe and reliable transportation solutions for Texas.
Goals
Maintain a safe system
Address congestion
Connect Texas communities
Become a best-in-class state agency
1 2013 Better Roads Bridge Inventory. http://www.betterroads.com/category/bridge-inventory
2 The Fix We’re In For: The State of Our Nation’s Bridges 2013. Transportation for America. An analysis of data
from the Federal Highway Administration’s 2013 National Bridge Inventory.
http://t4america.org/docs/bridgereport2013/2013BridgeReport.pdf
2014 Report on Texas Bridges Chapter 1 -- Overview
4
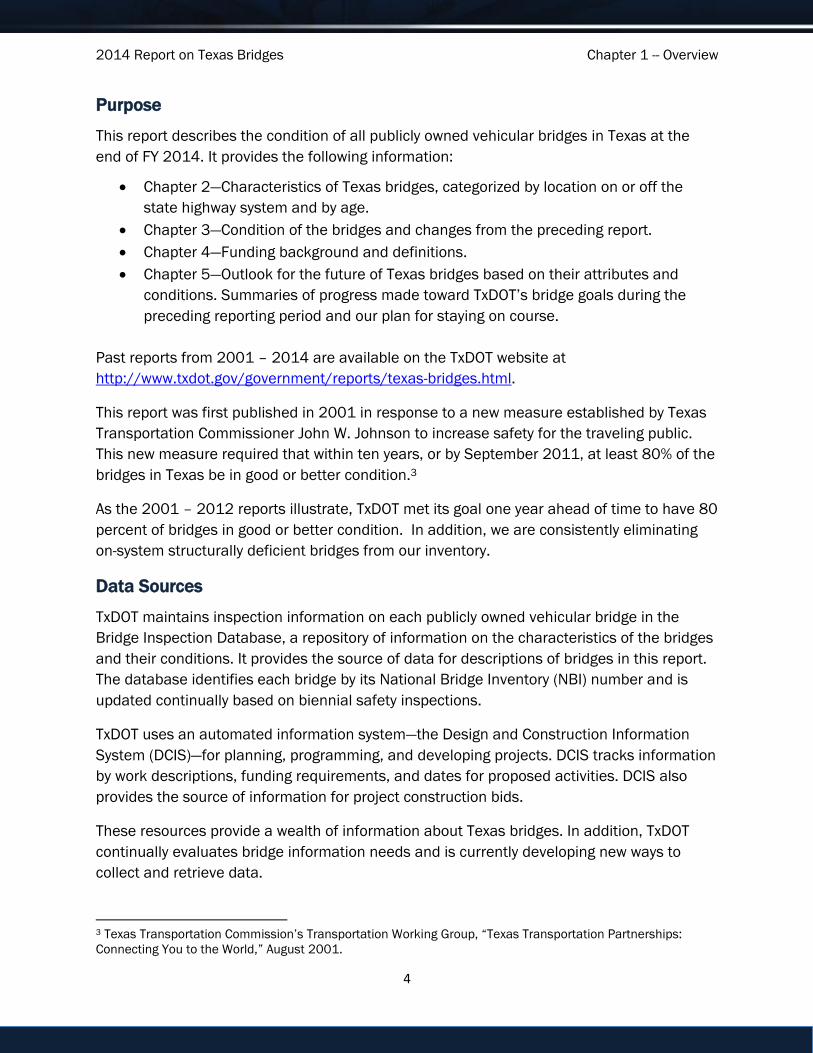
Purpose
This report describes the condition of all publicly owned vehicular bridges in Texas at the
end of FY 2014. It provides the following information:
Chapter 2—Characteristics of Texas bridges, categorized by location on or off the
state highway system and by age.
Chapter 3—Condition of the bridges and changes from the preceding report.
Chapter 4—Funding background and definitions.
Chapter 5—Outlook for the future of Texas bridges based on their attributes and
conditions. Summaries of progress made toward TxDOT’s bridge goals during the
preceding reporting period and our plan for staying on course.
Past reports from 2001 – 2014 are available on the TxDOT website at
http://www.txdot.gov/government/reports/texas-bridges.html.
This report was first published in 2001 in response to a new measure established by Texas
Transportation Commissioner John W. Johnson to increase safety for the traveling public.
This new measure required that within ten years, or by September 2011, at least 80% of the
bridges in Texas be in good or better condition.3
As the 2001 – 2012 reports illustrate, TxDOT met its goal one year ahead of time to have 80
percent of bridges in good or better condition. In addition, we are consistently eliminating
on-system structurally deficient bridges from our inventory.
Data Sources
TxDOT maintains inspection information on each publicly owned vehicular bridge in the
Bridge Inspection Database, a repository of information on the characteristics of the bridges
and their conditions. It provides the source of data for descriptions of bridges in this report.
The database identifies each bridge by its National Bridge Inventory (NBI) number and is
updated continually based on biennial safety inspections.
TxDOT uses an automated information system—the Design and Construction Information
System (DCIS)—for planning, programming, and developing projects. DCIS tracks information
by work descriptions, funding requirements, and dates for proposed activities. DCIS also
provides the source of information for project construction bids.
These resources provide a wealth of information about Texas bridges. In addition, TxDOT
continually evaluates bridge information needs and is currently developing new ways to
collect and retrieve data.
3 Texas Transportation Commission’s Transportation Working Group, “Texas Transportation Partnerships:
Connecting You to the World,” August 2001.

2014 Report on Texas Bridges Chapter 2 – Characteristics of Texas Bridges
5
Chapter 2 – Characteristics of Texas Bridges
Terms
Distinctive characteristics of publicly owned vehicular bridges include the following:
On-system or off-system: On-system bridges are located on the designated state
highway system, are maintained by TxDOT, and are typically funded with a
combination of federal and state or state-only funds. Off-system bridges are not part
of the designated state highway system and are under the direct jurisdiction of the
local government such as a county, city, other political subdivision of the state, or
special district with authority to finance a highway improvement project. This report
classifies bridges as either on- or off-system.
Age: This report classifies bridges by age according to significant historic changes in
design criteria governing widths and live loads. Live loads are the moving weights
placed on a bridge, not including the weight of the structure itself.
Age
Older bridges require special maintenance and additional resources for bridge replacement
and rehabilitation. In addition, on-system Texas bridges built after 1900 can be classified by
significant changes in the design criteria that governed their construction:
Built before 1950: Bridges generally designed for less than the current state legal
load.
Built between 1950 and 1970: Bridges generally required to accommodate the
minimum design load or higher recommended by the American Association of State
Highway and Transportation Officials, but may be narrower than their approach
roadways. A number of these bridges are too narrow to meet current requirements.
(Required bridge load capacity is described in detail in TxDOT’s Bridge Inspection
Manual.)
Built after 1970: Bridges generally required to accommodate the minimum design
load or higher recommended by the American Association of State Highway and
Transportation Officials, and must be at least as wide as their approach roadways.
Between 1950 and 1970, many new-location on-system bridges were built as the interstate
system developed and the state highway system expanded. However, since 1970 the
number of off-system bridges has increased at a faster rate. This is because additional new
off-system roads and bridges are being built as many of the metropolitan and urban areas of
Texas experience rapid growth. Tables 2-1, 2-2, and 2-3 show characteristics of bridges by
age groupings.

2014 Report on Texas Bridges Chapter 2 – Characteristics of Texas Bridges
6
Age Distribution of Texas Bridge Population in FY 2004: Number of Bridges and
Percent of Total by Year Constructed
Year Built On-System Off-System Total Percent of Total
Before 1950 6,917 2,751 9,668 20%
1950 - 1970 14,008 3,756 17,764 36%
After 1970 11,362 10,126 21,488 44%
Total 32,287 16,633 48,920 100%
Table 2-1.
Age Distribution of Texas Bridge Population in FY 2014: Number of Bridges and
Percent of Total by Year Constructed
Year Built On-System Off-System Total Percent of Total
Before 1950 6,425 1,812 8,237 16%
1950 - 1970 12,182 2,888 15,070 28%
After 1970 16,285 13,426 29,711 56%
Total 34,892 18,126 53,018 100%
Table 2-2.
Change in Number of Bridges by Year Built, FY 2004 to FY 2014
Year Built Number of Bridges in 2004
Number of Bridges in 2014
Change in Number of Bridges
Before 1950 9,668 8,237 -1,431
1950 - 1970 17,764 15,070 -2,694
After 1970 21,488 29,711 8,223
Total Number of Bridges 48,920 53,018 4,098
Table 2-3.
As seen in the tables above, older bridges are being replaced with new structures. This is
evidenced by the fact that as of FY 2014, 56 percent of all Texas bridges were built after
1970.

2014 Report on Texas Bridges Chapter 3 – Condition of Texas Bridges
7
Chapter 3 – Condition of Texas Bridges
Terms
This report characterizes the condition of bridges as follows:
Good or better (GB) structure: A good or better structure meets current federal and
Texas requirements. It is not structurally deficient, functionally obsolete, or sub-
standard for load only. Desirable change in good or better structures from year to
year is reflected by positive numbers, showing an increase in sufficient structures.
Structurally deficient (SD) structure: A bridge is classified by the Federal Highway
Administration (FHWA) as structurally deficient if it meets any of the following criteria:
It has an extreme restriction on its load-carrying capacity.
It has deterioration severe enough to reduce its load-carrying capacity beneath its
original as-built capacity.
It is closed.
It is frequently over-topped during flooding, creating severe traffic delays.
Functionally obsolete (FO) structure: A bridge is classified by the FHWA as
functionally obsolete if it fails to meet its design criteria in any one of the following
areas:
Deck geometry
Load-carrying capacity
Vertical or horizontal clearances
Approach roadway alignment
In this report, structures that are both functionally obsolete and structurally deficient are
counted only as structurally deficient.
Sub-standard for load only (SSLO) structure: A bridge is considered sub-standard for
load only if it is not classified as structurally deficient or functionally obsolete, but has
a load capacity less than the maximum load permitted by state law. It has not
deteriorated or has not deteriorated severely enough to reduce its load capacity
beneath its original as-built capacity, but its original as-built capacity was not
designed to carry current legal loads. A sub-standard for load only structure is load-
posted or recommended for load posting.
Load-posted bridge: A bridge that is load-posted has a safe load capacity less than
the state legal load, and its load capacity is communicated by signs at the bridge site.
(Note: Certain vehicles, identified in Chapter 622 of the Texas Transportation Code,
that exceed posted load capacity can legally use load-posted bridges.)
Land-locking bridge: This report classifies a bridge as land-locking if it restricts traffic
into an area because of load limitations or closures and no other public road into the
area is capable of supporting legal loads. These bridges are load-posted or closed.

2014 Report on Texas Bridges Chapter 3 – Condition of Texas Bridges
8
Bridge Conditions
In August 2001, TxDOT adopted a goal that within 10 years at least 80 percent of the
bridges in Texas would be in good or better condition. TxDOT met this goal one year ahead of
time, and as Figures 3-1 and 3-2 illustrate, the percentage of bridges in good or better
condition has continued to climb steadily over the past 10 years. As of September 2014,
81.8 percent, or 43,368 of the 53,018 bridges in Texas had achieved a “good or better”
rating.
Percentage of "Good or Better" Texas Bridges, 2004 – 2014
Figure 3-1.
Condition of Texas Bridges, 2004 – 2014
Figure 3-2.
75.9% 76.2%
77.3% 77.7%
78.8%
79.7% 80.3% 80.5%
81.2% 81.4% 81.8%
73.0%
74.0%
75.0%
76.0%
77.0%
78.0%
79.0%
80.0%
81.0%
82.0%
83.0%
2004 2005 2006 2007 2008 2009 2010 2011 2012 2013 2014
Per
cen
tage
Fiscal Year
2,4
16
2,2
47
2,1
25
1,9
69
1,8
14
1,6
76
1,5
53
1,4
69
1,2
49
1,1
94
1,0
25
7,6
96
7,8
47
7,8
02
7,8
99
7,6
05
7,4
72
7,4
33
7,4
80
7,4
46
7,4
88
7,5
77
1,6
59
1,5
73
1,4
09
1,3
46
1,2
79
1,2
14
1,1
51
1,1
46
1,1
17
1,0
88
1,0
48
37
,14
9
37
,42
7
38
,49
3
38
,97
5
39
,87
4
40
,65
7
41
,42
0
41
,71
3
42
,35
6
42
,76
6
43
,36
8
0
5,000
10,000
15,000
20,000
25,000
30,000
35,000
40,000
45,000
50,000
2004 2005 2006 2007 2008 2009 2010 2011 2012 2013 2014
Nu
mb
er o
f B
rid
ges
Fiscal Year
SD Count
FO Count
SSLO Count
G or B Count
2014 Report on Texas Bridges Chapter 3 – Condition of Texas Bridges
9
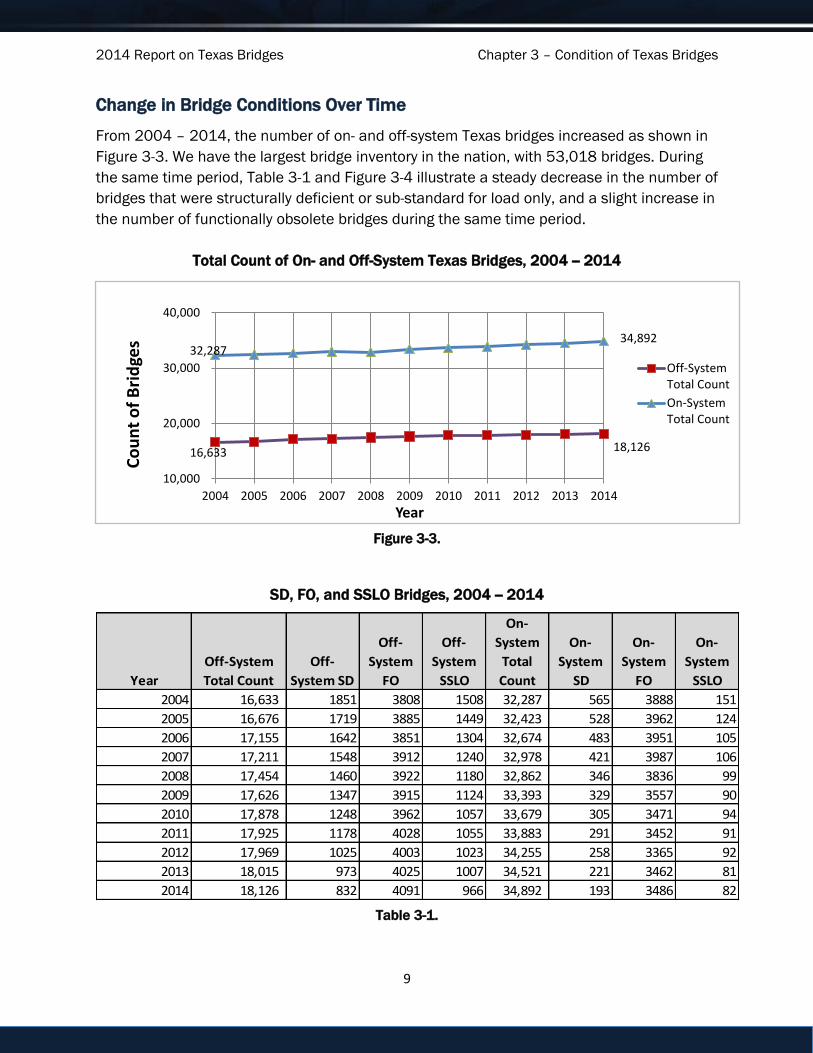
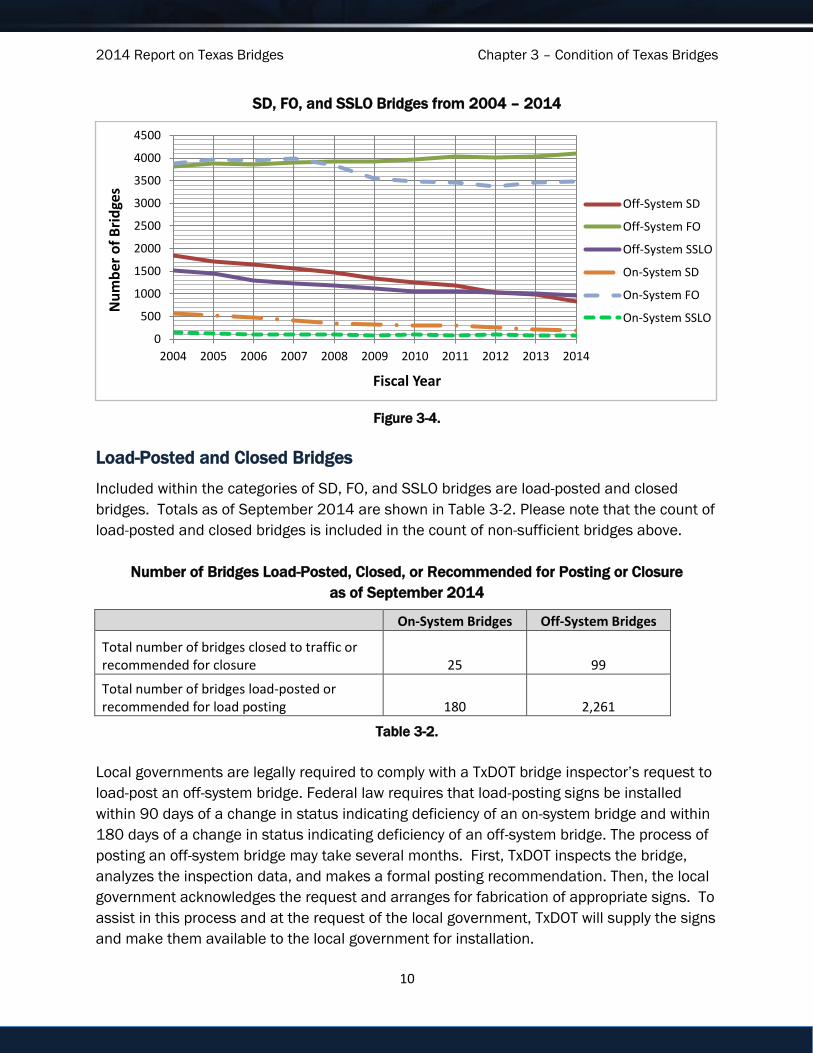
Change in Bridge Conditions Over Time
From 2004 – 2014, the number of on- and off-system Texas bridges increased as shown in
Figure 3-3. We have the largest bridge inventory in the nation, with 53,018 bridges. During
the same time period, Table 3-1 and Figure 3-4 illustrate a steady decrease in the number of
bridges that were structurally deficient or sub-standard for load only, and a slight increase in
the number of functionally obsolete bridges during the same time period.
Total Count of On- and Off-System Texas Bridges, 2004 -- 2014
Figure 3-3.
SD, FO, and SSLO Bridges, 2004 -- 2014
Table 3-1.
16,633 18,126
32,287 34,892
10,000
20,000
30,000
40,000
2004 2005 2006 2007 2008 2009 2010 2011 2012 2013 2014
Co
un
t o
f B
rid
ges
Year
Off-SystemTotal Count
On-SystemTotal Count
Year
Off-System
Total Count
Off-
System SD
Off-
System
FO
Off-
System
SSLO
On-
System
Total
Count
On-
System
SD
On-
System
FO
On-
System
SSLO
2004 16,633 1851 3808 1508 32,287 565 3888 151
2005 16,676 1719 3885 1449 32,423 528 3962 124
2006 17,155 1642 3851 1304 32,674 483 3951 105
2007 17,211 1548 3912 1240 32,978 421 3987 106
2008 17,454 1460 3922 1180 32,862 346 3836 99
2009 17,626 1347 3915 1124 33,393 329 3557 90
2010 17,878 1248 3962 1057 33,679 305 3471 94
2011 17,925 1178 4028 1055 33,883 291 3452 91
2012 17,969 1025 4003 1023 34,255 258 3365 92
2013 18,015 973 4025 1007 34,521 221 3462 81
2014 18,126 832 4091 966 34,892 193 3486 82
2014 Report on Texas Bridges Chapter 3 – Condition of Texas Bridges
10
SD, FO, and SSLO Bridges from 2004 – 2014
Figure 3-4.
Load-Posted and Closed Bridges
Included within the categories of SD, FO, and SSLO bridges are load-posted and closed
bridges. Totals as of September 2014 are shown in Table 3-2. Please note that the count of
load-posted and closed bridges is included in the count of non-sufficient bridges above.
Number of Bridges Load-Posted, Closed, or Recommended for Posting or Closure
as of September 2014
On-System Bridges Off-System Bridges
Total number of bridges closed to traffic or recommended for closure 25 99
Total number of bridges load-posted or recommended for load posting 180 2,261
Table 3-2.
Local governments are legally required to comply with a TxDOT bridge inspector’s request to
load-post an off-system bridge. Federal law requires that load-posting signs be installed
within 90 days of a change in status indicating deficiency of an on-system bridge and within
180 days of a change in status indicating deficiency of an off-system bridge. The process of
posting an off-system bridge may take several months. First, TxDOT inspects the bridge,
analyzes the inspection data, and makes a formal posting recommendation. Then, the local
government acknowledges the request and arranges for fabrication of appropriate signs. To
assist in this process and at the request of the local government, TxDOT will supply the signs
and make them available to the local government for installation.
0
500
1000
1500
2000
2500
3000
3500
4000
4500
2004 2005 2006 2007 2008 2009 2010 2011 2012 2013 2014
Nu
mb
er o
f B
rid
ges
Fiscal Year
Off-System SD
Off-System FO
Off-System SSLO
On-System SD
On-System FO
On-System SSLO

2014 Report on Texas Bridges Chapter 3 – Condition of Texas Bridges
11
Local governments are encouraged but not legally required to comply with a request to close
an off-system bridge. To encourage compliance, TxDOT uses its Participation-Waived
Project/Equivalent Match Project (PWP/EMP) program, described in Chapter 4, to encourage
compliance by local governments with recommendations for posting or closing off-system
bridges. Local governments cannot participate in the PWP/EMP program until TxDOT
confirms compliance with all requests to post or close off-system bridges in their jurisdiction.
Land-Locking Bridges
Land-locking bridges limit the movement of legal loads into an area by imposing load
restrictions or by being closed. TxDOT identifies a bridge or combination of bridges as land-
locking only if no other public road into the area—and it must be a public road shown on a
map maintained by TxDOT—is capable of supporting legal loads.
Chapter 621 of the Texas Transportation Code establishes the minimum load that unposted
Texas bridges must be able to carry. Bridges unable to support that minimum load must be
load-posted to protect them and the people who travel them from possible harm. The
minimum load is the same as the state legal load. In general, the maximum gross load on a
truck cannot exceed 80,000 pounds, the maximum load on tandem axles cannot exceed
34,000 pounds, and the maximum load on any single axle cannot exceed 20,000 pounds.
However, vehicles exceeding posted limits may use load-posted bridges under certain
conditions. Pursuant to current Texas law, a carrier may obtain for a fee an annual weight
tolerance permit. The permit allows for the transport of excess loads on a land-locking
bridge if the bridge provides the only public vehicular access to or from the permittee’s
origin or destination. In addition, certain vehicles identified in Chapter 622 of the Texas
Transportation Code that exceed posted load capacity but have a weight-tolerance permit
also can legally use load-posted bridges. Examples include vehicles transporting concrete,
timber, agricultural products, recyclable materials, or power poles, as well as vehicles with
idle reduction systems. These exceptions can be found in Sections 622.012, 622.0435,
622.131, 622.133, and 622.955.
Vehicles that exceed posted limits but have a weight tolerance permit may legally use land-
locking bridges. However, the use of land-locking bridges for excess loads increases the risk
of damage to the bridge. The size, number, and weight of trucks on Texas roads and bridges
are increasing, while at the same time, the bridge infrastructure is aging. Looking ahead,
TxDOT will need to seek long-term solutions and funding to ensure the rehabilitation or
replacement of load-posted and land-locking bridges in order to accommodate growing
traffic demands.

2014 Report on Texas Bridges Chapter 4 -- Funding
12
Chapter 4 – Funding
MAP-21
MAP-21, the Moving Ahead for Progress in the 21st Century Act (P.L. 112-141), was signed
into law by President Barack Obama on July 6, 2012. Funding surface transportation
programs at over $105 billion for fiscal years 2013 and 2014, MAP-21 is the first highway
authorization enacted since 2005. The text and additional information on MAP-21 are
available on the FHWA’s website.
MAP-21 restructures core highway formula programs. Activities carried out under some
existing formula programs, including the Highway Bridge Program, are incorporated into the
following new core formula program structure:
National Highway Performance Program (NHPP)
Surface Transportation Program (STP)
Congestion Mitigation and Air Quality Improvement Program (CMAQ)
Highway Safety Improvement Program (HSIP)
Railway-Highway Crossings (set-aside from HSIP)
Metropolitan Planning
While the previous federal Highway Bridge Program now has been incorporated into another
core formula—NHPP—as of the writing of this report, TxDOT continues to administer the HBP
as a state program, following the same rules and conditions as previously set out. The
federal dollars under MAP-21 will continue to provide funding to enable states to improve
the condition of their highway bridges through replacement, rehabilitation, systematic
preventive maintenance and inspection.
Unified Transportation Program
The TxDOT Unified Transportation Program (UTP) is a 10-year plan approved by the Texas
Transportation Commission to guide transportation project development and construction.
It contains 12 different categories of funding. Category 6 of the UTP is dedicated to bridge
replacement and rehabilitation.
Terms
This report uses the following terms to describe eligibility for funding of bridge projects
under the state Highway Bridge Program (HBP):
Category 6 on-system bridge projects: This is a classification of replacement or rehabilitation
work on structurally deficient or functionally obsolete on-system bridges that have a
sufficiency rating of 80 or less and are, therefore, eligible for specific funding support under
the HBP.
2014 Report on Texas Bridges Chapter 4 -- Funding
13
Category 6 off-system bridge projects: This is a classification of replacement or rehabilitation
work on structurally deficient or functionally obsolete off-system bridges that have a
sufficiency rating of 80 or less and are, therefore, eligible for specific funding support under
the HBP.
Programmed project: A programmed project is a project that has been identified as eligible
for funding (for example, under HBP), prioritized using specific TxDOT and federal criteria,
and listed in the current UTP as being authorized for letting to contract. Programmed
projects are scheduled for letting of construction bids for a specific fiscal year.
Sufficiency rating: This is a numerical evaluation established by the FHWA. It measures a
bridge’s structural adequacy and safety, serviceability and functional obsolescence, and
essentiality for traffic service. The higher the number, the more sufficient the bridge. The
rating is used to determine whether a bridge project is eligible for HBP rehabilitation or
replacement. A bridge must be structurally deficient or functionally obsolete and have a
sufficiency rating less than 80 to be eligible for the HBP. A sufficiency rating of 80 or less is
required to qualify for rehabilitation, and a sufficiency rating of less than 50 is required to
qualify for replacement. A structurally deficient bridge with a sufficiency rating between 50
and 80 may qualify for replacement if justified by engineering or economic analysis. The
lower the number, the higher the priority.
Highway Bridge Program Funding
TxDOT administers the state HBP by selecting bridge projects for funding according to
various eligibility criteria, including but not limited to structural deficiency and functional
obsolescence. Once eligible projects are identified, the structurally deficient and
functionally obsolete bridges are ordered by sufficiency rating and included in the program
list until available funding is exhausted. Finally, the projects are authorized using the UTP or,
in its absence, by Commission Minute Order.
On-System Bridge Projects Authorized to be Awarded Contracts
TxDOT authorized the following classes of on-system bridge projects to be awarded contracts
in FY 2012 through FY 2014:
HBP-funded projects (UTP Category 6-on-system)
Replacement and rehabilitation projects not funded under HBP (that is, these bridges
are not necessarily structurally deficient or functionally obsolete, and the projects are
funded under other funding categories)
New-location bridge projects funded under other categories of funding
2014 Report on Texas Bridges Chapter 4 -- Funding
14
Off-System Bridge Projects Authorized to be Awarded Contracts
The following classes of off-system bridge projects were funded in FY 2012 through FY
2014:
HBP-funded project (UTP Category 6-off-system)
Replacement and rehabilitation projects not funded under HBP (that is, these bridges
are not necessarily structurally deficient or functionally obsolete)
New-location bridge projects not funded with Category 6 funds.
PWP/EMP Program
In FY 2001, TxDOT initiated its Participation-Waived Project/Equivalent-Match Project
(PWP/EMP) program to allow a local government to waive its 10% cost participation
requirement in an HBP off-system bridge project if it agrees to use an equivalent dollar
amount to improve other deficient structures in its jurisdiction.4 In addition to HBP-
programmed bridges, EMP work may be performed on bridge structures that are not part of
the National Bridge Inventory.
Other Funding Resources for Off-System Bridge Work
Texas provides additional resources for local governments to facilitate the improvement of
off-system bridges, and those resources include the following:
The State Infrastructure Bank (SIB) is a revolving account in the State Highway Fund
from which TxDOT may award loans to local governments to fund eligible
transportation projects.
TxDOT’s Economically Disadvantaged Counties (EDC) Program allows TxDOT to adjust
a county’s matching funds requirements after evaluating the local government’s
ability to meet the requirement. TxDOT also allows a county participating in the EDC
program to use its adjusted participation amount in lieu of all or part of its cost
participation in the PWP/EMP program. More information on this program is available
in TxDOT’s Bridge Project Development Manual and in TxDOT’s
Transportation Planning Manual.
Summary of FY 2014 Funds Spent on On- and Off-System Bridges
Figures 4-1 and 4-2 show the distribution of money spent in FY 2014 for the maintenance,
replacement and rehabilitation, and construction of new-location on- and off-system bridges,
4 A November 2001 amendment to the PWP/EMP program expanded the safety-improvement types of work
that may be classified as EMP projects and allowed local governments to receive EMP credit for work
performed in geographically adjacent governmental units.
2014 Report on Texas Bridges Chapter 4 -- Funding
15
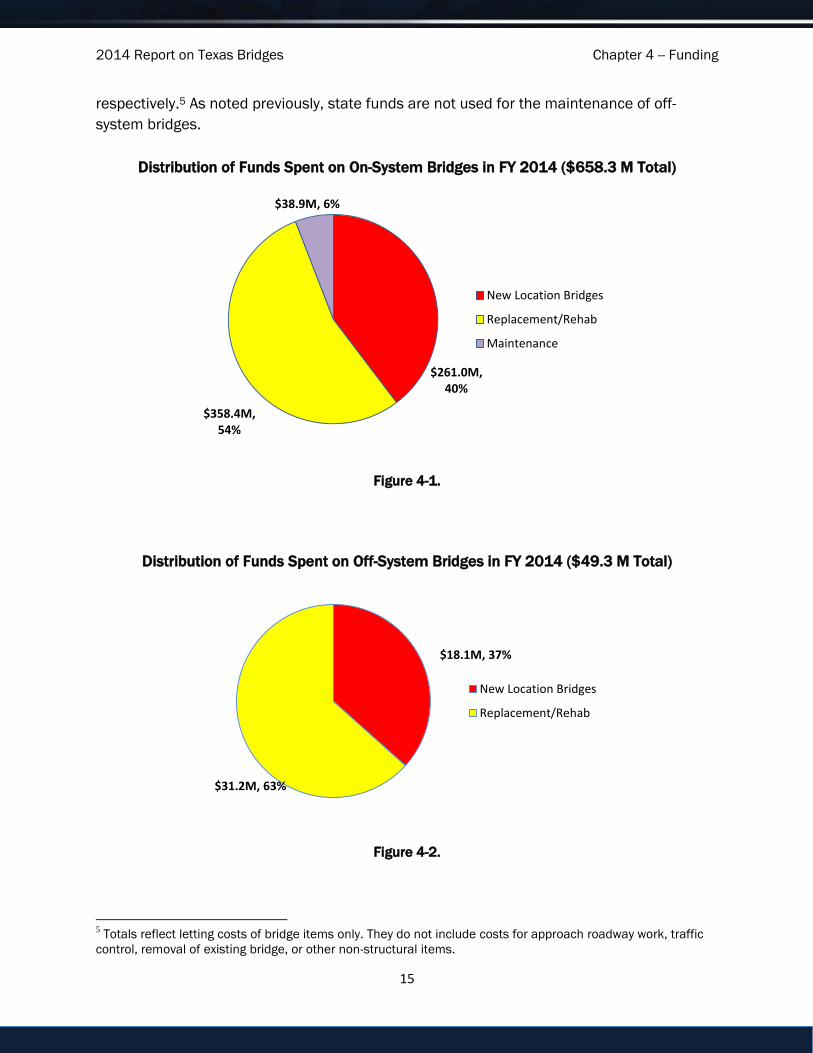
respectively.5 As noted previously, state funds are not used for the maintenance of off-
system bridges.
Distribution of Funds Spent on On-System Bridges in FY 2014 ($658.3 M Total)
Figure 4-1.
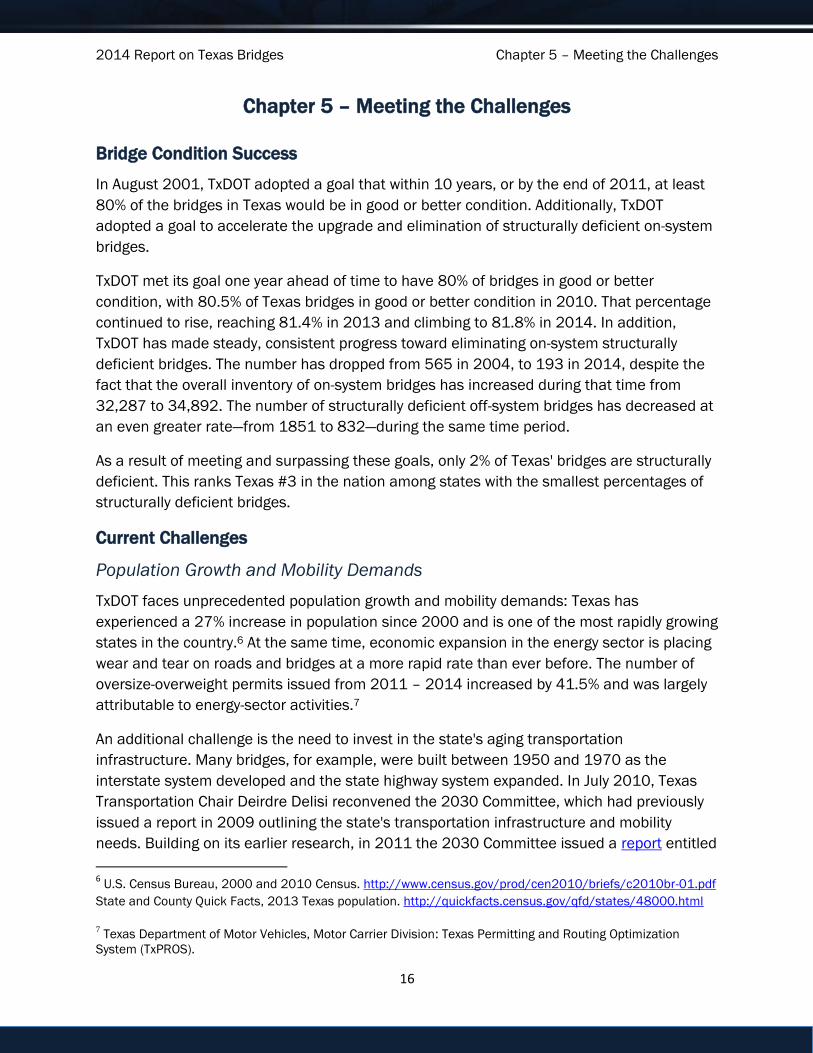
Distribution of Funds Spent on Off-System Bridges in FY 2014 ($49.3 M Total)
Figure 4-2.
5 Totals reflect letting costs of bridge items only. They do not include costs for approach roadway work, traffic
control, removal of existing bridge, or other non-structural items.
$261.0M, 40%
$358.4M, 54%
$38.9M, 6%
New Location Bridges
Replacement/Rehab
Maintenance
$18.1M, 37%
$31.2M, 63%
New Location Bridges
Replacement/Rehab
2014 Report on Texas Bridges Chapter 5 – Meeting the Challenges
16
Chapter 5 – Meeting the Challenges
Bridge Condition Success
In August 2001, TxDOT adopted a goal that within 10 years, or by the end of 2011, at least
80% of the bridges in Texas would be in good or better condition. Additionally, TxDOT
adopted a goal to accelerate the upgrade and elimination of structurally deficient on-system
bridges.
TxDOT met its goal one year ahead of time to have 80% of bridges in good or better
condition, with 80.5% of Texas bridges in good or better condition in 2010. That percentage
continued to rise, reaching 81.4% in 2013 and climbing to 81.8% in 2014. In addition,
TxDOT has made steady, consistent progress toward eliminating on-system structurally
deficient bridges. The number has dropped from 565 in 2004, to 193 in 2014, despite the
fact that the overall inventory of on-system bridges has increased during that time from
32,287 to 34,892. The number of structurally deficient off-system bridges has decreased at
an even greater rate—from 1851 to 832—during the same time period.
As a result of meeting and surpassing these goals, only 2% of Texas' bridges are structurally
deficient. This ranks Texas #3 in the nation among states with the smallest percentages of
structurally deficient bridges.
Current Challenges
Population Growth and Mobility Demands
TxDOT faces unprecedented population growth and mobility demands: Texas has
experienced a 27% increase in population since 2000 and is one of the most rapidly growing
states in the country.6 At the same time, economic expansion in the energy sector is placing
wear and tear on roads and bridges at a more rapid rate than ever before. The number of
oversize-overweight permits issued from 2011 – 2014 increased by 41.5% and was largely
attributable to energy-sector activities.7
An additional challenge is the need to invest in the state's aging transportation
infrastructure. Many bridges, for example, were built between 1950 and 1970 as the
interstate system developed and the state highway system expanded. In July 2010, Texas
Transportation Chair Deirdre Delisi reconvened the 2030 Committee, which had previously
issued a report in 2009 outlining the state's transportation infrastructure and mobility
needs. Building on its earlier research, in 2011 the 2030 Committee issued a report entitled
6 U.S. Census Bureau, 2000 and 2010 Census. http://www.census.gov/prod/cen2010/briefs/c2010br-01.pdf
State and County Quick Facts, 2013 Texas population. http://quickfacts.census.gov/qfd/states/48000.html
7 Texas Department of Motor Vehicles, Motor Carrier Division: Texas Permitting and Routing Optimization
System (TxPROS).
2014 Report on Texas Bridges Chapter 5 – Meeting the Challenges
17
It's About Time: Investing in Transportation to Keep Texas Economically Competitive, which
forecast alternative levels of service for four elements of the Texas transportation system—
including bridges—and determined the economic effects of under-investing in the system.
According to the report, the cost to repair the backlog of deficient bridges will increase from
$3 billion in 2010 to $7 billion in 2035.
If not addressed through additional funding, the pace of growth and change could threaten
to reverse the steady improvement in bridge conditions that Texas has enjoyed since 2004.
One indicator is that despite having the third-lowest percentage of structurally deficient
bridges in the nation, in 2013 Texas ranked #14 among all states with the smallest
combined percentage of SD and functionally obsolete (FO) bridges.8 This is largely
attributable to FO bridges and the fact that the population is growing faster than the rate at
which FO bridges can be replaced or improved.
Load-Posted Bridges
Currently there are 180 on-system and 2,261 off-system bridges that are load posted or
have been recommended for load posting. While these structures are safe, they are
incapable of carrying the state legal loads. These bridges have been load posted because it
is impractical to close them from a mobility standpoint, and because TxDOT lacks funds to
replace or rehabilitate them. While these 2,441 bridges make up less than 5% of all bridges
in the state, they represent approximately $1.2 billion in needed funding.
While many of these bridges are rated as Structurally Deficient or Functionally Obsolete,
thereby making them eligible for the Highway Bridge Program, nearly half of them are
Substandard for Load Only, which are not eligible. Eighty-two on-system and 966 off-system
bridges fall into this category. The estimate to replace or rehabilitate these bridges to carry
state legal loads exceeds $442 million. There currently are no dedicated funding
mechanisms available to TxDOT to address these needs.
Load-posted bridges restrict commerce, since many vehicles have to take alternate routes in
order to avoid traversing them. The presence of load-posted bridges on a given route often
impacts school bus routes and the availability of emergency services.
Land-Locking Bridges
Vehicles that exceed posted limits but have a weight-tolerance permit may legally use land-
locking bridges. However, the use of land-locking bridges for excess loads increases the risk
of damage to the bridge. The size, number, and weight of trucks on Texas roads and bridges
is increasing, while at the same time, the bridge infrastructure is aging. TxDOT will need to
8 The Federal Highway Administration’s 2013 National Bridge Inventory.
http://www.fhwa.dot.gov/bridge/nbi/no10/county.cfm
2014 Report on Texas Bridges Chapter 5 – Meeting the Challenges
18
seek long-term solutions and funding to ensure the rehabilitation or replacement of load-
posted and land-locking bridges in order to accommodate traffic demands.
Looking Ahead
Texas faces enormous and rapidly increasing transportation needs, with no quick and easy
solutions to meet them. Demand is outpacing funding. Factors including inflation, a growing
population, an aging infrastructure, and more fuel-efficient vehicles—which provide
environmental benefits but result in less revenue from the motor fuel tax---are pushing
current funding sources to their limits.
TxDOT will continue to maximize the use of funds made available for bridge preservation and
replacement. The agency also will continue to explore, develop and implement creative
programs to improve Texas bridges. In addition, TxDOT is committed to using all of the
financial tools made available to it by the Texas Legislature in order to meet its goals. Going
forward, TxDOT's bridge programs and work will support the goals and priorities of the TxDOT
2015 – 2019 Strategic Plan. The forthcoming Texas Transportation Plan 2040 and Texas
Freight Mobility Plan will serve as additional roadmaps. TxDOT continually monitors its
performance against the principles, measures and goals set out in this report. We will
continue to work together with the Legislature and local governments to maximize
efficiencies and use all the financial tools available to improve the bridges in Texas and
ensure the safety of the traveling public.
2014 Report on Texas Bridges Appendix A – Map of Texas Counties with TxDOT Districts
19
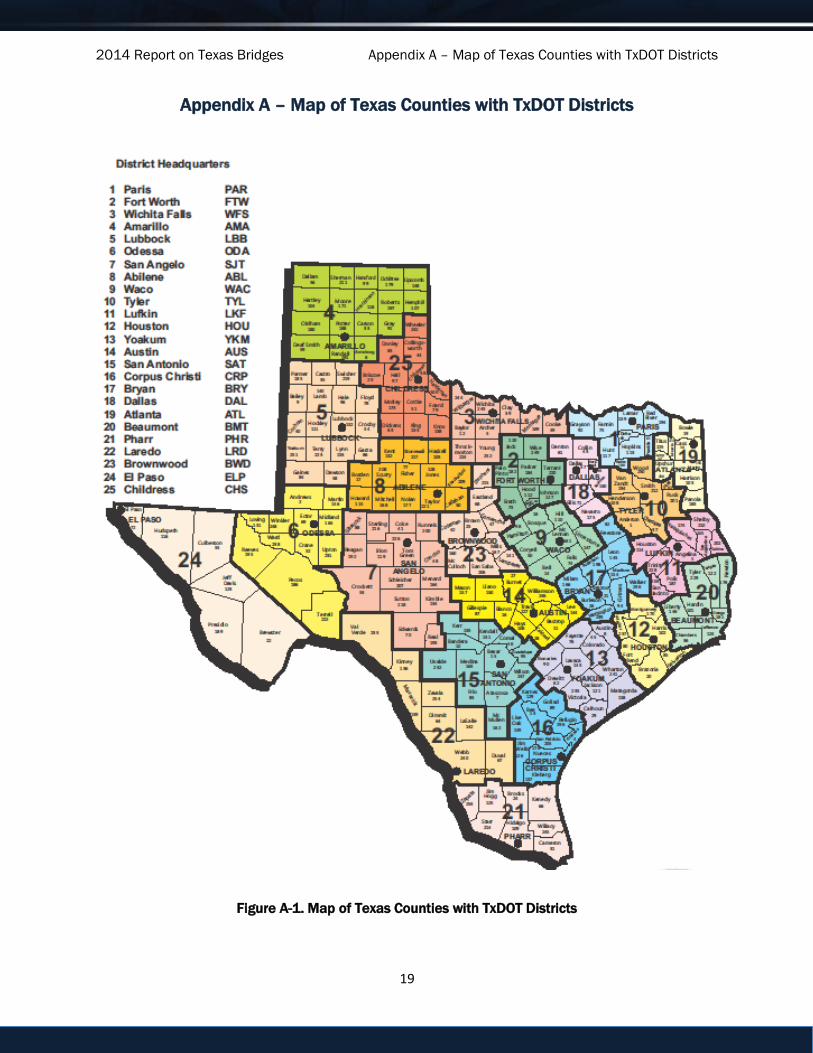
Appendix A – Map of Texas Counties with TxDOT Districts
Figure A-1. Map of Texas Counties with TxDOT Districts
2014 Report on Texas Bridges Appendix B– Condition of On-System Bridges
20
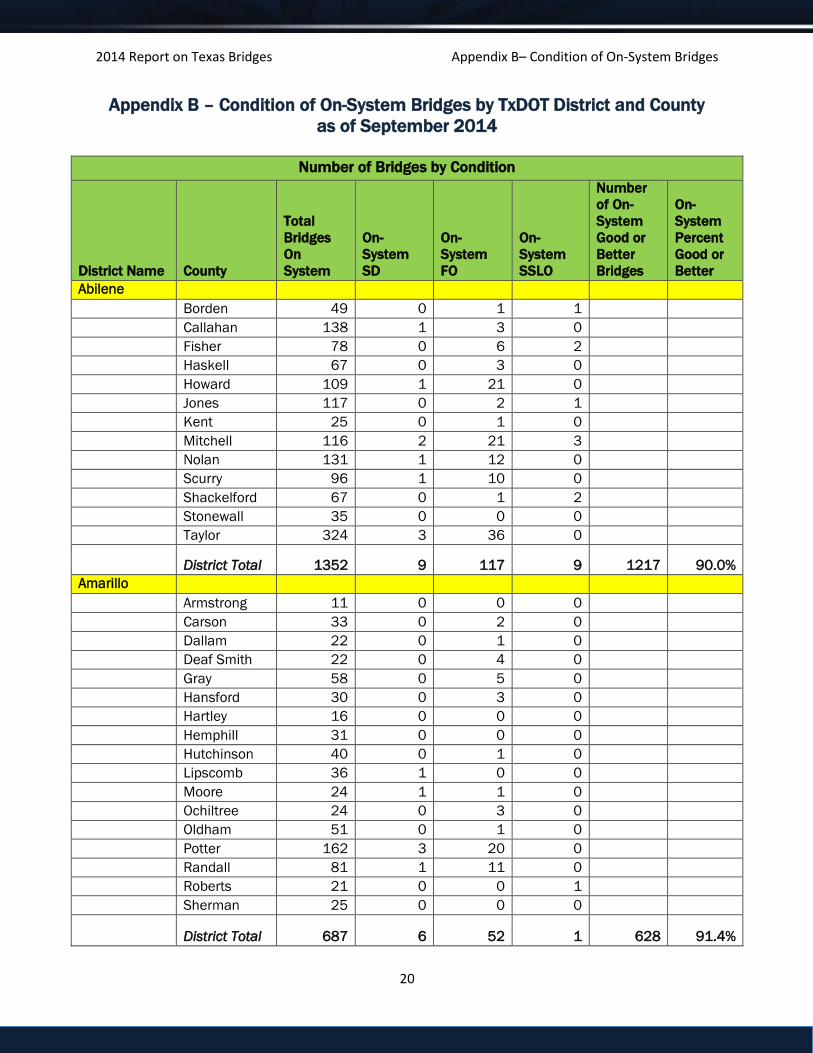
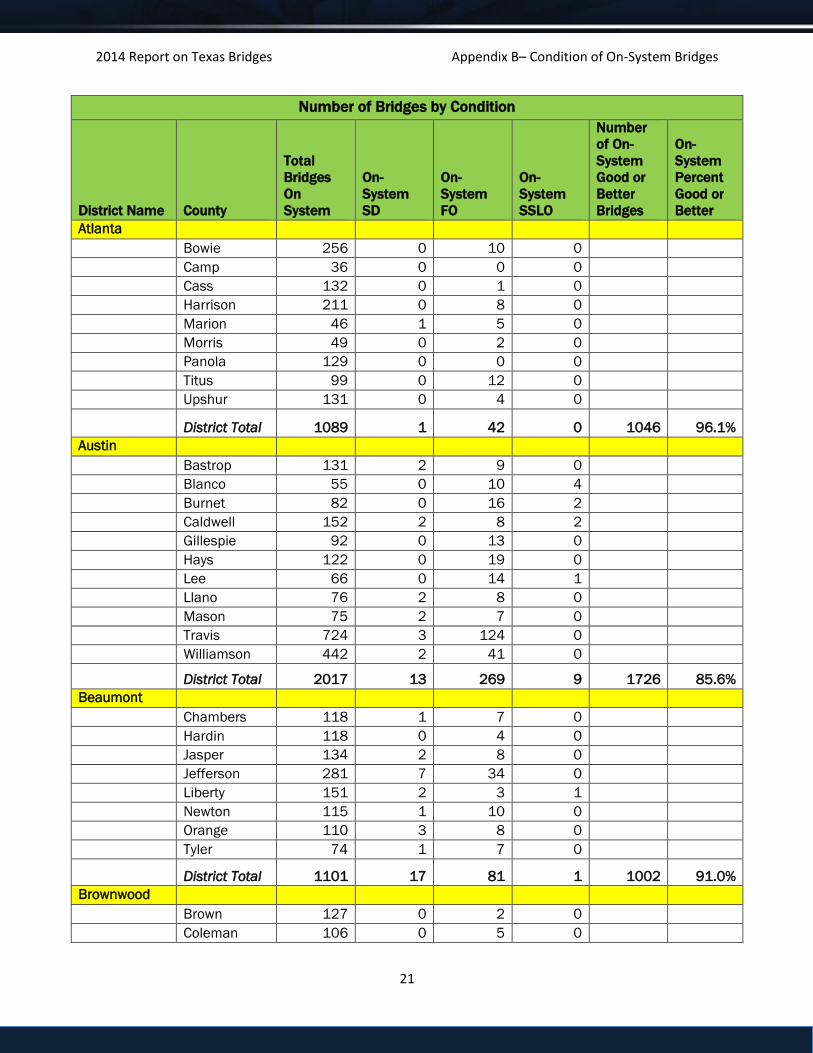
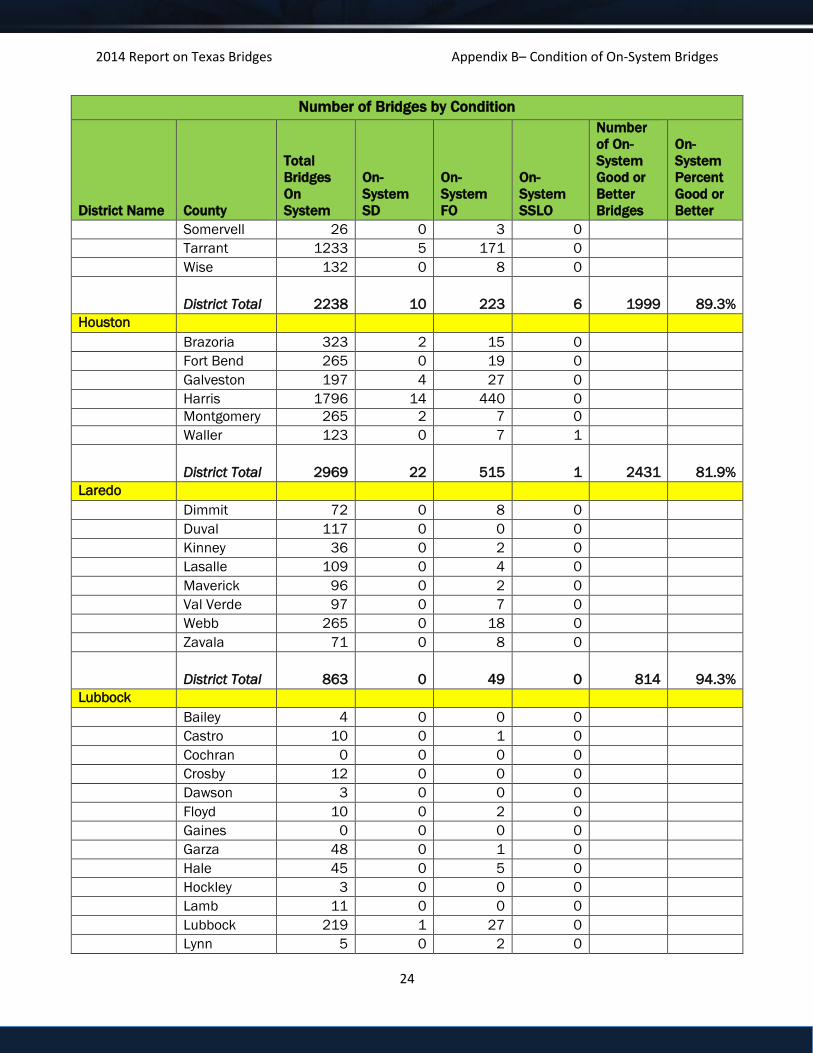
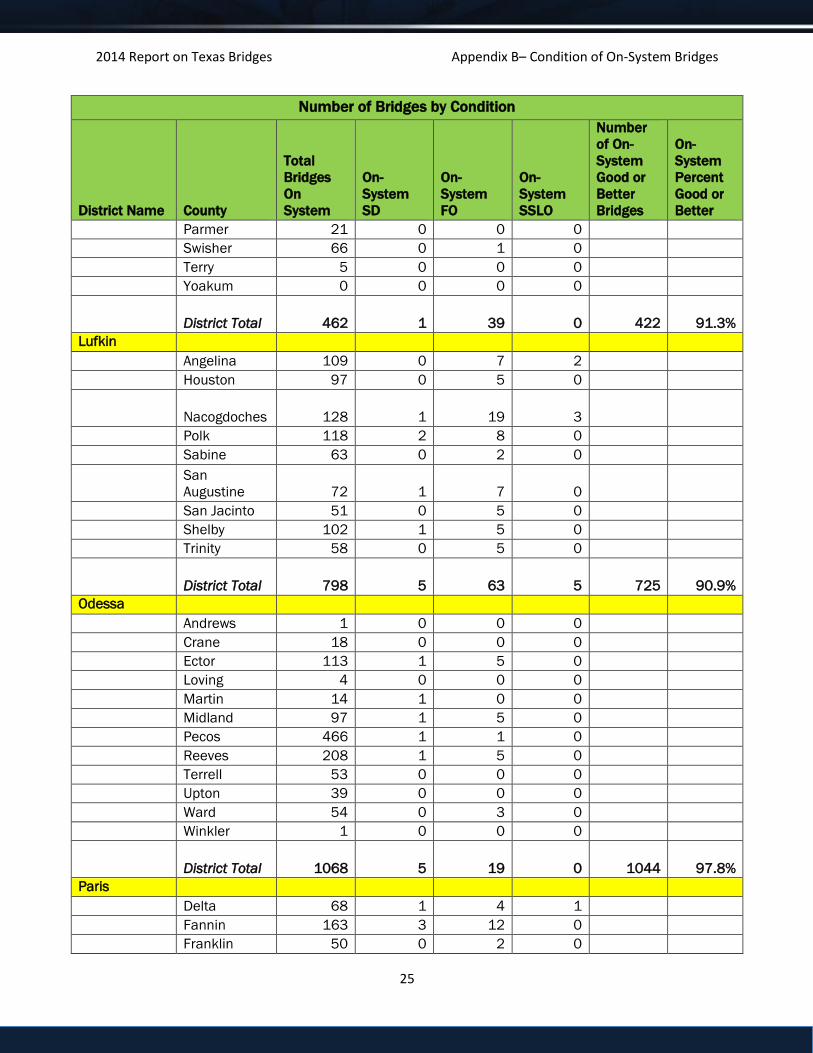
Appendix B – Condition of On-System Bridges by TxDOT District and County
as of September 2014
Number of Bridges by Condition
District Name County
Total
Bridges
On
System
On-
System
SD
On-
System
FO
On-
System
SSLO
Number
of On-
System
Good or
Better
Bridges
On-
System
Percent
Good or
Better
Abilene
Borden 49 0 1 1
Callahan 138 1 3 0
Fisher 78 0 6 2
Haskell 67 0 3 0
Howard 109 1 21 0
Jones 117 0 2 1
Kent 25 0 1 0
Mitchell 116 2 21 3
Nolan 131 1 12 0
Scurry 96 1 10 0
Shackelford 67 0 1 2
Stonewall 35 0 0 0
Taylor 324 3 36 0
District Total 1352 9 117 9 1217 90.0%
Amarillo
Armstrong 11 0 0 0
Carson 33 0 2 0
Dallam 22 0 1 0
Deaf Smith 22 0 4 0
Gray 58 0 5 0
Hansford 30 0 3 0
Hartley 16 0 0 0
Hemphill 31 0 0 0
Hutchinson 40 0 1 0
Lipscomb 36 1 0 0
Moore 24 1 1 0
Ochiltree 24 0 3 0
Oldham 51 0 1 0
Potter 162 3 20 0
Randall 81 1 11 0
Roberts 21 0 0 1
Sherman 25 0 0 0
District Total 687 6 52 1 628 91.4%
2014 Report on Texas Bridges Appendix B– Condition of On-System Bridges
21
Number of Bridges by Condition
District Name County
Total
Bridges
On
System
On-
System
SD
On-
System
FO
On-
System
SSLO
Number
of On-
System
Good or
Better
Bridges
On-
System
Percent
Good or
Better
Atlanta
Bowie 256 0 10 0
Camp 36 0 0 0
Cass 132 0 1 0
Harrison 211 0 8 0
Marion 46 1 5 0
Morris 49 0 2 0
Panola 129 0 0 0
Titus 99 0 12 0
Upshur 131 0 4 0
District Total 1089 1 42 0 1046 96.1%
Austin
Bastrop 131 2 9 0
Blanco 55 0 10 4
Burnet 82 0 16 2
Caldwell 152 2 8 2
Gillespie 92 0 13 0
Hays 122 0 19 0
Lee 66 0 14 1
Llano 76 2 8 0
Mason 75 2 7 0
Travis 724 3 124 0
Williamson 442 2 41 0
District Total 2017 13 269 9 1726 85.6%
Beaumont
Chambers 118 1 7 0
Hardin 118 0 4 0
Jasper 134 2 8 0
Jefferson 281 7 34 0
Liberty 151 2 3 1
Newton 115 1 10 0
Orange 110 3 8 0
Tyler 74 1 7 0
District Total 1101 17 81 1 1002 91.0%
Brownwood
Brown 127 0 2 0
Coleman 106 0 5 0

2014 Report on Texas Bridges Appendix B– Condition of On-System Bridges
22
Number of Bridges by Condition
District Name County
Total
Bridges
On
System
On-
System
SD
On-
System
FO
On-
System
SSLO
Number
of On-
System
Good or
Better
Bridges
On-
System
Percent
Good or
Better
Comanche 116 2 11 1
Eastland 170 0 8 2
Lampasas 76 1 3 1
McCulloch 93 0 4 1
Mills 53 0 1 2
San Saba 69 0 4 0
Stephens 83 1 4 1
District Total 893 4 42 8 839 94.0%
Bryan
Brazos 207 0 19 0
Burleson 75 0 12 0
Freestone 117 0 23 0
Grimes 118 1 16 0
Leon 131 1 10 0
Madison 103 0 21 0
Milam 126 4 15 0
Robertson 97 1 11 0
Walker 118 0 11 1
Washington 101 0 10 0
District Total 1193 7 148 1 1037 86.9%
Childress
Briscoe 14 0 0 0
Childress 67 0 1 0
Collingsworth 46 0 5 0
Cottle 56 0 6 1
Dickens 60 0 1 0
Donley 60 0 2 0
Foard 49 2 1 1
Hall 89 1 3 1
Hardeman 54 0 2 0
King 40 0 0 0
Knox 44 0 0 0
Motley 41 0 2 0
Wheeler 86 1 2 2
District Total 706 4 25 5 672 95.2%

2014 Report on Texas Bridges Appendix B– Condition of On-System Bridges
23
Number of Bridges by Condition
District Name County
Total
Bridges
On
System
On-
System
SD
On-
System
FO
On-
System
SSLO
Number
of On-
System
Good or
Better
Bridges
On-
System
Percent
Good or
Better
Corpus Christi
Aransas 17 1 0 0
Bee 109 2 4 2
Goliad 82 2 7 1
Jim Wells 144 0 10 0
Karnes 103 0 17 1
Kleberg 53 0 2 1
Live Oak 203 0 14 0
Nueces 328 1 28 2
Refugio 107 2 7 0
San Patricio 186 2 6 0
District Total 1332 10 95 7 1220 91.6%
Dallas
Collin 416 1 75 4
Dallas 1605 8 419 1
Denton 466 7 81 1
Ellis 457 1 76 0
Kaufman 380 0 50 0
Navarro 235 1 28 0
Rockwall 54 0 13 0
District Total 3613 18 742 6 2847 78.8%
El Paso
Brewster 91 0 1 0
Culberson 134 0 1 0
El Paso 463 3 76 0
Hudspeth 130 0 8 0
Jeff Davis 134 0 12 0
Presidio 73 0 3 0
District Total 1025 3 101 0 921 89.9%
Fort Worth
Erath 122 0 1 0
Hood 60 0 5 0
Jack 76 0 3 2
Johnson 244 1 23 1
Palo Pinto 182 1 3 2
Parker 163 3 6 1
2014 Report on Texas Bridges Appendix B– Condition of On-System Bridges
24
Number of Bridges by Condition
District Name County
Total
Bridges
On
System
On-
System
SD
On-
System
FO
On-
System
SSLO
Number
of On-
System
Good or
Better
Bridges
On-
System
Percent
Good or
Better
Somervell 26 0 3 0
Tarrant 1233 5 171 0
Wise 132 0 8 0
District Total 2238 10 223 6 1999 89.3%
Houston
Brazoria 323 2 15 0
Fort Bend 265 0 19 0
Galveston 197 4 27 0
Harris 1796 14 440 0
Montgomery 265 2 7 0
Waller 123 0 7 1
District Total 2969 22 515 1 2431 81.9%
Laredo
Dimmit 72 0 8 0
Duval 117 0 0 0
Kinney 36 0 2 0
Lasalle 109 0 4 0
Maverick 96 0 2 0
Val Verde 97 0 7 0
Webb 265 0 18 0
Zavala 71 0 8 0
District Total 863 0 49 0 814 94.3%
Lubbock
Bailey 4 0 0 0
Castro 10 0 1 0
Cochran 0 0 0 0
Crosby 12 0 0 0
Dawson 3 0 0 0
Floyd 10 0 2 0
Gaines 0 0 0 0
Garza 48 0 1 0
Hale 45 0 5 0
Hockley 3 0 0 0
Lamb 11 0 0 0
Lubbock 219 1 27 0
Lynn 5 0 2 0
2014 Report on Texas Bridges Appendix B– Condition of On-System Bridges
25
Number of Bridges by Condition
District Name County
Total
Bridges
On
System
On-
System
SD
On-
System
FO
On-
System
SSLO
Number
of On-
System
Good or
Better
Bridges
On-
System
Percent
Good or
Better
Parmer 21 0 0 0
Swisher 66 0 1 0
Terry 5 0 0 0
Yoakum 0 0 0 0
District Total 462 1 39 0 422 91.3%
Lufkin
Angelina 109 0 7 2
Houston 97 0 5 0
Nacogdoches 128 1 19 3
Polk 118 2 8 0
Sabine 63 0 2 0
San
Augustine 72 1 7 0
San Jacinto 51 0 5 0
Shelby 102 1 5 0
Trinity 58 0 5 0
District Total 798 5 63 5 725 90.9%
Odessa
Andrews 1 0 0 0
Crane 18 0 0 0
Ector 113 1 5 0
Loving 4 0 0 0
Martin 14 1 0 0
Midland 97 1 5 0
Pecos 466 1 1 0
Reeves 208 1 5 0
Terrell 53 0 0 0
Upton 39 0 0 0
Ward 54 0 3 0
Winkler 1 0 0 0
District Total 1068 5 19 0 1044 97.8%
Paris
Delta 68 1 4 1
Fannin 163 3 12 0
Franklin 50 0 2 0

2014 Report on Texas Bridges Appendix B– Condition of On-System Bridges
26
Number of Bridges by Condition
District Name County
Total
Bridges
On
System
On-
System
SD
On-
System
FO
On-
System
SSLO
Number
of On-
System
Good or
Better
Bridges
On-
System
Percent
Good or
Better
Grayson 263 0 32 0
Hopkins 175 5 15 0
Hunt 311 1 19 3
Lamar 178 5 16 2
Rains 34 1 0 0
Red River 119 4 1 6
District Total 1361 20 101 12 1228 90.2%
Pharr
Brooks 43 0 0 0
Cameron 241 0 15 0
Hidalgo 240 1 21 0
Jim Hogg 29 0 2 0
Kenedy 17 0 0 0
Starr 50 0 0 0
Willacy 61 0 2 0
Zapata 37 0 4 0
District Total 718 1 44 0 673 93.7%
San Angelo
Coke 82 0 1 0
Concho 67 1 1 0
Crockett 159 1 2 0
Edwards 26 0 1 0
Glasscock 18 0 0 0
Irion 50 0 0 0
Kimble 146 0 9 0
Menard 61 0 0 0
Reagan 28 0 0 0
Real 28 0 6 0
Runnels 115 0 13 1
Schleicher 28 0 0 0
Sterling 52 0 2 0
Sutton 90 0 4 0
Tom Green 262 0 21 0
District Total 1212 2 60 1 1149 94.8%
San Antonio
Atascosa 151 0 6 0
Bandera 56 0 11 0

2014 Report on Texas Bridges Appendix B– Condition of On-System Bridges
27
Number of Bridges by Condition
District Name County
Total
Bridges
On
System
On-
System
SD
On-
System
FO
On-
System
SSLO
Number
of On-
System
Good or
Better
Bridges
On-
System
Percent
Good or
Better
Bexar 1262 0 178 0
Comal 137 0 11 0
Frio 126 0 11 0
Guadalupe 237 1 10 0
Kendall 80 0 11 0
Kerr 142 2 12 0
McMullen 53 0 0 0
Medina 161 0 8 0
Uvalde 94 1 7 0
Wilson 97 0 11 0
District Total 2596 4 276 0 2316 89.2%
Tyler
Anderson 111 1 3 0
Cherokee 120 0 5 0
Gregg 137 0 15 0
Henderson 166 1 7 0
Rusk 162 1 2 0
Smith 249 1 16 0
Van Zandt 172 0 13 0
Wood 104 2 12 0
District Total 1221 6 73 0 1142 93.5%
Waco
Bell 383 0 43 1
Bosque 113 1 6 1
Coryell 135 0 8 1
Falls 158 0 6 0
Hamilton 81 0 2 0
Hill 232 3 12 2
Limestone 132 0 1 0
McLennan 422 0 51 2
District Total 1656 4 129 7 1516 91.5%
Wichita Falls
Archer 94 1 1 0
Baylor 51 0 4 0
Clay 121 2 10 0
Cooke 138 1 9 0

2014 Report on Texas Bridges Appendix B– Condition of On-System Bridges
28
Number of Bridges by Condition
District Name County
Total
Bridges
On
System
On-
System
SD
On-
System
FO
On-
System
SSLO
Number
of On-
System
Good or
Better
Bridges
On-
System
Percent
Good or
Better
Montague 99 0 3 0
Throckmorton 45 0 0 0
Wichita 305 1 37 0
Wilbarger 118 2 12 2
Young 84 0 2 0
District Total 1055 7 78 2 968 91.8%
Yoakum
Austin 110 1 7 0
Calhoun 77 2 1 0
Colorado 151 0 17 0
Dewitt 149 1 7 0
Fayette 231 2 15 0
Gonzales 232 1 27 1
Jackson 125 1 0 0
Lavaca 127 0 8 0
Matagorda 87 1 4 0
Victoria 203 2 8 0
Wharton 175 3 9 0
District Total 1667 14 103 1 1549 92.9%
Statewide
On-System
Total 34892 193 3486 82 31131 89.2%
Table B-1.

2014 Report on Texas Bridges Appendix C– Condition of Off-System Bridges
29
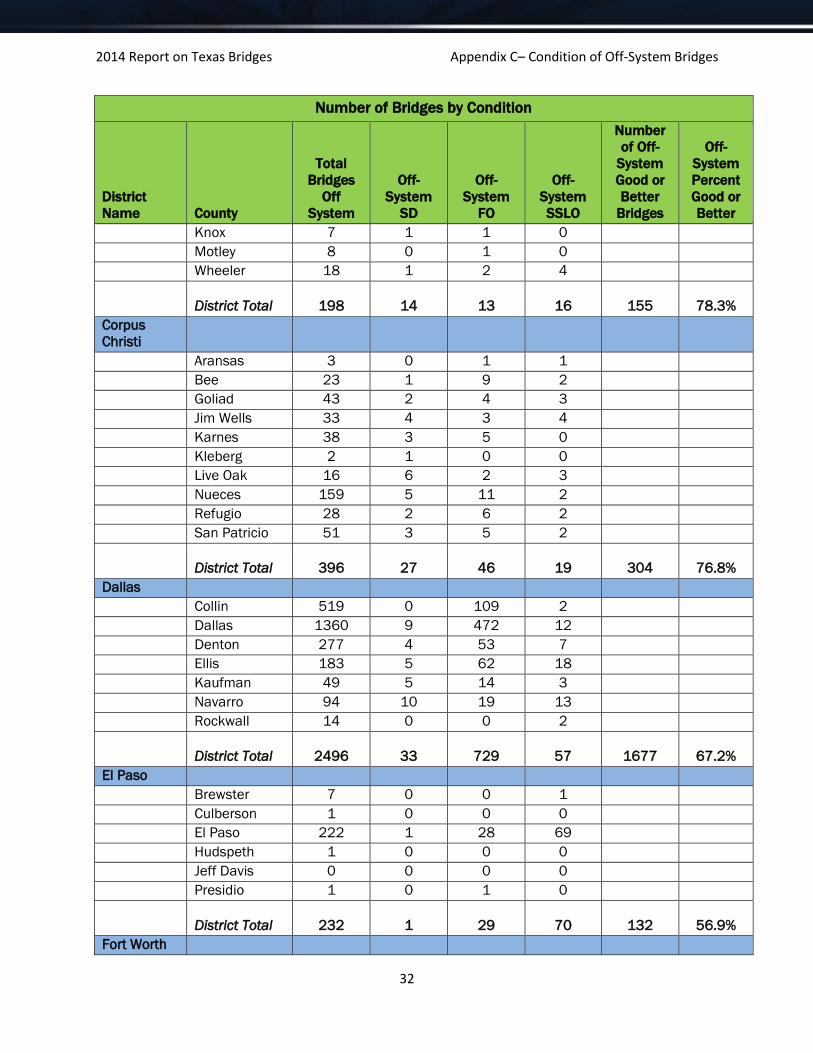
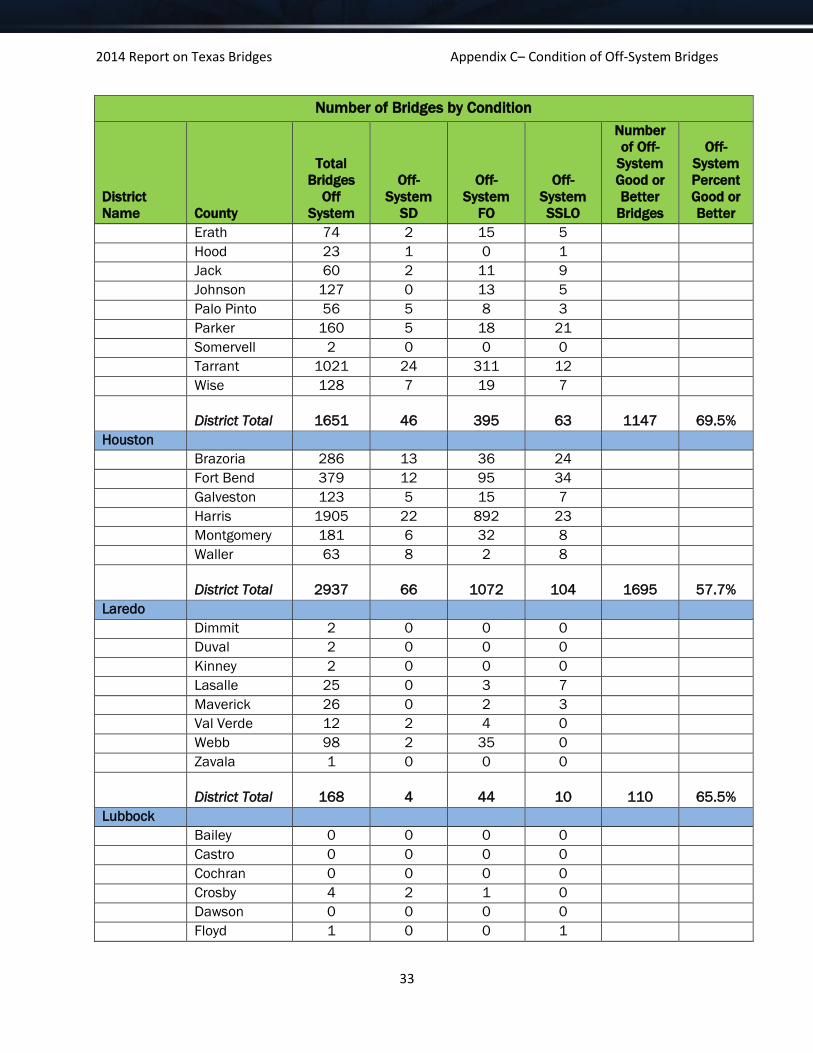
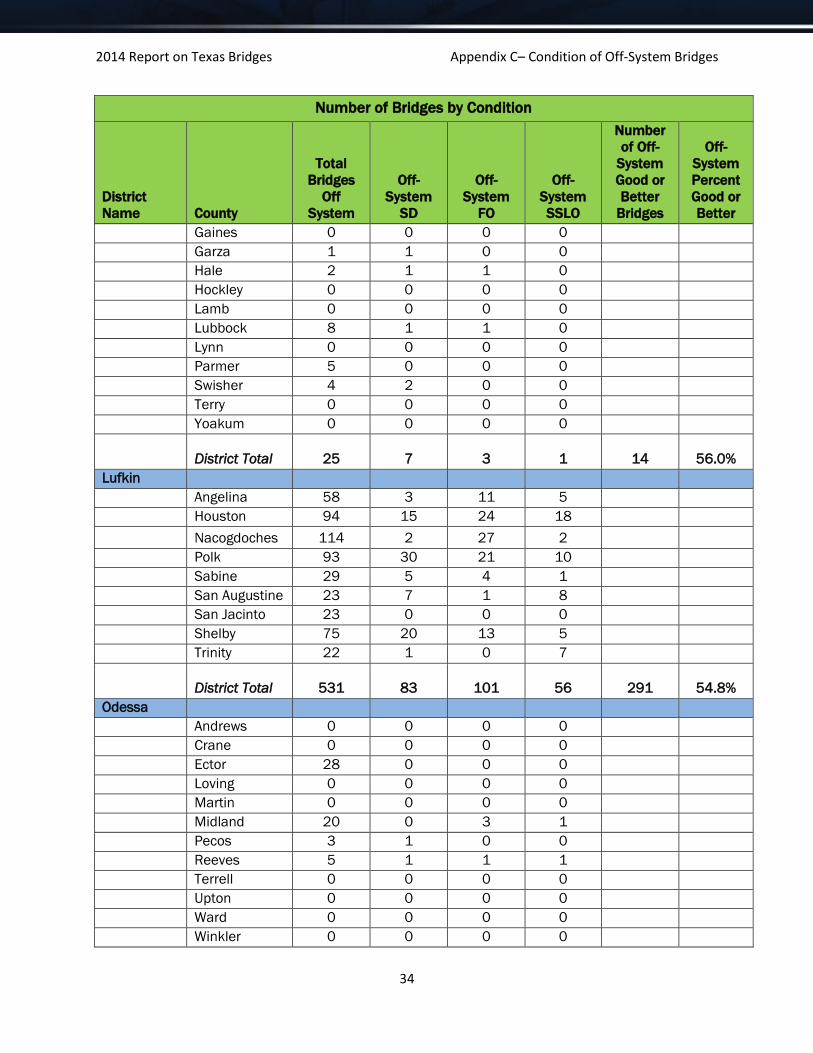
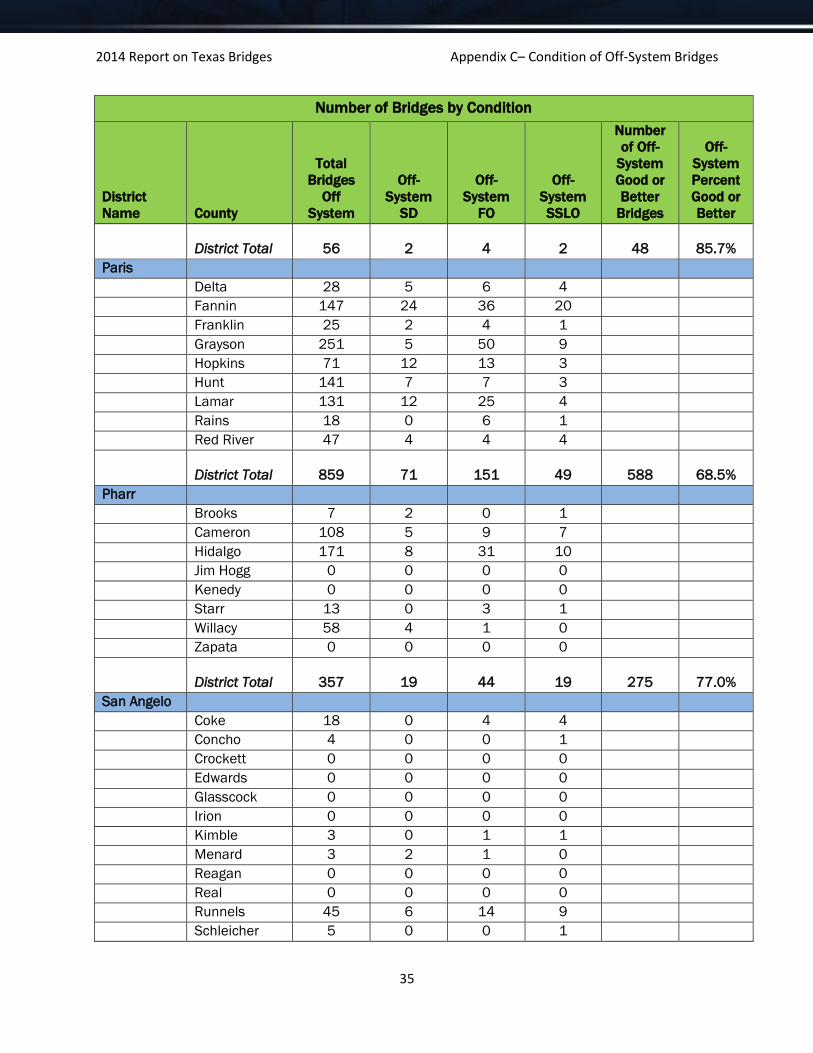
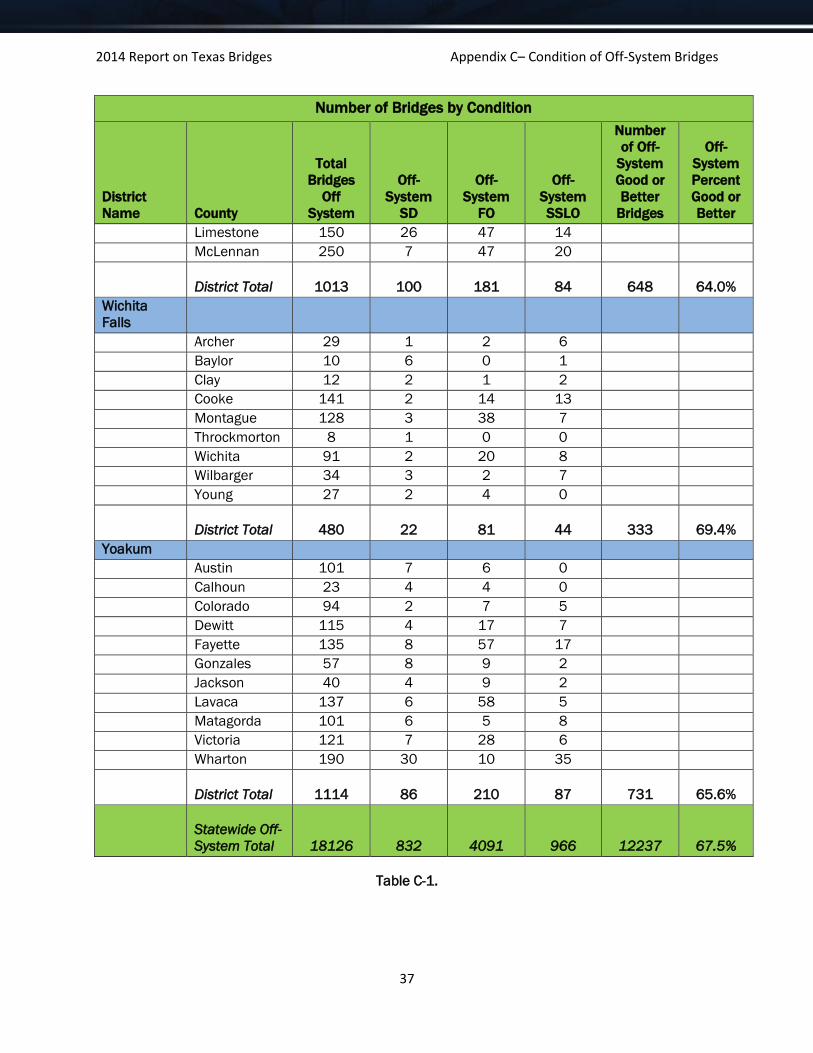
Appendix C – Condition of Off-System Bridges by TxDOT District and County
as of September 2014
Number of Bridges by Condition
District
Name County
Total
Bridges
Off
System
Off-
System
SD
Off-
System
FO
Off-
System
SSLO
Number
of Off-
System
Good or
Better
Bridges
Off-
System
Percent
Good or
Better
Abilene
Borden 3 0 0 0 3
Callahan 19 5 1 1 12
Fisher 74 22 15 10 27
Haskell 13 0 2 0 11
Howard 9 0 1 0 8
Jones 50 2 6 4 38
Kent 8 1 1 4 2
Mitchell 25 3 3 1 18
Nolan 36 1 6 8 21
Scurry 43 2 0 3 38
Shackelford 11 2 1 2 6
Stonewall 16 1 0 3 12
Taylor 85 1 13 4 67
District Total 392 40 49 40 263 67.1%
Amarillo
Armstrong 1 1 0 0 0
Carson 2 0 2 0 0
Dallam 0 0 0 0 0
Deaf Smith 5 0 0 4 1
Gray 24 6 4 1 13
Hansford 10 0 1 2 7
Hartley 0 0 0 0 0
Hemphill 4 0 0 0 4
Hutchinson 12 0 0 2 10
Lipscomb 3 0 0 0 3
Moore 2 0 0 2 0
Ochiltree 8 0 0 3 5
Oldham 0 0 0 0 0
Potter 22 1 4 0 17
Randall 6 0 1 0 5
Roberts 1 0 0 0 1
Sherman 5 0 0 0 5

2014 Report on Texas Bridges Appendix C– Condition of Off-System Bridges
30
Number of Bridges by Condition
District
Name County
Total
Bridges
Off
System
Off-
System
SD
Off-
System
FO
Off-
System
SSLO
Number
of Off-
System
Good or
Better
Bridges
Off-
System
Percent
Good or
Better
District Total 105 8 12 14 71 67.6%
Atlanta
Bowie 56 0 14 0 42
Camp 4 0 0 0 4
Cass 12 0 2 0 10
Harrison 45 2 5 4 34
Marion 12 1 2 0 9
Morris 21 0 6 4 11
Panola 16 0 10 0 6
Titus 45 2 4 0 39
Upshur 8 0 1 0 7
District Total 219 5 44 8 162 74.0%
Austin
Bastrop 100 3 19 3
Blanco 6 0 1 2
Burnet 26 1 2 1
Caldwell 46 5 7 3
Gillespie 36 3 11 2
Hays 49 2 3 0
Lee 74 0 19 1
Llano 9 2 2 0
Mason 11 2 4 4
Travis 654 0 117 7
Williamson 504 5 44 5
District Total 1515 23 229 28 1235 81.5%
Beaumont
Chambers 16 0 2 3
Hardin 43 1 2 5
Jasper 44 0 13 0
Jefferson 158 2 39 2
Liberty 40 3 11 1
Newton 42 7 4 6
Orange 60 5 17 3
Tyler 58 3 8 2

2014 Report on Texas Bridges Appendix C– Condition of Off-System Bridges
31
Number of Bridges by Condition
District
Name County
Total
Bridges
Off
System
Off-
System
SD
Off-
System
FO
Off-
System
SSLO
Number
of Off-
System
Good or
Better
Bridges
Off-
System
Percent
Good or
Better
District Total 461 21 96 22 322 69.8%
Brownwood
Brown 95 13 15 11
Coleman 42 0 6 7
Comanche 98 12 12 12
Eastland 63 4 7 8
Lampasas 15 0 3 0
McCulloch 26 1 4 3
Mills 15 4 0 3
San Saba 20 2 2 3
Stephens 33 4 7 5
District Total 407 40 56 52 259 63.6%
Bryan
Brazos 127 1 12 1
Burleson 48 8 7 9
Freestone 52 4 8 4
Grimes 95 8 36 8
Leon 31 1 5 7
Madison 25 7 8 5
Milam 54 4 14 4
Robertson 43 4 4 4
Walker 30 2 2 1
Washington 121 2 29 5
District Total 626 41 125 48 412 65.8%
Childress
Briscoe 4 0 0 0
Childress 24 1 1 2
Collingsworth 19 1 1 1
Cottle 25 0 2 0
Dickens 12 4 1 0
Donley 13 0 2 2
Foard 11 2 1 2
Hall 29 2 0 1
Hardeman 23 2 0 4
King 5 0 1 0
2014 Report on Texas Bridges Appendix C– Condition of Off-System Bridges
32
Number of Bridges by Condition
District
Name County
Total
Bridges
Off
System
Off-
System
SD
Off-
System
FO
Off-
System
SSLO
Number
of Off-
System
Good or
Better
Bridges
Off-
System
Percent
Good or
Better
Knox 7 1 1 0
Motley 8 0 1 0
Wheeler 18 1 2 4
District Total 198 14 13 16 155 78.3%
Corpus
Christi
Aransas 3 0 1 1
Bee 23 1 9 2
Goliad 43 2 4 3
Jim Wells 33 4 3 4
Karnes 38 3 5 0
Kleberg 2 1 0 0
Live Oak 16 6 2 3
Nueces 159 5 11 2
Refugio 28 2 6 2
San Patricio 51 3 5 2
District Total 396 27 46 19 304 76.8%
Dallas
Collin 519 0 109 2
Dallas 1360 9 472 12
Denton 277 4 53 7
Ellis 183 5 62 18
Kaufman 49 5 14 3
Navarro 94 10 19 13
Rockwall 14 0 0 2
District Total 2496 33 729 57 1677 67.2%
El Paso
Brewster 7 0 0 1
Culberson 1 0 0 0
El Paso 222 1 28 69
Hudspeth 1 0 0 0
Jeff Davis 0 0 0 0
Presidio 1 0 1 0
District Total 232 1 29 70 132 56.9%
Fort Worth
2014 Report on Texas Bridges Appendix C– Condition of Off-System Bridges
33
Number of Bridges by Condition
District
Name County
Total
Bridges
Off
System
Off-
System
SD
Off-
System
FO
Off-
System
SSLO
Number
of Off-
System
Good or
Better
Bridges
Off-
System
Percent
Good or
Better
Erath 74 2 15 5
Hood 23 1 0 1
Jack 60 2 11 9
Johnson 127 0 13 5
Palo Pinto 56 5 8 3
Parker 160 5 18 21
Somervell 2 0 0 0
Tarrant 1021 24 311 12
Wise 128 7 19 7
District Total 1651 46 395 63 1147 69.5%
Houston
Brazoria 286 13 36 24
Fort Bend 379 12 95 34
Galveston 123 5 15 7
Harris 1905 22 892 23
Montgomery 181 6 32 8
Waller 63 8 2 8
District Total 2937 66 1072 104 1695 57.7%
Laredo
Dimmit 2 0 0 0
Duval 2 0 0 0
Kinney 2 0 0 0
Lasalle 25 0 3 7
Maverick 26 0 2 3
Val Verde 12 2 4 0
Webb 98 2 35 0
Zavala 1 0 0 0
District Total 168 4 44 10 110 65.5%
Lubbock
Bailey 0 0 0 0
Castro 0 0 0 0
Cochran 0 0 0 0
Crosby 4 2 1 0
Dawson 0 0 0 0
Floyd 1 0 0 1
2014 Report on Texas Bridges Appendix C– Condition of Off-System Bridges
34
Number of Bridges by Condition
District
Name County
Total
Bridges
Off
System
Off-
System
SD
Off-
System
FO
Off-
System
SSLO
Number
of Off-
System
Good or
Better
Bridges
Off-
System
Percent
Good or
Better
Gaines 0 0 0 0
Garza 1 1 0 0
Hale 2 1 1 0
Hockley 0 0 0 0
Lamb 0 0 0 0
Lubbock 8 1 1 0
Lynn 0 0 0 0
Parmer 5 0 0 0
Swisher 4 2 0 0
Terry 0 0 0 0
Yoakum 0 0 0 0
District Total 25 7 3 1 14 56.0%
Lufkin
Angelina 58 3 11 5
Houston 94 15 24 18
Nacogdoches 114 2 27 2
Polk 93 30 21 10
Sabine 29 5 4 1
San Augustine 23 7 1 8
San Jacinto 23 0 0 0
Shelby 75 20 13 5
Trinity 22 1 0 7
District Total 531 83 101 56 291 54.8%
Odessa
Andrews 0 0 0 0
Crane 0 0 0 0
Ector 28 0 0 0
Loving 0 0 0 0
Martin 0 0 0 0
Midland 20 0 3 1
Pecos 3 1 0 0
Reeves 5 1 1 1
Terrell 0 0 0 0
Upton 0 0 0 0
Ward 0 0 0 0
Winkler 0 0 0 0
2014 Report on Texas Bridges Appendix C– Condition of Off-System Bridges
35
Number of Bridges by Condition
District
Name County
Total
Bridges
Off
System
Off-
System
SD
Off-
System
FO
Off-
System
SSLO
Number
of Off-
System
Good or
Better
Bridges
Off-
System
Percent
Good or
Better
District Total 56 2 4 2 48 85.7%
Paris
Delta 28 5 6 4
Fannin 147 24 36 20
Franklin 25 2 4 1
Grayson 251 5 50 9
Hopkins 71 12 13 3
Hunt 141 7 7 3
Lamar 131 12 25 4
Rains 18 0 6 1
Red River 47 4 4 4
District Total 859 71 151 49 588 68.5%
Pharr
Brooks 7 2 0 1
Cameron 108 5 9 7
Hidalgo 171 8 31 10
Jim Hogg 0 0 0 0
Kenedy 0 0 0 0
Starr 13 0 3 1
Willacy 58 4 1 0
Zapata 0 0 0 0
District Total 357 19 44 19 275 77.0%
San Angelo
Coke 18 0 4 4
Concho 4 0 0 1
Crockett 0 0 0 0
Edwards 0 0 0 0
Glasscock 0 0 0 0
Irion 0 0 0 0
Kimble 3 0 1 1
Menard 3 2 1 0
Reagan 0 0 0 0
Real 0 0 0 0
Runnels 45 6 14 9
Schleicher 5 0 0 1

2014 Report on Texas Bridges Appendix C– Condition of Off-System Bridges
36
Number of Bridges by Condition
District
Name County
Total
Bridges
Off
System
Off-
System
SD
Off-
System
FO
Off-
System
SSLO
Number
of Off-
System
Good or
Better
Bridges
Off-
System
Percent
Good or
Better
Sterling 2 2 0 0
Sutton 2 0 1 0
Tom Green 39 0 6 3
District Total 121 10 27 19 65 53.7%
San Antonio
Atascosa 25 0 1 2
Bandera 11 0 4 0
Bexar 913 13 191 5
Comal 37 0 9 0
Frio 16 2 1 1
Guadalupe 43 0 4 2
Kendall 25 3 4 0
Kerr 27 0 12 0
McMullen 4 0 0 0
Medina 46 3 8 1
Uvalde 7 0 0 0
Wilson 34 0 11 3
District Total 1188 21 245 14 908 76.4%
Tyler
Anderson 61 10 14 3
Cherokee 71 2 23 8
Gregg 76 2 11 1
Henderson 31 1 13 1
Rusk 107 1 10 2
Smith 144 14 13 19
Van Zandt 76 11 19 6
Wood 13 1 2 0
District Total 579 42 105 40 392 67.7%
Waco
Bell 209 6 42 5
Bosque 34 4 4 2
Coryell 27 2 2 4
Falls 155 31 17 20
Hamilton 39 8 7 3
Hill 149 16 15 16
2014 Report on Texas Bridges Appendix C– Condition of Off-System Bridges
37
Number of Bridges by Condition
District
Name County
Total
Bridges
Off
System
Off-
System
SD
Off-
System
FO
Off-
System
SSLO
Number
of Off-
System
Good or
Better
Bridges
Off-
System
Percent
Good or
Better
Limestone 150 26 47 14
McLennan 250 7 47 20
District Total 1013 100 181 84 648 64.0%
Wichita
Falls
Archer 29 1 2 6
Baylor 10 6 0 1
Clay 12 2 1 2
Cooke 141 2 14 13
Montague 128 3 38 7
Throckmorton 8 1 0 0
Wichita 91 2 20 8
Wilbarger 34 3 2 7
Young 27 2 4 0
District Total 480 22 81 44 333 69.4%
Yoakum
Austin 101 7 6 0
Calhoun 23 4 4 0
Colorado 94 2 7 5
Dewitt 115 4 17 7
Fayette 135 8 57 17
Gonzales 57 8 9 2
Jackson 40 4 9 2
Lavaca 137 6 58 5
Matagorda 101 6 5 8
Victoria 121 7 28 6
Wharton 190 30 10 35
District Total 1114 86 210 87 731 65.6%
Statewide Off-
System Total 18126 832 4091 966 12237 67.5%
Table C-1.

Related Documents