Office of Student Financial Aid Programs Report on Student Financial Aid in Texas Higher Education Fiscal Year 2015 September 2016

Welcome message from author
This document is posted to help you gain knowledge. Please leave a comment to let me know what you think about it! Share it to your friends and learn new things together.
Transcript
Office of Student Financial Aid Programs
Report on Student Financial Aid in Texas
Higher Education
Fiscal Year 2015
September 2016

This page has been left blank intentionally.
Texas Higher Education Coordinating Board
Robert “Bobby” Jenkins Jr., CHAIR Austin
Stuart W. Stedman, VICE CHAIR Houston
David D. Teuscher, MD, SECRETARY TO THE BOARD Beaumont
Arcilia C. Acosta Dallas
S. Javaid Anwar Midland
Fred Farias III, OD McAllen
Ricky A. Raven Sugar Land
Janelle Shepard Weatherford
John T. Steen Jr. San Antonio
Haley E.R. DeLaGarza, STUDENT REPRESENTATIVE Victoria
Raymund A. Paredes, COMMISSIONER OF HIGHER EDUCATION Agency Mission The mission of the Texas Higher Education Coordinating Board is to provide leadership and coordination for the Texas higher education system and to promote access, affordability, quality, success, and cost efficiency through 60x30TX, resulting in a globally competitive workforce that positions Texas as an international leader. Agency Vision The THECB will be recognized as an international leader in developing and implementing innovative higher education policy to accomplish our mission.
Agency Philosophy The THECB will promote access to and success in quality higher education across the state with the conviction that access and success without quality is mediocrity and that quality without access and success is unacceptable.
The Coordinating Board’s core values are:
Accountability: We hold ourselves responsible for our actions and welcome every opportunity to educate stakeholders about our policies, decisions, and aspirations.
Efficiency: We accomplish our work using resources in the most effective manner.
Collaboration: We develop partnerships that result in student success and a highly qualified, globally competent workforce.
Excellence: We strive for excellence in all our endeavors. The Texas Higher Education Coordinating Board does not discriminate on the basis of race, color, national
origin, gender, religion, age or disability in employment or the provision of services.
Please cite this report as follows: Texas Higher Education Coordinating Board. (2016). Report on Student Financial Aid in Texas Higher Education
Fiscal Year 2015. Austin, TX.
Table of Contents Executive Summary ................................................................................................................. i
Chapter 1 – Introduction ........................................................................................................ 1
Chapter 2 – Overview of Tuition and Fees .............................................................................. 6
Section 1: Tuition and Fees ................................................................................................................... 6
Section 2: Tuition Set-Asides............................................................................................................... 11
Section 3: Tuition Exemptions and Waivers .......................................................................................... 12
Chapter 3 – Overview of Financial Aid ................................................................................. 19
Section 1: Types and Sources of Financial Aid ...................................................................................... 19
Section 2: Financial Aid to Undergraduate Students .............................................................................. 20
Section 3: Financial Aid to Graduate Students ...................................................................................... 24
Section 4: Need-Based Aid and Merit Aid ............................................................................................. 28
Section 5: State and National Trends ................................................................................................... 32
Chapter 4 – Program Profiles ............................................................................................... 42
Section 1: Toward EXcellence, Access, and Success (TEXAS) Grant ....................................................... 44
Section 2: Tuition Equalization Grant (TEG) ......................................................................................... 49
Section 3: Texas Educational Opportunity Grant (TEOG) Program ......................................................... 54
Section 4: Texas Public Educational Grant (TPEG) ................................................................................ 59
Section 5: Financial Aid Funded by Designated Tuition Set-Asides (HB 3015) ................................... 63
Section 6: Merit Scholarships .............................................................................................................. 67
Section 7: Top Ten Percent Scholarship ............................................................................................... 71
Section 8: Texas College Work-Study (TX WS) ..................................................................................... 75
Section 9: College Access Loan (CAL) Program ..................................................................................... 79
Section 10: B-On-Time (BOT) Loan Program ........................................................................................ 83
Section 11: Texas Armed Services Scholarship Program (TASSP)........................................................... 87
Appendices Appendix A: Financial Aid by Student’s Home Region............................................................................ 88
Appendix B: Institutions Included in the Financial Aid Database ............................................................ 89
Appendix C: Cost of Attendance Budgets for Texas Colleges and Universities ......................................... 91
Appendix D: All Students Who Completed Need Analysis and Received Aid ............................................ 95
Appendix E: Number of Awards and Total Funds Awarded Per Institution .............................................. 96
Appendix F: Students Who Demonstrated Need and Received Aid ....................................................... 124
Appendix G: Students Who Demonstrated Need and Did Not Receive Aid. ........................................... 127
Appendix H: Students Who Did Not Demonstrate Need and Received Aid. ........................................... 129
Appendix I: Percent of Enrollment Receiving Tuition Equalization Grants, by Ethnicity. ..................... 131
Appendix J. Exemptions and Waivers ................................................................................................. 132
Appendix K: Resources ..................................................................................................................... 135
Index of Tables
Table 1. Comparison of recipient information for state financial aid programs. ........................................................ iii Table 2. Income levels used for poverty and median indicators and maximum EFC for Federal Pell Grant eligibility. ....................................................................................................................................................................... 4 Table 3. Average annual tuition & fees at Texas public institutions of higher education, FY 2011-2015. ................... 7 Table 4. Tuition and fee revenue perspectives. ......................................................................................................... 10 Table 5. Total exemptions and waivers, FY 2011-2015. ............................................................................................. 13 Table 6. Exemptions and waivers, by institutional sector, FY 2011-2015. ................................................................. 15 Table 7. Largest exemption and waiver programs, FY 2015. ..................................................................................... 15 Table 8. Hazlewood exemptions, FY 2011-2015. ....................................................................................................... 16 Table 9. Exemption and waiver detail, by institutional sector, FY 2015. ................................................................... 17 Table 10. Types and sources of aid to undergraduate students, FY 2015.................................................................. 20 Table 11. Grants and scholarships to undergraduate students, by program, FY 2015. ............................................. 21 Table 12. Loans to undergraduate students, by program, FY 2015. .......................................................................... 22 Table 13. Types and sources of aid to graduate students, FY 2015. .......................................................................... 25 Table 14. Grants and scholarships to graduate students, by program, FY 2015. ....................................................... 26 Table 15. Loans to graduate students, by program, FY 2015. .................................................................................... 26 Table 16. Students who demonstrated need and received aid (Group A), FY 2015. ................................................. 31 Table 17. Students who demonstrated need and did not receive aid (Group B), FY 2015. ....................................... 31 Table 18. Students who did not demonstrate need and received aid (Group C), FY 2015. ....................................... 32 Table 19. Grant and scholorship funding sources, FY 2011-2015. ............................................................................. 33 Table 20. Loan funding sources, FY 2011-2015. ......................................................................................................... 33 Table 21. All aid (in billions) to students who applied for financial aid, FY 2011-2015.............................................. 34 Table 22. TEXAS Grant, TEG, and TEOG funding summary, FY 2011-2015................................................................. 34 Table 23. Grant aid (in millions) awarded to students attending Texas institutions, FY 2011-2015. ........................ 35 Table 24. Percentage of total grant aid (Texas), by type, FY 2011-2015. ................................................................... 36 Table 25. National grant aid (in millions), FY 2011-2015. .......................................................................................... 36 Table 26. Percentage of total grant aid (nationally), by type, FY 2011-2015. ............................................................ 37 Table 27. Loans (in millions) awarded to students attending Texas institutions, FY 2011-2015. .............................. 38 Table 28. Educational loans (in millions) awarded nationally, FY 2011-2015. ........................................................... 38 Table 29. State and tuition set-aside financial aid funding, FY 2015. ........................................................................ 42 Table 30. Income data utilized in program profiles.................................................................................................... 43 Table 31. Race/ethnicity comparison, TEXAS Grant recipients vs. all students at eligible institutions, FY 2015. ...... 47 Table 32. Graduation and persistence rates of TEXAS Grant recipients. ................................................................... 48
Table 33. Summary TEG awards, FY 2011-2015. ..................................................................................................... 50 Table 34. Race/ethnicity comparison, TEG recipients vs. all students at eligible institutions, FY 2015. ................... 52 Table 35. Graduation and persistence rates of TEG recipients. ................................................................................. 53 Table 36. TEOG coverage of tuition and fees at public two-year institutions, FY 2011-2015. ................................... 55 Table 37. Summary – TEOG awards, FY 2011-2015. .................................................................................................. 56 Table 38. Race/ethnicity comparison, TEOG recipients vs. all students at eligible institutions, FY 2015. ................. 58 Table 39. Graduation and persistence rates of TEOG recipients. .............................................................................. 58 Table 40. Summary – TPEG awards, FY 2011-2015. ................................................................................................... 59 Table 41. Race/ethnicity comparison, TPEG recipients vs. all students at eligible institutions, FY 2015. ................. 62 Table 42. Graduation and persistence rates of TPEG recipients. ............................................................................... 62 Table 43. Summary – HB 3015 Awards, FY 2011-2015. ............................................................................................. 64 Table 44. Race/ethnicity comparison, HB 3015 recipients vs. all students at eligible institutions, FY 2015. ............ 66 Table 45. Graduation and persistence rates of HB 3015 recipients. .......................................................................... 66 Table 46. Summary – merit scholarships, FY 2015. .................................................................................................... 67 Table 47. Race/ethnicity comparison, merit scholarship recipients vs. all students at eligible institutions, FY 2015. ...................................................................................................................................................................... 69
Table 48. Graduation and persistence rates of merit scholarship recipients. ........................................................... 70 Table 49. Summary – Top Ten Percent Scholarship awards, FY 2011-2015. .............................................................. 72 Table 50. Race/ethnicity comparison, Top Ten Percent Scholarship recipients vs. all students at eligible institutions, FY 2015. .................................................................................................................................................. 74 Table 51. Graduation and persistence rates of Top Ten Percent Scholarship recipients. ......................................... 74 Table 52. Summary – TX WS awards, FY 2011-2015. ................................................................................................. 76 Table 53. Race/ethnicity comparison, TX WS recipients vs. all students at eligible institutions, FY 2015. ................ 78 Table 54. Graduation and persistence rates of TX WS recipients. ............................................................................. 78 Table 55. Summary – CAL awards, FY 2011-2015. ..................................................................................................... 79 Table 56. Race/ethnicity comparison, CAL recipients vs. all students at eligible institutions, FY 2015. .................... 82 Table 57. Graduation and persistence rates of CAL recipients. ................................................................................. 82 Table 58. Summary – BOT awards, FY 2011-2015. ..................................................................................................... 83 Table 59. Race/ethnicity comparison, BOT loan recipients vs. all students at eligible institutions, FY 2015. ........... 85 Table 60. Graduation and persistence rates of BOT loan recipients. ......................................................................... 86 Table 61. Summary – TASSP awards, FY2011-2015. .................................................................................................. 87
Index of Figures
Figure 1. Texas’ three-year average inflation-adjusted earnings. ................................................................................ 2 Figure 2. Nationally, Texas ranks 20th in affordability of public universities. .............................................................. 6 Figure 3. Public university undergraduate and graduate net tuition and fee revenue & state appropriations. ......... 9 Figure 4. Breakout of undergraduate tuition and fee charges. .................................................................................... 9 Figure 5. Students benefitting from exemptions and waivers, FY 2011-2015. .......................................................... 14 Figure 6. Institutional foregone revenue from exemptions and waivers, FY 2011-2015. .......................................... 14 Figure 7. Undergraduate and graduate financial aid, by type of aid, FY 2015. .......................................................... 19 Figure 8. Percentage of aid to undergraduate students, by aid type and source FY 2015. ....................................... 20 Figure 9. Percentage of undergraduates receiving aid within income ranges, FY 2015. ........................................... 23 Figure 10. Distribution of financial aid to undergraduate students, by sector and type of aid, FY 2015. ................. 24 Figure 11. Percentage of aid to graduate students, by aid type and source, FY 2015. .............................................. 25 Figure 12. Percentage of graduates receiving aid within income ranges, FY 2015. ................................................... 27 Figure 13. Distribution of financial aid to graduate students, by institutional sector and type of aid, FY 2015. ....... 28 Figure 14. Average amount of unmet need for undergraduate students, FY 2015. .................................................. 29 Figure 15. Average amount of unmet need for graduate students, FY 2015. ............................................................ 29 Figure 16. Comparison of students as to receipt of aid and demonstration of need, FY 2015.................................. 30 Figure 17. Students who demonstrated need, FY 2015. ............................................................................................ 32 Figure 18. Loans and grants (in billions) in Texas, FY 2011-2015. .............................................................................. 33 Figure 19. Grant aid (in millions) in Texas, FY 2011-2015. ......................................................................................... 35 Figure 20. Grant aid (in millions) nationally, FY 2011-2015. ...................................................................................... 36 Figure 21. Loan aid in Texas, FY 2011-2015. ............................................................................................................... 37 Figure 22. Educational loans nationwide, FY 2011-2015. .......................................................................................... 38 Figure 23. TEXAS Grant recipients, by income level, FY 2011-2015. .......................................................................... 45 Figure 24. TEXAS Grant recipients, by EFC, FY 2015. .................................................................................................. 46 Figure 25. TEXAS Grant recipients, by race/ethnicity, FY 2015. ................................................................................. 47 Figure 26. TEG recipients, by income level, FY 2011-2015. ........................................................................................ 50 Figure 27. TEG recipients, by EFC, FY 2015. ................................................................................................................ 51 Figure 28. TEG recipients, by race/ethnicity, FY 2015. ............................................................................................... 52 Figure 29. TEOG recipients, by income level, FY 2015. .............................................................................................. 56 Figure 30. TEOG recipients, by EFC, FY 2015. ............................................................................................................. 57 Figure 31. TEOG recipients, by race/ethnicity, FY2015. ............................................................................................. 57 Figure 32. TPEG recipients, by income level FY 2011-2015 ........................................................................................ 60 Figure 33. TPEG recipients, by EFC, FY 2015. .............................................................................................................. 61
Figure 34. TPEG recipients, by race/ethnicity, FY 2015. ............................................................................................. 61 Figure 35. HB 3015 recipients, by income level, FY 2011-2015.................................................................................. 64 Figure 36. HB 3015 recipients, by EFC, FY 2015. ........................................................................................................ 65 Figure 37. HB 3015 recipients, by race/ethnicity, FY 2015. ........................................................................................ 65 Figure 38. Merit scholarship recipients, by income level, FY 2011-2015. .................................................................. 68 Figure 39. Merit scholarship recipients, by EFC, FY 2015. .......................................................................................... 68 Figure 40. Merit scholarship recipients, by race/ethnicity, FY 2015. ......................................................................... 69 Figure 41. Top Ten Percent Scholarship recipients, by income level, FY 2011-2015. ................................................ 72 Figure 42. Top Ten Percent Scholarship recipients, by EFC, FY 2015. ........................................................................ 73 Figure 43. Top Ten Percent Scholarship recipients, by race/ethnicity, FY 2015. ....................................................... 73 Figure 44. TX WS recipients, by income level, FY 2011-2015. .................................................................................... 76 Figure 45. TX WS recipients, by EFC, FY 2015. ............................................................................................................ 77 Figure 46. TX WS recipients, by race/ethnicity, FY 2015. ........................................................................................... 77 Figure 47. CAL recipients, by income level, FY 2011-2015. ........................................................................................ 80 Figure 48. CAL recipients, by EFC, FY 2015. ................................................................................................................ 81 Figure 49. CAL recipients, by race/ethnicity, FY 2015. ............................................................................................... 81 Figure 50. BOT Recipients, by income level, FY 2011-2015. ....................................................................................... 84 Figure 51. BOT recipients, by EFC, FY 2015. ............................................................................................................... 84 Figure 52. BOT recipients, by race/ethnicity, FY 2015. .............................................................................................. 85
i
Executive Summary
Financial aid plays a critical role in accomplishing all four of the goals articulated in the 60x30TX strategic plan for higher education: attainment, completion, marketable skills, and student debt. Effective aid programs support both access and success in our higher education structure and provide work-study opportunities to prepare students for the workforce. Furthermore, the balance of grant and loan opportunities, including effective counseling on these options, plays a key role in helping students manage their student debt. In keeping with the General Appropriations Act requirement to present an annual report concerning student financial aid at Texas public and independent institutions of higher education, this report provides data and details regarding the financial aid awarded in Fiscal Year (FY) 2015 in order to inform policy discussions and other necessary activities as we continue our efforts to create the educated workforce necessary for Texas’ long-term success.
Although $9.2 billion in student financial aid was awarded from federal, institutional, private, and state funding in FY 2015, there was still a significant amount of unmet financial need among students attending Texas institutions of higher education. The average amount per student needed to cover the gap between undergraduate education costs and student resources (Expected Family Contribution and financial aid) was approximately $6,000 for students attending public two-year institutions, $6,200 for students attending public universities and health-related institutions (HRIs), and $7,000 for students attending private or independent institutions.
Some students can reduce this gap by working to earn more income and by reducing living expenses. However, they cannot control tuition and fee costs. Since tuition was deregulated in 2003, these charges for full-time undergraduate students have increased by 70 percent, in dollars adjusted for inflation. At the same time, state appropriations to institutions have declined.
Additionally, foregone institutional revenue from tuition exemptions and waivers have increased dramatically since 2009, reaching $752.2 million in FY 2015. The largest amount of foregone revenue from tuition exemption and waiver programs was from Hazlewood exemptions benefitting veterans and their dependents, dual credit exemptions, competitive scholarship waivers, and teaching or research assistant waivers.
In particular, “Hazlewood Legacy Act” exemptions, authorized by the Texas Legislature in 2009, accounted for 52 percent of all exemptions in FY 2015, which totaled $184.7 million. Legacy Act provisions extend eligibility to spouses and allow eligible veterans to assign their unused credit hours to their children. The amount of Legacy Act tuition exemptions increased by 157 percent from FY 2011 to FY 2015.
Another noteworthy element of student financial aid in Texas is “tuition set-asides.” Two state financial aid programs are funded by the mandatory setting aside of specified tuition dollars. The Texas Public Educational Grant (TPEG) program was authorized in 1975, while Financial Aid Funded by Designated Tuition Set-Asides, commonly referred to as HB 3015 funds, was authorized at the time of tuition deregulation in 2003. The funds collected from the set-asides are retained at the institutions for distribution to financially needy students. In FY 2015, 207,818 students received awards exceeding $345 million through these programs. Almost half of the students receiving these funds had family incomes below the federally established poverty level for a family of four.
Reliance on set-aside funds to assist financially needy students has increased as tuition and fees have increased. Students who don’t meet all requirements to qualify for other grant aid may be assisted with these funds. Additionally, institutions rely on these funds to meet the statutory requirements to make up the difference between tuition and fee costs and grants through two of the state’s signature grant programs, the Toward EXcellence, Access, and Success (TEXAS) Grant Program and the Texas Educational Opportunity Grant (TEOG) Program.
ii
In reviewing financial aid data overall, it is important to recognize that federal and state gift aid is primarily targeted for undergraduates, rather than graduate students. More than half of all financial aid to undergraduates attending Texas institutions in FY 2015 was grant aid, and approximately 43 percent was in the form of student loans. Conversely, only a small percentage of aid to graduate students was grant aid, with more than 83 percent of all aid to graduate students in the form of student loans.
It is also important to recognize that students attending Texas institutions of higher education rely to a great extent on federal funds for financial assistance. The majority of financial aid dollars awarded were from federal funds for student loans and Federal Pell grants. A total of $563.5 million, only 6 percent of all FY 2015 aid to students attending Texas institutions of higher education, was awarded through the seven state programs funded by General Revenue appropriations.
A significant amount of funding, more than $1.3 billion in merit aid was awarded to 224,841 students in Texas higher education in FY 2015. This includes aid from endowments and other institutional funds, as well as funds awarded to students by entities outside the institutions.
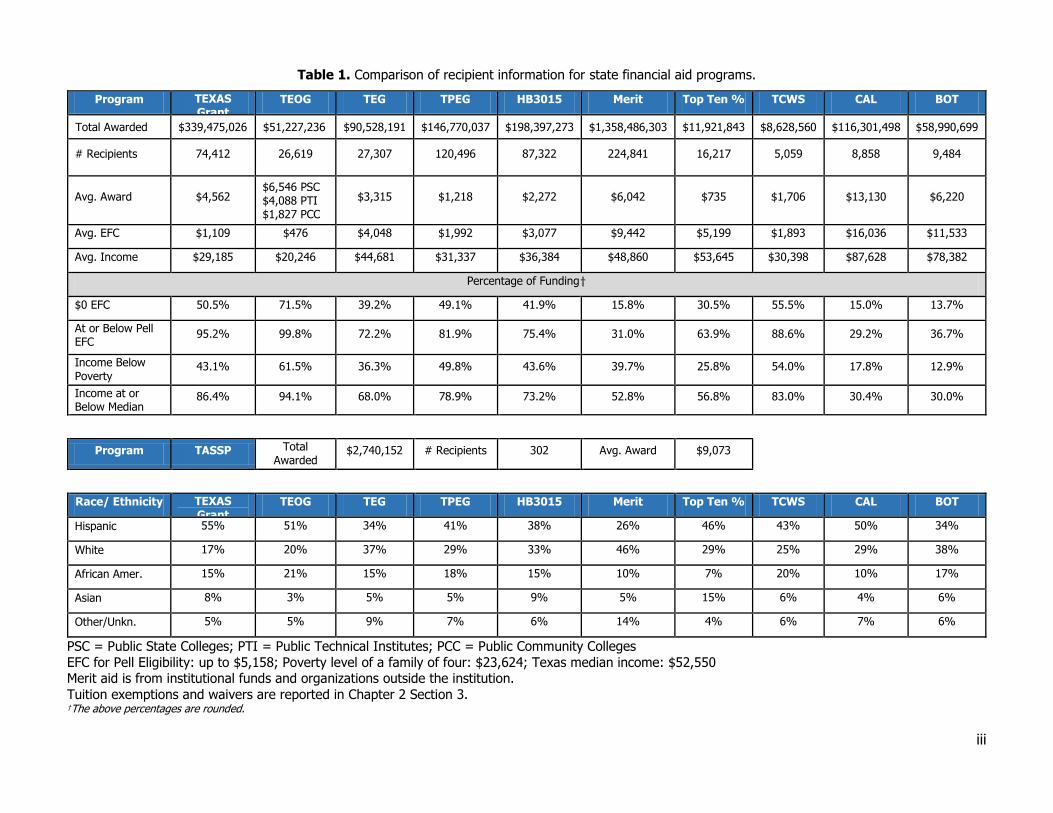
Table 1 provides a quick comparison of the profiles of state financial aid programs, including the average income and EFC of the students receiving awards in FY 2015. A very high percentage of students receiving awards through the state programs for financially needy students had an EFC below the threshold to qualify for Federal Pell grants, $5,158. The highest percentages of award recipients whose family incomes were below the poverty level were in the TEOG Program, the Texas College Work-Study Program, and the TPEG Program.
The College Access Loan (CAL) Program provides Texas students one of the lowest-cost nonfederal student loan options in the nation, with its 4.5 percent fixed annual interest rate. This program is funded through the sale of tax-exempt bonds and repayments from loans, at no cost to taxpayers. Even though approximately 70 percent of students receiving CAL and B-On-Time (BOT) loans had family incomes above the $52,550 median for Texas, almost 30 percent of CAL borrowers and 37 percent of BOT borrowers had an EFC below the Federal Pell EFC threshold. The BOT Loan Program, funded by state appropriations, is being phased out due to legislation passed by the 84th Texas Legislature.
Table 1 also shows an “at a glance” comparison of the distribution of state program award recipients in terms of race/ethnicity. Hispanic students represented the highest percentage of award recipients in all of the state financial aid programs except the BOT Loan Program and the Tuition Equalization Grant (TEG) Program.
Texas higher education continues to be relatively affordable, ranked third in affordability of public two-year institutions nationally, twentieth with regard to public universities, and thirtieth with regard to private or independent institutions. Even so, in order to increase access and persistence and expand students’ options for careers after graduation, developing mechanisms to finance higher education in a manner that provides the most effective balance among appropriations, tuition and fees, and financial aid remains critical in our effort to make higher education more affordable for students.
iii
Table 1. Comparison of recipient information for state financial aid programs.
Program TEXAS Grant
TEOG TEG TPEG HB3015 Merit Top Ten % TCWS CAL BOT
Total Awarded $339,475,026 $51,227,236 $90,528,191 $146,770,037 $198,397,273 $1,358,486,303 $11,921,843 $8,628,560 $116,301,498 $58,990,699
# Recipients 74,412 26,619 27,307 120,496 87,322 224,841 16,217 5,059 8,858 9,484
Avg. Award $4,562 $6,546 PSC $4,088 PTI $1,827 PCC
$3,315 $1,218 $2,272 $6,042 $735 $1,706 $13,130 $6,220
Avg. EFC $1,109 $476 $4,048 $1,992 $3,077 $9,442 $5,199 $1,893 $16,036 $11,533
Avg. Income $29,185 $20,246 $44,681 $31,337 $36,384 $48,860 $53,645 $30,398 $87,628 $78,382
Percentage of Funding†
$0 EFC 50.5% 71.5% 39.2% 49.1% 41.9% 15.8% 30.5% 55.5% 15.0% 13.7%
At or Below Pell EFC
95.2% 99.8% 72.2% 81.9% 75.4% 31.0% 63.9% 88.6% 29.2% 36.7%
Income Below Poverty
43.1% 61.5% 36.3% 49.8% 43.6% 39.7% 25.8% 54.0% 17.8% 12.9%
Income at or Below Median
86.4% 94.1% 68.0% 78.9% 73.2% 52.8% 56.8% 83.0% 30.4% 30.0%
Program TASSP Total Awarded
$2,740,152 # Recipients 302 Avg. Award $9,073
Race/ Ethnicity TEXAS Grant
TEOG TEG TPEG HB3015 Merit Top Ten % TCWS CAL BOT
Hispanic 55% 51% 34% 41% 38% 26% 46% 43% 50% 34%
White 17% 20% 37% 29% 33% 46% 29% 25% 29% 38%
African Amer. 15% 21% 15% 18% 15% 10% 7% 20% 10% 17%
Asian 8% 3% 5% 5% 9% 5% 15% 6% 4% 6%
Other/Unkn. 5% 5% 9% 7% 6% 14% 4% 6% 7% 6%
PSC = Public State Colleges; PTI = Public Technical Institutes; PCC = Public Community Colleges
EFC for Pell Eligibility: up to $5,158; Poverty level of a family of four: $23,624; Texas median income: $52,550 Merit aid is from institutional funds and organizations outside the institution.
Tuition exemptions and waivers are reported in Chapter 2 Section 3. †The above percentages are rounded.
1
Chapter 1 – Introduction
Since its inception in 1965, the Texas Higher Education Coordinating Board (THECB) has administered the state’s financial aid programs for Texas students enrolled in nonprofit institutions of higher education in Texas. In 1987, The Texas Charter for Higher Education called for public higher education to be accessible to all those who seek and qualify for admission. “Neither financial nor social status should serve as a barrier to opportunities for higher education in Texas. Financial aid as well as academic and social support services should be available. Texas colleges and universities will actively recruit and retain students from populations that have not heretofore fully participated in higher education” (Texas Charter, p.6).
Texans supported the goals of the previous statewide strategic plan for higher education, Closing the Gaps by 2015, in recognition of the state’s changing demographics and the importance of an educated workforce for its economic and social well-being. Over the 15-year period beginning in 2000, the Texas Legislature established and funded new higher education institutions, appropriated $3.3 billion for TEXAS Grants to help low-income students attend college, and increased funding for programs in critical fields. Since 2000, institutions of higher education have responded by increasing enrollment in 2014 by almost 600,000 students and awarding approximately 130,000 more bachelor’s degrees, associate degrees, and certificates.
Building on these foundational gains, the newly adopted 60x30TX strategic plan for higher education acknowledges that tremendous challenges remain and must be addressed to improve students’ opportunities for a better life, employers’ ability to remain competitive, and the state’s ability to grow a robust economy. The new strategic plan includes four broad goals:
By 2030, at least 60 percent of Texans ages 25-34 will have a certificate or degree
By 2030, at least 550,000 students in that year will complete a certificate, associate, bachelor’s, or master’s from an institution of higher education in Texas
By 2030, all graduates from Texas public institutions of higher education will have completed programs with identified marketable skills
By 2030, undergraduate student loan debt will not exceed 60 percent of first-year wages for graduates of public institutions
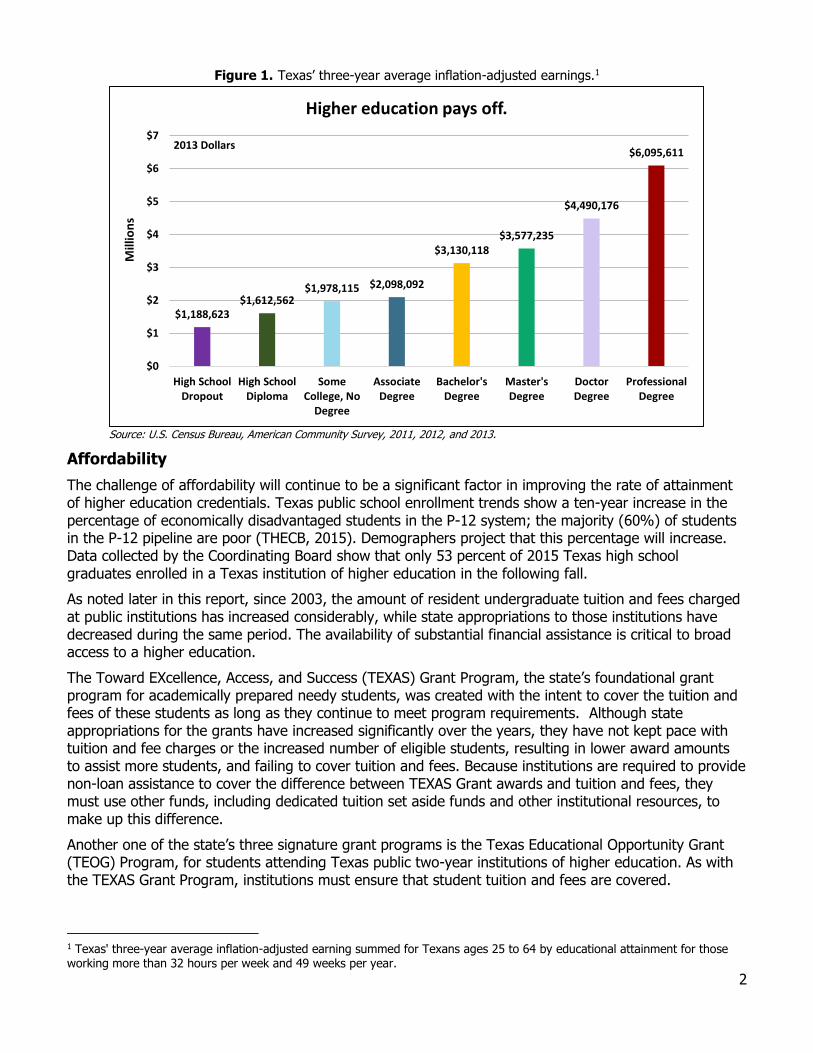
The College Board’s Education Pays 2013 states, “The median lifetime earnings of individuals with an associate degree and those with some college education but no degree (a category that includes certificate holders) are 27 percent and 13 percent higher than the median earnings of high school graduates, respectively.” Figure 1, based on three years of U.S. Census Bureau surveys, illustrates the considerable increase in lifetime earnings for individuals who attain increased levels of higher education.
2
Figure 1. Texas’ three-year average inflation-adjusted earnings.1
Source: U.S. Census Bureau, American Community Survey, 2011, 2012, and 2013.
Affordability
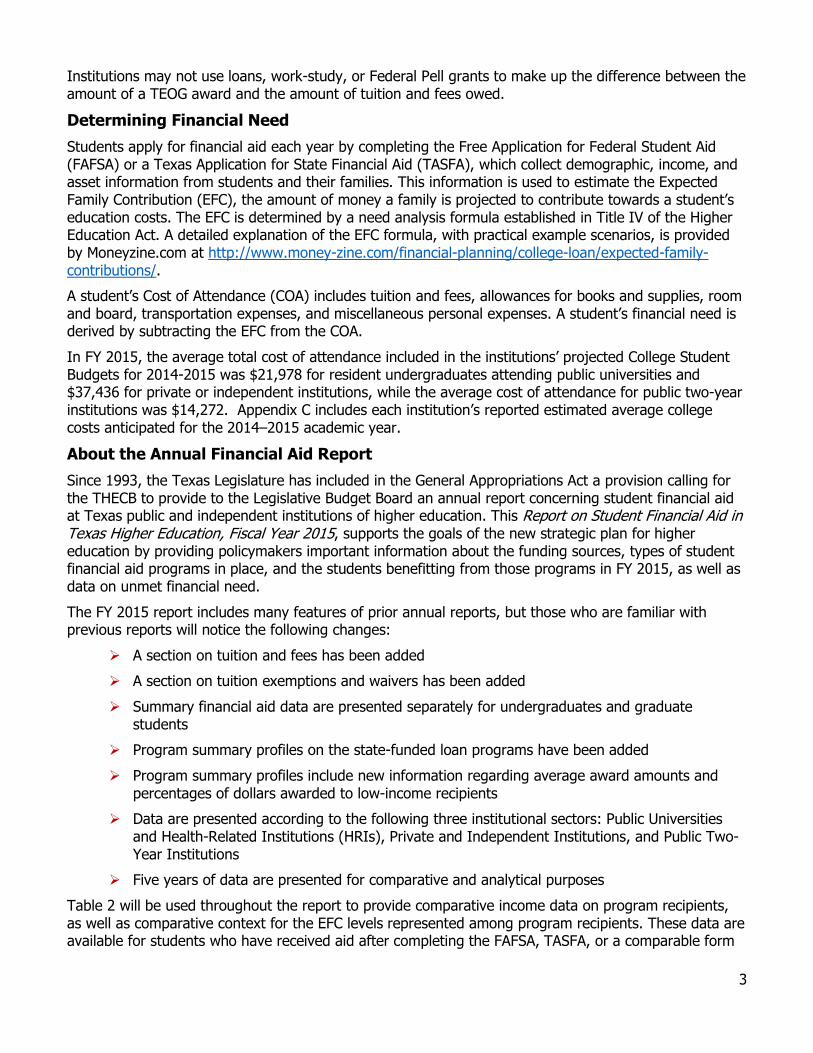
The challenge of affordability will continue to be a significant factor in improving the rate of attainment of higher education credentials. Texas public school enrollment trends show a ten-year increase in the percentage of economically disadvantaged students in the P-12 system; the majority (60%) of students in the P-12 pipeline are poor (THECB, 2015). Demographers project that this percentage will increase. Data collected by the Coordinating Board show that only 53 percent of 2015 Texas high school graduates enrolled in a Texas institution of higher education in the following fall.
As noted later in this report, since 2003, the amount of resident undergraduate tuition and fees charged at public institutions has increased considerably, while state appropriations to those institutions have decreased during the same period. The availability of substantial financial assistance is critical to broad access to a higher education.
The Toward EXcellence, Access, and Success (TEXAS) Grant Program, the state’s foundational grant program for academically prepared needy students, was created with the intent to cover the tuition and fees of these students as long as they continue to meet program requirements. Although state appropriations for the grants have increased significantly over the years, they have not kept pace with tuition and fee charges or the increased number of eligible students, resulting in lower award amounts to assist more students, and failing to cover tuition and fees. Because institutions are required to provide non-loan assistance to cover the difference between TEXAS Grant awards and tuition and fees, they must use other funds, including dedicated tuition set aside funds and other institutional resources, to make up this difference.
Another one of the state’s three signature grant programs is the Texas Educational Opportunity Grant (TEOG) Program, for students attending Texas public two-year institutions of higher education. As with the TEXAS Grant Program, institutions must ensure that student tuition and fees are covered.
1 Texas' three-year average inflation-adjusted earning summed for Texans ages 25 to 64 by educational attainment for those working more than 32 hours per week and 49 weeks per year.
$1,188,623$1,612,562
$1,978,115 $2,098,092
$3,130,118$3,577,235
$4,490,176
$6,095,611
$0
$1
$2
$3
$4
$5
$6
$7
High SchoolDropout
High SchoolDiploma
SomeCollege, No
Degree
AssociateDegree
Bachelor'sDegree
Master'sDegree
DoctorDegree
ProfessionalDegree
Mill
ion
s
Higher education pays off.
2013 Dollars
3
Institutions may not use loans, work-study, or Federal Pell grants to make up the difference between the amount of a TEOG award and the amount of tuition and fees owed.
Determining Financial Need
Students apply for financial aid each year by completing the Free Application for Federal Student Aid (FAFSA) or a Texas Application for State Financial Aid (TASFA), which collect demographic, income, and asset information from students and their families. This information is used to estimate the Expected Family Contribution (EFC), the amount of money a family is projected to contribute towards a student’s education costs. The EFC is determined by a need analysis formula established in Title IV of the Higher Education Act. A detailed explanation of the EFC formula, with practical example scenarios, is provided by Moneyzine.com at http://www.money-zine.com/financial-planning/college-loan/expected-family-contributions/.
A student’s Cost of Attendance (COA) includes tuition and fees, allowances for books and supplies, room and board, transportation expenses, and miscellaneous personal expenses. A student’s financial need is derived by subtracting the EFC from the COA.
In FY 2015, the average total cost of attendance included in the institutions’ projected College Student Budgets for 2014-2015 was $21,978 for resident undergraduates attending public universities and $37,436 for private or independent institutions, while the average cost of attendance for public two-year institutions was $14,272. Appendix C includes each institution’s reported estimated average college costs anticipated for the 2014–2015 academic year.
About the Annual Financial Aid Report
Since 1993, the Texas Legislature has included in the General Appropriations Act a provision calling for the THECB to provide to the Legislative Budget Board an annual report concerning student financial aid at Texas public and independent institutions of higher education. This Report on Student Financial Aid in Texas Higher Education, Fiscal Year 2015, supports the goals of the new strategic plan for higher education by providing policymakers important information about the funding sources, types of student financial aid programs in place, and the students benefitting from those programs in FY 2015, as well as data on unmet financial need.
The FY 2015 report includes many features of prior annual reports, but those who are familiar with previous reports will notice the following changes:
A section on tuition and fees has been added
A section on tuition exemptions and waivers has been added
Summary financial aid data are presented separately for undergraduates and graduate students
Program summary profiles on the state-funded loan programs have been added
Program summary profiles include new information regarding average award amounts and percentages of dollars awarded to low-income recipients
Data are presented according to the following three institutional sectors: Public Universities and Health-Related Institutions (HRIs), Private and Independent Institutions, and Public Two-Year Institutions
Five years of data are presented for comparative and analytical purposes
Table 2 will be used throughout the report to provide comparative income data on program recipients, as well as comparative context for the EFC levels represented among program recipients. These data are available for students who have received aid after completing the FAFSA, TASFA, or a comparable form
4
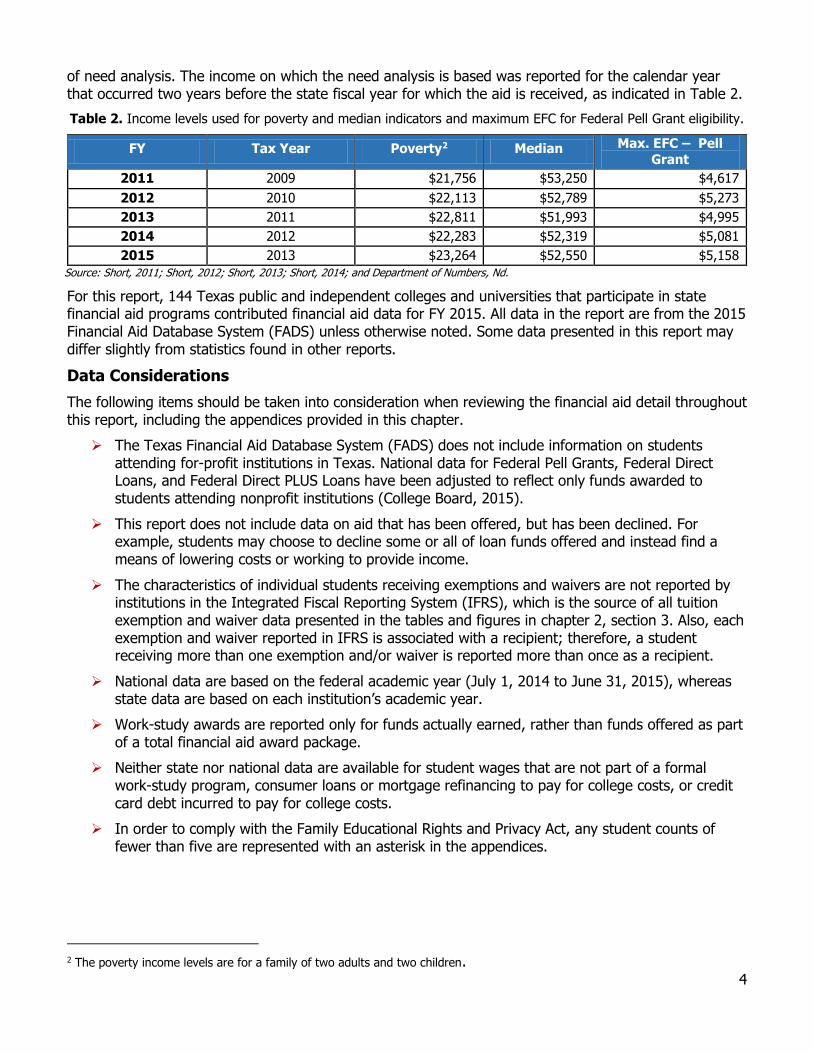
of need analysis. The income on which the need analysis is based was reported for the calendar year that occurred two years before the state fiscal year for which the aid is received, as indicated in Table 2.
Table 2. Income levels used for poverty and median indicators and maximum EFC for Federal Pell Grant eligibility.
FY Tax Year Poverty2 Median Max. EFC – Pell
Grant
2011 2009 $21,756 $53,250 $4,617
2012 2010 $22,113 $52,789 $5,273
2013 2011 $22,811 $51,993 $4,995
2014 2012 $22,283 $52,319 $5,081
2015 2013 $23,264 $52,550 $5,158
Source: Short, 2011; Short, 2012; Short, 2013; Short, 2014; and Department of Numbers, Nd.
For this report, 144 Texas public and independent colleges and universities that participate in state financial aid programs contributed financial aid data for FY 2015. All data in the report are from the 2015 Financial Aid Database System (FADS) unless otherwise noted. Some data presented in this report may differ slightly from statistics found in other reports.
Data Considerations
The following items should be taken into consideration when reviewing the financial aid detail throughout this report, including the appendices provided in this chapter.
The Texas Financial Aid Database System (FADS) does not include information on students attending for-profit institutions in Texas. National data for Federal Pell Grants, Federal Direct Loans, and Federal Direct PLUS Loans have been adjusted to reflect only funds awarded to students attending nonprofit institutions (College Board, 2015).
This report does not include data on aid that has been offered, but has been declined. For example, students may choose to decline some or all of loan funds offered and instead find a means of lowering costs or working to provide income.
The characteristics of individual students receiving exemptions and waivers are not reported by institutions in the Integrated Fiscal Reporting System (IFRS), which is the source of all tuition exemption and waiver data presented in the tables and figures in chapter 2, section 3. Also, each exemption and waiver reported in IFRS is associated with a recipient; therefore, a student receiving more than one exemption and/or waiver is reported more than once as a recipient.
National data are based on the federal academic year (July 1, 2014 to June 31, 2015), whereas state data are based on each institution’s academic year.
Work-study awards are reported only for funds actually earned, rather than funds offered as part of a total financial aid award package.
Neither state nor national data are available for student wages that are not part of a formal work-study program, consumer loans or mortgage refinancing to pay for college costs, or credit card debt incurred to pay for college costs.
In order to comply with the Family Educational Rights and Privacy Act, any student counts of fewer than five are represented with an asterisk in the appendices.
2 The poverty income levels are for a family of two adults and two children.
5
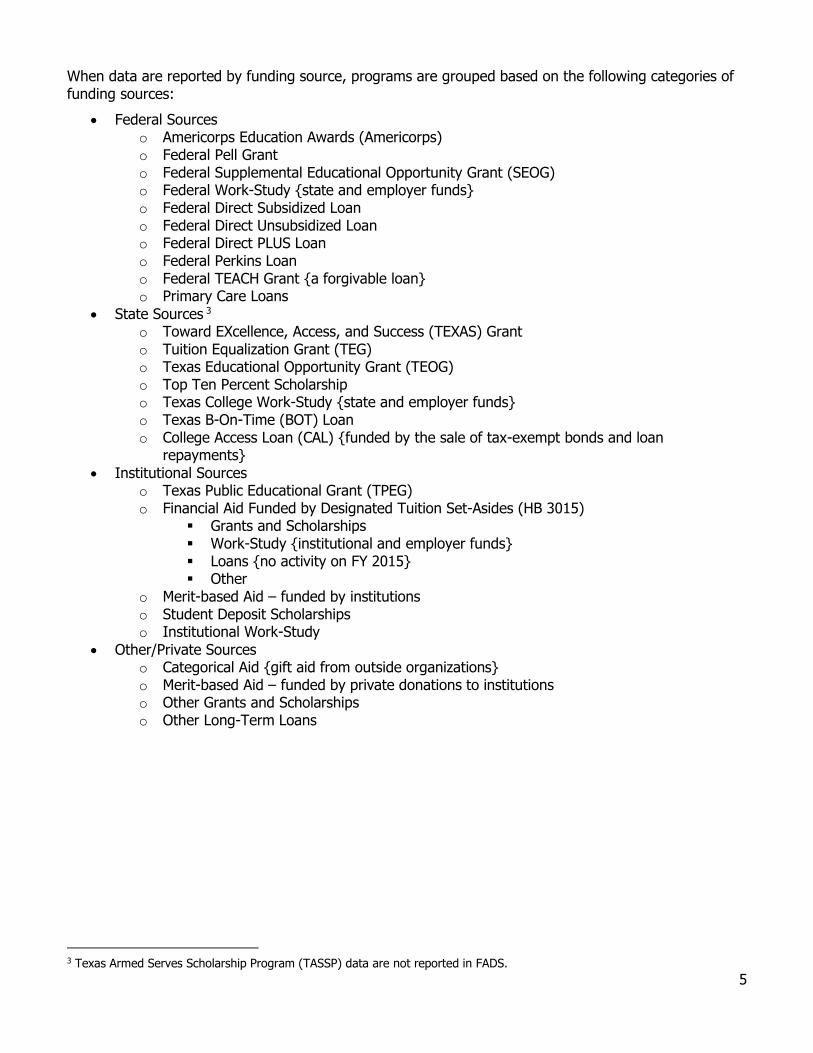
When data are reported by funding source, programs are grouped based on the following categories of funding sources:
Federal Sources o Americorps Education Awards (Americorps) o Federal Pell Grant o Federal Supplemental Educational Opportunity Grant (SEOG) o Federal Work-Study {state and employer funds} o Federal Direct Subsidized Loan o Federal Direct Unsubsidized Loan o Federal Direct PLUS Loan o Federal Perkins Loan o Federal TEACH Grant {a forgivable loan} o Primary Care Loans
State Sources 3 o Toward EXcellence, Access, and Success (TEXAS) Grant o Tuition Equalization Grant (TEG) o Texas Educational Opportunity Grant (TEOG) o Top Ten Percent Scholarship o Texas College Work-Study {state and employer funds} o Texas B-On-Time (BOT) Loan o College Access Loan (CAL) {funded by the sale of tax-exempt bonds and loan
repayments}
Institutional Sources o Texas Public Educational Grant (TPEG) o Financial Aid Funded by Designated Tuition Set-Asides (HB 3015)
Grants and Scholarships Work-Study {institutional and employer funds} Loans {no activity on FY 2015} Other
o Merit-based Aid – funded by institutions o Student Deposit Scholarships o Institutional Work-Study
Other/Private Sources o Categorical Aid {gift aid from outside organizations} o Merit-based Aid – funded by private donations to institutions o Other Grants and Scholarships o Other Long-Term Loans
3 Texas Armed Serves Scholarship Program (TASSP) data are not reported in FADS.
6
Chapter 2 – Overview of Tuition and Fees
Section 1: Tuition and Fees
Even though state appropriations have declined and tuition and fees have increased steadily since 2003, Texas higher education is still considered relatively affordable, when compared with other states. Texas has more robust higher education data than many states. Therefore, comparisons with national data require review of data that are commonly reported by all states in the Integrated Postsecondary Education Data System (IPEDS)4.
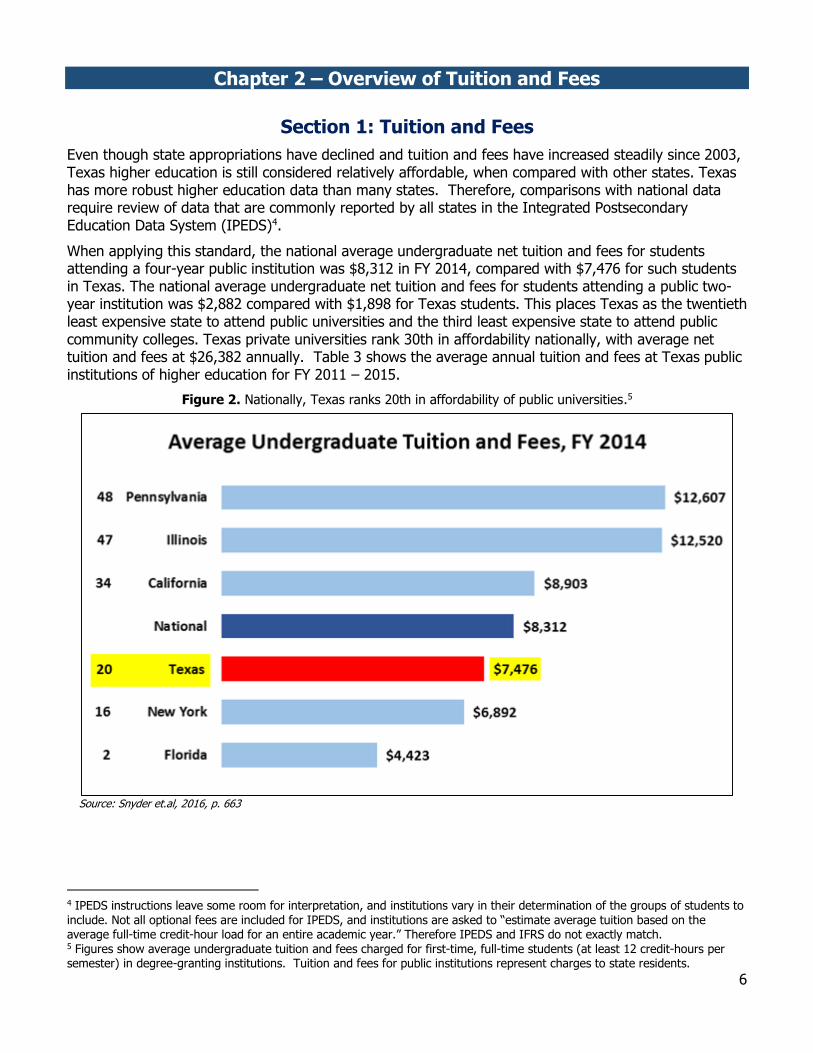
When applying this standard, the national average undergraduate net tuition and fees for students attending a four-year public institution was $8,312 in FY 2014, compared with $7,476 for such students in Texas. The national average undergraduate net tuition and fees for students attending a public two-year institution was $2,882 compared with $1,898 for Texas students. This places Texas as the twentieth least expensive state to attend public universities and the third least expensive state to attend public community colleges. Texas private universities rank 30th in affordability nationally, with average net tuition and fees at $26,382 annually. Table 3 shows the average annual tuition and fees at Texas public institutions of higher education for FY 2011 – 2015.
Figure 2. Nationally, Texas ranks 20th in affordability of public universities.5
Source: Snyder et.al, 2016, p. 663
4 IPEDS instructions leave some room for interpretation, and institutions vary in their determination of the groups of students to include. Not all optional fees are included for IPEDS, and institutions are asked to “estimate average tuition based on the average full-time credit-hour load for an entire academic year.” Therefore IPEDS and IFRS do not exactly match. 5 Figures show average undergraduate tuition and fees charged for first-time, full-time students (at least 12 credit-hours per semester) in degree-granting institutions. Tuition and fees for public institutions represent charges to state residents.
7
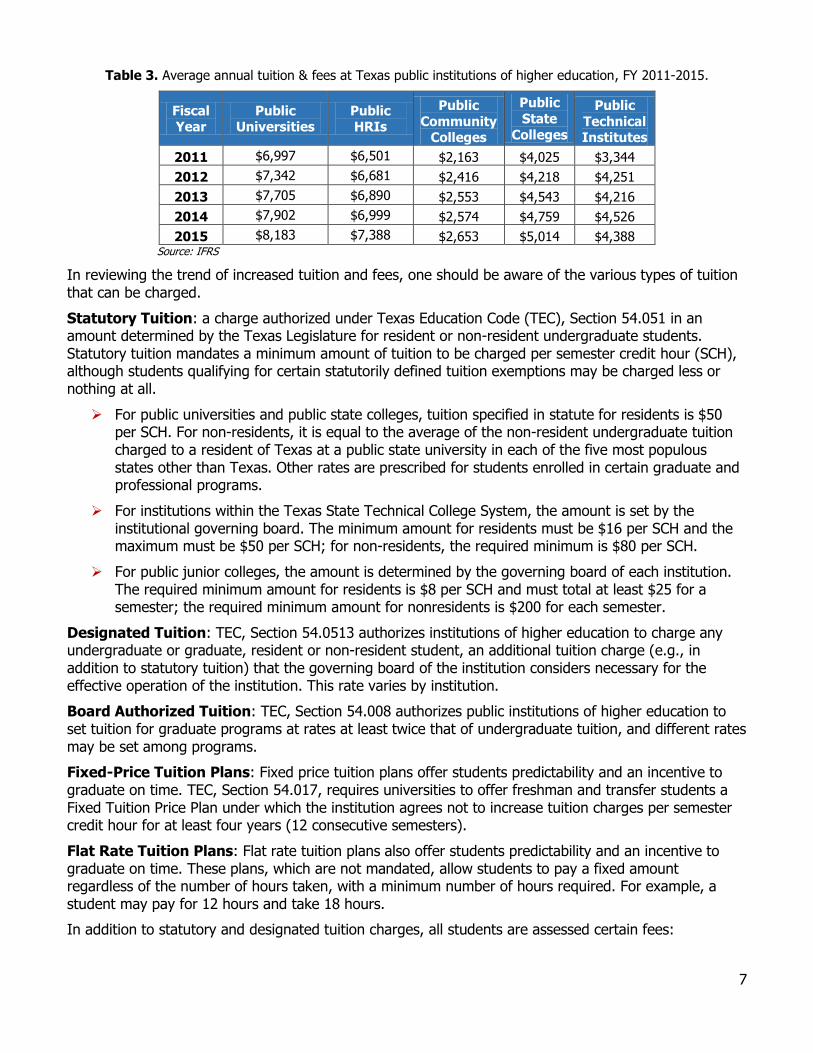
Table 3. Average annual tuition & fees at Texas public institutions of higher education, FY 2011-2015.
Fiscal Year
Public Universities
Public HRIs
Public
Community Colleges
Public
State
Colleges
Public
Technical Institutes
2011 $6,997 $6,501 $2,163 $4,025 $3,344
2012 $7,342 $6,681 $2,416 $4,218 $4,251
2013 $7,705 $6,890 $2,553 $4,543 $4,216
2014 $7,902 $6,999 $2,574 $4,759 $4,526
2015 $8,183 $7,388 $2,653 $5,014 $4,388 Source: IFRS
In reviewing the trend of increased tuition and fees, one should be aware of the various types of tuition that can be charged.
Statutory Tuition: a charge authorized under Texas Education Code (TEC), Section 54.051 in an amount determined by the Texas Legislature for resident or non-resident undergraduate students. Statutory tuition mandates a minimum amount of tuition to be charged per semester credit hour (SCH), although students qualifying for certain statutorily defined tuition exemptions may be charged less or nothing at all.
For public universities and public state colleges, tuition specified in statute for residents is $50 per SCH. For non-residents, it is equal to the average of the non-resident undergraduate tuition charged to a resident of Texas at a public state university in each of the five most populous states other than Texas. Other rates are prescribed for students enrolled in certain graduate and professional programs.
For institutions within the Texas State Technical College System, the amount is set by the institutional governing board. The minimum amount for residents must be $16 per SCH and the maximum must be $50 per SCH; for non-residents, the required minimum is $80 per SCH.
For public junior colleges, the amount is determined by the governing board of each institution. The required minimum amount for residents is $8 per SCH and must total at least $25 for a semester; the required minimum amount for nonresidents is $200 for each semester.
Designated Tuition: TEC, Section 54.0513 authorizes institutions of higher education to charge any undergraduate or graduate, resident or non-resident student, an additional tuition charge (e.g., in addition to statutory tuition) that the governing board of the institution considers necessary for the effective operation of the institution. This rate varies by institution.
Board Authorized Tuition: TEC, Section 54.008 authorizes public institutions of higher education to set tuition for graduate programs at rates at least twice that of undergraduate tuition, and different rates may be set among programs.
Fixed-Price Tuition Plans: Fixed price tuition plans offer students predictability and an incentive to graduate on time. TEC, Section 54.017, requires universities to offer freshman and transfer students a Fixed Tuition Price Plan under which the institution agrees not to increase tuition charges per semester credit hour for at least four years (12 consecutive semesters).
Flat Rate Tuition Plans: Flat rate tuition plans also offer students predictability and an incentive to graduate on time. These plans, which are not mandated, allow students to pay a fixed amount regardless of the number of hours taken, with a minimum number of hours required. For example, a student may pay for 12 hours and take 18 hours.
In addition to statutory and designated tuition charges, all students are assessed certain fees:
8
Mandatory Fees are authorized by statute or by the governing board of an institution, and are charged to a student upon enrollment to provide services available to every student. Examples of such fees are library and laboratory fees, course and incidental fees collected under TEC, Section 55.16(c), and other mandatory fees as authorized by the governing board of the institution.
Course Fees are mandatory fees required of all students enrolled in a particular course, such as materials for a chemistry lab, or a discretionary fee required of students in a given course, or for students participating in a special activity, such as a parking fee. This includes fees for state funded continuing education courses.
Deregulated Tuition and Decreased Appropriations
Before 2003, the Texas Legislature had regulatory authority to set tuition rates, generally mandating that the same statutory and designated tuition rate be charged across the state. House Bill 3015, 78th Texas Legislature, amended TEC, Section 54.0513 to allow governing boards of public universities to set different designated tuition rates. Universities began increasing designated tuition in spring 2004. Since then, there has been no upper limit on the amount of designated tuition that a university could charge, and amounts can vary by program, course level, and academic period.
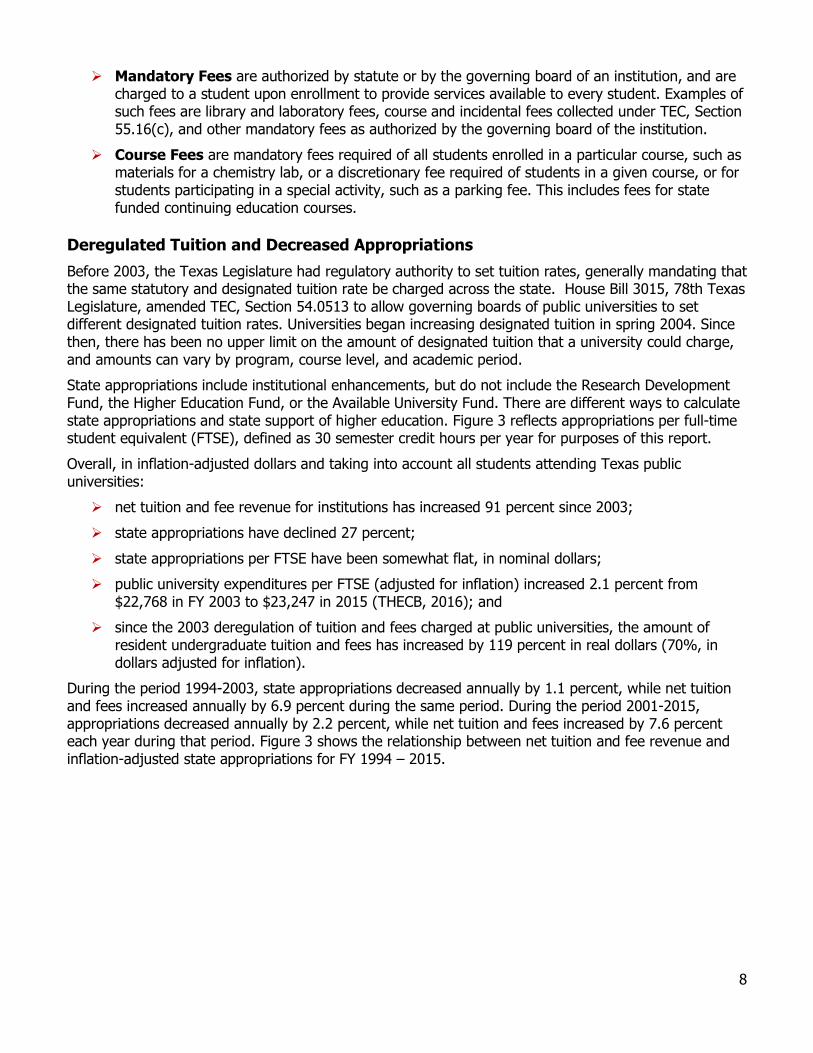
State appropriations include institutional enhancements, but do not include the Research Development Fund, the Higher Education Fund, or the Available University Fund. There are different ways to calculate state appropriations and state support of higher education. Figure 3 reflects appropriations per full-time student equivalent (FTSE), defined as 30 semester credit hours per year for purposes of this report.
Overall, in inflation-adjusted dollars and taking into account all students attending Texas public universities:
net tuition and fee revenue for institutions has increased 91 percent since 2003;
state appropriations have declined 27 percent;
state appropriations per FTSE have been somewhat flat, in nominal dollars;
public university expenditures per FTSE (adjusted for inflation) increased 2.1 percent from $22,768 in FY 2003 to $23,247 in 2015 (THECB, 2016); and
since the 2003 deregulation of tuition and fees charged at public universities, the amount of resident undergraduate tuition and fees has increased by 119 percent in real dollars (70%, in dollars adjusted for inflation).
During the period 1994-2003, state appropriations decreased annually by 1.1 percent, while net tuition and fees increased annually by 6.9 percent during the same period. During the period 2001-2015, appropriations decreased annually by 2.2 percent, while net tuition and fees increased by 7.6 percent each year during that period. Figure 3 shows the relationship between net tuition and fee revenue and inflation-adjusted state appropriations for FY 1994 – 2015.
9
Figure 3. Public university undergraduate and graduate net tuition and fee revenue & state appropriations.6
†Source: THECB Sources and Uses Report
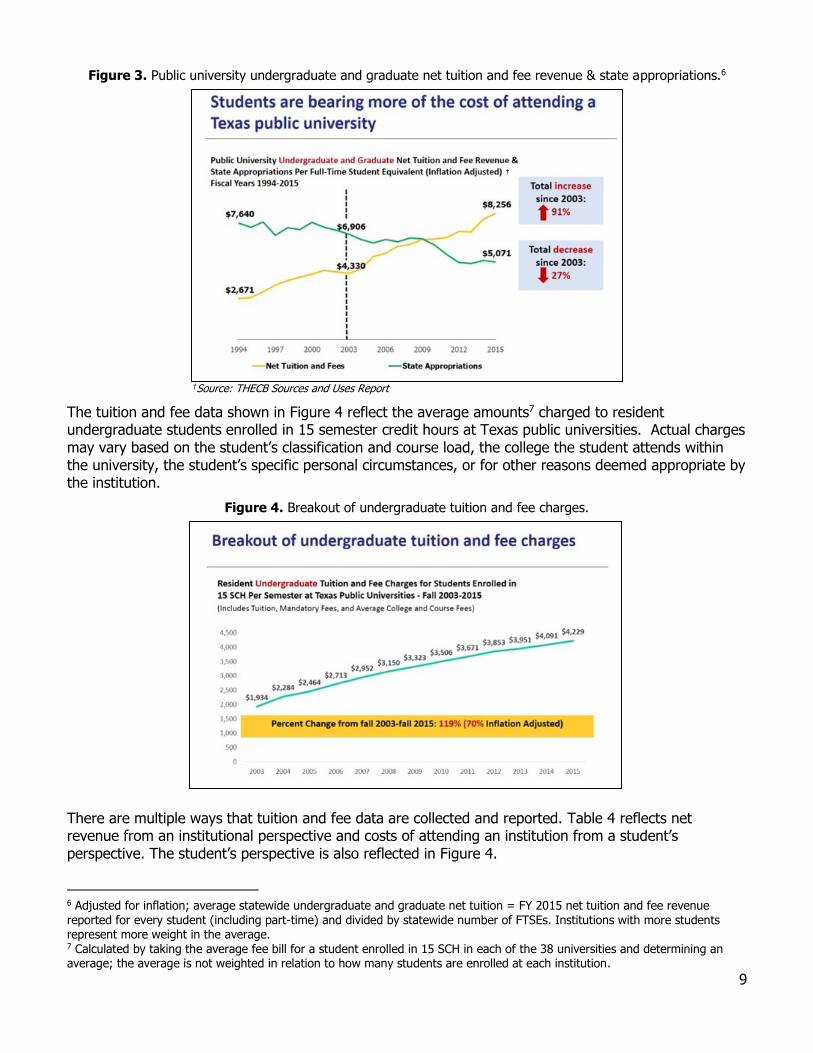
The tuition and fee data shown in Figure 4 reflect the average amounts7 charged to resident undergraduate students enrolled in 15 semester credit hours at Texas public universities. Actual charges may vary based on the student’s classification and course load, the college the student attends within the university, the student’s specific personal circumstances, or for other reasons deemed appropriate by the institution.
Figure 4. Breakout of undergraduate tuition and fee charges.
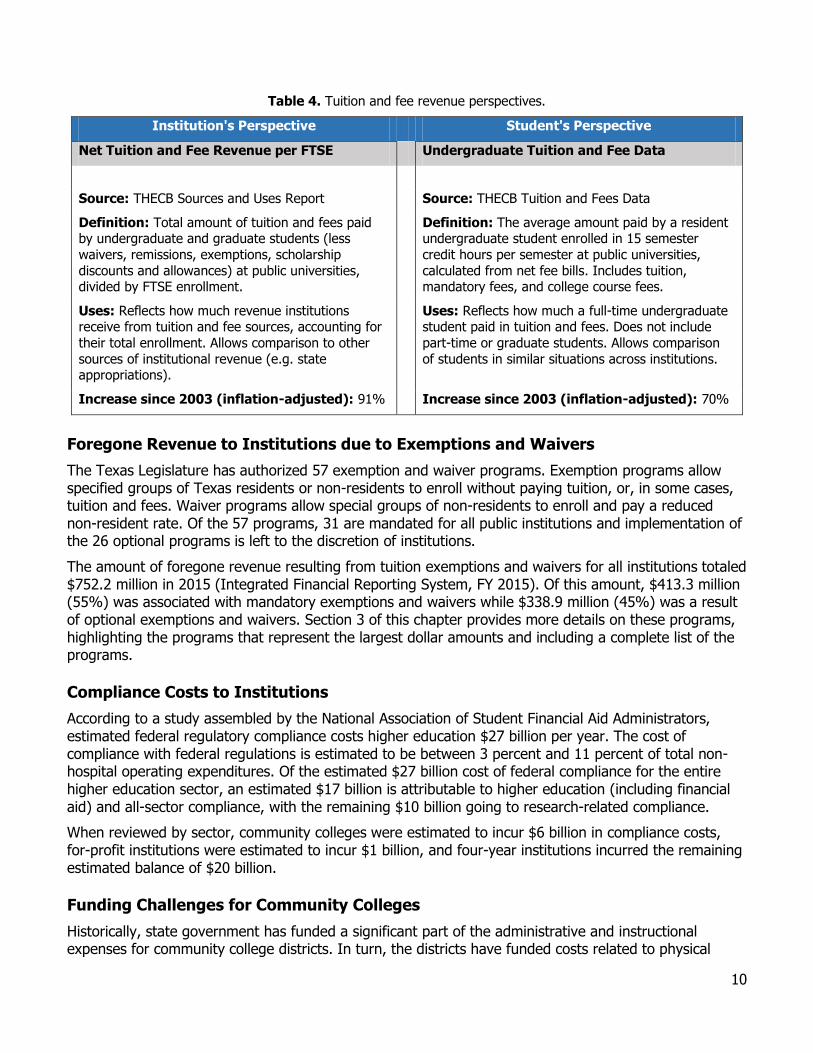
There are multiple ways that tuition and fee data are collected and reported. Table 4 reflects net revenue from an institutional perspective and costs of attending an institution from a student’s perspective. The student’s perspective is also reflected in Figure 4.
6 Adjusted for inflation; average statewide undergraduate and graduate net tuition = FY 2015 net tuition and fee revenue reported for every student (including part-time) and divided by statewide number of FTSEs. Institutions with more students represent more weight in the average. 7 Calculated by taking the average fee bill for a student enrolled in 15 SCH in each of the 38 universities and determining an average; the average is not weighted in relation to how many students are enrolled at each institution.
†
10
Table 4. Tuition and fee revenue perspectives.
Institution's Perspective Student's Perspective
Net Tuition and Fee Revenue per FTSE Undergraduate Tuition and Fee Data
Source: THECB Sources and Uses Report Source: THECB Tuition and Fees Data
Definition: Total amount of tuition and fees paid by undergraduate and graduate students (less
waivers, remissions, exemptions, scholarship
discounts and allowances) at public universities, divided by FTSE enrollment.
Definition: The average amount paid by a resident undergraduate student enrolled in 15 semester
credit hours per semester at public universities,
calculated from net fee bills. Includes tuition, mandatory fees, and college course fees.
Uses: Reflects how much revenue institutions receive from tuition and fee sources, accounting for
their total enrollment. Allows comparison to other
sources of institutional revenue (e.g. state appropriations).
Uses: Reflects how much a full-time undergraduate student paid in tuition and fees. Does not include
part-time or graduate students. Allows comparison
of students in similar situations across institutions.
Increase since 2003 (inflation-adjusted): 91% Increase since 2003 (inflation-adjusted): 70%
Foregone Revenue to Institutions due to Exemptions and Waivers
The Texas Legislature has authorized 57 exemption and waiver programs. Exemption programs allow specified groups of Texas residents or non-residents to enroll without paying tuition, or, in some cases, tuition and fees. Waiver programs allow special groups of non-residents to enroll and pay a reduced non-resident rate. Of the 57 programs, 31 are mandated for all public institutions and implementation of the 26 optional programs is left to the discretion of institutions.
The amount of foregone revenue resulting from tuition exemptions and waivers for all institutions totaled $752.2 million in 2015 (Integrated Financial Reporting System, FY 2015). Of this amount, $413.3 million (55%) was associated with mandatory exemptions and waivers while $338.9 million (45%) was a result of optional exemptions and waivers. Section 3 of this chapter provides more details on these programs, highlighting the programs that represent the largest dollar amounts and including a complete list of the programs.
Compliance Costs to Institutions
According to a study assembled by the National Association of Student Financial Aid Administrators, estimated federal regulatory compliance costs higher education $27 billion per year. The cost of compliance with federal regulations is estimated to be between 3 percent and 11 percent of total non-hospital operating expenditures. Of the estimated $27 billion cost of federal compliance for the entire higher education sector, an estimated $17 billion is attributable to higher education (including financial aid) and all-sector compliance, with the remaining $10 billion going to research-related compliance.
When reviewed by sector, community colleges were estimated to incur $6 billion in compliance costs, for-profit institutions were estimated to incur $1 billion, and four-year institutions incurred the remaining estimated balance of $20 billion.
Funding Challenges for Community Colleges
Historically, state government has funded a significant part of the administrative and instructional expenses for community college districts. In turn, the districts have funded costs related to physical
11
plant and facilities primarily through revenues generated from local tax bases. However, state support of administrative and instructional expenses has declined from a high of 62 percent in FY 1999 to 30 percent in FY 2015.
The shift in state fiscal support introduces a number of funding issues. Local financial resources for many community college districts, especially those in rural areas of the state, are severely limited by their constricted tax bases. The poorest district has a gross assessed valuation of only $105 million and collected only $237,000 in taxes. The property valuation requirement established by the Texas Legislature in 1985 for the creation of new districts is $2.5 billion, a level that, currently, seven established community colleges do not meet. All of those districts are rural or in smaller cities and several cover an area significantly smaller than the county in which they are located.
In addition, several community college districts have reached, or are near their maximum local tax levy, further restricting their ability to meet the financial challenges of maintaining and expanding facilities and providing for new educational and training needs of the community.
Section 2: Tuition Set-Asides
Texas Public Educational Grant (TPEG) Program
In 1975, the Texas Legislature created the TPEG program to provide grant assistance to students with financial need. In FY 2015, approximately $147 million in financial aid was awarded through the TPEG Program (see Chapter 4, Section 4). To fund this program, public institutions of higher education are required to “set aside” funds for TPEG awards, of which, not less than 90 percent of TPEG funds must be used for grants to students whose educational costs are not met in whole or in part from other sources, while more than 10 percent may be used for emergency loans. The set-aside amounts are established in Texas Education Code, Section 56.033 as follows:
Public Institutions of Higher Education
Not less than 15 percent nor more than 20 percent of the statutory tuition collected from resident students attending universities, state public colleges and state technical institutes; and
3 percent of each nonresident student’s statutory tuition charge.
Public Community Colleges
Not less than 6 percent nor more than 20 percent of resident hourly tuition at community colleges, exclusive of out-of-district charges; and
At least $1.50 must be set aside from nonresident student hourly tuition charges for academic courses at a public community college.
Financial Aid Funded by Designated Tuition Set-Asides (HB 3015)
In deregulating tuition by allowing universities to set their own designated tuition rates in 2003, the 78th Texas Legislature also required all public institutions of higher education to set aside a portion of their designated tuition revenues for financial aid targeted to financially needy students. Specifically, HB 3015 amended the Texas Education Code by adding Sections 56.011 and 56.012, which require institutions to set aside not less than 15 percent of the amount of undergraduate and graduate designated tuition charged in excess of $46 per semester credit hour. This set-aside is to be used for financial assistance for financially needy resident undergraduate or graduate students at the institution. In FY 2015, grant and scholarship aid awarded through HB 3015 set-asides totaled approximately $198 million (see Chapter 4, Section 5).
12
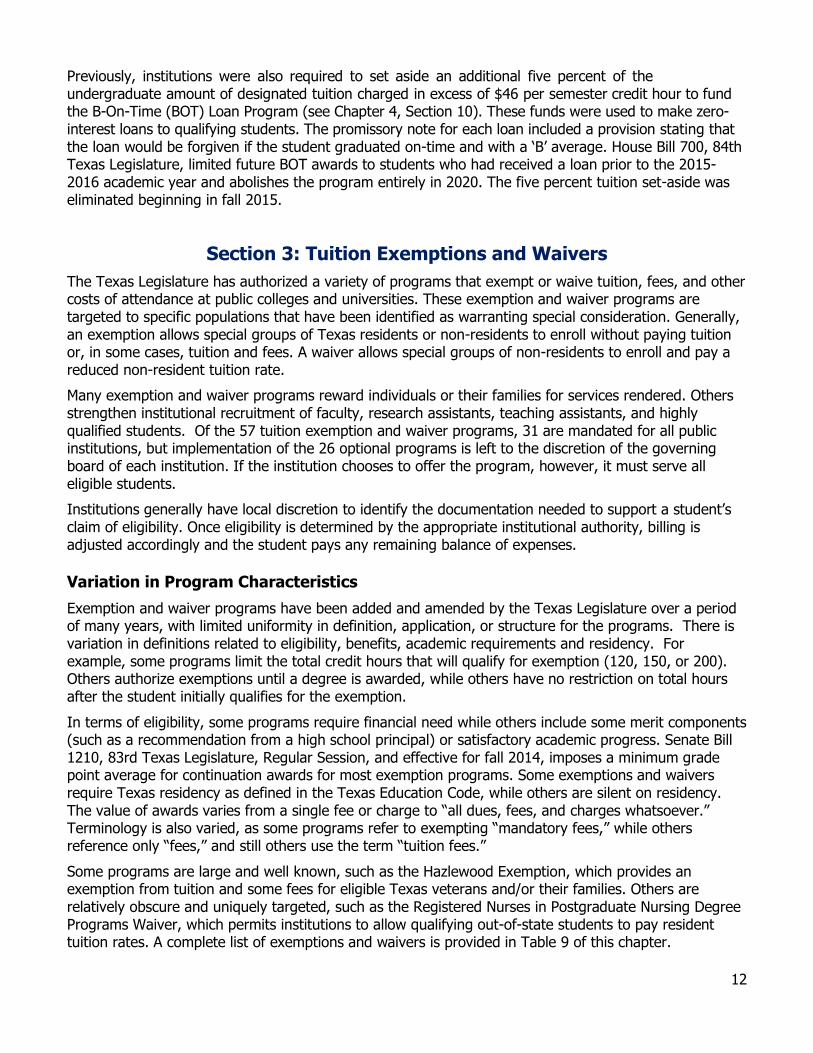
Previously, institutions were also required to set aside an additional five percent of the undergraduate amount of designated tuition charged in excess of $46 per semester credit hour to fund the B-On-Time (BOT) Loan Program (see Chapter 4, Section 10). These funds were used to make zero-interest loans to qualifying students. The promissory note for each loan included a provision stating that the loan would be forgiven if the student graduated on-time and with a ‘B’ average. House Bill 700, 84th Texas Legislature, limited future BOT awards to students who had received a loan prior to the 2015-2016 academic year and abolishes the program entirely in 2020. The five percent tuition set-aside was eliminated beginning in fall 2015.
Section 3: Tuition Exemptions and Waivers
The Texas Legislature has authorized a variety of programs that exempt or waive tuition, fees, and other costs of attendance at public colleges and universities. These exemption and waiver programs are targeted to specific populations that have been identified as warranting special consideration. Generally, an exemption allows special groups of Texas residents or non-residents to enroll without paying tuition or, in some cases, tuition and fees. A waiver allows special groups of non-residents to enroll and pay a reduced non-resident tuition rate.
Many exemption and waiver programs reward individuals or their families for services rendered. Others strengthen institutional recruitment of faculty, research assistants, teaching assistants, and highly qualified students. Of the 57 tuition exemption and waiver programs, 31 are mandated for all public institutions, but implementation of the 26 optional programs is left to the discretion of the governing board of each institution. If the institution chooses to offer the program, however, it must serve all eligible students.
Institutions generally have local discretion to identify the documentation needed to support a student’s claim of eligibility. Once eligibility is determined by the appropriate institutional authority, billing is adjusted accordingly and the student pays any remaining balance of expenses.
Variation in Program Characteristics
Exemption and waiver programs have been added and amended by the Texas Legislature over a period of many years, with limited uniformity in definition, application, or structure for the programs. There is variation in definitions related to eligibility, benefits, academic requirements and residency. For example, some programs limit the total credit hours that will qualify for exemption (120, 150, or 200). Others authorize exemptions until a degree is awarded, while others have no restriction on total hours after the student initially qualifies for the exemption.
In terms of eligibility, some programs require financial need while others include some merit components (such as a recommendation from a high school principal) or satisfactory academic progress. Senate Bill 1210, 83rd Texas Legislature, Regular Session, and effective for fall 2014, imposes a minimum grade point average for continuation awards for most exemption programs. Some exemptions and waivers require Texas residency as defined in the Texas Education Code, while others are silent on residency. The value of awards varies from a single fee or charge to “all dues, fees, and charges whatsoever.” Terminology is also varied, as some programs refer to exempting “mandatory fees,” while others reference only “fees,” and still others use the term “tuition fees.”
Some programs are large and well known, such as the Hazlewood Exemption, which provides an exemption from tuition and some fees for eligible Texas veterans and/or their families. Others are relatively obscure and uniquely targeted, such as the Registered Nurses in Postgraduate Nursing Degree Programs Waiver, which permits institutions to allow qualifying out-of-state students to pay resident tuition rates. A complete list of exemptions and waivers is provided in Table 9 of this chapter.
13
Foregone Revenue to Institutions
The All Funds Formula Funding Allocations to institutions does not include funding to offset tuition and fees lost to exemptions and waivers claimed at an institution. One exception occurred in 2013, when the 83rd Texas Legislature appropriated $30 million to offset tuition and fee losses by institutions from students using the “Hazlewood Legacy Act” option authorized by the 81st Texas Legislature. These funds were distributed to institutions at the end of FY 2013 with two additional years to expend the funds.
Given the large amount of foregone revenue to institutions represented by tuition exemptions and waivers, it is important to recognize their possible impact on tuition and fee charges for all students attending public institutions of higher education in Texas. The following exemption and waiver data for FY 2015 illustrate this:
Texas has 37 exemption programs and 20 waiver programs, providing assistance to 283,441 students in FY 2015
The amount of forgone tuition and fee revenue for institutions totaled $752.2 million
Exemptions and waivers at public universities represented 78 percent ($583.3 million) of this total
$413.3 million (55%) of the total was associated with the cost of mandatory exemptions and waivers
$338.9 million (45%) of the total was associated with optional programs that some institutions elected to administer
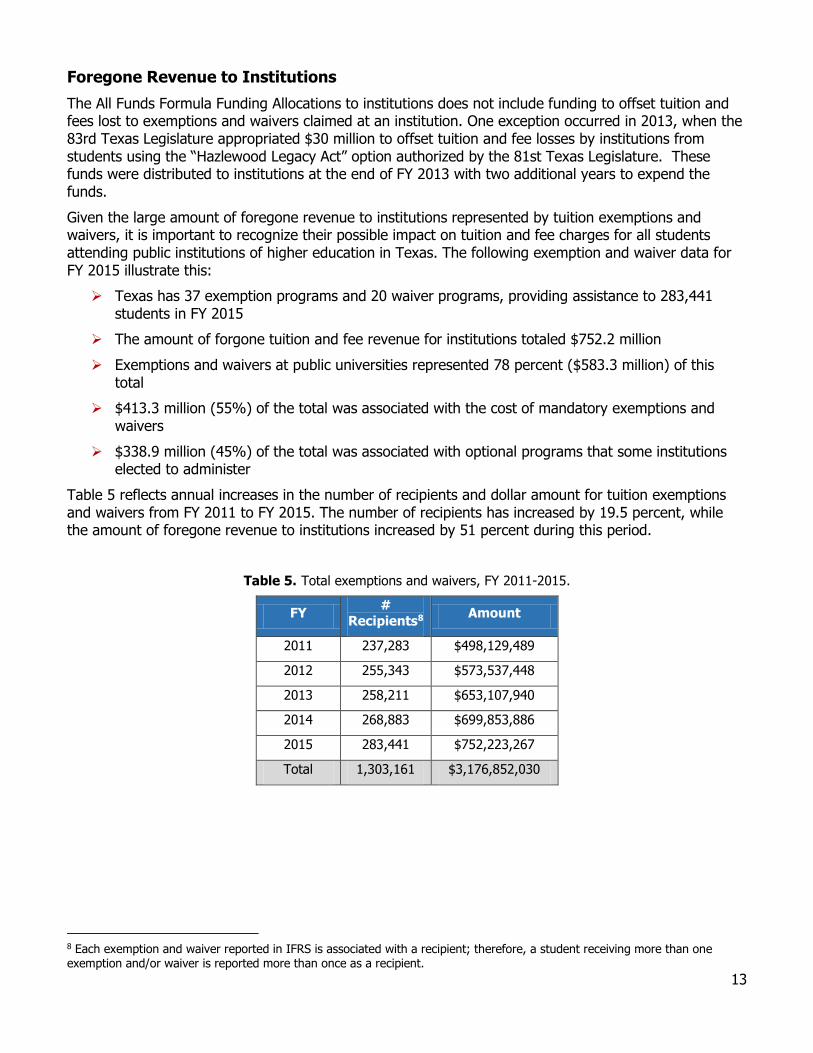
Table 5 reflects annual increases in the number of recipients and dollar amount for tuition exemptions and waivers from FY 2011 to FY 2015. The number of recipients has increased by 19.5 percent, while the amount of foregone revenue to institutions increased by 51 percent during this period.
Table 5. Total exemptions and waivers, FY 2011-2015.
8 Each exemption and waiver reported in IFRS is associated with a recipient; therefore, a student receiving more than one exemption and/or waiver is reported more than once as a recipient.
FY #
Recipients8 Amount
2011 237,283 $498,129,489
2012 255,343 $573,537,448
2013 258,211 $653,107,940
2014 268,883 $699,853,886
2015 283,441 $752,223,267
Total 1,303,161 $3,176,852,030
14
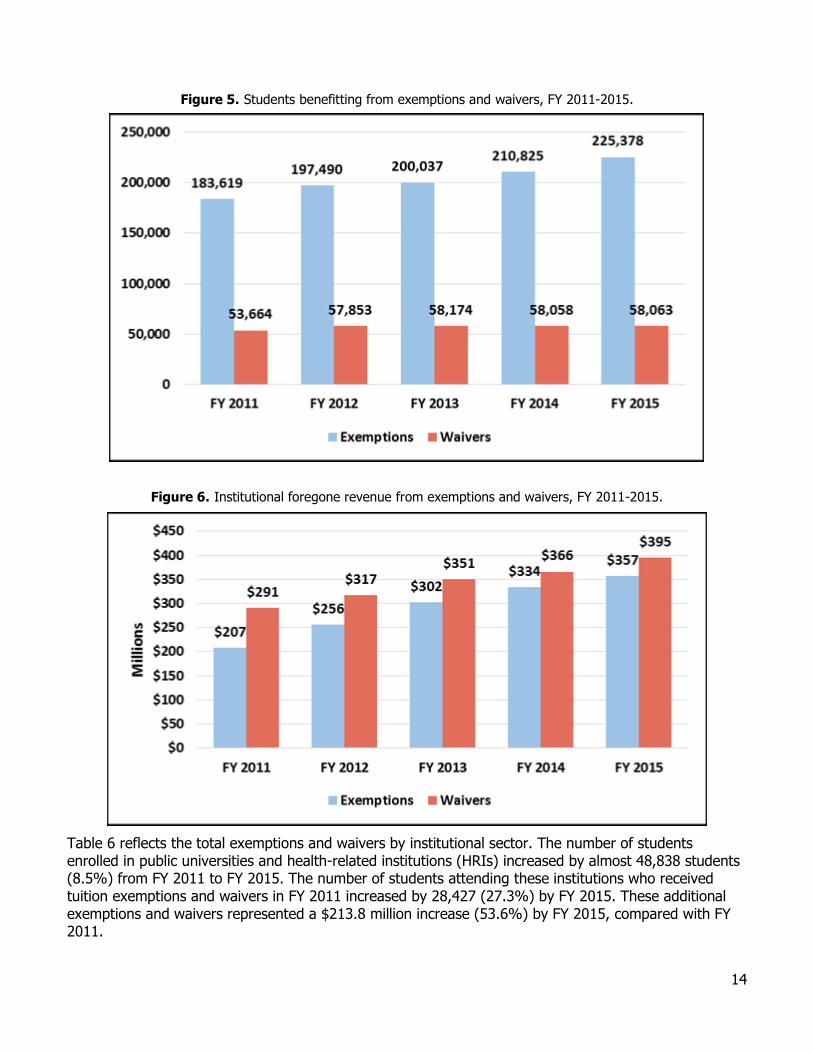
Figure 5. Students benefitting from exemptions and waivers, FY 2011-2015.
Figure 6. Institutional foregone revenue from exemptions and waivers, FY 2011-2015.
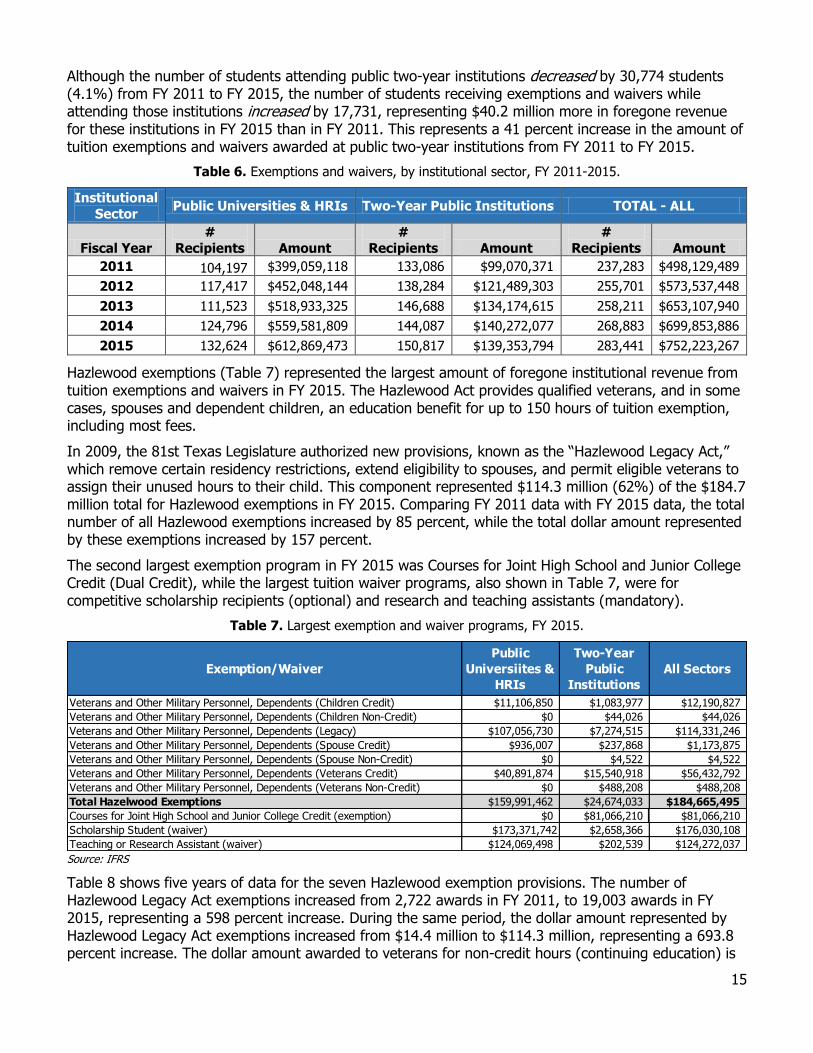
Table 6 reflects the total exemptions and waivers by institutional sector. The number of students enrolled in public universities and health-related institutions (HRIs) increased by almost 48,838 students (8.5%) from FY 2011 to FY 2015. The number of students attending these institutions who received tuition exemptions and waivers in FY 2011 increased by 28,427 (27.3%) by FY 2015. These additional exemptions and waivers represented a $213.8 million increase (53.6%) by FY 2015, compared with FY 2011.
15
Although the number of students attending public two-year institutions decreased by 30,774 students (4.1%) from FY 2011 to FY 2015, the number of students receiving exemptions and waivers while attending those institutions increased by 17,731, representing $40.2 million more in foregone revenue for these institutions in FY 2015 than in FY 2011. This represents a 41 percent increase in the amount of tuition exemptions and waivers awarded at public two-year institutions from FY 2011 to FY 2015.
Table 6. Exemptions and waivers, by institutional sector, FY 2011-2015.
Institutional
Sector Public Universities & HRIs Two-Year Public Institutions TOTAL - ALL
Fiscal Year
#
Recipients Amount
#
Recipients Amount
#
Recipients Amount
2011 104,197 $399,059,118 133,086 $99,070,371 237,283 $498,129,489
2012 117,417 $452,048,144 138,284 $121,489,303 255,701 $573,537,448
2013 111,523 $518,933,325 146,688 $134,174,615 258,211 $653,107,940
2014 124,796 $559,581,809 144,087 $140,272,077 268,883 $699,853,886
2015 132,624 $612,869,473 150,817 $139,353,794 283,441 $752,223,267
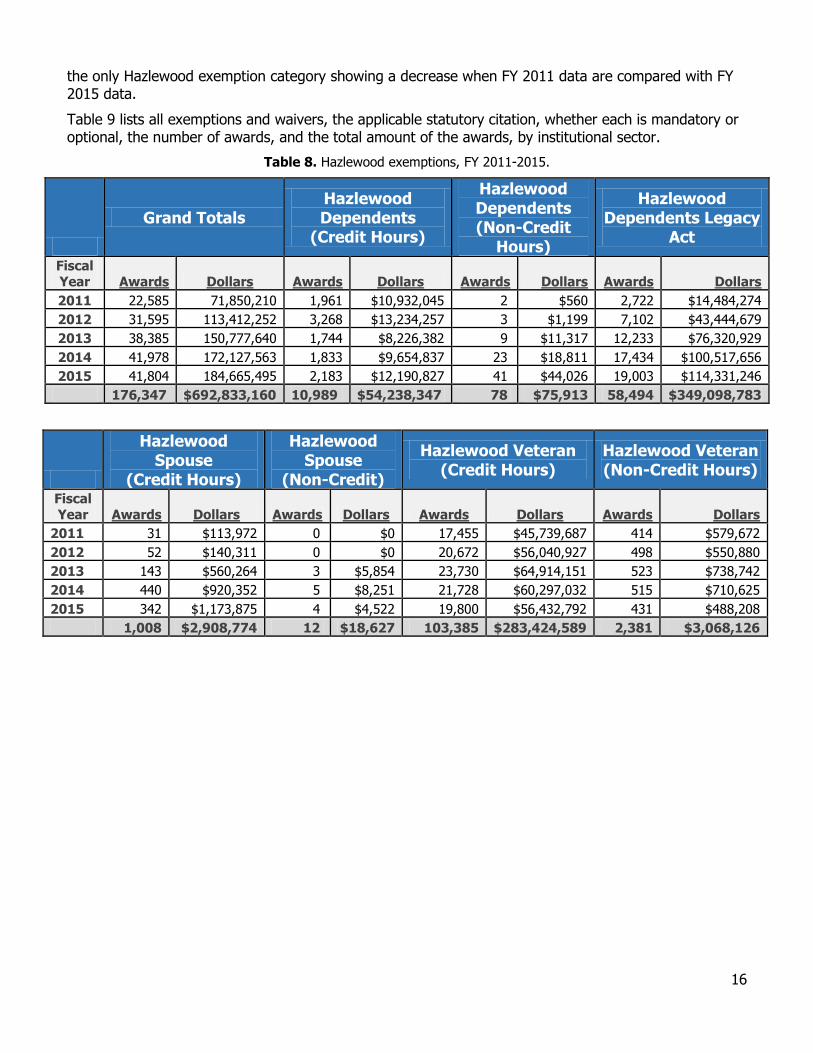
Hazlewood exemptions (Table 7) represented the largest amount of foregone institutional revenue from tuition exemptions and waivers in FY 2015. The Hazlewood Act provides qualified veterans, and in some cases, spouses and dependent children, an education benefit for up to 150 hours of tuition exemption, including most fees.
In 2009, the 81st Texas Legislature authorized new provisions, known as the “Hazlewood Legacy Act,” which remove certain residency restrictions, extend eligibility to spouses, and permit eligible veterans to assign their unused hours to their child. This component represented $114.3 million (62%) of the $184.7 million total for Hazlewood exemptions in FY 2015. Comparing FY 2011 data with FY 2015 data, the total number of all Hazlewood exemptions increased by 85 percent, while the total dollar amount represented by these exemptions increased by 157 percent.
The second largest exemption program in FY 2015 was Courses for Joint High School and Junior College Credit (Dual Credit), while the largest tuition waiver programs, also shown in Table 7, were for competitive scholarship recipients (optional) and research and teaching assistants (mandatory).
Table 7. Largest exemption and waiver programs, FY 2015.
Source: IFRS
Table 8 shows five years of data for the seven Hazlewood exemption provisions. The number of Hazlewood Legacy Act exemptions increased from 2,722 awards in FY 2011, to 19,003 awards in FY 2015, representing a 598 percent increase. During the same period, the dollar amount represented by Hazlewood Legacy Act exemptions increased from $14.4 million to $114.3 million, representing a 693.8 percent increase. The dollar amount awarded to veterans for non-credit hours (continuing education) is
Exemption/Waiver
Public
Universiites &
HRIs
Two-Year
Public
Institutions
All Sectors
Veterans and Other Military Personnel, Dependents (Children Credit) $11,106,850 $1,083,977 $12,190,827
Veterans and Other Military Personnel, Dependents (Children Non-Credit) $0 $44,026 $44,026
Veterans and Other Military Personnel, Dependents (Legacy) $107,056,730 $7,274,515 $114,331,246
Veterans and Other Military Personnel, Dependents (Spouse Credit) $936,007 $237,868 $1,173,875
Veterans and Other Military Personnel, Dependents (Spouse Non-Credit) $0 $4,522 $4,522
Veterans and Other Military Personnel, Dependents (Veterans Credit) $40,891,874 $15,540,918 $56,432,792
Veterans and Other Military Personnel, Dependents (Veterans Non-Credit) $0 $488,208 $488,208
Total Hazelwood Exemptions $159,991,462 $24,674,033 $184,665,495
Courses for Joint High School and Junior College Credit (exemption) $0 $81,066,210 $81,066,210
Scholarship Student (waiver) $173,371,742 $2,658,366 $176,030,108
Teaching or Research Assistant (waiver) $124,069,498 $202,539 $124,272,037
16
the only Hazlewood exemption category showing a decrease when FY 2011 data are compared with FY 2015 data.
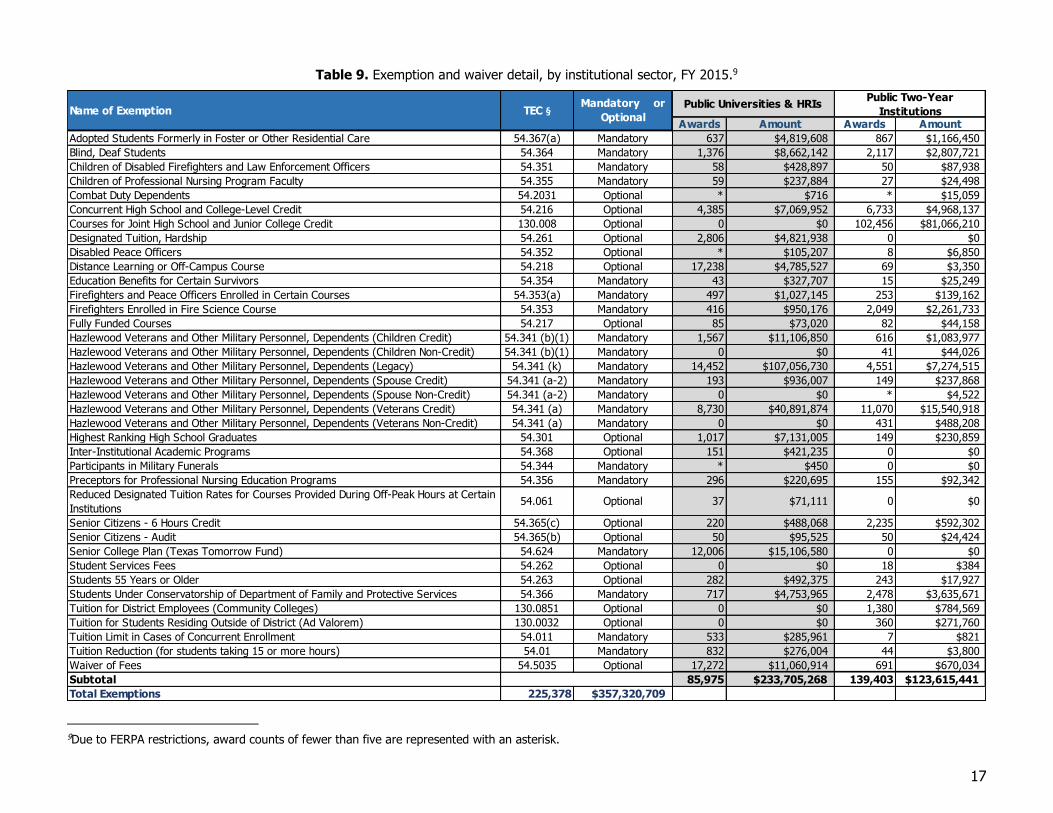
Table 9 lists all exemptions and waivers, the applicable statutory citation, whether each is mandatory or optional, the number of awards, and the total amount of the awards, by institutional sector.
Table 8. Hazlewood exemptions, FY 2011-2015.
Grand Totals
Hazlewood Dependents
(Credit Hours)
Hazlewood Dependents (Non-Credit
Hours)
Hazlewood Dependents Legacy
Act
Fiscal Year Awards Dollars Awards Dollars Awards Dollars Awards Dollars
2011 22,585 71,850,210 1,961 $10,932,045 2 $560 2,722 $14,484,274
2012 31,595 113,412,252 3,268 $13,234,257 3 $1,199 7,102 $43,444,679
2013 38,385 150,777,640 1,744 $8,226,382 9 $11,317 12,233 $76,320,929
2014 41,978 172,127,563 1,833 $9,654,837 23 $18,811 17,434 $100,517,656
2015 41,804 184,665,495 2,183 $12,190,827 41 $44,026 19,003 $114,331,246
176,347 $692,833,160 10,989 $54,238,347 78 $75,913 58,494 $349,098,783
Hazlewood Spouse
(Credit Hours)
Hazlewood Spouse
(Non-Credit)
Hazlewood Veteran (Credit Hours)
Hazlewood Veteran (Non-Credit Hours)
Fiscal Year Awards Dollars Awards Dollars Awards Dollars Awards Dollars
2011 31 $113,972 0 $0 17,455 $45,739,687 414 $579,672
2012 52 $140,311 0 $0 20,672 $56,040,927 498 $550,880
2013 143 $560,264 3 $5,854 23,730 $64,914,151 523 $738,742
2014 440 $920,352 5 $8,251 21,728 $60,297,032 515 $710,625
2015 342 $1,173,875 4 $4,522 19,800 $56,432,792 431 $488,208
1,008 $2,908,774 12 $18,627 103,385 $283,424,589 2,381 $3,068,126
17
Table 9. Exemption and waiver detail, by institutional sector, FY 2015.9
9Due to FERPA restrictions, award counts of fewer than five are represented with an asterisk.
Awards Amount Awards Amount
Adopted Students Formerly in Foster or Other Residential Care 54.367(a) Mandatory 637 $4,819,608 867 $1,166,450
Blind, Deaf Students 54.364 Mandatory 1,376 $8,662,142 2,117 $2,807,721
Children of Disabled Firefighters and Law Enforcement Officers 54.351 Mandatory 58 $428,897 50 $87,938
Children of Professional Nursing Program Faculty 54.355 Mandatory 59 $237,884 27 $24,498
Combat Duty Dependents 54.2031 Optional * $716 * $15,059
Concurrent High School and College-Level Credit 54.216 Optional 4,385 $7,069,952 6,733 $4,968,137
Courses for Joint High School and Junior College Credit 130.008 Optional 0 $0 102,456 $81,066,210
Designated Tuition, Hardship 54.261 Optional 2,806 $4,821,938 0 $0
Disabled Peace Officers 54.352 Optional * $105,207 8 $6,850
Distance Learning or Off-Campus Course 54.218 Optional 17,238 $4,785,527 69 $3,350
Education Benefits for Certain Survivors 54.354 Mandatory 43 $327,707 15 $25,249
Firefighters and Peace Officers Enrolled in Certain Courses 54.353(a) Mandatory 497 $1,027,145 253 $139,162
Firefighters Enrolled in Fire Science Course 54.353 Mandatory 416 $950,176 2,049 $2,261,733
Fully Funded Courses 54.217 Optional 85 $73,020 82 $44,158
Hazlewood Veterans and Other Military Personnel, Dependents (Children Credit) 54.341 (b)(1) Mandatory 1,567 $11,106,850 616 $1,083,977
Hazlewood Veterans and Other Military Personnel, Dependents (Children Non-Credit) 54.341 (b)(1) Mandatory 0 $0 41 $44,026
Hazlewood Veterans and Other Military Personnel, Dependents (Legacy) 54.341 (k) Mandatory 14,452 $107,056,730 4,551 $7,274,515
Hazlewood Veterans and Other Military Personnel, Dependents (Spouse Credit) 54.341 (a-2) Mandatory 193 $936,007 149 $237,868
Hazlewood Veterans and Other Military Personnel, Dependents (Spouse Non-Credit) 54.341 (a-2) Mandatory 0 $0 * $4,522
Hazlewood Veterans and Other Military Personnel, Dependents (Veterans Credit) 54.341 (a) Mandatory 8,730 $40,891,874 11,070 $15,540,918
Hazlewood Veterans and Other Military Personnel, Dependents (Veterans Non-Credit) 54.341 (a) Mandatory 0 $0 431 $488,208
Highest Ranking High School Graduates 54.301 Optional 1,017 $7,131,005 149 $230,859
Inter-Institutional Academic Programs 54.368 Optional 151 $421,235 0 $0
Participants in Military Funerals 54.344 Mandatory * $450 0 $0
Preceptors for Professional Nursing Education Programs 54.356 Mandatory 296 $220,695 155 $92,342
Reduced Designated Tuition Rates for Courses Provided During Off-Peak Hours at Certain
Institutions54.061 Optional 37 $71,111 0 $0
Senior Citizens - 6 Hours Credit 54.365(c) Optional 220 $488,068 2,235 $592,302
Senior Citizens - Audit 54.365(b) Optional 50 $95,525 50 $24,424
Senior College Plan (Texas Tomorrow Fund) 54.624 Mandatory 12,006 $15,106,580 0 $0
Student Services Fees 54.262 Optional 0 $0 18 $384
Students 55 Years or Older 54.263 Optional 282 $492,375 243 $17,927
Students Under Conservatorship of Department of Family and Protective Services 54.366 Mandatory 717 $4,753,965 2,478 $3,635,671
Tuition for District Employees (Community Colleges) 130.0851 Optional 0 $0 1,380 $784,569
Tuition for Students Residing Outside of District (Ad Valorem) 130.0032 Optional 0 $0 360 $271,760
Tuition Limit in Cases of Concurrent Enrollment 54.011 Mandatory 533 $285,961 7 $821
Tuition Reduction (for students taking 15 or more hours) 54.01 Mandatory 832 $276,004 44 $3,800
Waiver of Fees 54.5035 Optional 17,272 $11,060,914 691 $670,034
Subtotal 85,975 $233,705,268 139,403 $123,615,441
Total Exemptions 225,378 $357,320,709
TEC §Mandatory or
Optional
Public Universities & HRIsPublic Two-Year
InstitutionsName of Exemption
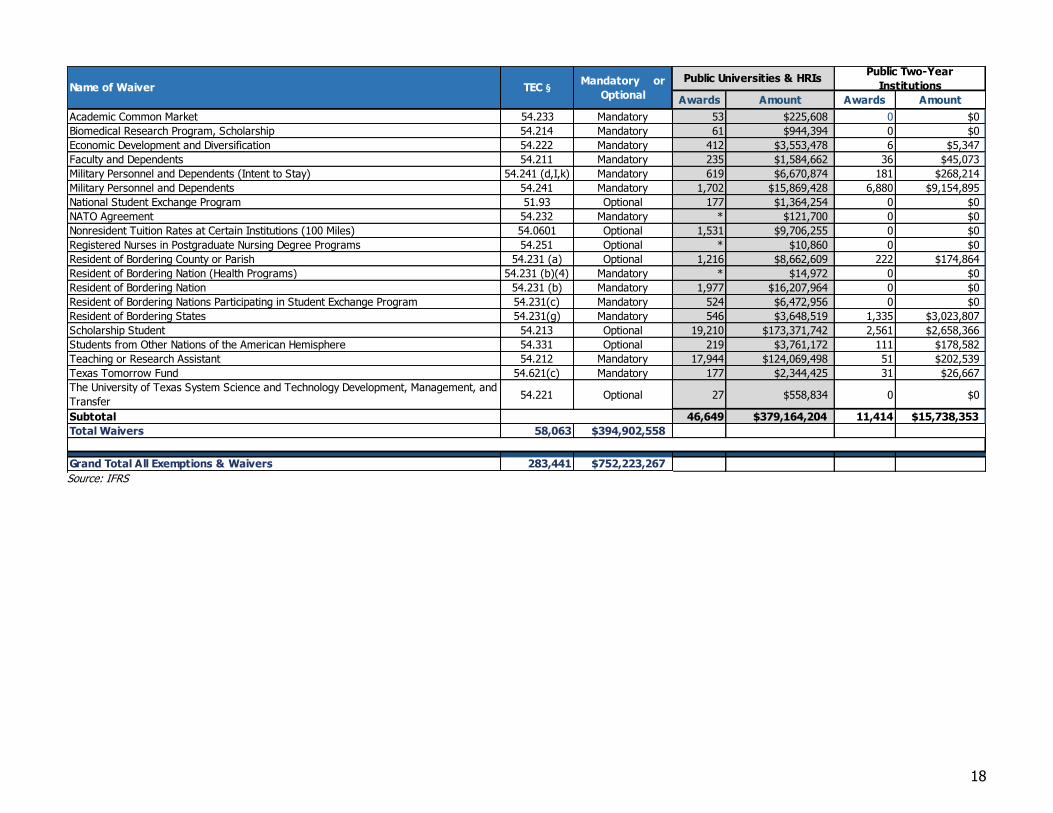
18
Source: IFRS
Awards Amount Awards Amount
Academic Common Market 54.233 Mandatory 53 $225,608 0 $0
Biomedical Research Program, Scholarship 54.214 Mandatory 61 $944,394 0 $0
Economic Development and Diversification 54.222 Mandatory 412 $3,553,478 6 $5,347
Faculty and Dependents 54.211 Mandatory 235 $1,584,662 36 $45,073
Military Personnel and Dependents (Intent to Stay) 54.241 (d,I,k) Mandatory 619 $6,670,874 181 $268,214
Military Personnel and Dependents 54.241 Mandatory 1,702 $15,869,428 6,880 $9,154,895
National Student Exchange Program 51.93 Optional 177 $1,364,254 0 $0
NATO Agreement 54.232 Mandatory * $121,700 0 $0
Nonresident Tuition Rates at Certain Institutions (100 Miles) 54.0601 Optional 1,531 $9,706,255 0 $0
Registered Nurses in Postgraduate Nursing Degree Programs 54.251 Optional * $10,860 0 $0
Resident of Bordering County or Parish 54.231 (a) Optional 1,216 $8,662,609 222 $174,864
Resident of Bordering Nation (Health Programs) 54.231 (b)(4) Mandatory * $14,972 0 $0
Resident of Bordering Nation 54.231 (b) Mandatory 1,977 $16,207,964 0 $0
Resident of Bordering Nations Participating in Student Exchange Program 54.231(c) Mandatory 524 $6,472,956 0 $0
Resident of Bordering States 54.231(g) Mandatory 546 $3,648,519 1,335 $3,023,807
Scholarship Student 54.213 Optional 19,210 $173,371,742 2,561 $2,658,366
Students from Other Nations of the American Hemisphere 54.331 Optional 219 $3,761,172 111 $178,582
Teaching or Research Assistant 54.212 Mandatory 17,944 $124,069,498 51 $202,539
Texas Tomorrow Fund 54.621(c) Mandatory 177 $2,344,425 31 $26,667
The University of Texas System Science and Technology Development, Management, and
Transfer54.221 Optional 27 $558,834 0 $0
Subtotal 46,649 $379,164,204 11,414 $15,738,353
Total Waivers 58,063 $394,902,558
Grand Total All Exemptions & Waivers 283,441 $752,223,267
Name of Waiver TEC §Mandatory or
Optional
Public Two-Year
InstitutionsPublic Universities & HRIs
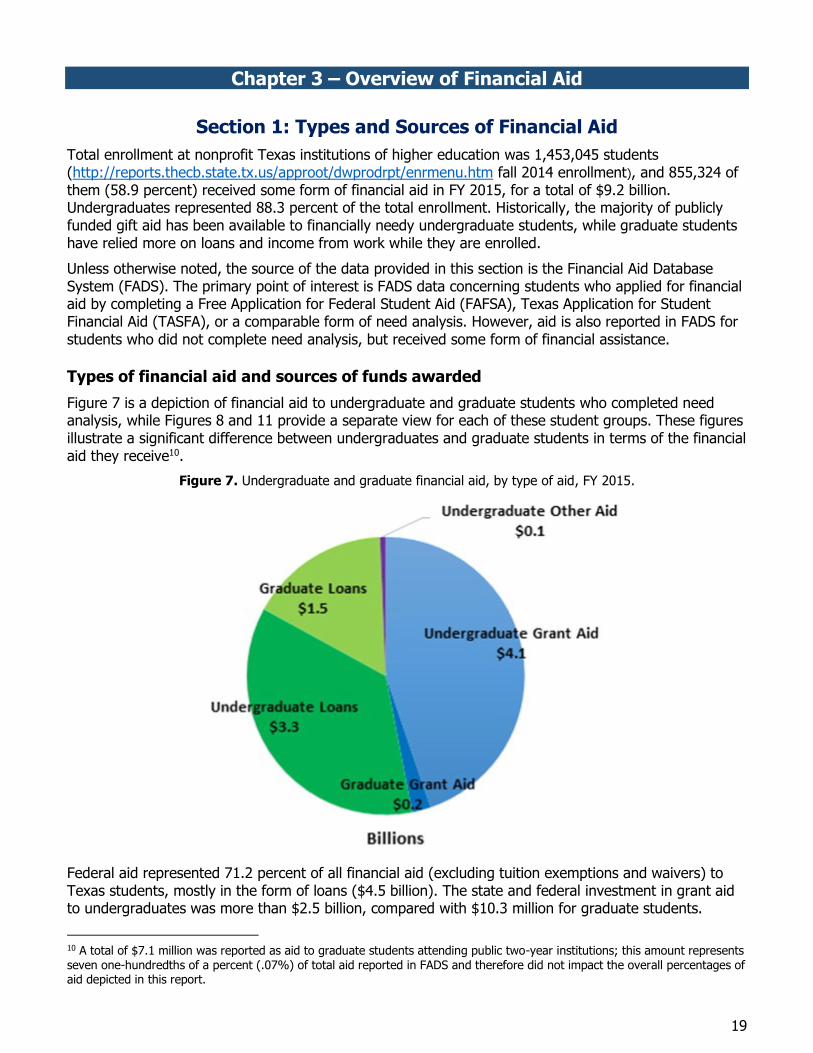
19
Chapter 3 – Overview of Financial Aid
Section 1: Types and Sources of Financial Aid
Total enrollment at nonprofit Texas institutions of higher education was 1,453,045 students (http://reports.thecb.state.tx.us/approot/dwprodrpt/enrmenu.htm fall 2014 enrollment), and 855,324 of them (58.9 percent) received some form of financial aid in FY 2015, for a total of $9.2 billion. Undergraduates represented 88.3 percent of the total enrollment. Historically, the majority of publicly funded gift aid has been available to financially needy undergraduate students, while graduate students have relied more on loans and income from work while they are enrolled.
Unless otherwise noted, the source of the data provided in this section is the Financial Aid Database System (FADS). The primary point of interest is FADS data concerning students who applied for financial aid by completing a Free Application for Federal Student Aid (FAFSA), Texas Application for Student Financial Aid (TASFA), or a comparable form of need analysis. However, aid is also reported in FADS for students who did not complete need analysis, but received some form of financial assistance.
Types of financial aid and sources of funds awarded
Figure 7 is a depiction of financial aid to undergraduate and graduate students who completed need analysis, while Figures 8 and 11 provide a separate view for each of these student groups. These figures illustrate a significant difference between undergraduates and graduate students in terms of the financial aid they receive10.
Figure 7. Undergraduate and graduate financial aid, by type of aid, FY 2015.
Federal aid represented 71.2 percent of all financial aid (excluding tuition exemptions and waivers) to Texas students, mostly in the form of loans ($4.5 billion). The state and federal investment in grant aid to undergraduates was more than $2.5 billion, compared with $10.3 million for graduate students.
10 A total of $7.1 million was reported as aid to graduate students attending public two-year institutions; this amount represents seven one-hundredths of a percent (.07%) of total aid reported in FADS and therefore did not impact the overall percentages of aid depicted in this report.
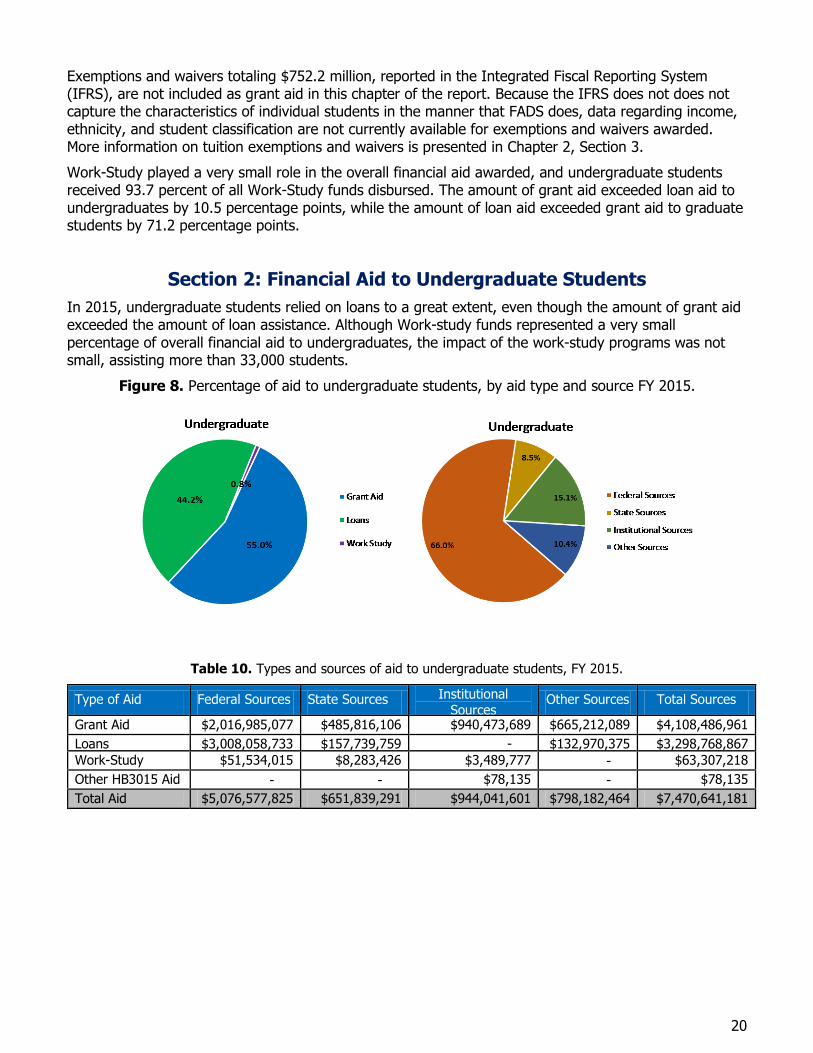
20
Exemptions and waivers totaling $752.2 million, reported in the Integrated Fiscal Reporting System (IFRS), are not included as grant aid in this chapter of the report. Because the IFRS does not does not capture the characteristics of individual students in the manner that FADS does, data regarding income, ethnicity, and student classification are not currently available for exemptions and waivers awarded. More information on tuition exemptions and waivers is presented in Chapter 2, Section 3.
Work-Study played a very small role in the overall financial aid awarded, and undergraduate students received 93.7 percent of all Work-Study funds disbursed. The amount of grant aid exceeded loan aid to undergraduates by 10.5 percentage points, while the amount of loan aid exceeded grant aid to graduate students by 71.2 percentage points.
Section 2: Financial Aid to Undergraduate Students
In 2015, undergraduate students relied on loans to a great extent, even though the amount of grant aid exceeded the amount of loan assistance. Although Work-study funds represented a very small percentage of overall financial aid to undergraduates, the impact of the work-study programs was not small, assisting more than 33,000 students.
Figure 8. Percentage of aid to undergraduate students, by aid type and source FY 2015.
Table 10. Types and sources of aid to undergraduate students, FY 2015.
Type of Aid Federal Sources State Sources Institutional Sources
Other Sources Total Sources
Grant Aid $2,016,985,077 $485,816,106 $940,473,689 $665,212,089 $4,108,486,961
Loans $3,008,058,733 $157,739,759 - $132,970,375 $3,298,768,867
Work-Study $51,534,015 $8,283,426 $3,489,777 - $63,307,218
Other HB3015 Aid - - $78,135 - $78,135
Total Aid $5,076,577,825 $651,839,291 $944,041,601 $798,182,464 $7,470,641,181
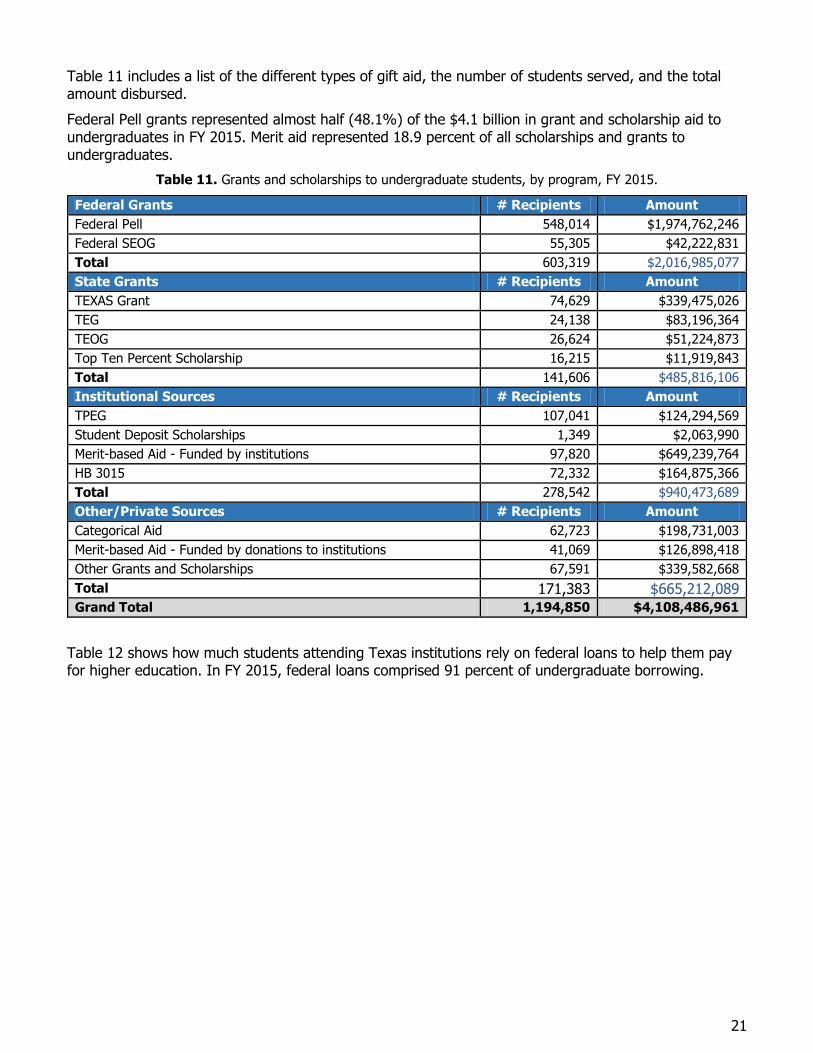
21
Table 11 includes a list of the different types of gift aid, the number of students served, and the total amount disbursed.
Federal Pell grants represented almost half (48.1%) of the $4.1 billion in grant and scholarship aid to undergraduates in FY 2015. Merit aid represented 18.9 percent of all scholarships and grants to undergraduates.
Table 11. Grants and scholarships to undergraduate students, by program, FY 2015.
Federal Grants # Recipients Amount
Federal Pell 548,014 $1,974,762,246
Federal SEOG 55,305 $42,222,831
Total 603,319 $2,016,985,077
State Grants # Recipients Amount
TEXAS Grant 74,629 $339,475,026
TEG 24,138 $83,196,364
TEOG 26,624 $51,224,873
Top Ten Percent Scholarship 16,215 $11,919,843
Total 141,606 $485,816,106
Institutional Sources # Recipients Amount
TPEG 107,041 $124,294,569
Student Deposit Scholarships 1,349 $2,063,990
Merit-based Aid - Funded by institutions 97,820 $649,239,764
HB 3015 72,332 $164,875,366
Total 278,542 $940,473,689
Other/Private Sources # Recipients Amount
Categorical Aid 62,723 $198,731,003
Merit-based Aid - Funded by donations to institutions 41,069 $126,898,418
Other Grants and Scholarships 67,591 $339,582,668
Total 171,383 $665,212,089
Grand Total 1,194,850 $4,108,486,961
Table 12 shows how much students attending Texas institutions rely on federal loans to help them pay for higher education. In FY 2015, federal loans comprised 91 percent of undergraduate borrowing.
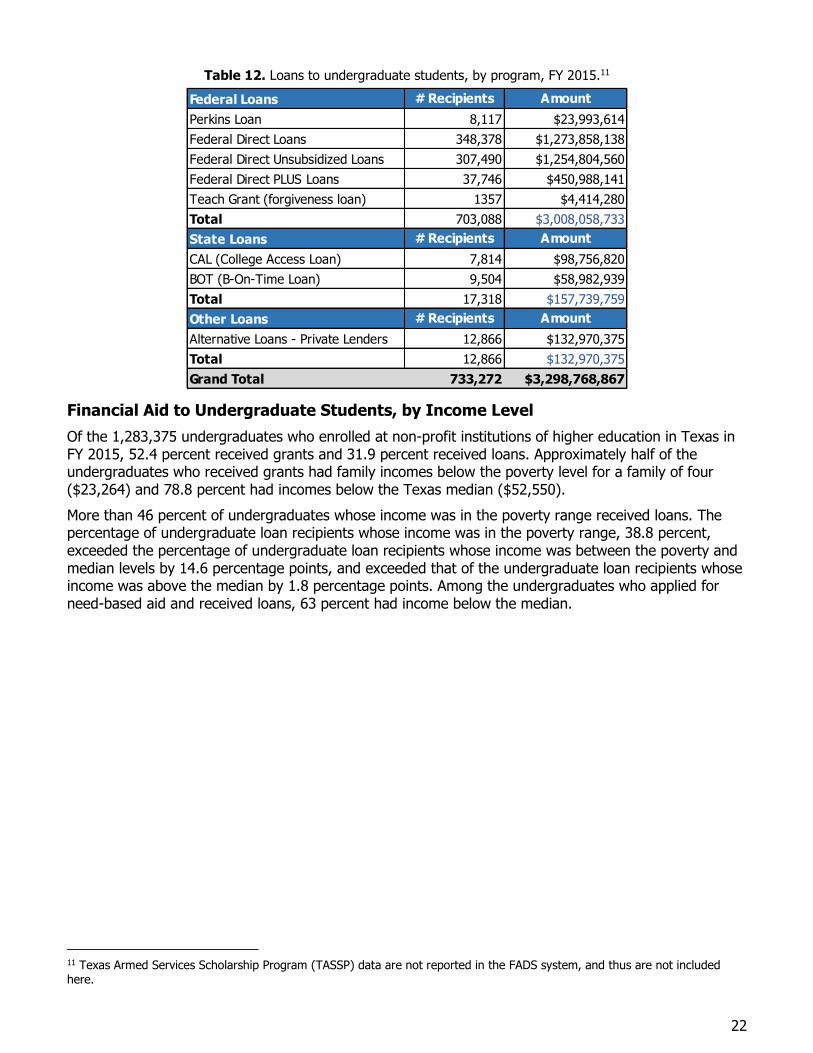
22
Table 12. Loans to undergraduate students, by program, FY 2015.11
Financial Aid to Undergraduate Students, by Income Level
Of the 1,283,375 undergraduates who enrolled at non-profit institutions of higher education in Texas in FY 2015, 52.4 percent received grants and 31.9 percent received loans. Approximately half of the undergraduates who received grants had family incomes below the poverty level for a family of four ($23,264) and 78.8 percent had incomes below the Texas median ($52,550).
More than 46 percent of undergraduates whose income was in the poverty range received loans. The percentage of undergraduate loan recipients whose income was in the poverty range, 38.8 percent, exceeded the percentage of undergraduate loan recipients whose income was between the poverty and median levels by 14.6 percentage points, and exceeded that of the undergraduate loan recipients whose income was above the median by 1.8 percentage points. Among the undergraduates who applied for need-based aid and received loans, 63 percent had income below the median.
11 Texas Armed Services Scholarship Program (TASSP) data are not reported in the FADS system, and thus are not included here.
Federal Loans # Recipients Amount
Perkins Loan 8,117 $23,993,614
Federal Direct Loans 348,378 $1,273,858,138
Federal Direct Unsubsidized Loans 307,490 $1,254,804,560
Federal Direct PLUS Loans 37,746 $450,988,141
Teach Grant (forgiveness loan) 1357 $4,414,280
Total 703,088 $3,008,058,733
State Loans # Recipients Amount
CAL (College Access Loan) 7,814 $98,756,820
BOT (B-On-Time Loan) 9,504 $58,982,939
Total 17,318 $157,739,759
Other Loans # Recipients Amount
Alternative Loans - Private Lenders 12,866 $132,970,375
Total 12,866 $132,970,375
Grand Total 733,272 $3,298,768,867
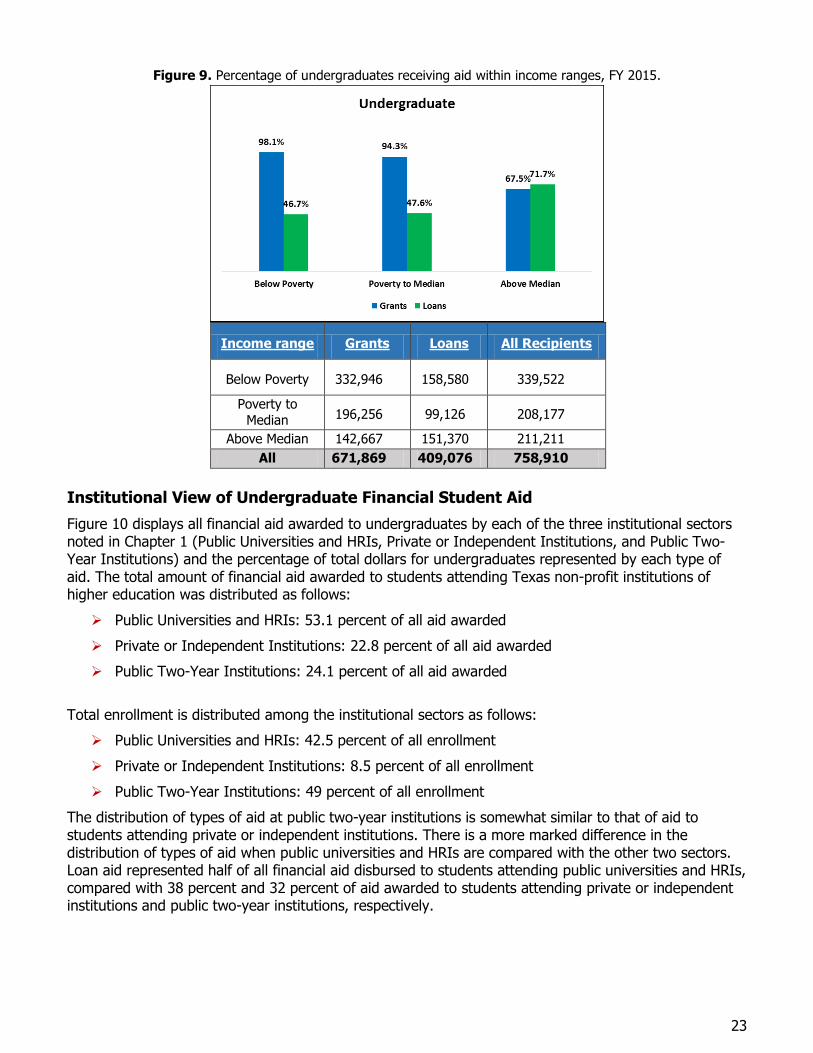
23
Figure 9. Percentage of undergraduates receiving aid within income ranges, FY 2015.
Income range Grants Loans All Recipients
Below Poverty 332,946 158,580 339,522
Poverty to
Median 196,256 99,126 208,177
Above Median 142,667 151,370 211,211
All 671,869 409,076 758,910
Institutional View of Undergraduate Financial Student Aid
Figure 10 displays all financial aid awarded to undergraduates by each of the three institutional sectors noted in Chapter 1 (Public Universities and HRIs, Private or Independent Institutions, and Public Two-Year Institutions) and the percentage of total dollars for undergraduates represented by each type of aid. The total amount of financial aid awarded to students attending Texas non-profit institutions of higher education was distributed as follows:
Public Universities and HRIs: 53.1 percent of all aid awarded
Private or Independent Institutions: 22.8 percent of all aid awarded
Public Two-Year Institutions: 24.1 percent of all aid awarded
Total enrollment is distributed among the institutional sectors as follows:
Public Universities and HRIs: 42.5 percent of all enrollment
Private or Independent Institutions: 8.5 percent of all enrollment
Public Two-Year Institutions: 49 percent of all enrollment
The distribution of types of aid at public two-year institutions is somewhat similar to that of aid to students attending private or independent institutions. There is a more marked difference in the distribution of types of aid when public universities and HRIs are compared with the other two sectors. Loan aid represented half of all financial aid disbursed to students attending public universities and HRIs, compared with 38 percent and 32 percent of aid awarded to students attending private or independent institutions and public two-year institutions, respectively.
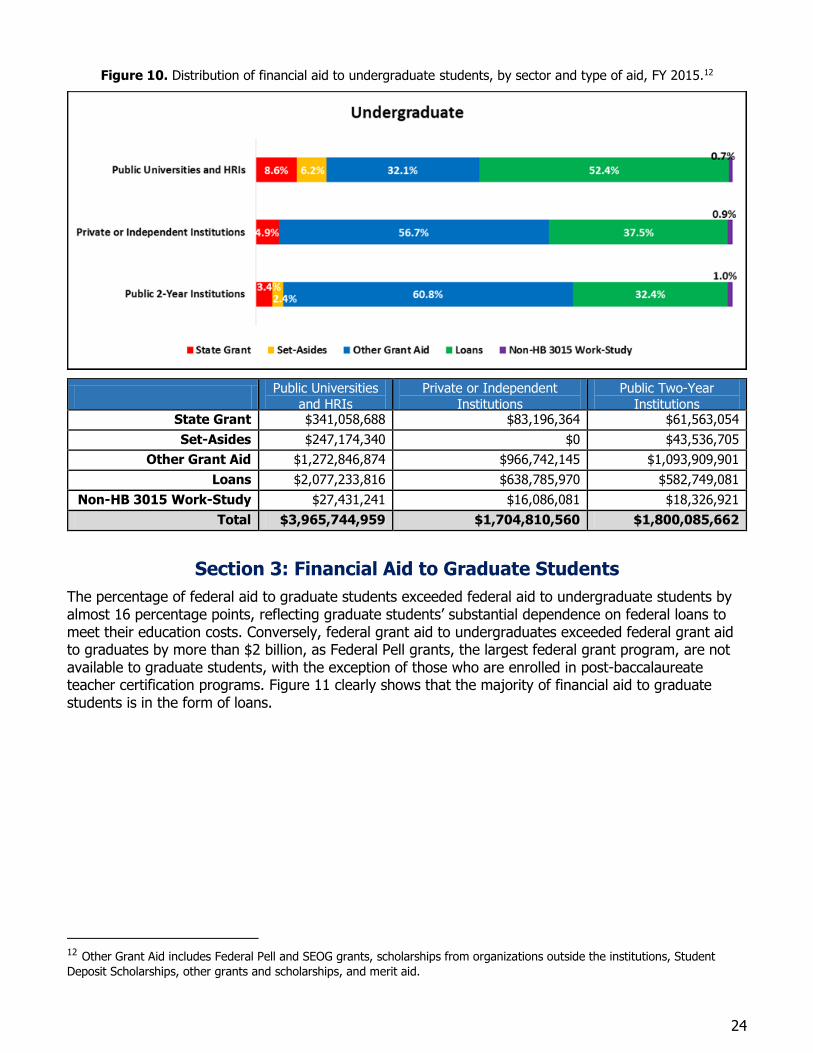
24
Figure 10. Distribution of financial aid to undergraduate students, by sector and type of aid, FY 2015.12
Public Universities
and HRIs
Private or Independent
Institutions
Public Two-Year
Institutions State Grant $341,058,688 $83,196,364 $61,563,054
Set-Asides $247,174,340 $0 $43,536,705
Other Grant Aid $1,272,846,874 $966,742,145 $1,093,909,901
Loans $2,077,233,816 $638,785,970 $582,749,081
Non-HB 3015 Work-Study $27,431,241 $16,086,081 $18,326,921
Total $3,965,744,959 $1,704,810,560 $1,800,085,662
Section 3: Financial Aid to Graduate Students
The percentage of federal aid to graduate students exceeded federal aid to undergraduate students by almost 16 percentage points, reflecting graduate students’ substantial dependence on federal loans to meet their education costs. Conversely, federal grant aid to undergraduates exceeded federal grant aid to graduates by more than $2 billion, as Federal Pell grants, the largest federal grant program, are not available to graduate students, with the exception of those who are enrolled in post-baccalaureate teacher certification programs. Figure 11 clearly shows that the majority of financial aid to graduate students is in the form of loans.
12 Other Grant Aid includes Federal Pell and SEOG grants, scholarships from organizations outside the institutions, Student
Deposit Scholarships, other grants and scholarships, and merit aid.
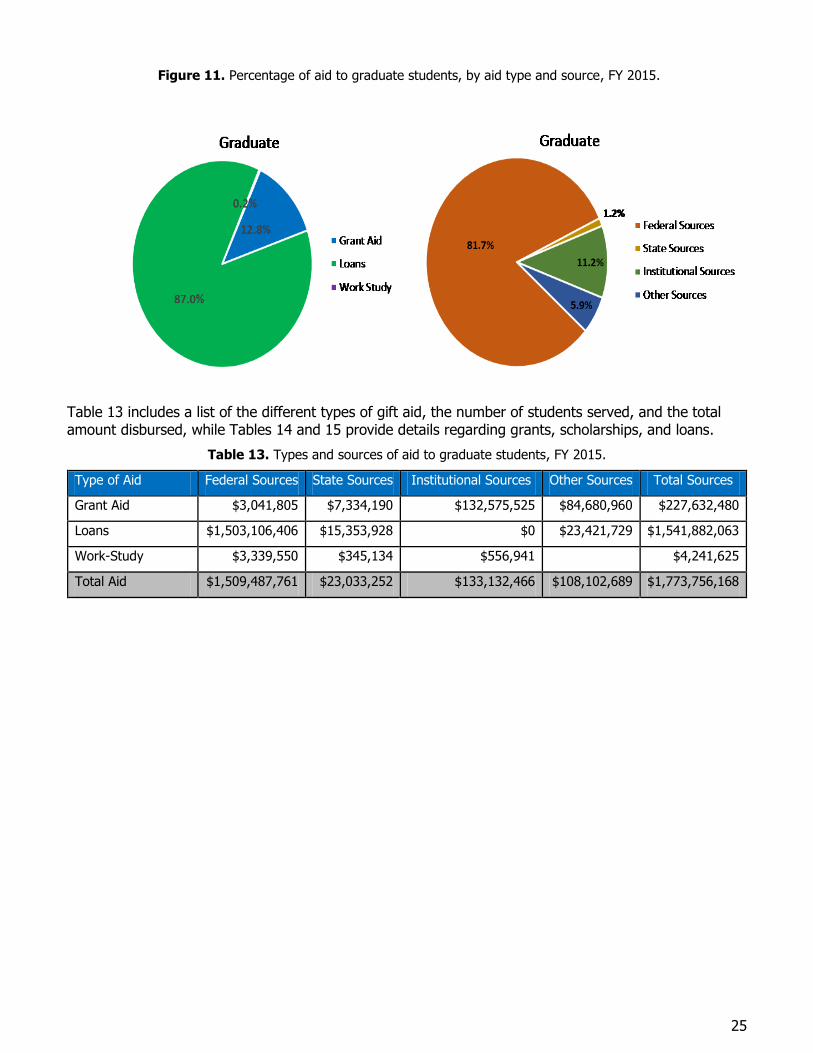
25
Figure 11. Percentage of aid to graduate students, by aid type and source, FY 2015.
Table 13 includes a list of the different types of gift aid, the number of students served, and the total amount disbursed, while Tables 14 and 15 provide details regarding grants, scholarships, and loans.
Table 13. Types and sources of aid to graduate students, FY 2015.
Type of Aid Federal Sources State Sources Institutional Sources Other Sources Total Sources
Grant Aid $3,041,805 $7,334,190 $132,575,525 $84,680,960 $227,632,480
Loans $1,503,106,406 $15,353,928 $0 $23,421,729 $1,541,882,063
Work-Study $3,339,550 $345,134 $556,941 $4,241,625
Total Aid $1,509,487,761 $23,033,252 $133,132,466 $108,102,689 $1,773,756,168
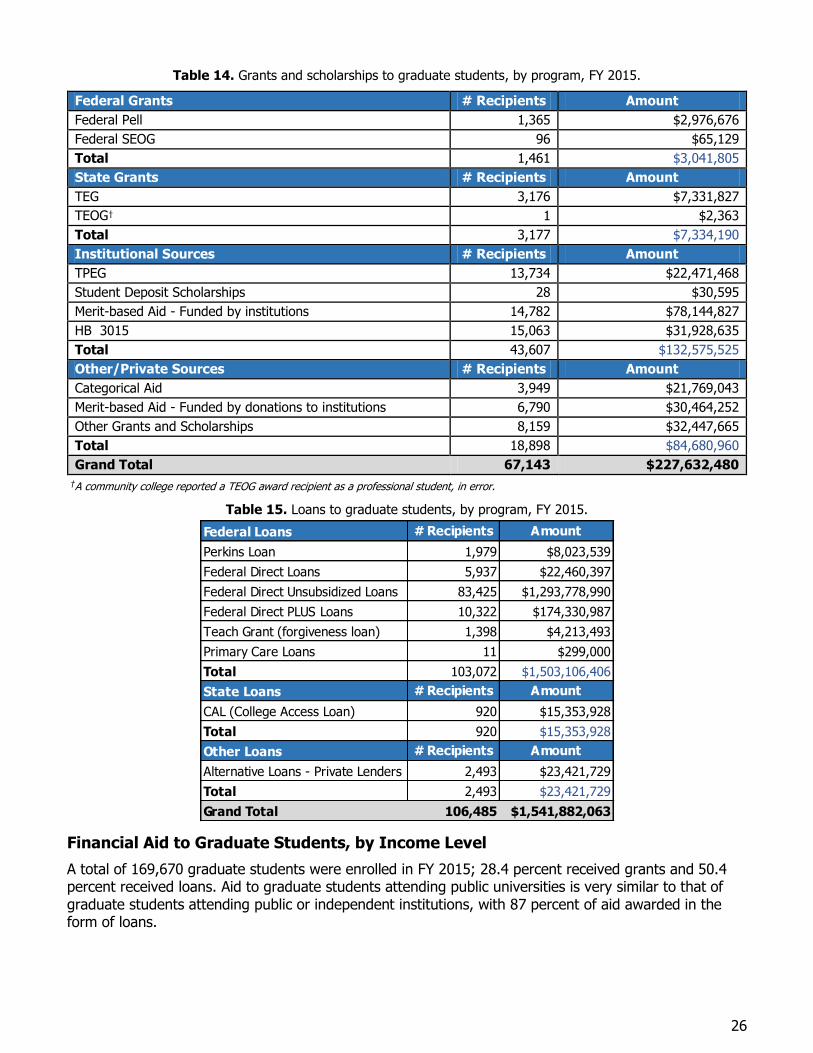
26
Table 14. Grants and scholarships to graduate students, by program, FY 2015.
Federal Grants # Recipients Amount
Federal Pell 1,365 $2,976,676
Federal SEOG 96 $65,129
Total 1,461 $3,041,805
State Grants # Recipients Amount
TEG 3,176 $7,331,827
TEOG† 1 $2,363
Total 3,177 $7,334,190
Institutional Sources # Recipients Amount
TPEG 13,734 $22,471,468
Student Deposit Scholarships 28 $30,595
Merit-based Aid - Funded by institutions 14,782 $78,144,827
HB 3015 15,063 $31,928,635
Total 43,607 $132,575,525
Other/Private Sources # Recipients Amount
Categorical Aid 3,949 $21,769,043
Merit-based Aid - Funded by donations to institutions 6,790 $30,464,252
Other Grants and Scholarships 8,159 $32,447,665
Total 18,898 $84,680,960
Grand Total 67,143 $227,632,480
†A community college reported a TEOG award recipient as a professional student, in error.
Table 15. Loans to graduate students, by program, FY 2015.
Financial Aid to Graduate Students, by Income Level
A total of 169,670 graduate students were enrolled in FY 2015; 28.4 percent received grants and 50.4 percent received loans. Aid to graduate students attending public universities is very similar to that of graduate students attending public or independent institutions, with 87 percent of aid awarded in the form of loans.
Federal Loans # Recipients Amount
Perkins Loan 1,979 $8,023,539
Federal Direct Loans 5,937 $22,460,397
Federal Direct Unsubsidized Loans 83,425 $1,293,778,990
Federal Direct PLUS Loans 10,322 $174,330,987
Teach Grant (forgiveness loan) 1,398 $4,213,493
Primary Care Loans 11 $299,000
Total 103,072 $1,503,106,406
State Loans # Recipients Amount
CAL (College Access Loan) 920 $15,353,928
Total 920 $15,353,928
Other Loans # Recipients Amount
Alternative Loans - Private Lenders 2,493 $23,421,729
Total 2,493 $23,421,729
Grand Total 106,485 $1,541,882,063
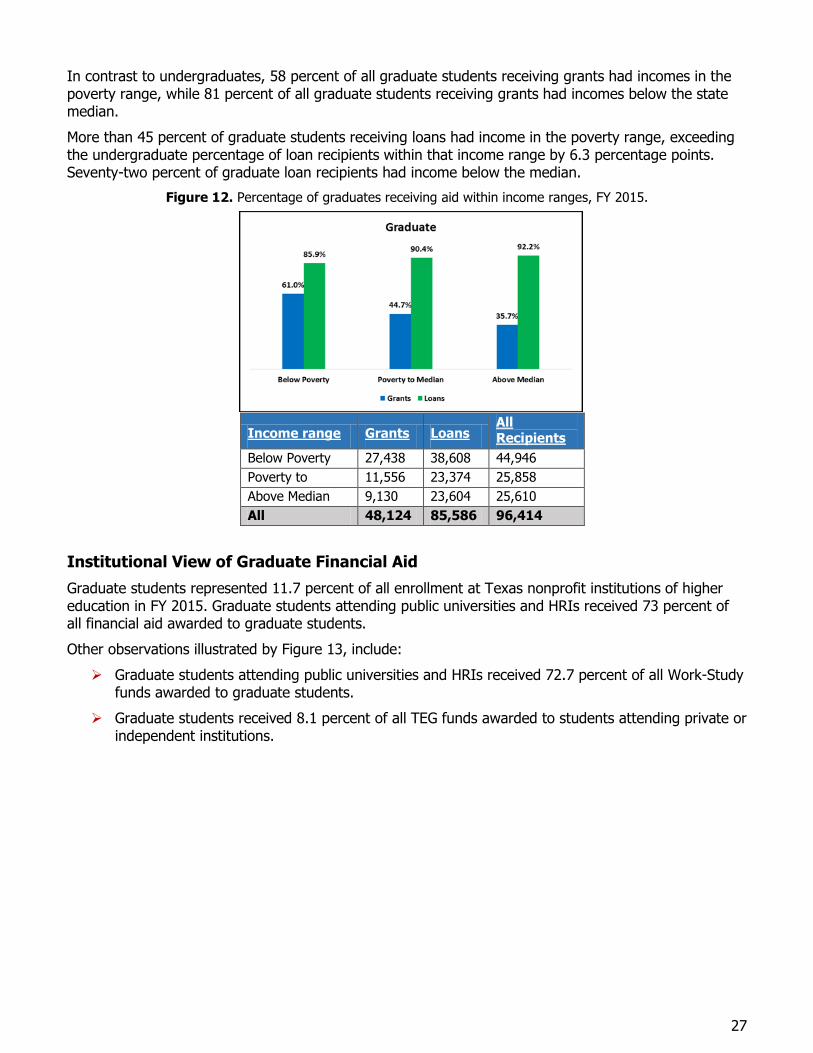
27
In contrast to undergraduates, 58 percent of all graduate students receiving grants had incomes in the poverty range, while 81 percent of all graduate students receiving grants had incomes below the state median.
More than 45 percent of graduate students receiving loans had income in the poverty range, exceeding the undergraduate percentage of loan recipients within that income range by 6.3 percentage points. Seventy-two percent of graduate loan recipients had income below the median.
Figure 12. Percentage of graduates receiving aid within income ranges, FY 2015.
Income range Grants Loans All Recipients
Below Poverty 27,438 38,608 44,946
Poverty to Median
11,556 23,374 25,858
Above Median 9,130 23,604 25,610
All 48,124 85,586 96,414
Institutional View of Graduate Financial Aid
Graduate students represented 11.7 percent of all enrollment at Texas nonprofit institutions of higher education in FY 2015. Graduate students attending public universities and HRIs received 73 percent of all financial aid awarded to graduate students.
Other observations illustrated by Figure 13, include:
Graduate students attending public universities and HRIs received 72.7 percent of all Work-Study funds awarded to graduate students.
Graduate students received 8.1 percent of all TEG funds awarded to students attending private or independent institutions.
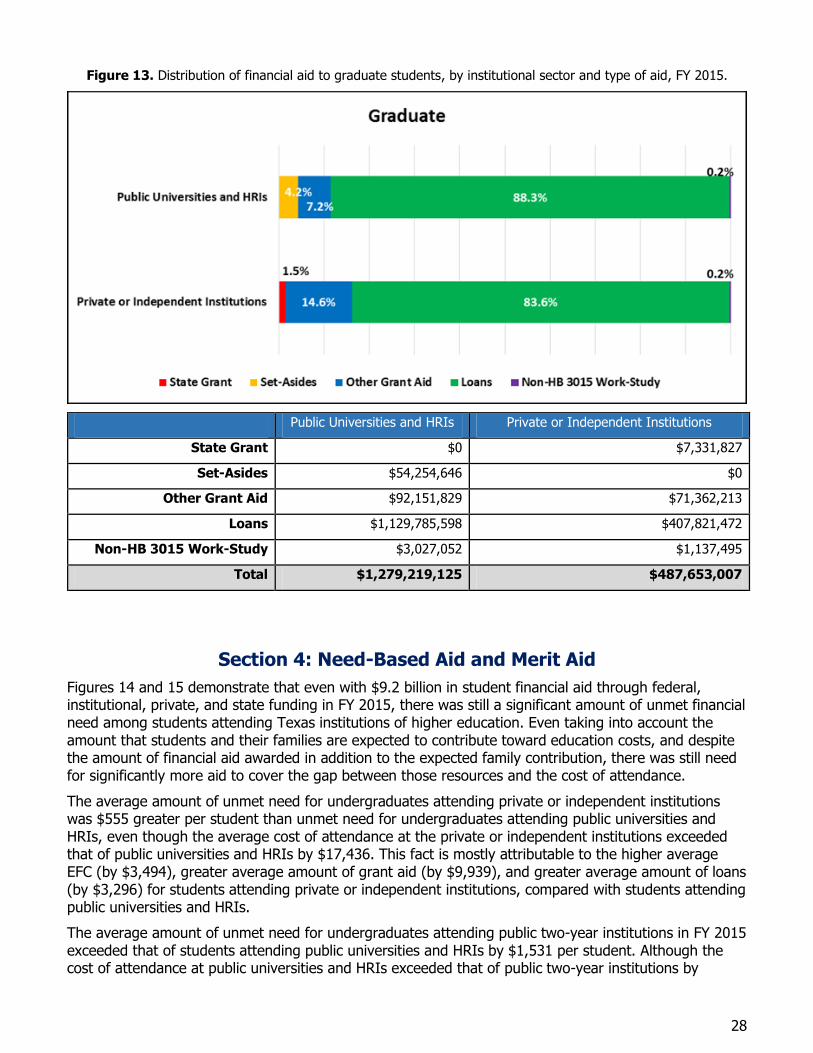
28
Figure 13. Distribution of financial aid to graduate students, by institutional sector and type of aid, FY 2015.
Public Universities and HRIs Private or Independent Institutions
State Grant $0 $7,331,827
Set-Asides $54,254,646 $0
Other Grant Aid $92,151,829 $71,362,213
Loans $1,129,785,598 $407,821,472
Non-HB 3015 Work-Study $3,027,052 $1,137,495
Total $1,279,219,125 $487,653,007
Section 4: Need-Based Aid and Merit Aid
Figures 14 and 15 demonstrate that even with $9.2 billion in student financial aid through federal, institutional, private, and state funding in FY 2015, there was still a significant amount of unmet financial need among students attending Texas institutions of higher education. Even taking into account the amount that students and their families are expected to contribute toward education costs, and despite the amount of financial aid awarded in addition to the expected family contribution, there was still need for significantly more aid to cover the gap between those resources and the cost of attendance.
The average amount of unmet need for undergraduates attending private or independent institutions was $555 greater per student than unmet need for undergraduates attending public universities and HRIs, even though the average cost of attendance at the private or independent institutions exceeded that of public universities and HRIs by $17,436. This fact is mostly attributable to the higher average EFC (by $3,494), greater average amount of grant aid (by $9,939), and greater average amount of loans (by $3,296) for students attending private or independent institutions, compared with students attending public universities and HRIs.
The average amount of unmet need for undergraduates attending public two-year institutions in FY 2015 exceeded that of students attending public universities and HRIs by $1,531 per student. Although the cost of attendance at public universities and HRIs exceeded that of public two-year institutions by
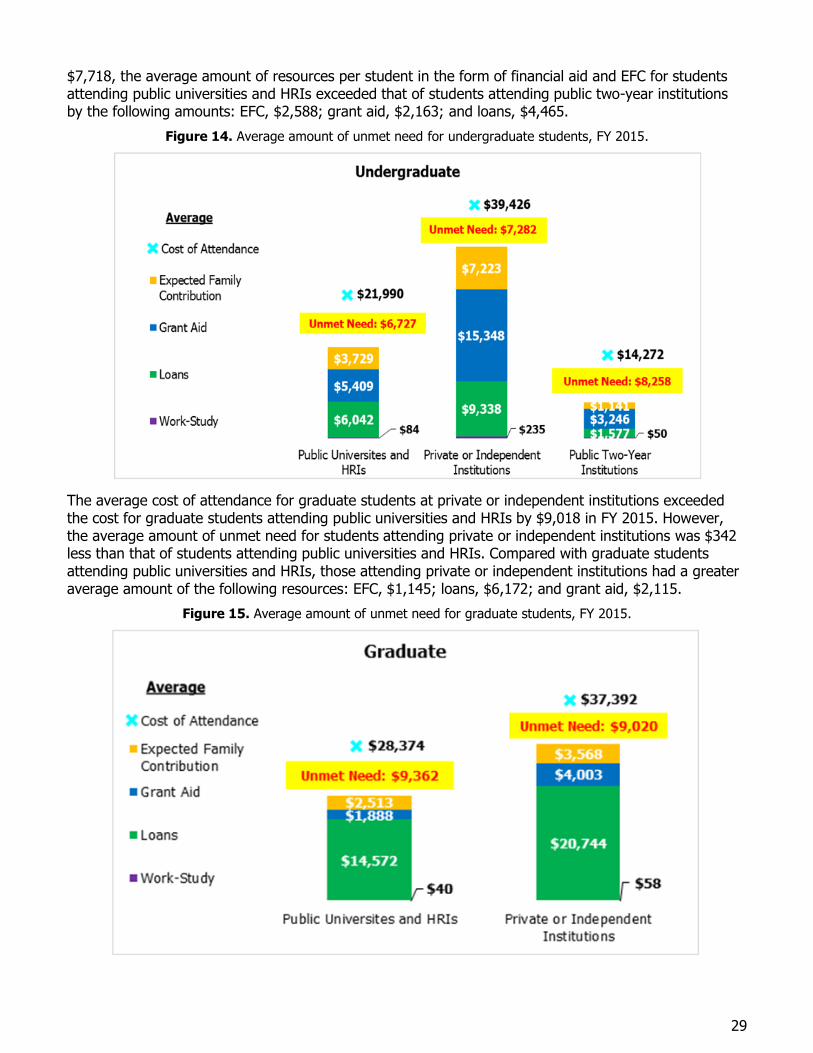
29
$7,718, the average amount of resources per student in the form of financial aid and EFC for students attending public universities and HRIs exceeded that of students attending public two-year institutions by the following amounts: EFC, $2,588; grant aid, $2,163; and loans, $4,465.
Figure 14. Average amount of unmet need for undergraduate students, FY 2015.
The average cost of attendance for graduate students at private or independent institutions exceeded the cost for graduate students attending public universities and HRIs by $9,018 in FY 2015. However, the average amount of unmet need for students attending private or independent institutions was $342 less than that of students attending public universities and HRIs. Compared with graduate students attending public universities and HRIs, those attending private or independent institutions had a greater average amount of the following resources: EFC, $1,145; loans, $6,172; and grant aid, $2,115.
Figure 15. Average amount of unmet need for graduate students, FY 2015.
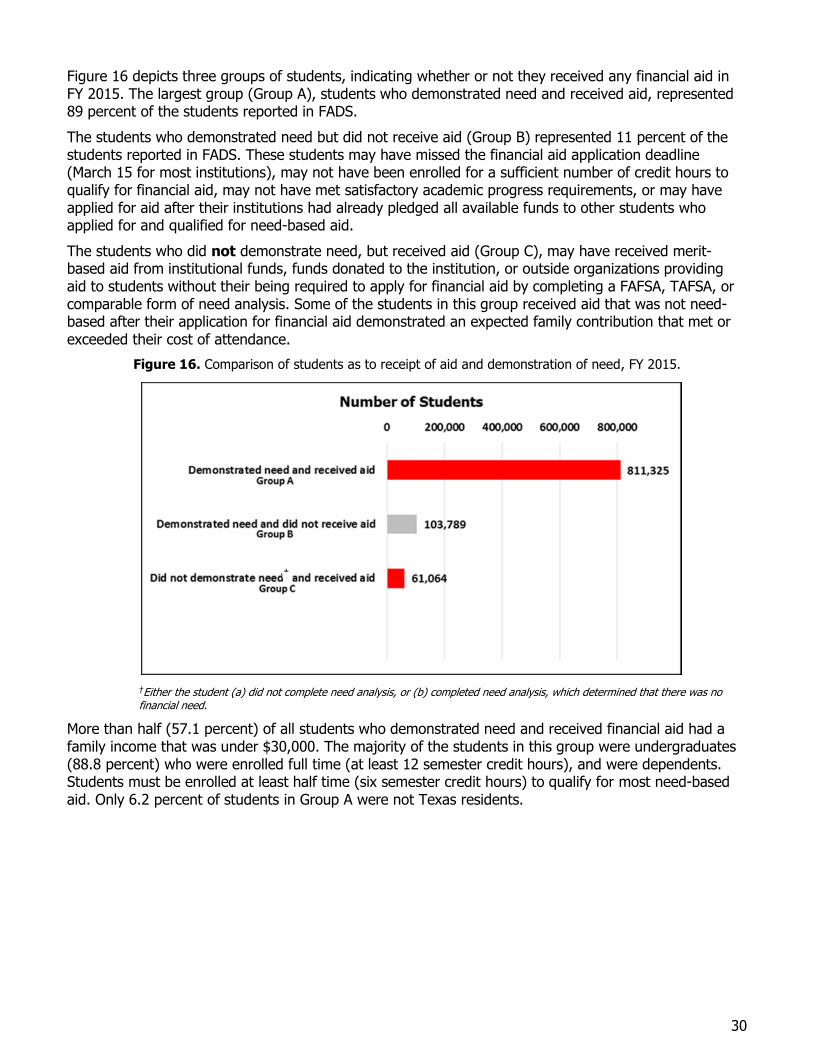
30
Figure 16 depicts three groups of students, indicating whether or not they received any financial aid in FY 2015. The largest group (Group A), students who demonstrated need and received aid, represented 89 percent of the students reported in FADS.
The students who demonstrated need but did not receive aid (Group B) represented 11 percent of the students reported in FADS. These students may have missed the financial aid application deadline (March 15 for most institutions), may not have been enrolled for a sufficient number of credit hours to qualify for financial aid, may not have met satisfactory academic progress requirements, or may have applied for aid after their institutions had already pledged all available funds to other students who applied for and qualified for need-based aid.
The students who did not demonstrate need, but received aid (Group C), may have received merit-based aid from institutional funds, funds donated to the institution, or outside organizations providing aid to students without their being required to apply for financial aid by completing a FAFSA, TAFSA, or comparable form of need analysis. Some of the students in this group received aid that was not need-based after their application for financial aid demonstrated an expected family contribution that met or exceeded their cost of attendance.
Figure 16. Comparison of students as to receipt of aid and demonstration of need, FY 2015.
†Either the student (a) did not complete need analysis, or (b) completed need analysis, which determined that there was no financial need.
More than half (57.1 percent) of all students who demonstrated need and received financial aid had a family income that was under $30,000. The majority of the students in this group were undergraduates (88.8 percent) who were enrolled full time (at least 12 semester credit hours), and were dependents. Students must be enrolled at least half time (six semester credit hours) to qualify for most need-based aid. Only 6.2 percent of students in Group A were not Texas residents.
†
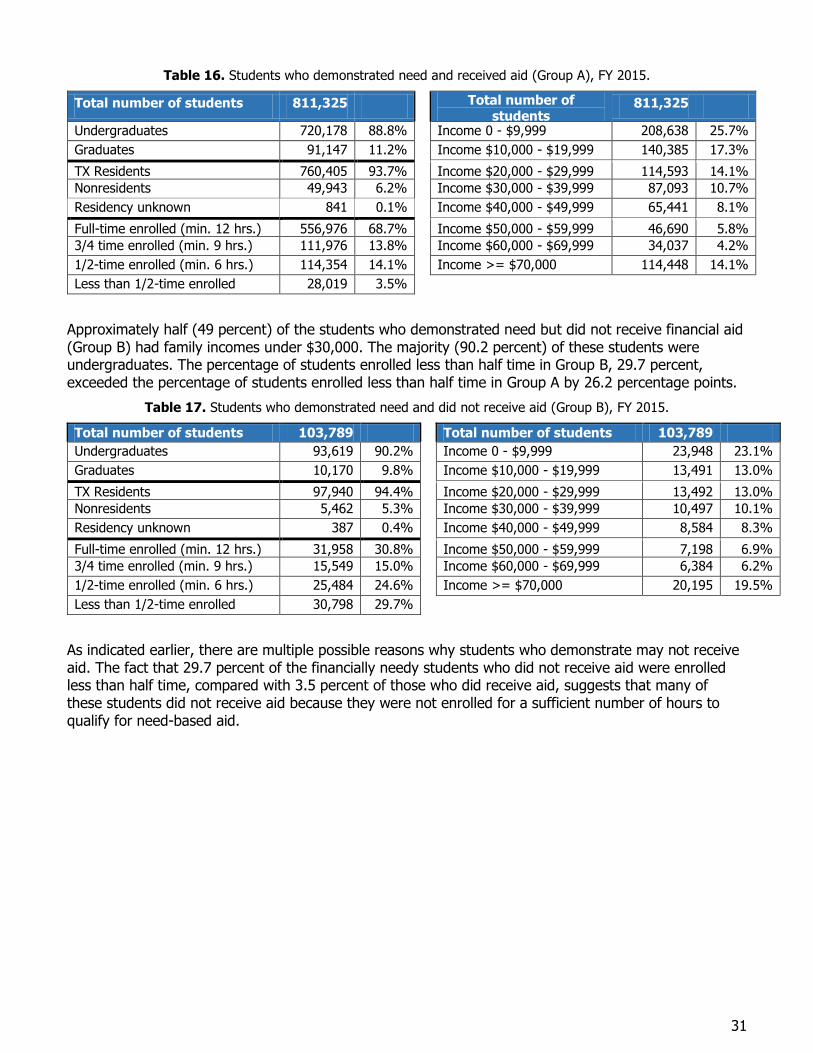
31
Table 16. Students who demonstrated need and received aid (Group A), FY 2015.
Total number of students 811,325 Total number of students
811,325
Undergraduates 720,178 88.8% Income 0 - $9,999 208,638 25.7%
Graduates 91,147 11.2% Income $10,000 - $19,999 140,385 17.3%
TX Residents 760,405 93.7% Income $20,000 - $29,999 114,593 14.1%
Nonresidents 49,943 6.2% Income $30,000 - $39,999 87,093 10.7%
Residency unknown 841 0.1% Income $40,000 - $49,999 65,441 8.1%
Full-time enrolled (min. 12 hrs.) 556,976 68.7% Income $50,000 - $59,999 46,690 5.8%
3/4 time enrolled (min. 9 hrs.) 111,976 13.8% Income $60,000 - $69,999 34,037 4.2%
1/2-time enrolled (min. 6 hrs.) 114,354 14.1% Income >= $70,000 114,448 14.1%
Less than 1/2-time enrolled 28,019 3.5%
Approximately half (49 percent) of the students who demonstrated need but did not receive financial aid (Group B) had family incomes under $30,000. The majority (90.2 percent) of these students were undergraduates. The percentage of students enrolled less than half time in Group B, 29.7 percent, exceeded the percentage of students enrolled less than half time in Group A by 26.2 percentage points.
Table 17. Students who demonstrated need and did not receive aid (Group B), FY 2015.
Total number of students 103,789 Total number of students 103,789
Undergraduates 93,619 90.2% Income 0 - $9,999 23,948 23.1%
Graduates 10,170 9.8% Income $10,000 - $19,999 13,491 13.0%
TX Residents 97,940 94.4% Income $20,000 - $29,999 13,492 13.0%
Nonresidents 5,462 5.3% Income $30,000 - $39,999 10,497 10.1%
Residency unknown 387 0.4% Income $40,000 - $49,999 8,584 8.3%
Full-time enrolled (min. 12 hrs.) 31,958 30.8% Income $50,000 - $59,999 7,198 6.9%
3/4 time enrolled (min. 9 hrs.) 15,549 15.0% Income $60,000 - $69,999 6,384 6.2%
1/2-time enrolled (min. 6 hrs.) 25,484 24.6% Income >= $70,000 20,195 19.5%
Less than 1/2-time enrolled 30,798 29.7%
As indicated earlier, there are multiple possible reasons why students who demonstrate may not receive aid. The fact that 29.7 percent of the financially needy students who did not receive aid were enrolled less than half time, compared with 3.5 percent of those who did receive aid, suggests that many of these students did not receive aid because they were not enrolled for a sufficient number of hours to qualify for need-based aid.
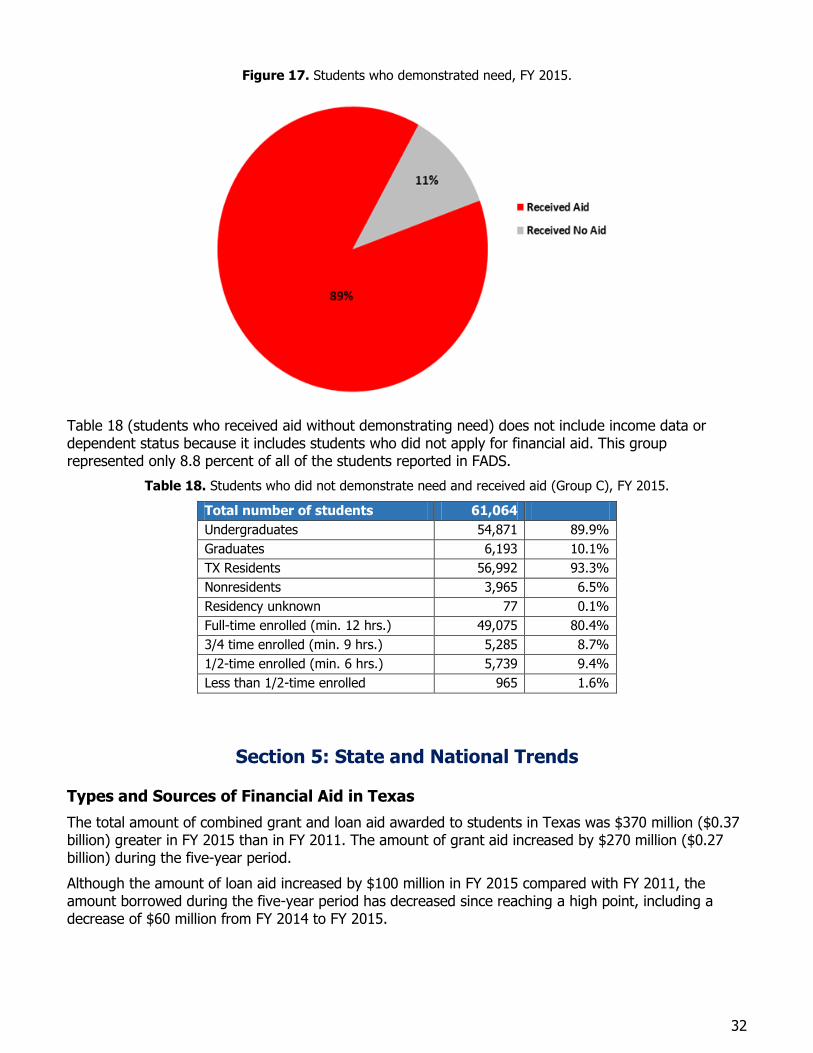
32
Figure 17. Students who demonstrated need, FY 2015.
Table 18 (students who received aid without demonstrating need) does not include income data or dependent status because it includes students who did not apply for financial aid. This group represented only 8.8 percent of all of the students reported in FADS.
Table 18. Students who did not demonstrate need and received aid (Group C), FY 2015.
Total number of students 61,064
Undergraduates 54,871 89.9%
Graduates 6,193 10.1%
TX Residents 56,992 93.3%
Nonresidents 3,965 6.5%
Residency unknown 77 0.1%
Full-time enrolled (min. 12 hrs.) 49,075 80.4%
3/4 time enrolled (min. 9 hrs.) 5,285 8.7%
1/2-time enrolled (min. 6 hrs.) 5,739 9.4%
Less than 1/2-time enrolled 965 1.6%
Section 5: State and National Trends
Types and Sources of Financial Aid in Texas
The total amount of combined grant and loan aid awarded to students in Texas was $370 million ($0.37 billion) greater in FY 2015 than in FY 2011. The amount of grant aid increased by $270 million ($0.27 billion) during the five-year period.
Although the amount of loan aid increased by $100 million in FY 2015 compared with FY 2011, the amount borrowed during the five-year period has decreased since reaching a high point, including a decrease of $60 million from FY 2014 to FY 2015.
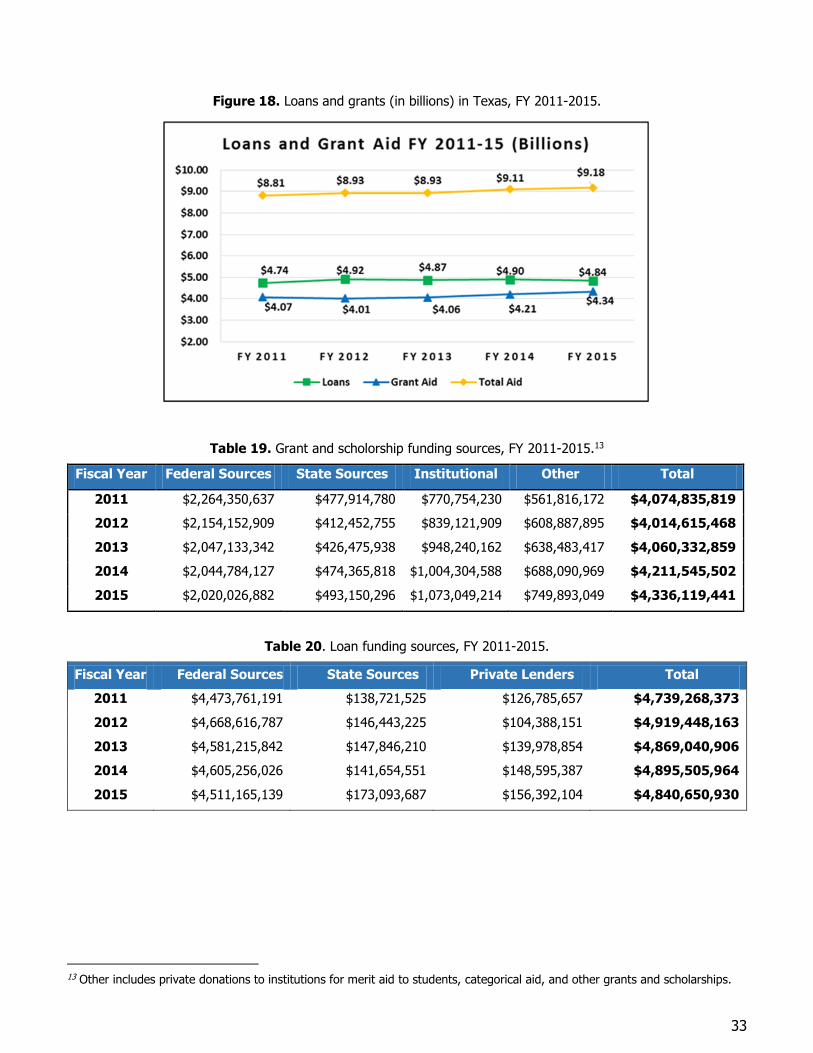
33
Figure 18. Loans and grants (in billions) in Texas, FY 2011-2015.
Table 19. Grant and scholorship funding sources, FY 2011-2015.13
Fiscal Year Federal Sources State Sources Institutional Other Total
2011 $2,264,350,637 $477,914,780 $770,754,230 $561,816,172 $4,074,835,819
2012 $2,154,152,909 $412,452,755 $839,121,909 $608,887,895 $4,014,615,468
2013 $2,047,133,342 $426,475,938 $948,240,162 $638,483,417 $4,060,332,859
2014 $2,044,784,127 $474,365,818 $1,004,304,588 $688,090,969 $4,211,545,502
2015 $2,020,026,882 $493,150,296 $1,073,049,214 $749,893,049 $4,336,119,441
Table 20. Loan funding sources, FY 2011-2015.
Fiscal Year Federal Sources State Sources Private Lenders Total
2011 $4,473,761,191 $138,721,525 $126,785,657 $4,739,268,373
2012 $4,668,616,787 $146,443,225 $104,388,151 $4,919,448,163
2013 $4,581,215,842 $147,846,210 $139,978,854 $4,869,040,906
2014 $4,605,256,026 $141,654,551 $148,595,387 $4,895,505,964
2015 $4,511,165,139 $173,093,687 $156,392,104 $4,840,650,930
13 Other includes private donations to institutions for merit aid to students, categorical aid, and other grants and scholarships.

34
Table 21. All aid (in billions) to students who applied for financial aid, FY 2011-2015.
Grant Aid Loans Work Study
Fiscal Year Dollars % of Total Dollars % of Total Dollars % of Total
2011 $4.07 45.8% $4.74 53.4% $7.00 0.8%
2012 $4.01 44.6% $4.92 54.6% $0.07 0.8%
2013 $4.06 45.1% $4.87 54.1% $0.07 0.8%
2014 $4.21 45.9% $4.90 53.4% $0.06 0.7%
2015 $4.34 46.9% $4.84 52.3% $0.07 0.8%
Signature State Grant Programs – At a Glance
Funding for the TEXAS Grant Program has returned to its FY 2011 funding level, following budget cuts for the FY 2011-2012 biennium. Also, a one-time transfer of funds to the TEOG Program, which serves students attending public two-year institutions, occurred for FY 2015. The transfer was made to assist students who would no longer qualify for TEXAS Grants following legislation limiting initial TEXAS Grant awards to students attending public universities and HRIs. The transfer of funds is evident not only in the total amount awarded in the TEOG Program in FY 2015, compared with FY 2014, but also in the 18,778 increase in the number of students served by TEOG. Accordingly, the TEXAS Grant program served 12,657 fewer students in FY 2015, compared with FY 2014.
Funding for the TEG Program, which serves students attending private or independent institutions, has not returned to the FY 2011 level. The number of students served by this program has not changed significantly throughout the five-year period shown in Table 22.
Table 22. TEXAS Grant, TEG, and TEOG funding summary, FY 2011-2015.
Program FY11 FY12 FY13 FY14 FY15
TEXAS Grant Funds (in Millions) $338.10 $286.38 $292.55 $345.43 $339.48
TEXAS Grant Recipients 71,410 75,585 76,873 87,069 74,412
Average Award Amount $4,735 $3,789 $3,806 $3,967 $4,562
TEG Funds (in Millions) $102.11 $84.30 $84.20 $89.42 $90.53
TEG Recipients 27,725 25,460 24,897 27,071 27,307
Average Award Amount $3,683 $3,311 $3,382 $3,303 $3,315
TEOG Funds (in Millions) $11.30 $9.20 $11.55 $13.70 $51.23
TEOG Recipients 6,825 5,799 6,562 7,841 26,619
Average Award Amount $1,655 $1,586 $1,761 $1,747 $1,924
National Trends in Student Aid
Most states do not maintain financial aid and enrollment data that are as robust as data reported to the Coordinating Board by institutions of higher education. The data published in the College Board’s Trends in Student Aid Report 2015 provide a means of comparing data for Texas with like data that are reported as national totals. The Trends in Student Aid Report does not provide data by individual states, and
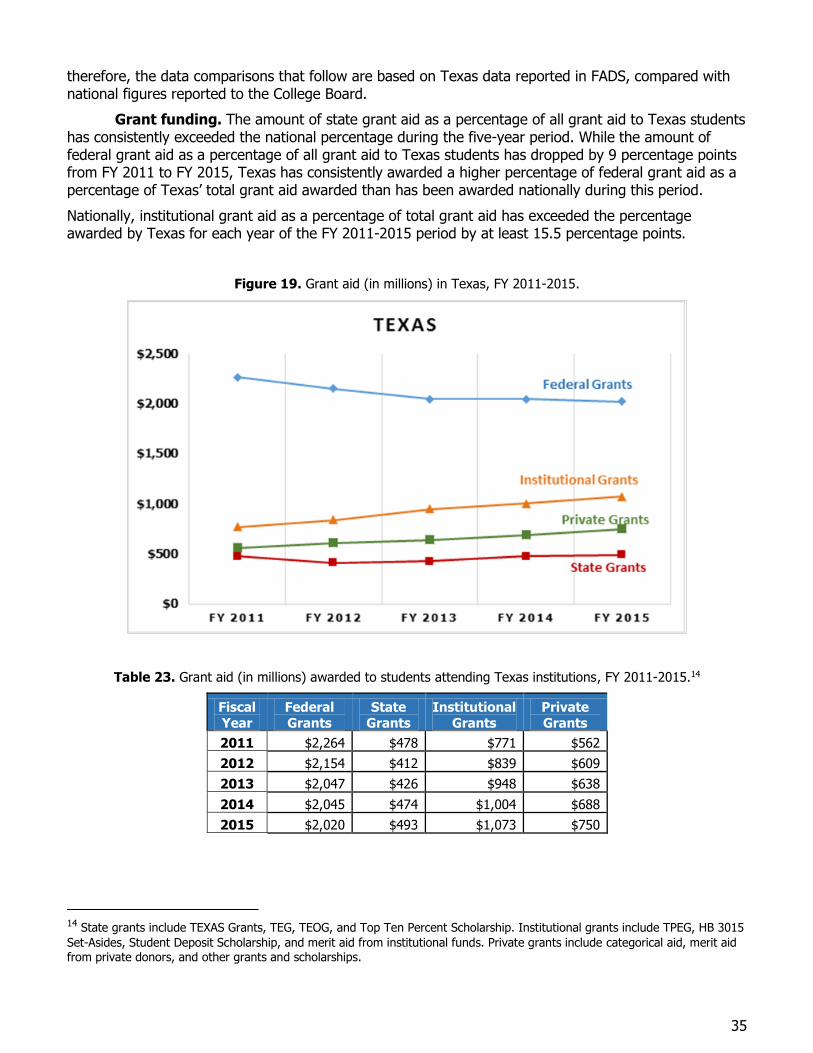
35
therefore, the data comparisons that follow are based on Texas data reported in FADS, compared with national figures reported to the College Board.
Grant funding. The amount of state grant aid as a percentage of all grant aid to Texas students has consistently exceeded the national percentage during the five-year period. While the amount of federal grant aid as a percentage of all grant aid to Texas students has dropped by 9 percentage points from FY 2011 to FY 2015, Texas has consistently awarded a higher percentage of federal grant aid as a percentage of Texas’ total grant aid awarded than has been awarded nationally during this period.
Nationally, institutional grant aid as a percentage of total grant aid has exceeded the percentage awarded by Texas for each year of the FY 2011-2015 period by at least 15.5 percentage points.
Figure 19. Grant aid (in millions) in Texas, FY 2011-2015.
Table 23. Grant aid (in millions) awarded to students attending Texas institutions, FY 2011-2015.14
Fiscal Year
Federal Grants
State Grants
Institutional Grants
Private Grants
2011 $2,264 $478 $771 $562
2012 $2,154 $412 $839 $609
2013 $2,047 $426 $948 $638
2014 $2,045 $474 $1,004 $688
2015 $2,020 $493 $1,073 $750
14 State grants include TEXAS Grants, TEG, TEOG, and Top Ten Percent Scholarship. Institutional grants include TPEG, HB 3015
Set-Asides, Student Deposit Scholarship, and merit aid from institutional funds. Private grants include categorical aid, merit aid from private donors, and other grants and scholarships.
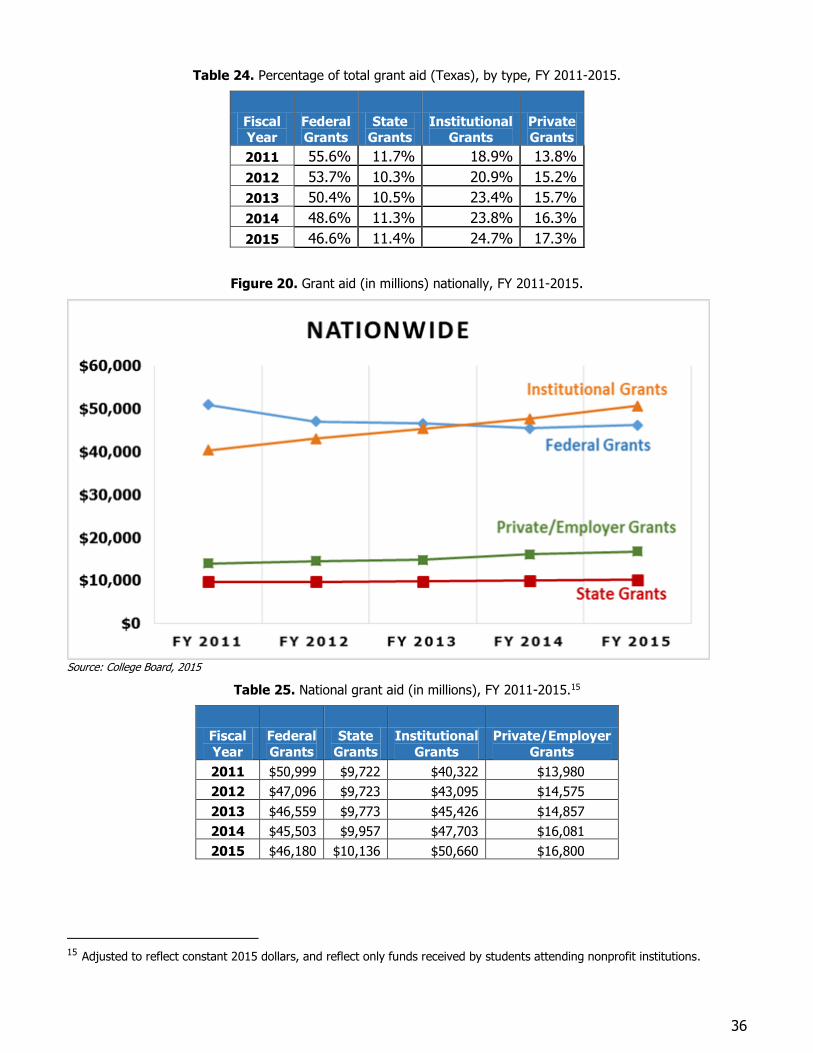
36
Table 24. Percentage of total grant aid (Texas), by type, FY 2011-2015.
Fiscal Year
Federal Grants
State Grants
Institutional Grants
Private Grants
2011 55.6% 11.7% 18.9% 13.8%
2012 53.7% 10.3% 20.9% 15.2%
2013 50.4% 10.5% 23.4% 15.7%
2014 48.6% 11.3% 23.8% 16.3%
2015 46.6% 11.4% 24.7% 17.3%
Figure 20. Grant aid (in millions) nationally, FY 2011-2015.
Source: College Board, 2015
Table 25. National grant aid (in millions), FY 2011-2015.15
Fiscal
Year
Federal
Grants
State
Grants
Institutional
Grants
Private/Employer
Grants
2011 $50,999 $9,722 $40,322 $13,980
2012 $47,096 $9,723 $43,095 $14,575
2013 $46,559 $9,773 $45,426 $14,857
2014 $45,503 $9,957 $47,703 $16,081
2015 $46,180 $10,136 $50,660 $16,800
15 Adjusted to reflect constant 2015 dollars, and reflect only funds received by students attending nonprofit institutions.
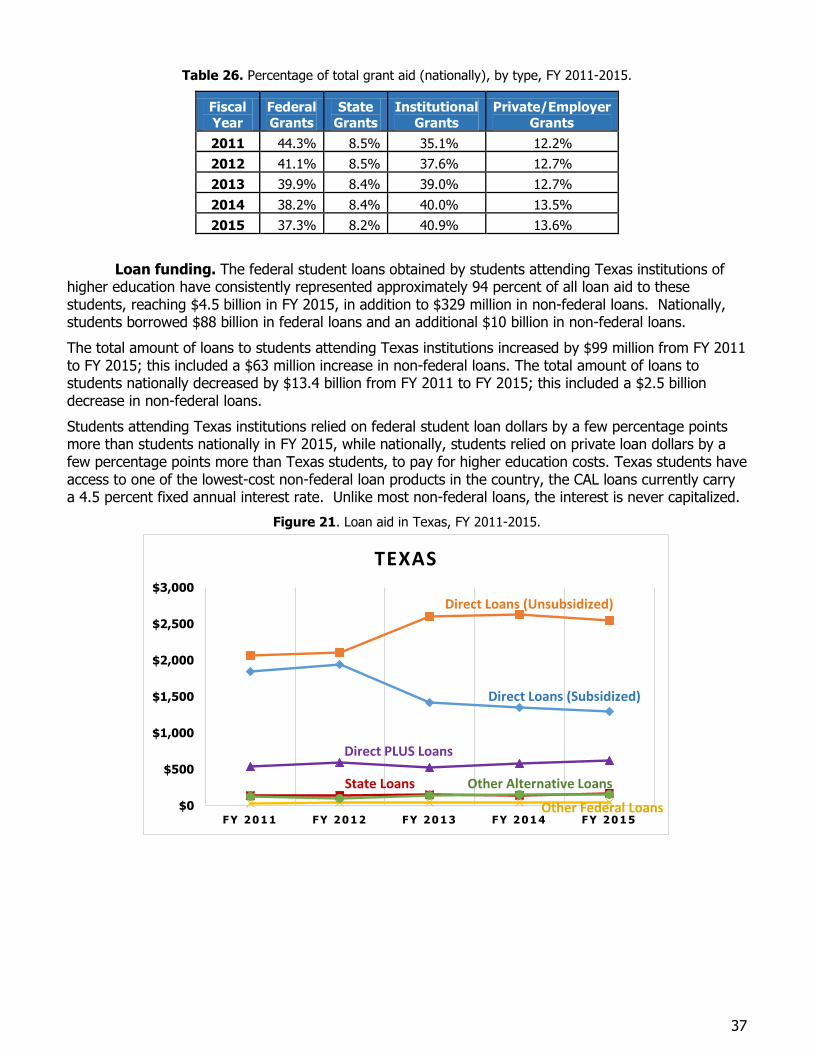
37
Table 26. Percentage of total grant aid (nationally), by type, FY 2011-2015.
Fiscal Year
Federal Grants
State Grants
Institutional Grants
Private/Employer Grants
2011 44.3% 8.5% 35.1% 12.2%
2012 41.1% 8.5% 37.6% 12.7%
2013 39.9% 8.4% 39.0% 12.7%
2014 38.2% 8.4% 40.0% 13.5%
2015 37.3% 8.2% 40.9% 13.6%
Loan funding. The federal student loans obtained by students attending Texas institutions of higher education have consistently represented approximately 94 percent of all loan aid to these students, reaching $4.5 billion in FY 2015, in addition to $329 million in non-federal loans. Nationally, students borrowed $88 billion in federal loans and an additional $10 billion in non-federal loans.
The total amount of loans to students attending Texas institutions increased by $99 million from FY 2011 to FY 2015; this included a $63 million increase in non-federal loans. The total amount of loans to students nationally decreased by $13.4 billion from FY 2011 to FY 2015; this included a $2.5 billion decrease in non-federal loans.
Students attending Texas institutions relied on federal student loan dollars by a few percentage points more than students nationally in FY 2015, while nationally, students relied on private loan dollars by a few percentage points more than Texas students, to pay for higher education costs. Texas students have access to one of the lowest-cost non-federal loan products in the country, the CAL loans currently carry a 4.5 percent fixed annual interest rate. Unlike most non-federal loans, the interest is never capitalized.
Figure 21. Loan aid in Texas, FY 2011-2015.
$0
$500
$1,000
$1,500
$2,000
$2,500
$3,000
F Y 2 0 1 1 F Y 2 0 1 2 F Y 2 0 1 3 F Y 2 0 1 4 F Y 2 0 1 5
TEXAS
Direct Loans (Subsidized)
Direct Loans (Unsubsidized)
Direct PLUS Loans
State Loans
Other Federal Loans
Other Alternative Loans
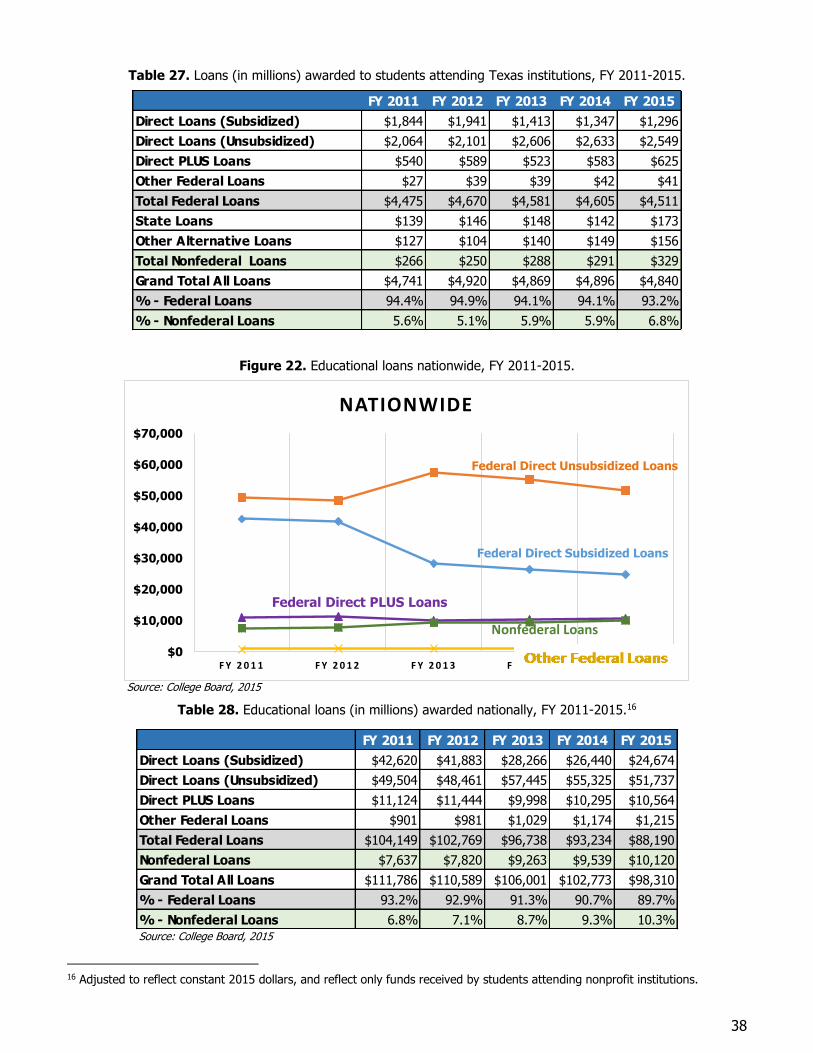
38
Table 27. Loans (in millions) awarded to students attending Texas institutions, FY 2011-2015.
Figure 22. Educational loans nationwide, FY 2011-2015.
Source: College Board, 2015
Table 28. Educational loans (in millions) awarded nationally, FY 2011-2015.16
Source: College Board, 2015
16 Adjusted to reflect constant 2015 dollars, and reflect only funds received by students attending nonprofit institutions.
FY 2011 FY 2012 FY 2013 FY 2014 FY 2015
Direct Loans (Subsidized) $1,844 $1,941 $1,413 $1,347 $1,296
Direct Loans (Unsubsidized) $2,064 $2,101 $2,606 $2,633 $2,549
Direct PLUS Loans $540 $589 $523 $583 $625
Other Federal Loans $27 $39 $39 $42 $41
Total Federal Loans $4,475 $4,670 $4,581 $4,605 $4,511
State Loans $139 $146 $148 $142 $173
Other Alternative Loans $127 $104 $140 $149 $156
Total Nonfederal Loans $266 $250 $288 $291 $329
Grand Total All Loans $4,741 $4,920 $4,869 $4,896 $4,840
% - Federal Loans 94.4% 94.9% 94.1% 94.1% 93.2%
% - Nonfederal Loans 5.6% 5.1% 5.9% 5.9% 6.8%
$0
$10,000
$20,000
$30,000
$40,000
$50,000
$60,000
$70,000
F Y 2 0 1 1 F Y 2 0 1 2 F Y 2 0 1 3 F Y 2 0 1 4 F Y 2 0 1 5
NATIONWIDE
Nonfederal Loans
Federal Direct Unsubsidized Loans
Federal Direct Subsidized Loans
Federal Direct PLUS Loans
FY 2011 FY 2012 FY 2013 FY 2014 FY 2015
Direct Loans (Subsidized) $42,620 $41,883 $28,266 $26,440 $24,674
Direct Loans (Unsubsidized) $49,504 $48,461 $57,445 $55,325 $51,737
Direct PLUS Loans $11,124 $11,444 $9,998 $10,295 $10,564
Other Federal Loans $901 $981 $1,029 $1,174 $1,215
Total Federal Loans $104,149 $102,769 $96,738 $93,234 $88,190
Nonfederal Loans $7,637 $7,820 $9,263 $9,539 $10,120
Grand Total All Loans $111,786 $110,589 $106,001 $102,773 $98,310
% - Federal Loans 93.2% 92.9% 91.3% 90.7% 89.7%
% - Nonfederal Loans 6.8% 7.1% 8.7% 9.3% 10.3%
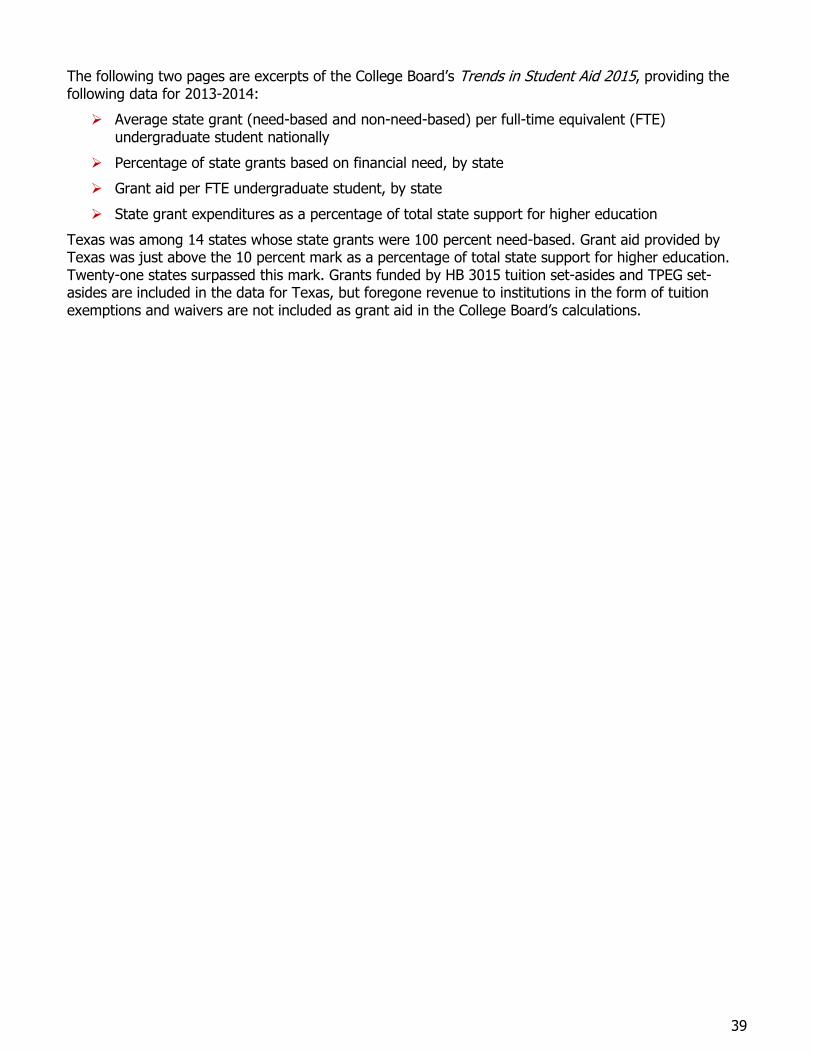
39
The following two pages are excerpts of the College Board’s Trends in Student Aid 2015, providing the following data for 2013-2014:
Average state grant (need-based and non-need-based) per full-time equivalent (FTE) undergraduate student nationally
Percentage of state grants based on financial need, by state
Grant aid per FTE undergraduate student, by state
State grant expenditures as a percentage of total state support for higher education
Texas was among 14 states whose state grants were 100 percent need-based. Grant aid provided by Texas was just above the 10 percent mark as a percentage of total state support for higher education. Twenty-one states surpassed this mark. Grants funded by HB 3015 tuition set-asides and TPEG set-asides are included in the data for Texas, but foregone revenue to institutions in the form of tuition exemptions and waivers are not included as grant aid in the College Board’s calculations.
State Grants State grant aid per full-time equivalent (FTE) student has partially recovered from its decline during the recession, rising to $710 in 2013-14 from $680 (in 2013 dollars) in 2011-12, but not yet reaching the 2007-08 peak of $740.
ljlijil;l#J:!•I Need-Based and Non-Need-Based State Grants per Full-Time Equivalent (FTE) Undergraduate Student in 2013 Dollars,
1973-74 to 2013-14
$800 $740 • Non-Need-Based $670 $680 ... • Need-Based t: c: $600 $560 -.. ..... .....
'E;;; $450 "' .. $410 $400 t; ii $400 .. :I $340 _..,
$310 s l! "'E!' .... ......
$200 I!! .. .,::::1
~ - - - - -~
; ; ; = : ; ; = ; ~ ~ ~ ii Iii -- ~ ~ Iii Iii -- -- Iii ii ~ :; 73-74 78-79 83-84 88-89 93-94 98-99 03-04 08-09
NOTE Percentages displayed represent percentages of total undergraduate state grant aid for which students' financial circumstances were considered.
FIGURE 288 Need-Based State Grant Aid as a Percentage of Total Undergraduate State Grant Aid by State, 2013-14
100% 96% 99%
:? ... .... 80% 76%
"' .. t;z s:! 60% "' .. -= "'"' 46% - .. o .-.....
40% ..... .. 0
'El ~= 20% G>Cll a.
0% "' "' "' "' "'
., 0
~ "' 'Ci "' "' "' "' ~ -.::: "' ., 0 "' "' ~
.. "' ~ ~ "" ~ "' "' "' >- "' ~ ~ 0 "' "' "' "' "' "' · ~ "' .,
"' "' 'O .E' ~ "' :;; .E ~
u 'O Q. ~ 'O "" ·c: :::>
~ :c ·c: :;; i E ,g ·;;; "' .E .,
"' 0 ~ ·c: ·c; £ .E ~ "' "' "' ~ g, :;; "' ')( "' -~
·.::: "' .§ ~ ~ 0 .§ 0 .!2 "' "' e ~ "' "' § "' 2 "' ~ 0 ] ·;;; e ., ~ ii; ::> 0 "' ~ ~ -g "' ~ 0 '5 ., ~
-~ § :s > g :;; ., :!!? ., < :::> ;: "' ~ 1; 0 .,
0 ·5 "' "' ~ z ·~ i:i: > ~ Cl > 0 "' "' i ~ -= "'
...., ., ., 0 ~ :c "' ::c "" "' < '-' "'
a; ~ < .,, :;;; .,
'-' ~ "' > -.; "' ., .,
~ .3 ,.2! ~ ~ ... "" "' Cl .~ Cl ~ z ~ "' ;:
"' '-' "' ~ '-' ~ z 'O
~ t:: ., 0 "' 0 0
., 0 c: t:: z '-' ., "' Cl) 0 z !!:: z ::> i
0 "- a: Cl) z
$710
;: 13-14
100%
"' "' "' "' >< e ,.2! 0
~
NOTES: Need-based aid includes any grants for which financial circumstances contribute to eligibility. Non-need-based aid refers to grants for which financial circumstances have no influence on el igibility. New Hampshire did not award state grant aid to undergraduate students in 2013-14.
SOURCES: National Association of State Student Grant and Aid Programs (NASSGAP) Annual Survey, 1973-74 to 2013-14, Tables 1 and 12.
- In 1981-82 and earlier years, virtually all state grant aid was
based on students' financial circumstances. From 2004-05 to
2010-11, only 71% to 73% of state grant aid was need-based. In
2013-14, that percentage was 76%.
- In 2013-14, 25 states considered students' financial circumstances
in allocating at least 95% of their state grant aid. Fifteen states
considered financial circumstances for less than half of their state
grant aid.
ALSO IMPORTANT:
-Total spending on state grant aid increased from $7.8 billion (in 2013 dollars) in 2003-04 to $9.0 billion in 2008-09, and to $9.9 billion in 2013-14. (NASSGAP Annual Survey, 2003-04, 2008-09, and 2013-14)
36 lg For detailed data behind the graphs and additional information, pl ease v isit: trends.collegeboard .org.
Carrwa
Text Box
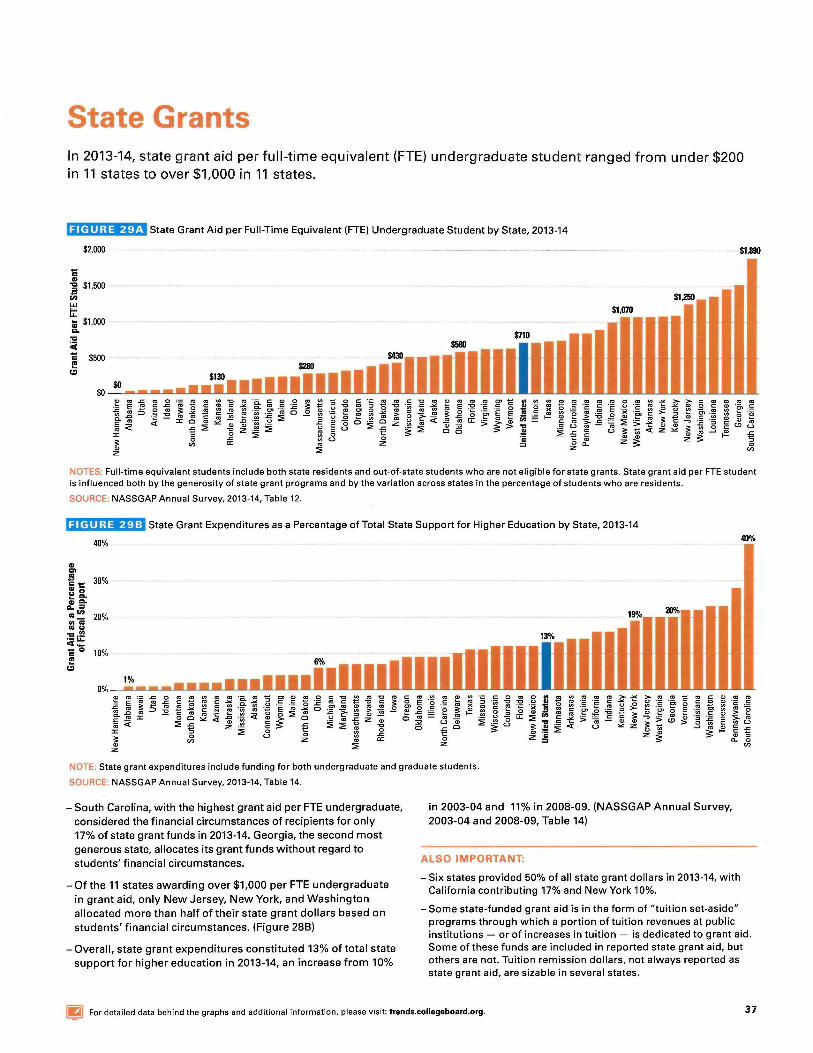
State Grants In 2013-14, state grant aid per full-time equivalent (FTE) undergraduate student ranged from under $200 in 11 states to over $1,000 in 11 states.
FIGURE 29A State Grant Aid per Full-Time Equivalent (FTE) Undergraduate Student by State, 2013-14
-c .. $2,000
] $1,500 en ... t:: :;; $1,000 ... ... ct -c f!
c::I
---- $1,890
$1,250
$1.1170
$710
$0 $0~~~~~~~~-...-...-....-.... ................................. .__.__~~~~~ ............... -.... ........... ._.._..._.._..__.__.__.___.._..__.._.._lllLJ__,__,._.._.._
"' "' -~ .~ > "' >" ~ -"-
NOTES: Full-time equivalent students include both state residents and out-of-state students who are not eligible for state grants. State grant aid per FTE student is influenced both by the generosity of state grant programs and by the variation across states in the percentage of students who are residents .
SOURCE: NASSGAP Annual Survey, 2013-14, Table 12.
1@1€111;1¥.Jii:I State Grant Expenditures as a Percentage of Total State Support for Higher Education by State, 2013-14
40% 40%
.. en J!l 30% c 1: .. c t:? g: .f~
20% 19% 20% .. _ .... .. ... "Cl.!!! 13% ·-u.. <--= 10% c f!
c::I
0% e E ·;;; ~ ~ "' "' "' "' ~ :~~ "
C> " "' 0 " ] ~ ~ "' ~ " E "' "' " "' ·;:: " 0 "' 2 .. ~ "' "' "' "' ~ -" ~ "' "' " "' " " "' "' " ~ "' " " " 'O :c "' " 0 ·5 .E "' " ·;;; 'E "' ii "' ·;: ·e !ii ,g ·;: ·e " ~ ~ ·~ ~ ~ "' ~ 5 ~ "' ~ " .E
~ -;:; 0 .2' ~ "' "' ~ g 0 .E ~ ><
~ " '§ ... "' " ~ 0 "' !ii "' ~ ~ i ~ ~ ~ ~ " '§ " ·e 0 E c. -g ~ .g 0 .<= ~ " 0 ~
0 0 " "' " "' ~ :g E ;: " ·;;;
" Q) .2 e E :i:: 0 0 "" ·~ <t ~
Cl " ~ ] z " ~ ~ 0 u:: ::;; " -" > -.. > Q) Q) ·:; :c " >"'
<( ::;; .<= .<= ~ :;;; '-' a; '-' "Cl " .::c -;;; Q) " ~ "' > .:: "' " "''-'
"' z ~ t:: "' Cl .<= Cl :!: ;: .~ ~ '-' "" z
~ ~ " .<= :i:: " 0 0 Q) ~ " 0 '-' 0 .<= t:: " z Q) " ;:
"' z ~
a: 0 z = "- 0
" z "' z
NOTE: State grant expenditures include funding for both undergraduate and graduate students.
SOURCE: NASSGAP Annual Survey, 2013-14, Table 14.
- South Carolina, with the highest grant aid per FTE undergraduate, considered the financial circumstances of recipients for only 17% of state grant funds in 2013-14. Georgia, the second most generous state, allocates its grant funds without regard to students' financial circumstances.
- Of the 11 states awarding over $1,000 per FTE undergraduate in grant aid, only New Jersey, New York, and Washington allocated more than half of their state grant dollars based on students' financial circumstances. (Figure 288)
-Overall, state grant expenditures constituted 13% of total state support for higher education in 2013-14, an increase from 10%
in 2003-04 and 11% in 2008-09. (NASSGAP Annual Survey, 2003-04 and 2008-09, Table 14)
ALSO IMPORTANT:
-Six states provided 50% of all state grant dollars in 2013-14, with California contributing 17% and New York 10%.
- Some state-funded grant aid is in the form of "tuition set-aside" programs through which a portion of tuition revenues at public institutions - or of increases in tuition - is dedicated to grant aid. Some of these funds are included in reported state grant aid, but others are not. Tuition remission dollars, not always reported as state grant aid, are sizable in several states.
lg For detailed data behind the graphs and additional information, please visit: trends.collegeboard.org. 37
Carrwa
Text Box
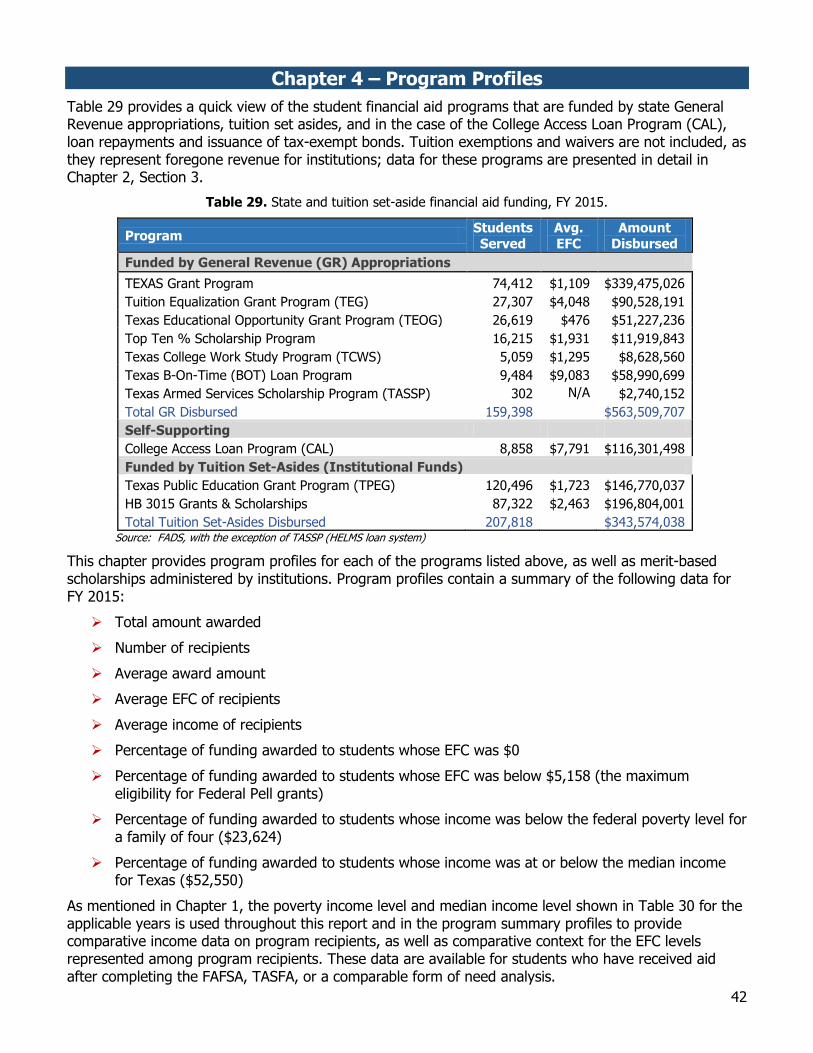
42
Chapter 4 – Program Profiles
Table 29 provides a quick view of the student financial aid programs that are funded by state General Revenue appropriations, tuition set asides, and in the case of the College Access Loan Program (CAL), loan repayments and issuance of tax-exempt bonds. Tuition exemptions and waivers are not included, as they represent foregone revenue for institutions; data for these programs are presented in detail in Chapter 2, Section 3.
Table 29. State and tuition set-aside financial aid funding, FY 2015.
Program Students Served
Avg. EFC
Amount Disbursed
Funded by General Revenue (GR) Appropriations
TEXAS Grant Program 74,412 $1,109 $339,475,026
Tuition Equalization Grant Program (TEG) 27,307 $4,048 $90,528,191
Texas Educational Opportunity Grant Program (TEOG) 26,619 $476 $51,227,236
Top Ten % Scholarship Program 16,215 $1,931 $11,919,843
Texas College Work Study Program (TCWS) 5,059 $1,295 $8,628,560
Texas B-On-Time (BOT) Loan Program 9,484 $9,083 $58,990,699
Texas Armed Services Scholarship Program (TASSP) 302 N/A $2,740,152
Total GR Disbursed 159,398 $563,509,707
Self-Supporting
College Access Loan Program (CAL) 8,858 $7,791 $116,301,498
Funded by Tuition Set-Asides (Institutional Funds)
Texas Public Education Grant Program (TPEG) 120,496 $1,723 $146,770,037
HB 3015 Grants & Scholarships 87,322 $2,463 $196,804,001
Total Tuition Set-Asides Disbursed 207,818 $343,574,038 Source: FADS, with the exception of TASSP (HELMS loan system)
This chapter provides program profiles for each of the programs listed above, as well as merit-based scholarships administered by institutions. Program profiles contain a summary of the following data for FY 2015:
Total amount awarded
Number of recipients
Average award amount
Average EFC of recipients
Average income of recipients
Percentage of funding awarded to students whose EFC was $0
Percentage of funding awarded to students whose EFC was below $5,158 (the maximum eligibility for Federal Pell grants)
Percentage of funding awarded to students whose income was below the federal poverty level for a family of four ($23,624)
Percentage of funding awarded to students whose income was at or below the median income for Texas ($52,550)
As mentioned in Chapter 1, the poverty income level and median income level shown in Table 30 for the applicable years is used throughout this report and in the program summary profiles to provide comparative income data on program recipients, as well as comparative context for the EFC levels represented among program recipients. These data are available for students who have received aid after completing the FAFSA, TASFA, or a comparable form of need analysis.
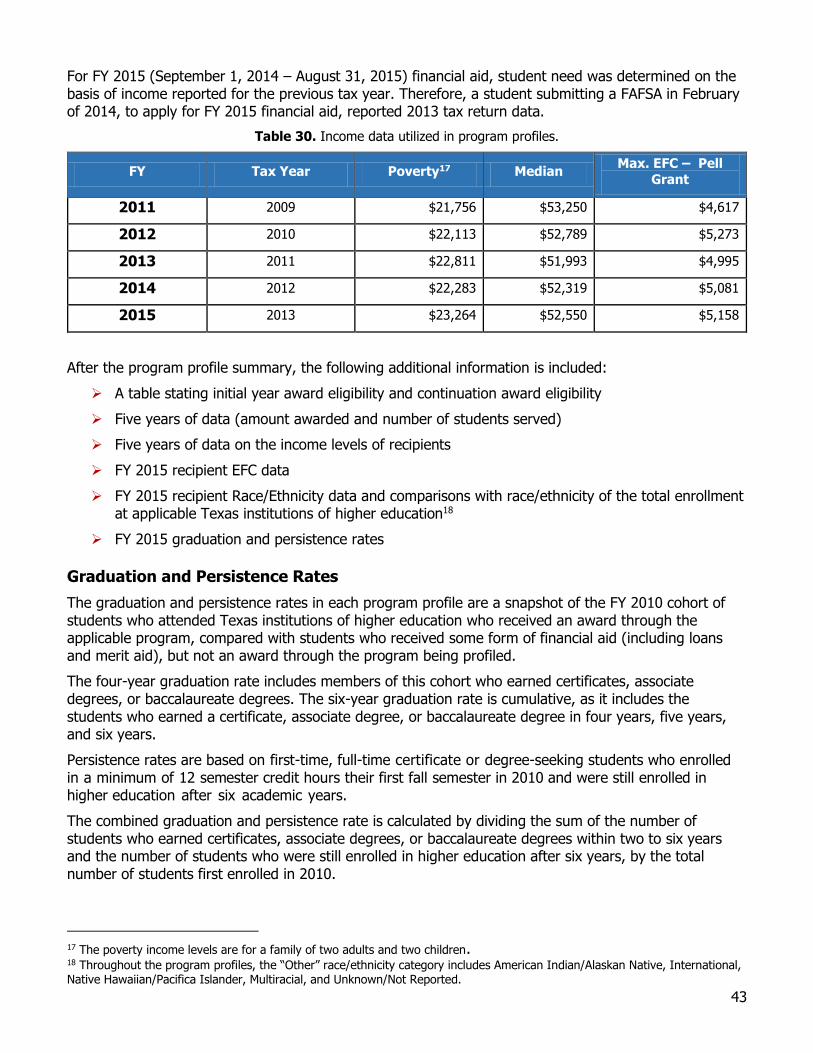
43
For FY 2015 (September 1, 2014 – August 31, 2015) financial aid, student need was determined on the basis of income reported for the previous tax year. Therefore, a student submitting a FAFSA in February of 2014, to apply for FY 2015 financial aid, reported 2013 tax return data.
Table 30. Income data utilized in program profiles.
FY Tax Year Poverty17 Median Max. EFC – Pell
Grant
2011 2009 $21,756 $53,250 $4,617
2012 2010 $22,113 $52,789 $5,273
2013 2011 $22,811 $51,993 $4,995
2014 2012 $22,283 $52,319 $5,081
2015 2013 $23,264 $52,550 $5,158
After the program profile summary, the following additional information is included:
A table stating initial year award eligibility and continuation award eligibility
Five years of data (amount awarded and number of students served)
Five years of data on the income levels of recipients
FY 2015 recipient EFC data
FY 2015 recipient Race/Ethnicity data and comparisons with race/ethnicity of the total enrollment at applicable Texas institutions of higher education18
FY 2015 graduation and persistence rates
Graduation and Persistence Rates
The graduation and persistence rates in each program profile are a snapshot of the FY 2010 cohort of students who attended Texas institutions of higher education who received an award through the applicable program, compared with students who received some form of financial aid (including loans and merit aid), but not an award through the program being profiled.
The four-year graduation rate includes members of this cohort who earned certificates, associate degrees, or baccalaureate degrees. The six-year graduation rate is cumulative, as it includes the students who earned a certificate, associate degree, or baccalaureate degree in four years, five years, and six years.
Persistence rates are based on first-time, full-time certificate or degree-seeking students who enrolled in a minimum of 12 semester credit hours their first fall semester in 2010 and were still enrolled in higher education after six academic years.
The combined graduation and persistence rate is calculated by dividing the sum of the number of students who earned certificates, associate degrees, or baccalaureate degrees within two to six years and the number of students who were still enrolled in higher education after six years, by the total number of students first enrolled in 2010.
17 The poverty income levels are for a family of two adults and two children. 18 Throughout the program profiles, the “Other” race/ethnicity category includes American Indian/Alaskan Native, International, Native Hawaiian/Pacifica Islander, Multiracial, and Unknown/Not Reported.
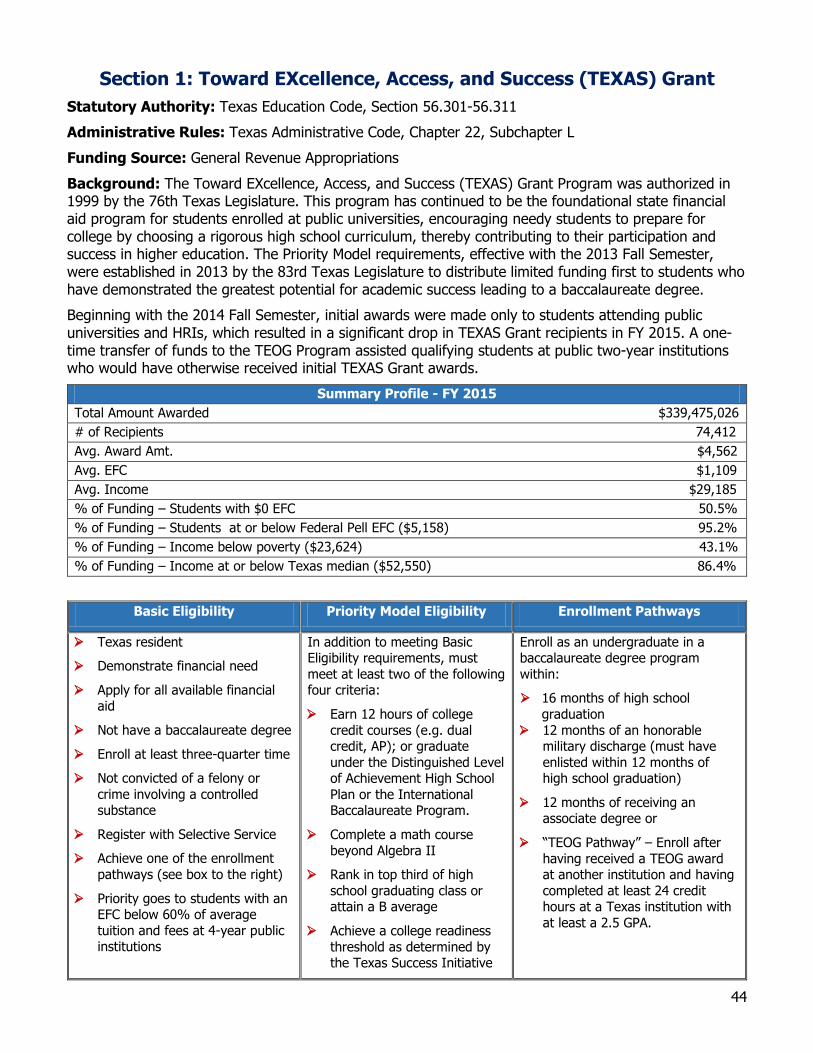
44
Section 1: Toward EXcellence, Access, and Success (TEXAS) Grant
Statutory Authority: Texas Education Code, Section 56.301-56.311
Administrative Rules: Texas Administrative Code, Chapter 22, Subchapter L
Funding Source: General Revenue Appropriations
Background: The Toward EXcellence, Access, and Success (TEXAS) Grant Program was authorized in 1999 by the 76th Texas Legislature. This program has continued to be the foundational state financial aid program for students enrolled at public universities, encouraging needy students to prepare for college by choosing a rigorous high school curriculum, thereby contributing to their participation and success in higher education. The Priority Model requirements, effective with the 2013 Fall Semester, were established in 2013 by the 83rd Texas Legislature to distribute limited funding first to students who have demonstrated the greatest potential for academic success leading to a baccalaureate degree.
Beginning with the 2014 Fall Semester, initial awards were made only to students attending public universities and HRIs, which resulted in a significant drop in TEXAS Grant recipients in FY 2015. A one-time transfer of funds to the TEOG Program assisted qualifying students at public two-year institutions who would have otherwise received initial TEXAS Grant awards.
Summary Profile - FY 2015
Total Amount Awarded $339,475,026
# of Recipients 74,412
Avg. Award Amt. $4,562
Avg. EFC $1,109
Avg. Income $29,185
% of Funding – Students with $0 EFC 50.5%
% of Funding – Students at or below Federal Pell EFC ($5,158) 95.2%
% of Funding – Income below poverty ($23,624) 43.1%
% of Funding – Income at or below Texas median ($52,550) 86.4%
Basic Eligibility Priority Model Eligibility Enrollment Pathways
Texas resident
Demonstrate financial need
Apply for all available financial aid
Not have a baccalaureate degree
Enroll at least three-quarter time
Not convicted of a felony or
crime involving a controlled substance
Register with Selective Service
Achieve one of the enrollment
pathways (see box to the right)
Priority goes to students with an EFC below 60% of average
tuition and fees at 4-year public institutions
In addition to meeting Basic Eligibility requirements, must
meet at least two of the following four criteria:
Earn 12 hours of college
credit courses (e.g. dual credit, AP); or graduate
under the Distinguished Level of Achievement High School
Plan or the International Baccalaureate Program.
Complete a math course
beyond Algebra II
Rank in top third of high
school graduating class or attain a B average
Achieve a college readiness
threshold as determined by the Texas Success Initiative
Enroll as an undergraduate in a baccalaureate degree program
within:
16 months of high school
graduation
12 months of an honorable military discharge (must have
enlisted within 12 months of high school graduation)
12 months of receiving an associate degree or
“TEOG Pathway” – Enroll after
having received a TEOG award at another institution and having
completed at least 24 credit hours at a Texas institution with
at least a 2.5 GPA.
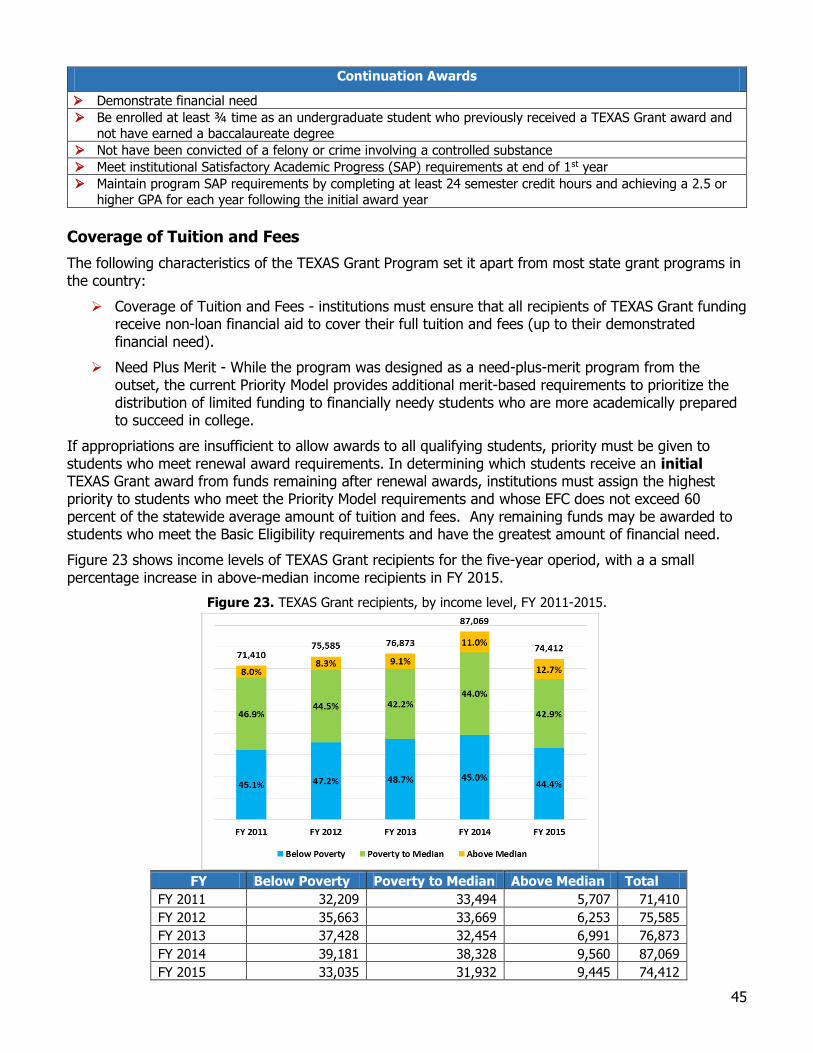
45
Continuation Awards
Demonstrate financial need
Be enrolled at least ¾ time as an undergraduate student who previously received a TEXAS Grant award and not have earned a baccalaureate degree
Not have been convicted of a felony or crime involving a controlled substance
Meet institutional Satisfactory Academic Progress (SAP) requirements at end of 1st year
Maintain program SAP requirements by completing at least 24 semester credit hours and achieving a 2.5 or higher GPA for each year following the initial award year
Coverage of Tuition and Fees
The following characteristics of the TEXAS Grant Program set it apart from most state grant programs in the country:
Coverage of Tuition and Fees - institutions must ensure that all recipients of TEXAS Grant funding receive non-loan financial aid to cover their full tuition and fees (up to their demonstrated financial need).
Need Plus Merit - While the program was designed as a need-plus-merit program from the outset, the current Priority Model provides additional merit-based requirements to prioritize the distribution of limited funding to financially needy students who are more academically prepared to succeed in college.
If appropriations are insufficient to allow awards to all qualifying students, priority must be given to students who meet renewal award requirements. In determining which students receive an initial TEXAS Grant award from funds remaining after renewal awards, institutions must assign the highest priority to students who meet the Priority Model requirements and whose EFC does not exceed 60 percent of the statewide average amount of tuition and fees. Any remaining funds may be awarded to students who meet the Basic Eligibility requirements and have the greatest amount of financial need.
Figure 23 shows income levels of TEXAS Grant recipients for the five-year operiod, with a a small percentage increase in above-median income recipients in FY 2015.
Figure 23. TEXAS Grant recipients, by income level, FY 2011-2015.
FY Below Poverty Poverty to Median Above Median Total
FY 2011 32,209 33,494 5,707 71,410
FY 2012 35,663 33,669 6,253 75,585
FY 2013 37,428 32,454 6,991 76,873
FY 2014 39,181 38,328 9,560 87,069
FY 2015 33,035 31,932 9,445 74,412
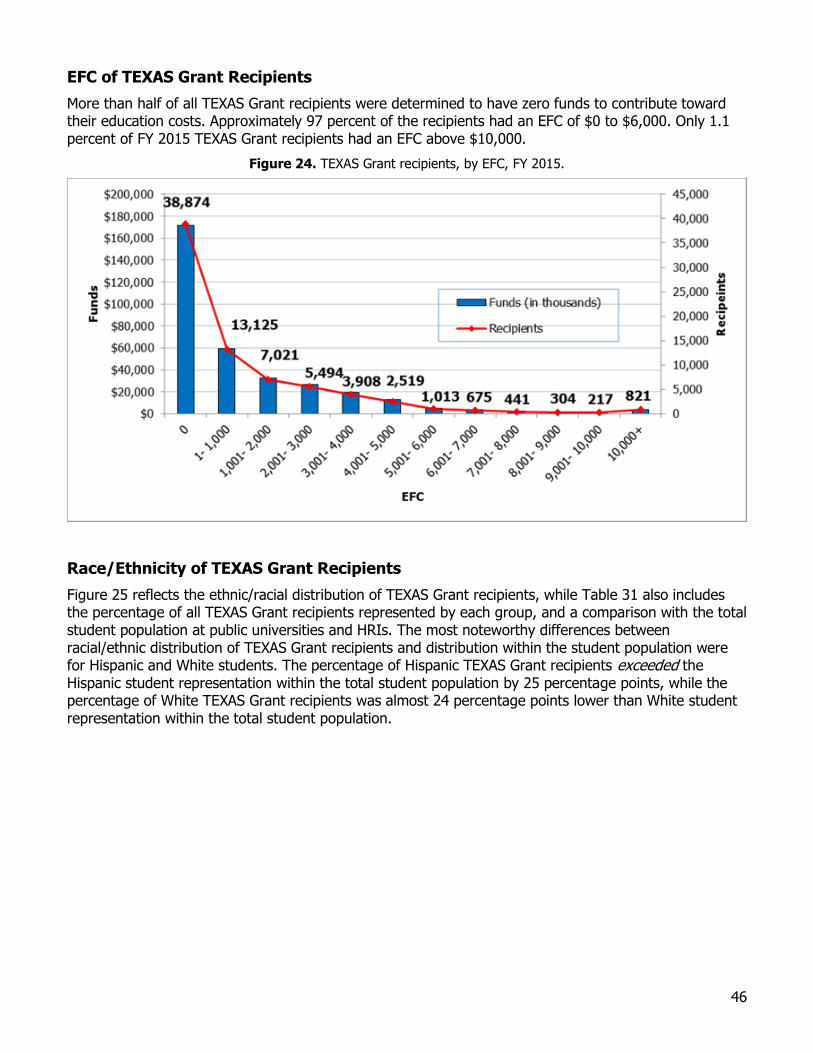
46
EFC of TEXAS Grant Recipients
More than half of all TEXAS Grant recipients were determined to have zero funds to contribute toward their education costs. Approximately 97 percent of the recipients had an EFC of $0 to $6,000. Only 1.1 percent of FY 2015 TEXAS Grant recipients had an EFC above $10,000.
Figure 24. TEXAS Grant recipients, by EFC, FY 2015.
Race/Ethnicity of TEXAS Grant Recipients
Figure 25 reflects the ethnic/racial distribution of TEXAS Grant recipients, while Table 31 also includes the percentage of all TEXAS Grant recipients represented by each group, and a comparison with the total student population at public universities and HRIs. The most noteworthy differences between racial/ethnic distribution of TEXAS Grant recipients and distribution within the student population were for Hispanic and White students. The percentage of Hispanic TEXAS Grant recipients exceeded the Hispanic student representation within the total student population by 25 percentage points, while the percentage of White TEXAS Grant recipients was almost 24 percentage points lower than White student representation within the total student population.
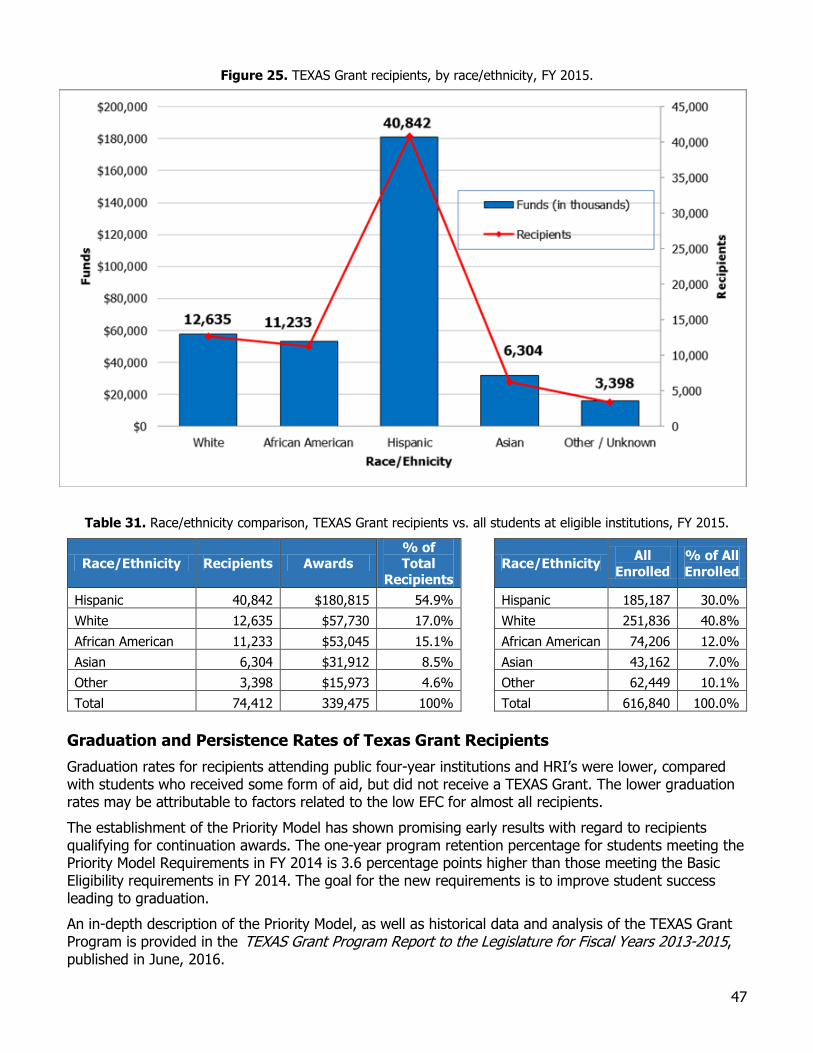
47
Figure 25. TEXAS Grant recipients, by race/ethnicity, FY 2015.
Table 31. Race/ethnicity comparison, TEXAS Grant recipients vs. all students at eligible institutions, FY 2015.
Race/Ethnicity Recipients Awards % of Total
Recipients Race/Ethnicity
All
Enrolled
% of All
Enrolled
Hispanic 40,842 $180,815 54.9% Hispanic 185,187 30.0%
White 12,635 $57,730 17.0% White 251,836 40.8%
African American 11,233 $53,045 15.1% African American 74,206 12.0%
Asian 6,304 $31,912 8.5% Asian 43,162 7.0%
Other 3,398 $15,973 4.6% Other 62,449 10.1%
Total 74,412 339,475 100% Total 616,840 100.0%
Graduation and Persistence Rates of Texas Grant Recipients
Graduation rates for recipients attending public four-year institutions and HRI’s were lower, compared with students who received some form of aid, but did not receive a TEXAS Grant. The lower graduation rates may be attributable to factors related to the low EFC for almost all recipients.
The establishment of the Priority Model has shown promising early results with regard to recipients qualifying for continuation awards. The one-year program retention percentage for students meeting the Priority Model Requirements in FY 2014 is 3.6 percentage points higher than those meeting the Basic Eligibility requirements in FY 2014. The goal for the new requirements is to improve student success leading to graduation.
An in-depth description of the Priority Model, as well as historical data and analysis of the TEXAS Grant Program is provided in the TEXAS Grant Program Report to the Legislature for Fiscal Years 2013-2015, published in June, 2016.
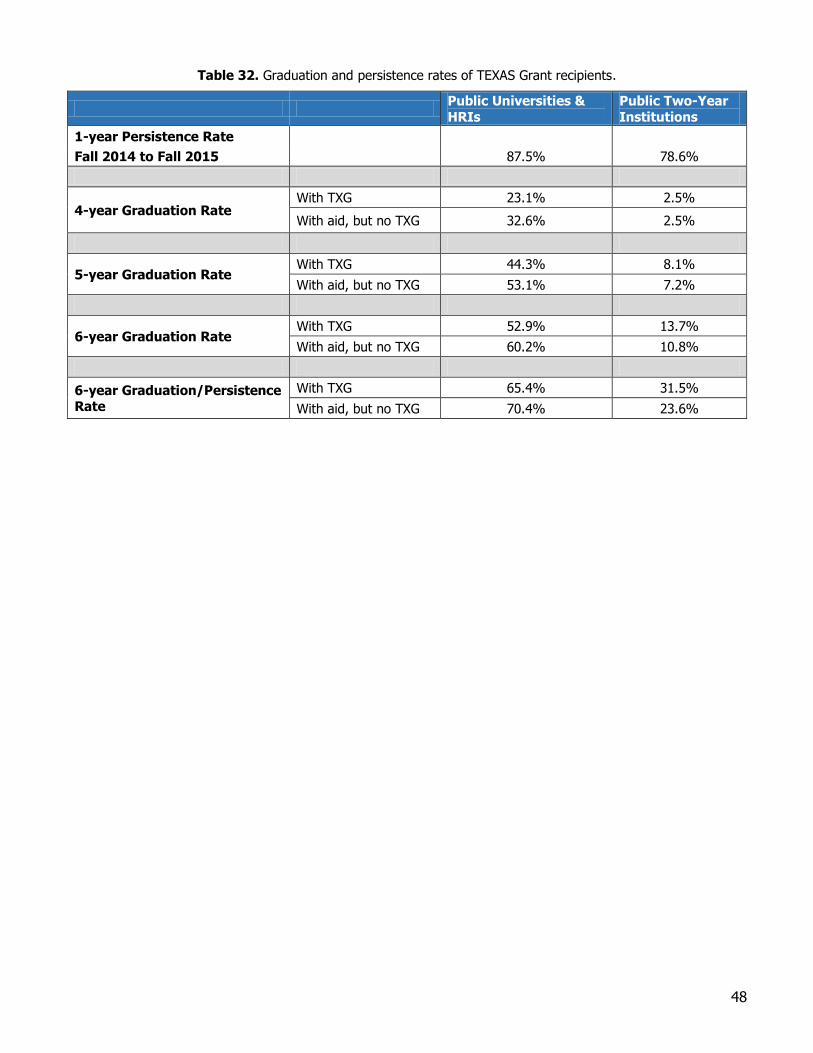
48
Table 32. Graduation and persistence rates of TEXAS Grant recipients.
Public Universities &
HRIs
Public Two-Year
Institutions
1-year Persistence Rate
Fall 2014 to Fall 2015 87.5% 78.6%
4-year Graduation Rate With TXG 23.1% 2.5%
With aid, but no TXG 32.6% 2.5%
5-year Graduation Rate With TXG 44.3% 8.1%
With aid, but no TXG 53.1% 7.2%
6-year Graduation Rate With TXG 52.9% 13.7%
With aid, but no TXG 60.2% 10.8%
6-year Graduation/Persistence Rate
With TXG 65.4% 31.5%
With aid, but no TXG 70.4% 23.6%
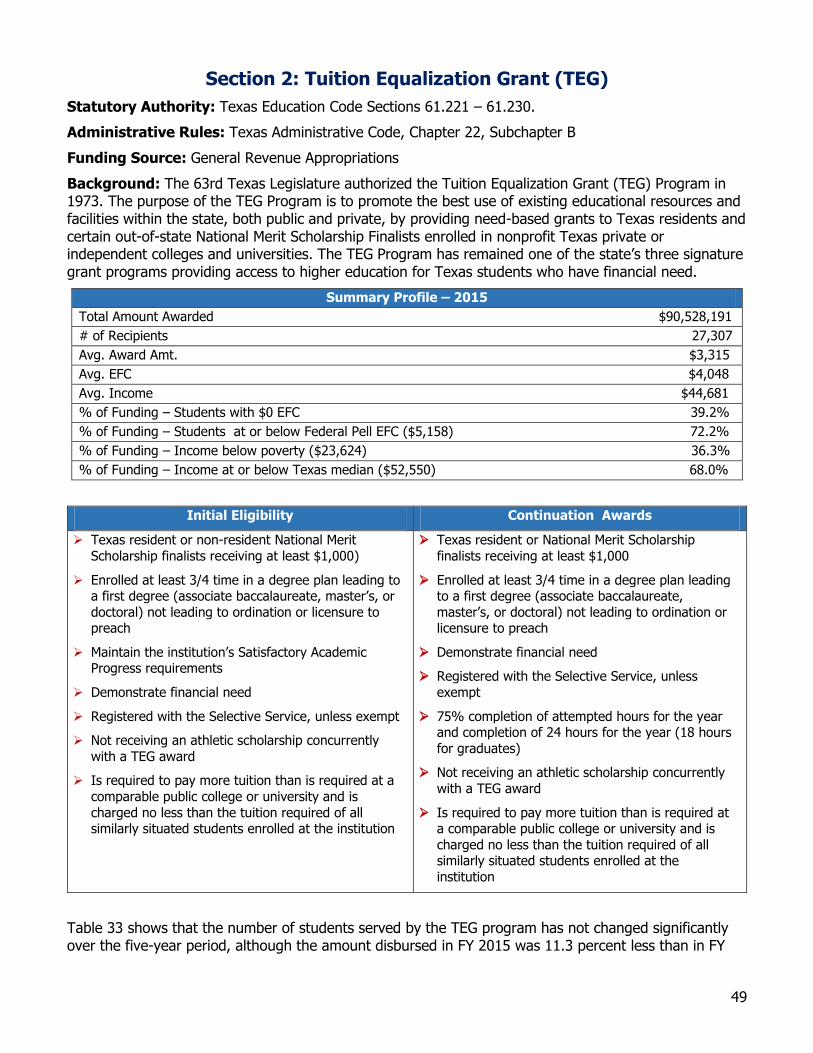
49
Section 2: Tuition Equalization Grant (TEG)
Statutory Authority: Texas Education Code Sections 61.221 – 61.230.
Administrative Rules: Texas Administrative Code, Chapter 22, Subchapter B
Funding Source: General Revenue Appropriations
Background: The 63rd Texas Legislature authorized the Tuition Equalization Grant (TEG) Program in 1973. The purpose of the TEG Program is to promote the best use of existing educational resources and facilities within the state, both public and private, by providing need-based grants to Texas residents and certain out-of-state National Merit Scholarship Finalists enrolled in nonprofit Texas private or independent colleges and universities. The TEG Program has remained one of the state’s three signature grant programs providing access to higher education for Texas students who have financial need.
Summary Profile – 2015
Total Amount Awarded $90,528,191
# of Recipients 27,307
Avg. Award Amt. $3,315
Avg. EFC $4,048
Avg. Income $44,681
% of Funding – Students with $0 EFC 39.2%
% of Funding – Students at or below Federal Pell EFC ($5,158) 72.2%
% of Funding – Income below poverty ($23,624) 36.3%
% of Funding – Income at or below Texas median ($52,550) 68.0%
Initial Eligibility Continuation Awards
Texas resident or non-resident National Merit
Scholarship finalists receiving at least $1,000)
Enrolled at least 3/4 time in a degree plan leading to a first degree (associate baccalaureate, master’s, or
doctoral) not leading to ordination or licensure to preach
Maintain the institution’s Satisfactory Academic Progress requirements
Demonstrate financial need
Registered with the Selective Service, unless exempt
Not receiving an athletic scholarship concurrently
with a TEG award
Is required to pay more tuition than is required at a
comparable public college or university and is
charged no less than the tuition required of all similarly situated students enrolled at the institution
Texas resident or National Merit Scholarship
finalists receiving at least $1,000
Enrolled at least 3/4 time in a degree plan leading to a first degree (associate baccalaureate,
master’s, or doctoral) not leading to ordination or licensure to preach
Demonstrate financial need
Registered with the Selective Service, unless
exempt
75% completion of attempted hours for the year and completion of 24 hours for the year (18 hours
for graduates)
Not receiving an athletic scholarship concurrently
with a TEG award
Is required to pay more tuition than is required at a comparable public college or university and is
charged no less than the tuition required of all similarly situated students enrolled at the
institution
Table 33 shows that the number of students served by the TEG program has not changed significantly over the five-year period, although the amount disbursed in FY 2015 was 11.3 percent less than in FY
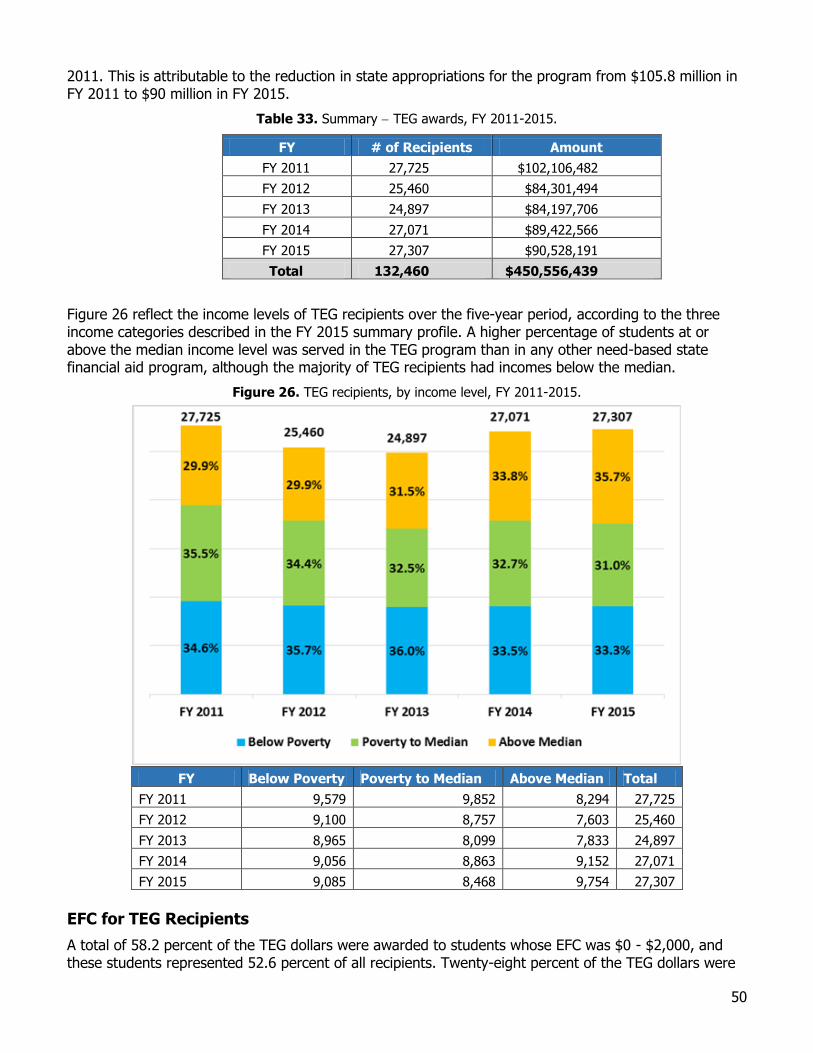
50
2011. This is attributable to the reduction in state appropriations for the program from $105.8 million in FY 2011 to $90 million in FY 2015.
Table 33. Summary TEG awards, FY 2011-2015.
FY # of Recipients Amount
FY 2011 27,725 $102,106,482
FY 2012 25,460 $84,301,494
FY 2013 24,897 $84,197,706
FY 2014 27,071 $89,422,566
FY 2015 27,307 $90,528,191
Total 132,460 $450,556,439
Figure 26 reflect the income levels of TEG recipients over the five-year period, according to the three income categories described in the FY 2015 summary profile. A higher percentage of students at or above the median income level was served in the TEG program than in any other need-based state financial aid program, although the majority of TEG recipients had incomes below the median.
Figure 26. TEG recipients, by income level, FY 2011-2015.
FY Below Poverty Poverty to Median Above Median Total
FY 2011 9,579 9,852 8,294 27,725
FY 2012 9,100 8,757 7,603 25,460
FY 2013 8,965 8,099 7,833 24,897
FY 2014 9,056 8,863 9,152 27,071
FY 2015 9,085 8,468 9,754 27,307
EFC for TEG Recipients
A total of 58.2 percent of the TEG dollars were awarded to students whose EFC was $0 - $2,000, and these students represented 52.6 percent of all recipients. Twenty-eight percent of the TEG dollars were
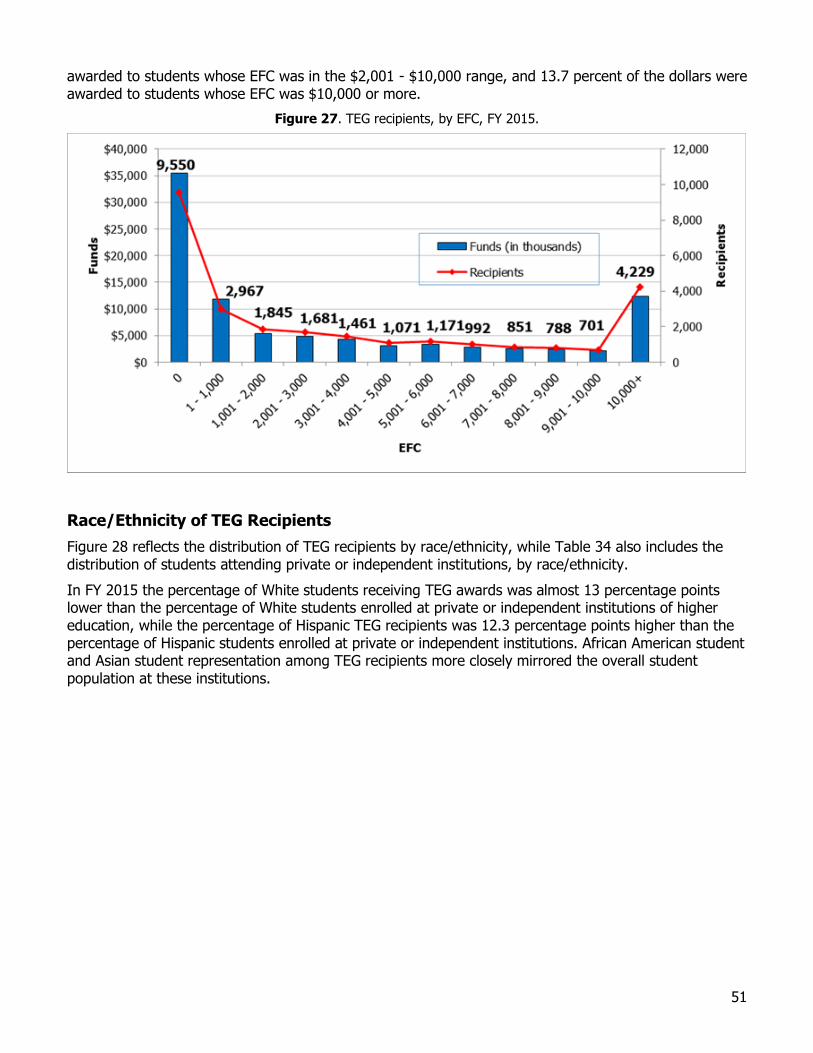
51
awarded to students whose EFC was in the $2,001 - $10,000 range, and 13.7 percent of the dollars were awarded to students whose EFC was $10,000 or more.
Figure 27. TEG recipients, by EFC, FY 2015.
Race/Ethnicity of TEG Recipients
Figure 28 reflects the distribution of TEG recipients by race/ethnicity, while Table 34 also includes the distribution of students attending private or independent institutions, by race/ethnicity.
In FY 2015 the percentage of White students receiving TEG awards was almost 13 percentage points lower than the percentage of White students enrolled at private or independent institutions of higher education, while the percentage of Hispanic TEG recipients was 12.3 percentage points higher than the percentage of Hispanic students enrolled at private or independent institutions. African American student and Asian student representation among TEG recipients more closely mirrored the overall student population at these institutions.
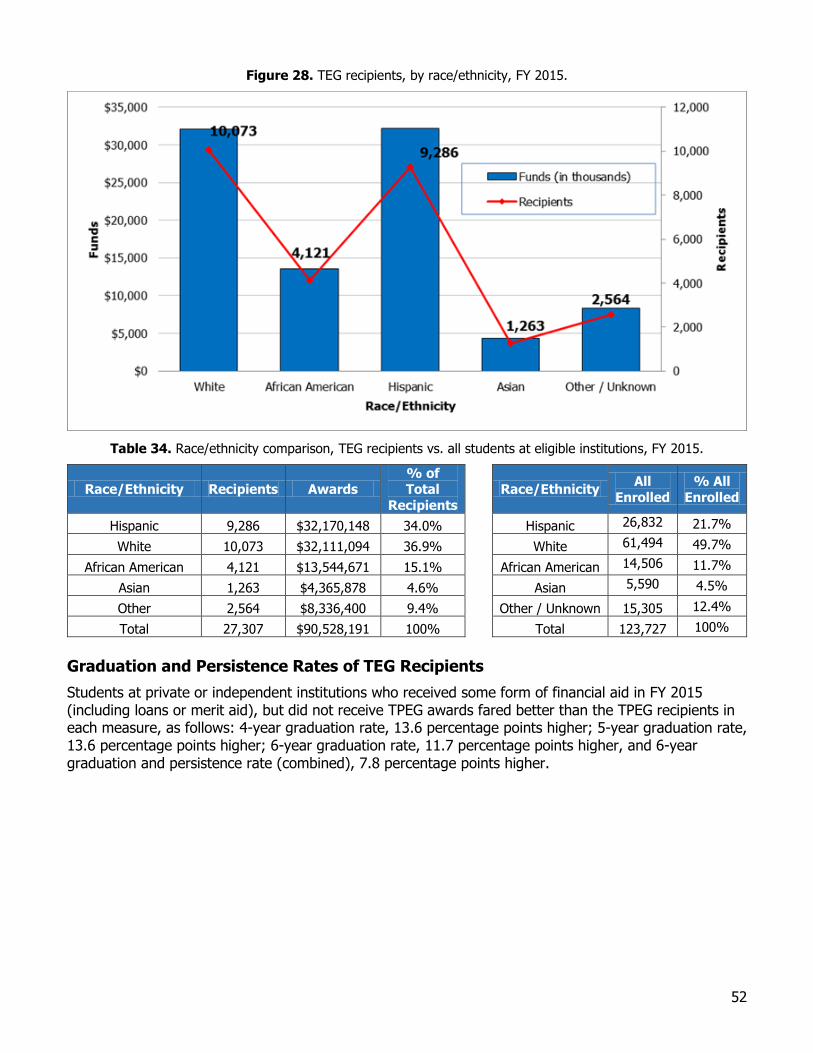
52
Figure 28. TEG recipients, by race/ethnicity, FY 2015.
Table 34. Race/ethnicity comparison, TEG recipients vs. all students at eligible institutions, FY 2015.
Race/Ethnicity Recipients Awards % of Total
Recipients
Race/Ethnicity All
Enrolled
% All
Enrolled
Hispanic 9,286 $32,170,148 34.0% Hispanic 26,832 21.7%
White 10,073 $32,111,094 36.9% White 61,494 49.7%
African American 4,121 $13,544,671 15.1% African American 14,506 11.7%
Asian 1,263 $4,365,878 4.6% Asian 5,590 4.5%
Other 2,564 $8,336,400 9.4% Other / Unknown 15,305 12.4%
Total 27,307 $90,528,191 100% Total 123,727 100%
Graduation and Persistence Rates of TEG Recipients
Students at private or independent institutions who received some form of financial aid in FY 2015 (including loans or merit aid), but did not receive TPEG awards fared better than the TPEG recipients in each measure, as follows: 4-year graduation rate, 13.6 percentage points higher; 5-year graduation rate, 13.6 percentage points higher; 6-year graduation rate, 11.7 percentage points higher, and 6-year graduation and persistence rate (combined), 7.8 percentage points higher.
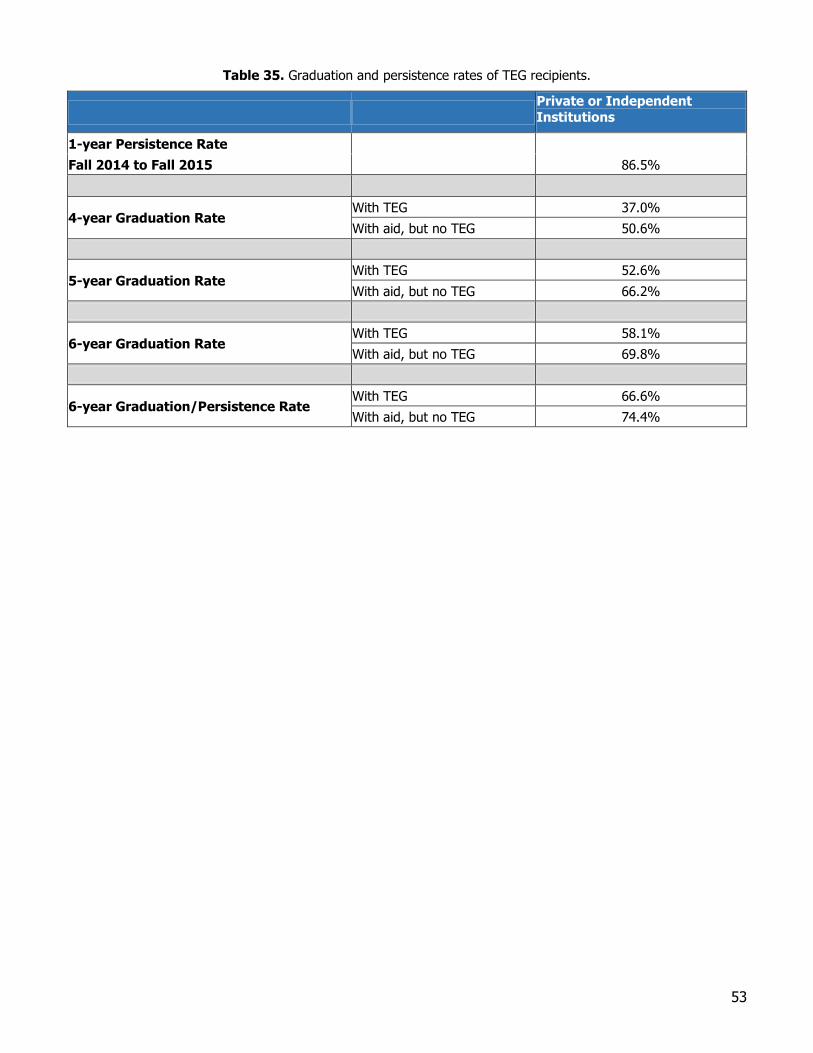
53
Table 35. Graduation and persistence rates of TEG recipients.
Private or Independent
Institutions
1-year Persistence Rate
Fall 2014 to Fall 2015 86.5%
4-year Graduation Rate With TEG 37.0%
With aid, but no TEG 50.6%
5-year Graduation Rate With TEG 52.6%
With aid, but no TEG 66.2%
6-year Graduation Rate With TEG 58.1%
With aid, but no TEG 69.8%
6-year Graduation/Persistence Rate With TEG 66.6%
With aid, but no TEG 74.4%
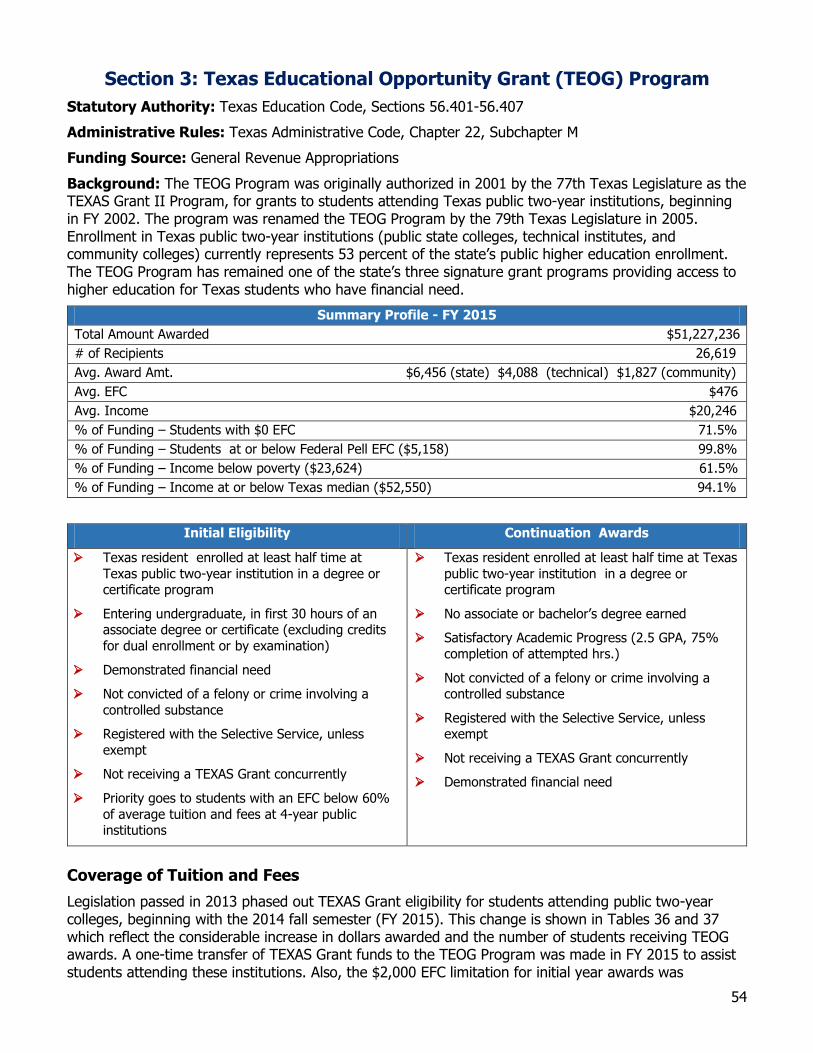
54
Section 3: Texas Educational Opportunity Grant (TEOG) Program
Statutory Authority: Texas Education Code, Sections 56.401-56.407
Administrative Rules: Texas Administrative Code, Chapter 22, Subchapter M
Funding Source: General Revenue Appropriations
Background: The TEOG Program was originally authorized in 2001 by the 77th Texas Legislature as the TEXAS Grant II Program, for grants to students attending Texas public two-year institutions, beginning in FY 2002. The program was renamed the TEOG Program by the 79th Texas Legislature in 2005. Enrollment in Texas public two-year institutions (public state colleges, technical institutes, and community colleges) currently represents 53 percent of the state’s public higher education enrollment. The TEOG Program has remained one of the state’s three signature grant programs providing access to higher education for Texas students who have financial need.
Summary Profile - FY 2015
Total Amount Awarded $51,227,236
# of Recipients 26,619
Avg. Award Amt. $6,456 (state) $4,088 (technical) $1,827 (community)
Avg. EFC $476
Avg. Income $20,246
% of Funding – Students with $0 EFC 71.5%
% of Funding – Students at or below Federal Pell EFC ($5,158) 99.8%
% of Funding – Income below poverty ($23,624) 61.5%
% of Funding – Income at or below Texas median ($52,550) 94.1%
Initial Eligibility Continuation Awards
Texas resident enrolled at least half time at
Texas public two-year institution in a degree or certificate program
Entering undergraduate, in first 30 hours of an associate degree or certificate (excluding credits
for dual enrollment or by examination)
Demonstrated financial need
Not convicted of a felony or crime involving a
controlled substance
Registered with the Selective Service, unless
exempt
Not receiving a TEXAS Grant concurrently
Priority goes to students with an EFC below 60%
of average tuition and fees at 4-year public institutions
Texas resident enrolled at least half time at Texas
public two-year institution in a degree or certificate program
No associate or bachelor’s degree earned
Satisfactory Academic Progress (2.5 GPA, 75%
completion of attempted hrs.)
Not convicted of a felony or crime involving a controlled substance
Registered with the Selective Service, unless exempt
Not receiving a TEXAS Grant concurrently
Demonstrated financial need
Coverage of Tuition and Fees
Legislation passed in 2013 phased out TEXAS Grant eligibility for students attending public two-year colleges, beginning with the 2014 fall semester (FY 2015). This change is shown in Tables 36 and 37 which reflect the considerable increase in dollars awarded and the number of students receiving TEOG awards. A one-time transfer of TEXAS Grant funds to the TEOG Program was made in FY 2015 to assist students attending these institutions. Also, the $2,000 EFC limitation for initial year awards was
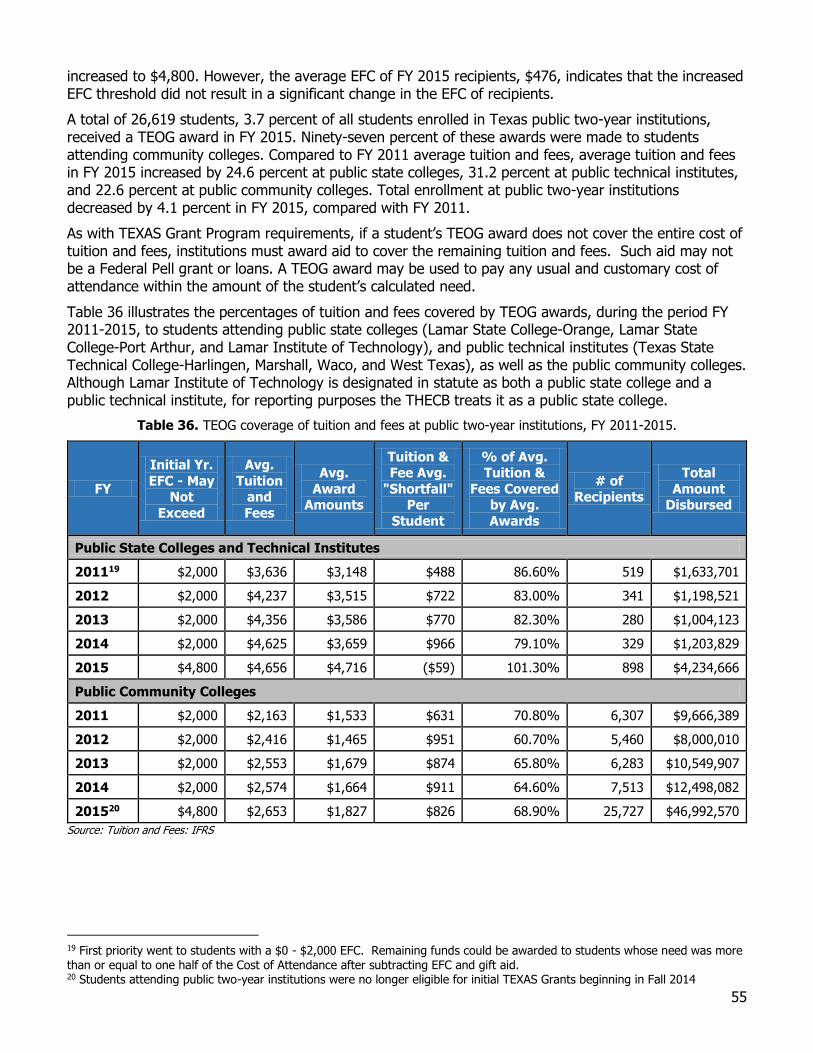
55
increased to $4,800. However, the average EFC of FY 2015 recipients, $476, indicates that the increased EFC threshold did not result in a significant change in the EFC of recipients.
A total of 26,619 students, 3.7 percent of all students enrolled in Texas public two-year institutions, received a TEOG award in FY 2015. Ninety-seven percent of these awards were made to students attending community colleges. Compared to FY 2011 average tuition and fees, average tuition and fees in FY 2015 increased by 24.6 percent at public state colleges, 31.2 percent at public technical institutes, and 22.6 percent at public community colleges. Total enrollment at public two-year institutions decreased by 4.1 percent in FY 2015, compared with FY 2011.
As with TEXAS Grant Program requirements, if a student’s TEOG award does not cover the entire cost of tuition and fees, institutions must award aid to cover the remaining tuition and fees. Such aid may not be a Federal Pell grant or loans. A TEOG award may be used to pay any usual and customary cost of attendance within the amount of the student’s calculated need.
Table 36 illustrates the percentages of tuition and fees covered by TEOG awards, during the period FY 2011-2015, to students attending public state colleges (Lamar State College-Orange, Lamar State College-Port Arthur, and Lamar Institute of Technology), and public technical institutes (Texas State Technical College-Harlingen, Marshall, Waco, and West Texas), as well as the public community colleges. Although Lamar Institute of Technology is designated in statute as both a public state college and a public technical institute, for reporting purposes the THECB treats it as a public state college.
Table 36. TEOG coverage of tuition and fees at public two-year institutions, FY 2011-2015.
FY
Initial Yr.
EFC - May Not
Exceed
Avg.
Tuition and
Fees
Avg.
Award Amounts
Tuition & Fee Avg.
"Shortfall" Per
Student
% of Avg. Tuition &
Fees Covered by Avg.
Awards
# of Recipients
Total
Amount Disbursed
Public State Colleges and Technical Institutes
201119 $2,000 $3,636 $3,148 $488 86.60% 519 $1,633,701
2012 $2,000 $4,237 $3,515 $722 83.00% 341 $1,198,521
2013 $2,000 $4,356 $3,586 $770 82.30% 280 $1,004,123
2014 $2,000 $4,625 $3,659 $966 79.10% 329 $1,203,829
2015 $4,800 $4,656 $4,716 ($59) 101.30% 898 $4,234,666
Public Community Colleges
2011 $2,000 $2,163 $1,533 $631 70.80% 6,307 $9,666,389
2012 $2,000 $2,416 $1,465 $951 60.70% 5,460 $8,000,010
2013 $2,000 $2,553 $1,679 $874 65.80% 6,283 $10,549,907
2014 $2,000 $2,574 $1,664 $911 64.60% 7,513 $12,498,082
201520 $4,800 $2,653 $1,827 $826 68.90% 25,727 $46,992,570
Source: Tuition and Fees: IFRS
19 First priority went to students with a $0 - $2,000 EFC. Remaining funds could be awarded to students whose need was more than or equal to one half of the Cost of Attendance after subtracting EFC and gift aid. 20 Students attending public two-year institutions were no longer eligible for initial TEXAS Grants beginning in Fall 2014
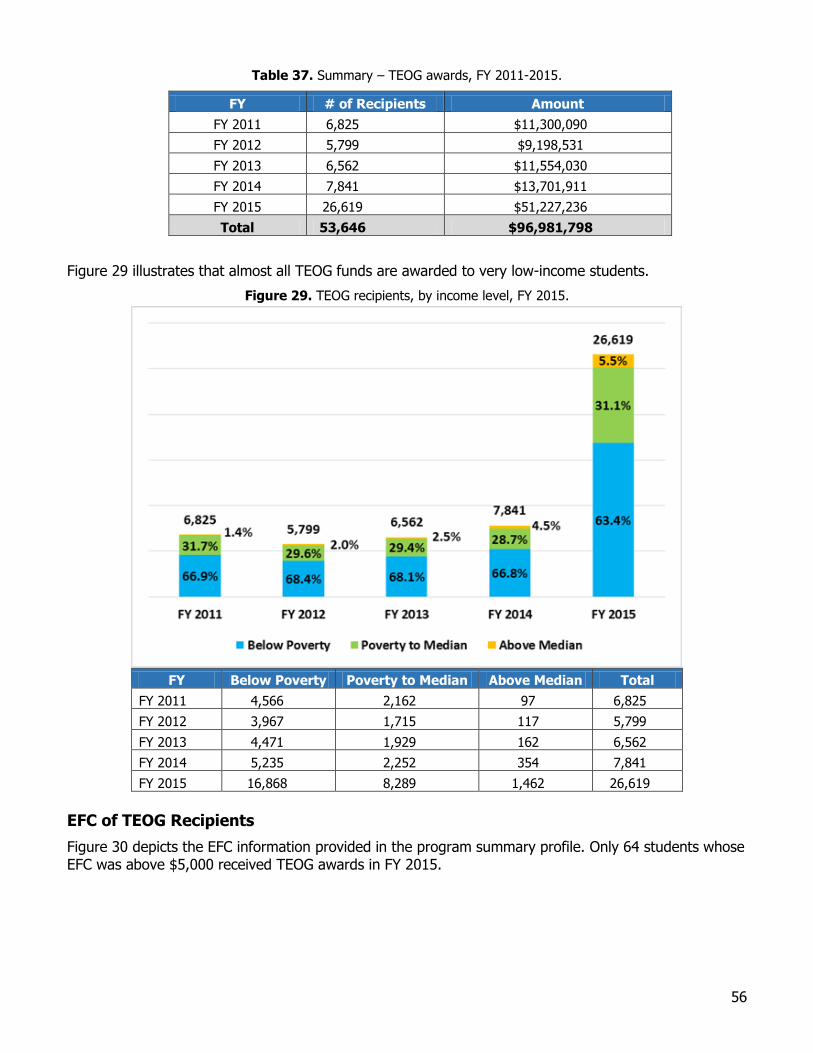
56
Table 37. Summary – TEOG awards, FY 2011-2015.
FY # of Recipients Amount
FY 2011 6,825 $11,300,090
FY 2012 5,799 $9,198,531
FY 2013 6,562 $11,554,030
FY 2014 7,841 $13,701,911
FY 2015 26,619 $51,227,236
Total 53,646 $96,981,798
Figure 29 illustrates that almost all TEOG funds are awarded to very low-income students.
Figure 29. TEOG recipients, by income level, FY 2015.
FY Below Poverty Poverty to Median Above Median Total
FY 2011 4,566 2,162 97 6,825
FY 2012 3,967 1,715 117 5,799
FY 2013 4,471 1,929 162 6,562
FY 2014 5,235 2,252 354 7,841
FY 2015 16,868 8,289 1,462 26,619
EFC of TEOG Recipients
Figure 30 depicts the EFC information provided in the program summary profile. Only 64 students whose EFC was above $5,000 received TEOG awards in FY 2015.
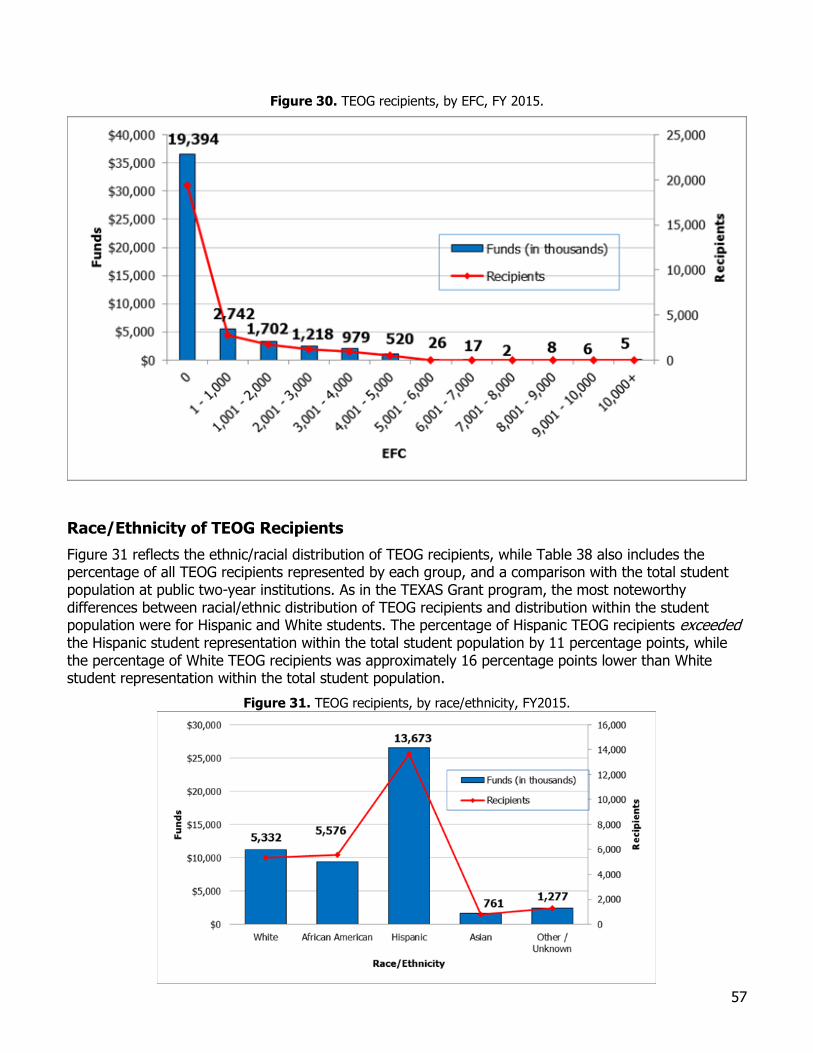
57
Figure 30. TEOG recipients, by EFC, FY 2015.
Race/Ethnicity of TEOG Recipients
Figure 31 reflects the ethnic/racial distribution of TEOG recipients, while Table 38 also includes the percentage of all TEOG recipients represented by each group, and a comparison with the total student population at public two-year institutions. As in the TEXAS Grant program, the most noteworthy differences between racial/ethnic distribution of TEOG recipients and distribution within the student population were for Hispanic and White students. The percentage of Hispanic TEOG recipients exceeded the Hispanic student representation within the total student population by 11 percentage points, while the percentage of White TEOG recipients was approximately 16 percentage points lower than White student representation within the total student population.
Figure 31. TEOG recipients, by race/ethnicity, FY2015.
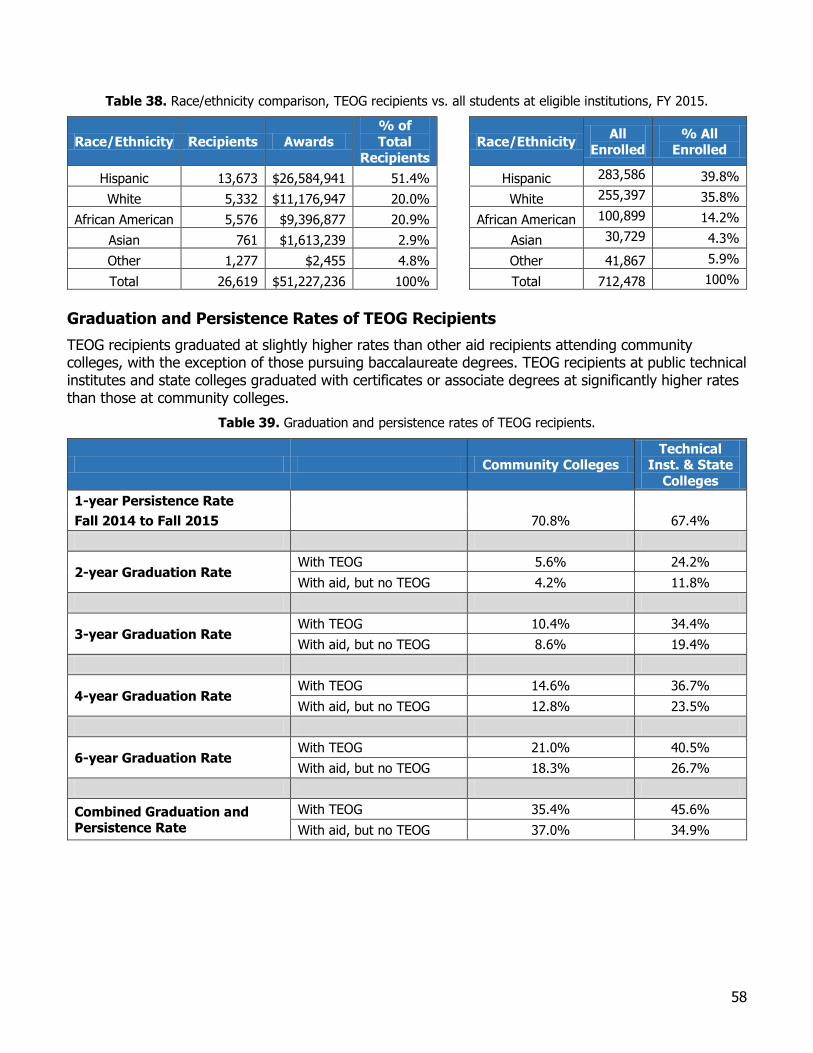
58
Table 38. Race/ethnicity comparison, TEOG recipients vs. all students at eligible institutions, FY 2015.
Race/Ethnicity Recipients Awards
% of
Total
Recipients
Race/Ethnicity All
Enrolled % All
Enrolled
Hispanic 13,673 $26,584,941 51.4% Hispanic 283,586 39.8%
White 5,332 $11,176,947 20.0% White 255,397 35.8%
African American 5,576 $9,396,877 20.9% African American 100,899 14.2%
Asian 761 $1,613,239 2.9% Asian 30,729 4.3%
Other 1,277 $2,455 4.8% Other 41,867 5.9%
Total 26,619 $51,227,236 100% Total 712,478 100%
Graduation and Persistence Rates of TEOG Recipients
TEOG recipients graduated at slightly higher rates than other aid recipients attending community colleges, with the exception of those pursuing baccalaureate degrees. TEOG recipients at public technical institutes and state colleges graduated with certificates or associate degrees at significantly higher rates than those at community colleges.
Table 39. Graduation and persistence rates of TEOG recipients.
Community Colleges Technical
Inst. & State
Colleges
1-year Persistence Rate
Fall 2014 to Fall 2015 70.8% 67.4%
2-year Graduation Rate With TEOG 5.6% 24.2%
With aid, but no TEOG 4.2% 11.8%
3-year Graduation Rate With TEOG 10.4% 34.4%
With aid, but no TEOG 8.6% 19.4%
4-year Graduation Rate With TEOG 14.6% 36.7%
With aid, but no TEOG 12.8% 23.5%
6-year Graduation Rate With TEOG 21.0% 40.5%
With aid, but no TEOG 18.3% 26.7%
Combined Graduation and Persistence Rate
With TEOG 35.4% 45.6%
With aid, but no TEOG 37.0% 34.9%
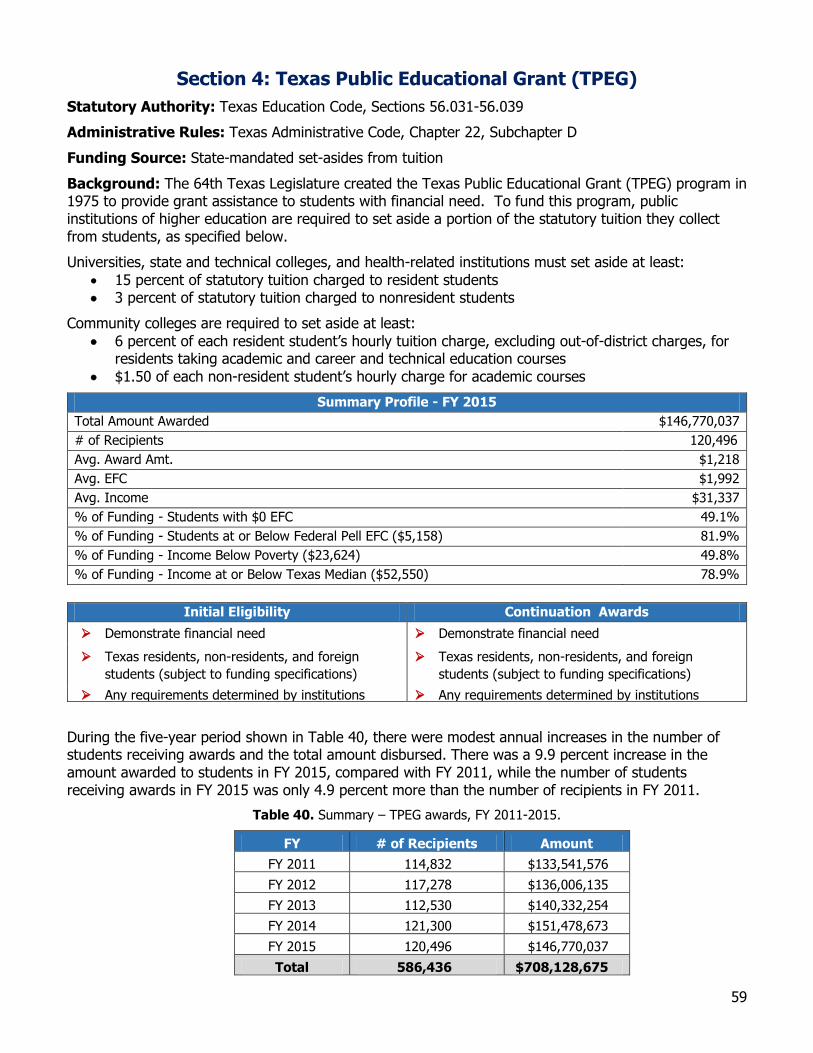
59
Section 4: Texas Public Educational Grant (TPEG)
Statutory Authority: Texas Education Code, Sections 56.031-56.039
Administrative Rules: Texas Administrative Code, Chapter 22, Subchapter D
Funding Source: State-mandated set-asides from tuition
Background: The 64th Texas Legislature created the Texas Public Educational Grant (TPEG) program in 1975 to provide grant assistance to students with financial need. To fund this program, public institutions of higher education are required to set aside a portion of the statutory tuition they collect from students, as specified below.
Universities, state and technical colleges, and health-related institutions must set aside at least:
15 percent of statutory tuition charged to resident students 3 percent of statutory tuition charged to nonresident students
Community colleges are required to set aside at least:
6 percent of each resident student’s hourly tuition charge, excluding out-of-district charges, for residents taking academic and career and technical education courses
$1.50 of each non-resident student’s hourly charge for academic courses
Summary Profile - FY 2015
Total Amount Awarded $146,770,037
# of Recipients 120,496
Avg. Award Amt. $1,218
Avg. EFC $1,992
Avg. Income $31,337
% of Funding - Students with $0 EFC 49.1%
% of Funding - Students at or Below Federal Pell EFC ($5,158) 81.9%
% of Funding - Income Below Poverty ($23,624) 49.8%
% of Funding - Income at or Below Texas Median ($52,550) 78.9%
Initial Eligibility Continuation Awards
Demonstrate financial need Demonstrate financial need
Texas residents, non-residents, and foreign
students (subject to funding specifications)
Texas residents, non-residents, and foreign
students (subject to funding specifications)
Any requirements determined by institutions Any requirements determined by institutions
During the five-year period shown in Table 40, there were modest annual increases in the number of students receiving awards and the total amount disbursed. There was a 9.9 percent increase in the amount awarded to students in FY 2015, compared with FY 2011, while the number of students receiving awards in FY 2015 was only 4.9 percent more than the number of recipients in FY 2011.
Table 40. Summary – TPEG awards, FY 2011-2015.
FY # of Recipients Amount
FY 2011 114,832 $133,541,576
FY 2012 117,278 $136,006,135
FY 2013 112,530 $140,332,254
FY 2014 121,300 $151,478,673
FY 2015 120,496 $146,770,037
Total 586,436 $708,128,675
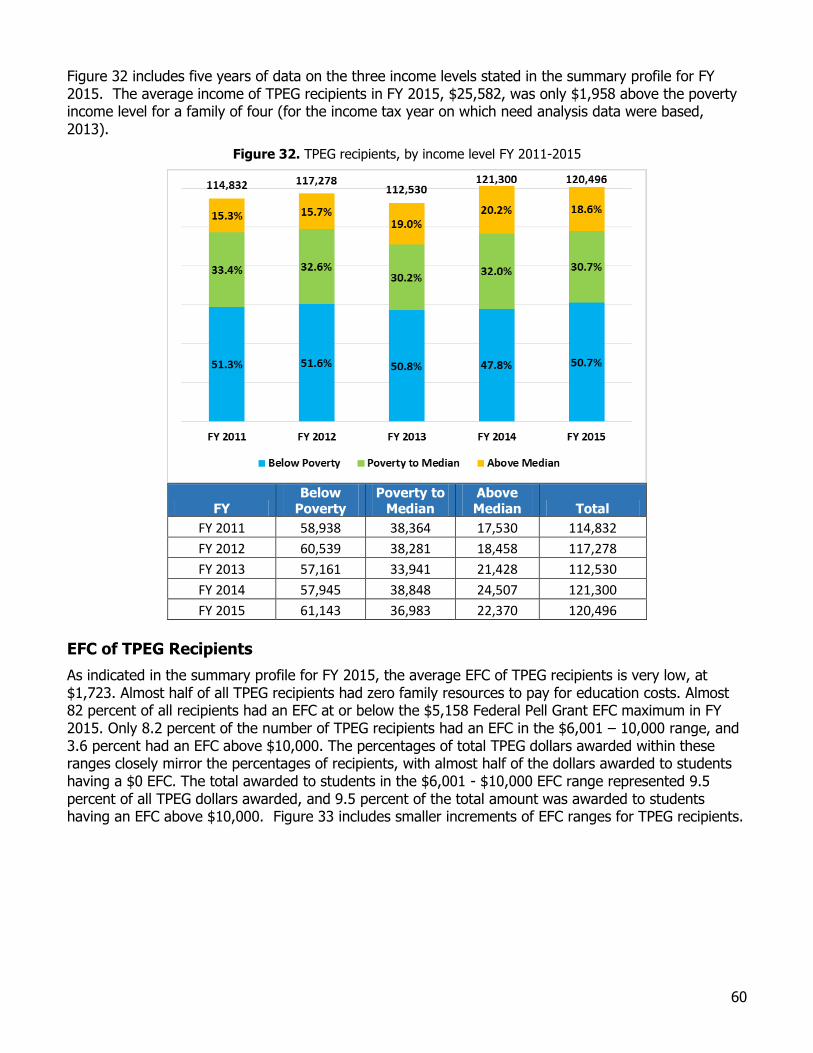
60
Figure 32 includes five years of data on the three income levels stated in the summary profile for FY 2015. The average income of TPEG recipients in FY 2015, $25,582, was only $1,958 above the poverty income level for a family of four (for the income tax year on which need analysis data were based, 2013).
Figure 32. TPEG recipients, by income level FY 2011-2015
FY Below
Poverty Poverty to
Median Above Median Total
FY 2011 58,938 38,364 17,530 114,832
FY 2012 60,539 38,281 18,458 117,278
FY 2013 57,161 33,941 21,428 112,530
FY 2014 57,945 38,848 24,507 121,300
FY 2015 61,143 36,983 22,370 120,496
EFC of TPEG Recipients
As indicated in the summary profile for FY 2015, the average EFC of TPEG recipients is very low, at $1,723. Almost half of all TPEG recipients had zero family resources to pay for education costs. Almost 82 percent of all recipients had an EFC at or below the $5,158 Federal Pell Grant EFC maximum in FY 2015. Only 8.2 percent of the number of TPEG recipients had an EFC in the $6,001 – 10,000 range, and 3.6 percent had an EFC above $10,000. The percentages of total TPEG dollars awarded within these ranges closely mirror the percentages of recipients, with almost half of the dollars awarded to students having a $0 EFC. The total awarded to students in the $6,001 - $10,000 EFC range represented 9.5 percent of all TPEG dollars awarded, and 9.5 percent of the total amount was awarded to students having an EFC above $10,000. Figure 33 includes smaller increments of EFC ranges for TPEG recipients.
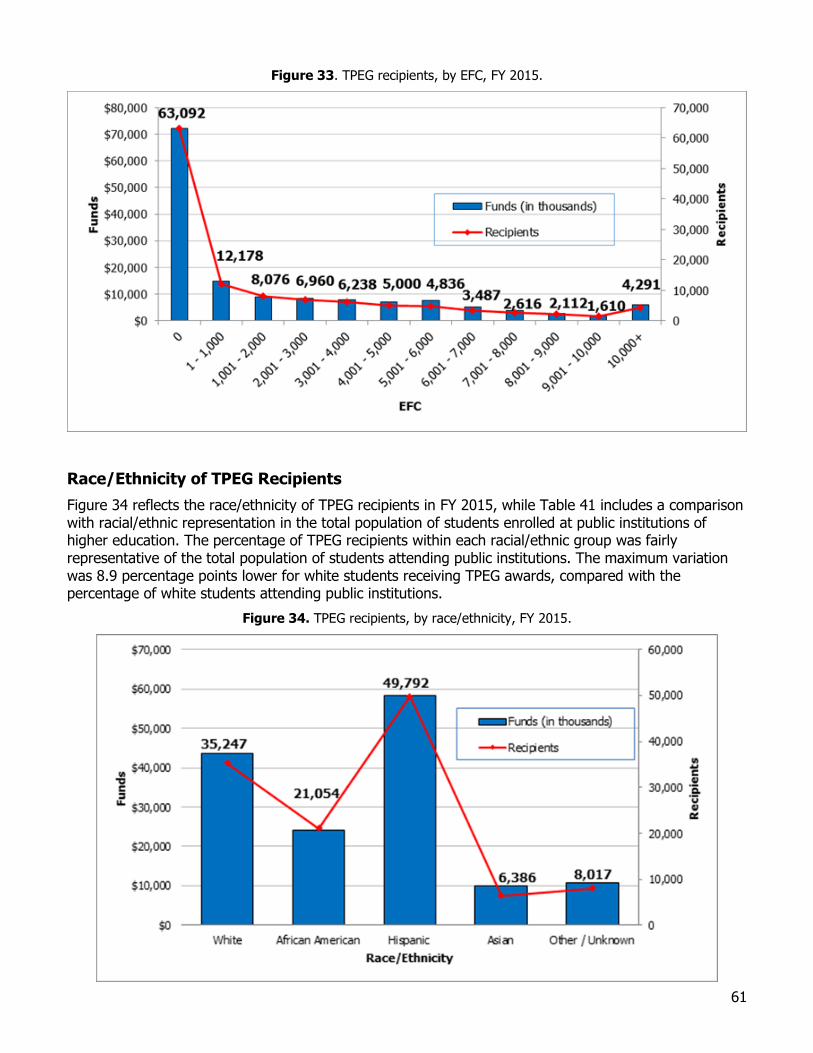
61
Figure 33. TPEG recipients, by EFC, FY 2015.
Race/Ethnicity of TPEG Recipients
Figure 34 reflects the race/ethnicity of TPEG recipients in FY 2015, while Table 41 includes a comparison with racial/ethnic representation in the total population of students enrolled at public institutions of higher education. The percentage of TPEG recipients within each racial/ethnic group was fairly representative of the total population of students attending public institutions. The maximum variation was 8.9 percentage points lower for white students receiving TPEG awards, compared with the percentage of white students attending public institutions.
Figure 34. TPEG recipients, by race/ethnicity, FY 2015.
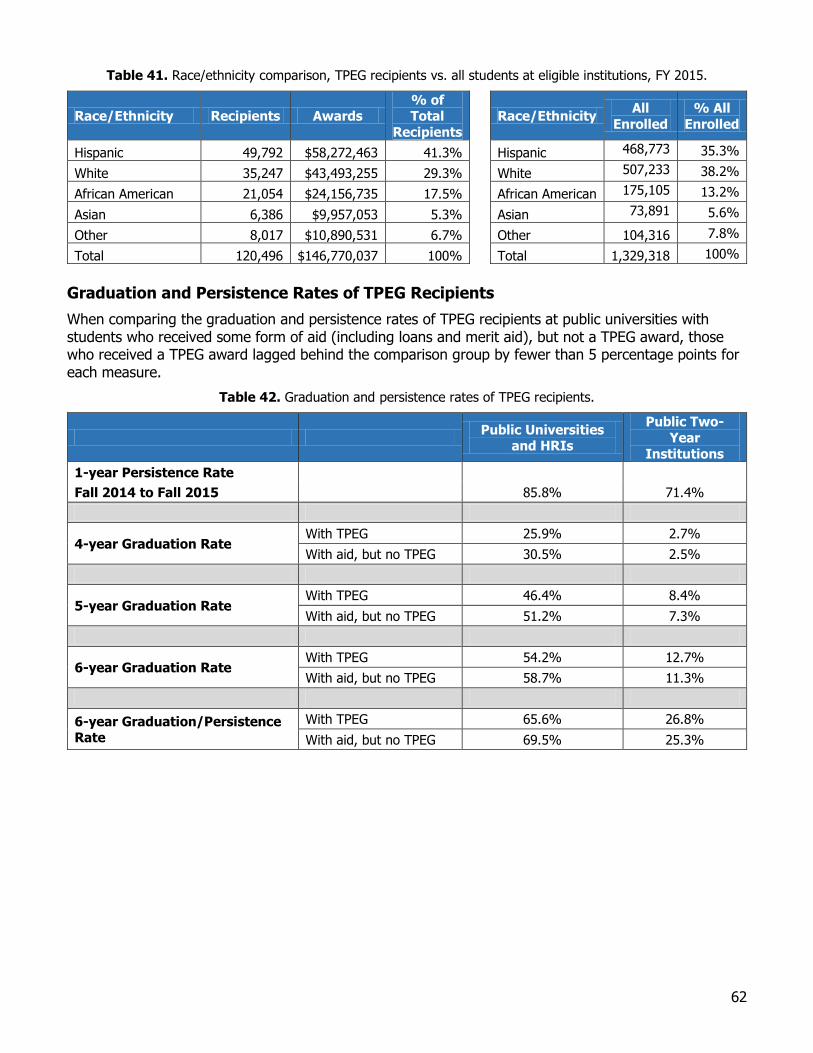
62
Table 41. Race/ethnicity comparison, TPEG recipients vs. all students at eligible institutions, FY 2015.
Race/Ethnicity Recipients Awards % of Total
Recipients Race/Ethnicity
All
Enrolled
% All
Enrolled
Hispanic 49,792 $58,272,463 41.3% Hispanic 468,773 35.3%
White 35,247 $43,493,255 29.3% White 507,233 38.2%
African American 21,054 $24,156,735 17.5% African American 175,105 13.2%
Asian 6,386 $9,957,053 5.3% Asian 73,891 5.6%
Other 8,017 $10,890,531 6.7% Other 104,316 7.8%
Total 120,496 $146,770,037 100% Total 1,329,318 100%
Graduation and Persistence Rates of TPEG Recipients
When comparing the graduation and persistence rates of TPEG recipients at public universities with students who received some form of aid (including loans and merit aid), but not a TPEG award, those who received a TPEG award lagged behind the comparison group by fewer than 5 percentage points for each measure.
Table 42. Graduation and persistence rates of TPEG recipients.
Public Universities
and HRIs
Public Two-
Year
Institutions
1-year Persistence Rate
Fall 2014 to Fall 2015 85.8% 71.4%
4-year Graduation Rate With TPEG 25.9% 2.7%
With aid, but no TPEG 30.5% 2.5%
5-year Graduation Rate With TPEG 46.4% 8.4%
With aid, but no TPEG 51.2% 7.3%
6-year Graduation Rate With TPEG 54.2% 12.7%
With aid, but no TPEG 58.7% 11.3%
6-year Graduation/Persistence Rate
With TPEG 65.6% 26.8%
With aid, but no TPEG 69.5% 25.3%
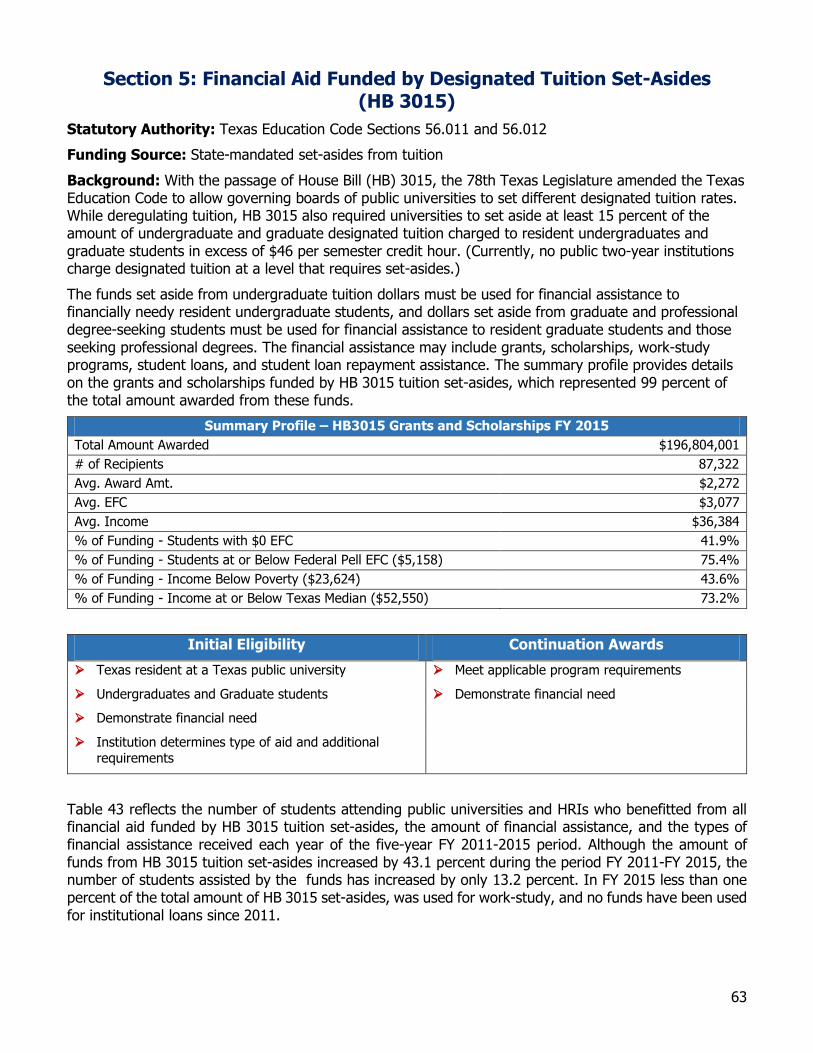
63
Section 5: Financial Aid Funded by Designated Tuition Set-Asides (HB 3015)
Statutory Authority: Texas Education Code Sections 56.011 and 56.012
Funding Source: State-mandated set-asides from tuition
Background: With the passage of House Bill (HB) 3015, the 78th Texas Legislature amended the Texas Education Code to allow governing boards of public universities to set different designated tuition rates. While deregulating tuition, HB 3015 also required universities to set aside at least 15 percent of the amount of undergraduate and graduate designated tuition charged to resident undergraduates and graduate students in excess of $46 per semester credit hour. (Currently, no public two-year institutions charge designated tuition at a level that requires set-asides.)
The funds set aside from undergraduate tuition dollars must be used for financial assistance to financially needy resident undergraduate students, and dollars set aside from graduate and professional degree-seeking students must be used for financial assistance to resident graduate students and those seeking professional degrees. The financial assistance may include grants, scholarships, work-study programs, student loans, and student loan repayment assistance. The summary profile provides details on the grants and scholarships funded by HB 3015 tuition set-asides, which represented 99 percent of the total amount awarded from these funds.
Summary Profile – HB3015 Grants and Scholarships FY 2015
Total Amount Awarded $196,804,001
# of Recipients 87,322
Avg. Award Amt. $2,272
Avg. EFC $3,077
Avg. Income $36,384
% of Funding - Students with $0 EFC 41.9%
% of Funding - Students at or Below Federal Pell EFC ($5,158) 75.4%
% of Funding - Income Below Poverty ($23,624) 43.6%
% of Funding - Income at or Below Texas Median ($52,550) 73.2%
Initial Eligibility Continuation Awards
Texas resident at a Texas public university Meet applicable program requirements
Undergraduates and Graduate students Demonstrate financial need
Demonstrate financial need
Institution determines type of aid and additional requirements
Table 43 reflects the number of students attending public universities and HRIs who benefitted from all financial aid funded by HB 3015 tuition set-asides, the amount of financial assistance, and the types of financial assistance received each year of the five-year FY 2011-2015 period. Although the amount of funds from HB 3015 tuition set-asides increased by 43.1 percent during the period FY 2011-FY 2015, the number of students assisted by the funds has increased by only 13.2 percent. In FY 2015 less than one percent of the total amount of HB 3015 set-asides, was used for work-study, and no funds have been used for institutional loans since 2011.
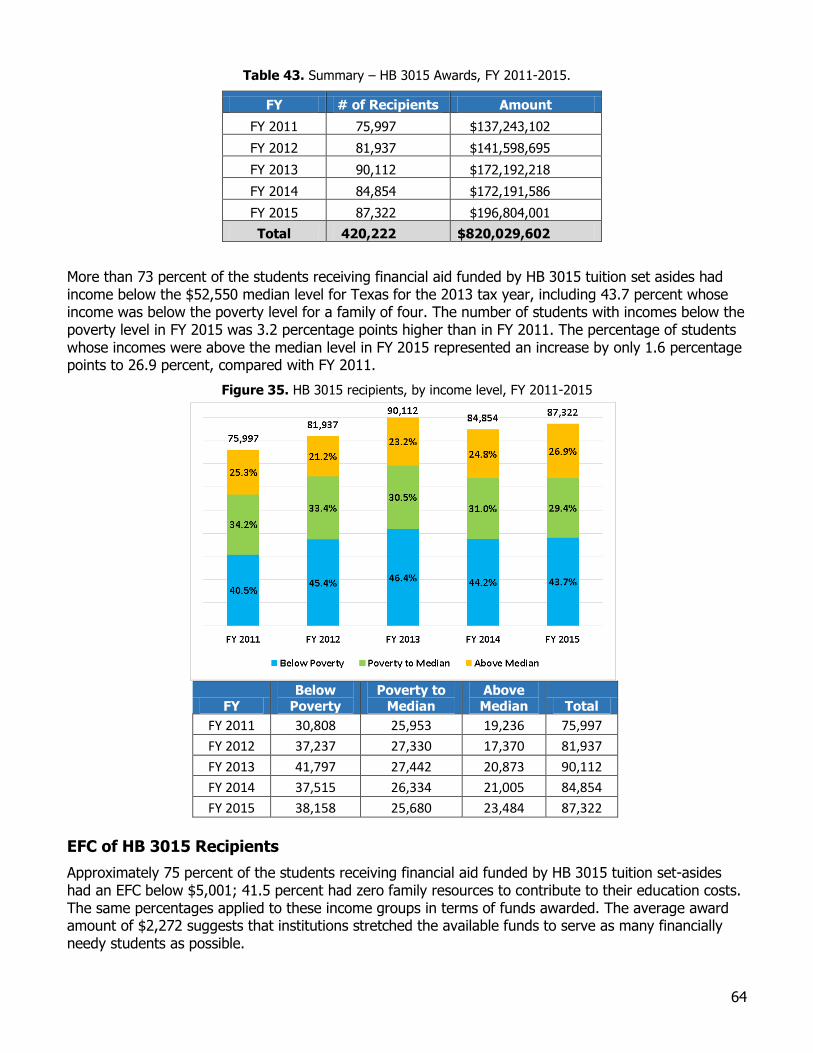
64
Table 43. Summary – HB 3015 Awards, FY 2011-2015.
FY # of Recipients Amount
FY 2011 75,997 $137,243,102
FY 2012 81,937 $141,598,695
FY 2013 90,112 $172,192,218
FY 2014 84,854 $172,191,586
FY 2015 87,322 $196,804,001
Total 420,222 $820,029,602
More than 73 percent of the students receiving financial aid funded by HB 3015 tuition set asides had income below the $52,550 median level for Texas for the 2013 tax year, including 43.7 percent whose income was below the poverty level for a family of four. The number of students with incomes below the poverty level in FY 2015 was 3.2 percentage points higher than in FY 2011. The percentage of students whose incomes were above the median level in FY 2015 represented an increase by only 1.6 percentage points to 26.9 percent, compared with FY 2011.
Figure 35. HB 3015 recipients, by income level, FY 2011-2015
FY Below
Poverty Poverty to
Median Above Median Total
FY 2011 30,808 25,953 19,236 75,997
FY 2012 37,237 27,330 17,370 81,937
FY 2013 41,797 27,442 20,873 90,112
FY 2014 37,515 26,334 21,005 84,854
FY 2015 38,158 25,680 23,484 87,322
EFC of HB 3015 Recipients
Approximately 75 percent of the students receiving financial aid funded by HB 3015 tuition set-asides had an EFC below $5,001; 41.5 percent had zero family resources to contribute to their education costs. The same percentages applied to these income groups in terms of funds awarded. The average award amount of $2,272 suggests that institutions stretched the available funds to serve as many financially needy students as possible.
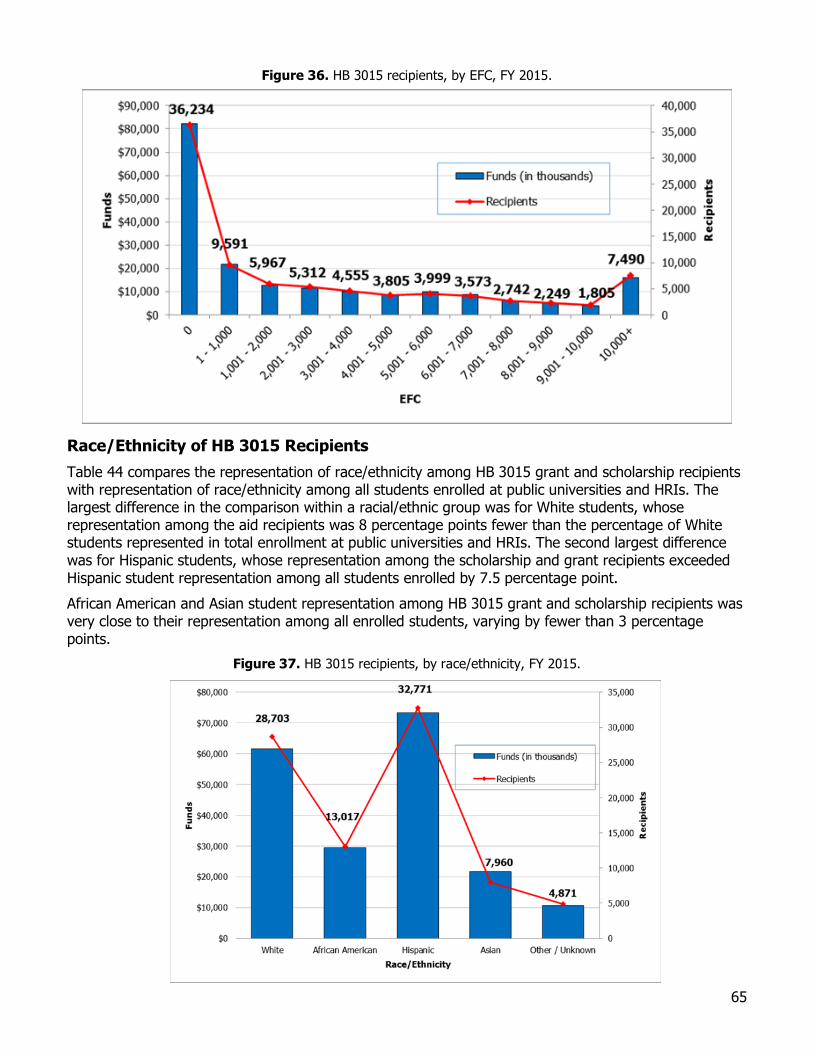
65
Figure 36. HB 3015 recipients, by EFC, FY 2015.
Race/Ethnicity of HB 3015 Recipients
Table 44 compares the representation of race/ethnicity among HB 3015 grant and scholarship recipients with representation of race/ethnicity among all students enrolled at public universities and HRIs. The largest difference in the comparison within a racial/ethnic group was for White students, whose representation among the aid recipients was 8 percentage points fewer than the percentage of White students represented in total enrollment at public universities and HRIs. The second largest difference was for Hispanic students, whose representation among the scholarship and grant recipients exceeded Hispanic student representation among all students enrolled by 7.5 percentage point.
African American and Asian student representation among HB 3015 grant and scholarship recipients was very close to their representation among all enrolled students, varying by fewer than 3 percentage points.
Figure 37. HB 3015 recipients, by race/ethnicity, FY 2015.
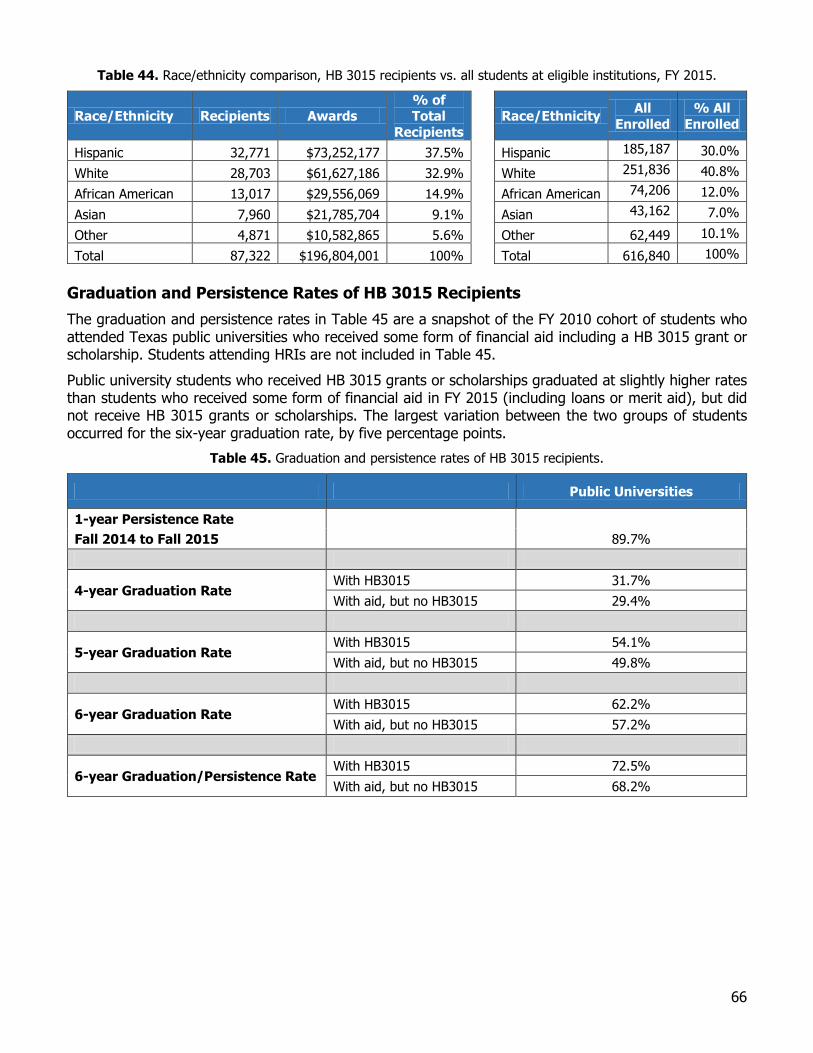
66
Table 44. Race/ethnicity comparison, HB 3015 recipients vs. all students at eligible institutions, FY 2015.
Race/Ethnicity Recipients Awards % of Total
Recipients Race/Ethnicity
All
Enrolled
% All
Enrolled
Hispanic 32,771 $73,252,177 37.5% Hispanic 185,187 30.0%
White 28,703 $61,627,186 32.9% White 251,836 40.8%
African American 13,017 $29,556,069 14.9% African American 74,206 12.0%
Asian 7,960 $21,785,704 9.1% Asian 43,162 7.0%
Other 4,871 $10,582,865 5.6% Other 62,449 10.1%
Total 87,322 $196,804,001 100% Total 616,840 100%
Graduation and Persistence Rates of HB 3015 Recipients
The graduation and persistence rates in Table 45 are a snapshot of the FY 2010 cohort of students who attended Texas public universities who received some form of financial aid including a HB 3015 grant or scholarship. Students attending HRIs are not included in Table 45.
Public university students who received HB 3015 grants or scholarships graduated at slightly higher rates than students who received some form of financial aid in FY 2015 (including loans or merit aid), but did not receive HB 3015 grants or scholarships. The largest variation between the two groups of students occurred for the six-year graduation rate, by five percentage points.
Table 45. Graduation and persistence rates of HB 3015 recipients.
Public Universities
1-year Persistence Rate
Fall 2014 to Fall 2015 89.7%
4-year Graduation Rate With HB3015 31.7%
With aid, but no HB3015 29.4%
5-year Graduation Rate With HB3015 54.1%
With aid, but no HB3015 49.8%
6-year Graduation Rate With HB3015 62.2%
With aid, but no HB3015 57.2%
6-year Graduation/Persistence Rate With HB3015 72.5%
With aid, but no HB3015 68.2%
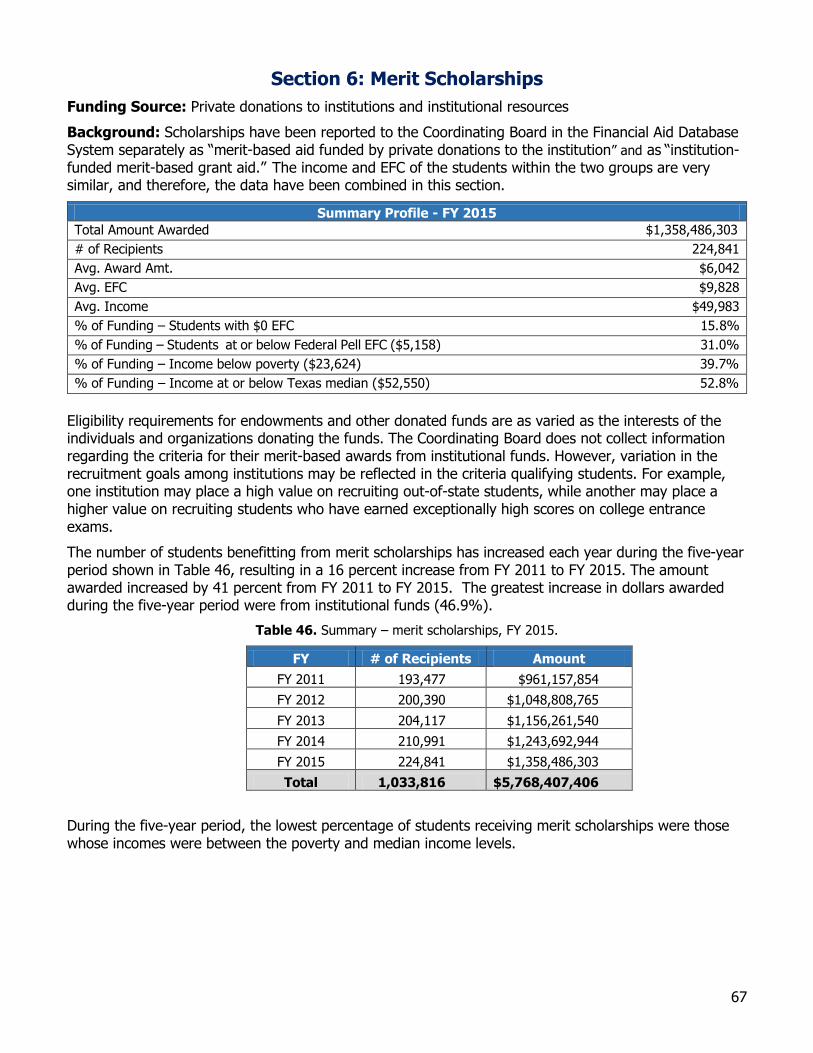
67
Section 6: Merit Scholarships
Funding Source: Private donations to institutions and institutional resources
Background: Scholarships have been reported to the Coordinating Board in the Financial Aid Database System separately as “merit-based aid funded by private donations to the institution” and as “institution-funded merit-based grant aid.” The income and EFC of the students within the two groups are very similar, and therefore, the data have been combined in this section.
Summary Profile - FY 2015
Total Amount Awarded $1,358,486,303
# of Recipients 224,841
Avg. Award Amt. $6,042
Avg. EFC $9,828
Avg. Income $49,983
% of Funding – Students with $0 EFC 15.8%
% of Funding – Students at or below Federal Pell EFC ($5,158) 31.0%
% of Funding – Income below poverty ($23,624) 39.7%
% of Funding – Income at or below Texas median ($52,550) 52.8%
Eligibility requirements for endowments and other donated funds are as varied as the interests of the individuals and organizations donating the funds. The Coordinating Board does not collect information regarding the criteria for their merit-based awards from institutional funds. However, variation in the recruitment goals among institutions may be reflected in the criteria qualifying students. For example, one institution may place a high value on recruiting out-of-state students, while another may place a higher value on recruiting students who have earned exceptionally high scores on college entrance exams.
The number of students benefitting from merit scholarships has increased each year during the five-year period shown in Table 46, resulting in a 16 percent increase from FY 2011 to FY 2015. The amount awarded increased by 41 percent from FY 2011 to FY 2015. The greatest increase in dollars awarded during the five-year period were from institutional funds (46.9%).
Table 46. Summary – merit scholarships, FY 2015.
FY # of Recipients Amount
FY 2011 193,477 $961,157,854
FY 2012 200,390 $1,048,808,765
FY 2013 204,117 $1,156,261,540
FY 2014 210,991 $1,243,692,944
FY 2015 224,841 $1,358,486,303
Total 1,033,816 $5,768,407,406
During the five-year period, the lowest percentage of students receiving merit scholarships were those whose incomes were between the poverty and median income levels.
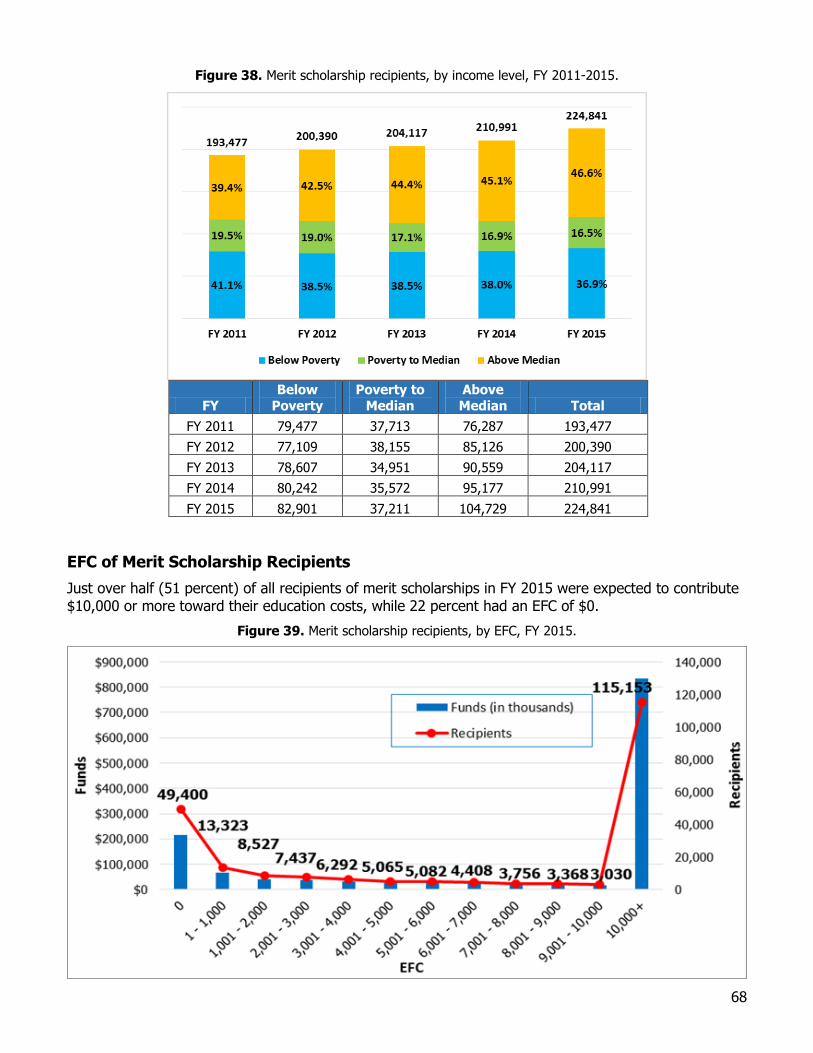
68
Figure 38. Merit scholarship recipients, by income level, FY 2011-2015.
FY
Below
Poverty
Poverty to
Median
Above
Median Total
FY 2011 79,477 37,713 76,287 193,477
FY 2012 77,109 38,155 85,126 200,390
FY 2013 78,607 34,951 90,559 204,117
FY 2014 80,242 35,572 95,177 210,991
FY 2015 82,901 37,211 104,729 224,841
EFC of Merit Scholarship Recipients
Just over half (51 percent) of all recipients of merit scholarships in FY 2015 were expected to contribute $10,000 or more toward their education costs, while 22 percent had an EFC of $0.
Figure 39. Merit scholarship recipients, by EFC, FY 2015.
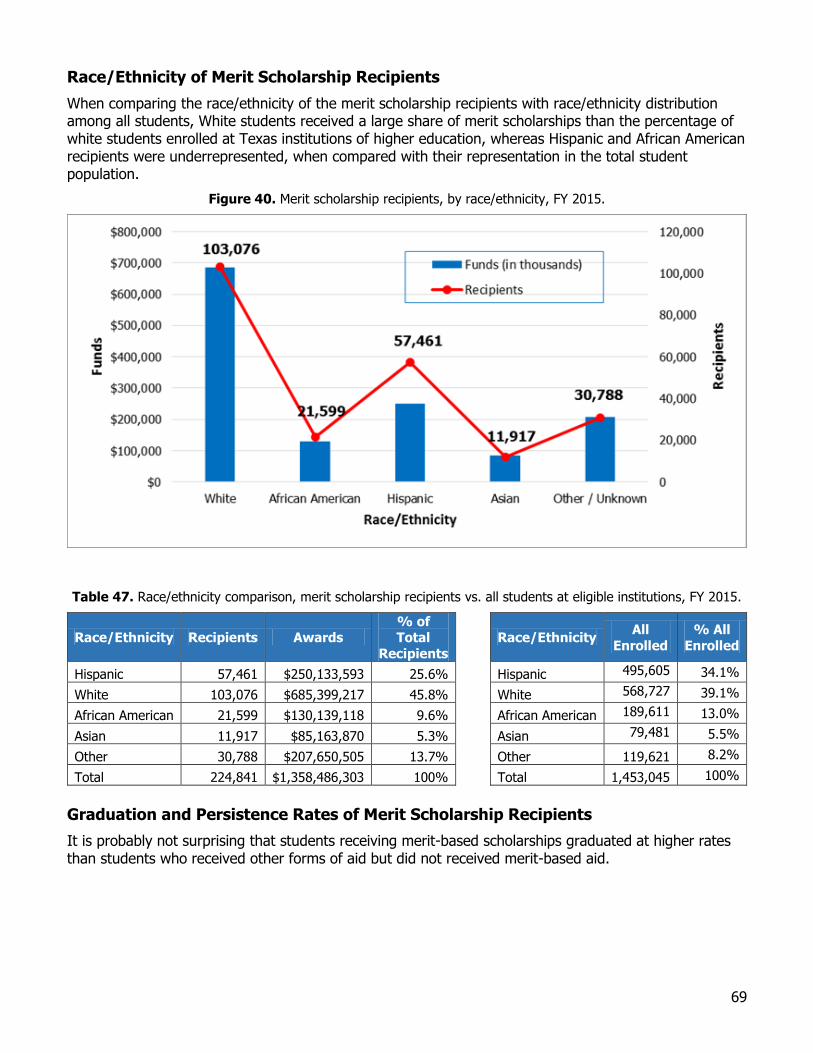
69
Race/Ethnicity of Merit Scholarship Recipients
When comparing the race/ethnicity of the merit scholarship recipients with race/ethnicity distribution among all students, White students received a large share of merit scholarships than the percentage of white students enrolled at Texas institutions of higher education, whereas Hispanic and African American recipients were underrepresented, when compared with their representation in the total student population.
Figure 40. Merit scholarship recipients, by race/ethnicity, FY 2015.
Table 47. Race/ethnicity comparison, merit scholarship recipients vs. all students at eligible institutions, FY 2015.
Race/Ethnicity Recipients Awards % of Total
Recipients Race/Ethnicity
All
Enrolled
% All
Enrolled
Hispanic 57,461 $250,133,593 25.6% Hispanic 495,605 34.1%
White 103,076 $685,399,217 45.8% White 568,727 39.1%
African American 21,599 $130,139,118 9.6% African American 189,611 13.0%
Asian 11,917 $85,163,870 5.3% Asian 79,481 5.5%
Other 30,788 $207,650,505 13.7% Other 119,621 8.2%
Total 224,841 $1,358,486,303 100% Total 1,453,045 100%
Graduation and Persistence Rates of Merit Scholarship Recipients
It is probably not surprising that students receiving merit-based scholarships graduated at higher rates than students who received other forms of aid but did not received merit-based aid.
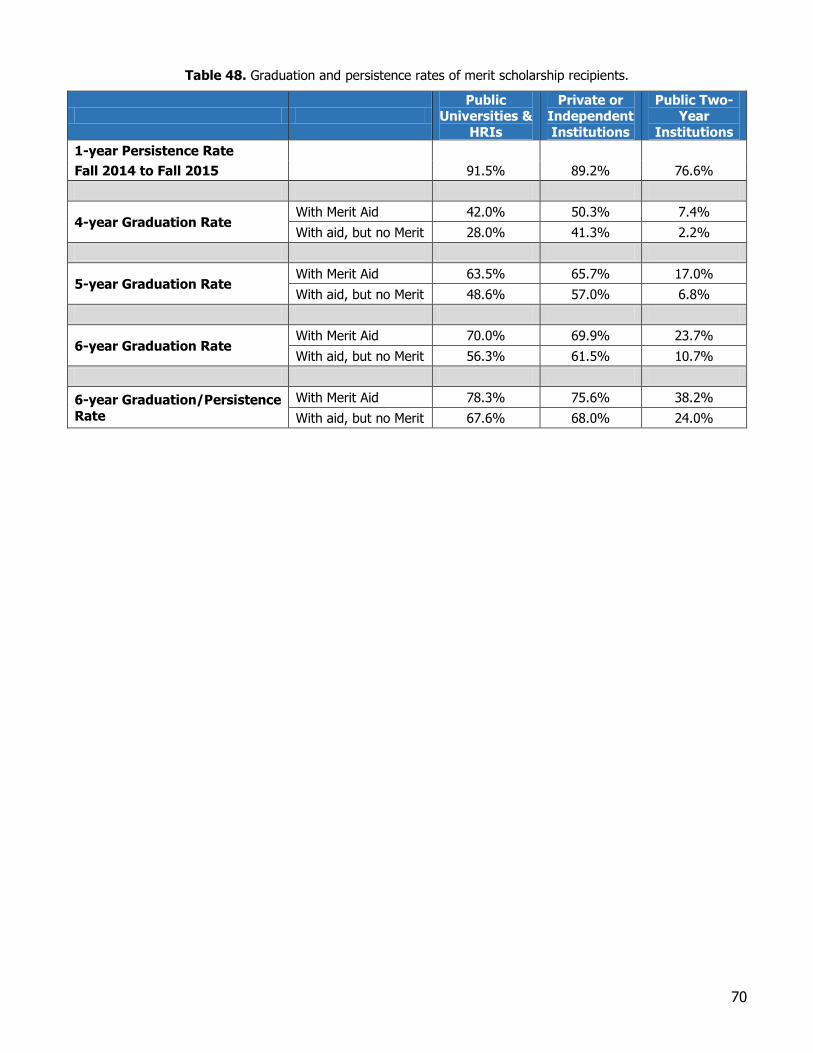
70
Table 48. Graduation and persistence rates of merit scholarship recipients.
Public
Universities &
HRIs
Private or Independent
Institutions
Public Two-Year
Institutions
1-year Persistence Rate
Fall 2014 to Fall 2015 91.5% 89.2% 76.6%
4-year Graduation Rate With Merit Aid 42.0% 50.3% 7.4%
With aid, but no Merit 28.0% 41.3% 2.2%
5-year Graduation Rate With Merit Aid 63.5% 65.7% 17.0%
With aid, but no Merit 48.6% 57.0% 6.8%
6-year Graduation Rate With Merit Aid 70.0% 69.9% 23.7%
With aid, but no Merit 56.3% 61.5% 10.7%
6-year Graduation/Persistence
Rate
With Merit Aid 78.3% 75.6% 38.2%
With aid, but no Merit 67.6% 68.0% 24.0%
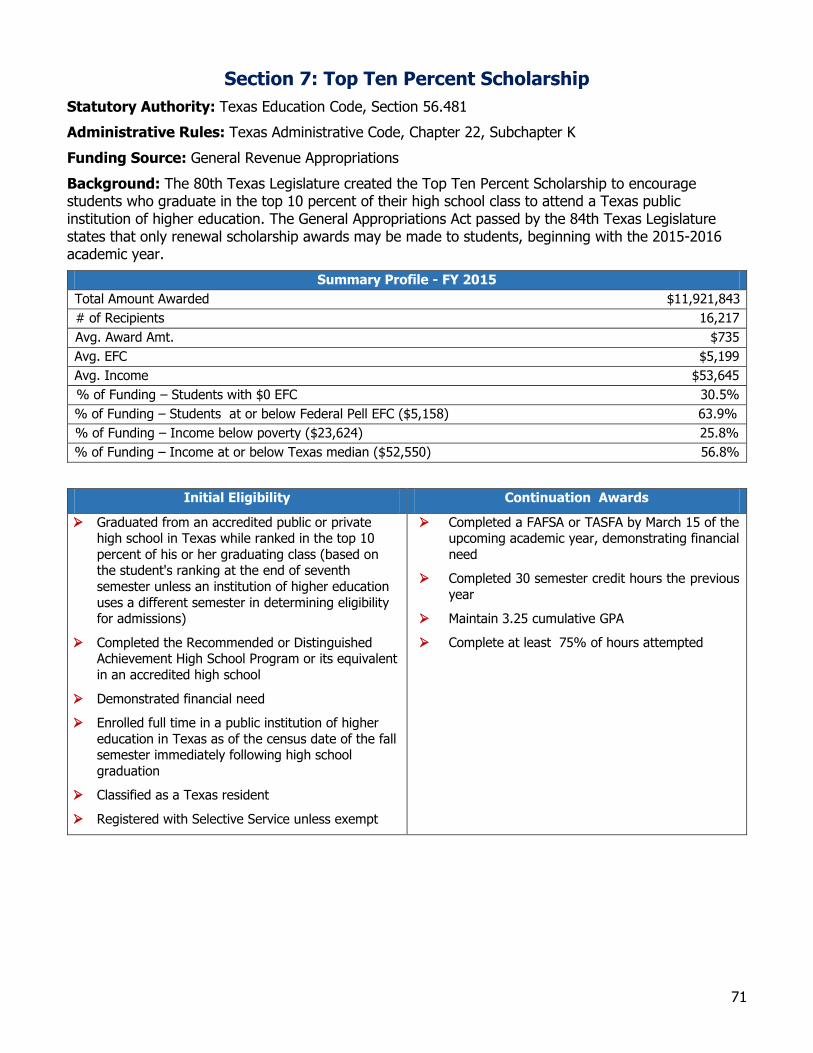
71
Section 7: Top Ten Percent Scholarship
Statutory Authority: Texas Education Code, Section 56.481
Administrative Rules: Texas Administrative Code, Chapter 22, Subchapter K
Funding Source: General Revenue Appropriations
Background: The 80th Texas Legislature created the Top Ten Percent Scholarship to encourage students who graduate in the top 10 percent of their high school class to attend a Texas public institution of higher education. The General Appropriations Act passed by the 84th Texas Legislature states that only renewal scholarship awards may be made to students, beginning with the 2015-2016 academic year.
Summary Profile - FY 2015
Total Amount Awarded $11,921,843
# of Recipients 16,217
Avg. Award Amt. $735
Avg. EFC $5,199
Avg. Income $53,645
% of Funding – Students with $0 EFC 30.5%
% of Funding – Students at or below Federal Pell EFC ($5,158) 63.9%
% of Funding – Income below poverty ($23,624) 25.8%
% of Funding – Income at or below Texas median ($52,550) 56.8%
Initial Eligibility Continuation Awards
Graduated from an accredited public or private high school in Texas while ranked in the top 10
percent of his or her graduating class (based on the student's ranking at the end of seventh
semester unless an institution of higher education
uses a different semester in determining eligibility for admissions)
Completed the Recommended or Distinguished Achievement High School Program or its equivalent
in an accredited high school
Demonstrated financial need
Enrolled full time in a public institution of higher
education in Texas as of the census date of the fall semester immediately following high school
graduation
Classified as a Texas resident
Registered with Selective Service unless exempt
Completed a FAFSA or TASFA by March 15 of the upcoming academic year, demonstrating financial
need
Completed 30 semester credit hours the previous
year
Maintain 3.25 cumulative GPA
Complete at least 75% of hours attempted 75
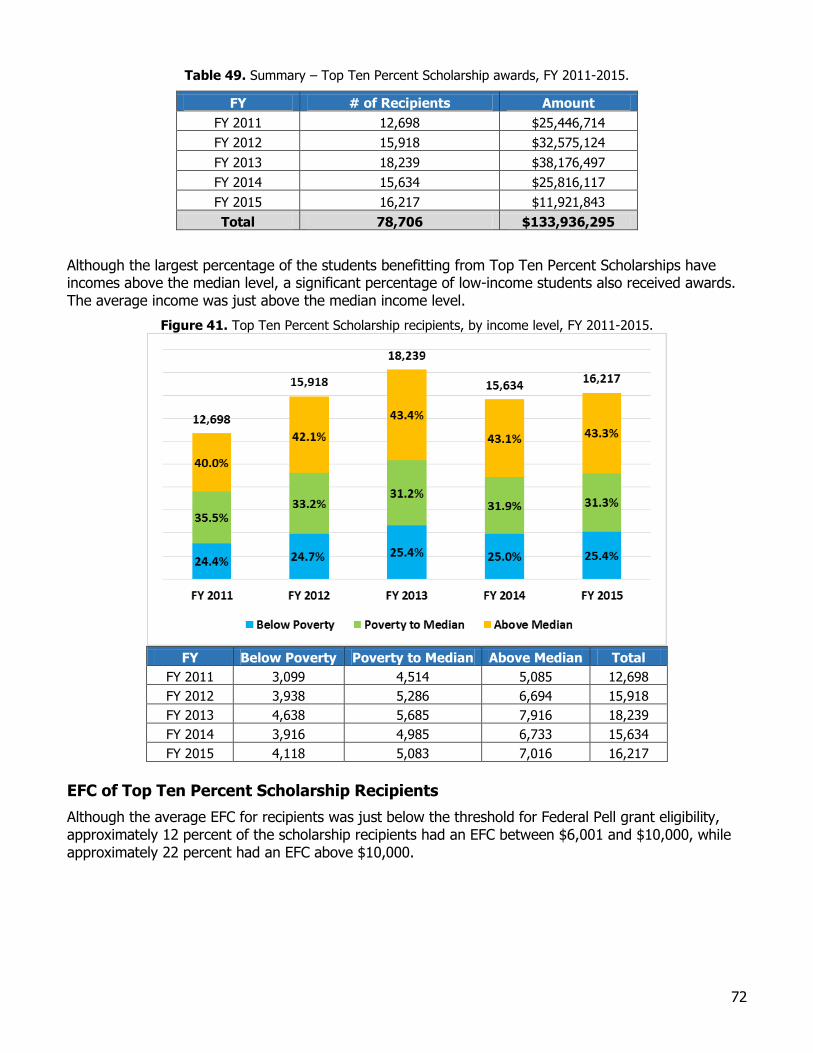
72
Table 49. Summary – Top Ten Percent Scholarship awards, FY 2011-2015.
FY # of Recipients Amount
FY 2011 12,698 $25,446,714
FY 2012 15,918 $32,575,124
FY 2013 18,239 $38,176,497
FY 2014 15,634 $25,816,117
FY 2015 16,217 $11,921,843
Total 78,706 $133,936,295
Although the largest percentage of the students benefitting from Top Ten Percent Scholarships have incomes above the median level, a significant percentage of low-income students also received awards. The average income was just above the median income level.
Figure 41. Top Ten Percent Scholarship recipients, by income level, FY 2011-2015.
FY Below Poverty Poverty to Median Above Median Total
FY 2011 3,099 4,514 5,085 12,698
FY 2012 3,938 5,286 6,694 15,918
FY 2013 4,638 5,685 7,916 18,239
FY 2014 3,916 4,985 6,733 15,634
FY 2015 4,118 5,083 7,016 16,217
EFC of Top Ten Percent Scholarship Recipients
Although the average EFC for recipients was just below the threshold for Federal Pell grant eligibility, approximately 12 percent of the scholarship recipients had an EFC between $6,001 and $10,000, while approximately 22 percent had an EFC above $10,000.
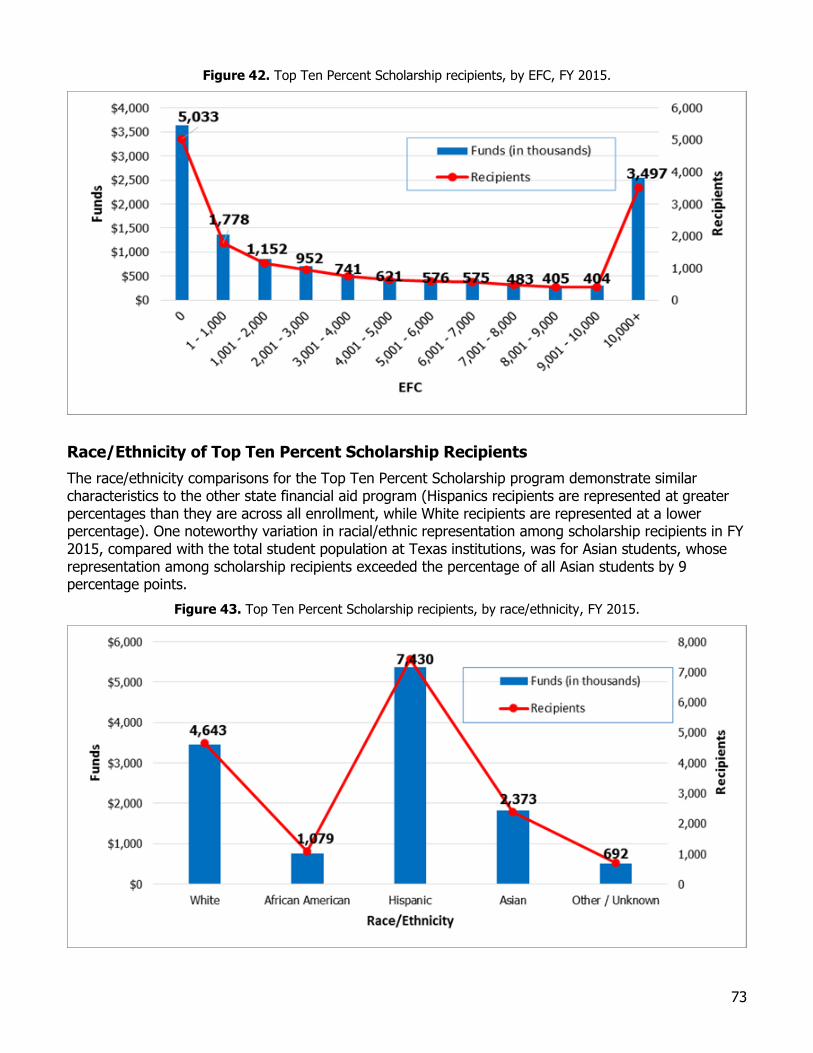
73
Figure 42. Top Ten Percent Scholarship recipients, by EFC, FY 2015.
Race/Ethnicity of Top Ten Percent Scholarship Recipients
The race/ethnicity comparisons for the Top Ten Percent Scholarship program demonstrate similar characteristics to the other state financial aid program (Hispanics recipients are represented at greater percentages than they are across all enrollment, while White recipients are represented at a lower percentage). One noteworthy variation in racial/ethnic representation among scholarship recipients in FY 2015, compared with the total student population at Texas institutions, was for Asian students, whose representation among scholarship recipients exceeded the percentage of all Asian students by 9 percentage points.
Figure 43. Top Ten Percent Scholarship recipients, by race/ethnicity, FY 2015.
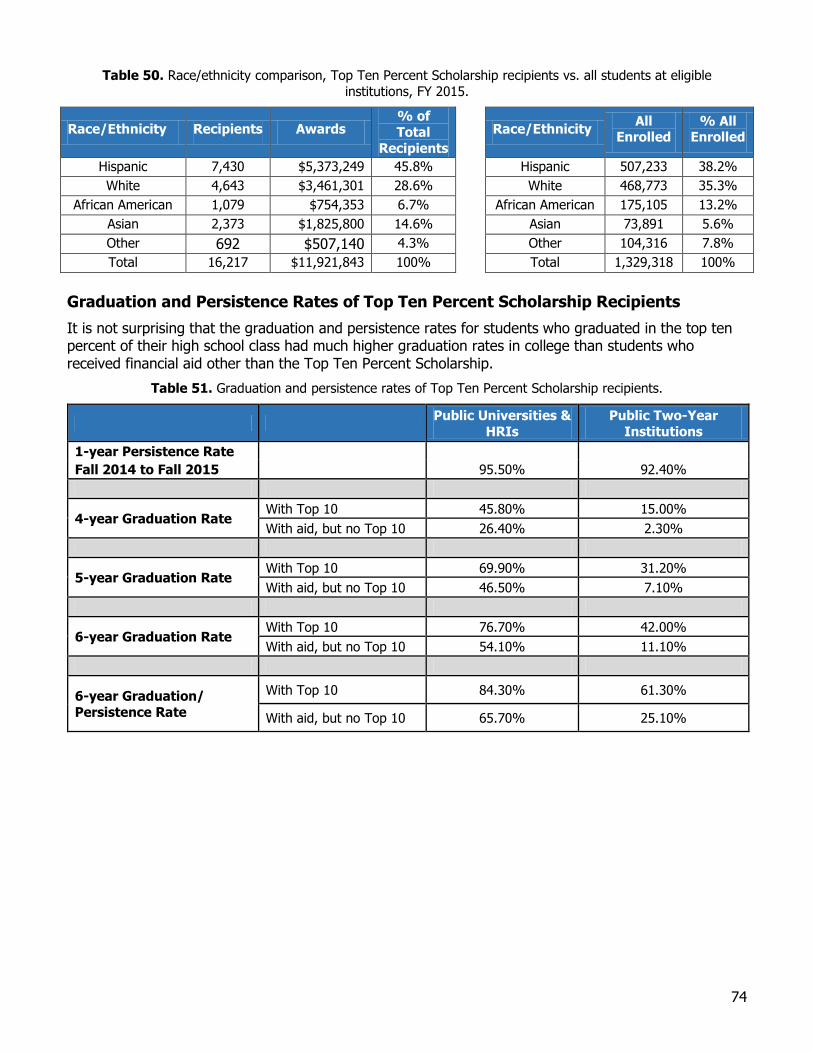
74
Table 50. Race/ethnicity comparison, Top Ten Percent Scholarship recipients vs. all students at eligible
institutions, FY 2015.
Race/Ethnicity Recipients Awards % of
Total
Recipients
Race/Ethnicity All
Enrolled % All
Enrolled
Hispanic 7,430 $5,373,249 45.8% Hispanic 507,233 38.2%
White 4,643 $3,461,301 28.6% White 468,773 35.3%
African American 1,079 $754,353 6.7% African American 175,105 13.2%
Asian 2,373 $1,825,800 14.6% Asian 73,891 5.6%
Other 692 $507,140 4.3% Other 104,316 7.8%
Total 16,217 $11,921,843 100% Total 1,329,318 100%
Graduation and Persistence Rates of Top Ten Percent Scholarship Recipients
It is not surprising that the graduation and persistence rates for students who graduated in the top ten percent of their high school class had much higher graduation rates in college than students who received financial aid other than the Top Ten Percent Scholarship.
Table 51. Graduation and persistence rates of Top Ten Percent Scholarship recipients.
Public Universities &
HRIs
Public Two-Year
Institutions
1-year Persistence Rate
Fall 2014 to Fall 2015 95.50% 92.40%
4-year Graduation Rate With Top 10 45.80% 15.00%
With aid, but no Top 10 26.40% 2.30%
5-year Graduation Rate With Top 10 69.90% 31.20%
With aid, but no Top 10 46.50% 7.10%
6-year Graduation Rate With Top 10 76.70% 42.00%
With aid, but no Top 10 54.10% 11.10%
6-year Graduation/
Persistence Rate
With Top 10 84.30% 61.30%
With aid, but no Top 10 65.70% 25.10%
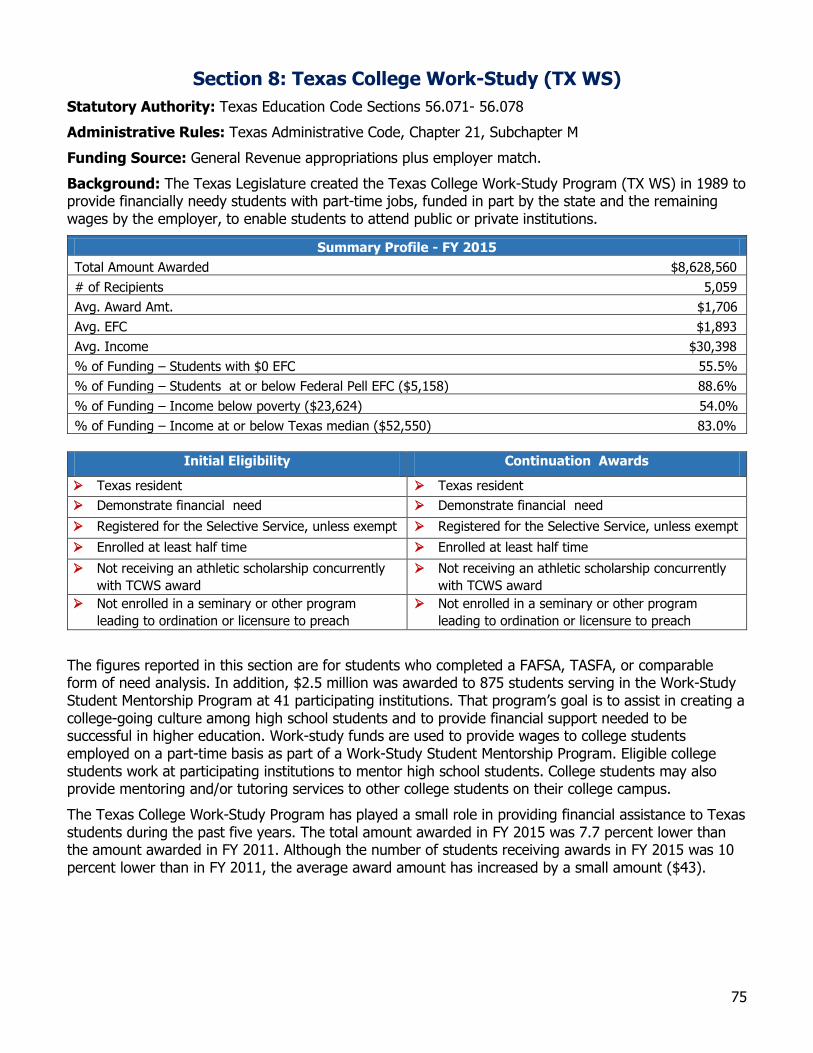
75
Section 8: Texas College Work-Study (TX WS)
Statutory Authority: Texas Education Code Sections 56.071- 56.078
Administrative Rules: Texas Administrative Code, Chapter 21, Subchapter M
Funding Source: General Revenue appropriations plus employer match.
Background: The Texas Legislature created the Texas College Work-Study Program (TX WS) in 1989 to provide financially needy students with part-time jobs, funded in part by the state and the remaining wages by the employer, to enable students to attend public or private institutions.
Summary Profile - FY 2015
Total Amount Awarded $8,628,560
# of Recipients 5,059
Avg. Award Amt. $1,706
Avg. EFC $1,893
Avg. Income $30,398
% of Funding – Students with $0 EFC 55.5%
% of Funding – Students at or below Federal Pell EFC ($5,158) 88.6%
% of Funding – Income below poverty ($23,624) 54.0%
% of Funding – Income at or below Texas median ($52,550) 83.0%
Initial Eligibility Continuation Awards
Texas resident Texas resident
Demonstrate financial need Demonstrate financial need
Registered for the Selective Service, unless exempt Registered for the Selective Service, unless exempt
Enrolled at least half time Enrolled at least half time
Not receiving an athletic scholarship concurrently
with TCWS award
Not receiving an athletic scholarship concurrently
with TCWS award
Not enrolled in a seminary or other program
leading to ordination or licensure to preach
Not enrolled in a seminary or other program
leading to ordination or licensure to preach
The figures reported in this section are for students who completed a FAFSA, TASFA, or comparable form of need analysis. In addition, $2.5 million was awarded to 875 students serving in the Work-Study Student Mentorship Program at 41 participating institutions. That program’s goal is to assist in creating a college-going culture among high school students and to provide financial support needed to be successful in higher education. Work-study funds are used to provide wages to college students employed on a part-time basis as part of a Work-Study Student Mentorship Program. Eligible college students work at participating institutions to mentor high school students. College students may also provide mentoring and/or tutoring services to other college students on their college campus.
The Texas College Work-Study Program has played a small role in providing financial assistance to Texas students during the past five years. The total amount awarded in FY 2015 was 7.7 percent lower than the amount awarded in FY 2011. Although the number of students receiving awards in FY 2015 was 10 percent lower than in FY 2011, the average award amount has increased by a small amount ($43).
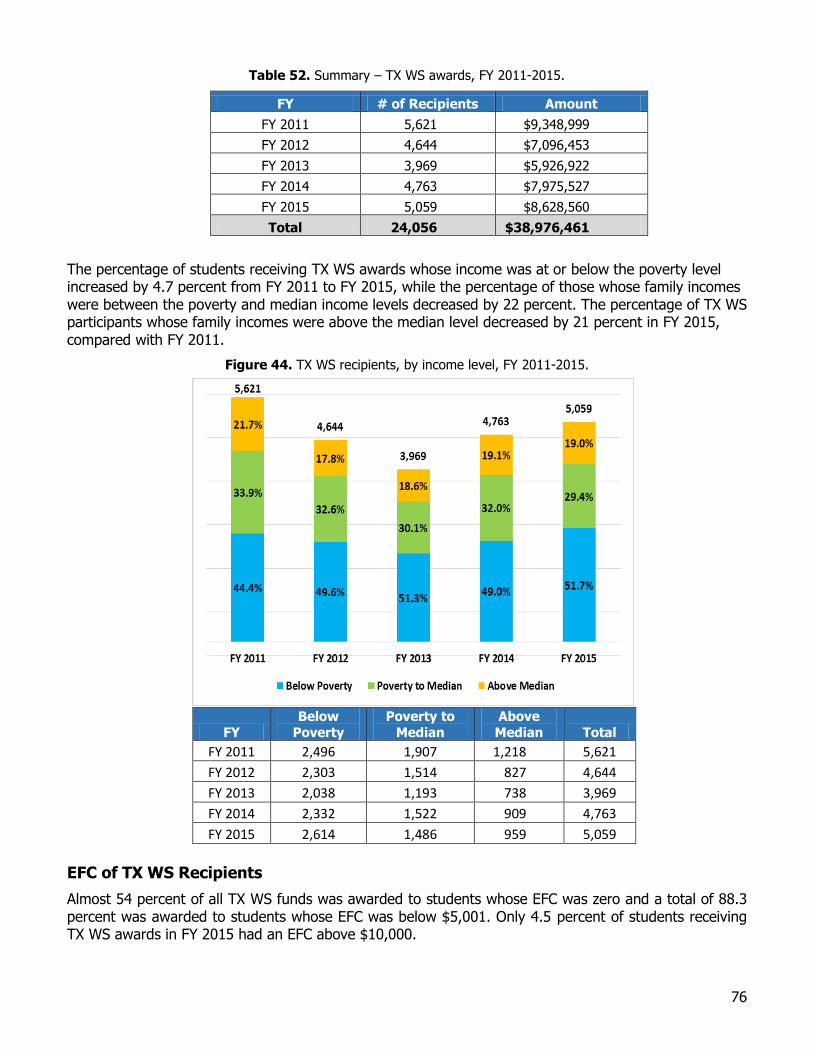
76
Table 52. Summary – TX WS awards, FY 2011-2015.
FY # of Recipients Amount
FY 2011 5,621 $9,348,999
FY 2012 4,644 $7,096,453
FY 2013 3,969 $5,926,922
FY 2014 4,763 $7,975,527
FY 2015 5,059 $8,628,560
Total 24,056 $38,976,461
The percentage of students receiving TX WS awards whose income was at or below the poverty level increased by 4.7 percent from FY 2011 to FY 2015, while the percentage of those whose family incomes were between the poverty and median income levels decreased by 22 percent. The percentage of TX WS participants whose family incomes were above the median level decreased by 21 percent in FY 2015, compared with FY 2011.
Figure 44. TX WS recipients, by income level, FY 2011-2015.
FY
Below
Poverty
Poverty to
Median
Above
Median Total
FY 2011 2,496 1,907 1,218 5,621
FY 2012 2,303 1,514 827 4,644
FY 2013 2,038 1,193 738 3,969
FY 2014 2,332 1,522 909 4,763
FY 2015 2,614 1,486 959 5,059
EFC of TX WS Recipients
Almost 54 percent of all TX WS funds was awarded to students whose EFC was zero and a total of 88.3 percent was awarded to students whose EFC was below $5,001. Only 4.5 percent of students receiving TX WS awards in FY 2015 had an EFC above $10,000.
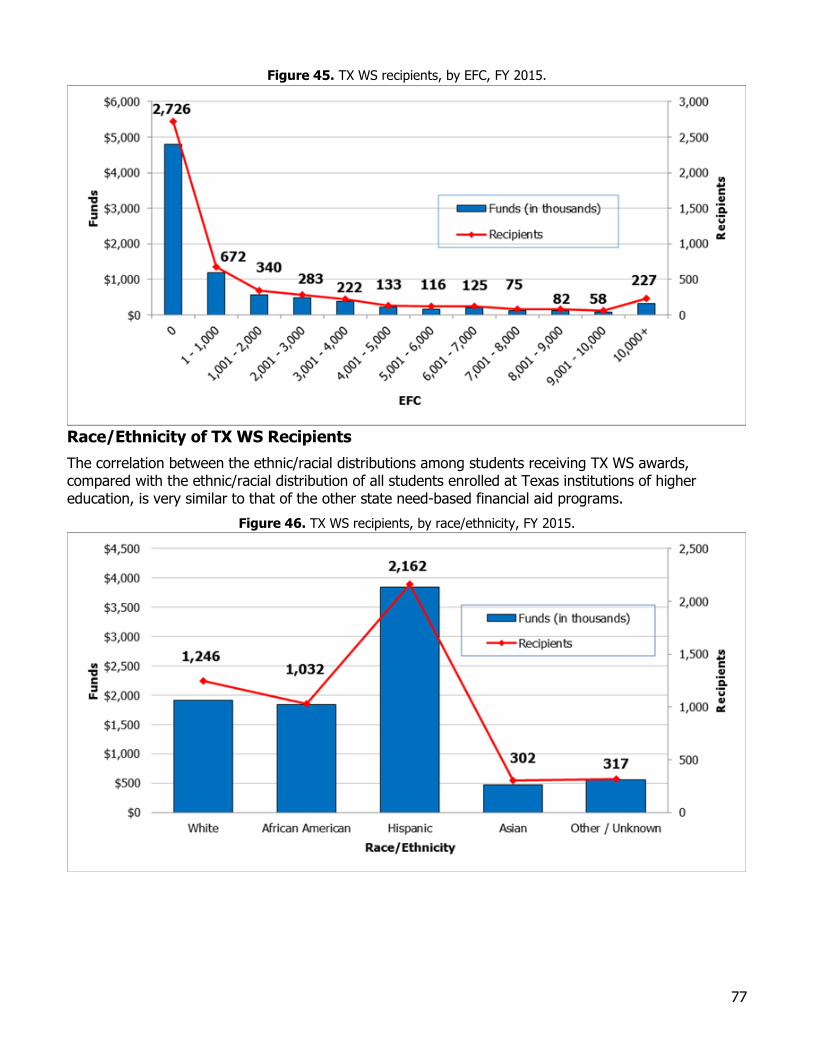
77
Figure 45. TX WS recipients, by EFC, FY 2015.
Race/Ethnicity of TX WS Recipients
The correlation between the ethnic/racial distributions among students receiving TX WS awards, compared with the ethnic/racial distribution of all students enrolled at Texas institutions of higher education, is very similar to that of the other state need-based financial aid programs.
Figure 46. TX WS recipients, by race/ethnicity, FY 2015.
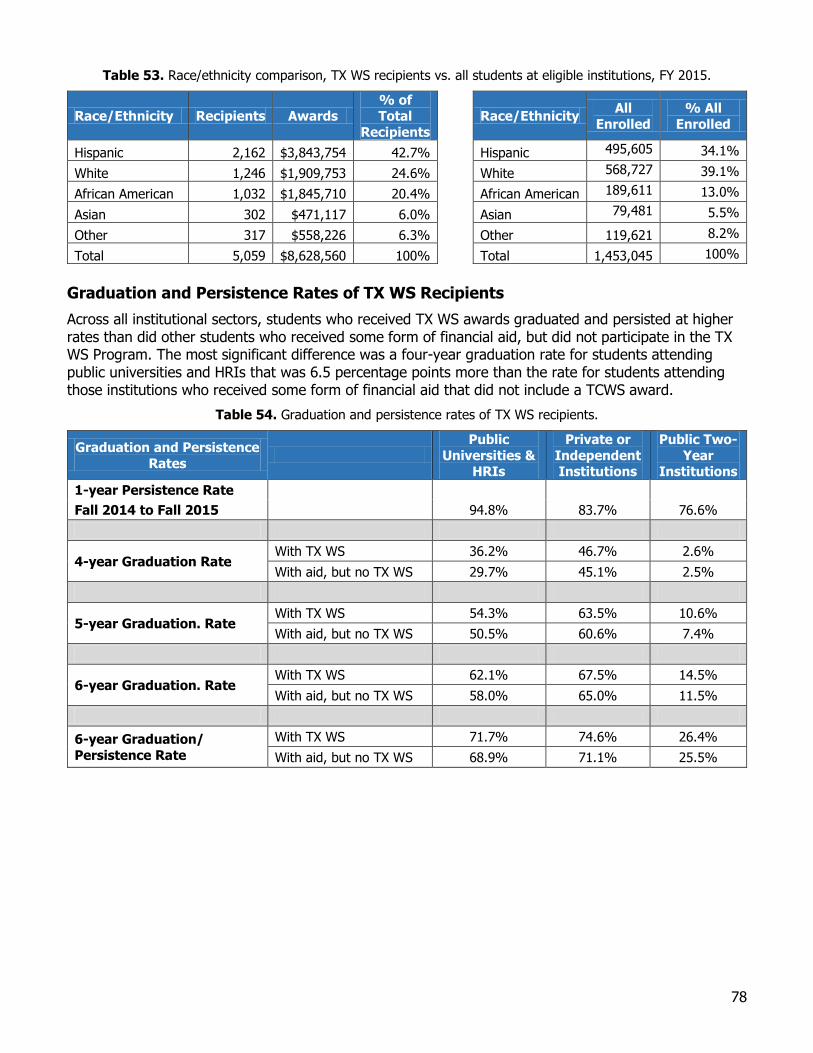
78
Table 53. Race/ethnicity comparison, TX WS recipients vs. all students at eligible institutions, FY 2015.
Race/Ethnicity Recipients Awards % of Total
Recipients Race/Ethnicity
All
Enrolled
% All
Enrolled
Hispanic 2,162 $3,843,754 42.7% Hispanic 495,605 34.1%
White 1,246 $1,909,753 24.6% White 568,727 39.1%
African American 1,032 $1,845,710 20.4% African American 189,611 13.0%
Asian 302 $471,117 6.0% Asian 79,481 5.5%
Other 317 $558,226 6.3% Other 119,621 8.2%
Total 5,059 $8,628,560 100% Total 1,453,045 100%
Graduation and Persistence Rates of TX WS Recipients
Across all institutional sectors, students who received TX WS awards graduated and persisted at higher rates than did other students who received some form of financial aid, but did not participate in the TX WS Program. The most significant difference was a four-year graduation rate for students attending public universities and HRIs that was 6.5 percentage points more than the rate for students attending those institutions who received some form of financial aid that did not include a TCWS award.
Table 54. Graduation and persistence rates of TX WS recipients.
Graduation and Persistence
Rates
Public
Universities & HRIs
Private or
Independent Institutions
Public Two-
Year Institutions
1-year Persistence Rate
Fall 2014 to Fall 2015 94.8% 83.7% 76.6%
4-year Graduation Rate With TX WS 36.2% 46.7% 2.6%
With aid, but no TX WS 29.7% 45.1% 2.5%
5-year Graduation. Rate With TX WS 54.3% 63.5% 10.6%
With aid, but no TX WS 50.5% 60.6% 7.4%
6-year Graduation. Rate With TX WS 62.1% 67.5% 14.5%
With aid, but no TX WS 58.0% 65.0% 11.5%
6-year Graduation/
Persistence Rate
With TX WS 71.7% 74.6% 26.4%
With aid, but no TX WS 68.9% 71.1% 25.5%
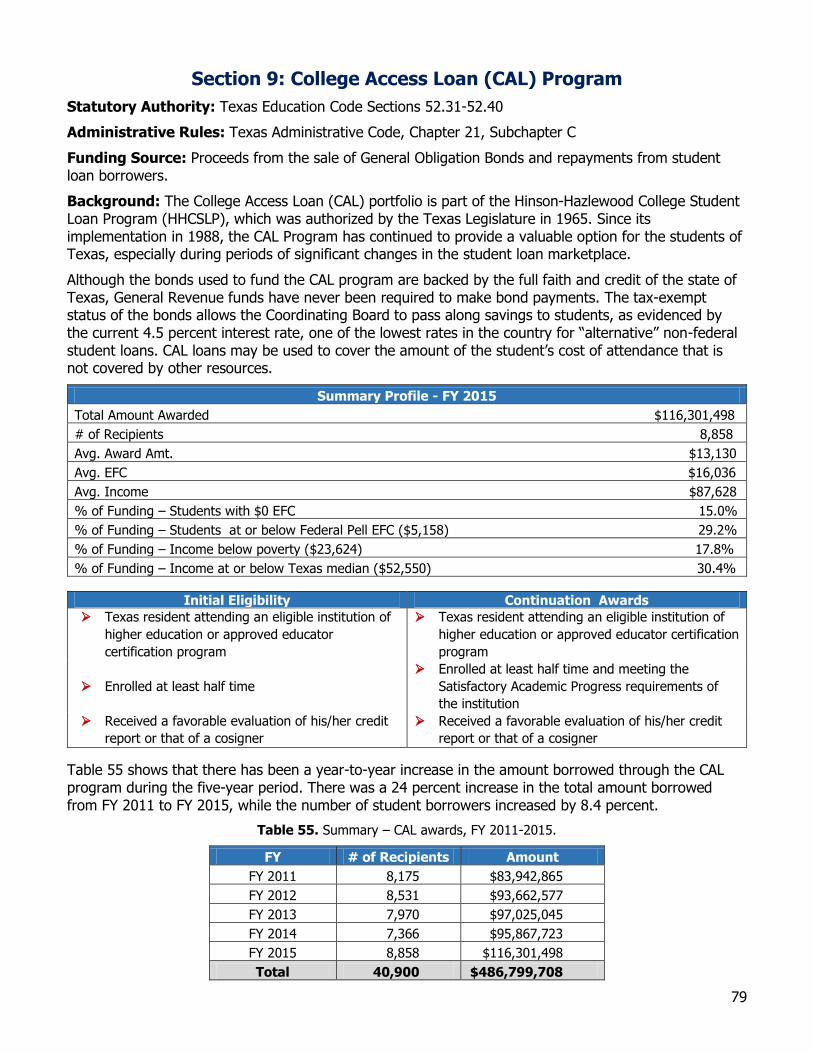
79
Section 9: College Access Loan (CAL) Program
Statutory Authority: Texas Education Code Sections 52.31-52.40
Administrative Rules: Texas Administrative Code, Chapter 21, Subchapter C
Funding Source: Proceeds from the sale of General Obligation Bonds and repayments from student loan borrowers.
Background: The College Access Loan (CAL) portfolio is part of the Hinson-Hazlewood College Student Loan Program (HHCSLP), which was authorized by the Texas Legislature in 1965. Since its implementation in 1988, the CAL Program has continued to provide a valuable option for the students of Texas, especially during periods of significant changes in the student loan marketplace.
Although the bonds used to fund the CAL program are backed by the full faith and credit of the state of Texas, General Revenue funds have never been required to make bond payments. The tax-exempt status of the bonds allows the Coordinating Board to pass along savings to students, as evidenced by the current 4.5 percent interest rate, one of the lowest rates in the country for “alternative” non-federal student loans. CAL loans may be used to cover the amount of the student’s cost of attendance that is not covered by other resources.
Summary Profile - FY 2015
Total Amount Awarded $116,301,498
# of Recipients 8,858
Avg. Award Amt. $13,130
Avg. EFC $16,036
Avg. Income $87,628
% of Funding – Students with $0 EFC 15.0%
% of Funding – Students at or below Federal Pell EFC ($5,158) 29.2%
% of Funding – Income below poverty ($23,624) 17.8%
% of Funding – Income at or below Texas median ($52,550) 30.4%
Initial Eligibility Continuation Awards
Texas resident attending an eligible institution of
higher education or approved educator
certification program
Texas resident attending an eligible institution of
higher education or approved educator certification
program
Enrolled at least half time
Enrolled at least half time and meeting the
Satisfactory Academic Progress requirements of
the institution
Received a favorable evaluation of his/her credit
report or that of a cosigner
Received a favorable evaluation of his/her credit
report or that of a cosigner
Table 55 shows that there has been a year-to-year increase in the amount borrowed through the CAL program during the five-year period. There was a 24 percent increase in the total amount borrowed from FY 2011 to FY 2015, while the number of student borrowers increased by 8.4 percent.
Table 55. Summary – CAL awards, FY 2011-2015.
FY # of Recipients Amount
FY 2011 8,175 $83,942,865
FY 2012 8,531 $93,662,577
FY 2013 7,970 $97,025,045
FY 2014 7,366 $95,867,723
FY 2015 8,858 $116,301,498
Total 40,900 $486,799,708
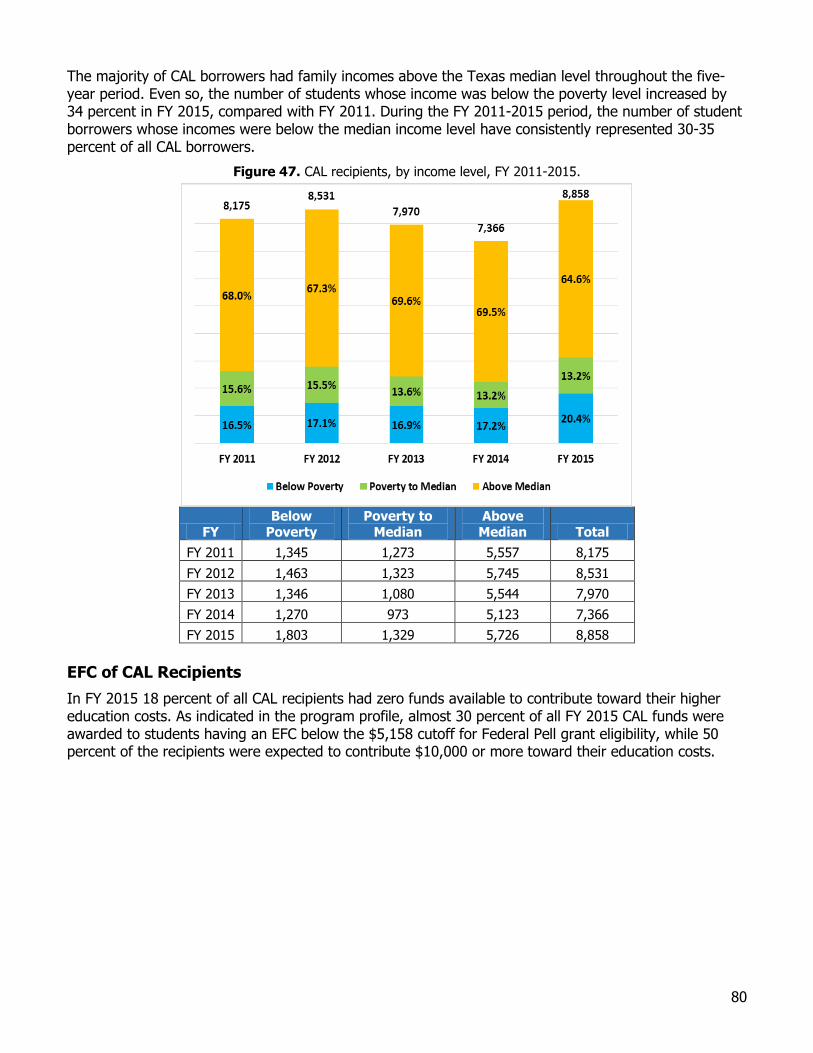
80
The majority of CAL borrowers had family incomes above the Texas median level throughout the five-year period. Even so, the number of students whose income was below the poverty level increased by 34 percent in FY 2015, compared with FY 2011. During the FY 2011-2015 period, the number of student borrowers whose incomes were below the median income level have consistently represented 30-35 percent of all CAL borrowers.
Figure 47. CAL recipients, by income level, FY 2011-2015.
FY Below
Poverty Poverty to
Median Above Median Total
FY 2011 1,345 1,273 5,557 8,175
FY 2012 1,463 1,323 5,745 8,531
FY 2013 1,346 1,080 5,544 7,970
FY 2014 1,270 973 5,123 7,366
FY 2015 1,803 1,329 5,726 8,858
EFC of CAL Recipients
In FY 2015 18 percent of all CAL recipients had zero funds available to contribute toward their higher education costs. As indicated in the program profile, almost 30 percent of all FY 2015 CAL funds were awarded to students having an EFC below the $5,158 cutoff for Federal Pell grant eligibility, while 50 percent of the recipients were expected to contribute $10,000 or more toward their education costs.
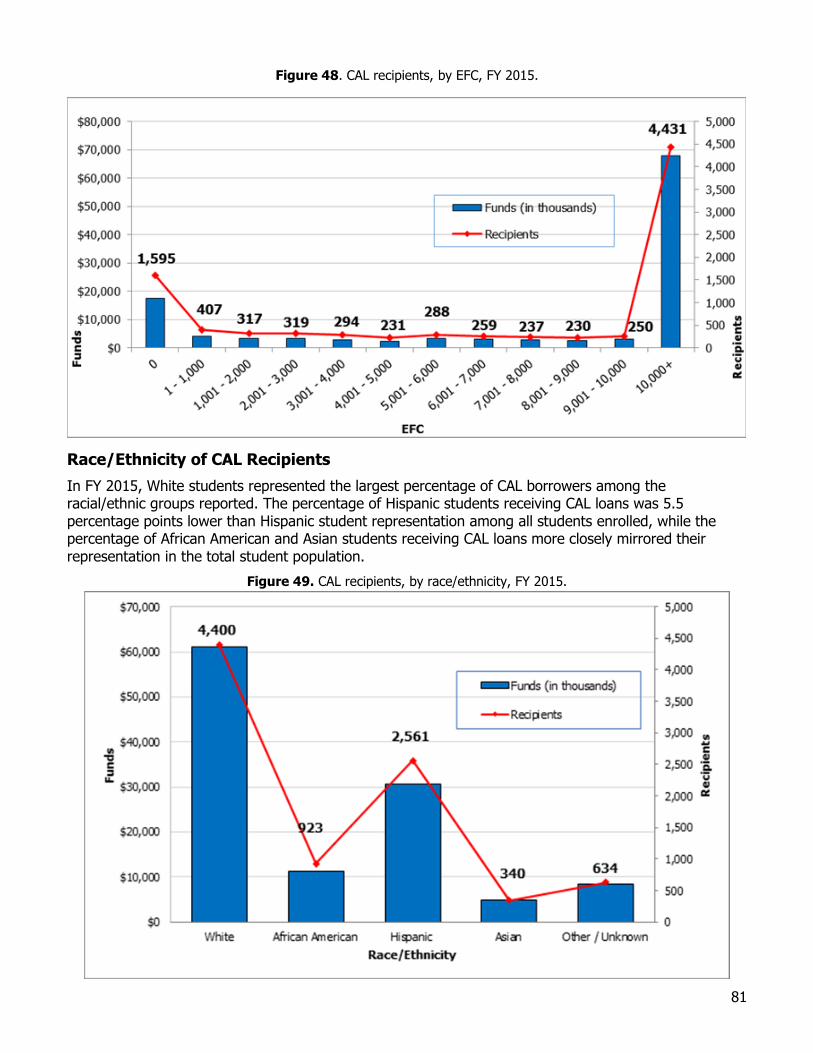
81
Figure 48. CAL recipients, by EFC, FY 2015.
Race/Ethnicity of CAL Recipients
In FY 2015, White students represented the largest percentage of CAL borrowers among the racial/ethnic groups reported. The percentage of Hispanic students receiving CAL loans was 5.5 percentage points lower than Hispanic student representation among all students enrolled, while the percentage of African American and Asian students receiving CAL loans more closely mirrored their representation in the total student population.
Figure 49. CAL recipients, by race/ethnicity, FY 2015.
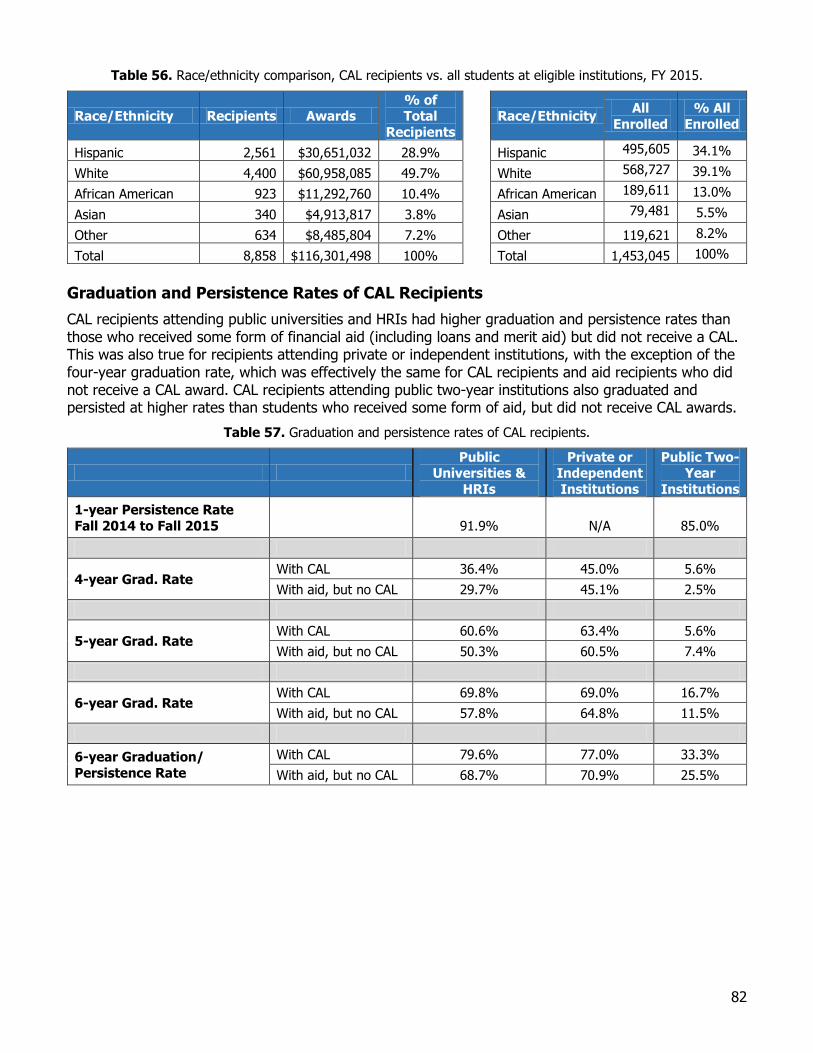
82
Table 56. Race/ethnicity comparison, CAL recipients vs. all students at eligible institutions, FY 2015.
Race/Ethnicity Recipients Awards % of Total
Recipients Race/Ethnicity
All
Enrolled
% All
Enrolled
Hispanic 2,561 $30,651,032 28.9% Hispanic 495,605 34.1%
White 4,400 $60,958,085 49.7% White 568,727 39.1%
African American 923 $11,292,760 10.4% African American 189,611 13.0%
Asian 340 $4,913,817 3.8% Asian 79,481 5.5%
Other 634 $8,485,804 7.2% Other 119,621 8.2%
Total 8,858 $116,301,498 100% Total 1,453,045 100%
Graduation and Persistence Rates of CAL Recipients
CAL recipients attending public universities and HRIs had higher graduation and persistence rates than those who received some form of financial aid (including loans and merit aid) but did not receive a CAL. This was also true for recipients attending private or independent institutions, with the exception of the four-year graduation rate, which was effectively the same for CAL recipients and aid recipients who did not receive a CAL award. CAL recipients attending public two-year institutions also graduated and persisted at higher rates than students who received some form of aid, but did not receive CAL awards.
Table 57. Graduation and persistence rates of CAL recipients.
Public
Universities &
HRIs
Private or Independent
Institutions
Public Two- Year
Institutions
1-year Persistence Rate
Fall 2014 to Fall 2015
91.9%
N/A
85.0%
4-year Grad. Rate With CAL 36.4% 45.0% 5.6%
With aid, but no CAL 29.7% 45.1% 2.5%
5-year Grad. Rate With CAL 60.6% 63.4% 5.6%
With aid, but no CAL 50.3% 60.5% 7.4%
6-year Grad. Rate With CAL 69.8% 69.0% 16.7%
With aid, but no CAL 57.8% 64.8% 11.5%
6-year Graduation/
Persistence Rate
With CAL 79.6% 77.0% 33.3%
With aid, but no CAL 68.7% 70.9% 25.5%
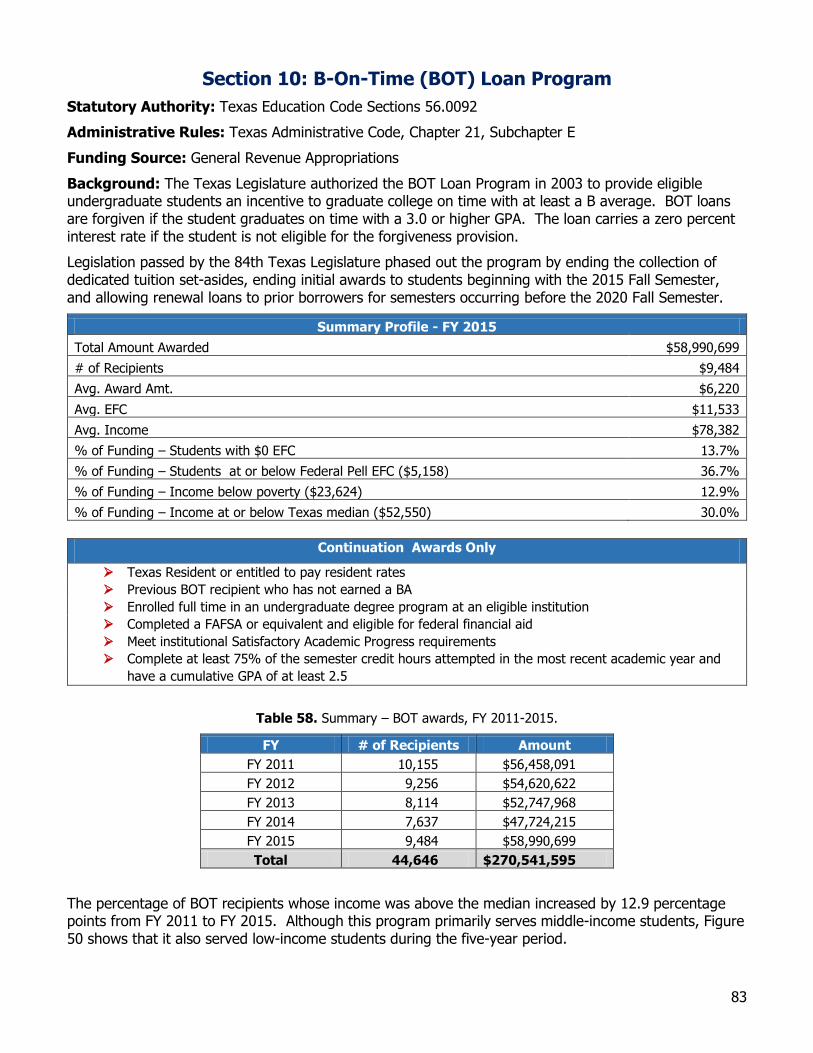
83
Section 10: B-On-Time (BOT) Loan Program
Statutory Authority: Texas Education Code Sections 56.0092
Administrative Rules: Texas Administrative Code, Chapter 21, Subchapter E
Funding Source: General Revenue Appropriations
Background: The Texas Legislature authorized the BOT Loan Program in 2003 to provide eligible undergraduate students an incentive to graduate college on time with at least a B average. BOT loans are forgiven if the student graduates on time with a 3.0 or higher GPA. The loan carries a zero percent interest rate if the student is not eligible for the forgiveness provision.
Legislation passed by the 84th Texas Legislature phased out the program by ending the collection of dedicated tuition set-asides, ending initial awards to students beginning with the 2015 Fall Semester, and allowing renewal loans to prior borrowers for semesters occurring before the 2020 Fall Semester.
Summary Profile - FY 2015
Total Amount Awarded $58,990,699
# of Recipients $9,484
Avg. Award Amt. $6,220
Avg. EFC $11,533
Avg. Income $78,382
% of Funding – Students with $0 EFC 13.7%
% of Funding – Students at or below Federal Pell EFC ($5,158) 36.7%
% of Funding – Income below poverty ($23,624) 12.9%
% of Funding – Income at or below Texas median ($52,550) 30.0%
Continuation Awards Only
Texas Resident or entitled to pay resident rates
Previous BOT recipient who has not earned a BA
Enrolled full time in an undergraduate degree program at an eligible institution
Completed a FAFSA or equivalent and eligible for federal financial aid
Meet institutional Satisfactory Academic Progress requirements
Complete at least 75% of the semester credit hours attempted in the most recent academic year and
have a cumulative GPA of at least 2.5
Table 58. Summary – BOT awards, FY 2011-2015.
FY # of Recipients Amount
FY 2011 10,155 $56,458,091
FY 2012 9,256 $54,620,622
FY 2013 8,114 $52,747,968
FY 2014 7,637 $47,724,215
FY 2015 9,484 $58,990,699
Total 44,646 $270,541,595
The percentage of BOT recipients whose income was above the median increased by 12.9 percentage points from FY 2011 to FY 2015. Although this program primarily serves middle-income students, Figure 50 shows that it also served low-income students during the five-year period.
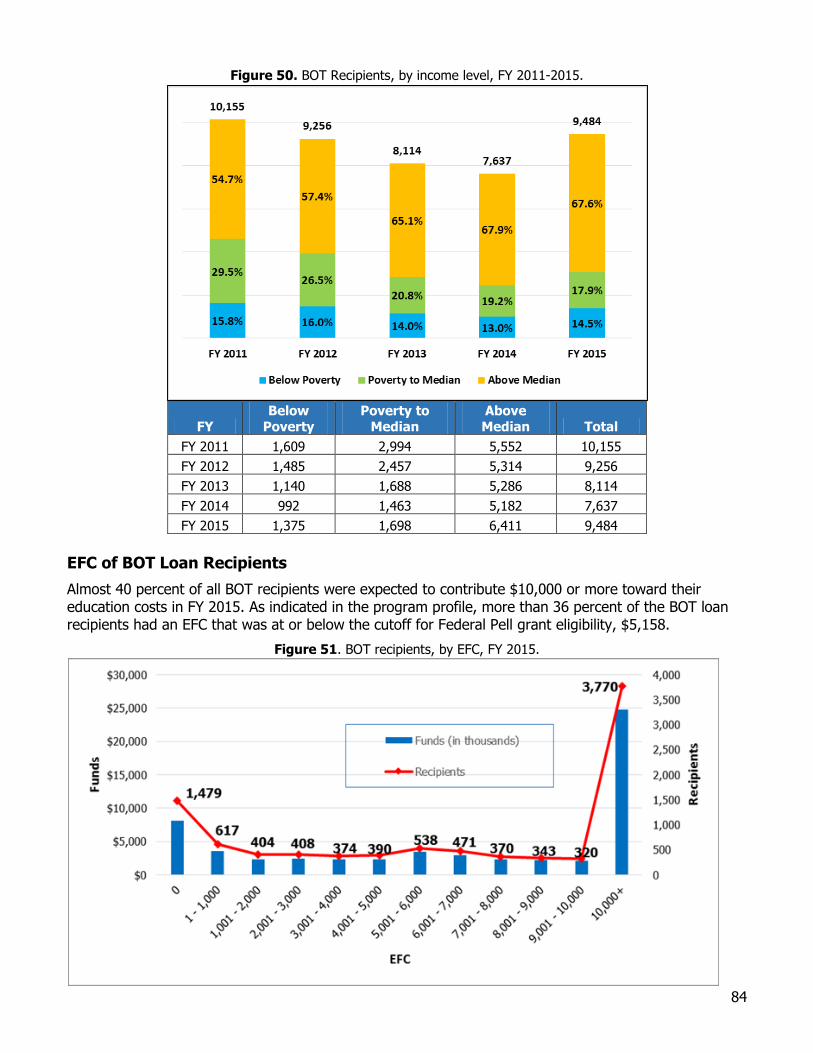
84
Figure 50. BOT Recipients, by income level, FY 2011-2015.
FY Below
Poverty Poverty to
Median Above Median Total
FY 2011 1,609 2,994 5,552 10,155
FY 2012 1,485 2,457 5,314 9,256
FY 2013 1,140 1,688 5,286 8,114
FY 2014 992 1,463 5,182 7,637
FY 2015 1,375 1,698 6,411 9,484
EFC of BOT Loan Recipients
Almost 40 percent of all BOT recipients were expected to contribute $10,000 or more toward their education costs in FY 2015. As indicated in the program profile, more than 36 percent of the BOT loan recipients had an EFC that was at or below the cutoff for Federal Pell grant eligibility, $5,158.
Figure 51. BOT recipients, by EFC, FY 2015.
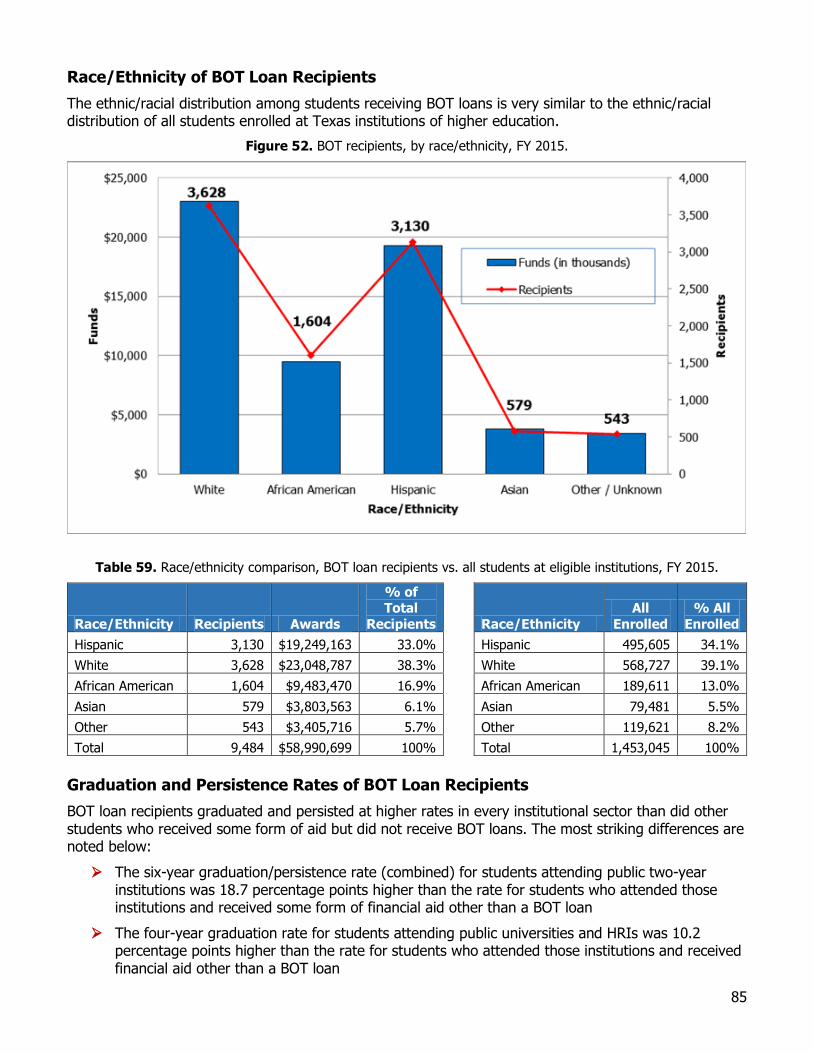
85
Race/Ethnicity of BOT Loan Recipients
The ethnic/racial distribution among students receiving BOT loans is very similar to the ethnic/racial distribution of all students enrolled at Texas institutions of higher education.
Figure 52. BOT recipients, by race/ethnicity, FY 2015.
Table 59. Race/ethnicity comparison, BOT loan recipients vs. all students at eligible institutions, FY 2015.
Race/Ethnicity Recipients Awards
% of Total
Recipients Race/Ethnicity
All
Enrolled
% All
Enrolled
Hispanic 3,130 $19,249,163 33.0% Hispanic 495,605 34.1%
White 3,628 $23,048,787 38.3% White 568,727 39.1%
African American 1,604 $9,483,470 16.9% African American 189,611 13.0%
Asian 579 $3,803,563 6.1% Asian 79,481 5.5%
Other 543 $3,405,716 5.7% Other 119,621 8.2%
Total 9,484 $58,990,699 100% Total 1,453,045 100%
Graduation and Persistence Rates of BOT Loan Recipients
BOT loan recipients graduated and persisted at higher rates in every institutional sector than did other students who received some form of aid but did not receive BOT loans. The most striking differences are noted below:
The six-year graduation/persistence rate (combined) for students attending public two-year institutions was 18.7 percentage points higher than the rate for students who attended those institutions and received some form of financial aid other than a BOT loan
The four-year graduation rate for students attending public universities and HRIs was 10.2 percentage points higher than the rate for students who attended those institutions and received financial aid other than a BOT loan
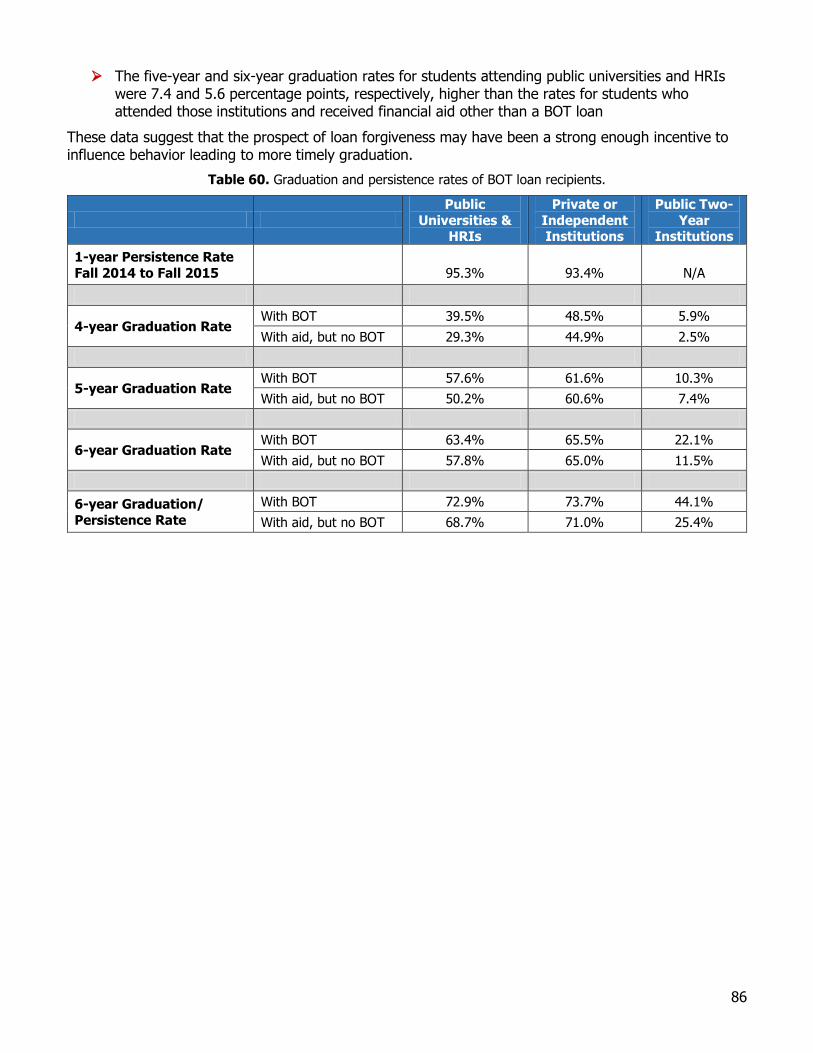
86
The five-year and six-year graduation rates for students attending public universities and HRIs were 7.4 and 5.6 percentage points, respectively, higher than the rates for students who attended those institutions and received financial aid other than a BOT loan
These data suggest that the prospect of loan forgiveness may have been a strong enough incentive to influence behavior leading to more timely graduation.
Table 60. Graduation and persistence rates of BOT loan recipients.
Public
Universities & HRIs
Private or
Independent Institutions
Public Two-
Year Institutions
1-year Persistence Rate
Fall 2014 to Fall 2015
95.3%
93.4%
N/A
4-year Graduation Rate With BOT 39.5% 48.5% 5.9%
With aid, but no BOT 29.3% 44.9% 2.5%
5-year Graduation Rate With BOT 57.6% 61.6% 10.3%
With aid, but no BOT 50.2% 60.6% 7.4%
6-year Graduation Rate With BOT 63.4% 65.5% 22.1%
With aid, but no BOT 57.8% 65.0% 11.5%
6-year Graduation/
Persistence Rate
With BOT 72.9% 73.7% 44.1%
With aid, but no BOT 68.7% 71.0% 25.4%
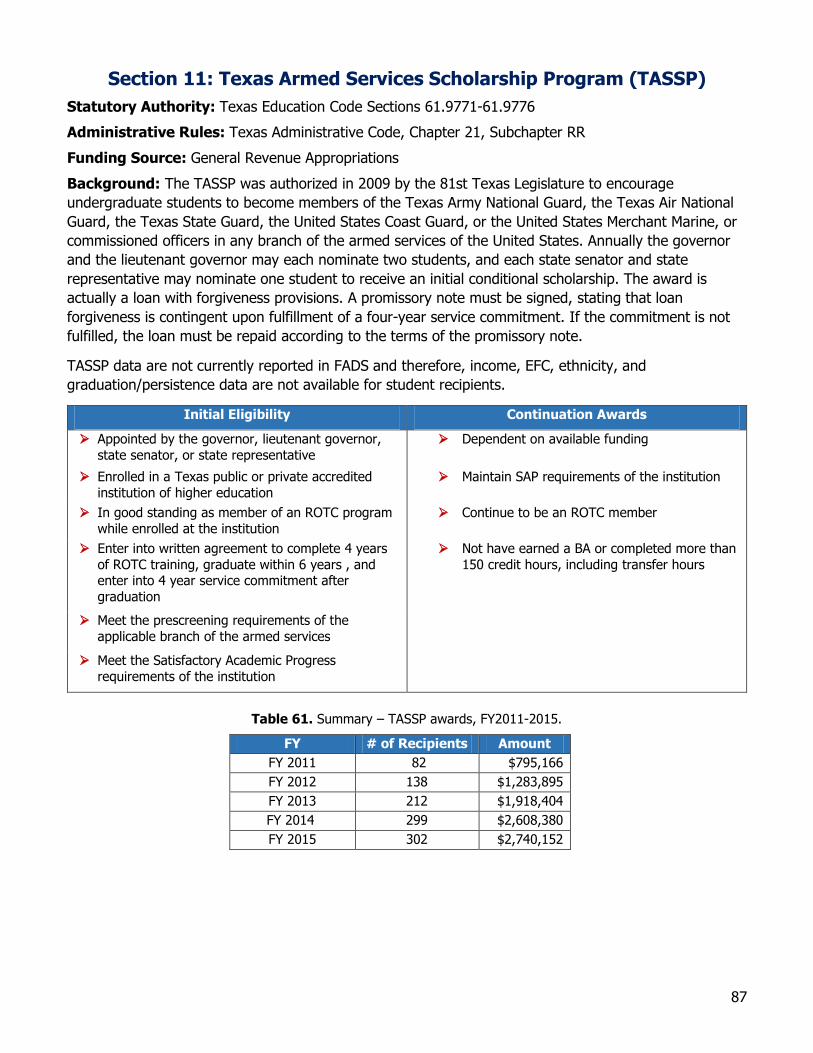
87
Section 11: Texas Armed Services Scholarship Program (TASSP)
Statutory Authority: Texas Education Code Sections 61.9771-61.9776
Administrative Rules: Texas Administrative Code, Chapter 21, Subchapter RR
Funding Source: General Revenue Appropriations
Background: The TASSP was authorized in 2009 by the 81st Texas Legislature to encourage
undergraduate students to become members of the Texas Army National Guard, the Texas Air National
Guard, the Texas State Guard, the United States Coast Guard, or the United States Merchant Marine, or
commissioned officers in any branch of the armed services of the United States. Annually the governor
and the lieutenant governor may each nominate two students, and each state senator and state
representative may nominate one student to receive an initial conditional scholarship. The award is
actually a loan with forgiveness provisions. A promissory note must be signed, stating that loan
forgiveness is contingent upon fulfillment of a four-year service commitment. If the commitment is not
fulfilled, the loan must be repaid according to the terms of the promissory note.
TASSP data are not currently reported in FADS and therefore, income, EFC, ethnicity, and
graduation/persistence data are not available for student recipients.
Initial Eligibility Continuation Awards
Appointed by the governor, lieutenant governor,
state senator, or state representative
Dependent on available funding
Enrolled in a Texas public or private accredited
institution of higher education
Maintain SAP requirements of the institution
In good standing as member of an ROTC program
while enrolled at the institution
Continue to be an ROTC member
Enter into written agreement to complete 4 years
of ROTC training, graduate within 6 years , and enter into 4 year service commitment after
graduation
Not have earned a BA or completed more than
150 credit hours, including transfer hours
Meet the prescreening requirements of the
applicable branch of the armed services
Meet the Satisfactory Academic Progress
requirements of the institution
Table 61. Summary – TASSP awards, FY2011-2015.
FY # of Recipients Amount
FY 2011 82 $795,166
FY 2012 138 $1,283,895
FY 2013 212 $1,918,404
FY 2014 299 $2,608,380
FY 2015 302 $2,740,152
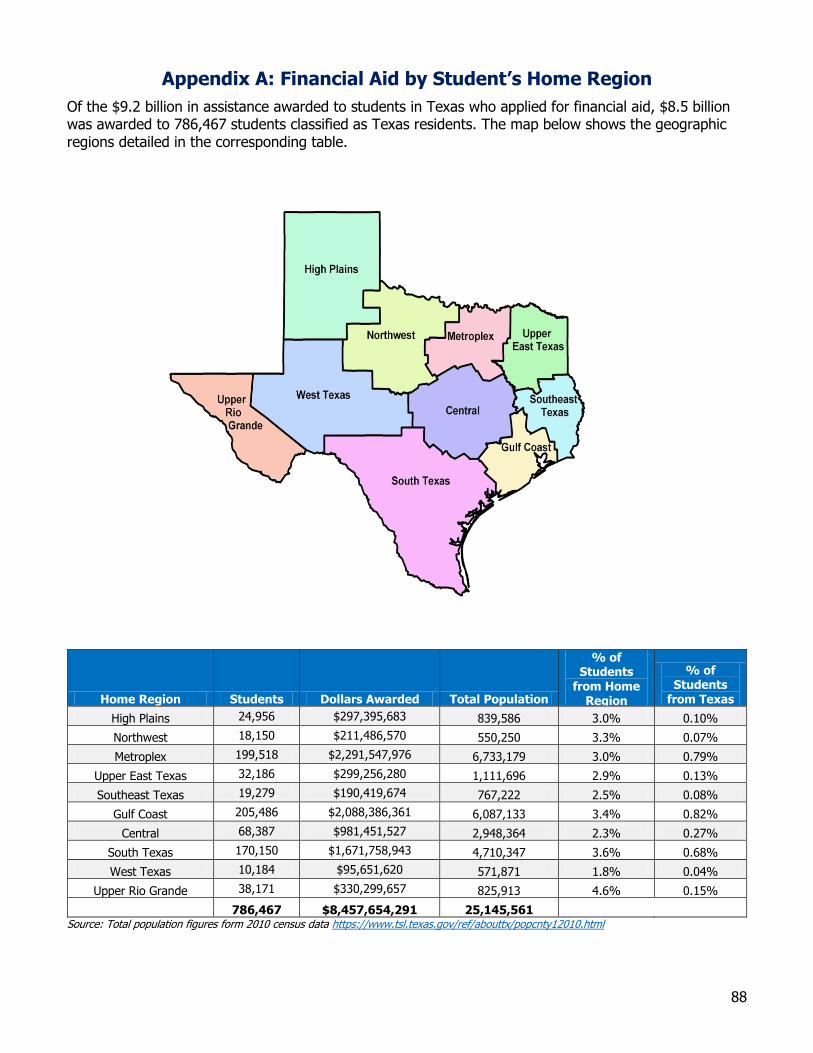
88
Appendix A: Financial Aid by Student’s Home Region
Of the $9.2 billion in assistance awarded to students in Texas who applied for financial aid, $8.5 billion was awarded to 786,467 students classified as Texas residents. The map below shows the geographic regions detailed in the corresponding table.
Home Region Students Dollars Awarded Total Population
% of Students
from Home Region
% of Students
from Texas
High Plains 24,956 $297,395,683 839,586 3.0% 0.10%
Northwest 18,150 $211,486,570 550,250 3.3% 0.07%
Metroplex 199,518 $2,291,547,976 6,733,179 3.0% 0.79%
Upper East Texas 32,186 $299,256,280 1,111,696 2.9% 0.13%
Southeast Texas 19,279 $190,419,674 767,222 2.5% 0.08%
Gulf Coast 205,486 $2,088,386,361 6,087,133 3.4% 0.82%
Central 68,387 $981,451,527 2,948,364 2.3% 0.27%
South Texas 170,150 $1,671,758,943 4,710,347 3.6% 0.68%
West Texas 10,184 $95,651,620 571,871 1.8% 0.04%
Upper Rio Grande 38,171 $330,299,657 825,913 4.6% 0.15%
786,467 $8,457,654,291 25,145,561
Source: Total population figures form 2010 census data https://www.tsl.texas.gov/ref/abouttx/popcnty12010.html
89
Appendix B: Institutions Included in the Financial Aid Database
Public Universities Angelo State University Lamar University Midwestern State University Prairie View A&M University Sam Houston State University Stephen F. Austin State University Sul Ross State University Tarleton State University Texas A&M University Texas A&M University-Commerce Texas A&M University-Corpus Christi Texas A&M University at Galveston Texas A&M International University Texas A&M University-Kingsville Texas A&M University-San Antonio Texas A&M University-Texarkana Texas Southern University Texas State University Texas Tech University Texas Woman's University The University of Texas at Arlington The University of Texas at Austin The University of Texas at Brownsville The University of Texas at Dallas The University of Texas at El Paso The University of Texas of the Basin The University of Texas-Pan American The University of Texas at San Antonio The University of Texas at Tyler University of Houston University of Houston-Clear Lake University of Houston-Downtown University of Houston-Victoria University of North Texas West Texas A&M University Private or Independent Universities Abilene Christian University Austin College Baylor University Concordia University Texas Dallas Baptist University East Texas Baptist University Hardin-Simmons University Houston Baptist University Howard Payne University Huston-Tillotson University Jarvis Christian College Letourneau University
Lubbock Christian University McMurry University Our Lady of the Lake University of San Antonio Paul Quinn College Rice University Schreiner University South Texas College of Law Southern Methodist University Southwestern Adventist University Southwestern Assemblies of God University Southwestern Christian College Southwestern University St. Edward's University St. Mary's University Texas Christian University Texas College Texas Lutheran University Texas Wesleyan University Trinity University University of Dallas University of Mary Hardin-Baylor University of St. Thomas University of the Incarnate Word Wayland Baptist University Wiley College Public Community Colleges Alamo Community College-Northeast
Lakeview College Alamo Community College-Northwest Vista
College Alamo Community College-Palo Alto College Alamo Community College-San Antonio College Alamo Community College-St. Philip’s College Alvin Community College Amarillo College Angelina College Austin Community College Blinn College Brazosport College Central Texas College Cisco College Clarendon College Coastal Bend College
90
Public Community Colleges (cont.) College of the Mainland Community College
District Collin County Community College District Dallas County Community College District Del Mar College El Paso Community College District Frank Phillips College Galveston College Grayson County College Hill College Houston Community College Howard County Junior College District Kilgore College Laredo Community College Lee College Lone Star College System McLennan Community College Midland College Navarro College North Central College Northeast Texas Community College Odessa College Panola College Paris Junior College Ranger College San Jacinto Community College District South Plains College South Texas College Southwest Texas Junior College Tarrant County College District Temple College Texarkana College Texas Southmost College Trinity Valley Community College Tyler Junior College Vernon College Victoria College Weatherford College Western Texas College Wharton County Junior College
Private Junior Colleges Jacksonville College
Public Health-Related Institutions Texas Tech University Health Sciences
Center Texas A&M University System Health
Science Center The University of Texas Health Science
Center of Houston The University of Texas Health Science
Center at San Antonio The University of Texas M.D. Anderson
Cancer Center The University of Texas Medical Branch at
Galveston The University of Texas Southwestern
Medical Center University of North Texas Health Science
Center Private Health-Related Institutions Baylor College of Medicine-Medical School Parker University Texas Chiropractic College Public State Colleges Lamar Institute of Technology Lamar State College-Orange Lamar State College-Port Arthur Public Technical Institutes
Texas State Technical College-Harlingen Texas State Technical College-Marshall Texas State Technical College-Waco Texas State Technical College-West Texas
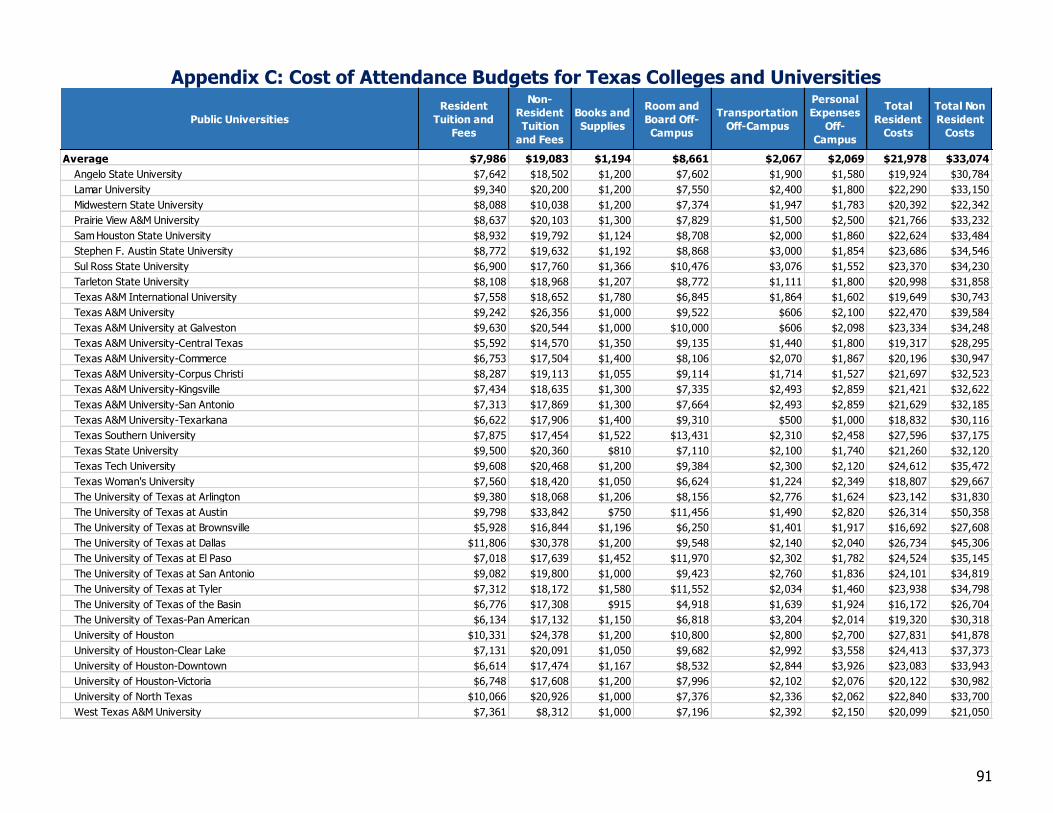
91
Appendix C: Cost of Attendance Budgets for Texas Colleges and Universities
Public Universities
Resident
Tuition and
Fees
Non-
Resident
Tuition
and Fees
Books and
Supplies
Room and
Board Off-
Campus
Transportation
Off-Campus
Personal
Expenses
Off-
Campus
Total
Resident
Costs
Total Non
Resident
Costs
Average $7,986 $19,083 $1,194 $8,661 $2,067 $2,069 $21,978 $33,074
Angelo State University $7,642 $18,502 $1,200 $7,602 $1,900 $1,580 $19,924 $30,784
Lamar University $9,340 $20,200 $1,200 $7,550 $2,400 $1,800 $22,290 $33,150
Midwestern State University $8,088 $10,038 $1,200 $7,374 $1,947 $1,783 $20,392 $22,342
Prairie View A&M University $8,637 $20,103 $1,300 $7,829 $1,500 $2,500 $21,766 $33,232
Sam Houston State University $8,932 $19,792 $1,124 $8,708 $2,000 $1,860 $22,624 $33,484
Stephen F. Austin State University $8,772 $19,632 $1,192 $8,868 $3,000 $1,854 $23,686 $34,546
Sul Ross State University $6,900 $17,760 $1,366 $10,476 $3,076 $1,552 $23,370 $34,230
Tarleton State University $8,108 $18,968 $1,207 $8,772 $1,111 $1,800 $20,998 $31,858
Texas A&M International University $7,558 $18,652 $1,780 $6,845 $1,864 $1,602 $19,649 $30,743
Texas A&M University $9,242 $26,356 $1,000 $9,522 $606 $2,100 $22,470 $39,584
Texas A&M University at Galveston $9,630 $20,544 $1,000 $10,000 $606 $2,098 $23,334 $34,248
Texas A&M University-Central Texas $5,592 $14,570 $1,350 $9,135 $1,440 $1,800 $19,317 $28,295
Texas A&M University-Commerce $6,753 $17,504 $1,400 $8,106 $2,070 $1,867 $20,196 $30,947
Texas A&M University-Corpus Christi $8,287 $19,113 $1,055 $9,114 $1,714 $1,527 $21,697 $32,523
Texas A&M University-Kingsville $7,434 $18,635 $1,300 $7,335 $2,493 $2,859 $21,421 $32,622
Texas A&M University-San Antonio $7,313 $17,869 $1,300 $7,664 $2,493 $2,859 $21,629 $32,185
Texas A&M University-Texarkana $6,622 $17,906 $1,400 $9,310 $500 $1,000 $18,832 $30,116
Texas Southern University $7,875 $17,454 $1,522 $13,431 $2,310 $2,458 $27,596 $37,175
Texas State University $9,500 $20,360 $810 $7,110 $2,100 $1,740 $21,260 $32,120
Texas Tech University $9,608 $20,468 $1,200 $9,384 $2,300 $2,120 $24,612 $35,472
Texas Woman's University $7,560 $18,420 $1,050 $6,624 $1,224 $2,349 $18,807 $29,667
The University of Texas at Arlington $9,380 $18,068 $1,206 $8,156 $2,776 $1,624 $23,142 $31,830
The University of Texas at Austin $9,798 $33,842 $750 $11,456 $1,490 $2,820 $26,314 $50,358
The University of Texas at Brownsville $5,928 $16,844 $1,196 $6,250 $1,401 $1,917 $16,692 $27,608
The University of Texas at Dallas $11,806 $30,378 $1,200 $9,548 $2,140 $2,040 $26,734 $45,306
The University of Texas at El Paso $7,018 $17,639 $1,452 $11,970 $2,302 $1,782 $24,524 $35,145
The University of Texas at San Antonio $9,082 $19,800 $1,000 $9,423 $2,760 $1,836 $24,101 $34,819
The University of Texas at Tyler $7,312 $18,172 $1,580 $11,552 $2,034 $1,460 $23,938 $34,798
The University of Texas of the Basin $6,776 $17,308 $915 $4,918 $1,639 $1,924 $16,172 $26,704
The University of Texas-Pan American $6,134 $17,132 $1,150 $6,818 $3,204 $2,014 $19,320 $30,318
University of Houston $10,331 $24,378 $1,200 $10,800 $2,800 $2,700 $27,831 $41,878
University of Houston-Clear Lake $7,131 $20,091 $1,050 $9,682 $2,992 $3,558 $24,413 $37,373
University of Houston-Downtown $6,614 $17,474 $1,167 $8,532 $2,844 $3,926 $23,083 $33,943
University of Houston-Victoria $6,748 $17,608 $1,200 $7,996 $2,102 $2,076 $20,122 $30,982
University of North Texas $10,066 $20,926 $1,000 $7,376 $2,336 $2,062 $22,840 $33,700
West Texas A&M University $7,361 $8,312 $1,000 $7,196 $2,392 $2,150 $20,099 $21,050
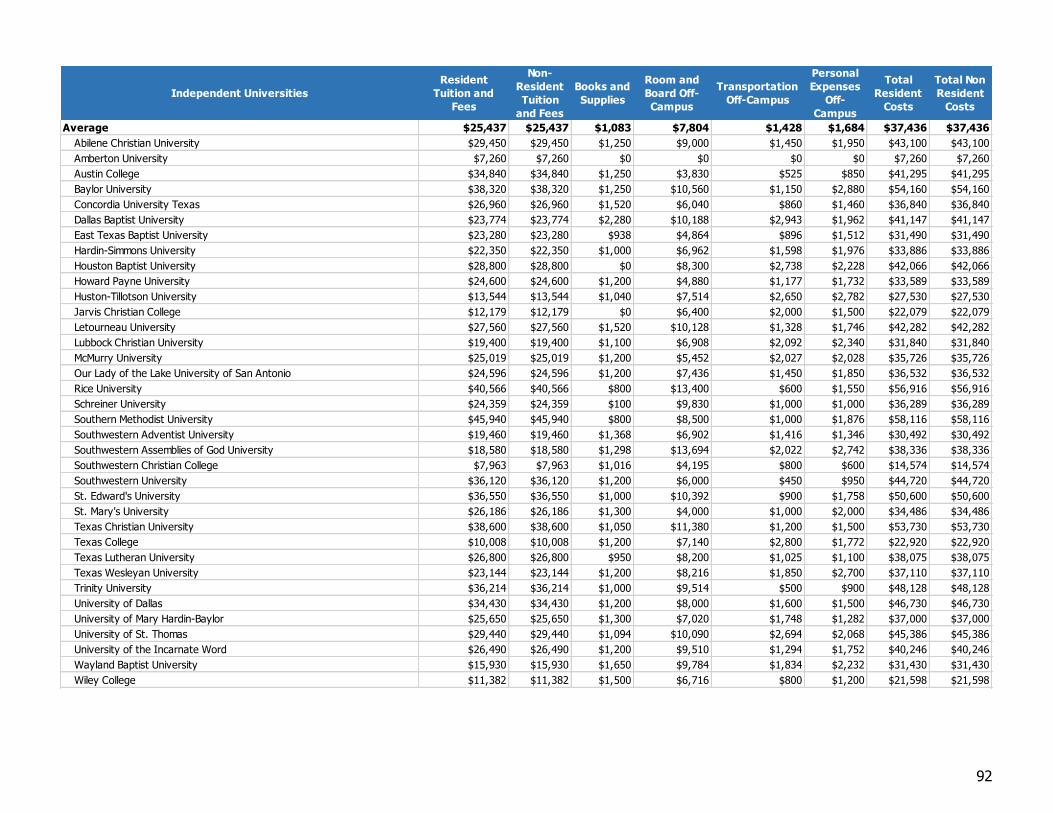
92
Independent Universities
Resident
Tuition and
Fees
Non-
Resident
Tuition
and Fees
Books and
Supplies
Room and
Board Off-
Campus
Transportation
Off-Campus
Personal
Expenses
Off-
Campus
Total
Resident
Costs
Total Non
Resident
Costs
Average $25,437 $25,437 $1,083 $7,804 $1,428 $1,684 $37,436 $37,436
Abilene Christian University $29,450 $29,450 $1,250 $9,000 $1,450 $1,950 $43,100 $43,100
Amberton University $7,260 $7,260 $0 $0 $0 $0 $7,260 $7,260
Austin College $34,840 $34,840 $1,250 $3,830 $525 $850 $41,295 $41,295
Baylor University $38,320 $38,320 $1,250 $10,560 $1,150 $2,880 $54,160 $54,160
Concordia University Texas $26,960 $26,960 $1,520 $6,040 $860 $1,460 $36,840 $36,840
Dallas Baptist University $23,774 $23,774 $2,280 $10,188 $2,943 $1,962 $41,147 $41,147
East Texas Baptist University $23,280 $23,280 $938 $4,864 $896 $1,512 $31,490 $31,490
Hardin-Simmons University $22,350 $22,350 $1,000 $6,962 $1,598 $1,976 $33,886 $33,886
Houston Baptist University $28,800 $28,800 $0 $8,300 $2,738 $2,228 $42,066 $42,066
Howard Payne University $24,600 $24,600 $1,200 $4,880 $1,177 $1,732 $33,589 $33,589
Huston-Tillotson University $13,544 $13,544 $1,040 $7,514 $2,650 $2,782 $27,530 $27,530
Jarvis Christian College $12,179 $12,179 $0 $6,400 $2,000 $1,500 $22,079 $22,079
Letourneau University $27,560 $27,560 $1,520 $10,128 $1,328 $1,746 $42,282 $42,282
Lubbock Christian University $19,400 $19,400 $1,100 $6,908 $2,092 $2,340 $31,840 $31,840
McMurry University $25,019 $25,019 $1,200 $5,452 $2,027 $2,028 $35,726 $35,726
Our Lady of the Lake University of San Antonio $24,596 $24,596 $1,200 $7,436 $1,450 $1,850 $36,532 $36,532
Rice University $40,566 $40,566 $800 $13,400 $600 $1,550 $56,916 $56,916
Schreiner University $24,359 $24,359 $100 $9,830 $1,000 $1,000 $36,289 $36,289
Southern Methodist University $45,940 $45,940 $800 $8,500 $1,000 $1,876 $58,116 $58,116
Southwestern Adventist University $19,460 $19,460 $1,368 $6,902 $1,416 $1,346 $30,492 $30,492
Southwestern Assemblies of God University $18,580 $18,580 $1,298 $13,694 $2,022 $2,742 $38,336 $38,336
Southwestern Christian College $7,963 $7,963 $1,016 $4,195 $800 $600 $14,574 $14,574
Southwestern University $36,120 $36,120 $1,200 $6,000 $450 $950 $44,720 $44,720
St. Edward's University $36,550 $36,550 $1,000 $10,392 $900 $1,758 $50,600 $50,600
St. Mary's University $26,186 $26,186 $1,300 $4,000 $1,000 $2,000 $34,486 $34,486
Texas Christian University $38,600 $38,600 $1,050 $11,380 $1,200 $1,500 $53,730 $53,730
Texas College $10,008 $10,008 $1,200 $7,140 $2,800 $1,772 $22,920 $22,920
Texas Lutheran University $26,800 $26,800 $950 $8,200 $1,025 $1,100 $38,075 $38,075
Texas Wesleyan University $23,144 $23,144 $1,200 $8,216 $1,850 $2,700 $37,110 $37,110
Trinity University $36,214 $36,214 $1,000 $9,514 $500 $900 $48,128 $48,128
University of Dallas $34,430 $34,430 $1,200 $8,000 $1,600 $1,500 $46,730 $46,730
University of Mary Hardin-Baylor $25,650 $25,650 $1,300 $7,020 $1,748 $1,282 $37,000 $37,000
University of St. Thomas $29,440 $29,440 $1,094 $10,090 $2,694 $2,068 $45,386 $45,386
University of the Incarnate Word $26,490 $26,490 $1,200 $9,510 $1,294 $1,752 $40,246 $40,246
Wayland Baptist University $15,930 $15,930 $1,650 $9,784 $1,834 $2,232 $31,430 $31,430
Wiley College $11,382 $11,382 $1,500 $6,716 $800 $1,200 $21,598 $21,598
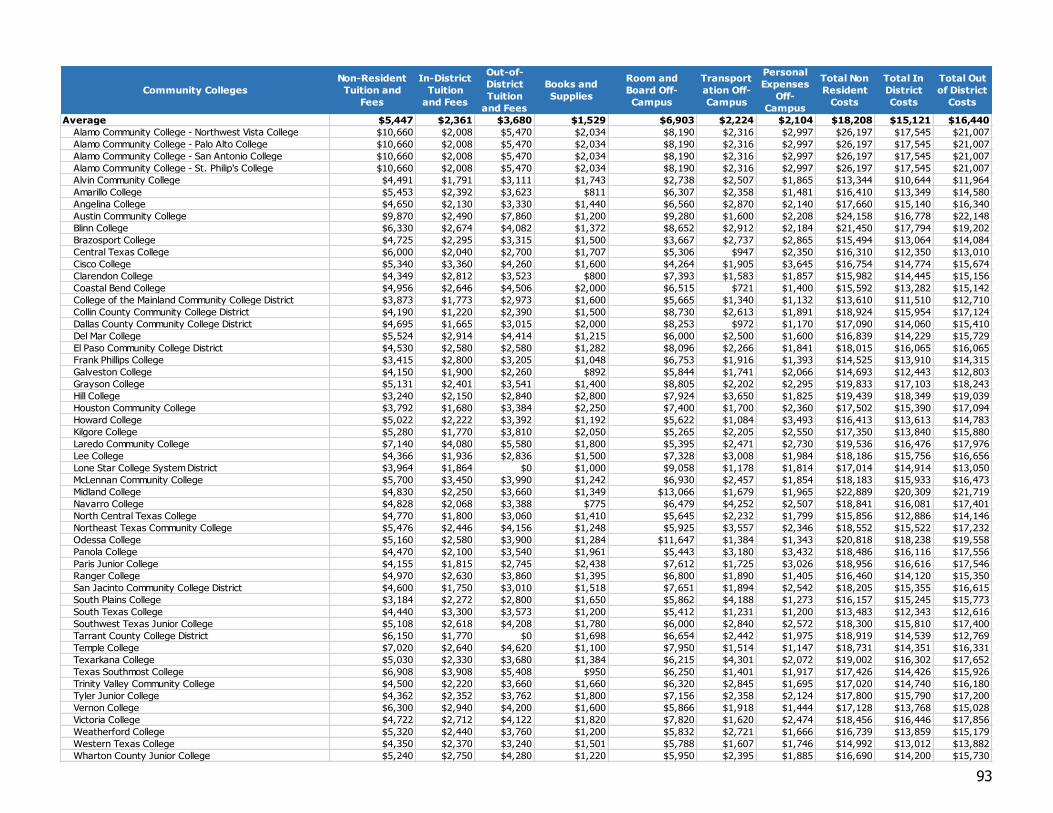
93
Community Colleges
Non-Resident
Tuition and
Fees
In-District
Tuition
and Fees
Out-of-
District
Tuition
and Fees
Books and
Supplies
Room and
Board Off-
Campus
Transport
ation Off-
Campus
Personal
Expenses
Off-
Campus
Total Non
Resident
Costs
Total In
District
Costs
Total Out
of District
Costs
Average $5,447 $2,361 $3,680 $1,529 $6,903 $2,224 $2,104 $18,208 $15,121 $16,440
Alamo Community College - Northwest Vista College $10,660 $2,008 $5,470 $2,034 $8,190 $2,316 $2,997 $26,197 $17,545 $21,007
Alamo Community College - Palo Alto College $10,660 $2,008 $5,470 $2,034 $8,190 $2,316 $2,997 $26,197 $17,545 $21,007
Alamo Community College - San Antonio College $10,660 $2,008 $5,470 $2,034 $8,190 $2,316 $2,997 $26,197 $17,545 $21,007
Alamo Community College - St. Philip's College $10,660 $2,008 $5,470 $2,034 $8,190 $2,316 $2,997 $26,197 $17,545 $21,007
Alvin Community College $4,491 $1,791 $3,111 $1,743 $2,738 $2,507 $1,865 $13,344 $10,644 $11,964
Amarillo College $5,453 $2,392 $3,623 $811 $6,307 $2,358 $1,481 $16,410 $13,349 $14,580
Angelina College $4,650 $2,130 $3,330 $1,440 $6,560 $2,870 $2,140 $17,660 $15,140 $16,340
Austin Community College $9,870 $2,490 $7,860 $1,200 $9,280 $1,600 $2,208 $24,158 $16,778 $22,148
Blinn College $6,330 $2,674 $4,082 $1,372 $8,652 $2,912 $2,184 $21,450 $17,794 $19,202
Brazosport College $4,725 $2,295 $3,315 $1,500 $3,667 $2,737 $2,865 $15,494 $13,064 $14,084
Central Texas College $6,000 $2,040 $2,700 $1,707 $5,306 $947 $2,350 $16,310 $12,350 $13,010
Cisco College $5,340 $3,360 $4,260 $1,600 $4,264 $1,905 $3,645 $16,754 $14,774 $15,674
Clarendon College $4,349 $2,812 $3,523 $800 $7,393 $1,583 $1,857 $15,982 $14,445 $15,156
Coastal Bend College $4,956 $2,646 $4,506 $2,000 $6,515 $721 $1,400 $15,592 $13,282 $15,142
College of the Mainland Community College District $3,873 $1,773 $2,973 $1,600 $5,665 $1,340 $1,132 $13,610 $11,510 $12,710
Collin County Community College District $4,190 $1,220 $2,390 $1,500 $8,730 $2,613 $1,891 $18,924 $15,954 $17,124
Dallas County Community College District $4,695 $1,665 $3,015 $2,000 $8,253 $972 $1,170 $17,090 $14,060 $15,410
Del Mar College $5,524 $2,914 $4,414 $1,215 $6,000 $2,500 $1,600 $16,839 $14,229 $15,729
El Paso Community College District $4,530 $2,580 $2,580 $1,282 $8,096 $2,266 $1,841 $18,015 $16,065 $16,065
Frank Phillips College $3,415 $2,800 $3,205 $1,048 $6,753 $1,916 $1,393 $14,525 $13,910 $14,315
Galveston College $4,150 $1,900 $2,260 $892 $5,844 $1,741 $2,066 $14,693 $12,443 $12,803
Grayson College $5,131 $2,401 $3,541 $1,400 $8,805 $2,202 $2,295 $19,833 $17,103 $18,243
Hill College $3,240 $2,150 $2,840 $2,800 $7,924 $3,650 $1,825 $19,439 $18,349 $19,039
Houston Community College $3,792 $1,680 $3,384 $2,250 $7,400 $1,700 $2,360 $17,502 $15,390 $17,094
Howard College $5,022 $2,222 $3,392 $1,192 $5,622 $1,084 $3,493 $16,413 $13,613 $14,783
Kilgore College $5,280 $1,770 $3,810 $2,050 $5,265 $2,205 $2,550 $17,350 $13,840 $15,880
Laredo Community College $7,140 $4,080 $5,580 $1,800 $5,395 $2,471 $2,730 $19,536 $16,476 $17,976
Lee College $4,366 $1,936 $2,836 $1,500 $7,328 $3,008 $1,984 $18,186 $15,756 $16,656
Lone Star College System District $3,964 $1,864 $0 $1,000 $9,058 $1,178 $1,814 $17,014 $14,914 $13,050
McLennan Community College $5,700 $3,450 $3,990 $1,242 $6,930 $2,457 $1,854 $18,183 $15,933 $16,473
Midland College $4,830 $2,250 $3,660 $1,349 $13,066 $1,679 $1,965 $22,889 $20,309 $21,719
Navarro College $4,828 $2,068 $3,388 $775 $6,479 $4,252 $2,507 $18,841 $16,081 $17,401
North Central Texas College $4,770 $1,800 $3,060 $1,410 $5,645 $2,232 $1,799 $15,856 $12,886 $14,146
Northeast Texas Community College $5,476 $2,446 $4,156 $1,248 $5,925 $3,557 $2,346 $18,552 $15,522 $17,232
Odessa College $5,160 $2,580 $3,900 $1,284 $11,647 $1,384 $1,343 $20,818 $18,238 $19,558
Panola College $4,470 $2,100 $3,540 $1,961 $5,443 $3,180 $3,432 $18,486 $16,116 $17,556
Paris Junior College $4,155 $1,815 $2,745 $2,438 $7,612 $1,725 $3,026 $18,956 $16,616 $17,546
Ranger College $4,970 $2,630 $3,860 $1,395 $6,800 $1,890 $1,405 $16,460 $14,120 $15,350
San Jacinto Community College District $4,600 $1,750 $3,010 $1,518 $7,651 $1,894 $2,542 $18,205 $15,355 $16,615
South Plains College $3,184 $2,272 $2,800 $1,650 $5,862 $4,188 $1,273 $16,157 $15,245 $15,773
South Texas College $4,440 $3,300 $3,573 $1,200 $5,412 $1,231 $1,200 $13,483 $12,343 $12,616
Southwest Texas Junior College $5,108 $2,618 $4,208 $1,780 $6,000 $2,840 $2,572 $18,300 $15,810 $17,400
Tarrant County College District $6,150 $1,770 $0 $1,698 $6,654 $2,442 $1,975 $18,919 $14,539 $12,769
Temple College $7,020 $2,640 $4,620 $1,100 $7,950 $1,514 $1,147 $18,731 $14,351 $16,331
Texarkana College $5,030 $2,330 $3,680 $1,384 $6,215 $4,301 $2,072 $19,002 $16,302 $17,652
Texas Southmost College $6,908 $3,908 $5,408 $950 $6,250 $1,401 $1,917 $17,426 $14,426 $15,926
Trinity Valley Community College $4,500 $2,220 $3,660 $1,660 $6,320 $2,845 $1,695 $17,020 $14,740 $16,180
Tyler Junior College $4,362 $2,352 $3,762 $1,800 $7,156 $2,358 $2,124 $17,800 $15,790 $17,200
Vernon College $6,300 $2,940 $4,200 $1,600 $5,866 $1,918 $1,444 $17,128 $13,768 $15,028
Victoria College $4,722 $2,712 $4,122 $1,820 $7,820 $1,620 $2,474 $18,456 $16,446 $17,856
Weatherford College $5,320 $2,440 $3,760 $1,200 $5,832 $2,721 $1,666 $16,739 $13,859 $15,179
Western Texas College $4,350 $2,370 $3,240 $1,501 $5,788 $1,607 $1,746 $14,992 $13,012 $13,882
Wharton County Junior College $5,240 $2,750 $4,280 $1,220 $5,950 $2,395 $1,885 $16,690 $14,200 $15,730
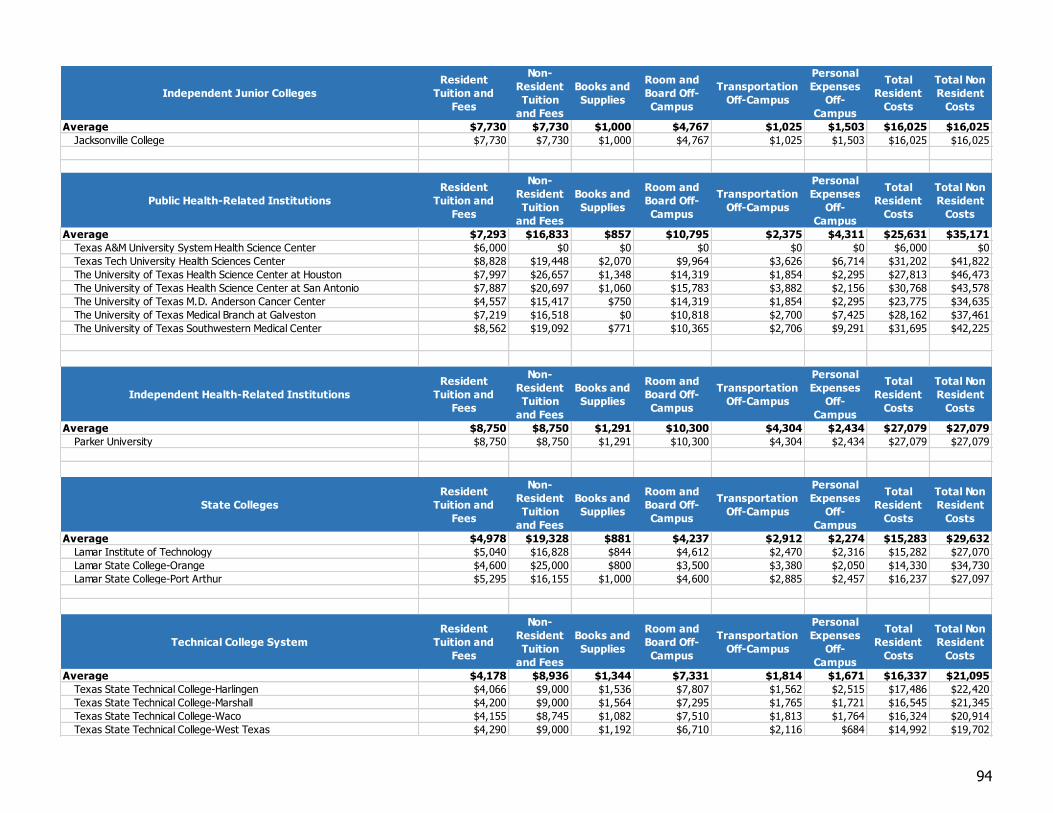
94
Independent Junior Colleges
Resident
Tuition and
Fees
Non-
Resident
Tuition
and Fees
Books and
Supplies
Room and
Board Off-
Campus
Transportation
Off-Campus
Personal
Expenses
Off-
Campus
Total
Resident
Costs
Total Non
Resident
Costs
Average $7,730 $7,730 $1,000 $4,767 $1,025 $1,503 $16,025 $16,025
Jacksonville College $7,730 $7,730 $1,000 $4,767 $1,025 $1,503 $16,025 $16,025
Public Health-Related Institutions
Resident
Tuition and
Fees
Non-
Resident
Tuition
and Fees
Books and
Supplies
Room and
Board Off-
Campus
Transportation
Off-Campus
Personal
Expenses
Off-
Campus
Total
Resident
Costs
Total Non
Resident
Costs
Average $7,293 $16,833 $857 $10,795 $2,375 $4,311 $25,631 $35,171
Texas A&M University System Health Science Center $6,000 $0 $0 $0 $0 $0 $6,000 $0
Texas Tech University Health Sciences Center $8,828 $19,448 $2,070 $9,964 $3,626 $6,714 $31,202 $41,822
The University of Texas Health Science Center at Houston $7,997 $26,657 $1,348 $14,319 $1,854 $2,295 $27,813 $46,473
The University of Texas Health Science Center at San Antonio $7,887 $20,697 $1,060 $15,783 $3,882 $2,156 $30,768 $43,578
The University of Texas M.D. Anderson Cancer Center $4,557 $15,417 $750 $14,319 $1,854 $2,295 $23,775 $34,635
The University of Texas Medical Branch at Galveston $7,219 $16,518 $0 $10,818 $2,700 $7,425 $28,162 $37,461
The University of Texas Southwestern Medical Center $8,562 $19,092 $771 $10,365 $2,706 $9,291 $31,695 $42,225
Independent Health-Related Institutions
Resident
Tuition and
Fees
Non-
Resident
Tuition
and Fees
Books and
Supplies
Room and
Board Off-
Campus
Transportation
Off-Campus
Personal
Expenses
Off-
Campus
Total
Resident
Costs
Total Non
Resident
Costs
Average $8,750 $8,750 $1,291 $10,300 $4,304 $2,434 $27,079 $27,079
Parker University $8,750 $8,750 $1,291 $10,300 $4,304 $2,434 $27,079 $27,079
State Colleges
Resident
Tuition and
Fees
Non-
Resident
Tuition
and Fees
Books and
Supplies
Room and
Board Off-
Campus
Transportation
Off-Campus
Personal
Expenses
Off-
Campus
Total
Resident
Costs
Total Non
Resident
Costs
Average $4,978 $19,328 $881 $4,237 $2,912 $2,274 $15,283 $29,632
Lamar Institute of Technology $5,040 $16,828 $844 $4,612 $2,470 $2,316 $15,282 $27,070
Lamar State College-Orange $4,600 $25,000 $800 $3,500 $3,380 $2,050 $14,330 $34,730
Lamar State College-Port Arthur $5,295 $16,155 $1,000 $4,600 $2,885 $2,457 $16,237 $27,097
Technical College System
Resident
Tuition and
Fees
Non-
Resident
Tuition
and Fees
Books and
Supplies
Room and
Board Off-
Campus
Transportation
Off-Campus
Personal
Expenses
Off-
Campus
Total
Resident
Costs
Total Non
Resident
Costs
Average $4,178 $8,936 $1,344 $7,331 $1,814 $1,671 $16,337 $21,095
Texas State Technical College-Harlingen $4,066 $9,000 $1,536 $7,807 $1,562 $2,515 $17,486 $22,420
Texas State Technical College-Marshall $4,200 $9,000 $1,564 $7,295 $1,765 $1,721 $16,545 $21,345
Texas State Technical College-Waco $4,155 $8,745 $1,082 $7,510 $1,813 $1,764 $16,324 $20,914
Texas State Technical College-West Texas $4,290 $9,000 $1,192 $6,710 $2,116 $684 $14,992 $19,702
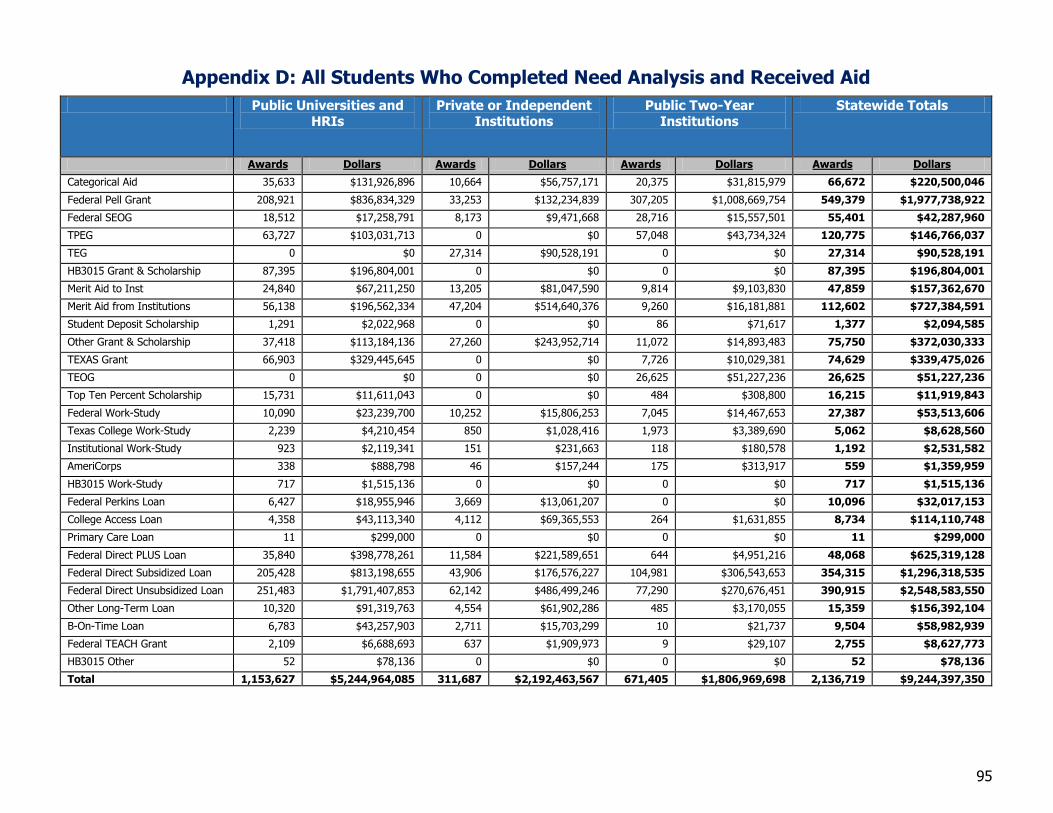
95
Appendix D: All Students Who Completed Need Analysis and Received Aid
Public Universities and HRIs
Private or Independent Institutions
Public Two-Year Institutions
Statewide Totals
Awards Dollars Awards Dollars Awards Dollars Awards Dollars
Categorical Aid 35,633 $131,926,896 10,664 $56,757,171 20,375 $31,815,979 66,672 $220,500,046
Federal Pell Grant 208,921 $836,834,329 33,253 $132,234,839 307,205 $1,008,669,754 549,379 $1,977,738,922
Federal SEOG 18,512 $17,258,791 8,173 $9,471,668 28,716 $15,557,501 55,401 $42,287,960
TPEG 63,727 $103,031,713 0 $0 57,048 $43,734,324 120,775 $146,766,037
TEG 0 $0 27,314 $90,528,191 0 $0 27,314 $90,528,191
HB3015 Grant & Scholarship 87,395 $196,804,001 0 $0 0 $0 87,395 $196,804,001
Merit Aid to Inst 24,840 $67,211,250 13,205 $81,047,590 9,814 $9,103,830 47,859 $157,362,670
Merit Aid from Institutions 56,138 $196,562,334 47,204 $514,640,376 9,260 $16,181,881 112,602 $727,384,591
Student Deposit Scholarship 1,291 $2,022,968 0 $0 86 $71,617 1,377 $2,094,585
Other Grant & Scholarship 37,418 $113,184,136 27,260 $243,952,714 11,072 $14,893,483 75,750 $372,030,333
TEXAS Grant 66,903 $329,445,645 0 $0 7,726 $10,029,381 74,629 $339,475,026
TEOG 0 $0 0 $0 26,625 $51,227,236 26,625 $51,227,236
Top Ten Percent Scholarship 15,731 $11,611,043 0 $0 484 $308,800 16,215 $11,919,843
Federal Work-Study 10,090 $23,239,700 10,252 $15,806,253 7,045 $14,467,653 27,387 $53,513,606
Texas College Work-Study 2,239 $4,210,454 850 $1,028,416 1,973 $3,389,690 5,062 $8,628,560
Institutional Work-Study 923 $2,119,341 151 $231,663 118 $180,578 1,192 $2,531,582
AmeriCorps 338 $888,798 46 $157,244 175 $313,917 559 $1,359,959
HB3015 Work-Study 717 $1,515,136 0 $0 0 $0 717 $1,515,136
Federal Perkins Loan 6,427 $18,955,946 3,669 $13,061,207 0 $0 10,096 $32,017,153
College Access Loan 4,358 $43,113,340 4,112 $69,365,553 264 $1,631,855 8,734 $114,110,748
Primary Care Loan 11 $299,000 0 $0 0 $0 11 $299,000
Federal Direct PLUS Loan 35,840 $398,778,261 11,584 $221,589,651 644 $4,951,216 48,068 $625,319,128
Federal Direct Subsidized Loan 205,428 $813,198,655 43,906 $176,576,227 104,981 $306,543,653 354,315 $1,296,318,535
Federal Direct Unsubsidized Loan 251,483 $1,791,407,853 62,142 $486,499,246 77,290 $270,676,451 390,915 $2,548,583,550
Other Long-Term Loan 10,320 $91,319,763 4,554 $61,902,286 485 $3,170,055 15,359 $156,392,104
B-On-Time Loan 6,783 $43,257,903 2,711 $15,703,299 10 $21,737 9,504 $58,982,939
Federal TEACH Grant 2,109 $6,688,693 637 $1,909,973 9 $29,107 2,755 $8,627,773
HB3015 Other 52 $78,136 0 $0 0 $0 52 $78,136
Total 1,153,627 $5,244,964,085 311,687 $2,192,463,567 671,405 $1,806,969,698 2,136,719 $9,244,397,350
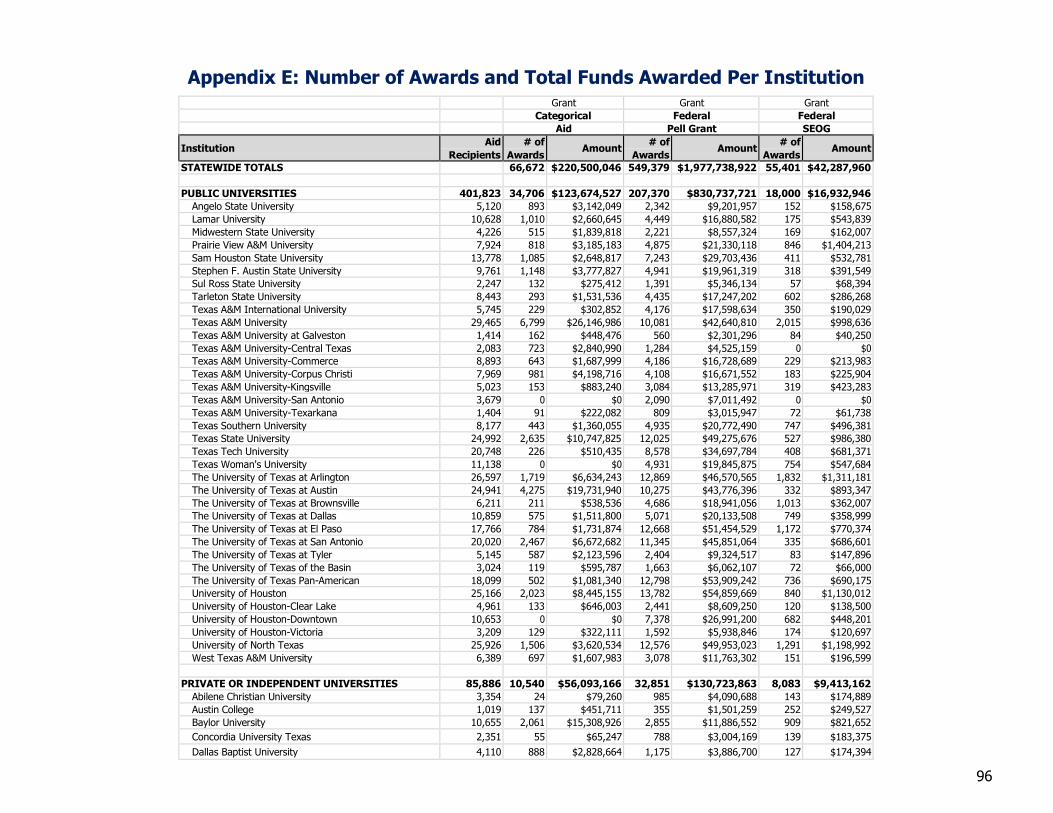
96
Appendix E: Number of Awards and Total Funds Awarded Per Institution
Grant Grant Grant
Categorical Federal Federal
Aid Pell Grant SEOG
Institution Aid
Recipients
# of
Awards Amount
# of
Awards Amount
# of
Awards Amount
STATEWIDE TOTALS 66,672 $220,500,046 549,379 $1,977,738,922 55,401 $42,287,960
PUBLIC UNIVERSITIES 401,823 34,706 $123,674,527 207,370 $830,737,721 18,000 $16,932,946
Angelo State University 5,120 893 $3,142,049 2,342 $9,201,957 152 $158,675
Lamar University 10,628 1,010 $2,660,645 4,449 $16,880,582 175 $543,839
Midwestern State University 4,226 515 $1,839,818 2,221 $8,557,324 169 $162,007
Prairie View A&M University 7,924 818 $3,185,183 4,875 $21,330,118 846 $1,404,213
Sam Houston State University 13,778 1,085 $2,648,817 7,243 $29,703,436 411 $532,781
Stephen F. Austin State University 9,761 1,148 $3,777,827 4,941 $19,961,319 318 $391,549
Sul Ross State University 2,247 132 $275,412 1,391 $5,346,134 57 $68,394
Tarleton State University 8,443 293 $1,531,536 4,435 $17,247,202 602 $286,268
Texas A&M International University 5,745 229 $302,852 4,176 $17,598,634 350 $190,029
Texas A&M University 29,465 6,799 $26,146,986 10,081 $42,640,810 2,015 $998,636
Texas A&M University at Galveston 1,414 162 $448,476 560 $2,301,296 84 $40,250
Texas A&M University-Central Texas 2,083 723 $2,840,990 1,284 $4,525,159 0 $0
Texas A&M University-Commerce 8,893 643 $1,687,999 4,186 $16,728,689 229 $213,983
Texas A&M University-Corpus Christi 7,969 981 $4,198,716 4,108 $16,671,552 183 $225,904
Texas A&M University-Kingsville 5,023 153 $883,240 3,084 $13,285,971 319 $423,283
Texas A&M University-San Antonio 3,679 0 $0 2,090 $7,011,492 0 $0
Texas A&M University-Texarkana 1,404 91 $222,082 809 $3,015,947 72 $61,738
Texas Southern University 8,177 443 $1,360,055 4,935 $20,772,490 747 $496,381
Texas State University 24,992 2,635 $10,747,825 12,025 $49,275,676 527 $986,380
Texas Tech University 20,748 226 $510,435 8,578 $34,697,784 408 $681,371
Texas Woman's University 11,138 0 $0 4,931 $19,845,875 754 $547,684
The University of Texas at Arlington 26,597 1,719 $6,634,243 12,869 $46,570,565 1,832 $1,311,181
The University of Texas at Austin 24,941 4,275 $19,731,940 10,275 $43,776,396 332 $893,347
The University of Texas at Brownsville 6,211 211 $538,536 4,686 $18,941,056 1,013 $362,007
The University of Texas at Dallas 10,859 575 $1,511,800 5,071 $20,133,508 749 $358,999
The University of Texas at El Paso 17,766 784 $1,731,874 12,668 $51,454,529 1,172 $770,374
The University of Texas at San Antonio 20,020 2,467 $6,672,682 11,345 $45,851,064 335 $686,601
The University of Texas at Tyler 5,145 587 $2,123,596 2,404 $9,324,517 83 $147,896
The University of Texas of the Basin 3,024 119 $595,787 1,663 $6,062,107 72 $66,000
The University of Texas Pan-American 18,099 502 $1,081,340 12,798 $53,909,242 736 $690,175
University of Houston 25,166 2,023 $8,445,155 13,782 $54,859,669 840 $1,130,012
University of Houston-Clear Lake 4,961 133 $646,003 2,441 $8,609,250 120 $138,500
University of Houston-Downtown 10,653 0 $0 7,378 $26,991,200 682 $448,201
University of Houston-Victoria 3,209 129 $322,111 1,592 $5,938,846 174 $120,697
University of North Texas 25,926 1,506 $3,620,534 12,576 $49,953,023 1,291 $1,198,992
West Texas A&M University 6,389 697 $1,607,983 3,078 $11,763,302 151 $196,599
PRIVATE OR INDEPENDENT UNIVERSITIES 85,886 10,540 $56,093,166 32,851 $130,723,863 8,083 $9,413,162
Abilene Christian University 3,354 24 $79,260 985 $4,090,688 143 $174,889
Austin College 1,019 137 $451,711 355 $1,501,259 252 $249,527
Baylor University 10,655 2,061 $15,308,926 2,855 $11,886,552 909 $821,652
Concordia University Texas 2,351 55 $65,247 788 $3,004,169 139 $183,375
Dallas Baptist University 4,110 888 $2,828,664 1,175 $3,886,700 127 $174,394
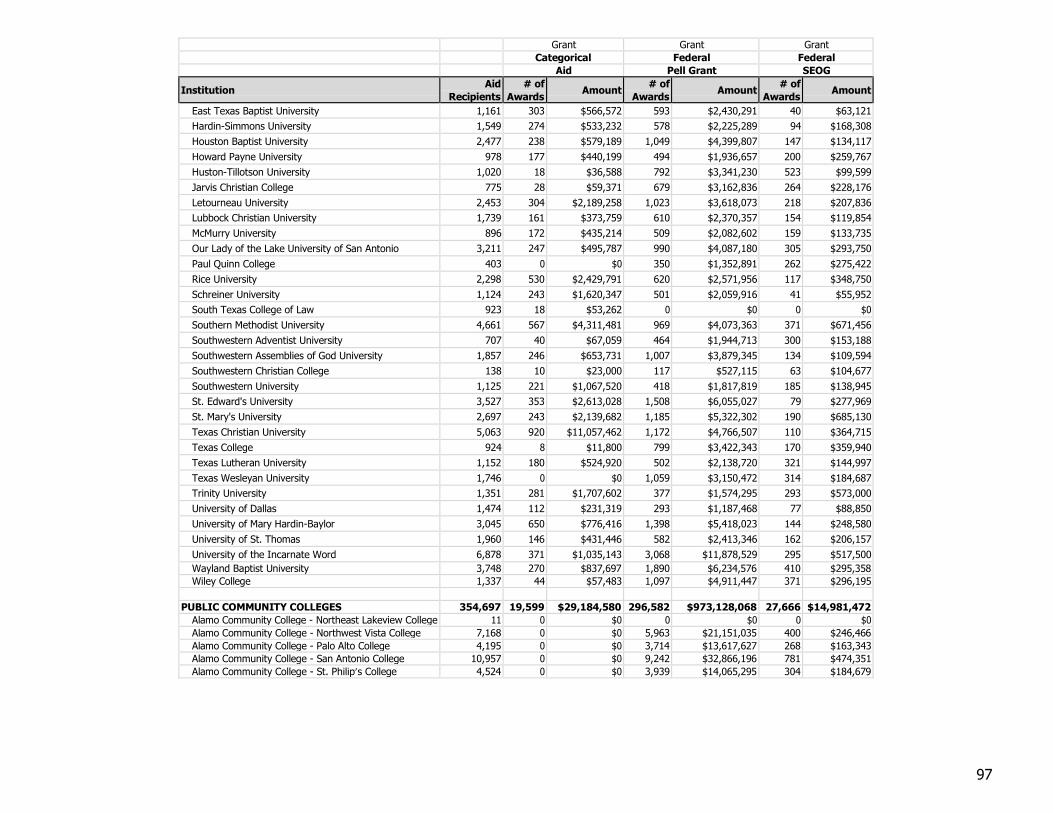
97
Grant Grant Grant
Categorical Federal Federal
Aid Pell Grant SEOG
Institution Aid
Recipients
# of
Awards Amount
# of
Awards Amount
# of
Awards Amount
East Texas Baptist University 1,161 303 $566,572 593 $2,430,291 40 $63,121
Hardin-Simmons University 1,549 274 $533,232 578 $2,225,289 94 $168,308
Houston Baptist University 2,477 238 $579,189 1,049 $4,399,807 147 $134,117
Howard Payne University 978 177 $440,199 494 $1,936,657 200 $259,767
Huston-Tillotson University 1,020 18 $36,588 792 $3,341,230 523 $99,599
Jarvis Christian College 775 28 $59,371 679 $3,162,836 264 $228,176
Letourneau University 2,453 304 $2,189,258 1,023 $3,618,073 218 $207,836
Lubbock Christian University 1,739 161 $373,759 610 $2,370,357 154 $119,854
McMurry University 896 172 $435,214 509 $2,082,602 159 $133,735
Our Lady of the Lake University of San Antonio 3,211 247 $495,787 990 $4,087,180 305 $293,750
Paul Quinn College 403 0 $0 350 $1,352,891 262 $275,422
Rice University 2,298 530 $2,429,791 620 $2,571,956 117 $348,750
Schreiner University 1,124 243 $1,620,347 501 $2,059,916 41 $55,952
South Texas College of Law 923 18 $53,262 0 $0 0 $0
Southern Methodist University 4,661 567 $4,311,481 969 $4,073,363 371 $671,456
Southwestern Adventist University 707 40 $67,059 464 $1,944,713 300 $153,188
Southwestern Assemblies of God University 1,857 246 $653,731 1,007 $3,879,345 134 $109,594
Southwestern Christian College 138 10 $23,000 117 $527,115 63 $104,677
Southwestern University 1,125 221 $1,067,520 418 $1,817,819 185 $138,945
St. Edward's University 3,527 353 $2,613,028 1,508 $6,055,027 79 $277,969
St. Mary's University 2,697 243 $2,139,682 1,185 $5,322,302 190 $685,130
Texas Christian University 5,063 920 $11,057,462 1,172 $4,766,507 110 $364,715
Texas College 924 8 $11,800 799 $3,422,343 170 $359,940
Texas Lutheran University 1,152 180 $524,920 502 $2,138,720 321 $144,997
Texas Wesleyan University 1,746 0 $0 1,059 $3,150,472 314 $184,687
Trinity University 1,351 281 $1,707,602 377 $1,574,295 293 $573,000
University of Dallas 1,474 112 $231,319 293 $1,187,468 77 $88,850
University of Mary Hardin-Baylor 3,045 650 $776,416 1,398 $5,418,023 144 $248,580
University of St. Thomas 1,960 146 $431,446 582 $2,413,346 162 $206,157
University of the Incarnate Word 6,878 371 $1,035,143 3,068 $11,878,529 295 $517,500
Wayland Baptist University 3,748 270 $837,697 1,890 $6,234,576 410 $295,358
Wiley College 1,337 44 $57,483 1,097 $4,911,447 371 $296,195
PUBLIC COMMUNITY COLLEGES 354,697 19,599 $29,184,580 296,582 $973,128,068 27,666 $14,981,472
Alamo Community College - Northeast Lakeview College 11 0 $0 0 $0 0 $0
Alamo Community College - Northwest Vista College 7,168 0 $0 5,963 $21,151,035 400 $246,466
Alamo Community College - Palo Alto College 4,195 0 $0 3,714 $13,617,627 268 $163,343
Alamo Community College - San Antonio College 10,957 0 $0 9,242 $32,866,196 781 $474,351
Alamo Community College - St. Philip’s College 4,524 0 $0 3,939 $14,065,295 304 $184,679
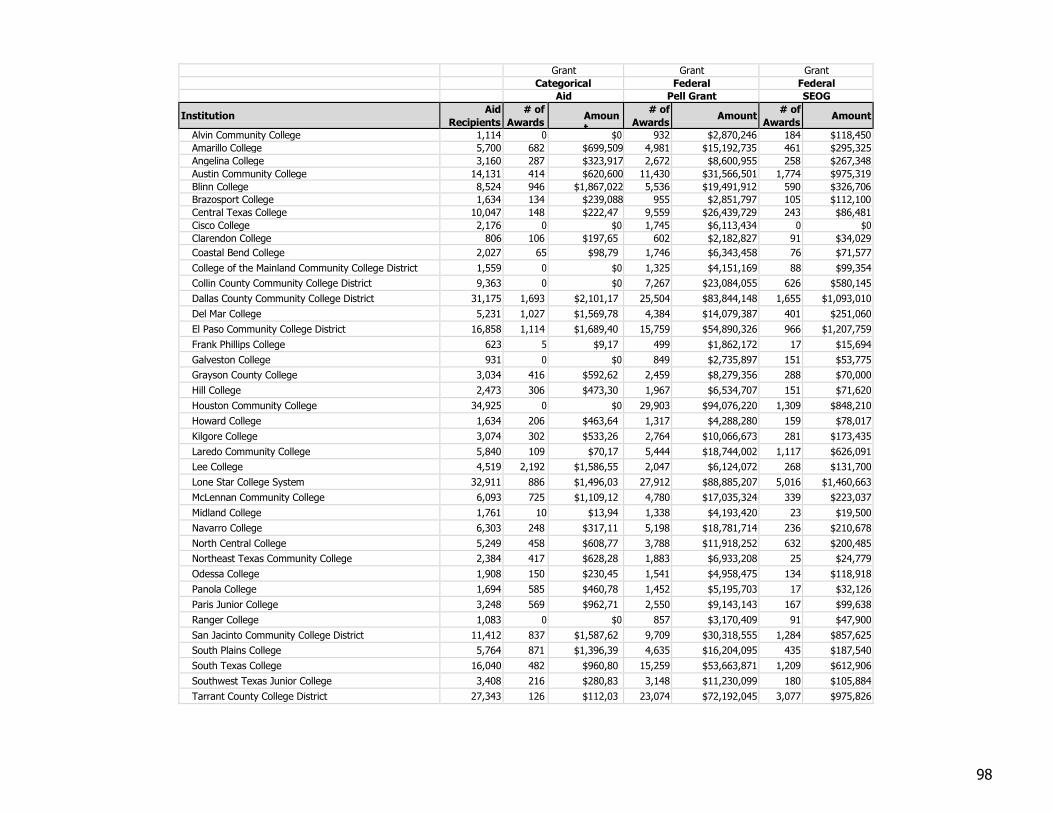
98
Grant Grant Grant
Categorical Federal Federal
Aid Pell Grant SEOG
Institution Aid
Recipients
# of
Awards Amount
# of
Awards Amount
# of
Awards Amount
Alvin Community College 1,114 0 $0 932 $2,870,246 184 $118,450
Amarillo College 5,700 682 $699,509 4,981 $15,192,735 461 $295,325
Angelina College 3,160 287 $323,917 2,672 $8,600,955 258 $267,348
Austin Community College 14,131 414 $620,600 11,430 $31,566,501 1,774 $975,319
Blinn College 8,524 946 $1,867,022 5,536 $19,491,912 590 $326,706
Brazosport College 1,634 134 $239,088 955 $2,851,797 105 $112,100
Central Texas College 10,047 148 $222,473
9,559 $26,439,729 243 $86,481
Cisco College 2,176 0 $0 1,745 $6,113,434 0 $0
Clarendon College 806 106 $197,651
602 $2,182,827 91 $34,029
Coastal Bend College 2,027 65 $98,790
1,746 $6,343,458 76 $71,577
College of the Mainland Community College District 1,559 0 $0 1,325 $4,151,169 88 $99,354
Collin County Community College District 9,363 0 $0 7,267 $23,084,055 626 $580,145
Dallas County Community College District 31,175 1,693 $2,101,171
25,504 $83,844,148 1,655 $1,093,010
Del Mar College 5,231 1,027 $1,569,788
4,384 $14,079,387 401 $251,060
El Paso Community College District 16,858 1,114 $1,689,408
15,759 $54,890,326 966 $1,207,759
Frank Phillips College 623 5 $9,172
499 $1,862,172 17 $15,694
Galveston College 931 0 $0 849 $2,735,897 151 $53,775
Grayson County College 3,034 416 $592,628
2,459 $8,279,356 288 $70,000
Hill College 2,473 306 $473,307
1,967 $6,534,707 151 $71,620
Houston Community College 34,925 0 $0 29,903 $94,076,220 1,309 $848,210
Howard College 1,634 206 $463,644
1,317 $4,288,280 159 $78,017
Kilgore College 3,074 302 $533,262
2,764 $10,066,673 281 $173,435
Laredo Community College 5,840 109 $70,171
5,444 $18,744,002 1,117 $626,091
Lee College 4,519 2,192 $1,586,559
2,047 $6,124,072 268 $131,700
Lone Star College System 32,911 886 $1,496,036
27,912 $88,885,207 5,016 $1,460,663
McLennan Community College 6,093 725 $1,109,129
4,780 $17,035,324 339 $223,037
Midland College 1,761 10 $13,941
1,338 $4,193,420 23 $19,500
Navarro College 6,303 248 $317,112
5,198 $18,781,714 236 $210,678
North Central College 5,249 458 $608,770
3,788 $11,918,252 632 $200,485
Northeast Texas Community College 2,384 417 $628,284
1,883 $6,933,208 25 $24,779
Odessa College 1,908 150 $230,451
1,541 $4,958,475 134 $118,918
Panola College 1,694 585 $460,785
1,452 $5,195,703 17 $32,126
Paris Junior College 3,248 569 $962,713
2,550 $9,143,143 167 $99,638
Ranger College 1,083 0 $0 857 $3,170,409 91 $47,900
San Jacinto Community College District 11,412 837 $1,587,623
9,709 $30,318,555 1,284 $857,625
South Plains College 5,764 871 $1,396,391
4,635 $16,204,095 435 $187,540
South Texas College 16,040 482 $960,807
15,259 $53,663,871 1,209 $612,906
Southwest Texas Junior College 3,408 216 $280,839
3,148 $11,230,099 180 $105,884
Tarrant County College District 27,343 126 $112,032
23,074 $72,192,045 3,077 $975,826
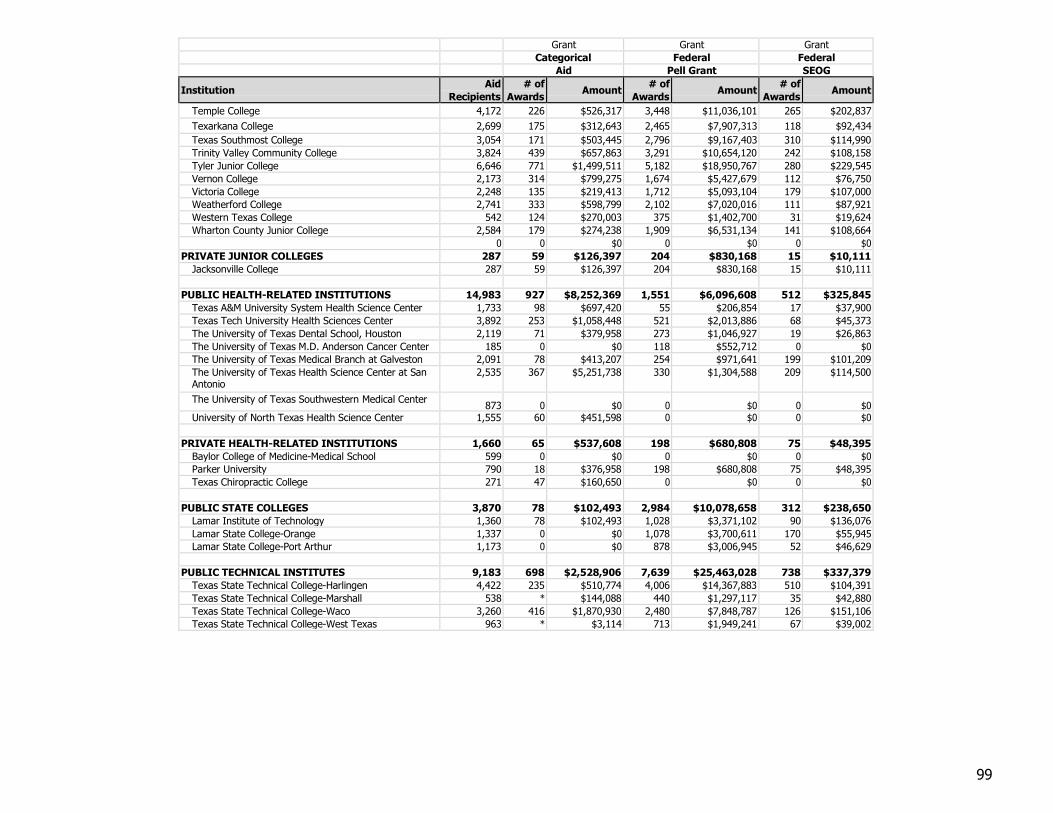
99
Grant Grant Grant
Categorical Federal Federal
Aid Pell Grant SEOG
Institution Aid
Recipients
# of
Awards Amount
# of
Awards Amount
# of
Awards Amount
Temple College 4,172 226 $526,317 3,448 $11,036,101 265 $202,837
Texarkana College 2,699 175 $312,643 2,465 $7,907,313 118 $92,434
Texas Southmost College 3,054 171 $503,445 2,796 $9,167,403 310 $114,990
Trinity Valley Community College 3,824 439 $657,863 3,291 $10,654,120 242 $108,158
Tyler Junior College 6,646 771 $1,499,511 5,182 $18,950,767 280 $229,545
Vernon College 2,173 314 $799,275 1,674 $5,427,679 112 $76,750
Victoria College 2,248 135 $219,413 1,712 $5,093,104 179 $107,000
Weatherford College 2,741 333 $598,799 2,102 $7,020,016 111 $87,921
Western Texas College 542 124 $270,003 375 $1,402,700 31 $19,624
Wharton County Junior College 2,584 179 $274,238 1,909 $6,531,134 141 $108,664
0 0 $0 0 $0 0 $0
PRIVATE JUNIOR COLLEGES 287 59 $126,397 204 $830,168 15 $10,111
Jacksonville College 287 59 $126,397 204 $830,168 15 $10,111
PUBLIC HEALTH-RELATED INSTITUTIONS 14,983 927 $8,252,369 1,551 $6,096,608 512 $325,845
Texas A&M University System Health Science Center 1,733 98 $697,420 55 $206,854 17 $37,900
Texas Tech University Health Sciences Center 3,892 253 $1,058,448 521 $2,013,886 68 $45,373
The University of Texas Dental School, Houston 2,119 71 $379,958 273 $1,046,927 19 $26,863
The University of Texas M.D. Anderson Cancer Center 185 0 $0 118 $552,712 0 $0
The University of Texas Medical Branch at Galveston 2,091 78 $413,207 254 $971,641 199 $101,209
The University of Texas Health Science Center at San Antonio
2,535 367 $5,251,738 330 $1,304,588 209 $114,500
The University of Texas Southwestern Medical Center 873 0 $0 0 $0 0 $0
University of North Texas Health Science Center 1,555 60 $451,598 0 $0 0 $0
PRIVATE HEALTH-RELATED INSTITUTIONS 1,660 65 $537,608 198 $680,808 75 $48,395
Baylor College of Medicine-Medical School 599 0 $0 0 $0 0 $0
Parker University 790 18 $376,958 198 $680,808 75 $48,395
Texas Chiropractic College 271 47 $160,650 0 $0 0 $0
PUBLIC STATE COLLEGES 3,870 78 $102,493 2,984 $10,078,658 312 $238,650
Lamar Institute of Technology 1,360 78 $102,493 1,028 $3,371,102 90 $136,076
Lamar State College-Orange 1,337 0 $0 1,078 $3,700,611 170 $55,945
Lamar State College-Port Arthur 1,173 0 $0 878 $3,006,945 52 $46,629
PUBLIC TECHNICAL INSTITUTES 9,183 698 $2,528,906 7,639 $25,463,028 738 $337,379
Texas State Technical College-Harlingen 4,422 235 $510,774 4,006 $14,367,883 510 $104,391
Texas State Technical College-Marshall 538 * $144,088 440 $1,297,117 35 $42,880
Texas State Technical College-Waco 3,260 416 $1,870,930 2,480 $7,848,787 126 $151,106
Texas State Technical College-West Texas 963 * $3,114 713 $1,949,241 67 $39,002
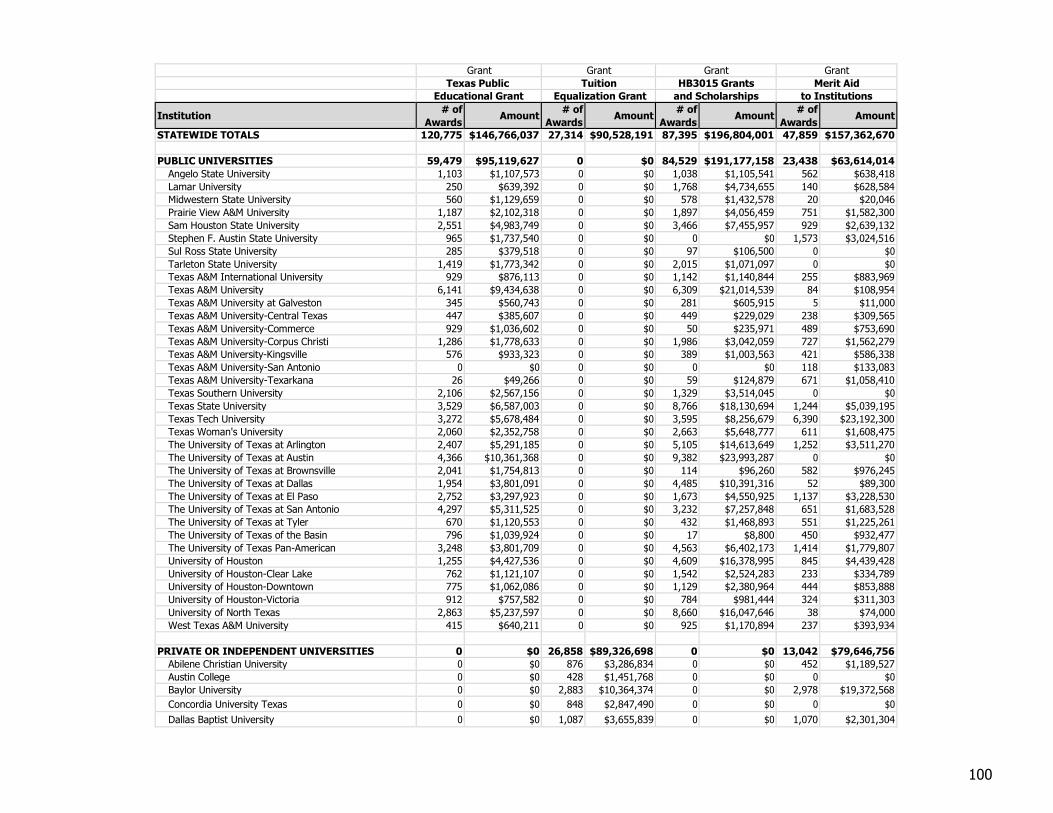
100
Grant Grant Grant Grant
Texas Public Tuition HB3015 Grants Merit Aid
Educational Grant Equalization Grant and Scholarships to Institutions
Institution # of
Awards Amount
# of
Awards Amount
# of
Awards Amount
# of
Awards Amount
STATEWIDE TOTALS 120,775 $146,766,037 27,314 $90,528,191 87,395 $196,804,001 47,859 $157,362,670
PUBLIC UNIVERSITIES 59,479 $95,119,627 0 $0 84,529 $191,177,158 23,438 $63,614,014
Angelo State University 1,103 $1,107,573 0 $0 1,038 $1,105,541 562 $638,418
Lamar University 250 $639,392 0 $0 1,768 $4,734,655 140 $628,584
Midwestern State University 560 $1,129,659 0 $0 578 $1,432,578 20 $20,046
Prairie View A&M University 1,187 $2,102,318 0 $0 1,897 $4,056,459 751 $1,582,300
Sam Houston State University 2,551 $4,983,749 0 $0 3,466 $7,455,957 929 $2,639,132
Stephen F. Austin State University 965 $1,737,540 0 $0 0 $0 1,573 $3,024,516
Sul Ross State University 285 $379,518 0 $0 97 $106,500 0 $0
Tarleton State University 1,419 $1,773,342 0 $0 2,015 $1,071,097 0 $0
Texas A&M International University 929 $876,113 0 $0 1,142 $1,140,844 255 $883,969
Texas A&M University 6,141 $9,434,638 0 $0 6,309 $21,014,539 84 $108,954
Texas A&M University at Galveston 345 $560,743 0 $0 281 $605,915 5 $11,000
Texas A&M University-Central Texas 447 $385,607 0 $0 449 $229,029 238 $309,565
Texas A&M University-Commerce 929 $1,036,602 0 $0 50 $235,971 489 $753,690
Texas A&M University-Corpus Christi 1,286 $1,778,633 0 $0 1,986 $3,042,059 727 $1,562,279
Texas A&M University-Kingsville 576 $933,323 0 $0 389 $1,003,563 421 $586,338
Texas A&M University-San Antonio 0 $0 0 $0 0 $0 118 $133,083
Texas A&M University-Texarkana 26 $49,266 0 $0 59 $124,879 671 $1,058,410
Texas Southern University 2,106 $2,567,156 0 $0 1,329 $3,514,045 0 $0
Texas State University 3,529 $6,587,003 0 $0 8,766 $18,130,694 1,244 $5,039,195
Texas Tech University 3,272 $5,678,484 0 $0 3,595 $8,256,679 6,390 $23,192,300
Texas Woman's University 2,060 $2,352,758 0 $0 2,663 $5,648,777 611 $1,608,475
The University of Texas at Arlington 2,407 $5,291,185 0 $0 5,105 $14,613,649 1,252 $3,511,270
The University of Texas at Austin 4,366 $10,361,368 0 $0 9,382 $23,993,287 0 $0
The University of Texas at Brownsville 2,041 $1,754,813 0 $0 114 $96,260 582 $976,245
The University of Texas at Dallas 1,954 $3,801,091 0 $0 4,485 $10,391,316 52 $89,300
The University of Texas at El Paso 2,752 $3,297,923 0 $0 1,673 $4,550,925 1,137 $3,228,530
The University of Texas at San Antonio 4,297 $5,311,525 0 $0 3,232 $7,257,848 651 $1,683,528
The University of Texas at Tyler 670 $1,120,553 0 $0 432 $1,468,893 551 $1,225,261
The University of Texas of the Basin 796 $1,039,924 0 $0 17 $8,800 450 $932,477
The University of Texas Pan-American 3,248 $3,801,709 0 $0 4,563 $6,402,173 1,414 $1,779,807
University of Houston 1,255 $4,427,536 0 $0 4,609 $16,378,995 845 $4,439,428
University of Houston-Clear Lake 762 $1,121,107 0 $0 1,542 $2,524,283 233 $334,789
University of Houston-Downtown 775 $1,062,086 0 $0 1,129 $2,380,964 444 $853,888
University of Houston-Victoria 912 $757,582 0 $0 784 $981,444 324 $311,303
University of North Texas 2,863 $5,237,597 0 $0 8,660 $16,047,646 38 $74,000
West Texas A&M University 415 $640,211 0 $0 925 $1,170,894 237 $393,934
PRIVATE OR INDEPENDENT UNIVERSITIES 0 $0 26,858 $89,326,698 0 $0 13,042 $79,646,756
Abilene Christian University 0 $0 876 $3,286,834 0 $0 452 $1,189,527
Austin College 0 $0 428 $1,451,768 0 $0 0 $0
Baylor University 0 $0 2,883 $10,364,374 0 $0 2,978 $19,372,568
Concordia University Texas 0 $0 848 $2,847,490 0 $0 0 $0
Dallas Baptist University 0 $0 1,087 $3,655,839 0 $0 1,070 $2,301,304
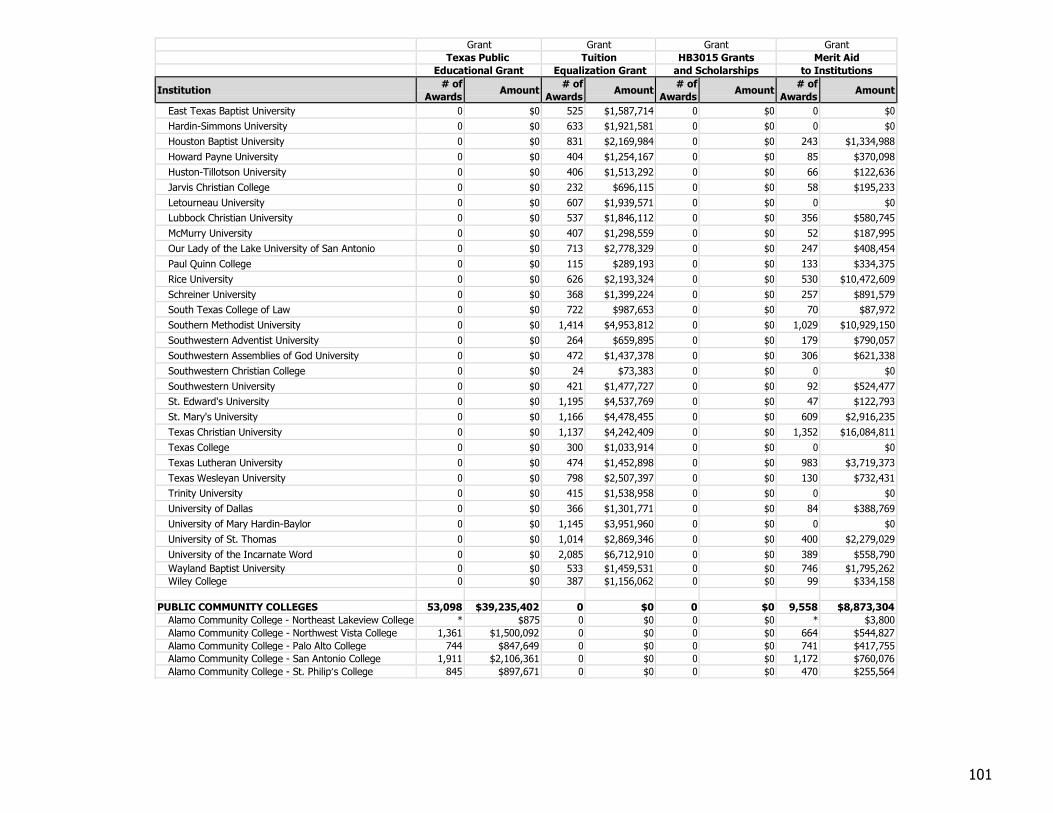
101
Grant Grant Grant Grant
Texas Public Tuition HB3015 Grants Merit Aid
Educational Grant Equalization Grant and Scholarships to Institutions
Institution # of
Awards Amount
# of
Awards Amount
# of
Awards Amount
# of
Awards Amount
East Texas Baptist University 0 $0 525 $1,587,714 0 $0 0 $0
Hardin-Simmons University 0 $0 633 $1,921,581 0 $0 0 $0
Houston Baptist University 0 $0 831 $2,169,984 0 $0 243 $1,334,988
Howard Payne University 0 $0 404 $1,254,167 0 $0 85 $370,098
Huston-Tillotson University 0 $0 406 $1,513,292 0 $0 66 $122,636
Jarvis Christian College 0 $0 232 $696,115 0 $0 58 $195,233
Letourneau University 0 $0 607 $1,939,571 0 $0 0 $0
Lubbock Christian University 0 $0 537 $1,846,112 0 $0 356 $580,745
McMurry University 0 $0 407 $1,298,559 0 $0 52 $187,995
Our Lady of the Lake University of San Antonio 0 $0 713 $2,778,329 0 $0 247 $408,454
Paul Quinn College 0 $0 115 $289,193 0 $0 133 $334,375
Rice University 0 $0 626 $2,193,324 0 $0 530 $10,472,609
Schreiner University 0 $0 368 $1,399,224 0 $0 257 $891,579
South Texas College of Law 0 $0 722 $987,653 0 $0 70 $87,972
Southern Methodist University 0 $0 1,414 $4,953,812 0 $0 1,029 $10,929,150
Southwestern Adventist University 0 $0 264 $659,895 0 $0 179 $790,057
Southwestern Assemblies of God University 0 $0 472 $1,437,378 0 $0 306 $621,338
Southwestern Christian College 0 $0 24 $73,383 0 $0 0 $0
Southwestern University 0 $0 421 $1,477,727 0 $0 92 $524,477
St. Edward's University 0 $0 1,195 $4,537,769 0 $0 47 $122,793
St. Mary's University 0 $0 1,166 $4,478,455 0 $0 609 $2,916,235
Texas Christian University 0 $0 1,137 $4,242,409 0 $0 1,352 $16,084,811
Texas College 0 $0 300 $1,033,914 0 $0 0 $0
Texas Lutheran University 0 $0 474 $1,452,898 0 $0 983 $3,719,373
Texas Wesleyan University 0 $0 798 $2,507,397 0 $0 130 $732,431
Trinity University 0 $0 415 $1,538,958 0 $0 0 $0
University of Dallas 0 $0 366 $1,301,771 0 $0 84 $388,769
University of Mary Hardin-Baylor 0 $0 1,145 $3,951,960 0 $0 0 $0
University of St. Thomas 0 $0 1,014 $2,869,346 0 $0 400 $2,279,029
University of the Incarnate Word 0 $0 2,085 $6,712,910 0 $0 389 $558,790
Wayland Baptist University 0 $0 533 $1,459,531 0 $0 746 $1,795,262
Wiley College 0 $0 387 $1,156,062 0 $0 99 $334,158
PUBLIC COMMUNITY COLLEGES 53,098 $39,235,402 0 $0 0 $0 9,558 $8,873,304
Alamo Community College - Northeast Lakeview College * $875 0 $0 0 $0 * $3,800
Alamo Community College - Northwest Vista College 1,361 $1,500,092 0 $0 0 $0 664 $544,827
Alamo Community College - Palo Alto College 744 $847,649 0 $0 0 $0 741 $417,755
Alamo Community College - San Antonio College 1,911 $2,106,361 0 $0 0 $0 1,172 $760,076
Alamo Community College - St. Philip’s College 845 $897,671 0 $0 0 $0 470 $255,564
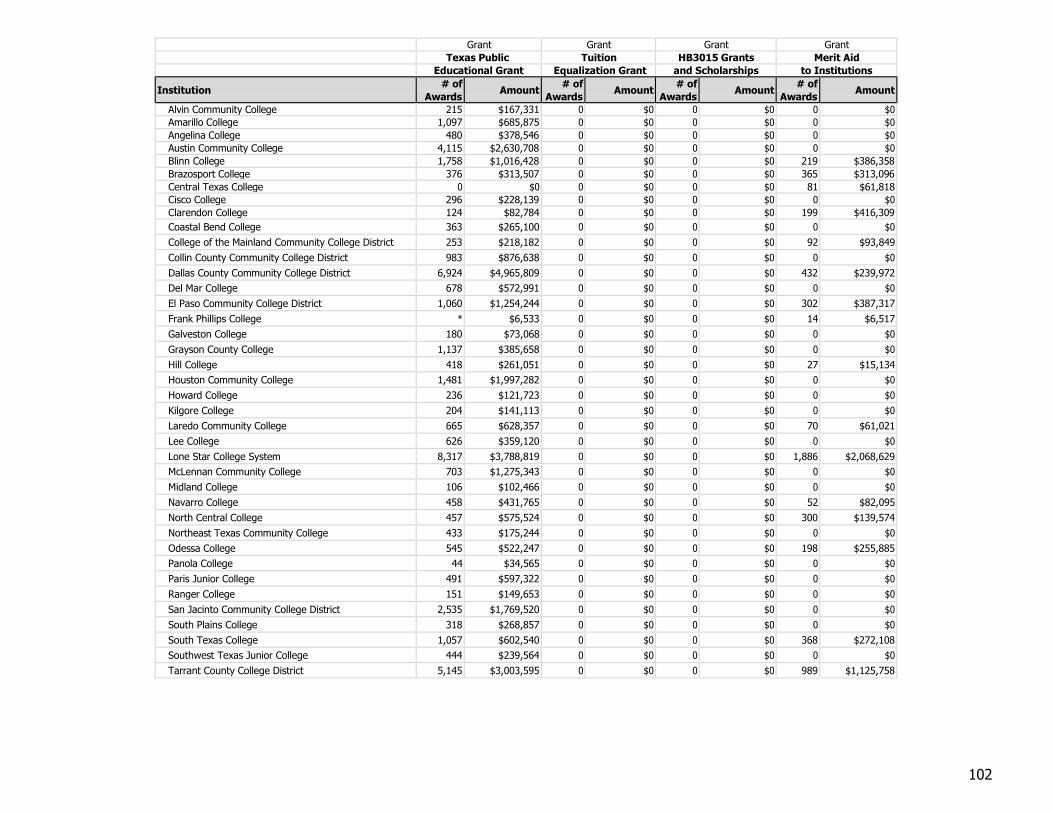
102
Grant Grant Grant Grant
Texas Public Tuition HB3015 Grants Merit Aid
Educational Grant Equalization Grant and Scholarships to Institutions
Institution # of
Awards Amount
# of
Awards Amount
# of
Awards Amount
# of
Awards Amount
Alvin Community College 215 $167,331 0 $0 0 $0 0 $0
Amarillo College 1,097 $685,875 0 $0 0 $0 0 $0
Angelina College 480 $378,546 0 $0 0 $0 0 $0
Austin Community College 4,115 $2,630,708 0 $0 0 $0 0 $0
Blinn College 1,758 $1,016,428 0 $0 0 $0 219 $386,358
Brazosport College 376 $313,507 0 $0 0 $0 365 $313,096
Central Texas College 0 $0 0 $0 0 $0 81 $61,818
Cisco College 296 $228,139 0 $0 0 $0 0 $0
Clarendon College 124 $82,784 0 $0 0 $0 199 $416,309
Coastal Bend College 363 $265,100 0 $0 0 $0 0 $0
College of the Mainland Community College District 253 $218,182 0 $0 0 $0 92 $93,849
Collin County Community College District 983 $876,638 0 $0 0 $0 0 $0
Dallas County Community College District 6,924 $4,965,809 0 $0 0 $0 432 $239,972
Del Mar College 678 $572,991 0 $0 0 $0 0 $0
El Paso Community College District 1,060 $1,254,244 0 $0 0 $0 302 $387,317
Frank Phillips College * $6,533 0 $0 0 $0 14 $6,517
Galveston College 180 $73,068 0 $0 0 $0 0 $0
Grayson County College 1,137 $385,658 0 $0 0 $0 0 $0
Hill College 418 $261,051 0 $0 0 $0 27 $15,134
Houston Community College 1,481 $1,997,282 0 $0 0 $0 0 $0
Howard College 236 $121,723 0 $0 0 $0 0 $0
Kilgore College 204 $141,113 0 $0 0 $0 0 $0
Laredo Community College 665 $628,357 0 $0 0 $0 70 $61,021
Lee College 626 $359,120 0 $0 0 $0 0 $0
Lone Star College System 8,317 $3,788,819 0 $0 0 $0 1,886 $2,068,629
McLennan Community College 703 $1,275,343 0 $0 0 $0 0 $0
Midland College 106 $102,466 0 $0 0 $0 0 $0
Navarro College 458 $431,765 0 $0 0 $0 52 $82,095
North Central College 457 $575,524 0 $0 0 $0 300 $139,574
Northeast Texas Community College 433 $175,244 0 $0 0 $0 0 $0
Odessa College 545 $522,247 0 $0 0 $0 198 $255,885
Panola College 44 $34,565 0 $0 0 $0 0 $0
Paris Junior College 491 $597,322 0 $0 0 $0 0 $0
Ranger College 151 $149,653 0 $0 0 $0 0 $0
San Jacinto Community College District 2,535 $1,769,520 0 $0 0 $0 0 $0
South Plains College 318 $268,857 0 $0 0 $0 0 $0
South Texas College 1,057 $602,540 0 $0 0 $0 368 $272,108
Southwest Texas Junior College 444 $239,564 0 $0 0 $0 0 $0
Tarrant County College District 5,145 $3,003,595 0 $0 0 $0 989 $1,125,758
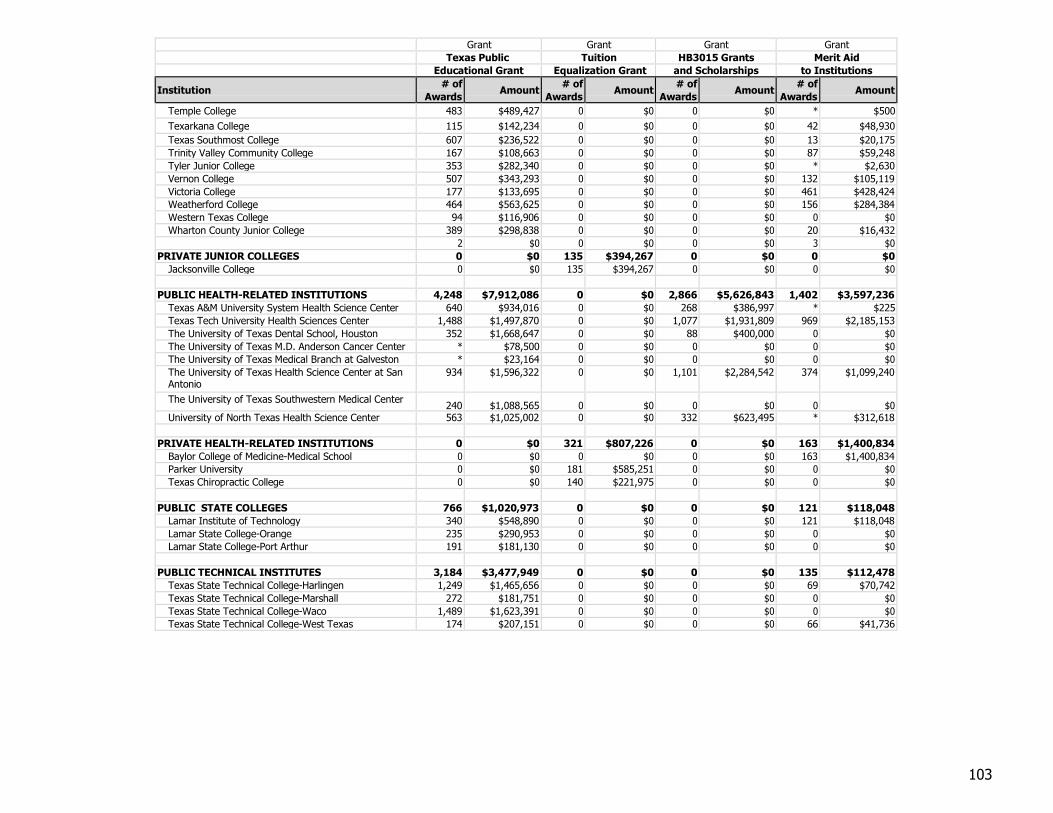
103
Grant Grant Grant Grant
Texas Public Tuition HB3015 Grants Merit Aid
Educational Grant Equalization Grant and Scholarships to Institutions
Institution # of
Awards Amount
# of
Awards Amount
# of
Awards Amount
# of
Awards Amount
Temple College 483 $489,427 0 $0 0 $0 * $500
Texarkana College 115 $142,234 0 $0 0 $0 42 $48,930
Texas Southmost College 607 $236,522 0 $0 0 $0 13 $20,175
Trinity Valley Community College 167 $108,663 0 $0 0 $0 87 $59,248
Tyler Junior College 353 $282,340 0 $0 0 $0 * $2,630
Vernon College 507 $343,293 0 $0 0 $0 132 $105,119
Victoria College 177 $133,695 0 $0 0 $0 461 $428,424
Weatherford College 464 $563,625 0 $0 0 $0 156 $284,384
Western Texas College 94 $116,906 0 $0 0 $0 0 $0
Wharton County Junior College 389 $298,838 0 $0 0 $0 20 $16,432
2 $0 0 $0 0 $0 3 $0
PRIVATE JUNIOR COLLEGES 0 $0 135 $394,267 0 $0 0 $0
Jacksonville College 0 $0 135 $394,267 0 $0 0 $0
PUBLIC HEALTH-RELATED INSTITUTIONS 4,248 $7,912,086 0 $0 2,866 $5,626,843 1,402 $3,597,236
Texas A&M University System Health Science Center 640 $934,016 0 $0 268 $386,997 * $225
Texas Tech University Health Sciences Center 1,488 $1,497,870 0 $0 1,077 $1,931,809 969 $2,185,153
The University of Texas Dental School, Houston 352 $1,668,647 0 $0 88 $400,000 0 $0
The University of Texas M.D. Anderson Cancer Center * $78,500 0 $0 0 $0 0 $0
The University of Texas Medical Branch at Galveston * $23,164 0 $0 0 $0 0 $0
The University of Texas Health Science Center at San Antonio
934 $1,596,322 0 $0 1,101 $2,284,542 374 $1,099,240
The University of Texas Southwestern Medical Center 240 $1,088,565 0 $0 0 $0 0 $0
University of North Texas Health Science Center 563 $1,025,002 0 $0 332 $623,495 * $312,618
PRIVATE HEALTH-RELATED INSTITUTIONS 0 $0 321 $807,226 0 $0 163 $1,400,834
Baylor College of Medicine-Medical School 0 $0 0 $0 0 $0 163 $1,400,834
Parker University 0 $0 181 $585,251 0 $0 0 $0
Texas Chiropractic College 0 $0 140 $221,975 0 $0 0 $0
PUBLIC STATE COLLEGES 766 $1,020,973 0 $0 0 $0 121 $118,048
Lamar Institute of Technology 340 $548,890 0 $0 0 $0 121 $118,048
Lamar State College-Orange 235 $290,953 0 $0 0 $0 0 $0
Lamar State College-Port Arthur 191 $181,130 0 $0 0 $0 0 $0
PUBLIC TECHNICAL INSTITUTES 3,184 $3,477,949 0 $0 0 $0 135 $112,478
Texas State Technical College-Harlingen 1,249 $1,465,656 0 $0 0 $0 69 $70,742
Texas State Technical College-Marshall 272 $181,751 0 $0 0 $0 0 $0
Texas State Technical College-Waco 1,489 $1,623,391 0 $0 0 $0 0 $0
Texas State Technical College-West Texas 174 $207,151 0 $0 0 $0 66 $41,736
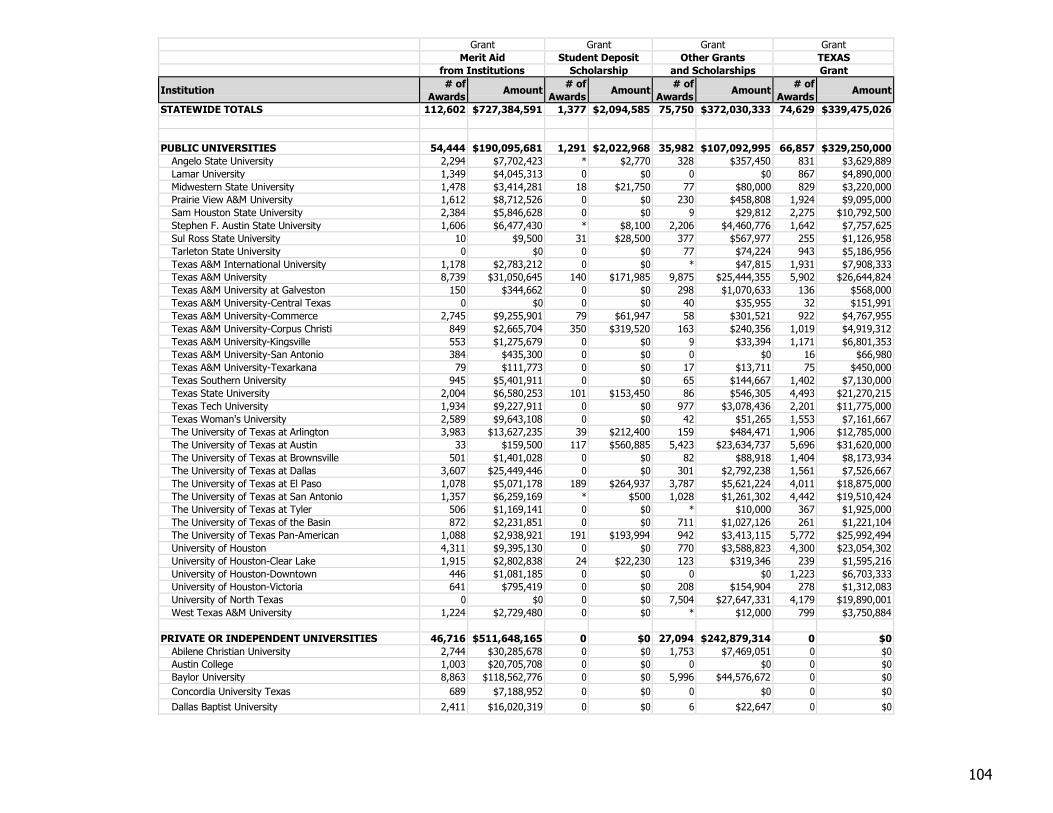
104
Grant Grant Grant Grant
Merit Aid Student Deposit Other Grants TEXAS
from Institutions Scholarship and Scholarships Grant
Institution # of
Awards Amount
# of
Awards Amount
# of
Awards Amount
# of
Awards Amount
STATEWIDE TOTALS 112,602 $727,384,591 1,377 $2,094,585 75,750 $372,030,333 74,629 $339,475,026
PUBLIC UNIVERSITIES 54,444 $190,095,681 1,291 $2,022,968 35,982 $107,092,995 66,857 $329,250,000
Angelo State University 2,294 $7,702,423 * $2,770 328 $357,450 831 $3,629,889
Lamar University 1,349 $4,045,313 0 $0 0 $0 867 $4,890,000
Midwestern State University 1,478 $3,414,281 18 $21,750 77 $80,000 829 $3,220,000
Prairie View A&M University 1,612 $8,712,526 0 $0 230 $458,808 1,924 $9,095,000
Sam Houston State University 2,384 $5,846,628 0 $0 9 $29,812 2,275 $10,792,500
Stephen F. Austin State University 1,606 $6,477,430 * $8,100 2,206 $4,460,776 1,642 $7,757,625
Sul Ross State University 10 $9,500 31 $28,500 377 $567,977 255 $1,126,958
Tarleton State University 0 $0 0 $0 77 $74,224 943 $5,186,956
Texas A&M International University 1,178 $2,783,212 0 $0 * $47,815 1,931 $7,908,333
Texas A&M University 8,739 $31,050,645 140 $171,985 9,875 $25,444,355 5,902 $26,644,824
Texas A&M University at Galveston 150 $344,662 0 $0 298 $1,070,633 136 $568,000
Texas A&M University-Central Texas 0 $0 0 $0 40 $35,955 32 $151,991
Texas A&M University-Commerce 2,745 $9,255,901 79 $61,947 58 $301,521 922 $4,767,955
Texas A&M University-Corpus Christi 849 $2,665,704 350 $319,520 163 $240,356 1,019 $4,919,312
Texas A&M University-Kingsville 553 $1,275,679 0 $0 9 $33,394 1,171 $6,801,353
Texas A&M University-San Antonio 384 $435,300 0 $0 0 $0 16 $66,980
Texas A&M University-Texarkana 79 $111,773 0 $0 17 $13,711 75 $450,000
Texas Southern University 945 $5,401,911 0 $0 65 $144,667 1,402 $7,130,000
Texas State University 2,004 $6,580,253 101 $153,450 86 $546,305 4,493 $21,270,215
Texas Tech University 1,934 $9,227,911 0 $0 977 $3,078,436 2,201 $11,775,000
Texas Woman's University 2,589 $9,643,108 0 $0 42 $51,265 1,553 $7,161,667
The University of Texas at Arlington 3,983 $13,627,235 39 $212,400 159 $484,471 1,906 $12,785,000
The University of Texas at Austin 33 $159,500 117 $560,885 5,423 $23,634,737 5,696 $31,620,000
The University of Texas at Brownsville 501 $1,401,028 0 $0 82 $88,918 1,404 $8,173,934
The University of Texas at Dallas 3,607 $25,449,446 0 $0 301 $2,792,238 1,561 $7,526,667
The University of Texas at El Paso 1,078 $5,071,178 189 $264,937 3,787 $5,621,224 4,011 $18,875,000
The University of Texas at San Antonio 1,357 $6,259,169 * $500 1,028 $1,261,302 4,442 $19,510,424
The University of Texas at Tyler 506 $1,169,141 0 $0 * $10,000 367 $1,925,000
The University of Texas of the Basin 872 $2,231,851 0 $0 711 $1,027,126 261 $1,221,104
The University of Texas Pan-American 1,088 $2,938,921 191 $193,994 942 $3,413,115 5,772 $25,992,494
University of Houston 4,311 $9,395,130 0 $0 770 $3,588,823 4,300 $23,054,302
University of Houston-Clear Lake 1,915 $2,802,838 24 $22,230 123 $319,346 239 $1,595,216
University of Houston-Downtown 446 $1,081,185 0 $0 0 $0 1,223 $6,703,333
University of Houston-Victoria 641 $795,419 0 $0 208 $154,904 278 $1,312,083
University of North Texas 0 $0 0 $0 7,504 $27,647,331 4,179 $19,890,001
West Texas A&M University 1,224 $2,729,480 0 $0 * $12,000 799 $3,750,884
PRIVATE OR INDEPENDENT UNIVERSITIES 46,716 $511,648,165 0 $0 27,094 $242,879,314 0 $0
Abilene Christian University 2,744 $30,285,678 0 $0 1,753 $7,469,051 0 $0
Austin College 1,003 $20,705,708 0 $0 0 $0 0 $0
Baylor University 8,863 $118,562,776 0 $0 5,996 $44,576,672 0 $0
Concordia University Texas 689 $7,188,952 0 $0 0 $0 0 $0
Dallas Baptist University 2,411 $16,020,319 0 $0 6 $22,647 0 $0
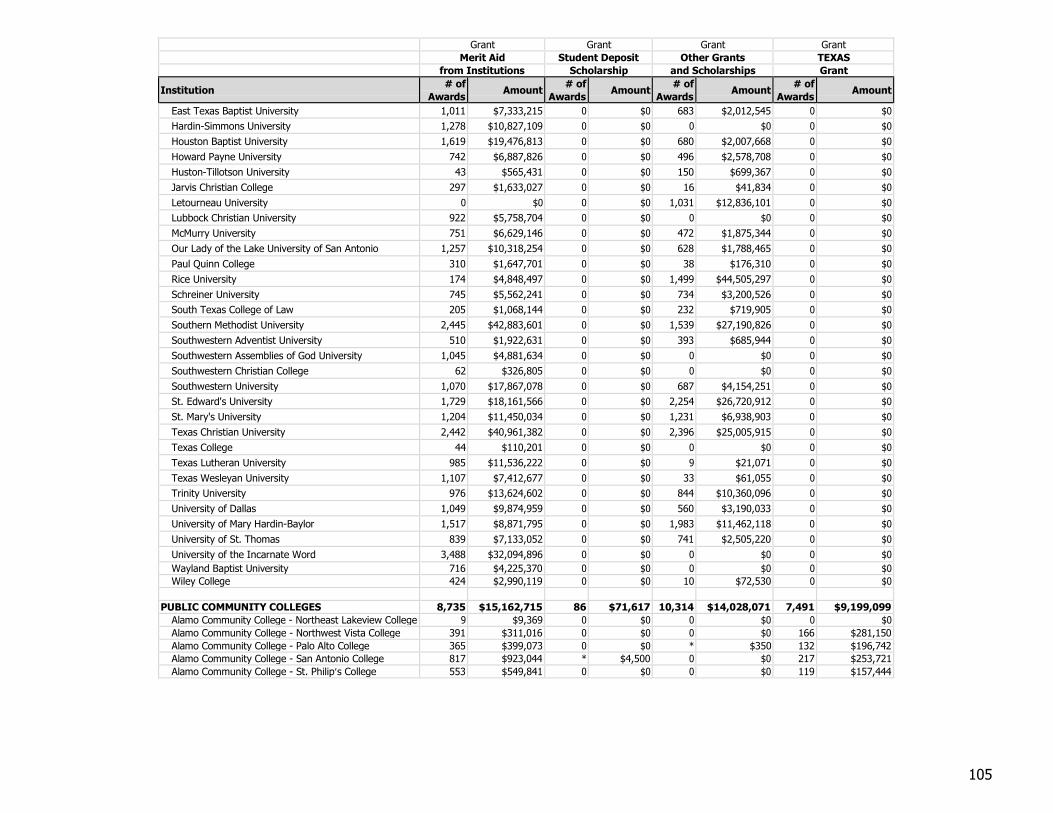
105
Grant Grant Grant Grant
Merit Aid Student Deposit Other Grants TEXAS
from Institutions Scholarship and Scholarships Grant
Institution # of
Awards Amount
# of
Awards Amount
# of
Awards Amount
# of
Awards Amount
East Texas Baptist University 1,011 $7,333,215 0 $0 683 $2,012,545 0 $0
Hardin-Simmons University 1,278 $10,827,109 0 $0 0 $0 0 $0
Houston Baptist University 1,619 $19,476,813 0 $0 680 $2,007,668 0 $0
Howard Payne University 742 $6,887,826 0 $0 496 $2,578,708 0 $0
Huston-Tillotson University 43 $565,431 0 $0 150 $699,367 0 $0
Jarvis Christian College 297 $1,633,027 0 $0 16 $41,834 0 $0
Letourneau University 0 $0 0 $0 1,031 $12,836,101 0 $0
Lubbock Christian University 922 $5,758,704 0 $0 0 $0 0 $0
McMurry University 751 $6,629,146 0 $0 472 $1,875,344 0 $0
Our Lady of the Lake University of San Antonio 1,257 $10,318,254 0 $0 628 $1,788,465 0 $0
Paul Quinn College 310 $1,647,701 0 $0 38 $176,310 0 $0
Rice University 174 $4,848,497 0 $0 1,499 $44,505,297 0 $0
Schreiner University 745 $5,562,241 0 $0 734 $3,200,526 0 $0
South Texas College of Law 205 $1,068,144 0 $0 232 $719,905 0 $0
Southern Methodist University 2,445 $42,883,601 0 $0 1,539 $27,190,826 0 $0
Southwestern Adventist University 510 $1,922,631 0 $0 393 $685,944 0 $0
Southwestern Assemblies of God University 1,045 $4,881,634 0 $0 0 $0 0 $0
Southwestern Christian College 62 $326,805 0 $0 0 $0 0 $0
Southwestern University 1,070 $17,867,078 0 $0 687 $4,154,251 0 $0
St. Edward's University 1,729 $18,161,566 0 $0 2,254 $26,720,912 0 $0
St. Mary's University 1,204 $11,450,034 0 $0 1,231 $6,938,903 0 $0
Texas Christian University 2,442 $40,961,382 0 $0 2,396 $25,005,915 0 $0
Texas College 44 $110,201 0 $0 0 $0 0 $0
Texas Lutheran University 985 $11,536,222 0 $0 9 $21,071 0 $0
Texas Wesleyan University 1,107 $7,412,677 0 $0 33 $61,055 0 $0
Trinity University 976 $13,624,602 0 $0 844 $10,360,096 0 $0
University of Dallas 1,049 $9,874,959 0 $0 560 $3,190,033 0 $0
University of Mary Hardin-Baylor 1,517 $8,871,795 0 $0 1,983 $11,462,118 0 $0
University of St. Thomas 839 $7,133,052 0 $0 741 $2,505,220 0 $0
University of the Incarnate Word 3,488 $32,094,896 0 $0 0 $0 0 $0
Wayland Baptist University 716 $4,225,370 0 $0 0 $0 0 $0
Wiley College 424 $2,990,119 0 $0 10 $72,530 0 $0
PUBLIC COMMUNITY COLLEGES 8,735 $15,162,715 86 $71,617 10,314 $14,028,071 7,491 $9,199,099
Alamo Community College - Northeast Lakeview College 9 $9,369 0 $0 0 $0 0 $0
Alamo Community College - Northwest Vista College 391 $311,016 0 $0 0 $0 166 $281,150
Alamo Community College - Palo Alto College 365 $399,073 0 $0 * $350 132 $196,742
Alamo Community College - San Antonio College 817 $923,044 * $4,500 0 $0 217 $253,721
Alamo Community College - St. Philip’s College 553 $549,841 0 $0 0 $0 119 $157,444
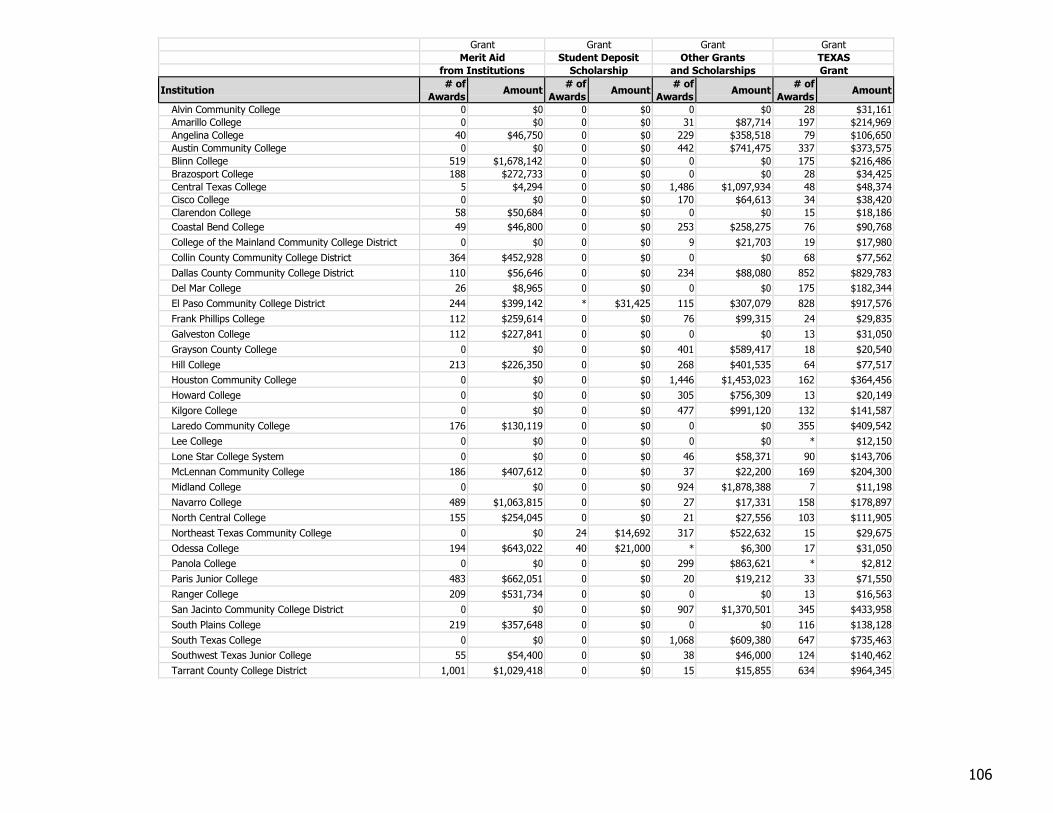
106
Grant Grant Grant Grant
Merit Aid Student Deposit Other Grants TEXAS
from Institutions Scholarship and Scholarships Grant
Institution # of
Awards Amount
# of
Awards Amount
# of
Awards Amount
# of
Awards Amount
Alvin Community College 0 $0 0 $0 0 $0 28 $31,161
Amarillo College 0 $0 0 $0 31 $87,714 197 $214,969
Angelina College 40 $46,750 0 $0 229 $358,518 79 $106,650
Austin Community College 0 $0 0 $0 442 $741,475 337 $373,575
Blinn College 519 $1,678,142 0 $0 0 $0 175 $216,486
Brazosport College 188 $272,733 0 $0 0 $0 28 $34,425
Central Texas College 5 $4,294 0 $0 1,486 $1,097,934 48 $48,374
Cisco College 0 $0 0 $0 170 $64,613 34 $38,420
Clarendon College 58 $50,684 0 $0 0 $0 15 $18,186
Coastal Bend College 49 $46,800 0 $0 253 $258,275 76 $90,768
College of the Mainland Community College District 0 $0 0 $0 9 $21,703 19 $17,980
Collin County Community College District 364 $452,928 0 $0 0 $0 68 $77,562
Dallas County Community College District 110 $56,646 0 $0 234 $88,080 852 $829,783
Del Mar College 26 $8,965 0 $0 0 $0 175 $182,344
El Paso Community College District 244 $399,142 * $31,425 115 $307,079 828 $917,576
Frank Phillips College 112 $259,614 0 $0 76 $99,315 24 $29,835
Galveston College 112 $227,841 0 $0 0 $0 13 $31,050
Grayson County College 0 $0 0 $0 401 $589,417 18 $20,540
Hill College 213 $226,350 0 $0 268 $401,535 64 $77,517
Houston Community College 0 $0 0 $0 1,446 $1,453,023 162 $364,456
Howard College 0 $0 0 $0 305 $756,309 13 $20,149
Kilgore College 0 $0 0 $0 477 $991,120 132 $141,587
Laredo Community College 176 $130,119 0 $0 0 $0 355 $409,542
Lee College 0 $0 0 $0 0 $0 * $12,150
Lone Star College System 0 $0 0 $0 46 $58,371 90 $143,706
McLennan Community College 186 $407,612 0 $0 37 $22,200 169 $204,300
Midland College 0 $0 0 $0 924 $1,878,388 7 $11,198
Navarro College 489 $1,063,815 0 $0 27 $17,331 158 $178,897
North Central College 155 $254,045 0 $0 21 $27,556 103 $111,905
Northeast Texas Community College 0 $0 24 $14,692 317 $522,632 15 $29,675
Odessa College 194 $643,022 40 $21,000 * $6,300 17 $31,050
Panola College 0 $0 0 $0 299 $863,621 * $2,812
Paris Junior College 483 $662,051 0 $0 20 $19,212 33 $71,550
Ranger College 209 $531,734 0 $0 0 $0 13 $16,563
San Jacinto Community College District 0 $0 0 $0 907 $1,370,501 345 $433,958
South Plains College 219 $357,648 0 $0 0 $0 116 $138,128
South Texas College 0 $0 0 $0 1,068 $609,380 647 $735,463
Southwest Texas Junior College 55 $54,400 0 $0 38 $46,000 124 $140,462
Tarrant County College District 1,001 $1,029,418 0 $0 15 $15,855 634 $964,345
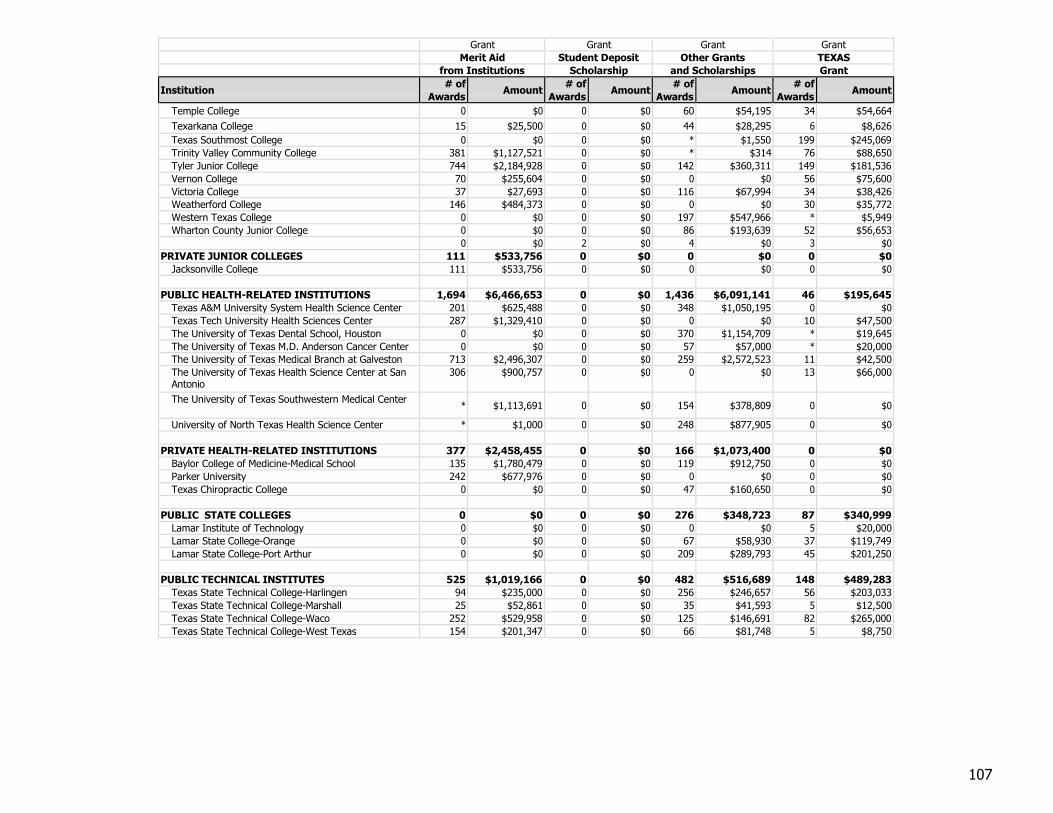
107
Grant Grant Grant Grant
Merit Aid Student Deposit Other Grants TEXAS
from Institutions Scholarship and Scholarships Grant
Institution # of
Awards Amount
# of
Awards Amount
# of
Awards Amount
# of
Awards Amount
Temple College 0 $0 0 $0 60 $54,195 34 $54,664
Texarkana College 15 $25,500 0 $0 44 $28,295 6 $8,626
Texas Southmost College 0 $0 0 $0 * $1,550 199 $245,069
Trinity Valley Community College 381 $1,127,521 0 $0 * $314 76 $88,650
Tyler Junior College 744 $2,184,928 0 $0 142 $360,311 149 $181,536
Vernon College 70 $255,604 0 $0 0 $0 56 $75,600
Victoria College 37 $27,693 0 $0 116 $67,994 34 $38,426
Weatherford College 146 $484,373 0 $0 0 $0 30 $35,772
Western Texas College 0 $0 0 $0 197 $547,966 * $5,949
Wharton County Junior College 0 $0 0 $0 86 $193,639 52 $56,653
0 $0 2 $0 4 $0 3 $0
PRIVATE JUNIOR COLLEGES 111 $533,756 0 $0 0 $0 0 $0
Jacksonville College 111 $533,756 0 $0 0 $0 0 $0
PUBLIC HEALTH-RELATED INSTITUTIONS 1,694 $6,466,653 0 $0 1,436 $6,091,141 46 $195,645
Texas A&M University System Health Science Center 201 $625,488 0 $0 348 $1,050,195 0 $0
Texas Tech University Health Sciences Center 287 $1,329,410 0 $0 0 $0 10 $47,500
The University of Texas Dental School, Houston 0 $0 0 $0 370 $1,154,709 * $19,645
The University of Texas M.D. Anderson Cancer Center 0 $0 0 $0 57 $57,000 * $20,000
The University of Texas Medical Branch at Galveston 713 $2,496,307 0 $0 259 $2,572,523 11 $42,500
The University of Texas Health Science Center at San Antonio
306 $900,757 0 $0 0 $0 13 $66,000
The University of Texas Southwestern Medical Center * $1,113,691 0 $0 154 $378,809 0 $0
University of North Texas Health Science Center * $1,000 0 $0 248 $877,905 0 $0
PRIVATE HEALTH-RELATED INSTITUTIONS 377 $2,458,455 0 $0 166 $1,073,400 0 $0
Baylor College of Medicine-Medical School 135 $1,780,479 0 $0 119 $912,750 0 $0
Parker University 242 $677,976 0 $0 0 $0 0 $0
Texas Chiropractic College 0 $0 0 $0 47 $160,650 0 $0
PUBLIC STATE COLLEGES 0 $0 0 $0 276 $348,723 87 $340,999
Lamar Institute of Technology 0 $0 0 $0 0 $0 5 $20,000
Lamar State College-Orange 0 $0 0 $0 67 $58,930 37 $119,749
Lamar State College-Port Arthur 0 $0 0 $0 209 $289,793 45 $201,250
PUBLIC TECHNICAL INSTITUTES 525 $1,019,166 0 $0 482 $516,689 148 $489,283
Texas State Technical College-Harlingen 94 $235,000 0 $0 256 $246,657 56 $203,033
Texas State Technical College-Marshall 25 $52,861 0 $0 35 $41,593 5 $12,500
Texas State Technical College-Waco 252 $529,958 0 $0 125 $146,691 82 $265,000
Texas State Technical College-West Texas 154 $201,347 0 $0 66 $81,748 5 $8,750
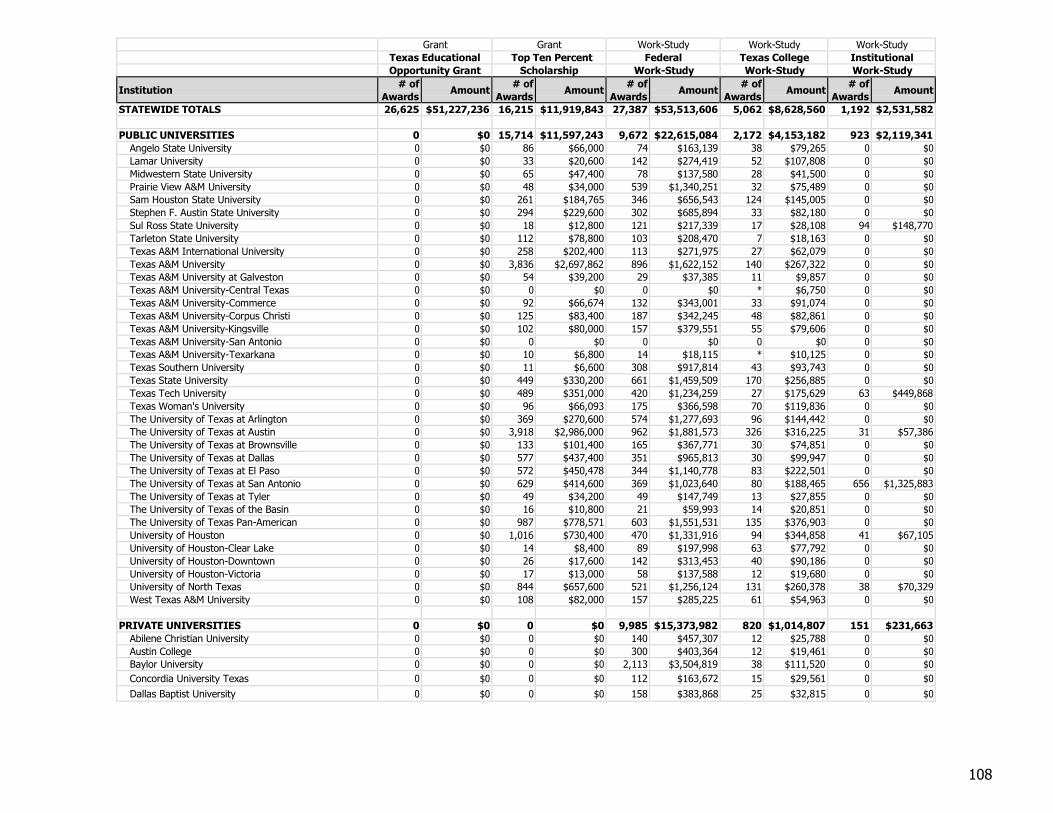
108
Grant Grant Work-Study Work-Study Work-Study
Texas Educational Top Ten Percent Federal Texas College Institutional
Opportunity Grant Scholarship Work-Study Work-Study Work-Study
Institution # of
Awards Amount
# of
Awards Amount
# of
Awards Amount
# of
Awards Amount
# of
Awards Amount
STATEWIDE TOTALS 26,625 $51,227,236 16,215 $11,919,843 27,387 $53,513,606 5,062 $8,628,560 1,192 $2,531,582
PUBLIC UNIVERSITIES 0 $0 15,714 $11,597,243 9,672 $22,615,084 2,172 $4,153,182 923 $2,119,341
Angelo State University 0 $0 86 $66,000 74 $163,139 38 $79,265 0 $0
Lamar University 0 $0 33 $20,600 142 $274,419 52 $107,808 0 $0
Midwestern State University 0 $0 65 $47,400 78 $137,580 28 $41,500 0 $0
Prairie View A&M University 0 $0 48 $34,000 539 $1,340,251 32 $75,489 0 $0
Sam Houston State University 0 $0 261 $184,765 346 $656,543 124 $145,005 0 $0
Stephen F. Austin State University 0 $0 294 $229,600 302 $685,894 33 $82,180 0 $0
Sul Ross State University 0 $0 18 $12,800 121 $217,339 17 $28,108 94 $148,770
Tarleton State University 0 $0 112 $78,800 103 $208,470 7 $18,163 0 $0
Texas A&M International University 0 $0 258 $202,400 113 $271,975 27 $62,079 0 $0
Texas A&M University 0 $0 3,836 $2,697,862 896 $1,622,152 140 $267,322 0 $0
Texas A&M University at Galveston 0 $0 54 $39,200 29 $37,385 11 $9,857 0 $0
Texas A&M University-Central Texas 0 $0 0 $0 0 $0 * $6,750 0 $0
Texas A&M University-Commerce 0 $0 92 $66,674 132 $343,001 33 $91,074 0 $0
Texas A&M University-Corpus Christi 0 $0 125 $83,400 187 $342,245 48 $82,861 0 $0
Texas A&M University-Kingsville 0 $0 102 $80,000 157 $379,551 55 $79,606 0 $0
Texas A&M University-San Antonio 0 $0 0 $0 0 $0 0 $0 0 $0
Texas A&M University-Texarkana 0 $0 10 $6,800 14 $18,115 * $10,125 0 $0
Texas Southern University 0 $0 11 $6,600 308 $917,814 43 $93,743 0 $0
Texas State University 0 $0 449 $330,200 661 $1,459,509 170 $256,885 0 $0
Texas Tech University 0 $0 489 $351,000 420 $1,234,259 27 $175,629 63 $449,868
Texas Woman's University 0 $0 96 $66,093 175 $366,598 70 $119,836 0 $0
The University of Texas at Arlington 0 $0 369 $270,600 574 $1,277,693 96 $144,442 0 $0
The University of Texas at Austin 0 $0 3,918 $2,986,000 962 $1,881,573 326 $316,225 31 $57,386
The University of Texas at Brownsville 0 $0 133 $101,400 165 $367,771 30 $74,851 0 $0
The University of Texas at Dallas 0 $0 577 $437,400 351 $965,813 30 $99,947 0 $0
The University of Texas at El Paso 0 $0 572 $450,478 344 $1,140,778 83 $222,501 0 $0
The University of Texas at San Antonio 0 $0 629 $414,600 369 $1,023,640 80 $188,465 656 $1,325,883
The University of Texas at Tyler 0 $0 49 $34,200 49 $147,749 13 $27,855 0 $0
The University of Texas of the Basin 0 $0 16 $10,800 21 $59,993 14 $20,851 0 $0
The University of Texas Pan-American 0 $0 987 $778,571 603 $1,551,531 135 $376,903 0 $0
University of Houston 0 $0 1,016 $730,400 470 $1,331,916 94 $344,858 41 $67,105
University of Houston-Clear Lake 0 $0 14 $8,400 89 $197,998 63 $77,792 0 $0
University of Houston-Downtown 0 $0 26 $17,600 142 $313,453 40 $90,186 0 $0
University of Houston-Victoria 0 $0 17 $13,000 58 $137,588 12 $19,680 0 $0
University of North Texas 0 $0 844 $657,600 521 $1,256,124 131 $260,378 38 $70,329
West Texas A&M University 0 $0 108 $82,000 157 $285,225 61 $54,963 0 $0
PRIVATE UNIVERSITIES 0 $0 0 $0 9,985 $15,373,982 820 $1,014,807 151 $231,663
Abilene Christian University 0 $0 0 $0 140 $457,307 12 $25,788 0 $0
Austin College 0 $0 0 $0 300 $403,364 12 $19,461 0 $0
Baylor University 0 $0 0 $0 2,113 $3,504,819 38 $111,520 0 $0
Concordia University Texas 0 $0 0 $0 112 $163,672 15 $29,561 0 $0
Dallas Baptist University 0 $0 0 $0 158 $383,868 25 $32,815 0 $0
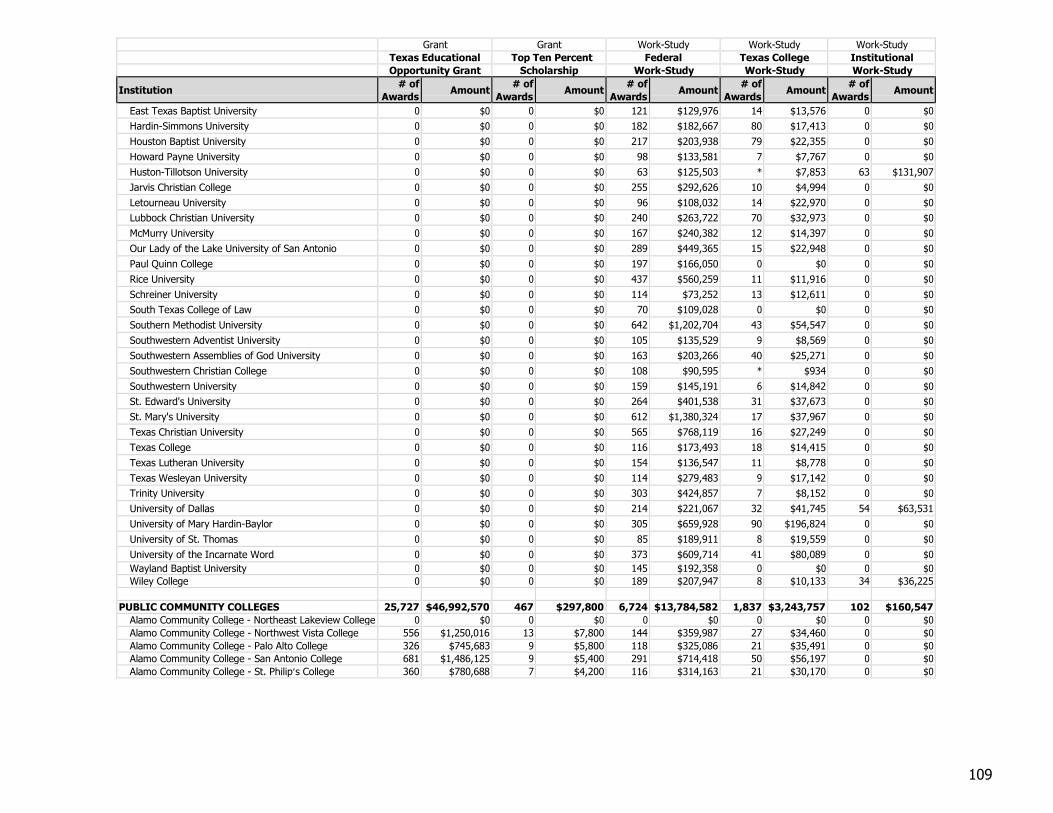
109
Grant Grant Work-Study Work-Study Work-Study
Texas Educational Top Ten Percent Federal Texas College Institutional
Opportunity Grant Scholarship Work-Study Work-Study Work-Study
Institution # of
Awards Amount
# of
Awards Amount
# of
Awards Amount
# of
Awards Amount
# of
Awards Amount
East Texas Baptist University 0 $0 0 $0 121 $129,976 14 $13,576 0 $0
Hardin-Simmons University 0 $0 0 $0 182 $182,667 80 $17,413 0 $0
Houston Baptist University 0 $0 0 $0 217 $203,938 79 $22,355 0 $0
Howard Payne University 0 $0 0 $0 98 $133,581 7 $7,767 0 $0
Huston-Tillotson University 0 $0 0 $0 63 $125,503 * $7,853 63 $131,907
Jarvis Christian College 0 $0 0 $0 255 $292,626 10 $4,994 0 $0
Letourneau University 0 $0 0 $0 96 $108,032 14 $22,970 0 $0
Lubbock Christian University 0 $0 0 $0 240 $263,722 70 $32,973 0 $0
McMurry University 0 $0 0 $0 167 $240,382 12 $14,397 0 $0
Our Lady of the Lake University of San Antonio 0 $0 0 $0 289 $449,365 15 $22,948 0 $0
Paul Quinn College 0 $0 0 $0 197 $166,050 0 $0 0 $0
Rice University 0 $0 0 $0 437 $560,259 11 $11,916 0 $0
Schreiner University 0 $0 0 $0 114 $73,252 13 $12,611 0 $0
South Texas College of Law 0 $0 0 $0 70 $109,028 0 $0 0 $0
Southern Methodist University 0 $0 0 $0 642 $1,202,704 43 $54,547 0 $0
Southwestern Adventist University 0 $0 0 $0 105 $135,529 9 $8,569 0 $0
Southwestern Assemblies of God University 0 $0 0 $0 163 $203,266 40 $25,271 0 $0
Southwestern Christian College 0 $0 0 $0 108 $90,595 * $934 0 $0
Southwestern University 0 $0 0 $0 159 $145,191 6 $14,842 0 $0
St. Edward's University 0 $0 0 $0 264 $401,538 31 $37,673 0 $0
St. Mary's University 0 $0 0 $0 612 $1,380,324 17 $37,967 0 $0
Texas Christian University 0 $0 0 $0 565 $768,119 16 $27,249 0 $0
Texas College 0 $0 0 $0 116 $173,493 18 $14,415 0 $0
Texas Lutheran University 0 $0 0 $0 154 $136,547 11 $8,778 0 $0
Texas Wesleyan University 0 $0 0 $0 114 $279,483 9 $17,142 0 $0
Trinity University 0 $0 0 $0 303 $424,857 7 $8,152 0 $0
University of Dallas 0 $0 0 $0 214 $221,067 32 $41,745 54 $63,531
University of Mary Hardin-Baylor 0 $0 0 $0 305 $659,928 90 $196,824 0 $0
University of St. Thomas 0 $0 0 $0 85 $189,911 8 $19,559 0 $0
University of the Incarnate Word 0 $0 0 $0 373 $609,714 41 $80,089 0 $0
Wayland Baptist University 0 $0 0 $0 145 $192,358 0 $0 0 $0
Wiley College 0 $0 0 $0 189 $207,947 8 $10,133 34 $36,225
PUBLIC COMMUNITY COLLEGES 25,727 $46,992,570 467 $297,800 6,724 $13,784,582 1,837 $3,243,757 102 $160,547
Alamo Community College - Northeast Lakeview College 0 $0 0 $0 0 $0 0 $0 0 $0
Alamo Community College - Northwest Vista College 556 $1,250,016 13 $7,800 144 $359,987 27 $34,460 0 $0
Alamo Community College - Palo Alto College 326 $745,683 9 $5,800 118 $325,086 21 $35,491 0 $0
Alamo Community College - San Antonio College 681 $1,486,125 9 $5,400 291 $714,418 50 $56,197 0 $0
Alamo Community College - St. Philip’s College 360 $780,688 7 $4,200 116 $314,163 21 $30,170 0 $0
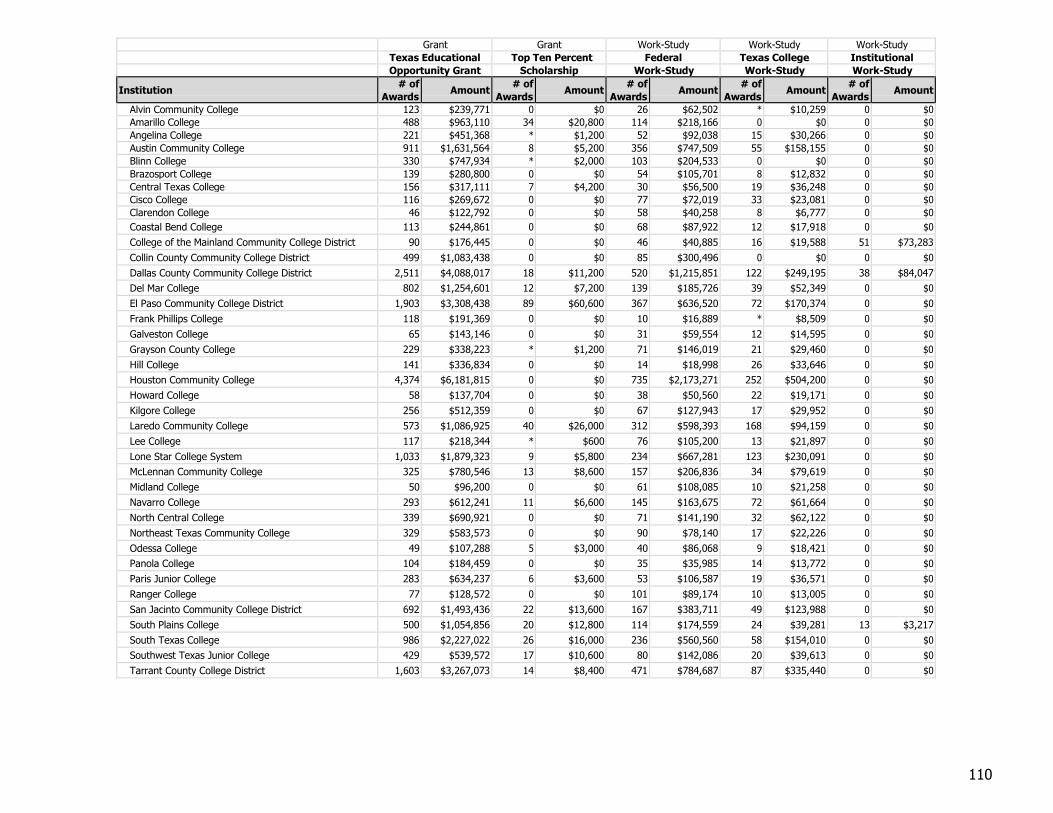
110
Grant Grant Work-Study Work-Study Work-Study
Texas Educational Top Ten Percent Federal Texas College Institutional
Opportunity Grant Scholarship Work-Study Work-Study Work-Study
Institution # of
Awards Amount
# of
Awards Amount
# of
Awards Amount
# of
Awards Amount
# of
Awards Amount
Alvin Community College 123 $239,771 0 $0 26 $62,502 * $10,259 0 $0
Amarillo College 488 $963,110 34 $20,800 114 $218,166 0 $0 0 $0
Angelina College 221 $451,368 * $1,200 52 $92,038 15 $30,266 0 $0
Austin Community College 911 $1,631,564 8 $5,200 356 $747,509 55 $158,155 0 $0
Blinn College 330 $747,934 * $2,000 103 $204,533 0 $0 0 $0
Brazosport College 139 $280,800 0 $0 54 $105,701 8 $12,832 0 $0
Central Texas College 156 $317,111 7 $4,200 30 $56,500 19 $36,248 0 $0
Cisco College 116 $269,672 0 $0 77 $72,019 33 $23,081 0 $0
Clarendon College 46 $122,792 0 $0 58 $40,258 8 $6,777 0 $0
Coastal Bend College 113 $244,861 0 $0 68 $87,922 12 $17,918 0 $0
College of the Mainland Community College District 90 $176,445 0 $0 46 $40,885 16 $19,588 51 $73,283
Collin County Community College District 499 $1,083,438 0 $0 85 $300,496 0 $0 0 $0
Dallas County Community College District 2,511 $4,088,017 18 $11,200 520 $1,215,851 122 $249,195 38 $84,047
Del Mar College 802 $1,254,601 12 $7,200 139 $185,726 39 $52,349 0 $0
El Paso Community College District 1,903 $3,308,438 89 $60,600 367 $636,520 72 $170,374 0 $0
Frank Phillips College 118 $191,369 0 $0 10 $16,889 * $8,509 0 $0
Galveston College 65 $143,146 0 $0 31 $59,554 12 $14,595 0 $0
Grayson County College 229 $338,223 * $1,200 71 $146,019 21 $29,460 0 $0
Hill College 141 $336,834 0 $0 14 $18,998 26 $33,646 0 $0
Houston Community College 4,374 $6,181,815 0 $0 735 $2,173,271 252 $504,200 0 $0
Howard College 58 $137,704 0 $0 38 $50,560 22 $19,171 0 $0
Kilgore College 256 $512,359 0 $0 67 $127,943 17 $29,952 0 $0
Laredo Community College 573 $1,086,925 40 $26,000 312 $598,393 168 $94,159 0 $0
Lee College 117 $218,344 * $600 76 $105,200 13 $21,897 0 $0
Lone Star College System 1,033 $1,879,323 9 $5,800 234 $667,281 123 $230,091 0 $0
McLennan Community College 325 $780,546 13 $8,600 157 $206,836 34 $79,619 0 $0
Midland College 50 $96,200 0 $0 61 $108,085 10 $21,258 0 $0
Navarro College 293 $612,241 11 $6,600 145 $163,675 72 $61,664 0 $0
North Central College 339 $690,921 0 $0 71 $141,190 32 $62,122 0 $0
Northeast Texas Community College 329 $583,573 0 $0 90 $78,140 17 $22,226 0 $0
Odessa College 49 $107,288 5 $3,000 40 $86,068 9 $18,421 0 $0
Panola College 104 $184,459 0 $0 35 $35,985 14 $13,772 0 $0
Paris Junior College 283 $634,237 6 $3,600 53 $106,587 19 $36,571 0 $0
Ranger College 77 $128,572 0 $0 101 $89,174 10 $13,005 0 $0
San Jacinto Community College District 692 $1,493,436 22 $13,600 167 $383,711 49 $123,988 0 $0
South Plains College 500 $1,054,856 20 $12,800 114 $174,559 24 $39,281 13 $3,217
South Texas College 986 $2,227,022 26 $16,000 236 $560,560 58 $154,010 0 $0
Southwest Texas Junior College 429 $539,572 17 $10,600 80 $142,086 20 $39,613 0 $0
Tarrant County College District 1,603 $3,267,073 14 $8,400 471 $784,687 87 $335,440 0 $0
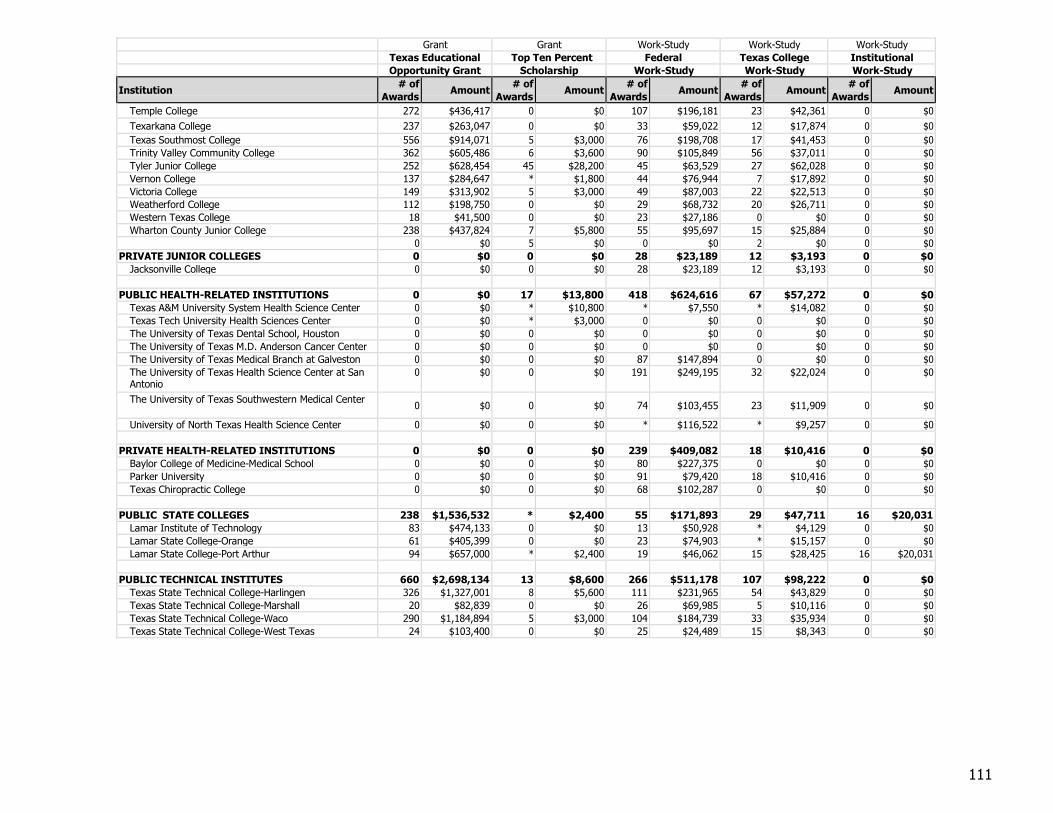
111
Grant Grant Work-Study Work-Study Work-Study
Texas Educational Top Ten Percent Federal Texas College Institutional
Opportunity Grant Scholarship Work-Study Work-Study Work-Study
Institution # of
Awards Amount
# of
Awards Amount
# of
Awards Amount
# of
Awards Amount
# of
Awards Amount
Temple College 272 $436,417 0 $0 107 $196,181 23 $42,361 0 $0
Texarkana College 237 $263,047 0 $0 33 $59,022 12 $17,874 0 $0
Texas Southmost College 556 $914,071 5 $3,000 76 $198,708 17 $41,453 0 $0
Trinity Valley Community College 362 $605,486 6 $3,600 90 $105,849 56 $37,011 0 $0
Tyler Junior College 252 $628,454 45 $28,200 45 $63,529 27 $62,028 0 $0
Vernon College 137 $284,647 * $1,800 44 $76,944 7 $17,892 0 $0
Victoria College 149 $313,902 5 $3,000 49 $87,003 22 $22,513 0 $0
Weatherford College 112 $198,750 0 $0 29 $68,732 20 $26,711 0 $0
Western Texas College 18 $41,500 0 $0 23 $27,186 0 $0 0 $0
Wharton County Junior College 238 $437,824 7 $5,800 55 $95,697 15 $25,884 0 $0
0 $0 5 $0 0 $0 2 $0 0 $0
PRIVATE JUNIOR COLLEGES 0 $0 0 $0 28 $23,189 12 $3,193 0 $0
Jacksonville College 0 $0 0 $0 28 $23,189 12 $3,193 0 $0
PUBLIC HEALTH-RELATED INSTITUTIONS 0 $0 17 $13,800 418 $624,616 67 $57,272 0 $0
Texas A&M University System Health Science Center 0 $0 * $10,800 * $7,550 * $14,082 0 $0
Texas Tech University Health Sciences Center 0 $0 * $3,000 0 $0 0 $0 0 $0
The University of Texas Dental School, Houston 0 $0 0 $0 0 $0 0 $0 0 $0
The University of Texas M.D. Anderson Cancer Center 0 $0 0 $0 0 $0 0 $0 0 $0
The University of Texas Medical Branch at Galveston 0 $0 0 $0 87 $147,894 0 $0 0 $0
The University of Texas Health Science Center at San Antonio
0 $0 0 $0 191 $249,195 32 $22,024 0 $0
The University of Texas Southwestern Medical Center 0 $0 0 $0 74 $103,455 23 $11,909 0 $0
University of North Texas Health Science Center 0 $0 0 $0 * $116,522 * $9,257 0 $0
PRIVATE HEALTH-RELATED INSTITUTIONS 0 $0 0 $0 239 $409,082 18 $10,416 0 $0
Baylor College of Medicine-Medical School 0 $0 0 $0 80 $227,375 0 $0 0 $0
Parker University 0 $0 0 $0 91 $79,420 18 $10,416 0 $0
Texas Chiropractic College 0 $0 0 $0 68 $102,287 0 $0 0 $0
PUBLIC STATE COLLEGES 238 $1,536,532 * $2,400 55 $171,893 29 $47,711 16 $20,031
Lamar Institute of Technology 83 $474,133 0 $0 13 $50,928 * $4,129 0 $0
Lamar State College-Orange 61 $405,399 0 $0 23 $74,903 * $15,157 0 $0
Lamar State College-Port Arthur 94 $657,000 * $2,400 19 $46,062 15 $28,425 16 $20,031
PUBLIC TECHNICAL INSTITUTES 660 $2,698,134 13 $8,600 266 $511,178 107 $98,222 0 $0
Texas State Technical College-Harlingen 326 $1,327,001 8 $5,600 111 $231,965 54 $43,829 0 $0
Texas State Technical College-Marshall 20 $82,839 0 $0 26 $69,985 5 $10,116 0 $0
Texas State Technical College-Waco 290 $1,184,894 5 $3,000 104 $184,739 33 $35,934 0 $0
Texas State Technical College-West Texas 24 $103,400 0 $0 25 $24,489 15 $8,343 0 $0
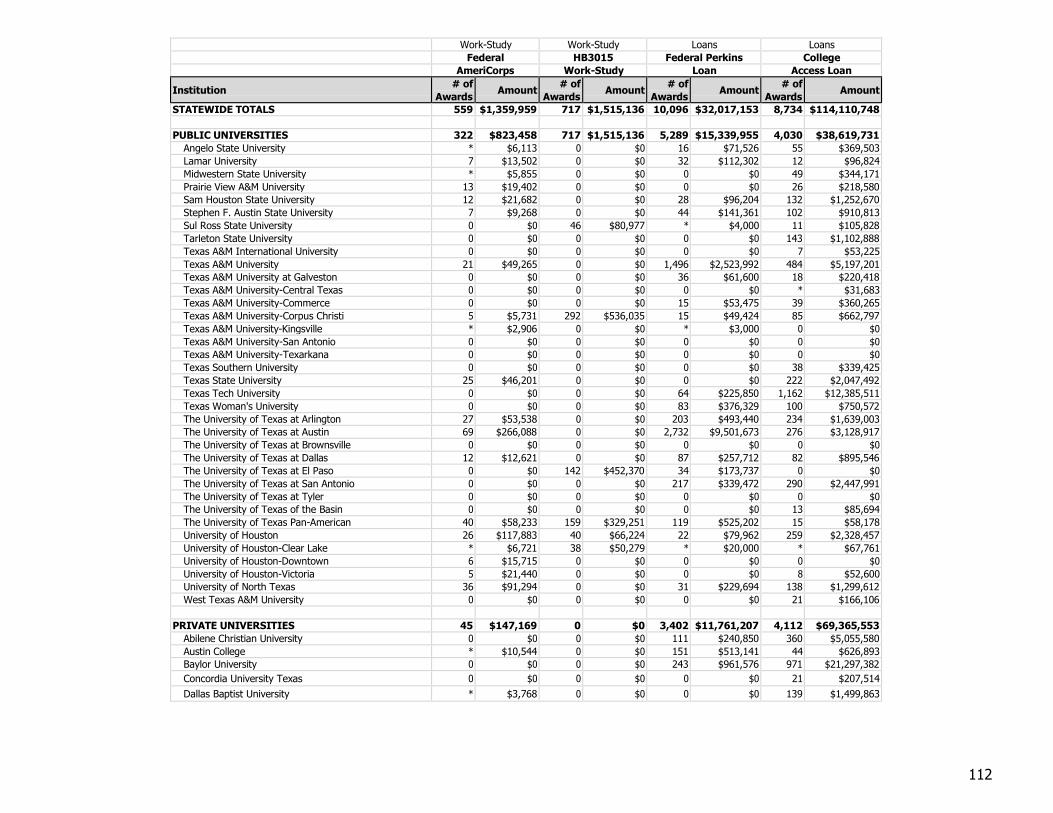
112
Work-Study Work-Study Loans Loans
Federal HB3015 Federal Perkins College
AmeriCorps Work-Study Loan Access Loan
Institution # of
Awards Amount
# of
Awards Amount
# of
Awards Amount
# of
Awards Amount
STATEWIDE TOTALS 559 $1,359,959 717 $1,515,136 10,096 $32,017,153 8,734 $114,110,748
PUBLIC UNIVERSITIES 322 $823,458 717 $1,515,136 5,289 $15,339,955 4,030 $38,619,731
Angelo State University * $6,113 0 $0 16 $71,526 55 $369,503
Lamar University 7 $13,502 0 $0 32 $112,302 12 $96,824
Midwestern State University * $5,855 0 $0 0 $0 49 $344,171
Prairie View A&M University 13 $19,402 0 $0 0 $0 26 $218,580
Sam Houston State University 12 $21,682 0 $0 28 $96,204 132 $1,252,670
Stephen F. Austin State University 7 $9,268 0 $0 44 $141,361 102 $910,813
Sul Ross State University 0 $0 46 $80,977 * $4,000 11 $105,828
Tarleton State University 0 $0 0 $0 0 $0 143 $1,102,888
Texas A&M International University 0 $0 0 $0 0 $0 7 $53,225
Texas A&M University 21 $49,265 0 $0 1,496 $2,523,992 484 $5,197,201
Texas A&M University at Galveston 0 $0 0 $0 36 $61,600 18 $220,418
Texas A&M University-Central Texas 0 $0 0 $0 0 $0 * $31,683
Texas A&M University-Commerce 0 $0 0 $0 15 $53,475 39 $360,265
Texas A&M University-Corpus Christi 5 $5,731 292 $536,035 15 $49,424 85 $662,797
Texas A&M University-Kingsville * $2,906 0 $0 * $3,000 0 $0
Texas A&M University-San Antonio 0 $0 0 $0 0 $0 0 $0
Texas A&M University-Texarkana 0 $0 0 $0 0 $0 0 $0
Texas Southern University 0 $0 0 $0 0 $0 38 $339,425
Texas State University 25 $46,201 0 $0 0 $0 222 $2,047,492
Texas Tech University 0 $0 0 $0 64 $225,850 1,162 $12,385,511
Texas Woman's University 0 $0 0 $0 83 $376,329 100 $750,572
The University of Texas at Arlington 27 $53,538 0 $0 203 $493,440 234 $1,639,003
The University of Texas at Austin 69 $266,088 0 $0 2,732 $9,501,673 276 $3,128,917
The University of Texas at Brownsville 0 $0 0 $0 0 $0 0 $0
The University of Texas at Dallas 12 $12,621 0 $0 87 $257,712 82 $895,546
The University of Texas at El Paso 0 $0 142 $452,370 34 $173,737 0 $0
The University of Texas at San Antonio 0 $0 0 $0 217 $339,472 290 $2,447,991
The University of Texas at Tyler 0 $0 0 $0 0 $0 0 $0
The University of Texas of the Basin 0 $0 0 $0 0 $0 13 $85,694
The University of Texas Pan-American 40 $58,233 159 $329,251 119 $525,202 15 $58,178
University of Houston 26 $117,883 40 $66,224 22 $79,962 259 $2,328,457
University of Houston-Clear Lake * $6,721 38 $50,279 * $20,000 * $67,761
University of Houston-Downtown 6 $15,715 0 $0 0 $0 0 $0
University of Houston-Victoria 5 $21,440 0 $0 0 $0 8 $52,600
University of North Texas 36 $91,294 0 $0 31 $229,694 138 $1,299,612
West Texas A&M University 0 $0 0 $0 0 $0 21 $166,106
PRIVATE UNIVERSITIES 45 $147,169 0 $0 3,402 $11,761,207 4,112 $69,365,553
Abilene Christian University 0 $0 0 $0 111 $240,850 360 $5,055,580
Austin College * $10,544 0 $0 151 $513,141 44 $626,893
Baylor University 0 $0 0 $0 243 $961,576 971 $21,297,382
Concordia University Texas 0 $0 0 $0 0 $0 21 $207,514
Dallas Baptist University * $3,768 0 $0 0 $0 139 $1,499,863
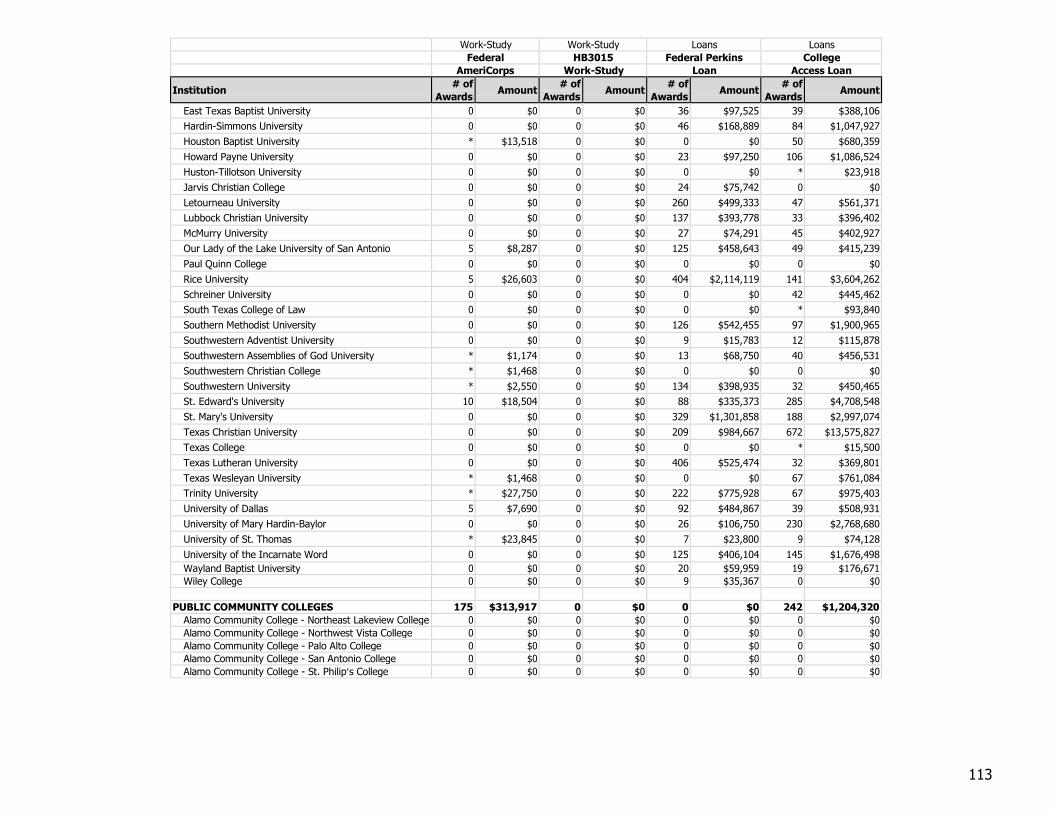
113
Work-Study Work-Study Loans Loans
Federal HB3015 Federal Perkins College
AmeriCorps Work-Study Loan Access Loan
Institution # of
Awards Amount
# of
Awards Amount
# of
Awards Amount
# of
Awards Amount
East Texas Baptist University 0 $0 0 $0 36 $97,525 39 $388,106
Hardin-Simmons University 0 $0 0 $0 46 $168,889 84 $1,047,927
Houston Baptist University * $13,518 0 $0 0 $0 50 $680,359
Howard Payne University 0 $0 0 $0 23 $97,250 106 $1,086,524
Huston-Tillotson University 0 $0 0 $0 0 $0 * $23,918
Jarvis Christian College 0 $0 0 $0 24 $75,742 0 $0
Letourneau University 0 $0 0 $0 260 $499,333 47 $561,371
Lubbock Christian University 0 $0 0 $0 137 $393,778 33 $396,402
McMurry University 0 $0 0 $0 27 $74,291 45 $402,927
Our Lady of the Lake University of San Antonio 5 $8,287 0 $0 125 $458,643 49 $415,239
Paul Quinn College 0 $0 0 $0 0 $0 0 $0
Rice University 5 $26,603 0 $0 404 $2,114,119 141 $3,604,262
Schreiner University 0 $0 0 $0 0 $0 42 $445,462
South Texas College of Law 0 $0 0 $0 0 $0 * $93,840
Southern Methodist University 0 $0 0 $0 126 $542,455 97 $1,900,965
Southwestern Adventist University 0 $0 0 $0 9 $15,783 12 $115,878
Southwestern Assemblies of God University * $1,174 0 $0 13 $68,750 40 $456,531
Southwestern Christian College * $1,468 0 $0 0 $0 0 $0
Southwestern University * $2,550 0 $0 134 $398,935 32 $450,465
St. Edward's University 10 $18,504 0 $0 88 $335,373 285 $4,708,548
St. Mary's University 0 $0 0 $0 329 $1,301,858 188 $2,997,074
Texas Christian University 0 $0 0 $0 209 $984,667 672 $13,575,827
Texas College 0 $0 0 $0 0 $0 * $15,500
Texas Lutheran University 0 $0 0 $0 406 $525,474 32 $369,801
Texas Wesleyan University * $1,468 0 $0 0 $0 67 $761,084
Trinity University * $27,750 0 $0 222 $775,928 67 $975,403
University of Dallas 5 $7,690 0 $0 92 $484,867 39 $508,931
University of Mary Hardin-Baylor 0 $0 0 $0 26 $106,750 230 $2,768,680
University of St. Thomas * $23,845 0 $0 7 $23,800 9 $74,128
University of the Incarnate Word 0 $0 0 $0 125 $406,104 145 $1,676,498
Wayland Baptist University 0 $0 0 $0 20 $59,959 19 $176,671
Wiley College 0 $0 0 $0 9 $35,367 0 $0
PUBLIC COMMUNITY COLLEGES 175 $313,917 0 $0 0 $0 242 $1,204,320
Alamo Community College - Northeast Lakeview College 0 $0 0 $0 0 $0 0 $0
Alamo Community College - Northwest Vista College 0 $0 0 $0 0 $0 0 $0
Alamo Community College - Palo Alto College 0 $0 0 $0 0 $0 0 $0
Alamo Community College - San Antonio College 0 $0 0 $0 0 $0 0 $0
Alamo Community College - St. Philip’s College 0 $0 0 $0 0 $0 0 $0
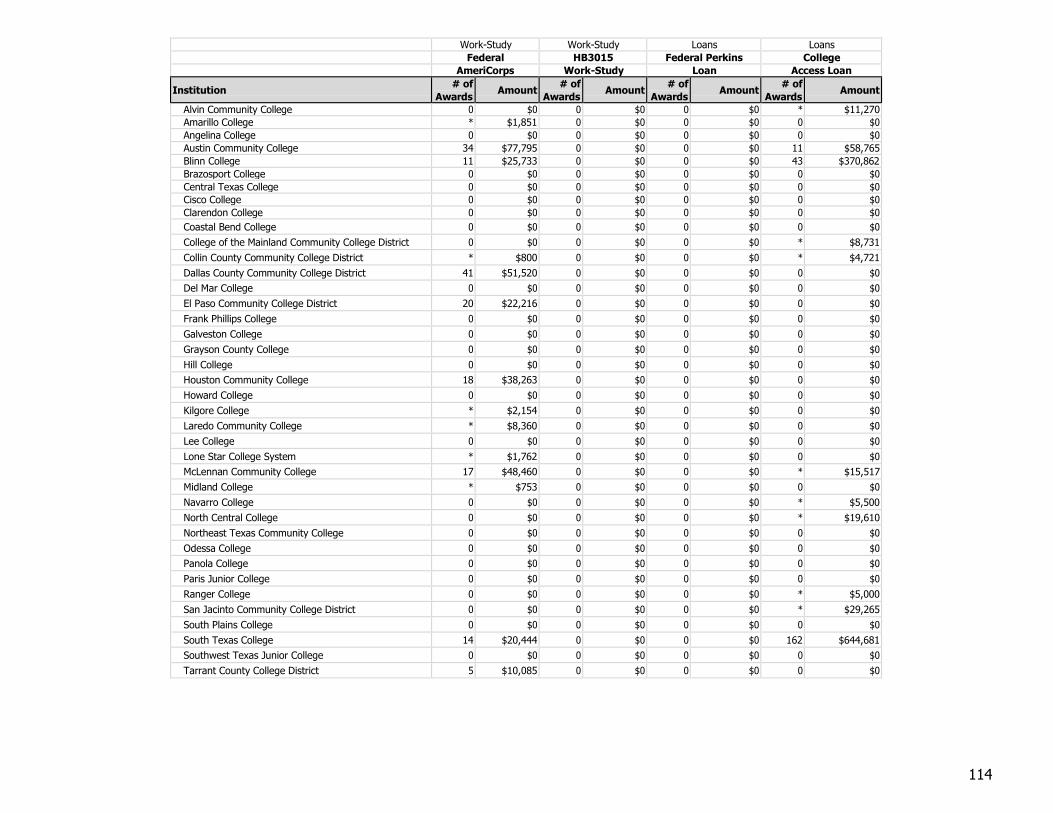
114
Work-Study Work-Study Loans Loans
Federal HB3015 Federal Perkins College
AmeriCorps Work-Study Loan Access Loan
Institution # of
Awards Amount
# of
Awards Amount
# of
Awards Amount
# of
Awards Amount
Alvin Community College 0 $0 0 $0 0 $0 * $11,270
Amarillo College * $1,851 0 $0 0 $0 0 $0
Angelina College 0 $0 0 $0 0 $0 0 $0
Austin Community College 34 $77,795 0 $0 0 $0 11 $58,765
Blinn College 11 $25,733 0 $0 0 $0 43 $370,862
Brazosport College 0 $0 0 $0 0 $0 0 $0
Central Texas College 0 $0 0 $0 0 $0 0 $0
Cisco College 0 $0 0 $0 0 $0 0 $0
Clarendon College 0 $0 0 $0 0 $0 0 $0
Coastal Bend College 0 $0 0 $0 0 $0 0 $0
College of the Mainland Community College District 0 $0 0 $0 0 $0 * $8,731
Collin County Community College District * $800 0 $0 0 $0 * $4,721
Dallas County Community College District 41 $51,520 0 $0 0 $0 0 $0
Del Mar College 0 $0 0 $0 0 $0 0 $0
El Paso Community College District 20 $22,216 0 $0 0 $0 0 $0
Frank Phillips College 0 $0 0 $0 0 $0 0 $0
Galveston College 0 $0 0 $0 0 $0 0 $0
Grayson County College 0 $0 0 $0 0 $0 0 $0
Hill College 0 $0 0 $0 0 $0 0 $0
Houston Community College 18 $38,263 0 $0 0 $0 0 $0
Howard College 0 $0 0 $0 0 $0 0 $0
Kilgore College * $2,154 0 $0 0 $0 0 $0
Laredo Community College * $8,360 0 $0 0 $0 0 $0
Lee College 0 $0 0 $0 0 $0 0 $0
Lone Star College System * $1,762 0 $0 0 $0 0 $0
McLennan Community College 17 $48,460 0 $0 0 $0 * $15,517
Midland College * $753 0 $0 0 $0 0 $0
Navarro College 0 $0 0 $0 0 $0 * $5,500
North Central College 0 $0 0 $0 0 $0 * $19,610
Northeast Texas Community College 0 $0 0 $0 0 $0 0 $0
Odessa College 0 $0 0 $0 0 $0 0 $0
Panola College 0 $0 0 $0 0 $0 0 $0
Paris Junior College 0 $0 0 $0 0 $0 0 $0
Ranger College 0 $0 0 $0 0 $0 * $5,000
San Jacinto Community College District 0 $0 0 $0 0 $0 * $29,265
South Plains College 0 $0 0 $0 0 $0 0 $0
South Texas College 14 $20,444 0 $0 0 $0 162 $644,681
Southwest Texas Junior College 0 $0 0 $0 0 $0 0 $0
Tarrant County College District 5 $10,085 0 $0 0 $0 0 $0
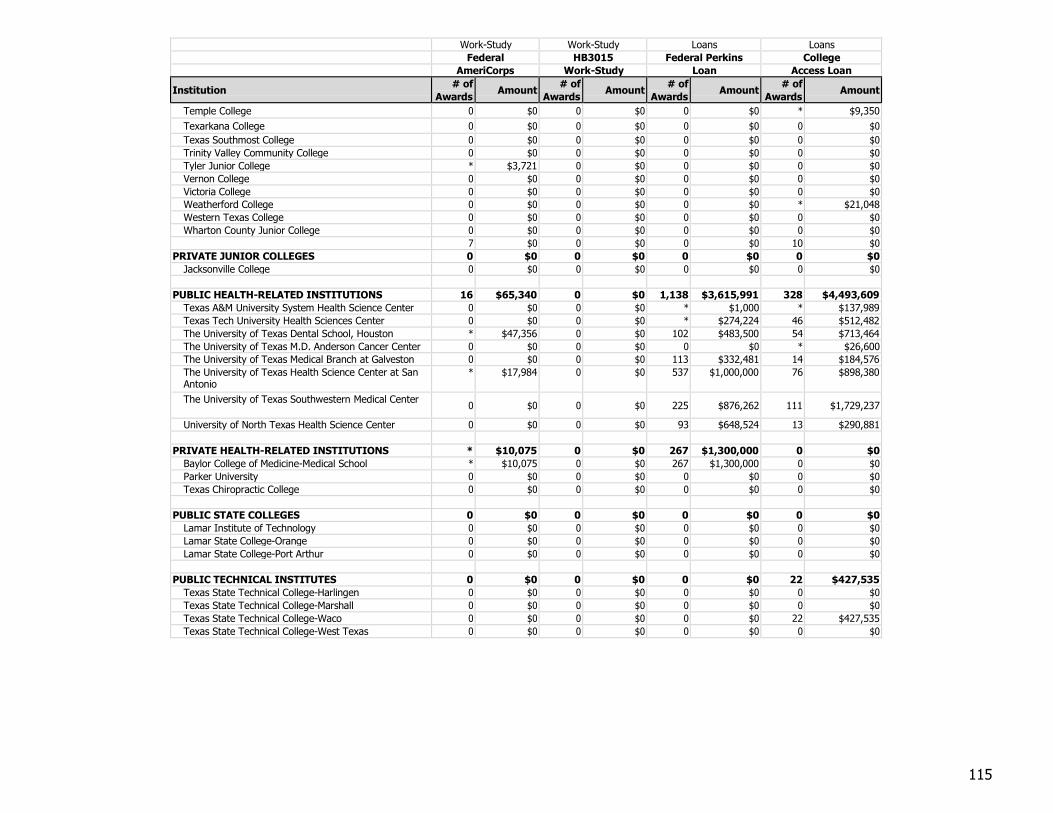
115
Work-Study Work-Study Loans Loans
Federal HB3015 Federal Perkins College
AmeriCorps Work-Study Loan Access Loan
Institution # of
Awards Amount
# of
Awards Amount
# of
Awards Amount
# of
Awards Amount
Temple College 0 $0 0 $0 0 $0 * $9,350
Texarkana College 0 $0 0 $0 0 $0 0 $0
Texas Southmost College 0 $0 0 $0 0 $0 0 $0
Trinity Valley Community College 0 $0 0 $0 0 $0 0 $0
Tyler Junior College * $3,721 0 $0 0 $0 0 $0
Vernon College 0 $0 0 $0 0 $0 0 $0
Victoria College 0 $0 0 $0 0 $0 0 $0
Weatherford College 0 $0 0 $0 0 $0 * $21,048
Western Texas College 0 $0 0 $0 0 $0 0 $0
Wharton County Junior College 0 $0 0 $0 0 $0 0 $0
7 $0 0 $0 0 $0 10 $0
PRIVATE JUNIOR COLLEGES 0 $0 0 $0 0 $0 0 $0
Jacksonville College 0 $0 0 $0 0 $0 0 $0
PUBLIC HEALTH-RELATED INSTITUTIONS 16 $65,340 0 $0 1,138 $3,615,991 328 $4,493,609
Texas A&M University System Health Science Center 0 $0 0 $0 * $1,000 * $137,989
Texas Tech University Health Sciences Center 0 $0 0 $0 * $274,224 46 $512,482
The University of Texas Dental School, Houston * $47,356 0 $0 102 $483,500 54 $713,464
The University of Texas M.D. Anderson Cancer Center 0 $0 0 $0 0 $0 * $26,600
The University of Texas Medical Branch at Galveston 0 $0 0 $0 113 $332,481 14 $184,576
The University of Texas Health Science Center at San Antonio
* $17,984 0 $0 537 $1,000,000 76 $898,380
The University of Texas Southwestern Medical Center 0 $0 0 $0 225 $876,262 111 $1,729,237
University of North Texas Health Science Center 0 $0 0 $0 93 $648,524 13 $290,881
PRIVATE HEALTH-RELATED INSTITUTIONS * $10,075 0 $0 267 $1,300,000 0 $0
Baylor College of Medicine-Medical School * $10,075 0 $0 267 $1,300,000 0 $0
Parker University 0 $0 0 $0 0 $0 0 $0
Texas Chiropractic College 0 $0 0 $0 0 $0 0 $0
PUBLIC STATE COLLEGES 0 $0 0 $0 0 $0 0 $0
Lamar Institute of Technology 0 $0 0 $0 0 $0 0 $0
Lamar State College-Orange 0 $0 0 $0 0 $0 0 $0
Lamar State College-Port Arthur 0 $0 0 $0 0 $0 0 $0
PUBLIC TECHNICAL INSTITUTES 0 $0 0 $0 0 $0 22 $427,535
Texas State Technical College-Harlingen 0 $0 0 $0 0 $0 0 $0
Texas State Technical College-Marshall 0 $0 0 $0 0 $0 0 $0
Texas State Technical College-Waco 0 $0 0 $0 0 $0 22 $427,535
Texas State Technical College-West Texas 0 $0 0 $0 0 $0 0 $0
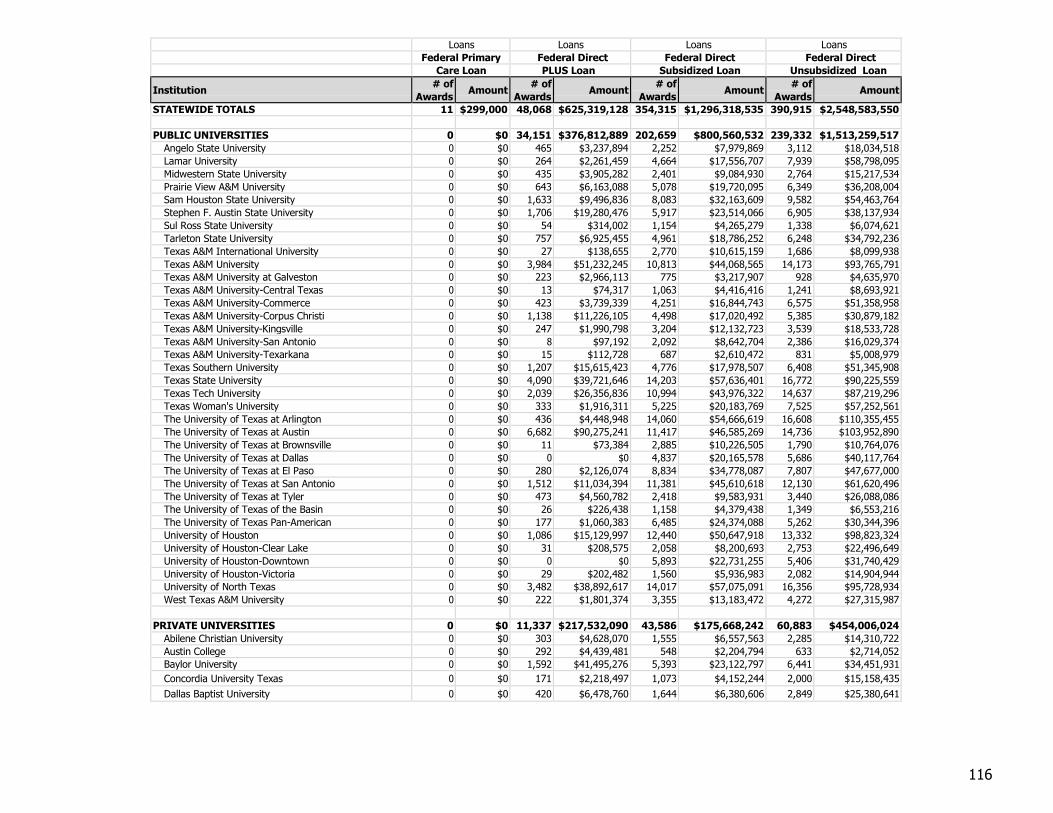
116
Loans Loans Loans Loans
Federal Primary Federal Direct Federal Direct Federal Direct
Care Loan PLUS Loan Subsidized Loan Unsubsidized Loan
Institution # of
Awards Amount
# of
Awards Amount
# of
Awards Amount
# of
Awards Amount
STATEWIDE TOTALS 11 $299,000 48,068 $625,319,128 354,315 $1,296,318,535 390,915 $2,548,583,550
PUBLIC UNIVERSITIES 0 $0 34,151 $376,812,889 202,659 $800,560,532 239,332 $1,513,259,517
Angelo State University 0 $0 465 $3,237,894 2,252 $7,979,869 3,112 $18,034,518
Lamar University 0 $0 264 $2,261,459 4,664 $17,556,707 7,939 $58,798,095
Midwestern State University 0 $0 435 $3,905,282 2,401 $9,084,930 2,764 $15,217,534
Prairie View A&M University 0 $0 643 $6,163,088 5,078 $19,720,095 6,349 $36,208,004
Sam Houston State University 0 $0 1,633 $9,496,836 8,083 $32,163,609 9,582 $54,463,764
Stephen F. Austin State University 0 $0 1,706 $19,280,476 5,917 $23,514,066 6,905 $38,137,934
Sul Ross State University 0 $0 54 $314,002 1,154 $4,265,279 1,338 $6,074,621
Tarleton State University 0 $0 757 $6,925,455 4,961 $18,786,252 6,248 $34,792,236
Texas A&M International University 0 $0 27 $138,655 2,770 $10,615,159 1,686 $8,099,938
Texas A&M University 0 $0 3,984 $51,232,245 10,813 $44,068,565 14,173 $93,765,791
Texas A&M University at Galveston 0 $0 223 $2,966,113 775 $3,217,907 928 $4,635,970
Texas A&M University-Central Texas 0 $0 13 $74,317 1,063 $4,416,416 1,241 $8,693,921
Texas A&M University-Commerce 0 $0 423 $3,739,339 4,251 $16,844,743 6,575 $51,358,958
Texas A&M University-Corpus Christi 0 $0 1,138 $11,226,105 4,498 $17,020,492 5,385 $30,879,182
Texas A&M University-Kingsville 0 $0 247 $1,990,798 3,204 $12,132,723 3,539 $18,533,728
Texas A&M University-San Antonio 0 $0 8 $97,192 2,092 $8,642,704 2,386 $16,029,374
Texas A&M University-Texarkana 0 $0 15 $112,728 687 $2,610,472 831 $5,008,979
Texas Southern University 0 $0 1,207 $15,615,423 4,776 $17,978,507 6,408 $51,345,908
Texas State University 0 $0 4,090 $39,721,646 14,203 $57,636,401 16,772 $90,225,559
Texas Tech University 0 $0 2,039 $26,356,836 10,994 $43,976,322 14,637 $87,219,296
Texas Woman's University 0 $0 333 $1,916,311 5,225 $20,183,769 7,525 $57,252,561
The University of Texas at Arlington 0 $0 436 $4,448,948 14,060 $54,666,619 16,608 $110,355,455
The University of Texas at Austin 0 $0 6,682 $90,275,241 11,417 $46,585,269 14,736 $103,952,890
The University of Texas at Brownsville 0 $0 11 $73,384 2,885 $10,226,505 1,790 $10,764,076
The University of Texas at Dallas 0 $0 0 $0 4,837 $20,165,578 5,686 $40,117,764
The University of Texas at El Paso 0 $0 280 $2,126,074 8,834 $34,778,087 7,807 $47,677,000
The University of Texas at San Antonio 0 $0 1,512 $11,034,394 11,381 $45,610,618 12,130 $61,620,496
The University of Texas at Tyler 0 $0 473 $4,560,782 2,418 $9,583,931 3,440 $26,088,086
The University of Texas of the Basin 0 $0 26 $226,438 1,158 $4,379,438 1,349 $6,553,216
The University of Texas Pan-American 0 $0 177 $1,060,383 6,485 $24,374,088 5,262 $30,344,396
University of Houston 0 $0 1,086 $15,129,997 12,440 $50,647,918 13,332 $98,823,324
University of Houston-Clear Lake 0 $0 31 $208,575 2,058 $8,200,693 2,753 $22,496,649
University of Houston-Downtown 0 $0 0 $0 5,893 $22,731,255 5,406 $31,740,429
University of Houston-Victoria 0 $0 29 $202,482 1,560 $5,936,983 2,082 $14,904,944
University of North Texas 0 $0 3,482 $38,892,617 14,017 $57,075,091 16,356 $95,728,934
West Texas A&M University 0 $0 222 $1,801,374 3,355 $13,183,472 4,272 $27,315,987
PRIVATE UNIVERSITIES 0 $0 11,337 $217,532,090 43,586 $175,668,242 60,883 $454,006,024
Abilene Christian University 0 $0 303 $4,628,070 1,555 $6,557,563 2,285 $14,310,722
Austin College 0 $0 292 $4,439,481 548 $2,204,794 633 $2,714,052
Baylor University 0 $0 1,592 $41,495,276 5,393 $23,122,797 6,441 $34,451,931
Concordia University Texas 0 $0 171 $2,218,497 1,073 $4,152,244 2,000 $15,158,435
Dallas Baptist University 0 $0 420 $6,478,760 1,644 $6,380,606 2,849 $25,380,641
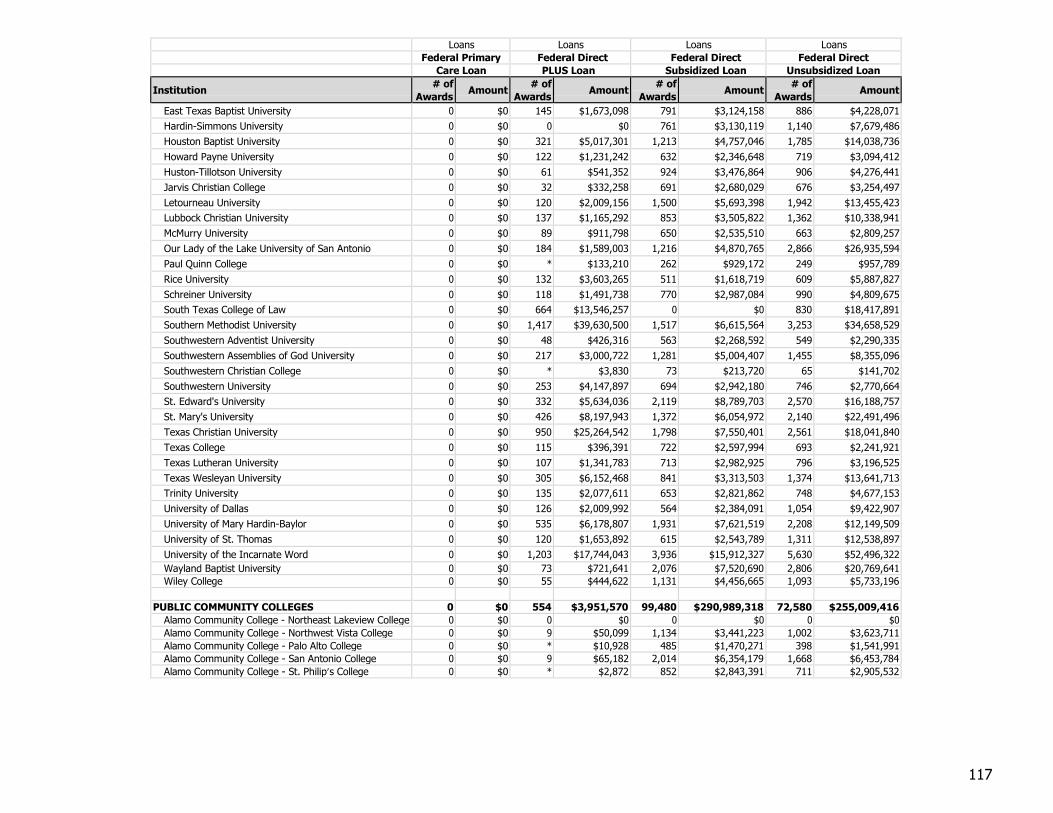
117
Loans Loans Loans Loans
Federal Primary Federal Direct Federal Direct Federal Direct
Care Loan PLUS Loan Subsidized Loan Unsubsidized Loan
Institution # of
Awards Amount
# of
Awards Amount
# of
Awards Amount
# of
Awards Amount
East Texas Baptist University 0 $0 145 $1,673,098 791 $3,124,158 886 $4,228,071
Hardin-Simmons University 0 $0 0 $0 761 $3,130,119 1,140 $7,679,486
Houston Baptist University 0 $0 321 $5,017,301 1,213 $4,757,046 1,785 $14,038,736
Howard Payne University 0 $0 122 $1,231,242 632 $2,346,648 719 $3,094,412
Huston-Tillotson University 0 $0 61 $541,352 924 $3,476,864 906 $4,276,441
Jarvis Christian College 0 $0 32 $332,258 691 $2,680,029 676 $3,254,497
Letourneau University 0 $0 120 $2,009,156 1,500 $5,693,398 1,942 $13,455,423
Lubbock Christian University 0 $0 137 $1,165,292 853 $3,505,822 1,362 $10,338,941
McMurry University 0 $0 89 $911,798 650 $2,535,510 663 $2,809,257
Our Lady of the Lake University of San Antonio 0 $0 184 $1,589,003 1,216 $4,870,765 2,866 $26,935,594
Paul Quinn College 0 $0 * $133,210 262 $929,172 249 $957,789
Rice University 0 $0 132 $3,603,265 511 $1,618,719 609 $5,887,827
Schreiner University 0 $0 118 $1,491,738 770 $2,987,084 990 $4,809,675
South Texas College of Law 0 $0 664 $13,546,257 0 $0 830 $18,417,891
Southern Methodist University 0 $0 1,417 $39,630,500 1,517 $6,615,564 3,253 $34,658,529
Southwestern Adventist University 0 $0 48 $426,316 563 $2,268,592 549 $2,290,335
Southwestern Assemblies of God University 0 $0 217 $3,000,722 1,281 $5,004,407 1,455 $8,355,096
Southwestern Christian College 0 $0 * $3,830 73 $213,720 65 $141,702
Southwestern University 0 $0 253 $4,147,897 694 $2,942,180 746 $2,770,664
St. Edward's University 0 $0 332 $5,634,036 2,119 $8,789,703 2,570 $16,188,757
St. Mary's University 0 $0 426 $8,197,943 1,372 $6,054,972 2,140 $22,491,496
Texas Christian University 0 $0 950 $25,264,542 1,798 $7,550,401 2,561 $18,041,840
Texas College 0 $0 115 $396,391 722 $2,597,994 693 $2,241,921
Texas Lutheran University 0 $0 107 $1,341,783 713 $2,982,925 796 $3,196,525
Texas Wesleyan University 0 $0 305 $6,152,468 841 $3,313,503 1,374 $13,641,713
Trinity University 0 $0 135 $2,077,611 653 $2,821,862 748 $4,677,153
University of Dallas 0 $0 126 $2,009,992 564 $2,384,091 1,054 $9,422,907
University of Mary Hardin-Baylor 0 $0 535 $6,178,807 1,931 $7,621,519 2,208 $12,149,509
University of St. Thomas 0 $0 120 $1,653,892 615 $2,543,789 1,311 $12,538,897
University of the Incarnate Word 0 $0 1,203 $17,744,043 3,936 $15,912,327 5,630 $52,496,322
Wayland Baptist University 0 $0 73 $721,641 2,076 $7,520,690 2,806 $20,769,641
Wiley College 0 $0 55 $444,622 1,131 $4,456,665 1,093 $5,733,196
PUBLIC COMMUNITY COLLEGES 0 $0 554 $3,951,570 99,480 $290,989,318 72,580 $255,009,416
Alamo Community College - Northeast Lakeview College 0 $0 0 $0 0 $0 0 $0
Alamo Community College - Northwest Vista College 0 $0 9 $50,099 1,134 $3,441,223 1,002 $3,623,711
Alamo Community College - Palo Alto College 0 $0 * $10,928 485 $1,470,271 398 $1,541,991
Alamo Community College - San Antonio College 0 $0 9 $65,182 2,014 $6,354,179 1,668 $6,453,784
Alamo Community College - St. Philip’s College 0 $0 * $2,872 852 $2,843,391 711 $2,905,532
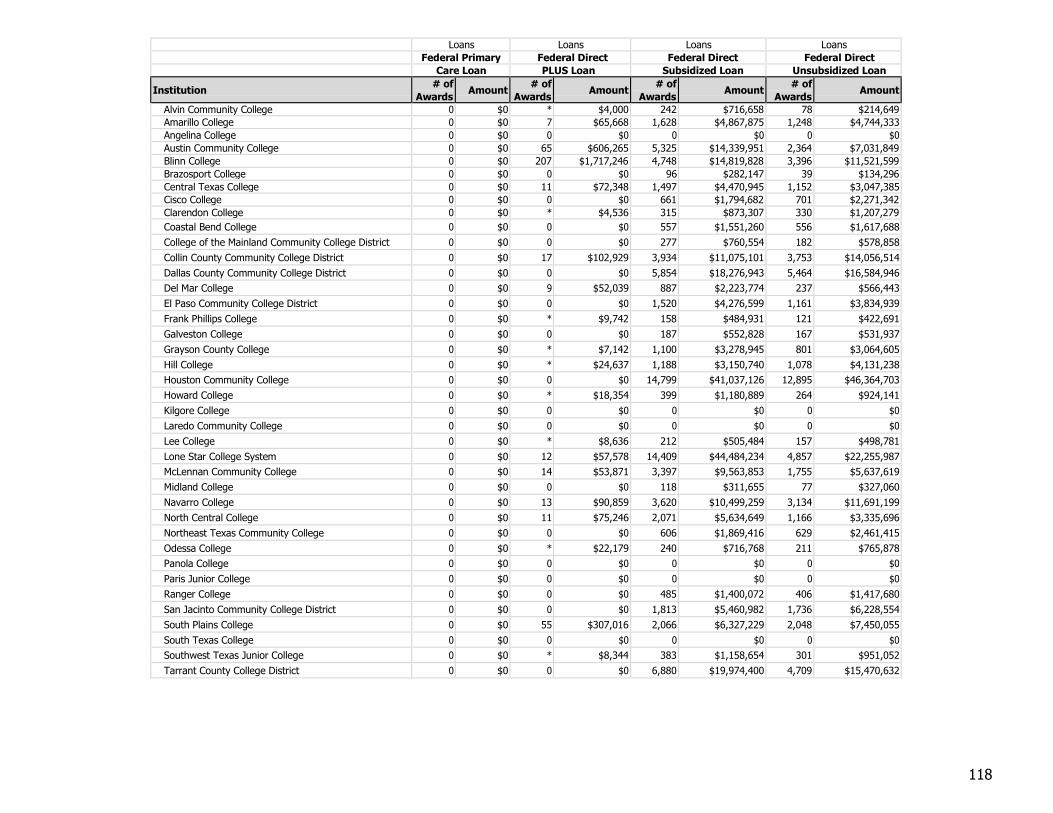
118
Loans Loans Loans Loans
Federal Primary Federal Direct Federal Direct Federal Direct
Care Loan PLUS Loan Subsidized Loan Unsubsidized Loan
Institution # of
Awards Amount
# of
Awards Amount
# of
Awards Amount
# of
Awards Amount
Alvin Community College 0 $0 * $4,000 242 $716,658 78 $214,649
Amarillo College 0 $0 7 $65,668 1,628 $4,867,875 1,248 $4,744,333
Angelina College 0 $0 0 $0 0 $0 0 $0
Austin Community College 0 $0 65 $606,265 5,325 $14,339,951 2,364 $7,031,849
Blinn College 0 $0 207 $1,717,246 4,748 $14,819,828 3,396 $11,521,599
Brazosport College 0 $0 0 $0 96 $282,147 39 $134,296
Central Texas College 0 $0 11 $72,348 1,497 $4,470,945 1,152 $3,047,385
Cisco College 0 $0 0 $0 661 $1,794,682 701 $2,271,342
Clarendon College 0 $0 * $4,536 315 $873,307 330 $1,207,279
Coastal Bend College 0 $0 0 $0 557 $1,551,260 556 $1,617,688
College of the Mainland Community College District 0 $0 0 $0 277 $760,554 182 $578,858
Collin County Community College District 0 $0 17 $102,929 3,934 $11,075,101 3,753 $14,056,514
Dallas County Community College District 0 $0 0 $0 5,854 $18,276,943 5,464 $16,584,946
Del Mar College 0 $0 9 $52,039 887 $2,223,774 237 $566,443
El Paso Community College District 0 $0 0 $0 1,520 $4,276,599 1,161 $3,834,939
Frank Phillips College 0 $0 * $9,742 158 $484,931 121 $422,691
Galveston College 0 $0 0 $0 187 $552,828 167 $531,937
Grayson County College 0 $0 * $7,142 1,100 $3,278,945 801 $3,064,605
Hill College 0 $0 * $24,637 1,188 $3,150,740 1,078 $4,131,238
Houston Community College 0 $0 0 $0 14,799 $41,037,126 12,895 $46,364,703
Howard College 0 $0 * $18,354 399 $1,180,889 264 $924,141
Kilgore College 0 $0 0 $0 0 $0 0 $0
Laredo Community College 0 $0 0 $0 0 $0 0 $0
Lee College 0 $0 * $8,636 212 $505,484 157 $498,781
Lone Star College System 0 $0 12 $57,578 14,409 $44,484,234 4,857 $22,255,987
McLennan Community College 0 $0 14 $53,871 3,397 $9,563,853 1,755 $5,637,619
Midland College 0 $0 0 $0 118 $311,655 77 $327,060
Navarro College 0 $0 13 $90,859 3,620 $10,499,259 3,134 $11,691,199
North Central College 0 $0 11 $75,246 2,071 $5,634,649 1,166 $3,335,696
Northeast Texas Community College 0 $0 0 $0 606 $1,869,416 629 $2,461,415
Odessa College 0 $0 * $22,179 240 $716,768 211 $765,878
Panola College 0 $0 0 $0 0 $0 0 $0
Paris Junior College 0 $0 0 $0 0 $0 0 $0
Ranger College 0 $0 0 $0 485 $1,400,072 406 $1,417,680
San Jacinto Community College District 0 $0 0 $0 1,813 $5,460,982 1,736 $6,228,554
South Plains College 0 $0 55 $307,016 2,066 $6,327,229 2,048 $7,450,055
South Texas College 0 $0 0 $0 0 $0 0 $0
Southwest Texas Junior College 0 $0 * $8,344 383 $1,158,654 301 $951,052
Tarrant County College District 0 $0 0 $0 6,880 $19,974,400 4,709 $15,470,632
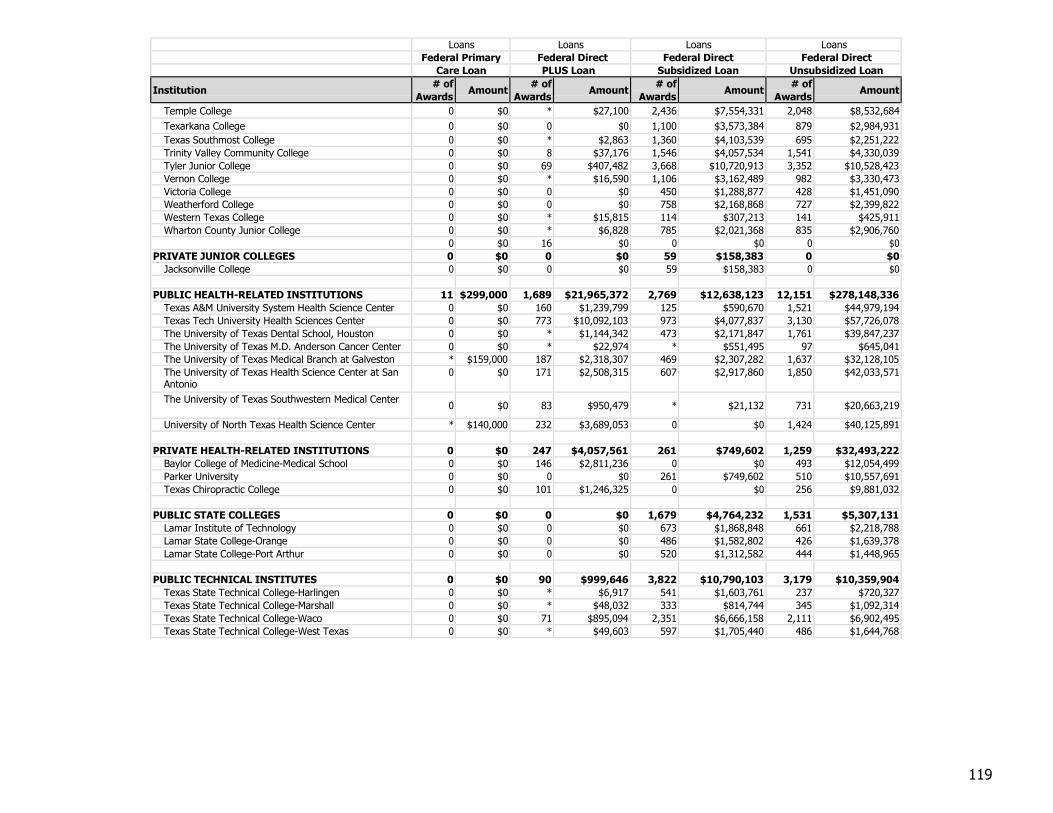
119
Loans Loans Loans Loans
Federal Primary Federal Direct Federal Direct Federal Direct
Care Loan PLUS Loan Subsidized Loan Unsubsidized Loan
Institution # of
Awards Amount
# of
Awards Amount
# of
Awards Amount
# of
Awards Amount
Temple College 0 $0 * $27,100 2,436 $7,554,331 2,048 $8,532,684
Texarkana College 0 $0 0 $0 1,100 $3,573,384 879 $2,984,931
Texas Southmost College 0 $0 * $2,863 1,360 $4,103,539 695 $2,251,222
Trinity Valley Community College 0 $0 8 $37,176 1,546 $4,057,534 1,541 $4,330,039
Tyler Junior College 0 $0 69 $407,482 3,668 $10,720,913 3,352 $10,528,423
Vernon College 0 $0 * $16,590 1,106 $3,162,489 982 $3,330,473
Victoria College 0 $0 0 $0 450 $1,288,877 428 $1,451,090
Weatherford College 0 $0 0 $0 758 $2,168,868 727 $2,399,822
Western Texas College 0 $0 * $15,815 114 $307,213 141 $425,911
Wharton County Junior College 0 $0 * $6,828 785 $2,021,368 835 $2,906,760
0 $0 16 $0 0 $0 0 $0
PRIVATE JUNIOR COLLEGES 0 $0 0 $0 59 $158,383 0 $0
Jacksonville College 0 $0 0 $0 59 $158,383 0 $0
PUBLIC HEALTH-RELATED INSTITUTIONS 11 $299,000 1,689 $21,965,372 2,769 $12,638,123 12,151 $278,148,336
Texas A&M University System Health Science Center 0 $0 160 $1,239,799 125 $590,670 1,521 $44,979,194
Texas Tech University Health Sciences Center 0 $0 773 $10,092,103 973 $4,077,837 3,130 $57,726,078
The University of Texas Dental School, Houston 0 $0 * $1,144,342 473 $2,171,847 1,761 $39,847,237
The University of Texas M.D. Anderson Cancer Center 0 $0 * $22,974 * $551,495 97 $645,041
The University of Texas Medical Branch at Galveston * $159,000 187 $2,318,307 469 $2,307,282 1,637 $32,128,105
The University of Texas Health Science Center at San Antonio
0 $0 171 $2,508,315 607 $2,917,860 1,850 $42,033,571
The University of Texas Southwestern Medical Center 0 $0 83 $950,479 * $21,132 731 $20,663,219
University of North Texas Health Science Center * $140,000 232 $3,689,053 0 $0 1,424 $40,125,891
PRIVATE HEALTH-RELATED INSTITUTIONS 0 $0 247 $4,057,561 261 $749,602 1,259 $32,493,222
Baylor College of Medicine-Medical School 0 $0 146 $2,811,236 0 $0 493 $12,054,499
Parker University 0 $0 0 $0 261 $749,602 510 $10,557,691
Texas Chiropractic College 0 $0 101 $1,246,325 0 $0 256 $9,881,032
PUBLIC STATE COLLEGES 0 $0 0 $0 1,679 $4,764,232 1,531 $5,307,131
Lamar Institute of Technology 0 $0 0 $0 673 $1,868,848 661 $2,218,788
Lamar State College-Orange 0 $0 0 $0 486 $1,582,802 426 $1,639,378
Lamar State College-Port Arthur 0 $0 0 $0 520 $1,312,582 444 $1,448,965
PUBLIC TECHNICAL INSTITUTES 0 $0 90 $999,646 3,822 $10,790,103 3,179 $10,359,904
Texas State Technical College-Harlingen 0 $0 * $6,917 541 $1,603,761 237 $720,327
Texas State Technical College-Marshall 0 $0 * $48,032 333 $814,744 345 $1,092,314
Texas State Technical College-Waco 0 $0 71 $895,094 2,351 $6,666,158 2,111 $6,902,495
Texas State Technical College-West Texas 0 $0 * $49,603 597 $1,705,440 486 $1,644,768
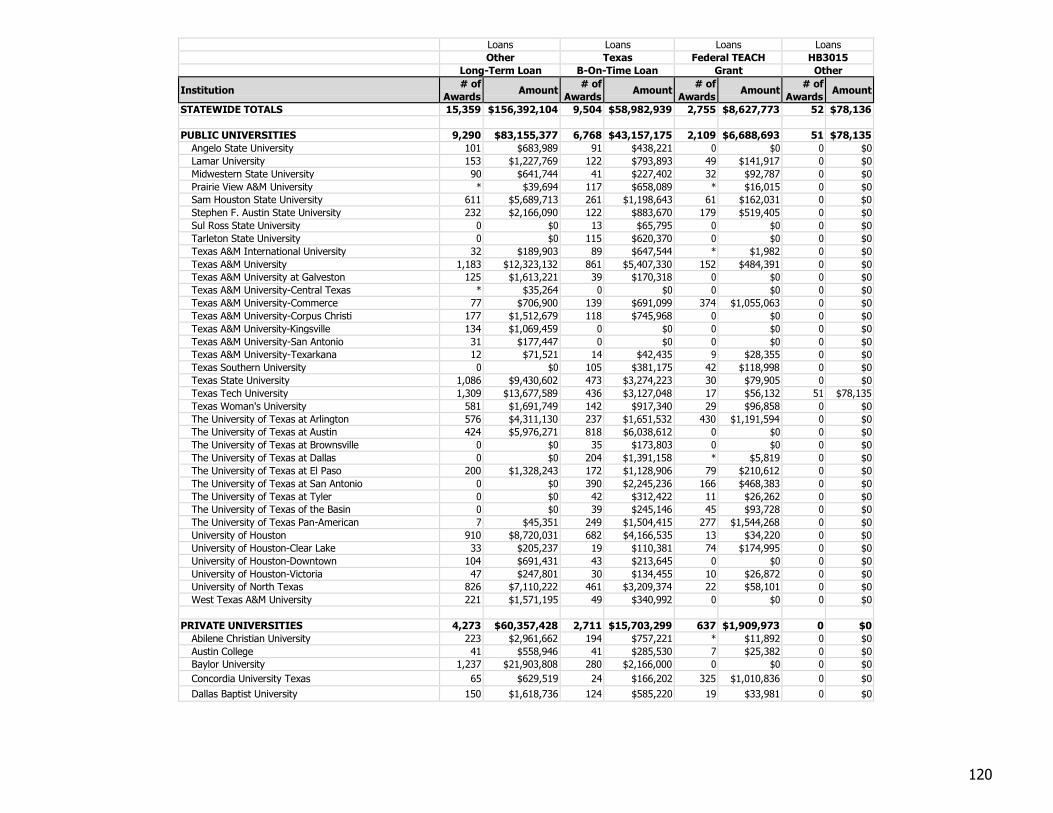
120
Loans Loans Loans Loans
Other Texas Federal TEACH HB3015
Long-Term Loan B-On-Time Loan Grant Other
Institution # of
Awards Amount
# of
Awards Amount
# of
Awards Amount
# of
Awards Amount
STATEWIDE TOTALS 15,359 $156,392,104 9,504 $58,982,939 2,755 $8,627,773 52 $78,136
PUBLIC UNIVERSITIES 9,290 $83,155,377 6,768 $43,157,175 2,109 $6,688,693 51 $78,135
Angelo State University 101 $683,989 91 $438,221 0 $0 0 $0
Lamar University 153 $1,227,769 122 $793,893 49 $141,917 0 $0
Midwestern State University 90 $641,744 41 $227,402 32 $92,787 0 $0
Prairie View A&M University * $39,694 117 $658,089 * $16,015 0 $0
Sam Houston State University 611 $5,689,713 261 $1,198,643 61 $162,031 0 $0
Stephen F. Austin State University 232 $2,166,090 122 $883,670 179 $519,405 0 $0
Sul Ross State University 0 $0 13 $65,795 0 $0 0 $0
Tarleton State University 0 $0 115 $620,370 0 $0 0 $0
Texas A&M International University 32 $189,903 89 $647,544 * $1,982 0 $0
Texas A&M University 1,183 $12,323,132 861 $5,407,330 152 $484,391 0 $0
Texas A&M University at Galveston 125 $1,613,221 39 $170,318 0 $0 0 $0
Texas A&M University-Central Texas * $35,264 0 $0 0 $0 0 $0
Texas A&M University-Commerce 77 $706,900 139 $691,099 374 $1,055,063 0 $0
Texas A&M University-Corpus Christi 177 $1,512,679 118 $745,968 0 $0 0 $0
Texas A&M University-Kingsville 134 $1,069,459 0 $0 0 $0 0 $0
Texas A&M University-San Antonio 31 $177,447 0 $0 0 $0 0 $0
Texas A&M University-Texarkana 12 $71,521 14 $42,435 9 $28,355 0 $0
Texas Southern University 0 $0 105 $381,175 42 $118,998 0 $0
Texas State University 1,086 $9,430,602 473 $3,274,223 30 $79,905 0 $0
Texas Tech University 1,309 $13,677,589 436 $3,127,048 17 $56,132 51 $78,135
Texas Woman's University 581 $1,691,749 142 $917,340 29 $96,858 0 $0
The University of Texas at Arlington 576 $4,311,130 237 $1,651,532 430 $1,191,594 0 $0
The University of Texas at Austin 424 $5,976,271 818 $6,038,612 0 $0 0 $0
The University of Texas at Brownsville 0 $0 35 $173,803 0 $0 0 $0
The University of Texas at Dallas 0 $0 204 $1,391,158 * $5,819 0 $0
The University of Texas at El Paso 200 $1,328,243 172 $1,128,906 79 $210,612 0 $0
The University of Texas at San Antonio 0 $0 390 $2,245,236 166 $468,383 0 $0
The University of Texas at Tyler 0 $0 42 $312,422 11 $26,262 0 $0
The University of Texas of the Basin 0 $0 39 $245,146 45 $93,728 0 $0
The University of Texas Pan-American 7 $45,351 249 $1,504,415 277 $1,544,268 0 $0
University of Houston 910 $8,720,031 682 $4,166,535 13 $34,220 0 $0
University of Houston-Clear Lake 33 $205,237 19 $110,381 74 $174,995 0 $0
University of Houston-Downtown 104 $691,431 43 $213,645 0 $0 0 $0
University of Houston-Victoria 47 $247,801 30 $134,455 10 $26,872 0 $0
University of North Texas 826 $7,110,222 461 $3,209,374 22 $58,101 0 $0
West Texas A&M University 221 $1,571,195 49 $340,992 0 $0 0 $0
PRIVATE UNIVERSITIES 4,273 $60,357,428 2,711 $15,703,299 637 $1,909,973 0 $0
Abilene Christian University 223 $2,961,662 194 $757,221 * $11,892 0 $0
Austin College 41 $558,946 41 $285,530 7 $25,382 0 $0
Baylor University 1,237 $21,903,808 280 $2,166,000 0 $0 0 $0
Concordia University Texas 65 $629,519 24 $166,202 325 $1,010,836 0 $0
Dallas Baptist University 150 $1,618,736 124 $585,220 19 $33,981 0 $0
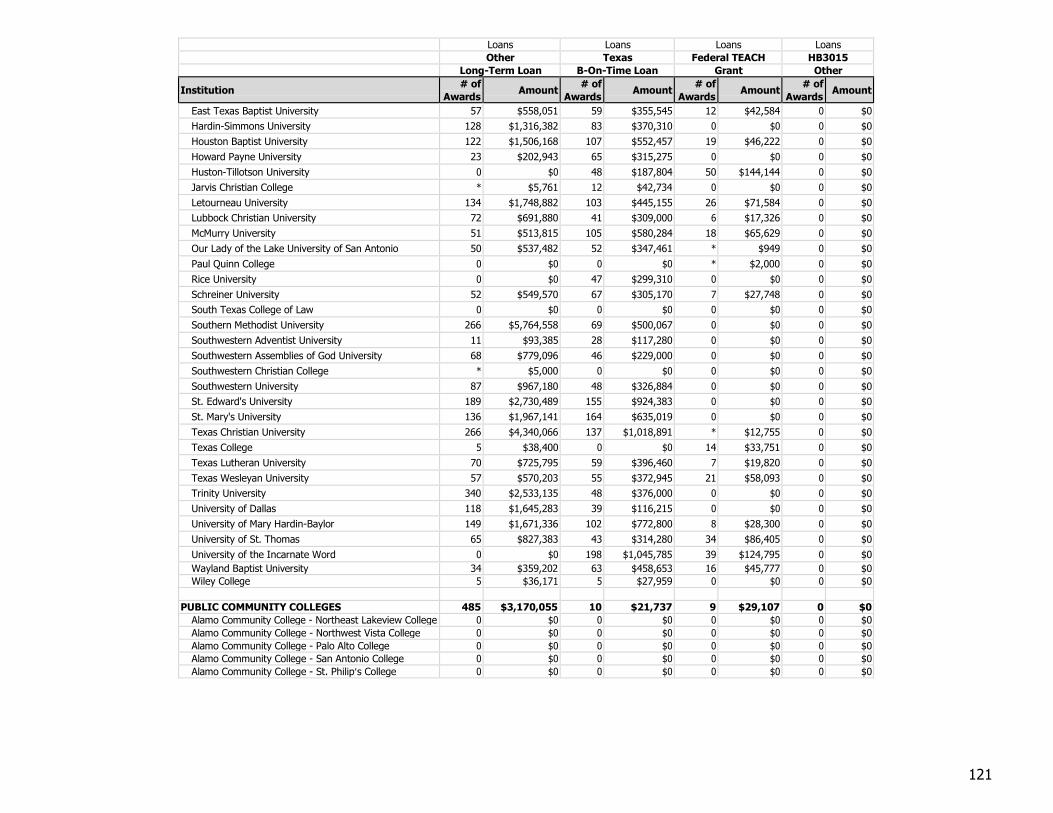
121
Loans Loans Loans Loans
Other Texas Federal TEACH HB3015
Long-Term Loan B-On-Time Loan Grant Other
Institution # of
Awards Amount
# of
Awards Amount
# of
Awards Amount
# of
Awards Amount
East Texas Baptist University 57 $558,051 59 $355,545 12 $42,584 0 $0
Hardin-Simmons University 128 $1,316,382 83 $370,310 0 $0 0 $0
Houston Baptist University 122 $1,506,168 107 $552,457 19 $46,222 0 $0
Howard Payne University 23 $202,943 65 $315,275 0 $0 0 $0
Huston-Tillotson University 0 $0 48 $187,804 50 $144,144 0 $0
Jarvis Christian College * $5,761 12 $42,734 0 $0 0 $0
Letourneau University 134 $1,748,882 103 $445,155 26 $71,584 0 $0
Lubbock Christian University 72 $691,880 41 $309,000 6 $17,326 0 $0
McMurry University 51 $513,815 105 $580,284 18 $65,629 0 $0
Our Lady of the Lake University of San Antonio 50 $537,482 52 $347,461 * $949 0 $0
Paul Quinn College 0 $0 0 $0 * $2,000 0 $0
Rice University 0 $0 47 $299,310 0 $0 0 $0
Schreiner University 52 $549,570 67 $305,170 7 $27,748 0 $0
South Texas College of Law 0 $0 0 $0 0 $0 0 $0
Southern Methodist University 266 $5,764,558 69 $500,067 0 $0 0 $0
Southwestern Adventist University 11 $93,385 28 $117,280 0 $0 0 $0
Southwestern Assemblies of God University 68 $779,096 46 $229,000 0 $0 0 $0
Southwestern Christian College * $5,000 0 $0 0 $0 0 $0
Southwestern University 87 $967,180 48 $326,884 0 $0 0 $0
St. Edward's University 189 $2,730,489 155 $924,383 0 $0 0 $0
St. Mary's University 136 $1,967,141 164 $635,019 0 $0 0 $0
Texas Christian University 266 $4,340,066 137 $1,018,891 * $12,755 0 $0
Texas College 5 $38,400 0 $0 14 $33,751 0 $0
Texas Lutheran University 70 $725,795 59 $396,460 7 $19,820 0 $0
Texas Wesleyan University 57 $570,203 55 $372,945 21 $58,093 0 $0
Trinity University 340 $2,533,135 48 $376,000 0 $0 0 $0
University of Dallas 118 $1,645,283 39 $116,215 0 $0 0 $0
University of Mary Hardin-Baylor 149 $1,671,336 102 $772,800 8 $28,300 0 $0
University of St. Thomas 65 $827,383 43 $314,280 34 $86,405 0 $0
University of the Incarnate Word 0 $0 198 $1,045,785 39 $124,795 0 $0
Wayland Baptist University 34 $359,202 63 $458,653 16 $45,777 0 $0
Wiley College 5 $36,171 5 $27,959 0 $0 0 $0
PUBLIC COMMUNITY COLLEGES 485 $3,170,055 10 $21,737 9 $29,107 0 $0
Alamo Community College - Northeast Lakeview College 0 $0 0 $0 0 $0 0 $0
Alamo Community College - Northwest Vista College 0 $0 0 $0 0 $0 0 $0
Alamo Community College - Palo Alto College 0 $0 0 $0 0 $0 0 $0
Alamo Community College - San Antonio College 0 $0 0 $0 0 $0 0 $0
Alamo Community College - St. Philip’s College 0 $0 0 $0 0 $0 0 $0
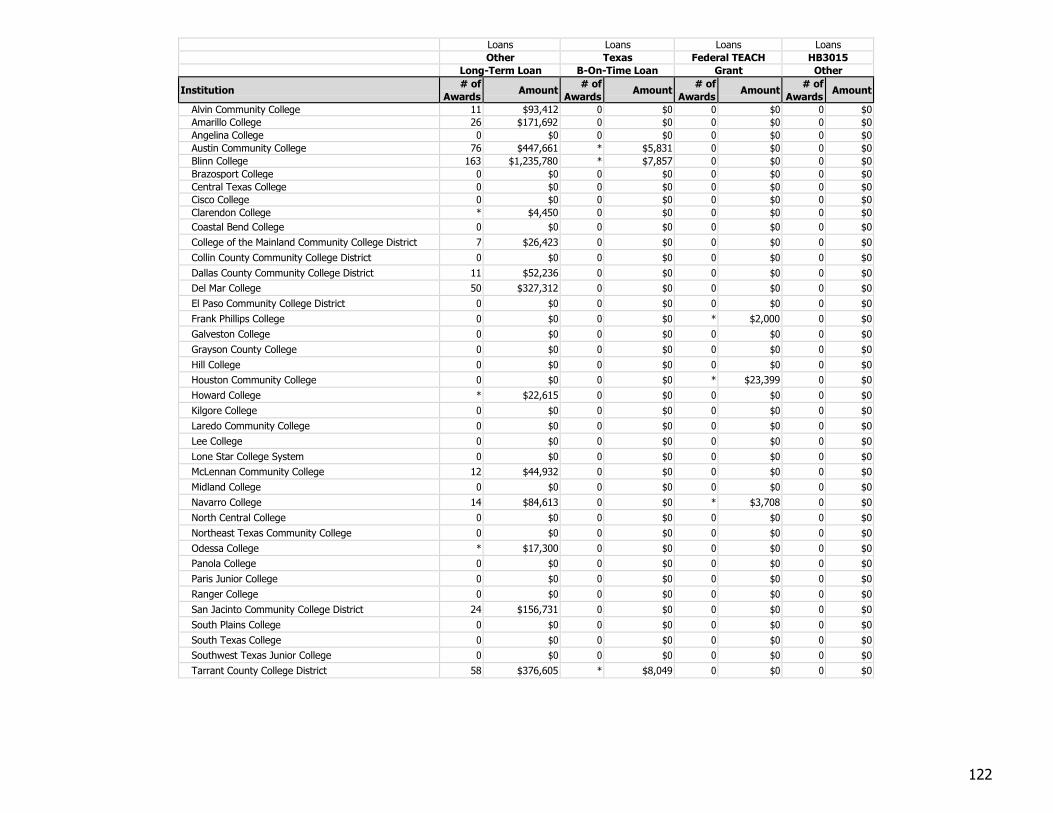
122
Loans Loans Loans Loans
Other Texas Federal TEACH HB3015
Long-Term Loan B-On-Time Loan Grant Other
Institution # of
Awards Amount
# of
Awards Amount
# of
Awards Amount
# of
Awards Amount
Alvin Community College 11 $93,412 0 $0 0 $0 0 $0
Amarillo College 26 $171,692 0 $0 0 $0 0 $0
Angelina College 0 $0 0 $0 0 $0 0 $0
Austin Community College 76 $447,661 * $5,831 0 $0 0 $0
Blinn College 163 $1,235,780 * $7,857 0 $0 0 $0
Brazosport College 0 $0 0 $0 0 $0 0 $0
Central Texas College 0 $0 0 $0 0 $0 0 $0
Cisco College 0 $0 0 $0 0 $0 0 $0
Clarendon College * $4,450 0 $0 0 $0 0 $0
Coastal Bend College 0 $0 0 $0 0 $0 0 $0
College of the Mainland Community College District 7 $26,423 0 $0 0 $0 0 $0
Collin County Community College District 0 $0 0 $0 0 $0 0 $0
Dallas County Community College District 11 $52,236 0 $0 0 $0 0 $0
Del Mar College 50 $327,312 0 $0 0 $0 0 $0
El Paso Community College District 0 $0 0 $0 0 $0 0 $0
Frank Phillips College 0 $0 0 $0 * $2,000 0 $0
Galveston College 0 $0 0 $0 0 $0 0 $0
Grayson County College 0 $0 0 $0 0 $0 0 $0
Hill College 0 $0 0 $0 0 $0 0 $0
Houston Community College 0 $0 0 $0 * $23,399 0 $0
Howard College * $22,615 0 $0 0 $0 0 $0
Kilgore College 0 $0 0 $0 0 $0 0 $0
Laredo Community College 0 $0 0 $0 0 $0 0 $0
Lee College 0 $0 0 $0 0 $0 0 $0
Lone Star College System 0 $0 0 $0 0 $0 0 $0
McLennan Community College 12 $44,932 0 $0 0 $0 0 $0
Midland College 0 $0 0 $0 0 $0 0 $0
Navarro College 14 $84,613 0 $0 * $3,708 0 $0
North Central College 0 $0 0 $0 0 $0 0 $0
Northeast Texas Community College 0 $0 0 $0 0 $0 0 $0
Odessa College * $17,300 0 $0 0 $0 0 $0
Panola College 0 $0 0 $0 0 $0 0 $0
Paris Junior College 0 $0 0 $0 0 $0 0 $0
Ranger College 0 $0 0 $0 0 $0 0 $0
San Jacinto Community College District 24 $156,731 0 $0 0 $0 0 $0
South Plains College 0 $0 0 $0 0 $0 0 $0
South Texas College 0 $0 0 $0 0 $0 0 $0
Southwest Texas Junior College 0 $0 0 $0 0 $0 0 $0
Tarrant County College District 58 $376,605 * $8,049 0 $0 0 $0
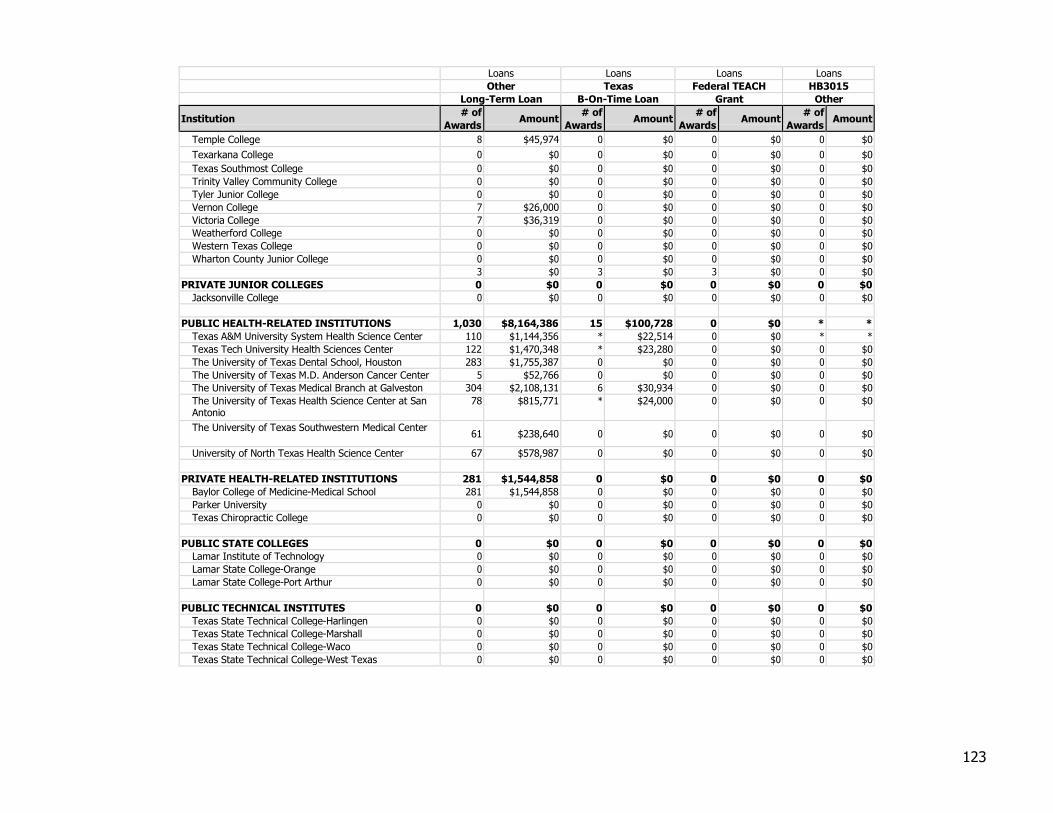
123
Loans Loans Loans Loans
Other Texas Federal TEACH HB3015
Long-Term Loan B-On-Time Loan Grant Other
Institution # of
Awards Amount
# of
Awards Amount
# of
Awards Amount
# of
Awards Amount
Temple College 8 $45,974 0 $0 0 $0 0 $0
Texarkana College 0 $0 0 $0 0 $0 0 $0
Texas Southmost College 0 $0 0 $0 0 $0 0 $0
Trinity Valley Community College 0 $0 0 $0 0 $0 0 $0
Tyler Junior College 0 $0 0 $0 0 $0 0 $0
Vernon College 7 $26,000 0 $0 0 $0 0 $0
Victoria College 7 $36,319 0 $0 0 $0 0 $0
Weatherford College 0 $0 0 $0 0 $0 0 $0
Western Texas College 0 $0 0 $0 0 $0 0 $0
Wharton County Junior College 0 $0 0 $0 0 $0 0 $0
3 $0 3 $0 3 $0 0 $0
PRIVATE JUNIOR COLLEGES 0 $0 0 $0 0 $0 0 $0
Jacksonville College 0 $0 0 $0 0 $0 0 $0
PUBLIC HEALTH-RELATED INSTITUTIONS 1,030 $8,164,386 15 $100,728 0 $0 * *
Texas A&M University System Health Science Center 110 $1,144,356 * $22,514 0 $0 * *
Texas Tech University Health Sciences Center 122 $1,470,348 * $23,280 0 $0 0 $0
The University of Texas Dental School, Houston 283 $1,755,387 0 $0 0 $0 0 $0
The University of Texas M.D. Anderson Cancer Center 5 $52,766 0 $0 0 $0 0 $0
The University of Texas Medical Branch at Galveston 304 $2,108,131 6 $30,934 0 $0 0 $0
The University of Texas Health Science Center at San Antonio
78 $815,771 * $24,000 0 $0 0 $0
The University of Texas Southwestern Medical Center 61 $238,640 0 $0 0 $0 0 $0
University of North Texas Health Science Center 67 $578,987 0 $0 0 $0 0 $0
PRIVATE HEALTH-RELATED INSTITUTIONS 281 $1,544,858 0 $0 0 $0 0 $0
Baylor College of Medicine-Medical School 281 $1,544,858 0 $0 0 $0 0 $0
Parker University 0 $0 0 $0 0 $0 0 $0
Texas Chiropractic College 0 $0 0 $0 0 $0 0 $0
PUBLIC STATE COLLEGES 0 $0 0 $0 0 $0 0 $0
Lamar Institute of Technology 0 $0 0 $0 0 $0 0 $0
Lamar State College-Orange 0 $0 0 $0 0 $0 0 $0
Lamar State College-Port Arthur 0 $0 0 $0 0 $0 0 $0
PUBLIC TECHNICAL INSTITUTES 0 $0 0 $0 0 $0 0 $0
Texas State Technical College-Harlingen 0 $0 0 $0 0 $0 0 $0
Texas State Technical College-Marshall 0 $0 0 $0 0 $0 0 $0
Texas State Technical College-Waco 0 $0 0 $0 0 $0 0 $0
Texas State Technical College-West Texas 0 $0 0 $0 0 $0 0 $0
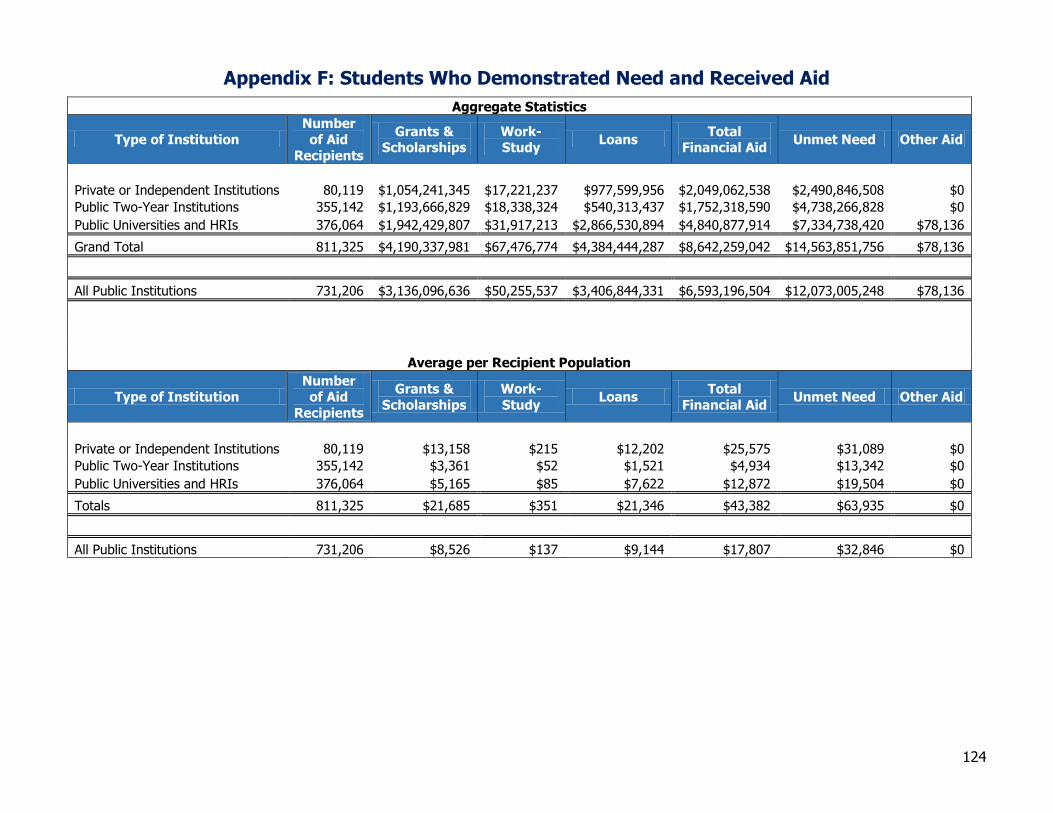
124
Appendix F: Students Who Demonstrated Need and Received Aid
Aggregate Statistics
Type of Institution
Number
of Aid
Recipients
Grants & Scholarships
Work-Study
Loans Total
Financial Aid Unmet Need Other Aid
Private or Independent Institutions 80,119 $1,054,241,345 $17,221,237 $977,599,956 $2,049,062,538 $2,490,846,508 $0
Public Two-Year Institutions 355,142 $1,193,666,829 $18,338,324 $540,313,437 $1,752,318,590 $4,738,266,828 $0
Public Universities and HRIs 376,064 $1,942,429,807 $31,917,213 $2,866,530,894 $4,840,877,914 $7,334,738,420 $78,136
Grand Total 811,325 $4,190,337,981 $67,476,774 $4,384,444,287 $8,642,259,042 $14,563,851,756 $78,136
All Public Institutions 731,206 $3,136,096,636 $50,255,537 $3,406,844,331 $6,593,196,504 $12,073,005,248 $78,136
Average per Recipient Population
Type of Institution Number of Aid
Recipients
Grants &
Scholarships
Work-
Study Loans
Total
Financial Aid Unmet Need Other Aid
Private or Independent Institutions 80,119 $13,158 $215 $12,202 $25,575 $31,089 $0
Public Two-Year Institutions 355,142 $3,361 $52 $1,521 $4,934 $13,342 $0
Public Universities and HRIs 376,064 $5,165 $85 $7,622 $12,872 $19,504 $0
Totals 811,325 $21,685 $351 $21,346 $43,382 $63,935 $0
All Public Institutions 731,206 $8,526 $137 $9,144 $17,807 $32,846 $0
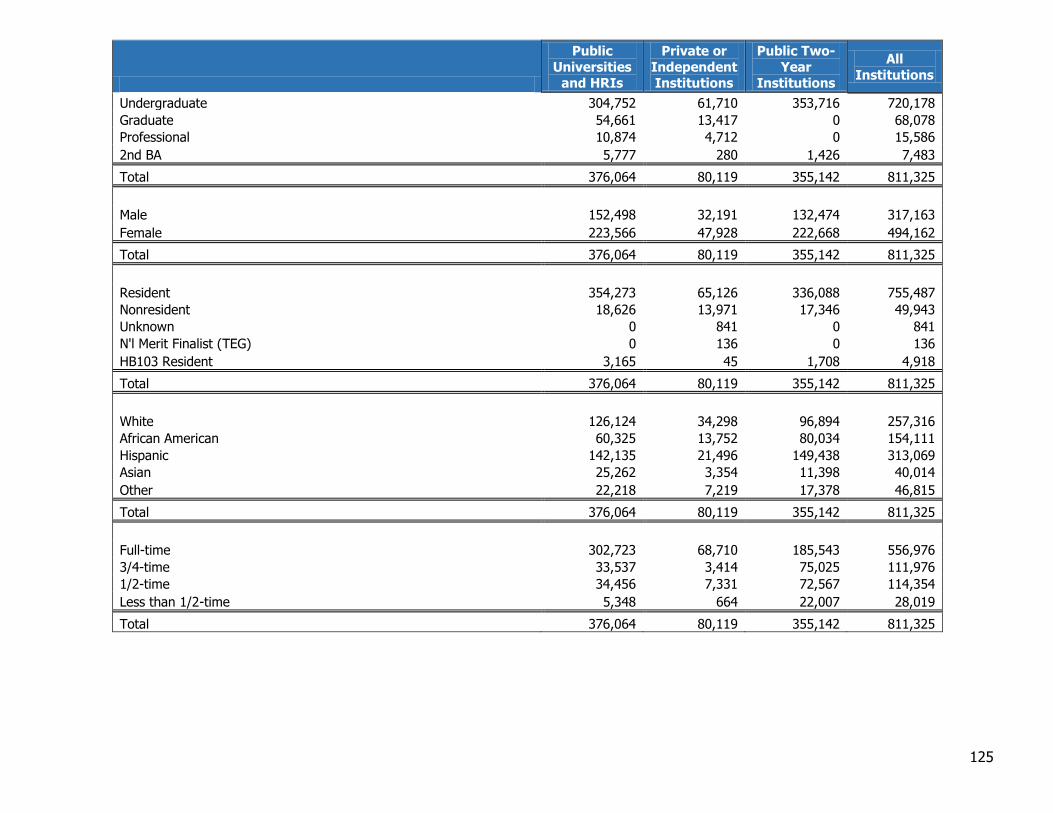
125
Public
Universities and HRIs
Private or
Independent Institutions
Public Two-
Year Institutions
All
Institutions
Undergraduate 304,752 61,710 353,716 720,178
Graduate 54,661 13,417 0 68,078
Professional 10,874 4,712 0 15,586
2nd BA 5,777 280 1,426 7,483
Total 376,064 80,119 355,142 811,325
Male 152,498 32,191 132,474 317,163
Female 223,566 47,928 222,668 494,162
Total 376,064 80,119 355,142 811,325
Resident 354,273 65,126 336,088 755,487
Nonresident 18,626 13,971 17,346 49,943
Unknown 0 841 0 841
N'l Merit Finalist (TEG) 0 136 0 136
HB103 Resident 3,165 45 1,708 4,918
Total 376,064 80,119 355,142 811,325
White 126,124 34,298 96,894 257,316
African American 60,325 13,752 80,034 154,111
Hispanic 142,135 21,496 149,438 313,069
Asian 25,262 3,354 11,398 40,014
Other 22,218 7,219 17,378 46,815
Total 376,064 80,119 355,142 811,325
Full-time 302,723 68,710 185,543 556,976
3/4-time 33,537 3,414 75,025 111,976
1/2-time 34,456 7,331 72,567 114,354
Less than 1/2-time 5,348 664 22,007 28,019
Total 376,064 80,119 355,142 811,325
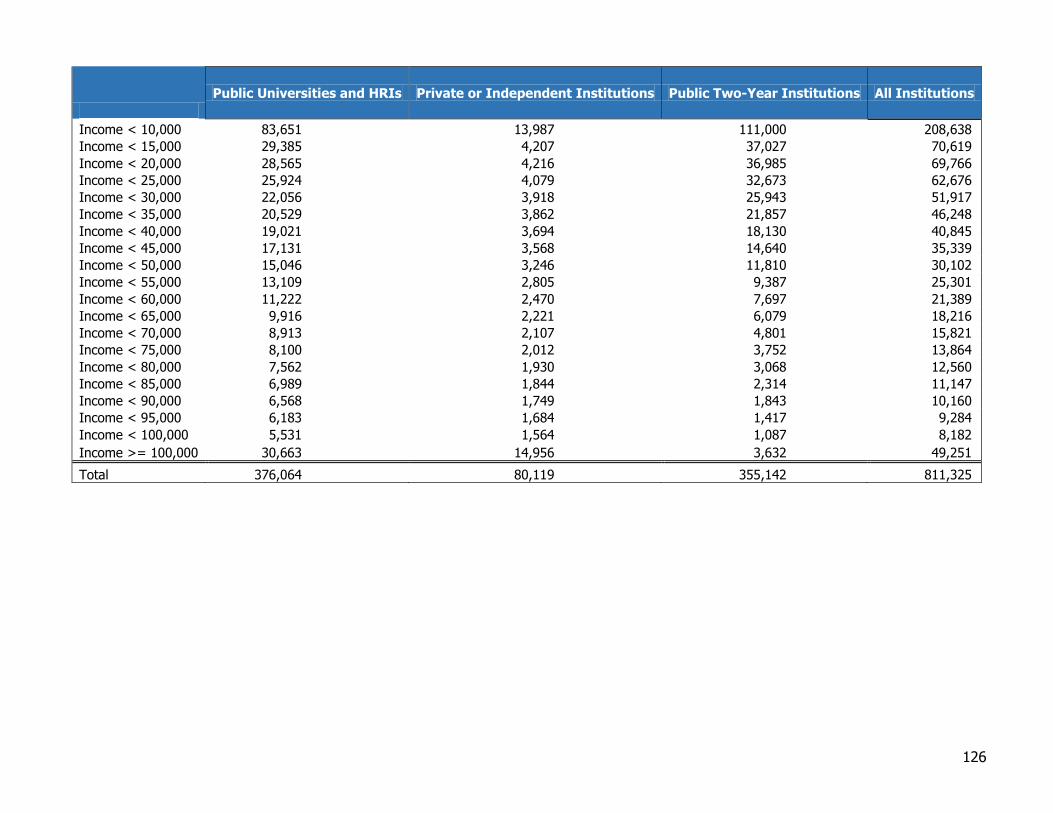
126
Public Universities and HRIs Private or Independent Institutions Public Two-Year Institutions All Institutions
Income < 10,000 83,651 13,987 111,000 208,638
Income < 15,000 29,385 4,207 37,027 70,619
Income < 20,000 28,565 4,216 36,985 69,766
Income < 25,000 25,924 4,079 32,673 62,676
Income < 30,000 22,056 3,918 25,943 51,917
Income < 35,000 20,529 3,862 21,857 46,248
Income < 40,000 19,021 3,694 18,130 40,845
Income < 45,000 17,131 3,568 14,640 35,339
Income < 50,000 15,046 3,246 11,810 30,102
Income < 55,000 13,109 2,805 9,387 25,301
Income < 60,000 11,222 2,470 7,697 21,389
Income < 65,000 9,916 2,221 6,079 18,216
Income < 70,000 8,913 2,107 4,801 15,821
Income < 75,000 8,100 2,012 3,752 13,864
Income < 80,000 7,562 1,930 3,068 12,560
Income < 85,000 6,989 1,844 2,314 11,147
Income < 90,000 6,568 1,749 1,843 10,160
Income < 95,000 6,183 1,684 1,417 9,284
Income < 100,000 5,531 1,564 1,087 8,182
Income >= 100,000 30,663 14,956 3,632 49,251
Total 376,064 80,119 355,142 811,325
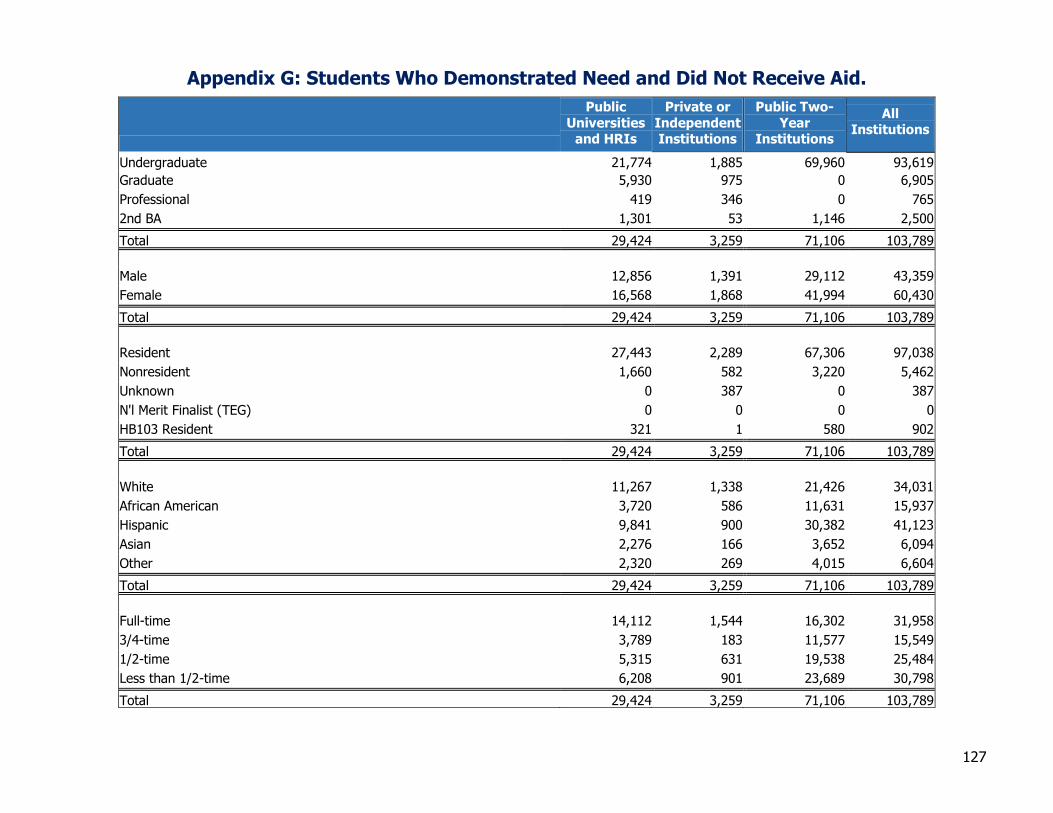
127
Appendix G: Students Who Demonstrated Need and Did Not Receive Aid.
Public
Universities and HRIs
Private or
Independent Institutions
Public Two-
Year Institutions
All Institutions
Undergraduate 21,774 1,885 69,960 93,619
Graduate 5,930 975 0 6,905
Professional 419 346 0 765
2nd BA 1,301 53 1,146 2,500
Total 29,424 3,259 71,106 103,789
Male 12,856 1,391 29,112 43,359
Female 16,568 1,868 41,994 60,430
Total 29,424 3,259 71,106 103,789
Resident 27,443 2,289 67,306 97,038
Nonresident 1,660 582 3,220 5,462
Unknown 0 387 0 387
N'l Merit Finalist (TEG) 0 0 0 0
HB103 Resident 321 1 580 902
Total 29,424 3,259 71,106 103,789
White 11,267 1,338 21,426 34,031
African American 3,720 586 11,631 15,937
Hispanic 9,841 900 30,382 41,123
Asian 2,276 166 3,652 6,094
Other 2,320 269 4,015 6,604
Total 29,424 3,259 71,106 103,789
Full-time 14,112 1,544 16,302 31,958
3/4-time 3,789 183 11,577 15,549
1/2-time 5,315 631 19,538 25,484
Less than 1/2-time 6,208 901 23,689 30,798
Total 29,424 3,259 71,106 103,789
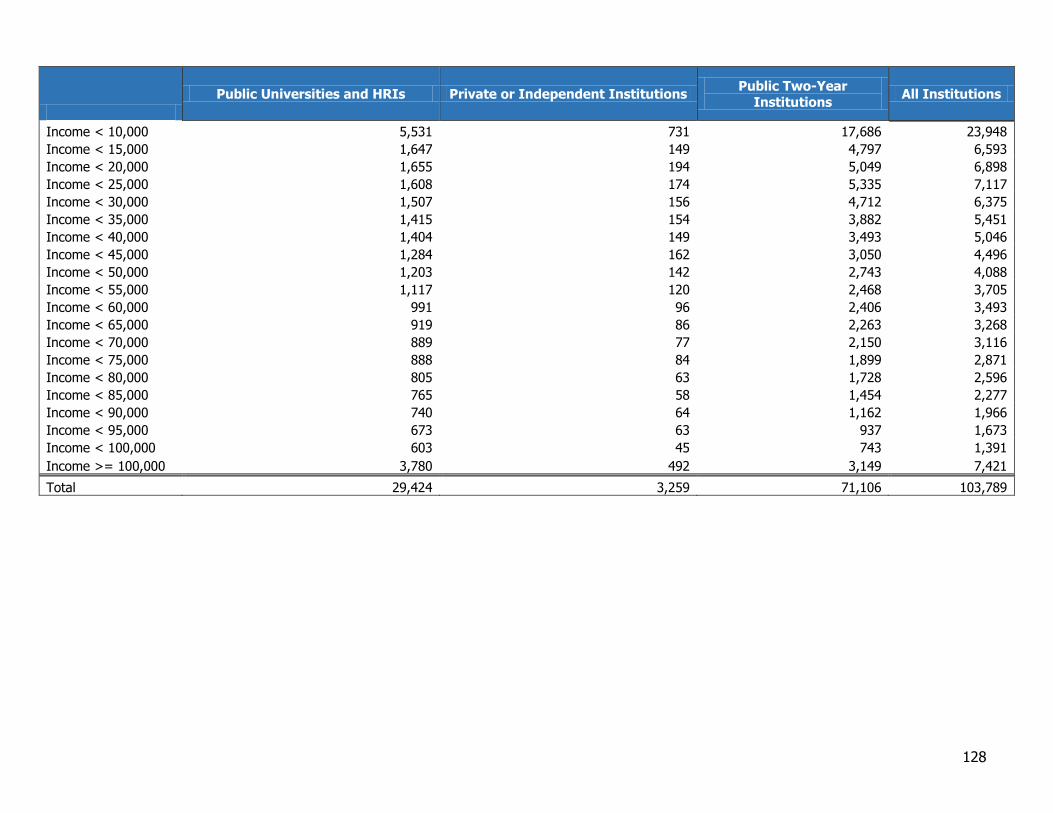
128
Public Universities and HRIs Private or Independent Institutions Public Two-Year
Institutions All Institutions
Income < 10,000 5,531 731 17,686 23,948
Income < 15,000 1,647 149 4,797 6,593
Income < 20,000 1,655 194 5,049 6,898
Income < 25,000 1,608 174 5,335 7,117
Income < 30,000 1,507 156 4,712 6,375
Income < 35,000 1,415 154 3,882 5,451
Income < 40,000 1,404 149 3,493 5,046
Income < 45,000 1,284 162 3,050 4,496
Income < 50,000 1,203 142 2,743 4,088
Income < 55,000 1,117 120 2,468 3,705
Income < 60,000 991 96 2,406 3,493
Income < 65,000 919 86 2,263 3,268
Income < 70,000 889 77 2,150 3,116
Income < 75,000 888 84 1,899 2,871
Income < 80,000 805 63 1,728 2,596
Income < 85,000 765 58 1,454 2,277
Income < 90,000 740 64 1,162 1,966
Income < 95,000 673 63 937 1,673
Income < 100,000 603 45 743 1,391
Income >= 100,000 3,780 492 3,149 7,421
Total 29,424 3,259 71,106 103,789
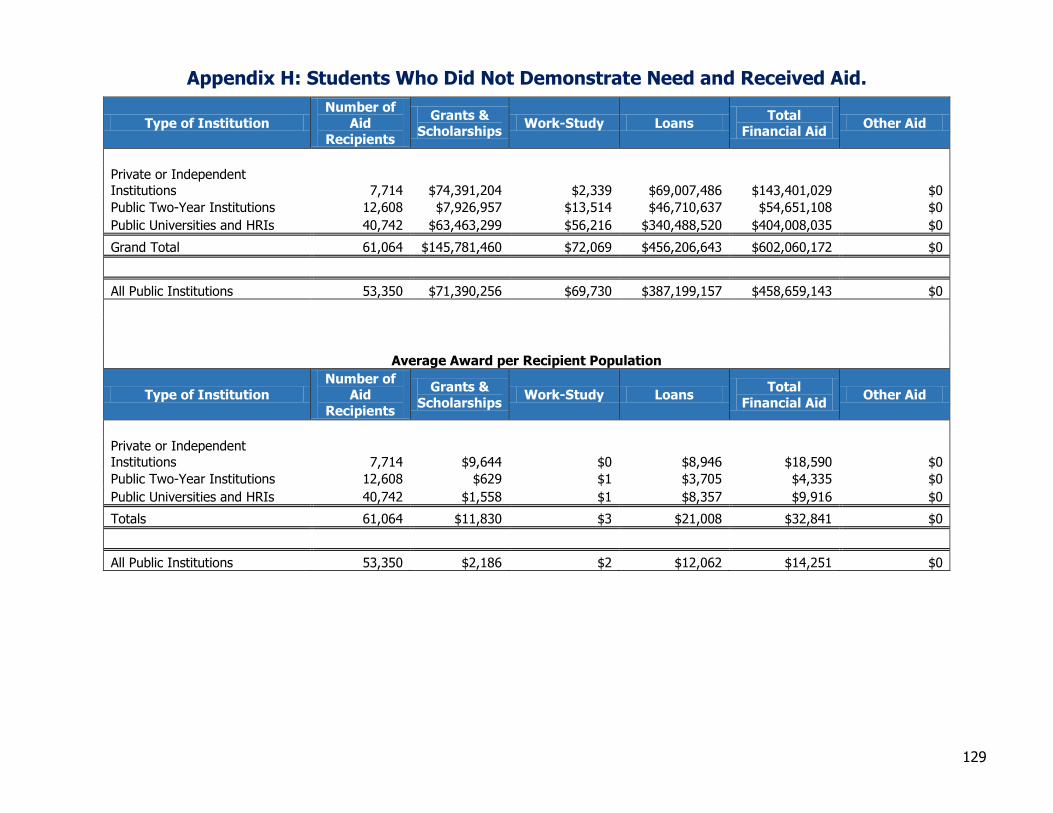
129
Appendix H: Students Who Did Not Demonstrate Need and Received Aid.
Type of Institution
Number of
Aid
Recipients
Grants & Scholarships
Work-Study Loans Total
Financial Aid Other Aid
Private or Independent
Institutions 7,714 $74,391,204 $2,339 $69,007,486 $143,401,029 $0
Public Two-Year Institutions 12,608 $7,926,957 $13,514 $46,710,637 $54,651,108 $0
Public Universities and HRIs 40,742 $63,463,299 $56,216 $340,488,520 $404,008,035 $0
Grand Total 61,064 $145,781,460 $72,069 $456,206,643 $602,060,172 $0
All Public Institutions 53,350 $71,390,256 $69,730 $387,199,157 $458,659,143 $0
Average Award per Recipient Population
Type of Institution Number of
Aid
Recipients
Grants &
Scholarships Work-Study Loans
Total
Financial Aid Other Aid
Private or Independent
Institutions 7,714 $9,644 $0 $8,946 $18,590 $0
Public Two-Year Institutions 12,608 $629 $1 $3,705 $4,335 $0
Public Universities and HRIs 40,742 $1,558 $1 $8,357 $9,916 $0
Totals 61,064 $11,830 $3 $21,008 $32,841 $0
All Public Institutions 53,350 $2,186 $2 $12,062 $14,251 $0
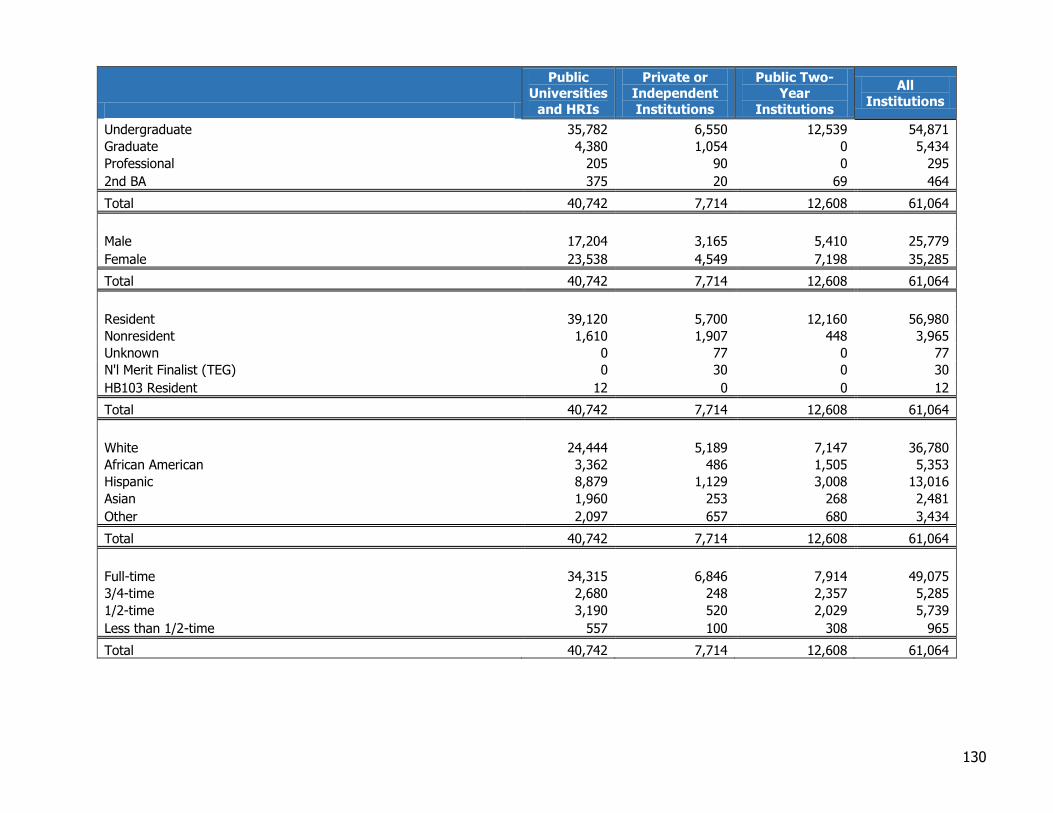
130
Public Universities
and HRIs
Private or Independent
Institutions
Public Two-Year
Institutions
All
Institutions
Undergraduate 35,782 6,550 12,539 54,871
Graduate 4,380 1,054 0 5,434
Professional 205 90 0 295
2nd BA 375 20 69 464
Total 40,742 7,714 12,608 61,064
Male 17,204 3,165 5,410 25,779
Female 23,538 4,549 7,198 35,285
Total 40,742 7,714 12,608 61,064
Resident 39,120 5,700 12,160 56,980
Nonresident 1,610 1,907 448 3,965
Unknown 0 77 0 77
N'l Merit Finalist (TEG) 0 30 0 30
HB103 Resident 12 0 0 12
Total 40,742 7,714 12,608 61,064
White 24,444 5,189 7,147 36,780
African American 3,362 486 1,505 5,353
Hispanic 8,879 1,129 3,008 13,016
Asian 1,960 253 268 2,481
Other 2,097 657 680 3,434
Total 40,742 7,714 12,608 61,064
Full-time 34,315 6,846 7,914 49,075
3/4-time 2,680 248 2,357 5,285
1/2-time 3,190 520 2,029 5,739
Less than 1/2-time 557 100 308 965
Total 40,742 7,714 12,608 61,064
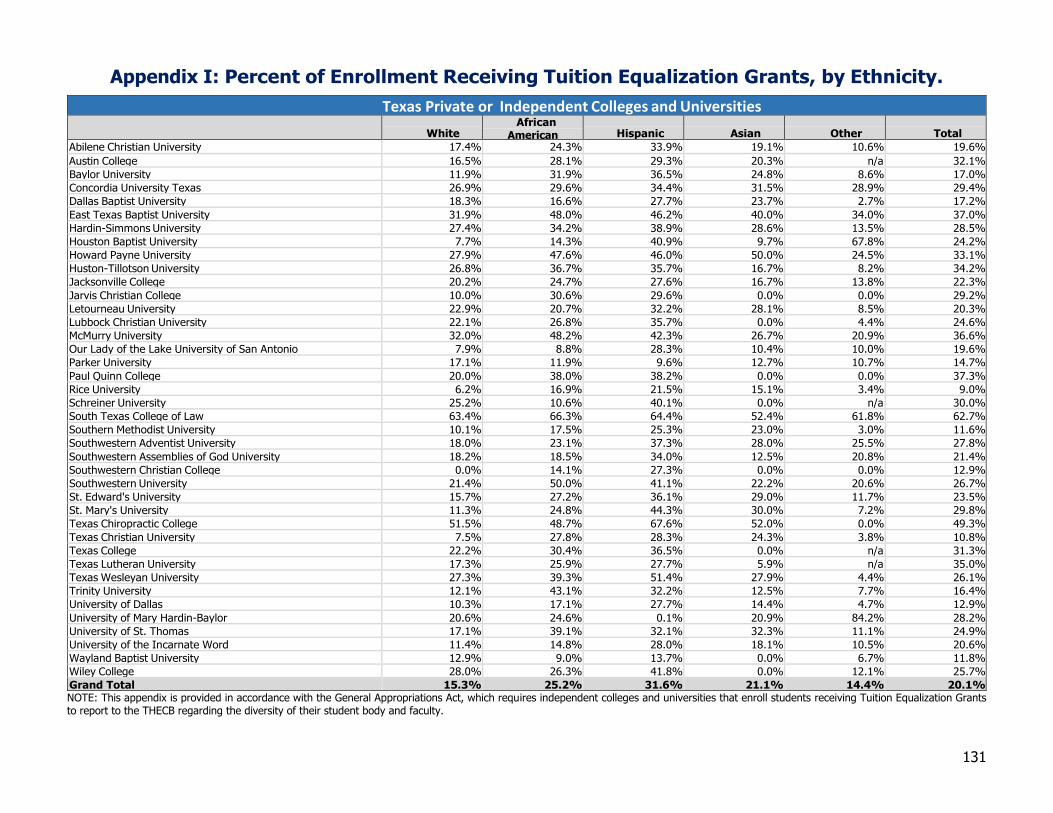
131
Appendix I: Percent of Enrollment Receiving Tuition Equalization Grants, by Ethnicity.
Texas Private or Independent Colleges and Universities
White
African American Hispanic Asian Other Total
Abilene Christian University 17.4% 24.3% 33.9% 19.1% 10.6% 19.6%
Austin College 16.5% 28.1% 29.3% 20.3% n/a 32.1%
Baylor University 11.9% 31.9% 36.5% 24.8% 8.6% 17.0%
Concordia University Texas 26.9% 29.6% 34.4% 31.5% 28.9% 29.4%
Dallas Baptist University 18.3% 16.6% 27.7% 23.7% 2.7% 17.2%
East Texas Baptist University 31.9% 48.0% 46.2% 40.0% 34.0% 37.0%
Hardin-Simmons University 27.4% 34.2% 38.9% 28.6% 13.5% 28.5%
Houston Baptist University 7.7% 14.3% 40.9% 9.7% 67.8% 24.2%
Howard Payne University 27.9% 47.6% 46.0% 50.0% 24.5% 33.1%
Huston-Tillotson University 26.8% 36.7% 35.7% 16.7% 8.2% 34.2%
Jacksonville College 20.2% 24.7% 27.6% 16.7% 13.8% 22.3%
Jarvis Christian College 10.0% 30.6% 29.6% 0.0% 0.0% 29.2%
Letourneau University 22.9% 20.7% 32.2% 28.1% 8.5% 20.3%
Lubbock Christian University 22.1% 26.8% 35.7% 0.0% 4.4% 24.6%
McMurry University 32.0% 48.2% 42.3% 26.7% 20.9% 36.6%
Our Lady of the Lake University of San Antonio 7.9% 8.8% 28.3% 10.4% 10.0% 19.6%
Parker University 17.1% 11.9% 9.6% 12.7% 10.7% 14.7%
Paul Quinn College 20.0% 38.0% 38.2% 0.0% 0.0% 37.3%
Rice University 6.2% 16.9% 21.5% 15.1% 3.4% 9.0%
Schreiner University 25.2% 10.6% 40.1% 0.0% n/a 30.0%
South Texas College of Law 63.4% 66.3% 64.4% 52.4% 61.8% 62.7%
Southern Methodist University 10.1% 17.5% 25.3% 23.0% 3.0% 11.6%
Southwestern Adventist University 18.0% 23.1% 37.3% 28.0% 25.5% 27.8%
Southwestern Assemblies of God University 18.2% 18.5% 34.0% 12.5% 20.8% 21.4%
Southwestern Christian College 0.0% 14.1% 27.3% 0.0% 0.0% 12.9%
Southwestern University 21.4% 50.0% 41.1% 22.2% 20.6% 26.7%
St. Edward's University 15.7% 27.2% 36.1% 29.0% 11.7% 23.5%
St. Mary's University 11.3% 24.8% 44.3% 30.0% 7.2% 29.8%
Texas Chiropractic College 51.5% 48.7% 67.6% 52.0% 0.0% 49.3%
Texas Christian University 7.5% 27.8% 28.3% 24.3% 3.8% 10.8%
Texas College 22.2% 30.4% 36.5% 0.0% n/a 31.3%
Texas Lutheran University 17.3% 25.9% 27.7% 5.9% n/a 35.0%
Texas Wesleyan University 27.3% 39.3% 51.4% 27.9% 4.4% 26.1%
Trinity University 12.1% 43.1% 32.2% 12.5% 7.7% 16.4%
University of Dallas 10.3% 17.1% 27.7% 14.4% 4.7% 12.9%
University of Mary Hardin-Baylor 20.6% 24.6% 0.1% 20.9% 84.2% 28.2%
University of St. Thomas 17.1% 39.1% 32.1% 32.3% 11.1% 24.9%
University of the Incarnate Word 11.4% 14.8% 28.0% 18.1% 10.5% 20.6%
Wayland Baptist University 12.9% 9.0% 13.7% 0.0% 6.7% 11.8%
Wiley College 28.0% 26.3% 41.8% 0.0% 12.1% 25.7%
Grand Total 15.3% 25.2% 31.6% 21.1% 14.4% 20.1% NOTE: This appendix is provided in accordance with the General Appropriations Act, which requires independent colleges and universities that enroll students receiving Tuition Equalization Grants to report to the THECB regarding the diversity of their student body and faculty.
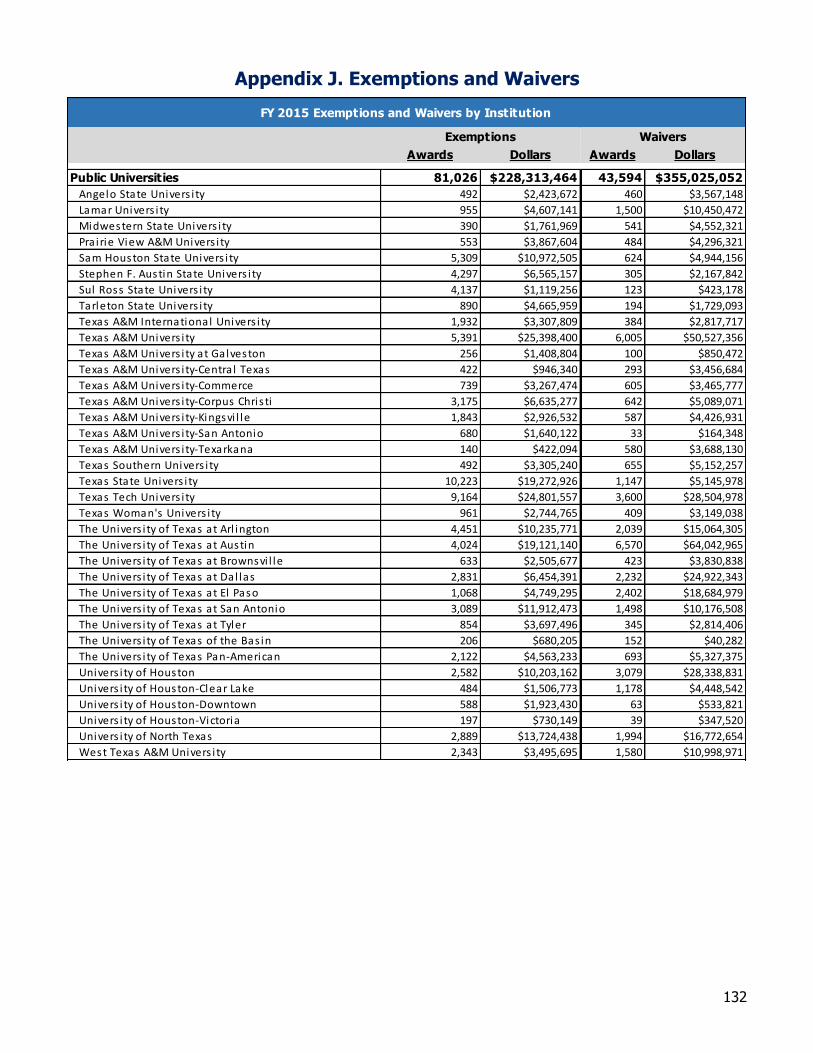
132
Appendix J. Exemptions and Waivers
Awards Dollars Awards Dollars
Public Universities 81,026 $228,313,464 43,594 $355,025,052
Angelo State Univers i ty 492 $2,423,672 460 $3,567,148
Lamar Univers i ty 955 $4,607,141 1,500 $10,450,472
Midwestern State Univers i ty 390 $1,761,969 541 $4,552,321
Prairie View A&M Univers i ty 553 $3,867,604 484 $4,296,321
Sam Houston State Univers i ty 5,309 $10,972,505 624 $4,944,156
Stephen F. Austin State Univers i ty 4,297 $6,565,157 305 $2,167,842
Sul Ross State Univers i ty 4,137 $1,119,256 123 $423,178
Tarleton State Univers i ty 890 $4,665,959 194 $1,729,093
Texas A&M International Univers i ty 1,932 $3,307,809 384 $2,817,717
Texas A&M Univers i ty 5,391 $25,398,400 6,005 $50,527,356
Texas A&M Univers i ty at Galveston 256 $1,408,804 100 $850,472
Texas A&M Univers i ty-Centra l Texas 422 $946,340 293 $3,456,684
Texas A&M Univers i ty-Commerce 739 $3,267,474 605 $3,465,777
Texas A&M Univers i ty-Corpus Chris ti 3,175 $6,635,277 642 $5,089,071
Texas A&M Univers i ty-Kingsvi l le 1,843 $2,926,532 587 $4,426,931
Texas A&M Univers i ty-San Antonio 680 $1,640,122 33 $164,348
Texas A&M Univers i ty-Texarkana 140 $422,094 580 $3,688,130
Texas Southern Univers i ty 492 $3,305,240 655 $5,152,257
Texas State Univers i ty 10,223 $19,272,926 1,147 $5,145,978
Texas Tech Univers i ty 9,164 $24,801,557 3,600 $28,504,978
Texas Woman's Univers i ty 961 $2,744,765 409 $3,149,038
The Univers i ty of Texas at Arl ington 4,451 $10,235,771 2,039 $15,064,305
The Univers i ty of Texas at Austin 4,024 $19,121,140 6,570 $64,042,965
The Univers i ty of Texas at Brownsvi l le 633 $2,505,677 423 $3,830,838
The Univers i ty of Texas at Dal las 2,831 $6,454,391 2,232 $24,922,343
The Univers i ty of Texas at El Paso 1,068 $4,749,295 2,402 $18,684,979
The Univers i ty of Texas at San Antonio 3,089 $11,912,473 1,498 $10,176,508
The Univers i ty of Texas at Tyler 854 $3,697,496 345 $2,814,406
The Univers i ty of Texas of the Bas in 206 $680,205 152 $40,282
The Univers i ty of Texas Pan-American 2,122 $4,563,233 693 $5,327,375
Univers i ty of Houston 2,582 $10,203,162 3,079 $28,338,831
Univers i ty of Houston-Clear Lake 484 $1,506,773 1,178 $4,448,542
Univers i ty of Houston-Downtown 588 $1,923,430 63 $533,821
Univers i ty of Houston-Victoria 197 $730,149 39 $347,520
Univers i ty of North Texas 2,889 $13,724,438 1,994 $16,772,654
West Texas A&M Univers i ty 2,343 $3,495,695 1,580 $10,998,971
Exemptions Waivers
FY 2015 Exemptions and Waivers by Institution
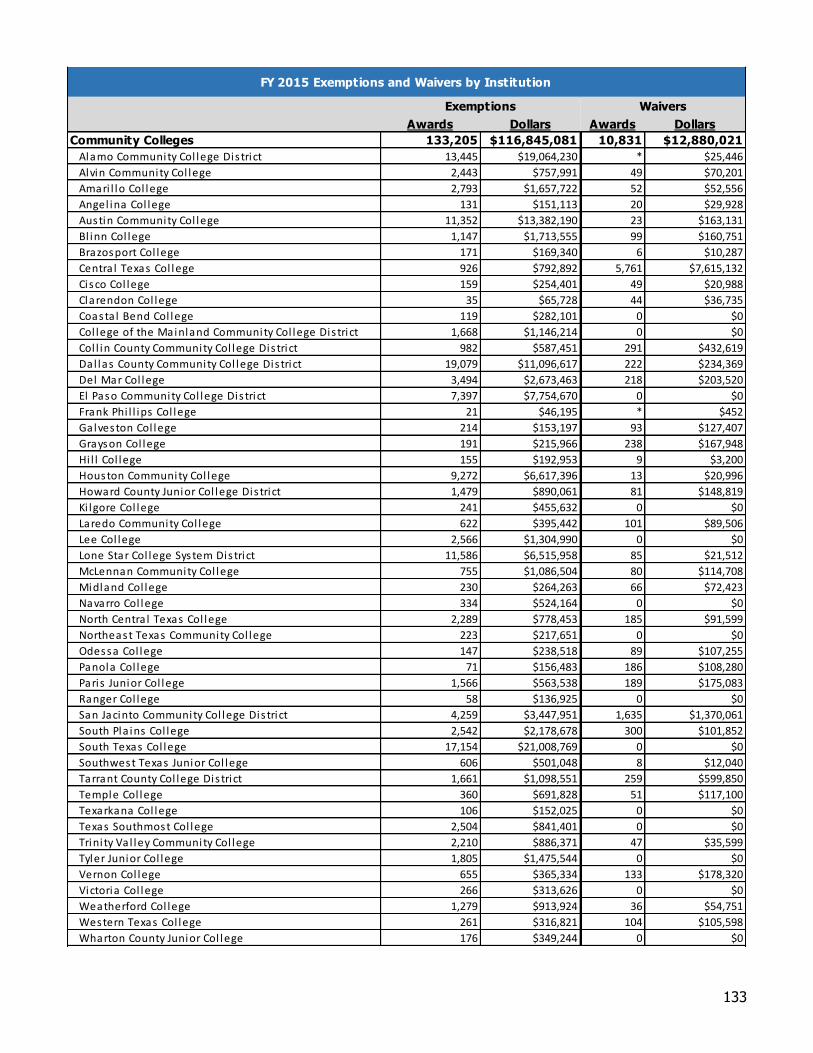
133
Awards Dollars Awards Dollars
Community Colleges 133,205 $116,845,081 10,831 $12,880,021
Alamo Community Col lege Dis trict 13,445 $19,064,230 * $25,446
Alvin Community Col lege 2,443 $757,991 49 $70,201
Amari l lo Col lege 2,793 $1,657,722 52 $52,556
Angel ina Col lege 131 $151,113 20 $29,928
Austin Community Col lege 11,352 $13,382,190 23 $163,131
Bl inn Col lege 1,147 $1,713,555 99 $160,751
Brazosport Col lege 171 $169,340 6 $10,287
Centra l Texas Col lege 926 $792,892 5,761 $7,615,132
Cisco Col lege 159 $254,401 49 $20,988
Clarendon Col lege 35 $65,728 44 $36,735
Coasta l Bend Col lege 119 $282,101 0 $0
Col lege of the Mainland Community Col lege Dis trict 1,668 $1,146,214 0 $0
Col l in County Community Col lege Dis trict 982 $587,451 291 $432,619
Dal las County Community Col lege Dis trict 19,079 $11,096,617 222 $234,369
Del Mar Col lege 3,494 $2,673,463 218 $203,520
El Paso Community Col lege Dis trict 7,397 $7,754,670 0 $0
Frank Phi l l ips Col lege 21 $46,195 * $452
Galveston Col lege 214 $153,197 93 $127,407
Grayson Col lege 191 $215,966 238 $167,948
Hi l l Col lege 155 $192,953 9 $3,200
Houston Community Col lege 9,272 $6,617,396 13 $20,996
Howard County Junior Col lege Dis trict 1,479 $890,061 81 $148,819
Ki lgore Col lege 241 $455,632 0 $0
Laredo Community Col lege 622 $395,442 101 $89,506
Lee Col lege 2,566 $1,304,990 0 $0
Lone Star Col lege System Dis trict 11,586 $6,515,958 85 $21,512
McLennan Community Col lege 755 $1,086,504 80 $114,708
Midland Col lege 230 $264,263 66 $72,423
Navarro Col lege 334 $524,164 0 $0
North Centra l Texas Col lege 2,289 $778,453 185 $91,599
Northeast Texas Community Col lege 223 $217,651 0 $0
Odessa Col lege 147 $238,518 89 $107,255
Panola Col lege 71 $156,483 186 $108,280
Paris Junior Col lege 1,566 $563,538 189 $175,083
Ranger Col lege 58 $136,925 0 $0
San Jacinto Community Col lege Dis trict 4,259 $3,447,951 1,635 $1,370,061
South Pla ins Col lege 2,542 $2,178,678 300 $101,852
South Texas Col lege 17,154 $21,008,769 0 $0
Southwest Texas Junior Col lege 606 $501,048 8 $12,040
Tarrant County Col lege Dis trict 1,661 $1,098,551 259 $599,850
Temple Col lege 360 $691,828 51 $117,100
Texarkana Col lege 106 $152,025 0 $0
Texas Southmost Col lege 2,504 $841,401 0 $0
Trini ty Val ley Community Col lege 2,210 $886,371 47 $35,599
Tyler Junior Col lege 1,805 $1,475,544 0 $0
Vernon Col lege 655 $365,334 133 $178,320
Victoria Col lege 266 $313,626 0 $0
Weatherford Col lege 1,279 $913,924 36 $54,751
Western Texas Col lege 261 $316,821 104 $105,598
Wharton County Junior Col lege 176 $349,244 0 $0
Exemptions Waivers
FY 2015 Exemptions and Waivers by Institution
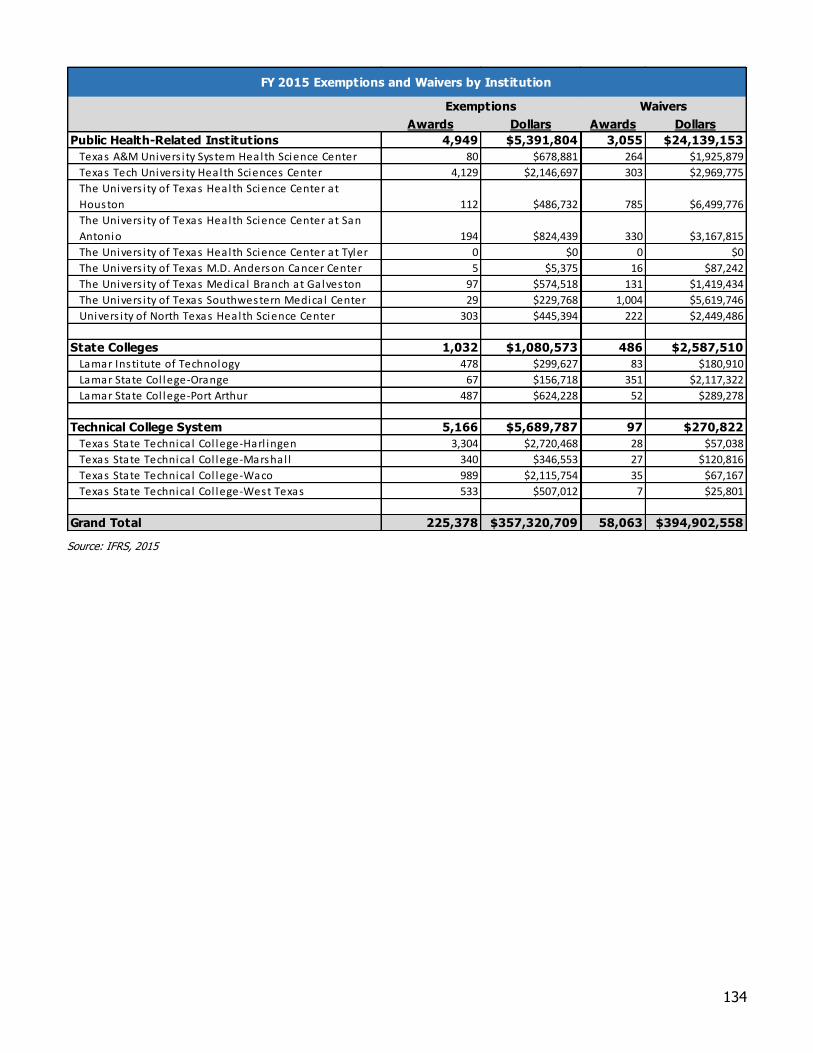
134
Source: IFRS, 2015
Awards Dollars Awards Dollars
Public Health-Related Institutions 4,949 $5,391,804 3,055 $24,139,153
Texas A&M Univers i ty System Health Science Center 80 $678,881 264 $1,925,879
Texas Tech Univers i ty Health Sciences Center 4,129 $2,146,697 303 $2,969,775
The Univers i ty of Texas Health Science Center at
Houston 112 $486,732 785 $6,499,776
The Univers i ty of Texas Health Science Center at San
Antonio 194 $824,439 330 $3,167,815
The Univers i ty of Texas Health Science Center at Tyler 0 $0 0 $0
The Univers i ty of Texas M.D. Anderson Cancer Center 5 $5,375 16 $87,242
The Univers i ty of Texas Medica l Branch at Galveston 97 $574,518 131 $1,419,434
The Univers i ty of Texas Southwestern Medica l Center 29 $229,768 1,004 $5,619,746
Univers i ty of North Texas Health Science Center 303 $445,394 222 $2,449,486
State Colleges 1,032 $1,080,573 486 $2,587,510
Lamar Insti tute of Technology 478 $299,627 83 $180,910
Lamar State Col lege-Orange 67 $156,718 351 $2,117,322
Lamar State Col lege-Port Arthur 487 $624,228 52 $289,278
Technical College System 5,166 $5,689,787 97 $270,822
Texas State Technica l Col lege-Harl ingen 3,304 $2,720,468 28 $57,038
Texas State Technica l Col lege-Marshal l 340 $346,553 27 $120,816
Texas State Technica l Col lege-Waco 989 $2,115,754 35 $67,167
Texas State Technica l Col lege-West Texas 533 $507,012 7 $25,801
Grand Total 225,378 $357,320,709 58,063 $394,902,558
Exemptions Waivers
FY 2015 Exemptions and Waivers by Institution
135
Appendix K: Resources
College Board. (2015). Trends in Student Aid 2015. Retrieved August 31, 2016 from https://trends.collegeboard.org/student-aid
Department of Numbers. (Nd.). Texas Household Income. Retrieved August 31, 2016 from http://www.deptofnumbers.com/income/texas/
Snyder, T., de Bray, C, Dillow, S. (2016). Digest of Education Statistics 2014. Retrieved August 31, 2016 from http://nces.ed.gov/pubs2016/2016006.pdf
Short, Kathleen. (2011). The Research Supplemental Poverty Measure: 2010. Retrieved August 31, 2016 from https://www.census.gov/prod/2011pubs/p60-241.pdf
Short, Kathleen. (2012). The Research Supplemental Poverty Measure: 2011. Retrieved August 31, 2016 form https://www.census.gov/prod/2012pubs/p60-244.pdf
Short, Kathleen. (2013). The Research Supplemental Poverty Measure: 2012. Retrieved August 31, 2016 form https://www.census.gov/prod/2013pubs/p60-247.pdf
Short, Kathleen. (2014). The Research Supplemental Poverty Measure: 2014. Retrieved August 31, 2016 form https://www.census.gov/content/dam/Census/library/publications/2014/demo/p60-251.pdf
Texas Charter for Higher Education. (1987). Retrieved August 31, 2016 from http://www.thecb.state.tx.us/reports/PDF/0081.PDF.
Texas Higher Education Coordinating Board. (2015). Annual Texas Success Initiative High School Summary Report. Retrieved August 31, 2016 from http://www.thecb.state.tx.us/reports/PDF/6849.PDF
Texas Higher Education Coordinating Board. (2016). Sources and Uses of Funds General Academic Institutions, Health-Related Institutions, Lamar State Colleges and Texas State Technical Colleges. Retrieved August 31, 2016 from http://www.thecb.state.tx.us/reports/PDF/7261.PDF?CFID=46913962&CFTOKEN=75836810
136
This document is available on the Texas Higher Education Coordinating Board website:
http://www.thecb.state.tx.us
For more information contact: Charles W. Puls, Ed.D, Deputy Assistant Commissioner Student Financial Aid Programs Texas Higher Education Coordinating Board P.O. Box 12788 Austin, TX 78711 PHONE (512) 427-6365 [email protected]
Related Documents