Current and Potential Economic Benefits of Legal Aid Services in Texas: 2013 Update THE PERRYMAN GROUP 510 N. Valley Mills Dr., Suite 300 Waco, TX 76710 ph. 254.751.9595, fax 254.751.7855 [email protected] www.perrymangroup.com February 2013

Economic Benefits of Legal Aid in Texas
Mar 28, 2016
Current and Potential Economic Benefits of Legal Aid Services in Texas: 2013 Update
Welcome message from author
This document is posted to help you gain knowledge. Please leave a comment to let me know what you think about it! Share it to your friends and learn new things together.
Transcript

Current and Potential Economic Benefits of Legal Aid Services in
Texas: 2013 Update
THE PERRYMAN GROUP
510 N. Valley Mills Dr., Suite 300
Waco, TX 76710
ph. 254.751.9595, fax 254.751.7855
www.perrymangroup.com
February 2013

Current and Potential Economic Benefits of Legal Aid Services in
Texas: 2013 Update
Contents Introduction and Overview .............................................................................. 1
Legal Aid in Texas .............................................................................................. 3
Funding for Legal Aid ............................................................................................................................. 3
Texans Receiving Legal Aid Services ................................................................................................. 4
Types of Cases Closed Through Legal Aid ........................................................................................ 4
Awards Stemming from Legal Aid Services ....................................................................................... 5
The Need for Additional Resources .................................................................................................... 7
Economic Benefits of Legal Aid Services ........................................................ 8
Current Impact of Legal Aid Services .................................................................................................. 9
Potential Impact of Expanding Legal Aid Services ......................................................................... 10
Conclusion ......................................................................................................... 11
APPENDICES ...................................................................................................... 12
About The Perryman Group .................................................................................................................... 13
Methods Used ......................................................................................................................................... 14
Detailed Sectoral Results ........................................................................................................................ 17

Current and Potential Economic Benefits of Legal Aid Services in Texas: 2013 Update
1 | P a g e w w w . p e r r y m a n g r o u p . c o m C o p y r i g h t 2 0 1 3
Introduction and Overview
The proper functioning of a free society and an efficient economy require the availability of a
fair and balanced legal system to adjudicate legitimate disputes and preserve individual rights.
This mechanism for resolving disputes must be reasonably available to everyone; achieving this
aim is widely considered a societal goal worthy of considerable support. In addition, a legal
system accessible to all enhances economic outcomes.
For some citizens, basic legal assistance is simply too expensive. Efforts to address this problem
encompass both the public sector (through support of legal services provided by various
governmental entities) and the private sector (through pro-bono attorneys and non-profit
organizations).
Legal assistance can be critically important for the individuals involved, as issues related to
marriage, divorce, child custody, housing, employment, and many other facets of daily life can
be successfully resolved. In addition, the economy can benefit. For example, productivity is
enhanced when the number of workdays missed due to legal problems is reduced or
eliminated, and more stable job, residential, and income patterns translate into tangible
benefits. While contributions to business activity are certainly not the primary objective of
these efforts, they are nonetheless an important consequence.
Legal aid services play a vital role in providing judicial access to less-advantaged persons.
Current contributions are notable, yet many legitimate needs remain unmet. The Perryman
Group (TPG) was asked to provide a reasonable quantification of the economic impact of
existing legal aid activities and the potential effects of expansion, updating a prior (2009) study
by the firm. The analysis was sponsored by the Texas Access to Justice Foundation.

Current and Potential Economic Benefits of Legal Aid Services in Texas: 2013 Update
2 | P a g e w w w . p e r r y m a n g r o u p . c o m C o p y r i g h t 2 0 1 3
Measuring Economic Impacts
Any economic stimulus (such as direct spending, investments, or corporate activity) generates multiplier
effects throughout the economy. In this instance, economic benefits of current and potentially
expanded legal aid services in Texas include enhancements to productivity through reclaimed income of
benefits, more stable household settings, and reduced uncertainty. Once the direct stimulus was
quantified, the associated multiplier effects were measured.
The Perryman Group’s input-output assessment model (the US Multi-Regional Impact Assessment
System, which is described in further detail in the Appendices to this report) was developed by The
Perryman Group some 30 years ago and has been consistently maintained and updated since that time;
it has been used in hundreds of analyses for clients ranging from major corporations to government
agencies. The system uses a variety of data (from surveys, industry information, and other sources) to
describe the various goods and services (known as resources or inputs) required to produce another
good/service. This process allows for estimation of the total economic impact (including multiplier
effects) of current and potentially expanded legal aid services. The submodel used in the current
analysis reflects the specific industrial composition and characteristics of the Texas economy.
These total economic effects are quantified for key measures of business activity:
Total expenditures (or total spending) measure the dollars changing hands as a result of the
economic stimulus.
Gross product (or output) is production of goods and services that will come about in each area as a
result of the activity. This measure is parallel to the gross domestic product numbers commonly
reported by various media outlets and is a subset of total expenditures.
Personal income is dollars that end up in the hands of people in the area; the vast majority of this
aggregate derives from the earnings of employees, but payments such as interest and rents are also
included.
Job gains are expressed as permanent jobs since legal aid is an ongoing annual effect.
Monetary values were quantified on a constant (2012) basis to eliminate the effects of inflation. See the
Appendices to this report for additional information regarding the methods and assumptions used in
this analysis.

Current and Potential Economic Benefits of Legal Aid Services in Texas: 2013 Update
3 | P a g e w w w . p e r r y m a n g r o u p . c o m C o p y r i g h t 2 0 1 3
Legal Aid in Texas
In 2011 (the latest available data), about 101,200 legal aid cases were closed. Almost half of
the Texans served were from particularly vulnerable populations such as disabled persons
(19,697 cases), domestic violence victims (11,059), the elderly (13,745), or children (7,106).
Funding for Legal Aid
Funding for legal aid stems from several primary sources, including the federal government,
State and local governments, private bar contributions, and other private sources such as
charities. In 2011, funding for legal aid in Texas totaled more than $96.5 million. The two
primary funding sources are the Legal Services Corporation (LSC) and the Texas Access to
Justice Foundation.
LSC is a private, nonprofit corporation established by Congress in 1974 to promote equal access
to justice and to provide high-quality legal assistance to low-income Americans. LSC distributes
funding to independent local legal aid programs throughout the US, including three programs in
Texas. In 2011, funding through the LSC in Texas exceeded $32.6 million.
The Texas Access to Justice Foundation was created in 1984 by the Supreme Court of Texas and
is a 501(c)(3) nonprofit corporation that administers funding for civil legal aid for low-income
Texans. The Foundation is the largest Texas-based funding source for civil legal aid, granting
more than $31.3 million to nonprofit legal aid organizations in 2011. The Foundation
administers funds including the Interest on Lawyers’ Trust Accounts (IOLTA) Program, Basic Civil
Legal Services (BCLS), Crime Victims Civil Legal Services (CVCLS) Program, Access to Justice Fee
(ATJ), and private donations. These funds are granted to legal aid organizations that provide
services to low-income Texans throughout the state.
The IOLTA Program accounts for a significant portion of available funds for the Texas Access to
Justice Foundation, but IOLTA funds have decreased significantly in recent years due to
plummeting interest rates. IOLTA funds in Texas totaled $20 million in 2007, declining to $12.2
million in 2008, and $5.2 million in 2011. This drop in funding negatively affects legal aid
programs throughout the state.

Current and Potential Economic Benefits of Legal Aid Services in Texas: 2013 Update
4 | P a g e w w w . p e r r y m a n g r o u p . c o m C o p y r i g h t 2 0 1 3
Texans Receiving Legal Aid Services
As noted, legal aid is concentrated among some of the most vulnerable groups in society.
Assistance spans age brackets and race/ethnicity. In addition, thousands of children (under 18)
and older Texans (over 60) are served.
Demographic Characteristics of Legal Aid Recipients in Texas (2011)
Race Under 18 years old
18-59 years old
60 years old and
older TOTAL
White 622 22,608 4,808 28,038
Black 524 18,772 3,277 22,573
Hispanic 5,069 34,762 4,981 44,812
Native American
112 324 62 498
Asian 235 1772 379 2,386
Other 544 2103 238 2,885
TOTAL 7,106 80,341 13,745 101,192
Source: Texas Access to Justice Foundation
Types of Cases Closed Through Legal Aid
Family law cases were the largest category of legal aid cases by a significant margin.

Current and Potential Economic Benefits of Legal Aid Services in Texas: 2013 Update
5 | P a g e w w w . p e r r y m a n g r o u p . c o m C o p y r i g h t 2 0 1 3
Legal Aid Cases by Type
(2011)
Consumer/Finance 6,424
Education 402
Employment 2,935
Family 41,294
Juvenile 311
Health 2,135
Housing 12,287
Income Maintenance 5,980
Disability 3,029
Individual Rights 17,181
Miscellaneous 9,214
TOTAL 101,192
Source: Texas Access to Justice Foundation
The lives of thousands of Texans are directly affected by the assistance provided through legal
aid. Without this mechanism for access to the judicial system, many of these persons would be
unable to resolve very difficult legal issues.
Awards Stemming from Legal Aid Services
As noted, the legal assistance obtained can be life altering for the individuals involved. In
addition to the crucial nature of the access to the legal system from the perspective of quality
of life or human/societal interest, the financial aspect of the aid is very important.

Current and Potential Economic Benefits of Legal Aid Services in Texas: 2013 Update
6 | P a g e w w w . p e r r y m a n g r o u p . c o m C o p y r i g h t 2 0 1 3
Awards Stemming From Legal Aid Cases by Type
(2011)
Category Back
Awards Monthly Benefits
Annualized Monthly Benefits
Social Security, SSI $2,439,385 $292,110 $3,505,320
Other Federal Benefits $1,677,427 $43,817 $525,804
Unemployment Compensation
$99,129 $33,913 $406,956
Food Stamps $88,301 $29,972 $359,664
Family Law—Child Support $4,711,317 $1,009,918 $12,119,016
Family Law—Spousal
Maintenance $946,168 $56,004 $672,048
Affirmative landlord/tenant judgments
$200,985 $64,007 $768,084
Affirmative employment judgments
$1,301,086 $0 $0
Affirmative consumer judgments
$1,364,531 $41,112 $493,344
Other $4,765,804 $11,607 $139,284
Other Worker Comp, Taxes, Probate
$50,800 $0 $0
Other Torts $7,311 $0 $0
Other Property Settlement $15,000 $0 $0
Civil Rights $245,400 $0 $0
Other CVC Claims $296,062 $0 $0
Other Home Value & Property $67,000 $0 $0
Other Private Help $315 $0 $0
Totals $18,276,021 $1,582,460 $18,989,520
Source: Texas Access to Justice Foundation

Current and Potential Economic Benefits of Legal Aid Services in Texas: 2013 Update
7 | P a g e w w w . p e r r y m a n g r o u p . c o m C o p y r i g h t 2 0 1 3
The Need for Additional Resources
Texas compares poorly in the nation in per-capita revenue for the provision of civil legal aid.
Limited resources and, in certain instances, declining resources, restrictions on the uses of
funding, and the scarcity of legal services in some of the rural areas of the state are major
problems. The gap between the civil legal needs of low-income persons and the legal help they
receive has long been recognized.
Circumstances can put even more pressure on the system. For example, Hurricane Katrina
increased the needs of many already eligible clients for legal aid and created a new group of
potential users. Legal services programs in the Gulf Coast Region were confronted with
overwhelming demand for legal services. Many of these client needs were persistent, including
problems such as resolution of landlord-tenant disputes, legal issues related to temporary
housing in mobile homes, home repair and contractor disputes, consumer fraud issues, health
problems, and increased family law issues, such as child abuse and domestic violence from
disaster-related distress.
The legal aid system in Texas is facing growing needs for services even as available funding
comes under increasing pressure. This combination of rising demand in the face of limited
resources is challenging to an already overburdened system.

Current and Potential Economic Benefits of Legal Aid Services in Texas: 2013 Update
8 | P a g e w w w . p e r r y m a n g r o u p . c o m C o p y r i g h t 2 0 1 3
Economic Benefits of Legal Aid Services
In order to assess the impact of legal aid on the economy, The Perryman Group first examined
the size and scope of services currently being provided. Next, TPG analyzed the need for such
services based on demographic patterns.
The current effects were measured using a framework that seeks to value the contribution to
overall economic welfare in a conservative manner. Using the ratio of value-added for typical
legal services to income earned in providing those services (as derived from The Perryman
Group’s impact assessment model and data from the US Department of Commerce), it is
possible to generate the estimates of the incremental benefits of purchased legal services
within the market. Because a portion of this income reflects partner profits and other types of
compensation that are not applicable to legal aid activity, this calculation must be adjusted to
reflect only the segment of overall payments attributable to wages, salaries, and benefits. The
information required for this modification is also obtained from the US Department of
Commerce. The result of the computations is that the typical contribution to economic well-
being per dollar of legal aid spending is approximately $2.677 per dollar expended. Based on
the average resources devoted to matters in Texas, the social value per legal aid case is about
$2,545.
It should be noted that this measure likely understates the true benefit in several respects.
First, because attorneys and others providing services to the indigent are compensated at levels
well below the average in the private sector, the cost per case (and, hence, the measured
benefit) is likely to be well below the levels observed in the market as a whole. Second,
because of the limited resources available for indigent legal aid relative to that in the
population as a whole, it is likely that there is greater social value per dollar expended (since
only a small fraction of needs can be met, services would tend to be allocated toward the most
serious matters). Third, the measured effects are based on market data which only measures
private returns and does not capture externalities. In many instances, litigation merely brings a
transfer of resources from one entity to another. Because of the critical nature of many legal
aid cases in the lives of individuals, they would generally reflect positive social benefits to a
greater degree than the norm for all matters.
Current and Potential Economic Benefits of Legal Aid Services in Texas: 2013 Update
9 | P a g e w w w . p e r r y m a n g r o u p . c o m C o p y r i g h t 2 0 1 3
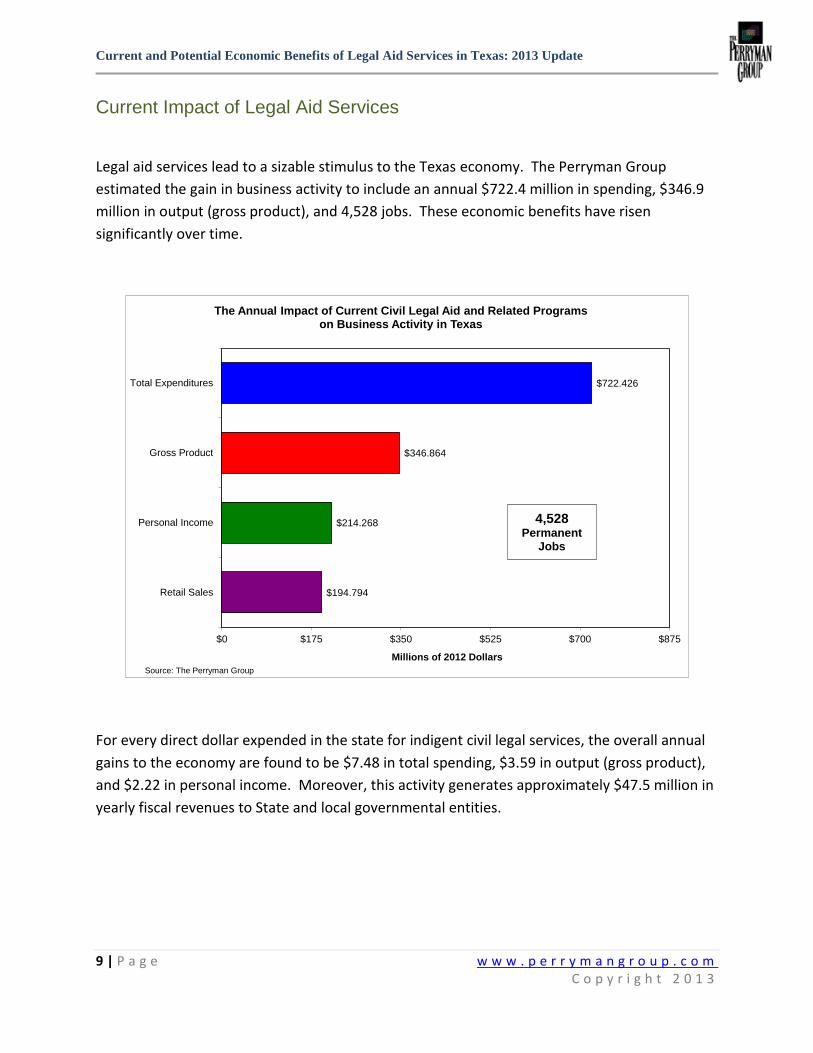
Current Impact of Legal Aid Services
Legal aid services lead to a sizable stimulus to the Texas economy. The Perryman Group
estimated the gain in business activity to include an annual $722.4 million in spending, $346.9
million in output (gross product), and 4,528 jobs. These economic benefits have risen
significantly over time.
For every direct dollar expended in the state for indigent civil legal services, the overall annual
gains to the economy are found to be $7.48 in total spending, $3.59 in output (gross product),
and $2.22 in personal income. Moreover, this activity generates approximately $47.5 million in
yearly fiscal revenues to State and local governmental entities.
$194.794
$214.268
$346.864
$722.426
$0 $175 $350 $525 $700 $875
Retail Sales
Personal Income
Gross Product
Total Expenditures
Millions of 2012 Dollars
The Annual Impact of Current Civil Legal Aid and Related Programson Business Activity in Texas
4,528Permanent
Jobs
Source: The Perryman Group

Current and Potential Economic Benefits of Legal Aid Services in Texas: 2013 Update
10 | P a g e w w w . p e r r y m a n g r o u p . c o m C o p y r i g h t 2 0 1 3
Potential Impact of Expanding Legal Aid Services
Because of the large unmet need for legal aid, additional funding (and, thus, assistance) would
lead to further gains in business activity even beyond the other social benefits of more
equitable access. To assess the potential incremental (over and above the current levels)
benefits of expanding funding for assistance, TPG developed an illustration assuming that the
resources available in Texas are permitted to expand to reach a level equivalent to the
percentage of low-income individuals in the state.
At present, Texas accounts for almost 6.9% of funding from all sources for indigent legal
assistance in the US, but has approximately 9.9% of the relevant population. If funding in Texas
rises sufficiently to be equivalent to the state’s share of the low-income population within the
United States, the added yearly benefits total an estimated $311.6 million in expenditures,
$149.6 million in gross state product, $92.4 million in personal income, and 1,953 permanent
jobs.
These benefits are spread across all major industry sectors (as described in the detailed
sectoral results in the Appendices to this report).
$84.023
$92.423
$149.617
$311.613
$0 $75 $150 $225 $300 $375
Retail Sales
Personal Income
Gross Product
Total Expenditures
Millions of 2012 Dollars
The Incremental Annual Impact of Additional Civil Legal Aid and RelatedPrograms on Business Activity in Texas with Funding Sufficientto Increase the State Percentage of Resources to be Equivalent
to the Proportion of Indigent Residents
1,953Permanent
Jobs
Source: The Perryman Group

Current and Potential Economic Benefits of Legal Aid Services in Texas: 2013 Update
11 | P a g e w w w . p e r r y m a n g r o u p . c o m C o p y r i g h t 2 0 1 3
Conclusion
Accessibility to civil legal services for all citizens is desirable both from the perspective of
individuals and the economy. Legal assistance can be crucial to maintaining quality of life and
dealing with critical personal and family issues. At the same time, providing legal aid has
notable positive economic and social outcomes.
The Perryman Group analyzed the impact of assistance currently being provided and found that
it includes $346.9 million in output and 4,528 permanent jobs. Even so, many needs are going
unmet due to funding constraints. Expanding funding to address this gap would not only help
some of the most vulnerable populations in the state, but would also generate notable
economic benefits.
Providing access to civil legal assistance to the thousands of Texans with legitimate needs not
currently being met is a worthy societal goal that should be pursued for many reasons
extending far beyond economics. Nonetheless, these efforts are beneficial to business activity
and, even by that standard, represent a prudent use of resources.

Current and Potential Economic Benefits of Legal Aid Services in Texas: 2013 Update
12 | P a g e w w w . p e r r y m a n g r o u p . c o m C o p y r i g h t 2 0 1 3
APPENDICES

Current and Potential Economic Benefits of Legal Aid Services in Texas: 2013 Update
13 | P a g e w w w . p e r r y m a n g r o u p . c o m C o p y r i g h t 2 0 1 3
About The Perryman Group
• The Perryman Group (TPG) is an economic research and analysis firm based in Waco, Texas. The
firm has more than 30 years of experience in assessing the economic impact of corporate
expansions, regulatory changes, real estate developments, public policy initiatives, and myriad
other factors affecting business activity. TPG has conducted hundreds of impact analyses for
local areas, regions, and states throughout the United States. Impact studies have been
performed for hundreds of clients including many of the largest corporations in the world,
governmental entities at all levels, educational institutions, major health care systems, utilities,
and economic development organizations.
• Dr. M. Ray Perryman, founder and President of the firm, developed the US Multi-Regional
Impact Assessment System (USMRIAS—used in this study) in the early 1980s and has
consistently maintained, expanded, and updated it since that time. The model has been used in
hundreds of diverse applications and has an excellent reputation for reliability.
• TPG has extensive experience in examining the economic effects of public policy. Moreover, the
firm has completed numerous economic assessments related to the judicial system in Texas and
other states, as well as evaluations of programs which provide support for less-advantaged
persons (such as Medicaid and the Children’s Health Insurance Program).

Current and Potential Economic Benefits of Legal Aid Services in Texas: 2013 Update
14 | P a g e w w w . p e r r y m a n g r o u p . c o m C o p y r i g h t 2 0 1 3
Methods Used
• The basic modeling technique employed in this study is known as dynamic input-output analysis.
This methodology essentially uses extensive survey data, industry information, and a variety of
corroborative source materials to create a matrix describing the various goods and services
(known as resources or inputs) required to produce one unit (a dollar’s worth) of output for a
given sector. Once the base information is compiled, it can be mathematically simulated to
generate evaluations of the magnitude of successive rounds of activity involved in the overall
production process.
• There are two essential steps in conducting an input-output analysis once the system is
operational. The first major endeavor is to accurately define the levels of direct activity to be
evaluated. In the case of a prospective evaluation, it is necessary to first calculate reasonable
estimates of the direct activity.
• In this instance, extensive data regarding legal aid were provided by the Texas Access to Justice
Foundation. The computation of aggregate benefit was based on essential premises of social
welfare and market value which served to determine the surplus generated by legal aid services.
• The second major phase of the analysis is the simulation of the input-output system to measure
overall economic effects of these direct changes in health care spending and outcomes. The
present study was conducted within the context of the USMRIAS which was developed and is
maintained by The Perryman Group. This model has been used in hundreds of diverse
applications across the country and has an excellent reputation for accuracy and credibility. The
systems used in the current simulations reflect the unique industrial structure and
characteristics of the Texas economy.
• The USMRIAS is somewhat similar in format to the Input-Output Model of the United States and
the Regional Input-Output Modeling System, both of which are maintained by the US
Department of Commerce. The model developed by TPG, however, incorporates several
important enhancements and refinements. Specifically, the expanded system includes (1)
comprehensive 500-sector coverage for any county, multi-county, or urban region; (2)
calculation of both total expenditures and value-added by industry and region; (3) direct
estimation of expenditures for multiple basic input choices (expenditures, output, income, or
employment); (4) extensive parameter localization; (5) price adjustments for real and nominal
assessments by sectors and areas; (6) measurement of the induced impacts associated with
payrolls and consumer spending; (7) embedded modules to estimate multi-sectoral direct
spending effects; (8) estimation of retail spending activity by consumers; and (9) comprehensive
linkage and integration capabilities with a wide variety of econometric, real estate,
occupational, and fiscal impact models. Moreover, the model uses specific local taxing patterns

Current and Potential Economic Benefits of Legal Aid Services in Texas: 2013 Update
15 | P a g e w w w . p e r r y m a n g r o u p . c o m C o p y r i g h t 2 0 1 3
to estimate the fiscal effects of activity on a detailed sectoral basis. The models used for the
present investigation have been thoroughly tested for reasonableness and historical reliability.
• The impact assessment (input-output) process essentially estimates the amounts of all types of
goods and services required to produce one unit (a dollar’s worth) of a specific type of output.
For purposes of illustrating the nature of the system, it is useful to think of inputs and outputs in
dollar (rather than physical) terms. As an example, the construction of a new building will
require specific dollar amounts of lumber, glass, concrete, hand tools, architectural services,
interior design services, paint, plumbing, and numerous other elements. Each of these suppliers
must, in turn, purchase additional dollar amounts of inputs. This process continues through
multiple rounds of production, thus generating subsequent increments to business activity. The
initial process of building the facility is known as the direct effect. The ensuing transactions in
the output chain constitute the indirect effect.
• Another pattern that arises in response to any direct economic activity comes from the payroll
dollars received by employees at each stage of the production cycle. As workers are
compensated, they use some of their income for taxes, savings, and purchases from external
markets. A substantial portion, however, is spent locally on food, clothing, health care services,
utilities, housing, recreation, and other items. Typical purchasing patterns in the relevant areas
are obtained from the ACCRA Cost of Living Index, a privately compiled inter-regional measure
which has been widely used for several decades, and the Consumer Expenditure Survey of the US
Department of Labor. These initial outlays by area residents generate further secondary activity
as local providers acquire inputs to meet this consumer demand. These consumer spending
impacts are known as the induced effect. The USMRIAS is designed to provide realistic, yet
conservative, estimates of these phenomena.
• Sources for information used in this process include the Bureau of the Census, the Bureau of
Labor Statistics, the Regional Economic Information System of the US Department of Commerce,
and other public and private sources. The pricing data are compiled from the US Department of
Labor and the US Department of Commerce. The verification and testing procedures make use
of extensive public and private sources.
• Impacts were measured in constant 2012 dollars to eliminate the effects of inflation.
• The USMRIAS generates estimates of the effect on several measures of business activity. The
most comprehensive measure of economic activity used in this study is Total Expenditures. This
measure incorporates every dollar that changes hands in any transaction. For example, suppose
a farmer sells wheat to a miller for $0.50; the miller then sells flour to a baker for $0.75; the
baker, in turn, sells bread to a customer for $1.25. The Total Expenditures recorded in this
instance would be $2.50, that is, $0.50 + $0.75 + $1.25. This measure is quite broad, but is
useful in that (1) it reflects the overall interplay of all industries in the economy, and (2) some
key fiscal variables such as sales taxes are linked to aggregate spending.

Current and Potential Economic Benefits of Legal Aid Services in Texas: 2013 Update
16 | P a g e w w w . p e r r y m a n g r o u p . c o m C o p y r i g h t 2 0 1 3
• A second measure of business activity frequently employed in this analysis is that of Gross
Product. This indicator represents the regional equivalent of Gross Domestic Product, the most
commonly reported statistic regarding national economic performance. In other words, the
Gross Product of Arkansas is the amount of US output that is produced in that state; it is defined
as the value of all final goods produced in a given region for a specific period of time. Stated
differently, it captures the amount of value-added (gross area product) over intermediate goods
and services at each stage of the production process, that is, it eliminates the double counting in
the Total Expenditures concept. Using the example above, the Gross Product is $1.25 (the value
of the bread) rather than $2.50. Alternatively, it may be viewed as the sum of the value-added
by the farmer, $0.50; the miller, $0.25 ($0.75 - $0.50); and the baker, $0.50 ($1.25 - $0.75). The
total value-added is, therefore, $1.25, which is equivalent to the final value of the bread. In
many industries, the primary component of value-added is the wage and salary payments to
employees.
• The third gauge of economic activity used in this evaluation is Personal Income. As the name
implies, Personal Income is simply the income received by individuals, whether in the form of
wages, salaries, interest, dividends, proprietors’ profits, or other sources. It may thus be viewed
as the segment of overall impacts which flows directly to the citizenry.
• The fourth measure, Retail Sales, represents the component of Total Expenditures which occurs
in retail outlets (general merchandise stores, automobile dealers and service stations, building
materials stores, food stores, drugstores, restaurants, and so forth). Retail Sales is a commonly
used measure of consumer activity.
• The final aggregates used are Permanent Jobs and Person-Years of Employment. The Person-
Years of Employment measure reveals the full-time equivalent jobs generated by an activity. It
should be noted that, unlike the dollar values described above, Permanent Jobs is a “stock”
rather than a “flow.” In other words, if an area produces $1 million in output in 2010 and $1
million in 2011, it is appropriate to say that $2 million was achieved in the 2010-2011 period. If
the same area has 100 people working in 2010 and 100 in 2011, it only has 100 Permanent Jobs.
When a flow of jobs is measured, such as in a construction project or a cumulative assessment
over multiple years, it is appropriate to measure employment in Person-Years (a person working
for a year). This concept is distinct from Permanent Jobs, which anticipates that the relevant
positions will be maintained on a continuing basis.
• Because any expenditure of State funds is an economic stimulus, The Perryman Group also
calculated these economic benefits on a “net” basis by adjusting for the diversion of State funds
that would have otherwise been spent for various other goods or services.

Current and Potential Economic Benefits of Legal Aid Services in Texas: 2013 Update
17 | P a g e w w w . p e r r y m a n g r o u p . c o m C o p y r i g h t 2 0 1 3
Detailed Sectoral Results

Current and Potential Economic Benefits of Legal Aid Services in Texas: 2013 Update
18 | P a g e w w w . p e r r y m a n g r o u p . c o m C o p y r i g h t 2 0 1 3
Total Gross Personal Employment
Expenditures Product Income (Permanent
Category (2012 Dollars) (2012 Dollars) (2012 Dollars) Jobs)
Agricultural Products & Services $13,355,681 $3,631,319 $2,473,131 40
Forestry & Fishery Products $337,277 $353,704 $131,183 2
Coal Mining $1,804,907 $521,322 $549,350 4
Crude Petroleum & Natural Gas $9,662,865 $2,110,796 $973,497 5
Miscellaneous Mining $232,471 $99,913 $58,733 1
New Construction $0 $0 $0 0
Maintenance & Repair Construction $17,462,442 $8,948,809 $7,374,375 104
Food Products & Tobacco $27,308,894 $7,024,325 $3,588,361 60
Textile Mill Products $359,083 $81,886 $69,284 2
Apparel $4,978,266 $2,752,688 $1,394,829 38
Paper & Allied Products $4,306,877 $1,905,930 $861,657 13
Printing & Publishing $6,062,195 $3,069,629 $2,003,616 34
Chemicals & Petroleum Refining $22,653,485 $3,430,397 $1,610,771 12
Rubber & Leather Products $3,290,474 $1,414,980 $827,191 16
Lumber Products & Furniture $1,360,011 $477,021 $340,091 7
Stone, Clay, & Glass Products $1,766,572 $979,094 $512,070 8
Primary Metal $1,422,612 $393,582 $292,963 4
Fabricated Metal Products $3,598,560 $1,292,167 $834,225 14
Machinery, Except Electrical $2,224,130 $891,544 $636,923 7
Electric & Electronic Equipment $2,156,252 $1,135,389 $678,775 6
Motor Vehicles & Equipment $1,735,975 $390,855 $253,925 4
Transp. Equip., Exc. Motor Vehicles $754,390 $322,923 $211,018 3
Instruments & Related Products $607,029 $248,935 $189,212 2
Miscellaneous Manufacturing $1,392,015 $549,183 $378,777 6
Transportation $20,430,762 $14,044,696 $9,288,660 128
Communication $21,306,487 $13,164,773 $5,620,464 50
Electric, Gas, Water, Sanitary Services $51,891,083 $11,648,448 $5,083,073 22
Wholesale Trade $21,931,452 $14,841,053 $8,557,483 96
Retail Trade $135,850,922 $112,571,298 $67,314,037 1,765
Finance $9,241,181 $4,880,726 $2,842,060 25
Insurance $12,694,843 $7,598,218 $4,542,514 55
Real Estate $126,713,491 $12,446,334 $2,005,374 18
Hotels, Lodging Places, Amusements $10,780,910 $5,678,315 $3,725,171 91
Personal Services $30,054,941 $18,694,232 $14,544,415 245
Business Services $28,345,695 $16,685,833 $13,611,364 166
Eating & Drinking Places $58,943,305 $34,519,662 $18,366,303 830
Health Services $37,635,763 $26,675,411 $22,554,307 372
Miscellaneous Services $26,914,641 $10,530,818 $9,129,342 218
Households $857,647 $857,647 $839,500 58
Total $722,425,586 $346,863,855 $214,268,025 4,528
SOURCE: US Multi-Regional Impact Assessment System, The Perryman Group
The Annual Impact of Current Civil Legal Aid and Related Programson Business Activity in Texas
Detailed Industrial Category

Current and Potential Economic Benefits of Legal Aid Services in Texas: 2013 Update
19 | P a g e w w w . p e r r y m a n g r o u p . c o m C o p y r i g h t 2 0 1 3
Total Gross Personal Employment
Expenditures Product Income (Permanent
Category (2012 Dollars) (2012 Dollars) (2012 Dollars) Jobs)
Agricultural Products & Services $5,760,873 $1,566,342 $1,066,767 17
Forestry & Fishery Products $145,482 $152,568 $56,585 1
Coal Mining $778,533 $224,868 $236,958 2
Crude Petroleum & Natural Gas $4,168,004 $910,476 $419,911 2
Miscellaneous Mining $100,275 $43,097 $25,334 0
New Construction $0 $0 $0 0
Maintenance & Repair Construction $7,532,294 $3,860,001 $3,180,882 45
Food Products & Tobacco $11,779,487 $3,029,890 $1,547,813 26
Textile Mill Products $154,888 $35,321 $29,885 1
Apparel $2,147,338 $1,187,351 $601,649 16
Paper & Allied Products $1,857,739 $822,109 $371,669 6
Printing & Publishing $2,614,882 $1,324,061 $864,245 15
Chemicals & Petroleum Refining $9,771,411 $1,479,676 $694,794 5
Rubber & Leather Products $1,419,321 $610,341 $356,802 7
Lumber Products & Furniture $586,630 $205,760 $146,696 3
Stone, Clay, & Glass Products $761,998 $422,325 $220,878 4
Primary Metal $613,633 $169,769 $126,368 2
Fabricated Metal Products $1,552,212 $557,367 $359,836 6
Machinery, Except Electrical $959,362 $384,561 $274,732 3
Electric & Electronic Equipment $930,083 $489,742 $292,784 2
Motor Vehicles & Equipment $748,800 $168,592 $109,529 2
Transp. Equip., Exc. Motor Vehicles $325,400 $139,291 $91,021 1
Instruments & Related Products $261,837 $107,376 $81,615 1
Miscellaneous Manufacturing $600,435 $236,886 $163,383 3
Transportation $8,812,656 $6,058,074 $4,006,594 55
Communication $9,190,393 $5,678,526 $2,424,345 21
Electric, Gas, Water, Sanitary Services $22,382,829 $5,024,471 $2,192,545 9
Wholesale Trade $9,459,967 $6,401,577 $3,691,206 41
Retail Trade $58,598,276 $48,556,785 $29,035,405 761
Finance $3,986,114 $2,105,264 $1,225,901 11
Insurance $5,475,825 $3,277,434 $1,959,379 24
Real Estate $54,656,914 $5,368,633 $865,003 8
Hotels, Lodging Places, Amusements $4,650,265 $2,449,298 $1,606,824 39
Personal Services $12,963,973 $8,063,617 $6,273,624 106
Business Services $12,226,703 $7,197,309 $5,871,160 71
Eating & Drinking Places $25,424,752 $14,889,797 $7,922,167 358
Health Services $16,233,904 $11,506,238 $9,728,631 161
Miscellaneous Services $11,609,429 $4,542,389 $3,937,873 94
Households $369,940 $369,940 $362,112 25
Total $311,612,856 $149,617,121 $92,422,905 1,953
SOURCE: US Multi-Regional Impact Assessment System, The Perryman Group
The Incremental Annual Impact of Additional Civil Legal Aid and RelatedPrograms on Business Activity in Texas With Funding Sufficient to Increase the State
Percentage of Resources to be Equivalent to the Proportion of Indigent ResidentsDetailed Industrial Category
Related Documents