MOES/IMD/RSMC-Tropical Cyclone Report/01(2022)/12 SATELLITE AND RADAR IMAGERY OF EXTREMELY SEVERE CYCLONIC STORM, "TAUKTAE" Government of India Ministry of Earth Sciences World Meteorological Organisation India Meteorological Department REPORT ON CYCLONIC DISTURBANCES OVER NORTH INDIAN OCEAN DURING 2021 RSMC-TROPICAL CYCLONES, NEW DELHI 16 th May/0630 UTC Extremely Severe Cyclonic Storm ‘TAUKTAE’ 17 th May/1100 IST

Welcome message from author
This document is posted to help you gain knowledge. Please leave a comment to let me know what you think about it! Share it to your friends and learn new things together.
Transcript

MOES/IMD/RSMC-Tropical Cyclone Report/01(2022)/12
SATELLITE AND RADAR IMAGERY OF EXTREMELY SEVERE CYCLONIC STORM, "TAUKTAE"
Government of India Ministry of Earth Sciences
World Meteorological Organisation India Meteorological Department
REPORT ON CYCLONIC DISTURBANCES OVER NORTH INDIAN OCEAN
DURING 2021
RSMC-TROPICAL CYCLONES, NEW DELHI
16th May/0630 UTC Extremely Severe Cyclonic Storm
‘TAUKTAE’ 17th May/1100 IST

i
INDIA METEOROLOGICAL DEPARTMENT
RSMC- TROPICAL CYCLONES, NEW DELHI
INDIA METEOROLOGICAL DEPARTMENT
WMO

ii
DOCUMENT CONTROL SHEET Ministry of Earth Sciences (MoES)
Earth System Science Organisation
1. ESSO Report
Number No. MOES/IMD/RSMC-Tropical Cyclone Report/01(2022)/12
2. Title of The Report Report on cyclonic disturbances over the north Indian Ocean during 2021
3. Authors RSMC-Tropical Cyclones, New Delhi
4. Originating Unit RSMC-Tropical Cyclones, New Delhi
5. Type of Document Technical Report
6. No. of Pages and figures
345/256
7. No. of references 0
8. Key words Cyclogenesis, intensity, track, landfall, NWP model, forecast verification
9. Security classification
Open
10. Distribution Open
11. Funding Agency India Meteorological Department
12. Abstract The activities of Regional Specialised Meteorological Centre (RSMC) – Tropical Cyclone New Delhi are briefly presented alongwith the current state of art for monitoring and prediction of cyclonic disturbances over the north Indian Ocean. This report further describes the characteristics of cyclonic disturbances formed over the north Indian Ocean during 2021. The special emphasis has been given on the features associated with genesis, intensification, movement, landfall and associated adverse weather like heavy rain, strong wind and storm surge. The performance of the forecasts issued by RSMC, New Delhi with respect to tropical cyclones are verified and discussed. Also the performance of various dynamical and statistical models for cyclone forecasting has been evaluated and discussed.

iii
CONTENTS
Page No INTRODUCTION 1 CHAPTER- I 2 ACTIVITIES OF REGIONAL SPECIALISED METEOROLOGICAL CENTRE, NEW DELHI
CHAPTER –II 24 CYCLONIC ACTIVITIES OVER NORTH INDIAN OCEAN DURING 2021
CHAPTER – III 228 PERFORMANCE OF STATISTICAL AND DYNAMICAL NWP MODELS DURING 2021
CHAPTER – IV 282 PERFORMANCE OF TRACK AND INTENSITY PREDICTION OF CYCLONES BY IMD DURING 2021
ACKNOWLEDGEMENT 340
1
INTRODUCTION
Regional Specialized Meteorological Centre (RSMC) - Tropical Cyclones, New Delhi,
which is co-located with Cyclone Warning Division has the responsibility of issuing Tropical
Weather Outlook and Tropical Cyclone Advisories for the benefit of the countries in the World
Meteorological Organization (WMO)/ Economic and Social Co-operation for Asia and the Pacific
(ESCAP) Panel region bordering the Bay of Bengal and the Arabian Sea, namely, Bangladesh,
India, Iran, Maldives, Myanmar, Pakistan, Qatar, Sultanate of Oman, Sri Lanka, Thailand,
United Arab Emirates, Saudi Arabia and Yemen. It has also the responsibilities as a Tropical
Cyclone Advisory Centre (TCAC) to provide Tropical Cyclone Advisories to the designated
International Airports as per requirement of International Civil Aviation Organization (ICAO).
The broad functions of RSMC- Tropical Cyclones, New Delhi are as follows:
Round the clock watch on weather situations over the entire north Indian Ocean.
Analysis and processing of global meteorological data for diagnostic and prediction
purposes.
Detection, tracking and prediction of cyclonic disturbances in the Bay of Bengal and the
Arabian Sea.
Running of numerical weather prediction models for tropical cyclone track and storm
surge predictions.
Interaction with National Disaster Management Authority and National Disaster
Management, Ministry of Home Affairs, Govt. of India to provide timely information and
warnings for emergency support services. RSMC-New Delhi also coordinates with
National Institute of Disaster Management (NIDM) for sharing the information related to
cyclone warning.
Implementation of the Regional Cyclone Operational Plan of WMO/ESCAP Panel.
Issue of Tropical Weather Outlook and Tropical Cyclone Advisories to the Panel
countries in general.
Issue of Tropical Cyclone advisories to International airports in the neighbouring
countries for International aviation.
Collection, processing and archival of all data pertaining to cyclonic disturbances viz.
wind, storm surge, pressure, rainfall, damage report, satellite and Radar derived
information etc. and their exchange with Panel member countries.
Preparation of comprehensive annual reports on cyclonic disturbances formed over
North Indian Ocean every year.
Preparation of annual review report on various activities including meteorological,
hydrological and disaster preparedness and prevention activities of panel member
countries.
Research on storm surge, track and intensity prediction techniques.
Organisation of annual training on tropical cyclone monitoring and prediction as well as
associated severe weather forecasting and warning services for WMO/ESCAP Panel
countries.

2
CHAPTER- I
ACTIVITIES OF REGIONAL SPECIALIZED METEOROLOGICAL CENTER – TROPICAL
CYCLONES, NEW DELHI
1.1 Area of Responsibility
The area of responsibility of RSMC- New Delhi covers Sea areas of north Indian
Ocean north of equator between 400E and 1000E and includes the member countries of
WMO/ESCAP Panel on Tropical Cyclones viz, Bangladesh, India, Iran, Maldives, Myanmar,
Oman, Pakistan, Saudi Arabia, Sri Lanka, Qatar, Thailand, United Arab Emirates and
Yemen as shown in Fig. 1.1.
Fig. 1.1 Area of responsibility of RSMC- Tropical Cyclone, New Delhi
1.2 Naming of tropical cyclones over north Indian Ocean:
The WMO/ESCAP Panel on Tropical Cyclones at its twenty-seventh Session held in
2000 in Muscat, Sultanate of Oman agreed in principle to assign names to the tropical
cyclones in the Bay of Bengal and Arabian Sea. After long deliberations among the member
countries, the naming of the tropical cyclones over north Indian Ocean commenced from
September 2004, by RSMC New Delhi. The first name was ‗ONIL‘ which developed over the
Arabian Sea (30 September to 03 October, 2004). According to approved principle, a list of
64 names in eight columns has been prepared. The name has been contributed by Panel
members. The RSMC tropical cyclones New Delhi gives a tropical cyclone an identification
name from this name list. The Panel member‘s name is listed alphabetically country wise in
each column. The names are used sequentially column wise. The first name starts from the
first row of column one and continues sequentially to the last row in column eight. The
names are not rotated every few years unlike that over Atlantic and Eastern Pacific lists. All
the names in the first list effective from September 2004 have been used. The second list in
the series was released in April, 2020 with representation from all the 13 WMO member
3
(b)
countries having a total of 169 names. The same is available on RSMC website at
http://www.rsmcnewdelhi.imd.gov.in/images/pdf/cyclone-awareness/tc-names/tc-names.pdf.
1.3 Observational System
A brief description of different types of observational network of India Meteorological
Department (IMD) and observations collected from networks are given below.
1.3.1 Surface Observatories
IMD has a good network of surface observatories satisfying the requirement of World
Meteorological Organization. There are 560 surface observatories in IMD. The data from
these stations are used on real time basis for operational forecasting. Recently a number of
moored ocean buoys including Meteorological Buoy (MB), Shallow Water (SW), Deep Sea
(DS) and Ocean Thermal (OT) buoys have been deployed over the Indian Sea, under the
National Data Buoy Programme (NDBP) of the Ministry of Earth Sciences, Government of
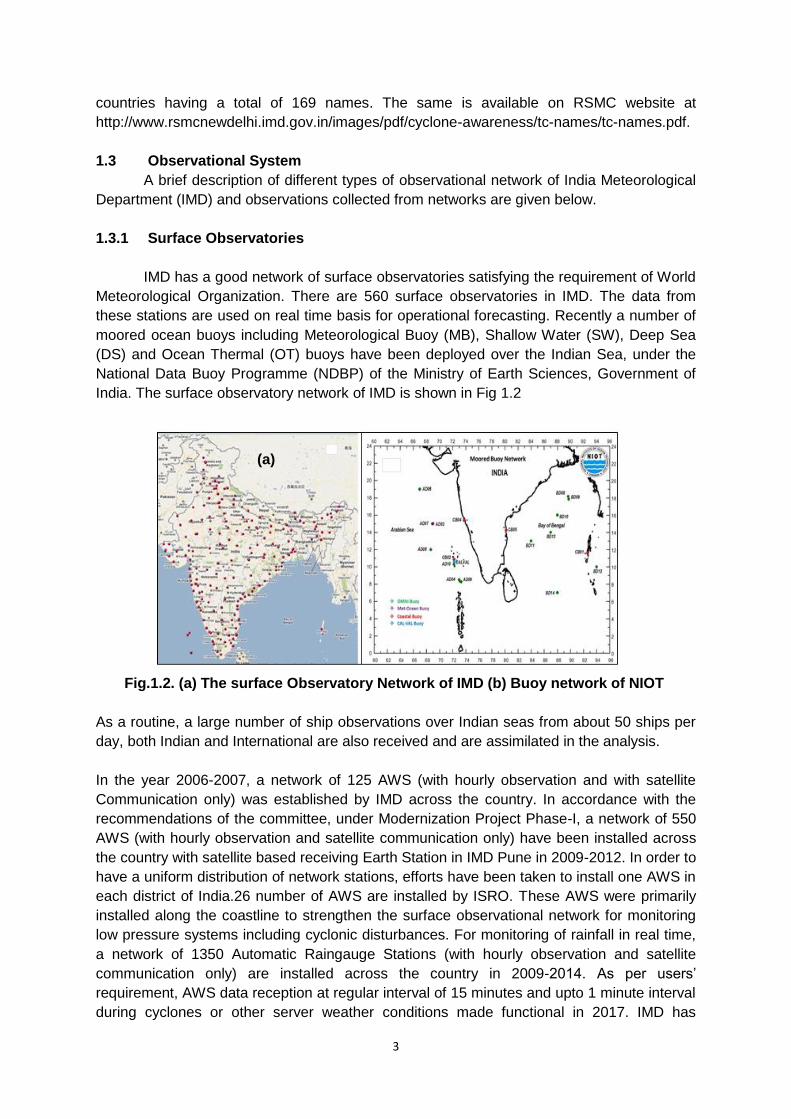
India. The surface observatory network of IMD is shown in Fig 1.2
Fig.1.2. (a) The surface Observatory Network of IMD (b) Buoy network of NIOT
As a routine, a large number of ship observations over Indian seas from about 50 ships per
day, both Indian and International are also received and are assimilated in the analysis.
In the year 2006-2007, a network of 125 AWS (with hourly observation and with satellite
Communication only) was established by IMD across the country. In accordance with the
recommendations of the committee, under Modernization Project Phase-I, a network of 550
AWS (with hourly observation and satellite communication only) have been installed across
the country with satellite based receiving Earth Station in IMD Pune in 2009-2012. In order to
have a uniform distribution of network stations, efforts have been taken to install one AWS in
each district of India.26 number of AWS are installed by ISRO. These AWS were primarily
installed along the coastline to strengthen the surface observational network for monitoring
low pressure systems including cyclonic disturbances. For monitoring of rainfall in real time,
a network of 1350 Automatic Raingauge Stations (with hourly observation and satellite
communication only) are installed across the country in 2009-2014. As per users‘
requirement, AWS data reception at regular interval of 15 minutes and upto 1 minute interval
during cyclones or other server weather conditions made functional in 2017. IMD has
(a)

4
upgraded the 300 data acquisition system with dual communication (GPRS and Satellite). In
2018, IMD in-house developed web portal for AWS/Agro AWS/ ARG stations for live
monitoring status and retrieval of data in real time. The purpose of this was to catch all the
impacts (extreme rains, gusty winds, drop in surface pressure and temperatures etc) of the
cyclones over coast and over land after its landfall. Web portal is further upgraded the web
portal with state map-based monitoring system in 2019-20.
To strengthen the observations especially during the severe weather,15 number of additional
AWS (GPRS based) with tiltable 10 Mast (New technology) and capable of generating
maximum wind data (taking one second sample) are installed Kerala and 19 AWS (GPRS)
are installed in Rajasthan for Indian Railway network. It was further augmented last year with
200 Agro AWS in the country last year having all essential met parameters with soil moisture
measurements at multiple levels.
A fairly dense network of 925 AWS as shown in Fig. 1.3 is now available for operational
utilization. In addition to AWS, a network of 1383 Automatic Rain Gauge (ARG) Stations has
been established in different states. Recently different state government AWS/ARG data is
also integrated with IMD Server for optimum utilisation of AWS data. The recent imitative to
strengthen further the observational network in Ladakh will very helpful.
Fig. 1.3 (a) Network of 913 AWS and (b) 1383 ARGs.
As a part of addressing the Impact of severe weathers over Megacities in the country; Meso
scale observational networks of AWS/ARG are established in Mumbai and Pune for location
specific real-time weather updates on web and on Mobile App recently. This was done jointly
with local state government authorities. Further more cities will be taken up in coming time.
In addition, 34 Nos. of High Wind speed recorders are installed for continuous monitoring of
High wind speed and Station Level Pressure along East & West coast of India during
cyclone and severe weather. The HWSR system have wind sampling capacity (every
second data sample) using state-of-the-art Ultrasonic wind sensor and data is made
available in real time to users. Some HWSR are also planned in the interior of country
specifically monitoring Gusty wind during severe Thunderstorm.
(a) (b)
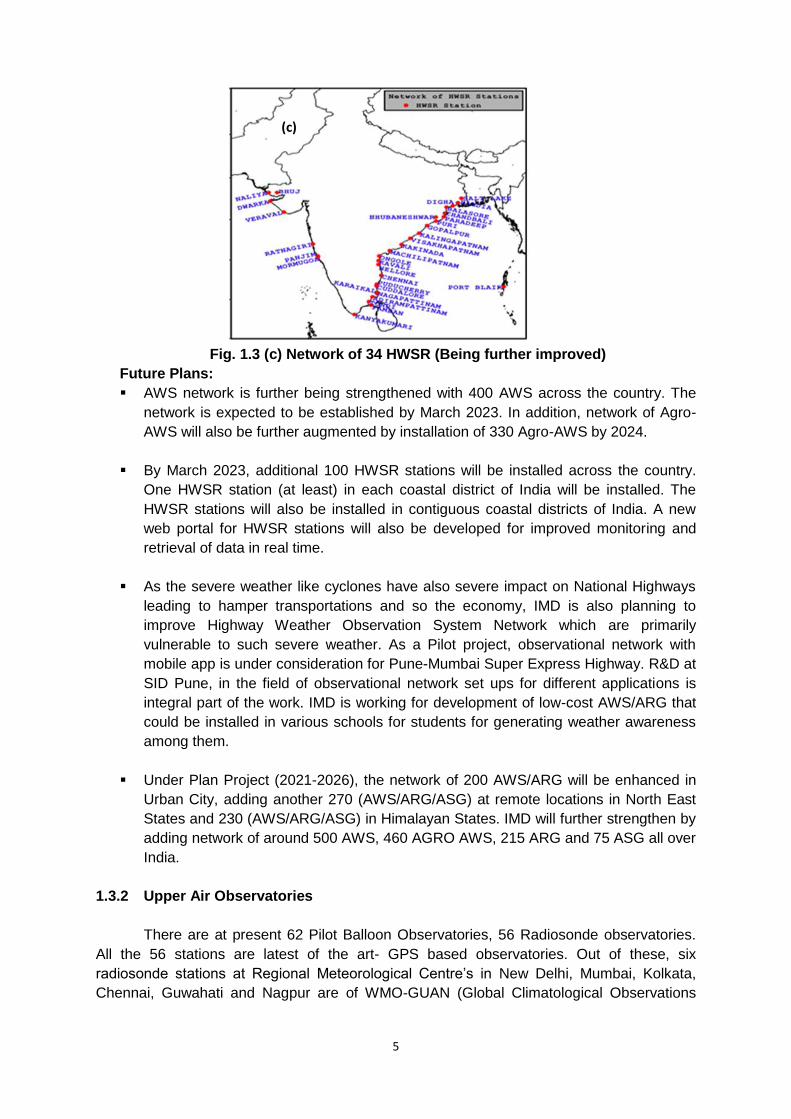
5
Fig. 1.3 (c) Network of 34 HWSR (Being further improved)
Future Plans:
AWS network is further being strengthened with 400 AWS across the country. The
network is expected to be established by March 2023. In addition, network of Agro-
AWS will also be further augmented by installation of 330 Agro-AWS by 2024.
By March 2023, additional 100 HWSR stations will be installed across the country.
One HWSR station (at least) in each coastal district of India will be installed. The
HWSR stations will also be installed in contiguous coastal districts of India. A new
web portal for HWSR stations will also be developed for improved monitoring and
retrieval of data in real time.
As the severe weather like cyclones have also severe impact on National Highways
leading to hamper transportations and so the economy, IMD is also planning to
improve Highway Weather Observation System Network which are primarily
vulnerable to such severe weather. As a Pilot project, observational network with
mobile app is under consideration for Pune-Mumbai Super Express Highway. R&D at
SID Pune, in the field of observational network set ups for different applications is
integral part of the work. IMD is working for development of low-cost AWS/ARG that
could be installed in various schools for students for generating weather awareness
among them.
Under Plan Project (2021-2026), the network of 200 AWS/ARG will be enhanced in
Urban City, adding another 270 (AWS/ARG/ASG) at remote locations in North East
States and 230 (AWS/ARG/ASG) in Himalayan States. IMD will further strengthen by
adding network of around 500 AWS, 460 AGRO AWS, 215 ARG and 75 ASG all over
India.
1.3.2 Upper Air Observatories
There are at present 62 Pilot Balloon Observatories, 56 Radiosonde observatories.
All the 56 stations are latest of the art- GPS based observatories. Out of these, six
radiosonde stations at Regional Meteorological Centre‘s in New Delhi, Mumbai, Kolkata,
Chennai, Guwahati and Nagpur are of WMO-GUAN (Global Climatological Observations
(c)

6
System Upper Air Network) standards. These have been included into GUAN. The pilot
balloon observation and radiosonde observatory betwork of IMD is shown in Fig 1.4
Fig.1.4 (a) Network of Pilot Balloon Observatories (PBO) and (b) Network of
Radiosonde/ Radio wind observatories
To monitor the daily ascent status and the stock of various consumables the
observatory performance monitoring system has been started on the intra IMD portal,
https://ddgmui.imd.gov.in. The upper air meteorological data collected all over the country
are used for operational forecasting. The PBOs at Jammu, Jaipur, Jodhpur, Dehradun have
been upgraded with GPS based PBO.
1.3.3 Radars
1.3.3.1 Current status
Weather radar network of India consists of 33 Doppler weather radars (DWRs)
including radars of ISRO, presently spreading across the country. It includes two sites with
C-band Polarimetric DWRs five in X-band. Indigenously manufactured S-band polarimetric
DWRs have been installed at Mumbai, Bhuj, Kochi and Gopalpur. IMD utilizes the DWRs
installed by ISRO at Thiruvananthapuram, Cherrapunji and Sriharikota.
Fig. 1.5 Network of Radar
(a) (b)

7
S-band DWRs are installed at Agartala, Bhopal, Chennai, Hyderabad, Kolkata,
Lucknow, Machilipatnam, Mohanbari, Goa, Karaikal, Paradeep, Nagpur, New Delhi (Palam),
Patna, Patiala, Gopalpur, Kochi, Mumbai, Bhuj, Sriharikota and Visakhapatnam. C-band
Polarimetric DWRs are installed at Jaipur and New Delhi. X-band DWRs have been installed
at Srinagar, Jammu, Kufri, Mukteshwar, Leh and New Delhi.
Radars of IMD are being used for detection of rainfall, hail storm, thunderstorms and
for tracking of cyclonic storms. Various meteorological and hydrological products derived
from radra data using software algorithms are extremely useful to the forecasters for
estimating the storm‘s center, direction of movement, structure and intensity. The existing
radars have also been networked to provide near real time data to super computers for
ingesting into numerical weather prediction (NWP) models for short range forecasting.
Composite images are also being generated centrally. Data is also converted to scientific
formats such as NetCDF, HDF5, and Opera BUFR for assimilation in NWP models. A
national Radar data centre has been established at IMD, New Delhi for archival and retrieval
of radar data. Radar data products are also provided to various users. Open source GIS
platforms are used to display the radar data on the web pages. UAI division has now
combined radar data with lightning data and satellite imagery for a unified display on the
website using GIS platform. This now provides accurate positional information of the location
of the storm cells.
Fig. 1.6: Integrated display using RADAR, Lightning and Satellite data
Location specific information of lightning is also being generated in the radar data
center and is available in the web page. A unique audio alter system announces the location
and number of lightning occurrences district wise which alerts the forecaster and other end
users to severe weather events.

8
1.3.3.2 Future Plan:
The Radar division is involved in implementation of modernization of Radar Network
by replacing old conventional Radars with state of art DWRs. IMD has a plan to induct more
than 55 DWRs in its network in the phased manner to bring entire Country and coasts under
radar coverage. It is proposed to install 10 X-band radars in the northwest India in the States
of Jammu & Kashmir, Union territory of Ladakh, Himachal Pradesh & Uttrakhand (four
DWRs are already installed), 11 C-band radars in the plains of the country and 8 X-band
radars in the northeastern states. The network of proposed radars is presented in Fig. 1.7.
For improved efficient management, there are also plans, to establish a Weather
Radar Operation Center, which would be responsible for weather radar related activities of
the department. It will manage radar network, archival, dissemination of data, development
of algorithms, network planning and related R&D.
Fig. 1.7: Proposed (a) C band Doppler weather radars, (b) Radar network in Central &
Western Himalayas and (c) Proposed Radar network in North East India
(a)
(c)
(b)
(c)

9
1.3.4 Satellite Monitoring
Multi Mission Meteorological Data Receiving and Processing System (MMDRPS) is
being used on an operational basis to receive and process meteorological data from
INSAT-3D and INSAT3-DR satellites on round the clock basis in Satellite Meteorological
Division. MMDRPS systems consist of advance & latest state of art servers capable
to process the complete set of data within 7 minutes after completion of scanning along
with the storage capacity of order 2.0/2.0PB (Main/ Mirror) & 324TB SSD which will
facilitate online sharing of processed data for all Indian meteorological satellites to the
registered users as per IMD data policy through Web based secured satellite Data
Supply System.
From MMDRPS, at present IMD is receiving and processing meteorological data from
two Indian satellites namely INSAT-3D & INSAT-3DR. INSAT-3D launched on 26 July
2013 is positioned at 82°E and INSAT 3DR launched on 8th Sep 2016 is located at 74°E.
INSAT-3D and INSAT-3DR have an advanced imager with six imagery channels {Visible
(0.55-0.75 µm), Short wave Infra-Red (SWIR) (1.55-1.70 µm), Medium Infra-Red (MIR)
(3.80-4.00 µm), Thermal Infra-Red-1(TIR-1) (10.2-11.3 µm), TIR-2 (11.5-12.5 µm), & WV
(6.50-7.10 µm)} and a nineteen channel sounder (18 IR & 1 Visible) for derivation of
atmospheric temperature and moisture profiles. It provides 1 km. resolution imagery in
visible band, 4 km resolution in IR band and 8 km in WV channel.
Imager payload of these satellites (INSAT3D/R) are operated in a staggered mode to get
images every 15 minutes. Sounder payload of INSAT 3D and INSAT 3DR satellite is
operated in an integrated mode so that every hourly data of Indian land region and every
one and half hour hourly data of Indian ocean region is obtained for generating multi-
level imageries and vertical profiles of humidity and temperature. Cloud Imagery and
derived products data are disseminated to forecasting offices of the IMD as well as to the
other users in India and foreign countries through dedicated web pages and online
analysis and visualization tool (RAPID). All the received and processed data from the
satellite are archived on a dedicated storage of MMRDPS
The following products derived from the satellite are useful for monitoring of tropical
cyclones
Enhanced grey scale imagery of cyclone.
Enhanced coloured imagery of cyclone.
Outgoing Long wave Radiation (OLR) at pixel resolution
The following Quantitative Precipitation Estimation (QPE)
GPI three hourly accumulated at 1x1 degree resolution,
Hydro estimator (HE) at pixel level
INSAT-Multi spectral Rainfall (IMR)at 0.1x0.1-degree resolution
Improved IMR at pixel level.
Sea Surface Temperature (SST) at pixel resolution
Upper Tropospheric Humidity (UTH) at pixel resolution
Cloud Motion Vector (CMV)
Water Vapour Wind (WVW)
Vis/MIR wind

10
Wind derived products such as: Lower level Vorticity, Upper level Divergence,
Lower level convergence, Vertical wind shear & Wind shear tendency
Temperature, Humidity profile
Value added parameters from sounder products
Geo-potential Height
Layer Precipitable Water
Total Precipitable Water
Lifted Index
Dry Microburst Index
Maximum Vertical Theta-E Differential
Wind Index
Ozone
At present Dvorak technique is used but manually applied. Recently efforts have been
made for automation of this technique. Automated Dvorak technique version (8.2.1) is
running in experimental mode at Satellite Application Unit, Satellite Meteorology Division.
Satellite Application Unit is also using Microwave imageries operationally from NOAA,
Metop‘s DMSP satellites for locating the tropical systems. Satellite Application Unit
issues three hourly bulletins in general and hourly and half hourly bulletins in case of
tropical cyclones and other severe weather events. Calibration coefficient of Visible &
SWIR channels using field campaign results of INSAT-3D & 3DR satellites has been
updated in MMDRPS operational chain (in 2021) after great persuasion with SAC team
for good quality of data. Typical MMDRPS and INSAT 3D/R data products are presented
in Fig. 1.8.
Fig. 1.8: MMDRPS and INSAT-3D/R data products

11
Real-time Analysis of Product and Information Dissemination (RAPID) is a visualization
tool developed jointly by IMD & ISRO for monitoring and analysis of satellite imageries
and products of INSAT 3D and INSAT 3D(R). A satellite based nowcast tool for its
prediction is also available in RAPID. As RAPID is a geo-reference platform, it provides
real time information on genesis, growth and decay along with its location and other geo-
physical parameters to help forecasters to provide more objective nowcast. This tool is
available in IMD website at the link: http://www.rapid.imd.gov.in/
With the Web Archival System developed at IMD, INSAT-3D and INSAT 3DR products &
imageries are archived. Spectral Band images and product images are archived online for
last 6 months. The generation of around ten new products has been put in operational chain
of MMDRPS to meet the NWP, Forecaster and Agromet services requirement.
INSAT-3DR Imager payload is used to conduct rapid scans during active cyclones following
a standard operating procedure. Each Rapid scan cover up 3 degree in N-S direction (6
Blocks/240 scan lines) in 4.5 minutes. Rapid scan data are being used to track these
cyclones in real time basis. The processed data is being disseminated on a dedicated
webpage (http://satellite.imd.gov.in/rapid/rapid_scan.htm ).
1.3.5. Lightning monitoring:
The occurrence of lightning in India is being monitored with the help of lightning detectors
established by Ministry of Earth Sciences and Indian Air Force. Currently, there are 203 No.
of lightning detectors in the country (46 Indian Institute of Tropical Meteorology and 157
Indian Air Force). The area of lightning during preceding 10 min., 20 min. and 30 min. are
superimposed with satellite and radar imageries. It help in proper monitoring of thunderstorm
and lightning activities and nowcasting of such events.
1.4 Analysis and Prediction
1.4.1 Analysis and Prediction system
Various strategies have been adopted in recent years for improvement of analysis
and prediction of cyclone. The tropical cyclone analysis, prediction and decision-making
process is made by blending scientifically based conceptual models, dynamical & statistical
models, meteorological datasets, technology and expertise. Conventional observational
network, automatic weather stations (AWS), buoy & ship observations, cyclone detection
radars and satellites are used for this purpose. A new weather analysis and forecasting
system in a digital environment is used to plot and analyse different weather parameters,
satellite, Radar and Numerical Weather Prediction (NWP) model products. An integrated
fully automated forecasting environment facility is thus set up for this purpose.
The manual synoptic weather forecasting has been replaced by hybrid systems in
which synoptic method could be overlaid on NWP models supported by modern graphical
and GIS applications to produce
high quality analyses
Ensemble of forecasts from NWP models at different scales - global, regional and
mesoscale
Prediction of intensity and track of tropical cyclone
A schematic representation of the monitoring and analysis, forecast and warning
procedure is given in Fig.1.9.

12
Fig.1.9. Strategy adopted for cyclone analysis and forecasting
The Tropical Cyclone Module installed in this forecasting system has the following
facilities.
Analysis of all synoptic, satellite and NWP model products for genesis, intensity and
track monitoring and prediction
Preparation of past and forecast tracks upto 120 hrs
Depiction of uncertainty in track forecast
Preparation of quadrant wind radii forecast upto 120 hrs.
All the available data and products from various national and international sources are
systematically considered for analysis and prediction of cyclones. Various data and products
utilized for this purpose are as follows.
Data and analysis Products through digitized system as mentioned above.
Radar data and products from IMD‘s radar network and neighbouring countries
Satellite imageries and products from IMD and international Centers
Dynamical and statistical Model products from various national and international
Centers.
Data, analysis and forecast products from various national and international Centers
through internet.
Cloud imageries from Geostationary Meteorological Satellites INSAT-3A, INSAT-3D and
INSAT-3D (R) are the main sources of information for the analysis of tropical cyclones over
the data-sparse region of north Indian Ocean. Data from scatteometry based satellites and
Ocean buoys also provide vital information. Ship observations are also used critically during
the cyclonic disturbance period. When the system comes closer to the coastline, the system
location and intensity are determined based on hourly observations from Radar as well as
from coastal observatories. The AWS stations along coast are also very useful as they
provide hourly observations on real time basis. The WVW and CMV in addition to the
conventional wind vectors observed by Radio Wind (RW) instruments are very useful for
monitoring and prediction of cyclonic disturbance, especially over the Sea region. The
direction and speed of the movement of a tropical cyclone are determined primarily from the

13
three hourly displacement vectors of the center of the cyclone. The consensus forecast that
gather all or part of the numerical forecast and used synoptic and statistical guidance are
utilised for issue of official forecast.
1.5. NWP Models in operational use during the year 2020
1.5.1. Global Forecast System
The Global Forecast System (GFS), adopted from National Centre for Environmental
Prediction (NCEP) was implemented at India Meteorological Department (IMD), New Delhi
on IBM based High Power Computing Systems (HPCS) at T1534 (~ 12 km in horizontal over
the tropics) with ENKF based Grid point Statistical Interpolation (GSI) scheme as the global
data assimilation for the forecast up to 10 days. The model is run four times in a day (00,
06, 12 and 18 UTC). 00 & 12 UTC runs are available for next 10 days forecast period. 06 &
18 UTC runs are available for 3 days forecast period. The real-time outputs are made
available to the national web site of IMD
(http://www.imd.gov.in/section/nhac/dynamic/nwp/welcome.htm).
1.5.2. Regional Forecast System
IMD operationally runs three regional models WRFDA-WRFARW (v3.9.1), and HWRF for
short-range prediction during cyclone condition.
1.5.2.1. Non-hydrostatic mesoscale modeling system WRFDA-WRF-ARW
The mesoscale forecast system Weather Research and Forecast WRFDA (version 3.9.1)
with 3DVAR data assimilation is being operated daily twice to generate mesoscale analysis
at 9 km horizontal resolution using IMD GFS-T574L64 analysis as first guess and forecasts
as boundary condition. Using analysis and updated boundary conditions from the WRFDA,
the WRF (ARW) is run for the forecast up to 3 days with 3 km and 45 Eta levels in the
vertical 4 times a day at 06 hourly interval..
The model domain covers the area between lat. 5ºS to 40ºN long 50ºE to 102ºE
covering India and neighbouring south Asian countries. The model runs with its own regional
data assimilation (Com GSI V3.7_EnKF1.3). The performance of the model is found to be
reasonably skilful for cyclone genesis and track prediction.
1.5.2.2. Hurricane WRF Model (HWRF)
Since 2011, time to time the HWRF modelling system is developed and customized atmospheric and ocean models with other associated pre-processing and post-processing components are implemented in IMD under the framework of MoU between MoES and NOAA. The HWRF version H217 has been ported on the MHIR HPCS with horizontal resolution of 18 km for parent domain and 6km & 2 km for intermediate and innermost nested domains following the center of cyclonic storm. The model is running with 61 vertical levels with parent domain, intermediate and innermost domain covering area of 80ox80o, 24ox24o and 7ox7o respectively. The special feature modified for tropical cyclone forecasting includes vortex initialization and correction, GSI based regional data assimilation, coupler for two-way coupling between atmosphere and ocean components and fine-tuned physical parameterization schemes. This model is customized specifically to forecast the track, intensity and structure of tropical cyclones. The HWRF modelling system uses the dynamics and infrastructure from the NMM WRF modelling system. It uses physics that are proven to be better for the tropics. Also, at this time, it is an Ocean coupled model system with a Moving two-way interactive nest, and advanced data assimilation. IMD is operationally

14
running ocean coupled HWRF models during Tropical Cyclone events with two ocean models viz. POM-TC and HYCOM. HYCOM initial conditions are provided through INCOIS whereas POM-TC is initialized based on climatology.
It is run 4 times a day in cyclic mode with GSI based (hybrid-EnVar) assimilation (80 members) with 6 hourly cycles in cycling mode with full physics configuration. The model is also configured with 2 different Ocean models i.e. Princeton Ocean Model (POM) and hybrid co-ordinate ocean model (HYCOM). The Unified Post-Processor (UPP) coverts raw model outputs from all three domains into standard GRIB1/2 format. Moreover, GFDL tracker generates track and intensity information in a standard ATCF (Automated Tropical Cyclone Forecasting System) format processing all GRIB files with a specified time interval (3 or 6 hours) as per requirement.
The modeling system was fully operational and predicted all cyclones during the year 2021. Whenever any low-pressure system intensified and became depression over both sub-basins of North Indian Ocean, the cyclic run of the modelling system had been initiated. The model utilized ocean initial state from the ITOPSI (INCOIS Tendral Ocean Prediction System – Indian Ocean Model) during each cycle to initialize the HYCOM ocean component. All available observed data including conventional and satellite observations were assimilated into the regional GSI system to improve further the initial condition after the vortex initialization of the atmospheric first guess state of the model forecast from previous cycle (except first cycle).
1.5.2.3. High Resolution Rapid Refresh Modeling System (HRRR)
The High Resolution Rapid Refresh system based on Weather Research and Forecast
(WRF-ARW) model with WRFDA (3DVAR-FGAT) data assimilation is experimentally
operationalized in India Meteorological Department in collaboration with Space Application
Center (ISRO) from beginning of 2021. The HRRR is hourly updated atmospheric model with
horizontal resolution of 2km. The model uses forecast of IMD-GFS (T1534L64) model as first
guess and forecast as boundary during cold start and is then cycled providing hourly
updates based on Radar Data. Using analysis and updated boundary conditions from the
WRFDA, the HRRR is run to produce forecasts up to 12 hours and forecasts are made
available after every two hours on NWP website.
The model is run in three different domains covering Indian mainland. The three domains
are North-West domain, East & North-East domain and South-Peninsular domain. HRRR
with hourly updates provide frequent and updated precipitation and reflectivity forecasts with
respect to the tropical cyclones which could be very useful in planning effective and
immediate disaster mitigation strategies.
1.5.3. NWP based Objective Cyclone Prediction System (CPS)
The method comprises of five forecast components, namely (a) Cyclone Genesis
Potential Parameter (GPP), (b) Multi-Model Ensemble (MME) technique for cyclone track
prediction, (c) Cyclone intensity prediction, (d) Rapid intensification and (e) Predicting
decaying intensity after the landfall.
1.5.3.1 Genesis Potential Parameter (GPP)
A cyclone genesis parameter, termed the genesis potential parameter (GPP), for the
North Indian Sea is developed (Kotal et al, 2009). The parameter is defined as the product of
four variables, namely vorticity at 850 hPa, middle tropospheric relative humidity, middle
tropospheric instability, and the inverse of vertical wind shear. The parameter is operationally
15
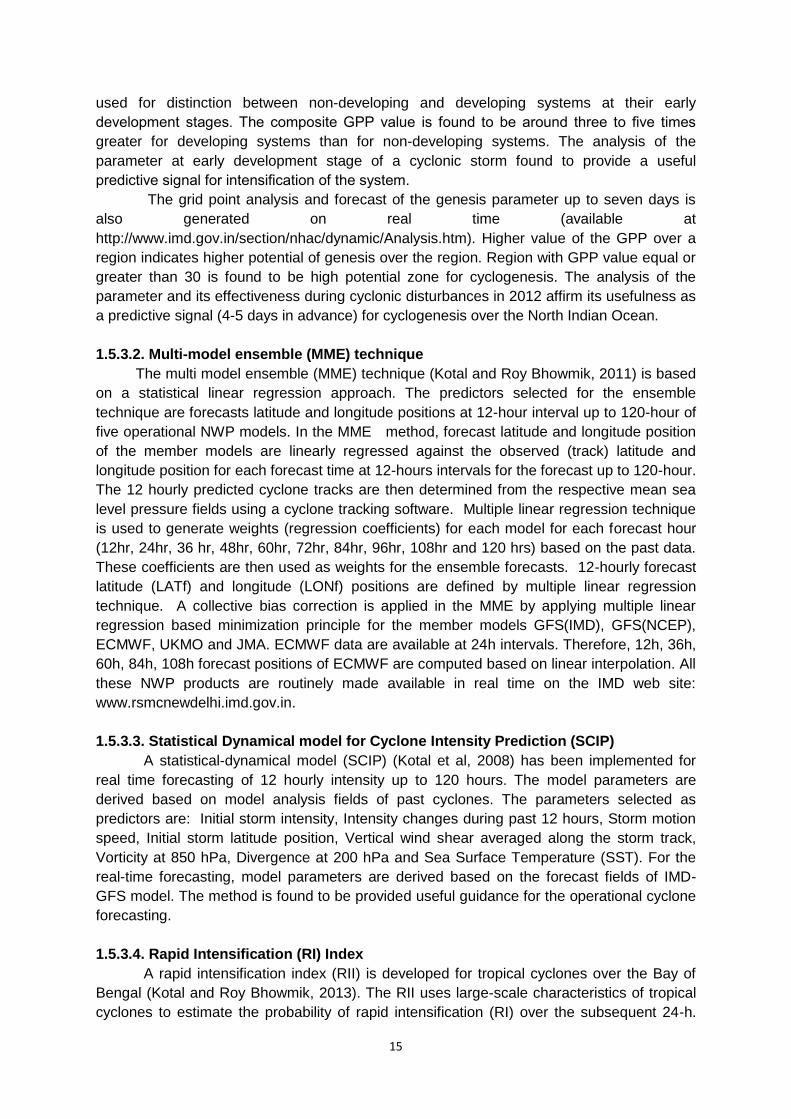
used for distinction between non-developing and developing systems at their early
development stages. The composite GPP value is found to be around three to five times
greater for developing systems than for non-developing systems. The analysis of the
parameter at early development stage of a cyclonic storm found to provide a useful
predictive signal for intensification of the system.
The grid point analysis and forecast of the genesis parameter up to seven days is
also generated on real time (available at
http://www.imd.gov.in/section/nhac/dynamic/Analysis.htm). Higher value of the GPP over a
region indicates higher potential of genesis over the region. Region with GPP value equal or
greater than 30 is found to be high potential zone for cyclogenesis. The analysis of the
parameter and its effectiveness during cyclonic disturbances in 2012 affirm its usefulness as
a predictive signal (4-5 days in advance) for cyclogenesis over the North Indian Ocean.
1.5.3.2. Multi-model ensemble (MME) technique
The multi model ensemble (MME) technique (Kotal and Roy Bhowmik, 2011) is based
on a statistical linear regression approach. The predictors selected for the ensemble
technique are forecasts latitude and longitude positions at 12-hour interval up to 120-hour of
five operational NWP models. In the MME method, forecast latitude and longitude position
of the member models are linearly regressed against the observed (track) latitude and
longitude position for each forecast time at 12-hours intervals for the forecast up to 120-hour.
The 12 hourly predicted cyclone tracks are then determined from the respective mean sea
level pressure fields using a cyclone tracking software. Multiple linear regression technique
is used to generate weights (regression coefficients) for each model for each forecast hour
(12hr, 24hr, 36 hr, 48hr, 60hr, 72hr, 84hr, 96hr, 108hr and 120 hrs) based on the past data.
These coefficients are then used as weights for the ensemble forecasts. 12-hourly forecast
latitude (LATf) and longitude (LONf) positions are defined by multiple linear regression
technique. A collective bias correction is applied in the MME by applying multiple linear
regression based minimization principle for the member models GFS(IMD), GFS(NCEP),
ECMWF, UKMO and JMA. ECMWF data are available at 24h intervals. Therefore, 12h, 36h,
60h, 84h, 108h forecast positions of ECMWF are computed based on linear interpolation. All
these NWP products are routinely made available in real time on the IMD web site:
www.rsmcnewdelhi.imd.gov.in.
1.5.3.3. Statistical Dynamical model for Cyclone Intensity Prediction (SCIP)
A statistical-dynamical model (SCIP) (Kotal et al, 2008) has been implemented for
real time forecasting of 12 hourly intensity up to 120 hours. The model parameters are
derived based on model analysis fields of past cyclones. The parameters selected as
predictors are: Initial storm intensity, Intensity changes during past 12 hours, Storm motion
speed, Initial storm latitude position, Vertical wind shear averaged along the storm track,
Vorticity at 850 hPa, Divergence at 200 hPa and Sea Surface Temperature (SST). For the
real-time forecasting, model parameters are derived based on the forecast fields of IMD-
GFS model. The method is found to be provided useful guidance for the operational cyclone
forecasting.
1.5.3.4. Rapid Intensification (RI) Index
A rapid intensification index (RII) is developed for tropical cyclones over the Bay of
Bengal (Kotal and Roy Bhowmik, 2013). The RII uses large-scale characteristics of tropical
cyclones to estimate the probability of rapid intensification (RI) over the subsequent 24-h.
16
The RI is defined as an increase of intensity 30 kt (15.4 ms-1) during 24-h. The RII technique
is developed by combining threshold (index) values of the eight variables for which
statistically significant differences are found between the RI and non-RI cases. The variables
are: Storm latitude position, previous 12-h intensity change, initial storm intensity, vorticity at
850 hPa, divergence at 200 hPa, vertical wind shear, lower tropospheric relative humidity,
and storm motion speed. The probability of RI is found to increase from 0% to 100% when
the total number of indices satisfied increases from zero to eight. The forecasts are made
available in real time since 2013.
1.5.3.5. Decay of Intensity after the landfall
Tropical cyclones (TCs) are well known for their destructive potential and impact
on human activities. The Super cyclone Orissa (1999) illustrated the need for the accurate
prediction of inland effects of tropical cyclones. The super cyclone of Orissa maintained the
intensity of cyclonic storm for about 30 hours after landfall. Because a dense population
resides at or near the Indian coasts, the decay forecast has direct relevance to daily
activities over a coastal zone (such as transportation, tourism, fishing, etc.) apart from
disaster management. In view of this, the decay model (Roy Bhowmik et al. 2005) has been
used for real time forecasting of decaying intensity (after landfall) of TCs.
1.5.4. Tropical Cyclone Ensemble Forecast based on Global Models Ensemble
(TIGGE) Data
The THORPEX Interactive Grand Global Ensemble (TIGGE, Philippe Bougeault et al.
2010) is an implementation of ensemble forecasting for global weather forecasting and is
part of THORPEX, an international research programme established in 2003 by the World
Meteorological Organization (WMO) to accelerate improvements in the utility and accuracy
of weather forecasts up to two weeks ahead. As part of WMO Program to provide a
guidance of tropical cyclone (TC) forecasts in near real-time for the ESCAP/WMO Member
Countries based on the TIGGE Cyclone XML (CXML) data, IMD implemented JMA
supported software for real-time TC forecast over North Indian Ocean (NIO) in 2011. The
Ensemble and deterministic forecast products from ECMWF (50+1 Members), NCEP (20+1
Members), UKMO (23+1 Members) and MSC (20+1 Members) are available near real-time
for NIO region for named TCs. These Products includes: Deterministic and Ensemble TC
track forecasts, Strike Probability Maps, Strike probability of cities within the range of 120
kms 4 days in advance. The JMA provided software to prepare Web page to provide
guidance of tropical cyclone forecasts in near real-time for the ESCAP/WMO committee
Members. The forecast products are made available in real time.
Since 2021, IMD has also implemented IFS TC Tracker (available from ECMWF) for all
available TIGGE models (9 in numbers). These 9 models are from Bureau of Meteorology,
Australia (BoM), Environment and Climate Change Canada (ECCC), European Centre for
Medium-Range Weather Forecasts (ECMWF), India Meteorological Department (IMD),
Japan Meteorological Agency (JMA), Korea Meteorological Administration (KMA), Met Office
- UK (UKMO), and National Centers for Environmental Prediction, USA (NCEP), and
National Centre for Medium Range Weather Forecasting (NCMRWF) are nine International
Institutes model outputs (contributing to the TIGGE) are chosen based on availability at the

17
ECMWF-TIGGE web data portal
https://apps.ecmwf.int/datasets/data/tigge/levtype=sfc/type=cf/ as on December 2021
1.5.5. Global Ensemble Forecast System
The Ministry of Earth Sciences (MoES) has commissioned two very high resolution
(12 km grid scale) state-of-the-art global Ensemble Prediction Systems (EPS) for generating
operational 10-days probabilistic forecasts of weather with 21 members. The EPS involves
the generation of multiple forecasts using slightly varying initial conditions. The forecast
products from these two prediction systems are available in IMD-NWP website. The
frameworks of the new EPSs are among the best weather prediction systems in the world at
present. Very few forecasting centres in the world use this high resolution for short-medium
range probabilistic weather forecasts. GEFS model is run twice a day based on 00 & 12 UTC
initial conditions.
1.5.6. Models run at NCMRWF
Two global models are also run at NCMRWF, NGFS adapted from NCEP GFS and
NCUM unified model adapted from UK Met Office. The observations assimilated at
NCMRWF include various in-situ and remote sensing observations. In-situ observations
includes measurements come from land weather stations, aircraft, radiosondes, ships and
buoys. Satellite observation includes Infrared and microwave radiance measurements from
Low Earth Orbiting (LEO) and Geostationary (GEO) satellites, Atmospheric Motion Vectors
from LEO and GEO, ocean surface winds from scatterometers, GPS Radio Occultation
measurements etc. Indian Doppler Weather Radar (DWR) observation are also assimilated
in the NCMRWF NWP systems. NCUM-G (N1024/L70) model features a horizontal
resolution of 12km and 70 vertical levels reaching upto an altitude of 80 km. It uses
―ENDGame‖ dynamical core, which provides improved accuracy of the solution of primitive
model equations and reduced damping. This was upgraded in June 2018 from the earlier
model with a horizontal resolution of 17km. NCUM is a grid point model which has a Non-
hydrostatic dynamics with a deep atmosphere suitable for all scales. It has semi-implicit time
integration with 3D semi-Lagrangian advection, terrain following height coordinates and high
order advection. It features mass-flux for shallow convection with convective momentum
transport, non-local mixing and entrainment for boundary layer. The new version of the
NCUM has the model physics configuration of GA6.0 (Global Atmosphere version 6.0) and a
land surface model configuration of GL 6.0 which is based on JULES land surface
scheme(Walters et al., 2017). This helps in producing finer details in the simulations of
synoptic scale systems such as cyclones, fronts, troughs and jet stream winds. ENDGame
also increases variability in the tropics, which leads to an improved representation of tropical
cyclones and other tropical phenomena (Walters et al., 2017). Hybrid 4D-Var data
assimilation system prepares initial condition for NCUM. The advantage of the Hybrid 4D-
Var is that it uses a blended background error, blend of ―climatological‖ r and day-to-day
varying flow dependent background error derived from the 22–member ensemble forecasts
at NCMRWF. The hybrid approach is scientifically attractive because it elegantly combines
the benefits of ensemble data assimilation with the known benefits of 4D-Var within a single
data assimilation system.
NCUM-R is a regional model having a horizontal grid resolution of ~4km with 80
vertical levels reaching up to 38.5 km height. NCUM-R uses the high-resolution analysis
prepared by regional 4D-Var system. In addition to most of the in-situ and satellite

18
observation types used in the global NCUM, Indian DWR observations of radial wind and
rainfall intensity estimates are also used in the regional NCUM DA system. The model
domain of NCUM-R spans entire south Asia covering Bay of Bengal and part of Arabian Sea
(5 N-40 N, 65-100 E).
NCMRWF Ensemble Prediction System (NEPS-G) is a global medium range
probabilistic forecasting system adapted from UK MET Office. The configuration consists of
four cycles of assimilation corresponding to 00Z, 06Z, 12Z & 18Z and 10-day forecasts are
made using the 00Z initial condition. The operational NCMRWF Ensemble Prediction
System (NEPS) has 22 ensemble members. The horizontal resolution of NEPS is ~12km.
The NCUM model analysis is used as the initial condition for the control model forecast. The
perturbations are generated by Ensemble Transform Kalman Filter (ETKF) method which
are added to the global deterministic analysis to create 22 perturbed initial conditions. These
are used for generating ensemble member forecasts. One control and 11 perturbed
ensemble members run from initial condition of 00UTC of current day and 11 more perturbed
members run from 12 UTC of previous day to give 23 members (11 + 11 + 1 control)
ensemble forecasts up to 10 days lead time. More details about NEPS-G are available in
Mamgain et al. (2018). The new 12-km NEPS-G is the highest resolution for Ensemble
forecasting.
1.5.7. Models run at IITM Pune
Global Ensemble Forecast System (GEFS) was upgraded from ~27 km (T574 with
GEFS v11.3) to ~12 km (T1534) resolution in year 2018. It is based on Global Forecast
System (GFS v14.1) which is a part of the ―Operational Model‖ developed at NCEP, USA in
2018. Table 1.0 gives the difference in the versions of the model which was newly
implemented. The dynamics, horizontal resolution, representation of physics processes and
the Near surface SST (NSST) are among the few to be mentioned which has significant
changes in the new version. Apart from the more number of observations, surface
perturbations (NSST) are also included in the Initial Conditions (ICs). The total number of 21
Ensembles (20 perturbed forecasts + 1 control forecast) constitutes the ensemble system.
These 20 ensembles analysis are generated by Ensemble Kalman Filter (EnKF) method
from the forecast perturbation of the previous cycles four times a day (00, 06, 12 and 18
UTC) at all 64 model vertical levels. These analysis perturbations are added to the
reconfigured analysis obtained from the hybrid four-dimensional Ensemble variational data
assimilation system (GDAS-Hybrid4DEnsVar) as part of the suite. The 243 hour forecast of
GEFS is routinely generated based on 00UTC and 12UTC initial conditions which include a
control forecast starting from GDAS assimilation and 20 (20 perturbations) ensemble
members with each perturbed initial conditions.
1.6 Bulletins and Products Generated by RSMC, New Delhi
RSMC, New Delhi prepares and disseminates the following bulletins:
1.6.1. Extended Range Outlook
IMD started issuing Extended Range Outlook for cyclogenesis during next two weeks
every Thursday from 22nd April, 2018. It contains information about large scale features over
the region, model guidance on probable cyclogenesis from various global/regional models,
probability of cyclogenesis as LOW (0-33%), MODERATE (34-67%) and HIGH (68-100%)
alongwith verification of forecast issued during last two weeks. The product is available on
19
RSMC website at http://www.rsmcnewdelhi.imd.gov.in/images/bulletin/eroc.pdf and is also
transmitted by email to WMO, WMO/ESCAP panel member countries and various scientists
and researchers in the country.
1.6.1 Tropical Weather Outlook
Tropical Weather Outlook is issued daily at 0600 UTC based on 0300 UTC
observations in normal weather for use of the member countries of WMO/ESCAP Panel.
This contains description of synoptic systems over NIO along with information on significant
cloud systems as seen in satellite imageries. It also provides probabilistic genesis forecast
(formation of depression) over Bay of Bengal and Arabian sea separately for day 1 (up to 24
hrs), day 2 (24 – 48 hrs), day 3 (48 – 72 hrs), day 4 (72-96 hrs) and day 5 (96-120 hrs). The
forecast is issued in probabilistic terms like Nil, Low, Fair, Moderate and High probability
corresponding to expected probability of occurrence of 00, 01 – 25, 26 – 50, 51 – 75 and 75
– 100 %. It is based on the consensus developed from various NWP and dynamical
statistical guidance coupled with guidance from observations and analyses. This forecast
has been introduced since 1st June 2014 upto 72 hrs lead period. The lead period of
cyclogenesis forecast has been extended to 120 hrs since 22nd April, 2018.
1.6.2 Special Tropical Weather Outlook
The Special Tropical Weather Outlook is issued at +03 hours based on observations
of 0000, 0300, 0600, 1200 & 1800 UTC observations when a tropical depression forms over
NIO. These bulletins contain the current position and intensity, past movement, central
pressure of the cyclone, description of satellite imageries, cloud imageries, expected
direction and speed of movement, expected track and intensity of the system up to 72 hrs in
case of depression and upto 120 hrs in case of a deep depression. It also includes the
description of sea condition. It also includes discussion on various diagnostic and prognostic
parameters. The 72 and 120 hours track and intensity forecasts are being issued from the
stage of depression and deep depression respectively since 2009 and 2018. The track and
intensity forecast are issued for +06, +12, +18, +24, +36, +48, +60, … 120 hours or till the
system is likely to weaken into a well marked low pressure area. IMD has initiated to give
the quantitative forecast of track & intensity from depression stage for lead period of +12,
+24, +48, +72 hours since April 2018. The time of issue of this bulletin is HH+03 hours. The
cone of uncertainty in the track forecast is also included in the graphical presentation of the
bulletin.(Fig.1.5). Tropical weather outlooks are transmitted to panel member countries
through global telecommunication system (GTS) & e-mails and are also made available on
real time basis through internet at IMD's website: www.mausam.imd.gov.in,
www.imd.gov.in and www.rsmcnewdelhi.imd.gov.in. RSMC, New Delhi can also be
contacted through e-mail ([email protected]) for any real time information on
cyclonic disturbances over NIO.
1.6.3 Tropical Cyclone Advisories
Tropical cyclone advisory bulletin is issued when a deep depression intensifies into a
tropical cyclone (wind speed= 34 knots or more). It replaces the ‗special tropical weather
outlook‘ bulletin. Tropical cyclone advisories are issued at 3 hourly intervals based on 00, 03,
06, 09, 12, 15, 18 and 21 UTC observations. The time of issue is HH+03 hrs. These bulletins
contain the current position and intensity, past movement, central pressure of the cyclone,

20
description of satellite imageries, cloud imageries, expected direction and speed of
movement, expected track and intensity of the system up to 120 hours like that in special
tropical weather outlook. The expected point and time of landfall, forecast winds, squally
weather and state of the Sea in and around the system are also mentioned. Storm surge
guidance is provided in the bulletin as and when required. Tropical cyclone advisories are
transmitted to panel member countries through e-mails & GTS and are also made available
on real time basis through internet at IMD's website: www.mausam.imd.gov.in,
www.imd.gov.in and www.rsmcnewdelhi.imd.gov.in.
1.6.4 Storm Surge Guidance
RSMC New Delhi is providing storm surge guidance to the panel member countries
since 2009 based on IIT Delhi Storm Surge model and. Recently INCOIS Hyderabad has
developed an ADvanced CIRCulation (ADCIRC) Storm Surge and Coastal Inundation model
which is running experimentally since 2013. In future it will be used as an input for providing
storm surge guidance to member countries.
1.6.5 Maritime forecast bulletins
Under Global Maritime Distress and Safety System (GMDSS) Scheme, India has
been designated as one of the 16 services providers in the world for issuing Sea area
bulletins for vessels on high seas for broadcast through GMDSS for MET AREA VIII (N),
which covers a large portion of NIO. As a routine, two GMDSS bulletins are issued at 0900
and 1800 UTC. During tropical cyclones/ depressions, additional bulletins (up to 4) are
issued for GMDSS broadcast. In addition, coastal weather and warning bulletins are also
issued for broadcast through NAVTEX transmitting stations. Fleet Forecasts for Indian seas
are also issued for Indian Navy twice a day with validity period of twelve hours.
Port Warnings & fishermen warnings are also issued for the entire Indian coast as
and when the coast is likely to be affected due to disturbances in seas. IMD has initiated to
issue the fishermen warning for entire BoB and AS since April, 2018. Further a graphics
based fishermen warning is being generated for entire BoB and AS since 26th April 2019.
1.6.6 Tropical Cyclone Advisories for Aviation
Tropical Cyclone Advisories for aviation are issued for international aviation as soon
as any disturbance over the NIO attains or likely to attain the intensity of cyclonic storm
(maximum sustained surface wind speed ≥ 34 knots) within next six hours. These bulletins
are issued at six hourly intervals based on 00, 06, 12, 18 UTC synoptic charts and the time
of issue is HH+03 hrs. These bulletins contain present location of cyclone in lat./long.,
maximum sustained surface wind (in knots), direction of past movement and estimated
central pressure, change in intensity, forecast position in Lat./Long. and forecast winds in
knots valid at HH+6, HH+12, HH+18 and HH+24 hrs in coded form. The tropical cyclone
advisories are transmitted on real time basis through GTS & AFTN channels to designated
International Airports of the region prescribed by ICAO and ftp to ADRR, Hong Kong
(WMO‘s Aviation Disaster Risk Reduction) in coded form. It is also being sent in graphics in
png format through GTS. The text and graphical bulletins are also uploaded on
www.rsmcnewdelhi.imd.gov.in
1.6.7 National bulletin
These bulletins are issued from the stage of depression onwards. During the stage of
depression/deep depression; it is issued based on 00, 03, 06, 12, and 18 UTC observations.

21
When the system intensifies into a cyclonic storm over NIO, these bulletins are issued at 00,
03, 06, 09, 12, 15, 18 and 21 UTC (every three hourly interval) based on previous
observations. This bulletin contains present status of the system i.e. location, intensity; past
movement and forecast intensity & movement for next 120 hours or till the systems weaken
into a low pressure area, likely landfall point & time and likely adverse weather including
heavy rain, gale wind & storm surge. Expected damage and action suggested are also
included in the bulletins. This bulletin is completely meant for national users and these are
disseminated through various modes of communication including All India Radio, Door
Darshan (National TV), Telephone/Fax, SMS, Print and electronic media. It is also posted on
cyclone page of IMD website and RSMC website. These are also posted on social
networking sites like facebook, tweeter and whatsapp.
1.6.8 Cone of uncertainty forecast
The Cone of uncertainty (COU) represents the probable position of a CD/ TC‘s
circulation Center, and is made by drawing a set of circles centered at each forecast point—
06, 12, 18, 24, 36, 48, 60, 72, 84, 96, 108 and 120 hours for a five-day forecast. IMD
introduced COU forecast upto a lead period of 72 hours in 2009 from Cyclone ―WARD‖. The
lead period was further extended to 120 hours in 2013 from Cyclone ―VIYARU‖. COU values
were revised in 2014 from cyclone ―Hudhud‖ based on the errors during 2009-13. From
cyclone FANI, 2019, the COU values have been revised based on the errors during 2014-18
The standard errors (nm) as radius of the circle around the forecast position (lat/long) so as
to construct the cone of uncertainty in the track forecast for 00, +06, +12, +18, +24, +36,
+48, +60, +72, +84, +96, +108 and +120 hrs lead period have been fixed as 10, 20, 30, 40,
45, 55, 70, 85, 95, 115, 130, 145 and 160 nm since April, 2019. Typical observed and
forecast track alongwith cone of uncertainty demonstrating accuracy in track forecast during
Super Cyclonic Storm Amphan is presented in Fig. 1.10 (a). This product is uploaded on
various websites of IMD viz. www.rsmcnewdelhi.imd.gov.in and www.mausam.imd.gov.in in
.png format and appended with the national and tropical cyclone advisory bulletins. Since,
severe cyclonic storm ―Nisarga‖ in June, 2020, this product was also made available on GIS
based platform at www.rsmcnewdelhi.imd.gov.in
Fig.1.10: Typical example of observed and forecast track during cyclone Tauktae
along with cone of uncertainty and wind distribution around the centre
demonstrating accuracy in track, landfall point and intensity.
22
1.6.9 Wind forecast for different quadrants
The forecast of the radius of maximum sustained wind in four quadrants of a cyclone
commenced with effect from the cyclone, GIRI during October 2010. In this forecast, the
radius of 28, 34, 50 and 64 knot winds are given for various forecast periods like +06, +12,
+18, +24, +36, +48, +60, … 120 hrs. A typical graphical presentation of this forecast is
shown in Fig.1.10 (b). This quadrant wind forecast is issued as a bulletin from the deep
depression stage onwards to various users through a global telecommunication system. This
product is uploaded on various websites of IMD viz. www.rsmcnewdelhi.imd.gov.in and
www.mausam.imd.gov.in in .png format and appended with the national and tropical cyclone
advisory bulletins. Since, severe cyclonic storm ―Nisarga‖ in June, 2020, this product was
also made available on GIS based platform at www.rsmcnewdelhi.imd.gov.in. It is also
uploaded on RSMC, New Delhi website in textual form.
1.6.10 Hourly Update
On the day of landfall IMD issues hourly updates on the landfalling cyclone over the
Indian coast since October, 2014. It contains information about the centre, it‘s distance &
direction from the station, landfall point and time, current maximum sustained wind speed
(MSW), MSW at the time of landfall. These bulletins are available at
http://www.rsmcnewdelhi.imd.gov.in/images/bulletin/hourly.pdf on the day of landfall.
1.6.11 TC Vital
The TC Vital is issued by RSMC New Delhi to various NWP Centers in coded form
for their use in creating the synthetic vortex in NWP models and running storm surge and
coastal inundation model. It is issued 4 times a day based on 00, 06, 12 and 18 UTC. This
bulletin contains the information on location (Latitude/Longitude), intensity (MSW and
estimated central pressure), movement (Speed/Direction), size, the radius of maximum wind
and wind radii of 34kts wind in 4 geographical quadrants namely NE, NW,SE and SW
quadrants etc. This bulletin has been introduced in 2012.
1.7 Cyclone Warning Dissemination System
Cyclone warnings are disseminated to various users through telephone, fax, email
SMS, Global Telecom System (GTS), WMO Information System (WIS), All India Radio, FM
& community radio, Television and other print & electronic media, press conference & press
release. These warnings/advisories are also put on the website
(www.rsmcnewdelhi.imd.gov.in) of IMD. Another means to transmit warning is IVRS
(Interactive Voice Response system). It is functioning with effect from July 2000.The
requests for weather information and forecasts from the general public are automatically
answered by this system. One can access current weather and forecast for major Indian
cities by dialing Toll-free number 1800 180 1717. Presently a centralized IVRS is catering
the weather information of major cities. India Meteorological Department has taken various
initiatives in recent years for improvement in the dissemination of weather forecast and
warning services based on latest tools and technologies. Since 2009, IMD has started SMS
based weather and alert dissemination system through AMSS (Transmet) at RTH New
Delhi. To further enhance this initiative, India Meteorological Department has taken the
leverage of Digital India Programme to utilize ―Mobile Seva‖ of Department of Electronics
and Information Technology (DeitY), Ministry of Communication and Information
Technology; Govt. of India for SMS based Warnings /Weather information dissemination for
a wide range of users. The SMS based cyclone alert to the registered users including public

23
was inaugurated on 25th December 2014. Global Maritime Distress and Safety System
(GMDSS) message is also put in RSMC, New Delhi website (URL:
www.rsmcnewdelhi.imd.gov.in) as well as transmitted through GTS. New IMD website
dedicated to general public (https://mausam.imd.gov.in) was launched by Hon'ble Minister of
Earth Sciences, Dr Harsh Vardhan on 27th July, 2019. Cyclone related bulletins are
uploaded on this site also since July, 2019. The WIS Portal –GISC New Delhi is another
system for cyclone warning dissemination. The user can access the warning messages
through the -URL: http://www.wis.imd.gov.in. IMD has also started issuing of NAVTEX
bulletins for the coastal region along east as well as the west coast of India for the operation
of lightships and fishermen from 30th March 2016. In addition to the above network, for quick
dissemination of warning against impending disaster from approaching cyclones, IMD has
installed specially designed receivers within the vulnerable coastal areas for transmission of
warnings to the concerned officials and people using the broadcast capacity of INSAT
satellite. This is a direct broadcast service of cyclone warning in the regional languages
meant for the areas affected or likely to be affected by the cyclone.
In addition, the SMS-based alert/warnings are issued to registered farmers through
Kisan portal of Govt. of India (Ministry of Agriculture) and to registered fishermen through
Indian National Centre for Ocean Information Sciences (INCOIS), Hyderabad also.
IMD is also working in collaboration with ISRO for disseminating the SMS to
fishermen in deep seas through GAMES and NAVIK systems. IMD has also established new
cyclone warning centre at Thiruvananthapuram w.e.f. October, 2018 to improve
dissemination of warnings and advisories for the states of Kerala, Karnataka and
Lakshadweep Islands.
Since 2019, IMD is also notifying cyclone warnings on mobile apps Umang and
Meghdoot Apps. IMD has also started the dissemination of weather information through
common alerting protocol. The URL of RSS feed is https://cap-
sources.s3.amazonaws.com/in-imd-en/rss.xml. During Super Cyclone Amphan, 2020,
cyclone warnings were transmitted through CAP also.
1.8 Forecast Demonstration Project (FDP) on Landfalling Tropical Cyclones over
the Bay of Bengal
A Forecast Demonstration Project (FDP) on landfalling tropical cyclones over the Bay
of Bengal was taken up in 2008. It helps us in monitoring and prediction of a tropical cyclone.
The project is operated during 15 October to 30th November every year. But during the year
2021, the FDP campaign commenced on 15th October and was extended upto 7th December
2021. Like previous years (2008-2020), several national institutions participated for joint
observational, communicational & NWP activities. There was an improved observational
campaign with the observation from Buoys, Scatterometer based satellite and microwave
imageries products. The daily reports were prepared during this period to find out the
characteristics of genesis, intensification, and movement of the systems as well as
environmental features over the NIO. During the period intense observation period was
declared for a total of 30 days for various coastal states of India along the east & west
coasts and for Sri Lanka in association with depressions/deep depressions and tropical
cyclone JAWAD over Bay of Bengal. All the bulletins issued during the period have been
archived and are available on the RSMC, New Delhi website. The detailed report on
implementation of FDP-2021 will be available at RSMC, New Delhi website.

24
CHAPTER-II
CYCLONIC ACTIVITIES OVER NORTH INDIAN OCEAN DURING 2021
There are 10 cyclonic disturbances (CDs) (MSW ≥ 17 kts) over the north Indian
Ocean (NIO) including 7 over the Bay of Bengal (BoB) and 3 over the Arabian Sea (AS) against the normal of 11-12 CDs per year over the NIO based on the data of 1961-2020.
Out of these, 5 intensified into cyclonic storms (CS) (maximum sustained wind speed (MSW) ≥ 34 kt) against the normal of 4.8 CS per year over the NIO based on
the data of 1961-2020. Out of these 5 CS, 3 intensified into severe category storms (MSW ≥ 50 kt). Over all there was 1 extremely severe cyclonic storm (ESCS) (MSW: 90-119 kt) (Tauktae), 1 very severe cyclonic storm (VSCS) (MSW: 64-89 kt) (YAAS),
1 severe cyclonic storm (SCS) (MSW: 48-63 kt) (Shaheen) and 2 cyclonic storm (CS) (MSW: 34-47 kt) (Gulab 7 Jawad).
Table 2.1 Brief statistics of Ccyclonic disturbances over NIO and adjoining land areas
during 2021:
1. Depression over North Andaman Sea during 02nd- 03rd April, 2021
2. Extremely Severe Cyclonic Storm, “Tauktae” over the Arabian Sea during 14
May- 19 May, 2021
3. Very Severe Cyclonic Storm, “YAAS” over the Bay of Bengal during 23 May-
28 May, 2021
4. Deep Depression over the Northwest Bay of Bengal and adjoining Odisha
coast during 12 Sept- 15 Sept, 2021
5. Cyclonic Storm GULAB over the Northwest Bay of Bengal and adjoining
Odisha coast during 24 Sept- 28 Sept, 2021
6. Severe Cyclonic Storm SHAHEEN over Arabian Sea during 30 Sept- 4 Oct,
2021
7. Depression over Arabian Sea during 07 Nov- 09 Nov, 2021
8. Depression over Bay of Bengal during 10 Nov- 12 Nov, 2021
9. Depression over southwest Bay of Bengal during 18 Nov- 19 Nov, 2021
10. Cyclonic Storm, “JAWAD” over the Bay of Bengal during 02 - 06 December,
2021
The salient features of the cyclonic activity over the NIO are mentioned below:
Considering the basin-wise activity, there were 3 CDs over the Arabian Sea
including 1 depression and 2 CS against the normal of 2.3 and 1.2 respectively
based on the data of 1961-2020. Over the BoB, there were 7 CDs including 4
depressions and 3 CS against the normal of 8.1 and 3.5 based on the data of 1961-
2020. Thus, both the basins witnessed decreased frequency of formation of
depressions. However, w.r.t. formation of CS, the activity was above normal over the
AS and slightly below normal over the BoB.

25
Considering the season-wise activity, post monsoon season was less active
during 2021 with formation of 4 CDs including 1 CS against normal of 4.8 and 2.8
per season (October-December) based on the data of 1961-2020.
Considering the track, out of 5 CS, 3 had recurving track (Tauktae, Shaheen &
Jawad) and 2 had straight moving track (Yaas and Gulab). Except cyclone JAWAD, the other 4 including Tauktae, Yaas, Gulab and
Shaheen were landfalling cyclones against normal of 3.2 per year based on the data of 1961-2020. The annual forecast performance of RSMC during 2021 is described below:
a. The annual average track forecast errors in 2021 have been 60 km, 92 km
and 164 km respectively for 24, 48 and 72 hrs against the long period average (LPA) errorS of 77, 117 and 159 km based on data of 2016-2020.
b. The annual average errors in intensity forecast during 2021 have been 6.1
knots, 9.5 knots and 10.8 knots respectively for 24, 48 and 72 hrs lead period of forecast against the LPA errors of 7.9, 11.4 and 14.1 knots.
c. The annual average landfall point forecast errors for the year 2021 have been 16 km and 20 km for 24 & 48 hrs lead period against the LPA errors of 32 km and 62 km respectively.
d. The landfall time forecast errors have been 1.2 and 3.0 hrs for 24 & 48 hrs lead period during 2021 against the LPA errors of 2.5 and 5.0 hrs
respectively.
Brief description of cyclones during 2021
1. Extremely Severe Cyclonic Storm TAUKTAE over the Arabian Sea (14th-19th
May, 2021)
A low pressure area formed over southeast Arabian Sea & adjoining Lakshadweep
area in the morning (0830 hrs IST/ 0300 UTC) of 13th May 2021. Under favourable
environmental conditions, it concentrated into a depression over Lakshadweep area
in the morning (0830 hrs IST) of 14th May, 2021. It intensified into the cyclonic storm
“TAUKTAE” in the midnight (2330 hrs IST/1800 UTC) 0f 14th May over
Lakshadweep area and adjoining southeast & eastcentral Arabian Sea. It reached
it’s peak intensity of 100 kt in the morning (0530 hrs IST) of 17 th May over
eastcentral Arabian Sea. Continuing to move nearly northwards, it entered
marginally unfavourable environment, weakened gradually and crossed Saurashtra
coast near latitude 20.8°N and longitude 71.1°E, close to northeast of Diu (about 20
km northeast of Diu) during 2000-2300 hours IST of 17th May, 2021 with maximum
sustained wind speed of 160-170 kmph gusting to 185 kmph. Moving north-
northeastwards, it weakened into a well marked low pressure area over central parts
of Rajasthan in the evening 1200 UTC of 19th May.

26
2. Very Severe Cyclonic Storm YAAS over the Bay of Bengal (23rd – 28th May,
2021)
A low pressure area formed over eastcentral Bay of Bengal (BoB) in the
morning (0830 IST/0300 UTC) of 22nd May. Under favourable environmental
conditions, it concentrated into a depression over eastcentral BoB in the noon (1130
IST/0600 UTC) of 23rd May, 2021. It moved northwestwards and intensified into the
cyclonic storm “YAAS” in the early morning (0530 IST/0000 UTC) of 24th over the
same region. It started moving northwards from the morning (0830 IST/0300 UTC) of
25th and intensified into a very severe cyclonic storm (VSCS) in the evening (1730
IST/1200 UTC) over northwest BoB. Thereafter, it moved north-northwestwards
reached peak intensity of 75 kts and lay centred over northwest BoB about 30 km
east of Dhamra Port, Odisha during early morning (0530 IST/0000 UTC) of 26 th May.
Continuing to move north-northwestwards, it crossed north Odisha coast near
latitude 21.35°N and longitude 86.95°E, about 20 km to the south of Balasore as a
VSCS with maximum sustained wind speed (MSW) of 75 kts gusting to 85 kts (130 -
140 kmph gusting to 155 kmph) between 1030-1130 IST(0500-0600 UTC) of 26th. It
moved northwestwards and weakened into a well-marked low pressure area over
Bihar and adjoining southeast Uttar Pradesh (UP) in the early morning (0530
IST/0000 UTC) of 28th May.
3. Cyclonic Storm GULAB over the Bay of Bengal (24th – 28th September 2021)
A low pressure area formed over east-central Bay of Bengal (BoB) and neighbourhood in the
morning (0830 hours IST / 0300 UTC) of 24th September. Under favourable environmental
and Sea conditions, it concentrated into a depression over eastcentral and adjoining
northeast BoB in the evening (1730 hours IST/ 1200 UTC) of 24th September. Moving
west-northwestwards, it intensified into the Cyclonic Storm “GULAB” (pronounced as
GUL-AAB) over northwest and adjoining west-central BoB in the evening (1730 hours IST)
of 25th September, 2021. Thereafter, it intensified gradually and reached it’s peak intensity
of 75-85 kmph gusting to 95 kmph around noon (1130 hours IST/0600 UTC) of 26th
September. Continuing to move further westwards, it crossed North Andhra Pradesh and
adjoining south Odisha coasts near Lat. 18.4°N/ Long. 84.2°E (20 km north of
Kalingapatnam) with maximum sustained wind speed of 75-85 gusting to 95 kmph
during 1930-2030 IST of 26th September. Thereafter, it weakened into a well marked
Low pressure area over western parts of Vidarbha and neighbourhood around noon of 28th
September.

27
4. Severe Cyclonic Storm Shaheen over northeast Arabian Sea adjoining Kutch (30th September – 4th October 2021)
The remnant of cyclonic storm Gulab emerged as a well marked low pressure area into
south Gujarat region & adjoining Gulf of Khambhat in the morning (0830 hours IST) of 29 th
September. Under favourable environmental and sea conditions, it concentrated into a
depression over northeast Arabian Sea (AS) & adjoining Kutch, in the morning (0530 hours
IST) of 30th September. It intensified into the cyclonic storm “Shaheen” over the
northeast AS off Gujarat coast in the morning (0530 hours IST) of 1st October, 2021. It
reached it’s peak intensity of 60 kts in the early morning (0000 UTC) of 2nd
October. It
crossed Oman coast during 0030-0130 IST of 4th Oct. with wind speed of 95-105
gusting to 115 kmph. It weakened into a well marked low pressure area in the evening
(1730 hours IST) of 4th October over northeast Oman.
5. Cyclonic Storm JAWAD (pronounced as JOWAD) over Bay of Bengal
A Low Pressure Area formed over South Thailand & neighbourhood in the forenoon
(0830 hours IST/0300 UTC) of 30th November. It emerged into central parts of Andaman
Sea in the same evening (1730 hrs IST/1200 UTC) and lay as a well marked low pressure
area over southeast Bay of Bengal (BoB) & adjoining Andaman Sea in the morning (0530
hrs IST/0000 UTC) of 2nd December. Under favourable environmental conditions, it
concentrated into a depression over southeast Bay of Bengal in the same evening (1730
hours IST/1200 UTC), moving north-northwestwards, it concentrated into a deep depression
over westcentral & adjoining south BoB in the morning (0530 hours IST/0000 UTC) and into
the Cyclonic Storm “JAWAD” (pronounced as JOWAD) over westcentral BoB in the
forenoon (1130 hours IST/0600 UTC) of 3rd December. It moved north-northeastwards till
morning (0530 hours IST/0000 UTC) of 4th December. Thereafter, the system started
recurving along the western periphery of the anticyclone over Myanmar region. It moved
northwards till evening (1730 hours IST/ 1200 UTC) of 4th and weakened into a deep
depression over westcentral BoB at 1730 hours IST of 4th December. Thereafter, it
moved north-northeastwards and reached very close to Odisha coast, about 50 km
southeast of Puri in the afternoon (1430 hours IST/0900 UTC) of 5th December and 30
km southeast of Paradip in the evening (1730 hours IST/1200 UTC) of 5th
December as
a depression. Thereafter, it moved northeastwards and weakened into a well marked low
pressure area over northwest BoB and adjoining West Bengal & Bangladesh coasts in the
morning (0530 hours IST/0000 UTC) and into a low pressure area over the same region in
the forenoon (0830 hours IST/0300 UTC) of 6th December, 2021.

28
Table 2.2 Some Characteristic features of cyclonic disturbances formed over north
Indian Ocean and adjoining region during 2021
S.
No
.
Cyclonic
storm/
Depression
Date, Time&
Place of
genesis (Lat.
N/long E)
Date, Time (UTC)
Place (Lat./Long.)
of Landfall
Estimated
lowest
central
pressure,
Time & Date
(UTC) &
Lat.N/Long.
E
Estimated
Maximum
wind
speed
(kt), Date
& Time
Max
T.
No.
Attai
ned
1 Depression
over North
Andaman
Sea during
02nd- 03rd
April, 2021
North Andaman
Sea in the early
morning (0000
UTC) of 2nd April
Near
(11.0N/96.3E)
Weakened into a
Well-Marked Low-
Pressure Area over
north Andaman
and adjoining south
Myanmar coast
1000 hPa at
0000 UTC 2nd
April 2021
near
(11.0N/96.3E
)
25 knots
at 0000
UTC 2nd
April 2021
near
(11.0N/96.
3E)
T1.5
2 Extremely
Severe
Cyclonic
Storm,
“Tauktae”
over the
Arabian Sea
during 14
May- 19 May,
2021
14th May 2021,
0300 UTC
over Arabian
Sea near
(10.5N/72.3E)
Crossed
Saurashtra coast
about 20 km
northeast of Diu,
near Lat.20.8°N
and
Long. 71.1°E
during 1530-1730
UTC of 17th May
2021
950 hPa at
0000 UTC
17th May
2021 near
(18.5N/71.5E
)
100 knots
at 0000
UTC 17th
May 2021
near
(18.5N/71.
5E)
T 5.5
3 Very Severe
Cyclonic
Storm,
“YAAS” over
the Bay of
Bengal during
23 May- 28
May, 2021
23rd May
2021, 0600
UTC over Bay
of Bengal near
(16.1N/90.2E)
Crossed north
Odisha coast near
Latitude 21.35°N
and Longitude
86.95°E, about 20
km
to the south of
Balasore as a
VSCS
970 hPa at
2100 UTC
25th May
2021 near
(20.4N/87.6E
)
75 knots
at 2100
UTC 25th
May 2021
near
(20.4N/87.
6E)
T 4.0

29
4 Deep
Depression
over the
Northwest
Bay of Bengal
and adjoining
Odisha coast
during 12
Sept- 15
Sept, 2021
12th September,
2021,1200 UTC
over Bay of
Bengal near
(20.3°N/87.4°)
Crossed north
Odisha coast,
close to south of
Chandbali between
0530 &
0630 hrs IST as a
Deep Depression
990 hPa at
0000 UTC
13th
September,
2021 near
(20.6N/87.0E
)
30 knots
at 0000
UTC 13th
Septembe
r, 2021
near
(20.6N/87.
0E)
T2.0
5 Cyclonic
Storm
GULAB over
the Northwest
Bay of
Bengal and
adjoining
Odisha coast
during 24
Sept- 28
Sept, 2021
24th September,
2021,1200 UTC
over northwest
Bay of Bengal
near
(18.3°N/91.2°)
Crossed north
Andhra Pradesh –
south Odisha
coasts near latitude
18.40N
and longitude
84.20E, about 20
km north of
Kalingapatnam
during 1930 &
2030 hrs IST
(1400-1500 UTC)
992 hPa at
0600 UTC
26th
September,
2021 near
(18.4N/85.9E
)
45 knots
at 0600
UTC 26th
Septembe
r, 2021
near
(18.4N/85.
9E)
T3.0
6 Severe
Cyclonic
Storm
SHAHEEN
over Arabian
Sea during
30 Sept- 4
Oct, 2021
30th September,
2021,0000 UTC
over Arabian
Sea near
(22.7°N/69.5°)
Crossed Oman
coast during 1900
to 2000 UTC of 3rd
October, near
latitude
23.9°N and
longitude 57.3°E,
about 120 km
west-northwest of
Muscat as a
severe cyclonic
storm
984 hPa at
1800 UTC
1st October,
2021 near
(23.6N/63.2E
)
60 knots
at 1800
UTC 1st
October,
2021 near
(23.6N/63.
2E)
T3.5
7 Depression
over Arabian
Sea during
07 Nov- 09
Nov, 2021
7th November
2021 at 0300
UTC over
Arabian Sea
near
(14.0N/67.5E)
weakened into a
Well Marked Low
pressure Area over
central parts of
Arabian Sea
1002 hPa at
0300 UTC
over Arabian
Sea near
(14.0N/67.5E
)
25 knots
at 0300
UTC over
Arabian
Sea near
(14.0N/67.
5E)
T1.5
8 Depression
over Bay of
Bengal during
10th November
2021, 1200 UTC
over Bay of
Crossed north
Tamil Nadu &
adjoining south
1000 hPa at
1200 UTC
over Bay of
25 knots
at 1200
UTC over
T1.5
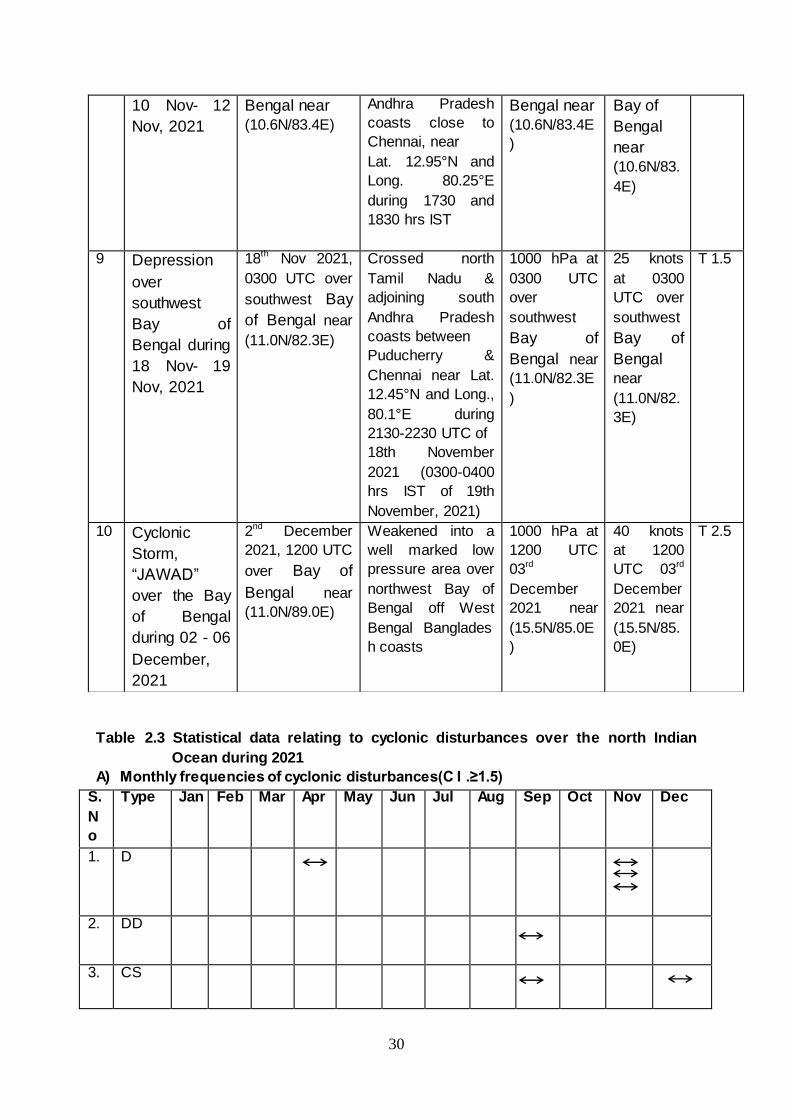
30
Table 2.3 Statistical data relating to cyclonic disturbances over the north Indian
Ocean during 2021
A) Monthly frequencies of cyclonic disturbances(C I .≥1.5)
S.
N
o
Type Jan Feb Mar Apr May Jun Jul Aug Sep Oct Nov Dec
1. D
2. DD
3. CS
10 Nov- 12
Nov, 2021
Bengal near
(10.6N/83.4E)
Andhra Pradesh
coasts close to
Chennai, near
Lat. 12.95°N and
Long. 80.25°E
during 1730 and
1830 hrs IST
Bengal near
(10.6N/83.4E
)
Bay of
Bengal
near
(10.6N/83.
4E)
9 Depression
over
southwest
Bay of
Bengal during
18 Nov- 19
Nov, 2021
18th Nov 2021,
0300 UTC over
southwest Bay
of Bengal near
(11.0N/82.3E)
Crossed north
Tamil Nadu &
adjoining south
Andhra Pradesh
coasts between
Puducherry &
Chennai near Lat.
12.45°N and Long.,
80.1°E during
2130-2230 UTC of
18th November
2021 (0300-0400
hrs IST of 19th
November, 2021)
1000 hPa at
0300 UTC
over
southwest
Bay of
Bengal near
(11.0N/82.3E
)
25 knots
at 0300
UTC over
southwest
Bay of
Bengal
near
(11.0N/82.
3E)
T 1.5
10 Cyclonic
Storm,
“JAWAD”
over the Bay
of Bengal
during 02 - 06
December,
2021
2nd December
2021, 1200 UTC
over Bay of
Bengal near
(11.0N/89.0E)
Weakened into a
well marked low
pressure area over
northwest Bay of
Bengal off West
Bengal�Banglades
h coasts
1000 hPa at
1200 UTC
03rd
December
2021 near
(15.5N/85.0E
)
40 knots
at 1200
UTC 03rd
December
2021 near
(15.5N/85.
0E)
T 2.5

31
4. SCS
5. VSCS
6. ESCS
7 SuCS
Peak intensity of the system, LD: Land Depression
B) Life time of cyclonic disturbances during 2021 at different stages of intensity
i. For NIO Region
S.No. Type Life Time in (Days)
1 D 13 days 15 hours
2. DD 05 days 3 hours
3. CS 5 days 09 hours
4. SCS 4 days 3 hours
5. VSCS 02 days 3 hours
6. ESCS 0 days 21 hours
Total Life Time in(Days) 31 days 6 hours
Average 03 days 03 hours
ii. For Bay of Bengal Region
S.No. Type Life Time in (Days)
1 D 09 days 21 hours
2. DD 04 days 03 hours
3. CS 3 days 15 hours
4. SCS 0 days 21 hours
5. VSCS 0 days 0 hours
6. ESCS 0 days 0 hours
Total Life Time in(Days) 19 days 9 hours
iii. For Arabian Sea Region
S.No. Type Life Time in (Days)
1 D 3 days 18 hours
2. DD 01 days 00 hours
3. CS 01 days 18 hours
4. SCS 03 day 06 hours
5. VSCS 01 days 06 hours
6. ESCS 00 days 21 hours
Total Life Time in(Days) 11 days 21 hours

32
C) Frequency distribution of cyclonic distribution with different intensities based on
satellite assessment
CI No (≥) ≥1.5 .≥2.0 .≥2.5 .≥3.0 .≥3.5 .≥4.0 .≥4.5 .≥5.0 ≥5.5 ≥6.0
No of
Disturbances
10 6 5 4 3 2 1 1 1 0
D) Basin-wise distribution of cyclonic distribution
Basin Number of cyclonic disturbances
Bay of Bengal 7
Arabian Sea 3
Land depression 0
Table 2.4. Cyclonic disturbances formed over the north Indian Ocean and land areas
of India during 1997-2021
Year Basin D DD CS SCS VSCS ESCS SuCS Total
1997
BOB 1 4 1 1 1 0 0 8
ARB 1 0 0 0 0 0 0 1
Land 0 0 0 0 0 0 0 0
Total 9
1998
BOB 0 3 0 1 2 0 0 6
ARB 0 1 1 1 1 0 0 4
Land 1 0 0 0 0 0 0 1
Total 11
1999
BOB 2 2 1 0 1 0 1 7
ARB 0 0 0 0 1 0 0 1
Land 1 0 0 0 0 0 0 1
Total 9
2000
BOB 1 1 2 -- 2 0 0 6
ARB 0 0 0 0 0 0 0 0
Land 1 0 0 0 0 0 0 1
Total 7
2001
BOB 2 0 1 0 0 0 0 3
ARB 0 0 2 0 1 0 0 3
Land 0 0 0 0 0 0 0 0
Total 6
2002
BOB 1 1 2 1 0 0 0 5
ARB 0 0 0 0 0 0 0 1
Land 0 0 0 0 0 0 0 0
Total 6
2003
BOB 2 2 0 1 1 0 0 6
ARB 0 0 0 1 0 0 0 1
Land 0 0 0 0 0 0 0 0
Total 7
2004
BOB 2 0 0 0 1 0 0 3
ARB 0 2 0 3 0 0 0 5
Land 2 0 0 0 0 0 0 2
Total 10

33
2005
BOB 2 3 4 0 0 0 0 9
ARB 2 0 0 0 0 0 0 2
Land 1 0 0 0 0 0 0 1
Total 12
2006
BOB 5 2 1 0 1 0 0 9
ARB 0 1 0 1 0 0 0 2
Land 1 0 0 0 0 0 0 1
Total 12
2007
BOB 3 4 1 0 1 0 0 9
ARB 0 1 1 0 0 0 1 3
Land 0 0 0 0 0 0 0 0
Total 12
2008
BOB 1 2 3 0 1 0 0 7
ARB 1 1 0 0 0 0 0 2
Land 1 0 0 0 0 0 0 1
Total 10
2009
BOB 0 2 2 1 0 0 0 5
ARB 2 0 1 0 0 0 0 3
Land 0 0 0 0 0 0 0 0
Total 8
2010
BOB 2 1 0 2 1 0 0 6
ARB 0 0- 1 0 1 0 0 2
Land 0 0 0 0 0 0 0 0
Total 8
2011
BOB 2 2 0 0 1 0 0 5
ARB 1 2 1 0 0 0 4
Land 1 0 0 0 0 0 0 1
Total 10
2012
BOB 0 2 1 0 0 0 0 3
ARB 0 1 1 0 0 0 0 2
LAND 0 0 0 0 0 0 0 0
Total 5
2013
BOB 3 0 1 1 3 0 0 8
ARB 0 1 0 0 0 0 0 1
Land 1 0 0 0 0 0 0 1
Total 10
2014
BOB 2 2 0 0 1 0 0 5
ARB 0 0 1 0 1 0 0 2
Land 1 0 0 0 0 0 0 1
Total 0
2015
BOB 1 1 1 0 0 0 0 3
ARB 2 1 0 0 2 0 5
Land 2 2 0 0 0 0 4
Total 12
2016 BOB 1 2 3 0 1 0 0 7
ARB 2 0 0 0 0 0 0 2

34
Land 1 0 0 0 0 0 0 1
Total 10
2017
BOB 4 1 1 1 1 0 0 8
ARB 0 0 0 0 0 0 0 0
Land 2 0 0 0 0 0 0 2
Total 10
2018
BOB 3 2 1 2 1 0 0 9
ARB 1 0 0 0 1 2 0 4
Land 1 0 0 0 0 0 0 1
Total 14
2019
BOB 0 1 1 0 1 1 0 4
ARB 2 1 1 0 2 1 1 8
Land 0 0 0 0 0 0 0 0
Total 12
2020
BOB 1 1 1 0 1 0 1 5
ARB 2 0 0 1 1 0 0 4
Land 0 0 0 0 0 0 0 0
Total 9
2021
BOB 3 1 2 0 1 0 0 7
ARB 1 0 0 1 0 1 0 3
Land 0 0 0 0 0 0 0 0
Total 10
D: Depression, DD: Deep Depression, CS: Cyclonic Storm, SCS: Severe Cyclonic Storm,
VSCS: Very Severe Cyclonic Storm, SuCS: super Cyclonic Storm, BOB: Bay of Bengal,
ARB: Arabian Sea
Fig. 2.1.: Tracks of cyclonic disturbances over north Indian Ocean and adjoining
land region during 2021

35
Table 2.5 Average translational speed of Tropical cyclones over the NIO during 2021
TC Name Basin Period Average Translational Speed
6 Hr 12 Hr 24 Hr
TAUKTAE AS 14-19 May 14.6 14.4 14.4
YAAS BoB 23-28 May 11.1 10.9 10.9
GULAB BoB 24-28 September 17.0 16.8 16.9
SHAHEEN AS 30 Sept–4 October
14.7 14.6 14.6
JAWAD BoB 2nd -06th Dec 15.1 14.6 14.6
Table 2.6 Velocity Flux of Tropical cyclones over the NIO during 2021
TC Name Velocity Flux (102 kt)
Accumulated Cyclone Energy (104 kt2)
Power Dissipation Index (106 kt3)
TAUKTAE 10.6 7.7 6.11
YAAS 0.6 3.6 2.3
GULAB 2.35 .93 .38
SHAHEEN 7.10 3.97 2.26
JAWAD 4.4 1.4 .48
TOTAL 25.05 17.6 11.53
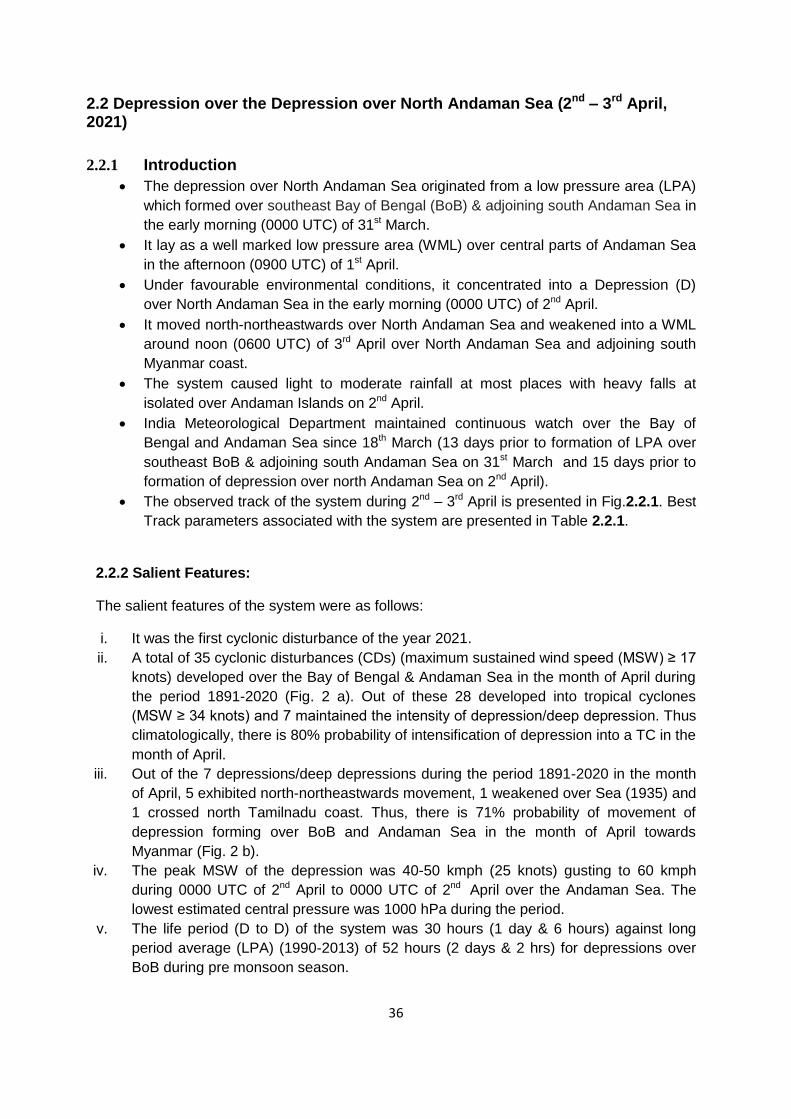
36
2.2 Depression over the Depression over North Andaman Sea (2nd – 3rd April, 2021)
2.2.1 Introduction
The depression over North Andaman Sea originated from a low pressure area (LPA)
which formed over southeast Bay of Bengal (BoB) & adjoining south Andaman Sea in
the early morning (0000 UTC) of 31st March.
It lay as a well marked low pressure area (WML) over central parts of Andaman Sea
in the afternoon (0900 UTC) of 1st April.
Under favourable environmental conditions, it concentrated into a Depression (D)
over North Andaman Sea in the early morning (0000 UTC) of 2nd April.
It moved north-northeastwards over North Andaman Sea and weakened into a WML
around noon (0600 UTC) of 3rd April over North Andaman Sea and adjoining south
Myanmar coast.
The system caused light to moderate rainfall at most places with heavy falls at
isolated over Andaman Islands on 2nd April.
India Meteorological Department maintained continuous watch over the Bay of
Bengal and Andaman Sea since 18th March (13 days prior to formation of LPA over
southeast BoB & adjoining south Andaman Sea on 31st March and 15 days prior to
formation of depression over north Andaman Sea on 2nd April).
The observed track of the system during 2nd – 3rd April is presented in Fig.2.2.1. Best
Track parameters associated with the system are presented in Table 2.2.1.
2.2.2 Salient Features:
The salient features of the system were as follows:
i. It was the first cyclonic disturbance of the year 2021.
ii. A total of 35 cyclonic disturbances (CDs) (maximum sustained wind speed (MSW) ≥ 17
knots) developed over the Bay of Bengal & Andaman Sea in the month of April during
the period 1891-2020 (Fig. 2 a). Out of these 28 developed into tropical cyclones
(MSW ≥ 34 knots) and 7 maintained the intensity of depression/deep depression. Thus
climatologically, there is 80% probability of intensification of depression into a TC in the
month of April.
iii. Out of the 7 depressions/deep depressions during the period 1891-2020 in the month
of April, 5 exhibited north-northeastwards movement, 1 weakened over Sea (1935) and
1 crossed north Tamilnadu coast. Thus, there is 71% probability of movement of
depression forming over BoB and Andaman Sea in the month of April towards
Myanmar (Fig. 2 b).
iv. The peak MSW of the depression was 40-50 kmph (25 knots) gusting to 60 kmph
during 0000 UTC of 2nd April to 0000 UTC of 2nd April over the Andaman Sea. The
lowest estimated central pressure was 1000 hPa during the period.
v. The life period (D to D) of the system was 30 hours (1 day & 6 hours) against long
period average (LPA) (1990-2013) of 52 hours (2 days & 2 hrs) for depressions over
BoB during pre monsoon season.

37
2.2.3 Monitoring of depression over north Andaman Sea
India Meteorological Department (IMD) maintained round the clock watch over the
north Indian Ocean and the system was monitored since 18th March (13 days prior to
formation of LPA over southeast BoB & adjoining south Andaman Sea on 31st March and
15 days prior to formation of depression over north Andaman Sea on 2nd April). First
information about formation of depression around 1st April with low probability was
indicated in the extended range outlook issued by IMD on 18th March. Thus the cyclone
was monitored & predicted continuously from 18th March onwards by IMD.
The cyclone was monitored with the help of available satellite observations from
INSAT 3D and 3DR, polar orbiting satellites. Various numerical weather prediction
models run by Ministry of Earth Sciences (MoES) institutions and dynamical-statistical
models were utilized to predict the genesis, track, landfall and intensity of the cyclone. A
digitized forecasting system of IMD was utilized for analysis and comparison of various
model guidance, decision making process and warning product generation.
Fig.2.2.1: Observed track of depression over North Andaman Sea and neighbourhood
(2nd-3rd April, 2021)

38
Fig. 2.2.2: (a) Tracks of CDs (MSW≥17 knots) and (b) tracks of depressions/deep
depressions (MSW 17-33 knots) in the month of April during 1891-2020
Table:2.2.1 Best track positions and other parameters of the Depression over North
Andaman Sea during 02nd- 03rd April, 2021
Date
Time
(UTC)
Centre lat.0 N/
long. 0 E
C.I.
NO.
Estimated
Central
Pressure
(hPa)
Estimated
Maximum
Sustained
Surface
Wind (kt)
Estimated
Pressure
drop at the
Centre
(hPa)
Grade
02/04/2021
0000 11.0 96.3 1.5 1000 25 3 D
0300 11.0 96.3 1.5 1000 25 3 D
0600 11.2 96.4 1.5 1000 25 3 D
1200 11.8 96.8 1.5 1000 25 3 D
1800 12.3 97.2 1.5 1000 25 3 D
03/04/2021
0000 13.0 97.5 1.5 1002 25 3 D
0300 13.2 97.6 1.5 1004 20 2 D
0600 Weakened into a Well Marked Low Pressure Area over north Andaman and
adjoining south Myanmar coast
(a) (b)

39
2.2.4 Brief life history
2.2.4.1 Genesis
An active convective zone developed in the northern hemispheric near equatorial
trough (NET), stretching from Malay Peninsula to the equatorial Indian Ocean to the south of
Sri Lanka from 26th March onwards. In this region, under the equatorial wave trough, the
convection got organized into 3 distinct vorticity cells on both sides of the equator.Gradually
one of this vortex got detached from the NET and evolved as a cyclonic circulation over
southeast Bay of Bengal (BOB).
Under the influence of the cyclonic circulation which lay over southeast BoB &
adjoining south Andaman Sea, an LPA formed over the same region at 0000 UTC of 31st
March. On 31st March, the Madden Julian Oscillation (MJO) index lay in phase 5 with
amplitude more than 1. It was forecast to continue in same phase till 3rd. Thereafter, it was
forecast to move to phase 6 with amplitude remaining more than 1 for next 3 days. Thus,
MJO phase and amplitude was supporting enhancement of convective activity over BOB till
3rd April. The tropical cyclone heat potential (TCHP) over the region was around 80 KJ/s and
the Sea Surface Temperature (SST) was 29-30°C over the region. The low level positive
vorticity was about 80-90 x10-6sec-1 over south Andaman Sea. Positive low level
convergence was about 5-10x10-5 sec-1 over south Andaman Sea. Positive zone of upper
level divergence was 10-15x10-5 sec-1 over south Andaman Sea. Vertical wind shear was
moderate (10-20 kt) over Andaman Sea and adjoining eastcentral BOB. The upper
tropospheric ridge ran along 10.5°N over the BOB. All these supportive conditions favoured
formation of LPA over southeast BOB & adjoining south Andaman Sea on 31st.
Similar favourable conditions continued on 1st April. The low level positive vorticity
was about 80-90 x10-6sec-1 over south Andaman Sea. The areal extension of positive low
level convergence zone increased (5-10x10-5 sec-1) and was covering entire south Andaman
Sea. The areal extension and magnitude of the zone of positive upper level divergence also
increased (20x10-5 sec-1) over south Andaman Sea. It was south-southwest to north-
northeast oriented. Vertical wind shear (VWS) was moderate (15-20 KTS) over Andaman
Sea and adjoining eastcentral BOB. It was higher towards the northeast sector. The upper
tropospheric ridge ran along 12°N over the BOB. Under the influence of the anticyclonic
circulation over southeast Asia and upper tropospheric trough in westerlies running along
880E to the north of 150N, the low pressure system was forecast to move northeastwards
towards Myanmar coast. Under these conditions, the system further consolidated and lay as
a WML over the same region at 0900 UTC of 1st April.
Similar MJO and sea conditions prevailed on 2nd April. The low level positive vorticity
remained same and was about 80-90 x10-6sec-1 over north Andaman Sea. The areal
extension of positive low level convergence zone increased during past 24 hours (10x10-5
sec-1) and was covering norh Andaman Sea to the east of Nicobar islands. The areal
extension and magnitude of the zone of positive upper level divergence also increased
(30x10-5 sec-1) over Andaman Sea. It was now more circular in shape and was coupled
with the low level convergence zone. Vertical wind shear (VWS) was moderate (15-20 KTS)
over Andaman Sea along the forecast track. It was higher towards the northwest sector.
Under these conditions, the system concentrated into a depression over north Andaman Sea
and neighbourhood at 0000 UTC of 2nd April. The upper tropospheric ridge ran along 13°N
over the BOB. Under the influence of the anticyclonic circulation over southeast Asia and

40
mid trospheric westerlies the depression was forecast to move north-northeastwards
towards Myanmar coast.
2.2.4.2 Intensification and movement
At 0600 UTC of 2nd April, similar Sea conditions prevailed. The low level positive
vorticity was same during past 06 hours and was about 80-90 x10-6sec-1 over Andaman Sea
to the southeast of the system centre. The magnitude of positive low level convergence over
the system area remained same during past 06 hours (15-20 x10-5 sec-1). The positive upper
level divergence remained organised with no change in magnitude (30x10-5 sec-1) during
past 06 hours and it lay over the system centre. It was coupled with the low level
convergence zone. At 0600 UTC, a weak outflow prevailed in the upper levels. Vertical wind
shear (VWS) was moderate (15-20 KTS) over north Andaman Sea along the forecast track.
The upper tropospheric ridge ran along 13°N over the BOB. Under the influence of the
anticyclonic circulation over southeast Asia and mid trospheric westerlies the depression
was forecast to move north-northeastwards towards Myanmar coast. Under these
conditions, the system maintained it’s intensity and lay as a depression over the same
region.
At 1200 UTC of 2nd April, the low level positive vorticity increased slightly and was
about 100 x10-6sec-1 over Andaman Sea to the southeast of the system centre. The
magnitude of positive low level convergence over the system area remained same during
past 06 hours (20 x10-5 sec-1). The positive upper level divergence decreased slightly in
magnitude (20x10-5 sec-1) during past 06 hours and it lay over the system centre. It was still
coupled with the low level convergence zone. The Cirrus outflow increased in past 3-hours.
Vertical wind shear (VWS) decreased and was low to moderate (10-15 KTS) over north
Andaman Sea and along the forecast track. Under these conditions, the system maintained
it’s intensity. The upper tropospheric ridge ran along 13oN over the BOB. In the upper level,
similar conditions prevailed and the system moved north-northeastwards, under the
influence of the anticyclonic circulation over southeast Asia and mid tropospheric westerlies.
At 0000 UTC of 3rd April, the system weakened slightly. The low level positive
vorticity reduced and was about 50 – 60 x10-6sec-1 over Andaman Sea to the southeast of
the system centre. The magnitude of positive low level convergence over the system area
also reduced during past 06 hours (5-10 x10-5 sec-1) and was seen along Myanmar coast to
the northeast of the system centre. The upper level divergence became negative (05-10x10-5
sec-1) during past 06 hours leading to subsidence over the system area. Vertical wind shear
(VWS) increased and was moderate (15-20 KTS) over north Andaman Sea. The mid-latitude
westerlies in association with an upper tropospheric trough roughly along 80°E dissolved the
upper tropospheric ridge running along 13°N over the BOB. Under the influence of the
anticyclonic circulation over southeast Asia and the mid tropospheric westerlies the
depression continued to move north-northeastwards.
At 0600 UTC of 3rd April, the low level positive vorticity was about 50–60 x10-6 sec-1
over Andaman Sea and adjoining south Myanmar coast. The magnitude of positive low level
convergence over the system area is around 5-10 x10-5 sec-1 and was now seen along
Myanmar coast. No upper level divergence is seen over the system area. Vertical wind
shear (VWS) is moderate to high (20-25 kts) over north Andaman Sea and adjoining south
Myanmar coast. The adverse environmental conditions like enhanced vertical wind shear,

41
decreased vorticity and decreased convergence over the system area caused the system to
weaken into a well marked low pressure area over north Andaman Sea and adjoining south
Myanmar coast.
2.2.5 Monitoring
2.2.5.1 Features observed through satellite
Satellite monitoring of the system was mainly done by using half hourly INSAT-3D
and 3DR imageries. Satellite imageries of international geostationary satellites Meteosat-8 &
MTSAT, high resolution polar orbiting satellites and scatterometer imageries from
ASCAT/SCATSAT were also considered for monitoring the system. Typical INSAT-3D
visible/ IR imageries, enhanced colored imageries and ASCAT (Met-Op A) imageries are
presented in Fig.2.2.3. The system showed shear pattern during it’s life cycle. The detailed
sat features are discussed in this section.
As per INSAT-3D at 0300 UTC of 31st March, scattered to broken low and medium
clouds with embedded intense to very intense convection lay over southeast BOB and
adjoining Andaman Sea between latitude 5.0⁰N & 10.0⁰N and longitude 90.0⁰E & 96.0⁰E in
association with the LPA over southeast BOB & adjoining south Andaman Sea. Minimum
cloud top temperature is minus 93⁰C.
At 0300 UTC of 1st April, the area of intense convection moved northeastwards
during past 24 hours. The number of clusters with intense to very intense convection also
increased during the period. The clouds started organising around the low level cyclonic
circulation (LLCC) over Andaman Sea. Scattered to broken low and medium clouds
with embedded intense to very intense convection lay over central Andaman Sea adjoining
southeast Bay of Bengal between latitude 6.0⁰N & 12.0⁰N and longitude 91.0⁰E & 97.0⁰E in
association with the LPA. Minimum cloud top temperature was minus 93⁰C. The microwave
imagery indicated broad scale convective cloud banding features building up with the
system.
At 0000 UTC of 02nd April, the system further organized and concentrated into a
depression. The intensity of the system was characterized as T 1.5. Scattered low and
medium clouds with embedded intense to very intense convection lay over north Andaman
Sea and neighbourhood in association with the system. Minimum cloud top temperature was
-93°C.
At 0300 UTC of 02nd April, the intensity of the system was T 1.5. The convection was
organised as shear pattern. Convective clouds clusters sheared to the north of system
centre. A new convective cloud mass emerged near the system centre in last 3 hours. The
area of very intense convection (-93°C) lay over north Andaman Sea & adjoining Andaman
Islands to the northwest of system center. Broken low & medium clouds with embedded
intense to very intense convection lay over north Andaman Sea and adjoining Andaman
Islands between latitude 10.0°N & 15.0°N and longitude 92.0°E & 97.0°E. Minimum cloud
top temperature is -93°C.
At 0600 UTC of 02nd April, the intensity of the system was T 1.5. The convection was
organised as shear pattern. Convective clouds clusters were sheared to north. Three
convective cloud clusters developed in the northern sector of the system in last 3 hours. The
area of very intense convection (-93°C) lay over north Andaman Sea & adjoining Andaman
Islands to the north of system center. Broken low & medium clouds with embedded intense

42
to very intense convection lay over north Andaman Sea and adjoining Andaman Islands
between latitude 10.5°N & 15.5°N and longitude 91.0°E & 97.0°E. Minimum cloud top
temperature is -93°C.
At 1200 UTC of 02nd April, the intensity of the system was T 1.5. The convection was
organised as shear pattern. Convective clouds clusters were sheared to north. The three
clusters merged into two around 0900 UTC. Out of these two, the northern cluster dissipated
and the southern cluster moved north-northeastwards maintaining it’s intensity. The area of
very intense convection (-93°C) lay over north Andaman Sea & Gulf of Martaban to the north
of system center. Broken low & medium clouds with embedded intense to very intense
convection lay over north Andaman Sea and adjoining Andaman Islands between latitude
10.5oN & 17.0oN and longitude 93.5oE & 97.5oE. Minimum cloud top temperature is -93°C.
Fig. 2.2.3a: INSAT-3D IR imageries during life cycle of Depression over North
Andaman Sea during 2nd-3rd April, 2021
At 0000 UTC of 03rd April, the intensity of the system was C.I. 1.5. The clouds
disorganized, however, the winds with maximum sustained intensity (MSW) of 20-25 kts
prevailed over the region. As a result the intensity was characterized as T1.0/C.I. 1.5.
Associated broken low to medium clouds with embedded isolated moderate to intense
02 APRIL/0000 UTC 02 APRIL/1200 UTC
03 APRIL/0000 UTC 03 APRIL/0600 UTC

43
convection lay over north Andaman Sea and adjoining Andaman Islands to the north of lat
11.5 oN. Minimum cloud top temperature of -44oC was seen in the northwest sector.
Convection and structure of the system indicated strong weakening in last 6 hrs.
Fig. 2.2.3 b: INSAT-3D VIS imageries during life cycle of Depression during 02-03
April, 2021
Fig. 2.2.3c: INSAT-3D enhanced colored imageries during life cycle of Depression
during 02-03 April, 2021
02 APRIL/0600 UTC
03 APRIL/0600 UTC

44
At 0300 UTC of 03rd April, the clouds further showed disorganisation. However, low
level clouds indicated the existence of low level cyclonic circulation. The multi-satellite based
derived winds indicated MSW of 20-25 KTS around the system centre. Winds were higher in
the southern sector. The scatterometer based winds also estimated to be around 20-25 KTS.
Thus, though the clouds showed disorganisation, based on the intensity of winds prevailing
over the region, the intensity was characterised as T 1.0/C.I. 1.5. Associated scattered low
and medium clouds with embedded intense to very intense convection lay over north
Andaman Sea between latitude 12.0oN & 15.0oN and longitude 93.5 oE & 97.5 oE. Minimum
cloud top temperature was minus 78oC. Slight increase in convection in western sector of
the system centre was seen during last 3 hours.
At 0600 UTC of 03rd April, the clouds remained same over north Andaman Sea.
Maximum convection lay over north Andaman Sea to the northwest of system centre. The
multi-satellite based derived winds indicated MSW of 10-15 KTS to the east of system
centre. The scatterometer based winds continued to show estimated winds around 20-25
KTS. However, circulation features were not seen in the wind pattern. Thus, intensity of the
system was characterised as T1.0/C.I.1.0. Associated scattered low and medium clouds with
embedded intense to very intense convection lay over north Andaman Sea between latitude
12.5 oN & 15.5 oN and longitude 94.0oE & 97.5oE. Minimum cloud top temperature was -
70oC.
Fig. 2.2.3 d: ASCAT imageries during life cycle of Depression during 02-03 April, 2021
02 April 03 April
02 April 03 April

45
2.2.6. Dynamical features
IMD GFS analysis fields of mean sea level pressure (MSLP), 10m wind, winds at
850, 500 & 200 hPa level are presented in Fig. 2.2.4. The 10m wind analysis based on 0000
UTC of 31st March indicated a cyclonic circulation over south Andaman Sea and adjoining
southeast BoB with vertical extension upto 850 hPa level. At upper level, the ridge was seen
near 100N. On 31st the system lay as an LPA over southeast BoB and adjoining south
Andaman Sea.
Fig.2.2.4 (a): IMD GFS (T1534) mean sea level pressure (MSLP), winds at 10m, 850, 500
and 200 hPa levels based on 0000 UTC of 31st March 2021

46
The 10m wind analysis based on 0000 UTC of 1st April indicated a cyclonic
circulation over south Andaman Sea with vertical extension upto 850 hPa level. At upper
level, the ridge was seen near 130N. IMD GFS could capture the presence of anticyclonic
circulation over southeast Asia and westerlies to the north of 180N. On 1st April, the system
lay as an LPA over south Andaman Sea.
Fig.2.2.4 (b): IMD GFS (T1534) mean sea level pressure (MSLP), winds at 10m, 850, 500
and 200 hPa levels based on 0000 UTC of 1st April 2021

47
The isobaric analysis based on 0000 UTC of 2nd April indicated an LPA over south
Andaman Sea with vertical extension upto 500 hPa level. At 200 hPa level, IMD GFS could
capture the trough in westerlies extending upto central parts of BoB and the anticyclone over
southeast Asia that indicated north-northeastwards movement of the system towards
Myanmar coast. On 1st April, the system lay as a depression over north Andaman Sea.
Fig.2.2.4 (c): IMD GFS (T1534) mean sea level pressure (MSLP), winds at 10m, 850, 500
and 200 hPa levels based on 0000 UTC of 2nd April 2021
The isobaric analysis based on 0000 UTC of 3rd April indicated an LPA over north
Andaman Sea with vertical extension upto 850 hPa level. At 200 hPa level, IMD GFS could
nicely capture the trough in westerlies extending upto central parts of BoB and the
anticyclone over southeast Asia that indicated north-northeastwards movement of the
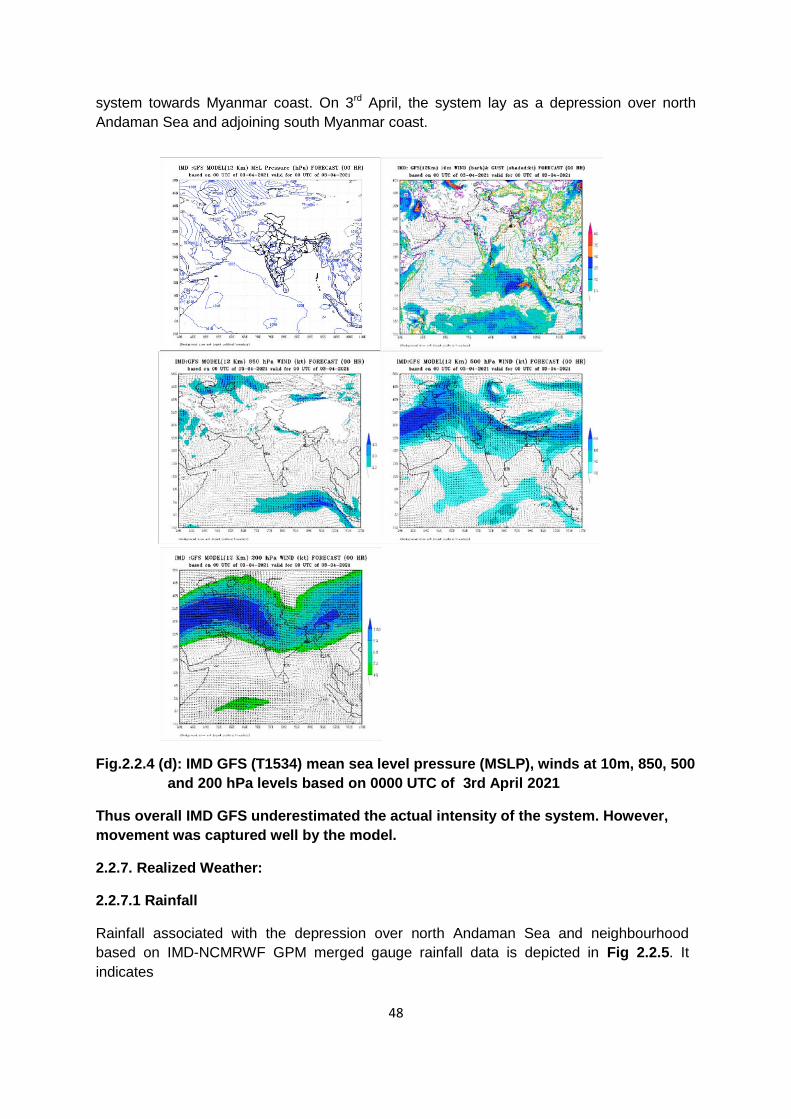
48
system towards Myanmar coast. On 3rd April, the system lay as a depression over north
Andaman Sea and adjoining south Myanmar coast.
Fig.2.2.4 (d): IMD GFS (T1534) mean sea level pressure (MSLP), winds at 10m, 850, 500
and 200 hPa levels based on 0000 UTC of 3rd April 2021
Thus overall IMD GFS underestimated the actual intensity of the system. However,
movement was captured well by the model.
2.2.7. Realized Weather:
2.2.7.1 Rainfall
Rainfall associated with the depression over north Andaman Sea and neighbourhood
based on IMD-NCMRWF GPM merged gauge rainfall data is depicted in Fig 2.2.5. It
indicates

49
Fig.2.2.5: IMD-NCMRWF GPM merged gauge rainfall during 02nd – 03rd April and 7
days average rainfall (cm/day)
Realized 24 hrs accumulated rainfall (≥7cm) ending at 0830 hrs IST of date during the life
cycle of the system is presented below:
Light to moderate rainfall occurred at most places with isolated heavy falls over Andaman Islands
during past 24 hours ending at 0830 hrs IST of 3rd April 2021.
Port Blair reported 7 cm rainfall during the above period.
2.2.7.2. Realised Wind
Realised estimated maximum sustained surface wind was 40-50 kmph gusting to 60
kmph over Andaman Islands on 2nd April.
2.2.8 Damage due to the system
No damage was reported in association with this system.

50
2.3 Extremely Severe Cyclonic Storm TAUKTAE over the Arabian Sea
(14th-19th May, 2021)
2.3.1 Life History of TAUKTAE:
A low pressure area formed over southeast Arabian Sea & adjoining Lakshadweep
area in the morning (0830 hrs IST/ 0300 UTC) of 13th May 2021. It lay as a well
marked low pressure area over Lakshadweep area and adjoining southeast Arabian
Sea in the same evening (1730 hours IST/1200 UTC of 13th May).
Under favourable environmental conditions, it concentrated into a Depression (D)
over Lakshadweep area in the morning (0830 hrs IST) of 14th May, 2021.
It intensified into a Deep Depression (DD) over Lakshadweep area and adjoining
southeast & eastcentral Arabian Sea (EC AS) in the same afternoon (1430 hrs IST/
0900 UTC of 14th May) and into Cyclonic Storm (CS) “TAUKTAE” in the same
midnight (2330 hrs IST/1800 UTC) over the same region.
It moved nearly northwards and further intensified into a Severe Cyclonic Storm
(SCS) in the evening (1730 hrs IST) of 15th May over EC AS.
Continuing to move nearly northwards, it intensified into a Very Severe Cyclonic
Storm (VSCS) over EC AS in the early hours (0230 hrs IST- 2100 UTC / 15th) of 16th
May.
It gradually started moving north-northwestwards from noon (1130 hours IST/0600
UTC) of 16th May and intensified rapidly into an Extremely Severe Cyclonic Storm
(ESCS) in the early hours (0230 hrs IST/16th, 2100 UTC) of 17th May.
Thereafter, it entered in a marginally unfavourable environment, weakened gradually
and crossed Saurashtra coast near latitude 20.8°N and longitude 71.1°E, close to
northeast of Diu (about 20 km northeast of Diu) during 2000-2300 hours IST of 17th
May, 2021 with maximum sustained wind speed of 160-170 kmph gusting to 185
kmph.
During the landfall, the system moved slowly nearly northwards, as it started re-
curving. After landfall, it weakened into a VSCS over Saurashtra in the midnight (2330
hrs IST) of 17th May.
Thereafter, it started moving north-northeastwards and weakened into an SCS in the
morning (0300 UTC) over Saurashtra and further into a CS around noon (0600 UTC)
of 18th May, 2021 over Saurashtra and adjoining Gujarat region.
Continuing to move north-northeastwards, it weakened into a DD over Gujarat region
in the evening (1730 hrs IST) and into a D over Gujarat region and adjoining South
Rajasthan in the midnight (2330 hrs IST) of 18th May. The observed track of the
system is presented in Fig. 2.3.1. The best track parameters of the system are
presented in Table 2.3.1.

51
2.3.2. Salient features:
i. TAUKTAE was the first CS over the north Indian Ocean during the year 2021.
ii. During satellite era (1961-2021), Tauktae was the most intense cyclone after Kandla
cyclone in 1998. During this period, 3 extremely severe cyclonic storms crossed
Gujarat coast. Tracks of tropical cyclones (TCs) crossing Gujarat coast during 1961-
2020 are presented in Fig. 2.3.2. Frequency of TCs crossing Gujarat coast is
presented in Fig.2.3.3. The cyclone Tauktae had the same intensity as that of
Kandla cyclone of June, 1998 at the time of landfall as both had maximum sustained
surface wind speed of 160-170 kmph gusting to 185 kmph at the time of landfall.
However, life time maximum intensity was higher in case of Tauktae, as it had the
maximum intensity of 180-190 gusting to 210 kmph over the east-central Arabian
Sea during early morning to afternoon of 17th May 2021. Table- 2.3.2 provides a
comparison of salient features and damage potential of the two Extremely Severe
Cyclonic Storms viz., Tauktae and Kandla Cyclone.
iii. Tauktae was a very rare cyclone causing adverse weather and damage over entire
west coast states and Union Territories and Lakshadweep as it moved parallel to
west coast and crossed Gujarat.
iv. It had a longer period of the impact of cyclone intensity over Gujarat (about 24 hrs
from 1730 IST of 17th to 1730 IST of 18th May).
v. The track length of the cyclone was 1880 km.
vi. It had rapid intensification for about 24 hrs period during 16th morning (0530
IST/0000 UTC) to 17th morning (0530 IST/0000 UTC), with increase in maximum
sustained wind speed (MSW) from 65 knots at 0530 IST of 16th to 100 knots at 0530
IST of 17th.
vii. The peak MSW of the cyclone was 180-190 kmph (100 knots) gusting to 210 kmph
during 0530 IST (0000 UTC) 0f 17th to 1130 IST (0600 UTC) of 17th over the EC AS.
The lowest estimated central pressure (ECP) was 950 hPa during the period with a
pressure drop of about 50 hPa at the centre as compared to the surroundings
(Fig.2.3.8).
viii. The life period (D to D) of the system was 129 hours (5 days & 9 hours) against long
period average (LPA) (1990-2013) of 165 hours (6 days & 21 hrs) for VSCS
categories over the Arabian Sea during pre-monsoon season.
ix. It moved with 12-hour average translational speed of 14.4 kmph against LPA (1990-
2013) of 11.8 kmph for VSCS category over Arabian Sea during pre-monsoon
season (Fig.2.3.7).
x. The Velocity Flux, Accumulated Cyclone Energy (a measure of damage potential)
and Power Dissipation Index (a measure of loss) were 10.6 X10² knots, 7.7 X 10⁴
knots2 and 6.11 X10⁶ knots3 respectively.
xi. The operational track forecast errors for 24 and 48 hrs lead period were 73 and 113
km respectively against the average long period average (LPA) track forecast errors
of 77 and 117 km during last five years (2016-20) respectively.
xii. The operational absolute error (AE) of intensity (wind) forecast for 24 and 48 hrs lead
period were 4.4 and 8.9 kt against the LPA of 7.9 and 11.4 kt respectively.

52
xiii. The operational landfall point errors were 27 and 71 km for 24 and 48 hrs lead period
against LPA of 32 and 62 km.
xiv. The operational landfall time errors were 3.5 hrs and 6.5 hrs for 24 and 48 hrs lead
period against LPA of 2.5 hrs and 5.0 hrs.
xv. As the cyclone moved parallel to west coast, it caused heavy to extremely heavy
rainfall activity, strong wind and tidal waves affecting Lakshadweep on 13th-14th,
Kerala on 14th-15th, Karnataka on 15th, Goa and south coastal Maharashtra on 15th -
16th, north Maharashtra on 16th -17th, Gujarat, Daman & Diu, Dadra & Nagar Haveli
on 17th and 18th. It‟s remnant also impacted northwest India with heavy to very
heavy rainfall activity at isolated places over Rajasthan, Haryana, Chandigarh, Delhi,
Uttar Pradesh, Uttarakhand on 19th May 2021.
xvi. It also caused strong winds along the west coast of India as well as over
Lakshadweep. Agathi reported maximum sustained wind speed of 45 kts on 14th
May, Panaji reported 46 kts on 16th, Diu reported 85 kts on 17th.
xvii. A total of 41 national bulletins, 30 RSMC bulletins to WMO/ESCAP Panel member
countries, 9 Press Releases, 15 hourly bulletins on the day of landfall, 18 bulletins
for International Civil Aviation, 83 lakh SMS to fishermen, farmers & coastal
population, very frequent updates on social networking sites were sent to trigger
mass response and sensitize masses about the impending disaster in association
with the system.
xviii. While 3 hourly bulletins were issued commencing from cyclone stage, hourly
updates were provided on the day of landfall.
Fig.2.3.1: Observed track of ESCS TAUKTAE during 14th-19th May, 2021

53
Fig.2.3.2: Tracks of (a) CS & above (Total 8), (b) SCS & above (Total 8), (c) VSCS & above (Total 6) and (d) ESCS & above (Total 3) category storms crossing Gujarat coast during 1961-2020
Fig.2.3.3: Frequency of landfalling TCs of Gujarat coast during 1961-2021
(a) (b)
(d) (c)

54
2.3.3 Monitoring of ESCS, „TAUKTAE‟
India Meteorological Department (IMD) maintained round the clock
watch over the north Indian Ocean and the cyclone was monitored since 6th May, about
7 days prior to the formation of low pressure area over southeast Arabian Sea &
adjoining Lakshadweep area on 13th May and 8 days prior to the formation of the D over
Lakshadweep area. The cyclone was monitored with the help of available satellite
observations from INSAT 3D and 3DR, SCAT SAT, polar orbiting satellites and available
ships & buoy observations in the region. The system was also monitored by Doppler
Weather RADARs (DWR) Thiruvananthapuram, Kochi and Goa. Various numerical
weather prediction models run by Ministry of Earth Sciences (MoES) institutions, global
models and dynamical-statistical models were utilized to predict the genesis, track,
landfall and intensity of the cyclone. A digitized forecasting system of IMD was utilized
for analysis and comparison of various models‟ guidance, decision making process and
warning products generation. Typical satellite and radar imageries during ESCS
TAUKTAE are presented in Fig. 2.3.4.
Fig. 2.3.4: Typical INSAT 3D satellite and radar imageries from Doppler Weather Radars Kochi and Goa Table2.3.1: Best track positions and other parameters of the Extremely Severe Cyclonic Storm, “Tauktae” over the Arabian Sea during 14 May- 19 May, 2021
Date
Time (UTC)
Centre lat.0 N/ long. 0 E
C.I. NO.
Estimated Central
Pressure (hPa)
Estimated Maximum Sustained Surface
Wind (kt)
Estimated Pressure
drop at the Centre (hPa)
Grade
14/05/2021
0300 10.5 72.3 1.5 997 25 3 D
0600 11.0 72.5 1.5 996 25 4 D
0900 11.5 72.5 2.0 995 30 5 D
16th May/2000 UTC
DWR Kochi
17th May/1100 IST
INSAT 3D imagery
16th May/0630 UTC

55
1200 11.6 72.6 2.0 995 30 6 DD
1800 12.3 72.6 2.5 993 35 7 CS
2100 12.3 72.6 2.5 992 40 8 CS
15/05/2021
0000 12.7 72.5 2.5 992 40 8 CS
0300 12.8 72.5 2.5 992 40 8 CS
0600 13.2 72.6 2.5 990 45 10 CS
0900 13.5 72.7 2.5 990 45 10 CS
1200 13.8 72.7 3.0 985 55 15 SCS
1500 14.2 72.7 3.0 984 55 16 SCS
1800 14.5 72.6 3.0 982 60 18 SCS
2100 14.7 72.7 3.0 982 60 18 SCS
16/05/2021
0000 15.0 72.7 4.0 979 65 21 VSCS
0300 15.3 72.7 4.0 976 70 24 VSCS
0600 15.7 72.7 4.0 976 70 24 VSCS
0900 16.2 72.6 4.0 976 70 24 VSCS
1200 16.7 72.5 4.5 972 75 28 VSCS
1500 17.2 72.3 4.5 978 80 32 VSCS
1800 17.5 72.0 4.5 964 85 36 VSCS
2100 18.0 71.7 5.0 960 90 40 ESCS
17/05/2021
0000 18.5 71.5 5.5 950 100 50 ESCS
0300 18.8 71.5 5.5 950 100 50 ESCS
0600 19.2 71.4 5.5 950 100 50 ESCS
0900 19.6 71.4 5.5 950 100 50 ESCS
1200 20.1 71.3 5.0 955 95 45 ESCS
1500 20.5 71.2 5.0 960 90 40 ESCS
Crossed Saurashtra coast about 20 km northeast of Diu, near Lat.20.8°N and Long. 71.1°E during 1530-1730 UTC of 17th May 2021 with maximum sustained wind speed of 90 knots gusting to 100 knots.
1800 20.9 71.1 - 964 85 36 VSCS
2100 21.3 71.2 - 972 75 28 VSCS
18/05/2021
0000 21.5 71.2 - 978 65 22 VSCS
0300 21.6 71.3 - 984 55 16 SCS
0600 22.0 71.5 - 990 45 10 CS
0900 22.5 71.8 - 992 40 8 CS
1200 23.1 72.3 - 993 35 7 CS
1500 23.6 72.6 - 994 30 6 DD
1800 24.1 73.0 - 995 30 5 DD
19/05/2021 0000 24.5 73.3 - 996 25 4 D
0300 24.9 73.7 - 997 20 3 D
0600 25.8 74.8 - 997 20 3 D
1200 Weakened into a Well-Marked Low Pressure Area over Northeast Rajasthan.
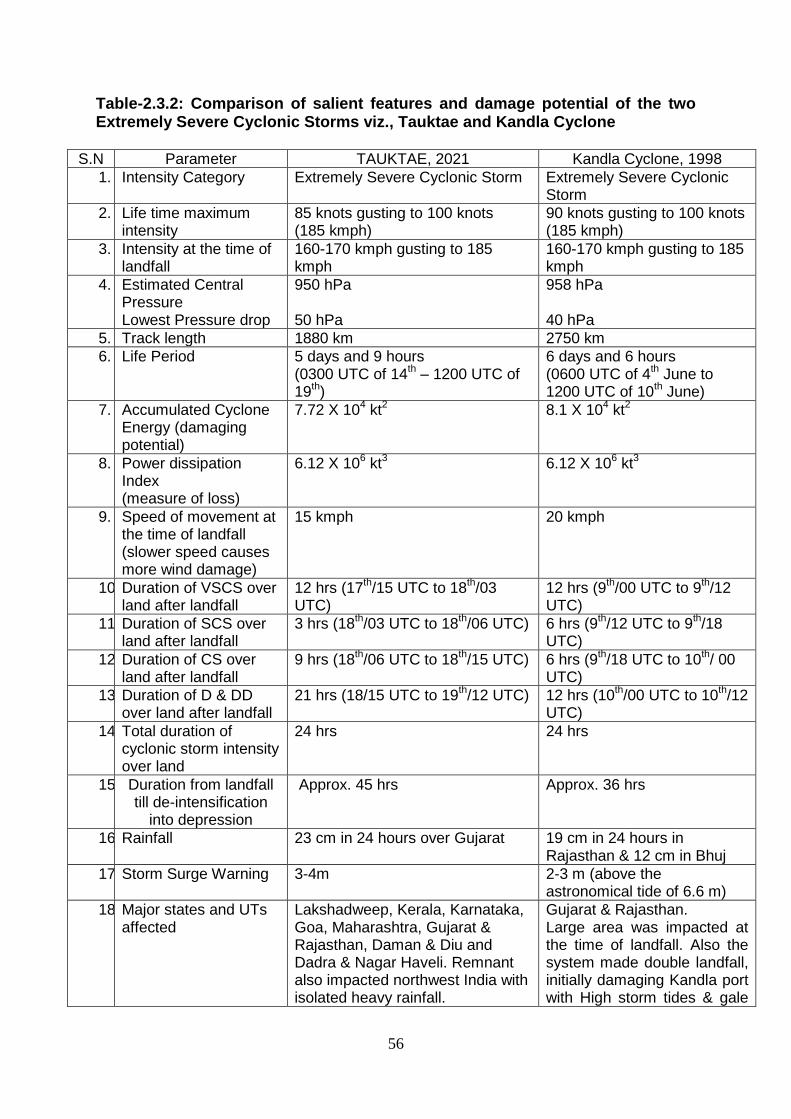
56
Table-2.3.2: Comparison of salient features and damage potential of the two Extremely Severe Cyclonic Storms viz., Tauktae and Kandla Cyclone
S.N Parameter TAUKTAE, 2021 Kandla Cyclone, 1998
1. Intensity Category Extremely Severe Cyclonic Storm Extremely Severe Cyclonic Storm
2. Life time maximum intensity
85 knots gusting to 100 knots (185 kmph)
90 knots gusting to 100 knots (185 kmph)
3. Intensity at the time of landfall
160-170 kmph gusting to 185 kmph
160-170 kmph gusting to 185 kmph
4. Estimated Central Pressure Lowest Pressure drop
950 hPa 50 hPa
958 hPa 40 hPa
5. Track length 1880 km 2750 km
6. Life Period 5 days and 9 hours (0300 UTC of 14
th – 1200 UTC of
19th)
6 days and 6 hours (0600 UTC of 4
th June to
1200 UTC of 10th June)
7. Accumulated Cyclone Energy (damaging potential)
7.72 X 10⁴ kt
2 8.1 X 10
4 kt
2
8. Power dissipation Index (measure of loss)
6.12 X 10⁶ kt
3 6.12 X 10
6 kt
3
9. Speed of movement at the time of landfall (slower speed causes more wind damage)
15 kmph 20 kmph
10. Duration of VSCS over land after landfall
12 hrs (17th/15 UTC to 18
th/03
UTC) 12 hrs (9
th/00 UTC to 9
th/12
UTC)
11. Duration of SCS over land after landfall
3 hrs (18th/03 UTC to 18
th/06 UTC) 6 hrs (9
th/12 UTC to 9
th/18
UTC)
12. Duration of CS over land after landfall
9 hrs (18th/06 UTC to 18
th/15 UTC) 6 hrs (9
th/18 UTC to 10
th/ 00
UTC)
13. Duration of D & DD over land after landfall
21 hrs (18/15 UTC to 19th/12 UTC) 12 hrs (10
th/00 UTC to 10
th/12
UTC)
14. Total duration of cyclonic storm intensity over land
24 hrs 24 hrs
15. Duration from landfall till de-intensification
into depression
Approx. 45 hrs Approx. 36 hrs
16. Rainfall 23 cm in 24 hours over Gujarat 19 cm in 24 hours in Rajasthan & 12 cm in Bhuj
17. Storm Surge Warning 3-4m 2-3 m (above the astronomical tide of 6.6 m)
18. Major states and UTs affected
Lakshadweep, Kerala, Karnataka, Goa, Maharashtra, Gujarat & Rajasthan, Daman & Diu and Dadra & Nagar Haveli. Remnant also impacted northwest India with isolated heavy rainfall.
Gujarat & Rajasthan. Large area was impacted at the time of landfall. Also the system made double landfall, initially damaging Kandla port with High storm tides & gale

57
Large area was impacted at the time of landfall
force winds. After re-emerging into Gulf of Kutch, it made the second landfall near Bhuj.
19. Damages reported Houses damaged-129297
In Gujarat due to effect of cyclone, power supply affected in coastal areas in around 9543 villages/cities.
Minor damage to electricity also reported in Daman & Diu.
Houses damaged – more than 2.5 Lakhs
The total extent of damage to Gujarat state was of the order of Rs. 190 crores (in 1998).
20. Death toll (in Gujarat) 67 Around 3,000
Anaysis of environmental features associated with the genesis, intensification
& movement
2.3.4 Brief Life History
2.3.4.1 Genesis
A near equatorial convergence zone developed over south AS from the
beginning of the second week of May. Cross equatorial flow began strengthening
over the region following the persistence & enhancement of convection since 10th
May. As the cyclonic shear vorticity increased in the lower tropospheric levels, a low
pressure area formed over southeast Arabian Sea & adjoining Lakshadweep area in
the morning (0300 UTC) of 13th May. It became well marked over Lakshadweep
area and adjoining southeast Arabian Sea in the same evening (1200 UTC of
13th May). Under favourable environmental conditions, it concentrated into a D over
Lakshadweep area in the morning (0300 UTC) of 14th May. It intensified into a DD
over Lakshadweep area and adjoining southeast & EC AS in the same afternoon
(0900 UTC of 14th May) and into CS “TAUKTAE” in the same midnight (1800 UTC)
over the same region.
2.3.4.2 Intensification and movement
CS „Tauktae‟ moved nearly northwards and intensified into an SCS in the
evening (1200 UTC) of 15th May over EC AS. Continuing to move nearly
northwards, it further intensified into a VSCS over EC AS in the early hours (2100
UTC of 15th) of 16th May over EC AS. It gradually started moving north-
northwestwards from noon (0600 UTC) of 16th May and intensified rapidly into an
ESCS in the early hours (0000 UTC) of 17th May. Thereafter, it entered in a
marginally unfavourable environment, weakened gradually and crossed Saurashtra
coast near latitude 20.8°N and longitude 71.1°E, close to northeast of Diu (about 20
km northeast of Diu) during 1430 – 1730 UTC of 17th May, with maximum sustained
wind speed of 160-170 kmph gusting to 185 kmph. During the landfall, the system
moved slowly & nearly northward, as it started re-curving under the influence of a

58
trough in mid-latitude westerlies. After landfall, it weakened into a VSCS over
Saurashtra in the midnight (1800 UTC) of 17th May.
Thereafter, it started moving north-northeastwards and weakened into an SCS
in the morning (0300 UTC) over Saurashtra and further into a CS around noon (0600
UTC) of 18th May over Saurashtra and adjoining Gujarat region. Continuing to move
north-northeastwards, it weakened into a DD over Gujarat region in the evening
(1200 UTC) and into a D over Gujarat region and adjoining South Rajasthan in the
midnight (1800 UTC) of 18th May.
2.3.4.3 Environmental features associated with intensification & movement
The index of Madden Julian Oscillation (MJO) remained in Phase 2, though
with amplitude less than 1 all through the life period of the system, thereby providing
environment for enhanced convection over the Arabian Sea (AS). The Tropical
Cyclone Heat Potential (TCHP) was more than 140 KJ/cm2 over southeast AS. It
was comparatively less over central & north AS. Sea Surface Temperature (SST)
was around 30-31oC over southeast AS and around 300C over the rest of the AS.
These Oceanic conditions also continued to prevail during the life Cycle of the
system. The cross equatorial flow in the near equatorial belt was found to be
enhanced in association with a westerly wind burst.
On 14th May morning, the low level cyclonic vorticity was getting further
organised and was around 200 x10-6 s-1 to the south-southwest of system centre
over southeast AS. Low level convergence also increased (40 x10-5 s-1) to the
southwest of system centre. Positive upper level divergence (40 x 10-5 s-1) was seen
to the west-southwest of system centre. Upper tropospheric ridge ran along 12.5oN.
The system remained in a region of low to moderate Vertical Wind Shear (VWS) (10-
15 KTS). Thus under favourable environment of MJO, high SST, high TCHP, good
pole ward outflow, moderate VWS and westerly wind burst, the well marked Low
pressure area concentrated into a D over Lakshadweep area at 0300 UTC of 14th
May.
By 14th evening, the low level cyclonic vorticity was around 150 x10-6 s-1 to the south
of system centre. Low level convergence remained more or less the same (40 x10-5
s-1) to the southwest of system centre. Positive upper level divergence (40 x 10-5 s-1)
was seen to the southwest of the system centre. Upper tropospheric ridge ran along
12.50N. The system at this time remained in a region of moderate to high VWS (25-
30 KTS). Thus under favourable environment of MJO, high SST, high TCHP, good
pole ward outflow and westerly wind burst, the D over Lakshadweep area intensified
into a DD at 1200 UTC of 14th May over the same region.
By the night of 14th May, the Convection over Lakshadweep and adjoining
southeast Arabian Sea organized further and clouds became organized in a curved
band pattern. The cross equatorial flow in the near equatorial belt was further
enhanced due to westerly wind burst. The low level cyclonic vorticity was around 150
x10-6 s-1 to the south of system centre. Low level convergence further increased and
59
was (60 x10-5 s-1) to the west of system centre. Positive upper level divergence (30 x
10-5 s-1) was seen around the system center. Upper tropospheric ridge ran along
12.50N. The system continued to remain in a region of moderate to high vertical wind
shear (VWS) (25-30 KTS). Thus under favourable environment of MJO, high SST,
high TCHP, good pole ward outflow, and westerly wind burst, the DD over
Lakshadweep area intensified into a Cyclonic Storm At 1800 UTC of 14th May.
By the evening of 15th May, the satellite imagery indicated development of a CDO
pattern. The low level cyclonic vorticity was about 250 x10-6s-1 around system centre.
Low level convergence has been (40 x10-5 s-1) to the southwest of system centre.
Positive upper level divergence was (30 x 10-5 s-1) to the south-southwest of the
system centre. Upper tropospheric ridge continued to run along 12.50N. At this
period, the system entered to the region of moderate vertical wind shear (VWS) (15-
20 KTS). Thus under favourable environment of MJO, high SST, high TCHP, good
pole ward outflow, moderate VWS and westerly wind burst, the CS over EC AS
intensified into an SCS at 1200 UTC of 15th May.
In the early morning of 16th May, the clouds organized further. The low level cyclonic
vorticity was about 250 x10-6 s -1 around system centre. Low level convergence was
(40 x10-5 s-1) to the southwest of system centre. Positive upper level divergence
remained to be (20 x 10-5 s-1) around the system centre. Upper tropospheric ridge
shifted northwards and ran along 15 0N. The system at this period was found to be
entering into a region of low VWS (05-10 KTS). Thus, under favourable environment
like MJO, high SST, high TCHP, good pole ward outflow, low VWS and westerly
wind burst, the SCS over eastcentral Arabian Sea rapidly intensified into a VSCS by
0000 UTC of 16th May and into an ESCS by 2100 UTC of 16th May.
On 17th morning, the low level cyclonic vorticity remained to be about 250 x10-6 s -1
around system centre. Low level convergence had further increased and was (60
x10-5 s-1) to the southeast of system centre. Positive upper level divergence has
been (40 x 10-5 s-1) to the south of the system centre. Upper tropospheric ridge ran
along 21 0N. The system continued to remain in the region of low vertical wind shear
(VWS) (10-15 KTS). The movement of the system became faster during past 12
hours due to strong steering from upper tropospheric winds. Thus, under favorable
environment, the ESCS over east-central Arabian Sea moved north northwestwards
maintaining its intensity.
At 1500 UTC of 17th May, just prior to the beginning of the landfall process, the low
level cyclonic vorticity had reduced slightly and was about 200-250 x10-6 s -1 around
system centre. Low level convergence was (40 x10-5 s-1) to the southeast of system
centre. Positive upper level divergence was (30 x 10-5 s-1) which lay to the south of
the system centre. Upper tropospheric ridge continued to run along 21ºN.
The ESCS made landfall during 1530 – 1730 UTC of 17th May and started
weakening further due to land interaction. Still, at 0000 UTC of 18th, the low level
cyclonic vorticity continued to remain about 200-250 x10-6 s -1 around system centre.
Low level convergence was (40 x10-5 s-1) to the south of system centre. Positive

60
upper level divergence was (30 x 10-5 s-1) which also lay to the south of the system
centre. Upper tropospheric ridge ran along 22 0N to the east of the system. Under
these environmental conditions, the system weakened in to a VSCS at 1800 UTC of
17th May.
Subsequently, on 18th morning, the low level cyclonic vorticity reduced and was
about 200-250 x10-6s -1 around system centre. Low level convergence also reduced
and was about (30 x10-5 s-1) to the south of system centre. Positive upper level
divergence remained to be (40 x 10-5 s-1) to the south of the system centre. Upper
tropospheric ridge ran along 23.50N to the east of the system centre. At 0300 UTC of
18th, the system further weakened into a severe cyclonic storm.Around noon of 18th,
the low level cyclonic vorticity further reduced and was about 200 x10-6 s-1 around
system centre. Low level convergence was about (50 x10-5s-1) to the south of system
centre. Positive upper level divergence has been (30 x 10-5 s-1) to the south of the
system centre. Upper tropospheric ridge ran along 23.00 N to the east of the system
centre. At 0600 UTC of 18th, the severe cyclonic storm further weakened into a
cyclonic storm.
During 18th night, he low level cyclonic vorticity remained to be about 200 x10-6 s-1
around system centre. Low level convergence was about (20 X10-5s-1) around the
system centre. Positive upper level divergence reduced and was (10 x 10-5s-1) to the
south of the system centre. Upper tropospheric ridge ran along 23.0 0N to the east of
the system center. At 1500 UTC of 18th, the cyclonic storm further weakened into a
Deep Depression, into a Depression by 0000 UTC of 19th and further into a Well
Marked low by 1200 UTC of 19th May.
The total precipitable water (TPW) vapour imageries (Source: TC Forecaster
Website: https://rammb-data.cira.colostate.edu/tc_realtime/index.asp) during life
cycle of ESCS Tauktae are presented in Fig. 2.3.5. These imageries indicate
continued supply of warm moist around the system centre from the near equatorial
belt in association with the westerly wind burst till the late night of 16th May.
Comparatively Cooler & drier air prevailed to the north of the system all through its
life period. The rapid intensification characteristic exhibited by the system during 00
UTC of 16th to 00 UTC of 17th, could have been aided by this continuous supply of
warm & moist air from the south. However no cold & dry air intrusion could be
attributed to the weakening of the system after landfall. On the other hand the
system maintained the Cyclonic Storm intensity over and for nearly 24 hours under
the favourable interaction with a mid-latitude upper level trough.

61
Fig.2.3.5: Typical total precipitable water vapour imageries during life cycle of
ESCS Tauktae (14th-19th May, 2021). The mean wind speed and wind shear in middle and deep layer is presented in Fig.2.3.6. The mean wind shear speed in the deep layer significantly reduced (<10 knot) especially during the rapid intensification period from 16th morning to17th morning. The mean wind shear in the middle layer remained „low‟ since the genesis until the landfall. This also lowered slightly during the period of rapid intensification. The mean wind direction in the deep layer represented the near northward movement of the system.
19 MAY/0120 UTC
18 MAY/1340 UTC
17 MAY/0140 UTC
15 MAY/1335 UTC
16MAY/1320 UTC
16 MAY/0140 UTC
15 MAY/0120 UTC
19 MAY/1035 UTC
14 MAY/1340 UTC
17 MAY/1935 UTC
17 MAY/1320 UTC
18 MAY/0140 UTC

62
Fig.2.3.6: Wind shear and wind speed in the middle and deep layer around the system during ESCS TAUKTAE (14 May -19 May), 2021
2.3.4.4 Characteristic movement of the system
It moved with 12 hour average translational speed of 14.4 kmph against LPA (1990-
2013) of 11.8 kmph for VSCS category over the Arabian Sea during pre-monsoon
season (Fig.2.3.7). During initial two days of the maturing Phase (1800 UTC of 14th
to 0600 UTC of 16th May), Tauktae moved slower than the average. After maturing
into an ESCS also the movement slowed down when it began re-curving close to its
landfall time. After landfall, the system moved faster than normal as it was steered by
strong upper troposheric westerlies ahead of the trough. Also the system moved
nearly northwards till 1800 UTC of 17th and re-curved northeastwards subsequent to
landfall.
Fig. 2.3.7: Translational speed & direction of movement

63
2.3.4.5 Maximum Sustained Surface Wind speed and estimated central
pressure
The six hourly maximum sustained wind speed and estimated central pressure is
presented in Fig. 8. After landfall, the system exhibited rather slow weakening during
1800 UTC of 17th to 0600 UTC of 19th May. The peak MSW of the cyclone was 180-
190 kmph (100 knots) gusting to 210 kmph during 0530 IST (0000 UTC) 0f 17th to
1130 IST (0600 UTC) of 17th over the EC AS. The lowest estimated central pressure
(ECP) was 950 hPa during the period with a pressure drop of about 50 hPa at the
centre as compared to the surroundings.
Fig. 2.3.8: Maximum sustained surface winds (kts) & Estimated Central
Pressure
2.3.4.6 Features contributed to the rapid intensification of „Tauktae‟
„Tauktae‟ underwent a phase of rapid intensification with increase in maximum
sustained wind speed (MSW) from 65 knots at 0000 IST of 16th to 100 knots at 0000
IST of 17th May.
Apart from the substantial reduction in mean vertical wind shear as illustrated in Fig.
2.3.6 as well as the consistently high values of TCHP (> 140 KJ / cm2 as discussed
above) over major parts of the Arabian Sea, Fig.2.3.9 shows the anomalies of the
skin Sea Surface Temperatures (SSTs) during 14th – 17th May.

64
Fig. 2.3.9: Daily composite Skin SST anomalies over the Arabian Sea during
14th, 15th, 16th & 17th May 2021
The prevalence of a warm pool (in which temperatures above normal by 0.8- 1.2ᵒC)
may be noticed over the east-central Arabian Sea off north Maharashtra coast, over
which the rapid intensification occurred on all the 4 days. Analysis of previous days
(figures not shown) indicates that this warm pool was building up over this specific
region since 4th May. This signifies a major role played by the warmer than normal
SSTs with respect to the rapid intensification of the system.
2.3.5 Features observed via Satellite
At 0300 UTC of 14th May, convection over Lakshadweep and adjoining
southeast Arabian Sea had further organised in a curved band pattern. Associated
minimum cloud top temperature (CTT) was -93ºC. Intensity of the system was
categorised as T 1.5. broken low and medium clouds with embedded intense to very
intense convection lay over Arabian Sea (AS) between latitude 6.0°N & 15.0°N and
long 57.0°E & 78.0°E and Lakshadweep area.
At 1200 UTC of 14th May, convection over Lakshadweep and adjoining southeast
AS had further organised and the curved band pattern continued. Associated
14th
May 15th
May
15th
May 16
th May

65
minimum CTT was -93ºC. Intensity of the system was categorized as T 2.0. broken
low and medium clouds with embedded intense to very intense convection lay over
AS between latitude 6.0°N & 17.0°N and long 58.0°E & 77.5°E and Lakshadweep
area.
At 1800UTC of 14th May, convection over Lakshadweep and adjoining southeast
AS had further organised and clouds the curved band pattern continued. Associated
minimum CTT was -93ºC. Intensity of the system was categorised as T 2.5. broken
low and medium clouds with embedded intense to very intense convection lay over
AS between latitude 10.0°N & 17.0°N and long 67.0°E & 75.0°E and Lakshadweep
area.
At 1200 UTC of 15th May, the intensity of the system was categorised as T 3.5 with
Central Dense Overcast (CDO) pattern. Associated minimum CTT was -93ºC.
Broken low and medium clouds with embedded intense to very intense convection
lay over AS between latitude 11.0°N & 19°N and east of long 65.0ºE.
At 0000UTC of 16th May, the intensity of the system was categorised as T 4.0 with
CDO pattern. Associated minimum CTT was -93ºC. Broken low and medium clouds
with embedded intense to very intense convection lay over AS between latitude
12.0°N & 20°N and east of long 67.0ºE.
At 2100 UTC of 16th, the intensity of the system was categorised as T 5.0 with eye
pattern. However, eye had become ragged. Broken low and medium clouds with
embedded intense to very intense convection lay over EC AS between latitude
13.5°N & 20°N and east of long 67.0ᵒE, over south Konkan, Goa and also over
southwest Madhya Maharashtra.
At 1800 UTC of 17th May, a vortex was seen over northeast Arabian Sea (near
south Gujarat coast) with large ragged eye. Eye temperature was (minus) 13.0ᵒC.
Broken low and medium clouds with embedded intense to very intense convection
lay over EC & adjoining northeast AS between latitude 16.0°N & 22.5°N and east of
long 68.0ᵒE and also over Gulf of Cambay, Gujarat, Konkan, Goa and north Madhya
Maharashtra. Minimum CTT was -93°C.
At 0300 UTC of 18th May, the associated vortex was seen over land (over southwest
Gujarat). Associated broken low and medium clouds with embedded intense to very
intense convection lay over south Rajasthan, Gulf of Kutch, Gulf of Cambay, North
Konkan, Madhya Maharashtra and adjoining Madhya Pradesh and also over
northeast Arabian Sea between latitude 18.0°N & 22.5°N and east of long 69.0ᵒE
and also over Gulf of Cambay, Gujarat, Konkan, Goa and north Madhya
Maharashtra. Minimum CTT was -93°C.
At 1500 UTC of 18th May, associated broken low and medium clouds with
embedded intense to very intense convection lay over south Gujarat, north Konkan,
Gulf of Cambay and adjoining EC AS and moderate to intense convection over south

66
Rajasthan, Gulf of Kutch, south Konkan, Madhya Maharashtra, northwest Vidarbha,
southwest Madhya Pradesh and adjoining EC & northeast AS between latitude
18.0°N & 22.5°N and east of long 65.0ᵒE.
At 1200 UTC of 19th May, the system weakened into a Well-Marked Low Pressure
Area over Northeast Rajasthan and the clouds also became disorganized.
Typical INSAT-3D imageries during the life cycle of ESCS TAUKTAE (14th-19th May) are presented in Fig. 2.3.10(a)-Fig 10(f) and Scatterometer derived winds in Fig. 2.3.11.
Fig. 2.3.10(a): INSAT-3D enhanced colored imageries during life cycle of ESCS TAUKTAE during 14-19 May, 2021
14 MAY/ 0600UTC 14 MAY/ 1200UTC 15 MAY/ 0000UTC
16 MAY/ 1200UTC 17 MAY/ 0600UTC 17 MAY/ 1800UTC
18 MAY/ 0000UTC 18 MAY/ 1800UTC 19 MAY/ 0000UTC

67
Fig. 2.3.10(b): INSAT-3D BD imageries during life cycle of ESCS TAUKTAE during 14-19 May, 2021
14 MAY/ 0600UTC 14 MAY/ 1200UTC 15 MAY/ 0000UTC
16 MAY/ 1200UTC 17 MAY/ 0600UTC 17 MAY/ 1800UTC
18 MAY/ 0000UTC 18 MAY/ 1800UTC 19 MAY/ 0000UTC

68
Fig. 2.3.10(c): INSAT-3D Visible imageries during life cycle of ESCS TAUKTAE during 14-19 May, 2021
Fig. 2.3.10(d) : INSAT-3D IR imageries during life cycle of ESCS TAUKTAE during 14-19 May, 2021
14 MAY/ 0600UTC 15 MAY/ 0600UTC 15 MAY/ 0600UTC
17 MAY/ 0600UTC 17 MAY/ 0900UTC 18 MAY/ 0600UTC
14 MAY/ 0600UTC 14 MAY/ 1200UTC 15 MAY/ 0000UTC
16 MAY/ 1200UTC 17 MAY/ 0600UTC 17 MAY/ 1800UTC
18 MAY/ 0000UTC 18 MAY/ 1800UTC 19 MAY/ 0000UTC

69
Fig. 2.3.10(e): INSAT-3D Cloud Top Brightness Temperature (CTBT) imageries during life cycle of ESCS TAUKTAE during 14-19 May, 2021
14 MAY/ 0600UTC 14 MAY/ 1200UTC 15 MAY/ 0000UTC
16 MAY/ 1200UTC 17 MAY/ 0600UTC 17 MAY/ 1800UTC
18 MAY/ 0000UTC 18 MAY/ 1800UTC 19 MAY/ 0000UTC
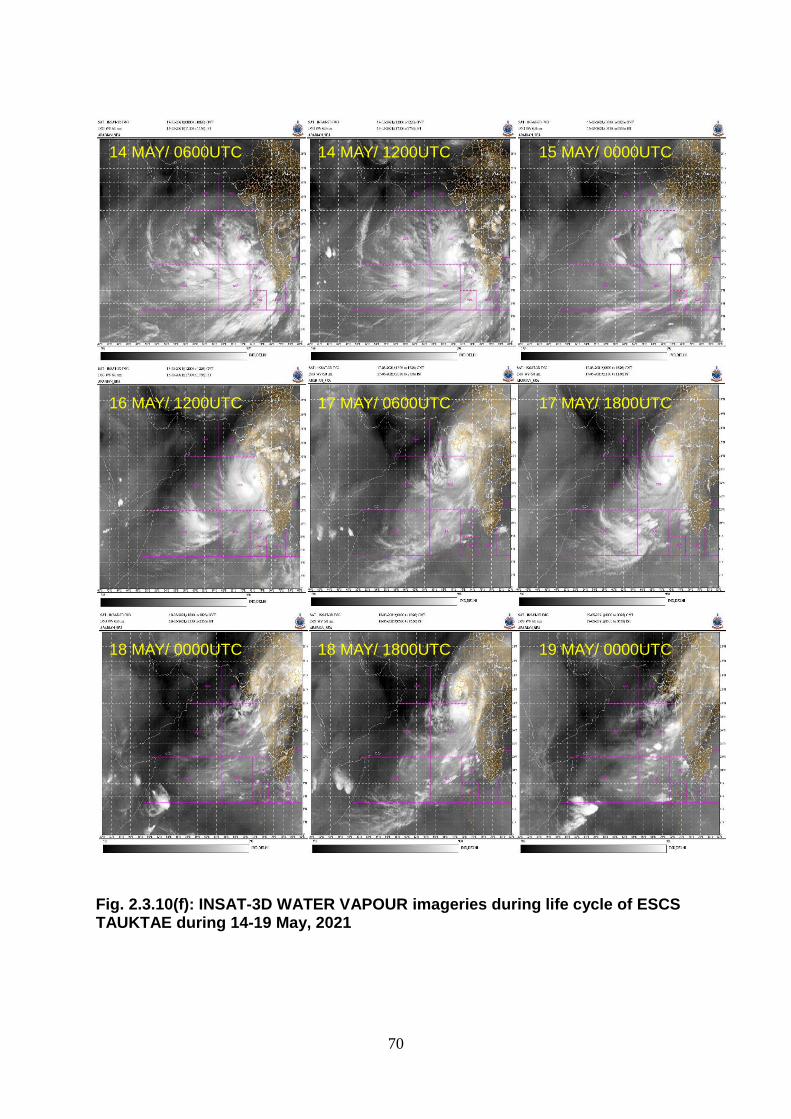
70
Fig. 2.3.10(f): INSAT-3D WATER VAPOUR imageries during life cycle of ESCS TAUKTAE during 14-19 May, 2021
14 MAY/ 0600UTC 14 MAY/ 1200UTC 15 MAY/ 0000UTC
16 MAY/ 1200UTC 17 MAY/ 0600UTC 17 MAY/ 1800UTC
18 MAY/ 0000UTC 18 MAY/ 1800UTC 19 MAY/ 0000UTC
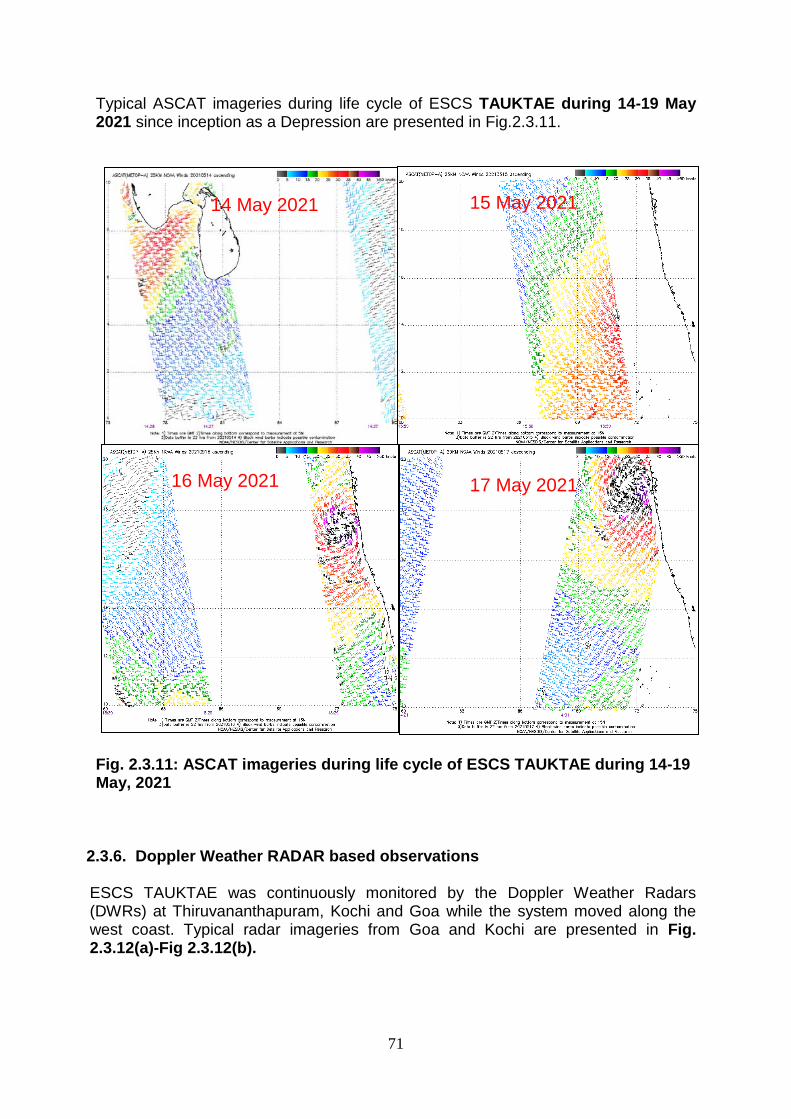
71
Typical ASCAT imageries during life cycle of ESCS TAUKTAE during 14-19 May 2021 since inception as a Depression are presented in Fig.2.3.11.
Fig. 2.3.11: ASCAT imageries during life cycle of ESCS TAUKTAE during 14-19 May, 2021
2.3.6. Doppler Weather RADAR based observations ESCS TAUKTAE was continuously monitored by the Doppler Weather Radars (DWRs) at Thiruvananthapuram, Kochi and Goa while the system moved along the west coast. Typical radar imageries from Goa and Kochi are presented in Fig. 2.3.12(a)-Fig 2.3.12(b).
14 May 2021 15 May 2021
16 May 2021 17 May 2021

72
Fig. 2.3.12(a): Typical Radar Max dBZ imageries from DWR GOA during 15-16 May, 2021
15 MAY/0153UTC 15 MAY/0800UTC 15 MAY/1140UTC 15 MAY/1620 UTC 15 MAY/2230 UTC 16 MAY/0230 UTC 16 MAY/0925 UTC 16 MAY/1438 UTC 16 MAY/1850 UTC

73
Fig. 2.3.12 (b): Typical Radar Max Z imageries from DWR Kochi during 14-15 May, 2021 2.3.7 Dynamical features
IMD GFS analysis of mean sea level pressure, winds at 10m, 850 hPa, 500 hPa and 200 hPa levels based on 0000 UTC during 12th -19th May, 2021 are presented in Fig.2.3.13(a)–(h). On 12th May 00 UTC, IMD GFS indicated presence of strong (30 – 40 knots) near equatorial westerlies at 10 m level in association with a near equatorial convergence zone over south Arabian Sea.
14 MAY/01UTC 14 MAY/07UTC 14 MAY/09UTC
14 MAY/11UTC 14 MAY/21UTC 15 MAY/06UTC

74
Fig. 2.3.13 (a): IMD GFS (T 1534) mean sea level pressure (MSLP), winds at 10m, 850, 500 and 200 hPa levels based on 0000 UTC of 12th May,2021
On 13th May 00 UTC, IMD GFS indicated the continued presence of strong
(30 – 40 knots) near equatorial westerlies at 10 m level in association with a near equatorial convergence zone over south Arabian Sea and also indicated deepening of westerlies upto 500 hPa level.

75
Fig. 2.3.13 (b): IMD GFS (T 1534) mean sea level pressure (MSLP), winds at
10m, 850, 500 and 200 hPa levels based on 0000 UTC of 13th May,2021
On 14th May 00 UTC, IMD GFS indicated a Depression over Lakshadweep
area and adjoining southeast Arabian Sea with vertical extension of the cyclonic circulation upto 500 hPa level. The system in reality became a Depression about 3 hours later, ie, around 0300 UTC of 14th.

76
Fig. 2.3.13 (c): IMD GFS (T 1534) mean sea level pressure (MSLP), winds at
10m, 850, 500 and 200 hPa levels based on 0000 UTC of 14th May, 2021
On 15th May 00 UTC, IMD GFS indicated a Cyclonic Storm of severe intensity
over southeast & adjoining east central Arabian Sea with vertical extension of the cyclonic circulation upto 500 hPa level. Actually, it was a Cyclonic storm at 00 UTC of 15th May over southeast AS and adjoining Lakshadweep area. IMD GFS had significantly over estimated the intensity of the system.

77
Fig. 2.3.13 (d): IMD GFS (T 1534) mean sea level pressure (MSLP), winds at 10m, 850, 500 and 200 hPa levels based on 0000 UTC of 15th May,2021
On 16th May 00 UTC, IMD GFS indicated rapid intensification of the system. It lay as an Extremely Severe Cyclonic Storm over EC AS very close to Goa coast, with vertical extension of the cyclonic circulation upto 500 hPa level. GFS also indicated near northward movement of the system, very close to west coast. Actually, it was a Very Severe cyclonic storm at 0000 UTC of 16th May over EC AS.

78
IMD GFS over estimated the intensity of the system and also its proximity to the coast.
Fig. 2.3.13 (e): IMD GFS (T 1534) mean sea level pressure (MSLP), winds at
10m, 850, 500 and 200 hPa levels based on 0000 UTC of 16 May,2021
On 17th May 00 UTC, IMD GFS indicated further intensification of the system. It lay as a Super cyclonic storm over EC AS, close to north Maharashtra coast with vertical extension of the cyclonic circulation upto 200 hPa level. GFS also indicated near northwards movement of the system, gracing the west coast. Actually, it was an

79
extremely severe cyclonic storm at 0000 UTC of 17th May over EC AS. IMD GFS slightly over estimated the intensity of the system.
Fig. 2.3.13 (f): IMD GFS (T 1534) mean sea level pressure (MSLP), winds at
10m, 850, 500 and 200 hPa levels based on 0000 UTC of 17th May,2021
On 18th May 00 UTC, IMD GFS indicated the system, soon after making landfall, lying over south coastal Saurashtra. Actually, the system crossed Saurashtra coast and weakened slightly into a VSCS over coastal Saurashtra by this time. This feature was correctly simulated by the model.

80
Fig.2.3.13 (g): IMD GFS (T 1534) mean sea level pressure (MSLP), winds at
10m, 850, 500 and 200 hPa levels based on 0000 UTC of 18th May,2021
On 19th May 00 UTC, IMD GFS indicated weakening of the system into a CS
category and located over Gujarat – Rajasthan border. The presence of a trough in the mid-latitude westerlies in phase with the system at 500 hPa was also simulated well. By this time the system had weakened into a Depression over north Gujarat &
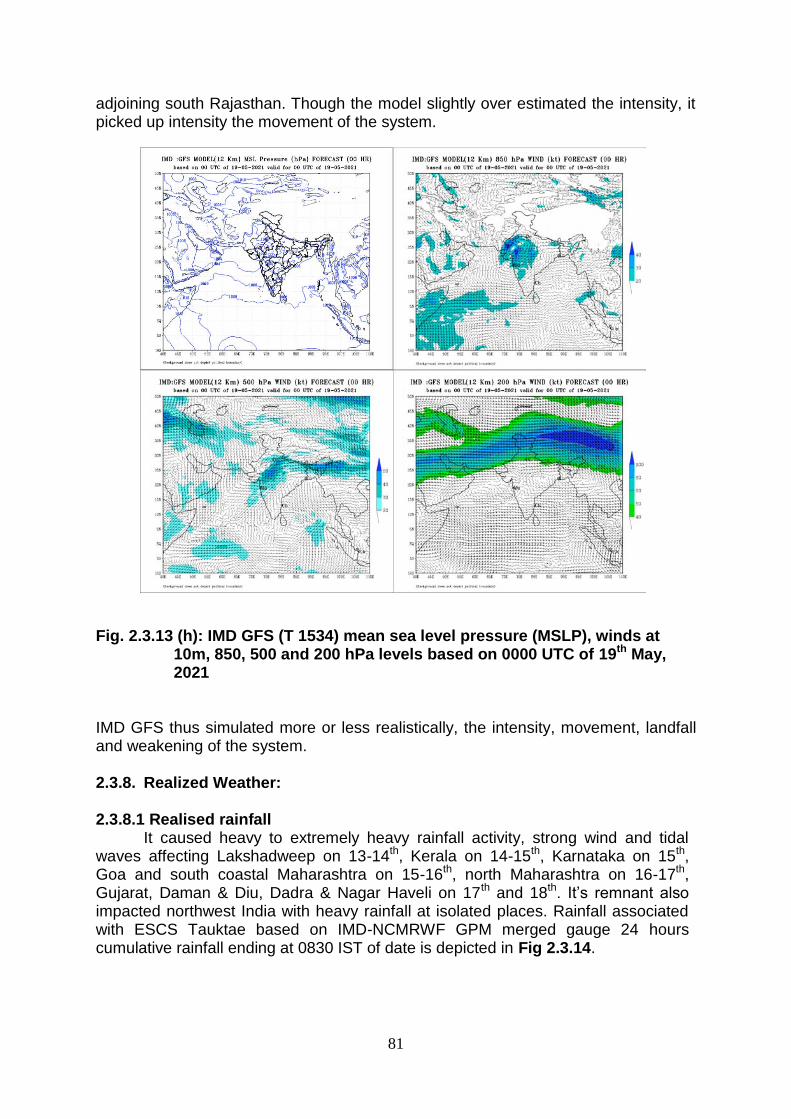
81
adjoining south Rajasthan. Though the model slightly over estimated the intensity, it picked up intensity the movement of the system. Fig. 2.3.13 (h): IMD GFS (T 1534) mean sea level pressure (MSLP), winds at
10m, 850, 500 and 200 hPa levels based on 0000 UTC of 19th May, 2021
IMD GFS thus simulated more or less realistically, the intensity, movement, landfall and weakening of the system. 2.3.8. Realized Weather: 2.3.8.1 Realised rainfall
It caused heavy to extremely heavy rainfall activity, strong wind and tidal waves affecting Lakshadweep on 13-14th, Kerala on 14-15th, Karnataka on 15th, Goa and south coastal Maharashtra on 15-16th, north Maharashtra on 16-17th, Gujarat, Daman & Diu, Dadra & Nagar Haveli on 17th and 18th. It‟s remnant also impacted northwest India with heavy rainfall at isolated places. Rainfall associated with ESCS Tauktae based on IMD-NCMRWF GPM merged gauge 24 hours cumulative rainfall ending at 0830 IST of date is depicted in Fig 2.3.14.

82
Fig.2.3.14: IMD-NCMRWF GPM merged gauge 24 hr cumulative rainfall (cm)
ending at 0830 IST of date during 13th May – 18th May and 7 days average rainfall (cm/day)
Rainfall (cm) reported (realised during the past 24 hours ending at 0830 hrs IST of date) along the west coast during 12th-20th May, 2021
Realized 24 hrs accumulated rainfall (≥7cm) ending at 0830 hrs IST of date during the
life cycle of the system is presented below:
12 May
LAKSHADWEEP: Agathi-8, Minicoy-1.
13 May
LAKSHADWEEP: Agathi-17, Amini-8, Minicoy-5.
14 May
KERALA & MAHE: Mavelikara-15, Konni-14, Kayamkulam-14, Kayamkulam Agri-13,
Neyyattinkara-11, Nedumangad-11, Kottayam-11, Kurudamannil-10, Varkala-10,
Mancompu-9, Kozha-9, Vaikom-9, Haripad-9, Kumarakam-9, Chalakudi-8, Aluva-8,
Thritala-7, Kochi C.I.A.L.-7, Ernakulam South-7
LAKSHADWEEP: Agathi-12.
SOUTH INTERIOR KARNATAKA: Balehonnur-7
15 May
COASTAL KARNATAKA: Mangaluru AP - 8, Panambur - 7, Mangaluru-7,
KERALA & MAHE: Kochi-21, Peermade-21, Kodungallur-20, Enamakkal-19, Ernakulam
South-17, Kumarakam-16, Kannur-16, Kollam-16, Alapuzha-16, Chalakudi-15,
Irinjalakuda-15, Ponnani-14, Pattambi-14, Vaikom-14, Cherthala-13, Kozhikode-13,
Varkala-13, Mancompu-13, Thritala-13, Mavelikara-12, Aluva-12, Kayamkulam-12,
Kurudamannil-11, Konni-11, Quilandi-11, Perumpavur-11, Taliparamba-11, Vellanikkara-
11, Kochi C.I.A.L.-11, Kottayam-11, Haripad-11, Vadakkancherry-11, Kozha-11,
Kanjirappally-10, Munnar KSEB-10, Manjeri-10, Mahe-9, Perinthalmanna-9, Vadakara-9,

83
Ottapalam-9, Punalur-9, Talassery-9, Hosdurg-9, Piravam-8, Nilambur-8, Angadipuram-
8, Vyttiri-8, Karipur -7, Thodupuzha-7, Kudulu-7, Neyyattinkara-7
LAKSHADWEEP: Agathi-10, Amini-8
16 May
KONKAN & GOA: Canacona-7, Pernem-7
COASTAL KARNATAKA: Kollur-24, Manki-19, Kota-19, Puttur -19, Kundapur-17,
Bhatkal-16, Udupi-15, Dharmasthala-14, Mani-13, Mulki-12, Karkala-11, Shirali -11,
Mangaluru -11, Kadra-11, Panambur -10, Karwar -10, Mudubidre-10, Belthangadi-9,
Honavar -9, Gokarna-9, Vitla ARG-9, Sulya-8, Siddapura-8
NORTH INTERIOR KARNATAKA: Vijayapura-8
SOUTH INTERIOR KARNATAKA: Hosanagara-19, Bhagamandala-17, Kalasa-13,
Virajpet-13, Linganamakki -9, Thalaguppa-7, Sagar-7
KERALA & MAHE: Mahe-24, Vadakara-23, Vyttiri-21, Taliparamba-17, Talassery-17,
Quilandi-16, Ernakulam South-14, Kochi I.A.F.-14, Kochi C.I.A.L.-13, Aluva -13,
Manantoddy-13, Irikkur-13, Kannur-12, Piravam-11, Perumpavur-11, Enamakkal-11,
Kudulu-10, Thodupuzha-10, Karipur.-10, Munnar KSEB-10, Varkala-10, Kozha-9,
Vaikom-9, Nilambur-9, Neyyattinkara-9, Idukki-9, Vadakkancherry-8, Nedumangad-8,
Parambikulam-8, Irinjalakuda-8, Perinthalamanna-8, Pattambi-8, Angadipuram-8,
Kozhikode-8, Ottapalam-8, Peerumade -8, Chalakudi-7, Ponnani-7,
Thiruvananthapuram-7, Ambalavayal-7, Mannarkkad-7, Myladumpara Agri-7, Thritala-7
17 May
KONKAN & GOA: Sawantwadi-37, Ratnagiri -36, Dodamarg-25, Panjim -23, Malvan-21,
Kudal-20, Devgad-20, Kankavli-19, Vengurla -18, Mapusa-17, Lanja-16, Dabolim- Navy-
15, Vaibhavwadi-15, Sangameshwar Devrukh-14, Guhagarh-12, Margao-12, Dapoli Agri-
8, Harnai -8, Sanguem-7
COASTAL KARNATAKA: Kadra-11, Honavar -7, Kollur-7
18 May
GUJARAT REGION: Umergam-18, Daman-15, Daman FMO-13, Surat City-9, Khanvel-
8, Valsad-8, Silvassa-7
SAURASHTRA & KUTCH: Bagasra-21, Gir Gadhada-19, Una-17, Savarkundla-17,
Palitana-16, Amreli-13, Mahuva-13, Rajula-13, Khambha-13, Babra-13, Gadhda-11,
Visavadar-10, Diu-9, Umrala-9, Bhavnagar-8, Dhari-7, Jesar-7
KONKAN & GOA: Palghar Agri-30, Dahanu -28, Santacruz -23, Devgad-23,
Sawantwadi-21, Colaba -21, Talasari-17, Canacona-9, Tbia -9, Kankavli-9, Murud-8,
Wada-8
19 May
GUJARAT REGION: Nadiad-23, Mahudha-16, Anand-16, Daman FMO-15, Umergam-
15, Matar-15, Pardi-14, Daman-14, Khambhat-13, Kheda-13, Tarapur-13, Vaso-13,
Olpad-12, Khergam-12, Mahemdavad-12, Dhansura-11, Ahmedabad City-11, Jalalpor-
11, Sojitra-11, Kathalal-11, Prantij-10, Wanakbori-10, Borsad-10, Navsari-10, Kapadvanj-
10, Virpur-10, Modasa-10, Balasinor-9, Dahegam-9, Bayad-9, Bardoli-9, Talod-9,
Madhban-9, Valsad-9, Hansot-9, Vadodara-9, Vagra-9, Meghraj-9, Bhiloda-8,
Himatanagar-8, Kamrej-8, Anklav-8, Silvassa-8, Padra-8, Palsana-7, Gandevi-7, Thasra-

84
7, Galteshwar-7, Idar-7, Vapi-7, Poshina-7, Chikhli-7, Sanand-7, Vijapur-7, Khanpur-7,
Kaprada-7, Kalol-7, Dascroi-7, Mahuva-7, Lunawada-7, Danta-7, Malpur-7, Petlad-7,
SAURASHTRA & KUTCH: Gir Gadhada-19, Una-18, Bhavnagar-11, Rajula-10, Botad-9,
Shihor-9, Visavadar-8, Palitana-8, Vallabhipur-8, Umrala-7,
EAST RAJASTHAN: Veja-23, Kanva-14, Devel-14, Dungarpur Tehsil-14, Dhambola-13,
Sarara-13, Girva-11, Aspur-11, Gogunda-10, Ganeshpur-10, Ajmer Tehsil-9, Railmagra-
9, Dungla-9, Sagwara-8, Jhadol-8, Udaipur/D-Aero-8, Ajmer-7, Tatgarh-7, Salumber-7,
Nithuwa-7, Bari-Sadri-7, Loharia-7, Dhariabad-7, Badesar-7,
20th May:
UTTARAKHAND: Nainital-12; Mussoorie-10; Mukteshwar-9; Haldwani-8
HARYANA, CHANDIGARH & DELHI: Jhajjar-12; Gurgaon-11; Mewat-8; Faridabad-8;
Narnaul-8
WEST UTTAR PRADESH: Bareilly-15; Meerut-9; Aligarh-7; Muzzafarnagar-7
EAST UTTAR PRADESH: Gorakhpur-8; Varanasi-8; Sultanpur-7; Mirzapur-7, Jaunpur-7,
WEST RAJASTHAN: Nagaur-7
EAST RAJASTHAN: Dholpur-10; Alwar-9; Jaipur-8, Dausa-7; Sikar-7
2.3.8.2 Realised / recorded wind speed
Some of the Peak wind speed (kmph) recorded by the Meteorological Observatories in
association with the passage of TAUKTAE are:
Agathi reported maximum sustained wind speed of 45 kts on 14th May, Panaji reported
46 kts on 16th. The maximum wind at the time of landfall over Gujarat and Diu was 90
kts gusting to 100 kts (160-170 kmph gusting to 185 kmph) on 17th May.
2.3.8.3 Storm Surge
It was estimated that about 3-4 meters of storm surge above the astronomical tide
inundated the low lying areas of coastal districts of Saurashtra around the time of
landfall.
2.3.9. Damage due to ESCS TAUKTAE
Since the system moved along & off the west coast, it affected all the States & Union
Territories along the west coast of India.
As per the situation report #3 published by „UNICEF‟ on 20th May, more than 120
people lost their lives as detailed below:
Kerala : 20, Karnataka : 09 , Goa : 03 ,Maharashtra : 19
Gujarat : 67 people including 23 women have been killed across 13 districts of
Gujarat . Number of Livestock lost: 635
TOTAL death toll is estimated to be 118.
Ten districts of Maharashtra & 17 Districts of Gujarat were impacted. The number of
Houses damaged was 1532 in Kerala, 1576 in Maharashtra and 16,500 in Gujarat. A
total of 1.1 Million people were affected in 421 villages.
Apart from this, 26 people died and more than 50 were reported to be missing after a Barge sank into the Arabian Sea off coast of Mumbai (Maharashtra). Fig. 2.3.15 (a)–(h) shows the Photographs of a few damages.

85
Fig. 2.3.15:(a) Fishing boat damage due to cyclone at Jaafrabaad fishing harbor (b)
Indian Navy in the coastal village of Chellanam in Ernakulam district (Kerala) which
was heavily hit by tidal waves (c) House Collapses into the Sea In Kasargod (Kerala)
due to the effect of Cyclone Tauktae. (d) Rough Sea waves crash against the
Bhagavathi Prem Sinken Dredger, at Surathkal Beach near Mangaluru (PTI) (e)
uprooted trees in Goa (f) & (g) flood in Mumbai (h) Strong winds uproot electric
poles at Bidarahalli near Chikmagalur(PTI)
(a) (b)
(c) (d)
(e) (f)
(g) (h)
(g)

86
2.4. VSCS YAAS over Bay of Bengal during 23rd May – 28th May, 2021
2.4.1 Introduction
A low pressure area formed over eastcentral Bay of Bengal (BoB) in the morning (0830 IST/0300 UTC) of 22nd May. It lay as a well marked low pressure area (WML) in the same afternoon (1430 IST/0900 UTC) over eastcentral BoB.
Under favourable environmental conditions, it concentrated into a depression over eastcentral BoB in the noon (1130 IST/0600 UTC) of 23rd May, 2021.
It moved northwestwards and intensified into a deep depression (DD) over eastcentral BoB in the midnight (2330 IST/1800 UTC) of 23rd May and into the Cyclonic Storm(CS) “YAAS” in the early morning (0530 IST/0000 UTC) of 24th over the same region.
It moved nearly north-northwestwards and intensified into a Severe Cyclonic Storm (SCS) in the midnight (2330 IST/1800 UTC) of 24th May over eastcentral BoB.
It started moving northwards from the morning (0830 IST/0300 UTC) of 25th and intensified into a Very Severe Cyclonic Storm (VSCS) in the evening (1730 IST/1200 UTC) over northwest BoB.
Thereafter, it moved north-northwestwards reached peak intensity of 75 knots(kt) and lay centred over northwest BoB about 30 km east of Dhamra Port, Odisha during early morning (0530 IST/0000 UTC) of 26th May.
Continuing to move north-northwestwards, it crossed north Odisha coast near latitude 21.35°N and longitude 86.95°E, about 20 km to the south of Balasore as a VSCS with maximum sustained wind speed (MSW) of 75 kts gusting to 85 kts (130 -140 kmph gusting to 155 kmph) between 1030-1130 IST (0500-0600 UTC) of 26th.
Further moving north-northwestwards, it weakened rapidly into a VSCS over north coastal Odisha in the afternoon (1430 IST/0900 UTC), into a VSCS over north Odisha in the evening (1730 IST/1200 UTC) and into a DD in the midnight (2330 IST/1800 UTC) of 26th over north interior Odisha and adjoining Jharkhand.
It weakened into a depression over central parts of Jharkhand in the noon (1130 IST/0600 UTC) of 27th. Thereafter, it moved northwestwards and weakened into a well-marked low pressure area over Bihar and adjoining southeast Uttar Pradesh (UP) in the early morning (0530 IST/0000 UTC) of 28th May. It became a low pressure area over southeast UP and adjoining Bihar on 28th evening (1730 IST/1200 UTC) and became less marked on 29th morning (0530 IST/0000 UTC).
The observed track of the system is presented in Fig. 2.4.1. The best track parameters of the system are presented in Table 2.4.1.
Fig. 2.4.1: Observed track of VSCS, YAAS during 23rd-28th May, 2021

87
Table 2.4.1: Best track positions and other parameters of the Very Severe Cyclonic Storm, “YAAS” over the Bay of Bengal during 23 May- 28 May, 2021
2.4.2 Salient Features:
It developed just after 4 days of the dissipation of extremely severe Very Severe
Cyclonic Storm (ESCS) Tauktae over the Arabian Sea (14-19 May). Such back to back
or simultaneous occurrence of cyclones over the BoB and Arabian Sea (AS) is not
rare. Considering past 10 years statististics (2010-2020), similar back to
back/simultaneous occurrence of Very Severe Cyclonic Storms over BoB & AS has
Date
Time (UTC)
Centre lat.0 N/ long. 0 E
C.I. NO.
Estimated Central
Pressure (hPa)
Estimated Maximum Sustained Surface
Wind (kt)
Estimated Pressure
drop at the Centre (hPa)
Grade
23.05.21
0600 16.1 90.2 1.5 996 25 4 D
1200 16.2 89.9 1.5 994 25 4 D
1800 16.3 89.7 2.0 992 30 5 DD
24.05.21
0000 16.3 89.7 2.5 990 35 7 CS
0300 16.5 89.6 2.5 988 40 8 CS
0600 16.4 89.6 2.5 988 40 8 CS
0900 16.8 89.5 2.5 988 40 8 CS
1200 17.1 89.3 3.0 986 45 10 CS
1500 17.4 89.2 3.0 986 45 10 CS
1800 17.6 89.0 3.0 984 50 12 SCS
2100 17.8 88.9 3.5 982 55 14 SCS
25.05.21
0000 18.0 88.6 3.5 980 55 16 SCS
0300 18.3 88.3 3.5 980 55 16 SCS
0600 18.7 88.0 3.5 978 60 18 SCS
0900 19.1 88.1 3.5 978 60 18 SCS
1200 19.5 88.0 4.0 976 65 20 VSCS
1500 19.8 87.9 4.0 976 65 20 VSCS
1800 20.1 87.8 4.0 974 70 24 VSCS
2100 20.4 87.6 4.0 970 75 28 VSCS
26.05.21
0000 20.8 87.3 4.0 970 75 28 VSCS
0300 21.2 87.1 4.0 970 75 28 VSCS
Crossed north Odisha coast near Latitude 21.35°N and Longitude 86.95°E, about 20 km to the south of Balasore as a VSCS with maximum sustained wind speed of 75 knots gusting to 85 knots (130 -140 kmph gusting to 155 kmph) between 0500 & 0600 UTC
0600 21.4 86.9 - 970 75 28 VSCS
0900 21.6 86.7 - 978 55 16 SCS
1200 21.8 86.6 - 984 45 10 CS
1500 22.2 86.2 - 986 40 8 CS
1800 22.5 86.0 - 988 30 6 DD
27.05.21
0000 22.8 85.8 - 988 30 6 DD
0300 23.1 85.7 - 990 30 6 DD
0600 23.5 85.6 - 991 25 5 D
1200 24.3 85.3 - 992 25 4 D
1800 24.7 84.8 992 25 4 D
28.05.21 0000 Weakened into a well marked low pressure area over Bihar and adjoining east Uttar Pradesh

88
been observed in 2020 (Gati, AS-Nivar, BoB), 2019 (Maha, AS-Bulbul, BoB), 2018
(Luban, AS-Titli, BoB), 2018 (Sagar & Mekunu both AS), 2016 (Nada & Vardah both
BoB), 2015 (Chapala & Megh both AS), 2013 (Helen, Lehar & Madi all BoB), 2010
(Laila, BoB- Bandu, AS).
During satellite era (1965-2020), 3 VSCS and above intensity storms crossed Odisha coast (1 VSCS (May1989, 65 kt), 2 ESCS (May 1982, 90 kt & Fani, May 2019, 100 kt) in the month of May. YAAS was the 4th such storm (VSCS, 75 kt) crossing Odisha coast in the month of May during 1965-2021.
It affected relatively less area as compared to Tauktae causing adverse weather over Andaman & Nicobar Islands, Odisha & West Bengal (till 26th May) and Jharkhand, Bihar and East UP after landfall.
It had a straight north-northwestwards moving track (Fig. 2.4.1).
The track length of the cyclone was 1100 km.
It moved with 12 hour average translational speed of 10.9 kmph against LPA (1990-2013) of 13.7 kmph for VSCS category over BoB during pre-monsoon season (Fig. 2.4.4a).
The peak MSW of the cyclone was 130-140 kmph gusting to 155 kmph (75 kt gusting to 85 kt) during 0230 IST of 26th to 1130 IST of 26th over the northwest BoB. The lowest estimated central pressure was 970 hPa during the period with a pressure drop of 28 hPa at the centre compared to surroundings (Fig. 2.4.4b).
It had rapid weakening after landfall with intensity falling by 35 kt in just 9 hours. The system maintained the intensity of VSCS after landfall for 12 hours (0600 to 1800 UTC of 26th).
The life period (D to D) of the system was 114 hours (4 days & 18 hours) against long period average (LPA) (1990-2013) of 134 hours (5 days & 14 hrs) for VSCS/ESVSCS categories over the BoB during pre-monsoon season. Thus, it had a comparatively lower life period.
The Velocity Flux, Accumulated Cyclone Energy (a measure of damage potential) and Power Dissipation Index (a measure of loss) were 0.6 X10² kt, 3.6 X 10⁴ kt2 and 2.3 X10⁶ kt3 respectively.
The track forecast errors for 24, 48 and 72 hrs lead period were 24.1, 53.1 and 81.6
km respectively against the LPA(2016-20) errors of 77, 117 and 159 km respectively
The landfall point forecast errors for 12, 24, 48 and 60 hrs lead period were 7.8, 7.8,
7.8 and 38.9 km respectively against the LPA (2016-20) errors of 17, 32, 62 and 61 km
during 2016-20 respectively. Thus there was almost zero landfall point forecast error
48 hrs in advance.
The landfall time forecast errors for 12, 24, 48 and 60 hrs lead period were 1.0, 1.0, 2.5
and 3.5 hours respectively against the LPA errors (2016-20) of 1.3, 2.5, 5.0 and 5.3
hours during 2016-20 respectively. Thus there was almost zero landfall time forecast
error 48 hrs in advance
The absolute error (AE) of intensity (wind) forecast for 24, 48 and 72 hrs lead period
were 13.7, 12.9 and 14.1 knots against the LPA errors of 7.9, 11.4, and 14.1 knots
during 2016-20 respectively
Initially in its formative stage, it caused heavy to very heavy rainfall and Squally winds
and tidal waves over Andaman & Nicobar Islands on 23rd & 24th May. It caused heavy
to extremely heavy rainfall activity at isolated places over coastal Odisha on 25th May
and heavy to very heavy rainfall at a few places and extremely heavy rains at isolated
places on 26th May over north Odisha. It caused heavy to very heavy rainfall activity at
isolated places over Gangetic West Bengal on 26th May and heavy to extremely heavy
rainfall over Sub-Himalayan West Bengal on 27th. It also caused heavy to extremely
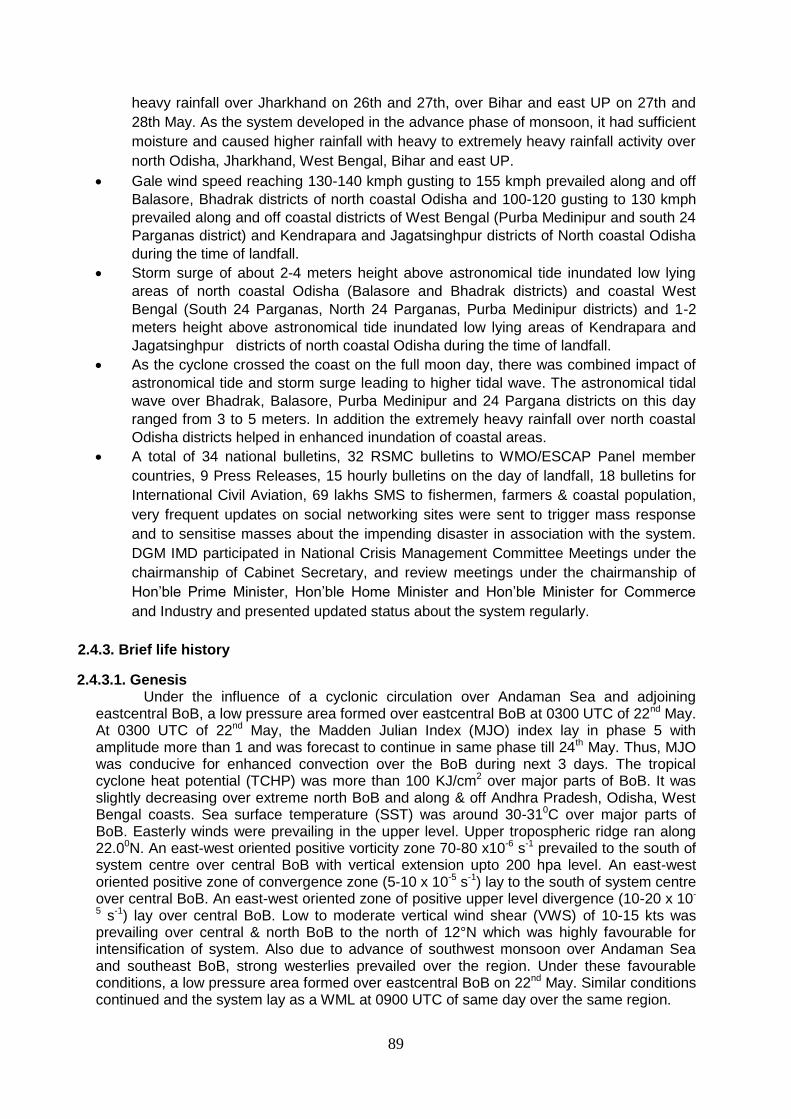
89
heavy rainfall over Jharkhand on 26th and 27th, over Bihar and east UP on 27th and
28th May. As the system developed in the advance phase of monsoon, it had sufficient
moisture and caused higher rainfall with heavy to extremely heavy rainfall activity over
north Odisha, Jharkhand, West Bengal, Bihar and east UP.
Gale wind speed reaching 130-140 kmph gusting to 155 kmph prevailed along and off
Balasore, Bhadrak districts of north coastal Odisha and 100-120 gusting to 130 kmph
prevailed along and off coastal districts of West Bengal (Purba Medinipur and south 24
Parganas district) and Kendrapara and Jagatsinghpur districts of North coastal Odisha
during the time of landfall.
Storm surge of about 2-4 meters height above astronomical tide inundated low lying
areas of north coastal Odisha (Balasore and Bhadrak districts) and coastal West
Bengal (South 24 Parganas, North 24 Parganas, Purba Medinipur districts) and 1-2
meters height above astronomical tide inundated low lying areas of Kendrapara and
Jagatsinghpur districts of north coastal Odisha during the time of landfall.
As the cyclone crossed the coast on the full moon day, there was combined impact of
astronomical tide and storm surge leading to higher tidal wave. The astronomical tidal
wave over Bhadrak, Balasore, Purba Medinipur and 24 Pargana districts on this day
ranged from 3 to 5 meters. In addition the extremely heavy rainfall over north coastal
Odisha districts helped in enhanced inundation of coastal areas.
A total of 34 national bulletins, 32 RSMC bulletins to WMO/ESCAP Panel member
countries, 9 Press Releases, 15 hourly bulletins on the day of landfall, 18 bulletins for
International Civil Aviation, 69 lakhs SMS to fishermen, farmers & coastal population,
very frequent updates on social networking sites were sent to trigger mass response
and to sensitise masses about the impending disaster in association with the system.
DGM IMD participated in National Crisis Management Committee Meetings under the
chairmanship of Cabinet Secretary, and review meetings under the chairmanship of
Hon’ble Prime Minister, Hon’ble Home Minister and Hon’ble Minister for Commerce
and Industry and presented updated status about the system regularly.
2.4.3. Brief life history
2.4.3.1. Genesis Under the influence of a cyclonic circulation over Andaman Sea and adjoining
eastcentral BoB, a low pressure area formed over eastcentral BoB at 0300 UTC of 22nd May. At 0300 UTC of 22nd May, the Madden Julian Index (MJO) index lay in phase 5 with amplitude more than 1 and was forecast to continue in same phase till 24th May. Thus, MJO was conducive for enhanced convection over the BoB during next 3 days. The tropical cyclone heat potential (TCHP) was more than 100 KJ/cm2 over major parts of BoB. It was slightly decreasing over extreme north BoB and along & off Andhra Pradesh, Odisha, West Bengal coasts. Sea surface temperature (SST) was around 30-310C over major parts of BoB. Easterly winds were prevailing in the upper level. Upper tropospheric ridge ran along 22.00N. An east-west oriented positive vorticity zone 70-80 x10-6 s-1 prevailed to the south of system centre over central BoB with vertical extension upto 200 hpa level. An east-west oriented positive zone of convergence zone (5-10 x 10-5 s-1) lay to the south of system centre over central BoB. An east-west oriented zone of positive upper level divergence (10-20 x 10-
5 s-1) lay over central BoB. Low to moderate vertical wind shear (VWS) of 10-15 kts was prevailing over central & north BoB to the north of 12°N which was highly favourable for intensification of system. Also due to advance of southwest monsoon over Andaman Sea and southeast BoB, strong westerlies prevailed over the region. Under these favourable conditions, a low pressure area formed over eastcentral BoB on 22nd May. Similar conditions continued and the system lay as a WML at 0900 UTC of same day over the same region.

90
At 0600 UTC of 23rd May, it concentrated into a depression over eastcentral BOB. Similar sea and MJO conditions prevailed. Upper tropospheric ridge ran along 22.00N. A northeast-southwest oriented positive vorticity zone of 100-120 X10-6 s-1 prevailed to the south of system centre over central BoB with vertical extension upto 200 hPa level. Low level vorticity increased during previous 24 hours. An east-west oriented positive convergence zone also increased and was 30-40 X 10-5 S -1 & lay to the south of system centre. An east-west oriented zone of positive upper-level divergence (30-40 X 10-5 S -1) also increased and lay over central BOB. Moderate VWS (10-20 KTS) prevailed over central & north BoB to the north of 15°N and was decreasing becoming low (5-10 kts) over north BoB. The sea conditions and existing environmental features like enhanced low level vorticity, lower-level convergence, equatorward & poleward outflow, moderate VWS led to intensification of the the WML into a depression over eastcentral BoB at 0600 UTC of 23rd.
2.4.3.2 Intensification and movement At 1800 UTC of 23rd May, similar MJO conditions prevailed. The TCHP was more
than 100 KJ/cm2 over major parts of BoB. It was slightly decreasing over extreme north BoB and along & off Andhra, Odisha, West Bengal coasts. The SST was around 30-310C over major parts of BOB. Upper tropospheric ridge ran along 22.50 N. A northeast-southwest oriented lower-level positive vorticity zone 150x10-5 s -1 lay around system centre with vertical extension upto 200 hPa level. A northwest-southeast oriented lower level positive convergence zone (40-50x10-5 s-1) lay to the southwest of system centre and east-west oriented zone of positive upper level divergence (30-40x10-5 s-1) lay over entire central BoB. Moderate VWS (10-20 kts) prevailed over central & north BoB to the north of 15°N and was decreasing becoming low (5-10 kts) over north BoB off north Odisha & west Bengal coasts. Under favourable sea and environmental conditions like enhanced low level vorticity, lower-level convergence, equatorward & poleward outflow, moderate vertical wind shear, the system intensified into a deep depression at 1800 UTC of 23rd May.
At 0000 UTC of 24th May, similar sea conditions prevailed over the central and north BoB. The environmental conditions further consolidated. The northeast-southwest oriented positive vorticity zone became more circular and increased to 200-250 x10-6 s-1 around system centre with vertical extension upto 200 hPa level. The positive convergence zone became east-west oriented and increased to 50 x 10-5 s -1) & lay to the southwest of system centre. The east-west oriented zone of positive upper level divergence remained the same (30-40 x10-5 s-1) and lay over westcentral BoB. Low VWS (05-10 kts) prevailed over the system area and to the northeast of it. It was high to the west of the system centre and also over northwest BoB along and off N Odisha & West Bengal coasts. The sea conditions and existing environmental features like enhanced low level vorticity, lower-level convergence, strong poleward outflow, low to moderate VWS led to the further intensification of the system into the CS “Yaas” over eastcentral BoB.
At 1800 UTC of 24th, similar sea conditions continued. The upper tropospheric ridge ran along 21.50N. Positive low level vorticity was 250 x10-6 s-1 around system centre with vertical extension upto 200 hPa level. Low level convergence increased and was about 60 x 10-5 s-1 to the southwest of system centre. The positive upper level divergence was 20x10-5 s -1 and lay to the southwest of system centre. Moderate VWS (20-25 kts) prevailed over the system centre. Under these conditions, the system moved north-northwestwards and intensified into an SCS over eastcentral BoB at 1800 UTC of 24th.
At 1200 UTC of 25th May 1200 UTC, the TCHP was about 150 KJ/cm2 over major parts of BOB. It was slightly decreasing over extreme north BOB and along & off Andhra, Odisha, west Bengal coasts. SST was around 30-310C over major parts of BOB. Positive low level vorticity increased and was around 300 x10-6 s-1 to the south of system centre with vertical extension upto 200 HPA level. Low level convergence was about 30 x 10-5 s-1 to the southwest of system centre. The positive upper-level divergence was 20x 10-5 s -1 to the southwest of system centre. Strong poleward and equatorward outflow was seen in the upper level. Moderate to high VWS (20-25 kts) was prevailing over the system centre. However, high SST, high TCHP and strong equatorward & poleward outflow led to further
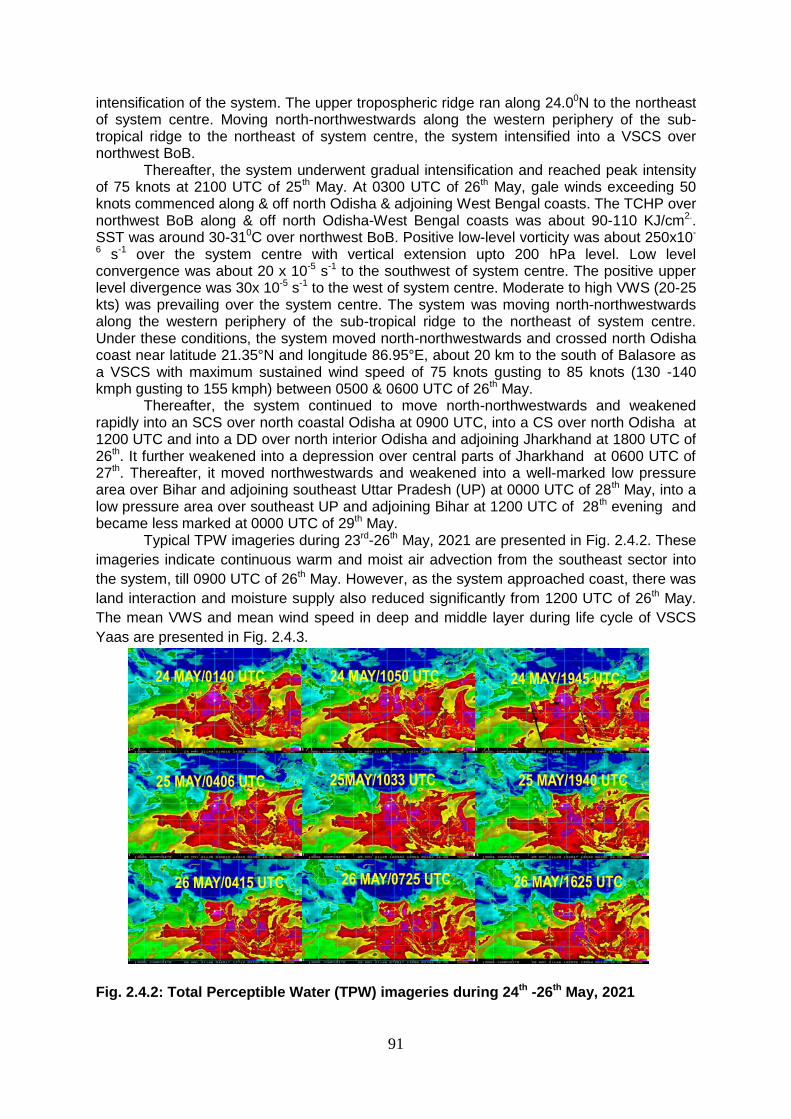
91
intensification of the system. The upper tropospheric ridge ran along 24.00N to the northeast of system centre. Moving north-northwestwards along the western periphery of the sub-tropical ridge to the northeast of system centre, the system intensified into a VSCS over northwest BoB.
Thereafter, the system underwent gradual intensification and reached peak intensity of 75 knots at 2100 UTC of 25th May. At 0300 UTC of 26th May, gale winds exceeding 50 knots commenced along & off north Odisha & adjoining West Bengal coasts. The TCHP over northwest BoB along & off north Odisha-West Bengal coasts was about 90-110 KJ/cm2.. SST was around 30-310C over northwest BoB. Positive low-level vorticity was about 250x10-
6 s-1 over the system centre with vertical extension upto 200 hPa level. Low level convergence was about 20 x 10-5 s-1 to the southwest of system centre. The positive upper level divergence was 30x 10-5 s-1 to the west of system centre. Moderate to high VWS (20-25 kts) was prevailing over the system centre. The system was moving north-northwestwards along the western periphery of the sub-tropical ridge to the northeast of system centre. Under these conditions, the system moved north-northwestwards and crossed north Odisha coast near latitude 21.35°N and longitude 86.95°E, about 20 km to the south of Balasore as a VSCS with maximum sustained wind speed of 75 knots gusting to 85 knots (130 -140 kmph gusting to 155 kmph) between 0500 & 0600 UTC of 26th May.
Thereafter, the system continued to move north-northwestwards and weakened rapidly into an SCS over north coastal Odisha at 0900 UTC, into a CS over north Odisha at 1200 UTC and into a DD over north interior Odisha and adjoining Jharkhand at 1800 UTC of 26th. It further weakened into a depression over central parts of Jharkhand at 0600 UTC of 27th. Thereafter, it moved northwestwards and weakened into a well-marked low pressure area over Bihar and adjoining southeast Uttar Pradesh (UP) at 0000 UTC of 28th May, into a low pressure area over southeast UP and adjoining Bihar at 1200 UTC of 28th evening and became less marked at 0000 UTC of 29th May.
Typical TPW imageries during 23rd-26th May, 2021 are presented in Fig. 2.4.2. These
imageries indicate continuous warm and moist air advection from the southeast sector into
the system, till 0900 UTC of 26th May. However, as the system approached coast, there was
land interaction and moisture supply also reduced significantly from 1200 UTC of 26th May.
The mean VWS and mean wind speed in deep and middle layer during life cycle of VSCS
Yaas are presented in Fig. 2.4.3.
Fig. 2.4.2: Total Perceptible Water (TPW) imageries during 24th -26th May, 2021
26 MAY/0725 UTC
26 MAY/0415 UTC
25 MAY/1940 UTC
24 MAY/1945 UTC
25MAY/1033 UTC
25 MAY/0406 UTC
24 MAY/1050 UTC
26 MAY/1625 UTC
24 MAY/0140 UTC

92
Fig. 2.4.3: Mean wind shear and speed in the deep (200-850 hPa) and middle (500-850
hPa) layers during life cycle of VSCS YAAS
2.4.3.3 Maximum Sustained Surface Wind speed and estimated central pressure
The six hourly maximum sustained wind speed & estimated central pressure and translational speed are presented in Fig. 2.4.4(a) and 4(b). YAAS had a straight track and it moved relatively slower than long period average during 1990-2013 (Fig. 2.4.4a). After landfall, it moved relatively faster leading to rapid weakening of the system during 0600 to 1800 UTC of 26th May.
Fig. 2.4.4: (a) Translational speed & direction of movement and (b) Maximum
sustained surface winds (kts) & Estimated Central Pressure

93
2.4.4 Monitoring of "YAAS”:
India Meteorological Department (IMD) maintained round the clock watch over the
north Indian Ocean and the cyclone was monitored since 13th May, about 9 days prior to the
formation of low pressure area over eastcentral BoB on 22nd May and 10 days prior to
formation of depression over eastcentral BoB on 23rd May. The cyclone was monitored with
the help of available satellite observations from INSAT 3D and 3DR, SCAT SAT, polar
orbiting satellites and available ships & buoy observations in the region. The system was
also monitored by Doppler Weather Radar (DWR), Paradip. Various numerical weather
prediction models run by Ministry of Earth Sciences (MoES) institutions, global models and
dynamical-statistical models were utilized to predict the genesis, track, landfall and intensity
of the cyclone. A digitized forecasting system of IMD was utilized for analysis and
comparison of various models’ guidance, decision making process and warning products
generation. Typical satellite and radar imageries during VSCS YAAS are presented in Fig.
2.4.5. Detailed features are discussed in Section 4.1 and satellite imageries during entire life
cycle of Yaas are presented in Fig. 2.4.6.
Fig. 2.4.5: Typical INSAT 3D satellite and radar imagery from Doppler Weather Radar Paradip
2.4.4.1 Features observed through satellite
Satellite monitoring of the system was mainly done by using half hourly INSAT-3D
and 3DR imageries. Satellite imageries of international geostationary satellites Meteosat-8 &
MTSAT and microwave & high resolution images of polar orbiting satellites DMSP, NOAA
series, TRMM, Metops were also considered. Typical INSAT-3D visible/IR imageries,
enhanced colored imageries and cloud top brightness temperature imageries are presented
in Fig. 2.4.5. The system showed curved band pattern during genesis and growth stage upto
the intensity of VSCS. It has central dense overcast (CDO) pattern during VSCS stage. It
showed sheared pattern after landfall.
At 0600 UTC of 23rd May, the clouds associated with the system were organized in curved band pattern. Intensity of the system was characterised as T 1.5. Broken low and medium clouds with embedded intense to very intense convection lay over eastcentral BoB, Andaman Sea and neighbourhood. Minimum cloud top temperature (CTT) was -93°C.
INSAT 3D imagery
25th May/2330 IST
25th May/2040 IST
DWR Paradip

94
Fig. 2.4.6(a): INSAT-3D IR imageries during life cycle of VSCS YAAS (23-27 May, 2021)
At 1800 UTC of 23rd May the depression intensified into a Deep Depression. As per satellite imagery based on 1800 UTC of 23rd May, the cloud mass was organised in shear pattern. Intensity of the system was characterised as T 2.0. Broken low and medium clouds with embedded intense to very intense convection lay over the area between latitude 7.0°N & 20.0°N and 82.0°E & 93.0°E and Andaman Islands. Minimum cloud top temperature is -93°celcius.
At 0000 UTC of 24th May the system intensified into a CS. As per satellite imagery based on 0000 UTC of, the 24th May, the vortex further intensified with a curved band pattern with wrap of 0.5 on log 10-degree spiral yielding a T=2.5. Broken low and medium clouds with embedded intense to very intense convection lay over the area between latitude 11°N & 20°N and 82°E & 94.0°E. Minimum cloud top temperature was -93°celcius

95
At 1800 UTC of 24th May the it intensified into an SCS. As per satellite imagery based on 1800 UTC of, the 24th May, the clouds were organised in curved band pattern with T 3.0. Broken low and medium clouds with embedded intense to very intense convection lay over the area between latitude 14.0°N & 21°N and 84.0°E & 90.0E. Minimum cloud top temperature was -93°C.
Fig. 2.4.6(b): INSAT-3D enhanced color imageries during life cycle of VSCS YAAS (23-27 May, 2021)
At 1200 UTC of 25th May it further intensified into VSCS. As per satellite imagery
based on 1200 UTC of the 25th May, the central dense overcast (CDO) pattern became regular and compact. Outer spiral bands were entering into coastal Odisha leading to rainfall over the area. The intensity of the system was characterised as T 4.0. Broken low and medium clouds with embedded intense to very intense convection lay over the BoB between latitude 14.0°N & 20.0°N and 84.0°E & 91.0E Minimum cloud top temperature is -93°C.
26 MAY/0900 UTC
26 MAY/0300 UTC
25 MAY/1200 UTC
24 MAY/0300 UTC
25 MAY/0300 UTC
24 MAY/1800 UTC
23 MAY/1800 UTC
26 MAY/1800 UTC
23 MAY/0600 UTC
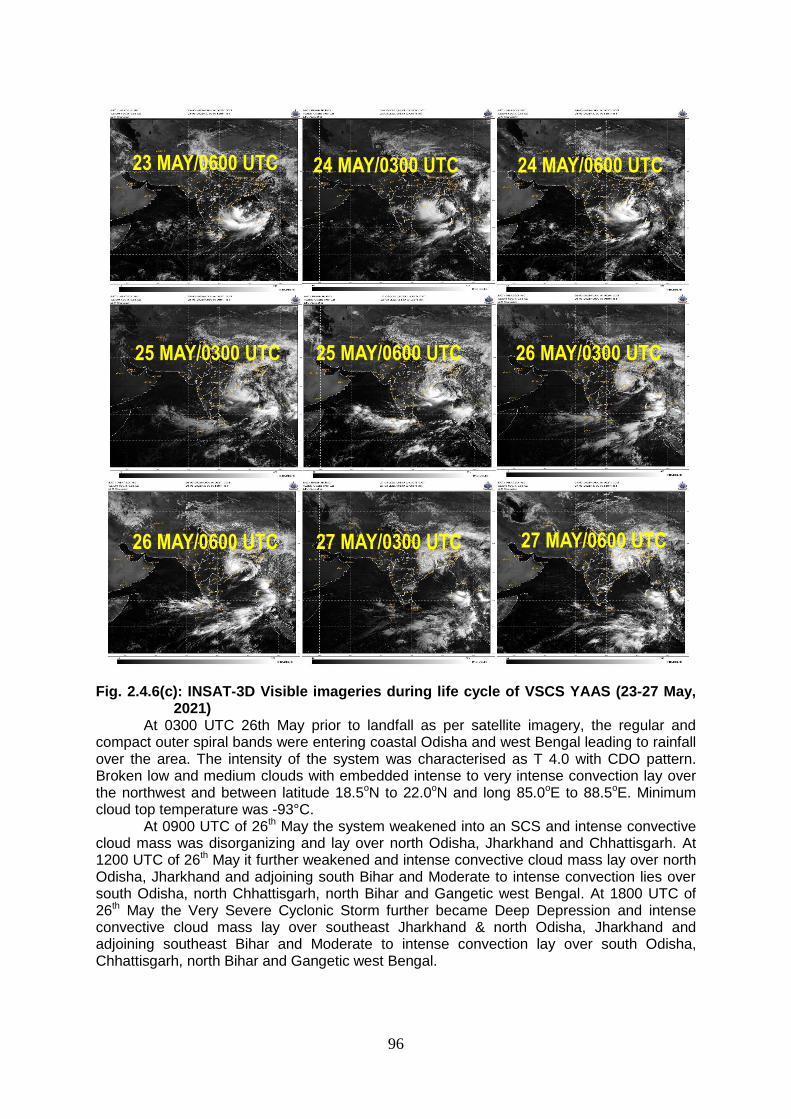
96
Fig. 2.4.6(c): INSAT-3D Visible imageries during life cycle of VSCS YAAS (23-27 May,
2021) At 0300 UTC 26th May prior to landfall as per satellite imagery, the regular and
compact outer spiral bands were entering coastal Odisha and west Bengal leading to rainfall over the area. The intensity of the system was characterised as T 4.0 with CDO pattern. Broken low and medium clouds with embedded intense to very intense convection lay over the northwest and between latitude 18.5oN to 22.0oN and long 85.0oE to 88.5oE. Minimum cloud top temperature was -93°C.
At 0900 UTC of 26th May the system weakened into an SCS and intense convective cloud mass was disorganizing and lay over north Odisha, Jharkhand and Chhattisgarh. At 1200 UTC of 26th May it further weakened and intense convective cloud mass lay over north Odisha, Jharkhand and adjoining south Bihar and Moderate to intense convection lies over south Odisha, north Chhattisgarh, north Bihar and Gangetic west Bengal. At 1800 UTC of 26th May the Very Severe Cyclonic Storm further became Deep Depression and intense convective cloud mass lay over southeast Jharkhand & north Odisha, Jharkhand and adjoining southeast Bihar and Moderate to intense convection lay over south Odisha, Chhattisgarh, north Bihar and Gangetic west Bengal.
27 MAY/0300 UTC
26 MAY/0600 UTC
26 MAY/0300 UTC
24 MAY/0600 UTC
25 MAY/0600 UTC
25 MAY/0300 UTC
24 MAY/0300 UTC
27 MAY/0600 UTC
23 MAY/0600 UTC
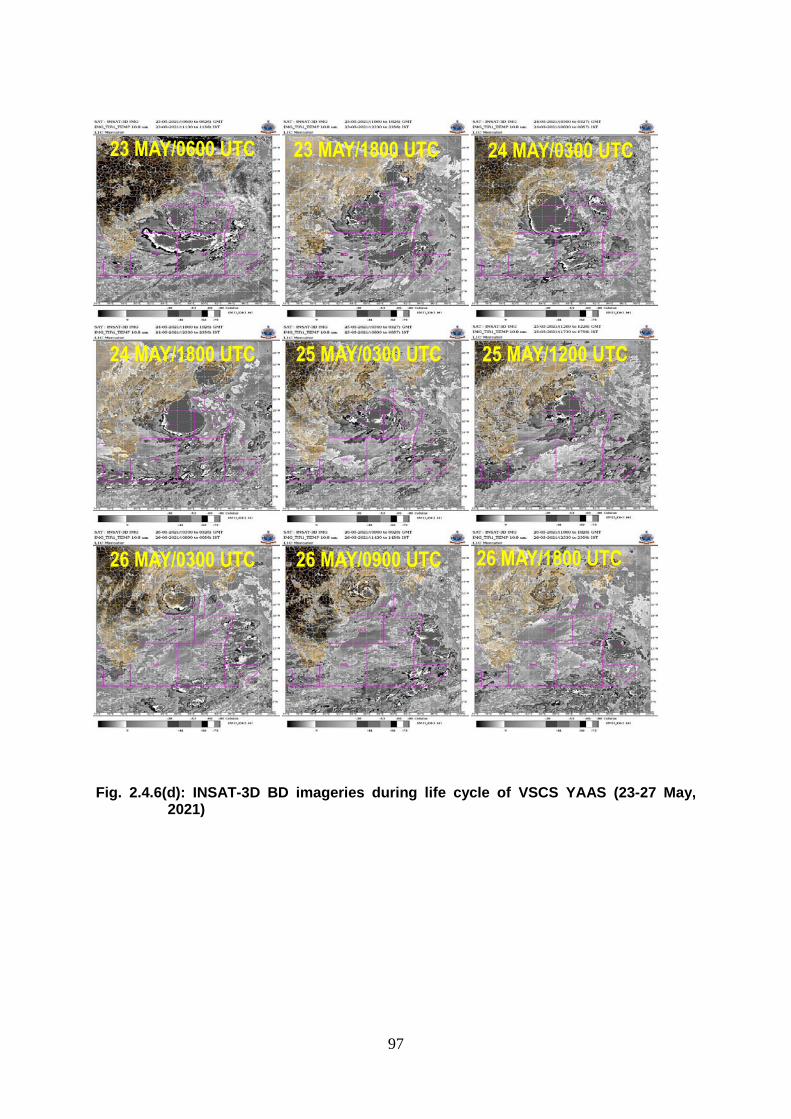
97
Fig. 2.4.6(d): INSAT-3D BD imageries during life cycle of VSCS YAAS (23-27 May,
2021)
26 MAY/0900 UTC
26 MAY/0300 UTC
25 MAY/1200 UTC
24 MAY/0300 UTC
25 MAY/0300 UTC
24 MAY/1800 UTC
23 MAY/1800 UTC
26 MAY/1800 UTC
23 MAY/0600 UTC

98
Fig. 2.4.6(e): INSAT-3D Microwave imageries during life cycle of VSCS YAAS (23-27
May, 2021)
26 MAY/0900 UTC
26 MAY/0300 UTC
25 MAY/1200 UTC
24 MAY/0300 UTC
25 MAY/0300 UTC
24 MAY/1800 UTC
23 MAY/1800 UTC
26 MAY/1800 UTC
23 MAY/0600 UTC

99
Typical ASCAT imageries during 23rd to 26th May depicting the location and winds around the centre are presented in Fig. 2.4.6(f). It showed stronger winds in association with monsoon surge in the onset phase over the BoB during genesis stage over the area to the south of system centre. Fig. 2.4.6(f): ASCAT imageries during life cycle of VSCS YAAS (23th -27th May), since
inception as low pressure area are presented in Fig. 2.4.
24 MAY 2021 24 MAY 2021
25 MAY 2021 25 MAY 2021
26 MAY 2021 26 MAY 2021
23 MAY 2021 23 MAY 2021

100
The system was captured by Doppler Weather Radar (DWR) Paradeep on 25th. Typical imageries from DWR Paradeep depicting development of eye and curved bands around the system centre are presented in Fig. 2.4.6(g). Fig. 2.4.6(g): RADAR imageries during life cycle of VSCS YAAS (23th -27th May), from
DWR PARADEEP 2.4.5 Dynamical features
IMD GFS (T1534) mean sea level pressure (MSLP), winds at 10m, 850, 500 and 200 hPa levels during 22nd-27th May are presented in Fig. 2.4.7. The analysis of IMD-GFS based on 0000 UTC of 22nd May, 2021 indicated a trough of low over central parts of BoB. However, at 0300 UTC of 22nd, the system lay as a WML over eastcentral BoB.
25 MAY/0650UTC 25 MAY/
25 MAY/1050UTC 25 MAY/1440UTC
25 MAY/1240UTC 25 MAY/1530UTC
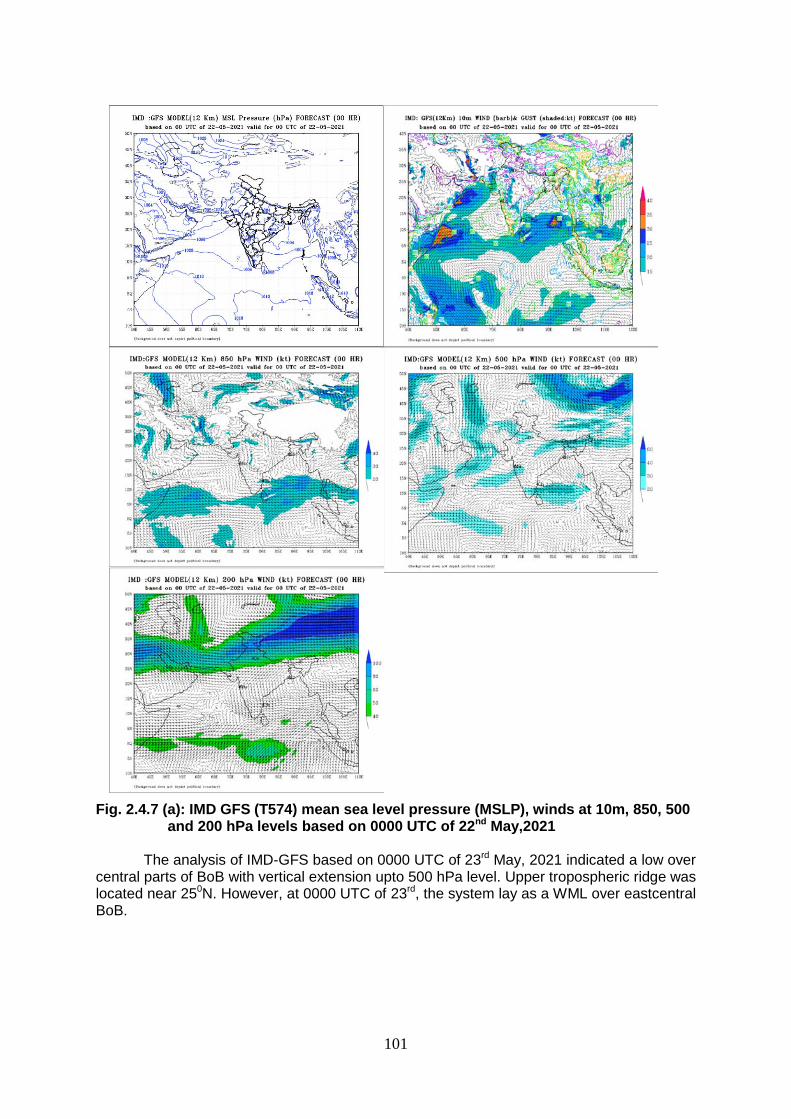
101
Fig. 2.4.7 (a): IMD GFS (T574) mean sea level pressure (MSLP), winds at 10m, 850, 500
and 200 hPa levels based on 0000 UTC of 22nd May,2021 The analysis of IMD-GFS based on 0000 UTC of 23rd May, 2021 indicated a low over central parts of BoB with vertical extension upto 500 hPa level. Upper tropospheric ridge was located near 250N. However, at 0000 UTC of 23rd, the system lay as a WML over eastcentral BoB.

102
Fig. 2.4.7 (b): IMD GFS (T574) mean sea level pressure (MSLP), winds at 10m, 850, 500 and 200 hPa levels based on 0000 UTC of 23rd May,2021
The analysis of IMD-GFS based on 0000 UTC of 24th May, 2021 indicated an SCS over eastcentral BoB with vertical extension upto 500 hPa level. Upper tropospheric ridge was located near 250N. Actually at 0000 UTC of 24th, the system intensified into the cyclonic storm “YAAS” over eastcentral BoB. Thus, IMD GFS highly over-estimated the intensity of

103
the system. However, the location of the system and steering winds were correctly captured by the model.
Fig. 2.4.7(c): IMD GFS (T574) mean sea level pressure (MSLP), winds at 10m, 850, 500 and 200 hPa levels based on 0000 UTC of 24th May,2021
The analysis of IMD-GFS based on 0000 UTC of 25th May, 2021 indicated a VSCS
over northwest BoB with vertical extension upto 500 hPa level. Upper tropospheric ridge was located near 250N. However, at 0000 UTC of 25th, the system lay as a WML over eastcentral

104
BoB. IMD GFS reasonably estimated the intensity of the system on 25th alongwith the location of the system and steering winds were correctly captured by the model.
Fig. 2.4.7(d): IMD GFS (T574) mean sea level pressure (MSLP), winds at 10m, 850, 500 and 200 hPa levels based on 0000 UTC of 25th May,2021
The analysis of IMD-GFS based on 0000 UTC of 26th May, 2021 indicated a VSCS
over northwest BoB very close to extreme north Odisha-West Bengal coasts near 21.1N/87.7E with vertical extension upto 500 hPa level. Upper tropospheric ridge was located near 250N. However, at 0000 UTC of 26th, the system lay as a VSCS over northwest

105
BoB near 20.8N/87.3E. Thus, IMD GFS indicated the location slightly northeastwards as compared to actual location.
Fig. 2.4.7(e): IMD GFS (T574) mean sea level pressure (MSLP), winds at 10m, 850, 500 and 200 hPa levels based on 0000 UTC of 26th May,2021
The analysis of IMD-GFS based on 0000 UTC of 27th May, 2021 indicated a DD over north Odisha and adjoining Bihar & West Bengal near 22.6N/85.9E with vertical extension upto 500 hPa level. Upper tropospheric ridge was located near 250N. However, at 0000 UTC of 27th, the system lay as a DD over Bihar near 22.8N/87.8E. Thus, IMD GFS indicated the location about two degrees longitudes eastwards as compared to actual location.

106
Fig. 2.4.7 (f): IMD GFS (T574) mean sea level pressure (MSLP), winds at 10m, 850, 500 and 200 hPa levels based on 0000 UTC of 27th May,2021
2.4.6. Realized Weather: 2.4.6.1. Rainfall:
It caused heavy to very heavy rainfall and Squally winds and tidal waves over Andaman & Nicobar Islands on 23rd & 24th May. It caused heavy to extremely heavy rainfall activity at isolated places over coastal Odisha on 25th May and heavy to very heavy rainfall at a few places and extremely heavy rains at isolated places on 26th May. It caused heavy to very heavy rainfall activity at isolated places over Gangetic West Bengal on 26th May and heavy to extremely heavy rainfall over Sub-Himalayan West Bengal on 27th. It also caused heavy to extremely heavy

107
rainfall over Jharkhand on 26th and 27th and over Bihar and east UP on 27th and 28th May. Rainfall associated with VSCS YAAS based on IMD-NCMRWF GPM merged gauge 24 hours cumulative rainfall ending at 0830 IST of date is depicted in Fig 2.4.8.
Fig. 2.4.8: IMD-NCMRWF GPM and gauge merged 24 hr cumulative rainfall (cm) ending at
0830 IST of date during 21st– 27th May and 7 days average rainfall Realized 24 hrs accumulated rainfall (≥7cm) ending at 0830 hrs IST of date during the life cycle of the system is presented below: 23 May 2021: Andaman & Nicobar Islands: Long Island-10, Maya Bandar-9 24 May 2021: Andaman & Nicobar Islands: Port Blair-7 25 May 2021: Andaman & Nicobar Islands: Hut Bay-11, Carnicobar-8, Gangetic West Bengal: Contai-9 26 May 2021: Odisha: Chandbali-29, Rajkanika & Garadapur-25 each, Marsaghai & Kujanga-23 each, Nawana &Tirtol-21 each, Paradip -20, Pattamundai, Balikuda & Derabis-19 each, Astaranga-18, Bhadrak-17, Kendrapara, Dhamnagar & Soro-16 each, Jagatsinghpur-15, Tihidi, Bari & Alipingal-14 each, Jajpur, Nilgiri, Akhuapada & Basudevpur-13 each, Chandikhol & Bonth-12 each, Korei & Kakatpur-11 each, Danagadi-10, Jenapur, Nischintakoili & Bhograi-9 each, Niali & Anandpur & Kaptipada-8 each, Joshipur, Jaleswar, Salepur, Mahanga, Chandanpur, Rairangpur, NH5 Gobindpur, Balimundali, Betanati, Balasore & Jhumpura-7 each 27 May 2021 Odisha: Nawana-28, Joda-27, Joshipur-25, Lathikata & Jhumpura-21 each, Champua, Keonjhargarh & Panposh-20 each, Basudevpur-19, Chandikhol & Karanjia-17 each, Rajgangpur & Mandira Dam each, Swam-Patna & Deogarh-13 each, Tiring-12, Udala, Gurundia, Barkote, Hatadihi, Tihidi & Pallahara-11 each, Ghatagaon, Lahunipara, Sharpada, Soro & Bamra-10 each, Binjharpur, Laikera, Jajpur, Kirmira & Talcher- 9 each, Sukinda &

108
Kuchinda-8 each, Telkoi, Kaptipada, Deogaon, Jenapur, Rairangpur, Bargaon, Kankadahad, Kolabira, Danagadi, Pattamundai & Bhadrak- 7 each Jharkhand: Chaibasa-21, Mandar-18, Ranchi-15, Chakradharpur-13, Torpa-12, Kuru, Jamshedpur & Kharsema-11 each, Nimdih-10, Ramgarh & Jamshedpur-9 each, Chandil, Chatra, Manatu, Hariharganj & Hendigir-8 each, Shilaichak, Koner & Chandrapura-7 each, Gangetic West Bengal: Diamond Harbour & Phulberia-11 each & Kharidwar-9, Labpur, Purihansa & Kalyani SMO-8 each, Uluberia, Mangalkote, Kangsabati Dam-7 each, Sub-Himalayan West Bengal & Sikkim: Rongli, Damthang, Darjeeling & Gyalsing-9 each, Pedong & Pakyong-8 each, Sankalan, Mangan, Singhik & Khanitar- 7 each Bihar: Sherghati-7 Uttar Pradesh: Light to moderate rainfall occurred at many places over East UP 28 May 2021 Sub-Himalayan West Bengal & Sikkim: Malda-31, Sukiapokhri & Darjeeling-11 each, Damthang & Gyalsing-8 each, Gangetic West Bengal: Debagram-13, Barrackpur-12, Amtala & Durgachack-10 each, Dum Dum & Alipore-9 each, MO Salt Lake, Diamond Harbour, Kalyani SMO, Bagati, Nalhati – 7 each Jharkhand: Rajmahal-23, Koner & Tilaiya-11 each, Koderma & Hariharganj-10 each, Hazaribagh-9, Tenughat-7 Bihar: Manihari-25, Kadwa-24, Barari-23, Purnea-21, Parsa & Katihar North-18 each, Amaur-16, Banmankhi, Arwal & Sheikhpura-15 each, Vaishali, Rupauli, Saraiya & Murliganj-14 each, Siswan, Umarkhand, Ghosi, Chapra, Madhipura & Jamui-13 each, Hisua, Koilwar, Gaya Aero, Mahua, Harnaut & Islampur-12 each, Ekangersarai, Narhat, Lakhisarai, Singheshwar, Bodh Gaya, Maharajganj, Sandesh, Sherghati & Nawada-11 each, Kursela, Pachrukhi, Balrampur, Marhaura/Amnaur, Chand, Barh, Udai Kishanganj & Rajgir-10 each, Halsi, Patahi, Jandhaha, Barahara, Patna Aerodrome, Bihta, Jalalpur, Barauni, Matihani, Morwa/Tajpur, Saurbazar, Dinara, Charpokhari & Goraul/Doli-9 each, Kako, Hathwa, Barhiya, Narpatganj, Colgaon & Bihar Shrif-8 each, Hussainganj, Barauli, Tekari, Khagadia, Simrii, Bikram, Adhwara, Rajauli, Makhdumpur, Mushari, Bhore, Motihari, Tarari, Suryagadha, Jahanabad, Supaul, Marsrakh, Chandan, Bagaha, Araria & Sangrampur – 7 each. East Uttar Pradesh: Chanderdeepghat-13, Gaighat -10, Ballia & Ayodhya-7 each 29 May 2021 Bihar: Tribeni/Balmikinagar21, Darbhanga18, Bagaha & Basua17 each, Balrampur & Kadwa16 each, Hayaghat15, Gaunaha, Mushari & Kodawanpur-13 each, Ramnagar, Goraul/Doli, Rosera & Muzaffarpur-12 each, Jaley & Barh-11 each, Saraiya, Bairgania & Sonbarsa10 each, Matihani, Minapur, Jhanjharpur, Kishanganj, Jandhaha, Sheikhpura, Tarapur, Madhwapur, Bahadurganj, Supaul, Saurbazar, Jainagar & Umarkhand-9 each, Purnea, Belsand, Morwa/Tajpur, Dhengbridge, Samastipur, Madhipura, Thakurganj, Sangrampur, Nirmali & Barauni-8 each, Harnaut, Cheria B.Pur, Parbatta, Aryari, Vaishali, Patahi, Siswan, Barbigha & Nauihatta7 each East Uttar Pradesh: Bansi Tehsil-21, Nichlaul-19, Nautanwa-17, Trimohanighat & Maharajganj-15 each, Kakrahi & Pharenda-14 each, Chanderdeepghat & Balrampur TEH-11 each, Balrampur10, Bansi, Tulsipur, Uska Bazar-9 each, Gorakhpur8 and Shoharatgarh, Domeriaganj, Ramnagar & Birdghat7 each
(b) Peak wind speed (kmph) recorded by the Meteorological Observatories in association with the passage of YAAS Gale wind speed reaching 130-140 gusting to 155 kmph prevailed along and off Balasore, Bhadrak districts of north coastal Odisha and 100-120 gusting to 130 kmph prevailed along and off coastal districts of West Bengal (Purba Medinipur and south 24 Parganas district) and Kendrapara and Jagatsinghpur districts of north coastal Odisha during the time of landfall.

109
(c) Storm Surge: Estimated storm surge of about 2-4 meters height above astronomical tide inundated low lying areas of Balasore and Bhadrak districts of north coastal Odisha and coastal West Bengal districts(Purba Medinipur and 24 Pargana districts) and 1-2 meters height above astronomical tide inundated low lying areas of districts of Kendrapara and Jagatsinghpur districts of north coastal Odisha during the time of landfall.
2.4.7 Damage due to VSCS YAAS
In West Bengal, no death was reported. The state has incurred a total loss of more than Rs 20,000 crore due to Cyclone, Yaas which battered the state and around 2.21 lakh hectare of crops were damaged. 3 lakh houses were damaged in West Bengal; while around 1 crore people were affected in the state alone.
In Odisha, 2 deaths were reported as they were trapped in a collapsed house. 1,500 homes were damaged, 10 lakh people were effected and 18 people were injured in Jharkhand. An additional two people died in Ranchi after a five year-old bridge connecting the Tamar block to Bundu and Sonahatu block of the city collapsed. 75 hectares worth of farmland were destroyed. Seven people died in the state of Bihar due to floods produced by Yaas as it moved further inland. A few damage photographs are shown in Fig. 2.4.9.
Fig. 2.4.9: (a)Rescue from flood in West Bengal(b)Devastated homes in West Bengal(c) Thatched hut nearby Dhamra worst affected by Cyclone & sea water (d)River Baitarani in Akhuapada (e) Electric Pole uprooted at Dhamra (f) damaged shoreline at a beach in Shankarpur(WB)(g) A bridge at river Kanchi after it collapsed due to heavy rain triggered by Cyclone Yaas, in Ranchi(source: https://www.timesnownews.com,dated 27 May 2021) (h) Flooding and heavy rains in coastal Digha-Shankarpur area in West Bengal.(source: https://www.news18.com/,dated 27 May 2021)
(a) (b)
(c) (d)
(e) (f)
(g) (h)
(g) (h)

110
Table 2.4.2 Forecast verification of Gale wind
Forecast Winds (kmph) Realised wind (kmph)
Gale wind speed reaching 155-165 gusting to 185 kmph over north coastal districts of Balasore, Bhadrak Jagatsinghpur, Kendrapara of Odisha. It was modified to 130-140 gusting to 155 kmph on 25th night.
Gale wind speed reaching 110-120 gusting to 130 kmph over coastal districts of West Bengal (Purba Medinipur and south 24 Parganas district) and during the time of landfall.
Gale wind speed reaching 130-140 gusting to 155 kmph prevailed over north coastal districts of Balasore, Bhadrak and 100-120 kmph gusting to 130 kmph along and off Kendrapara and Jagatsinghpur districts of Odisha.
Gale wind speed reaching 100-120 gusting to 130 kmph prevailed over coastal districts of West Bengal (Purba Medinipur and south 24 Parganas district) during the time of landfall
Table 2.4.3 Verification of Heavy Rainfall Warning
Forecast Rainfall Realised 24 hr cumulative heavy rainfall ending at 0830 IST of date
Heavy to very heavy rainfall over Andaman & Nicobar Islands on 23rd & 24th May.
Heavy to extremely heavy rainfall at isolated places over coastal Odisha on 25th & heavy to very heavy rainfall at a few places & extremely heavy falls at isolated places on 26th May over North Odisha.
Heavy to very heavy rainfall at isolated places over Gangetic West Bengal on 26th & heavy to extremely heavy rainfall over Sub-Himalayan West Bengal on 27th.
Heavy to extremely heavy rainfall over Jharkhand on 26th & 27th, over Bihar and east UP on 27th & 28th May.
Heavy to very heavy rainfall over Andaman & Nicobar Islands on 23rd & 24th May.
Heavy to extremely heavy rainfall at isolated places over coastal Odisha on 25th May and heavy to very heavy rainfall at a few places and extremely heavy rains at isolated places on 26th May over North Odisha.
Heavy to very heavy rainfall at isolated places over Gangetic West Bengal on 26th May and heavy to extremely heavy rainfall over Sub-Himalayan West Bengal on 27th.
Heavy to extremely heavy rainfall over Jharkhand on 26th and 27th, over Bihar and east UP on 27th and 28th May.
Table 2.4.4 Verification of storm surge warning
Forecast Storm Surge (m) Realised Storm Surge (m)
Tidal waves of height 2-4 meters above astronomical tide to inundate low lying areas of Balasore, Bhadrak Medinipur, South 24 Parganas, and about 1-2 meters above astronomical tide to inundate low lying areas of Kendrapara & Jagatsinghpur Districts around the time of landfall.
Estimated storm surge of about 2-4 meters height above astronomical tide inundated low lying areas of Balasore and Bhadrak districts of north Odisha and West Bengal (South 24 parganas, North 24 parganas, Purba Medinipur districts) and 1-2 meters height above astronomical tide inundated low lying areas of Kendrapara and Jagatsinghpur districts of north Odisha during time of landfall.

111
2.5 Deep depression over northwest Bay of Bengal during 12th -15th September, 2021
2.5.1 Introduction
A low pressure area (LPA) formed over eastcentral and adjoining northeast Bay of
Bengal (BoB) in the early morning (0000 UTC/0530 hrs IST) of 11th September,
2021.
It lay as a well marked low pressure area (WML) over northwest and adjoining
westcentral BoB in the early morning (0000 UTC/0530 hours IST) of 12th.
Under favourable environmental and oceanic conditions, it concentrated into a
depression over northwest BoB and adjoining Odisha coast in the evening (1200
UTC/1730 hrs IST) of 12th.
Moving west-northwestwards, it intensified into a deep depression over northwest
BoB very close to Odisha coast in the early morning (0000 UTC/0530 hrs IST) of 13th
and crossed the north Odisha coast, close to south of Chandbali between 0530 &
0630 hrs IST (0000 & 0100 UTC) as a deep depression with maximum sustained
wind speed of 30 knots (50-60 kmph).
Continuing to move further west-northwestwards, it weakened into a depression over
north Chhattisgarh & adjoining north interior Odisha in the morning (0300 UTC/0830
hrs IST) of 14th and into a WML over northeast Madhya Pradesh & neighbourhood in
the early morning (0000 UTC/0530 hrs IST) of 15th.
The observed track and best track parameters of the system are presented in Fig.
2.5.1 and table 2.5.1.
2.5.2. The salient features of the system were as follows:
Deep depression over BoB was the first depression over the north Indian Ocean
during the monsoon season, 2021.
It caused active to vigorous monsoon conditions leading to extremely heavy rainfall
at a few places over Odisha on 12th & 13th , at isolated places over Chhattisgarh on
13th and over East Madhya Pradesh on 14th. In conjunction with another low
pressure area over Gujarat, extremely heavy rainfall at a few places also occurred
over Saurashtra and north Konkan on 13th September. Low level convergence of
wind & enhanced moisture incursion from the Bay of Bengal in association with a
trough extending eastwards across the system also caused extremely heavy rains at
isolated places over West Bengal on 14th September.
A few of the rainfall amounts such as Astaranga & Kakatpur-53 cm-each, Balikuda-
44cm, Kantapada-38cm, Niali-37cm, Puri-34 cm, Gop & Satyabadi-33cm-each,
Ragunathpur-32 cm were recorded over Odisha on 12th, Talcher – 39 cm,
Birmaharajpur – 37cm, Tikarapara – 35cm in Odisha on 13th and Lodhika – 52cm,
Visavadar – 47cm, Kalavad – 41cm in Saurashtra had been exceptionally heavy.
These extreme rainfall events caused Flash floods & Urban flood situation in major
Districts including Puri, Khorda, Jagatsinghpur, Kendrapara, Subarnapur & Angul in
Odisha and Rajkot & Jamnagar in Saurashtra. As per the report from Central Water
Commission Mahanadi river was in spate over some parts of Odisha due to this
rainfall.

112
It had a total life period of 60 hours against the average life period (1990-2013) of 75
hours of deep depression category in monsoon season over the BoB. The system
had track length of about 545 km
Fig. 2.5.1: Observed track of deep depression over northwest BoB during 12th-15th Sep, 2021
2.5.3. Brief life history
2.5.3.1. Genesis
Under the influence of a cyclonic circulation over eastcentral BoB & neighbourhood,
a low pressure area formed over eastcentral & adjoining northeast BoB at 0000 UTC of 11th
September. At that time, Sea Surface temperature (SST) was around 29-30°C over central &
north BoB. The tropical cyclone heat potential (TCHP) was about 80-100 KJ/cm2 over
central & north BoB and >100 KJ/cm2 over northwest BoB. Madden Julian oscillation (MJO)
index was in phase 3 with amplitude more than 1. It was forecast to continue in same phase
with amplitude remaining more than 1 till 16th September. The environmental conditions
indicated, increase in positive vorticity at lower level (150x10-6S-1) to the southeast of
system centre over central BoB during past 24 hours. The positive vorticity zone extended
upto 500 hpa level. A zone of positive upper level divergence (30x10-5S-1) lay over
westcentral BoB to the southwest of system centre. Another zone of positive upper level
divergence (20 x 10-5 S-1) lay over northeast BoB off Myanmar coast. A zone of positive
lower level convergence 30x10-5S-1 lay over westcentral BoB and another zone (30x10-5S-
1) lay over eastcentral BoB off Myanmar coast. The vertical wind shear (VWS) was low to
12/12,25KT,D 13/00,30KT,DD
13/06,30KT,DD 13/12,30KT,DD
14/03,25KT,D 14/12,25KT,D
14/18,25KT,D
DATE/TIME IN UTC
IST = UTC + 0530 HRS
D: DEPRESSION
DD: DEEP DEPRESSION
OBSERVED TRACK
ODISHA
W. BENGAL
Jharkhand
Maharashtra
Gujarat Madhya Pradesh
Rajasthan
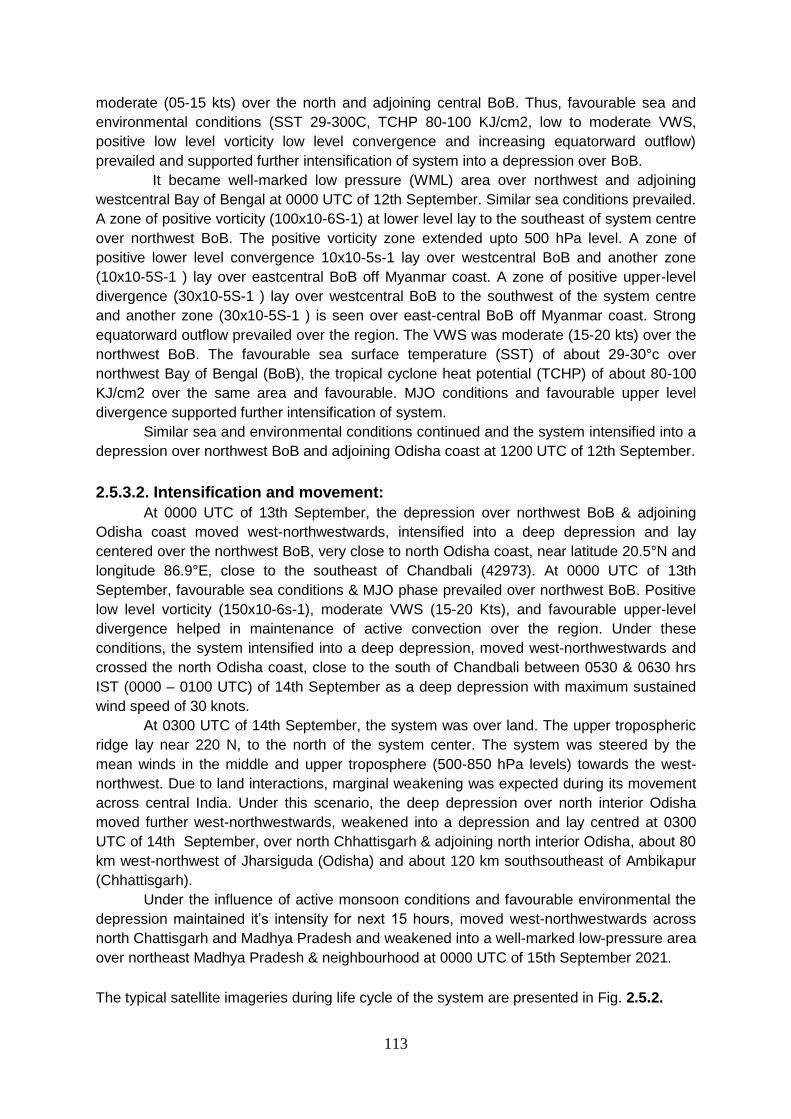
113
moderate (05-15 kts) over the north and adjoining central BoB. Thus, favourable sea and
environmental conditions (SST 29-300C, TCHP 80-100 KJ/cm2, low to moderate VWS,
positive low level vorticity low level convergence and increasing equatorward outflow)
prevailed and supported further intensification of system into a depression over BoB.
It became well-marked low pressure (WML) area over northwest and adjoining
westcentral Bay of Bengal at 0000 UTC of 12th September. Similar sea conditions prevailed.
A zone of positive vorticity (100x10-6S-1) at lower level lay to the southeast of system centre
over northwest BoB. The positive vorticity zone extended upto 500 hPa level. A zone of
positive lower level convergence 10x10-5s-1 lay over westcentral BoB and another zone
(10x10-5S-1 ) lay over eastcentral BoB off Myanmar coast. A zone of positive upper-level
divergence (30x10-5S-1 ) lay over westcentral BoB to the southwest of the system centre
and another zone (30x10-5S-1 ) is seen over east-central BoB off Myanmar coast. Strong
equatorward outflow prevailed over the region. The VWS was moderate (15-20 kts) over the
northwest BoB. The favourable sea surface temperature (SST) of about 29-30°c over
northwest Bay of Bengal (BoB), the tropical cyclone heat potential (TCHP) of about 80-100
KJ/cm2 over the same area and favourable. MJO conditions and favourable upper level
divergence supported further intensification of system.
Similar sea and environmental conditions continued and the system intensified into a
depression over northwest BoB and adjoining Odisha coast at 1200 UTC of 12th September.
2.5.3.2. Intensification and movement:
At 0000 UTC of 13th September, the depression over northwest BoB & adjoining
Odisha coast moved west-northwestwards, intensified into a deep depression and lay
centered over the northwest BoB, very close to north Odisha coast, near latitude 20.5°N and
longitude 86.9°E, close to the southeast of Chandbali (42973). At 0000 UTC of 13th
September, favourable sea conditions & MJO phase prevailed over northwest BoB. Positive
low level vorticity (150x10-6s-1), moderate VWS (15-20 Kts), and favourable upper-level
divergence helped in maintenance of active convection over the region. Under these
conditions, the system intensified into a deep depression, moved west-northwestwards and
crossed the north Odisha coast, close to the south of Chandbali between 0530 & 0630 hrs
IST (0000 – 0100 UTC) of 14th September as a deep depression with maximum sustained
wind speed of 30 knots.
At 0300 UTC of 14th September, the system was over land. The upper tropospheric
ridge lay near 220 N, to the north of the system center. The system was steered by the
mean winds in the middle and upper troposphere (500-850 hPa levels) towards the west-
northwest. Due to land interactions, marginal weakening was expected during its movement
across central India. Under this scenario, the deep depression over north interior Odisha
moved further west-northwestwards, weakened into a depression and lay centred at 0300
UTC of 14th September, over north Chhattisgarh & adjoining north interior Odisha, about 80
km west-northwest of Jharsiguda (Odisha) and about 120 km southsoutheast of Ambikapur
(Chhattisgarh).
Under the influence of active monsoon conditions and favourable environmental the
depression maintained it’s intensity for next 15 hours, moved west-northwestwards across
north Chattisgarh and Madhya Pradesh and weakened into a well-marked low-pressure area
over northeast Madhya Pradesh & neighbourhood at 0000 UTC of 15th September 2021.
The typical satellite imageries during life cycle of the system are presented in Fig. 2.5.2.

114
Table 2.5.1: Best track positions and other parameters of the Deep Depression over
the Northwest Bay of Bengal and adjoining Odisha coast during 12 Sept- 15
Sept, 2021
Knots: kt, 1 kt = 1.85 kmph, Time in IST= Time in UTC + 0530 hrs 2.5.4. Monitoring through satellite and radar:
India Meteorological Department (IMD) maintained round the clock watch over the north Indian Ocean and the system was monitored since 2nd September, about 9 days prior to the formation of LPA over eastcentral & adjoining northeast BoB on 11th and 10 days prior to formation of depression on 12th. The cyclone was monitored with the help of available satellite observations from INSAT 3D and 3DR, polar orbiting satellites and available ships & buoy observations in the region. The system was also monitored by Doppler Weather RADAR (DWR) Paradip (Odisha). Various numerical weather prediction models run by Ministry of Earth Sciences (MoES) institutions, global models and dynamical-statistical models were utilized to predict the genesis, track, landfall and intensity of the system. A digitized forecasting system of IMD was utilized for analysis and comparison of various models’ guidance, decision making process and warning products generation. Typical satellite and radar imageries at the time of crossing Odisha coast are presented in
Fig. 2.5.2.
Date
Time
(UTC)
Centre lat.0 N/
long. 0 E
C.I.
NO.
Estimated
Central
Pressure
(hPa)
Estimated
Maximum
Sustained
Surface
Wind (kt)
Estimated
Pressure
drop at the
Centre
(hPa)
Grade
12.09.2021
1200 20.3 87.4 1.5 992 25 4 D
1800 20.4 87.1 1.5 992 25 4 D
13.09.2021
0000 20.6 87.0 2.0 990 30 4 DD
0300 20.9 86.5 2.0 990 30 6 DD
Crossed north Odisha coast, close to south of Chandbali between 0530 &
0630 hrs IST as a Deep Depression with maximum sustained wind speed of
30 knots
0600 21.1 86.2 - 990 30 6 DD
1200 21.4 85.5 - 990 30 6 DD
1800 21.6 84.8 - 990 30 6 DD
14.09.2021
0000 22.0 83.6 - 990 30 6 DD
0300 22.1 83.4 - 990 25 5 D
0600 22.4 83 - 990 25 5 D
1200 22.7 82.5 - 996 25 4 D
1800 23.0 82.0 996 25 4 D
0000 Weakened into a well marked low pressure area over northeast
Madhya Pradesh & neighbourhood

115
Fig. 2.5.2: Typical imagery from Doppler weather Radar Paradip and INSAT 3D satellite at the time of crossing the coast on 13th early morning
2.5.4.1 Detailed feature observed through Satellites and Radar:
The system was monitored by DWR Paradip. Typical Radar imageries during life cycle of the
system are presented in Fig. 2.5.3.
Fig. 2.5.3: Typical imagery from Doppler weather Radar Paradip during 12- 13
Sept, 2021
Typical INSAT-3D IR, visible, enhanced colored and cloud top brightness
temperature imageries during life cycle of the system are presented in Fig. 2.5.4.
As per INSAT 3D imagery at 0300 UTC of 12th Sept, the WML over northwest Bay of
Bengal& neighbourhood was centered near 19.50N / 88.00E. Intensity of the system was
T1.0. Associated broken low and medium clouds with embedded intense to very intense
convection lay over north & adjoining central Bay of Bengal and east Odisha. Minimum cloud
top temperature was -930C.
12 Sept/1902 UTC 12 Sept/2342 UTC 13 Sept/0502 UTC

116
As per INSAT 3D imagery at 0300 UTC of 13th Sept, the system lay over land.
Associated broken low and medium clouds with embedded intense to very intense
convection lay over northwest & adjoining westcentral Bay of Bengal, Odisha and adjoining
north coastal Andhra Pradesh and gangetic West Bengal. Minimum cloud top temperature is
-930C.
As per INSAT 3D imagery at 0300 UTC of 14th Sept, the system lay over land.
Associated broken low and medium clouds with embedded intense to very intense
convection lay over Chhattisgarh, south Jharkhand, Gangetic West Bengal, Odisha, and
adjoining northwest Bay of Bengal & neighbourhood. Minimum cloud top temperature was
-90 0C.
Fig. 2.5.4(i): INSAT-3D Visible imageries during 12-15 Sept, 2021
12 Sept/0600UTC 13 Sept/0600UTC
14 Sept/0600UTC 15 Sept/0600UTC
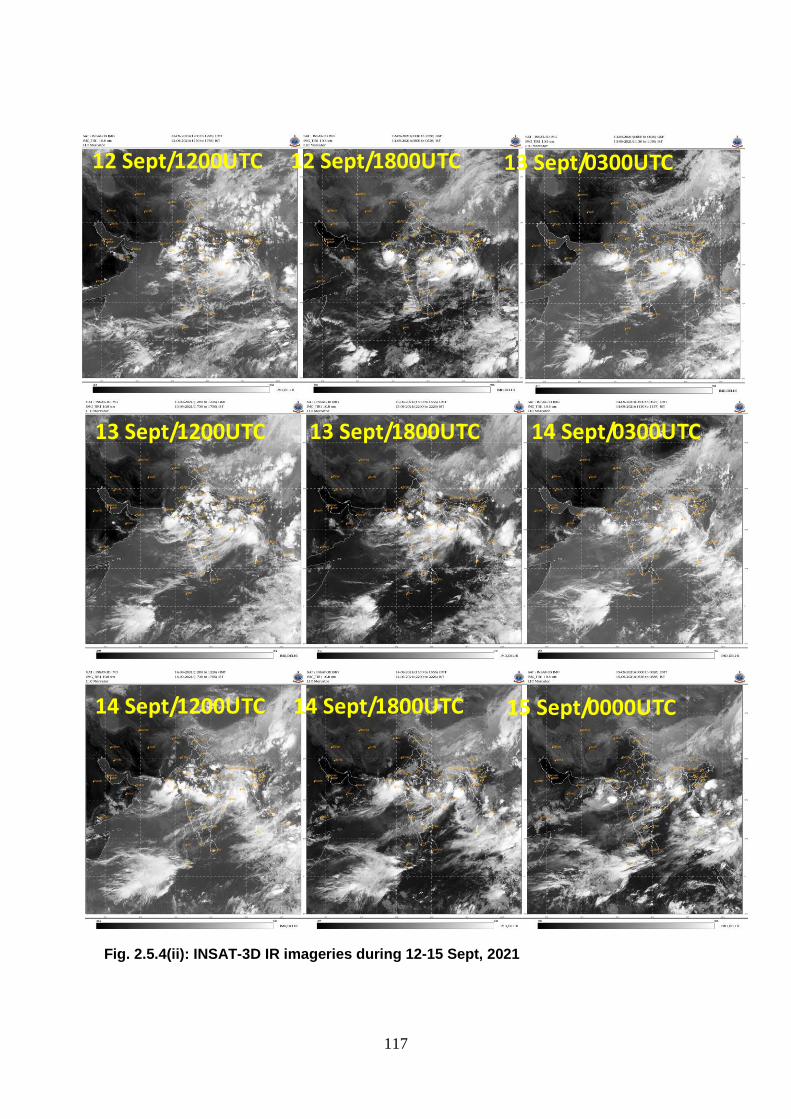
117
Fig. 2.5.4(ii): INSAT-3D IR imageries during 12-15 Sept, 2021
14 Sept/1200UTC 14 Sept/1800UTC 15 Sept/0000UTC
12 Sept/1200UTC 12 Sept/1800UTC 13 Sept/0300UTC
13 Sept/1200UTC 13 Sept/1800UTC 14 Sept/0300UTC

118
Fig. 2.5.4(iii): INSAT-3D BD imageries during 12-15 Sept, 2021
14 Sept/2130UTC 15 Sept/0000UTC
12 Sept/1200UTC 12 Sept/2130UTC
13 Sept/1200UTC 13 Sept/2130UTC 14 Sept/0300UTC
14 Sept/1200UTC
13 Sept/0300UTC

119
Fig. 2.5.4(iv): INSAT-3D enhanced color imaginaries imageries during 12-15 Sept, 2021
12 Sept/1200UTC 12 Sept/2130UTC 13 Sept/0300UTC
13 Sept/1200UTC 13 Sept/2130UTC 14 Sept/0300UTC
14 Sept/1200UTC 14 Sept/2130UTC 15 Sept/0000UTC

120
2.5.5. Dynamical features
IMD GFS (T1534) mean sea level pressure (MSLP), winds at 10 m, 850, 500 and 200
hPa levels are presented in Fig. 2.5.5. The analysis field of IMD GFS at 0000 UTC of 12th
September indicated a deep depression over northwest BoB off Odisha coast with vertical
extension upto 500 hPa level. East-southeasterly winds prevailed in the upper level
indicating west-northwestwards movement. GFS slightly over-estimated the intensity at 0000
UTC of 12th, as system lay as a WML over northwest BoB at that time.
Fig2.5.5 (i): IMD GFS (T1534) mean sea level pressure (MSLP), winds at 10m, 850, 500 and 200 hPa levels based on 0000 UTC of 12 September, 2021

121
The analysis field of IMD GFS at 0000 UTC of 13th September indicated further intensification of system north Odisha coast with vertical extension upto 500 hPa level. However, GFS slightly over-estimated the intensity at 0000 UTC of 13th, as system lay as a deep depression over north coastal Odisha at that time. However, movement and landfall time was correctly picked up.
Fig2.5.5 (ii): IMD GFS (T1534) mean sea level pressure (MSLP), winds at 10m,
850, 500 and 200 hPa levels based on 0000 UTC of 13 September 2021
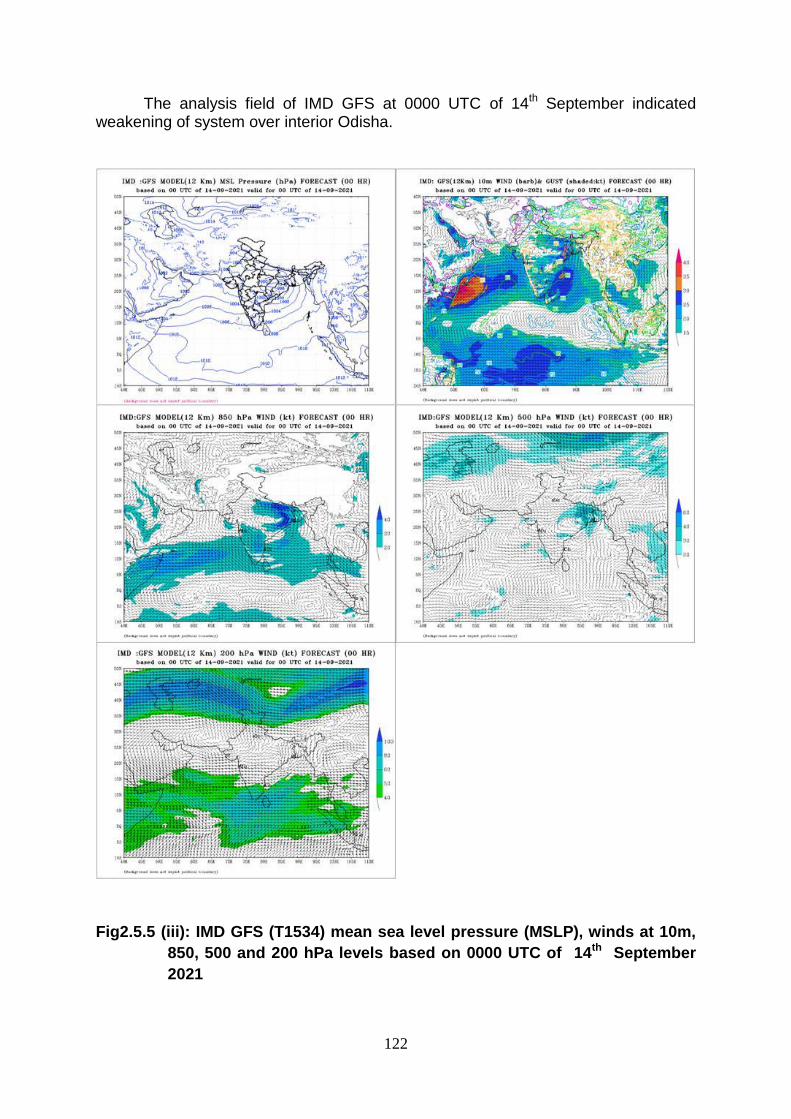
122
The analysis field of IMD GFS at 0000 UTC of 14th September indicated weakening of system over interior Odisha.
Fig2.5.5 (iii): IMD GFS (T1534) mean sea level pressure (MSLP), winds at 10m,
850, 500 and 200 hPa levels based on 0000 UTC of 14th September
2021

123
Thus, IMD GFS could capture the genesis and movement correctly. However, it
slightly over estimated the intensity of the system.
2.5.6. Realized Weather:
2.5.6.1 Rainfall:
Under the influence of deep depression, active to vigorous monsoon conditions
prevailed leading to extremely heavy rainfall at a few places over Odisha on 12th & 13th, at
isolated places over Chhattisgarh on 13th and over East Madhya Pradesh on 14th. In
conjunction with another low pressure area over Gujarat, extremely heavy rainfall at a few
places also occurred over Saurashtra and north Konkan on 13th September. Low level
convergence of wind & enhanced moisture incursion from the Bay of Bengal in association
with a trough extending eastwards across the system also caused extremely heavy rains at
isolated places over West Bengal on 14th September.
The daily rainfall distribution ending at 0300 UTC of each date during 9-15 Sept,
2021 based on merged gridded rainfall data of IMD/NCMRWF is shown in Fig. 2.5.6.
Fig. 2.5.6: Daily rainfall distribution based on merged grided rainfall data of
IMD/NCMRWF during 9-15 Sept 2021
(Heavy rainfall distribution: Isolated places: upto 25%, A few places: 26-50%, Many places : 51-75%, Most places: 76-100% of total stations in the region;

124
Heavy rainfall: 64.5 – 115.5 mm, Very heavy rainfall: 115.6 – 204.4 mm, Extremely heavy rainfall: 204.5 mm or more). The 24 hour cumulative rainfall (≥ 7 cm) ending at 0830 hours IST of date during 13th -15th August is presented below:
Datewise 24 hours accumulated rainfall (≥ 7cm) ending at 0830 hours IST of date in association with the system: 12th September Odisha Paradeep -13, Jagatsinghpur, Tentulikhunti & Balikuda-10 each, Kujanga & Tihidi-9 each, Bari, Rajkishorenagar & Derabis – 8 each and Bissem-Cuttack, Rajgangpur, Kalampur, Lahunipara, Alipingal, Rajkanika & Marsaghai-7 each 13th September Odisha Astaranga & Kakatpur-53-each, Balikuda-44, Kantapada-38, Niali-37, Puri-34, Gop & Satyabadi-33-each, Ragunathpur-32, Balipatna & Kendrapada-28-each, Marshaghai & Kujanga-27, Jagatsinghpur & Pipili-26-each, Tirtol-25, Brahmagiri-24, Paradeep & Chandikhol-22-each, Derabis-21, Tangi, Birmaharajpur & Bhubaneswar-20-each, Boudhgarh & Krishnaprasad-18-each, Garadpur-17, Nayagarh, Ullunda, Harabhanga, Phulbani, Binjharpur, Bolagarah, Mahanga & Sonepur-15-each, Salipur & Banpur-14, Odagaon, Bari & Ranpur-13-each, Jajpur, Banki & Cuttack-12, Dashpalla & Rairakhol-11-each, Lakhanpur-10, 14th September Odisha Talcher - 39, Birmaharajpur - 37, Tikarpara - 35, Sonepur - 28, Boudhgarh - 26, Patnagarh & Banarpal - 25 each, Bolangir, Hindol & Paikmal - 24 each, Kantamal & Parjang - 23 each, Barmul & Belpada - 22 each, Bari, Jenapur, Phiringia, Gaisilet & Mahanga – 21 each, Angul, Nawapara, Kamakhyanagar, Tarva & Athmalik – 20 each, Altuma, Harabhanga, Banki, Gania & Narsinghpur – 19 each, Rajkishorenagar, Phulbani, Kankadahad & Agalpur-18 each, Jharbandh, Binjharpur, Bhuban & Dhenkanal -17 each, Daitari, Athgarh, Khairamal, Rajghat, Chandikhol, Khaprakhol, Padampur – 16 each, Ullunda & Salebhatta – 15 each, Sukinda, Danagadi & Tikabali 14 each, Balasore, Telkoi, Komna, Tigiria, Salepur & Naraj – 13 each, Dunguripalli, Daspalla & Cuttack-12 each, Jaleswar, Korei, Loisingha, Jajpur & Rairakhol -11 each, Rengali, Turekela & Saintala - 10 each, Barpalli, Madanpur Rampur, Jagannath Prasad, Karlamunda, Harichandanpur, Burla, Baliguda, Chendipada, Kaniha, Atabira , K Nuagaon & Kotagarh - 9 each, Chandbali, Bhadrak, Akhuapada, Nh5 Gobindpur, Kalinga, Pallahara, Kujanga, Rajkanika, Raikia, G Udayagiri, Bargarh, Similiguda , Daringibadi, Bonth, Batli, Mundali, Dhamnagar & Jujumura - 8 each and Bhograi, Nawana, Anandpur, Belaguntha, Khandapara, Bijepur, Niali, Kaptipada, Narla, Bhanjnagar, Nischintakoili, Belgaon & Betanati – 7 each.

125
Gujarat Region: Kaprada -19, Dharampur - 17, Waghai - 14, Valsad - 13, Valsadkvkaws - 12, Dholera , Umergam & Dangs – 11 each, Vansda - 10, Quant, Uchchhal & Khergam – 9 each, Surat City, Subir, Daman & Chhota Udepur – 8 and Mangrol, Pardi & Surat – 7 each. Saurashtra & Kutch: Lodhika - 52, Visavadar - 47, Kalavad - 41, Dhoraji -25, Targhadia - 24, Junagadh & Kotdasangani - 21 each, Rajkot , Junagarh & Keshod - 20, Gondal & Jamkandorna – 19 each, Paddhari - 18, Ranavav -16, Talala & Mendarda – 15 each, Porbandar - 14, Malia - 13, Vanthali, Jamnagar, Jamjodhpur & Upleta – 12 each, Dhrol, Manavadar, Vadia & Bhesan – 11 each, Lalpur, Kutiana, Bhanvad & Kalyanpur – 10 each, Jetpur, Tankara & Jamnagarkvkaws – 9 each, Una, Veraval & Diu (dist Diu) - 8 each and Gir Gadhada & Dwarka 7 each. Chhattisgarh: Gariabund-20, Basana-19, Magarlod, Bagbahara & Chhura-14 each, Kurud-13, Rajim, Mahasamund & Saraipali-11 each, Raipur & Labhandih-10 each, Patan-9, Arang & Mana-raipur, Kartala & Abhanpur 8 each and Sakti, Bilaigarh, Saja & Gandai-7 each
15th September Gangetic West Bengal: Kharagpur-28, Midnapore-28, Kalaikunda & Mohanpur-27 each, Midnapore-26, Uluberia AWS-20, Contai & Diamond Harbour-18 each, Durgachack-17, Dum Dum-16, MO Salt Lake-14, Barrackpur-13, Lalgarh & Burdwan -12 each, Jhargram -11, Alipore & AMFU Kakdwip-10 each, Harinkhola, Canning & Digha-9 each, Bagati-8 and Kalyani -7 Chhattisgarh:-Pendra Road-18, Dhamtari-15, Marwahi-13, Gurur-12, Dondilohara & Mainpat-11each, Pendra, Jashpurnagar & Mungeli-10, Balod, Dongargaon, Lakhanpur & Kota-9, Gariabund, Gundardehi, Mohla, Chhuikhadan, Surajpur, Katghora & Bemetara-8 each and Duldula, Batoli, Khairagarh, Ambagarh Chowki, Rajpur, Pusaur, Gandai, Baloda Bazar, Sarangarh & Manora-7each. West Madhya Pradesh:-Khirkiya—11 and Budhni & Bhimpur-7 each, East Madhya Pradesh: Amarkantak-24, Lanji-13, Balaghat--10, Karanjia-9, Kotma-8 and Channodi & Lalburra-7 each. Odisha: Chandanpur-15, Ghatagaon-13, Bhograi & Sundargarh-12, Kakatpur-11, Deogaon & Banaigarh-10, Lathikata & Bangiriposi-9, Jamsolaghat, Gurundia, Lahunipara & Jharsuguda-8, Gunupur & Jaleswar-7 Gujarat Region:-Mangrol-16 and Mahuva, Chhota Udepur-7 each. Saurashtra & Kutch: Mangrol(J)-16, Vanthali & Junagadh-10 each, Malia, Jamkandorna & Jamjodhpur-9 each and Rajula, Anjar & Bhanvad-7 each. Vidarbha:-Gondia -7

126
2.5.6.2 Realised wind:
At 1200 UTC of 12th, a buoy located near 17.50 N/89.10 E reported mean sea level
pressure (MSLP) of 1001.9 hPa and winds of 1000/21.4 kt. Another Buoy near 16.30 N/
87.90 E reported 1002.4 hPa and winds of 2000/15.6 kt. Another Buoy near 13.90 N/86.90 E
reported 1005.2 hPa and winds of 2200/19.4 Kt.
At 0300 UTC of 13th a buoy located near 17.50 N/ 89.10 E MSLP of 1001.9 hPa and
winds of 1000/21.4 kt. Another buoy near 16.30 N/ 87.90 E reported 1002.4 hPa and winds Of
2000/15.6 kt. Another buoy near 13.90 N/ 86.90 E reported 1005.2 hPa and winds of
2200/19.4 kt.
2.5.7. Damage by Deep Depression
The record heavy rain over Odisha claimed the lives of at least 3 persons, hit over 19.53
lakh people and inundated extensive areas in 11 districts, prompting authorities to launch
evacuation of people from low lying areas of coastal Odisha.
Fig. 2.5.7(a-d) (a)Vehicles wade through a waterlogged road during rain in Puri, on
September 12, 2021 (source: https://www.indiatoday.in/ dated 14/09/2021) (b)Bhubaneswar
railway station ( source:https://www.downtoearth.org.in/ dated 13/09/2021) (c)A tree
uprooted on Nandankanan-KIIT Road in Bhubaneswar (source:https:// https://odishatv.in//
dated 13/09/2021) (d) Heavy rain in the wake of a deep depression in the Bay of Bengalis
likely to have caused the accident on a bridge over river Nandira when the goods train was
on its way from Firozpur to Khurda Road (source: https://economictimes.indiatimes.com/
dated 14/09/2021)
(a)
(c) (d)
(b)

127
2.6 Cyclonic Storm GULAB over Bay of Bengal (24–28th September 2021)
2.6.1 Life History:
A low pressure area formed over eastcentral Bay of Bengal (BoB) and neighbourhood
in the morning (0830 hours IST / 0300 UTC) of 24th September. It lay as a well
marked low pressure area (WML) in the same afternoon (1430 hours IST) over
eastcentral and adjoining northeast BoB.
Under favourable environmental and Sea conditions, it concentrated into a
depression over eastcentral and adjoining northeast BoB in the same evening (1730
hours IST/ 1200 UTC) of 24th September.
Moving nearly westwards, it further intensified into a deep depression over north &
adjoining central BoB in the early morning (0530 hours IST/ 0000 UTC) of 25th
September.
Continuing to move further westwards, it intensified into the Cyclonic Storm “GULAB”
(pronounced as GUL-AAB) over northwest and adjoining west-central BoB in the
same evening (1730 hours IST) of 25th September, 2021.
Thereafter, it intensified gradually and reached it‟s peak intensity of 75-85 kmph
gusting to 95 kmph around noon (1130 hours IST/0600 UTC) of 26th September.
Continuing to move further westwards, it crossed North Andhra Pradesh and adjoining
south Odisha coasts near Lat. 18.4°N/ Long. 84.2°E (20 km north of Kalingapatnam)
with maximum sustained wind speed of 75-85 gusting to 95 kmph during 1930-2030
IST of 26th September.
Thereafter, it weakened into a deep depression in the early hours (0230 hours IST) of
27th September over north Andhra Pradesh and adjoining south Odisha and into a
depression over south Chhattisgarh in the evening (1730 hours IST) of 27th.
It further weakened into a well marked Low pressure area over western parts of
Vidarbha and neighbourhood around noon of 28th September.
Observed track of the system during 24th-28th September is presented in Fig.2.6.1.
The best track parameters of the system are presented in Table 2.6.1.
Fig.2.6.1: Observed track of cyclonic storm “Gulab” during 24th – 28th September, 2021
KT: Knots (1 knot=1.86 kmph)

128
Table 2.6.1: Best track positions and other parameters of the Cyclonic Storm GULAB
over Northwest Bay of Bengal and adjoining Odisha coast during 24 - 27 Sept,
2021
2.6.2 Salient features:
Climatologically, there had been 41 cyclonic storms (MSW≥34 knots) during 1891-2020
developing over the BoB region in the month of September. Out of these 15 were severe
category storms (MSW≥48 knots). During this period there were 9 cyclones crossing
Andhra Pradesh coast. Out of these there was 1 depression in the year 1948 (19 Sep. to
1 Oct.) that developed over eastcentral BoB, crossed central India, emerged into Arabian
Date
Time
(UTC)
Centre lat.0
N/ long. 0 E
C.I.
NO.
Estimated
Central
Pressure
(hPa)
Estimated
Maximum
Sustained
Surface
Wind (kt)
Estimated
Pressure
drop at the
Centre
(hPa)
Grade
24.09.2021
1200 18.3 91.2 1.5 1000 25 4 D
1800 18.4 90.4 1.5 1000 25 4 D
25.09.2021
0000 18.4 89.7 2.0 999 30 5 DD
0300 18.4 89.3 2.0 998 30 6 DD
0600 18.4 88.7 2.0 998 30 6 DD
1200 18.3 88.3 2.5 997 35 7 CS
1500 18.3 88.1 2.5 997 35 7 CS
1800 18.3 87.9 2.5 996 35 7 CS
2100 18.3 87.6 2.5 996 35 7 CS
26.09.2021
0000 18.3 87.3 2.5 994 40 8 CS
0300 18.4 86.4 2.5 994 40 8 CS
0600 18.4 85.9 3.0 992 45 10 CS
0900 18.4 85.3 3.0 992 45 10 CS
1200 18.4 84.6 3.0 992 45 10 CS
Crossed north Andhra Pradesh – south Odisha coasts near latitude 18.40
N and longitude 84.20E, about 20 km north of Kalingapatnam with a
maximum sustained wind speed of 75-85 kmph gusting to 95 kmph
during 1930 & 2030 hrs IST (1400-1500 UTC)
1500 18.3 83.8 - 992 45 10 CS
1800 18.4 83.4 - 994 35 7 CS
2100 18.4 83.0 - 996 30 6 DD
27.09.2021
0000 18.4 82.8 - 996 30 6 DD
0300 18.4 82.5 - 996 30 6 DD
0600 18.5 82.0 - 996 30 6 DD
1200 18.6 80.1 - 998 25 4 D
1800 18.7 79.4 - 998 25 4 D
28.09.2021
0000 19.0 78.2 - 998 25 4 D
0300 19.4 77.3 - 999 20 3 D
0600 Weakened into a well marked low pressure area over western parts of
Vidarbha and neighbourhood

129
Sea and intensified into a severe cyclonic storm. It crossed south Gujarat coast as a
severe cyclonic storm and further emerged into Arabian Sea and crossed Oman coast as
a depression. The climatological tracks are presented in Fig. 2.6.2.
The system developed during active phase of monsoon over Indian sub-continent. Warm
Sea, warm moist air incursion into the core of the system, favourable Madden Julian
Oscillation phase and low to moderate vertical wind shear over the region helped in
development of cyclonic storm(CS), „Gulab”.
It caused extremely heavy rainfall over Andhra Pradesh and heavy to very rainfall over
Odisha.
The system had a life period of about 90 hours against the long period average of 110
hours for cyclonic storms during monsoon season over the Bay of Bengal based on data
during 1990-2013.
The 12 hourly average translational speed of the system was 16.8 kmph against the long
period average of 14.3 kmph based on data during 1990-2013(Fig.2.6.3 a)
The peak intensity of the system was 45 knots during 0600 to 1200 UTC of 26th
(Fig.2.6.3b).
The velocity flux, accumulated cyclone energy and power dissipation index associated
with the system were 2.35X10², 0.94 X10⁴ and 0.38 X10⁶ respectively.
There had been a total of about 18 deaths in association with this system and its remnant
over Andhra Pradesh, Telangana and Maharashtra.
The system had a track length of 1440 km.
Fig.2.6.2: Tracks of (i) cyclones crossing east coast of India, (ii) severe cyclones
crossing east coast of India, (iii) cyclones crossing Andhra Pradesh coast and (iv)
cyclone crossing Andhra Pradesh coast and emerging into Arabian Sea (all during the
month of September)
(i) (ii)
(iii) (iv)

130
Fig.2.6.3: (a) Average translational speed & direction of movement and (b) Maximum
sustained surface wind speed (kts) & Estimated Central Pressure during life
cycle of CS Gulab
2.6.3 Analysis of environmental features associated with the genesis, intensification &
movement
2.6.3.1 Genesis
Under the influence of a cyclonic circulation over eastcentral BoB, a low pressure area formed over eastcentral BoB and neighbourhood at 0300 UTC of 24th September. On 24th, the Madden Julian Oscillation (MJO) index was lying in phase 4 with amplitude close to 1. The sea surface temperature (SST) was about 28-29°C over central & adjoining north BoB. The environmental conditions were also supportive. Under these conditions, the cyclonic circulation over eastcentral BoB concentrated into a low pressure area over eastcentral BoB and neighbourhood at 0300 UTC and further into a WML over eastcentral and adjoining northeast BoB at 0900 UTC of 24th September At 1200 UTC, similar sea conditions prevailed over eastcentral BoB. A zone of positive low level vorticity (80x10-6s-1) lay to the south of system centre with vertical extension upto 200 hpa level. A zone of positive lower level convergence of 10 x10-5s-1 lay to the south of system centre. Positive upper level divergence of 10 x10-5s-1 lay to the south of system centre. The vertical wind shear (VWS) was low (05-10 kts) over north and adjoining central BoB. The sub-tropical ridge lay along 20.50N. Easterly to east-southeasterly winds to the south of the ridge steered the system nearly westwards. Under these favourable sea and environmental conditions, the system moved nearly westwards and intensified into a depression over eastcentral and adjoining northeast BoB at 1200 UTC of 24th September.
2.6.3.2. Intensification and movement
At 0000 UTC of 25th September, the positive low level vorticity increased and was about 100x10-6s-1 around the system centre with vertical extension upto 500 hPa level. A zone of positive lower level convergence of 20 x10-5s-1 lay around the system centre. The positive upper level divergence also increased and was about 20 x10-5s-1 around the system centre. The vertical wind shear (VWS) was low (05-10 KTS) over north and adjoining central BoB. The sub-tropical ridge lay along lat. 20.50N. Easterly to east-southeasterly winds prevailing to the south of the ridge were steering the system nearly westwards. Under these favourable conditions the system moved nearly westwards and intensified into a deep depression at 0000 UTC of 25th over northwest and adjoining westcentral BoB. The mean wind speed and wind shear speed and direction during the life cycle of the system are presented in Fig.2.6.4.
At 1200 UTC of 25th September, similar sea conditions prevailed over central and northwest BoB. MJO index was lying in phase 5 with amplitude close to 1, thereafter it was
(a) (b)

131
likely to move to phase 4 with amplitude becoming more than 1 for next 5 days. Thus, MJO was likely to support convective activity over the BoB region. Similar favourable environmental conditions prevailed with positive low level vorticity of 100x10-6s-1 around the system centre and with vertical extension upto upper tropospheric level. Positive lower level convergence of 10 x10-5s-1 lay to the northwest of system centre. Positive upper level divergence of 10 x10-5s-1 lay over the system centre. VWS was moderate (15-20 KTS) over northwest and adjoining central BoB and along the forecast track. The easterly to east-northeasterly winds prevailing over the system area in association with the anticyclone lying over the north India steered the system nearly westwards and it intensified into a cyclonic storm “Gulab”.
At 0600 UTC of 26th September, favourable MJO and sea conditions prevailed. The positive low level vorticity increased further (150x10-6s-1) around the system centre with vertical extension upto mid tropospheric level. Positive lower level convergence increased and was around 20 x10-5s-1 to the southwest of system centre. Positive upper level divergence also increased and was about 20 x10-5s-1 to the southwest of system centre. However, VWS was moderate to high (20-25 kt) over northwest and adjoining central BoB and along the forecast track. The upper tropospheric ridge lay along 25°N. The system was lying in the southern periphery of the ridge near 25°N and was thus steered nearly westwards. Under these conditions, the system while moving nearly westwards, intensified further and reached it‟s peak intensity of 45 kt at 0600 UTC of 26th.
Continuing to move further westwards, the system crossed north Andhra Pradesh – south Odisha coasts near 18.40 N/84.20E, about 20 km north of Kalingapatnam with a maximum sustained wind speed of 75-85 kmph gusting to 95 kmph during 1400-1500 UTC of 26th.
Thereafter, due to land interactions, increased VWS and decreased moisture supply into the core of the system, it weakened into a deep depression at 2100 UTC of 26th, into a depression at 1200 UTC of 27th and into a WML over western parts of Vidarbha and neighbourhood at 0600 UTC of 27th.
Fig.2.6.4: Mean wind shear and wind speed in the middle and deep layer around the
system during 24-28 September, 2021
2.6.4 Monitoring:
India Meteorological Department (IMD) maintained round the clock watch over the north
Indian Ocean and the system was monitored since 16th September, about 8 days prior to the
formation of LPA over eastcentral BoB on 24th. The cyclone was monitored with the help of
available satellite observations from INSAT 3D and 3DR, polar orbiting satellites and
available ships & buoy observations in the region. The system was also monitored by
Doppler Weather RADAR (DWR) Visakhapatnam (Andhra Pradesh). Various numerical

132
weather prediction models run by Ministry of Earth Sciences (MoES) institutions, global
models and dynamical-statistical models were utilized to predict the genesis, track, landfall
and intensity of the system as well as associated adverse weather. A digitized forecasting
system of IMD was utilized for analysis and comparison of various models‟ guidance,
decision making process and warning products generation.
2.6.4.1 Features observed through Satellite
Detailed satellite imageries from INSAT-3D, ASCAT & Microwave utilized for monitoring of
CS Gulab are presented in Fig.2.6.5 (a-f) respectively. As per INSAT 3D imagery at 1200
UTC of 24th September, convection over eastcentral & adjoining northeast BOB indicated
further organization. The clouds got organized in curved band pattern. Associated minimum
CTT was -930C. Intensity of the system was categorised as T 1.5. Associated broken low and
medium clouds with embedded intense to very intense convection lay over eastcentral &
adjoining northeast BOB and Arakan coast.
At 0000 UTC of 25th September, associated minimum CTT was -930C. Intensity of the
system was categorised as T2.0. Associated broken low and medium clouds with embedded
intense to very intense convection lay over north and adjoning central BoB.
At 1200 UTC of 25th Sep., there was gradual organisation of convection. The intensity of
the system was categorised as T 2.5. Clouds were organised in CDO pattern. Minimum
cloud top temperature was -930C. Total precipitable water vapour imagery at 0740 UTC of
25th indicated good warm moist air incursion into the core of system. Associated broken low
and medium clouds with embedded intense to very intense convection lay over north and
adjoining central BoB between latitude 16.0°N& 20.0°N and longitude 87.0°E& 91.5°E .
At 0600 UTC of 26th Sep., the clouds got organized in curved band pattern. The area of
deep convection was seen to the west of low level circulation centre under the influence of
easterly vertical wind shear. The intensity of the system was categorised as T 2.5. Minimum
CTT was -930 C. Associated broken low and medium clouds with embedded intense to
very intense convection lay over northwest and adjoining westcentral BoB between latitude
16.0°N & 19.5°N & longitude 83.5°E & 87.0°E and south coastal Odisha & north coastal
Andhra Pradesh.
At 1200 UTC of 26th Sep., the intensity of the system was categorised as T 2.5. Minimum
CTT was -930C. Associated broken low and medium clouds with embedded intense to very
intense convection lay over northwest and adjoining westcentral BoB between latitude
15.5°N to 19.0°N and longitude 81.5°E to 85.5°E and south coastal Odisha & north coastal
Andhra Pradesh.
At 2100 UTC of 26th Sep. minimum CTT was -930C. Associated broken low/medium
clouds with embeded intense to very intense convection over coastal Andhra Pradesh
adjoining Odisha, east Telangana adjoining south Chattisgarh and over west-central BoB
between latitude 14.00 N to 18.50 N and longitude 80.00 E to 86.50 E.

133
Fig.2.6.5(a): INSAT-3D visible imageries during 24-28 September, 2021
Fig.2.6.5(b): INSAT-3D colour enhanced imageries during 24-28 September, 2021
24 SEPT/0900 UTC 25 SEPT/0600 UTC 26 SEPT/0600
UTC
27 SEPT/0600 UTC 28 SEPT/0600 UTC
24 SEPT/1200 UTC 25 SEPT/0000 UTC 25 SEPT/1200 UTC
26 SEPT/0000 UTC 26 SEPT/1200 UTC 25 SEPT/2000 UTC
28 SEPT/0000 UTC 27 SEPT/1200 UTC 28 SEPT/0000 UTC

134
Fig.2.6.5(c): INSAT-3D BD imageries during 24-28 September, 2021
24 SEPT/1200 UTC 24 SEPT/2000 UTC 25SEPT/0000UTC
25 SEPT/1200 UTC 26 SEPT/0000 UTC 26SEPT/1200UTC
27 SEPT/0000 UTC 27 SEPT/1200 UTC 28SEPT/0000UTC

135
Fig.2.6.5(d): INSAT-3D IR1 imageries during 24-28 September, 2021
24 SEPT/1200 UTC 25 SEPT/0300 UTC 25 SEPT/1200 UTC
26 SEPT/0300 UTC 26 SEPT/1200 UTC 27 SEPT/0300 UTC
27 SEPT/1200 UTC 27 SEPT/2000 UTC 28 SEPT/0000 UTC

136
Fig.2.6.5(e): Microwave imageries during life cycle of CS GULAB during 24-28
September, 2021
24 SEPT/0110 UTC 25 SEPT/0100 UTC
26 SEPT/2310 UTC 27 SEPT/2040 UTC
28 SEPT/2120 UTC

137
Fig.2.6.5(f): ASCAT imageries during 24-27 September, 2021
2.6.4.2 Doppler Weather RADAR based observations
CS GULAB was monitored by the Doppler Weather Radars (DWR) at Vishakhapattanam on
26th September. Typical radar imageries are presented in Fig.2.6.6. It could indicate the
curved bands and deep convection in association with the system.
Fig.2.6.6: RADAR imageries from DWR Visakhapatnam on 26th September
24 SEPT 25 SEPT
26 SEPT 27 SEPT
26 SEP /0600 UTC
26 SEP /1800 UTC
26 SEP /1200 UTC
26 SEP /1500 UTC
26 SEP /0900 UTC
26 SEP /2100 UTC

138
2.6.5 Dynamical Features
IMD GFS analysis of mean sea level pressure, winds at 10m, 850 hPa, 500 hPa and 200
hPa levels based on 0000 UTC during 24th-28th September are presented in Fig.2.6.7 (a-e).
On 24th IMD GFS was not capturing low pressure area over eastcentral BoB.
Fig.2.6.7 (a): IMD GFS (T574) mean sea level pressure (MSLP), winds at 10m, 850, 500
and 200 hPa levels based on 0000 UTC of 24th September, 2021

139
The analysis fields based on 0000 UTC of 25th indicated a low pressure area over
eastcentral BoB. However, at that time, the system lay as a deep depression over
westcentral & adjoining northwest BoB. However, it could capture easterly flow over central
and adjoining north BoB.
Fig.2.6.7(b): IMD GFS (T574) mean sea level pressure (MSLP), winds at 10m, 850, 500
and 200 hPa levels based on 0000 UTC of 25th September, 2021
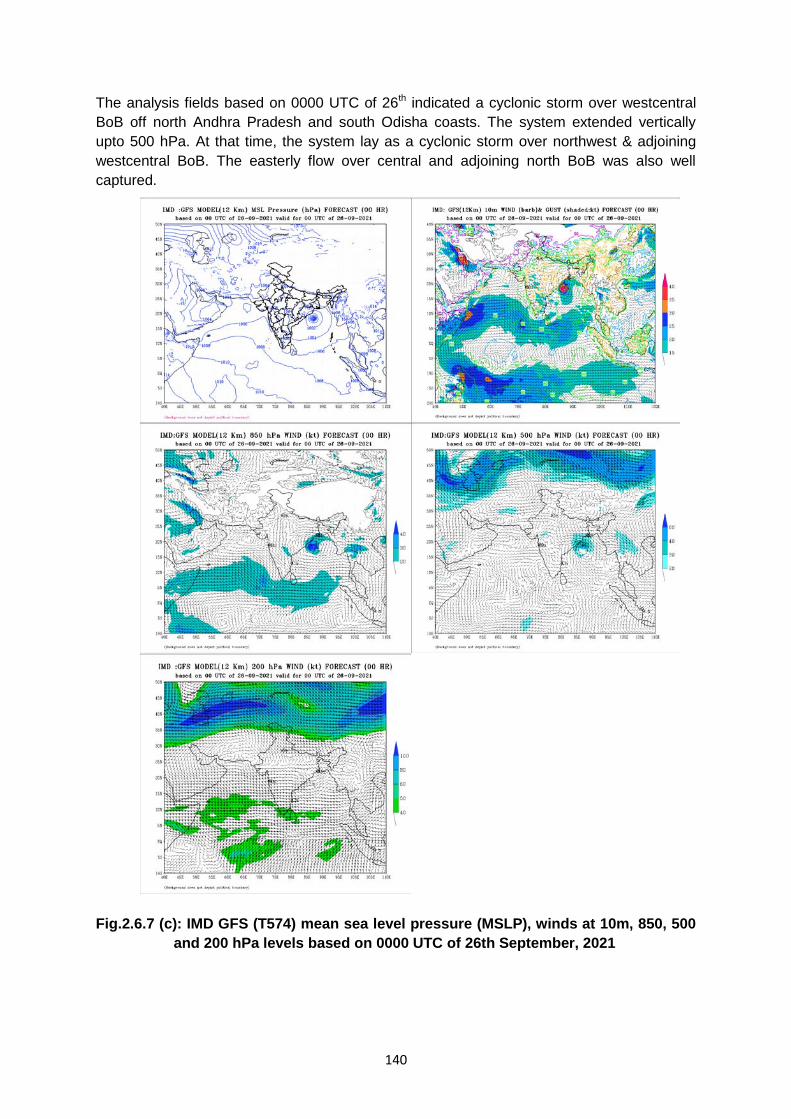
140
The analysis fields based on 0000 UTC of 26th indicated a cyclonic storm over westcentral
BoB off north Andhra Pradesh and south Odisha coasts. The system extended vertically
upto 500 hPa. At that time, the system lay as a cyclonic storm over northwest & adjoining
westcentral BoB. The easterly flow over central and adjoining north BoB was also well
captured.
Fig.2.6.7 (c): IMD GFS (T574) mean sea level pressure (MSLP), winds at 10m, 850, 500
and 200 hPa levels based on 0000 UTC of 26th September, 2021

141
The analysis fields based on 0000 UTC of 27th indicated that the system lay over northern
parts of Andhra Pradesh as a depression. However, the system lay as a deep depression
over south Odisha and adjoining Chattisgarh at that time.
Fig.2.6.7 (d): IMD GFS (T574) mean sea level pressure (MSLP), winds at 10m, 850, 500
and 200 hPa levels based on 0000 UTC of 27th September, 2021

142
The analysis fields based on 0000 UTC of 28th indicated that the system lay over north
Telangana and adjoining Vidarbha as a depression with vertical extension upto 500 hPa
level. The easterly flow in the upper levels that was steering the system westwards was also
well captured.
Fig.2.6.7 (e): IMD GFS (T574) mean sea level pressure (MSLP), winds at 10m, 850, 500
and 200 hPa levels based on 0000 UTC of 28th September, 2021
Thus, initially IMD GFS underestimated the intensity of the system. However, from 25th
onwards, it correctly picked the intensity. It was lagging behind the best track positions as far
as location and movement of the system concerned.
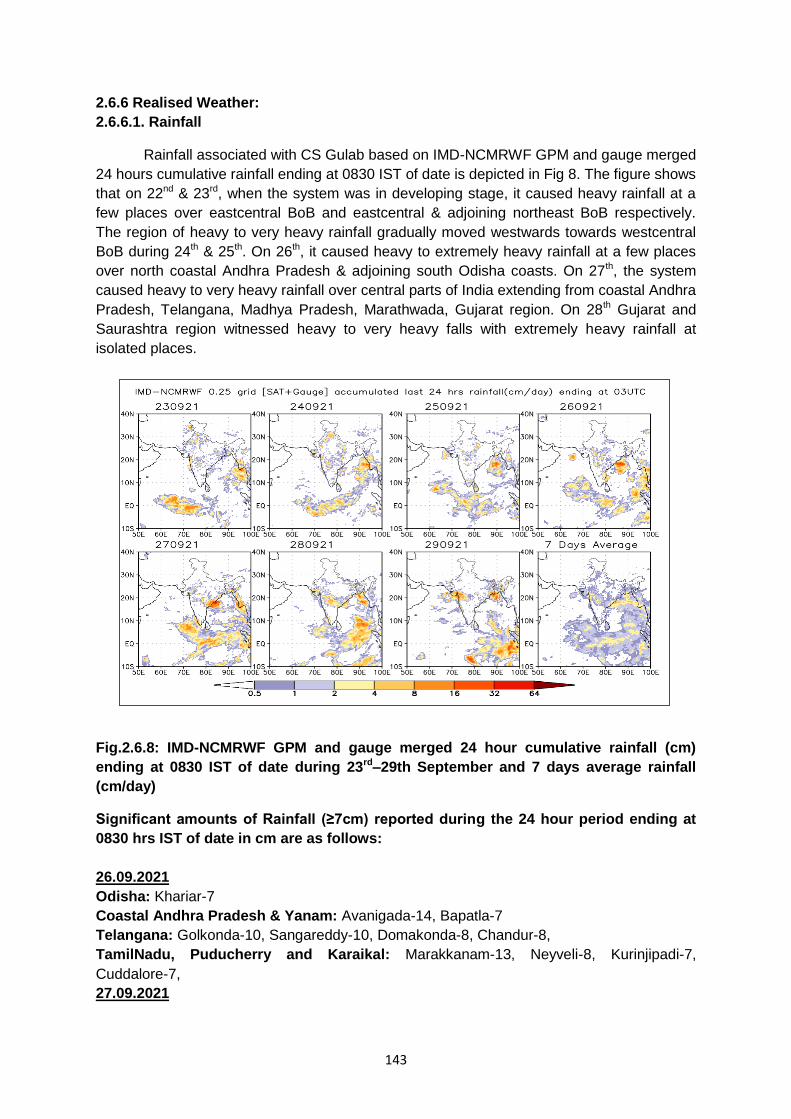
143
2.6.6 Realised Weather:
2.6.6.1. Rainfall
Rainfall associated with CS Gulab based on IMD-NCMRWF GPM and gauge merged
24 hours cumulative rainfall ending at 0830 IST of date is depicted in Fig 8. The figure shows
that on 22nd & 23rd, when the system was in developing stage, it caused heavy rainfall at a
few places over eastcentral BoB and eastcentral & adjoining northeast BoB respectively.
The region of heavy to very heavy rainfall gradually moved westwards towards westcentral
BoB during 24th & 25th. On 26th, it caused heavy to extremely heavy rainfall at a few places
over north coastal Andhra Pradesh & adjoining south Odisha coasts. On 27th, the system
caused heavy to very heavy rainfall over central parts of India extending from coastal Andhra
Pradesh, Telangana, Madhya Pradesh, Marathwada, Gujarat region. On 28th Gujarat and
Saurashtra region witnessed heavy to very heavy falls with extremely heavy rainfall at
isolated places.
Fig.2.6.8: IMD-NCMRWF GPM and gauge merged 24 hour cumulative rainfall (cm)
ending at 0830 IST of date during 23rd–29th September and 7 days average rainfall
(cm/day)
Significant amounts of Rainfall (≥7cm) reported during the 24 hour period ending at
0830 hrs IST of date in cm are as follows:
26.09.2021
Odisha: Khariar-7
Coastal Andhra Pradesh & Yanam: Avanigada-14, Bapatla-7
Telangana: Golkonda-10, Sangareddy-10, Domakonda-8, Chandur-8,
TamilNadu, Puducherry and Karaikal: Marakkanam-13, Neyveli-8, Kurinjipadi-7,
Cuddalore-7,
27.09.2021

144
Coastal Andhra Pradesh & Yanam : Visakhapatnam, Gajapathinagaram and Nellimarla -
28 each, Mentada - 25, Pusapatirega - 24, Garividi, Denkada and Gantyada - 19 each,
Anakapalle and Salur - 18 each, Bondapalle 17, Cheepurupalle 16, Ranastalam and
Therlam - 15 each, Chodavaram - 14, Vizianagaram, Vepada, Bheemunipatnam and
Kalingapatnam 13 each, Bobbili, Araku Valley and Amalapuram - 12 each, Kakinada ,
Merakamudidam and Vijayawada - 11 each, Polavaram, Palakoderu, Chintalapudi and
Koyyalagudem - 10 each, Chintapalle , Srungavarapukota, Palakonda, Tadepalligudem,
Narsipatnam, Yanam, Bhimadole, Tanuku and Yelamanchili - 9 each, Palasa, Nuzvid,
Seethanagaram and Parvathipuram - 8 each, Vararamachandrapur, Paderu, Balajipeta,
Chintur, Eluru, Mandasa, Garugubilli, Tekkali, Kaikalur and Velairpad - 7 each.
Odisha: Pottangi - 15, Mahendragarh - 9, Mohana and Nandapur - 8, Lamataput ,
Semiliguda and R.Udayagiri - 7 each
28.09.2021
Odisha: Cuttack-13, Gajapati-8, Jajpur-7;
Chhattisgarh: Dantewada-18;
Coastal Andhra Pradesh & Yanam: Vishakhapatnam and West Godavari-13 each; Krishna
and Vijaywada-8 each;
Telangana: Jakranpalle 23, Navipet 21, Dhar Palle 21, Ranjal , Dich Palle & Armur 18 each,
Nandipet, Chandurthi & Sirsilla 17 each, Jammikunta & Bheemgal 16 each, Yeda Palle,
Makloor , Ellanthukunta, Jukkal, Sarangapurnrl & Velpur 15 each, Nizamabad, Bodhan,
Nirmal, Shriramsag pocha & Dilawarpur 14 each, Mudhole, Mogullapalle, Mallapur,
Balkonda & Laxmanchanda 13 each, Srirampur, Nizam Sagar & Domakonda 12 each,
Mortad, Venkatapur, Gundala, Elagaid, Tadwai Mlg & Peddapalle 11 each, Kusumanchi,
Naga Reddipet, Konaraopeta, Kammar Palle,Metpalle, Madhira, Manthani, Machareddy &
Bhiknur – 10 each, Sultanabad, Parkal, Kamareddy, Burgampadu, Pinapaka, Chegunta,
Khanpur, Gambhiraopet,Thimmapur, Banswada, Madnur, Mulug, Boath, Ibrahimpatnam &
Julapalle 9 each, Mustabad, Shadnagar, Choppadandi, Shayampet, Shamirpet,
Papannapet, Karimnagar,Pitlam, Tupran, Govindaraopet, Dharmaram, Aswapuram &
Dummugudem – 8 each and Yellareddypeta, Varni, Hakimpet, Kotgiri, Ramgundam,
Bhupalpalle, Manuguru, Karimnagar, Venkatapuram, Manchal,Tekmal, Chigurumamidy,
Lingampet, Birkoor, Bomraspeta, Ramayampet, Kothaguda,Bejjanki, Narayankhed, Tadwai,
Kondurg, Bhadrachalam, Medak, Sadasivanagar – 7 each
Marathwada: Nanded-15, Aurangabad-13, Beed-11; Osmanabad and Latur-10 each; Jalna
8, Hingoli and Parbhani-7 each;
Vidarbha: Chandrapur-10; Buldana-9;
Madhya Maharashtra: Jalgaon-11, Kolhapur-7;
West Madhya Pradesh: Dewas-7;
Gujarat Region: Mehsana-9; Saurashtra & Kutch: Amreli-12, Gir Somnath-8. Jamnagar,
Junagarh, Morbi and Porbandar-7 each
29.09.2021
Gujarat Region: Khanvel-37, Silvassa-22 & Umerpada-22 each, Palsana-19, Bharuch-18,
Maktampur & Madhbun-17 each, Dang, Nanipalson & Garudeshwar-16, Kaprada, Dholera,
Tilakwada & Dediapada-15 each, Khambhat & Nizer-14 each, Hansot, Narmadakvk &
Dangkvk-13 each, Waghai-12, Rajpipala, Kukarmunda, Uchchhal & Dholka-11 each, Subir,
Dhandhuka, Choryasi, Nandod, Ukai, Valsad & Naswadi-10 each, Vagra, Surat City,
Gandevi, Valia, Ankleshwer, Vansda, Sagbara, Kamrej, Surat, Khergam, Tarapur, Borsad &

145
Pardi-9 each, Vadodara, Songadh, Daman, Netrang & Jhagadia-8 each, Navasari, Vapi,
Dharampur, Sojitra, Mahuva, Nadiad, Bardoli, Karjan, Arnej, Dabhoi, Umergam & Valod-7
each
Saurashtra & Kutch: Jamnagar-14, Targhadia-11, Lodhika, Gondal & Barvala-10 each,
Rajkot, Kotdasangani & Botad-9 each, Chuda, Junagadh & Babra-8 each, Chotila,
Jamkandorna, Vadia, Chotila, Jetpur & Dhoraji-7 each
Madhya Maharashtra: Shahada-18, Harsul-15, Akkalkuwa & Shrirampur-14 each, Peth-13,
Surgana, Taloda & Jamner-12 each, Nandurbar, Igatpuri & Yeola-11 each, Ozharkheda-10,
Dhadgaon/Akrani, Trimbakshwar & Lonavala-9 each, Nandgaon & Girnadam-8, Shirpur,
Savlivihir Agri, Parola, Pachora & Bhadgaon-7 each
Marathwada: Khultabad-14, Vaijapur-11, Paithan-10, Gangapur-9, Kannad-7,
2.6.6.2. Realised wind
Maximum Wind Speed of 52 knots (95 kmph) was reported at Kalingapatnam on 26.09.2021
at 1349 UTC (19:19 hrs IST) around the time of landfall.
2.6.7. Damage due to cyclonic storm Gulab
As per media reports about 4 persons in Andhra Pradesh, 3 in Telangana and 11 in
Maharashtra lost their lives due to cyclonic storm Gulab. The damage photographs are
presented in Fig.2.6.9.
Fig.2.6.9 (a-b): Submerged paddy field at Pinagadi in Visakhapatnam district (Source-
https://www.newindianexpress.com/ dated:29 Sept), (b) Road network to several villages in
the coastal mandals of Srikakulam was cut off due to the downpour (Source:
https://timesofindia.indiatimes.com/ dated: 28 Sept),
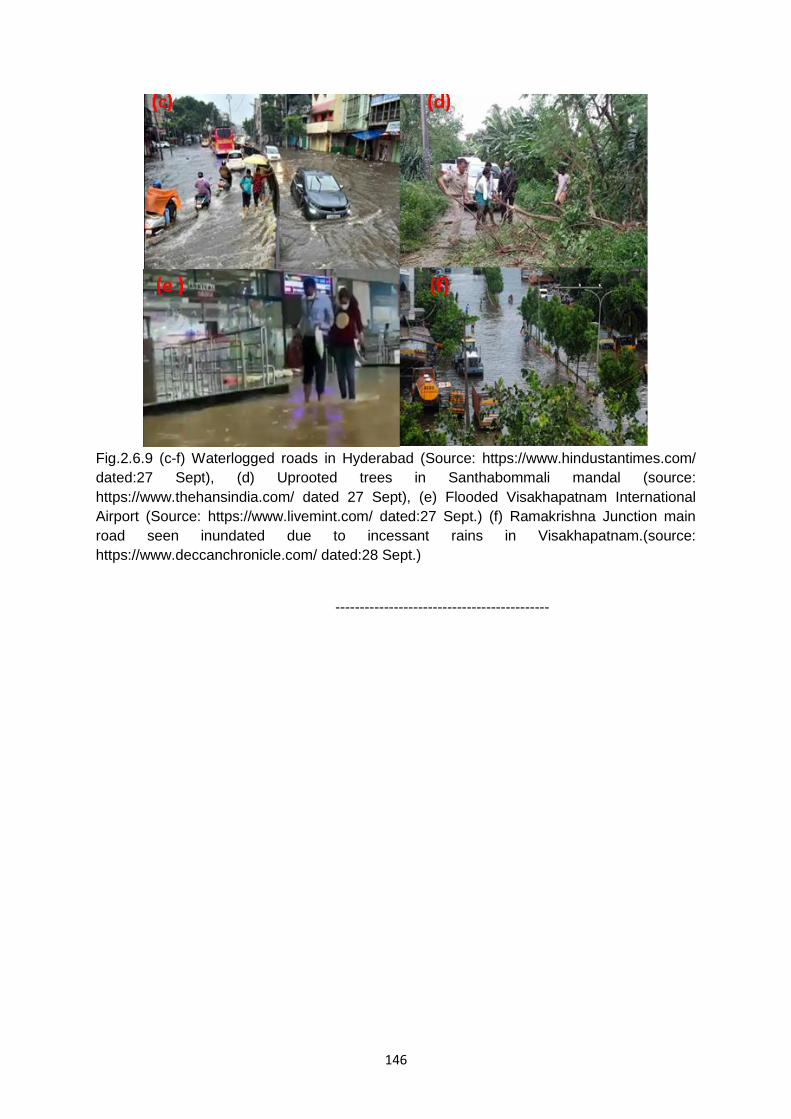
146
Fig.2.6.9 (c-f) Waterlogged roads in Hyderabad (Source: https://www.hindustantimes.com/
dated:27 Sept), (d) Uprooted trees in Santhabommali mandal (source:
https://www.thehansindia.com/ dated 27 Sept), (e) Flooded Visakhapatnam International
Airport (Source: https://www.livemint.com/ dated:27 Sept.) (f) Ramakrishna Junction main
road seen inundated due to incessant rains in Visakhapatnam.(source:
https://www.deccanchronicle.com/ dated:28 Sept.)
--------------------------------------------

147
2.7 Severe Cyclonic Storm Shaheen over Arabian Sea
2.7.1 Life History:
The remnant of cyclonic storm Gulab emerged as a well marked low pressure area
into south Gujarat region & adjoining Gulf of Khambhat in the morning (0830 hours
IST) of 29th September.
Under favourable environmental and sea conditions, it concentrated into a
depression over northeast Arabian Sea (AS) & adjoining Kutch, in the morning (0530
hours IST) of 30th September.
Moving west-northwestwards, it further intensified into a deep depression over the
same region in the midnight (2330 hours IST) of 30th September.
Thereafter it moved westwards and intensified into cyclonic storm “Shaheen” over the
northeast AS off Gujarat coast in the morning (0530 hours IST) of 1st October, 2021.
Moving westwards for some time, it moved west-northwestwards and intensified into
a severe cyclonic storm in the evening (1730 hours IST) of 1st October over
northwest & adjoining northeast Arabian Sea.
Continuing to move further west-northwards till evening (1730 hours IST) of 2nd
October, it recurved west-southwestwards and crossed Oman coast during 0030-
0130 IST of 4th Oct. with wind speed of 95-105 gusting to 115 kmph.
Thereafter moving west-southwestwards, it weakened into a cyclonic storm over
North Oman and adjoining United Arab Emirates in the morning (0530 hours IST),
into deep depression in the forenoon (0830 hours IST), into a depression around
noon (1130 hours IST) and into a well marked low pressure area in the evening
(1730 hours IST) of 4th October over the same region.
Observed track of the system during 30th September -4th October is presented in
Fig.2.7.1.
Fig.2.7.1: Observed track of cyclonic storm Gulab (24th Sep - 28th Sep), it’s remnant
(28th Sep-30th Sep.) and severe cyclonic storm, Shaheen (30th Sep.-4th Oct.)

148
Table 2.7.1: Best track positions and other parameters of the Severe Cyclonic Storm
SHAHEEN over Arabian Sea during 30 Sept- 4 Oct, 2021
Date
Time
(UTC)
Centre lat.0 N/
long. 0 E
C.I.
NO.
Estimated
Central
Pressure
(hPa)
Estimated
Maximum
Sustained
Surface
Wind (kt)
Estimated
Pressure
drop at the
Centre
(hPa)
Grade
30.09.2021
0000 22.7 69.5 1.5 998 25 4 D
0300 22.7 68.6 1.5 998 25 4 D
0600 22.8 68.2 1.5 998 25 4 D
1200 23.1 67.4 1.5 998 25 4 D
1800 23.1 66.8 2.0 996 30 6 DD
01.10.2021
0000 23.2 65.5 2.5 995 35 7 CS
0300 23.2 64.9 2.5 994 40 8 CS
0600 23.2 64.5 3.0 992 45 10 CS
0900 23.3 64.1 3.0 991 45 11 CS
1200 23.4 63.7 3.5 987 55 15 SCS
1500 23.6 63.4 3.5 986 55 16 SCS
1800 23.6 63.2 3.5 984 60 18 SCS
2100 23.8 62.8 3.5 984 60 18 SCS
02.10.2021
0000 23.8 62.4 3.5 984 60 18 SCS
0300 23.9 62.1 3.5 984 60 18 SCS
0600 24.1 61.8 3.5 984 60 18 SCS
0900 24.3 61.3 3.5 984 60 18 SCS
1200 24.5 60.7 3.5 984 60 18 SCS
1500 24.5 60.4 3.5 984 60 18 SCS
1800 24.4 60.0 3.5 984 60 18 SCS
2100 24.4 59.7 3.5 984 60 18 SCS
03.10.2021
0000 24.3 59.5 3.5 984 60 18 SCS
0300 24.2 59.0 3.5 984 60 18 SCS
0600 24.1 58.6 3.5 984 60 18 SCS
0900 24.1 58.3 3.5 984 60 18 SCS
1200 24.0 58.0 3.5 984 60 18 SCS
1500 24.0 57.7 3.5 984 60 18 SCS
1800 23.9 57.3 3.5 986 55 16 SCS
Crossed Oman coast during 1900 to 2000 UTC of 3rd
October, near latitude
23.9°N and longitude 57.3°E, about 120 km west-northwest of Muscat as a
severe cyclonic storm with a maximum sustained wind speed of 95-105 kmph
gusting to 115 kmph.
2100 23.8 57.2 - 988 55 14 SCS
04.10.2021
0000 23.7 56.8 - 994 40 08 CS
0300 23.5 56.4 - 998 30 05 DD
0600 23.3 56 - 1000 20 03 D
1200 Weakened into a well-marked low pressure area over north Oman and
adjoining United Arab Emirates

149
2.7.2 Brief life history
2.7.2.1. Genesis
At 0000 UTC of 30th September, the well marked low pressure area over
south Gujarat region and adjoining Khambat moved west-northwestwards, emerged
into Gulf of Kutch and concentrated into a depression over northeast AS and
adjoining Gulf of Kutch. The sea surface temperature (SST) was about 28-29°C over
northeast and eastcentral AS with decreasing trend towards west. The tropical
cyclone heat potential (TCHP) was about 80-90KJ/cm2 over northeast AS with
decreasing trend towards the northwest & westcentral AS. A zone of positive lower
level convergence of 20 x10-5s-1 lay to the south of the system center. Positive upper
level divergence of 30 x10-5s-1 lay to the south-southwest of the system center. Low
vertical wind shear (VWS) about (15-20 KTS) prevailed around the system center.
Satellite derived total precipitable water vapour imagery (TPW) indicated that the
system was under favourable environment of warm moist air. The easterly winds
prevailing in the mid & upper tropospheric levels suggested westwards movement of
the system. Typical total precipitable water vapour (TPW) imageries and mean wind
shear & mean wind speed during the life cycle of SCS Shaheen are presented in
Fig.2.7.2 and Fig.2.7.3 respectively.
2.7.2.2 Intensification and movement
At 1800 UTC of 30th September, similar sea conditions prevailed over north
and central AS. Positive low level vorticity increased and was about 120 x10-6s-1 over
northeast AS and adjoining Gulf of Kutch with vertical extension upto 200 hPa. An
elongated zone of positive lower level convergence of 10 x10-5s-1 was seen over
northeast AS from Gujarat to Makaran coasts. Positive upper level divergence of 20
x10-5s-1 was seen to the southwest of the system center. Vertical wind shear (VWS)
was low (5-10 KTS) over the system area. TPW imagery indicated warm moist air
over the system area. Easterly winds prevailed in the mid & upper tropospheric
levels indicating westwards steering of the system. Under these favourable
conditions, the system moved nearly westwards and intensified into a deep
depression over northeast AS.
At 0000 UTC of 1st October, similar sea conditions prevailed over northeast
AS. Positive low level vorticity increased and was about 200 x10-6s-1 over northeast
AS and adjoining Gulf of Kutch with vertical extension upto 200 hPa. Positive lower
level convergence also increased and was about 20 x10-5s-1 over northeast AS
around the system centre. Elongated positive upper level divergence of 20 x10-5s-1
lay over northeast AS. Low vertical wind shear (VWS) about (5-10 KTS) prevailed
around the system center. Warm moist air prevailed over the system area. The east-
southeasterly winds prevailed in the mid & upper tropospheric levels steering the
system west-northwestwards Under these favourable conditions, the system moved
nearly northwest and intensified into the cyclonic storm “Shaheen” over the northeast
AS.

150
At 1200 UTC of 1st October, similar sea conditions prevailed and warm moist
air incursion continued. Positive vorticity was about 250 x10-6s-1 lay over northwest
and adjoining northeast AS with vertical extension upto 200 hPa. Positive lower level
convergence zone extended over the entire northwest Arabian Sea and was about
20 x10-5s-1 around the system centre. Positive upper level divergence was about 20
x10-5s-1 over system centre. Equatorward outflow was seen in the upper level. Low
vertical wind shear (VWS) about (5-10 KTS) prevailed around the system center and
along the forecast track upto Gulf of Oman. All other dynamic & thermodynamic
parameters including warm sea, high ocean thermal energy, low vertical wind shear,
warm moist environment around the system and equatorward outflow favoured
further intensification of the system. The east-southeasterly winds in the middle &
upper tropospheric levels indicated west-northwestwards steering of the system.
Under these conditions, the system moved west-northwestwards and intensified into
a severe cyclonic storm over northwest AS.
At 0300 UTC of 2nd October, similar sea conditions prevailed. Positive vorticity
decreased slightly and was about 200 x10-6s-1 over northwest Arabian Sea with
vertical extension upto 200 hPa. Positive lower level convergence zone extended
over the entire northwest As and was about 5-10 x10-5s-1. Positive upper level
divergence was about 10x10-5s-1 to the south of the system centre. Strong
equatorward outflow was seen in the upper level. VWS was about 10-15 KTS around
the system centre and along the forecast track upto Gulf of Oman. Shear tendency
was neutral along the forecast track. Satellite derived total precipitable water vapour
imagery indicated continuous warm moist air feedback into the core of the system.
However, dry air intrusion from Iran-Afghanistan region commenced in the southern
sector of the system from 0000 UTC of 2nd October. Other dynamic &
thermodynamic parameters including warm sea, high ocean thermal energy, low
vertical wind shear and strong equatorward outflow were favourable for the system
to maintain its intensity during next 12 hours. The east-southeasterly winds in the
middle & upper tropospheric levels indicated west-northwestwards steering of the
system during next 1 2 hours. Thereafter, the system was expected to be steered
west-southwestwards under the influence of east-northeasterly winds in the
periphery of anticyclone over Iran. Under these conditions, the system moved west-
northwestwards and lay as an SCS over northwest AS.
At 1200 UTC of 2nd October, similar sea conditions prevailed. However, a
warmer tongue of SST (29-30°C) also prevailed over Gulf of Oman. TCHP was
about 60-70 KJ/cm2 over northwest Arabian Sea and adjoining Gulf of Oman.
Positive vorticity was about 200 x10-6s-1 to the south of the system centre with
vertical extension upto 200 hPa. Positive lower level convergence and upper level
divergence were both about 20 x10-5s-1 over the system centre. Strong equatorward
outflow was also seen in the upper level. Low level vertical wind shear (VWS) of 10-
15 KTS prevailed around the system centre and along the forecast track over entire
Gulf of Oman. Decreasing shear tendency prevailed over the Gulf of Oman and over
the Oman coast. Warm moist air incursion continued into the core of the system. Dry

151
air intrusion taking place since morning hours of 2nd October ceased and as per
satellite water vapour imageries no dry air intrusion was observed at 1200 UTC.
Other dynamic & thermodynamic parameters including warm sea, low vertical wind
shear, strong equatorward outflow were favourable for the system to maintain its
intensity during next 12 hours. The east-southeasterly winds in the middle & upper
tropospheric levels in association with an anticyclone over western parts of India,
was steering the system west-northwestwards. Thereafter, the system was expected
to weaken gradually and move west-southwestwards, under the influence of east-
northeasterly winds in the periphery of another anticyclone over Iran.
At 0300 UTC of 3rd October, SST was about 28-29°C over northwest AS.
However, a warm tongue of higher SST (29-30°C) prevailed over Gulf of Oman.
TCHP was about 60-70 KJ/cm2 over northwest AS and adjoining Gulf of Oman.
Positive vorticity decreased and was about 80-100 x10-6s-1 to the south of the system
center. Positive lower level convergence was around 20 x10-5s-1 and upper level
divergence was about 20 x10-5s-1 to the south of the system center. Strong
equatorward outflow was also seen in the upper level. Low VWS (10-15 KTS)
prevailed over the system centre and along the forecast track over entire Gulf of
Oman. Decreasing wind shear tendency prevailed over the Gulf of Oman and over
the Oman coast. The TPW imageries indicated that the system was under
favourable environment of warm moist air. However, dry air prevailed to the southern
sector but it was not entering into the core of the system. Other dynamic &
thermodynamic parameters including warm sea, low vertical wind shear, strong
equatorward outflow were favourable for maintaining the intensity of the system
helped till 1500 UTC of 3rd October. The system was steered west-southwestwards
gradually under the influence of east-northeasterly winds in the periphery of another
anticyclone over Persian Gulf. During it’s west-southwestwards movement, the
system was expected to weaken gradually due to land interactions.
At 1200 UTC of 3rd, similar sea and environmental conditions prevailed.
However, due to commencement of land interactions, the system indicated slight
weakening. Continuing to move west-southwestwards, the system crossed Oman
coast near latitude 23.9 °N and longitude 57.3 °E about 120 km west-northwest of
Muscat (Oman) as a severe cyclonic storm with a maximum sustained wind speed of
95-105 kmph (55 kts) gusting to 115 kmph (65 kts) during 1900 to 2000 UTC of 3rd
October.Thereafter, the system weakened rapidly due to land interactions and cold
dry air incursion into the core from the Arabian Peninsular region into a cyclonic
storm at 0000 UTC, into a deep depression at 0300 UTC, a depression at 0600 UTC
over north Oman and into a well marked low pressure area over north Oman and
adjoining United Arab Emirates at 1200 UTC of 4th October.

152
Fig.2.7.2: Typical total precipitable water vapour imageries during life cycle of SCS
SHAHEEN during 30 Sept.- 4 Oct. 2021
The mean wind shear and speed in the middle (500-850 hPa) layer and deep (200-850 hPa)
layer is presented in Fig.2.7.3. The mean wind speed in middle layer best represents the
southwestwards recurvature of the system.

153
Fig.2.7.3: Mean wind shear and speed in the deep (200-850 hPa) and middle (500-850
hPa) layers during life cycle of VSCS YAAS
2.7.3. Monitoring through satellite
India Meteorological Department (IMD) maintained round the clock watch over the
north Indian Ocean and the system was continuously tracked after the landfall of cyclone
Gulab over north Andhra Pradesh on 26th. Gulab weakened into a well marked low pressure

154
area over western parts of Vidarbha in the afternoon (0600 UTC) of 28th Sep. However, the
system was monitored even after that. On 29th September forenoon (0830 hours IST) the
media and general public were informed about the likely emergence of remnant of Gulab into
northeast Arabian Sea. The extended range outlook issued on 30th September indicated
high probability of cyclogenesis over north Arabian Sea. The cyclone was monitored with the
help of available satellite observations from INSAT 3D and 3DR, polar orbiting satellites and
available ships & buoy observations in the region. Various numerical weather prediction
models run by Ministry of Earth Sciences (MoES) institutions, global models and dynamical-
statistical models were utilized to predict the genesis, track, landfall and intensity of the
system. A digitized forecasting system of IMD was utilized for analysis and comparison of
various models’ guidance, decision making process and warning products generation.
Detailed satellite imageries from INSAT-3D, ASCAT and Microwave imageries utilized for
monitoring SCS SHAHEEN are presented in Fig.2.7.4 (a-f).
2.7.3.1 Monitoring of Shaheen through Satellite
Fig.2.7.4(a): INSAT-3D Visible imageries during life cycle of SCS SHAHEEN during 30
Sept- 4 Oct, 2021
As per INSAT 3D imagery at 0000 UTC of 30th September, associated minimum cloud top
temperature (CTT) was -930C. Intensity of the system was categorised as T 1.5. Associated
scattered to broken low and medium clouds with embedded intense to very intense
convection lay over west Gujarat, Gulf of Kutch, northeast and adjoining eastcentral Arabian
Sea.
04 Oct/0600
30 Sep/0600 01 Oct/0600 02 Oct/0600
03 Oct/0600

155
Fig.2.7.4(b): INSAT-3D BD imageries during life cycle of SCS SHAHEEN during 30
Sept- 4 Oct, 2021
At 1800 UTC of 30th September, intense convection was seen over northeast AS
and neighbourhood around the system area. Associated minimum CTT was -930C. Intensity
30 Sep/0000 30 Sep/1200 01 Oct/0000
01 Oct/1200
02 Oct/0000
02 Oct/1200
02 Oct/1630
03 Oct/0000
03 Oct/1200
03 Oct/1630
04 Oct/0000
04 Oct/1200

156
of the system was categorised as T 2.0. Associated scattered to broken low and medium
clouds with embedded intense to very intense convection lay over west Gujarat, Gulf of
Kutch, north and adjoining eastcentral Arabian Sea. At 0300 UTC of 2nd October, the system
moved northwards. Maximum convection was seen in the southern sector of the system.
Ragged eye was observed in the visible imagery. Minimum cloud top temperature was -
930C. Intensity of the system was categorised as T 3.5. Broken low and medium clouds with
embedded intense to very intense convection lay over AS between latitude 21. 0N & 24.50N
and longitude 60.0 0E & 63.50E.
At 1200 UTC of 2nd October, ragged eye was observed. Minimum CTT was -930C.
Intensity of the system was categorised as T 3.5. Broken low and medium clouds with
embedded intense to very intense convection lay over Arabian Sea area between latitude
21.5N & 25.0N and longitude 60.0 0E & 63.50E and Makran coast.
At 0300 UTC of 3rd October, minimum CTT was -820C. Intensity of the system was
categorised as T 3.5. Broken low and medium clouds with embedded intense to very intense
convection lay over AS area between latitude 230N & 260N and longitude 57 0E & 610N and
Makran coast.
At 1200 UTC of 3rd October, the cloud mass was seen engulfing the eye. Strong
convective cloud bands wrapping the system centre were clearly seen in the visible and IR
imagery. The primary cloud bands associated with central feature of the system entered
north coast of Oman. Outer cloud band with embedded intense convective cells weakened.
Eye temperature decreased suggesting possible weakening of the system. Intensity of the
system was characterized as T 3.5. Associated broken low/medium clouds with embedded
intense to very intense convection lay over AS bet latitude 230N & 260N and longitude 57 0E
& 61.0 0N, Makran coast, Gulf of Oman and north Oman. Minimum CTT was minus 80 0C.
At 1800 UTC of 3rd, the intensity of the system was T 3.5. Associated broken
low/medium clouds with embedded intense to very intense convection lay over Gulf of Oman
and adjoining northwest AS between latitude 22.50N & 25.50N and longitude 56.00E &
60.00E, West Makaran coast, Gulf of Oman and north Oman. Minimum CTT was minus 78 0C.
At 0000 UTC of 4th October, broken low and medium clouds with embedded
moderate to intense convection lay over Oman and Gulf of Oman. Minimum cloud top
temperature was minus 68 0C.
At 0300 UTC of 4th October, cloud mass got distorted due to land interactions.
Broken low and medium clouds with embedded moderate to intense convection lay over
Oman and Gulf of Oman. Minimum cloud top temperature was minus 67 0C.
At 0600 UTC of 4th October, cloud mass got further disorganized. Scattered to
broken low and medium clouds with embedded moderate to intense convection lay over
Oman and Gulf of Oman. Minimum cloud top temperature was minus 58 0C.

157
Fig.2.7.4(c): INSAT-3D IR imageries during life cycle of SCS SHAHEEN during 30 Sept-
4 Oct, 2021
30 Sep/0000 30 Sep/1200 01 Oct/0000
01 Oct/1630
02 Oct/0000
02 Oct/1200
02 Oct/1630
03 Oct/0000
03 Oct/1200
03 Oct/1630
04 Oct/0000
04 Oct/1200

158
Fig.2.7.4(d): INSAT-3D enhanced colored imageries during life cycle of SCS SHAHEEN
during 30 Sept- 4 Oct, 2021
30 Sep/0000 30 Sep/1200 01 Oct/0000
01 Oct/1200
02 Oct/0000
02 Oct/1200
02 Oct/1630
03 Oct/0000
03 Oct/1200
03 Oct/1630
04 Oct/0000
04 Oct/1200

159
Typical ASCAT imageries during 30th September – 4th October are presented in Fig.2.7.4 (e).
Fig.2.7.4(e): ASCAT imageries during life cycle SCS SHAHEEN during 30 Sept- 4 Oct,
2021
30 Sep/1450 01 Oct/1730
03 Oct/1650 04 Oct/1650

160
Typical microwave imageries during life cycle of SCS Shaheen are presented in Fig.2.7.4 (f).
Eye was clearly seen during 1st to 3rd October.
Fig.2.7.4 (f): Microwave imageries during life cycle of SCS SHAHEEN during 30 Sept- 4
Oct, 2021
30 Sep/2100 01 Oct/1430 01 Oct/2144
02 Oct/0300
02 Oct/1400
03 Oct/0300
03 Oct/1200
03 Oct/1400
04 Oct/0230
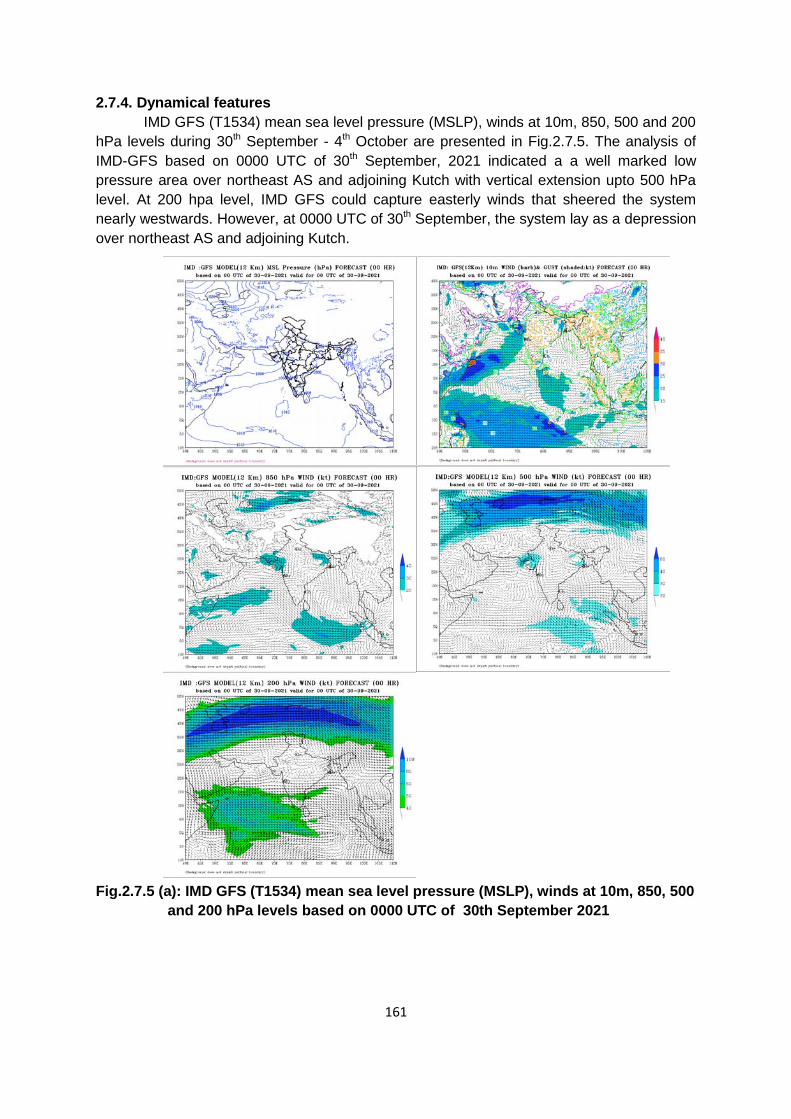
161
2.7.4. Dynamical features
IMD GFS (T1534) mean sea level pressure (MSLP), winds at 10m, 850, 500 and 200
hPa levels during 30th September - 4th October are presented in Fig.2.7.5. The analysis of
IMD-GFS based on 0000 UTC of 30th September, 2021 indicated a a well marked low
pressure area over northeast AS and adjoining Kutch with vertical extension upto 500 hPa
level. At 200 hpa level, IMD GFS could capture easterly winds that sheered the system
nearly westwards. However, at 0000 UTC of 30th September, the system lay as a depression
over northeast AS and adjoining Kutch.
Fig.2.7.5 (a): IMD GFS (T1534) mean sea level pressure (MSLP), winds at 10m, 850, 500
and 200 hPa levels based on 0000 UTC of 30th September 2021
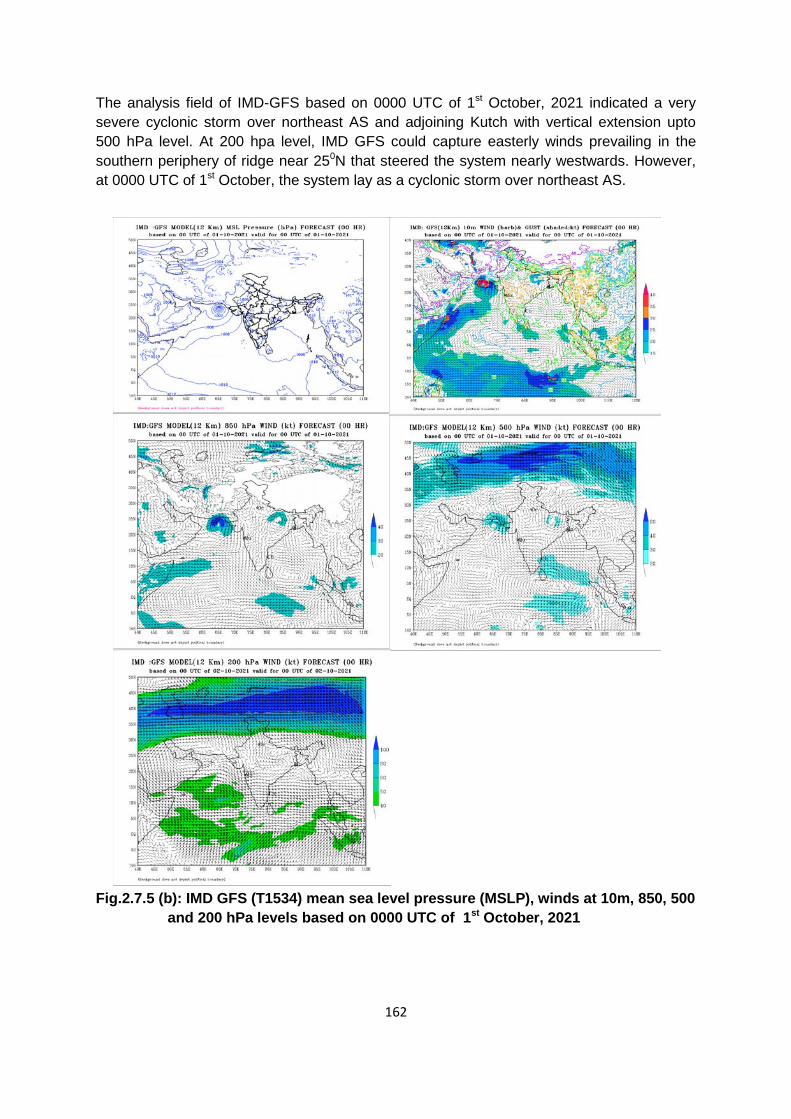
162
The analysis field of IMD-GFS based on 0000 UTC of 1st October, 2021 indicated a very
severe cyclonic storm over northeast AS and adjoining Kutch with vertical extension upto
500 hPa level. At 200 hpa level, IMD GFS could capture easterly winds prevailing in the
southern periphery of ridge near 250N that steered the system nearly westwards. However,
at 0000 UTC of 1st October, the system lay as a cyclonic storm over northeast AS.
Fig.2.7.5 (b): IMD GFS (T1534) mean sea level pressure (MSLP), winds at 10m, 850, 500
and 200 hPa levels based on 0000 UTC of 1st October, 2021

163
The analysis field of IMD-GFS based on 0000 UTC of 2nd October, 2021 indicated an
extremely severe cyclonic storm over northwest AS close to Iran with vertical extension upto
500 hPa level. At 200 hpa level, IMD GFS could capture easterly winds prevailing in the
southern periphery of ridge near 260N that steered the system nearly westwards. However,
at 0000 UTC of 2nd October, the system lay as a severe cyclonic storm over northwest AS
near 23.8N/62.4E close to Iran.
Fig.2.7.5 (c): IMD GFS (T1534) mean sea level pressure (MSLP), winds at 10m, 850, 500
and 200 hPa levels based on 0000 UTC of 2nd October, 2021

164
The analysis field of IMD-GFS based on 0000 UTC of 3rd October, 2021 indicated an
extremely severe cyclonic storm over Gulf of Oman with vertical extension upto 500 hPa
level. It also indicated west-southwestawrds movement of the system. At 200 hpa level, IMD
GFS could indicate easterly winds prevailing in the southern periphery of ridge near 260N
and an anticyclone over Arabian Peninsular region that steered the system west-
southwestwards. However, at 0000 UTC of 3rd October, the system lay as a severe cyclonic
storm over Gulf of Oman.
Fig.2.7.5 (d): IMD GFS (T1534) mean sea level pressure (MSLP), winds at 10m, 850, 500
and 200 hPa levels based on 0000 UTC of 2nd October, 2021
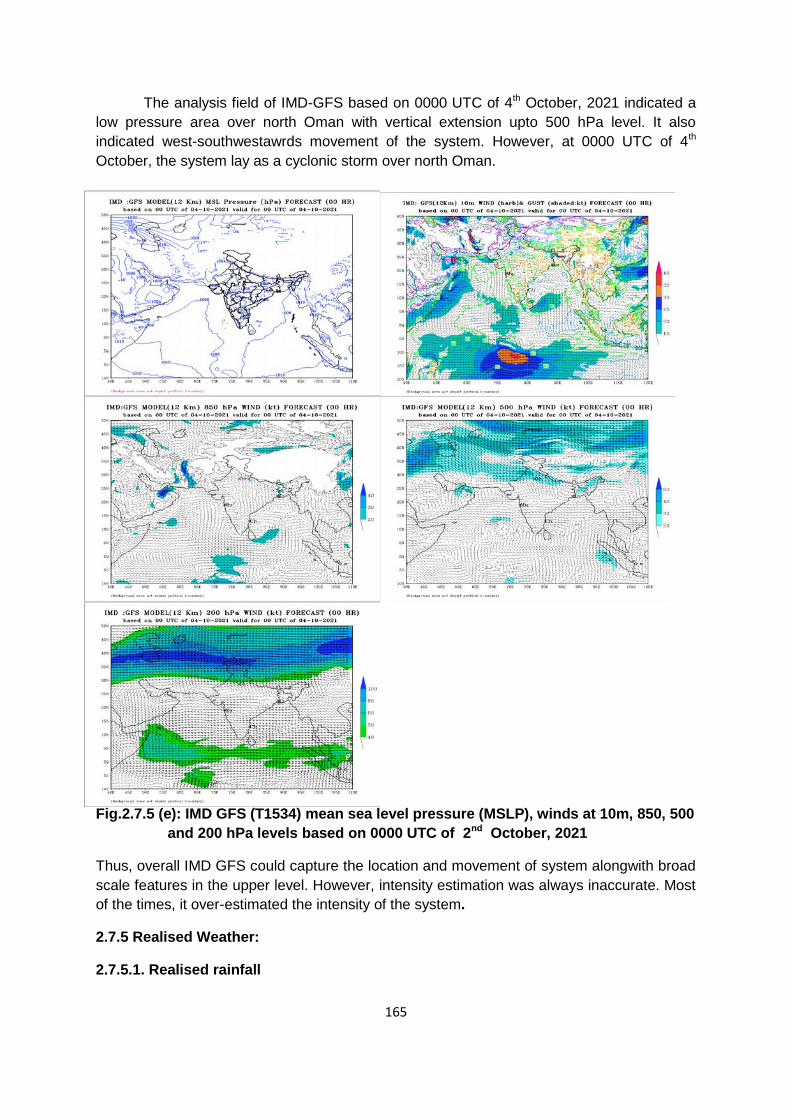
165
The analysis field of IMD-GFS based on 0000 UTC of 4th October, 2021 indicated a
low pressure area over north Oman with vertical extension upto 500 hPa level. It also
indicated west-southwestawrds movement of the system. However, at 0000 UTC of 4th
October, the system lay as a cyclonic storm over north Oman.
Fig.2.7.5 (e): IMD GFS (T1534) mean sea level pressure (MSLP), winds at 10m, 850, 500
and 200 hPa levels based on 0000 UTC of 2nd October, 2021
Thus, overall IMD GFS could capture the location and movement of system alongwith broad
scale features in the upper level. However, intensity estimation was always inaccurate. Most
of the times, it over-estimated the intensity of the system.
2.7.5 Realised Weather:
2.7.5.1. Realised rainfall

166
Rainfall associated with SCS Shaheen based on IMD-NCMRWF GPM merged gauge 24
hours cumulative rainfall ending at 0830 IST of date is depicted in Fig.2.7.6. The figure
depicts that the system caused heavy to extremely heavy rainfall over Gujarat and
Saurashtra region on 29th September. Thereafter, the rainfall belt shifted gradually from over
northeast AS to northwest AS during 30th Sep. and 1st Oct. On 2nd Oct. heavy to extremely
heavy rainfall was observed over northwest AS and adjoining Gulf of Oman. On 3rd, coastal
Oman received heavy to extremely heavy rainfall.
Fig.2.7.6: IMD-NCMRWF GPM merged gauge 24 hr cumulative rainfall (cm) ending at
0830 IST of date (30th Sep. – 6th October) and 7 days average rainfall (cm/day)
30 September 2021
India
24 hours accumulated rainfall ending at 0830 hours IST of 30th Sep (cm)
Gujarat Region:- Vagra-10, Hansot-9, Ankleshwer-9, Khambhat-7,
Saurashtra & Kutch:- Visavadar-29, Lilia-14, Khambhalia-14, Kalyanpur-13, Amreli-13,
Mangrol(J)-13, Jafrabad-13, Bagasra-13, Jesar-12, Jamnagar-12, Amrelikvkaws-12,
Keshod-11, Lalpur-11, Veraval-11, Kalavad-11, Rajula-11, Kutiana-10, Talala-9, Malia-9,
Gariadhar-9, Dwarka-9, Palitana-9, Anjar-8, Mendarda-8, Lodhika-8, Talaja-7, Mundra-7,
Okha-7, Rajkot-7, Bhesan-7, Upleta-7, Manavadar-7, Savarkundla-7, Bhavnagar-7
Pakistan : As per media reports, the cyclone caused light rain and gusty winds in parts of
Karachi on September 30. The city’s Millennium Mall on Rashid Minhas Road also saw
heavy traffic due to three electric poles falling on the area.
4th October
Oman
As per media reports 369 mm of rainfall was reported in the Wilayat of Al-Khaboura, the
highest in association with the storm on 4th October. 290.8 mm of downpour was recorded
in Suwaiq and Al-Khaboura at 167.9 mm.
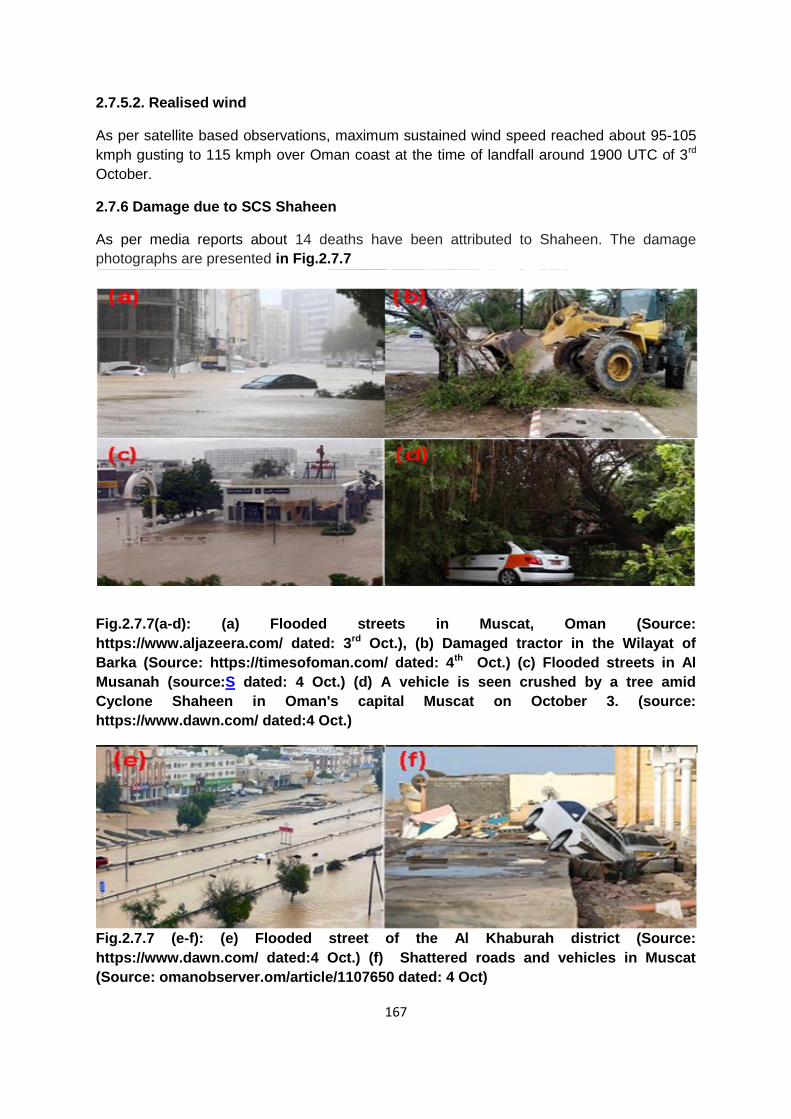
167
2.7.5.2. Realised wind
As per satellite based observations, maximum sustained wind speed reached about 95-105
kmph gusting to 115 kmph over Oman coast at the time of landfall around 1900 UTC of 3rd
October.
2.7.6 Damage due to SCS Shaheen
As per media reports about 14 deaths have been attributed to Shaheen. The damage
photographs are presented in Fig.2.7.7
Fig.2.7.7(a-d): (a) Flooded streets in Muscat, Oman (Source:
https://www.aljazeera.com/ dated: 3rd Oct.), (b) Damaged tractor in the Wilayat of
Barka (Source: https://timesofoman.com/ dated: 4th Oct.) (c) Flooded streets in Al
Musanah (source:S dated: 4 Oct.) (d) A vehicle is seen crushed by a tree amid
Cyclone Shaheen in Oman's capital Muscat on October 3. (source:
https://www.dawn.com/ dated:4 Oct.)
Fig.2.7.7 (e-f): (e) Flooded street of the Al Khaburah district (Source:
https://www.dawn.com/ dated:4 Oct.) (f) Shattered roads and vehicles in Muscat
(Source: omanobserver.om/article/1107650 dated: 4 Oct)

168
2.8 Depression over eastcentral Arabian Sea during 07thNov-9th Nov 2021
2.8.1 Introduction
Under the influence of the cyclonic circulation over southeast and adjoining
southwest Bay of Bengal (BoB), a low pressure area formed over central parts
of south BoB at 0300 UTC (0830 hours IST) of 27th October, 2021.
It moved westwards and emerged into Comorin Area at 0300 UTC (0830
hours IST) of 1st November. Continuing to move westwards, it emerged into
southeast Arabian Sea (AS) at 0300 UTC (0830 hours IST) of 3rd November.
It lay as a well marked low pressure area over eastcentral AS at 0300 UTC
(0830 hours IST) of 6th November.
It concentrated into a depression over eastcentral AS at 0300 UTC (0830
hours IST) of 7th November.
It moved west-northwestwards till 0300 UTC (0830 hours IST) of 8th. It
thereafter gradually recurved south-southwestwards and weakened into a well
marked low pressure area over eastcentral AS at 0000 UTC (0530 hours IST)
of 9th November.
The observed track of the system during 07th Nov- 09th Nov is presented in
Fig.2.8.1. Best Track parameters associated with the system are presented in
Table1.
Fig.2.8.1: Observed track of depression over North Andaman Sea and
neighbourhood (07th - 09th Nov, 2021)

169
Table 2.8.1 : Best track positions and other parameters of the Depression over
Arabian Sea during 07th Nov- 09th Nov, 2021
2.8.2 Brief life history
Genesis Intensification and movement
Under the influence of a cyclonic circulation over southeast and adjoining southwest
Bay of Bengal (BoB), a low pressure area formed over central parts of south BoB at 0300
UTC of 27th October, 2021. Moving westwards, it emerged into Comorin Area at 0300 UTC
of 1st November and into southeast AS at 0300 UTC of 3rd November.
At 0300 UTC of 3rd November, the Madden Julian Oscillation (MJO) index was in
Phase 2, with amplitude less than 1. It was expected to propagate further eastwards & move
across phase 3 and reach phase 4 on 5th November with amplitude remaining less than 1. It
was expected to continue in same phase till 8th November. Hence, MJO was supporting
enhancement of convective activity over the North Indian Ocean (NIO) during next 5 days.
The sea surface temperature (28- 29ᵒC) and ocean thermal energy (OTE) over southeast &
eastcentral AS were favourable to support convection. Vertical wind shear was low to
moderate over southeast & adjoining eastcentral AS. There were 2 distinct regions of
vertically coupled low level convergence & upper level divergence maxima, one located over
Maldives – Comorin area and the other over southeast AS to the northwest of Lakshadweep
area. The upper tropospheric ridge lay along latitude 150N over the AS.
The system moved north-northwestwards and lay as a well marked low pressure
area over eastcentral AS at 0300 UTC of 6th November. At 0300 UTC of 6th November, the
convectively active phase of MJO lay in phase 3 with amplitude less than 1. It was likely to
enter into phase 4 around 9th November and further propagate eastwards with amplitude
less than 1 till 9th November. Favourable sea conditions prevailed over southeast & east-
central. Vertical wind shear was low (5-10 knots) over the region and the shear tendency
was neutral. However, it was high to the north of the system centre. The low level
convergence was 5-10 x 10-5 s-1 over southeast AS. The upper level divergence was also 5-
10 x 10-5 s-1 over southeast and adjoining eastcentral AS. The low level cyclonic vorticity was
Date
Time (UTC)
Centre lat.0 N/
long. 0 E
C.I. NO.
Estimated Central
Pressure (hPa)
Estimated Maximum Sustained Surface
Wind (knot)
Estimated Pressure
drop at the Centre (hPa)
Grade
07.11.2021
0300 14.0 67.5 1.5 1002 25 4 D
0600 14.2 67.2 1.5 1002 25 4 D
1200 14.3 67.0 1.5 1002 25 4 D
1800 14.5 66.8 1.5 1002 25 4 D
08.11.2021
0000 14.6 66.6 1.5 1002 25 4 D
0300 14.7 66.4 1.5 1002 25 4 D
0600 14.7 66.2 1.5 1002 25 4 D
1200 14.6 65.9 1.5 1003 20 3 D
1800 14.5 65.8 1.5 1003 20 3 D
09.11.2021 0000 Weakened into a Well Marked Low Pressure Area over central parts of
Arabian Sea

170
around (50-60 x 10-6 s-1) and it extended upto mid-tropospheric levels over east-central AS.
The upper tropospheric ridge roughly lay along lat. 150N over the AS. A moist environment,
as indicated by the total precipitable water vapour imageries prevailed over the southeast
and adjoining east-central AS. Under these conditions, the system moved west-
northwestwards and lay as a well marked low pressure area over eastcentral AS.
At 0300 UTC of 07th November, the SST was about 28-29°C over northeast and
eastcentral AS with decreasing trend towards west. The TCHP was about 80-90 KJ/cm2 over
northeast AS with decreasing trend towards the northwest & westcentral AS. Positive
vorticity increased and was about 100 X 10-6 s-1 around system centre at 850 hPa with
vertical extension upto 500 hPa level. Positive lower level convergence increased and was
about 10 X10-5s-1 to the east of system center. Positive upper level divergence also
increased and was about 20 X10-5s-1 to the east of system center. Moderate vertical wind
shear about (20-25 knots) prevailed around the system center. Under these favourable
environmental conditions, it concentrated into a depression over eastcentral AS at 0300 UTC
of 7th November and moved northwestwards under the influence of southeasterlies
prevailing in middle and upper tropospheric levels.
At 0300 UTC of 8th November, similar sea and environmental conditions prevailed.
The system lay to the south of ridge near 15.5°N. Under these conditions, the system moved
west-northwestwards maintaining it’s intensity of depression.
Thereafter, the system was steered by easterly to northeasterly winds in the mid &
upper tropospheric levels. Thus, it moved nearly westwards for some time and gradually
recurved southwestwards from 1200 UTC of 8th November. At 1200 UTC of 08th November,
similar sea conditions prevailed. However, slight weakening trend was seen in all the
thermodynamic parameters and wind shear also increased over the system area. Under
these conditions, the system recurved southwestwards and weakened gradually into a well
marked low pressure area over central parts of AS at 0000 UTC of 9th November.
2.8.3 Monitoring of depression over Arabian Sea
India Meteorological Department (IMD) maintained round the clock watch over the north Indian Ocean and the system was monitored since 30th October (8 days prior to formation of depression over eastcentral AS on 7th November) when it was indicated that the low pressure area over southwest BoB would move westwards and emerge into southeast AS and intensify further. The cyclone was monitored with the help of available satellite observations from INSAT 3D and 3DR and polar orbiting satellites. Various numerical weather prediction models developed by Ministry of Earth Sciences (MoES) institutions and dynamical-statistical models were utilized to predict the genesis, track, landfall and intensity of the cyclone. A digitized forecasting system of IMD was utilized for analysis and comparison of various model guidance, decision making process and warning product generation.
2.8.4 Features observed through satellite
Satellite monitoring of the system was mainly done by using half hourly
INSAT-3D and 3DR imageries. Satellite imageries of international geostationary
satellites Meteosat-8 & MTSAT, high resolution polar orbiting satellites and
scatterometer imageries from ASCAT were also considered for monitoring the
system. Typical INSAT-3D visible/ IR imageries, enhanced colored imageries and
ASCAT (Met-Op A) imageries are presented in Fig.2.8.2. The cloud mass was

171
organized in shear pattern during it’s life cycle. The detailed sat features are
discussed in this section.
At 0300 UTC of 7th November, INSAT 3D imagery indicated broken low and medium clouds with embedded intense to very intense convection lay over eastcentral AS between latitude 12.00N & 19.00N and longitude 67.00E & 71.50E. Minimum cloud top temperature (CTT) was -930C. Intensity of the system was categorized as T 1.5. Satellite derived total precipitable water vapour (TPW) imagery indicated moist environment around the system centre.
At 0300 UTC of 8th November, the cloud mass further shifted northwestwards. Minimum CTT was -930C. Intensity of the system was categorised as T 1.5. Associated broken low and medium clouds with embedded intense to very intense convection lay over eastcentral AS between latitude 13.00N & 17.00N and longitude 65.00E & 71.00E.
Fig.2.8.2a:INSAT-3D enhanced colored imageries during life cycle of
Depression over North Andaman Sea during 07th- Nov- 09th Nov, 2021
07 NOV/0300 UTC
08 NOV/0030 UTC
08 NOV/2000 UTC
07 NOV/1230 UTC
08 NOV/1200 UTC
09 NOV/0030 UTC
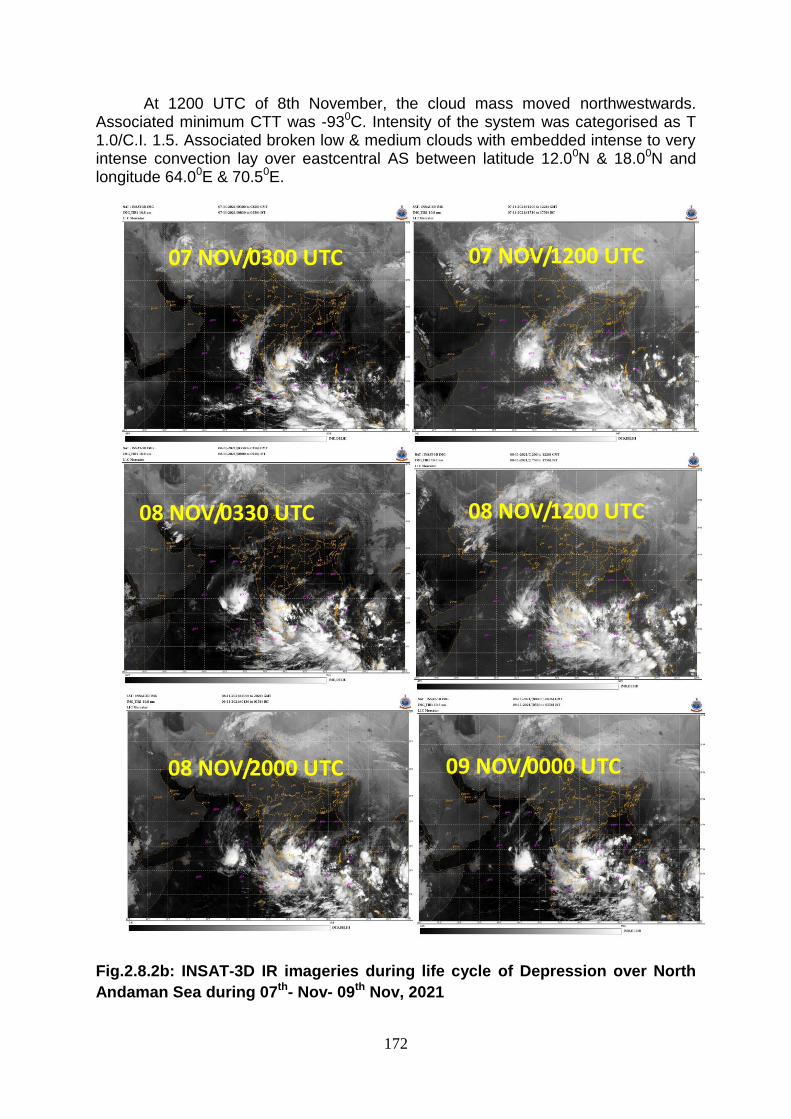
172
At 1200 UTC of 8th November, the cloud mass moved northwestwards. Associated minimum CTT was -930C. Intensity of the system was categorised as T 1.0/C.I. 1.5. Associated broken low & medium clouds with embedded intense to very intense convection lay over eastcentral AS between latitude 12.00N & 18.00N and longitude 64.00E & 70.50E.
Fig.2.8.2b: INSAT-3D IR imageries during life cycle of Depression over North
Andaman Sea during 07th- Nov- 09th Nov, 2021
07 NOV/0300 UTC
08 NOV/0330 UTC
08 NOV/2000 UTC
07 NOV/1200 UTC
08 NOV/1200 UTC
09 NOV/0000 UTC
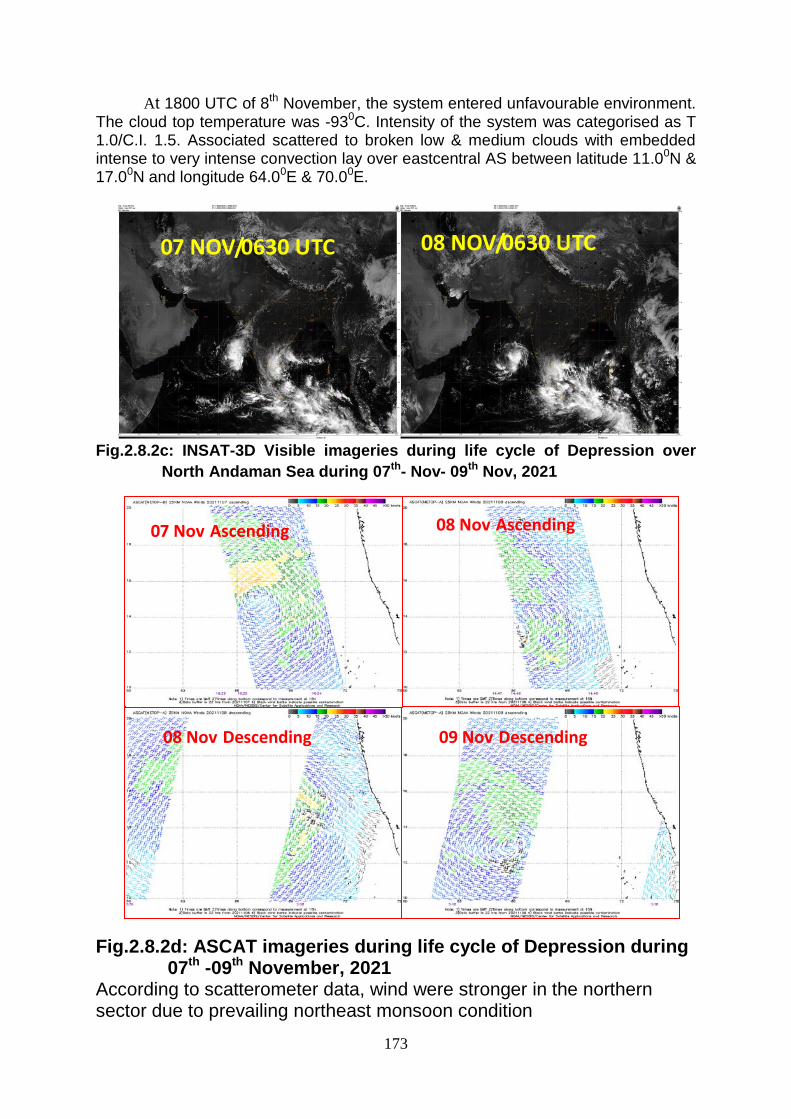
173
At 1800 UTC of 8th November, the system entered unfavourable environment. The cloud top temperature was -930C. Intensity of the system was categorised as T 1.0/C.I. 1.5. Associated scattered to broken low & medium clouds with embedded intense to very intense convection lay over eastcentral AS between latitude 11.00N & 17.00N and longitude 64.00E & 70.00E.
Fig.2.8.2c: INSAT-3D Visible imageries during life cycle of Depression over
North Andaman Sea during 07th- Nov- 09th Nov, 2021
Fig.2.8.2d: ASCAT imageries during life cycle of Depression during
07th -09th November, 2021 According to scatterometer data, wind were stronger in the northern sector due to prevailing northeast monsoon condition
07 NOV/0630 UTC
08 NOV/0630 UTC
08 Nov Descending 09 Nov Descending
08 Nov Ascending 07 Nov Ascending
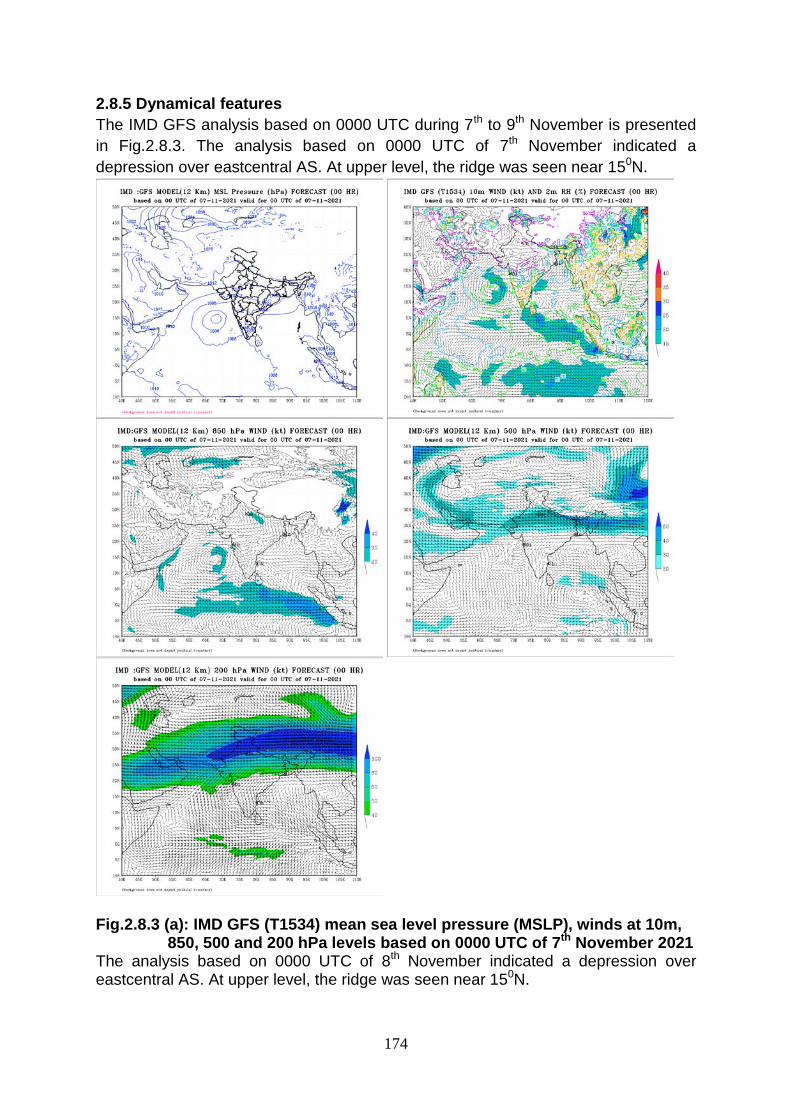
174
2.8.5 Dynamical features
The IMD GFS analysis based on 0000 UTC during 7th to 9th November is presented
in Fig.2.8.3. The analysis based on 0000 UTC of 7th November indicated a
depression over eastcentral AS. At upper level, the ridge was seen near 150N.
Fig.2.8.3 (a): IMD GFS (T1534) mean sea level pressure (MSLP), winds at 10m, 850, 500 and 200 hPa levels based on 0000 UTC of 7th November 2021
The analysis based on 0000 UTC of 8th November indicated a depression over eastcentral AS. At upper level, the ridge was seen near 150N.

175
Fig.2.8.3 (b): IMD GFS (T1534) mean sea level pressure (MSLP), winds at 10m, 850, 500 and 200 hPa levels based on 0000 UTC of 8th November 2021

176
The analysis based on 0000 UTC of 9th November indicated a depression over eastcentral AS and also southwestwards movement of the system. Weakening of the system was also picked by the model. At upper level, the ridge was seen near 150N.
Fig.2.8.3 (c): IMD GFS (T1534) mean sea level pressure (MSLP), winds at 10m, 850, 500 and 200 hPa levels based on 0000 UTC of 9th November 2021

177
2.8.6 Realized Weather: Rainfall associated with the depression over eastcentral AS based on IMD-NCMRWF GPM merged gauge rainfall data is depicted in Fig 2.8.4. It indicates higher rainfall activity in the northern sctor.
Fig.2.8.4: IMD-NCMRWF GPM merged gauge rainfall during 6th November - 12th
November and 7 days average rainfall (cm/day) 2.8.7 Realised Weather As the system was moving away from Indian coast, no adverse occurred over the west coast of India due to this system. 2.8.8 Damage due to the system
No damage was reported in association with this system.
___________

178
2.9 Depression over southwest Bay of Bengal (10th– 11th November, 2021)
2.9.1 Introduction
A low pressure area formed over the southeast Bay of Bengal (BoB) and
neighbourhood at 0300 UTC (0830 hrs IST) of 9th November, 2021.
It lay as a well marked low pressure area (WML) over southeast and adjoining
southwest BoB at 0000 UTC (0530 hrs IST) of 10th Nov.
It moved west-northwestwards and concentrated into a depression over
southwest BoB at 1200 UTC (1730 hrs IST) of 10th Nov.
Moving further northwestwards, it crossed north Tamil Nadu & adjoining south
Andhra Pradesh coasts close to Chennai, near latitude. 12.95°N and
longitude 80.25°E during 1200 to 1300 UTC (1730 to 1830 hrs IST) with a
maximum sustained wind speed of 45 – 55 kmph gusting to 65 kmph.
It weakened into a WML over north Tamilnadu & neighborhood at 0000 UTC
(0530 hrs IST) of 12th Nov.
The observed track of the system is presented in Fig.2.9.1. The best track
parameters of the system are presented in table 2.9.1.
Fig. 2.9.1: Observed track of depression over southwest BoB (10-12 November, 2021)
Table2.9.1: Best track positions and other parameters of the depression over southwest
Bay of Bengal during 10 Nov- 12 Nov, 2021
Date
Time
(UTC)
Centre
lat.0 N/
long. 0 E
C.I.
NO.
Estimated
Central
Pressure
(hPa)
Estimated
Maximum
Sustained
Surface
Wind (kt)
Estimated
Pressure
drop at the
Centre
(hPa)
Grade
10.11.2021 1200 10.6 83.4 1.5 998 25 4 D
1800 11.3 82.3 1.5 998 25 4 D

179
Knots: kt, 1 kt = 1.85 kmph
2.9.2 Salient features
It caused heavy to very rainfall at a few places with extremely heavy rainfall at
isolated places over Tamil Nadu, Puducherry and Karaikal on 11th and heavy to
very rainfall at a few places on 12th. It also caused heavy rainfall at a few places
over Rayalseema on 12th.
It had a total life period of 36 hours against the average life period (1990-2013)
of 48 hours of depression category in post-monsoon season over the BoB.
The system had track length of about 485 km
2.9.3 Genesis, Intensification and movement Under the influence of the cyclonic circulation over southeast Bay of Bengal &
neighbourhood, a low pressure area formed over the same region at 0300 UTC of 9th
November. At 0300 UTC of 9th, the sea surface temperature (SST) was about 29-
30°C over entire BoB. Tropical cyclone heat potential (TCHP) was about 100-120
KJ/cm2 over parts of eastern equatorial Indian Ocean and adjoining southeast BoB &
south Andaman Sea. In addition, a near equatorial convergence zone was present
roughly along 50N latitude over the region, providing the necessary cyclonic vorticity.
An elongated zone of positive low level convergence (10-40 x10-5s-1) lay over
equatorial Indian Ocean and adjoining southwest BoB. A large extended zone of
positive upper level divergence about 05-20 x10-5s-1 lay over the same region.
Positive low level vorticity was about (50 x10-6 s-1) to the southeast and also to the
southwest of system area with vertical extension upto 500 hpa level. Under these
favourable conditions a low pressure area formed over southeast BoB at 0300 UTC
of 9th November. Similar favourable conditions prevailed and the system lay as a
well marked low pressure area (WML) over southeast and adjoining southwest BoB
at 0000 UTC of 10th Nov.
At 1200 UTC of 10th Nov., the SST was about 29-30°C over southwest &
adjoining westcentral BOB. TCHP was about 80-100 KJ/cm2 over the system region.
Various environmental features including the low level vorticity, low level
convergence and upper level divergence further consolidated. Positive low level
vorticity was about (100 X10-6s-1) around system area andwais oriented
northwestwards with vertical extension upto 500 hPa level. Positive low level
convergence was around 30 x10-5 s -1 to the northwest of system centre. Positive
11.11.2021
0000 12.0 81.5 1.5 998 25 4 D
0300 12.3 81.2 1.5 998 25 4 D
0600 12.6 80.8 1.5 998 25 4 D
1200 12.9 80.3 1.5 998 25 4 D
Crossed north Tamil Nadu & adjoining south Andhra Pradesh coasts close to Chennai,
near Lat. 12.95°N and Long. 80.25°E during 1730 and 1830 hrs IST with a maximum
sustained wind speed of 45 – 55 kmph gusting to 65 kmph.
1800 13.1 79.8 1.5 1000 20 3 D
12.11.2021 0000
Depression weakened into a Well Marked Low pressure Area over north
Tamilnadu & neighborhood

180
upper level divergence was around 40 x10-5 s -1 to the northwest of system centre.
Warm moist air incursion was seen into the core of system as per total precipitable
water imagery. Wind shear was low to moderate (10-20 kts) over the system region
and high (>30 kt) near Tamilnadu-Andhra Pradesh coasts. The upper tropospheric
ridge lay along 19°N over BOB. The east-southeasterly winds prevailing in the upper
tropospheric level steered the system west-northwestwards.
At 0300 UTC of 11th Nov., similar sea conditions prevailed at the system
region. The positive low level vorticity was about (150 x10-6 s-1) around the system
centre and was oriented slightly to the west with vertical extension upto 500 hpa
level. Positive low level convergence was around 30 x10-5 s -1 to the northwest of
system centre. The positive upper level divergence increased and was around 40
x10-5 s-1 to the east of system centre. Warm moist air incursion was seen into the
core of system as per total precipitable water imagery. Wind shear was low to
moderate (15-20 kts) over the system region and high (>25 kt) near Tamilnadu &
Andhra Pradesh coasts. This high vertical wind shear near the coast was expected
to off-set other favourable environmental conditions thereby depleting the chances of
further intensification of the system. The upper tropospheric ridge lay along 17°N
over BoB. east-southeasterly winds prevailing in the southern periphery of upper
tropospheric level steered the system west-northwestwards. Under these conditions,
the system maintained the intensity of depression, moved west-northwestwards and
crossed north Tamil Nadu and adjoining south Andhra Pradesh coasts close to
Chennai, near 12.95°N/80.25°E during 1200 and 1300 UTC (1730 and 1830 hrs IST)
with a maximum sustained wind speed of 45 – 55 kmph gusting to 65 kmph.
Thereafter, due to land interactions and increased vertical wind shear, the
system weakened into a WML over north Tamil Nadu and neighborhood at 0000
UTC of 12th November, 2021.
2.9.4 Monitoring of depression over southwest BoB
India Meteorological Department (IMD) maintained round the clock watch over
the north Indian Ocean and the system was monitored since 4th November (5 days
prior to formation of LPA over southeast BoB on 9th November and 6 days prior to
formation of depression over southwest BoB on 10th November). First information
about formation of depression over southwest during 10th-12th November was
indicated in the extended range outlook issued by IMD on 4th November.
The cyclone was monitored with the help of available satellite observations from
INSAT 3D and 3DR and various polar orbiting satellites. Various numerical weather
prediction models developed by Ministry of Earth Sciences (MoES) institutions and
dynamical-statistical models were utilized to predict the genesis, track, landfall and
intensity of the cyclone. A digitized forecasting system of IMD was utilized for
analysis and comparison of various models guidance, decision making process and
warning product generation.
The features observed through satellite are discussed below:
At 1200UTC of 10th Nov, intensity of the system was characterized as T 1.5. The
clouds associated with the system were organised in shear pattern with convective

181
clouds sheared to the northwest of system centre. The centre of the system was
clearly seen in F-18 microwave pass imagery at 1056 UTC. Scattered to broken low
& medium clouds with embedded intense to very intense convection lay over
southwest & adjoining westcentral BOB between latitude 9.5N & 17.5N, longitude
80.0E & 89.0E. Minimum cloud top temperature was minus 930C.
At 0300 UTC of 11th Nov., similar features continued. The cloud mass moved
further northwards. Broken low & medium clouds with embedded intense to very
intense convection lay over southwest & adjoining westcentral BoB between latitude
11.5N & 18.0N and longitude 80.0E & 89.0E, over north Tamil Nadu, coastal Andhra
Pradesh and neighbourhood. Minimum cloud top temperature is minus 930C.
At 0000 UTC 12th, weak convective clouds lay over north Tamilnadu and
neighbouhood. Typical INSAT 3D based cloud imageries are presented in Fig. 2.9.2
a-d and ASCAT imageries are presented in Fig. 2.9.3.
Fig. 2.9.2 a. INSAT-3D IR imageries during 10-11 November, 2021

182
Fig. 2.9.2 b.INSAT-3D IR NHC imageries during 10-11 November, 2021
Fig. 2.9.2c.INSAT-3D IR1 TEMP imageries during 10-11 November, 2021

183
Fig. 2.9.2d.INSAT-3D Vis imageries during life cycle of Depression (10-11 November, 2021)
Fig. 2.9.3: ASCAT imageries during 10-11 November, 2021 Typical maximum reflectivity imageries from Doppler Weather Radar, Chenani are presented in Fig. 2.9.4.

184
Fig. 2.9.4: Typical Max Z Radar imageries of DWR Chennai during 10-11 November, 2021 The total precipitable imagery during 10th-11th November indicating warm moist to the northeast of system centre are presented in Fig. 2.9.5.
Fig. 2.9.5. Total Precipitable Water Imagery during 10-11 November, 2021 2.9.5 Dynamical features

185
IMD GFS analysis fields of mean sea level pressure (MSLP), 10m wind, winds
at 850, 500 & 200 hPa levels are presented in Fig. 2.9.6. The 10m wind analysis
based on 0000 UTC of 10th November indicated a well marked low pressure area
over southwest BoB with vertical extension upto 500 hPa level. At upper level, the
ridge was seen near 160N. East-southeasterly winds were prevailing over the
system area indicating west-northwestwards movement of the system. At 0000 UTC
of 10th IMD GFS correctly picked intensity, location and movement of the system.
Fig. 2.9.6 (a) IMD GFS (T1534) mean sea level pressure (MSLP), winds at 10m, 850,
500 and 200 hPa levels based on 0000 UTC of 11th November 2021

186
The 10m wind analysis based on 0000 UTC of 11th
November indicated a deep
depression over southwest BoB with vertical extension upto 500 hPa level. At upper level,
the ridge was seen near 160N. East-southeasterly winds were prevailing over the system area
indicating west-northwestwards movement of the system. Though broad scale features were
correctly picked, but at 0000 UTC of 11th
IMD GFS slightly over-estimated the intensity of
the system.
Fig. 2.9.6 (b): IMD GFS (T1534) mean sea level pressure (MSLP), winds at 10m, 850,
500 and 200 hPa levels based on 0000 UTC of 11th
November 2021
Thus, overall IMD GFS correctly picked genesis, location and movement and of the
system.
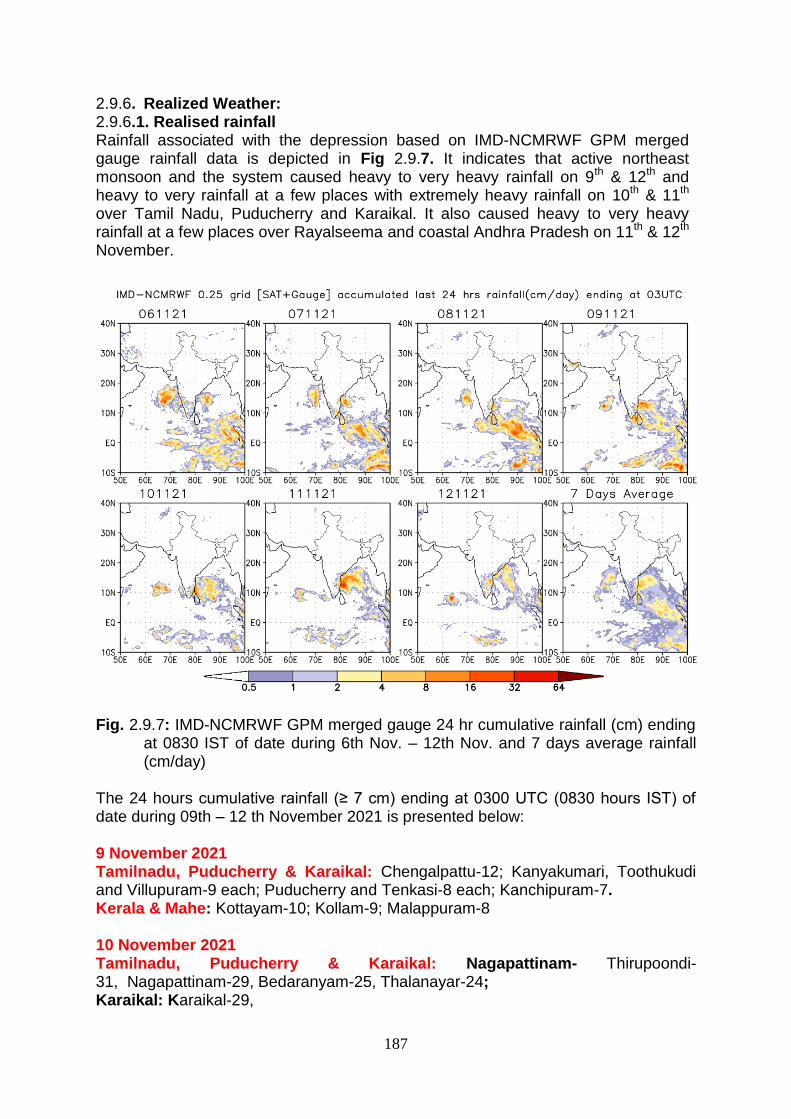
187
2.9.6. Realized Weather: 2.9.6.1. Realised rainfall Rainfall associated with the depression based on IMD-NCMRWF GPM merged gauge rainfall data is depicted in Fig 2.9.7. It indicates that active northeast monsoon and the system caused heavy to very heavy rainfall on 9th & 12th and heavy to very rainfall at a few places with extremely heavy rainfall on 10th & 11th over Tamil Nadu, Puducherry and Karaikal. It also caused heavy to very heavy rainfall at a few places over Rayalseema and coastal Andhra Pradesh on 11th & 12th November.
Fig. 2.9.7: IMD-NCMRWF GPM merged gauge 24 hr cumulative rainfall (cm) ending
at 0830 IST of date during 6th Nov. – 12th Nov. and 7 days average rainfall (cm/day)
The 24 hours cumulative rainfall (≥ 7 cm) ending at 0300 UTC (0830 hours IST) of date during 09th – 12 th November 2021 is presented below:
9 November 2021 Tamilnadu, Puducherry & Karaikal: Chengalpattu-12; Kanyakumari, Toothukudi and Villupuram-9 each; Puducherry and Tenkasi-8 each; Kanchipuram-7. Kerala & Mahe: Kottayam-10; Kollam-9; Malappuram-8 10 November 2021 Tamilnadu, Puducherry & Karaikal: Nagapattinam- Thirupoondi-31, Nagapattinam-29, Bedaranyam-25, Thalanayar-24; Karaikal: Karaikal-29,

188
Tiruvarur- Thiruthuraipoondi-22, Mannargudi-14, Nannilam, Muthupettai-13 each, Valangaiman-12, Pandavaiyaru, Needamangalam, Kudavasal, Vettikadu, Lower Anaicut-11 each, Thanjavur- Peravurani-20, Echanviduthi-17, Thanjavur-16, Madukkur-15 each, Adiramapatnam-13, Manjalaru, Kumbakonam, Ayyampettai-12, Vallam-10, Budalur, Tiruvaiyaru -9 each, Mayiladuthuirai-16. Pudukkotai: Karambakudi-18, Manamelkudi, Avudayarkoil-10 each, Mimisal-8; Mayiladuthurai: Tarangambadi-16, Mayiladuthurai-14, Sirkali-13, Manalmedu-12,Kollidam-11; Puducherry: M.o Pondicherry-9, Namakkal: Rasipuram-8, Ariyalur: Jayamkondam-10. 11 November 2021 Tamilnadu, Puducherry & Karaikal: Chengalpattu: Tambaram-23, Mahabalipuram-17, Kelabakkam, Satyabama & Thirupporur-12 each, Thirukalukundram-11, Chengalpattu-10, Maduranthagam-9; Tiruvallur: Cholavaram-22, Ennore-21, Gummidipoonai & Red Hills-18 each, Ambathur & Thomaraipakkam-15 each, Chembarabakkam-14, Ponneri-13, Poonamallee-12, Tiruvallur & Uthukottai-10 each, Koratur & Pondi-9 each; Chennai: Peerambur-17, Nungambakkam-16, MGR Nagar-15, Meenambakkam, Taramani, Anna University & Chennai-14 each; Kancheepuram: Kattukuppam-11, Sriperumbudur-10; Villupuram: Marakkanam-10, Coastal Andhra Pradesh: Nellore: Sullurpeta-18, Tada-14, Rayalseema: Chittoor: Satyavedu-11, Tirupati-8, Puttur-7, Kerala & Mahe: Kollam:Aryankavu-18, 12 November 2021 Rayalseema: YSR: Kodur-17; Rajampet-13; Pullampeta-11; Royachoti and Penagaluru-10 each;, Sambepalle-9 each; Utukuru, Cuddapah-8 each; Vempalle, Chinnamandem, Atlur, Kadiri-7 each; Chittoor: Puttur, Nagari-12 each; Satyavedu, Kalakada, Tirupathi-9 each; Thottambedu, Pakala-8 each; Srikalahasthi-7; Tamilnadu, Puducherry & Karaikal: Kanyakumari: Suralacode-15; Perunchani Dam-13; Boothapandy-11; Mylaudi-10; Kottaram and Nagarcoil-7; Tiruvallur: Tiruttani-12; Pallipattu-11; Cholavaram-10; Gummidipoondi-9; Uthukottai-8; Ranipet: Wallajah-11; Arakonam and Kalavai-7; Tiruvannamalai: Vembakkam-8; Chennai: DGP Office-8; MGR Nagar-7; Kanchipuram-7; Salem: Yercaud-7; Vellore: Katpadi-7; Kerala: Idukki-14; Thodupuzha, Thiruvananthapuram-11 each; Ernakulam-7; Coastal Andhra Pradesh: Nellore: Tada-11; Kavali-10; Atmapur-8; Vinjamur, Rapur, Kandukur, Venkatgiri-7 each.
2.9.6.2. Realised Wind
Realised estimated maximum sustained surface wind was 45-55 kmph gusting to 65 kmph prevailed over north coastal Tamil Nadu close to Chennai at the time of landfall.
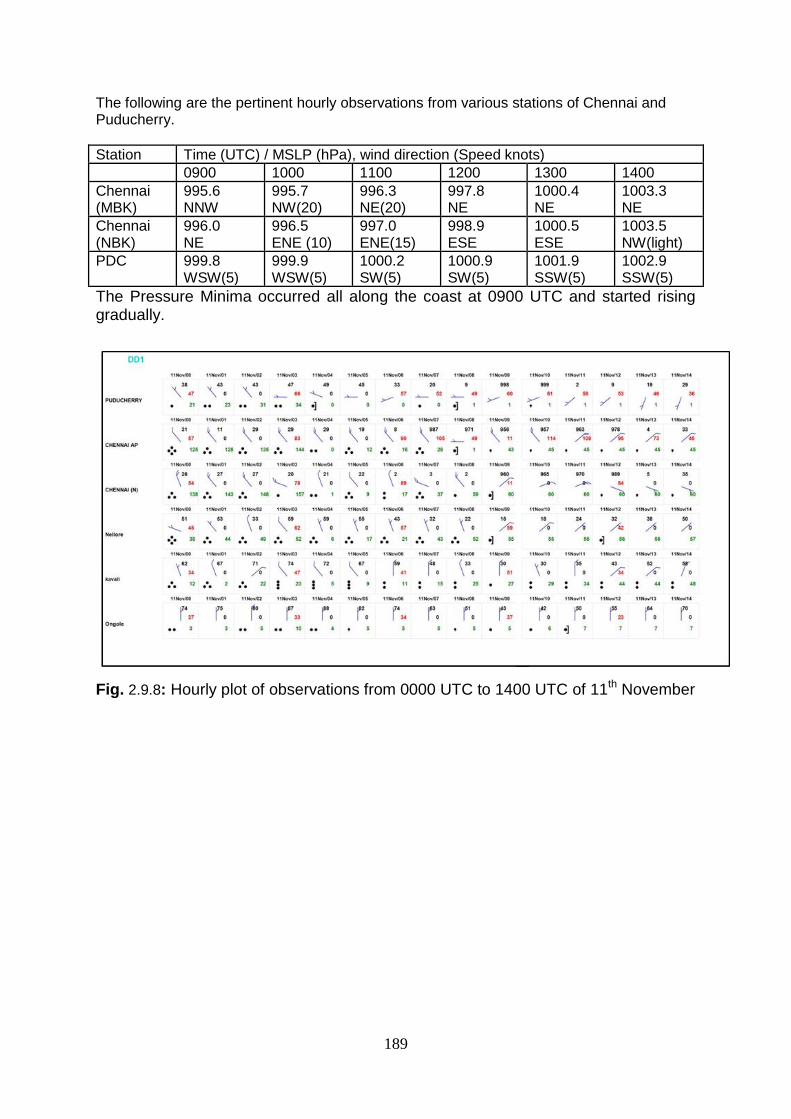
189
The following are the pertinent hourly observations from various stations of Chennai and Puducherry.
Station Time (UTC) / MSLP (hPa), wind direction (Speed knots)
0900 1000 1100 1200 1300 1400
Chennai (MBK)
995.6 NNW
995.7 NW(20)
996.3 NE(20)
997.8 NE
1000.4 NE
1003.3 NE
Chennai (NBK)
996.0 NE
996.5 ENE (10)
997.0 ENE(15)
998.9 ESE
1000.5 ESE
1003.5 NW(light)
PDC 999.8 WSW(5)
999.9 WSW(5)
1000.2 SW(5)
1000.9 SW(5)
1001.9 SSW(5)
1002.9 SSW(5)
The Pressure Minima occurred all along the coast at 0900 UTC and started rising gradually.
Fig. 2.9.8: Hourly plot of observations from 0000 UTC to 1400 UTC of 11th November

190
2.10 Depression over Bay of Bengal (18th – 19th November, 2021) 2.10.1 Introduction
A Low Pressure Area (LPA) formed over south Andaman Sea & adjoining Thailand coast during the noon (0830 hrs IST/0300 UTC) of 13th November.
It persisted as a low pressure area over south Bay of Bengal(BoB) for around 4 days.
It moved westwards and lay as a well marked low pressure area (WML) over southwest & adjoining westcentral BoB off north Tamil Nadu and South Andhra Pradesh coasts in the morning (0530 hrs IST/0000 UTC) of 18th Nov.
Under favourable environmental conditions, it concentrated into a depression over southwest BoB off North Tamil Nadu coast in the forenoon (0830 hrs IST/0300 UTC) of 18th Nov.
It moved west-northwestwards and crossed north Tamil Nadu coast between Puducherry and Chennai near latitude 12.45°N and longitude 80.1°E during early hours of 19th Nov (0300-0400 hours IST of 19th / 2130-2230 UTC of 18th).
It weakened into a well marked low pressure area over interior Tamil Nadu on 19th early morning (0530 hrs IST/0000 UTC) and gradually became less marked over same region on 20th November.
The observed track of the system during 18th – 19th November is presented in
Fig. 2.10.1. Best Track parameters associated with the system are presented
in Table 2.10.1.
2.10.2. Salient features:
The system developed during active phase of northeast monsoon season.
It had a brief life period of about 27 hours against the average life period
(1990-2013) of 48 hours of depression category in post-monsoon season over
the BoB.
It caused heavy to very heavy rainfall at few places with extremely heavy rainfall at isolated places over Tamil Nadu, Puducherry & Karaikal and Rayalseema on 18th November
Fig. 2.10.1: Observed track of depression over the Bay of Bengal during 18-19th
November 2021

191
Table 2.10.1: Best track positions and other parameters of the Depression over southwest Bay of Bengal during during 18-19th November 2021
2.10.3 Brief life history
2.10.3.1 Genesis, Intensification and movement
Under the influence of a cyclonic circulation over Gulf of Thailand and neighbourhood, an LPA formed over south Andaman Sea & adjoining Thailand coast at 0300 UTC of 13th November. It persisted as a low pressure area over south BoB for around 4 days.
Under favourable environmental conditions, it concentrated into a WML over southwest BoB at 0000 UTC of 18th and into a depression over southwest BoB off North Tamil Nadu coast at 0300 UTC of 18th Nov. At 0300 UTC of 18th November, the sea surface temperature (SST) was about 29-31°C over southwest BoB. Tropical cyclone heat potential (TCHP) was about 80-100 KJ/cm2 over southwest BoB. Madden Julian Oscillation Index was in phase 4 with amplitude close to 1. It was likely to continue in same phase during next 5 days. The positive low level vorticity increased in previous 24 hours and was around (100 x10-6 s-1) over southwest BoB to the south of system centre with vertical extension upto 500 hpa level. Positive low level convergence also increased and was about 30 x10-5 s-1 to the northwest of system centre. Positive upper level divergence also increased significantly and was around 30x10-5 s-1 to the northwest of system centre. Vertical wind shear was low (10-15 kts) over system area and upto north Tamilnadu & adjoining south Andhra Pradesh coasts. The latest total precipitable water vapour imagery at that time indicated moist warm air inflow into the core of system. The upper tropospheric ridge lay near 19.50N. Under these favourable conditions, the low pressure area over central parts of south BoB moved west-northwestwards and intensified into a well marked low pressure area over southwest BoB at 0000 UTC and into a depression at 0300 UTC of 18th November.
The system was steered west-northwestwards by the east-southeasterly winds in the southern periphery of the upper tropospheric ridge. However, the land
Date
Time
(UTC)
Centre lat.0
N/ long. 0 E
C.I.
NO.
Estimated
Central
Pressure
(hPa)
Estimated
Maximum
Sustained
Surface
Wind (kt)
Estimated
Pressure
drop at the
Centre
(hPa)
Grade
18.112021
0300 11.0 82.3 1.5 1000 25 4 D
0600 11.2 81.7 1.5 1000 25 4 D
1200 11.8 80.9 1.5 1000 25 4 D
1800 12.2 80.5 1.5 1000 25 4 D
19.11.2021
Crossed north Tamilnadu coast between Puducherry & Chennai near Lat. 12.45°N and Long., 80.1°E during 0300-0400 hour IST of 19th November, 2021
0000 12.5 80.0 1.5 1000 25 4 D
0300 12.7 79.7 1.5 1002 20 3 D
0600 Depression weakened into a Well Marked Low pressure Area over north Tamilnadu & neighborhood.

192
interactions inhibited further intensification of the system. Under these conditions, the depression over southwest BoB moved further west-northwestwards and maintained it’s intensity.
At 1200 UTC of 18th November, similar sea and MJO conditions prevailed. The positive low level vorticity was around 100 x10-6 s-1 over southwest BoB to the south of system centre with vertical extension upto 500 hpa level. Positive low level convergence reduced slightly and was about 20 x10-5 s-1 to the west of system centre. Positive upper level divergence also reduced and was around 05-10 x 10-5 s-1 to the northwest of system centre. Vertical wind shear was low (15-20 kts) over system area and along forecast track. The upper tropospheric ridge lay near 19.50N. The system was continuously steered west-northwestwards by the east-southeasterly winds prevailing in the southern periphery of the upper tropospheric ridge.
At 1800 UTC of 18th November, similar sea and MJO conditions prevailed. The positive low level vorticity was around 100 x10-6 s-1 over southwest BoB to the south of system centre with vertical extension upto 500 hpa level. Positive low level convergence was about 20 x10-5 s-1 to the west of system centre. Positive upper level divergence was around 15-20 x 10-5 s-1 to the northwest of system centre. Vertical wind shear was low to moderate (15-20 kts) over system area and along forecast track. The upper tropospheric ridge lay near 19.50N. The system moved northwestwards by the east-southeasterly winds prevailing in the southern periphery of the upper tropospheric ridge and crossed north Tamilnadu coast between Puducherry & Chennai near 12.45°N/80.1°E during 0300-0400 hours IST of 19th (2130-2230 UTC of 18th). At 0300 UTC of 19th November, positive low level vorticity was about 100x10-6 s-1 over Tamilnadu to the south of system centre. Positive low level convergence was about 10 x10-5 s-1 to the northeast of system centre. Positive upper level divergence was 20 x10-5 s-1 to the northwest of system centre. Wind shear was low (05-10 kt) over system area and increased gradually becoming 15 kt to it’s northwest, along the forecast track. Upper tropospheric ridge ran along 180N. Under these conditions, the system moved west-northwestwards and weakened marginally.
Similar unfavourable trends in the environmental features continued and because of land interactions, the system weakened into a WML over interior Tamil Nadu on at 0600 UTC of 19th and gradually became less marked over the same region on 20th November morning.
2.10.4. Monitoring of depression over southwest Bay of Bengal
India Meteorological Department (IMD) maintained round the clock watch over the north Indian Ocean and the system was monitored since 10th November (3 days prior to formation of LPA over south Andaman Sea and adjoining Thailand on 13th November and 8 days prior to formation of depression over southwest BoB on 18th November).
The depression was monitored with the help of available satellite observations from INSAT 3D & 3DR and polar orbiting satellites. Various numerical weather prediction models developed by Ministry of Earth Sciences (MoES) institutions and dynamical-statistical models were utilized to predict the genesis, track, landfall and intensity of the system. A digitized forecasting system of IMD was utilized for analysis and comparison of various model guidance, decision making process and warning product generation.

193
2.10.4. 1. Features observed through satellite
Satellite monitoring of the system was mainly done by using half hourly
INSAT-3D and 3DR imageries. Satellite imageries of international geostationary
satellites Meteosat-8, high resolution polar orbiting satellites and scatterometer
imageries from ASCAT were also considered for monitoring the system. Typical
INSAT-3D visible/ IR imageries, enhanced colored imageries and ASCAT(Met-Op A)
imageries are presented in Fig. 2.10.2. As per INSAT-3D at 0300 UTC of 18th
November, the intensity of the system was characterised as T 1.5. The cloud mass
over southwest BoB and neighbourhood further organised. Intense convective cloud
mass was sheared to the west of system centre. The western part of the convective
cloud mass entered northeast Tamilnadu & a secondary cloud band was observed
over Andhra Pradesh. Broken low and medium clouds with embedded intense to
very intense convection lay over southwest and adjoining westcentral BoB between
bet latitude 9.0N & 13.5N and west of longitude 82.5E, over Tamilnadu & adjoining
south Andhra Pradesh & Palk Strait. Minimum cloud top temperature (CTT) was
minus 930C.
Fig.2.10.2a: INSAT-3D IR imageries during life cycle of Depression during 18th-19th Nov, 2021
18 NOV/0300 UTC
18 NOV /1800 UTC
18 NOV /1200 UTC
19 NOV /0300 UTC
19 NOV /0600 UTC
19 NOV /1200 UTC

194
Fig. 2.10.2 b: INSAT-3D VIS imageries during 18-19 Nov, 2021
Fig. 2.10.2c: INSAT-3D BD curve imageries during 18-19 November, 2021
18 NOV /0600 UTC 19 NOV /0600 UTC
18 NOV/0600 UTC
18 NOV /1800 UTC
18 NOV /1200 UTC
19 NOV /0600 UTC
19 NOV /1200 UTC 19 NOV /1800 UTC

195
Fig.2.10.2d: INSAT-3D enhanced colored imageries during 18-19 November,
2021
At 1200 UTC of 18th November, the intensity of the system was characterised
as T 1.5. The clouds were organised in shear pattern. Intense convective cloud mass
was sheared to the west of system centre. Due to land interaction the convective
cloud mass over Tamilnadu got disorganised. The cloud mass was spread across
north Tamilnadu, south Andhra Pradesh and south interior Karnataka. Broken low
and medium clouds with embedded intense to very intense convection lay over
southwest and adjoining westcentral BoB between bet latitude 11.0N & 15.0N and
west of longitude 80.5E and also over Tamilnadu & adjoining south Andhra Pradesh
& south interior Karnataka. Minimum CTT was minus 930C. Microwave imagery at
1055 UT of 18th indicated exposed low level circulation to the east of the cloud mass.
18 NOV/0600 UTC
18 NOV /1800 UTC
18 NOV /1200 UTC
19 NOV /0600 UTC
19 NOV /1200 UTC
19 NOV /1800 UTC

196
The system moved northwestwards and was over land during 2130-2230 UTC
of 18th. Thereafter, due to land interactions the system started disorganizing.
At 0300 UTC of 19th November, broken low and medium clouds with
embedded moderate to intense convection lay over northwest Tamilnadu,
Rayalseema, adjoining south coastal Andhra Pradesh and south interior Karnataka.
Minimum CTT was minus 700C.
Fig. 2.10.2e: ASCAT imageries on 18th -19th November 2021
2.10.5. Dynamical features
IMD GFS analysis fields of mean sea level pressure (MSLP), 10m wind, winds
at 850, 500 & 200 hPa levels at 0000 UTC of 18th and 19th November are presented
in Fig. 2.10.3 (a-b). The analysis fields based on 0000 UTC of 18th November
indicated a depression over southwest BoB with vertical extension upto 500 hPa
level. At upper level, the ridge was captured near 190N (Fig. 2.10.3a).
18 Nov Ascending 19 Nov Descending

197
Fig. 2.10.3 (a): IMD GFS (T1534) mean sea level pressure (MSLP), winds at 10m, 850, 500 and 200 hPa levels based on 0000 UTC of 18th November 2021

198
The analysis fields based on 0000 UTC of 19th November indicated that the
depression was centred over north Tamil Nadu and adjoining south Andhra Pradesh
coasts close to Chennai. At upper level, the ridge was captured near 190N (Fig.
2.10.3b).
Fig. 2.10.3 (b): IMD GFS (T1534) mean sea level pressure (MSLP), winds at
10m, 850, 500 and 200 hPa levels based on 0000 UTC of 19th November 2021

199
Thus, IMD GFS could capture the broad scale features, location, intensity and
movement of system correctly throughout the life period of the system.
2.10.6. Realized Weather: 2.10.6.1. Realised rainfall Rainfall associated with the depression over BoB based on IMD-NCMRWF GPM merged gauge rainfall data is depicted in Fig 2.10.4. It indicates heavy to very heavy rainfall at a few places over north Tamil Nadu & south Andhra Pradesh and at isolated places over Rayalseema and north interior Karnataka on 18th November. On 19th, heavy to very heavy rainfall at a few places over north interior Tamil Nadu, south Andhra Pradesh, Rayalseema and north interior Karnataka with extremely heavy rainfall at isolated places over north interior Tamil Nadu and Rayalseema.
Fig.2.10.4: IMD-NCMRWF GPM merged gauge rainfall plots during 16th -22nd
November 2021
Realized 24 hrs accumulated rainfall (≥7cm) ending at 0830 hrs IST of date during the life cycle of the system is presented below:
Rainfall Dated 18.11.2021
Tamilnadu: Tiruppur district: Dharmapuram-13, Palladam-8, Tiruppur, Avinasi-7
each, Thanjavur district: Thanjavur-12, Ayyampettai-10, Budalur-8, Thanjai
Papanasam, Tiruvaiyaru-7 each, Tenkasi district: Sankarankoil-11, Perambalur
district: Chettikulam-11, Coimbatore district: Sulur-10, Valparai-8, Chinnakalur-7,
Dindigul: Odanchatram-9, Palani-7; Erode district Bhavanisagar-9; Tiruvarur
district: Needamangalam, Valangaiman-9 each; Tirunelveli district: Palayamkottai-

200
9, Ambasamudram-7, Toothukudi district: Srivaikuntam, Surangudi, Kayathar-9
each, Kayalpattinam-8, Virudhunagar district: Sattur-8, Virudhunagar-7, Nilgiris
district: Avalanche-8; Cuddalore district: Tozhudur-7;
Rayalaseema: YSR District: Atlur-10, Penagaluru-9, Rajampet, Cuddapah Vallur,
Utukuru-7 each, Chittoor district: Tirupati-9, Srikalahasti, Thottambedu-7 each,
Theni: gudalur, Veerapandi-7 each;
Coastal Andhra Pradesh: Nellore district: Atmakur-8, Vinjamur-7;
North Interior Karnataka: Haveri district: Hirekerur-10.
Rainfall Dated 19.11.2021
Tamilnadu, Puducherry & Karaikal: Puducherry district -Puducherry-19,
Dharmapuri district: Dharmapuri-18, Harur and Palacode-12, Kanchipuram
district -Uthiramerur-14, Cuddalore district -Cuddalore-14, Krishnagiri district -
Uthangiri-14, Penikondapuram- 11, Barur-10, Chengalpattu district -Cheyyur-10,
Ranipet district -Wallajah-12, Tirupattur district -Alangayam-13;
Rayalaseema: Anantapuramu district -Nambulipulikunta-24, YSR district -
Sambalpur, Royachoti and Vemapalle-18 each, Pulivendla-17, Lakkireddipalle-16;
Coastal Andhra Pradesh & Yanam: Prakasham district -Kandukur-11, Nellore
district -Venkatagiri-10, Sullupreta-8, Udaigiri, Vinjamur, Rapur and Atmakun-7
each; East Godavari district -Amlapuram-9, Krishna district -Avanigada-7;
South Interior Karnataka: Bengaluru district: Hoskte-10, Electronic City-12;
Chikaballapura district: Chintamani-12; Kolar district: Bangapet-18, Malur-17,
Kolar PWD-15; Tumkuru district: Gubbi-15.
2.10.6.2. Realised Wind
Realised estimated maximum sustained surface wind was 40-50 kmph gusting to 60 kmph over north Tamil Nadu in the early hours of 19th November at the time of landfall.
2.10.7. Damage due to the system
As per media reports, 9 persons including four kids, died in house collapse in
Vellore’s Pernambut (Source: Indian Express dated 19th November)
__

201
2.11 Cyclonic Storm JAWAD (pronounced as JOWAD) over Bay of Bengal
2.11.1 Life History:
A Low Pressure Area formed over South Thailand & neighbourhood in the forenoon
(0830 hours IST/0300 UTC) of 30th November.
It emerged into central parts of Andaman Sea in the same evening (1730 hrs
IST/1200 UTC) and lay as a well marked low pressure area over southeast Bay of
Bengal (BoB) & adjoining Andaman Sea in the morning (0530 hrs IST/0000 UTC) of
2nd December.
Under favourable environmental conditions, it concentrated into a depression over
southeast Bay of Bengal in the same evening (1730 hours IST/1200 UTC).
Moving north-northwestwards, it concentrated into a deep depression over
westcentral & adjoining south BoB in the morning (0530 hours IST/0000 UTC) and
into the Cyclonic Storm “JAWAD” (pronounced as JOWAD) over westcentral BoB in
the forenoon (1130 hours IST/0600 UTC) of 3rd December.
It moved north-northeastwards till morning (0530 hours IST/0000 UTC) of 4th
December. Thereafter, the system started recurving along the western periphery of
the anticyclone over Myanmar region. It moved northwards till evening (1730 hours
IST/ 1200 UTC) of 4th and weakened into a deep depression over westcentral BoB at
1730 hours IST of 4th December.
Thereafter, it moved north-northeastwards and reached very close to Odisha coast,
about 50 km southeast of Puri in the afternoon (1430 hours IST/0900 UTC) of 5th
December and 30 km southeast of Paradip in the evening (1730 hours IST/1200
UTC) of 5th December as a depression.
Thereafter, it moved northeastwards and weakened into a well marked low pressure
area over northwest BoB and adjoining West Bengal & Bangladesh coasts in the
morning (0530 hours IST/0000 UTC) and into a low pressure area over the same
region in the forenoon (0830 hours IST/0300 UTC) of 6th December, 2021.
The observed track of the system is presented in Fig.2.11.1(a) and the best track
parameters are presented in Table 2.11.1.
2.11.2 Salient features:
JAWAD was the 5th cyclone over the north Indian Ocean (NIO) during the year 2021
and 1st cyclone during the post monsoon season (October-December).
The tracks of cyclonic disturbances over the NIO in the month of December during
the period 1891-2020 are presented in Fig.2.11.2. The figure shows that no cyclone
crossed Odisha in the month of December in recorded history. There had been
landfall over north Andhra Pradesh and West Bengal. Even if there was no landfall,
there had been impact of cyclones over Odisha during past years in terms of heavy
rainfall. Maximum genesis took place over south BoB & south Andaman Sea. Once
the system crossed 150 N over BoB, it changed it’s path and recurved north-
northeastwards. The same has been observed with cyclone Jawad.
JAWAD had a recurving track. It moved north-northwestwards initially and started
recurving from 4th morning (0530 hours IST/0000 UTC).
It had a track length of about 940 km.

202
The peak maximum sustained wind speed (MSW) of the cyclone was 70-80 kmph
(40 knots) gusting to 90 kmph during 3rd/1200 UTC to 4th/0000 UTC. Dhamra Port
reported south-southeasterly winds of intensity 32 knots gusting to 35 knots at
4th/0600 UTC. Thereafter, the system started weakening under unfavourable
conditions (enhanced wind shear, dry air incursion into the core of system, lower
ocean thermal energy, land interactions and unfavourable Madden Julian Oscillation
index).
The lowest estimated central pressure (ECP) was 1000 hPa during the period with a
pressure drop of about 8 hPa at the centre as compared to the surroundings (Fig.2a).
The life period (D to D) of the system was 84 hours (3 days & 12 hours) against long
period average (LPA) (1990-2013) of about 88 hours (3 days & 16 hrs) for CS
category over the BoB during post-monsoon season.
It moved with a 12-hour average translational speed of 14.6 kmph against LPA
(1990-2013) of 12.9 kmph for CS category over BoB during post-monsoon season
(Fig.2 b).
The Velocity Flux, Accumulated Cyclone Energy (a measure of damage potential)
and Power Dissipation Index (a measure of loss) were 4.4 X10² knots, 1.4 X 10⁴
knots2 and 0.48 X10⁶ knots3 respectively.
The operational track forecast errors for 24, 48 and 60 hrs lead period were 79, 82
and 78 km respectively against the long period average (LPA) track forecast errors of
77, 117 and 137 km during last five years (2016-20) respectively.
The operational absolute error (AE) of intensity (wind) forecast for 24, 48 and 60 hrs
lead period were 6.7, 13.3 and 11.7 knots against the LPA of 7.9, 11.4 and 12.7
knots respectively.
While recurving north-northeastwards, the cyclone came very close to Odisha caost.
It was about 90 km east-southeast of Gopalpur at 0830 hrs IST, 70 km south-
southeast of Puri at 1130 hrs IST, 50 km southeast of Puri at 1430 hrs IST, 30 km
southeast of Paradip at 1730 hrs IST and 65 km east-southeast of Chandbali & 140
km south-southwest of Digha (West Bengal) at 2330 hrs IST of 5th December.
As the cyclone moved very close to Odisha coast on 5th December, it caused heavy
to extremely heavy rainfall activity affecting Odisha coast on 5th and 6th December
and Gangetic West Bengal coast on 6th December. Very heavy rainfall (maximum 9
cm) was reported in Ganjam district on 5th December and extremely heavy rainfall
(maximum 23 cm) was reported in Jagatsinghpur district of Odisha on 6th December.
Very heavy rainfall (maximum 18 cm) was reported in Hooghly district of Gangetic
West Bengal on 6th December.
It also caused strong winds over Odisha coast. Meteorological Office at Puri reported
MSW of 18 knots during 1030-1130 hrs IST (0500 to 0600 UTC) of 5th December,
high wind speed recorder at Paradeep reported MSW of 26 knots at 1530 hrs IST
(0995 UTC) of 5th December. Dhamra Port reported south-southeasterly winds of
intensity 32 knots gusting to 35 knots at 4th/0600 UTC (1130 IST).
A total of 23 national bulletins, 3 Special Messages, 28 RSMC bulletins to
WMO/ESCAP Panel member countries, 4 Press Releases, 7 bulletins for
International Civil Aviation, 72 lakhs SMS to fishermen, farmers & coastal population,
frequent updates on social networking sites were sent to trigger mass response and
sensitize masses about the impending disaster in association with the system.
Director General of Meteorology gave a presentation on the status of cyclone
JAWAD during the two National Crisis Management Committee Meetings chaired by

203
Cabinet Secretary and special review meetings chaired by Hon’ble Prime Minister of
India and Hon’ble Minister for Railways on 2nd December. A joint press conference
was addressed by DGM IMD and DG NDRF on 3rd December to sensitize masses
Fig.2.11.1: (a) Observed track of cyclonic storm JAWAD and (b) tracks of cyclonic
disturbances over the NIO in the month of December during 1891-2019 Fig.2.11.2: (a) 6 hourly Maximum sustained surface wind & estimated central pressure
and (b) 6 hourly translational speed during life cycle of cyclonic storm JAWAD Table2.11.1: Best track positions and other parameters of the Cyclonic Storm, “JAWAD” over the Bay of Bengal during 02 December- 06 December, 2021
Date
Time (UTC)
Centre lat.0 N/ long. 0 E
C.I. NO.
Estimated Central
Pressure (hPa)
Estimated Maximum Sustained
Surface Wind (kt)
Estimated Pressure drop at
the Centre (hPa)
Grade
02.12.21
1200 11.0 89.0 1.5 1004 25 4 D
1800 12.0 87.5 1.5 1004 25 4 D
03.12.21
0000 13.4 86.4 2.0 1002 30 5 DD
0300 14.0 86.0 2.0 1002 30 6 DD
0600 14.5 85.6 2.5 1001 35 7 CS
0900 15.0 85.3 2.5 1001 35 7 CS
1200 15.5 85.0 2.5 1000 40 8 CS
1500 15.7 85.0 2.5 1000 40 8 CS
1800 15.9 84.8 2.5 1000 40 8 CS
(a) (b)

204
2100 16.0 84.9 2.5 1000 40 8 CS
04.12.21
0000 16.2 84.7 2.5 1000 40 8 CS
0300 16.3 84.7 2.5 1000 40 8 CS
0600 16.4 84.7 2.5 1001 35 7 CS
0900 16.5 84.7 2.5 1001 35 7 CS
1200 16.9 84.8 2.0 1002 30 6 DD
1800 17.5 85.0 2.0 1002 30 6 DD
05.12.21
0000 18.2 85.4 2.0 1002 30 6 DD
0300 18.7 85.6 2.0 1003 30 5 DD
0600 19.1 85.9 2.0 1003 30 5 DD
0900 19..5 86.2 1.5 1004 25 4 D
1200 20.1 86.9 1.5 1004 25 4 D
1800 20.6 87.3 1.5 1005 20 3 D
06.12.21
0000 Weakened into a well marked low pressure area over northwest Bay of Bengal off West Bengal-Bangladesh coasts
2.11.3 Brief life history
2.11.3.1 Genesis
Under the influence of a cyclonic circulation over Gulf of Thailand, a low
pressure area formed over South Thailand & neighbourhood in the morning (0830
hours IST/0300 UTC) of 30th November. At 0300 UTC of 30th, the sea surface
temperature (SST) was 29-310C over Andaman Sea. Tropical cyclone heat potential
(TCHP) was 100-120 KJ/cm2 over Gulf of Thailand, south Andaman Sea & adjoining
eastern Equatorial Indian Ocean (EIO) and southeast BOB. Depth of 260C isotherm
was 100-120 m over the Gulf of Thailand, Andaman Sea and adjoining eastcentral
BOB. The Madden Julian Oscillation index (MJO) was in phase 5 with amplitude
more than 1. It was forecast to remain in same phase for next 1 day with amplitude
remaining more than 1. Thereafter, it was expected to propagate eastwards into
phase 6 from 2nd December onwards. Wind shear was moderate (10-20 knots) over
Gulf of Thailand, becoming high over south Andaman sea. However, it was
becoming low to moderate (05-15) over north Andaman sea, central BOB and
adjoining north BOB. The positive low level vorticity was 50x10-6s-1 over Gulf of
Thailand to the west of system centre. Positive low level convergence was 20x10-6s-1
over south Thailand to the northwest of system centre. Positive upper level
divergence was 20x10-5s-1 over Gulf of Thailand to the northwest of system centre.
Upper tropospheric ridge ran along 150N. A trough in westerlies ran along 580E upto
180N. Under these favourable conditions, the cyclonic circulation over Gulf of
Thailand concentrated into a low pressure area over South Thailand.
The east-southeasterly winds prevailing in the upper levels steered the system
west-northwestwards and it emerged into central parts of Andaman Sea in the same
evening (1730 hrs IST). Similar environmental conditions prevailed & the system
moved west-northwestwards and lay as a well marked low pressure area over
southeast Bay of Bengal (BoB) & adjoining Andaman Sea in the early morning (0530
hrs IST) of 2nd December.

205
At 1200 UTC of 2nd December, similar sea conditions prevailed. The
environmental conditions further consolidated. Wind shear was moderate 15-20
knots over the system area over southeast BOB. Positive low level vorticity
increased and was around 100x10-6 s-1 to the northwest of system area. Positive low
level convergence was 20x10-6s-1 to the northwest of the system centre. Positive
Upper level divergence increased and was about 30x10-5s-1 to the northwest of
system centre. Continuing to move further west-northwestwards, it concentrated into
a depression over southeast Bay of Bengal in the evening (1730 hours IST) of 2nd
December.
2.11.3.2 Intensification and movement
At 0000 UTC of 3rd December, similar sea conditions prevailed over southeast
BoB. Wind shear was moderate (20-25 knots) over the system area over southeast
and adjoining westcentral BOB. It was becoming slightly higher towards westcentral
& northwest BOB. Positive low level vorticity increased and was 150x10-6s-1 around
the system center. Low level convergence increased significantly and was 50x10-5s-1
to the northwest of the system centre. Upper level divergence also increased and
was 50 x 10-5 s-1 to the northwest of system centre. Both divergence and
convergence lay over the same area. The system was steered north-northwestwards
as it lay in the southern periphery of sub-tropical ridge at 180N. Under these
conditions, the system intensified into a deep depression at 0000 UTC of 3rd
December.
At 0600 UTC of 03rd December, similar sea conditions prevailed. However,
MJO entered phase 6. Wind shear was moderate (15-20 knots) over the system
area. Positive low level vorticity further increased and was about 180x10-6s-1 around
the system center with vertical extension upto 500 hpa level. Low level convergence
was 20-30x10-6s-1 to the northeast of the system centre. Upper level divergence was
40x10-5s-1 to the north of system centre. The sub-tropical ridge lay near 180N. Under
these conditions, the system moved north-northwestwards and intensified slightly
into the cyclonic storm “JAWAD”.
The system moved north-northwestwards, followed by subsequent northwards
movement from 0300 UTC of 4th as it lay in the western periphery of the anticyclone
over Myanmar region. Thereafter, from 1200 UTC onwards, it recurved north-
northeastwards along the western periphery of anticyclone over Myanmar region.
At 1200 UTC of 04th December, the sea conditions became slightly
unfavourable with decrease in tropical cyclone heat potential (60-80 KJ/cm2) and
unfavourable MJO conditions. Wind shear was moderate (about 10-15 knots) over
the system area, becoming high (20-30 knots) over northwest BoB and along the
forecast track. Positive low level vorticity decreased and was about 100x10-6s-1
around the system centre with vertical extension upto 500 hpa level. The Low level
convergence decreased (about 20x10-6s-1) and was located to the north-northeast of
system centre. Upper level divergence also decreased and was about 10x10-5s-1
around the system centre. Warm moist air incursion decreased. Upper tropospheric
ridge ran along 180N. Under these conditions, the system re-curved north-
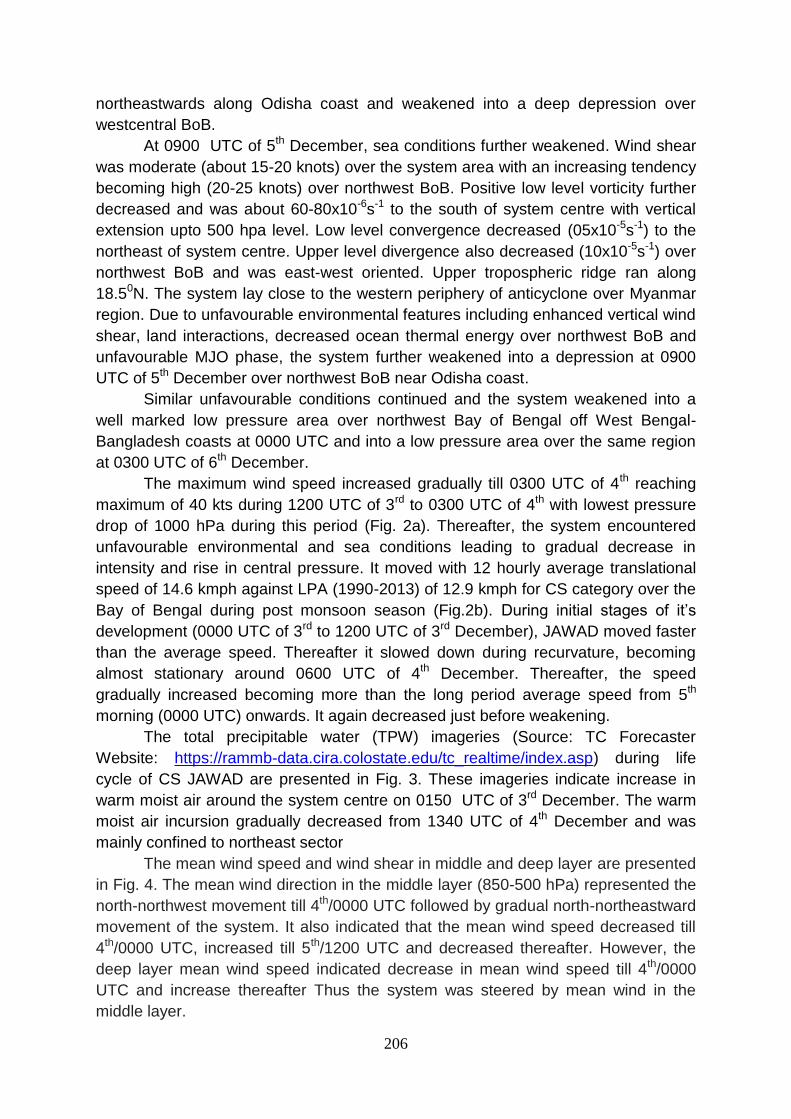
206
northeastwards along Odisha coast and weakened into a deep depression over
westcentral BoB.
At 0900 UTC of 5th December, sea conditions further weakened. Wind shear
was moderate (about 15-20 knots) over the system area with an increasing tendency
becoming high (20-25 knots) over northwest BoB. Positive low level vorticity further
decreased and was about 60-80x10-6s-1 to the south of system centre with vertical
extension upto 500 hpa level. Low level convergence decreased (05x10-5s-1) to the
northeast of system centre. Upper level divergence also decreased (10x10-5s-1) over
northwest BoB and was east-west oriented. Upper tropospheric ridge ran along
18.50N. The system lay close to the western periphery of anticyclone over Myanmar
region. Due to unfavourable environmental features including enhanced vertical wind
shear, land interactions, decreased ocean thermal energy over northwest BoB and
unfavourable MJO phase, the system further weakened into a depression at 0900
UTC of 5th December over northwest BoB near Odisha coast.
Similar unfavourable conditions continued and the system weakened into a
well marked low pressure area over northwest Bay of Bengal off West Bengal-
Bangladesh coasts at 0000 UTC and into a low pressure area over the same region
at 0300 UTC of 6th December.
The maximum wind speed increased gradually till 0300 UTC of 4th reaching
maximum of 40 kts during 1200 UTC of 3rd to 0300 UTC of 4th with lowest pressure
drop of 1000 hPa during this period (Fig. 2a). Thereafter, the system encountered
unfavourable environmental and sea conditions leading to gradual decrease in
intensity and rise in central pressure. It moved with 12 hourly average translational
speed of 14.6 kmph against LPA (1990-2013) of 12.9 kmph for CS category over the
Bay of Bengal during post monsoon season (Fig.2b). During initial stages of it’s
development (0000 UTC of 3rd to 1200 UTC of 3rd December), JAWAD moved faster
than the average speed. Thereafter it slowed down during recurvature, becoming
almost stationary around 0600 UTC of 4th December. Thereafter, the speed
gradually increased becoming more than the long period average speed from 5th
morning (0000 UTC) onwards. It again decreased just before weakening.
The total precipitable water (TPW) imageries (Source: TC Forecaster
Website: https://rammb-data.cira.colostate.edu/tc_realtime/index.asp) during life
cycle of CS JAWAD are presented in Fig. 3. These imageries indicate increase in
warm moist air around the system centre on 0150 UTC of 3rd December. The warm
moist air incursion gradually decreased from 1340 UTC of 4th December and was
mainly confined to northeast sector
The mean wind speed and wind shear in middle and deep layer are presented
in Fig. 4. The mean wind direction in the middle layer (850-500 hPa) represented the
north-northwest movement till 4th/0000 UTC followed by gradual north-northeastward
movement of the system. It also indicated that the mean wind speed decreased till
4th/0000 UTC, increased till 5th/1200 UTC and decreased thereafter. However, the
deep layer mean wind speed indicated decrease in mean wind speed till 4th/0000
UTC and increase thereafter Thus the system was steered by mean wind in the
middle layer.
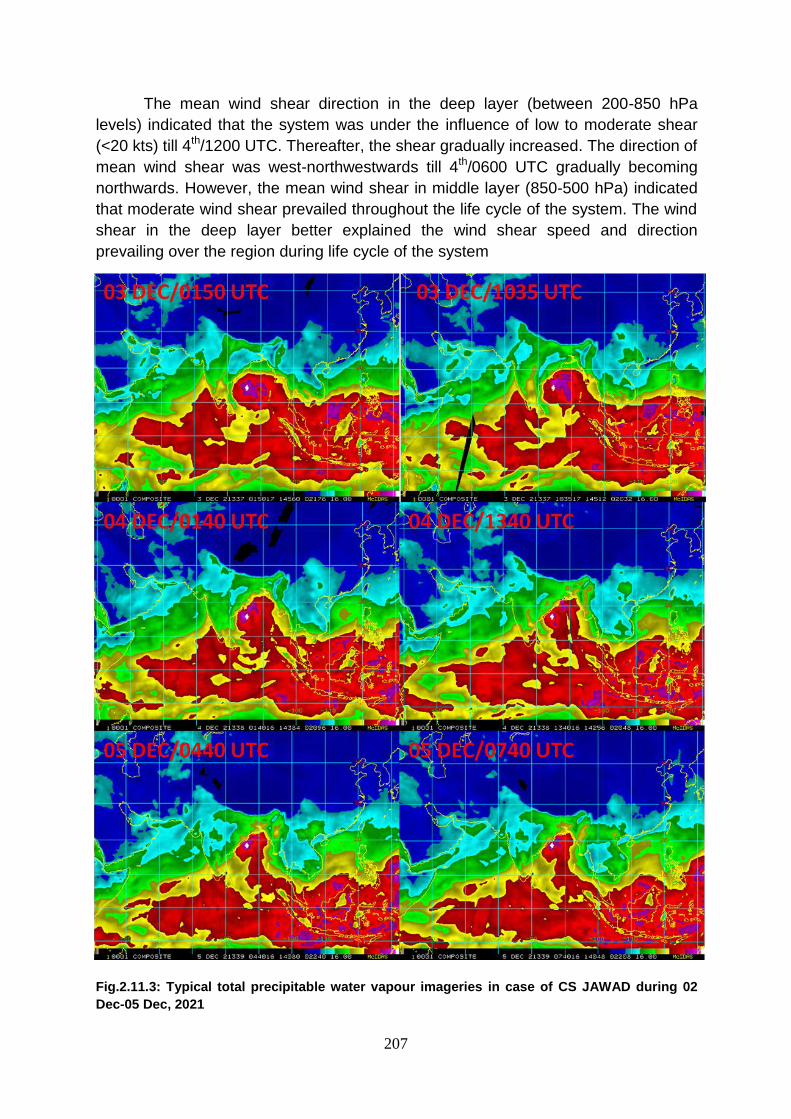
207
The mean wind shear direction in the deep layer (between 200-850 hPa
levels) indicated that the system was under the influence of low to moderate shear
(<20 kts) till 4th/1200 UTC. Thereafter, the shear gradually increased. The direction of
mean wind shear was west-northwestwards till 4th/0600 UTC gradually becoming
northwards. However, the mean wind shear in middle layer (850-500 hPa) indicated
that moderate wind shear prevailed throughout the life cycle of the system. The wind
shear in the deep layer better explained the wind shear speed and direction
prevailing over the region during life cycle of the system
Fig.2.11.3: Typical total precipitable water vapour imageries in case of CS JAWAD during 02
Dec-05 Dec, 2021

208
Fig.2.11.4: Mean Wind shear and mean wind speed in the middle (500-850 hPa) and deep layer (200-850 hPa) over the system during CS JAWAD (02-05 Dec.) 2021
2.11.4 Monitoring
India Meteorological Department (IMD) maintained round the clock watch over
the north Indian Ocean and the cyclone was monitored since 18th November, about 12 days prior to the formation of low pressure area over south Thailand and neighborhood on 30th November and 14 days prior to formation of depression over southeast BoB on 2nd December. The cyclone was monitored with the help of all

209
available satellite observations including geostationary satellites (INSAT 3D & 3DR) & various polar orbiting satellites and available ships & buoy observations in the region. The system was also monitored by Doppler Weather RADARs (DWR) Visakhapatnam and Gopalpur. Various numerical weather prediction models run by Ministry of Earth Sciences (MoES) institutions, global models and dynamical-statistical models were utilized to predict the genesis, track, landfall and intensity of the cyclone. A digitized forecasting system of IMD was utilized for analysis and comparison of various models’ guidance, decision making process and warning products generation. Typical satellite and radar imageries during CS JAWAD are presented in Fig. 5.
2.11.4.1 Features observed through satellite
At 1200 UTC of 2nd December, the convective clouds organised into shear
pattern. The intensity of the system was characterized as T 1.5. The convective
cloud clusters are sheared to northwest sector. Associated scattered to broken low &
medium clouds with embedded intense to very intense convection lay over southeast
& adjoining southwest BOB and central BOB between latitude 9.50N & 17.50N and
longitude 81.50E & 92.50E, Andaman Islands and adjoining Andaman Sea.
Fig. 2.11.5(a): INSAT-3D enhanced colored imageries during life cycle of CS JAWAD during 02 Dec-05 Dec, 2021

210
At 0000 UTC of 3rd December, the intensity of the system was characterized
as T 2.0. The cloud mass was organized in shear pattern. The convective cloud
clusters were sheared to northwest sector. Associated scattered to broken low &
medium clouds with embedded intense to very intense convection lay over central &
adjoining northwest BOB between latitude 13.00N & 20.00N and longitude 81.00E &
92.00E, north coastal Andhra Pradesh and east Odisha.
Fig. 2.11.5(b): INSAT-3D BD imageries during life cycle of CS JAWAD during 02 Dec-05 Dec, 2021
At 0600 UTC of 3rd December , the intensity of the system was characterized
as T 2.5. The cloud mass was organized in shear pattern. The system moved west
north-westwards and consolidated further. The convective cloud clusters were

211
sheared to northwest sector. Area of intense convection lay in the northern sector.
Secondary cloud bands were observed over north Andhra Pradesh and south
Odisha coasts. Associated broken low & medium clouds with embedded intense to
very intense convection lay over central & adjoining northwest BOB between latitude
14.00N & 22.00N and longitude 81.00E & 92.00E, north coastal Andhra Pradesh and
east Odisha.
At 1200 UTC of 4th December, the system entered moderately unfavourable
environment. Wind shear increased and the system gradually started weakening.
The intensity of the system was characterized as T 2.0. Associated cloud mass with
embedded moderate to intense convection was seen over north coastal Andhra
Pradesh and adjoining south Odisha, and moderate to intense convection lay over
Jharkhand, Gangetic West Bengal and southeast Bihar. Associated broken low to
medium clouds with embedded intense to very intense convection lay over
westcentral and north Bay of Bengal between latitude 15.50N & 22.00N and longitude
82.50E & 92.00E. The maximum cloud top temperature was - 930C.
Fig. 2.11.5(c): INSAT-3D Visible imageries during life cycle of CS JAWAD during 02 Dec-05 Dec, 2021

212
At 0900 UTC of 5th December, further weakening of system was witnessed
due to decreased ocean thermal energy, increased vertical wind shear and land
interactions. The intensity of the system was characterized as T1.5/C.I.1.5.
Associated cloud mass with embedded intense to very intense convection was seen
over east Odisha and moderate to intense convection was seen over west Odisha,
Jharkhand & Gangetic West Bengal. Associated scattered to broken low to medium
clouds with embedded intense to very intense convection lay over westcentral &
northwest BoB, north of latitude 17.50N and west of longitude 89.00E. The minimum
cloud top temperature was minus 930C.
Fig.2.11.5(d) : INSAT-3D IR imageries during life cycle of CS JAWAD during 02 Dec-05 Dec, 2021

213
Fig. 2.11.5(e): INSAT-3D WATER VAPOUR imageries during life cycle of CS JAWAD during 02 Dec-04 Dec, 2021

214
Typical imageries from GCOM-W1, AMSR2 (89 GHz) imageries are presented in Fig.5 (f). At 1800 UTC of 2nd December, the intense convection was sheared in the northwest sector. Gradually from 4th morning onwards, the intense convection area shifted northeastwards. At 1800 UTC, area of intense convection extended over north BoB off north Odisha, Gangetic West Bengal & south Bangladesh coasts. Fig.7 (f): ): Microwave imageries during life cycle of CS JAWAD during 02 Dec-04 Dec, 2021 Fig.2.11.5(f): Typical microwave imageries during life cycle of CS JAWAD during 02 Dec-04 Dec, 2021
02 Dec/1800 03 Dec/0600
04 Dec/0600 04 Dec/1800
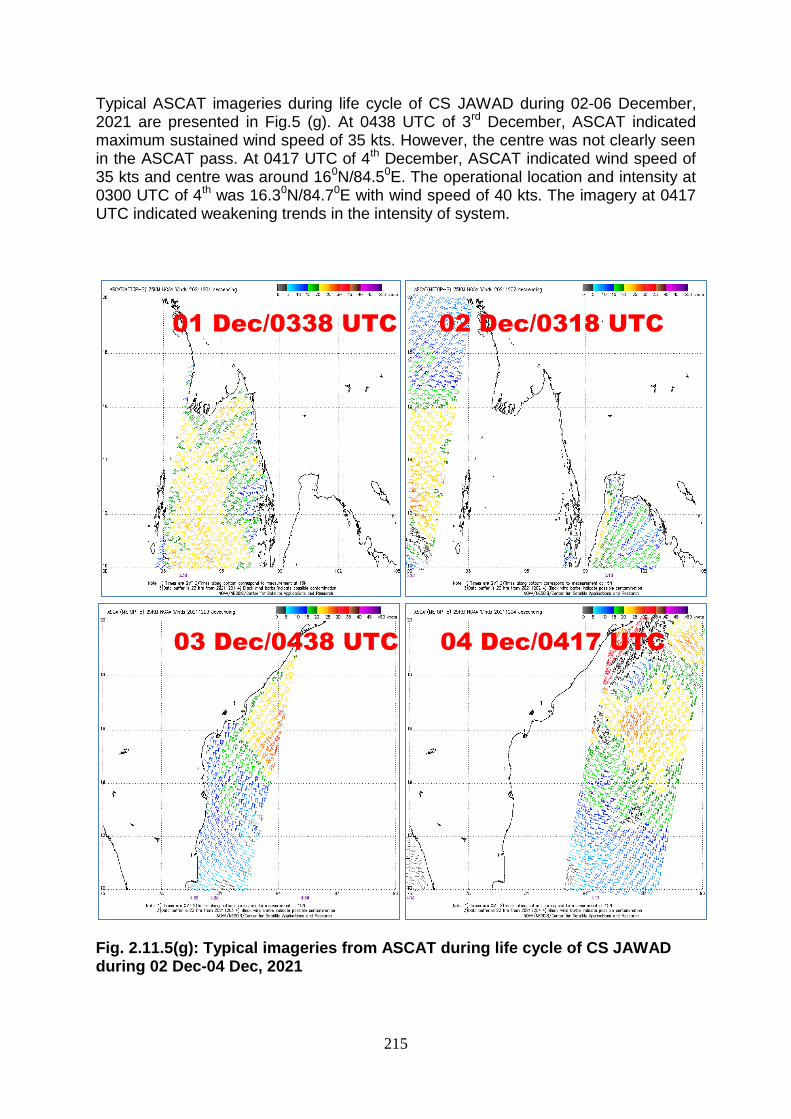
215
Typical ASCAT imageries during life cycle of CS JAWAD during 02-06 December, 2021 are presented in Fig.5 (g). At 0438 UTC of 3rd December, ASCAT indicated maximum sustained wind speed of 35 kts. However, the centre was not clearly seen in the ASCAT pass. At 0417 UTC of 4th December, ASCAT indicated wind speed of 35 kts and centre was around 160N/84.50E. The operational location and intensity at 0300 UTC of 4th was 16.30N/84.70E with wind speed of 40 kts. The imagery at 0417 UTC indicated weakening trends in the intensity of system. Fig. 2.11.5(g): Typical imageries from ASCAT during life cycle of CS JAWAD during 02 Dec-04 Dec, 2021
01 Dec/0338 UTC 02 Dec/0318 UTC
03 Dec/0438 UTC 04 Dec/0417 UTC

216
2.11.4.2 Features observed through Radar CS JAWAD was continuously monitored by IMD’s Doppler Weather Radars (DWR) at Visakhapatnam, Gopalpur and Paradeep while moving north-northeastwards along the east coast of India close towards north BoB. Typical imageries from these Radars during 3rd to 6th December are presented in (Fig. 2.11.6).
Fig.2.11.6(a): Maximum reflectivity (dBz) imageries from DWR Visakhapatnam during 03 Dec-06 Dec, 2021 in association with CS Jawad

217
Maximum reflectivity imageries from DWR Gopalpur during 3rd to 5th December are presented in Fig.2.11.6(b). Fig.2.11.6(b): Maximum reflectivity (Z) imageries from DWR Gopalpur during 03 Dec-05 Dec, 2021 in association with CS Jawad

218
Volume Velocity Processing (VVP (V)) imageries presenting the horizontal wind speed and direction in a vertical column from DWR Gopalpur during 3rd to 5th are presented in Fig. 6(c). Fig.2.11.6(c): Volume Velocity Processing (VVP(V)) imageries from DWR
Visakhapatnam during 03 Dec-05 Dec, 2021 in association with CS Jawad
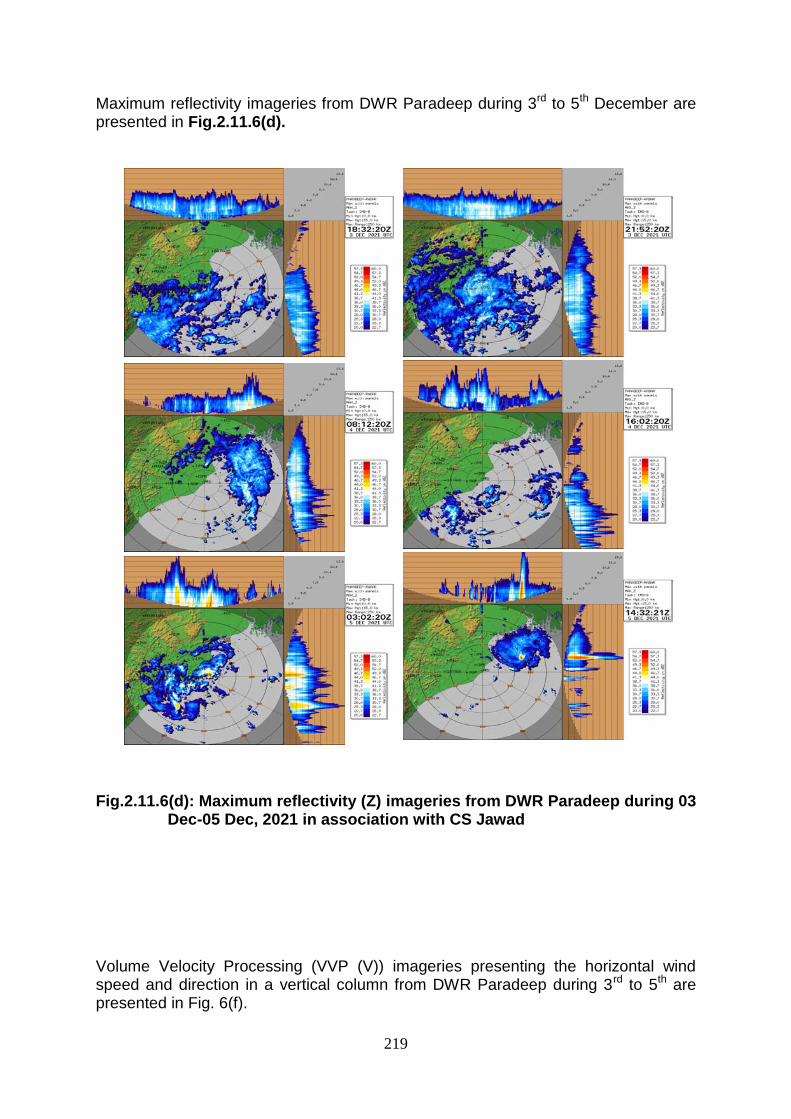
219
Maximum reflectivity imageries from DWR Paradeep during 3rd to 5th December are presented in Fig.2.11.6(d). Fig.2.11.6(d): Maximum reflectivity (Z) imageries from DWR Paradeep during 03
Dec-05 Dec, 2021 in association with CS Jawad Volume Velocity Processing (VVP (V)) imageries presenting the horizontal wind speed and direction in a vertical column from DWR Paradeep during 3rd to 5th are presented in Fig. 6(f).

220
Fig.2.11.6(e): Volume Velocity Processing (VVP(V)) imageries from DWR
Paradeep during 03 Dec-05 Dec, 2021 in association with CS Jawad
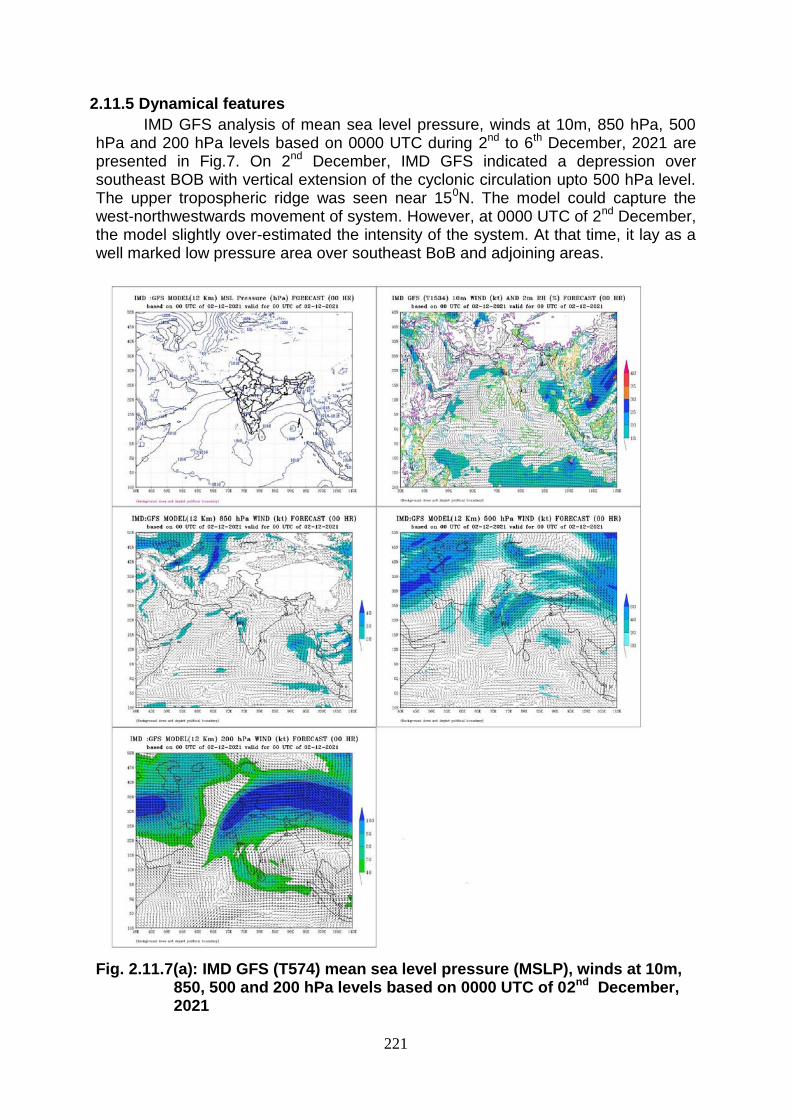
221
2.11.5 Dynamical features
IMD GFS analysis of mean sea level pressure, winds at 10m, 850 hPa, 500 hPa and 200 hPa levels based on 0000 UTC during 2nd to 6th December, 2021 are presented in Fig.7. On 2nd December, IMD GFS indicated a depression over southeast BOB with vertical extension of the cyclonic circulation upto 500 hPa level. The upper tropospheric ridge was seen near 150N. The model could capture the west-northwestwards movement of system. However, at 0000 UTC of 2nd December, the model slightly over-estimated the intensity of the system. At that time, it lay as a well marked low pressure area over southeast BoB and adjoining areas.
Fig. 2.11.7(a): IMD GFS (T574) mean sea level pressure (MSLP), winds at 10m,
850, 500 and 200 hPa levels based on 0000 UTC of 02nd December, 2021

222
On 3rd December, IMD GFS indicated a severe cyclonic storm over westcentral BOB with vertical extension upto 500 hPa level. The upper tropospheric ridge was seen near 150N. The approaching westerly trough was also picked by the model. The forecast field indicated further intensification of system and also crossing over south Odisha coast close to Puri around 1700 UTC of 4th. However, at 0000 UTC of 3rd, it lay as a deep depression over westcentral BoB. Thus, the model picked up the movement & location correctly, but over-estimated the intensity of the system.
Fig. 2.11.7(b): IMD GFS (T574) mean sea level pressure (MSLP), winds at 10m, 850, 500 and 200 hPa levels based on 0000 UTC of 03rd December, 2021

223
On 4th December, IMD GFS indicated slight weakening into a cyclonic storm over westcentral BOB with vertical extension upto 500 hPa level. The anticyclone over eastcentral BoB near Myanmar and the approaching trough was captured by the model. The forecast field indicated northeastwards movement of system and it’s weakening over northwest BoB off Odisha coast on 5th evening. However, at 0000 UTC of 4th, it lay as a cyclonic storm over westcentral BoB. Thus, the model picked up the movement, location and intensity of the system correctly on 4th December.
Fig. 2.11.7(c): IMD GFS (T574) mean sea level pressure (MSLP), winds at 10m, 850, 500 and 200 hPa levels based on 0000 UTC of 04th December, 2021
On 5th December, IMD GFS indicated further weakening into a deep depression over westcentral BOB (close to Odisha coast) with vertical extension upto 500 hPa level. The anticyclone over eastcentral BoB near Myanmar and the approaching trough was captured by the model. However, at 0000 UTC of 5th, it lay

224
as a deep depression over westcentral BoB. Thus, the model picked up the movement, location and intensity of the system correctly on 5th December.
Fig. 2.11.7(d): IMD GFS (T574) mean sea level pressure (MSLP), winds at 10m, 850, 500 and 200 hPa levels based on 0000 UTC of 05th December, 2021
Hence to conclude, IMD GFS initially over-estimated the intensity of the system. But from 4th onwards, it correctly picked the location, intensity and movement. It could also capture the impact of approaching westerly trough and the anticyclone over eastcentral BoB and predicted northeastwards recurvature of the system from 4th onwards correctly.

225
2.11.6 Realized Weather: 2.11.6.1 Realised rainfall
The rainfall associated with CS Jawad based on IMD-NCMRWF GPM merged gauge 24 hours cumulative rainfall ending at 0830 IST of date is depicted in Fig 2.11.8. The plots show that the system caused heavy over south Andaman Sea on 29th November. The rainfall belt gradually moved west-northwestwards, causing heavy to very heavy rainfall at few places over south Andaman Sea on 30th November and at many places over Andaman Islands on 1st December. It caused widespread heavy to very rainfall at a few places with extremely heavy falls at isolated places over westcentral BoB on 2nd December. On 3rd, it caused scattered heavy to very rainfall with isolated extremely falls over westcentral BoB off north Andhra Pradesh & south Odisha coasts. On 4th decrease in rainfall activity is seen with isolated heavy to extremely heavy rainfall over westcentral BoB off Odisha-Gangetic West Bengal coasts. On 5th December, heavy to very heavy rainfall at few places over north Odisha, Gangetic West Bengal and south Bangladesh coasts is seen.
Fig.2.11.8: IMD-NCMRWF GPM merged gauge 24 hr cumulative rainfall (cm)
ending at 0830 IST of date during 30th Nov. – 6th December and 7 days average rainfall (cm/day)
24 hours realized heavy to extremely rainfall (≥7cm) ending at 0830 hrs IST of date during the life cycle of the system is presented below: 5th December 2021: Odisha: Ganjam district: Chhattarpur-9, Purushottampur-8, Behrampur, Digapahandi, Gopalpur-6 each; Khurda district: Banpur-8; Jagatsinghpur district: Paradip CWR-6, Balikuda-5; Nayagarh district: Nayagarh-6; Puri district: Astaranga-5; Kendrapada district: Garadapur5; Cuttack district: Kantapada-5; Jajpur district: Chandikhol-5 6th December 2021: Odisha: Jagatsinghpur district: Erasama-23, Paradip-20, Balikuda-15, Kujanga-14, Nuagaon-13, Tirtol-12, Raghunathpur-9, Jagatsinghpur-7; Kendrapara district: Marshaghai, Garadpur13 each, Rajnagar-12, Mohakalpara-10, Derabis-9,

226
Kendrapara, Patamundai-8 each; Puri district: Kakatpur12, Astaranga-11, Delang, Kanas-8 each, Nimapara-7; Cuttack district: Niali-10, Tangi-Choudwar-7. Gangetic West Bengal: Hooghly district: Tarakeshwar-18, Bagati-13, Harinkhola-8; Burdwan district: Burdwan - 13, Manteswar-7; Nadia district: Kalyani -12; North 24 Parganas district: Barrackpur-12, Dum Dum-10, Salt lake-9; West Midnapore district: Mohanpur, Kharagpur-11 each, Midnapore, Kalaikunda -9 each, Jhargram, Lalgarh-7 each; Howrah district: Uluberia -9; Kolkata district: Alipore-7; South 24 Parganas district: Canning-7.
Cumulative realised rainfall (cm) during 29th November to 6th December over Visakhapatnam, Odisha and Gangetic West Bengal in association with CS JAWAD is presented in Fig. 2.11.9.
Fig.2.11.9: Cumulative realised rainfall (cm) during 29th November to 6th December over Visakhapatnam, Odisha and Gangetic West Bengal in association with CS JAWAD
0830 hrs IST of 29th Nov-6th Dec. 0830 hrs IST of 30th Nov-6th Dec. 0830 hrs IST of 1st Dec-6th Dec.
0830 hrs IST of 02nd Dec-6th Dec. 0830 hrs IST of 03rd Dec-6th Dec. 0830 hrs IST of 04th Dec-6th Dec.
0830 hrs IST of 05th Dec-6th Dec.
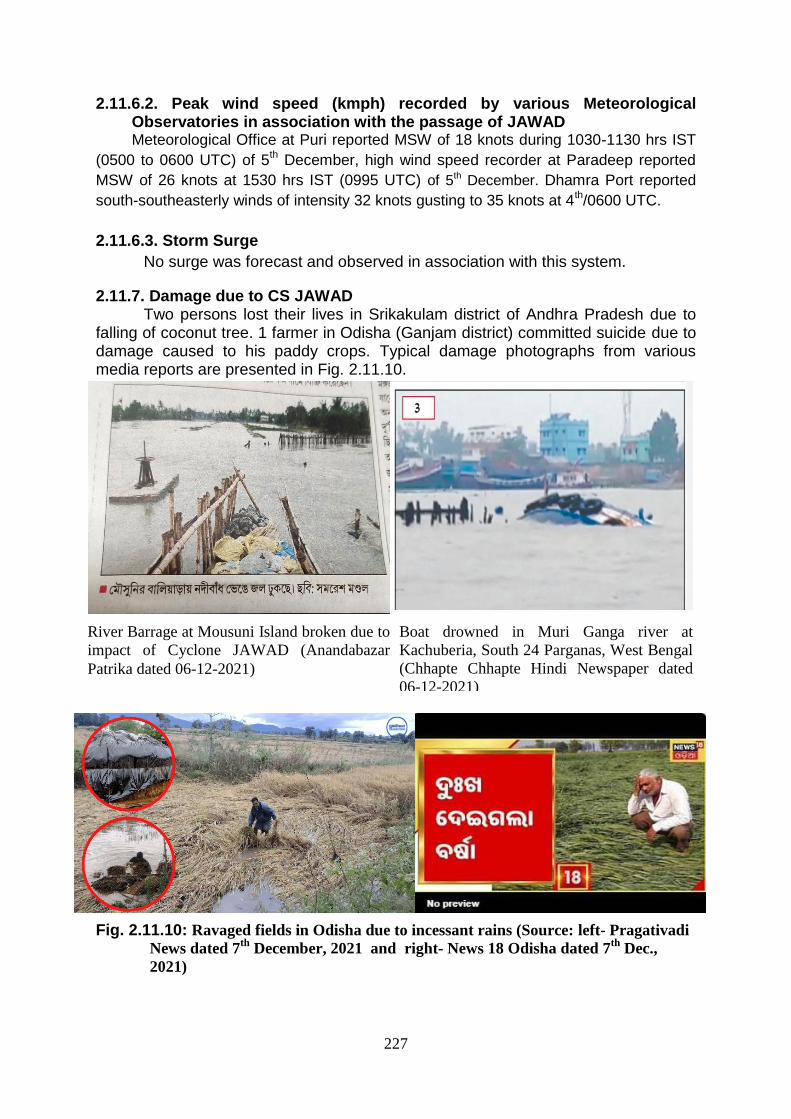
227
2.11.6.2. Peak wind speed (kmph) recorded by various Meteorological Observatories in association with the passage of JAWAD Meteorological Office at Puri reported MSW of 18 knots during 1030-1130 hrs IST
(0500 to 0600 UTC) of 5th December, high wind speed recorder at Paradeep reported
MSW of 26 knots at 1530 hrs IST (0995 UTC) of 5th December. Dhamra Port reported
south-southeasterly winds of intensity 32 knots gusting to 35 knots at 4th/0600 UTC.
2.11.6.3. Storm Surge
No surge was forecast and observed in association with this system.
2.11.7. Damage due to CS JAWAD
Two persons lost their lives in Srikakulam district of Andhra Pradesh due to falling of coconut tree. 1 farmer in Odisha (Ganjam district) committed suicide due to damage caused to his paddy crops. Typical damage photographs from various media reports are presented in Fig. 2.11.10.
Fig. 2.11.10: Ravaged fields in Odisha due to incessant rains (Source: left- Pragativadi
News dated 7th
December, 2021 and right- News 18 Odisha dated 7th
Dec.,
2021)
Boat drowned in Muri Ganga river at
Kachuberia, South 24 Parganas, West Bengal
(Chhapte Chhapte Hindi Newspaper dated
06-12-2021)
River Barrage at Mousuni Island broken due to
impact of Cyclone JAWAD (Anandabazar
Patrika dated 06-12-2021)

228
CHAPTER- III
3.1. NWP Models in operational use during the year 2021
The Global Forecast System (GFS), adopted from National Centre for
Environmental Prediction (NCEP) was implemented at India Meteorological
Department (IMD), New Delhi on IBM based High Power Computing Systems
(HPCS) at T1534 (~ 12 km in horizontal over the tropics) with ENKF based Grid point
Statistical Interpolation (GSI) scheme as the global data assimilation for the forecast
up to 10 days. The model is run four times in a day (00, 06, 12 and 18 UTC). 00 &
12 UTC runs are available for next 10 days forecast period. 06 & 18 UTC runs are
available for 3 days forecast period. The real-time outputs are made available to the
national web site of IMD (http://www.imd.gov.in/section/nhac/
dynamic/nwp/welcome.htm).
IMD operationally runs three regional models WRFDA-WRFARW (v3.6), and
HWRF for short-range prediction during cyclone condition.
The mesoscale forecast system Weather Research and Forecast WRFDA
(version 3.6) with 3DVAR data assimilation is being operated daily twice to generate
mesoscale analysis at 9 km horizontal resolution using IMD GFS-T574L64 analysis
as first guess and forecasts as boundary condition. Using analysis and updated
boundary conditions from the WRFDA, the WRF (ARW) is run for the forecast up to
3 days with double nested configuration with horizontal resolution of 9 km and 3 km
and 45 Eta levels in the vertical. The model mother domain covers the area between
lat. 23ºS to 46ºN long 40ºE to 120ºE and child covers whole India. The performance
of the model is found to be reasonably skilful for cyclone genesis and track
prediction. At ten other regional Centers, very high resolution mesoscale models
(WRF at 3 km resolution) are also operational with their respective regional
setup/configurations.
Recently, the joint collaborative work within TC-project of IMD under the
MOU between MOES-NOAA, has upgraded operational coupled Hurricane-WRF
model for Tropical Cyclone forecast over North Indian Ocean. The HWRF model
coupled with POM-TC model has been made operational in the year 2017 and first
coupled run of HWRF-POM has been carried out during OCKHI cyclone over NIO.
The HWRF- POM coupled configuration was operational in cyclic mode for all the
system in the year 2018 viz Sagar, Mekunu, Luban, Titli, Gaja, Phethai and Pabuk.
The HWRF model is now operational in coupled mode with both POM and HYCOM
ocean models.
The HWRF version H217 which was operational at EMC, NCEP USA has
been ported on the MHIR HPCS with horizontal resolution of 18 km for parent
domain and 6km & 2 km for intermediate and innermost nested domains following
the center of cyclonic storm. The model is running with 61 vertical levels with parent
domain, intermediate and innermost domain covering area of 80ox80o, 24ox24o and
7ox7o respectively. The model also has state of the art features specially modified

229
for tropical cyclone forecasting. The special feature includes vortex initialization and
correction, GSI based regional data assimilation, coupler for two way coupling
between atmosphere and ocean components of coupled HWRF model and physics
options fine-tuned for tropical cyclone prediction. The ocean model provides the
SST field to the atmospheric component through coupler during the model
integration to update the effect of mixing, cooling as well as advection effect on SST
field, whereas the atmospheric component provides the heat fluxes, wind stress,
precipitation and surface pressure fields to the ocean model through coupler. The
coupled HWRF model uses GFDL vortex tracker and diagnostic software to provide
the graphic and text information on track, intensity as well as structure of tropical
cyclones for real time operational requirements. The HWRF physics scheme
upgrades include updated Scale-Aware Simplified Arakawa-Schubert (SASAS)
scheme, Ferrier-Aligo microphysics, GFS Hybrid-EDMF PBL, partial cloudiness for
RRTMG scheme, and surface-exchange coefficients in the surface layer.
Within coupled framework of HWRF modeling system, the POM is initialized
based on the climatological data whereas the HYCOM is initialized based on the
ocean fields from RTOFS (Real-Time Ocean Forecast System) of INCOIS,
Hyderabad. The atmospheric component of HWRF is initialized based on the
analysis and forecast from IMD-GFS(T1534L64) and associated GDAS analysis.
The HWRF model uses 3D-EnVAR-GSI as its data assimilation component. The
coupled HWRF model is run every 6 hours on real time basis in cyclic mode based
on 00, 06, 12, 18 UTC initial conditions to provide track and intensity forecast along
with surface wind, rain swaths and other diagnostic products for up to 126 hours.
The INCOIS-IMD joint team successfully carried out a thorough study and
several experiments with HWRF-HYCOM coupled model using INCOIS HYCOM
input fields for the “PHETHAI” cyclonic system during February, 2019 before its
operational implementation. The first operational forecasts from HWRF-HYCOM
(INCOIS inputs) Cyclic Coupled runs in real-time are being provided since FANI
cyclone over Bay of Bengal.
The method comprises of five forecast components, namely (a) Cyclone
Genesis Potential Parameter (GPP), (b) Multi-Model Ensemble (MME) technique for
cyclone track prediction, (c) Cyclone intensity prediction, (d) Rapid intensification
and (e) Predicting decaying intensity after the landfall.
A cyclone genesis parameter, termed the genesis potential parameter (GPP),
for the North Indian Sea is developed (Kotal et al, 2009). The parameter is defined
as the product of four variables, namely vorticity at 850 hPa, middle tropospheric
relative humidity, middle tropospheric instability, and the inverse of vertical wind
shear. The parameter is operationally used for distinction between non-developing
and developing systems at their early development stages. The composite GPP
value is found to be around three to five times greater for developing systems than
for non-developing systems. The analysis of the parameter at early development
stage of a cyclonic storm found to provide a useful predictive signal for intensification
of the system.

230
The grid point analysis and forecast of the genesis parameter up to seven
days is also generated on real time (available at
http://www.imd.gov.in/section/nhac/dynamic/Analysis.htm). Higher value of the GPP
over a region indicates higher potential of genesis over the region. Region with GPP
value equal or greater than 30 is found to be high potential zone for cyclogenesis.
The analysis of the parameter and its effectiveness during cyclonic disturbances in
2012 affirm its usefulness as a predictive signal (4-5 days in advance) for
cyclogenesis over the North Indian Ocean.
The multi model ensemble (MME) technique (Kotal and Roy Bhowmik, 2011)
is based on a statistical linear regression approach. The predictors selected for the
ensemble technique are forecasts latitude and longitude positions at 12-hour interval
up to 120-hour of five operational NWP models. In the MME method, forecast
latitude and longitude position of the member models are linearly regressed against
the observed (track) latitude and longitude position for each forecast time at 12-
hours intervals for the forecast up to 120-hour. The 12 hourly predicted cyclone
tracks are then determined from the respective mean sea level pressure fields using
a cyclone tracking software. Multiple linear regression technique is used to generate
weights (regression coefficients) for each model for each forecast hour (12hr, 24hr,
36 hr, 48hr, 60hr, 72hr, 84hr, 96hr, 108hr and 120 hrs) based on the past data.
These coefficients are then used as weights for the ensemble forecasts. 12-hourly
forecast latitude (LATf) and longitude (LONf) positions are defined by multiple linear
regression technique. A collective bias correction is applied in the MME by applying
multiple linear regression based minimization principle for the member models GFS
(IMD), GFS(NCEP), ECMWF, UKMO and JMA. ECMWF data are available at 24h
intervals. Therefore, 12h, 36h, 60h, 84h, 108h forecast positions of ECMWF are
computed based on linear interpolation. All these NWP products are routinely made
available in real time on the IMD web site: www.rsmcnewdelhi.imd.gov.in.
A statistical-dynamical model (SCIP) (Kotal et al, 2008) has been
implemented for real time forecasting of 12 hourly intensity up to 120 hours. The
model parameters are derived based on model analysis fields of past cyclones. The
parameters selected as predictors are: Initial storm intensity, Intensity changes
during past 12 hours, Storm motion speed, Initial storm latitude position, Vertical
wind shear averaged along the storm track, Vorticity at 850 hPa, Divergence at 200
hPa and Sea Surface Temperature (SST). For the real-time forecasting, model
parameters are derived based on the forecast fields of IMD-GFS model. The method
is found to be provided useful guidance for the operational cyclone forecasting.
A rapid intensification index (RII) is developed for tropical cyclones over the
Bay of Bengal (Kotal and Roy Bhowmik, 2013). The RII uses large-scale
characteristics of tropical cyclones to estimate the probability of rapid intensification
(RI) over the subsequent 24-h. The RI is defined as an increase of intensity 30 kt
(15.4 ms-1) during 24-h. The RII technique is developed by combining threshold
(index) values of the eight variables for which statistically significant differences are
found between the RI and non-RI cases. The variables are: Storm latitude position,

231
previous 12-h intensity change, initial storm intensity, vorticity at 850 hPa,
divergence at 200 hPa, vertical wind shear, lower tropospheric relative humidity, and
storm motion speed. The probability of RI is found to increase from 0% to 100%
when the total number of indices satisfied increases from zero to eight. The forecasts
are made available in real time since 2013.
Tropical cyclones (TCs) are well known for their destructive potential and
impact on human activities. The Super cyclone Orissa (1999) illustrated the need for
the accurate prediction of inland effects of tropical cyclones. The super cyclone of
Orissa maintained the intensity of cyclonic storm for about 30 hours after landfall.
Because a dense population resides at or near the Indian coasts, the decay forecast
has direct relevance to daily activities over a coastal zone (such as transportation,
tourism, fishing, etc.) apart from disaster management. In view of this, the decay
model (Roy Bhowmik et al. 2005) has been used for real time forecasting of
decaying intensity (after landfall) of TCs.
As part of WMO Program to provide a guidance of tropical cyclone (TC)
forecasts in near real-time for the ESCAP/WMO Member Countries based on the
TIGGE Cyclone XML (CXML) data, IMD implemented JMA supported software for
real-time TC forecast over North Indian Ocean (NIO) in 2011.
The Ensemble and deterministic forecast products from ECMWF (50+1
Members), NCEP (20+1 Members), UKMO (23+1 Members) and MSC (20+1
Members) are available near real-time for NIO region for named TCs. These
Products includes: Deterministic and Ensemble TC track forecasts, Strike Probability
Maps, Strike probability of cities within the range of 120 kms 4 days in advance. The
JMA provided software to prepare Web page to provide guidance of tropical cyclone
forecasts in near real-time for the ESCAP/WMO committee Members. The forecast
products are made available in real time.
The Ministry of Earth Sciences (MoES) has commissioned two very high
resolution (12 km grid scale) state-of-the-art global Ensemble Prediction Systems
(EPS) for generating operational 10-days probabilistic forecasts of weather. The EPS
involves the generation of multiple forecasts using slightly varying initial conditions.
The forecast products from these two prediction systems are available at the
following links (http://nwp.imd.gov.in/gefspro.php) and
(http://www.ncmrwf.gov.in/product_main.php). The frameworks of the new EPSs are
among the best weather prediction systems in the world at present. Very few
forecasting centres in the world use this high resolution for short-medium range
probabilistic weather forecasts. GEFS model is run twice a day based on 00 & 12
UTC initial conditions.
The NCUM-G (Rajagopal et al., 2012; George et al., 2016) uses a seamless
modeling approach. It has a horizontal grid resolution of ~12 km and 70 vertical
levels (reaching 80 km height), is being used for the 240 hrs numerical weather
forecast since 2018 (Kumar et al., 2018). These model and assimilation systems
have been updated periodically to adapt to various scientific and technical
developments. Advanced ENDGame dynamical core is used in the model, which

232
provides improved accuracy of the solution of primitive model equations and reduced
damping. ENDGame also increases variability in the tropics, which leads to an
improved representation of TCs and other tropical phenomena (Walters et al., 2017).
An advanced data assimilation method Hybrid 4D-Var is used for the creation of
NCUM global atmospheric analysis. Ensemble Transform Kalman Filter (ETKF)
based on the NCUM ensemble prediction system (NEPS) provides flow-dependent
background errors to this Hybrid 4D-Var system. Utmost importance has been given
to the assimilation of Indian satellite observations in this data assimilation system.
INSAT-3D Atmospheric Motion Vector (AMV), MeghaTropiques (MT)-SAPHIR
radiance, Scatsat Ocean Surface Winds are being assimilated in the operational
NCUM global data assimilation system, in addition to other global observations. A list
of observations assimilated in the latest NCUM global data assimilation system is
given in Table-2. Salient Features of NCUM Assimilation–Forecast System is shown
in Table-3
NCUM global data assimilation system produces analyses at 00, 06, 12, and
18 UTC. In each 6 hourly data assimilation cycle, the available observations
distributed over the 6 hour assimilation window (center of the analysis cycle ± 3 hr)
are combined with the model background to produce the NCUM-G analysis. Table 1
summarizes the model configurations operational at NCMRWF. Details on the model
parameterizations schemes, data assimilation, etc., can be found in Kumar et al.
(2018).
NCUM-R has a horizontal grid resolution of ~4 km and 80 vertical levels, with
the model top at 38.5 km and 14 model levels below 1 km. The model has a time
step of 1 minute. The model domain covers India and the adjacent oceanic regions
and is operationally producing 72hrs forecasts. In this convection-permitting model
configuration, sub-grid scale deep convection is not parameterized. The prognostic
cloud fraction and prognostic condensate (PC2) scheme used in this model is based
on Wilson (2008 a & b). The sub-grid turbulence scheme used is a blended scheme
(Boutle et al., 2014), which dynamically combines the one-dimensional (1D)
boundary-layer scheme of Lock et al. (2000) with a 3D Smagorinsky scheme using a
mixing factor of 0.5. The model employs NASA Shuttle Radar Topographic Mission
(SRTM) 90 m digital elevation map orography.
NCUM-R uses the high resolution analysis prepared by the 4D-Var data
assimilation (DA) system. In addition to most of the observations used in the NCUM
global data assimilation system (even though data thinning strategies are different),
Indian Doppler Weather Radar observations of radial wind are also used in the
regional DA system with a time window of ± 3hours. The vortex initialization scheme
is also employed in the NCUM-R. The model domain covers the South Asian region,
covering BOB and part of the Arabian Sea (6.S -41.N and 62.-106.E). The details of
NCUM-R model configuration can be found in Dutta et al. 2019, Jayakumar et al.
2019 and Bush et al. 2020.
NCMRWF Ensemble Prediction System (NEPS-G) is a global medium range
probabilistic forecasting system adapted from UK MET Office. The configuration

233
consists of four cycles of assimilation corresponding to 00Z, 06Z, 12Z & 18Z and 10-
day forecasts are made using the 00Z initial condition. The operational NCMRWF
Ensemble Prediction System (NEPS) has 22 ensemble members. The horizontal
resolution of NEPS is ~12km. The NCUM model analysis is used as the initial
condition for the control model forecast. The perturbations are generated by
Ensemble Transform Kalman Filter (ETKF) method which is added to the global
deterministic analysis to create 22 perturbed initial conditions. These are used for
generating ensemble member forecasts. One control and 11 perturbed ensemble
members run from initial condition of 00UTC of current day and 11 more perturbed
members run from 12 UTC of previous day to give 23 members (11 + 11 + 1 control)
ensemble forecasts up to 10 days lead time. More details about NEPS-G are
available in Mamgain et al. (2018). The new 12-km NEPS-G is the highest resolution
for Ensemble forecasting.

234
3.2 Extremely Severe Cyclonic Storm TAUKTAE (14th-19th May 2021)
3.2.1 Prediction of cyclogenesis [Genesis Potential Parameter (GPP)] for ESCS
Tauktae Fig. 3.2.1 (a-f) indicates that the GPP could predict the potential zone for cyclogenesis
on 14th May, over southeast Arabian Sea about 120 hours in advance. However, the
location of genesis became accurate only with a lead time of 72 hours.
Since all low-pressure systems do not intensify into cyclones, it is important to
identify the potential of intensification (into cyclone) of a low pressure system at the early
stages (T No. 1.0, 1.5, 2.0) of development. Average GPP ≥ 8.0 is the threshold value for
system likely to develop into a cyclonic storm and average GPP < 8.0 indicates a non-
developing system. The area average analysis of GPP on 14th May is presented in Fig.
3.2.2. The area average analysis was predicting the system to develop into a cyclonic
storm from the 00 UTC run of 14th.
Fig.3.2.1 (a-f): Predicted zone of cyclogenesis for 0000 UTC of 14th May based on
0000 UTC of 09th-14th May 2021
(a) (b)
(c) (d)
(e) (f)
(c)

235
Fig. 3.2.2: Area average analysis and forecasts of GPP based on (a) 0000 of 14th & (b) 1200
UTC of 14th May 2021
3.2.2 Track prediction by NWP models
Tracks predicted by various NWP models including IMD GFS, IMD MME, IMD
HWRF, WRF-VAR, NCMRWF Unified Model (NCUM), UM Regional, NCMRWF
Ensemble Prediction System (NEPS), NCEP GFS, ECMWF, UKMO and JMA during 14th
to 17th May are presented in Fig.3.2.3. Based on initial conditions of 0000 UTC of 14th
May, most of the models, other than JMA & NCEP- GFS indicated likely crossing of the
system over Gujarat coast. JMA was far out when it predicted the system to move away
from the west coast of India fooled by NCEP GFS, which hinted the possibility of crossing
south Pakistan coast to the west of Kutch (India). HWRF (HYCOM) forecast was the
most realistic followed by that of ECMWF, though the actual landfall point remained to be
nearly 50 to 100 km to the east respectively. Predicted landfall timings also varied and
most of the models lagged by nearly 12 hours, at this stage.
Fig. 3.2.3 (a): NWP model for tropical cyclone “TAUKTAE” based on 0000 UTC of
14th May 2021
00 12 24 36 48 60 72 84 96 108
0
5
10
15
20
25
30
35
40
GENESIS POTENTIAL PARAMETER (GPP)Based on 00z of 14.05.2021
Lead-Time (h)
GP
P
00 12 24 36 48 60 72 84
0
5
10
15
20
25
30
35
GENESIS POTENTIAL PARAMETER (GPP)Based on 12z of 14.05.2021
Lead-Time (h)
GP
P

236
Based on initial conditions of 0000 UTC of 15th May, a few more models like
UKMO shifted the track more eastwards confirming the system to cross Gujarat coast.
However, the forecasts by ECMWF, HWRF (HYCOM) and the mean track from the strike
probability of GEFS were nearly accurate, whereas IMD GFS indicated the landfall point
about 50 km to the west, JMA to the west of Kutch (India) and NCEP GFS far to the west
of Indian coast line. The landfall timings continued to vary most of them predicted it to
happen during the morning hours of 18th May.
Based on the initial conditions of 1200 UTC of 15th May, MME for the first time
indicated chances of rapid intensification on 16th – 17th May, reaching the maximum
intensity (98 Knots) at 1200 UTC of 17th May.
Fig. 3.2.3 (b): NWP model for tropical cyclone “TAUKTAE” based on 0000 UTC of
15th May 2021

237
Based on initial conditions of 0000 UTC of 16th May, all the models, except JMA
predicted the landfall point with reasonable accuracy. The landfall timings also started
converging in majority of the model forecasts. However, at this stage, MME indicated an
intensity of 100 knots at 0000 UTC of 18th, over Saurashtra, after landfall.
Fig. 3.2.3 (c): NWP model for tropical cyclone “TAUKTAE” based on 0000 UTC of
16th May 2021

238
Based on initial conditions of 0000 UTC of 17th May, all the models converged in
the landfall point. However, the time of landfall still varied. All of them also predicted the
initial near northward movement followed by north-northeastwards re-curvature after
landfall. At this point, MME indicated an intensity of 105 Knots till 1200 UTC of 17th and a
rapid weakening after landfall into 55 knots at 0000 UTC of 18th May.
Fig. 3.2.3 (d): NWP model for tropical cyclone “TAUKTAE” based on 0000 UTC of
17th May 2021
3.2.3 Track forecast errors
Average track forecast errors by various NWP models are presented in Table
3.2.1 a. For 24 hrs lead period track forecast error was the least i.r.o. MME followed by
IMD-GFS and GEFS. For 48 hrs lead period, the track forecast error was the least i.r.o.
ECMWF followed by MME and IMD-GFS. For 72 hours lead period, the error was the
least i.r.o. ECMWF followed by HWRF and IMD GFS. For 96 and 120 hrs lead period,
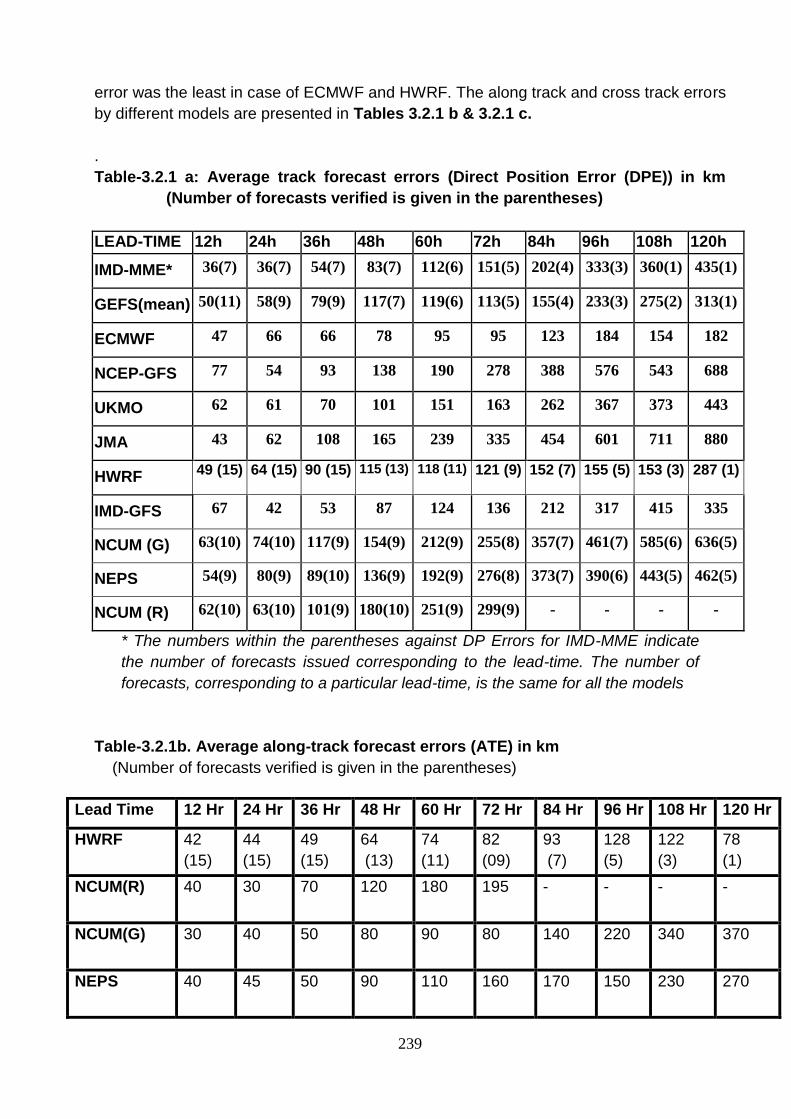
239
error was the least in case of ECMWF and HWRF. The along track and cross track errors
by different models are presented in Tables 3.2.1 b & 3.2.1 c.
.
Table-3.2.1 a: Average track forecast errors (Direct Position Error (DPE)) in km
(Number of forecasts verified is given in the parentheses)
LEAD-TIME 12h 24h 36h 48h 60h 72h 84h 96h 108h 120h
IMD-MME* 36(7) 36(7) 54(7) 83(7) 112(6) 151(5) 202(4) 333(3) 360(1) 435(1)
GEFS(mean) 50(11) 58(9) 79(9) 117(7) 119(6) 113(5) 155(4) 233(3) 275(2) 313(1)
ECMWF 47 66 66 78 95 95 123 184 154 182
NCEP-GFS 77 54 93 138 190 278 388 576 543 688
UKMO 62 61 70 101 151 163 262 367 373 443
JMA 43 62 108 165 239 335 454 601 711 880
HWRF 49 (15) 64 (15) 90 (15) 115 (13) 118 (11) 121 (9) 152 (7) 155 (5) 153 (3) 287 (1)
IMD-GFS 67 42 53 87 124 136 212 317 415 335
NCUM (G) 63(10) 74(10) 117(9) 154(9) 212(9) 255(8) 357(7) 461(7) 585(6) 636(5)
NEPS 54(9) 80(9) 89(10) 136(9) 192(9) 276(8) 373(7) 390(6) 443(5) 462(5)
NCUM (R) 62(10) 63(10) 101(9) 180(10) 251(9) 299(9) - - - -
* The numbers within the parentheses against DP Errors for IMD-MME indicate
the number of forecasts issued corresponding to the lead-time. The number of
forecasts, corresponding to a particular lead-time, is the same for all the models
Table-3.2.1b. Average along-track forecast errors (ATE) in km
(Number of forecasts verified is given in the parentheses)
Lead Time 12 Hr 24 Hr 36 Hr 48 Hr 60 Hr 72 Hr 84 Hr 96 Hr 108 Hr 120 Hr
HWRF 42
(15)
44
(15)
49
(15)
64
(13)
74
(11)
82
(09)
93
(7)
128
(5)
122
(3)
78
(1)
NCUM(R) 40 30 70 120 180 195 - - - -
NCUM(G) 30 40 50 80 90 80 140 220 340 370
NEPS 40 45 50 90 110 160 170 150 230 270

240
Table-3.2.1c Average cross-track forecast errors (CTE) in km
(Number of forecasts verified is given in the parentheses)
Lead Time 12 Hr 24 Hr 36 Hr 48 Hr 60 Hr 72 Hr 84 Hr 96 Hr 108 Hr 120 Hr
HWRF 74
(15)
92
(15)
111
(15)
140
(13)
133
(11)
121
(9)
90
(7)
104
(5)
85
(3)
94
(1)
NCUM(R) 25 30 40 100 130 185 - - - -
NCUM(G) 20 25 85 110 155 220 310 390 450 480
NEPS 10 50 40 95 130 200 300 360 370 320
3.2.4 Landfall forecast errors
Average model errors in landfall point and time are presented in Tables 3.2.2 (a &
b). The tables indicate that many models like NCEP GFS, JMA and NCUM didn’t predict
landfall till 0000 UTC of 15th May. Though the mean error of GEFS was high in the initial
run based on 00 UTC of 14th May, it reduced significantly from the next run (based on 12
UTC of 14th May onwards, signifying the importance of ensemble prediction system in
providing guidance nearly 72 hours in advance. The landfall point errors of ECMWF and
IMD GFS were significantly less as compared to other models. The landfall time errors
were the least by IMD HWRF upto 72 hours lead period.
Table-3.2.2(a): Landfall point forecast errors (km) of NWP Models at different lead time
(hour)
(‘NLF’ indicates No Landfall Forecast)
Forecast Lead
Time (hour) → 16.5 h (17/00)
28.5 h (16/12)
40.5 h (16/00)
52.5 h (15/12)
64.5 h (15/00)
76.5 h (14/12)
88.5 h (14/00)
IMD-GFS 33 43 47 47 155 197 251
GEFS (mean) 44 50 32 15 68 98 501
ECMWF 00 00 41 15 10 172 96
NCEP GFS 00 15 86 267 NLF NLF NLF
UKMO 10 00 33 74 116 NLF 219
JMA 33 62 119 NLF NLF NLF NLF
NCUM(R) 10.4 9.6 80.7 NLF NLF NLF NLF
NCUM(G) 67.8 59.3 51.8 36.4 141.2 NLF NLF
NEPS 64.9 26.2 24.5 317.7 153.1 NLF NLF
IMD-MME 00 00 33 33 319 214 327
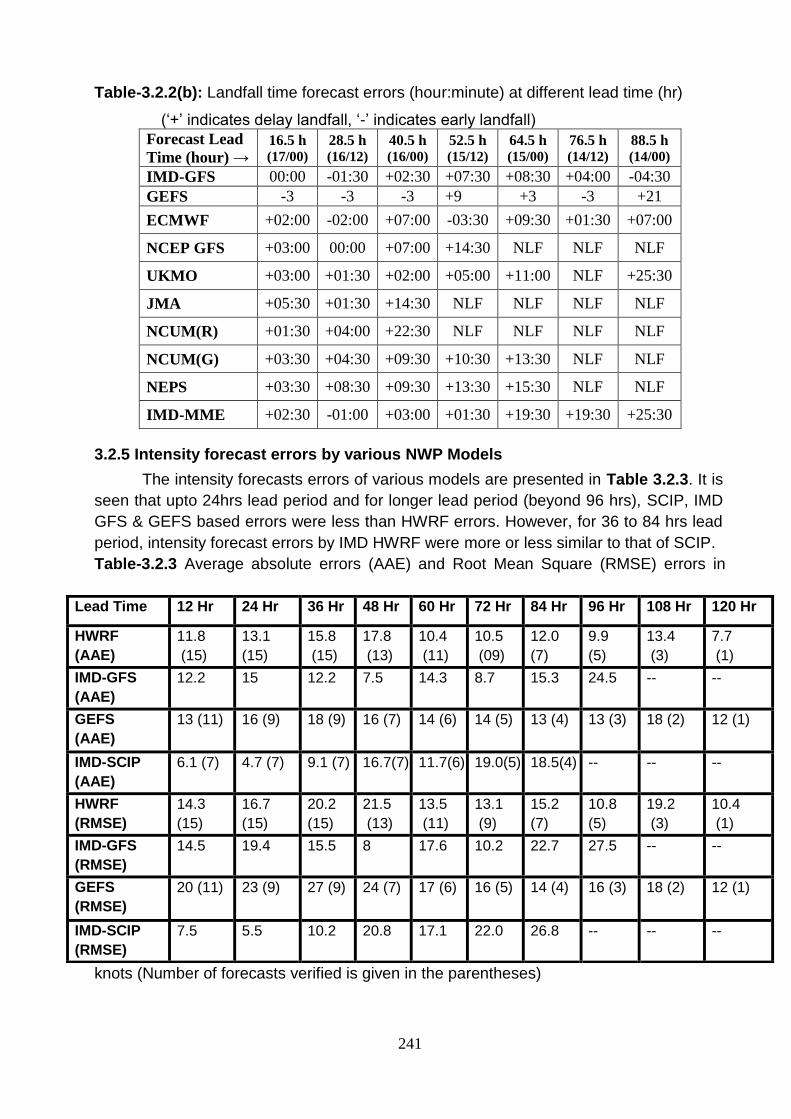
241
Table-3.2.2(b): Landfall time forecast errors (hour:minute) at different lead time (hr)
(‘+’ indicates delay landfall, ‘-’ indicates early landfall)
Forecast Lead
Time (hour) → 16.5 h (17/00)
28.5 h (16/12)
40.5 h (16/00)
52.5 h (15/12)
64.5 h (15/00)
76.5 h (14/12)
88.5 h (14/00)
IMD-GFS 00:00 -01:30 +02:30 +07:30 +08:30 +04:00 -04:30
GEFS -3 -3 -3 +9 +3 -3 +21
ECMWF +02:00 -02:00 +07:00 -03:30 +09:30 +01:30 +07:00
NCEP GFS +03:00 00:00 +07:00 +14:30 NLF NLF NLF
UKMO +03:00 +01:30 +02:00 +05:00 +11:00 NLF +25:30
JMA +05:30 +01:30 +14:30 NLF NLF NLF NLF
NCUM(R) +01:30 +04:00 +22:30 NLF NLF NLF NLF
NCUM(G) +03:30 +04:30 +09:30 +10:30 +13:30 NLF NLF
NEPS +03:30 +08:30 +09:30 +13:30 +15:30 NLF NLF
IMD-MME +02:30 -01:00 +03:00 +01:30 +19:30 +19:30 +25:30
3.2.5 Intensity forecast errors by various NWP Models
The intensity forecasts errors of various models are presented in Table 3.2.3. It is
seen that upto 24hrs lead period and for longer lead period (beyond 96 hrs), SCIP, IMD
GFS & GEFS based errors were less than HWRF errors. However, for 36 to 84 hrs lead
period, intensity forecast errors by IMD HWRF were more or less similar to that of SCIP.
Table-3.2.3 Average absolute errors (AAE) and Root Mean Square (RMSE) errors in
knots (Number of forecasts verified is given in the parentheses)
Lead Time 12 Hr 24 Hr 36 Hr 48 Hr 60 Hr 72 Hr 84 Hr 96 Hr 108 Hr 120 Hr
HWRF
(AAE)
11.8
(15)
13.1
(15)
15.8
(15)
17.8
(13)
10.4
(11)
10.5
(09)
12.0
(7)
9.9
(5)
13.4
(3)
7.7
(1)
IMD-GFS
(AAE)
12.2 15 12.2 7.5 14.3 8.7 15.3 24.5 -- --
GEFS
(AAE)
13 (11) 16 (9) 18 (9) 16 (7) 14 (6) 14 (5) 13 (4) 13 (3) 18 (2) 12 (1)
IMD-SCIP
(AAE)
6.1 (7) 4.7 (7) 9.1 (7) 16.7(7) 11.7(6) 19.0(5) 18.5(4) -- -- --
HWRF
(RMSE)
14.3
(15)
16.7
(15)
20.2
(15)
21.5
(13)
13.5
(11)
13.1
(9)
15.2
(7)
10.8
(5)
19.2
(3)
10.4
(1)
IMD-GFS
(RMSE)
14.5 19.4 15.5 8 17.6 10.2 22.7 27.5 -- --
GEFS
(RMSE)
20 (11) 23 (9) 27 (9) 24 (7) 17 (6) 16 (5) 14 (4) 16 (3) 18 (2) 12 (1)
IMD-SCIP
(RMSE)
7.5 5.5 10.2 20.8 17.1 22.0 26.8 -- -- --

242
Intensity forecast by IMD Statistical Cyclone Intensity Prediction (SCIP) model is
presented in Fig. 19. The SCIP model is developed by applying multiple linear integration
technique by using the predictors viz., initial storm intensity, intensity changes in past 12
hours, storm motion speed, initial position, vertical wind shear averaged along the storm
track, vorticity at 850 hPa, divergence at 200 hPa & SST. The AAE & RMSE thus
calculated shows that it was less than or equal to 10 knots upto a lead time of 36 hours
and higher with increase in lead time. Based on the initial conditions of 00 UTC of 16th,
the intensity predicted by the SCIP model was very close to the observed intensity.
Fig.3.2.4: Intensity forecast based on 0000 and 1200 UTC during 14th May to 17th
May of IMD SCIP model
The mean absolute error in Minimum SLP (MSPE in hPa) and (MSWE in kt) for NCUM
(G), NCUM(R) & NEPS are shown in Figure 20. Minimum average error in Min SLP in
model analyses is evident in NCUM-G whereas the least error is seen at higher lead
times (>36 h) in NEPS-G. Error in MSW by all the models are relatively higher ( <= 72 h)
than in Min SLP.
Fig.3.2.5: Intensity forecast errors by NCUM (Global & Regional) and NEPS
2021051412
2021051500
2021051512
2021051600
2021051612
2021051700
2021051712
0
20
40
60
80
100
120
OBSERVED vs SCIP INTENSITY (TAUKTAE)
OBSERVED
2021051400
2021051412
2021051500
2021051512
2021051600
2021051612
2021051700
Lead-time(h)
Inte
nsi
ty (
Knot
)

243
3.3 Very Severe Cyclonic Storm “YAAS’ (23rd – 28th May, 2021)
3.3.1 Prediction of Cyclogenesis (Genesis Potential Parameter (GPP) for YAAS The predicted zone of cyclogenesis for 0000 UTC of 23rd May based on forecast
during 18th -23rd May 2021 is presented in Fig. 3.3.1(a-f). It indicates that GPP could
forecast the potential zone over eastcentral BoB since 18th May.
Fig.3.3.1 (a-f): Predicted zone of cyclogenesis for 0000 UTC of 23rd May based
on forecast during 18th -23rd May 2021
IMD also runs operationally dynamical statistical models. The dynamical statistical
models have been developed for (a) Cyclone Genesis Potential Parameter (GPP), (b) Multi-
Model Ensemble (MME) technique for cyclone track prediction, (c) Cyclone intensity
prediction, (d) Rapid intensification and (e) Predicting decay in intensity after the landfall.
Genesis potential parameter (GPP) is used for predicting potential of cyclogenesis (T3.0)
and forecast for potential cyclogenesis zone. The multi-model ensemble (MME) for
predicting the track (at 12h interval up to 120h) of tropical cyclones for the Indian Seas is
developed applying multiple linear regression technique using the member models IMD-
GFS, UKMO, GFS (NCEP), ECMWF and JMA. The SCIP model is used for 12 hourly
intensity predictions up to 72-h and a rapid intensification index (RII) is developed and
(c)

244
implemented for the probability forecast of rapid intensification (RI). Decay model is used for
prediction of intensity after landfall.
Since all low-pressure systems do not intensify into cyclones, it is important to identify the potential of intensification (into cyclone) of a low pressure system at the early stages (T No. 1.0, 1.5, 2.0) of development. Conditions for (i) Developed system: Threshold value of average GPP ≥ 8.0 and (ii) non-developed system: Threshold value of GPP < 8.0. The analysis and forecasts of GPP based on 00 UTC of 23rd May 2021 (Fig. 3.3.2 (a)) shows that the "LOW" over the Bay of Bengal has potential to intensify into a tropical cyclone and on 12 UTC of 23rd May 2021 (Fig. 3.3.2 (b)) shows that the "DEPRESSION" over the Bay of Bengal has potential to intensify into a tropical cyclone.
Fig.3.3.2. Area average analysis of Genesis Potential Parameter (GPP) based
on (a) 00 UTC of 23rd May, 2021 (b) 12 UTC of 23rd May, 2021

245
3.3.2 Track prediction by NWP models
Track prediction by various NWP models is presented in Fig.3.3.3. Based on
initial conditions of 0000 UTC of 23rd May, most of the models indicated north-
northwestwards movement towards Odisha coast and crossing near actual
21°N/87°E between 0600 UTC to 1800 UTC of 26th May. However HWRF indicated
crossing over West Bengal coast. Actually, the system crossed Odisha coast near
21.35°N/86.95°E around 0600 UTC of 26th May.
Fig. 3.3.3 (a) Individual-tracks for tropical cyclone “YAAS” based on 0000 UTC of 23rd May 2021

246
Based on initial conditions of 1200 UTC of 23rd May, most of the models
indicated north-northwestwards movement and landfall over north Odisha coast
except HWRF which indicated landfall over West Bengal coast.
Fig 3.3.3(b): Individual-tracks for tropical cyclone “YAAS” based on 1200 UTC of 23rd May 2021

247
Based on initial conditions of 0000 UTC of 24th May, most of the models indicated
north-northwestwards movement and landfall over north Odisha coast except
bHWRF which indicated landfall over West Bengal coast.
Fig 3.3.3 c: Individual-tracks for tropical cyclone “YAAS” based on 0000 UTC of 24th
May 2021

248
Based on initial conditions of 1200 UTC of 24rd May, most of the models indicated
north-northwestwards movement and landfall over north Odisha coast except
bHWRF which indicated landfall over West Bengal coast.
Fig. 3.3.3d: Individual-tracks for tropical cyclone “YAAS” based on 1200 UTC of 24th
May 2021

249
Based on initial conditions of 0000 UTC of 25th May, most of the models indicated
north-northwestwards movement and landfall over north Odisha coast.
Fig. 3.3.3e: Individual-tracks for tropical cyclone “YAAS” based on 0000 UTC of 25th May 2021

250
Based on initial conditions of 1200 UTC of 25th May, most of the models indicated
north-northwestwards movement and landfall over north Odisha coast.
3.3.3 Track forecast errors by various NWP Models
The average track forecast errors (Direct Position Error) in km at different lead period (hr) of various models are presented in Table 3.3.1. From the verification of the forecast guidance available from various NWP models, it is found that the performed better in track forecast for 24 and 48 hrs and ECMWF for 72 and 96 hrs. Table-3.3.1. Average track forecast errors (Direct Position Error (DPE)) in km (Number of forecasts verified is given in the parentheses)
LEAD-TIME 12h 24h 36h 48h 60h 72h 84h 96h 108h
IMD-MME* 33(6) 48(6) 43(6) 48(6) 81(5) 103(4) 114(3) 147(2) 157(1)
ECMWF 55 88 65 61 84 100 90 89 39
Fig. 3.3.3 f: Individual-tracks for tropical cyclone “YAAS” based on 1200 UTC of 25th
May 2021

251
NCEP-GFS 72 70 65 92 119 151 175 196 282
UKMO 37 66 63 56 68 103 136 208 168
JMA-25 55 36 41 75 139 168 206 228 298
IMD-GFS 72 81 88 134 181 216 163 174 173
HWRF 54 (13) 56 (13) 86 (13) 141 (11) 183 (9) 218 (7) 242 (5) 257 (3) 246 (1)
NCUM 34(8) 47(8) 66(8) 99(9) 106(8) 129(7) 161(7) 169(7) 205(6)
NEPS 53(8) 51(9) 58(9) 78(10) 106(9) 124(8) 169(7) 190(6) 216(5)
GEFS 53(10) 63(9) 78(8) 136(7) 171(5) 205(4) 184(3) 170(2) 211(1)
ENS_MEAN 44(10) 45(9) 50(8) 115(7) 170(5) 181(4) 194(3) 215(2) 240(1)
* The numbers within the parentheses against DP Errors for IMD-MME indicate the number of forecasts issued corresponding to the lead-time. The number of forecasts, corresponding to a particular lead-time, is the same for all the models.
3.3.4 Intensity forecast errors by various NWP Models
The intensity forecasts of IMD-SCIP model and HWRF model are shown in Table 3.3.2. It is found that errors were higher for HWRF followed by GEFS upto 72 hrs. Table 3.3.2: Table- Average absolute errors (AAE) and Root Mean Square (RMSE)
errors in knots of SCIP model (Number of forecasts verified is given in the parentheses)
LEAD-TIME 12h 24h 36h 48h 60h 72h 84h 96h 108h
IMD-SCIP AAE
5.5(6) 3.3(6) 6.2(6) 5.5(6) 6.6(5) 3.2(4)
IMD-HWRF AAE
13.8 (13) 13.7 (13) 9.8 (13) 10.1 (11) 12.1 (9) 18.7 (7) 22.2 (5) 26.7 (3) 21.0 (1)
GEFS CNTL AAE
-2(10) -5(9) 5(8) -6(7) 1(5) 10(4) 18(3) 10(2) 7(1)
GEFS ENS_MEAN
AAE -1(10) -5(9) 5(8) -2(7) 1(5) 7(4) 12(3) 10(2) 7(1)
IMD-SCIP RMSE
5.7 3.7 7.8 7.7 11.0 4.7
IMD-HWRF RMSE
15.8 (13) 17.2 (13) 12.2 (13) 11.3 (11) 14.3 (9) 21.0 (7) 25.8 (5) 27.2 (3) 21.0 (1)
GEFS CNTL RMSE
5(10) 5(9) 4(8) 4(7) 4(5) 11(4) 12(3) 7(2) 7(1)
GEFS ENS_MEAN
RMSE 14(10) 14(9) 11(8) 8(7) 8(5) 14(4) 12(3) 10(2) 7(1)

252
3.3.5 Landfall forecast errors by various NWP Models
From Table 3.3.3(a), it is found that the ECMWF model performed better.
Table-3.3.3 a. Landfall point forecast errors (km) of NWP Models at different lead time
hour)
(‘NLF’ indicates No Landfall Forecst)
Forecast Lead Time (hour) →
5.5 h (25/12)
17.5 h (25/00)
29.5 h (24/12)
41.5 h (24/00)
53.5 h (23/12)
65.5 h (23/00)
ECMWF 07 08 17 07 126 16
NCEP GFS 07 50 52 39 63 63
UKMO 07 16 54 46 92 08
JMA 46 28 07 85 31 59
IMD-GFS 07 28 109 07 69 59
IMD-MME 07 28 07 07 63 08
HWRF LANDFALL POINT
71 63 39 18 125 153
GEFS LANDFALL POINT_CNTL
32 18 38 101 14 79
GEFS LANDFALL POINT_MEAN
25 16 13 77 35 130
Table-3.3.3 b. Landfall time forecast errors (hour:minute) at different lead time (hr)
(‘+’ indicates delay landfall, ‘-’ indicates early landfall)
Forecast Lead Time (hour) →
5.5 h (25/12
)
17.5 h (25/00)
29.5 h (24/12)
41.5 h (24/00)
53.5 h (23/12)
65.5 h (23/00)
ECMWF 00:30 01:30 06:00 07:00 -05:00 00:30
NCEP GFS 00:30 -05:00 03:00 06:30 06:30 00:30
UKMO 03:30 06:00 01:30 00:30 03:30 13:30
JMA 00:30 -00:30 00:30 00:30 06:30 24:30
IMD-GFS -04:30 -05:00 -00:30 12:30 00:30 12:30
IMD-MME 00:30 01:30 04:30 06:30 -02:30 06:30
HWRF LANDFALL TIME 0 0 +9 +9 +9 +6
GEFS LANDFALL TIME_CNTL
0 0 -6 +1 +12 +9
GEFS LANDFALL TIME_MEAN
0 0 0 -6 +12 +6

253
3.3.6: Heavy rainfall and mean wind forecast by IMD HWRF
Fig. 3.3.4: (a) SWATH 10m WIND and SWATH RAIN (b) CORE Domain – (2km) –
700-500 hPa RH , GEO Ht. & 700 mb Winds based on HWRF model
Fig. 3.3.5 (b) ISOTACHS and (h) ISOTHERMS – Cross section (E-W) (N-S) based on
HWRF model
Fig.3.3.5(a) shows the rainfall and wind swath and Fig.3.3.5(b) shows the vertical
structure of wind and temperature analyses at the time of landfall based on HWRF
model.

254
3.4 Cyclonic Storm GULAB over Bay of Bengal (24–28th September 2021)
3.4.1 Prediction of cyclogenesis(Genesis Potential Parameter (GPP)) for CS GULAB
Fig. 3.4.1 (a-d) shows the analysis and forecast fields of GPP based on 0000 UTC of 25th September. It indicates the potential zone of cyclogenesis over eastcentral BoB with gradual
westwards movement towards south Odisha-north Andhra Pradesh coasts.
Fig.3.4.1 (a-d): Predicted zone of cyclogenesis based on 0000 UTC of 25th
September, 2021
Since all low pressure systems do not intensify into cyclones, it is important to identify the
potential of intensification (into cyclone) of a low pressure system at the early stages (T No. 1.0,
1.5, 2.0) of development. Average GPP ≥ 8.0 is the threshold value for the system to develop
into a CS and average GPP < 8.0 indicates a non-developing system. The area average
analysis of GPP based on 0000 UTC of 25th Sept is presented in Fig. 3.4.2. The area average
analysis predicted the system to develop into a CS from 0000 UTC run of 25th September.
Fig. 3.4.2: Area average analysis and forecasts of GPP based on 0000 UTC of 25.09.2021.

255
3.4.2 Track prediction by NWP models
Tracks predicted by various NWP models including IMD GFS, IMD MME, IMD HWRF, WRF-
VAR, NCMRWF Unified Model (NCUM), UM Regional, NCMRWF Ensemble Prediction System
(NEPS), NCEP GFS, ECMWF, UKMO and JMA during 25th to 26th Sept are presented in
Fig.3.4.3. Based on initial conditions of 0000 UTC of 25th Sept, all the models were indicating
landfall over south Odisha-north Andhra Pradesh coasts. However, there was large variation
among the models with respect to landfall point and time with ECMWF, UKMO, JMA, MME
indicating landfall between Visakhapatnam and Gopalpur. GEFS control and mean tracks were
indicating landfall over south Odisha close to Gopalpur and north coastal Andhra Pradesh
respectively. HWRF (HYCOM) indicated northward shift of track with landfall between Gopalpur
and Paradeep. Predicted landfall time also varied between 1200 UTC of 26th (IMD GFS, NCEP
GFS JMA, MME, HWRF) to 0000 UTC of 27th September (ECMWF, UKMO).
Fig. 3.4.3 (a): NWP model for tropical cyclone “GULAB” based on 0000 UTC of 25th Sept
2021

256
Based on initial conditions of 1200 UTC of 25th Sept, all the models except IMD GFS were
indicating landfall over north Andhra Pradesh coast. ECMWF and UKMO were indicating quite
south of the actual landfall and IMD GFS was not showing landfall. HWRF (HYCOM) indicated
landfall between Kalingapatnam and Gopalpur. MME predicted landfall near Kalingapatnam
around 1800 UTC of 26th. Predicted landfall timings also varied significantly between 1200 UTC
of 26th (NCEP GFS JMA, MME, HWRF) to 0000 UTC of 27th September (ECMWF, UKMO).
Fig. 3.4.3 (b): NWP model for tropical cyclone “GULAB” based on 1200 UTC of 25th Sept
2021

257
Based on initial conditions of 0000 UTC of 26th Sept, most of the models indicated landfall close
to Kalingatpatnam (ECMWF, UKMO, JMA, MME and HWRF). NCEP GFS and GEFS control
and mean runs were biased towards south. Landfall time varied between 1200 UTC & 1800
UTC of 26th September except NCEP GFS and JMA which showed around 0900 UTC of 26th
September.
Thus, overall MME picked up landfall point and time more correctly since 0000 UTC of 25th
September.
Fig. 3.4.3 (c): NWP model for tropical cyclone “GULAB” based on 0000 UTC of 26th Sept
2021

258
3.4.3 Track forecast errors
Average track forecast errors by various NWP models is presented in Table 3.4.1(a). For 24 hrs
lead period track forecast error was the least for IMD MME, followed by GEFS control, UKMO
and NCEP GFS. For 48 hrs lead period, the track forecast error was the least for NCEP GFS
followed by IMD GFS and JMA.
Table-3.4.1. Average track forecast errors (Direct Position Error (DPE)) in km (Number of
forecasts verified is given in the parentheses)
Lead time → 12h 24h 36h 48h
IMD-MME 60.4(3) 60.7(3) 46.1(3) 93.9(2)
ECMWF 74.8(3) 108.2(3) 103.3(3) 205.2(2)
NCEP-GFS 125.0(2) 80.6(1) 129.3(1) 17.5(1)
UKMO 89.8(3) 72.8(3) 83.0(3) 150.1(1)
JMA-25 103.1(3) 126.7(3) 164.0(2) 55.6(1)
IMD-GFS 91.9(3) 143.3(3) 173.0(1) 54.6(1)
HWRF 91 (9) 138 (9) 137 (9) 138 (7)
GEFS (CNTL) 75(6) 71(6) 95(5) 126(4)
GEFS (ENS_MEAN) 92(6) 91(5) 99(5) 106(4)
* The numbers within the parentheses against DP Errors indicate the number of forecasts
issued corresponding to the lead-time.
3.4.4. Landfall forecast errors by various NWP Models
The Landfall forecasts errors of various models are presented in Table 3.4.2. For 12 hours lead
period, the landfall point error was the least for GEFS followed by IMD GFS, NCEP GFS and
IMD MME. For 24 hours lead period, the landfall point error was the least for MME, JMA and
HWRF.
Table-3.4.2 Landfall point forecast errors (km) of NWP Models at different lead time (hour) (‘-’ indicates No Landfall Forecast)
Forecast Lead Time (hour) →
36 h (25/00)
24 h (25/12)
12 h (26/00)
ECMWF 162 315 71
NCEP GFS 155 - 24
UKMO 130 192 48
JMA 55 34 85
IMD-GFS 131 - 24

259
IMD-MME 77 11 24
HWRF 102 46 39
GEFS (CNTL) 156 153 15
GEFS (ENS_MEAN) 144 85 17
The Landfall time forecasts errors of various models are presented in Table 3.4.3. For 12 hours
lead period, the landfall time error was the least for IMD MME & ECMWF followed by UKMO,
HWRF and GEFS. For 24 hours lead period, the landfall time error was the least for GEFS,
followed by HWRF and MME.
Table-3.4.3. Landfall time forecast errors (hour) at different lead time (hr)
(‘+’ indicates delay landfall, ‘-’ indicates early landfall)
Forecast Lead Time
(hour) →
36 h
(25/00)
24 h
(25/12)
12 h
(26/00)
ECMWF 09:30 21:30 00:30
NCEP GFS -3.5 - -5.5
UKMO 09:30 09:30 01:30
JMA -7:30 -5:30 -4:30
IMD-GFS -8:30 - 3:30
IMD-MME -2:30 03:30 00:30
HWRF 69 3 3
GEFS (CNTL) -3 0 -3
GEFS (ENS_MEAN) -3 0 -3
3.4.5. Intensity forecast errors by various NWP Models
The intensity forecasts errors of various models are presented in Table 3.4.4. It
is seen that intensity prediction error was the least in case of IMD SCIP followed by
HWRF for different lead periods.
Table-3.4.4 Average absolute errors (AAE) and Root Mean Square (RMSE) errors in
knots of various models (Number of forecasts verified is given in the
parentheses)
Lead time → 12H 24H 36H 48H
IMD-SCIP (AAE) 3.0(3) 5.5(2) 7.0(2) 5.0(1)
IMD-SCIP (RMSE) 4.7 5.5 7.3 5.0
HWRF (AAE) 4.0 (9) 7.1 (9) 5.8 (9) 6.7 (7)
HWRF (RMSE) 4.9 (9) 8.4 (9) 7.8 (9) 9.2 (7)
GEFS CNTL (AAE) -12(6) -14(6) -18(5) -19(4)

260
GEFS CNTL (RMSE) 14(6) 16(6) 20(5) 21(4)
GEFS ENS_MEAN (AAE) -11(6) -15(5) -16(5) -16(4)
GEFS ENS_MEAN (RMSE) 12(6) 17(5) 18(5) 19(4)
Intensity forecast by IMD-SCIP model is presented in Fig. 3.4.4. It is seen that at 0000
UTC of 25th, IMD SCIP model underestimated the intensity of the system. At 1200 UTC,
it overestimated intensity for all lead periods. At 0000 UTC of 26th, correctly picked
intensity of the system.
Fig. 3.4.4: SCIP Intensity Forecast Error (GULAB)
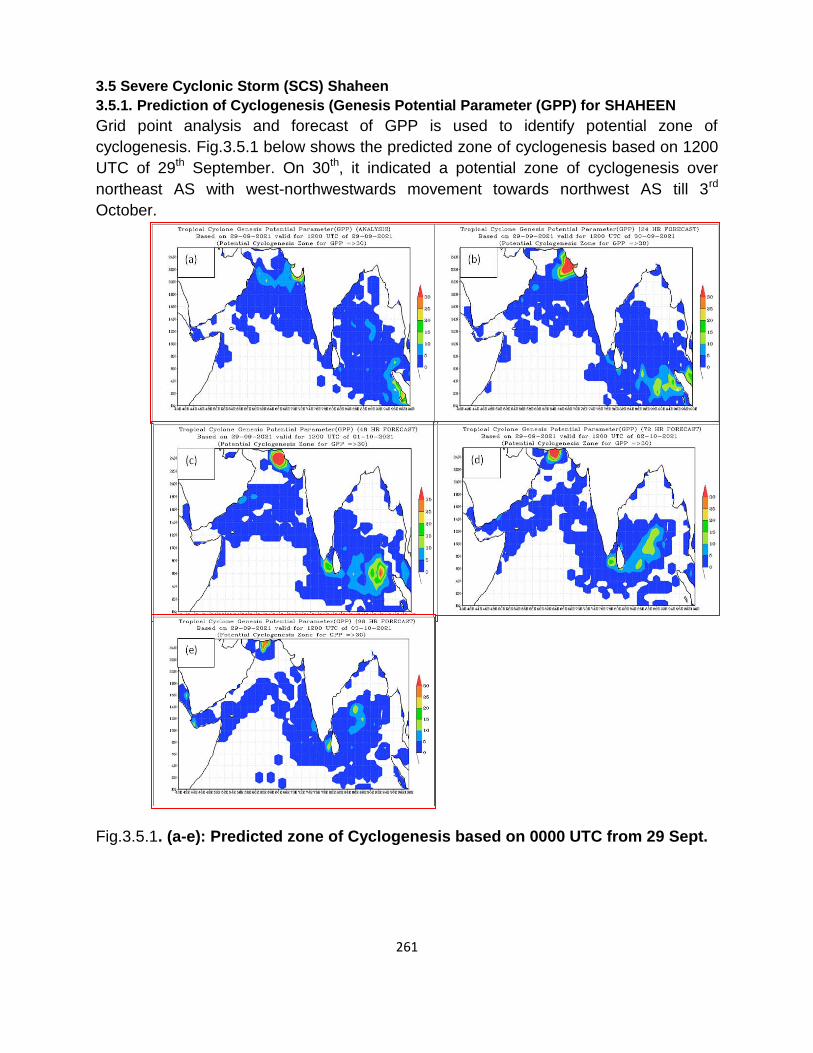
261
3.5 Severe Cyclonic Storm (SCS) Shaheen
3.5.1. Prediction of Cyclogenesis (Genesis Potential Parameter (GPP) for SHAHEEN
Grid point analysis and forecast of GPP is used to identify potential zone of
cyclogenesis. Fig.3.5.1 below shows the predicted zone of cyclogenesis based on 1200
UTC of 29th September. On 30th, it indicated a potential zone of cyclogenesis over
northeast AS with west-northwestwards movement towards northwest AS till 3rd
October.
Fig.3.5.1. (a-e): Predicted zone of Cyclogenesis based on 0000 UTC from 29 Sept.

262
3.5.2. Track prediction by NWP models
Track prediction by various NWP models is presented in Fig.3.5.2 (a-d). Based on initial
conditions of 0000 UTC of 30th September, most of the models indicated near west-
northwestwards movement away from Gujarat coasts. There was large divergence
among the models wrt point and time of landfall to Pakistan. ECMWF, JMA and IMD
GFS predicted weakening over sea with ECMWF indicating system to reach very close
to Pakistan-Iran border around 1200 UTC of 2nd October. UKMO, MME and HWRF
predicted landfall with UKMO and MME predicted landfall over southwest Pakistan and
HWRF indicating double landfall over Pakistan and eastwards recurvature. MME
predicted peak intensity of 60 knots at 0000 UTC of 2nd, while HWRF predicted peak
intensity of 55 knots at 1200 UTC of 1st October.
Fig.3.5.2. (a): NWP model track forecast based on 0000 UTC of 30th September, 2021

263
Based on initial conditions of 0000 UTC of 1st October, most of the models indicated
near west-northwestwards movement away from Gujarat coasts. However, some
models like ECMWF, NCEP GFS, MME and HWRF also indicated southwestwards
recurvature. MME, NCEP GFS & HWRF indicated crossing over north Oman and
ECMWF indicating weakening over Gulf of Oman close to north Oman. UKMO indicated
crossing over Iran and re-emergence into northwest AS with gradual weakening over
Gulf of Oman. MME predicted peak intensity of 60 knots at 0000 UTC of 2nd, while
HWRF predicted peak intensity of 70 knots at 1200 UTC of 3rd October.
Fig. 3.5.2. (b): NWP model track forecast based on 0000 UTC of 01.10.2021
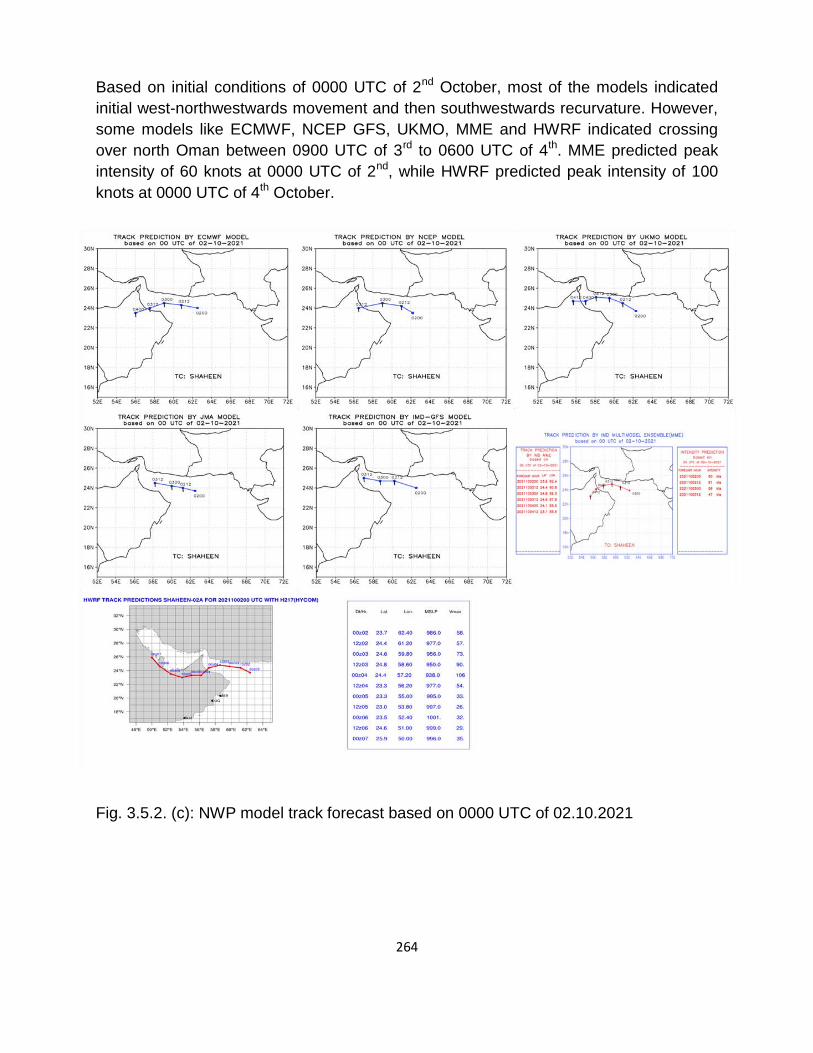
264
Based on initial conditions of 0000 UTC of 2nd October, most of the models indicated
initial west-northwestwards movement and then southwestwards recurvature. However,
some models like ECMWF, NCEP GFS, UKMO, MME and HWRF indicated crossing
over north Oman between 0900 UTC of 3rd to 0600 UTC of 4th. MME predicted peak
intensity of 60 knots at 0000 UTC of 2nd, while HWRF predicted peak intensity of 100
knots at 0000 UTC of 4th October.
Fig. 3.5.2. (c): NWP model track forecast based on 0000 UTC of 02.10.2021

265
Based on initial conditions of 0000 UTC of 3rd October, most of the models indicated
west- southwestwards movement and crossing over north Oman coast between 1200
UTC of 3rd and 0000 UTC of 4th October. However, some models like IMD GFS and
JMA indicated westwards movement and weakening over Gulf of Oman.
Fig. 3.5.2. (d): NWP model track forecast based on 0000 UTC of 03.10.2021
3.5.3 Errors by various NWP Models
3.5.3.1 Track forecast errors by various NWP Models
Average track forecast errors by various NWP models is presented in Table 3.5.1. For
24 hrs lead period the track forecast error were the least i.r.o. JMA, UKMO & MME
followed by IMD GFS, GEFS, ECMWF & HWRF. For 48 hrs lead period, the track

266
forecast error was the least i.r.o. JMA followed by MME and ECMWF. For 72 hours lead
period, the error was the least i.r.o. JMA followed by ECMWF and MME.
Table-3.5.1. Average track forecast errors (Direct Position Error (DPE)) in km (Number
of forecasts verified is given in the parentheses)
3.5.3.2 Landfall forecast errors by various NWP Models
Average landfall point forecast errors by various NWP models is presented in Table
3.5.2 a. For 24 hrs lead period the landfall point forecast errors were the least i.r.o.
GEFS followed by NCEP GFS and HWRF. For 48 hrs lead period, the landfall point
forecast errors were the least i.r.o. JMA followed by MME and HWRF. For 60 hours lead
period, the error were the least i.r.o. NCEP GFS & MME followed by GEFS and HWRF.
Table-3.5.2a. Landfall point forecast errors (km) of various NWP Models
Forecast Lead Time (hour) →
60 h (01/00z)
48 h (01/12z)
36 h (02/00z)
24 h (02/12z)
12 h (03/00z)
ECMWF - 23 10 69 0
NCEP GFS 23 46 65 55 -
UKMO - 105 127 75 23
JMA - - - - -
IMD-GFS - - - - -
IMD-MME 23 67 69 67 10
HWRF 97 95 81 59 40
LEAD-TIME 12h 24h 36h 48h 60h 72h
IMD-MME 26.4(7) 57.2(7) 86.9(6) 102.3(5) 131.0(4) 162.7(3)
ECMWF 45.4(7) 77.7(7) 89.9(6) 108.0(5) 133.0(4) 136.9(3)
NCEP-GFS 58.1(7) 90.1(7) 155.0(6) 131.9(5) 150.3(3) 199.7(2)
UKMO 28.5(7) 54.2(7) 81.5(6) 113.4(5) 167.1(4) 185.8(2)
JMA 47.5(7) 52.3(6) 46.7(5) 47.4(3) 71.5(2) 102.8(2)
IMD-GFS 48.0(7) 70.1(6) 108.5(5) 142.9(4) 158.7(3) 279.2(2)
HWRF 48 (16) 78 (14) 108 (12) 135 (10) 183 (8) 266.0 (6)
GEFS_CNTL 60(8) 71(7) 111(6) 139(5) 198(4) 267(3)
GEFS_ENS_M
EAN 47(8) 68(7) 90(6) 130(5) 168(4) 238(3)
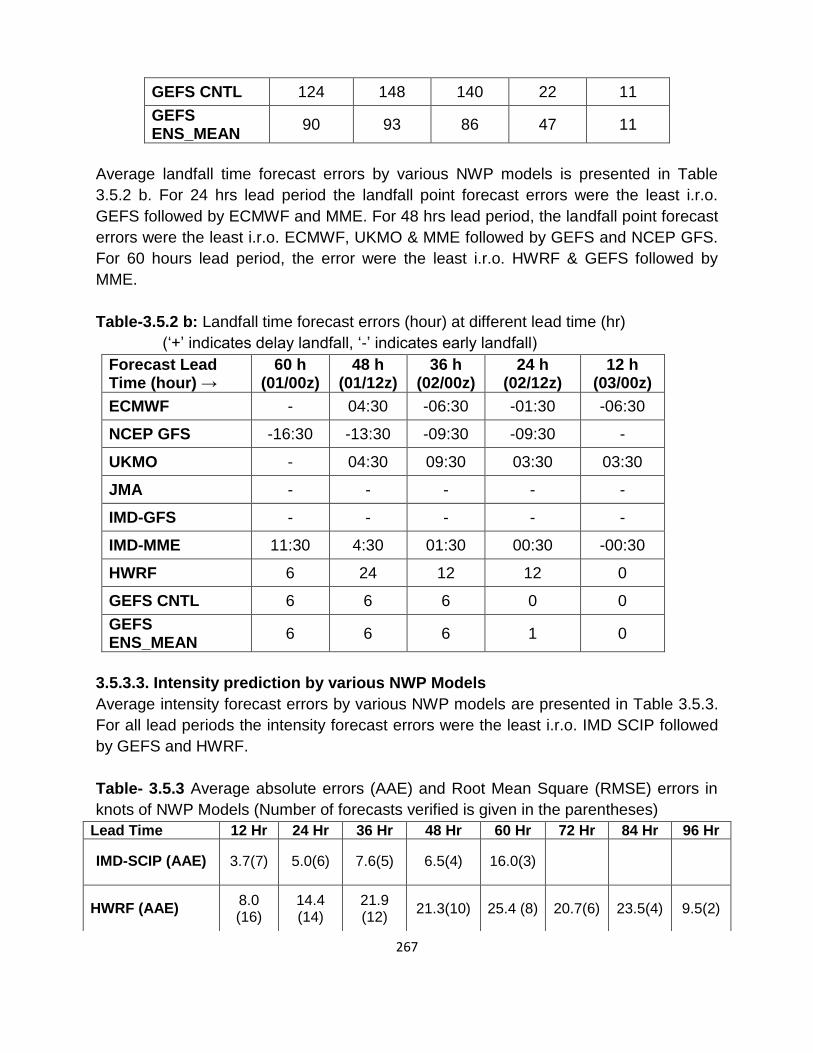
267
GEFS CNTL 124 148 140 22 11
GEFS ENS_MEAN
90 93 86 47 11
Average landfall time forecast errors by various NWP models is presented in Table
3.5.2 b. For 24 hrs lead period the landfall point forecast errors were the least i.r.o.
GEFS followed by ECMWF and MME. For 48 hrs lead period, the landfall point forecast
errors were the least i.r.o. ECMWF, UKMO & MME followed by GEFS and NCEP GFS.
For 60 hours lead period, the error were the least i.r.o. HWRF & GEFS followed by
MME.
Table-3.5.2 b: Landfall time forecast errors (hour) at different lead time (hr)
(‘+’ indicates delay landfall, ‘-’ indicates early landfall)
Forecast Lead Time (hour) →
60 h (01/00z)
48 h (01/12z)
36 h (02/00z)
24 h (02/12z)
12 h (03/00z)
ECMWF - 04:30 -06:30 -01:30 -06:30
NCEP GFS -16:30 -13:30 -09:30 -09:30 -
UKMO - 04:30 09:30 03:30 03:30
JMA - - - - -
IMD-GFS - - - - -
IMD-MME 11:30 4:30 01:30 00:30 -00:30
HWRF 6 24 12 12 0
GEFS CNTL 6 6 6 0 0
GEFS ENS_MEAN
6 6 6 1 0
3.5.3.3. Intensity prediction by various NWP Models
Average intensity forecast errors by various NWP models are presented in Table 3.5.3.
For all lead periods the intensity forecast errors were the least i.r.o. IMD SCIP followed
by GEFS and HWRF.
Table- 3.5.3 Average absolute errors (AAE) and Root Mean Square (RMSE) errors in
knots of NWP Models (Number of forecasts verified is given in the parentheses)
Lead Time 12 Hr 24 Hr 36 Hr 48 Hr 60 Hr 72 Hr 84 Hr 96 Hr
IMD-SCIP (AAE) 3.7(7) 5.0(6) 7.6(5) 6.5(4) 16.0(3)
HWRF (AAE) 8.0 (16)
14.4 (14)
21.9 (12)
21.3(10) 25.4 (8) 20.7(6) 23.5(4) 9.5(2)

268
3.5.3.4. HWRF based rainfall forecast
HWRF forecast of total rain swath for different forecast periods is presented in Fig.
3.5.3.
Fig. 3.5.3 IMD HWRF based total rain swath (cm) for different lead periods
GEFS CNTL (AAE)
-6(8) -6(7) -15(6) -15(5) -9(4) -13(3) -15(2) -15(1)
GEFS ENS_MEAN
(AAE) -8(8) -9(7) -12(6) -12(5) -13(4) -16(3) -19(2) -14(1)
IMD-SCIP
(RMSE) 4.8 6.9 8.8 9.2 16.0
HWRF (RMSE) 9.2 (16)
17.5 (14)
26.1 (12)
26.8 (10) 28.9 (8) 23.6 (6)
24.3 (4)
11.5 (2)
GEFS CNTL (RMSE)
10(8) 8(7) 18(6) 17(5) 13(4) 14(3) 23(2) 15(1)
GEFS ENS_MEAN
(RMSE) 10(8) 9(7) 14(6) 14(5) 15(4) 17(3) 22(2) 14(1)

269
3.6 Cyclonic Storm JAWAD (pronounced as JOWAD) (2 - 5 December 2021)
3.6.1 Prediction of cyclogenesis (Genesis Potential Parameter (GPP)) for JAWAD
Fig. 3.6.1 (a-i) indicates that the GPP could predict the potential zone for cyclogenesis on
2nd December since 25th Nov (about 168 hours in advance) over eastcentral BoB.
However, the location of genesis was predicted slightly northwards.
Fig. 3.6.1 (a-i): Predicted zone of cyclogenesis over the Bay of Bengal (168 hrs before its
formation at 1200 UTC of 02nd
December) based on 1200 UTC of 25th
Nov -02nd
Dec 2021.
(c)

270
Since all low pressure systems do not intensify into cyclones, it is important to
identify the potential of intensification (into cyclone) of a low pressure system at the early
stages (T No. 1.0, 1.5, 2.0) of development. Average GPP ≥ 8.0 is the threshold value for
system likely to develop into a cyclonic storm and average GPP < 8.0 indicates a non-
developing system. The area average analysis of GPP on 02nd December is presented in
Fig. 3.6.2. The area average analysis based on 00 & 12 UTC of 1st & 2nd December
predicted the system to maintain cyclonic storm intensity from 0000 UTC of 1st upto 5th
December. However, the analysis based on 0000 UTC of 3rd December predicted
cyclonic storm intensity upto 1200 UTC of 3rd only. Thus. On 3rd, it indicated early
weakening of system. The system actually maintained the intensity of cyclonic storm till
1200 UTC of 4th December.
Fig.3.6.2 (a-f) Area average analysis and forecasts of GPP based on (a) 0000 UTC of 01ST
Dec
(b) 1200 UTC of 01st Dec (c) 0000 of 02
nd Dec (d) 1200 UTC of 02
nd Dec (e) 0000
UTC of 03rd
Dec 2021

271
3.6.2 Track prediction by NWP models
Tracks predicted by various NWP models including ECMWF, NCEP GFS, IMD GFS, UKMO, JMA, IMD MME, IMD HWRF and GEFS during 02nd to 04th Dec are presented in Fig.3.6.3. Based on initial conditions of 1200 UTC of 02nd Dec, most of the models indicated initial northwest movement followed by gradual north-northeastwards recurvature towards north BoB. However, models like ECMWF, JMA, IMD GFS, HWRF and GEFS (control and mean) predicted landfall over south Odisha-north Andhra Pradesh coast. NCEP GFS, UKMO predicted weakening over northwest BoB. MME indicated that the system would cross Odisha coast marginally on 5th December. There was large spread among various ensemble members of GEFS. The model mean was biased towards east. Peak intensity predicted by HWRF was about 50 kts and that by SCIP was 45 kts. Thus, in the 1200 UTC run of 2nd December, about 5 out of 8 models were indicating the system to cross south Odisha-north Andhra Pradesh coast during 1200 to 2100 UTC of 4th December.
Fig.3.6.3 (a) NWP model for tropical cyclone “JAWAD” based on 1200 UTC of 02
nd Dec
2021

272
Based on initial conditions of 0000 UTC of 03rd Dec, a few more models like NCEP-GFS indicated weakening over sea. However, the forecasts by ECMWF, JMA, IMD GFS, HWRF and GEFS (control and mean) predicted landfall over south Odisha coast. MME indicated that the system would move touching Odisha coast on 5th December. There was large spread among various ensemble members of GEFS. The model mean was biased towards east. Peak intensity predicted by HWRF was about 50 kts and SCIP was about 45 kts. Thus, in the 0000 UTC run of 3rd December, about 5 out of 8 models were indicating the system to cross south Odisha coast during 1800 of 4th to 0600 UTC of 5th December.
Fig.3.6.3(b) NWP model for tropical cyclone “JAWAD” based on 0000 UTC of 03RD
Dec
2021

273
Based on initial conditions of 1200 UTC of 03rd Dec, NCEP-GFS indicated movement parallel to Odisha coast but slightly away and weakening over sea. All other models including ECMWF, UKMO, JMA, IMD GFS, HWRF and GEFS (control and mean) predicted landfall over Odisha coast. However, MME indicated that the system would touch Odisha coast near Puri-Paradip at 0000-0600 UTC of 5th December and recurve north-northeastwards thereafter. There was large spread among various ensemble members of GEFS. However, all members indicated crossing over Odisha coast except NCEP-GFS. Peak intensity predicted by HWRF was about 52 kts and SCIP was about 40 kts. .
Fig.3.6.3(c) NWP model for tropical cyclone “JAWAD” based on 1200 UTC of 03rd
Dec 2021

274
Based on initial conditions of 0000 UTC of 4th Dec, ECMWF, JMA and HWRF predicted landfall over Odisha coast near 200N around 1800 UTC of 5th. Rest of the models including UKMO, NCEP GFS, IMD GFS, MME indicated north-northeastwards recurvature with weakening over northwest BoB. There was large spread among various ensemble members of GEFS. However, all members indicated movement very close to Odisha coast except ECMWF, JMA, HWRF and GEFS which prected landfall over Odisha and movement along the coast. Both SCIP and HWRF indicated peak intensity of 40 kts.
Fig.3.6.3(d) NWP model for tropical cyclone “JAWAD” based on 0000 UTC of 04th
Dec 2021

275
Based on initial conditions of 1200 UTC of 4th Dec, all the models shifted the track north-northeastwards. Only HWRF indicated that the system would cross Odish and then West Bengal coast and JMA indicated the system to cross Odisha coast while ECMWF predicted it to touch Odisha coast while moving northeastwards. Ensemble member tracks also shifted north-northeastwards. Both SCIP and HWRF indicated peak intensity of 30 kts. Thus, in the 0200 UTC run of 4th December, most of the models (excluding ECMWF, HWRF and JMA) indicated north-northeastwards movement close to Odisha coast and weakening over sea
Fig.3.6.3(e) NWP model for tropical cyclone “JAWAD” based on 1200 UTC of 04th
Dec 2021

276
3.6.3 Track forecast errors
Average track forecast errors by various NWP models is presented in Table
3.6.1a. For 24 hrs lead period track forecast error was the least i.r.o. ECMWF followed by
NCUM (Global) and MME. For 48 hrs lead period, the track forecast error was the least
i.r.o. NCUM (Global) followed by UKMO and NEPS. For 72 hours lead period, the error
was the least i.r.o. IMD GFS followed by GEFS (Mean) and NCEP GFS. Thus, for longer
lead period GFS group of models error was the least.
Table-3.6.1a: Average track forecast errors (Direct Position Error (DPE)) in km
(Number of forecasts verified is given in the parentheses)
Lead time → 12H 24H 36H 48H 60H 72H
IMD-MME 45(5) 67(5) 80(4) 126(3) 72(2) 118(1)
ECMWF 31(5) 54(5) 89(4) 145(3) 92(2) 147(1)
NCEP-GFS 62(5) 81(5) 126(4) 165(3) 92(2) 92(1)
UKMO 74(5) 105(5) 92(4) 91(3) 88(2) 133(1)
JMA 75(5) 118(5) 142(4) 186(3) 241(2) 222(1)
IMD-GFS 57(5) 97(5) 153(4) 133(3) 169(2) 61(1)
NCUM(R) 100(6) 86(6) 154(6) 158(5) 196(4) 286(2)
NCUM (G) 58(6) 61(5) 93(6) 87(5) 82(4) 140(3)
NEPS 66(5) 85(6) 108(7) 102(6) 149(5) 185(4)
GEFS
(CNTL)
65(6) 95(5) 147(4) 158(3) 173(2) 113(1)
GEFS
(ENS_MEAN)
53(6) 84(5) 132(4) 154(3) 118(2) 89(1)
* The numbers within the parentheses against DP Errors for indicate the number
of forecasts issued corresponding to the lead-time. The number of forecasts,
corresponding to a particular lead-time, is the same for all the models
3.6.4. Intensity forecast errors by various NWP Models
The intensity forecasts errors of various models are presented in Table 3.6.2. It is
seen that intensity prediction errors were the least in case of GEFS followed by SCIP for
different lead periods.

277
Table-3.6.2. Average absolute errors (AAE) and Root Mean Square (RMSE) errors in
knots of various models (Number of forecasts verified is given in the
parentheses)
Lead time → 12H 24H 36H 48H 60H 72H 84H
SCIP (AAE) 3.6(5) 2.6(5) 5.0(5) 6.3(4) 4.3(3) 3.0(2) 2.0(1)
SCIP (RMSE) 3.9 3.3 7.6 7.9 4.7 3.6 2.0
NCUMR (AAE) 8.9 11.6 9.8 13.8 18.3 21.5
NUCMG (AAE) 4.7 4.4 6.5 7 6.3 9.7 15.5
GEFS CNTL
(AAE)
-2(6) 1(5) -4(4) -2(3) -7(2) -5(1)
GEFS ENS_MEAN (AAE)
-1(6) -1(5) -3(4) -4(3) -6(2) -3(1)
GEFS CNTL
(RMSE)
3(6) 4(5) 4(4) 6(3) 7(2) 5(1)
GEFS ENS_MEAN (RMSE)
1(6) 1(5) 2(4) 2(3) 4(2) 3(1)
Intensity forecast by IMD Statistical Cyclone Intensity Prediction (SCIP) model is
presented in Fig. 3.6.4(a). It is seen that for longer lead period (beyond 24 hours), there
was over estimation of the intensity of system.
Fig.3.6.4: Intensity forecast based on 0000 and 1200 UTC during 2nd to 4th
December
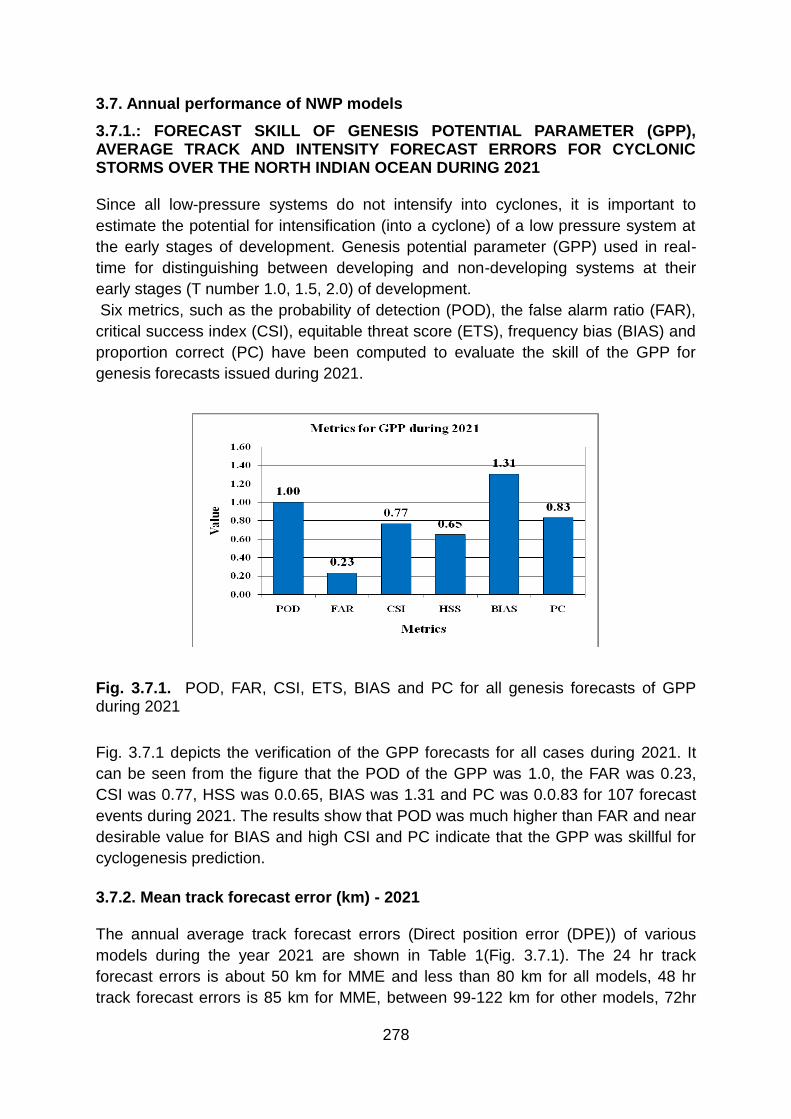
278
3.7. Annual performance of NWP models
3.7.1.: FORECAST SKILL OF GENESIS POTENTIAL PARAMETER (GPP), AVERAGE TRACK AND INTENSITY FORECAST ERRORS FOR CYCLONIC STORMS OVER THE NORTH INDIAN OCEAN DURING 2021 Since all low-pressure systems do not intensify into cyclones, it is important to
estimate the potential for intensification (into a cyclone) of a low pressure system at
the early stages of development. Genesis potential parameter (GPP) used in real-
time for distinguishing between developing and non-developing systems at their
early stages (T number 1.0, 1.5, 2.0) of development.
Six metrics, such as the probability of detection (POD), the false alarm ratio (FAR),
critical success index (CSI), equitable threat score (ETS), frequency bias (BIAS) and
proportion correct (PC) have been computed to evaluate the skill of the GPP for
genesis forecasts issued during 2021.
Fig. 3.7.1. POD, FAR, CSI, ETS, BIAS and PC for all genesis forecasts of GPP during 2021
Fig. 3.7.1 depicts the verification of the GPP forecasts for all cases during 2021. It
can be seen from the figure that the POD of the GPP was 1.0, the FAR was 0.23,
CSI was 0.77, HSS was 0.0.65, BIAS was 1.31 and PC was 0.0.83 for 107 forecast
events during 2021. The results show that POD was much higher than FAR and near
desirable value for BIAS and high CSI and PC indicate that the GPP was skillful for
cyclogenesis prediction.
3.7.2. Mean track forecast error (km) - 2021 The annual average track forecast errors (Direct position error (DPE)) of various
models during the year 2021 are shown in Table 1(Fig. 3.7.1). The 24 hr track
forecast errors is about 50 km for MME and less than 80 km for all models, 48 hr
track forecast errors is 85 km for MME, between 99-122 km for other models, 72hr

279
track forecast errors is 136 km for MME, between 110-231 km for all other models.
The 96 hr track forecast errors is about 260 km for MME, and between 146-424 km
for other models, and 120 h track forecast errors is 435 km for MME, and between
182-688 km other models. Consensus track forecast error of MME ranged from 37
km at 12h to 435 km at 120h. Year wise mean MME track forecast error (km) during
2009-2021 is shown in Fig 3.7.2 below.
Table-3.7.1: Annual average track forecast errors (DPE) of various models for the
year 2021 (Number of forecasts verified given in the parentheses)
Lead time
→ 12 hr 24 hr 36 hr 48 hr 60 hr 72 hr 84hr 96hr 108hr 120hr
MME 37(28) 52(28) 62(26) 85(23) 102(17) 136(13) 164(7) 258(5) 258(2) 435(1)
ECMWF 48(28) 76(28) 79(26) 100(23) 100(17) 110(13) 109(7) 146(5) 96(2) 182(1)
NCEP-GFS 72(27) 73(25) 109(24) 122(22) 148(16) 207(12) 297(7) 424(5) 413(2) 688(1)
IMD-GFS 64(28) 79(27) 97(23) 116(21) 154(16) 180(12) 191(7) 260(5) 294(2) 335(1)
UKMO 53(28) 70(28) 76(26) 99(23) 123(17) 144(12) 208(7) 304(5) 270(2) 443(1)
JMA 59(28) 72(27) 89(24) 118(20) 184(15) 231(12) 348(7) - - -
NCUMG 55(39) 66(39) 93(39) 114(37) 127(35) 166(30) 194(26) 224(23) 293(19) 357(15)
NEPSG 73(33) 79(34) 83(35) 96(33) 132(30) 164(25) 212(20) 252(15) 294(11) 361(9)
NCUMR 80(39) 98(39) 107(34) 138(35) 210(31) 265(28) - - - -
Fig. 3.7.2. Mean MME track forecast error (km) during 2021

280
Fig. 3.7.3. Year wise MME track forecast error (km) during 2009-2021 3.7.3 Mean Intensity forecast error (kt) -2021
(I) . SCIP model -2021 The annual average intensity forecast errors of SCIP model are shown in Table
3.7.2. The absolute average error (AAE) is 4.6 kts at 24h, 9.8 kts at 48h, 11.2 kts at
72h, 16.8 kts at 96 h and 22.0 kts at 108 h for all the cyclonic storms over the North
Indian Seas during the year 2021. Mean Intensity forecast error (kt) of SCIP model
during 2021 is shown in Fig.3.7.4. Year wise and mean intensity forecast error (kt) by
SCIP model during 2008-2021 for 12h to 120h forecasts are presented in Fig 3.7.5.
Fig. 3.7.4. Mean Intensity forecast error (kt) of SCIP model during 2021

281
Table-3.7.2: The annual average intensity forecast errors (kt) AAE and RMSE (root
mean square error) of SCIP for all the systems during 2021(Number of forecast
verified given in the parentheses)
Lead time →
12H 24H 36H 48H 60H 72H 84H 96H 108H
IMD-SCIP (AAE)
4.6 (28)
4.1 (26)
7.3 (24)
9.8 (21)
9.3 (14)
11.2 (10)
14.4 (7)
16.8 (5)
22.0 (2)
IMD-SCIP (RMSE)
5.6 5.2 8.8 13.8 13.8 15.8 21.4 23.2 28.4
Fig.3.7.5: Year wise intensity forecast error (kt) by SCIP model during 2008-2021 for 12h to 120 h forecasts The above analysis illustrates that CPS provided more robust guidance than most
other forms of guidance in TC forecasting over recent years in the NIO.
(II) Performance of NCMRWF Models during 2021
The performance of various models at NCMRWF models in predicting the intensity of
the systems during 2021 is presented in Table 3.7.3
Table 3.7.3 Mean Error in Intensity in terms of CP (hPa) and MSW (kt)
0 12 24 36 48 60 72 84 96 108 120
MSPE (hPa) NCUMG 4 5 6 7 6 6 6 7 11 16 20
NCUMR 3 4 6 9 12 12 12 14
MSWE (kt) NCUMG 7 7 8 8 8 10 10 10 15 21 22
NCUMR 13 11 13 13 16 16 16 14

282
CHAPTER-IV
PERFORMANCE OF RSMC, NEW DELHI
IN TRACK AND INTENSITY PREDICTION OF CYCLONES DURING 2021
4.1 Introduction
The Cyclone Warning Division/ Regional Specialized Meteorological Centre (RSMC)-
Tropical Cyclone, IMD, New Delhi mobilized all its resources for monitoring and prediction of
cyclonic disturbances over the north Indian Ocean during 2021. It issued 3 hourly forecast
and warning/advisory bulletins to various national and international disaster management
agencies including National Disaster Management (NDM), Ministry of Home Affairs (MHA),
concerned state Govt. and other users in regular intervals. It also issued advisories to World
Meteorological Organization (WMO)/Economic and Social Cooperation for Asia and the
Pacific (ESCAP) Panel member countries including Bangladesh, Myanmar, Thailand,
Pakistan, Oman, Sri Lanka, Maldives and Yemen during cyclone period. As tropical cyclone
advisory centre (TCAC), it also issued tropical cyclone advisories with effect from the stage
of deep depression for international civil aviation purpose as per the requirement of
international civil aviation organization (ICAO) to the Meteorological watch offices of Asia
Pacific region and middle east countries. The TCAC bulletin was also sent to Aviation
Disaster Risk Reduction (ADRR) centre of WMO at Hong Kong like previous years.
IMD continuously monitored, predicted cyclogenesis, track, intensity and structure of
cyclones. The genesis forecast in probabilistic term was issued from 01 June 2015. Bulletins
containing track & intensity forecast at +06, +12, +18, +24, +36, +48, +60, +72, +84, +96,
+108 and +120 hrs or till the system weakened into a low pressure area warning issued
regularly. The above structured track and intensity forecasts were issued from the stage of
deep depression onwards. The cone of uncertainty in the track forecast was also given for
all cyclones. The radius of maximum wind and radius of ≥ 34 kts, ≥ 50 kts and ≥ 64 kts wind
in four quadrants of cyclone was also issued for every six hours. The graphical display of the
observed and forecast track with cone of uncertainty and the wind forecast for different
quadrants were uploaded in the RSMC's website regularly. The storm surge guidance was
provided as and when required to the member countries of WMO/ESCAP Panel based on
IITD model. The prognosis and diagnosis of the systems were described in the special
tropical weather outlook and tropical cyclone advisory bulletins since 2008.
The statistics of bulletins issued by IMD, New Delhi with respect to cyclonic
disturbances is presented in sec.4.2. The performance of RSMC-New Delhi in track and
intensity prediction of the cyclones during 2021 are analysed and discussed in sec.4.3.
4.2 Bulletins issued by IMD
The following are the statistics of bulletins issued by IMD in association with the cyclonic
disturbances during 2021
Bulletins issued during „TAUKTAE‟
Bulletins for national disaster management agencies : 42
Bulletin for WMO/ESCAP Panel counties
(Special Tropical Weather Outlook and Tropical Cyclone Advisory) : 30
Tropical cyclone advisory for international civil aviation : 18
Bulletins issued during „YAAS‟

283
Bulletins for national disaster management agencies : 34
Bulletin for WMO/ESCAP Panel counties
(Special Tropical Weather Outlook and Tropical Cyclone Advisory) : 32
Tropical cyclone advisory for international civil aviation : 13
Bulletins issued during 'GULAB'
Bulletins for national disaster management agencies : 25
Bulletin for WMO/ESCAP Panel counties
(Special Tropical Weather Outlook and Tropical Cyclone Advisory) : 17
Tropical cyclone advisory for international civil aviation : 09
Bulletins issued during 'SHAHEEN'
Bulletins for national disaster management agencies : 34
Bulletin for WMO/ESCAP Panel counties
(Special Tropical Weather Outlook and Tropical Cyclone Advisory) : 30
Tropical cyclone advisory for international civil aviation : 15
Bulletins issued during 'JAWAD'
Bulletins for national disaster management agencies : 23
Bulletin for WMO/ESCAP Panel counties
(Special Tropical Weather Outlook and Tropical Cyclone Advisory) : 23
Tropical cyclone advisory for international civil aviation : 7
Bulletins issued for all cyclones during 2021
Bulletins for national disaster management agencies : 158
RSMC bulletin for WMO/ESCAP Panel member countries
(Special Tropical Weather Outlook and Tropical Cyclone Advisory) : 132
TCAC bulletin for international civil aviation : 62
The number of bulletins issued during 2009-2021 for all cyclones over the NIO is shown in
Fig.4.2.1 for comparison.
Fig 4.2.1: Total Number of bulletins issued by RSMC, New Delhi for all cyclones
during 2009-2021
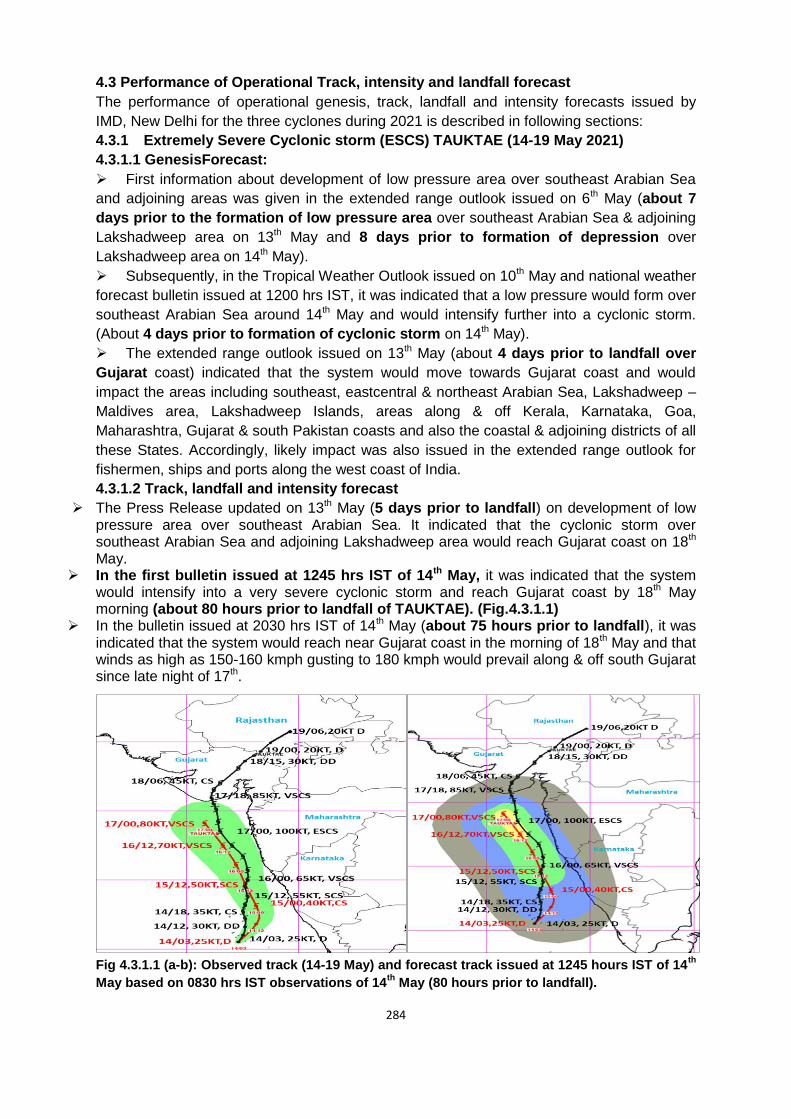
284
4.3 Performance of Operational Track, intensity and landfall forecast
The performance of operational genesis, track, landfall and intensity forecasts issued by
IMD, New Delhi for the three cyclones during 2021 is described in following sections:
4.3.1 Extremely Severe Cyclonic storm (ESCS) TAUKTAE (14-19 May 2021)
4.3.1.1 GenesisForecast:
First information about development of low pressure area over southeast Arabian Sea
and adjoining areas was given in the extended range outlook issued on 6th May (about 7
days prior to the formation of low pressure area over southeast Arabian Sea & adjoining
Lakshadweep area on 13th May and 8 days prior to formation of depression over
Lakshadweep area on 14th May).
Subsequently, in the Tropical Weather Outlook issued on 10th May and national weather
forecast bulletin issued at 1200 hrs IST, it was indicated that a low pressure would form over
southeast Arabian Sea around 14th May and would intensify further into a cyclonic storm.
(About 4 days prior to formation of cyclonic storm on 14th May).
The extended range outlook issued on 13th May (about 4 days prior to landfall over
Gujarat coast) indicated that the system would move towards Gujarat coast and would
impact the areas including southeast, eastcentral & northeast Arabian Sea, Lakshadweep –
Maldives area, Lakshadweep Islands, areas along & off Kerala, Karnataka, Goa,
Maharashtra, Gujarat & south Pakistan coasts and also the coastal & adjoining districts of all
these States. Accordingly, likely impact was also issued in the extended range outlook for
fishermen, ships and ports along the west coast of India.
4.3.1.2 Track, landfall and intensity forecast
The Press Release updated on 13th May (5 days prior to landfall) on development of low pressure area over southeast Arabian Sea. It indicated that the cyclonic storm over southeast Arabian Sea and adjoining Lakshadweep area would reach Gujarat coast on 18th May.
In the first bulletin issued at 1245 hrs IST of 14th May, it was indicated that the system would intensify into a very severe cyclonic storm and reach Gujarat coast by 18th May morning (about 80 hours prior to landfall of TAUKTAE). (Fig.4.3.1.1)
In the bulletin issued at 2030 hrs IST of 14th May (about 75 hours prior to landfall), it was indicated that the system would reach near Gujarat coast in the morning of 18th May and that winds as high as 150-160 kmph gusting to 180 kmph would prevail along & off south Gujarat since late night of 17th.
Fig 4.3.1.1 (a-b): Observed track (14-19 May) and forecast track issued at 1245 hours IST of 14th
May based on 0830 hrs IST observations of 14th
May (80 hours prior to landfall).

285
The landfall point & time was further updated in the bulletin issued at 0330 hours IST of 16th May (about 45 hours prior to landfall) that the system would reach Gujarat coast in the evening hours of 17th& cross Gujarat coast between Porbandar & Mahuva (Bhavnagar district) around 18th May early morning with wind speed of 150-160 kmph gusting to 180 kmph.
In the bulletin issued at 0815 hrs IST of 17th May (about 15 hours prior to landfall), the warnings were further specified and it was informed that the system would reach Gujarat coast in the evening hours of 17th & cross Gujarat coast between Porbandar & Mahuva (Bhavnagar district) during the night (2000 – 2300 hrs IST) of 17th May as a Very Severe Cyclonic Storm with a maximum sustained wind speed 155-165 kmph gusting to 185 kmph.
Actually, the extremely severe cyclonic storm TAUKTAE crossed Saurashtra coast close to about 20 km northeast of Diu near latitude 20.80N and longitude 71.10E during 2000-2300 hrs IST of 17th May with wind speed of 160-170 kmph gusting to 185 kmph.
Thus, the track, landfall point & time, intensity and associated adverse weather like heavy rainfall, gale wind and storm surge were well predicted by IMD.
Fig. 4.3.1.2 & 4.3.1.3 represent the observed and forecast track, intensity & landfall forecast issued at various lead times indicating accuracy in track, landfall and intensity forecast.
Fig.4.3.1.2 (a-b): Observed track (14-19 May) and forecast track issued at 1430 hours IST of 16th
May based on 1130 hrs IST observations of 16th
May (about 36 hours prior to landfall)
demonstrating accuracy in track, intensity and landfall.
Fig.4.3.1.3 (a-b): Observed track (14-19 May) and forecast track issued at 0830 hours IST of 17th
May based on 0530 hrs IST observations of 17th
May (about 15 hours prior to landfall)
demonstrating accuracy in track, intensity and landfall.
MSW(knot)/kmph) Impact Action
28-33 /(52–61 ) Very rough seas. Total suspension of fishing operations
34-40/(62-74) High to very high seas Total suspension of fishing operations
41-63/(75-117) Very High seas Total suspension of fishing operations
≥ 64 (≥118) Phenomenal Total suspension of fishing operations
DATE/TIME IN UTC, IST = UTC + 0530 HRS, D: DEPRESSION, DD: DEEP DEPRESSION, CS: CYCLONIC STORM, SCS: SEVERE CYCLONIC STORM, VSCS: VERY SEVERE CYCLONIC STORM, OBSERVED TRACK, FORECAST TRACK, CONE OFUNCERTAINTY

286
4.3.1.3 Operational Track, Intensity and Landfall Point & Time Forecast Errors:
The operational track, intensity and landfall errors as compared to long period average
errors during 2016-20 are presented in Fig. (4.3.1.4).
The track forecast errors for 24, 48 and 72 hrs lead period were 73, 118, and 224 km
respectively against the LPA errors of 77, 117, and 159 km respectively
The absolute error (AE) of intensity (wind) forecast for 24, 48 and 72 hrs lead period were
4.4, 8.9 and 15.5 knots against the LPA errors of 7.9, 11.4, and 14.1 knots during 2015-19
respectively.
The landfall point forecast errors for 24 and 48 hrs lead period were 27 and 71km
respectively against the LPA errors of 32 and 62 km during 2016-20 respectively.
The landfall time forecast errors for 24 and 48 hrs lead period were 3.5 and 6.5 hours
respectively against the LPA errors of 2.5 and 6.5 hours during 2016-20 respectively.
Fig. 4.3.1.4: Operational track, intensity and landfall errors of extremely severe
cyclonic storm Tauktae as compared to long period average errors during 2016-
2020

287
Table 4.3.1.1: Operational Track forecast errors and skill of ESCS „TAUKTAE” as
compared to long period average (2016-20)
*N: no. of observations verified
Table 4.3.1.2: Operational Absolute errors (AE) and Root Mean Square errors (RMSE)
and corresponding skill in intensity forecast of ESCS “TAUKTAE” as compared to
long period average (2016-20)
Table 4.3.1.3: Operational Landfall point and time forecast errors of ESCS “TAUKTAE”
as compared to long period average (2016-20)
Lead Period (hrs)
N
Operational Track
forecast error (km)
Error-cl
Operational Track
Forecast Skill (%)
Long Period Average Track Forecast Error (2016-20)
Track Forecast Error (km)
Track Forecast Skill
(%)
12 17 40 68 41.0 49 60
24 15 73 117 37.3 77 64
36 14 99 169 41.3 95 72
48 12 119 176 32.5 117 76
60 10 158 133 -18.2 137 76
72 8 223 120 -85.1 159 78
84 6 318 204 -55.5 197 77
96 4 388 296 -31.2 226 79
Lead Period (hrs)
N AE RMSE AE-
PERS RMSE-PERS
SKILL-AE
SKILL-RMSE
Long Period Average (2016-20)
AE RMSE Skill-AE
Skill-RMSE
12 17 3.6 5.7 11.8 16.2 69.7 64.8 5.0 6.5 36.5 35.9
24 15 4.4 6.4 23.7 36.0 81.3 82.2 7.9 9.9 52.2 51.8
36 14 7.9 10.4 36.1 57.1 78.0 81.7 10.9 12.5 68.0 56.9
48 12 8.9 11.8 60.8 80.8 85.3 85.4 11.4 13.8 72.1 64.1
60 10 8.7 11.4 60.0 75.4 85.5 84.9 12.7 14.9 73.3 69.8
72 8 15.5 22.8 71.3 82.3 78.3 72.3 14.1 16.7 75.1 73.0
84 6 25.9 29.9 95.0 100.5 72.7 70.2 15.8 18.6 76.7 76.0
96 4 21.1 22.6 100.0 100.6 78.9 77.5 17.0 19.9 76.7 77.2
Lead
Period
(hrs)
Base
date/Time
(UTC)
Forecast
Latitude
(Deg)
Forecast
Longitude
(Deg)
Actual
latitude
(Deg)
Actual
Longitude
(Deg)
OP-
LPE
(km)
Forecast
Time
(UTC)
Actual
Time
(UTC)
OP-
LTE
(hrs)
12 17/06 20.76 71.11 20.78 71.14 4.0 17/1730 17/1630 +1.0
24 16/18 20.74 70.9 20.78 71.14 26.8 17/2000 17/1630 +3.5
36 16/06 20.72 70.83 20.78 71.14 34.7 17/2200 17/1630 +7.5
48 15/18 20.88 70.5 20.78 71.14 71.3 17/2300 17/1630 +6.5
60 15/06 22 69.2 20.78 71.14 252.1 18/0930 17/1630 +17.0
72 14/18 22.24 69 20.78 71.14 285.0 18/0600 17/1630 +14.0
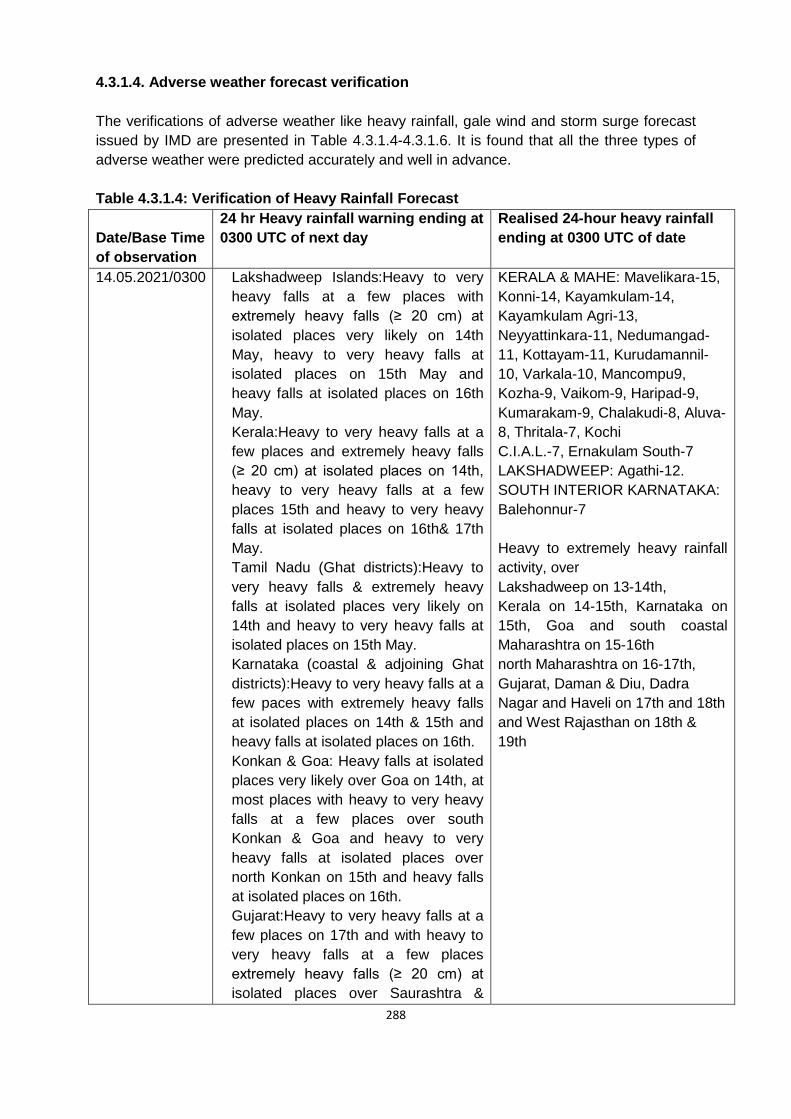
288
4.3.1.4. Adverse weather forecast verification
The verifications of adverse weather like heavy rainfall, gale wind and storm surge forecast
issued by IMD are presented in Table 4.3.1.4-4.3.1.6. It is found that all the three types of
adverse weather were predicted accurately and well in advance.
Table 4.3.1.4: Verification of Heavy Rainfall Forecast
Date/Base Time
of observation
24 hr Heavy rainfall warning ending at
0300 UTC of next day
Realised 24-hour heavy rainfall
ending at 0300 UTC of date
14.05.2021/0300 Lakshadweep Islands:Heavy to very
heavy falls at a few places with
extremely heavy falls (≥ 20 cm) at
isolated places very likely on 14th
May, heavy to very heavy falls at
isolated places on 15th May and
heavy falls at isolated places on 16th
May.
Kerala:Heavy to very heavy falls at a
few places and extremely heavy falls
(≥ 20 cm) at isolated places on 14th,
heavy to very heavy falls at a few
places 15th and heavy to very heavy
falls at isolated places on 16th& 17th
May.
Tamil Nadu (Ghat districts):Heavy to
very heavy falls & extremely heavy
falls at isolated places very likely on
14th and heavy to very heavy falls at
isolated places on 15th May.
Karnataka (coastal & adjoining Ghat
districts):Heavy to very heavy falls at a
few paces with extremely heavy falls
at isolated places on 14th & 15th and
heavy falls at isolated places on 16th.
Konkan & Goa: Heavy falls at isolated
places very likely over Goa on 14th, at
most places with heavy to very heavy
falls at a few places over south
Konkan & Goa and heavy to very
heavy falls at isolated places over
north Konkan on 15th and heavy falls
at isolated places on 16th.
Gujarat:Heavy to very heavy falls at a
few places on 17th and with heavy to
very heavy falls at a few places
extremely heavy falls (≥ 20 cm) at
isolated places over Saurashtra &
KERALA & MAHE: Mavelikara-15,
Konni-14, Kayamkulam-14,
Kayamkulam Agri-13,
Neyyattinkara-11, Nedumangad-
11, Kottayam-11, Kurudamannil-
10, Varkala-10, Mancompu9,
Kozha-9, Vaikom-9, Haripad-9,
Kumarakam-9, Chalakudi-8, Aluva-
8, Thritala-7, Kochi
C.I.A.L.-7, Ernakulam South-7
LAKSHADWEEP: Agathi-12.
SOUTH INTERIOR KARNATAKA:
Balehonnur-7
Heavy to extremely heavy rainfall
activity, over
Lakshadweep on 13-14th,
Kerala on 14-15th, Karnataka on
15th, Goa and south coastal
Maharashtra on 15-16th
north Maharashtra on 16-17th,
Gujarat, Daman & Diu, Dadra
Nagar and Haveli on 17th and 18th
and West Rajasthan on 18th &
19th

289
Kutch on 18th.
15.05.2021/0300 Lakshadweep Islands:Heavy to very
heavy falls at isolated places over
northern Islands on 15th May and
heavy falls at isolated places on 16th
May.
Kerala:Heavy to very heavy falls at a
few places and extremely heavy falls
at isolated places on 15th, heavy to
very heavy falls at isolated places on
16th and heavy falls at isolated places
on 17th May.
Tamil Nadu (Ghat districts):Heavy to
very heavy falls at isolated places on
15th May.
Karnataka (coastal & adjoining Ghat
districts):Heavy to very heavy falls at a
few paces and extremely heavy falls at
isolated places on 15th and heavy to
very heavy falls at isolated places on
16th.
Konkan & Goa: Heavy to very heavy
falls at a few places over south
Konkan & Goa and heavy to very
heavy falls at isolated places over
north Konkan on 15th and heavy to
very heavy falls at a few places over
Konkan & Goa & adjoining Ghat areas
on 16th and heavy falls at isolated
places on 17th May over north
Konkan.
Gujarat:Heavy to very heavy falls at
isolated places over Saurashtra &
Kutch and extremely heavy falls at
isolated places ( in Junagarh & Gir
Somnath Districts) on 17th and with
heavy to very heavy falls at a few
places over Saurashtra & Kutch with
extremely heavy falls (≥ 20 cm) at
isolated places (Porbandar,
Devbhoomi Dwarka, Jamnagar &
Kutch districts) on 18th.
West Rajasthan:Heavy to very heavy
falls at isolated places very likely on
18th & 19th May.
COASTAL KARNATAKA:
Mangaluru AP - 8, Panambur - 7,
Mangaluru-7,
KERALA & MAHE: Kochi-21,
Peermade-21, Kodungallur-20,
Enamakkal-19, Ernakulam
South-17, Kumarakam-16, Kannur-
16, Kollam-16, Alapuzha-16,
Chalakudi-15, Irinjalakuda15,
Ponnani-14, Pattambi-14, Vaikom-
14, Cherthala-13, Kozhikode-13,
Varkala-13,
Mancompu-13, Thritala-13,
Mavelikara-12, Aluva-12,
Kayamkulam-12, Kurudamannil-11,
Konni-11, Quilandi-11,
Perumpavur-11, Taliparamba-11,
Vellanikkara-11, Kochi C.I.A.L.-11,
Kottayam-11, Haripad-11,
Vadakkancherry-11, Kozha-11,
Kanjirappally-10, Munnar KSEB10,
Manjeri-10, Mahe-9,
Perinthalmanna-9, Vadakara-9,
Ottapalam-9, Punalur-9,
Talassery9, Hosdurg-9, Piravam-8,
Nilambur-8, Angadipuram-8, Vyttiri-
8, Karipur -7, Thodupuzha-7,
Kudulu-7, Neyyattinkara-7
LAKSHADWEEP: Agathi-10,
Amini-8
16.05.2021/0300 Kerala:Heavy to very to very heavy falls
at isolated places on 16th and heavy
falls at isolated places on 17th May.
KONKAN & GOA: Canacona-7,
Pernem-7
COASTAL KARNATAKA: Kollur-

290
Karnataka (coastal & adjoining Ghat
districts):Heavy to very heavy falls at
isolated places on 16th.
South Konkan & Goa: Heavy to very
heavy falls at a few places and
extremely heavy falls at isolated places
over south Konkan & Goa and adjoining
Ghat areas on 16th and heavy to very
heavy falls at isolated places on 17th
May.
North Konkan: Heavy to very heavy falls
at isolated places on 16th and 17th
May.
Gujarat:Heavy to very heavy falls at
isolated places over Saurashtra &
Kutch, Diu and southern most Gujarat
region with extremely heavy falls at
isolated places on 17th and with heavy
to very heavy falls at a few places over
Saurashtra & Kutch and Diu & south
Gujarat region with extremely heavy
falls (≥ 20 cm) at isolated places on
18th.
Rajasthan:Heavy to very heavy falls &
extremely heavy falls at isolated places
very likely over south Rajasthan on 18th
& heavy to very heavy falls at isolated
places over Rajasthan on 19th May.
24, Manki-19, Kota-19, Puttur -19,
Kundapur-17, Bhatkal-16,
Udupi-15, Dharmasthala-14, Mani-
13, Mulki-12, Karkala-11, Shirali -
11, Mangaluru -11,
Kadra-11, Panambur -10, Karwar -
10, Mudubidre-10, Belthangadi-9,
Honavar -9, Gokarna-9,
Vitla ARG-9, Sulya-8, Siddapura-8
NORTH INTERIOR KARNATAKA:
Vijayapura-8
SOUTH INTERIOR KARNATAKA:
Hosanagara-19, Bhagamandala-
17, Kalasa-13, Virajpet13,
Linganamakki -9, Thalaguppa-7,
Sagar-7
KERALA & MAHE: Mahe-24,
Vadakara-23, Vyttiri-21,
Taliparamba-17, Talassery-17,
Quilandi-16, Ernakulam South-14,
Kochi I.A.F.-14, Kochi C.I.A.L.-13,
Aluva -13, Manantoddy13, Irikkur-
13, Kannur-12, Piravam-11,
Perumpavur-11, Enamakkal-11,
Kudulu-10,
Thodupuzha-10, Karipur.-10,
Munnar KSEB-10, Varkala-10,
Kozha-9, Vaikom-9, Nilambur-9,
Neyyattinkara-9, Idukki-9,
Vadakkancherry-8, Nedumangad-
8, Parambikulam-8, Irinjalakuda8,
Perinthalamanna-8, Pattambi-8,
Angadipuram-8, Kozhikode-8,
Ottapalam-8, Peerumade -
8, Chalakudi-7, Ponnani-7,
Thiruvananthapuram-7,
Ambalavayal-7, Mannarkkad-7,
Myladumpara Agri-7, Thritala-7
17.05.2021/0300 Konkan & adjoining Madhya
Maharashtra: Heavy to very heavy falls
and extremely heavy falls at isolated
places on 17th May and isolated heavy
rainfall over north Konkan on 18th May.
Gujarat:Heavy to very heavy falls at a
few places and extremely heavy falls at
isolated places very likely over
Saurashtra, Diu and adjoining Gujarat
region on 17th & heavy to very heavy
KONKAN & GOA: Sawantwadi-37,
Ratnagiri -36, Dodamarg-25,
Panjim -23, Malvan-21,
Kudal-20, Devgad-20, Kankavli-19,
Vengurla -18, Mapusa-17, Lanja-
16, Dabolim- Navy-15,
Vaibhavwadi-15, Sangameshwar
Devrukh-14, Guhagarh-12,
Margao-12, Dapoli Agri-8,
Harnai -8, Sanguem-7

291
falls at a few places over Gujarat region
and heavy to very heavy falls at isolated
places over Saurashtra on 18th May.
Isolated heavy to very heavy rainfall
also likely over Kutch during the same
period.
Rajasthan:Heavy to very heavy falls &
extremely heavy falls at isolated places
very likely over south Rajasthan on 18th
& heavy to very heavy falls at isolated
places over Rajasthan on 19th May.
COASTAL KARNATAKA: Kadra-
11, Honavar -7, Kollur-7
18.05.2021/0300 Gujarat: Heavy to very heavy falls
isolated places very likely over Gujarat
region and Saurashtra on 18th May.
Rajasthan: Heavy to very heavy falls at
isolated places very likely over south
Rajasthan on 18th & heavy falls at
isolated places over north Rajasthan on
19th May
GUJARAT REGION: Umergam-
18, Daman-15, Daman FMO-13,
Surat City-9, Khanvel-8,
Valsad-8, Silvassa-
7SAURASHTRA & KUTCH:
Bagasra-21, Gir Gadhada-19,
Una-17, Savarkundla-17,
Palitana16, Amreli-13, Mahuva-
13, Rajula-13, Khambha-13,
Babra-13, Gadhda-11, Visavadar-
10,
Diu-9, Umrala-9, Bhavnagar-8,
Dhari-7, Jesar-7
KONKAN & GOA: Palghar Agri-
30, Dahanu -28, Santacruz -23,
Devgad-23, Sawantwadi-21,
Colaba -21, Talasari-17,
Canacona-9, Tbia -9, Kankavli-9,
Murud-8, Wada-8
19.05.2021/0300 Heavy to very heavy falls at isolated
places very likely over East Rajasthan
on 19th May.
Heavy to very heavy falls and extremely
heavy falls at isolated places over
Uttarakhand, heavy to very heavy
rainfall at isolated places over Himachal
Pradesh, Haryana, West Uttar Pradesh
and Heavy rainfall at isolated places
over Punjab, East Uttar Pradesh, north
Madhya Pradesh and West Rajasthan
during next 24 hours.
GUJARAT REGION: Nadiad-23,
Mahudha-16, Anand-16, Daman
FMO-15, Umergam-15,
Matar-15, Pardi-14, Daman-14,
Khambhat-13, Kheda-13, Tarapur-
13, Vaso-13, Olpad-12,
Khergam-12, Mahemdavad-12,
Dhansura-11, Ahmedabad City-11,
Jalalpor-11, Sojitra-11,
Kathalal-11, Prantij-10, Wanakbori-
10, Borsad-10, Navsari-10,
Kapadvanj-10, Virpur-10,
Modasa-10, Balasinor-9,
Dahegam-9, Bayad-9, Bardoli-9,
Talod-9, Madhban-9, Valsad-9,
Hansot-9, Vadodara-9, Vagra-9,
Meghraj-9, Bhiloda-8,
Himatanagar-8, Kamrej-8, Anklav-

292
8,
Silvassa-8, Padra-8, Palsana-7,
Gandevi-7, Thasra-7, Galteshwar-
7, Idar-7, Vapi-7, Poshina7,
Chikhli-7, Sanand-7, Vijapur-7,
Khanpur-7, Kaprada-7, Kalol-7,
Dascroi-7, Mahuva-7,
Lunawada-7, Danta-7, Malpur-7,
Petlad-7,
SAURASHTRA & KUTCH: Gir
Gadhada-19, Una-18, Bhavnagar-
11, Rajula-10, Botad-9,
Shihor-9, Visavadar-8, Palitana-8,
Vallabhipur-8, Umrala-7,
EAST RAJASTHAN: Veja-23,
Kanva-14, Devel-14, Dungarpur
Tehsil-14, Dhambola-13,
Sarara-13, Girva-11, Aspur-11,
Gogunda-10, Ganeshpur-10, Ajmer
Tehsil-9, Railmagra-9,
Dungla-9, Sagwara-8, Jhadol-8,
Udaipur/D-Aero-8, Ajmer-7,
Tatgarh-7, Salumber-7,
Nithuwa-7, Bari-Sadri-7, Loharia-7,
Dhariabad-7, Badesar-7
Table 4.3.1.5: Verification of Squally/Gale wind forecast (14-19 May)
Date/Base Time
of observation
Gale/ Squally wind Forecast at 0300 UTC of date
Realised wind
14.05.2021/0300 Squally weather with wind speed reaching 45-55
kmph gusting to 65 kmph is very likely over
southeast Arabian Sea and adjoining Lakshadweep
– Maldives area and equatorial Indian Ocean on
14th May. It is very likely to increase gradually
becoming 50- 60 kmph gusting to 70 kmph over the
same region from 14th morning.
It is likely to increase gradually becoming Gale wind
speed reaching 70 – 80 kmph gusting to 90 kmph
over east-central Arabian Sea and adjoining
southeast Arabian Sea and Lakshadweep area from
15th May morning.
Squally wind speed reaching 45-55 kmph gusting to
65 kmph likely along & off Kerala coast on 14th May
and 50-60 kmph gusting to 70 kmph along & off
Kerala - Karnataka coasts on 15th May.
Squally wind speed reaching 40-50 kmph gusting to
60 kmph likely along & off south Maharashtra & Goa
Agathi reported
maximum sustained
wind speed of 85
kmph, Minicoy-50
kmph, Amini Divi-38
kmph kts on 14th May.
Coastal Karnata
reported 55 kmph on
15th May.
Mumbai City reported
114 kmph on 18th
May. Gujarat coast
reported 160-170
gusting to 185 kmph at
the time of landfall on
18th

293
coasts on 15th and Gale winds speed reaching 60-
70 kmph gusting to 80 kmph along & off south
Maharashtra –Goa coasts on16th May.
Squally wind speed reaching 40-50 kmph gusting to
60 kmph likely over northeast Arabian Sea and
along & off south Gujarat & Daman and Diu coasts
on 17th morning and gradually increase becoming
Gale winds speed reaching 90-100 kmph gusting to
115 kmph over northeast Arabian Sea along & off
Gujarat coast from the early hours of 18th May and
increase gradually thereafter till 18th morning.
15.05.2021/0300 Squally weather with wind speed reaching 45-55
kmph gusting to 65 kmph is very likely over Maldives
area and equatorial Indian Ocean during next 06
hours.
Gale wind speed reaching 75 – 85 kmph gusting to
95 kmph is prevailing over east-central Arabian Sea
and adjoining southeast Arabian Sea and
Lakshadweep area. It is likely to increase over
eastcentral Arabian Sea becoming 120-130 kmph
gusting to 145 kmph from 16th May morning.
Squally wind speed reaching 50-60 kmph gusting to
70 kmph along & off Kerala coast on 15th May.
Squally wind speed reaching 50-60 kmph gusting to
70 kmph likely along & off Karnataka south
Maharashtra & Goa coasts on 15th and Gale winds
speed reaching 60-70 kmph gusting to 80 kmph
along & off Maharashtra –Goa coasts on16th May.
Squally wind speed reaching 40-50 kmph gusting to
60 kmph likely over northeast Arabian Sea and
along & off south Gujarat & Daman and Diu coasts
on 17th morning and gradually increase becoming
Gale winds speed reaching 150-160 kmph gusting to
175 kmph over northeast Arabian Sea from 18th
morning and along & off Saurashtra & Kutch coasts
(Devbhoomi Dwarka & Porbandar) and 120 -150
kmph gusting to 165 kmph over Kutch, Porbandar,
Junagarh, Jamnagar districts of Gujarat from 18th
May afternoon / evening for subsequent 06 hours.
16.05.2021/0300 Gale wind speed reaching 130–140 kmph gusting to
155 kmph is prevailing over eastcentral Arabian Sea.
It is likely to increase over eastcentral Arabian Sea
becoming 145-155 kmph gusting to 170 kmph from
16th May mid-night.
Gale winds speed reaching 80-90 kmph gusting to
100 kmph along & off south Maharashtra –Goa and
adjoining Karnataka coasts on 16th, 50-60 kmph
gusting to 70 kmph along & off north Maharashtra
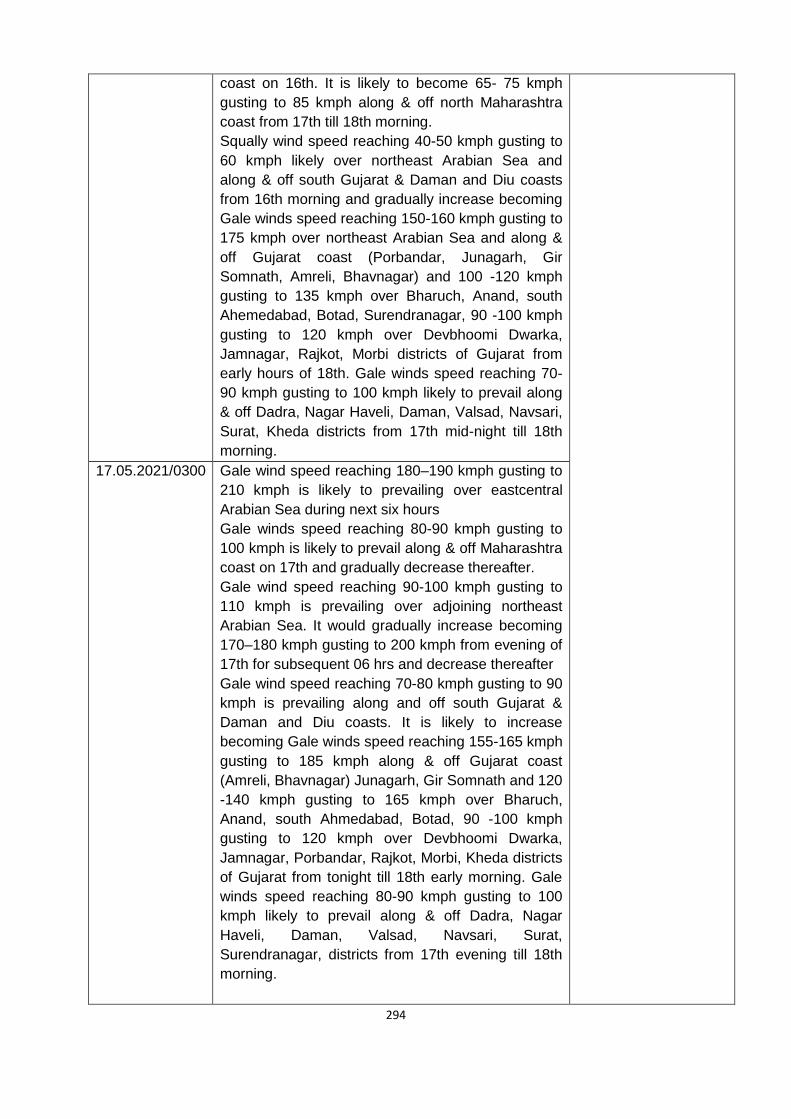
294
coast on 16th. It is likely to become 65- 75 kmph
gusting to 85 kmph along & off north Maharashtra
coast from 17th till 18th morning.
Squally wind speed reaching 40-50 kmph gusting to
60 kmph likely over northeast Arabian Sea and
along & off south Gujarat & Daman and Diu coasts
from 16th morning and gradually increase becoming
Gale winds speed reaching 150-160 kmph gusting to
175 kmph over northeast Arabian Sea and along &
off Gujarat coast (Porbandar, Junagarh, Gir
Somnath, Amreli, Bhavnagar) and 100 -120 kmph
gusting to 135 kmph over Bharuch, Anand, south
Ahemedabad, Botad, Surendranagar, 90 -100 kmph
gusting to 120 kmph over Devbhoomi Dwarka,
Jamnagar, Rajkot, Morbi districts of Gujarat from
early hours of 18th. Gale winds speed reaching 70-
90 kmph gusting to 100 kmph likely to prevail along
& off Dadra, Nagar Haveli, Daman, Valsad, Navsari,
Surat, Kheda districts from 17th mid-night till 18th
morning.
17.05.2021/0300 Gale wind speed reaching 180–190 kmph gusting to
210 kmph is likely to prevailing over eastcentral
Arabian Sea during next six hours
Gale winds speed reaching 80-90 kmph gusting to
100 kmph is likely to prevail along & off Maharashtra
coast on 17th and gradually decrease thereafter.
Gale wind speed reaching 90-100 kmph gusting to
110 kmph is prevailing over adjoining northeast
Arabian Sea. It would gradually increase becoming
170–180 kmph gusting to 200 kmph from evening of
17th for subsequent 06 hrs and decrease thereafter
Gale wind speed reaching 70-80 kmph gusting to 90
kmph is prevailing along and off south Gujarat &
Daman and Diu coasts. It is likely to increase
becoming Gale winds speed reaching 155-165 kmph
gusting to 185 kmph along & off Gujarat coast
(Amreli, Bhavnagar) Junagarh, Gir Somnath and 120
-140 kmph gusting to 165 kmph over Bharuch,
Anand, south Ahmedabad, Botad, 90 -100 kmph
gusting to 120 kmph over Devbhoomi Dwarka,
Jamnagar, Porbandar, Rajkot, Morbi, Kheda districts
of Gujarat from tonight till 18th early morning. Gale
winds speed reaching 80-90 kmph gusting to 100
kmph likely to prevail along & off Dadra, Nagar
Haveli, Daman, Valsad, Navsari, Surat,
Surendranagar, districts from 17th evening till 18th
morning.

295
18.05.2021/0300 Gale wind speed reaching 90-100 kmph gusting to
110 kmph is likely to prevail over Gulf of Khambat
and adjoining northeast Arabian Sea during next 06
hours. It is likely to reduce gradually thereafter.
Gale wind speed reaching 40-50 gusting to 60 kmph
along & off extreme north Maharashtra coast during
next 06 hours.
Gale winds speed reaching 100-110 kmph gusting to
120 kmph likely to prevail over Amreli, Bhavnagar,
Botad, 90-100 kmph gusting to 110 kmph over
Surendranagar, Rajkot, Anand, South Ahmedabad :
60-70 kmph gusting to 80 kmph over Diu, Gir
Somnath, Junagarh, Kheda, Bharuch, Jamnagar,
Porbandar & Morbi during next 06 hours and
gradually decrease thereafter.
Squally wind speed reaching 45-55 kmph gusting to
65 kmph likely to prevail along and off Dadra, Nagar
Haveli, Daman, Valsad, Navsari, Surat, districts and
35-45 kmph gusting to 55 kmph over Devbhoomi
Dwarka & Kutch during next 06 hours and gradually
decrease thereafter.
Squally wind speed reaching 45-55 kmph gusting to
65 kmph is likely to prevail over south Rajasthan
from the evening of 18th till 19th early morning.
19.05.2021/0300 Squally wind speed reaching 45-55 kmph gusting to 65 kmph is likely to prevail over East Rajasthan and adjoining west Madhya Pradesh during next 12 hours.
Table4.3.1.6: Verification of Storm Surge Forecast
Date/Base Time
of observation
Storm Surge Forecast at 0300 UTC of date
Realized surge
14.05.2021/0300 Tidal wave of about 1 meter height above
the astronomical tide is very likely to
inundate low lying areas of Lakshadweep
Islands on 15th& 16th May.
About 3-4 m above
astronomical tide over Diu and
of coastal districts of
Saurashtra.
15.05.2021/0300 Tidal wave of about 2- 3 m above
astronomical tide is likely to inundate coastal
areas of Morbi, Kutch, Devbhoomi Dwarka
& Jamnagar districts and 1-2 meters along
Porbandar, Junagarh, Gir Somnath, Amreli,
Bhavnagar and 0.5 to 1m over the
remaining coastal districts of Gujarat during
the time of landfall..
16.05.2021/0300 Tidal wave above astronomical tide is likely
to inundate coastal areas as per details

296
below:
about 3 m over Junagarh,1-2.5 m over Diu,
Gir Somnath, Amreli, Bharuch, Bhavnagar,
Ahmedabad, Anand, Surat and about 0.5 -
1m over Devbhoomi Dwarka , Jamnagar,
Porbandar, Kutch the remaining coastal
districts of Gujarat during the time of
landfall.
17.05.2021/0300 Tidal wave above astronomical tide is likely
to inundate coastal areas as per details
below:
about 3 -4 meter (m) over Anand & Amreli,
Gir Somnath, Diu, Bhavnagar, 2-3 m over
Bharuch, southern parts of Ahmedabad, 1-2
m over Surat, Navsari, Valsad, and 0.5 – 1m
over the remaining coastal districts of
Gujarat during the time of landfall.
18.05.2021/0300 Tidal wave above astronomical tide is likely
to inundate coastal areas during next 06
hours, as per details below:
About 1-2 meter (m) over Anand & Amreli,
Gir Somnath, Diu, Bhavnagar, 1 m over
Bharuch, southern parts of Ahmedabad,
Surat, Navsari, Valsad, during next 06
hours.

297
4.3.2 Very Severe Cyclonic storm (VSCS) YAAS (23-27 May 2021)
4.3.2.1 Genesis Forecast
First information about development of depression over eastcentral BoB with (1-33%
probability) during 21st-23rd May was given in the extended range outlook issued on 13th May
(about 10 days prior to the formation of formation of depression over eastcentral BoB
on 23rd May).
Subsequently, in the Press Release, Tropical Weather Outlook and national weather forecast
bulletin issued at 1200 hrs IST of 19th May, it was indicated that a low pressure would form
over north Andaman Sea and adjoining eastcentral BoB around 22nd May and that it would
intensify further into a cyclonic storm. It was also indicated that the system would move
northwestwards and reach Odisha-West Bengal coasts on 26th May (about 3 days prior to
formation of low pressure area on 22nd May and 4 days prior to formation of
depression on 23rd May).
The extended range outlook issued on 20th May (about 3 days prior to formation of
depression on 23rd May and 6 days prior to the cyclonic storm reaching near Odisha-
West Bengal coasts on 26th May) indicated with high probability (67-100%) that the system
would move towards northwest BoB near Odisha-West Bengal coasts during 23rd-26th May.
Accordingly, likely impact was also issued in the extended range outlook for fishermen, ships
and ports along the east coast of India and adjoining Bangladesh & Myanmar coasts.
In the first bulletin issued at 1245 hrs IST of 22nd May on formation of low pressure area over eastcentral BoB, it was indicated that the system would intensify upto very severe cyclonic storm and that the system would move northwestwards and reach north Odisha-West Bengal coasts around 26th morning(about 90 hours prior to YAAS reaching Odisha-West Bengal coasts on 26th morning).
The first bulletin issued at 1350 IST of 23rd (about 72 hours prior to landfall around noon of 26th), it was indicated that the system would move north-northwestwards, reach close to north Odisha-West Bengal coasts around 26th morning and cross north Odisha coast by afternoon of 26th May.
The bulletin issued at 0830 IST of 24th indicated that the system would cross coast close to south of Balasore, Odisha by afternoon of 26th as a very severe cyclonic storm (about 54 hours prior to landfall) with almost zero landfall point error.
Actually, the very severe cyclonic storm YAAS moved nearly north-northwestwards and lay centred over northwest BoB about 30 km east of Dhamara Port, Odisha during early morning (around 0530 IST) of 26th May. Since first bulletin issued on 22nd May (about 90 hours prior to landfall) it was indicated that the system would reach north Odisha-West Bengal coasts around 26th morning.
Also continuing to move north-northwestwards, YAAS crossed north Odisha coast near latitude 21.35°N and longitude 86.95°E, about 20 km to the south of Balasore as a VSCS with maximum sustained wind speed of 75 kts gusting to 85 kts (130 -140 kmph gusting to 155 kmph) between 0500 & 0600 UTC (103030 IST) of 26th as indicated since 24th May (about 54 hours prior to landfall) with almost zero landfall point error (8 km) and about zero landfall time error (0.5-1.0 hour).
Fig. 4.3.2.1, 4.3.2.2 represent the observed and forecast track, intensity & landfall forecast
issued at various lead times indicating accuracy in track, landfall and intensity forecast.

298
Fig.4.3.2.1 : Observed track (23-28 May) and first forecast track issued at 1350 hours
IST of 23rd May based on 1130 hrs IST observations of 23rd May (about 72 hours prior
to landfall) demonstrating accuracy in track, intensity and landfall.
Fig.4.3.2.2: Observed track (23-28 May) and forecast track issued at 0830 IST based on
0530 IST observations of 24th May (about 54 hours prior to landfall)
demonstrating accuracy in track, intensity and landfall
MSW(knot)/kmph) Impact Action
28-33 /(52–61 ) Very rough seas. Total suspension of fishing operations
34-40/(62-74) High to very high seas Total suspension of fishing operations
41-63/(75-117) Very High seas Total suspension of fishing operations
≥ 64 (≥118) Phenomenal Total suspension of fishing operations
DATE/TIME IN UTC, IST = UTC + 0530 HRS, D: DEPRESSION, DD: DEEP DEPRESSION, CS: CYCLONIC STORM, SCS: SEVERE CYCLONIC STORM, VSCS: VERY SEVERE CYCLONIC STORM, OBSERVED TRACK, FORECAST TRACK, CONE OFUNCERTAINTY
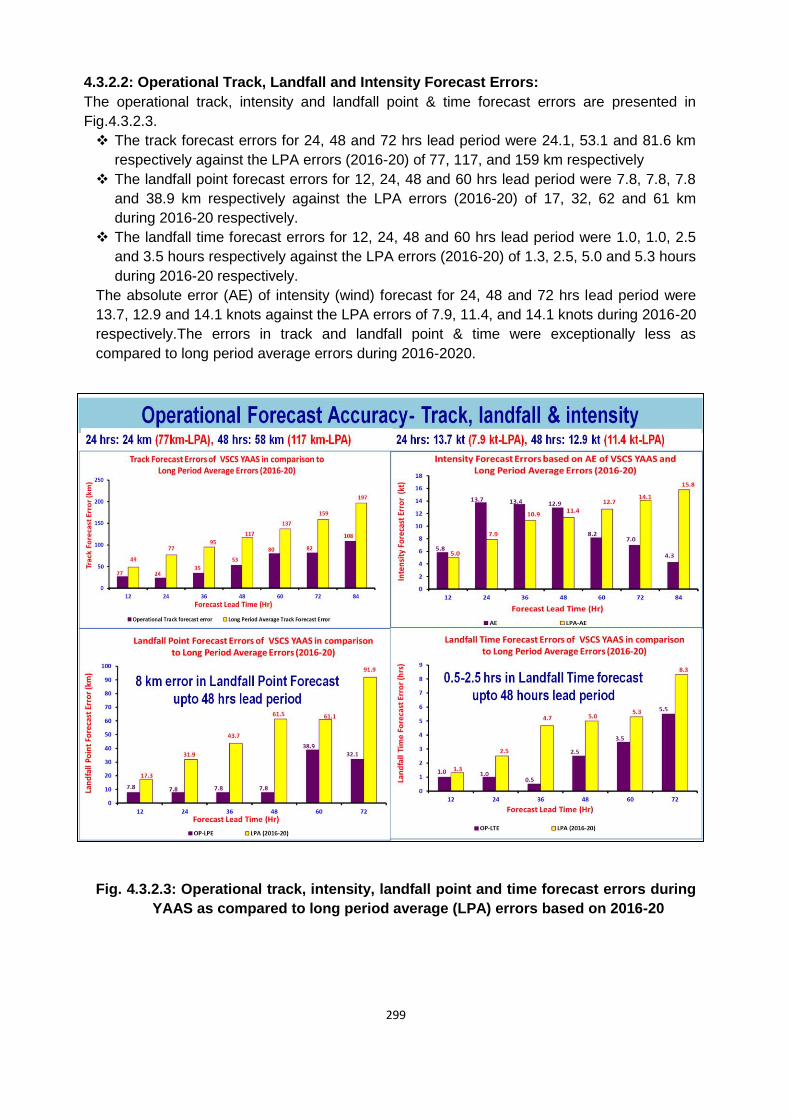
299
4.3.2.2: Operational Track, Landfall and Intensity Forecast Errors:
The operational track, intensity and landfall point & time forecast errors are presented in
Fig.4.3.2.3.
The track forecast errors for 24, 48 and 72 hrs lead period were 24.1, 53.1 and 81.6 km
respectively against the LPA errors (2016-20) of 77, 117, and 159 km respectively
The landfall point forecast errors for 12, 24, 48 and 60 hrs lead period were 7.8, 7.8, 7.8
and 38.9 km respectively against the LPA errors (2016-20) of 17, 32, 62 and 61 km
during 2016-20 respectively.
The landfall time forecast errors for 12, 24, 48 and 60 hrs lead period were 1.0, 1.0, 2.5
and 3.5 hours respectively against the LPA errors (2016-20) of 1.3, 2.5, 5.0 and 5.3 hours
during 2016-20 respectively.
The absolute error (AE) of intensity (wind) forecast for 24, 48 and 72 hrs lead period were
13.7, 12.9 and 14.1 knots against the LPA errors of 7.9, 11.4, and 14.1 knots during 2016-20
respectively.The errors in track and landfall point & time were exceptionally less as
compared to long period average errors during 2016-2020.
Fig. 4.3.2.3: Operational track, intensity, landfall point and time forecast errors during
YAAS as compared to long period average (LPA) errors based on 2016-20

300
Table 4.3.2.1: Operational Track forecast errors and skill of VSCS „YAAS” as
compared to long period average (2016-20)
*N: no. of observations verified
Table 4.3.2.2: Operational Absolute errors (AE) and Root Mean Square errors (RMSE)
and corresponding skill in intensity forecast of VSCS “YAAS” as compared to long
period average (2016-20)
Table 4.3.2.3: Operational Landfall point and time forecast errors of VSCS “YAAS” as
compared to long period average (2016-20)
Lead
Period (hrs)
N
Operational Track
forecast error (km)
Error-cl
Operational Track
Forecast Skill (%)
Long Period Average Track Forecast Error (2016-20)
Track Forecast Error (km)
Track Forecast Skill (%)
12 12 27.1 77 64.7 49 60
24 10 24.1 153 84.2 77 64
36 9 35.2 236 85.1 95 72
48 8 53.1 336 84.2 117 76
60 7 80.2 471 83.0 137 76
72 4 81.6 857 90.5 159 78
84 3 108.4 1084 90.0 197 77
Lead Period (hrs)
N AE RMSE AE-
PERS RMSE-PERS
SKILL-AE
SKILL-RMSE
Long Period Average (2016-20)
AE RMSE Skill-AE
Skill-RMSE
12 12 5.8 6.8 9.6 19.1 39.6 64.2 5.0 6.5 36.5 35.9
24 10 13.7 15.0 18.0 30.9 23.6 51.4 7.9 9.9 52.2 51.8
36 9 13.4 14.3 28.9 41.2 53.5 65.2 10.9 12.5 68.0 56.9
48 8 12.9 14.8 43.1 52.3 70.0 71.7 11.4 13.8 72.1 64.1
60 7 7.5 10.2 60.7 64.4 87.7 84.2 12.7 14.9 73.3 69.8
72 4 7.0 10.9 62.5 65.5 88.9 83.4 14.1 16.7 75.1 73.0
84 3 4.3 4.5 68.3 71.2 93.7 93.7 15.8 18.6 76.7 76.0
Lead Period (hrs)
Base date/Time
(UTC)
Forecast Latitude
(Deg)
Forecast Longitude
(Deg)
Actual latitude (Deg)
Actual Longitude
(Deg)
OP-LPE (km)
Forecast Time (UTC)
Actual Time (UTC)
OP-LTE (hrs)
12 25/18 21.3 86.9 21.35 86.95 7.8 26/0630 26/0530 +1.0
24 25/06 21.3 86.9 21.35 86.95 7.8 26/0630 26/0530 +1.0
36 24/18 21.4 87 21.35 86.95 7.8 26/0600 26/0530 -0.5
48 24/06 21.4 87 21.35 86.95 7.8 26/0800 26/0530 +2.5
60 23/18 21.6 87.2 21.35 86.95 38.9 26/0900 26/0530 +3.5
72 23/06 21.5 87.2 21.35 86.95 32.1 26/1100 26/0530 +5.5

301
4.3.2.3. Adverse weather forecast verification
The verifications of adverse weather like heavy rainfall, gale wind and storm surge
forecast issued by IMD are presented in Table 4.3.2.4-4.3.2.6. It is found that all the three
types of adverse weather were predicted accurately and well in advance.
Table 4.3.2.4 Forecast verification of Gale wind
Forecast Winds (kmph) Realised wind (kmph)
Gale wind speed reaching 155-165
gusting to 185 kmph over north
coastal districts of Balasore,
Bhadrak Jagatsinghpur, Kendrapara
of Odisha. It was modified to 130-
140 gusting to 155 kmph on 25th
night.
Gale wind speed reaching 110-120
gusting to 130 kmph over coastal
districts of West Bengal (Purba
Medinipur and south 24 Parganas
district) and during the time of
landfall.
Gale wind speed reaching 130-140
gusting to 155 kmph prevailed over north
coastal districts of Balasore, Bhadrak and
100-120 kmph gusting to 130 kmph along
and off Kebdrapara and Jagatsinghpur
districts of Odisha.
Gale wind speed reaching 110-120
gusting to 130 kmph prevailed over
coastal districts of West Bengal (Purba
Medinipur and south 24 Parganas
district) during the time of landfall
Table 4.3.2.5 Verification of Heavy Rainfall Warning
Forecast Rainfall Realised 24 hr cumulative heavy rainfall ending at 0830 IST of date
Heavy to very heavy rainfall over
Andaman & Nicobar Islands on 23rd &
24th May.
Heavy to extremely heavy rainfall activity at isolated places over coastal Odisha on 25th May and heavy to very heavy rainfall at a few places and extremely heavy rains at isolated places on 26th May over North Odisha.
Heavy to very heavy rainfall activity at
isolated places over Gangetic West Bengal on 26th May and heavy to extremely heavy rainfall over Sub-Himalayan West Bengal on 27th.
Heavy to extremely heavy rainfall over Jharkhand on 26th and 27th, over Bihar
Heavy to very heavy rainfall over Andaman & Nicobar Islands on 23rd & 24th May. Long Island-10, Maya Bandar-9Port Blair-7
Heavy to extremely heavy rainfall at isolated places over coastal Odisha on 25th May and heavy to very heavy rainfall at a few places and extremely heavy rains at isolated places on 26th May over North Odisha. Andaman & Nicobar Islands: Hut Bay-11, Carnicobar-8,
Gangetic West Bengal: Contai-9 Heavy to very heavy rainfall at isolated
places over Gangetic West Bengal on 26th May and heavy to extremely heavy rainfall over Sub-Himalayan West Bengal on 27th.
26 May 2021: Odisha: Chandbali-29, Rajkanika &Garadapur-25 each, Marsaghai & Kujanga-23 each, Nawana&Tirtol-21

302
Table 4.3.2.6 Verification of storm surge warning
Forecast Storm Surge (m) Realised Storm Surge (m)
Tidal waves of height 2-4 meters above astronomical tide to inundate low lying areas of Balasore, Bhadrak Medinipur, South 24 Parganas, and about 1-2 meters above astronomical tide to inundate low lying areas of Kendrapara & Jagatsinghpur Districts around the time of landfall.
Estimated storm surge of about 2-4 meters height above astronomical tide inundated low lying areas of Balasore and Bhadrak districts of north Odisha and West Bengal (South 24 parganas, North 24 parganas, Purba Medinipur districts) and 1-2 meters height above astronomical tide inundated low lying areas of Kendrapara and Jagatsinghpur districts of north Odisha during time of landfall.
Thus, the track, intensity, landfall point & time and associated adverse weather like heavy rainfall, gale wind and storm surge were predicted by IMD well in advance with reasonable accuracy.
and east UP on 27th and 28th May. each, Paradip -20, Pattamundai, Balikuda & Derabis-19 each, Astaranga-18,Bhadrak-17, Kendrapara, Dhamnagar & Soro-16 each, Jagatsinghpur-15, Tihidi, Bari &Alipingal-14 each, Jajpur, Nilgiri, Akhuapada & Basudevpur-13 each, Chandikhol & Bonth-12each, Korei & Kakatpur-11 each, Danagadi-10, Jenapur, Nischintakoili & Bhograi-9 each, Niali &Anandpur & Kaptipada-8 each, Joshipur, Jaleswar, Salepur, Mahanga, Chandanpur, Rairangpur,NH5 Gobindpur, Balimundali, Betanati, Balasore & Jhumpura-7 eacHeavy to extremely heavy rainfall over Jharkhand on 26th and 27th, over Bihar and east UP on 27th and 28th May. (May see realised rainfall data)
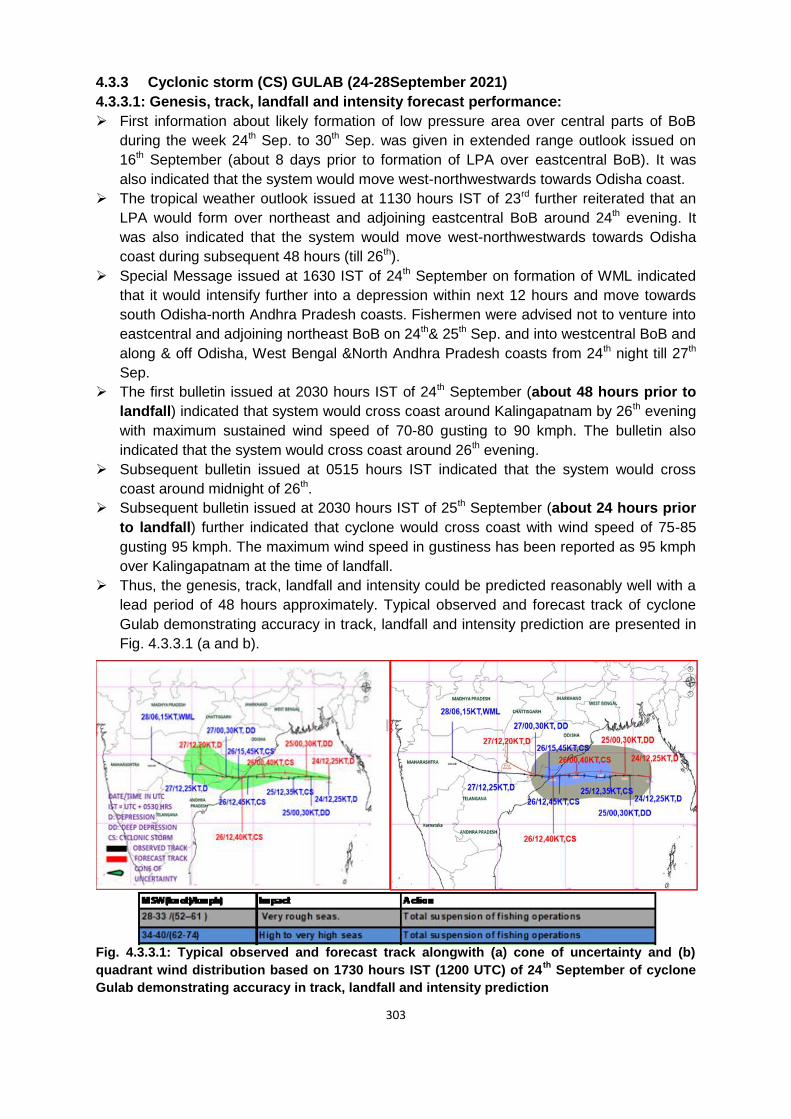
303
4.3.3 Cyclonic storm (CS) GULAB (24-28September 2021)
4.3.3.1: Genesis, track, landfall and intensity forecast performance:
First information about likely formation of low pressure area over central parts of BoB
during the week 24th Sep. to 30th Sep. was given in extended range outlook issued on
16th September (about 8 days prior to formation of LPA over eastcentral BoB). It was
also indicated that the system would move west-northwestwards towards Odisha coast.
The tropical weather outlook issued at 1130 hours IST of 23rd further reiterated that an
LPA would form over northeast and adjoining eastcentral BoB around 24th evening. It
was also indicated that the system would move west-northwestwards towards Odisha
coast during subsequent 48 hours (till 26th).
Special Message issued at 1630 IST of 24th September on formation of WML indicated
that it would intensify further into a depression within next 12 hours and move towards
south Odisha-north Andhra Pradesh coasts. Fishermen were advised not to venture into
eastcentral and adjoining northeast BoB on 24th& 25th Sep. and into westcentral BoB and
along & off Odisha, West Bengal &North Andhra Pradesh coasts from 24th night till 27th
Sep.
The first bulletin issued at 2030 hours IST of 24th September (about 48 hours prior to
landfall) indicated that system would cross coast around Kalingapatnam by 26th evening
with maximum sustained wind speed of 70-80 gusting to 90 kmph. The bulletin also
indicated that the system would cross coast around 26th evening.
Subsequent bulletin issued at 0515 hours IST indicated that the system would cross
coast around midnight of 26th.
Subsequent bulletin issued at 2030 hours IST of 25th September (about 24 hours prior
to landfall) further indicated that cyclone would cross coast with wind speed of 75-85
gusting 95 kmph. The maximum wind speed in gustiness has been reported as 95 kmph
over Kalingapatnam at the time of landfall.
Thus, the genesis, track, landfall and intensity could be predicted reasonably well with a
lead period of 48 hours approximately. Typical observed and forecast track of cyclone
Gulab demonstrating accuracy in track, landfall and intensity prediction are presented in
Fig. 4.3.3.1 (a and b).
Fig. 4.3.3.1: Typical observed and forecast track alongwith (a) cone of uncertainty and (b)
quadrant wind distribution based on 1730 hours IST (1200 UTC) of 24th
September of cyclone
Gulab demonstrating accuracy in track, landfall and intensity prediction

304
4.3.3.2. Operational landfall forecast error
The landfall point and time Forecast errors (Forecast – Actual) compared to long period
average (LPA) errors during 2016-20 are presented in Fig.4.3.3.2 (a-b) and Table4.3.3.1.
The landfall point forecast errors for 24, 36 and 48 hrs lead period were 31, 0 and 0 km
respectively against the LPA errors (2016-20) of 31.9, 43.7 and 61.5 km during 2016-20
respectively. The landfall time forecast errors for 24, 36 and 48 hrs lead period were 0.5, 3.0,
and 3.0 hours respectively against the LPA errors (2016-20) 2.5, 4.7 and 5.0 hours during
2016-20 respectively.
For all lead periods, the landfall point errors were exceptionally less than the LPA
errors during 2016-20. There was almost zero landfall point error for 36 and 48 hours
lead period. Landfall time error was also significantly less for all lead periods from 24
to 48 hours.
Fig.4.3.3.2: Operational Landfall (a) point and (b) time forecast errors of CS „GULAB”
as compared to long period average (2016-20)
Table 4.3.3.1: Operational Landfall point and time forecast errors of CS „GULAB” as
compared to long period average (2016-20)
OP-LPE: Operational Landfall Point Error, OP-LTE: Operational Landfall Time Error,
„+‟: Delay, „-„: Early
4.3.3.3. Track forecast error and skill
The track forecast errors (Forecast position – Actual position of Cyclone centre) and skill as
compared to Climatological and Persistence forecast are presented in Fig.4.3.3.3 (a-b) and
Lead
Period
(hrs)
Base
date/Time
(UTC)
Forecast
Latitude
(Deg)
Forecast
Longitude
(Deg)
Actual
latitude
(Deg)
Actual
Longitude
(Deg)
OP-
LPE
(km)
Forecast
Time
(UTC)
Actual
Time
(UTC)
OP-
LTE
(hrs)
12 26/00 18.5 84.3 18.4 84.2 15.6 26/1800 26/1430 +3.5
24 25/12 18.6 84.4 18.4 84.2 31.1 26/1500 26/1430 +0.5
36 25/00 18.4 84.2 18.4 84.2 0.0 26/1130 26/1430 -3.0
48 24/12 18.4 84.2 18.4 84.2 0.0 26/1130 26/1430 -3.0

305
Table 4.3.3.2. The track forecast errors for 24, 48 and 72 hrs lead period were 82.4, 65.9,
and 110.0 km respectively against the LPA errors (2016-20) of 77.5, 116.8, and 158.8 km
respectively (Fig.4.3.3.3 a). The track forecast skill was about 79%, 89%, and 92% against
the LPA skill of 64%, 76%, and 78% for 24, 48 and 72 hrs lead period respectively (Fig.
4.3.3.3b).
The track forecast error for 48-72 hours lead period was significantly less than the
LPA errors. Skill in track forecasting was better than LPA skill for all lead periods.
Fig. 4.3.3.3: Operational Track forecast (a) errors and (b) skill of CS „GULAB” as
compared to long period average (2016-20)
Table 4.3.3.2: Operational Track forecast errors and skill of CS „GULAB” as compared
to long period average (2016-20)
Lead Period (hrs)
N Operational Track forecast
error (km)
Operational Track Forecast
Skill (%)
Long Period Average (2016-20)
Track Forecast Error (km)
Track Forecast Skill (%)
12 12 66.6 61.4 49.0 60.3
24 8 82.4 78.5 77.5 64.4
36 7 98.7 83.6 94.7 71.7
48 5 65.9 89.2 116.8 75.9
60 4 71.4 91.0 137.0 76.4
72 1 110.0 91.9 158.8 78.0
N: no. of observations verified
4.3.3.4. Intensity forecast error and skill
The intensity forecast errors (Forecast wind – Actual wind) and skill based on absolute errors
and root mean square errors are presented in Fig.4.3.3.4& and Table 4.3.3.3 respectively.
The absolute error (AE) of intensity (wind) forecast for 24, 48 and 72 hrs lead period were
1.3, 2.2 and 5.0 knots against the LPA errors of 7.9, 11.4, and 14.1 knots during 2016-20
respectively (Fig. 4.3.3.4 a). The root mean square error (RMSE) of intensity (wind) forecast
for 24, 48 and 72 hrs lead period were 2.5, 3.3 and 5.0 knots against the LPA errors of 9.9,

306
13.8, and 16.7 knots respectively (Fig. 4.3.3.5a). The skill (%) in intensity forecast as
compared to persistence forecast based on AE for 24, 48 and 72 hrs lead period was 90%,
95% and 88% against the LPA of 52%, 72% and 75% respectively (Fig.4.3.3.4b). The skill
(%) in intensity forecast based on RMSE for 24, 48 and 72 hrs lead period was 87%, 92% &
88% against the LPA of 60%, 69% and 78% respectively (Fig.4.3.3.5 b).
Fig. 4.3.3.4: (a) Absolute errors (AE) and (b) Root Mean Square errors (RMSE) in
intensity forecast (winds in knots) of CS „GULAB” as compared to long period
average (2016-20)
Fig. 4.3.3.5: Skill (%) in intensity forecast based on (a) Absolute errors (AE) and (b)
Root Mean Square errors (RMSE) of CS „GULAB” as compared to long period average
(2016-20)
Table 4.3.3.3: Operational Absolute errors (AE) and Root Mean Square errors (RMSE)
and corresponding skill in intensity forecast of CS „GULAB” as compared to long
period average (2016-20)
Lead
Period
N AE RMSE Skill-AE Skill-RMSE Long Period Average (2016-20)
AE RMSE Skill-AE Skill-RMSE
12 12 1.7 2.9 84.7 81.0 5.0 6.5 36.5 46.8
24 8 1.3 2.5 90.4 86.7 7.9 9.9 52.2 59.5
36 7 3.6 5.0 88.1 84.3 10.9 12.5 68.0 62.8
48 5 2.2 3.3 94.9 92.4 11.4 13.8 72.1 69.0
60 4 2.5 3.5 93.1 91.6 12.7 15.9 73.3 75.2
72 1 5.0 5.0 87.5 87.5 14.1 16.7 75.1 77.7
N: No. of observations verified, AE: Absolute error, RMSE: Root Mean Square Error, LPA:
Long Period Average

307
4.3.4 Severe Cyclonic storm (SCS) SHAHEEN (30th Sept – 4th Oct 2021)
4.3.4.1 Genesis, track, landfall and intensity forecast performance:
First information about likely emergence of remnant of cyclonic storm Gulab into
northeast Arabian Sea was indicated in the All India Weather Inference issued at 1230
hours IST of 28th September. From 28th onwards, the fishermen were advised not to
venture into north & adjoining central Arabian Sea and along & off Gujarat & north
Maharashtra coasts during 30th September-2nd November.
The extended range outlook issued at 30th September indicated high probability of
cyclogenesis over north Arabian Sea.
The special Message issued at 1250 IST of 29th September indicated that the well
marked low pressure area over south Gujarat & adjoining Khambat region would
emerge into northeast Arabian Sea by 30th and intensify gradually into a cyclonic storm.
It was also indicated that the system would move away from Indian coast and would not
cause damage over Indian mainland. Since first bulletin issued at 0830 hours IST of 30th
it was indicated that the system would move away from Indian mainland.
Fig.4.3.4.1: Typical observed and forecast track of severe cyclonic storm Shaheen at 0830
hours IST (0300 UTC) of 30th Sep. demonstrating movement of system away from
Indian coast
Fig.4.3.4.2: Typical observed and forecast track severe cyclonic storm Shaheen at 1130 hours
IST of 1st
October (about 60 hours prior to landfall) demonstrating accuracy in track,
landfall and intensity prediction
Typical observed and forecast track issued at 0830 hours IST (0300 UTC) of 30th
September alongwith cone of uncertainty and wind warnings is presented in Fig.4.3.4.1.
Typicalobserved and forecast track of cyclone Shaheenbased on 1130 hours IST (0600
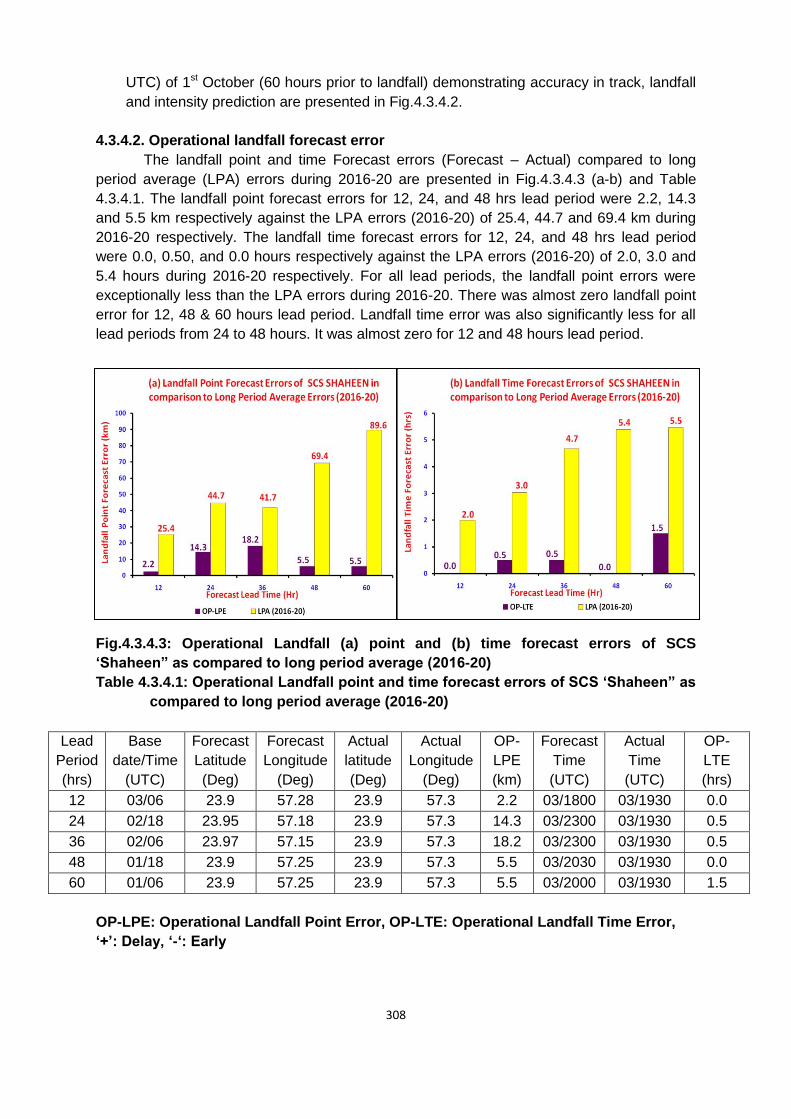
308
UTC) of 1st October (60 hours prior to landfall) demonstrating accuracy in track, landfall
and intensity prediction are presented in Fig.4.3.4.2.
4.3.4.2. Operational landfall forecast error
The landfall point and time Forecast errors (Forecast – Actual) compared to long
period average (LPA) errors during 2016-20 are presented in Fig.4.3.4.3 (a-b) and Table
4.3.4.1. The landfall point forecast errors for 12, 24, and 48 hrs lead period were 2.2, 14.3
and 5.5 km respectively against the LPA errors (2016-20) of 25.4, 44.7 and 69.4 km during
2016-20 respectively. The landfall time forecast errors for 12, 24, and 48 hrs lead period
were 0.0, 0.50, and 0.0 hours respectively against the LPA errors (2016-20) of 2.0, 3.0 and
5.4 hours during 2016-20 respectively. For all lead periods, the landfall point errors were
exceptionally less than the LPA errors during 2016-20. There was almost zero landfall point
error for 12, 48 & 60 hours lead period. Landfall time error was also significantly less for all
lead periods from 24 to 48 hours. It was almost zero for 12 and 48 hours lead period.
Fig.4.3.4.3: Operational Landfall (a) point and (b) time forecast errors of SCS
„Shaheen” as compared to long period average (2016-20)
Table 4.3.4.1: Operational Landfall point and time forecast errors of SCS „Shaheen” as
compared to long period average (2016-20)
Lead
Period
(hrs)
Base
date/Time
(UTC)
Forecast
Latitude
(Deg)
Forecast
Longitude
(Deg)
Actual
latitude
(Deg)
Actual
Longitude
(Deg)
OP-
LPE
(km)
Forecast
Time
(UTC)
Actual
Time
(UTC)
OP-
LTE
(hrs)
12 03/06 23.9 57.28 23.9 57.3 2.2 03/1800 03/1930 0.0
24 02/18 23.95 57.18 23.9 57.3 14.3 03/2300 03/1930 0.5
36 02/06 23.97 57.15 23.9 57.3 18.2 03/2300 03/1930 0.5
48 01/18 23.9 57.25 23.9 57.3 5.5 03/2030 03/1930 0.0
60 01/06 23.9 57.25 23.9 57.3 5.5 03/2000 03/1930 1.5
OP-LPE: Operational Landfall Point Error, OP-LTE: Operational Landfall Time Error,
„+‟: Delay, „-„: Early

309
4.3.4.3. Track forecast error and skill
The track forecast errors (Forecast position – Actual position of Cyclone centre) and skill as
compared to Climatological and Persistence forecast are presented in Fig.4.3.4.4(a-b) and
Table 4.3.4.2. The track forecast errors for 24, 48 and 72 hrs lead period were 58.1, 107.2,
and 120.1 km respectively against the LPA errors (2016-20) of 77.5, 116.8, and 158.8 km
respectively (Fig.4.3.4.4a). The track forecast skill was about 85%, 88%, and 88% against
the LPA skill of 64%, 76%, and 78% for 24, 48 and 72 hrs lead period respectively
(Fig.4.3.4.4b). The track forecast error for all lead periods were significantly less than the
LPA errors. Skill in track forecasting was better than LPA skill for all lead periods.
Fig.4.3.4.4: Operational Track forecast (a) errors and (b) skill of SCS „Shaheen” as
compared to long period average (2016-20)
Table 4.3.4.2: Operational Track forecast errors and skill of SCS „Shaheen” as
compared to long period average (2016-20)
Lead
Period
(hrs)
N Operational
Track forecast
error (km)
Operational
Track Forecast
Skill (%)
Long Period Average (2016-20)
Track Forecast
Error (km)
Track Forecast
Skill (%)
12 16 37.7 75.2 49.0 60.3
24 14 58.1 85.1 77.5 64.4
36 12 80.8 87.0 94.7 71.7
48 10 107.2 87.7 116.8 75.9
60 7 92.6 89.4 137.0 76.4
72 2 120.1 88.2 158.8 78.0
N: no. of observations verified
4.3.4.4. Intensity forecast error and skill
The intensity forecast errors (Forecast wind – Actual wind) and skill based on absolute errors
and root mean square errors are presented in Fig.4.3.4.5 & and Table 4.3.4.3 respectively.
The absolute error (AE) of intensity (wind) forecast for 24, 48 and 72 hrs lead period were
5.0, 9.0 and 2.4 knots against the LPA errors of 7.9, 11.4, and 14.1 knots during 2016-20
respectively (Fig. 4.3.4.5 a). The root mean square error (RMSE) of intensity (wind) forecast
for 24, 48 and 72 hrs lead period were 6.8, 9.53 and 3.3 knots against the LPA errors of 9.9,
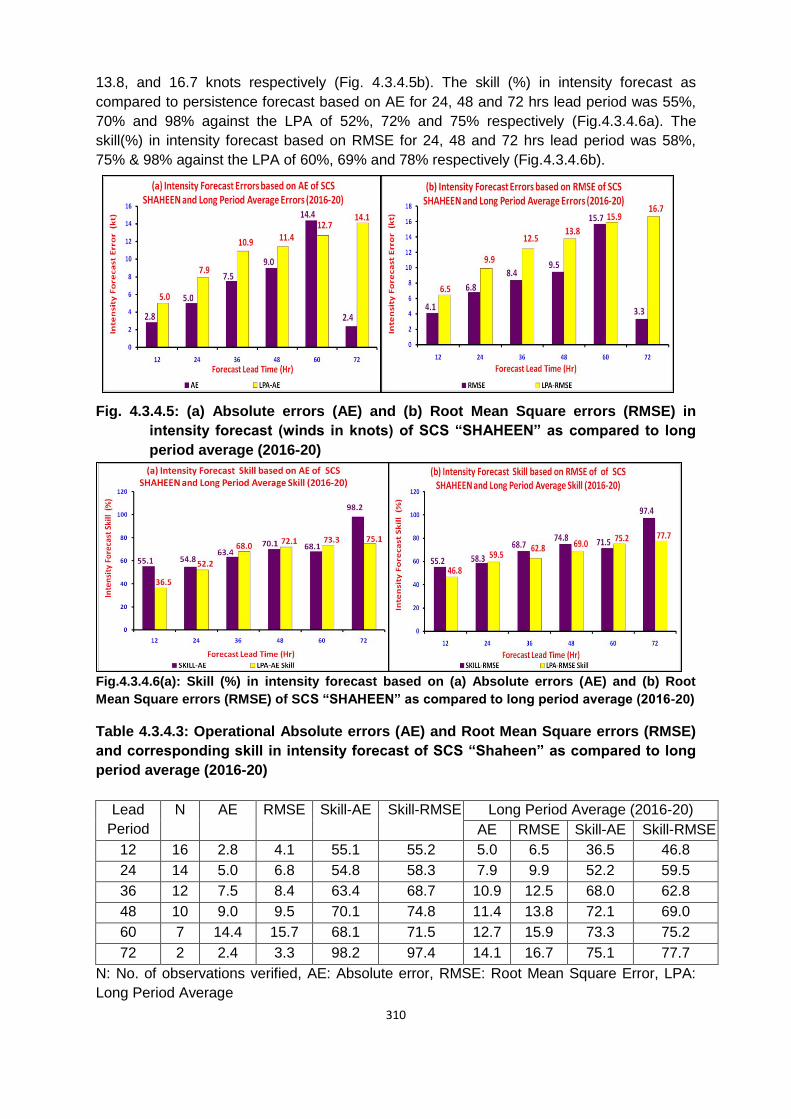
310
13.8, and 16.7 knots respectively (Fig. 4.3.4.5b). The skill (%) in intensity forecast as
compared to persistence forecast based on AE for 24, 48 and 72 hrs lead period was 55%,
70% and 98% against the LPA of 52%, 72% and 75% respectively (Fig.4.3.4.6a). The
skill(%) in intensity forecast based on RMSE for 24, 48 and 72 hrs lead period was 58%,
75% & 98% against the LPA of 60%, 69% and 78% respectively (Fig.4.3.4.6b).
Fig. 4.3.4.5: (a) Absolute errors (AE) and (b) Root Mean Square errors (RMSE) in
intensity forecast (winds in knots) of SCS “SHAHEEN” as compared to long
period average (2016-20)
Fig.4.3.4.6(a): Skill (%) in intensity forecast based on (a) Absolute errors (AE) and (b) Root
Mean Square errors (RMSE) of SCS “SHAHEEN” as compared to long period average (2016-20)
Table 4.3.4.3: Operational Absolute errors (AE) and Root Mean Square errors (RMSE)
and corresponding skill in intensity forecast of SCS “Shaheen” as compared to long
period average (2016-20)
Lead
Period
N AE RMSE Skill-AE Skill-RMSE Long Period Average (2016-20)
AE RMSE Skill-AE Skill-RMSE
12 16 2.8 4.1 55.1 55.2 5.0 6.5 36.5 46.8
24 14 5.0 6.8 54.8 58.3 7.9 9.9 52.2 59.5
36 12 7.5 8.4 63.4 68.7 10.9 12.5 68.0 62.8
48 10 9.0 9.5 70.1 74.8 11.4 13.8 72.1 69.0
60 7 14.4 15.7 68.1 71.5 12.7 15.9 73.3 75.2
72 2 2.4 3.3 98.2 97.4 14.1 16.7 75.1 77.7
N: No. of observations verified, AE: Absolute error, RMSE: Root Mean Square Error, LPA:
Long Period Average

311
(a)
4.3.5 Cyclonic storm (CS) JAWAD (02nd – 5th December 2021)
4.3.5.1 Genesis, track, landfall and intensity forecast performance:
First information about likely cyclogenesis (low probability: 1-33%) over southeast BoB was
given in the extended range outlook issued on 18th November, about 12 days prior to the
formation of low pressure area over south Thailand and neighbourhood on 30th November
and 14 days prior to formation of depression over southeast BoB on 2nd December.
Subsequent extended range outlooks issued on 25th November and 2nd December indicated
initial northwestwards movement and then north-northeastwards recurvature of the system
while moving parallel to east coast of India close to Andhra Pradesh-Odisha coasts
(Fig.4.3.5.1 a-c).
Since 25th November, fishermen warnings were issued for Andaman Sea area for 30th
November (even before the emergence of low pressure area over south Andaman Sea on
30th) in graphical form and also in the six hourly bulletins issued by National Weather
Forecasting Centre, New Delhi. Fishermen warnings were subsequently issued for entire
BoB region in association with cyclone Jawad.
First special message for the disaster managers was issued at 1400 hours IST of 30th
November on formation of low pressure area over south Thailand and neighbourhood at
0830 hours IST of 30th November indicating that the system would emerge into Andaman
Sea and subsequently intensify intro a cyclonic storm around 3rd December. It was also
indicated that the system would reach north Andhra Pradesh-Odisha coasts around 4th
December morning. On 30th November, heavy rainfall warnings for Andaman & Nicobar
Islands.
Typical observed and forecast tracks of cyclone JAWAD based on 0530 hours IST of 3rd
December demonstrating accuracy in track, landfall and intensity prediction are presented
in Fig.4.3.5.2.
Fig. 4.3.5.1 (a): Extended range outlook issued on 18th November

312
Fig. 4.3.5.1 (b): Extended range outlook issued on 25th November,(c): Extended range
outlook issued on 02nd December
Fig.4.3.5.2: Typical observed and forecast track of cyclonic storm JAWAD at 0530
hoursIST (0000 UTC) of 03rd Dec. demonstrating accuracy in track, intensity,
and landfall of system
4.3.5.2. Track forecast error and skill
The track forecast errors (Forecast position – Actual position of Cyclone centre) and skill as
compared to Climatological and Persistence forecast are presented in Fig.4.3.5.3(a-b) and
Table 4.3.5.1 The track forecast errors for 24, 48 and 60 hrs lead period were 78.8, 82.2,
and 77.5 km respectively against the LPA errors (2016-20) of 77.5, 116.8, and 137 km
respectively (Fig.4.3.5.3 a). The track forecast skill was about 66%, 88%, and 92% against
the LPA skill of 64%, 76%, and 76% for 24, 48 and 60 hrs lead period respectively
(Fig.4.3.5.3b). The track forecast error for all lead periods were comparable or significantly
less than the LPA errors. Skill in track forecasting was comparable or better than LPA skill
for all lead periods.
(b) (c)

313
Fig.4.3.5.3: Operational Track forecast (a) errors and (b) skill of CS „JAWAD” as
compared to long period average (2016-20)
Table 4.3.5.1: Operational Track forecast errors and skill of CS „JAWAD” as compared
to long period average (2016-20)
Lead
Period
(hrs)
N Operational
Track forecast
error (km)
Operational
Track Forecast
Skill (%)
Long Period Average (2016-20)
Track Forecast
Error (km)
Track Forecast
Skill (%)
12 11 50.7 48.1 49 60
24 9 78.8 65.9 77 64
36 8 95.0 77.8 95 72
48 6 82.2 87.8 117 76
60 3 77.5 91.9 137 76
N: no. of observations verified
4.3.5.3. Intensity forecast error and skill
The intensity forecast errors (Forecast wind – Actual wind) and skill based on absolute errors
and root mean square errors are presented in Fig.4.3.5.4, 4.3.5.5& and Table 4.3.5.2
respectively. The absolute error (AE) of intensity (wind) forecast for 24, 48 and 60 hrs lead
period were 6.7, 13.3 and 11.7 knots against the LPA errors of 7.9, 11.4, and 12.7 knots
during 2016-20 respectively (Fig. 4.3.5.4a). The root mean square error (RMSE) of intensity
(wind) forecast for 24, 48 and 60 hrs lead period were 9.4, 14.1 and 11.9 knots against the
LPA errors of 9.9, 13.8, and 14.9 knots respectively (Fig. 4.3.5.4b). The skill (%) in intensity
forecast as compared to persistence forecast based on AE for 24, 48 and 60 hrs lead period
was 56%, 65% and 77% against the LPA of 52%, 72% and 73% respectively (Fig.4.3.5.5a).
The skill(%) in intensity forecast based on RMSE for 24, 48 and 60 hrs lead period was 63%,
68% &78% against the LPA of 52%, 64% and 70% respectively (Fig.4.3.5.5b).

314
Fig. 4.3.5.4: (a) Absolute errors (AE) and (b) Root Mean Square errors (RMSE) in
intensity forecast (winds in knots) of CS “JAWAD” as compared to long
period average (2016-20)
Fig.4.23: Skill (%) in intensity forecast based on (a) Absolute errors (AE) and (b) Root
Mean Square errors (RMSE) of SCS “JAWAD” as compared to long period average
(2016-20)
Fig. 4.3.5.5: Skills based on (a) Absolute errors (AE) and (b) Root Mean Square errors
(RMSE) in intensity forecast (winds in knots) of CS “JAWAD” as compared to
long period average (2016-20)
Table 4.3.5.2: Operational Absolute errors (AE) and Root Mean Square errors (RMSE)
and corresponding skill in intensity forecast of CS “JAWAD” as compared to long
period average (2016-20)
Lead
Period
N AE RMSE Skill-AE Skill-RMSE Long Period Average (2016-20)
AE RMSE Skill-AE Skill-RMSE
12 11 3.6 4.8 63.6 75.7 5.0 6.5 36.5 35.9
24 9 6.7 9.4 55.6 62.6 7.9 9.9 52.2 51.8
36 8 10.6 12.9 60.5 64.6 10.9 12.5 68.0 56.9
48 6 13.3 14.1 65.2 67.6 11.4 13.8 72.1 64.1
60 3 11.7 11.9 77.4 77.9 12.7 14.9 73.3 69.8
*N: No. of observations verified, AE: Absolute error, RMSE: Root Mean Square Error, LPA:
Long Period Average

315
4.3.5.4. Adverse weather forecast verification
The verifications of adverse weather like heavy rainfall and gale wind forecast issued by IMD
are presented in Tables 4.3.5.3-4.3.5.4. It is found that both types of adverse weather were
predicted accurately and well in advance.
Table 4.3.5.3: Verification of Heavy Rainfall Forecast
Date/Base
Time of
observation
(UTC)
24 hr Heavy rainfall warning ending at 0830 hrs IST of
next day
Realised 24-hour
heavy rainfall ending
at 0300 UTC of date
30/11/2021
0300 UTC
30th Nov.: Heavy to very heavy rainfall falls at isolated places very likely over Andaman & Nicobar Islands.
1st Dec.: Heavy to very heavy rainfallat a few places & extremely heavy falls at isolated places very likely over Andaman & Nicobar Islands.
2nd Dec.: Heavy rainfall at isolated places very likely over Andaman & Nicobar Islands.
3rd Dec.: Heavy rainfall at isolated places very likely to commence over north coastal Andhra Pradesh and south coastal Odisha from evening / night.
4th Dec.: Heavy to very heavy rainfall&extremely heavy falls at isolated places very likely over coastal Odisha and heavy to very heavy rainfall at isolated places over adjoining interior districts of Odisha, coastal districts of West Bengal and north coastal Andhra Pradesh.
5th Dec.: Heavy to very heavy rainfall at isolated places likely over West Bengal and adjoining north coastal Odisha.
It is likely that the north eastern states would also experience enhanced rainfall activity on 5th& 6th December, with isolated heavy to very heavy rainfall owing to the likely northeastward movement of the remnant of the system during the same period.
5th December 2021:
Odisha: Ganjam district:
Chhattarpur-9,
Purushottampur-8,
Behrampur,
Digapahandi, Gopalpur-
6 each; Khurda district:
Banpur-8; Jagatsinghpur
district: Paradip CWR-6,
Balikuda-5; Nayagarh
district: Nayagarh6; Puri
district: Astaranga-5;
Kendrapada district:
Garadapur5; Cuttack
district: Kantapada-5;
Jajpur district:
Chandikhol-5
6th December 2021:
Odisha: Jagatsinghpur
district: Erasama-23,
Paradip-20, Balikuda-
15, Kujanga-14,
Nuagaon-13, Tirtol-12,
Raghunathpur-9,
Jagatsinghpur-7;
Kendrapara district:
Marshaghai,
Garadpur13 each,
Rajnagar-12,
Mohakalpara-10,
Derabis-9, Kendrapara,
01/12/2021
0300 UTC
1st Dec.: Light to moderate rainfall at most places with heavy to very heavy rainfallat isolated places very likely over Andaman & Nicobar Islands.
2nd Dec.: Light to moderate rainfall at most places with heavy rainfall at isolated places very likely over Andaman & Nicobar Islands.
3rd Dec.: Light to moderate rainfall at many places with heavy rainfall at isolated places very likely to commence over north coastal Andhra Pradesh and south coastal Odisha from evening.
4th Dec.: Light to moderate rainfall at most places with heavy to very heavy rainfall at a few places &extremely

316
heavy falls at isolated places very likely over north coastal Andhra Pradesh and coastal Odisha, heavy to very heavy rainfall at isolated places over adjoining interior districts of Odisha and heavy falls at isolated places over Gangetic west Bengal.
5th Dec.: Light to moderate rainfall at most places with heavy to very heavy rainfall at isolated places likely over West Bengal and adjoining north coastal Odisha and heavy rainfall at isolated places over Assam & Meghalaya and Tripura.
Patamundai-8 each;
Puri district: Kakatpur12,
Astaranga-11, Delang,
Kanas-8 each,
Nimapara-7; Cuttack
district: Niali-10, Tangi-
Choudwar-7.
Gangetic West Bengal:
Hooghly district:
Tarakeshwar-18, Bagati-
13, Harinkhola-8;
Burdwan district:
Burdwan - 13,
Manteswar-7; Nadia
district: Kalyani -12;
North 24 Parganas
district: Barrackpur-12,
Dum dum-10, Salt lake-
9; West Midnapore
district: Mohanpur,
Kharagpur-11 each,
Midnapore, Kalaikunda -
9 each, Jhargram,
Lalgarh-7 each; Howrah
district: Uluberia -9;
Kolkata district: Alipore-
7; South 24 Parganas
district: Canning-7.
02/12/2021
0300 UTC
2nd Dec.: Heavy rainfall at isolated places likely over Andaman & Nicobar Islands.
3rd Dec.: Heavy to very heavy rainfall at isolated places over south coastal Odisha and heavy rainfall at isolated places over north coastal Andhra Pradesh.
4th Dec.: Heavy to very heavy rainfall&extremely heavy falls at isolated places very likely over south Odisha and north coastal Andhra Pradesh and heavy to very heavy rainfall at isolated places over north coastal Andhra Pradesh, north & interior districts of Odisha and also over Gangetic west Bengal.
5th Dec.: Heavy to very heavy rainfall at isolated places likely over West Bengal & Odisha and heavy rainfall at isolated places over Assam & Meghalaya and Tripura.
6th Dec.: Heavy to very heavy rainfall at isolated places likely over Assam & Meghalaya, Mizoram and Tripura.
03/12/2021
0300 UTC
3rd Dec.:Heavy to very heavy rainfall at isolated places
over north coastal Andhra Pradesh and south coastal
Odisha.
4th Dec.:Heavy to very heavy rainfall & extremely heavy
falls at isolated places very likely over south coastal Odisha
and north coastal Andhra Pradesh and heavy to very heavy
rainfall at isolated places over north coastal Odisha &
adjoining interior districts and also over coastal districts of
Gangetic west Bengal.
5th Dec.:Heavy to very heavy rainfall at isolated places
likely over Gangetic West Bengal & north Odisha and
heavy rainfall at isolated places over Assam & Meghalaya,
Mizoram and Tripura.
6th Dec.:Heavy to very heavy rainfall at isolated places
likely over Assam & Meghalaya, Mizoram and Tripura and
heavy rainfall at isolated places over west Bengal.
04/12/2021
0300 UTC
4th Dec.:Heavy to very heavy rainfall & extremely heavy
falls at isolated places very likely over coastal Odisha;
heavy to very heavy rainfall at isolated places over north
Coastal Andhra Pradesh, interior Odisha and coastal

317
districts of Gangetic West Bengal.
5th Dec.:Heavy to very heavy rainfall at isolated places
likely over Gangetic West Bengal & north Odisha and
heavy rainfall at isolated places over south Assam &
Meghalaya, Mizoram and Tripura.
6th Dec.:Heavy rainfall at isolated places likely over Assam
& Meghalaya, Mizoram and Tripura.
05/12/2021
0300 UTC
5th Dec.:Heavy to very heavy rainfall at isolated places
likely over north coastal & adjoining areas of Odisha &
Gangetic West Bengal. Heavy rainfall at isolated places is
also likely over south coastal Odisha during next 12 hours.
6th Dec.:Heavy to very heavy rainfall at isolated places
likely over south Assam & Meghalaya, Mizoram and
Tripura and heavy rainfall at isolated places over eastern
districts of Gangetic West Bengal.
Table 4.3.5.4: Verification of Squally/Gale wind forecast (2-6Dec)
Date/Base
Time of
observation
(UTC)
24 hr wind warning ending at 0830 hrs IST of next day Realised 24-
hour wind
ending at
0300 UTC of
date
30/11/2021
0300 UTC
• Squally wind speed reaching 40-50 kmph gusting to 60 kmph likely to prevail over Andaman Sea, today 30th November. It would increase gradually becoming 45-55 kmph gusting to 65 kmph over Andaman Sea, Andaman & Nicobar Islands and adjoining southeast Bay of Bengal, tomorrow, the 1st December.
• It would further increase to wind speed reaching 50-60 kmph gusting to 70 kmph over southeast & adjoining east-central Bay of Bengal, Andaman & Nicobar Islands & Andaman Sea on 2nd December.
• Gale winds speed reaching 65-75 kmph gusting to 85 kmph likely to prevail over central Bay of Bengal from the early morning of 3rd December and gradually increase becoming 90-100 kmph gusting to 110 kmph over northwest & adjoining west-central Bay of Bengal from the morning of 4th December for the subsequent 24 hours.
• Squally wind speed reaching 45-55 kmph gusting to 65 kmph likely to commence along & off North Andhra Pradesh – Odisha coast from the mid-night of 3rd December and increase gradually becoming 70-80 kmph gusting to 90 kmph from 4th Afternoon, for the subsequent 12 hours.
• Squally wind speed reaching 45-55 kmph gusting to 65 kmph also likely to commence along & off West Bengal coast from 4th December morning and become Gale wind speed reaching 60-70 kmph gusting to 80 kmph from the evening of 4th December for
Meteorol
ogical Office at
Puri reported
MSW of 18
knots during
1030-1130 hrs
IST (0500 to
0600 UTC) of
5th December,
high wind
speed recorder
at Paradeep
reported MSW
of 26 knots at
1530 hrs IST
(0995 UTC) of
5th December.
Dhamra Port
reported
south-
southeasterly
winds of

318
the subsequent 12 hours. intensity 32
knots gusting
to 35 knots at
4th/0600 UTC.
01/12/2021
0300 UTC
• Squally wind speed reaching 45-55 kmph gusting to 65 kmph likely to prevail over Andaman Sea, today the 1st December.
• It would further increase to wind speed reaching 50-60 kmph gusting to 70 kmph over southeast & adjoining east-central Bay of Bengal, Andaman & Nicobar Islands & Andaman Sea on 2nd December.
• Gale winds speed reaching 65-75 kmph gusting to 85 kmph likely to prevail over central Bay of Bengal from the early morning of 3rd December and gradually increase becoming 90-100 kmph gusting to 110 kmph over northwest & adjoining west-central Bay of Bengal from the morning of 4th December for the subsequent 24 hours.
• Squally wind speed reaching 45-55 kmph gusting to 65 kmph likely to commence along & off North Andhra Pradesh – Odisha coasts from the mid-night of 3rd December and increase gradually becoming 70-80 kmph gusting to 90 kmph from 4th morning, for the subsequent 12 hours.
• Squally wind speed reaching 45-55 kmph gusting to 65 kmph also likely to commence along & off West Bengal coast from 4th December morning and become Gale wind speed reaching 60-70 kmph gusting to 80 kmph from the evening of 4th December for the subsequent 12 hours.
02/12/2021
0300 UTC
• Squally wind speed reaching 45-55 kmph gusting to 65 kmph likely to prevail over southeast Bay of Bengal & adjoining Andaman Sea during next 6 hours.
• It would further increase to wind speed reaching 50-60 kmph gusting to 70 kmph over southeast & adjoining east-central Bay of Bengal, from today, the 2nd December evening.
• Gale winds speed reaching 65-75 kmph gusting to 85 kmph likely to prevail over central Bay of Bengal from the morning of 3rd December and gradually increase becoming 90-100 kmph gusting to 110 kmph over northwest & adjoining west-central Bay of Bengal from the morning of 4th December for the subsequent 24 hours.
• Squally wind speed reaching 45-55 kmph gusting to 65 kmph likely to commence along & off North Andhra Pradesh – Odisha

319
coasts from the mid-night of 3rd December and increase gradually becoming 70-80 kmph gusting to 90 kmph from 4th morning, for the subsequent 12 hours.
• Squally wind speed reaching 45-55 kmph gusting to 65 kmph also likely to commence along & off West Bengal coast from 4th December morning and become Gale wind speed reaching 60-70 kmph gusting to 80 kmph from the evening of 4th December for the subsequent 12 hours.
03/12/2021
0300 UTC
• Squally wind speed reaching 55-65 kmph gusting to 75 kmph over westcentral and adjoining southeast & eastcentral Bay of Bengal during next 06 hours.
• Gale winds speed reaching 70-80 kmph gusting to 90 kmph likely to prevail over westcentral & adjoining northwest Bay of Bengal from today evening and gradually increase becoming 90-100 kmph gusting to 110 kmph over northwest & adjoining west-central Bay of Bengal from the evening of 4th December for the subsequent 12 hours.
• Squally wind speed reaching 45-55 kmph gusting to 65 kmph likely to commence along & off North Andhra Pradesh – Odisha coasts from the mid-night of today, the 3rd December and increase gradually becoming 80-90 kmph gusting to 100 kmph from 4th evening, for the subsequent 12 hours.
• Squally wind speed reaching 45-55 kmph gusting to 65 kmph also likely to commence along & off West Bengal coast from 4th December evening and become Gale wind speed reaching 60-70 kmph gusting to 80 kmph from the morning of 5th December for the subsequent 12 hours.
04/12/2021
0300 UTC
• Gale wind, speed reaching 70-80 kmph gusting to 90 kmph, prevails over westcentral Bay of Bengal. It would gradually decrease becoming 60-70 kmph gusting to 80 kmph over northwest and adjoining westcentral Bay of Bengal by mid-night of today, the 4th December. It would decrease further becoming 50-60 gusting to 70 kmph from the morning of 5th December over northwest Bay of Bengal.
• Squally winds speed reaching 45-55 kmph gusting to 65 kmph likely to prevail along & off North Andhra Pradesh–Odisha coasts during next 12 hours. It will gradually increase becoming 55-65 gusting to 75 kmph till morning of 5th and squally winds speed reaching 50-60 kmph gusting to 70 kmph from 5th morning till afternoon. It would decrease thereafter gradually.
• Squally wind speed reaching 45-55 kmph gusting to 65 kmph also likely to commence along & off West Bengal coast from 4th December evening till the evening of 5th December and gradually decrease thereafter.
05/12/2021
0300 UTC
• Squally wind speed reaching 50-60 kmph gusting to 70 kmph prevails over northwest and adjoining westcentral Bay of Bengal. It would gradually decrease becoming 40-50 kmph gusting to 60 kmph over northwest and adjoining westcentral Bay of Bengal by evening of today, the 5th December. It would decrease further becoming 30-40 kmph gusting to 50 kmph over northwest Bay of Bengal by night of today, the 5th December.
• Squally winds speed reaching 45-55 kmph gusting to 65 kmph likely to prevail along & off North Andhra Pradesh coast during next 06 hours and along & off Odisha – West Bengal coasts during next 24 hours.

320
4.4 Annual Performance of cyclone landfall, track and intensity forecast
4.4.1 Track Forecast
Annual average track forecast error is calculated by considering the track forecast
errors of all the cyclones during the year. The mean error of each cyclone is weighted by
number of forecasts verified to calculate the annual average track forecast errors as
mentioned below. This is calculated for 12, 24, 36, 48, 60, 72, 84, 96, 108, 120 hr forecasts.
Where n1, n2, n3... are number of six hourly forecasts verified for cyclone 1, 2, 3.
And E1, E2, E3... are the average track forecast errors for cyclone n1, n2, n3.
Similarly, annual average CLIPER model-based track forecast errors are calculated.
Subsequently, skill is calculated for a given cyclone by comparing the six hourly operational
track forecast errors with track forecast errors of a reference model.
The annual average track forecast errors in 2021 have been 63 km, 91 km and 164
km, respectively for 24, 48 and 72hrs against the past five-year average error of 77, 117 and
159 km based on data of 2016-2020. The errors have been significantly lower during this
year as compared to long period average (LPA) (2016-20). The track forecast skills
compared to climatology and persistence forecast have been 75%, 82% and 68%
respectively for the 24, 48 and 72 hrs lead period which is much higher than long period
average of 2016-2020 (64%, 76% &78% respectively). The annual average track forecast
errors and skill during 2021 are presented in Fig. 4.4.1 (a-b).
Fig.4.4.1 Annual average (a) track forecast error (km) and (b) track forecast skill against the
climatology and persistence forecast during 2021 as compared to that during 2016-2020
4.4.2 Landfall Forecast
The annual average landfall forecast errors for the year 2021 have been 7 km, 16 km
and 20 km for 12, 24 and 48 hrs lead period against the average of past five years of 17 km,
40 km and 61.5 km during 2016-2020. The landfall time forecast errors have been 1.4, 1.3
and 3.0 hrs for 12, 24 and 48 hrs lead period during 2021 against the average of past five

321
years of 1.3, 2.5 and 5.0 hrs during 2016-2020. The annual average landfall point and time
forecast errors are presented in Fig. 4.4.2 (a-b).
Fig.4.4.2. Annual average (a) landfall point forecast error (km) and (b) landfall time forecast
skill against the climatology and persistence forecast as compared to that during 2016-2020
4.4.3 Intensity Forecast
The annual average intensity forecast error based on AE is the weighted mean of the
absolute error for each cyclone. Similarly, the annual average error is calculated by
persistence method. Based on these two errors, the intensity forecast skill with reference to
absolute error is calculated. Errors and skills are calculated for 12, 24, 36, 48, 60, 72, 84, 96,
108 and 120 hour forecasts.
The annual average intensity forecast error based on RMSE is calculated by taking
square root of the average of squared error between the forecast and observed intensity
values for 12, 24, 36, 48, 60, 72, 84, 96, 108 and 120 hours forecast period for every six
hourly forecast. Similarly, RMSE error based on persistence is calculated and hence the
skill.
The annual average absolute error (AE) in intensity forecast error (Fig.4.4.3 a-b) has
been 6.2 knots, 9.5 knots and 10.8 knots respectively for 24, 48 and 72 hrs lead period of
forecast against the past five year average of 7.9, 11.4 and 14.1 knots. The skill in terms of
AE compared to persistence forecast was 63.2%, 78.4% and 85.6% as compared to long
period average (2012-16) of 52.2%, 72.1% and 75.1% for 24, 48 and 72 hours lead period.
Fig.4.4.3. Annual average (a) absolute error (AE) in kts and (b) skill in % during 2021 as
compared to that during 2016-2020
The annual average root mean square error (RMSE) in intensity forecast error
(Fig.4.4.4 a-b) has been 8.0 knots, 11.1 knots and 15.8 knots respectively for 24, 48 and 72

322
hrs lead period of forecast against the past five year average of 9.9, 13.8 and 16.7 knots.
The skill in terms of RMSE compared to persistence forecast was 70.6%, 80.6% and 81.2%
as compared to long period average (2016-20) of 59.5%, 69% and 77.8% for 24, 48 and 72
hours lead period.
Fig.4.4.4. Annual average (a) root mean square error (RMSE) in kts and (b) skill in %
during 2021 as compared to that during 2016-2020

323
4.5. Interannual errors of TCs over north Indian Ocean
4.5.1. Track forecast error and skill
Inter-annual errors and skill in track forecast since 2003 are presented in Fig.4.5.1 a
& b and table 4.5.1 a & b. There has been significant improvement in annual average track
forecast errors and skill due to modernisation programme of IMD in 2009 with respect to
observation, analysis and prediction tools & techniques which has been further augmented
through improvement in observations, mainly from DWR and satellite and in terms of
improved numerical modelling including enhanced data assimilation, higher resolution,
improved physics etc.
There has been continuous improvement in track forecast accuracy with decrease in
track forecast errors at the rate of 6.2 km/year (62 km in 10 years) for 24 hrs lead period and
increase in skill at the rate of 3.4% per year (34% in 10 years) since 2003. Similarly, for 12
hrs lead period, there has been improvement in track forecast accuracy with decrease in
track forecast errors at the rate of 3.5 km/year (35 km in 10 years) and increase in skill at the
rate of 5.1% per year (51% in 10 years) since 2003.
Fig. 4.5.1 Inter-annual average track forecast (a) errors and (b) skill during 2021
Table. 4.5.1 (a) Inter-annual average Track forecast errors during 2003 to 2021
(Values shown in “()” indicate number of cases verified)
Year 12-hr 24-hr 36-hr 48-hr 60-hr 72-hr 84-hr 96-hr 108-hr 120-hr
2003 131
(41)
203
(41)
2004 97 (3) 165
(3)
2005 84
(32)
136
(26)
2006 66
(25)
127
(19)
2007 88
(29)
142
(24)
2008 94
(22)
110
(16)
2009 98 181 289 420 503 483

324
(32) (26) (16) (8) (6) (2)
2010 65
(56)
134
(48)
169
(38)
250
(29)
329
(23)
451
(19)
2011 52
(21)
98
(19)
153
(16)
195
(14)
191
(10)
181
(7)
2012 72
(16)
109
(13)
168
(8)
186
(6)
197
(4)
240
(2)
2013 63.7
(94)
109
(84)
135.1
(72)
156.9
(65)
175
(55)
194.7
(44)
205.1
(34)
251.3
(26)
304.9
(18)
296.4
(11)
2014 55
(49)
76.1
(44)
74.7
(38)
85.6
(32)
88.5
(25)
114.3
(20)
138.1
(14)
135.1
(10)
121.5
(6)
203 (3)
2015 54.7
(66)
94.4
(60)
114.7
(52)
150.9
(43)
174.9
(37)
209.1
(30)
244.3
(22)
283.3
(17)
303.5
(12)
356 (8)
2016 59.7
(58)
96.1
(50)
129.6
(42)
185.1
(34)
238
(27)
291.7
(21)
330.4
(15)
379.5
(9)
344.1
(4)
438.3
(2)
2017 43.7
(35)
61.4
(29)
87.2
(23)
107.6
(18)
190.1
(14)
189.6
(12)
292.5
(10)
304.2
(8)
158.7
(3)
159.7
(3)
2018 55.4
(127)
87.5
(111)
99.2
(97)
124.2
(80)
131.2
(63)
134.3
(51)
165.8
(34)
189
(24)
220.8
(16)
247.6
(7)
2019 41.0
(168)
68.6
(150)
87.8
(136)
103.7
(123)
120.4
(109)
148.6
(89)
177.7
(66)
217.8
(55)
261.3
(46)
337.5
(33)
2020 50.3
(62)
72.5
(51)
76.4
(44)
85.3
(36)
89.1
(27)
111.4
(21)
105.5
(7)
88.8
(5)
86.3
(3)
93.3
(1)
2021 43.7
(68)
62.9
(56)
82.6
(50)
91.4
(41)
105.7
(32)
164.0
(15)
248
(9)
15.3
(4)
Table. 4.5.1 (b) Inter-annual average track forecast skill (%) during 2003 to 2021
(Values shown in “()” indicate no. of cases)
Skill 12-hr 24-hr 36-hr 48-hr 60-hr 72-hr 84-hr 96-hr 108-hr 120-hr
2003 -19.8
(41)
6.3
(41)
2004 -61.7
(3)
29.5
(3)
2005 11.3
(32)
18.6
(26)
2006 3.4
(25)
13
(19)
2007 10.3
(29)
21.9
(24)
2008 15.9
(22)
53
(16)
2009 7
(32)
13.1
(26)
-8.4
(16)
1.5
(8)
2010 20.9
(56)
22.3
(48)
32.5
(38)
39
(29)
45.1
(23)
42.3
(19)
2011 49.5 54.5 56.1 58.5 70.4 78 (7)

325
(21) (19) (16) (14) (10)
2012 37.1
(16)
56.8
(13)
61.2
(8)
62.3
(6)
58.8
(4)
52.6
(2)
2013 39.1
(94)
41.6
(84)
53.5
(72)
62.5
(65)
67.3
(55)
70.9
(44)
2014 51.4
(49)
66
(44)
78.1
(38)
81.9
(32)
85.8
(25)
85.1
(20)
2015 32.3
(66)
36.8
(60)
48.8
(52)
50
(43)
57
(37)
57.3
(30)
62
(22)
62.3
(17)
67.7
(12)
69.6 (8)
2016 53.1
(58)
67.9
(50)
74.7
(42)
75.6
(34)
76.4
(27)
76
(21)
74.7
(15)
73.2
(9)
72.1
(4)
2017 50
(35)
68.1
(29)
73
(23)
77.2
(18)
2018 63.3
(127)
54.4
(111)
66.1
(97)
69.1
(80)
74.1
(63)
78.3
(51)
78.5
(34)
82.6
(24)
71.7
(16)
2019 62.4
(168)
67.6
(150)
72.4
(136)
78.5
(123)
77.1
(109)
77.3
(89)
77.6
(66)
78.1
(55)
78.7
(46)
78.8
(33)
2020 58.9
(62)
67.8
(51)
75.4
(44)
79.5
(36)
83
(27)
84.4
(21)
84
(7)
90.3
(5)
92.1
(3)
92.6
(1)
2021 61.2
(68)
74.6
(56)
78.9
(50)
81.8
(41)
80.3
(32)
68.4
(15)
50.1
(9)
4.5.2. Landfall point and time forecast errors
There has been an improvement in landfall point forecast accuracy at the rate of 15.3
km/year (153 km in 10 years) for 24 hrs lead period since 2003. Similarly, for 12 hrs lead
period, there has been improvement in landfall point forecast error at the rate of 7.7 km/year
(77 km in 10 years) since 2003. Considering the landfall time errors, there has been an
improvement at the rate of 0.22 hrs/year (2.2 hrs in 10 years) for 24 hrs lead period since
2003. Similarly, for 12 hrs lead period, there has been an improvement at the rate of 0.28
hrs/year (2.8 hrs in 10 years) for 12 hrs lead period since 2003.
Fig. 4.5.2 Annual average (a) Landfall Point errors (b) Landfall Time errors

326
Table 4.5.2. (a): Inter-annual average landfall point errors (value shown in “()” indicate
no. of cases)
Year 12-hr 24-hr 36-hr 48-hr 60-hr 72-hr 84-hr 96-hr 108-hr 120-hr
2003 142
(2)
257
(1)
2004 197
(1)
550
(1)
2005 137
(2)
167
(1)
2006 67
(2)
113
(2)
2007 80
(5)
102
(3)
2008 43
(4)
96
(4)
2009 57
(4)
119
(4)
117
(4)
114
(3)
2010 30
(5)
77
(5)
120
(4)
86
(3)
78
(3)
133
(3)
2011 64
(2)
137
(2)
94
(2)
134
(2)
150
(1)
140
(1)
2012 15
(2)
12
(2)
48
(2)
45
(2)
11
(2)
2013 31
(4)
29
(4)
70
(4)
102
(4)
108
(4)
109
(3)
2014 10
(1)
20
(1)
17
(1)
4
(1)
8
(1)
2
(1)
2015 48.8
(3)
80.7
(3)
48.8
(3)
129.2
(2)
170.1
(2)
165.2
(1)
284.5
(1)
272.7
(1)
403.8
(1)
435.9
(1)
2016 7.8
(2)
14.1
(2)
71.6
(2)
127.2
(2)
129.2
(2)
180.1
(2)
253.2
(1)
286
(1)
403.4
(1)
2017 19.1
(2)
50.4
(2)
29.8
(2)
59
(2)
2018 26.7
(8)
44
(7)
42.1
(7)
40.3
(5)
56.4
(5)
67.6
(3)
2019 8.9
(2)
27.1
(3)
21.9
(3)
34.7
(2)
15
(1)
37.2
(1)
2020 10
(6)
17.6
(5)
53.5
(5)
69.7
(4)
27.7
(2)
43
(1)
77
(1)
47
(1)
47
(1)
2021 6.8
(4)
16.4
(4)
10.6
(4)
19.8
(4)
97
(3)
158.5
(2)

327
Table 4.5.2 (b): Inter annual average landfall time errors (value shown in “()” indicate
no. of cases)
Year 12-hr 24-hr 36-hr 48-hr 60-hr 72-hr 84-hr 96-hr 108-hr 120-hr
2003 2
(2)
2
(1)
2004 10
(1)
4
(1)
2005 4.5
(2)
1
(1)
2006 4
(2)
12
(2)
2007 7.5
(5)
6.5
(3)
2008 3.5
(4)
10.5
(4)
2009 3.5
(4)
6
(4)
15 (4) 16
(3)
2010 1.8
(5)
2.9
(5)
5.2
(4)
2
(3)
2
(3)
1.2
(3)
2011 1.5
(2)
3
(2)
8.5
(2)
8.7
(2)
1
(1)
1
(1)
2012 1.3
(2)
3.8
(2)
2.3
(2)
1
(2)
3
(2)
2013 2.7
(4)
5
(4)
4.7
(4)
5.7
(4)
5.5
(4)
2.8
(3)
2014 0
(1)
0
(1)
4
(1)
4
(1)
3
(1)
1
(1)
2015 4.5
(3)
5.5
(3)
4
(3)
2.75
(2)
3.25
(2)
3.7
(1)
6.5
(1)
8.5
(1)
7.5
(1)
4.5 (1)
2016 0.8
(2)
3
(2)
6.3
(2)
9
(2)
5 (2) 6.8
(2)
3.5
(1)
2.5
(1)
5
(1)
2017 1 (2) 0.5
(2)
3.5
(2)
4.5
(2)
2018 1.9
(8)
2.8
(7)
3.7
(7)
4.9
(5)
4.7
(5)
7.4
(3)
6.4
(3)
15.5
(1)
14.5
(1)
2019 0.8
(2)
2.8
(3)
7.3
(3)
6.5
(2)
14.5
(1)
20.5
(1)
2020 0.8
(6)
2.4
(5)
4.5
(5)
2.8
(4)
2.3
(2)
2
(1)
0.5
(1)
1.5
(1)
0.5
(1)
2021 1.4
(4)
1.3
(4)
2.75
(4)
3
(4)
6.8
(3)
9.75
(2)

328
4.5.3 Inter-annual intensity forecast error and skill
Inter-annual errors and skill in intensity forecast since 2005 are presented in Fig. 4.5.3
(a & b) and 4.5.4 (a & b) and Tables 4.5.3 (a & b). As regards improvement in intensity
forecast based on AE, there has been decrease in errors at the rate of 0.49 knots/year (4.9
knots in 10 years) for 24 hrs lead period and increase in skill at the rate of 3.1% per year
(31% in 10 years) since 2005. Similarly, for 12 hrs lead period, there has been decrease in
intensity forecast errors at the rate of 0.27 knots/year (2.7 knots in 10 years) and increase in
skill at the rate of 2.0% per year (20% in 10 years) since 2003. As regards improvement in
intensity forecast errors based on RMSE, there has been decrease in errors at the rate of
0.53 knots/year (5.3 knots in 10 years) for 24 hrs lead period and increase in skill at the rate
of 3.0% per year (30% in 10 years) since 2005. Similarly, for 12 hrs lead period, there has
been decrease in intensity forecast errors at the rate of 0.34 knots/year (3.4 knots in 10
years) and increase in skill at the rate of 2.4% per year (24% in 10 years) since 2003.
Fig. 4.5.3 Annual average intensity forecast (kt) errors based on (a) AE (b) RMSE
Fig. 4.5.4 Annual average intensity forecast skill (%) based on (a) AE (b) RMSE

329
Table. 4.5.3 (a) Inter annual average Intensity forecast errors based on AE
(Values shown in “()” indicate no. of cases)
Year 12-hr 24-hr 36-hr 48-hr 60-hr 72-hr 84-hr 96-hr 108-hr 120-hr
2003 9.7 17.8
2004 7.5 15.8
2005 5.3
(31)
13.7
(23)
2006 9.8
(25)
15.8
(19)
2007 13.9
(27)
20
(20)
2008 5.7
(23)
9.5
(18)
2009 3.8
(33)
5.6
(26)
9.7
(18)
7.3
(11)
2 (5) 5 (1)
2010 8.1
(55)
12.2
(49)
15.8
(37)
16.6
(29)
13.9
(23)
20.5
(19)
2011 7.4
(21)
10.7
(19)
12.5
(17)
13.8
(14)
18.5
(10)
21.3
(7)
2012 6.1
(16)
7.4
(13)
6.8
(10)
8.6
(7)
7.9
(5)
6.9
(3)
2013 6.2
(94)
10.3
(84)
13.8
(73)
15.2
(63)
15.9
(54)
16.7
(42)
19.4
(34)
17.4
(26)
15.5
(18)
13.1 (11)
2014 8.6
(49)
12.7
(44)
16.5
(38)
18.9
(32)
19.5
(25)
17.3
(20)
15.6
(14)
20.5
(10)
19.3
(6)
16.9 (3)
2015 7.3
(66)
13.6
(60)
17.4
(52)
20.4
(43)
20.3
(37)
19.4
(30)
20
(22)
17.5
(17)
13.7
(12)
10.6 (8)
2016 4.6
(58)
7.2
(50)
8.5
(42)
8.3
(34)
9.7
(27)
11.2
(21)
14
(15)
18.4
(9)
9.5
(4)
5 (2)
2017 4.3
(35)
5.7
(29)
10.8
(23)
12.4
(18)
9 (14) 8.2
(12)
9 (10) 7.8
(8)
5 (3) 3.7 (3)
2018 4.8
(127)
8.2
(112)
12
(98)
11.6
(81)
12.8
(63)
12.9
(51)
12.9
(34)
13.8
(24)
13.3
(16)
9.2 (7)
2019 5.5
(168)
8.7
(150)
11.7
(136)
12.7
(123)
14.7
(109)
17.4
(89)
19.3
(66)
19.8
(55)
19.9
(46)
21.2 (33)
2020 5 (62)
7.1 (51)
8.7 (44)
8.8 (36)
9.7 (27)
9.3 (21)
10.8 (7)
13.9 (5)
8.7 (3)
4.3 (1)
2021 3.5 (68)
6.2 (56)
8.6 (50)
9.5 (41)
9.3 (32)
10.8 (15)
18.8 (9)
21 (4)

330
Table. 4.5.3 (b) Inter annual average Intensity forecast errors based on RMSE
(Values shown in “()” indicate no. of cases)
Year 12-hr 24-hr 36-hr 48-hr 60-hr 72-hr 84-hr 96-hr 108-hr 120-hr
2003 11.4 24.1
2004 8.5 17
2005 7.9
(31)
15.1
(23)
2006 12
(25)
18.6
(19)
2007 16.9
(27)
23.7
(20)
2008 7.1
(23)
11.8
(18)
2009 5.7
(33)
9.2
(26)
12.1
(18)
11.9
(11)
3.2
(5)
5
(1)
2010 12.5
(55)
17
(49)
21.6
(37)
22.9
(29)
16.9
(23)
28.3
(19)
2011 8.1
(21)
11.6
(19)
13.9
(17)
15.6
(14)
19.5
(10)
22.4
(7)
2012 7.2
(16)
8.7
(13)
8.3
(10)
11.7
(7)
8.5
(5)
7.8
(3)
2013 8.3
(94)
14.2
(84)
17.6
(73)
18.8
(63)
19.3
(54)
20
(42)
23.7
(34)
20.9
(26)
16.2
(18)
14.3
(11)
2014 11.7
(49)
15.2
(44)
20.6
(38)
23.5
(32)
23.5
(25)
19.7
(20)
18.5
(14)
22.2
(10)
21.2
(6)
17.4
(3)
2015 10.2
(66)
18.1
(60)
24.1
(52)
27.8
(43)
27.8
(37)
28
(30)
27.3
(22)
22.9
(17)
18.6
(12)
13.1
(8)
2016 5.9
(58)
9.1
(50)
10
(42)
10.1
(34)
11.3
(27)
12.6
(21)
15.9
(15)
19.9
(9)
13.1
(4)
5 (2)
2017 5.4
(35)
7.6
(29)
12.6
(23)
14.8
(18)
13.4
(14)
12.6
(12)
14.7
(10)
13.1
(8)
9.6
(3)
6.9
(3)
2018 6.4
(127)
9.8
(112)
12
(98)
14.4
(81)
12.8
(63)
15.1
(51)
15.3
(34)
16.2
(24)
15
(16)
12.7
(7)
2019 6.8
(168)
10.7
(150)
13.8
(136)
14.6
(123)
17.3
(109)
19.7
(89)
21.6
(66)
22.3
(55)
22.7
(46)
23.8
(33)
2020 6.8 (62)
9.5 (51)
11.8 (44)
12.4 (36)
12.7 (27)
11.2 (21)
12.5 (7)
15.6 (5)
10.1 (3)
4.3 (1)
2021 4.9 (68)
8 (56)
10.3 (50)
11.1 (41)
11.1 (31)
15.8 (15)
21.5 (9)
22.6 (4)
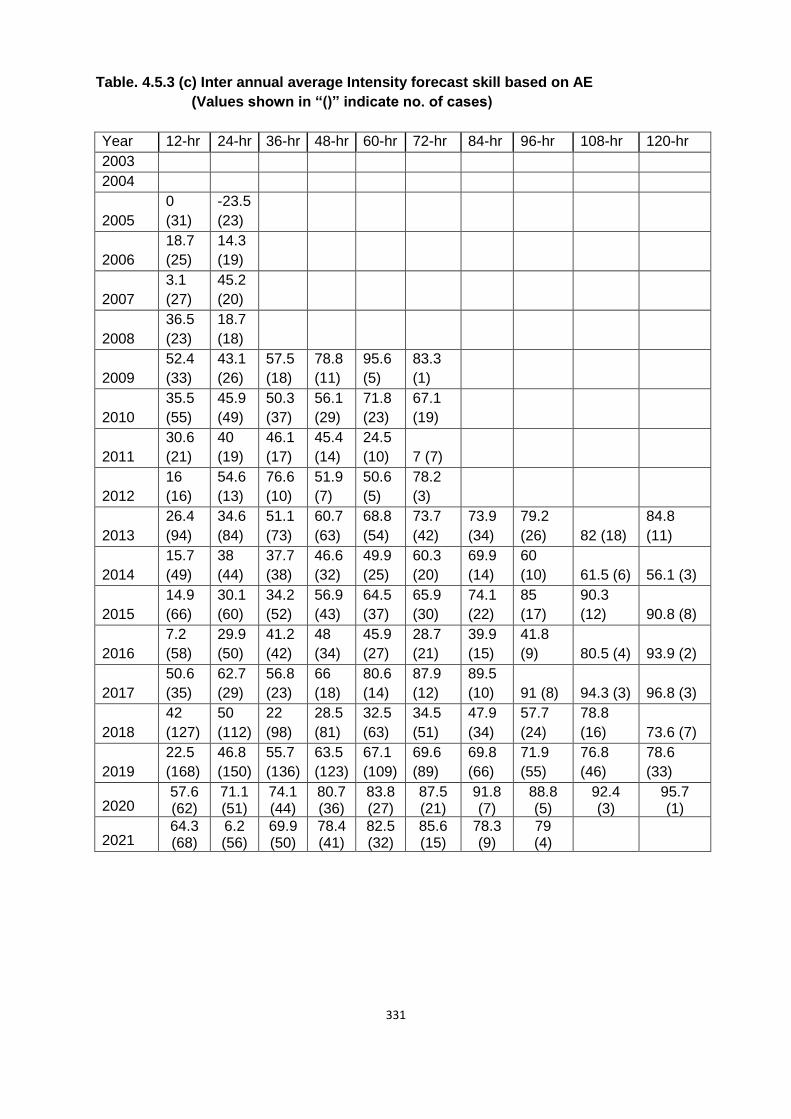
331
Table. 4.5.3 (c) Inter annual average Intensity forecast skill based on AE
(Values shown in “()” indicate no. of cases)
Year 12-hr 24-hr 36-hr 48-hr 60-hr 72-hr 84-hr 96-hr 108-hr 120-hr
2003
2004
2005
0
(31)
-23.5
(23)
2006
18.7
(25)
14.3
(19)
2007
3.1
(27)
45.2
(20)
2008
36.5
(23)
18.7
(18)
2009
52.4
(33)
43.1
(26)
57.5
(18)
78.8
(11)
95.6
(5)
83.3
(1)
2010
35.5
(55)
45.9
(49)
50.3
(37)
56.1
(29)
71.8
(23)
67.1
(19)
2011
30.6
(21)
40
(19)
46.1
(17)
45.4
(14)
24.5
(10) 7 (7)
2012
16
(16)
54.6
(13)
76.6
(10)
51.9
(7)
50.6
(5)
78.2
(3)
2013
26.4
(94)
34.6
(84)
51.1
(73)
60.7
(63)
68.8
(54)
73.7
(42)
73.9
(34)
79.2
(26) 82 (18)
84.8
(11)
2014
15.7
(49)
38
(44)
37.7
(38)
46.6
(32)
49.9
(25)
60.3
(20)
69.9
(14)
60
(10) 61.5 (6) 56.1 (3)
2015
14.9
(66)
30.1
(60)
34.2
(52)
56.9
(43)
64.5
(37)
65.9
(30)
74.1
(22)
85
(17)
90.3
(12) 90.8 (8)
2016
7.2
(58)
29.9
(50)
41.2
(42)
48
(34)
45.9
(27)
28.7
(21)
39.9
(15)
41.8
(9) 80.5 (4) 93.9 (2)
2017
50.6
(35)
62.7
(29)
56.8
(23)
66
(18)
80.6
(14)
87.9
(12)
89.5
(10) 91 (8) 94.3 (3) 96.8 (3)
2018
42
(127)
50
(112)
22
(98)
28.5
(81)
32.5
(63)
34.5
(51)
47.9
(34)
57.7
(24)
78.8
(16) 73.6 (7)
2019
22.5
(168)
46.8
(150)
55.7
(136)
63.5
(123)
67.1
(109)
69.6
(89)
69.8
(66)
71.9
(55)
76.8
(46)
78.6
(33)
2020 57.6 (62)
71.1 (51)
74.1 (44)
80.7 (36)
83.8 (27)
87.5 (21)
91.8 (7)
88.8 (5)
92.4 (3)
95.7 (1)
2021 64.3 (68)
6.2 (56)
69.9 (50)
78.4 (41)
82.5 (32)
85.6 (15)
78.3 (9)
79 (4)
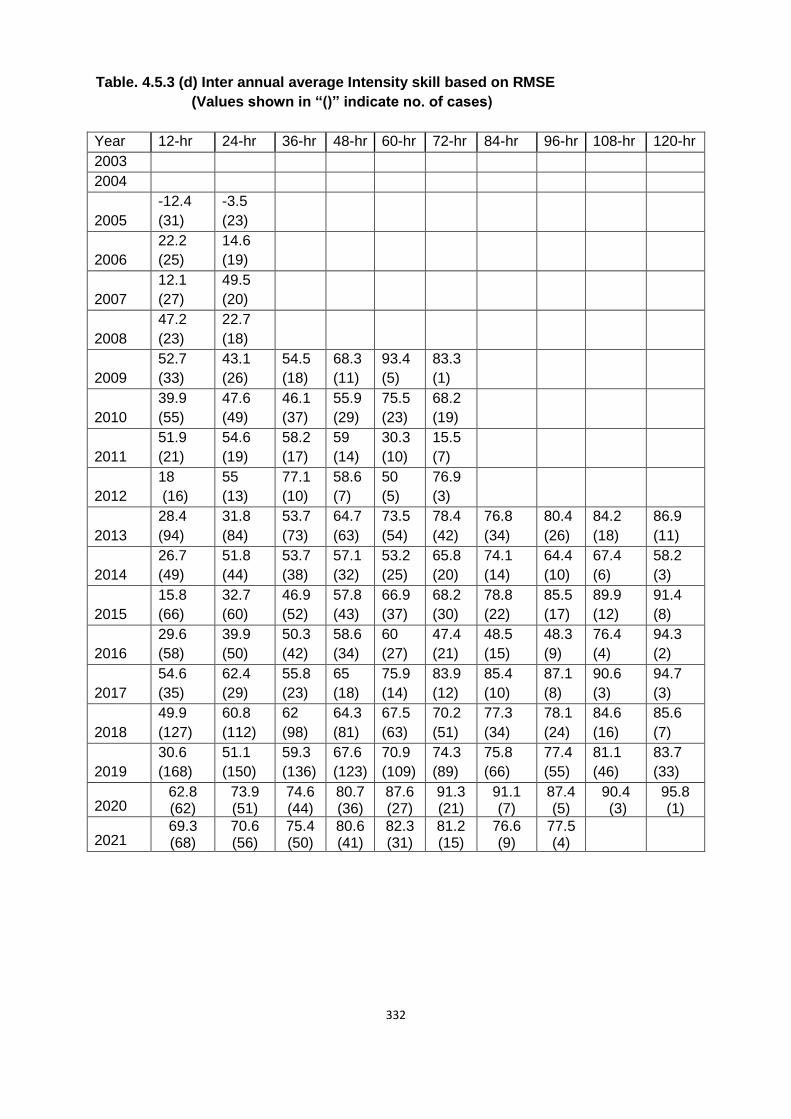
332
Table. 4.5.3 (d) Inter annual average Intensity skill based on RMSE
(Values shown in “()” indicate no. of cases)
Year 12-hr 24-hr 36-hr 48-hr 60-hr 72-hr 84-hr 96-hr 108-hr 120-hr
2003
2004
2005
-12.4
(31)
-3.5
(23)
2006
22.2
(25)
14.6
(19)
2007
12.1
(27)
49.5
(20)
2008
47.2
(23)
22.7
(18)
2009
52.7
(33)
43.1
(26)
54.5
(18)
68.3
(11)
93.4
(5)
83.3
(1)
2010
39.9
(55)
47.6
(49)
46.1
(37)
55.9
(29)
75.5
(23)
68.2
(19)
2011
51.9
(21)
54.6
(19)
58.2
(17)
59
(14)
30.3
(10)
15.5
(7)
2012
18
(16)
55
(13)
77.1
(10)
58.6
(7)
50
(5)
76.9
(3)
2013
28.4
(94)
31.8
(84)
53.7
(73)
64.7
(63)
73.5
(54)
78.4
(42)
76.8
(34)
80.4
(26)
84.2
(18)
86.9
(11)
2014
26.7
(49)
51.8
(44)
53.7
(38)
57.1
(32)
53.2
(25)
65.8
(20)
74.1
(14)
64.4
(10)
67.4
(6)
58.2
(3)
2015
15.8
(66)
32.7
(60)
46.9
(52)
57.8
(43)
66.9
(37)
68.2
(30)
78.8
(22)
85.5
(17)
89.9
(12)
91.4
(8)
2016
29.6
(58)
39.9
(50)
50.3
(42)
58.6
(34)
60
(27)
47.4
(21)
48.5
(15)
48.3
(9)
76.4
(4)
94.3
(2)
2017
54.6
(35)
62.4
(29)
55.8
(23)
65
(18)
75.9
(14)
83.9
(12)
85.4
(10)
87.1
(8)
90.6
(3)
94.7
(3)
2018
49.9
(127)
60.8
(112)
62
(98)
64.3
(81)
67.5
(63)
70.2
(51)
77.3
(34)
78.1
(24)
84.6
(16)
85.6
(7)
2019
30.6
(168)
51.1
(150)
59.3
(136)
67.6
(123)
70.9
(109)
74.3
(89)
75.8
(66)
77.4
(55)
81.1
(46)
83.7
(33)
2020 62.8 (62)
73.9 (51)
74.6 (44)
80.7 (36)
87.6 (27)
91.3 (21)
91.1 (7)
87.4 (5)
90.4 (3)
95.8 (1)
2021 69.3 (68)
70.6 (56)
75.4 (50)
80.6 (41)
82.3 (31)
81.2 (15)
76.6 (9)
77.5 (4)

333
4.6 Comparative analysis of forecast accuracy in recent five years (2017-21) as compared to previous five years (2012-16)
4.6.1 Landfall Forecast Error
Comparative analysis of landfall point error (LPE) and landfall time error (LTE) during
2017-21 vis-à-vis 2012-16 is presented in Fig. 4.6.1 (a & b). The LPE for 24, 48 and 72 hrs
lead period during 2017-21 were 30.7 km, 43.9km and 85.7 km against 35.9 km, 92.3 km
and 122.1 km respectively during 2012-16 which shows an improvement of 14.5%, 52.4%
and 29.8% respectively. The LTEs for 24 and 48 hrs lead period during 2017-21 were 2.2hrs
& 4.1hrs against 4.2hrs & 4.8hrs respectively during 2012-16 registering an improvement of
44.3% and 2.96 % for 24 and 48 hours lead period respectively.
Figure 4.6.1: Comparative average landfall (a) point and (b) time forecast errors during 2017-21
vis-à-vis 2012-16
4.6.2 Track forecast error and skill
The comparative analysis of average track forecast error and skill during 2017-21
and 2012-16 is presented in Fig.4.6.2. The average track forecast errors during 2017-21
were 73 km, 106 km & 144 km against 97 km, 149 km & 203 km during 2012-16 for 24, 48
and 72 hrs lead period respectively. There has been an improvement of 25%, 29% & 29% in
track forecast errors for 24, 48 and 72 hours lead period during 2017-21 with respect to
2016-2020. The 24, 48 and 72 hr average track forecast skill during 2017-21 were 65%, 77%
and 78% against 54%, 67% and 71% respectively during 2012-16 with an improvement of
12%, 10% and 7% for 24, 48 and 72 hours lead period during 2017-21 with respect to 2016-
2020.
Figure 4.6.2: Comparative Average track forecast (a) error and (b) skill during 2017-21 vis-à-vis 2012-16

334
4.6.3 Intensity forecast error and skill
The comparative analysis of average intensity forecast error and skill based on AE
and RMSE during 2017-21 and 2012-16 are presented in Fig.4.6.3 and 4.6.4 respectively.
The average intensity forecast error based on AE for 24hrs, 48hrs and 72hrs are 7.8 knots,
11.5knots and 14.2 knots during 2017-21 against 10.7knots, 15.5knots and 16.3knots during
2017-21. Based on RMSE the intensity forecast errors were 9.7 knots, 13.9 knots and 17.0
knots during 2017-21 against 14.4 knots, 20.8knots, and 21.1 knots during 2012-16. It can
be seen that there has been marginal improvement in intensity forecast during recent five
years (2017-21) as compared to previous five years (2012-16).
Figure 4.6.3.Comparative Average Intensity forecast errors (kts) based on (a) absolute error and (b) root mean square errors during 2017-21 vis-à-vis 2012-16
The average intensity forecast skill based on AE for 24hrs, 48hrs and 72hrs are 55.3%, 74.0% and 77.4% during 2017-21 against 35.2%, 55.7% and 66.8% during 2017-21. Based on RMSE the intensity forecast skill were 62.1%, 71.3% and 78.6% during 2017-21 against 39.0%, 59.6% and 72.2% during 2012-16. It can be seen that there has been marginal improvement in intensity forecast during recent five years (2017-21) as compared to previous five years (2012-16).
Figure 4.6.4 Comparative Average Intensity forecast skill(%) based on (a) absolute error and (b) root mean square errors during 2017-21 vis-à-vis 2012-16

335
4.7 Five Year Moving Average errors and skill over north Indian Ocean
It can be seen from Fig.4.7.1-4.7.3 that there has been continuous improvement in forecast
accuracy with decrease in landfall and track forecast errors and increase in skill over the
years. Due to modernization programme of IMD and other initiatives of MoES, the
improvement has been more significant since 2009. However, the rate of improvement in
intensity forecast over the years has been marginal as can be seen from Fig.4.7.3. The 36-
72 hours forecasts commenced from 2009 and it was further extended to 120 hrs from 2013
onwards.
Figure 4.7.1:Five Year Moving Average (a) Track Forecast Error (km) and (b) Track
Forecast Skill (%) of RSMC, New Delhi over North Indian Ocean
Figure 4.7.2: Five Year Moving Average Errors in (a) Landfall Point (km) and (b)
Landfall Time (hrs) of RSMC, New Delhi over north Indian Ocean
Figure 4.7.3: Five Year Moving Average Intensity Forecast (a) Absolute Error (kts) and
(b) Root Mean Square Error (kts) of RSMC, New Delhi over the NIO

336
Fig. 4.7.4: Five Year Moving Average Intensity Forecast skill based on (a) AE and (b)
RMSE of RSMC, New Delhi over North Indian Ocean
Table 4.7.1: Homogeneous comparison of official landfall forecast errors over north
Indian Ocean in 2021 with averages during 2016-20 and 2011-20.
Parameter Forecast Period (hr)
12 24 36 48 60 72
2021
Mean OFCL Landfall Point Error (km) 6.8 16.4 10.6 19.8 97.0 158.5
Mean OFCL Landfall Time Error (hr) 1.4 1.3 2.8 3.0 6.8 9.8
No. of cases 4 4 4 4 3 2
2016-20
Mean OFCL Landfall Point Error (km) 17.3 31.9 43.7 61.5 61.1 91.9
Mean OFCL Landfall Time Error (hr) 1.3 2.5 4.7 5.0 5.3 8.3
No. of cases 20 19 19 15 10 7
2011-20
Mean OFCL Landfall Point Error (km) 24.5 41.4 50.3 75.0 78.2 98.3
Mean OFCL Landfall Time Error (hr) 1.7 3.1 4.7 4.9 4.6 5.6
No. of cases 32 31 31 26 20 13
2021 OFCL Landfall Point Error relative to 2016-20 mean (%) 60.7 48.5 75.7 67.9 -58.7 -72.5
2021 OFCL Landfall Time Error relative to 2016-20 mean (%) -5.8 50.0 41.5 40.0 -28.9 -17.5
2020 OFCL Landfall Point Error relative to 2011-20 mean (%) 72.2 60.4 78.9 73.7 -24.0 -61.3
2021 OFCL Landfall Time Error relative to 2011-20 mean (%) 19.1 59.7 41.5 38.8 -48.6 -74.1
OFCL: Official
The landfall forecast was issued upto 24 hrs from 2003 to 2008, upto 72 hrs from 2009
to 2012 and 120 hrs from 2013 onwards,

337
Table 4.7.2 Homogeneous comparison of OFCL & CLIPER Track Forecast Errors over
NIO in 2021 with Averages for 2016-20 and 2011-20
The track forecast was issued upto 24 hrs from 2003 to 2008, upto 72 hrs from 2009 to
2012 and 120 hrs from 2013 onwards, OFCL: Official
Parameter Forecast Period (hr)
12 24 36 48 60 72 84 96 108 120
2021 Mean OFCL Forecast Error (km) 43.7 62.9 82.6 91.4 105.7 164.0 248.1 15.3
- -
2021 Mean CLIPER Error (km) 112.6 247.8 391.4 502.6 554.6 518.4 497.6 11.6
- -
2021 Mean OFCL Skill wrt CLIPER (%) 61.2 74.6 78.9 81.8 80.3 68.4 50.1 -
- -
2021 No. of cases 68.0 56.0 50.0 41.0 32.0 15.0 9.0 4.0 - -
2016-20 Mean OFCL Forecast Error (km) 49.0 77.5 94.7 116.8 137.0 158.8 196.9 225.8 245.3 311.3
2016-20 Mean CLIPER Error (km) 123.4 217.6 334.2 484.2 579.6 720.9 858.0 1071.2 1134.5 1428.2
2016-20 Mean OFCL Skill wrt CLIPER (%) 60.3 64.4 71.7 75.9 76.4 78.0 77.1 78.9 78.4 78.2
2016-20 No. of cases 450 391 342 291 240 194 132 101 72 46
2011-20 Mean OFCL Forecast Error (km) 52.5 84.7 103.6 127.0 145.3 167.3 199.3 230.6 254.8 309.4
2011-20 Mean CLIPER Error (km) 113.8 219.2 342.2 472.2 587.9 727.2 850.7 1033.5 1097.5 1306.8
2011-20 Mean OFCL Skill wrt CLIPER (%) 53.8 61.4 69.7 73.1 75.3 77.0 76.6 77.7 76.8 76.3
2011-20 No. of cases 696 611 528 451 371 297 202 154 108 68
2021 relative to 2016-20 mean (%) 10.9 18.8 12.8 21.8 22.9 -3.3 -26.0 - - -
2021 CLIPER error relative to 2016-20 mean (%) 8.8 -13.9 -17.1 -3.8 4.3 28.1 42.0 - - -
2021 Skill relative to 2016-20 mean (%) -1.5 -15.8 -10.1 -7.8 -5.2 12.3 34.9 - - -
2021 relative to 2011-20 mean (%) 16.9 25.7 20.3 28.0 27.2 2.0 -24.5 - - -
2021 CLIPER error relative to 2011-20 mean (%) 1.1 -13.0 -14.4 -6.4 5.7 28.7 41.5 - - -
2020 Skill relative to 2011-20 mean (%) -13.7 -21.6 -13.2 -11.9 -6.7 11.2 34.5 - - -

338
Table 4.7.3 Homogeneous comparison of OFCL & Persistence Intensity Forecast
Errors based on Absolute Error over NIO in 2021 with Averages for 2016-
20 and 2011-20
Parameter Forecast Period (hr)
12 24 36 48 60 72 84 96 108 120
2021 Mean OFCL
Forecast Error (km) 3.5 6.2 8.6 9.5 9.3 10.8 18.7 21.1 - -
2021 Mean Persistence
Error (km) 9.7 16.7 28.7 44.3 52.9 74.7 86.1 - - -
2021 Mean OFCL Skill
wrt Persistence (%) 64.3 63.2 69.9 78.4 82.5 85.6 78.3 78.9 - -
2021 No. of cases 68 56 50 41 32 15 9 4 - -
2016-20 Mean OFCL
Forecast Error (km) 5 7.9 10.9 11.4 12.7 14.1 15.8 17 16.8 17.2
2016-20 Mean
Persistence Error (km) 7.9 16.6 34.2 40.9 47.8 56.7 67.9 72.9 84.5 98.7
2016-20 Mean OFCL
Skill wrt Persistence (%) 36.5 52.2 68 72.1 73.3 75.1 76.7 76.7 80.1 82.6
2016-20 No. of cases 450 392 343 292 240 194 132 101 72 46
2011-20 Mean OFCL
Forecast Error (km) 5.7 9.2 12.3 13.3 14.5 15.3 16.9 17.4 16.4 15.7
2011-20 Mean
Persistence Error (km) 8.3 17.1 32.5 4- 47.5 55.8 68.8 78.1 89.1 96.1
2011-20 Mean OFCL
Skill wrt Persistence
(%)
30.5 46.2 62 66.6 69.5 72.5 75.5 77.8 81.7 83.6
2011-20 No. of cases 696 612 533 451 371 296 202 154 108 68
2021 OFCL error
relative to 2016-20
mean (%)
31 22.5 21.1 16.2 27.2 23.7 -18.1 -24 - -
2021 Persistence error
relative to 2016-20
mean (%)
-22.8 -0.6 16.1 -8.3 -10.8 -31.7 -26.9 -37.1 - -
2021 Relative Skill wrt
20116-20 -76.4 -21 -2.8 -8.7 -12.5 -13.9 -2.1 -2.9 - -
2021 OFCL error
relative to 2011-20
mean (%)
39.7 33.4 3- 28.5 36.1 29.8 -10.8 -21.5 - -
2021 Persistence error
relative to 2011-20
mean (%)
-17.4 2.6 -54 -2.6 32.7 73.1 86.9 94.9 - -
2021 Relative Skill wrt
2011-20
-
110.8 -36.8 -12.7 -17.7 -18.7 -18 -3.7 -1.5 - -
The intensity forecast was issued upto 24 hrs during 2003 to 2008, 72 hrs during 2009-
12 and 120 hrs from 2013 onwards, OFCL: Official

339
Table 4.7.4 Homogeneous comparison of OFCL & Persistence Intensity Forecast
Errors based on Root Mean Square Error over NIO in 2021 with Averages
for 2016-20 and 2011-20
The intensity forecast was issued upto 24 hrs during 2003- 2008, 72 hrs during 2009-
12 and 120 hrs from 2013 onwards
OFCL: Official
Parameter Forecast Period (hr)
12 24 36 48 60 72 84 96 108 120
2021 Mean OFCL
Forecast Error (km) 4.9 8.0 10.3 11.1 11.1 15.8 21.5 22.6 - -
2021 Mean Persistence
Error (km) 9.7 16.7 28.7 44.3 52.9 74.7 86.1 100.0 - -
2021 Mean OFCL Skill wrt
Persistence (%) 64.3 63.2 69.9 78.4 82.5 85.6 78.3 78.9 - -
2021 No. of cases 68 56 50 41 32 15 9 4 - -
2016-20 Mean OFCL
Forecast Error (km) 6.5 9.9 12.5 13.8 14.9 16.7 18.6 19.9 19.9 20.9
2016-20 Mean
Persistence Error (km) 12.2 24.4 33.5 44.7 60.1 75.2 84.2 91.3 111.3 134.9
2016-20 Mean OFCL Skill
wrt Persistence (%) 46.7 59.5 62.6 69.0 75.2 77.8 77.9 78.3 82.1 84.5
2016-20 No. of cases 450 392 343 292 240 194 132 101 72 46
2011-20 Mean OFCL
Forecast Error (km) 7.7 12.0 15.4 17.2 18.0 18.9 20.6 20.5 19.3 19.0
2011-20 Mean
Persistence Error (km) 12.5 24.7 36.3 48.5 63.1 77.0 90.7 102.7 119.5 129.1
2011-20 Mean OFCL Skill
wrt Persistence (%) 38.7 51.3 57.5 64.5 71.5 75.5 77.2 80.0 83.9 85.3
2011-20 No. of cases 696 612 533 451 371 296 202 154 108 68
2021 OFCL error relative
to 2016-20 mean (%) 24.7 19.4 18.1 19.8 25.4 5.2 -15.2 -13.9 - -
2021 Persistence error
relative to 2016-20 mean
(%)
-30.8 -11.3 -24.5 -28.3 -4.7 -12.1 -9.0 -10.2 - -
2021 Relative Skill wrt
2016-20 -48.3 -18.8 -20.5 -16.8 -9.5 -4.4 1.6 0.9 - -
2021 OFCL error relative
to 2011-20 mean (%) 36.5 33.7 33.4 35.5 38.2 16.3 -3.9 -10.0 - -
2021 Persistence error
relative to 2011-20 mean
(%)
-26.9 -10.0 -37.7 15.4 50.9 80.5 90.1 96.1 - -
2021 Relative Skill wrt
2011-20 -79.3 -37.7 -31.2 -25.0 -15.1 -7.7 0.8 3.1 - -

340
Acknowledgement
India Meteorological Department (IMD) and RSMC New Delhi duly acknowledge the
contribution from various national and international organizations/institutes for their
contribution in early warning services against various cyclonic disturbances over the
North Indian Ocean during 2019.
World Meteorological Organisation (WMO) and all the 13 WMO/ESCAP Panel
member countries including Bangladesh, Iran, Maldives, Myanmar, Pakistan,
Qatar, Sri Lanka, Saudi Arabia, Sultanate of Oman, Thailand, United Arab
Emirates, Yemen.
All sister organisations of Ministry of Earth Sciences including National Centre
for Medium Range Weather Forecasting Centre (NCMRWF), Indian Institute
of Tropical Meteorology (IITM), Indian National Centre for Ocean Information
Services (INCOIS), National Institute of Ocean Technology (NIOT).
Research institutes including IIT Bhubaneswar, IIT Delhi and Indian Space
Research Organisation (ISRO).
Various international modeling centres including European Centre for Medium
Range Weather Forecasting (ECMWF), UK Meteorological Office, National
centre for Environmental Prediction (NCEP), USA, Japan Meteorological
Agency and Meteo-France
Various international meteorological satellite groups/institutes providing the
cloud imageries and products related to cyclonic disturbances over north
Indian Ocean region through open access
Various central and state disaster management agencies, stakeholders, press
& electronic media and general public
We also acknowledge the contribution and support from various Divisions/Centres of
IMD including Area Cyclone Warning Centres (ACWCs) Chennai, Mumbai, Kolkata,
Cyclone Warning Centres (CWCs) Bhubaneswar, Visakhapatnam,
Thiruvananthapuram & Ahmedabad, various Regional Meteorological Centres,
Meteorological Centres, Meteorological Offices, Doppler Weather Stations along the
east and west coast of India, National Weather Forecasting Centre, Numerical
Weather Prediction Division, Satellite and Radar Division, Surface & Upper Air
Instruments Divisions, Information System and Services Division,
Agrometeorological Advisory Services Division and Central Aviation Meteorology
Division of IMD.

[[[[
DAMAGE DUE TO EXTREMELY SEVERE CYCLONIC STORM ‘TAUKTAE’
Uprooted trees in Goa Damaged Kutcha House (PTI)
House Collapses into the Sea In Kasargod
(Kerala)
Rough Sea waves crash against the Bhagavathi
Prem Sinken Dredger, at Surathkal Beach near
Mangaluru (PTI)
Indian Navy in the coastal village of Chellanam
in Ernakulam district (Kerala) which was heavily
hit by tidal waves
Fishing boat damage due to cyclone at
Jaafrabaad fishing harbor
Related Documents