GROUP OF TEN REPORT ON CONSOLIDATION IN THE FINANCIAL SECTOR January 2001

Welcome message from author
This document is posted to help you gain knowledge. Please leave a comment to let me know what you think about it! Share it to your friends and learn new things together.
Transcript
GROUP OF TEN
REPORT ON CONSOLIDATION
IN THE FINANCIAL SECTOR
January 2001

The present publication can be obtained through the websites of the BIS, the IMF and theOECD:
www.bis.orgwww.imf.orgwww.oecd.org
© All rights reserved. Brief excerpts may be reproduced or translated provided thesource is stated.
ISBN 92-9131-611-3

i
Table of Contents
Introduction and summary of findings and policy implications.................................................... 1
1. Introduction.................................................................................................................. 1
2. Key findings and policy implications .......................................................................... 2
3. Extended summary....................................................................................................... 9
Chapter I: Patterns of consolidation ............................................................................................ 31
1. Introduction................................................................................................................ 31
2. Methods of consolidation........................................................................................... 31
3. Patterns in transaction activity ................................................................................... 32
4. Patterns in the structure of the financial sector .......................................................... 42
5. Conclusion ................................................................................................................. 59
Annex I.1 Securities exchanges and consolidation............................................................. 60
Chapter II: Fundamental causes of consolidation ....................................................................... 65
1. Introduction................................................................................................................ 65
2. Framework ................................................................................................................. 65
3. Forces encouraging consolidation.............................................................................. 70
4. Forces discouraging consolidation............................................................................. 77
5. Future trends .............................................................................................................. 81
Tables and charts (Chapter II) ............................................................................................ 85
Annex II.1 Interviews – country synopses ......................................................................... 98
Annex II.2 Interviews – technical appendix ..................................................................... 115
Annex II.3 Chronological list of key regulatory changes................................................. 117
Chapter III: Effects of consolidation on financial risk .............................................................. 125
1. Introduction.............................................................................................................. 125
2. A working definition of systemic risk...................................................................... 126
3. Effects of consolidation in the United States ........................................................... 127
4. Effects of consolidation in Europe........................................................................... 147
5. Effects of consolidation in Japan ............................................................................. 161
Annex III.1 The effects of consolidation on managing systemic risk in Canada:the 1998 Bank Merger Decision ....................................................................................... 208
Annex III.2 Potential effects of strategic alliances on financial risk ................................ 211
Annex III.3 Consolidation and the liquidity of financial markets .................................... 212
Chapter IV: The impact of financial sector consolidation on monetary policy......................... 223
1. Introduction.............................................................................................................. 223

ii
2. The impact of consolidation on the implementation of monetary policy.................223
3. The impact of financial sector consolidation on the transmission ofmonetary policy ................................................................................................................230
4. Some further possible consequences of consolidation for monetary policy ............239
5. Some caveats and research challenges .....................................................................242
6. Conclusions ..............................................................................................................243
Chapter V: The effects of consolidation on efficiency, competition and credit flows .............247
1. Introduction ..............................................................................................................247
2. Consolidation and efficiency....................................................................................248
3. Consolidation and competition.................................................................................265
4. Consolidation and the availability of credit flows....................................................278
5. Policy issues .............................................................................................................286
Annex V.1 Antitrust rules and their implementation in specific countries.......................289
Annex V.2 Case studies ....................................................................................................298
Chapter VI: The effects of consolidation on payment and settlement systems .........................309
1. Introduction ..............................................................................................................309
2. Types of consolidation .............................................................................................309
3. Causes of and obstacles to consolidation .................................................................312
4. The effects of consolidation .....................................................................................314
5. Conclusions ..............................................................................................................323
Annex VI.1: TARGET......................................................................................................326
Working Party on Financial Sector Consolidation ....................................................................329
Data Annex A: Patterns in consolidation transactions...............................................................333
Data Annex B: Patterns in the structure of the financial sector.................................................405

1
Introduction and summary of
findings and policy implications
1. IntroductionThe ongoing consolidation of financial institutions is one of the most notable contemporaryfeatures of the financial landscape both within and across many industrial countries. Inrecognition of this fact, and its potential implications for public policy in a variety of areas, inSeptember 1999 Finance Ministers and central bank Governors of the Group of Ten asked theirDeputies to conduct a study of financial consolidation and its potential effects. This Reportpresents the results of that study.
To conduct the study, a Working Party was established under the auspices of finance ministryand central bank deputies of the Group of Ten.1 From the beginning, it was recognised that thesubject matter was substantial and that there was a need to utilise expertise from a wide range ofsources. Thus, the Working Party was organised into six Task Forces, each of which wascharged with addressing a key aspect of financial consolidation and its potential effects. TheseTask Forces addressed the patterns of financial consolidation observed in the 11 G10 nationsplus Australia and Spain (the study nations), the causes of consolidation, and the potentialeffects of consolidation on financial risk, monetary policy, financial institution efficiency,competition and credit flows, and payment and settlement systems.
The Working Party sought to employ a broad definition of financial services, but also to limitthe work’s scope to manageable proportions. Thus, the definition of the financial servicesindustry used here includes commercial banking, investment banking, insurance and, in somecases, asset management. Most other types of financial activity, such as exchanges and specialtyfinance, are excluded.
When attempting to understand and interpret this Report’s findings and implications, it iscritical to keep some general principles in mind. First, a core objective of the study is to identifythe potential impacts of consolidation, not to judge whether consolidation in combination withother developments has led to a net change in, say, financial risk or the competitiveenvironment. In practice, isolating such “partial” effects is extremely difficult. Consolidation isonly one of several powerful forces causing change in the financial system, and each of theseforces affects and is affected by the others. Nevertheless, a systematic attempt to focus on thepossible effects of consolidation has, in the Working Party’s judgement, significant value added.
Second, it is well known that international comparisons are inherently difficult for manyreasons. The current study certainly suffers from this complexity, and the study is organisedalong national lines in a number of places for precisely this reason.2 Still, financial consolidation
1 The Working Party was chaired by Roger W Ferguson, Jr, Vice-Chairman of the Board of Governors of theFederal Reserve System. The Working Party comprised finance ministry and central bank staff from Australia,Belgium, Canada, France, Germany, Italy, Japan, the Netherlands, Spain, Sweden, Switzerland, the UnitedKingdom and the United States, and representatives from the Bank for International Settlements, the EuropeanCentral Bank, the European Commission, the International Monetary Fund and the Organisation for EconomicCo-operation and Development.
2 In some cases international comparisons have become easier over time. For example, creation of the euro hasfacilitated comparisons among the member states.

2
and its close cousin financial globalisation are phenomena that cut across national boundaries inmany dimensions. Thus, international comparisons are imperative, and a second core objectiveof the study is to identify common (but not necessarily identical or equally important) patterns,causes, and implications across the study nations.
Although it was not the Working Party’s intention to develop specific policy recommendations,an important objective was to identify key areas in which financial consolidation supports theneed for new or continued, and in some cases accelerated, policy development. These areas arediscussed in some detail in this chapter and in the separate chapters written by the individualTask Forces.
Lastly, as indicated above, the study adopted a broad definition of financial services. However,as a practical matter, the predominant portion of existing research and to a great extent theavailable data are focused on the banking industry in all the study nations. Thus, the study ismore bank-centric than was originally intended. This emphasis may not be too distortingbecause, as discussed below, most merger and acquisition activity in the financial sector duringthe 1990s involved banking firms. Nevertheless, one of the conclusions of the study is that insome cases more research and data collection would be helpful for non-bank financial servicefirms and markets. The remainder of this chapter proceeds as follows. Section 2 presents a brieflisting of the study’s key findings and policy implications. Little effort is made here to explainthe reasoning and evidence behind the findings and implications identified by the WorkingParty. Section 3 is a more extended discussion of findings and policy implications that alsosummarises the analysis behind the Working Party’s conclusions.
2. Key findings and policy implicationsThe study’s most important findings and their policy implications, organised by topic, may belisted briefly.
Findings
Patterns(1) There was a high level of merger and acquisition (M&A) activity in the 1990s amongfinancial firms in the 13 countries studied. In addition, the level of activity increased over time,with a noticeable acceleration in consolidation activity in the last three years of the decade. As aresult, a significant number of large, and in some cases increasingly complex, financialinstitutions have been created.
(2) Most mergers and acquisitions involved firms competing in the same segment of thefinancial services industry and the same country, with domestic mergers involving firms indifferent segments the second most common type of transaction.
(3) Cross-border M&As were less frequent, especially those involving firms in differentindustry segments. However, cross-border activity was relatively strong at insurance companiesand in joint ventures and strategic alliances outside the United States.
(4) Most M&A activity during the 1990s in the financial sector involved banking firms.Acquisitions of banking firms accounted for 60% of all financial mergers and 70% of the valueof those mergers.
(5) The number of joint ventures and strategic alliances increased over the 1990s, withespecially large increases in the last two years.
(6) The number of banking firms decreased in almost every country during the decade andthe concentration of the banking industry, as measured by the percentage of a country’s depositscontrolled by the largest banks, tended to increase. If other banking activity, such as off-balance
3
sheet activities, were included in the size measure, the increase in banking concentration wouldbe even greater.
(7) The structure of banking industries continues to differ greatly across countries,ranging from very unconcentrated in a few nations (the United States and Germany) to highlyconcentrated in about half of the nations in the study (Australia, Belgium, Canada, France, theNetherlands and Sweden).
(8) There are no consistent patterns across countries in changes in the number ofinsurance firms or concentration in the insurance industry during the 1990s. Also, patterns oftendiffered for life and non-life insurance companies in the same country.
(9) Many specific activities of the securities industry, such as underwriting, are dominatedby a small number of leading institutions. It is unclear, however, whether this pattern changedmuch over the 1990s.
(10) Over-the-counter (OTC) derivatives markets grew dramatically in the 1990s, withnotional value quadrupling between 1992 and 1999. Concentration measures in worldwidederivatives markets were at modest levels at the end of the decade.
Causes
(1) According to the practitioners interviewed, the primary motives for financialconsolidation are cost savings and revenue enhancements.
(2) The most important forces encouraging consolidation are improvements ininformation technology, financial deregulation, globalisation of financial and real markets, andincreased shareholder pressure for financial performance. With respect to globalisation, the eurohas accelerated the speed of financial market integration in Europe and encourages cross-borderactivity, partly through consolidation.
(3) Important factors discouraging consolidation are diverse domestic regulatory regimesand corporate and national cultural differences.
(4) Consolidation is likely to continue, but the likelihood of specific future scenarios isimpossible to assess with confidence. Possible scenarios, none of which are mutually exclusive,include (a) continuation of the current trend towards globally active universal financial serviceproviders; (b) the emergence of more functionally specialised financial firms within a givensegment of the financial industry; and (c) continued consolidation, but a more radical form ofspecialisation through the gradual “deconstruction” of the supply chain via the outsourcing ofcertain activities (eg internet services) to both financial and non-financial third parties.
Financial risk
(1) The potential effects of financial consolidation on the risk of individual institutions aremixed, the net result is impossible to generalise, and thus a case by case assessment is required.The one area where consolidation seems most likely to reduce firm risk is the potential for(especially geographic) diversification gains. Even here, risk reduction is not assured, as therealisation of potential gains is always dependent upon the actual portfolio held. Afterconsolidation some firms shift towards riskier asset portfolios, and other risks, such as operatingrisks and managerial complexities, may increase. More broadly, there is no guarantee that costsavings or efficiency gains will be realised.
(2) Systemic financial risk is most likely to be transmitted to the real economy through thewholesale activities of financial institutions and markets, including payment and settlementsystems.
(3) In part because the net impact of consolidation on individual firm risk is unclear, thenet impact of consolidation on systemic risk is also uncertain. However, it seems likely that if alarge and complex banking organisation became impaired, then consolidation and any attendant

4
complexity may have, other things being equal, increased the probability that the “work-out” or“wind-down” of such an organisation would be difficult and could be disorderly. Because suchfirms are the ones most likely to be associated with systemic risk, this aspect of consolidationhas most likely increased the probability that a work-out could have broad implications.
(4) Another critical element in evaluating the potential for consolidation to affect systemicrisk is assessing the extent of interdependencies among large and complex financialorganisations. A high degree of interdependency would suggest the potential for systemic risks.
(5) Evidence suggests that interdependencies between large and complex bankingorganisations have increased over the last decade in the United States and Japan, and arebeginning to do so in Europe. Although a causal link has not been established, these increasesare positively correlated with measures of consolidation. Areas of increased interdependencythat are most associated with consolidation include interbank loans, market activities such asOTC derivatives, and payment and settlement systems.
(6) Partly as a result of consolidation, non-bank financial institutions, not just banks, havethe potential to be sources of systemic risk.
(7) Consolidation also appears to be increasing the possibility that even a medium-sizedforeign bank (or perhaps a non-bank financial institution) from a large nation would be apotential source of instability to a relatively small host country. The possibility of loss ofdomestic ownership of a small nation’s major banks has, other things being equal, alsoincreased.
(8) It appears that consolidation, and especially any resulting increase in firms’complexity, has had an ambiguous effect on the potential for market discipline to control therisk-taking of large and complex financial institutions. On the one hand, increased disclosureshave probably improved firm transparency and encouraged market discipline. On the otherhand, increased complexity has made assessment of a firm’s financial condition more difficult,and firms’ increased size has the potential to augment moral hazard problems.
(9) Consolidation may encourage the further development of capital markets, especially inJapan, with potential benefits for financial stability.
Monetary policy(1) The potential effects of consolidation on the implementation of monetary policydepend on whether consolidation has an impact on the market for central bank balances or themarket(s) used by the central bank to adjust the supply of such balances. Consolidation couldreduce competition in these markets, increasing the cost of liquidity for some firms andimpeding the arbitrage of interest rates between markets. In addition, consolidation could affectthe performance of the markets if the resulting large financial firms behave differently fromtheir smaller predecessors.
(2) Virtually all central banks in the study nations suggest that the impact of consolidationon these markets has so far been minimal, and consolidation is not expected to be a significantconcern in the foreseeable future, although in some cases it may prompt minor changes inaspects of policy implementation.
(3) Financial consolidation may also alter the channels through which the monetarytransmission mechanism links monetary policy actions to the rest of the economy. The“monetary channel” concerns the transmission of interest rates across financial markets byarbitrage along the yield curve and across financial products. The “bank lending channel”operates through the supply of bank loans to borrowers without direct access to financialmarkets. The “balance sheet channel” operates through the effect of monetary policy on thevalue of collateral, and thus on the availability of credit to those requiring collateral to obtainfunds.

5
(4) According to central banks and the few empirical studies, there is little evidence thatconsolidation has significantly affected any of these channels.
(5) Central banks have not identified significant effects of consolidation on the volatilityor liquidity of financial markets, nor do they think it has substantially complicated interpretationof movements in indicator variables such as monetary aggregates.
(6) Consolidation has encouraged the development of very large and complex financialfirms, and this trend is expected to continue. In the event of financial difficulties at such firms,central banks would need to consider carefully the appropriate provision of emergency liquidity,as well as whether and for how long the stance of monetary policy should be adjusted in thelight of the possible macroeconomic impact of such difficulties.
Efficiency, competition and credit flows
(1) Evidence suggests that only relatively small banks could generally become moreefficient from an increase in size. However, changes in technology and market structure mightaffect scale and scope economies in the future. For deals consummated over the last decade,there is some evidence of efficiency improvement, especially on the revenue side. Mergers andacquisitions typically seem to transfer wealth from the shareholders of the bidder to those of thetarget.
(2) In the securities industry, research based on US data suggests that economies of scaleexist, but mainly among smaller firms. Economies of scope do not appear to be generallyimportant in the securities industry.
(3) As with commercial banks, smaller insurance companies could probably reduce theircosts by taking advantage of potential economies of scale. However, the limited evidenceavailable and the rapid changes anticipated in the future make it difficult to assess the potentialefficiency gains from insurance consolidations.
(4) Research results and views of industry participants regarding the potential forefficiency gains from consolidation may differ because: (a) participants may not look at costreductions or revenue enhancements relative to peer group trends; (b) participants may focus onabsolute cost savings rather than on measures of efficiency; (c) research results are for thetypical merger, while some consolidations do result in efficiency gains; and (d) pastconsolidations may have suffered from restrictive regulations that may not hold in the future.
(5) The effects of consolidation on competition depend on the demand and supplyconditions in the relevant economic markets, including the size of any barriers to entry by newfirms.
(6) For retail banking products, evidence on both the demand and supply side suggeststhat markets for a number of key products are geographically local. Research generally findsthat higher concentration in banking markets may lead to less favourable conditions forconsumers, especially in markets for small business loans, retail deposits and payment services.Results are, however, weaker for the 1990s than for the previous decade.
(7) Markets for wholesale banking products, investment banking services, money marketsand foreign exchange trading, derivatives, and asset management are normally national orinternational in scope. However, evidence suggests that investment banks may be exerting somedegree of market power.
(8) Geographic markets for most insurance activities appear to be national (statewide inthe United States). In recent years, the insurance market has generally become morecompetitive, although the extent of competition seems to vary significantly across products andcountries.
(9) It seems clear that barriers to entry have decreased with the deregulation andglobalisation of financial markets.

6
(10) The continued evolution of electronic finance could expand greatly, or even eliminate,existing geographic limits of financial markets and lower entry barriers, thereby altering thepotential effects of consolidation. However, the potential benefits of electronic finance shouldnot be exaggerated. For example, electronic finance may also reduce competition because of anincrease in customer switching costs.
(11) Statistical studies of the effect of consolidation of banks on small business lending areavailable for only a couple of countries (Italy and the United States). These studies suggest thatbanks reduce the percentage of their portfolio invested in small business loans afterconsolidation. What is relevant, however, is the effect of consolidation on the total availabilityof credit to small business and whether it is associated with more accurate pricing of risk.Studies using US data find that other banks and new entrants tend to offset the reduction in thesupply of credit to small businesses by the consolidating banks. Similar results hold for Italy,where only a shift away from the worst borrowers is detected.
(12) New technologies, such as credit scoring models, may have somewhat encouragedsmall business lending, and thus offset to some degree the tendency of larger banks to lend tolarger customers. However, the benefits to date seem quite limited. In addition, technology willnot necessarily reduce the cost, and may increase the relative cost, of processing the informationtypically used in relationship lending, thus disadvantaging borrowers who do not, for example,qualify for a sufficiently high credit score.
Payment and settlement systems(1) Consolidation has led to a greater concentration of payment and settlement flowsamong fewer parties within the financial sector. Interbank transactions may increasingly becomein-house transactions.
(2) Because of the significant economies of scale in electronic payment technologies, thelarge institutions resulting from consolidation may be better able to invest in new, often costlytechnologies, and to decrease unit costs by capturing economies of scale.
(3) Emerging global firms that participate in multiple systems are pressuring the operatorsof payment and settlement systems to enhance their systems, sometimes through consolidation.
(4) A reduction in the number of institutions providing payment and settlement servicesbelow a certain level might result in higher prices and lower incentives for innovation.Consolidation among systems, however, may decrease, increase or have no effect oncompetition from the customer’s point of view. The competitive effects of system consolidationlargely depend on the combination of such factors as the governance structure of the survivingsystem, access criteria, market demand for downstream services, and economies of scale.
(5) The risk implications of the consolidation of payment and settlement systems arecomplex. On the one hand, consolidation may help to improve the effectiveness of institutions’credit and liquidity risk controls. On the other hand, consolidation may lead to a significant shiftof risk from settlement systems to customer banks and third-party service providers. In addition,it may lead to a greater proportion of on-us large-value payments, which may raise questionsabout the certainty of final settlement and the systemic implications of the concentration ofpayments within a few banks. For example, if a major payment processor were to fail or werenot able to process payment orders, systemic risks could arise. These developments have alsoled to some convergence of risk considerations between payment and settlement systemoverseers and traditional bank safety and soundness authorities.
(6) The emergence of multinational institutions and specialised service providers withinvolvement in several payment and settlement systems in different countries, as well as theincreasing liquidity interdependence of different systems, further serves to accentuate thepotential role of payment and settlement systems in the transmission of contagion effects.

7
(7) At the interbank systems infrastructure level, central banks have made major effortsover the past decades to reduce and contain systemic risk by operating and promoting real-timegross settlement systems, and by insisting on effective risk control measures in net settlementsystems. To the extent that these efforts have increased the robustness of interbank systems’ riskcontrols, they should help to dampen and contain any contagion effects being transmittedthrough the payment system.
Policy implicationsThe Working Party has identified a variety of areas that could benefit from continued policydevelopment involving financial risk, monetary policy, competition and credit flows, andpayment and settlement systems.
Financial risk
Existing policies and procedures appear adequate to contain individual firm and systemic risksboth now and in the intermediate term. However, the current study is quite supportive ofcontinued policy development on the following topics.
(1) Both crisis prevention and crisis management could be improved by additionalcommunication and cooperation among central banks, finance ministries, and the range of otherfinancial supervisors, both domestically and internationally.
(2) Important components of improved crisis prevention and management are effectiveand efficient policies and operating procedures for acting promptly to deter and resolve apotential crisis. A central element here, particularly in the light of consolidation’s contributionto the creation of very large and complex financial organisations, is how to act in ways thatminimise moral hazard.
(3) Crisis management and the moral hazard incentives associated with large and complexfinancial institutions could be eased considerably by augmented contingency planning forworking out a troubled large and complex financial institution in an orderly way.
(4) The probabilities of both an individual firm experiencing severe financial difficultiesand of a systemic crisis could be lowered by more effective risk-based supervision of financialinstitutions. A critical component of these efforts should be risk-based capital standards that aretied more closely to economic risk.
(5) Both crisis prevention and crisis management could be enhanced by clearerunderstanding of how best to deal with non-bank financial institutions, including the treatmentof non-bank entities that are part of a financial conglomerate that includes a bank.
(6) Improved market discipline has the potential to decrease the probabilities of individualfirm and systemic crises. A number of strategies for improving market discipline seempotentially promising, including augmented disclosures, improved risk management, strongerincentives for risk control by owners and managers, and improved accounting conventions.
(7) Assessment of the likelihood of a systemic crisis, and the understanding of itspotential implications, could be improved by the collection and analysis of data that are bettertargeted on such concerns. The monitoring and evaluation of individual firm data, bothtraditional (or improved) accounting and market data, in combination with data on firms’interdependencies, financial markets, and domestic and international macroeconomic variables,might yield valuable insights into risks posed by interdependencies and possibly improve earlywarning systems.

8
Monetary policy
Although financial sector consolidation appears to have neither impeded the implementation ofmonetary policy nor altered significantly the transmission mechanism of monetary policy, threeareas of policy interest should be highlighted.
(1) Central banks can be reasonably confident when setting monetary policy that frequentreviews of the data allow them to take account of most changes in the relationship between theirtarget interest rates and developments in financial markets and the real economy, even if thereasons for the changes are unclear. However, identifying those reasons may help establish howpersistent those changes are likely to be.
(2) It would be prudent for central banks to remain alert to the implications of anyreduction in the competitiveness of the key financial markets involved in monetary policyimplementation that might be caused by future consolidation.
(3) Similarly, central banks ought to bear in mind that financial consolidation may, overtime, change the way in which the bank lending and the balance sheet channels of the monetarypolicy transmission mechanism work.
Competition and credit flows
(1) Policymakers should carefully examine claims of substantial efficiency gains byfinancial institutions proposing major consolidations, especially in cases where a merger couldraise significant issues of market power.
(2) The impact of consolidation on competition can be assessed only by using empiricallysupported definitions of the relevant product and geographic markets. Such empirical supportshould be updated regularly.
(3) The impact of technological changes on competition could be more powerful forhouseholds than for small firms, because standardised techniques such as credit scoring modelsare more suited to households.
(4) To increase competition in an environment that is reducing significantly the number ofproviders of financial services, consideration could be given to reducing obstacles to themobility of customers across financial service providers.
(5) To the extent that consolidation may harm small business lending, the problems facedby small firms might be alleviated if alternative sources of finance to traditional bank lendingare developed.
(6) Cross-industry competition may benefit consumers by encouraging competition onexisting and new products.
(7) Effective antitrust policy implementation needs data on market shares, prices andquantities in key financial services and products. Financial institutions already provide some ofthe relevant data. However, it would be helpful to enrich the available information, especially atthe firm level.
Payment and settlement systems
(1) Because of consolidation, central bank oversight of interbank payment systems isbecoming more closely linked with traditional bank safety and soundness supervision at theindividual firm level. Increasing cooperation and communication between banking supervisorsand payment system overseers may be necessary both domestically and cross-border.
(2) At the current time, it does not appear that consolidation has adversely affectedcompetition in the provision of payment and securities settlement services. It may be advisable,however, for government authorities to continue to monitor competition in the payment systemas short-term effects of consolidation may not be indicative of longer-term effects.
9
(3) In specific cases, public authorities may want to consider removing potential obstaclesto consolidation if such action would enable the market to develop initiatives aimed at reducingrisks and enhancing efficiency in the field of payment and securities settlement.
(4) With regard to risk management, central banks and bank supervisors should carefullymonitor the impact of consolidation on the payment and settlement business, and should definesafety standards when appropriate. In particular, central banks, in conjunction with banksupervisors, may need to consider various approaches, possibly including standards, that couldbe used to limit potential liquidity, credit, and operational risks stemming from concentratedpayment flows through a few very large players participating in payment systems. With regardto major payment systems, the Core Principles for Systemically Important Payment Systemsnow provide a key set of evaluative standards for the relevant authorities.
3. Extended summary
Patterns
Firms can combine with each other in a number of ways. The most common approaches aremergers and acquisitions (M&As), which combine independent firms under common control,and joint ventures and strategic alliances, which enhance inter-firm cooperation withoutcombining separate entities. Patterns in the number and total value of mergers, acquisitions,joint ventures and strategic alliances among financial institutions are examined during the 1990sin the 13 countries covered by this study. The structures of the banking, insurance and securitiesindustries are then described to illustrate some of the effects of this consolidation, and otherfactors.
Patterns in transaction activityMergers and acquisitions are considered separately from joint ventures and strategic alliances.In some cases, trends in consolidation are similar across all of the study nations. In other cases,there are substantial differences in the experiences of individual countries.3
Broad patterns in merger and acquisition activity
(1) There was a high level of M&A activity in the 1990s among financial firms in the 13countries studied. In addition, the level of activity increased over time, with a noticeableacceleration in consolidation activity in the last three years of the decade. The annual number ofdeals increased threefold during the 1990s and the total value of deals increased almost tenfoldin the 13 reference countries considered as a whole. As a result, a significant number of large,and in some cases increasingly complex, financial institutions have been created.
(2) The average value of M&A transactions increased substantially during the last fewyears of the 1990s. This increase was widespread across the study nations.
(3) Most M&A activity during the 1990s in the financial sector involved banking firms.Acquisitions of banking firms accounted for 60% of all financial mergers and 70% of the valueof those mergers in the study nations.
3 M&A activity is examined separately using either the target or the acquiring firm as the classifying criterion.Results are most often quite similar using either criterion, and the findings summarised here are, unless notedotherwise, based on results using the target firm. In addition, although the data used are the best available, theclassification of transactions within industries and countries can sometimes be problematic and information onthe value of transactions is not known in many cases.

10
(4) Most mergers and acquisitions involved firms competing in the same segment of thefinancial services industry and the same country, with domestic mergers involving firms indifferent segments of the overall industry the second most common type of transaction.
(5) Cross-border M&As were less frequent, especially those involving firms in differentindustry segments.
(6) Most domestic mergers involved banking organisations, but cross-border deals wereroughly evenly divided between banks and insurance firms.
(7) All types of M&As, whether within one country or cross-border and whether withinone industry segment or across segments, increased in frequency and value during the 1990s.
(8) Overall, financial firms in the 13 countries studied were net acquirers. That is, in theaggregate, firms in these countries acquired financial firms in the rest of the world more oftenthan firms in the rest of the world acquired firms in the study nations.
Merger and acquisition patterns in individual regions and countries
(9) Using a variety of measures, the United States accounted for about 55% of M&Aactivity during the 1990s, in part due to its historically large number of relatively small financialfirms. However, it is also the case that many very large US banking firms expanded theirgeographic footprint by acquiring other very large banks, especially in the later part of thedecade.
(10) The overall level of M&A activity as a percentage of GDP varied across countries,from relatively high levels in Belgium, Switzerland, the United Kingdom and the United Statesto relatively low levels in Canada, Germany and Japan.
(11) Trends in the number and size of M&As over time varied across countries. France, theNetherlands and Switzerland showed little growth in the number of deals over the 1990s, whileJapan showed a very rapid increase in the number of transactions at the end of the decade.Regarding average value, the end of the decade showed Belgium and Switzerland withparticularly large increases.
(12) Financial firms in Japan and the United States tended to focus more on domesticM&As, while other countries, notably Belgium, were more heavily involved in cross-borderdeals. In large part because of legal restrictions, deals across industry segments were relativelyless prevalent in Japan and the United States than in other countries.
(13) In the United States, financial mergers were more heavily concentrated in banking,while Australia, Canada, the Netherlands and the United Kingdom had a greater proportion ofM&As in the insurance, securities and other segments of the financial industry.
(14) In Europe, roughly two thirds of M&A activity, as measured by the value of theEuropean firm acquired, occurred during the decade’s last three years.
(15) In Europe, there were a number of relatively large cross-border acquisitions ofinsurance firms. Many domestic acquisitions of European insurance companies were by firms inother segments of the financial industry.
Joint ventures and strategic alliances
(16) The number of joint ventures and strategic alliances increased over the 1990s, withespecially large increases in the last two years.
(17) US firms accounted for nearly half of all joint ventures and strategic alliances, andthese were overwhelmingly domestic arrangements.
(18) In the other 12 countries overall, cross-border joint ventures and strategic allianceswere more common than domestic deals, a strikingly different result than for M&As.
11
Patterns in the structure of the financial sector
International comparisons of industry structures are very difficult because of differences indefinitions and measurement across countries. Nevertheless, some broad similarities anddifferences in industry structures can be distinguished.
(1) The importance of the banking and insurance industries, as measured by the ratio ofindustry assets to GDP, tended to increase during the 1990s in the study nations, especially inEurope.
(2) The number of banking firms in each country tended to decrease during the decadeand the concentration of the banking industry, as measured by the percentage of a country’sdeposits controlled by the largest banks, tended to increase. If other banking activity, such asoff-balance sheet activities, were included in the size measure, the increase in bankingconcentration would be even greater.
(3) The structure of banking industries continues to differ greatly across countries,ranging from very unconcentrated in a few nations (the United States and Germany) to highlyconcentrated in about half of the nations in the study (Australia, Belgium, Canada, France, theNetherlands and Sweden).
(4) The increase in the concentration of the banking industry during the 1990s wasrelatively great in Belgium, Canada, Italy and the United States and relatively small in Japanand the United Kingdom.
(5) There are no consistent patterns across countries in changes in the number ofinsurance firms or concentration in the insurance industry during the 1990s. Also, structuralpatterns often differed for life and non-life insurance companies in the same country.
(6) Many specific activities of the securities industry, such as underwriting, are dominatedby a small number of leading institutions. It is unclear, however, whether this pattern changedmuch over the 1990s.
(7) Over-the-counter derivatives markets grew dramatically in the 1990s, with notionalvalue quadrupling between 1992 and 1999. Concentration measures in worldwide derivativesmarkets were at modest levels at the end of the decade.
Fundamental causesThe fundamental causes of consolidation are examined using the extensive body of researchliterature and interviews conducted by Task Force members with 45 selected industryparticipants and experts from the study nations. Interviewees were asked for their opinionsbased on a common interview guide.4
The analysis distinguishes between motives for consolidation and the environmental factors thatinfluence the form and pace of consolidation. In practice, motives and environmental factors areintertwined, but analysis is facilitated by treating each separately. Environmental factors aredivided into two categories: those encouraging and those discouraging financial consolidation.
Motives for consolidation
Both motives and environmental factors vary over time, across countries, across industrysegments, and even across lines of business within a segment. In the interviews, these variousdimensions were explored and the contrast in the responses across categories was indeedsubstantial. Nevertheless, some common themes emerge.
4 Summaries of each country’s interview responses are presented in an annex to Chapter II of the full report.

12
Cost savings
(1) Mergers and acquisitions can lead to reductions in costs for a variety of reasons. Theexisting research literature, which focuses on cost savings attributable to economies of scale,economies of scope, or more efficient allocation of resources, fails to find much evidencesuggesting that cost savings constitute an important outcome of mergers and acquisitions.
(2) A large majority of interviewees pointed to economies of scale as a very importantmotivating factor for consolidations involving firms that operate within the same country andthe same industry segment. They viewed economies of scope as a moderately important factorunderlying cross-segment M&As. Reasons for the differences between research results and theviews of practitioners are discussed in the section on Efficiency, Competition and Credit Flows,below.
Revenue enhancement
(3) Consolidation can lead to increased revenues through its effects on firm size, firmscope (through either product or geographic diversification), or market power. Researchsuggests that mergers may provide some opportunities for revenue enhancement either fromefficiency gains or from increased market power.
(4) Interviewees indicated that revenue enhancement due to increased size was amoderately important factor motivating domestic within-segment mergers, while revenueenhancement due to increased product diversity was a moderately to very important factorunderlying domestic cross-segment mergers. Revenue enhancement was also viewed as a fairlyimportant motivator for cross-border consolidation.
Other motives
(5) Other potential motives for consolidation include risk reduction, change inorganisational focus and managerial empire building. Interviewees viewed all of these factors asat most slightly important.
Environmental factors encouraging consolidation
Research and interviews have revealed a number of important factors encouraging consolidationamong financial service providers.
Improvements in information technology
(1) New technological developments have encouraged consolidation because of their highfixed costs and the need to spread these costs across a large customer base. At the same time,dramatic improvements in the speed and quality of communications and information processinghave made it possible for financial service providers to offer a broader array of products andservices to larger numbers of clients over wider geographic areas than had been feasible in thepast.
(2) Interviewees perceived technological advances to be a moderately to very importantforce encouraging consolidation in the financial services industry.
Deregulation
(3) Over the past 20 years, many governments have removed important legal andregulatory barriers to financial industry consolidation. The removal of these barriers has openedthe way for increased M&As, both within and across national boundaries and both within andacross financial industry segments.
(4) The majority of interviewees ranked deregulation as an important factor encouragingconsolidation.

13
Globalisation
(5) Globalisation is, in many respects, a by-product of technological change andderegulation. Its influence as a factor encouraging consolidation has been strongest among firmsengaged in the provision of wholesale financial services, highlighting the importance of theexpansion of capital markets. As non-financial firms expand the geographic scope of theiroperations, they expect their financial service providers to be able to meet their changing needs,which may also encourage consolidation.
Shareholder pressures
(6) Increased competition has helped to squeeze profit margins, resulting in shareholderpressure to improve performance. Importantly, shareholders have gained power relative to otherstakeholders in recent years. This development is expected to continue, as it is the result of astructural move towards the institutionalisation of savings.
(7) The interplay of all of these factors has put increased pressure on financial institutionsto improve profitability. Consolidation has in many cases seemed an attractive way toaccomplish this objective.
The euro
(8) Although the impact of the euro on financial sector consolidation in Europe is stilldifficult to assess, there are reasons to believe that the euro is stimulating consolidation inEurope. These reasons relate primarily to the euro-induced changes in financial markets inEurope, which provide new opportunities for realising economies of scale and revenueenhancement through consolidation.
(9) The euro has not significantly influenced consolidation in countries outside Europe.
Environmental factors discouraging consolidation
Two key factors continue to discourage financial consolidation: regulation and culturaldifferences.
Regulation
(1) Deregulation has played an important role in encouraging consolidation amongfinancial service providers over the past two decades. However, remaining legal and regulatoryrestrictions (eg competition policies and policies limiting foreign ownership of financialinstitutions) and differences in regulations across countries (eg capital standards) continue todiscourage some types of consolidations, especially those that involve cross-border activity.
(2) Interviewees frequently cited legal and regulatory constraints as an importantimpediment to mergers and acquisitions.
Cultural differences
(3) Cultural differences, which include different corporate cultures and corporategovernance regimes, as well as differences in language or national customs, appear to beimportant impediments to consolidation, especially on the cross-border and cross-productlevels.
(4) Regulation and cultural differences can have particularly strong deterrent effects onhostile takeovers of financial institutions. In addition, the existence of strong informationasymmetries between potential acquirers and potential targets in appraising illiquid financialassets probably discourages hostile takeovers.
14
Future trends
On balance, financial consolidation is likely to continue. At least three reasonable and notmutually exclusive scenarios can be distinguished, and the future balance among thesepossibilities is impossible to project with any reasonable degree of confidence.
(1) Continuation of the current trend towards globally active universal financial serviceproviders. Under this scenario, M&As both within segments of the financial industry and acrosssegments would continue, as well as between financial and non-financial entities (wherepermitted by law).
(2) Continued consolidation resulting in functionally specialised financial firms. Underthis scenario, firms would become more specialised as they grow in part through mergers offirms within a given segment of the financial industry, combined with the spinning-off of non-core lines of business.
(3) Continued consolidation along with a gradual "deconstruction" of the supply chain offinancial services. In this scenario, in some ways a more extreme form of scenario (2), firmsspecialise in the production of particular components of financial services or in the distributionto end users of products obtained from specialised producers (eg internet services) either withinor outside the traditional financial services industry.
As the costs of merging rise, particularly between large entities, looser forms of consolidation,such as strategic alliances or joint ventures, may become attractive alternatives within thecontext of any of these scenarios.
Financial risk
Financial consolidation can affect the risk both of individual financial institutions and of asystemic financial crisis. Thus, both types of risk are analysed below. Because different nations,or sometimes geographic groupings of nations, can have very distinct economic characteristics,risk is analysed separately for the United States, Europe and Japan.5 The discussion focuses onthe effects of consolidation on financial risk that are judged to be common across the regions,effects that are relatively concentrated in a particular region, and the implications of both forpolicy development.
Common effects in the United States, Europe and JapanAlthough the evaluation of financial risk for each of the three geographic regions used acommon analytical framework, authors were given wide latitude to pursue their topics from theperspectives most appropriate for their area. Interestingly, this approach identified a largenumber of common themes across the nations in the three regions regarding the potential effectsof financial consolidation on financial risk. These include:
(1) The potential effects of financial consolidation on the risk of individual financialinstitutions are mixed, and the net result impossible to generalise. Indeed, the analysis stronglyindicates that, when it comes to evaluating individual firm risk, a case by case assessment isrequired. The one area where consolidation seems most likely to reduce firm risk is the potentialfor diversification gains, although even here the possibilities are complex. For example,diversification gains seem likely to accrue from consolidation across regions of a given nationand from consolidation across national borders. Although such gains are most likely to arise dueto asset diversification across geographies, some gains may also derive from geographicdiversification on the liabilities side of the balance sheet. In addition, diversification gains mayresult from consolidation across financial products and services, although research suggests the
5 An annex to Chapter III considers the potential impacts of consolidation on managing systemic risk in Canada.

15
potential benefits may be fairly limited. On the other hand, after consolidation some firms shifttowards riskier asset portfolios, and consolidation may increase operating risks and managerialcomplexities. For example, organisational diseconomies may occur as financial institutionsbecome larger and more complex if senior management teams stray far from their areas of corecompetency. More broadly, there is no guarantee that cost savings or efficiency gains will berealised.
(2) Economic shocks that have the potential to become systemic financial risk events aremost likely to be transmitted to the real sector through the wholesale activities of financialinstitutions and markets, including payment and settlement systems.6 Largely because of depositinsurance, retail deposit runs and traditional flights to currency are highly unlikely, and in facthave not occurred in the regions studied since World War II. However, the costs of a systemiccrisis are likely to be borne by a broad range of economic agents.
(3) In part because the net impact of consolidation on individual firm risk is unclear, thenet impact of consolidation on systemic risk is also uncertain. However, it seems likely that if alarge and complex banking organisation became impaired, then consolidation and any attendantcomplexity may have, other things being equal, increased the probability that the work-out orwind-down of such an organisation would be difficult and could be disorderly. Because suchfirms are the ones most likely to be associated with systemic risk, this aspect of consolidationhas most likely increased the probability that a wind-down could have broad implications.
Important reasons for this effect include disparate supervisory and bankruptcy policies andprocedures both within and across national borders, complex corporate structures and riskmanagement practices that cut across different legal entities within the same organisation, andthe increased importance of market-sensitive activities such as OTC derivatives and foreignexchange transactions. In addition, the larger firms that result, in part, from consolidation have atendency either to participate in or to otherwise rely more heavily on “market” instruments.Because market prices can sometimes change quite rapidly, the potential speed of such a firm’sfinancial decline has risen. This increased speed, combined with the greater complexity of firmscaused in substantial degree by consolidation, could make timely detection of the nature of afinancial problem more difficult, and could complicate distinguishing a liquidity problem from asolvency problem at individual institutions.
The importance of this concern is illustrated by the fact that probably the most complex largebanking organisation wound down in the United States was the Bank of New England Corp. ItsUSD 23.0 billion in total assets (USD 27.6 billion in 1999 dollars) in January 1991 when it wastaken over by the government pale in comparison to the total assets of the largest contemporaryUS firms, which can be on the order of USD 700 billion.
(4) Evidence suggests that interdependencies between large and complex financialinstitutions have increased over the last decade in the United States and Japan, and arebeginning to do so in Europe. Importantly, although a causal linkage has not been established,these increases are positively correlated with measures of consolidation. Increasedinterdependencies are consistent with the view that systemic risk may have increased, becausethey suggest that a common shock would tend to be transmitted to many firms. A variety ofevidence is presented which attempts to measure changes in total, direct and indirectinterdependencies between firms. The evidence suggests that the areas of increasedinterdependency that are most associated with consolidation include interbank loan exposures,market activities such as exposures in OTC derivatives, and (as discussed below) payment andsettlement systems.
(5) Partly as a result of consolidation, banks are not the only potential sources of andtransmission mechanisms for financial instability. The general blurring of differences among
6 Payment and settlement issues are considered separately in the relevant section below.

16
commercial banks, investment banks, insurance companies and other types of financialintermediaries and the substantial rise in the importance of market activities strongly suggestthat some non-bank financial institutions and markets could also be sources and transmissionmechanisms. In addition, the consolidation of an increasingly wide range of financial activitieswithin large and complex organisations that include banking units points to an increased risk ofcontagion effects running from the non-bank to the commercial bank parts of the sameorganisation.
(6) Consolidation also appears to be increasing the possibility that even a medium-sizedforeign bank (or perhaps a non-bank financial institution) from a large nation would be apotential source of instability to a relatively small host country. The possibility of loss ofdomestic ownership of a small nation’s major banks has, other things being equal, alsoincreased. In addition, partly through cross-border consolidation there has been an increase inthe role within the international financial system of institutions with operations in a number ofjurisdictions. These developments raise the issues of: (a) how much further national crisisprevention and management policies may need to converge; (b) the extent to which policies mayneed to be assessed in an international rather than a domestic context; and (c) potentialcomplications in crisis resolution due to the absence of cost-sharing arrangements acrosscountries.
(7) It appears that consolidation, and especially any resulting increased complexity offinancial institutions, have to some extent increased both the demand by market participants forand the supply by institutions of information regarding a firm’s financial condition. Theresulting rise in disclosures has probably improved firm transparency and encouraged marketdiscipline, thus lowering individual firm risk and perhaps increasing financial stability.However, the increased complexity of firms has also made them more opaque, their increasedsize has the potential to augment moral hazard, and thus the net effects on firm transparency andmarket discipline are unclear. Indeed, there appears to be considerable room for improvement indisclosures.
Important asymmetries of effects
In addition to important common themes, a number of key diversities were identified acrosscountries and regions. These diversities sometimes derive substantially from consolidation, andin some cases complicate evaluation of consolidation effects. Moreover, it is important tounderstand that the differences are primarily a matter of degree, and generally do not reflectstark asymmetries of effects. For example, although European firms have to date played arelatively prominent role in cross-border consolidation, cross-border deals, and the issuesresulting therefrom, are clearly relevant in all the study nations.
United States
(1) The relatively strong desire of the United States to limit the federal safety net toinsured depository institutions, and its relative lack of experience with financial conglomerates,raise a number of difficult issues that derive in part from the resulting complex corporatestructure of growing and consolidating large US financial institutions. Important issues thatderive in some degree from consolidation include the extent of supervision that should beapplied to the various legal entities within a single organisation, the division of labour among“functional” supervisors, how best to manage the wind-down of a large and complexorganisation, and a relatively high level of concern with operational risks.
(2) Market activities tend to play a considerably greater role in the total activities of USfinancial institutions than they play in continental European and Japanese financial institutions.Although increased reliance on markets and market activities are likely to be, in a broad sense,risk-reducing, such activities can introduce new risk considerations that may become systemicin certain situations. For example, as discussed above, the speed of a firm’s deterioration couldbe accelerated. Partly in response to such considerations, disclosure practices in the United

17
States appear to be considerably more extensive than are those in either Europe or Japan.Finally, the long period of macroeconomic stability in the United States has not provided astrong test of reforms begun in the early 1990s that were designed to limit the safety net andencourage market discipline.
Europe
(3) As in other G10 countries, systemic events are likely to remain primarily nationalconcerns in Europe over the near future. However, the euro has accelerated the speed offinancial market integration and is encouraging cross-border activity by financial institutions,partly through consolidation. Therefore, if cross-border interdependencies grow rapidly acrossEuropean countries, the probability that a banking crisis in one country will affect the bankingsystems of other countries is likely to be higher in the future. The current framework ofharmonised directives across EU countries and the arrangements in place for extensive bilateraland multilateral cooperation, such as the Banking Advisory Committee, the BankingSupervisory Committee and the Groupe de Contact, provide a comprehensive framework for themanagement of banking crises. Still, European national authorities should increase theharmonisation of their policies and the coordination of actions taken in the prevention andmanagement of crises, along the lines suggested recently by the European Union Economic andFinancial Committee in its Brouwer Report (2000).
(4) Because of the number of sovereign nations involved, the cross-national problems thatusually arise in all nations when merging institutions try to integrate across national borderstend to be more immediate and relatively intense in Europe. Such difficulties can derive from,for example, differences in national law and custom. These complexities are in addition to thestandard problems that often appear from efforts to combine different corporate cultures. In bothcases, integration complexities can affect the risk profiles of the firms involved.
Japan
(5) To date, the rather limited consolidation among large financial institutions in Japanhas been driven primarily by two imperatives: the need to manage and resolve the ongoingfinancial crisis, and the Big Bang deregulation reforms. Thus, key issues revolve around crisismanagement, crisis prevention and the desire to encourage market discipline. In addition,despite the relatively small amount of consolidation among large financial institutions so far,additional consolidation is anticipated.
(6) In Japan, the need to manage a financial crisis that involves, among others, some ofthe largest financial institutions in the nation has required considerable flexibility inadministration of the safety net. For example, explicit government guarantees of financialinstitution liabilities have been much more extensive in Japan than in other G10 nations inrecent years. Looking forward, and as consolidation proceeds, it is expected that competitiveforces as well as market discipline will play much greater roles in maintaining the strength andstability of the financial system.
(7) Consolidation may encourage the development of capital markets in Japan, withpotential benefits for improved financial stability. For example, as consolidating (andcompetitively pressed) financial institutions are forced to concentrate more on maximisingreturn on equity, some former borrowers may need to seek funding from other sources,including the capital markets. In addition, in order to reduce risk, consolidating firms are likelyto need to shrink their balance sheets through other devices, including the securitisation ofassets and the sale of portions of their often extensive holdings of corporate stock. Both actionswould further stimulate capital market development.
(8) With respect to the possible effects of consolidation on individual firm risk in Japan,two additional points are noteworthy. First, the potential for risk reduction through thegeographic diversification of assets seems quite limited within Japan. However, the potential forrisk reduction via the diversification of liabilities, including the acquisition of relatively stable
18
core deposits, appears to be much greater. Second, the ongoing expansion of the co-ownershipof banking and commercial firms in Japan may lead to the creation of “platform risk”, wherebya bank is physically dependent on the platform (eg a supermarket) of the commercial business.
Policy implications
Existing policies and procedures appear adequate to contain individual firm and systemic risksboth now and in the intermediate term. However, the analyses presented are quite supportive ofthe need for continued policy development in a number of areas. The Working Party is awarethat a large number of policy initiatives are under way in a variety of forums. The intention hereis to reinforce those that, from the point of view of the effects of consolidation on financial risk,appear to be the most important, and to suggest some new directions or areas needing expandedattention.
The areas worthy of further policy development cut across a number of interdependentdimensions. These include crisis prevention and crisis management, public and private actions,including the appropriate use of taxpayer versus private funds, supervisory and marketdiscipline, and trading off public actions and moral hazard. In the judgement of the WorkingParty, the most important areas in need of ongoing policy development are:
(1) Both crisis prevention and crisis management could be improved by additionalcommunication and cooperation among central banks, finance ministries and financial (bothbank and non-bank) supervisors, both domestically and internationally. Such efforts areparticularly important given the extent of current and expected cross-sector and cross-borderconsolidation in the financial services industry. Specific areas where improvements could yieldsignificant net benefits are discussed below.
(2) Important components of improved crisis prevention and management are effectiveand efficient policies and operating procedures for acting promptly to deter and resolve apotential crisis. A central element here, particularly in the light of consolidation’s contributionto the creation of very large and complex financial organisations, is how to act in ways thatminimise moral hazard. Policies implemented in recent years in a number of nations designed toencourage prompt intervention by supervisors in a troubled institution appear to have promise,but have yet to be tested in a major crisis. Although all nations studied are sensitive to the needto minimise moral hazard incentives, perspectives differ depending in part on a nation’s currentsituation and experience with crisis management.
(3) Crisis management could be eased considerably by augmented contingency planningfor working out a troubled large and complex financial institution in an orderly way. The mosteffective approach will probably involve efforts by both the public and private sectors, andpossibly both within and across borders. Areas where clear understanding is critical include: (a)the administration of bankruptcy laws and conventions; (b) the coordination of supervisorypolicies, especially early intervention, within and across borders; (c) the treatment of OTCderivatives, foreign exchange, and other “market” activities in distress situations; (d) the rolesand responsibilities of management and boards of directors; and (e) administration of the lenderof last resort function.
(4) The probabilities both of an individual firm experiencing severe financial difficultiesand of a systemic crisis could be lowered by more effective risk-based supervision of financialinstitutions. In addition to the large number of initiatives under way, the results of this studyhighlight the importance of timely monitoring and surveillance. With regard to monitoring andsurveillance, the increasing importance of cross-border operations and market activities suggestsan augmented need to evaluate risk developments at not only the individual institution level, butalso at the overall market level or, put differently, from a “systems” perspective (see point 9below).
(5) A critical element of improved risk-based supervision is risk-based capital standardsthat are tied more closely to economic risk. Capital standards provide an anchor for virtually all

19
other supervisory and regulatory actions, and can support and improve both supervisory andmarket discipline. For example, early intervention policies triggered by more accurate capitalstandards could prove to be important in crisis prevention.
(6) If taxpayer funds are needed to manage and resolve a crisis, as seems likely given theincreasing size and complexity of financial institutions, increasing cross-border consolidationmay require the development of cost-sharing arrangements among governments, and additionalpolicies and procedures to minimise moral hazard incentives.
(7) Both crisis prevention and crisis management could be enhanced by clearerunderstanding of how best to deal with non-bank financial institutions, including the treatmentof non-bank entities that are part of a financial conglomerate that includes a bank. It should beacknowledged that the scale and level of financial market participation of a number of non-bankfinancial institutions in some countries are sufficient to make their impairment a potentiallysystemic event. How best to resolve the resulting and inevitable tension between protectingfinancial stability and inducing moral hazard is difficult to determine, but an issue thatpolicymakers should address.
(8) Improved market discipline also has the potential to decrease the probabilities ofindividual firm and systemic crises, although markets can sometimes react quite rapidly, therebyforcing supervisors’ actions and introducing complexities that might not otherwise occur. In anyevent, the size and complexity of consolidating financial institutions support, and may wellrequire, the use of market discipline as a complement to supervisory discipline. Effective marketdiscipline requires clear incentive structures both within institutions and among other marketparticipants. A number of strategies for improving market discipline seem potentially promisingfor financial institutions in all of the nations studied, and include augmented disclosures,improved risk management, stronger incentives for risk control by owners and managers, andimproved accounting conventions.
(9) Assessment of the likelihood of a systemic crisis, and the understanding of itspotential implications, could be improved by the collection and analysis of data that are bettertargeted on such concerns. Although the precise links between financial institutions and marketsthat are most likely to augment systemic risks are uncertain, and indeed somewhat unique to agiven crisis, the analysis suggests that consolidation has probably increased interdependenciesamong firms and raised the probability that markets will play an important role in a future crisis.Thus, the monitoring and evaluation of individual firm data, both traditional (or improved)accounting and market data, in combination with data on firms’ interdependencies, financialmarkets, and domestic and international macroeconomic variables, might yield valuable insightsinto risks posed by interdependencies and possibly improve early warning systems. At aminimum, it would seem prudent to evaluate whether central banks, finance ministries and otherfinancial supervisors are collecting and evaluating data at both the domestic and internationallevels that are appropriately targeted on future possibilities.
Monetary policyThe behaviour of financial firms and markets influences the environment in which monetarypolicy decisions are made, how they are put into practice, and how they are transmitted tooutput and prices. Thus, if consolidation causes changes in the behaviour of financialintermediaries or the operation of financial markets, it could have implications for the conductof monetary policy. As with other topics evaluated in this study, it is difficult, particularlylooking at data within a single country, to disentangle the effects, if any, of consolidation fromthose of globalisation, technical innovation, deregulation, and other factors affecting thebehaviour of financial intermediaries.
20
Effects on the implementation of policy
Whether consolidation affects the implementation of monetary policy depends on whether it hasimpacts on the market for central bank balances, or the market(s) used by the central bank toadjust the supply of such balances. Consolidation may affect such markets in two ways.
(1) First, consolidation may reduce the degree of competition in the relevant markets.Reduced competition might cause liquidity to be more costly for those participants with lessmarket power, and hence impede the arbitrage of interest rates between the market targeted bythe central bank and other financial markets. Decreased competition might also lead to highervolatility in very short-term interest rates, if consolidation allowed firms to exercise theirincreased market power only from time to time, depending on market conditions.
(2) Second, consolidation could affect the performance of these markets because theresulting large financial firms behave differently from their smaller predecessors. For example,by internalising what had previously been interbank transactions, consolidation could reduce theliquidity of the market for central bank reserves, making it less efficient at reallocating balancesacross institutions and increasing market volatility.
(3) Virtually all central bank responses to a Task Force questionnaire suggest that theimpact of consolidation on the operation of these markets has so far been minimal, and it is notexpected to be a significant concern in the future. In practice, the structures of the market forcentral bank balances and the markets used for monetary policy operations differ widely acrosscountries. In most countries, consolidation has reduced the number of participants in thesemarkets. However, even in those countries with relatively few participants, the relevant marketsappear to be partially contestable. That is, the market power of participants is constrained tosome degree by the possibility that new firms could enter the market. In addition, the euro hasencouraged development of European money and capital markets, thus making the number ofparticipants in a particular nation’s markets less relevant. Finally, the central bank’s position asa monopoly supplier of central bank liquidity gives it countervailing power and allows it toadjust operational arrangements as it sees fit.
(4) Nevertheless, central banks reported that possible reactions to increased consolidationin the future might include more careful monitoring of operations, stricter assessment andmanagement of counterparty risk, and efforts to encourage the participation of morecounterparties (eg changing eligibility criteria).
Effects on the monetary transmission mechanismFinancial sector consolidation may also alter the monetary transmission mechanism that linkscentral bank decisions and operations to the rest of the economy. This mechanism works viavarious channels.
The monetary channel
(1) The “monetary channel” concerns the transmission of interest rates across financialmarkets by arbitrage along the yield curve and across financial products (ie the “pass-through”of changes in the interest rate targeted by the central bank to other rates, including bank lendingand deposit rates).
If consolidation leads to greater concentration among financial intermediaries, that could lead tohigher and perhaps more variable margins between borrowing and lending rates. It could alsoinfluence the lags in the monetary transmission mechanism (eg reduce them if bigger firms canprocess more information more rapidly or increase them if bigger firms are more able to exploitcustomer inertia when official rates change).
(2) Many other factors also affect the pass-through in practice, such as the introduction ofnew technologies by financial intermediaries, the development of new financial instruments, thereduction in barriers to entry in some financial markets, and the greater integration of capital

21
markets across countries. Even if consolidation does affect the transmission mechanism, centralbanks would over time be able to adjust their policy settings appropriately in response toobserved changes in pass-through without needing to identify the precise reasons for thosechanges – if necessary, by trial and error – particularly if the pace of consolidation is gradualcompared with central banks’ decision cycles.
(3) Empirical evidence about the effect of consolidation on pass-through is scarce andinconclusive. Some evidence suggests that consolidation may have led to margins being higherthan they would otherwise have been. One cross-country study concluded that barriers to entry –but not market concentration as such – may slow down interest rate adjustments.
(4) The responses of central banks to the Task Force’s survey generally indicated thatconsolidation by itself had not had an important influence on pass-through, although some notedthat the speed of pass-through had increased for various reasons, possibly includingconsolidation. Some European central banks thought that consolidation would increase thedegree and speed of pass-though to administered rates in the future. Several respondents notedthat other factors – especially globalisation and increases in competition in more integratedmarkets – had probably more than offset the possible adverse effects of consolidation on thelevel of competition in financial markets.
Bank lending and balance sheet channels
Consolidation could also affect the transmission mechanism by influencing other possiblechannels of monetary policy.
(5) These channels include: the “bank lending” channel, which operates through theimpact of policy changes on the supply of bank loans to borrowers without direct access tofinancial markets; and the “balance sheet” channel, which operates through the effect ofmonetary policy on the value of collateral, and so on the availability of credit to those requiringcollateral to obtain funds.
(6) In principle, consolidation could influence both of these alternative channels. Indeed,there is some suggestive cross-country evidence that differences in the structure of countries’financial sectors can help to explain differences in the strength of the effects of monetary policy.However, some research has cast doubt on the empirical importance of these channels of policy,and direct effects of consolidation have been difficult to identify.
(7) There is some evidence that larger banks find it easier than smaller banks to fundloans in periods of tight monetary policy, so consolidation might reduce the importance of thebank lending channel, and hence the impact of any given change in the interest rate targeted bythe central bank.
(8) Central bankers did not report such an effect, generally noting either that this channelwas not particularly important in their country or that its importance was difficult to assess.
(9) Similarly, if consolidation influences the need for borrowers to post collateral, it couldinfluence the balance sheet channel, although the sign of the theoretical relationship is not clear.The empirical evidence is also ambiguous, and so it is not surprising that central banks reportedthat changes in the importance of this channel have not been a major consideration.
Other possible effectsFinancial sector consolidation could also affect the setting in which monetary policy isdetermined.
(1) For example, cross-border consolidation is likely to have increased the potential forshocks in one country to affect financial firms and markets in another.
(2) A reduction in the number of firms participating in financial markets could reducemarket liquidity and depth and perhaps boost market volatility.

22
(3) Consolidation could also reduce the resilience of markets during times of stress, eitherbecause shocks were transmitted across firms and markets more rapidly or to a greater degreethan had been the case, or because financial firms became less willing or able to act to cushionthe impact of shocks on borrowers and markets.
(4) However, central banks did not report significant effects of consolidation on thevolatility or liquidity of financial markets.
(5) Nor did they think that consolidation had made it significantly more difficult tointerpret movements in indicator variables such as monetary aggregates.
(6) Consolidation has encouraged the development of very large and complex financialinstitutions, and this trend is expected to continue. Such institutions could pose increasedchallenges to central banks in their lender of last resort and monetary policy roles. In the eventof financial difficulties at such firms, central banks would need to consider carefully theappropriate provision of emergency liquidity, as well as whether the stance of monetary policyshould be adjusted in the light of the possible macroeconomic impact of the difficulties.However, central bankers did not believe that consolidation increased the likelihood that policywould be unduly influenced by firm-specific concerns.
Conclusions and policy implications(1) So far, financial sector consolidation does not appear to have impeded theimplementation of monetary policy or altered significantly the transmission mechanism ofmonetary policy.
(2) Central bankers reported that they had not noticed any effect of consolidation on thedistributional impact of monetary policy (eg households vs firms or large firms vs small ones).This is consistent with the lack of evidence of significant changes in the monetary transmissionmechanism.
(3) Research targeted on further refining theories of the monetary transmissionmechanism could help to clarify what effects might appear in the future.
(4) Central banks can be reasonably confident when setting monetary policy that frequentreviews of the data allow them to take account of most changes in the relationship between theirtarget interest rates and developments in the rest of the economy, even if the reasons for thechanges are unclear. However, identifying those reasons may help establish how persistentthose changes are likely to be.
(5) Nonetheless, it would be prudent for central banks to bear in mind the possibleimplications of any reductions in the competitiveness of the key financial markets involved inthe implementation of policy, as well as the potential changes in the role of the bank lendingand balance sheet channels of monetary policy transmission that might be brought about byfuture financial sector consolidation.
Efficiency, competition and credit flowsForeign ministries, central banks and financial supervisors are frequently concerned about thepotential impacts of financial consolidation on the efficiency of financial institutions, the degreeof competition in the markets for financial services, and on credit flows to small and medium-sized enterprises.
EfficiencyEfficiency is a broad concept that can be applied to many dimensions of a firm’s activity. Anarrow definition takes size and technology as given, and focuses on measuring managerialefficiency (the optimisation of existing resources) by analysing how production factors arecombined. A more comprehensive definition also considers economies of scale and scope, both

23
of which vary with technologies, regulations and consumers’ tastes. Efficiency gains can begauged with the help of the stock market performance of the merging institutions; consolidationcreates value if the sum of the market valuations of the bidder and the target increases.
Commercial banks
When comparing cost and revenue structures, it should be remembered that in countries with aheavily bank-oriented financial system the banking industry may evolve differently than incountries where securities markets are prominent. In countries with well developed financialmarkets, banks provide many services in addition to loans and deposits; they have betteropportunities to tailor their risk profile, both on- and off-balance sheet. Furthermore, differencesin regulation mean that, while in some countries commercial and investment banks are (or havein the past been) separated, in others they can operate jointly as universal banks and even havecross-shareholdings with industrial companies. These differences hamper internationalcomparisons. All these warnings notwithstanding, the banking industries in the countries studiedshare some structural features that emerge from a careful analysis.
(1) Evidence suggests that only relatively small banks could generally become moreefficient from an increase in size. However, changes in technology and market structure mightaffect scale and scope economies in the future. In addition, the direct evidence on how M&Asaffect banks’ performance is mixed. In general, more efficient banks acquire relativelyinefficient banks, but there is little evidence of subsequent cost reduction. For dealsconsummated over the last decade, there is some evidence of improvement, especially on therevenue side. The gains, however, are probably not as large as those anticipated by practitioners.
(2) The main finding of studies that examine share prices around the time that a merger isannounced is that, on average, total shareholder value is not affected by the announcement ofthe deal. On average, the bidder suffers a loss that offsets the gains of the target. Put differently,M&As seem typically to transfer wealth from the shareholders of the bidder to those of thetarget.
Other financial institutions
(3) For the securities industry, results based on US data indicate that economies of scaleexist, but mainly among smaller firms; larger firms demonstrate scale diseconomies. Similarly,research suggests that smaller specialty firms tend to exhibit modest economies of scope whilelarge multi-product firms exhibit modest diseconomies of scope. In general, however,economies of scope do not appear to be important in the securities industry. These resultssuggest that there is room for both diversified and specialty firms, as long as they are aboveminimum efficient scale.
(4) Economies of scale in the asset management industry are significant only up to arelatively small size threshold. The evidence is slightly more favourable for scope economies.Such findings are consistent with recent developments in the industry, in which assetmanagement services are often distributed jointly with other financial products in order to reapthe benefits from cross-selling.
(5) As is the case for commercial banks, smaller insurance companies could probablyreduce their costs by taking advantage of potential economies of scale. However, the benefitsare likely to disappear after a threshold that is well below the size of the largest firms. Theexistence of economies of scope with other financial institutions is unclear. The insuranceindustry is still very fragmented because of regulation and the specificity of some of itsproducts. The dispersion of efficiency levels that results from these barriers to entry couldprobably be reduced if better managed firms acquired weaker ones, but the limited evidenceavailable for the past and the rapid changes expected in the future make it difficult to assess thepotential efficiency gains from M&As.
24
Views of practitioners versus results of research
Research on the ex post results of M&As seems to contradict most of the motivations given bypractitioners for consolidation, which are largely related to issues of economies of scale andscope and to improvements in management quality. However, to a certain extent this puzzlemight be only apparent because:
(6) practitioners may consider cost reductions or revenue increases per se to be a success,without also taking into account industry trends as a benchmark;
(7) practitioners may focus on absolute cost savings rather than on efficiency measuresthat compare costs to assets;
(8) while research finds no improvements on average, some institutions improveefficiency and some do not. Given the inside knowledge of their firm and the arm’s-lengthknowledge of competitors, managers might be justified in believing that their institution mightbe among the ones that would benefit from a merger or acquisition; and
(9) deals done in the past might have suffered from stricter regulation (eg labour laws)that prevented firms involved in M&As from reaping all the benefits of the deal. Suchregulations may not exist in the future.
CompetitionThe effects of consolidation on competition depend on the demand and supply conditions in therelevant economic markets, including the size of any barriers to entry by new firms.
Market definition
(1) On the demand side, markets for a number of key retail bank products appear to beprimarily local. In empirical research, local markets are usually approximated by areas such asprovinces, rural counties, cantons or metropolitan areas. In the United States, this assumption issupported by survey evidence indicating that both households and small businessesoverwhelmingly procure banking services from suppliers located within a few miles of thecustomer; it is still rare to deal with institutions that can be reached only via the telephone or theinternet. Despite the development of electronic banking and other advances, in Europe transportcosts are still significant, and entry into foreign markets requires opening or acquiring a networkof branches.
(2) There is also evidence on the supply side that some banking markets are local. Thenumber of bank branches in most countries continues to increase despite a consolidation processthat has reduced the number of independent banking organisations and statutory changes thathave largely removed legal constraints on bank geographic expansion. This indicates that firmscontinue to feel the need for a local presence.
(3) Wholesale banking products generally have markets that are national or internationalin scope. In much of continental Europe, bond markets that tended to be national have expandedwith the adoption of the euro; cross-border competition should also increase for services likecorrespondent banking. The geographic scope of markets is also national or international forinvestment banking services, money market trading, foreign exchange trading, derivativestrading and asset management.
(4) Geographic markets for most insurance activities appear to be national (statewide forthe United States), although the barriers to entering geographic markets might be low relative tothe barriers to entering different product lines.
Barriers to entry in financial markets
There are three main types of barriers to entry in financial markets: (a) regulatory barriers,including specific subsidies or public guarantees; (b) entry barriers due to differences in firms’costs, especially those that arise when entry requires significant sunk costs, such as the necessity

25
to set up a network of branches; and (c) relatively inelastic customer demand, which may existif costs of switching among financial service providers are large.
(5) It seems clear that regulatory barriers to entry have decreased with the deregulationand globalisation of financial markets. Introduction of the euro has reduced barriers to entry intosome European markets.
(6) The impact of technology, driven in part by consolidation, is uncertain. On the onehand, technology might increase some fixed costs, including advertising expenses, and it mightcontribute to locking consumers in with their existing suppliers by increasing switching costsfor customers. On the other hand, technology might expand the geographic limits of markets,thus enhancing competition from firms located in other areas.
Consolidation and prices
(7) Research using both European and US data generally finds that higher concentrationin banking markets may lead to less favourable conditions for consumers. Studies using US dataindicate the existence of market power in some markets for small business loans, retail depositsand payment services, although results are weaker for the 1990s than for the previous decade.
Studies that examine directly the pricing strategies of merging institutions support the view thatM&As may influence market prices. Studies in the United States, Italy and Switzerland find thatin-market concentrations have the potential to cause a reduction in deposit interest rates or anincrease in loan rates.
(8) On balance, evidence suggests that investment banks may be exerting some degree ofmarket power. Moreover, the importance of reputation and of the placing power of underwritersmay create a barrier to entry that is likely to survive even the technological developmentsforeseeable in the near future. Therefore, in-market consolidation among large firms couldaffect negatively their consumers.
The investment banking industry is highly internationalised, as the largest firms are chartered inmany different countries. However, the market is highly concentrated: a small group of firmsdominates each segment. For example, the market share of equity underwriting of the fivelargest firms is above 50% both in the United States and in Europe. Nonetheless, there is littleresearch available on the degree of competition in the investment banking sector.
In Italy, a thorough examination by the antitrust authorities concluded that, even though themarket for investment banking was dominated by a small number of firms, there was noevidence of abuses. In contrast, studies of US securities markets found evidence ofanticompetitive pricing and procompetitive effects of entry.
(9) In the last few years, the insurance markets in the nations studied have generallybecome more competitive, although the extent of competition seems to vary significantly fromproduct to product and from country to country. Research on US insurance markets finds higherprices in more concentrated markets.
The potential impact of technology on competition
(10) The continued evolution of the internet and other forms of electronic commerce couldhave major implications for the definition of geographic markets, thereby altering the potentialeffects of consolidation. Although electronic finance is not yet widespread, forecasts suggestrapid growth in the near future. If financial services can be purchased or supplied effectively byelectronic means without the need for physical branch offices, geographic limits to marketexpansion may disappear, increasing competition from firms located in other areas.Developments in electronic technology could also reduce entry barriers by reducing search costsfor consumers.
(11) The development of e-finance may also reduce, rather than increase, competition.Financial institutions are increasingly operating in multiple sectors, partly in an attempt to sell
26
bundles of products to customers. Due to technological progress, these bundles may becomemore and more customised for a large number of consumers. As a result, switching costs mayrise, especially if suppliers provide enough products to justify “one-stop shopping” strategies.Finally, new ways of distributing financial services may be created which could only beexploited by vertical consolidation of financial institutions with non-financial partners such astelecom and media enterprises.
(12) The short- and medium-term benefits of e-finance, however, should not beexaggerated. Electronic banking does not reduce information costs for products where the bankhas to rely on information about local markets. Furthermore, new entrants may be forced toback up their internet entry with significant advertising outlays before they can effectivelycompete. For some high-value, infrequently purchased products, customers may demand morethan online contracts, however personalised. Generally speaking, consumers currently do notseem to view internet banking as a substitute for banking with an institution that has physicalbranches. Also, at the moment, the necessary legal framework is incomplete for internetcommerce, in particular with regard to consumer protection and money laundering.
Credit flows
Small and medium-sized enterprises (SMEs) make a substantial contribution to the economiesof the nations studied. For example, in 1996, on average, they accounted for 66% of totalemployment in Europe and more than 50% of the labour force in Canada and the United States.SMEs are also prominent in Japan. Currently, SMEs are highly dependent on banks, particularlyin Europe.
In many countries, consolidation in the banking system has involved a large number of smallbanks. The reduction in the number of these institutions may affect the availability of credit tosmall firms. When consolidation occurs, the larger bank resulting from the merger is able toexpand its lending capacity with respect to larger borrowers and it may restructure its portfolio,discontinuing credit relationships with smaller borrowers. To the extent that credit relationshipsbetween banks and small businesses are characterised by a greater degree of informationasymmetries, small firms could face difficulties in finding credit from other sources.
Consolidation and credit rationing
(1) Statistical studies of the effect of consolidation of banks on small business lending areavailable for only a couple of countries (Italy and the United States). These studies suggest thatbanks reduce the percentage of their portfolio invested in small business loans afterconsolidation.
(2) However, the impact of M&As on small business lending depends crucially on themotivations of the deal and on the type of banks involved. Moreover, what is relevant is theeffect on the total availability of credit to small borrowers and whether it is associated withmore accurate pricing of risk. In the United States, studies that have examined the effect ofM&As on small business lending by other banks in the same local markets found that otherbanks and new entrants tend to offset the reduction in the supply of credit to small firms by theconsolidating banks. In Italy, consolidating banks tend to shift away from the worst borrowers.
Potential impact of technology on small business lending
(3) Credit scoring models, currently used mostly by large banks, will benefit mainly“transaction-type” loans, which, like credit card loans, do not need much information-intensivecredit evaluation. Thus, some of the potentially negative effects of consolidation, such as areduction in credit availability by banks involved in M&As, may be partially offset by suchinnovations. However, benefits to date seem quite limited. In addition, technology will notnecessarily reduce the cost, and indeed may increase the relative cost, of processing theinformation typical of relationship lending, harming small borrowers who do not, for example,qualify for a sufficiently high credit score.

27
Policy implications
In the judgement of the Working Party, the most important policy implications of consolidationfor efficiency, competition and credit flows are:
(1) Policymakers should carefully examine claims of substantial efficiency improvementsby financial institutions proposing major consolidations, especially in cases in which a mergercould raise significant issues of market power.
(2) The impact of consolidation on competition can only be assessed by using empiricallysupported definitions of the relevant product and geographic markets. Because financial marketsare constantly changing, these definitions have to be scrutinised regularly, also taking intoaccount the differential impact on different classes of consumers, such as households and smallfirms.
(3) The impact of technological changes could be more powerful for households than forsmall firms, because standardised techniques such as credit scoring models are more suited tothe former. The analysis of relevant markets for antitrust purposes should take into accountchanges due to technological forces in the geographic and the product dimensions as well aschanges in demand.
(4) In order to increase competition in an environment that is reducing significantly thenumber of providers of financial services, consideration could be given in some nations toremoving obstacles to the mobility of customers across financial service providers. This couldbe done, for example, through greater transparency regarding products and prices, or bysimplifying the process of changing providers. Better flows of information between customersand financial institutions could also decrease the asymmetric information problems betweensmall firms and banks and limit the probability of credit rationing.
(5) To the extent that consolidation may harm small business lending, the problems facedby small firms in funding their projects might be alleviated if alternative sources of finance, interms of both providers and products, are developed. This could be encouraged by, for example,fostering the development of equity markets or decreasing the costs of being listed on anexchange. Such measures, together with actions already taken, may foster the development offinancial markets, particularly equity markets. Alternative sources of finance may become moreavailable as costs of information generation and storage decrease, especially in Europe andJapan. Policies that encourage transparency and promote awareness of financial markets wouldprobably be helpful in this respect.
(6) Cross-industry competition may benefit consumers by encouraging competition onexisting and new products. Eliminating policies that limit cross-industry competition generallywould have a beneficial effect.
(7) Effective antitrust policy implementation needs data on market shares, prices andvolumes of activity in key financial services and products. The financial services industryalready regularly provides some of the relevant data; however, it would be helpful to enrich theavailable information, especially at the firm level. The burden of these added reportingrequirements should be minimised; authorities should explore ways to encourage financialinstitutions to contribute the needed data on an ongoing basis and authorities should focus oncollecting data only in areas where consolidation is likely to have significant effects, such assmall business lending and retail branch banking services. In general, it is important to considerwhat kind of information should be readily available so that the potential impacts of proposedM&As can be quickly assessed.
Payment and settlement systemsThe ongoing consolidation of the financial industry is affecting the market infrastructures forpayment and securities settlement, as well as banks’ internal systems and procedures forpayment and back office activities. At the global level, correspondent banking and the global

28
custody businesses are becoming more concentrated among a smaller number of large marketplayers. At the domestic level, banks are increasingly outsourcing payment and settlementactivities to “processing factories” – transaction banks and non-bank service providers. On thedemand side, users of payment and settlement services are increasingly calling for moreefficient payment and securities processing. Consequently, they are often the main driving forcebehind a greater harmonisation of interbank systems and consolidation of systems within andacross borders.
Effects of consolidation
Consolidation affects the efficiency of payment and securities settlement processes, the degreeof competition between banks and between market infrastructures, and the level of financial andoperational risk. It also has implications for central banks’ approach to oversight of the paymentsystem. The complexity of the consolidation processes taking place within the financialindustry, however, makes it impossible to categorise clearly the net effects as either positive ornegative.
Efficiency
(1) Consolidation has led to a greater concentration of payment and settlement flowsamong fewer parties within the financial sector. Indeed, consolidation tends to lead to theemergence of very large financial institutions and non-bank service providers that specialise inproviding a wide range of payment and settlement services to third parties. Interbanktransactions may increasingly become in-house transactions, which do not involve externalexchanges of payment messages and hence tend to be cheaper to process.
(2) Because of the significant economies of scale in electronic payments technologies, thelarge institutions resulting from consolidation may be better able to invest in new, often costlytechnologies, and to decrease unit costs by capturing economies of scale.
(3) Due to their specific business needs, the emerging global firms are pressuring theoperators of payment and securities settlement systems to enhance their systems, reduce overallprocessing redundancies through consolidation of systems, and to increase efficiency and reducecosts to users. In this connection, operators of payment and securities settlement systems mayface increasing demands for remote access capabilities and for a wider range of eligiblecollateral that can be used across a variety of systems. Remote access and broader collateral,however, involve complex policy and legal considerations that require further analysis.
Competition
(1) The overall effects of consolidation on competition in the provision of paymentservices are likely to vary according to the type of consolidation being considered (egconsolidation of financial institutions or of market infrastructures), the definition of the market(ie local, national or global), the market’s degree of competitiveness, the extent of existingmarket concentration, and the legal and policy framework governing competition.
(2) On one level, a reduction in the number of institutions providing payment andsecurities settlement activities beyond a certain limit might result in increased prices forsettlement services and lower incentives for innovation. To the extent that large players havesunk costs in a particular clearing technology, an established customer base with switchingcosts, and market power, they may actively discourage or slow the movement to more efficienttechnologies or processes for clearing. On the other hand, large institutions may be morecapable and willing to invest in better risk management systems and form alliances with otherclearers to clear payments and securities more efficiently. Whether any such efficiency gains arepassed on to customers is open to debate.
(3) On another level, consolidation among payment and settlement systems may alsoaffect competition, but the effects may vary depending on the model used. Three policy views

29
of system consolidation exist in the literature – a competing network model, a public utilitymodel, and a model for promoting intra-network competition. The competitive effects of systemconsolidation under each of these models largely depend on such factors as the governancestructure of the surviving system, access criteria, market demand for downstream services, andeconomies of scale. For example, under an intra-network competition model, shared automatedteller machine (ATM) networks may reduce competition at the network level, butsimultaneously enhance competition among banks by allowing small and large banks to offerATM services on an equal basis at a similar number of locations. The ownership structure andthe governance of a specific system are crucial points in this respect. To the extent that one or afew large participants dominate the network’s decisions, access, efficiency and innovation maybe affected, possibly to the detriment of other participants or would-be participants.
(4) Apart from these considerations, policymakers should be aware that competition is adynamic process where effects observed over the short term might not be indicative ofcompetition effects over the longer term.
Risk
The payment system risk implications of financial consolidation are complex.
(1) On the one hand, consolidation may help to improve the effectiveness of institutions’credit and liquidity risk controls. For example, increased concentration of payment flows mayreduce liquidity tensions due to the greater degree of offset between payments received andpayments sent by individual participants.
(2) On the other hand, consolidation (especially through specialisation and outsourcing)may lead to a significant shift of risk from settlement systems to customer banks and third-partyservice providers. Moreover, consolidation may lead to a greater proportion of on-us large-valuepayments, which may raise questions about the certainty of final settlement and theconcentration of payments within a few banks.
(3) To the extent that institutional and system consolidations result in a greaterconcentration of payment flows, potential effects of an operational problem may increase. Forexample, if a major payment processor were to fail or were no longer able to process paymentorders, serious repercussions might arise, not only for the liquidity situation of individualmarket participants that would not receive expected incoming funds, but also for the money,capital and foreign exchange markets in general.
(4) The emergence of multinational institutions and specialised service providers withinvolvement in several payment and securities settlement systems in different countries, as wellas the increasing liquidity interdependence of different systems, further serve to accentuate thepotential role of payment and settlement systems in the transmission of contagion effects.
(5) In order to properly manage these risks, banks need to have well developed riskcontrol mechanisms in place to monitor service providers and the service relationship that isapplicable to intraday and overnight credit, liquidity and operational exposures.
(6) At the interbank systems infrastructure level, central banks have made major effortsover the past decades to reduce and contain systemic risk by operating and promoting real-timegross settlement systems, and by insisting on the implementation of risk control measures in netsettlement systems. To the extent that these efforts have increased the robustness of interbanksystems’ risk controls, interbank systems should help to dampen and contain any contagioneffects being transmitted through the payment system.
Policy implications
The key policy implications identified by the Working Party are:
(1) Because of consolidation, central bank oversight of interbank payment systems isbecoming more closely linked with traditional bank safety and soundness supervision at the

30
individual firm level. Increasing cooperation and communication between banking supervisorsand payment system overseers may be necessary both domestically and cross-border.
(2) At the current time, it does not appear that consolidation has adversely affectedcompetition in the provision of payment and securities settlement services. It may be advisable,however, for government authorities to continue to monitor competition in the payment systemas short-term effects of consolidation may not be indicative of longer-term effects.
(3) In specific cases, public authorities may want to consider removing potential obstaclesto consolidation if such action would enable the market to develop initiatives aimed at reducingrisks and enhancing efficiency in the field of payment and securities settlement.
(4) With regard to risk management, central banks and bank supervisors should carefullymonitor the impact of consolidation on the payment and settlement business, and should definesafety standards when appropriate. In particular, central banks, in conjunction with banksupervisors, may need to consider various approaches, possibly including standards, that couldbe used to limit potential liquidity, credit and operational risks stemming from concentratedpayment flows through a few very large players participating in payment systems. With regardto major payment systems, the Core Principles for Systemically Important Payment Systemsnow provide a key set of evaluative standards for the relevant authorities.
31
Chapter I
Patterns of consolidation
1. IntroductionThis chapter provides a comprehensive overview of the patterns of consolidation in the financialservices sector during the 1990s. The main focus is on three important groups of financialinstitutions: depository institutions (banks), insurance companies and securities firms. Thirteencountries – those in the G10 plus Spain and Australia – are included in the study. As asupplementary discussion, Annex I.1 describes securities exchanges in the United States, Japanand Europe and any associated consolidation.
Several methods of consolidation are discussed in the chapter, including mergers, acquisitions,joint ventures and strategic alliances. These transaction types are defined and quantitative datapresented and discussed. In addition, data on the condition, performance, structure andconcentration of each country’s commercial banking and insurance industries are presented tohighlight patterns, particularly those associated with consolidation. Concentration of certainfinancial activities on a global basis is also examined to assess the importance of the world’slargest financial firms.
The chapter is organised as follows: Section 2 discusses several of the methods that are used byfirms to consolidate. Section 3 presents extensive data and discussion of merger and acquisitionactivity. More limited data and discussion on joint ventures and strategic alliances are alsoprovided. Section 4 focuses on the structure of the financial services industry and has three mainparts. First, the banking and insurance industries of each country are discussed. Second, somebasic international comparisons are made. Third, the global role of banking and securitiesleaders is examined. The chapter ends with a brief conclusion.
2. Methods of consolidationIn general terms, consolidation of the financial services sector involves the resources of theindustry becoming more tightly controlled, either because the number of key firms is smaller orthe rivalry between firms is reduced. Consolidation may result from combinations of existingfirms, growth among leading firms, or industry exit of weaker institutions. This chapter focusesprimarily on the first of these causes.
There are several alternatives for firms combining with each other. Each has its strengths andweaknesses and may be particularly appropriate in certain situations. Section 3 presents data ontwo classes of methods: (1) mergers and acquisitions and (2) joint ventures and strategicalliances.
The primary methods of consolidation employed by firms are mergers and acquisitions. Withboth of these methods, two formerly independent firms become commonly controlled.Throughout this chapter, the terms merger and acquisition are used interchangeably to refer totransactions involving the combination of two independent firms to form one or morecommonly controlled entities. The distinction between a merger and an acquisition is somewhatvague. A merger is often defined as a transaction where one entity is combined with another sothat at least one initial entity loses its distinct identity. Thus, full integration of the two firmstakes place and control over a single entity can easily be exercised. An acquisition is often
32
classified as a transaction where one firm purchases a controlling stake of another firm withoutcombining the assets of the firms involved. Relative to acquisitions, mergers provide a greaterlevel of control, because there is only one corporate entity to manage. Acquisitions are mostappropriate when there are operational, geographic or legal reasons to maintain separatecorporate structures.
Mergers and acquisitions are also sometimes distinguished by defining mergers as transactionsinvolving two firms that are of essentially equal size, while acquisitions are transactions whereone party clearly obtains control of another. A partial, or non-controlling, acquisition is similarto an acquisition of a controlling interest, except that, as the name implies, the acquiring firmdoes not establish control. Such deals encourage cooperation between potential rivals, becausethey establish a common interest among the firms. Partial acquisitions may also serve as a firststep for firms before engaging in more complete consolidations of control.
Joint ventures and strategic alliances enable firms to work together without either firmrelinquishing control of its own operations and activities. Strategic alliances are partnershipsbetween independent firms that involve the creation of tangible or intangible assets. The level ofcollaboration is often fairly low and focused on a well-defined set of activities, services orproducts. Strategic alliances may be most appropriate for the exchange of technical informationand sophisticated knowledge or when there are legal, regulatory or cultural constraints making amore thorough collaboration difficult or illegal. Moreover, relative to mergers and acquisitions,strategic alliances generally involve lower formation and dissolution costs. Like partialacquisitions, strategic alliances may enhance cooperation among firms or serve as a first steptowards a merger or acquisition.
A joint venture, which may be viewed as a type of strategic alliance, occurs when two or moreindependent firms form and jointly control a different entity, which is created to pursue aspecific objective. This new entity typically draws on the strengths of each partner. Jointventures facilitate consolidation, because they enable firms to develop strong ties. Joint venturesmay also serve as a precursor to more comprehensive consolidation such as mergers.
3. Patterns in transaction activityIn this section, patterns in mergers and acquisitions and patterns in joint ventures and strategicalliances are examined over the 1990s for deals involving financial firms. The data wereobtained from Securities Data Company (SDC), which attempts to collect information on alltransactions involving large and medium-sized firms. With the mergers and acquisitions (M&A)data, the analysis only includes those deals in which both of the participating firms were fromthe financial sector. With joint ventures and strategic alliance data, only deals where the sharedbusiness arrangement is classified as financial in nature are included.
Constructing transactions data that are accurate, comprehensive and comparable acrosscountries is inherently difficult, and although SDC appears to have done a good job, there arelikely to be differences in the availability of data across countries that could influence reportedfigures. In addition, it is highly likely that at least some deals include firms with improperlyclassified industries or countries.7
In the M&A data, financial firms are classified as operating in one of three industries: banking,insurance or securities/other. Investment banks are classified as securities firms. Theannouncement date is used to determine when the transaction took place. Only deals that werecompleted or still pending as of May 2000 were included; all cancelled deals were excluded.
7 As a result of improper classifications and other issues associated with obtaining accurate and consistent data,some of the figures reported in the tables in Annex A exhibit minor inconsistencies.

33
The number of M&A deals, total deal value and average deal value are reported in the tables inData Annex A for a variety of groupings based on the country and industry of the participants ineach year of the 1990s, as well as for the entire decade.8
Joint venture and strategic alliance data are not as comprehensive as M&A data. The annual anddecade total number of deals in each country is reported, as is the breakdown between cross-border and within-border deals. Cross-border agreements are defined as those deals in which thefirms sponsoring the joint venture or strategic alliance were not all located in the same country.Therefore, within-border transactions involve sponsoring firms that were all from a singlecountry. The distinction between cross- and within-border agreements is based solely on thelocation of the firms sponsoring the venture. Therefore, the tables present no informationregarding the country of the venture itself relative to the country of the sponsoring firms.
A more detailed description of the source of the transactions data, as well as the definitions,screens and classifications that are used, is provided in Data Annex A. The annex also presentstransactions tables. Table A.1 presents global figures on M&A activity between 1990 and 1999.Tables A.2 to A.4 provide aggregate figures for the North American, Pacific Rim, and Europeancountries included in the study, and Tables A.5 to A.17 provide separate data for each of thosecountries. The number of joint ventures and strategic alliances is reported in Table A.18. It isimportant to note that the data collected by SDC are not comprehensive or free of errors.However, most large deals are included and the data should provide an excellent foundation foranalysing patterns in transactions.
Mergers and acquisitions
Mergers and acquisitions are methods of consolidation where a change in control takes placethrough a transfer of ownership. These two methods, which are not distinguished from eachother in this chapter, strongly bind the participating firms and can have a substantial effect oneconomic structure. For purposes of the tables and discussion, M&A activity is defined asoccurring when ownership by one financial firm of another goes from less than 50% to morethan 50%. Such a change generally results in an unambiguous transfer of corporate control.
Broad global patterns
SDC reports that in the 1990s there were more than 7,300 deals in which a financial firm in oneof the 13 countries included in this study was acquired by another financial firm (Table A.1).The value of these deals was roughly USD 1.6 trillion.9 Over the same period, financial firms inthese countries made roughly 7,600 acquisitions with a similar estimated value. The differencesbetween the two sets of figures are attributable to cross-border deals involving a firm in acountry not included in this study and a firm in a country that is included.10
8 Value is not always released by participating firms. Therefore, average value, which is total value divided by thenumber of deals with a reported value, does not always equal total value divided by the total number of deals.
9 Deal value is a somewhat ambiguous term as SDC obtains its estimates from announcements available frompublic sources. In the case of share exchanges, the deal value is based on the market price of shares. In the case ofa merger of equals, the transaction value is calculated as the value of shares that are exchanged. Values are alsonot based on a consistent date relative to the merger process, as the recorded transaction value may vary duringthe period between announcement and consummation of a deal as information becomes available or deal termsare changed during post-announcement negotiations. The value is reported in nominal terms, so changes overtime are influenced at least somewhat by inflation.
10 In some deals, a firm in one of the 13 countries purchased a firm located outside the group of 13, and in otherdeals, a firm from elsewhere made an acquisition in one of the 13. The former would only be included when dealsare classified by acquirer. Likewise, the latter would only be included when classification is based on the target.Deals involving two firms from the 13 reference countries are included regardless of whether deals are classifiedby target or acquirer.

34
The level of M&A activity involving financial firms increased during the 1990s, with stronggrowth both in the number and in the average value of M&A transactions. In the last three yearsof the decade, there were nearly 900 transactions annually involving the acquisition of afinancial company in one of the 13 reference countries. These deals were associated with anestimated total value of almost USD 400 billion per year. These levels represent a nearlythreefold increase in the number of deals observed in 1990 and roughly a tenfold increase intotal value per year. Similar patterns exist among deals in which the acquirer was a financialfirm in one of the 13 countries under examination. The increase in activity between 1990 and1999 may be somewhat exaggerated, because the SDC database excluded deals with a reportedvalue below USD 1 million before 1992.
The rapid growth in total M&A transaction value was accompanied by an increase in theestimated size of the average transaction, which was roughly similar to the growth of the marketvalue of financial sector stocks over the same period. In the last three years of the decade, therewas a dramatic rise in the number of and value associated with large M&A deals. This pattern isdemonstrated in Table I.1, which reports the annual number and aggregate value of mergers andacquisitions that involved a financial firm in one of the 13 countries as the target and that had areported value of at least USD 1 billion.
Table I.1Financial sector mergers and acquisitions with value greater than USD 1 billion
1990 1991 1992 1993 1994 1995 1996 1997 1998 1999
Number 8 10 6 11 14 23 21 49 58 46
Value (USD bn) 26.5 22.1 12.4 39.7 23.7 113.0 59.0 233.0 431.0 291.0
Source: Thomson Financial, SDC Platinum.
Most of the M&A activity during the decade involved banking firms. About 60% of dealsinvolved the acquisition of a banking organisation. Securities/other firms were targets in about aquarter of deals, and acquisitions of insurance firms only constituted about 15% of transactions.Interestingly, banking deals accounted for about 70% of the value of all deals, whilesecurities/other acquisitions comprised only about 11%.11
Global patterns by same/different countries and industriesTo further examine patterns for different types of M&A activity, deals are placed into one offour groups based on whether the transactions involved firms in the same or different countriesand industries. The first group examined comprises domestic, same-industry deals. The dataclearly indicate that most of the M&A consolidation activity in the financial services sectorduring the 1990s involved firms operating in the same industry and from the same country(Table A.1). Such transactions accounted for more than 70% of total activity measured in termsof both the number of deals and the value of deals. The prevalence of same-country, same-industry activity may reflect regulatory constraints in some countries prohibiting cross-borderand cross-industry mergers.
Because domestic, same-industry deals are so prevalent, observed patterns of consolidation aregenerally not strongly influenced by whether deals are classified by the country and industry of
11 When deals are classified by the industry of the acquirer, the results are similar.

35
the acquirer or of the target. Therefore, most of the discussion in this chapter regarding patternsof M&A activity focuses on deals classified by target. However, distinctions between resultsbased on target and acquirer classifications are noted when they are important.
The average value of domestic, same-industry transactions was much greater in the latter half ofthe decade than in the first half. The average deal value was under USD 150 million for theperiod up to 1994 and jumped to USD 500 million between 1995 and 1999. Transaction valuewas especially large at the end of the decade, averaging about USD 800 million over the lasttwo years.
The banking industry represented by far the largest share of domestic, same-industry M&Aactivity. Approximately 68% of all deals and 78% of the value of such deals involved a bankbeing acquired. A landmark year for domestic banking mergers was 1995, when the averagevalue of transactions quadrupled compared to the previous two years. The average value of bankM&A transactions generally increased throughout the second half of the decade.
The second type of domestic deal involves firms that operated in the same country and differentindustries. Although these deals were the second most common type of transaction, they onlyaccounted for about 15% of all deals, whether measured by number or value. There was a fairlysteady increase in the overall number of deals throughout the decade. In terms of the value oftransactions, 1998 was a year of very large deals. The aggregate deal value during that year wasnearly USD 110 billion, about half of the 10-year total, and the average value exceededUSD 1.3 billion. These deals often resulted in the creation or substantial growth of large,complex banking organisations.
As with the case of domestic, same-industry transactions, mergers with banks as targetsrepresented the most common type of deal as measured by value. However, securities firmswere more important than observed in the case of domestic, same-industry transactions.Average values for domestic, cross-industry deals with targets from each industry werecomparable to the average levels for similar domestic, same-industry deals, with the exceptionof the insurance industry, where same-industry deals were larger on average.
Cross-border, same-industry deals are examined next. When deals are classified by the countryand industry of the acquirer, there are about 250 more deals than when deals are classified bytarget. This discrepancy indicates that, in the aggregate, firms located in the 13 referencecountries were net acquirers of firms in their own industry. In other words, firms in the 13countries acquired more same-industry firms in countries not in the study than were purchasedby firms in those non-study countries.
During the 1990s, the total value of acquisitions of firms located in reference countries byforeign firms operating in the same industry amounted to about USD 140 billion, a figure thatcorresponds to nearly 10% of the total transactions in the financial sector over the period. Suchactivity grew throughout the decade. Nevertheless, the impact of various impediments to cross-border consolidation, including economic, operational and regulatory barriers, is evidenced bythe large differences in the level of domestic and cross-border activities in all three industries.
A particularly striking contrast between domestic and cross-border consolidation involvingsame-industry firms was the relative importance of different industries. In particular, insurancefirms were frequently involved in buying foreign rivals, as the acquisition of insurancecompanies accounted for about 40% of all deals and nearly half of total transaction value. Incontrast, banking deals, which were very prevalent in domestic consolidation, accounted foronly about one third of the number and value of all cross-border, same-industry activity.Insurance transactions were prevalent throughout the period under review, but were particularlyimportant after 1997.
Finally, the least common type of deal was cross-industry, cross-border consolidation. Therewere only about 250 such M&A transactions with a target from a country included in the studyand roughly 330 such deals with an acquirer from one of the 13 countries. The averagetransaction in this category typically involved a lower value than deals with firms that shared a
36
country, industry or both. Similarly to all other categories of consolidation, cross-border andcross-industry deals became both more frequent and larger during the second half of the 1990s,especially in the last three years of the decade. International, cross-border deals helped facilitatethe creation and growth of large and complex financial institutions.
As with the international, same-industry transactions, financial firms in the 13 countries wereacquirers more frequently and for more value outside their domestic country than they weretargets of foreign firms. There were also important differences in the industry composition ofdeals in which the firms from the reference countries were the targets and those where they werethe acquirers. When a firm from one of the 13 countries was acquired, it was commonly a bank(57% of total value) or, to a lesser extent, a securities/other firm (25%). In contrast, overseasacquisitions by firms in one of the 13 countries often involved a purchase by a securities/otherfirm (48%) or insurance company (33%).
Patterns in individual regions and countries
Even though some general patterns are evident on a global level, a number of differences in thepatterns of M&A activity in various countries existed in the 1990s (Tables A.5 - A.17). Therelative importance of M&A activity, as measured by total deal value over the decade dividedby GDP over the period, differed substantially across countries. In Germany, Japan and Canada,this measure was less than 0.5%, whereas in Switzerland, Belgium, the United States and theUnited Kingdom, it exceeded 1% regardless of whether deals are classified by target or acquirer.
Countries also differed in the extent to which their firms engaged in international mergers. Inthe United States and Japan, almost all deals involved two firms from the home country. Incontrast, when one of the firms was located in Belgium, half of all deals, accounting for about40% of all value, involved an international transaction. Classifying by target or acquirergenerally makes little difference in the relative importance of foreign and domestic deals, exceptin the case of the Netherlands. Dutch firms made some large overseas acquisitions that raisedtheir cross-border figures when deals are classified by acquirer relative to when deals areclassified by target.
Although there were differences across countries in the relative amount of activity within andacross industries, those differences tended to be smaller than those observed within and acrossborders. In Japan, Spain and the United States, a large amount of M&A activity involved firmsoperating in the same industry.12 Among the countries with firms that engaged in a lot of cross-industry activity was Belgium, which also had firms that engaged in a lot of cross-border deals.
The particular industries in which targets and acquirers operated varied by country. In theUnited States, targets and acquirers were frequently banks, a finding that is consistent withdomestic banking deals being highly prevalent in the United States. In other countries, such asAustralia, Canada, the Netherlands and the United Kingdom, banking deals were not nearly ascommon. In Japan, almost half of all deals involved firms in the securities/other industry, butthese deals were very small and accounted for very little value. In contrast, the banking industryaccounted for about half of all deals, yet virtually all of the value of deals.
Although countries generally exhibited similar patterns in M&A activity, there were substantialdifferences in patterns across time. Comparing the last three years of the decade (1997-99) tothe first seven (1990-96) reveals that Canada and, to an even greater extent, Japan experiencedvery large increases in the average annual number of deals. In contrast, firms in France,Switzerland and the Netherlands were involved in fewer deals annually as both targets andacquirers.
12 The relatively modest amount of cross-industry activity in Japan and the United States in the 1990s may havebeen largely due to legal restrictions, whereas the relative lack of such activity in Spain may have been largelyattributable to an already high level of cross-industry ownership.

37
Average deal value reveals a somewhat different and more consistent picture. Nearly allcountries exhibited a higher average deal value at the end of the decade. In seven countries, theaverage value of a deal involving a home-country firm was at least three times as high duringthe last three years as during the first seven. Most notable is Switzerland, where the averagevalue of purchased firms was almost 30 times more at the end of the decade. This difference isdue largely to a small number of very large firms being acquired or engaging in mergers,primarily in 1997. When deals are classified by acquirer, acquisitions averaged twice as much inthe last three years than in the first seven in 10 countries. Belgian firms made acquisitions thatwere nearly 15 times larger. The only countries that showed a decline in average deal valuewere Japan (by target and by acquirer) and the Netherlands (by target). Japan’s decline wasattributable to one huge deal in 1995 and the drop in the Netherlands was due to several largedeals in the early part of the decade.
In the remainder of this section, patterns in M&A activity for the countries included in thisstudy are examined more closely on a regional basis. Nations are placed into one of threegeographic regions – North America, the Pacific Rim and Europe. In both North America andthe Pacific Rim, there are only two countries, one of which is much larger than the other.Therefore, because a regional discussion would be very similar to a discussion of the largercountry, the text focuses on each country separately. In Europe, the discussion is not organisedon a country-by-country basis. Instead, area-wide patterns are described more thoroughly, anddata from individual countries are introduced as supporting evidence. This approach seemsmore appropriate for Europe given that there are nine nations with strong economic ties, manyof which are fairly comparable in size.
North America
United States
The global M&A picture was dominated by firms located in the United States. During the1990s, deals involving US firms, classified either by the country of the target or by that of theacquirer, accounted for about 55% of all financial deals, measured by either number or totalvalue of transactions (Table A.5). The intense consolidation activity in the United States wasdriven, at least in part, by changes in the regulatory framework, a variety of technologicalchanges, and intense pressure for cost reductions and revenue enhancements in segments of theindustry (see the Causes chapter for a more thorough discussion of the causes ofconsolidation).13
In particular, the data reflect the reaction of the US banking industry to the Riegle-NealInterstate Banking and Branching Efficiency Act of 1994, which greatly relaxed interstatebanking and branching restrictions. Although many of the deals in the United States weredomestic bank-to-bank transactions throughout the decade, the average value of such deals roseconsiderably in the latter part of the 1990s. Very large banking companies were increasinglyexpanding the geographic footprint of their operations by buying other very large banks. In1998, several extremely large deals took place including BankAmerica-NationsBank, WellsFargo-Norwest, and Banc One-First Chicago NBD.
Domestic, cross-industry merger activity represented 11% of the total financial sectorconsolidation activity by number of transactions and 14% by value. This picture, however, ismisleading, as most of the domestic, cross-industry transaction volume, in terms of value, tookplace in the 1997-98 period. During these years, there were some large deals, especially thoseinvolving banks. Indeed, the value of banking acquisitions rose to more than USD 80 billion in
13 The relatively high level of measured activity for US firms may also reflect a potential bias in the coverage of thedatabase as discussed in Annex A, whereby deals among US firms may be more highly represented than dealsinvolving firms from other countries.

38
1998, accounting for almost two thirds of the total value of domestic, cross-industry deals in theentire decade. One of the most important and unique financial deals in this period was the 1998merger between Citicorp, which was a bank holding company, and Travelers, which was aninsurance and securities firm.14 Cross-industry deals involving the acquisition of non-bankfinancial companies peaked around 1996-97. Earlier in the decade, restrictions on bankactivities limited the level of domestic, cross-industry consolidation activity.
Acquisitions of US financial firms by foreign, same-industry firms increased in the late 1990s,as three quarters of the overall deal value associated with such acquisitions arose between 1997and 1999. Likewise, US firms also increased the rate at which they purchased foreign firms thatoperated in their own industry. Of special note, firms headquartered in the United States madeforeign acquisitions more frequently than their foreign counterparts made US acquisitions, butthe size of the purchases made by US firms was smaller. During the decade, acquisitions offoreign firms by US firms had an estimated average value (roughly USD 300 million) whichwas less than half the value of acquisitions by foreign firms of US firms (roughlyUSD 800 million), suggesting that foreign firms may have been more focused on larger, moremature firms.
Cross-border, cross-industry deals were rare in the 1990s, but many of the deals of this typeinvolved US firms in the securities/other industry, as either acquirer or target. US banks werealso not uncommon targets of such deals.
Canada
In Canada, consolidation activity was fairly modest in the first half of the 1990s (Table A.6).During this period, M&A activity was characterised by a small number of transactions betweensmall and medium-sized financial firms. However, in later years, a greater number oftransactions took place, including some large deals, especially in the banking and insuranceindustries. Of particular note was a merger between two Canadian banking concerns (TD BankFinancial Group and CT Financial Services) announced in 1999.
Most other domestic, same-industry activity was not very significant. More than half of suchdeals involved firms in the securities/other industry, but these transactions tended to be verysmall, with an average deal value under CAD 50 million. The most frequent targets of domestic,cross-industry merger activity were banks. However, with domestic, cross-industry deals,securities/other firms were both the most active acquirers and the largest targets, and insurancefirms were engaged in the largest deals as acquirers. Many of the cross-border deals involvingCanadian firms, as either acquirer or target, were relatively modest in size.15
14 The merger between Citicorp and Travelers to form Citigroup did not violate the provisions of the Glass-SteagallAct or the Bank Holding Company Act, which restricted the securities and insurance activities of bank holdingcompanies, because the Board of Governors of the Federal Reserve had the authority to allow Citigroup tooperate for as long as five years before requiring a divestiture of certain activities that might be consideredimpermissible. The issue of whether the deal violated existing laws and regulations became irrelevant with thepassage of the Financial Services Modernization Act in 1999.
15 There is one cross-border, same-industry transaction in the banking industry that may raise questions. Thedatabase shows this particular deal as the merger/takeover of Newcourt Credit Group Inc (classified by SDC as aCanadian “credit institution”) by CIT Group Inc (a US “credit institution”). “Credit institutions” are classified asbanks in the analysis conducted in this chapter. While this classification might not be highly relevant in this case,classifying credit institutions as banks is appropriate in the context of other countries included in the study.
39
Pacific Rim
Japan
Merger and acquisition activity in the Japanese financial sector was rather subdued for nearlythe entire 1990s (Table A.7). Before 1999, there were few acquisitions of firms in either thebanking or securities/other industries and even fewer acquisitions of Japanese insurancecompanies. The main deals that took place during this period of modest M&A activity were aseries of transactions by Mitsubishi Bank, which purchased a majority interest in Nippon Trustin 1994 before merging with Bank of Tokyo in the following year. Also, Taiyo Kobe Bank andMitsui Bank merged to become Sakura Bank, and Kyowa Bank and Saitama Bank merged tobecome Asahi Bank at the start of the decade. A number of deals in the middle and late 1990stook place as a result of financial distress among the acquired institutions.
The pattern of modest M&A activity that persisted throughout much of the decade changeddramatically in 1999. Nearly half of all Japanese deals that took place in the 1990s occurred inthat final year. Moreover, except for the 1995 Nippon Trust-Mitsubishi Bank merger, the 1999deals tended to be larger than those in previous years. Many of the 1999 deals were among thenation’s top banks and were a product of government efforts to resolve those banks’ bad loansituations and improve their longer-term profitability. Only a handful of significant cross-borderacquisitions took place in the 1990s that involved Japanese financial companies as eitheracquirers or targets. However, several distressed Japanese banks and insurance companies wereacquired during the decade, especially in the second half. The average value of cross-borderdeals involving Japanese acquirers was extremely low and was much smaller than the value ofsuch deals with Japanese targets.
Australia
The number of deals between domestic, same-industry Australian firms increased slightly overthe 1990s, but not steadily and not by much (Table A.8). However, most large deals of that typewere generally concluded during the second half of the decade. Several more very large same-industry deals might have taken place, but mergers between the country's four largest bankingorganisations were ruled out by the government because of their likely effect in reducingcompetition. An important factor driving mergers involving insurance firms was the gradualconversion of mutual firms to stock firms. This “demutualisation” increased the opportunitiesfor consolidation.
Domestic, cross-industry M&A activity, which was concentrated in the second half of the1990s, involved a relatively large number of acquisitions by banks of firms in thesecurities/other industry. An important factor driving some cross-industry acquisitions,especially those by banks, was a desire to acquire asset management capacity in order toparticipate in the growth of the private pension provision market. The overall number ofdomestic, cross-industry transactions was not only half of same-industry activity, but theaverage value of cross-industry deals was lower as well.
There were only a handful of significant cross-border acquisitions of Australian financialcompanies during the 1990s, many of which involved firms in the same industry. Onesignificant cross-border deal involved the takeover of an Australian insurance company in 1995.Australian firms were engaged in slightly fewer, but larger, international cross-industry deals asacquirers than as targets.
EuropeRoughly two thirds of European M&A activity in the 1990s, as measured by the total value oftransactions involving the acquisition of a European financial firm, occurred during the lastthree years of the decade (Table A.4). Overall, firms in the European countries included in thisstudy engaged in fewer, but generally larger transactions than North American institutions. Thetotal value of all European deals, however, was only about half that of North American deals.

40
Merger activity, as measured by the value of firms acquired, was primarily concentrated in thebanking industry, which accounted for about 65% of the total. Insurance was the second mostactive industry at roughly 25%. In both the banking and insurance industries, average Europeanacquisition values were substantially higher than averages in North America. In contrast, valueswere lower in European deals involving firms in the securities/other industry.
The number of domestic, same-industry transactions showed a less pronounced upward trend inEurope than in North America during the decade. However, important differences exist in thepatterns of domestic, same-industry consolidation activity among individual Europeancountries. In Belgium, Italy, Spain, the Netherlands and the United Kingdom, most, and in somecases almost all, of such activity, measured by value, occurred in the last two years of thedecade.
Other differences in the patterns of domestic, same-sector deals also existed, as Belgium, Spainand Switzerland exhibited a high concentration of transaction activity in the banking industry,primarily in terms of value. In several European countries, at least one large transaction tookplace that led to the creation of a dominant domestic institution (eg BayerischeHypoVereinsbank in Germany, UBS in Switzerland).
Among European countries, the United Kingdom was home to the largest amount of domestic,same-sector transaction activity, accounting for about 25% of the number and 30% of the totalvalue of such deals in Europe. This finding is consistent with the casual observation that theincreased integration of European financial and capital markets prompted many UK (as well asnon-UK) financial institutions to seek a foothold in London or expand their existing operationsin that financial centre.
As with the other global regions, domestic, cross-industry consolidation in Europe was lesscommon than domestic, same-industry activity. Compared to North America, however,domestic, cross-industry consolidation exhibited a different pattern over time in terms of thenumber of firms being acquired. In Europe, the number of acquisitions remained fairly steady inthe latter half of the decade, although registering a one-year slump in 1998.
While the overall number of domestic, cross-industry deals was roughly the same in the tworegions, the average European deal was valued at about USD 300 million, which was about onethird lower than in North America. Both regions experienced a surge in the average value oftransactions in 1997 and 1998. This surge resulted in the average value of European, cross-industry targets during this two-year period being about four times the average for the remainderof the decade. Interestingly, the dip in the number of domestic, cross-industry transactions in1998 coincided with the peak in the total value of deals, with the greatest share of that valueinvolving purchases of banks.
A distinguishing feature in Europe was the relative importance of domestic, cross-industryacquisitions of insurance firms. Transactions in the insurance industry represented the secondlargest group in terms of total value and exhibited a high average deal value. The total value ofsuch transactions accounted for at least half the value of all domestic, cross-industry activity inGermany, France, Spain and Switzerland. In all of these countries, however, the importance ofinsurance deals was the result of a few large transactions, as acquisitions of banks outnumberedthose that involved the purchase of insurance companies.
Domestic, cross-industry patterns in Belgium, Switzerland and the Netherlands shared animportant similarity. In all three countries, there were relatively few, albeit very large,acquisitions, which enabled conglomerates pairing banking concerns with insurance companies(“bancassurance”) to emerge. In fact, in Belgium and the Netherlands, the aggregate value ofdomestic, cross-industry consolidation exceeded the value of domestic, same-industrytransactions.
International mergers and acquisitions involving European firms accounted for a large share ofall cross-border, same-industry activity. In fact, European firms were targets in 65% of suchtransactions. These deals correspond to transactions valued at roughly USD 65 billion. More
41
importantly, however, same-sector foreign acquisitions by European financial companies overthe 1990s exceeded USD 120 billion. Overall, European firms were therefore large same-industry net acquirers, in that they were purchasers of foreign firms (in terms of number andvalue) more than they were targets.
Overall, insurance was the leading industry in cross-border, same-industry transactions inEuropean countries. This pattern holds, although just barely in some cases, with both thenumber and average value of transactions, as well as when deals are classified either by thecountry of the target or by that of the acquirer. In six of the nine European reference countries,more than half of the value associated with the purchase of domestic firms by foreign financialinstitutions involved transactions with domestic insurance firms. Such deals were particularlyimportant in Germany, Italy, the Netherlands and Switzerland.
A difference exists between the typical size of cross-border, same-industry transactionsinvolving European banks when such firms were targets and when they were acquirers. Theaverage deal value associated with the acquisition of a European bank by a foreign bank wasabout USD 200 million. This figure is less than half the average value associated with dealsinvolving a European bank buying a foreign bank.
Finally, cross-border, cross-industry acquisitions of European financial firms represented morethan 60% of the number and value of all international, cross-industry deals. European bankswere particularly popular targets, as the total value of acquisitions of European banks by foreignnon-banks was more than two times greater than the value of deals involving the other twofinancial industries combined. While most of the activity in terms of value took place after1997, especially in Belgium, Germany, Italy and the United Kingdom, the acquisition ofEuropean banking interests by foreign non-banking firms showed an early peak in 1990-93,when a few large deals took place. Overall, European firms were net acquirers with respect tocross-border, cross-industry transactions.
Joint ventures and strategic alliances
In this section, joint ventures and strategic alliances are defined as agreements where two ormore entities combine resources to form a new, mutually advantageous business arrangement toachieve predetermined objectives. In addition to participating in the venture, the original firmscontinue to operate as they had before their alliance. Joint ventures and strategic alliances are aweaker method of binding two firms together than mergers and acquisitions.
The data presented in Table A.18 reveal several of the same patterns as those observed with theM&A data. First, activity volume increased over the decade, especially in the last few years. Ofthe roughly 3000 deals recorded by SDC, about half took place in either 1998 or 1999. Incontrast, about one quarter of all agreements occurred in the five-year period between 1990 and1994. Second, the United States accounted for much of the activity. Nearly half of all the jointventures and strategic alliances involved the creation of a US entity.
Third, within-border ventures, defined as deals involving “parent” firms from a single country,were 50% more prevalent than cross-border ones. However, within-border deals were not nearlyas universally common as with M&A activity. In fact, with ventures involving the creation of aEuropean or Pacific Rim entity, cross-border transactions were, in aggregate, more commonthan within-border deals. In Europe, there were about 50% more cross-border joint ventures andstrategic alliances than within-border agreements, and in the Pacific Rim, cross-border dealswere about 25% more common. Among all deals, cross-border joint ventures and strategicalliances were more common than cross-border mergers and acquisitions. This difference isconsistent with the belief that ventures and alliances are highly useful in cases where mergersand acquisitions may be difficult, such as when firms from different countries are involved.

42
Summary of key patterns in transactions activity
Merger and acquisition activity generally increased during the 1990s, especially during the lastthree years of the decade when average deal value increased substantially. Over the entireperiod, several types of deals were prevalent. Transactions involving firms located in the samecountry and operating in the same industry were by far the most common type of deal. Inaddition, M&A activity frequently involved firms in the banking industry. Finally, firms in thethirteen countries included in this study were, in the aggregate, acquirers more often than theywere targets and were involved in deals with greater total value as acquirers than as targets.
In addition to several important common trends, some key differences characterised the M&Aactivity of various countries during the decade. The value of such activity varied across nationsand was relatively low in Germany, Japan and Canada (below 0.5% of GDP over the decade bytarget and acquirer) and relatively high in Belgium, Switzerland, the United States and theUnited Kingdom (greater than 1.0% of GDP). In the United States, a large share of activity, interms of both number and value of deals, involved domestic, banking mergers. In othercountries, most notably Belgium, deals tended to more heavily involve firms from differentcountries or different industries. Also, some countries, such as Canada, experienced asubstantial increase in the number and average value of deals towards the end of the decade,whereas others, such as the Netherlands, did not experience an end-of-decade spike.
Joint venture and strategic alliance data reveal some of these same patterns. The number ofagreements increased over the decade, especially in the last few years, and the United Statesaccounted for a large portion of all such ventures. Although agreements involving firms from asingle country were more prevalent among all ventures and alliances than cross-borderagreements, the latter were actually more common outside the United States.
4. Patterns in the structure of the financial sectorIn this section, key structural measures of the commercial banking and insurance industries areexamined for each country with the primary focus being elements associated with consolidation.Some international comparisons are also made. In addition, features of banking and certainsecurities and over-the-counter derivatives activities are examined on a global basis. Thissection of the chapter illustrates some of the effects that the transaction activity discussed in theprevious section has had on financial structure.
The primary data used in the chapter, which were collected from national authorities with thehelp of the OECD and other sources, are well suited to an analysis of particular industries inindividual countries. However, extensive cross-country comparisons are difficult to make due toa lack of consistency. According to the OECD, “international comparisons in the field ofincome and expenditure accounts of banks are particularly difficult due to considerabledifferences in OECD countries as regards structural and regulatory features of national bankingsystems, accounting rules and practices, and reporting methods.”16 Comparisons of insurancedata are similarly difficult. A detailed description of the data and how they were collected isprovided in Data Annex B. The annex also presents Tables B.1 to B.13 with banking andinsurance data for each country. Table B.14 presents some of the key measures from Tables B.1to B.13 in a way that makes it easy to view all countries simultaneously.
Most of the data in the section relate to the banking and, to a lesser extent, insurance industries.Only a limited amount of securities data is presented. The discrepancy in the volume of datacovering the different industries is driven largely by availability. Obtaining sufficient country-
16 Organisation for Economic Co-operation and Development (1999a).
43
specific banking and insurance data was easier than collecting securities data. Nonetheless,available securities data are presented to illustrate key patterns.
Before discussing each country’s financial sector, a brief historical background is provided.Around 1980, there were two basic models for the relationship between commercial bankingand securities activities. One, which could be called the “Glass-Steagall” model, involved alegal separation of the two activities; Japan and the United States were good examples of thismodel. The second, which could be referred to as the “universal bank” model, permittedfinancial institutions to engage in both commercial banking and securities activities. Asomewhat related issue is the degree to which insurance was separate from banking andsecurities activities.
Another key feature of a country’s financial sector was the degree to which capital markets wereactive and developed. In 1980, capital markets were well developed in Canada, the UnitedStates and the United Kingdom. In contrast, capital markets were generally not well developedin the other countries in this study. Firms there relied primarily on banks for long-term funds.Although the characteristics of a country’s financial sector in 1980 influenced the consolidationpatterns observed in subsequent years, a country’s starting point was not necessarily a predictorof subsequent consolidation activity.
Country-by-country analysis
North America
United States
The US financial services sector has traditionally consisted of three largely distinct types offirms – depository institutions (banking), securities firms and insurance firms. Thissegmentation is primarily attributable to various laws that have defined the scope of activities inwhich particular types of financial firms may engage. Throughout the late 1980s and 1990s, theseverity of the separation was weakened, and the Financial Services Modernization Act, whichwas passed and signed into law in late 1999, removed most of the remaining barriers amongbanking, securities and insurance activities. This law did, however, seek largely to retain thelong-standing barrier between financial services and non-financial commerce. The US securitiesindustry is large and well developed, with many of the leading securities firms (investmentbanks) in the world being headquartered in the United States.
The number of firms in each financial segment in the United States is large in comparison withmost other industrial countries, particularly in the case of depository institutions. The largenumber of depository institutions in the United States is due, in large part, to historicalrestrictions on interstate and intrastate banking and branching. Most restrictions on intrastatebanking and branching and some restrictions on interstate banking and non-banking financialactivities were eliminated by 1990. The Riegle-Neal Interstate Banking and BranchingEfficiency Act eliminated remaining restrictions on interstate branching as of 1 June 1997,making nationwide banking possible and spawning numerous interstate mergers andacquisitions.
There are, and have been, three main types of depository institutions in the United States: (1)commercial banks, (2) thrift institutions (savings banks and savings and loan associations) and(3) credit unions.17 Thrifts and credit unions tend to be small and provide basic banking services
17 Deposits up to USD 100,000 held at any of these types of institutions are protected by federal deposit insurance.Savings and loan associations used to have a separate deposit insurance system (FSLIC) from commercial banksand savings banks (FDIC), but FSLIC was integrated into the FDIC in 1989 after the savings and loans crisis ofthe 1980s.
44
to households.18 Commercial banks are the largest and most important group of depositoryinstitutions. They typically serve both households and businesses and engage in the widestvariety of financial activities. Most commercial banks are owned by bank holding companies,which may not only control multiple commercial banking institutions, but may operate thriftsand financial, non-depository subsidiaries as well.
Changes in the structure of the banking industry clearly reflect the extensive consolidation thattook place in the United States during the 1990s (Table B.1). Between 1990 and 1999, the totalnumber of commercial banks and thrifts decreased by about one third from roughly 15,000 to10,000. This dramatic decrease was accompanied by substantial growth, in both absolute andrelative terms, by the largest institutions. The top 100 commercial banks increased their size, interms of total assets and assets relative to GDP, and the very largest banks controlled anincreasing share of the industry. Relative to GDP, the overall banking industry in the UnitedStates decreased during the period.
The life segment of the US insurance industry experienced more modest changes during the1990s. Although the number of institutions steadily declined, concentration only changed by asmall amount, with the direction of the change varying by the number of firms incorporated intothe measure. The non-life segment experienced a different pattern of change than the lifesegment. The number of firms increased slightly, but concentration rose as well. As a share ofGDP, both the life and non-life industries grew during the decade, but the non-life industrybarely grew, whereas the life industry grew at a more rapid rate.
Canada
For several decades, the Canadian financial system has been based on five principal types ofinstitutions: chartered banks, trust and loan companies, the cooperative credit movement, lifeinsurance companies and securities dealers. These different types of firms traditionally operatedseparately. Banks entered the securities business following a legislative change in 1987 thatallowed banks to invest in such firms.
In 1992, consolidation was further facilitated with the passage of legislation that permittedfinancial firms to provide most financial services unless expressly prohibited from doing so.19 In1992, in order to ensure that banking issues are periodically reviewed, the duration of the sunsetclause incorporated in Canadian banking legislation was changed to five years from 10 years.As earlier, life insurance companies and all deposit-taking institutions were restricted in theirholdings of equity in commercial enterprises. In 1999, legislation allowed foreign banks toestablish commercially oriented branches in Canada. Legislation was introduced in 2000 tofurther ease ownership restrictions, allow more flexible holding company structures, facilitatejoint ventures and strategic alliances, and ease entry requirements by allowing small, closelyheld financial institutions, including banks, to exist. However, the legislation was not passedbefore Parliament ended its activities prior to the November 2000 federal election.
The 2000 legislative initiative included guidelines (non-legislative) for the review of mergerproposals of major banks. A formal and transparent merger review process was established forbanks with equity in excess of CAD 5 billion. The guidelines were established after the Ministerof Finance rejected two proposed mergers among leading Canadian banks on the basis that thedeals would have resulted in an unacceptable level of concentration, a significant reduction incompetition and reduced policy flexibility to address future prudential issues that might arise.
18 Throughout the 1980s and 1990s, many thrift institutions faced less restrictive limitations on branching, interstatebanking and non-bank activities than commercial banking organisations.
19 The new laws included the Bank Act, Trust and Loan Companies Act, Insurance Companies Act and CooperativeCredit Associations Act.

45
The number of commercial banks in Canada increased substantially in the 1980s beforedeclining somewhat in the 1990s (Table B.2). The large rise in the earlier decade was driven bythe initial entry of foreign banks, which was allowed starting in 1980. Despite increased entryby foreign banks, the leading Canadian domestic banks, of which there were five during the1990s, tended to be very large and traditionally controlled most of the banking activity inCanada. The dominance of the largest banks increased substantially during the decade.Moreover, the overall banking industry grew during the 1990s, as assets-to-GDP nearlydoubled.
The number of life insurance companies did not change much during the late 1990s. Moreover,although concentration for the five largest life firms increased during the latter part of thedecade, concentration levels for the one, ten and fifteen largest firms remained virtuallyunchanged. The number of non-life insurance companies (largely property and casualty firms)also remained steady in the latter half of the 1990s. Several insurance firms recently convertedfrom mutual to stock ownership.
Pacific Rim
Japan
For many years, the Japanese financial sector has been compartmentalised. Specifically,banking, securities and insurance activities have traditionally been segmented by regulatorymeasures with financial institutions competing within narrowly defined industries.20 Banks canbe classified into the following groups: (1) city banks, which conduct wholesale bankingactivities and maintain large branch networks, (2) long-term credit banks, which engage in long-term lending and issue long-term debentures, (3) trust banks, (4) regional banks and (5) secondtier regional banks. In addition, there are groups of smaller, more specialised deposit-takinginstitutions that include (6) shinkin banks,21 (7) credit cooperatives and (8) agricultural andfishery cooperatives and others. Often, groups (1), (2) and (3) are considered “major banks” andgroups (1)-(5) are called “commercial banks.” In addition, the government-operated postalsavings system has had a significant market share.
Divisions began to change in the late 1990s in response to more intense global competition, theannouncement of extensive legislation (Big Bang) in 1996, and other, more gradualderegulation of the financial sector. During the decade, Japan’s economy experienced protractedproblems that emanated from a large and rising volume of bad debts associated with theproperty and stock market collapses of the late 1980s. In the face of these problems, severalJapanese financial institutions (eg banks, long-term credit banks and securities firms) failed,were acquired by another entity, or were taken over by the government. Much of the financialsector consolidation in terms of the decline in the number of institutions in Japan was driven bybalance sheet deterioration in the midst of a broader economic decline..
Little consolidation took place in the Japanese banking industry. The number of firms did notchange much between 1980 and 1999, although the number of smaller institutions not classifiedas banks declined sharply during that period (Table B.3).22 There was a modest reduction in the
20 For more details of the Japanese financial market, see Ito (1992).21 Shinkin banks are smaller deposit-taking institutions that specialise in taking deposits and lending in the
community.22 The number of banks increased from 150 in 1994 to 173 in 1995, because of a classification change whereby trust
bank subsidiaries were classified as banks. The number of credit cooperatives declined from 475 in 1980 to 407in 1990 and 322 in 1998.
46
number of banks at the end of the 1990s as a result of some bank failures.23 Other indicatorsshow that Japanese banks retrenched during the 1990s. Relative to GDP, total bank assets fellmodestly and large bank assets declined substantially through much of the decade.Concentration measures also tended to decline modestly. The slow growth of the 1990sprovides a stark contrast to the rapid growth of the 1980s, especially among large banks. In thelate 1980s and early 1990s, large Japanese banks occupied high places in the world rankings interms of asset size.24 However, distress in the banking industry and a lack of consolidationresulted in only one bank remaining among the top 10 in 1998.
There is also little sign of consolidation in the Japanese insurance industry. The number of lifeinsurance companies more than doubled, primarily due to deregulation and the entry of 13 firmsin 1996. Moreover, concentration ratios remained fairly steady between 1980 and 1997, beforedropping suddenly in 1998. Both the number of non-life insurance companies and industryconcentration remained stable. The two segments of the insurance industry showed little growthin the level of premiums written throughout the 1990s.
Australia
The Australian financial system in 1980 was strongly segmented along institutional lines. Whilethere were no formal restrictions separating banking, insurance and securities activities,competition was played out within, not across, these lines. The bulk of financial intermediationwas conducted through the banking system, which included five private banks, ninegovernment-owned banks (which included two trust banks), and two foreign banks which, forhistorical reasons, were permitted to operate as branches. In addition, other, smaller deposit-taking institutions (building societies and credit unions) operated as well. With theaforementioned two exceptions, the banking system was closed to foreign entry. Together,banks, merchant banks and finance companies met the bulk of corporate borrowing demand inAustralia, and only limited use was made of direct borrowing through the issue of corporatesecurities. Life insurance and pension funds comprised the remaining significant segment of thefinancial sector. Although the majority of life insurance companies were foreign-owned, theindustry was dominated by one large domestic firm (AMP Society).
The opening of the banking system to foreign competition, which initially occurred in 1984 fora limited number of firms, but was expanded to all foreign firms in 1992, had a large effect onthe banking industry. Deregulation, which allowed banks to compete against finance companiesin the wholesale market and building societies and credit unions in the retail market, alsoinfluenced the industry. Some domestic banks consolidated their merchant banking and financecompany affiliates into one entity.
Regarding consolidation, government policy ruled out mergers among any of the four majorbanks and, until 1997, mergers between the four major banks and the top two or three lifeinsurance institutions. Currently, the only significant restriction in place concerns not permittingmergers among the four major banks, the so-called “four pillars” policy.
Financial deregulation and the opening of the banking industry to foreign competition hasresulted in an increase in the number of banks in Australia over the past 15 years (Table B.4). Inthis deregulated environment, nine large building societies converted to banks. During the1990s all of the government-owned banks were privatised or sold. Notwithstanding the increasein bank numbers, the Australian banking industry has been consistently dominated by fourmajor banks – the Commonwealth Bank, ANZ, Westpac and National Australia Bank.
23 Seven housing loan companies (Jusen) failed in 1995. Several banks failed in the 1990s including Hyogo Bank,an exchange-listed regional bank, in 1995, Hokkaido Takushoku Bank, a city bank, in 1997, and Long-TermCredit Bank and Nippon Credit Bank in 1998.
24 Data on the largest banks in the world were obtained from various issues of The Banker (see Table B.15).

47
Concentration was initially high, but did not change much in the 1990s, although there was adrop in the middle of the decade, before a modest increase towards the latter part of the 1990s.
Consolidation had little impact on the structure of the insurance industry. Not only did thenumber of life and non-life insurance companies remain fairly steady throughout the 1990s, butconcentration also declined. These patterns were observed during a period when both the lifeand non-life segments of the insurance industry grew substantially.
Europe
Common characteristics of European banking
There were several important and widely shared characteristics of the banking industry inEurope. First, European banks tended to operate in accordance with the universal bankingprinciple. This principle encompasses two elements: banks may engage in a full range ofsecurities activities in a direct way rather than through separately incorporated subsidiaries andbanks may closely link themselves to non-bank firms, by either equity holdings or boardparticipations. Firms in Germany, Sweden and Switzerland were the best examples of universalbanks.
The second feature of the European banking industry was a fairly high level of governmentinvolvement. There was widespread public ownership of banks, especially in Germany, Italy,Spain and France, although, beginning in the late 1980s, important privatisation took place incertain countries. Moreover, regulations were frequently stringent regarding interest rates ondeposit and loans. Also, credit and capital market controls existed in all European countries,except Germany, the Netherlands and, to a lesser extent, Switzerland.
Third, capital markets played a limited role around 1980. Equity markets were generally smalland had low market capitalisations in all countries except the Netherlands and Switzerland.Markets for government bonds were more developed, especially in countries with large publicdebts like Belgium and Italy.
The final feature of European banking was the generally limited role of institutional investors,which were particularly unimportant in Italy and Spain, but somewhat more important inSweden, the Netherlands and Switzerland. Restrictions on bank ownership of insurancecompanies were generally binding, especially in Belgium, France and the Netherlands.Regulations were even more constraining on insurance companies holding equity stakes inbanks.25
Belgium
Belgian commercial banks, which have been the dominant entities in the financial sector, can beclassified as universal banks to the extent that they conduct investment banking activities,especially in connection with public debt operations. Also, in the early 1990s, banks wereallowed to perform activities in the equity markets through the acquisition or creation ofspecialised securities firms. Some large banks were permitted to become market-makers in thesecondary market for public bonds. This activity was opened to foreign banks in 1998. Bankshave not traditionally had significant holdings in non-financial corporations or insurancecompanies, as this role has been the limited preserve of several large holding companies.
Government ownership of the so-called public credit institutions is another feature of thebanking system in Belgium. These institutions were established to grant long-term credit onfavourable terms to specific sectors (eg cities, agriculture and small commercial businesses), butevolved during the 1990s to become much more similar to commercial banks. In fact, some
25 Office for Official Publications of the European Communities (1997).
48
public credit institutions were privatised during the decade. The Belgian banking industry alsoconsists of small private savings banks and highly specialised institutions including mortgagecompanies and finance companies.
The high level of public debt in Belgium partially explains the weakness in the issuance ofbonds by private, non-financial corporations. However, equity markets became more fullydeveloped after a 1982 fiscal package that was aimed at stimulating share issues and equityholdings by individuals. In general, limited capital markets increased corporate dependence onbanks.
The dynamism of the insurance industry may have been impaired by very strict rules restrictingthe ownership of such companies and the start-up of insurance subsidiaries by banks.Nonetheless, composite insurance firms, which engage in a wide range of insurance activities,played a much larger role in the financial sector by the end of the 1990s.
Consolidation began influencing the banking industry around the middle of the 1990s. The totalnumber of banks actually increased in the early part of the decade, before reversing course anddecreasing (Table B.5). The drop was especially pronounced after 1996 as a result of mergersand acquisitions. Mergers were initially confined to small and medium-sized banks, but a fewdeals involved large banks towards the end of the decade. As a result of these large mergers, thenumber of large banks declined and concentration increased in the last few years of the decade.
Consolidation also appears to have influenced the insurance industry. Over the decade, thenumber of non-life insurance companies fell by almost half, and the number of life companiesfell by roughly a quarter. Most of the drop in the number of non-life companies occurred in1994. The drop in this year may reflect the exclusion from the data after 1993 of branches offoreign companies whose head offices were situated in the European Economic Area. Premiumlevels indicate that growth was fairly modest in the non-life segment, but robust in the lifesegment.
France
Until the early 1980s, banking activity in France was governed by a set of regulations adoptedin the 1940s that favoured a high degree of specialisation within the financial sector. The maindivision was between commercial banks and investment banks, although this basic classificationwas supplemented by the presence of many specialised banks. Specialisations were typicallybased on such features as the average maturity of credits, industry served (eg agriculture), typeof credit provided (eg export financing), and degree of control exercised by the monetaryauthorities. State-owned mutual and cooperative banks were particularly prominent among thespecialised banks. In addition, two special institutions governed by special laws played animportant role: the postal financial service and the “Caisse des dépots et consignations.”
The role of the state in the French banking industry increased in the beginning of the 1980s,when prominent commercial banks were nationalised. However, this development was soonreversed during two periods of privatisation. The first period took place in the late 1980s andinvolved banks like Société Générale, Crédit Commercial de France and Banque Indosuez. Thesecond period occurred in the 1990s. For instance, Banque Nationale de Paris was privatised in1993 and Crédit Lyonnais was sold in 1999.
Banks could operate insurance companies, but faced very restrictive rules regarding starting upand acquiring equity stakes in such firms. In the life insurance industry, the largest firms werelimited companies. Mutual companies played a much larger role in non-life insurance.
Although the financial sector was highly segmented, a progressive tendency towards universalbanking was felt even before 1980. This evolution was decisively reinforced with the adoptionof the Banking Act of 1984, which abolished the legal distinctions between commercial banks,
49
investment banks and other specialised institutions, thereby establishing a full-blown universalbanking system.26 This evolution towards universal banking was further reinforced by a greaterinvolvement of banks in life insurance activities (“bancassurance”) after the liberalisationbrought about by the single European market.
Significant consolidation took place among French banks in the 1990s, as revealed by the largereduction in the total number of institutions (Table B.6). This decline was primarily driven by adecrease in the number of small banks, and because much of the consolidation activity involvedsmall banks, concentration was largely unaffected. The French banking industry did not growmuch over the decade, as assets-to-GDP remained fairly steady, although it was relatively highthroughout.
The life insurance industry also experienced change. The number of firms declined modestly,the industry became more concentrated, and the size of the industry increased dramatically,almost tripling as a share of GDP. The structure of the non-life segment experienced greaterchange, as the number of firms fell by a third and concentration rose fairly sharply. Much of theincrease in concentration followed the privatisation of public companies. The overall size of theindustry grew only fairly modestly.
Germany
In Germany, banks have traditionally been free to operate as universal banks. However, theconcept of universal banks has to be qualified in several respects: Banks have been able to carryout the full range of commercial banking and investment banking activities, but somerestrictions required the separation of banking and insurance. Nonetheless, banks havecollaborated with insurance companies primarily through strategic alliances and, to a lesserextent, cross-participations. Aside from the currently four big privately owned universal banks(Deutsche Bank, Bayerische Hypo- und Vereinsbank, Dresdner Bank and Commerzbank),specialised financial institutions, mortgage banks and small local cooperative banks have playedan important role and led to a German banking market that has been multi-layered, with a largenumber of institutions. Publicly-owned banks (Landesbanken and Sparkassen (savingsinstitutions)) were fairly important in Germany and their presence in the industry remainedvirtually unchanged during the 1990s, although there was a lot of consolidation among thesavings banks. The postal giro agencies were merged into the Postbank, which is beingprivatised.
An important tax change was adopted in 2000 that will exempt German banks (and all othercorporations) from corporate tax on capital gains associated with the sale of participatinginterests from 2002 onwards. This legislation is expected to encourage banks to dispose of someof their industrial interests.
Germany had a tradition of cross-shareholdings between banks and insurance companies. As aresult, banks chose to collaborate with insurance companies rather than develop in-housebancassurance. These relationships were further encouraged by conservative marketingpractices. Tied agents dominated the life and non-life insurance industries, although brokersplayed a significant role as well as in the life insurance sector.
Equity and corporate bond markets were both quite small and largely dependent on the bankingindustry. This dependence was increased by the issuance of medium-term notes by the bankingindustry. Deregulation proceeded at a slow pace in Germany due to the liberal starting point.Stock market regulations were relaxed in the 1980s, enabling banks to gain better access tosecurities activities.
26 The 1984 Banking Act redefined the notion of credit institutions.

50
During the 1990s, the German banking industry experienced both substantial consolidation andgrowth. The number of banks declined by about a third from 4,700 to 3,200, primarily as aresult of consolidation among savings and cooperative banks (Table B.7). As a result,consolidation appears to have had little effect on concentration among the largest banks. At thesame time that the industry consolidated, total assets increased relative to GDP. In addition, theratio of deposits to assets decreased during the decade, suggesting that much of the increase inbanking assets may have been due to an increase in non-depository activities conducted byGerman universal banks.
The structure of the life insurance industry was not influenced much by consolidation in the1990s: the number of firms declined modestly and concentration increased by a very smallamount. Concentration among non-life firms showed similarly small increases, although thenumber of firms fell from about 400 to 330. Both industries grew relative to GDP.
Italy
Italian banks have traditionally faced regulations related to the funding needs of thegovernment. Segmentation existed within the banking industry, with savings banks playing aparticularly important role. Moreover, regulation explicitly differentiated between short- andlong-term lending banks. In this framework, the so-called special credit institutions providedmedium- and long-term financing to the corporate sector. Banks also traditionally facedgeographic restrictions that limited their ability to establish branches. Most banking restrictionswere removed during the 1980s, so banks faced increasingly less restrictive regulations on theirability to lend, branch and hold participations in non-financial companies.
State involvement in the banking industry was very important at the beginning of the 1980s.However, this involvement declined significantly from the mid-1990s, with the privatisation ofseveral institutions.27 Nonetheless, despite the privatisations, the state retained an indirectinfluence on many banks via its role in the so-called “fondazioni” (joint stock companiesholding stakes in several banks).
The role of insurance companies was limited at the beginning of the 1980s despite a moreliberal regulatory framework. The main channel of distribution constituted tied agents,especially in the non-life segment of the industry. Nearly all large insurance firms offer a widerange of life and non-life products.
Consolidation had a pronounced effect on the Italian banking industry in the 1990s. The numberof banks steadily declined, falling by more than a third (Table B.8). At the same time,concentration increased substantially. For example, the largest 10 banks controlled almost twofifths of deposits in 1992 but that figure increased to three fifths by 1999. After growing fairlyrapidly in the first few years of the decade, the banking industry actually shrank relative toGDP, possibly due to the effect of economic liberalisation and privatisation.
The limited data available for the Italian insurance industry do not suggest that there wassizeable consolidation. Between 1991 and 1997, the number of life insurance companiesincreased, while the number of non-life insurance firms declined by about the same amount.Also during this time, total life insurance premiums grew dramatically, whereas non-lifeinsurance premiums grew at a more modest rate.
Netherlands
The Dutch financial landscape underwent a major change at the beginning of the 1990s. Large-scale mergers and closer cooperation among savings banks resulted in a more concentrated
27 The most prominent privatised banks were Banca Commerciale Italiana, Credito Italiano and Istituto MobiliareItaliano. The privatisation wave followed the adoption of the 1993 Banking Law (“Testo Unico” or unified text),which allowed banks to pursue market objectives as opposed to social functions.
51
banking industry. The process of liberalisation and deregulation, which started as early as the1970s, made large advances as universal banks that provided an array of services in commercialbanking, investment banking and insurance were permitted to emerge. Both the equity and bondmarkets were highly developed relative to other continental European countries.
In general, Dutch authorities did not impose substantial regulation. The sole significant rule wasa strict institutional separation between the money market and the capital market, with eachmarket having its own participants, structure and customs. Partly in response to the matureconditions at home, the largest institutions shifted their focus abroad and became substantialplayers in international markets. In contrast, penetration into the Netherlands by foreigninstitutions has remained limited. During the decade under observation, no major financialupheavals occurred. Moreover, the government sold its remaining holdings in commerciallyrelevant institutions.
The insurance industry exhibited a historically close relationship to the banking industry, withbancassurance taking off quite early in the Netherlands as compared to other countries.However, brokers were by far the most prominent distribution channels for insurancecompanies. Another important feature of insurance was the prevalence of mutual companies inthe non-life segment.
Consolidation had a large, but unique, effect on the banking industry. The total number of banksdid not change much in the 1990s, in large part due to high levels of new entry (Table B.9).Concentration did, however, rise by a few percentage points. In addition, the largest banks grewsubstantially. Between 1990 and 1998, the aggregate assets of the three largest banks as apercentage of GDP more than doubled. Increased large bank presence may be due, to a largeextent, to the merger of ABN and AMRO in 1991 and several significant foreign acquisitions byING, a leading Dutch bank. The overall banking industry also grew quickly during the decade,but not as fast as the largest banks.
The number of life insurance companies increased over the 1991-97 period, primarily in 1997.In contrast, the number of non-life firms decreased dramatically. However, much of the drop(over 350 firms) took place between 1994 and 1995 and probably reflects changes in the datawhereby reinsurance companies, exempted small local mutuals and branches of foreign insurerswith a head office within the EU/EEA were no longer included after 1994.
Spain
The Spanish financial sector is characterised by universal banking, whereby banking groupsinclude firms that engage in insurance, asset management and securities activities. Banks canalso hold equity stakes in non-financial companies. This relationship between banks and non-financial companies in Spain has had a considerable historical tradition, dating back to theestablishment of the so-called industrial banks in 1962. However, the traditional activities ofindustrial banks were gradually taken over by larger banks in the 1970s and 1980s, and thehistorical segmentation between industrial-merchant banks and commercial banks witheredaway. Strict geographical limits were also imposed on banks, which had to be distinguished asnational, regional or local banks according to their size and the number of provinces in whichthey operated. Ties between insurance companies and banks were historically close in Spain(the main insurance companies were bank affiliates), but banks faced strict regulatoryconstraints, especially as regards the distribution of insurance products. Tied agents constitutedthe main distribution channel of insurance products.
Starting in the mid-1980s, regulations such as interest rate controls, branching restrictions,solvency and investment requirements, accounting rules and entry constraints were relaxed orharmonised, which increased the level of competition in the financial sector. Trading on theSpanish stock market was very thin, exhibited a low degree of transparency, and was dominatedby a small number of institutions. Bond markets were equally underdeveloped. However, adrastic reform of the equity market began in 1988 to address some of the problems.
52
Consolidation had a relatively minor effect on the Spanish banking industry. There was amodest decline in the total number of banks in the 1990s and a small increase in the number ofcommercial banks (Table B.10). Concentration figures generally remained steady between 1992and 1997. However, more recent figures, which are not reported, are likely to be higher as aresult of the mergers between Banco Santander and Banco Central Hispanoamericano (to createBSCH) and between Banco Bilbao Vizcaya and Argentaria (to create BBVA). Banks exhibitedmodest growth relative to GDP in the early part of the 1990s, but no growth thereafter.
The number of life insurance companies declined by about 20% from 1990 to 1997. Thisconsolidation was accompanied by a nearly fourfold increase in premiums collected. Thenumber of non-life companies fell by a comparable amount on a percentage basis. However,that segment grew much less rapidly over the period.
Sweden
In Sweden, banking and insurance have traditionally remained separate. In the late 1970s, thebanking industry included commercial banks, saving banks and cooperative banks, withcommercial banks operating as universal banks. Each savings bank was self-owned,independent and required to confine its activities to a well-defined geographical area. Inaddition, specialised lenders such as mortgage institutions also operated in Sweden. At the time,a few large commercial banking groups and insurance groups dominated their industries.
In the early 1990s, banks and insurance companies were allowed to own shares in each otherand be part of the same holding company. Cross-industry consolidation was further encouragedin the mid-1990s with legislation that opened the pension savings market to banks and otherfinancial companies. In addition, savings banks and cooperative banks were permitted to changelegal status and become limited liability companies in 1991-92. This change had a large effecton the structure of the banking industry. In the early 1990s, about 10 of the larger saving bankstransformed into a new banking group with a parent holding company. Also, the 12 centralcooperative banks were merged and subsequently transformed into a single commercial bank.
The banking industry in Sweden exhibited several patterns that were in contrast to most othercountries examined in this study. First, as previously mentioned, the cooperative banks mergedinto one commercial bank in 1992, which accounts for the substantial decline in the number ofbanks in that year and is also likely to have contributed to the increased concentration in theearly part of the decade (Table B.11). Also in 1992, the largest savings banks were transformedinto one banking group. It should be noted that this transaction influenced the structure of theindustry, but possibly not the reported figures, which are based on institution-level, notorganisation-level, data.
Besides these two events, the Swedish banking industry went through a further consolidationinvolving all the major banking groups. The result was a further decrease in the number of largeinstitutions from six to four. At the same time, between 1992 and 1998 the number of banksincreased somewhat due to foreign entry and the establishment of several new, so-called nichebanks that competed mainly in the household deposit market. During this time, the bankingindustry declined relative to GDP in the first part of the decade, before growing rapidly in thelatter part.
The available data suggest that the insurance industry was largely unaffected by consolidation.Both the life and non-life segments saw their membership increase by roughly 25% during the1990s. Between 1990 and 1998, both segments experienced healthy growth, as each roughlydoubled in size relative to GDP.
Switzerland
The Swiss banking and, to a lesser degree, insurance industries are characterised by a two-tierstructure. The first tier is internationally oriented and, at year-end 1999, consisted of two largebanks, two large insurance companies and some smaller private banks and insurance groups thatfocus either on private banking or life insurance, including asset management. The large banks

53
are universal banks with substantial investment banking activities that place them among theglobal leaders in underwriting and brokerage operations.
Large banks and insurance companies were active in the consolidation process of the 1990s on adomestic and cross-border level, and large financial conglomerates emerged as a result. Besidesthe consolidation of insurance firms and banks, some institutions expanded into assetmanagement abroad.
The second tier consists of a large, heterogeneous group of small, domestically focused banksand insurance companies. This group includes cantonal banks (state-owned), regional banks,Raiffeisen banks (credit cooperatives) and, in another category with a clear focus on a foreignclient base, foreign banks. In the early 1990s, Switzerland experienced asset deflation in the realestate market followed by a prolonged period of stagnation, which led to a significantrestructuring and consolidation in the banking industry. Many regional banks were acquired bylarger domestic competitors, and global financial conglomerates emerged.
The importance of the banking industry in Switzerland is evidenced by the very high level ofassets, relative to GDP, held by all banks throughout the decade (Table B.12). Moreover, assetlevels grew throughout the period and, by 1997, assets were nearly five times larger than annualGDP. Four large banks accounted for most of this growth and, by 1997, they controlled assetsthree times larger than GDP. Increased concentration accompanied large bank growth.Concentration figures are only reported up to 1997 and therefore do not fully reflect the increasein concentration over the decade, because they omit the effects of the 1998 merger of two verylarge Swiss banks – Union Bank of Switzerland and Swiss Banking Corporation. During the1990s, the number of banks in the industry, which started at just over 450, fell by about 100.However, this decrease was not attributable to fewer commercial banks, which maintained fairlystable numbers.
Consolidation had little impact on the insurance industry. The number of both life and non-lifefirms increased, albeit modestly, during the 1990s. The level of life insurance premiums morethan doubled, suggesting that the segment enjoyed healthy growth, but the level of non-lifepremiums remained stable. The insurance sector was important in Switzerland, partly due to thesignificance of asset management activities and the development of private pension schemes.
United Kingdom
The UK financial sector was dominated by a relatively small number of large banks in 1980,along with a larger number of building societies, insurance firms, credit unions and friendlysocieties.28 Strict regulations restricted the ability of institutions to compete across traditionallines of business, but regulatory reforms during the 1980s and 1990s removed many of thosebarriers. This deregulation allowed for the development of more universal banking. Restrictionson building societies' activities were further liberalised in 1997.
The 1986 Big Bang reforms of the London Stock Exchange achieved extensive deregulation,including elimination of practices that had restricted the entry of new participants into London’smarkets. The wave of mergers and acquisitions that followed these changes resulted in manyUK securities firms being acquired by domestic retail banks and foreign investors.
There was a dramatic expansion in the number of banks competing in the United Kingdomduring the 1980s from about 350 in 1980 to roughly 500 in 1990 (Table B.13). This increasewas primarily due to the growth of international banking and also partly due to building
28 Friendly societies have a long history of making mutual provisions for members and their relatives against loss ofincome through sickness or unemployment and for retirement. The provision of life and accident insurance andsmall-scale savings products is the staple of most societies. According to the UK Treasury, there wereapproximately 270 societies with total funds of GBP 12 billion and at least 5 million estimated members as ofMarch 1999.
54
societies becoming banks after converting from mutual to stock ownership. Subsequentconsolidation in the 1990s, however, reduced the number of banks by almost 20%. Surprisingly,concentration ratios among the largest one and five banks in the UK banking industry fell in the1990s, while concentration among the top 10 and 15 rose only very modestly. In all cases,concentration fell during the late 1990s. Relative to GDP, industry assets grew at a healthy ratethroughout the decade, with much of this growth arising from the expansion of internationalbanks operating from London.
The number of life insurance companies declined steadily throughout most of the 1990s.However, there were no significant changes in concentration ratios until the late 1990s. Whilethe concentration ratios of the largest firm showed little change, those of the largest five, 10, and15 firms increased substantially in 1998. This increase may be due to several mergers involvinglarge insurance companies. The number of non-life insurance companies climbed slightly.Increases in the concentration ratios within the non-life industry were more consistent thanthose found in the life industry. This may reflect the higher level of merger activity of thelargest non-life firms relative to the largest life insurance firms.
International comparisons
Although the data presented in Tables B.1 to B.13 are not well suited for internationalcomparisons, certain large and important differences are clearly observable, especially in thebanking industry. Table B.14 presents key banking and insurance data in a manner that enablesfigures for all countries to be examined simultaneously.
The banking industry in the United States was particularly unique, as a result of strictlimitations on branching and interstate banking, as well as on bank activities. Throughout thedecade, the United States had many more banks and lower concentration levels than othercountries (with the possible exception of Germany). Although both numbers have movedtowards most of the world, there was still a substantial difference at the end of the decade.Moreover, as measured as a share of GDP, the banking industry was relatively less importantthan elsewhere.
Other countries exhibited distinguishing characteristics as well. In about half of the countriesincluded in this study, concentration levels were extremely high throughout the decade, as asmall group of banks controlled a substantial share of deposits. These highly concentratedcountries include North American (Canada), European (Belgium, France, Netherlands, Swedenand possibly Switzerland) and Pacific Rim (Australia) countries. Also, in several countries, bothhighly and not highly concentrated, concentration increased substantially over the decade. Thelargest banks in Belgium, Canada, Italy and the United States generally showed a pattern ofcontrolling a rapidly increasing share of banking deposits. In contrast, the largest banks in Japanand the United Kingdom experienced no change or even a modest decline in their share of totalbank deposits.
At the end of the decade, the banking industry was very important in four European countries:Belgium, Netherlands, Switzerland and the United Kingdom. In all four, banking assets weremore than three times annual GDP during the late 1990s. In the United States, where thebanking industry was relatively small, banking assets did not exceed 100% of GDP at any timein the 1990s. In Switzerland and the Netherlands, bank assets relative to GDP increased by wellover 100 percentage points over the decade, contributing to the prominent position of thebanking industry in those countries in the late 1990s.
International comparisons of insurance data are even more difficult to make than with bankdata, in part because insurance data are reported for only about half of the countries in the study.Nonetheless, notable differences exist among the countries for which insurance data are

55
available.29 At the end of the decade, concentration in the life insurance segment was high inAustralia, Canada, France and Japan, and low in Germany and the United States. Also, thecountries for which non-life data are available can be classified into two well-defined groups:Australia, Germany and the United States were less concentrated than France, Japan and theUnited Kingdom.
Concentration tended to decline in Japan and Australia, with the leading Australian firmstending to control a declining share of the non-life segment as well. Finally, as measured byassets-to-GDP, the insurance industry was relatively important in Sweden and Switzerland andrelatively unimportant in the United Kingdom.
Global financial leadersAnalysing the banking and insurance industries of each country is very helpful for anexamination of the effects of consolidation on those industries in each country. However, theanalysis does not shed any light on the impact of consolidation on a global basis. In this section,such an analysis is conducted on the banking and securities industries.
Table I.2 indicates that the consolidated assets of the largest banks in the world increasedrelative to the GDP of the 13 countries included in this study during the last two decades of thecentury. The largest banks include banks from all over the world, not just the 13 referencecountries, but many of the largest banks, especially the very largest ones, are located in one ofthe 13 reference countries. Because the GDP numbers in the denominator only reflect the 13countries examined in this study, the figures account for only about half of total world output.Therefore, the figures reported in the table overstate the relative importance of the largest bankson a global basis.
Relative to GDP, the consolidated assets of the largest banks steadily increased. Assets of thetop 50 banks in the world exceeded 70% of the combined GDP in 1998, while the same ratiowas just above 35% in 1980. The top 20 banks’ ratio increased from almost 20% in 1980 tonearly 40% in 1998. These dramatic changes clearly illustrate the growth of the leading banks inthe world relative to the economies of the countries included in this study.
Table I.2Assets of the world's largest banks to G13 GDP
(in percentages)
1980 1990 1991 1992 1993 1994 1995 1996 1997 1998
Top 20 19.5 31.6 35.2 34.2 36.0 36.5 37.5 36.8 38.1 39.8
Top 30 25.5 40.3 44.4 44.1 46.3 47.0 48.5 49.0 51.1 52.7
Top 40 30.8 47.0 51.5 51.5 54.1 55.1 56.8 56.8 61.4 63.2
Top 50 35.4 52.8 57.6 57.6 60.5 61.9 64.0 66.0 69.0 71.2
G13 refers to the 13 countries included in this study. Sources: Asset data: The Banker, various issues. GDP: IMF,International Financial Statistics, CD-ROM, March 2000.
29 Life insurance companies in Canada are allowed to issue some types of annuities with deposit-like characteristics.In Canada, life insurance companies continue to be generally restricted by legislation from directly acceptingdeposits.
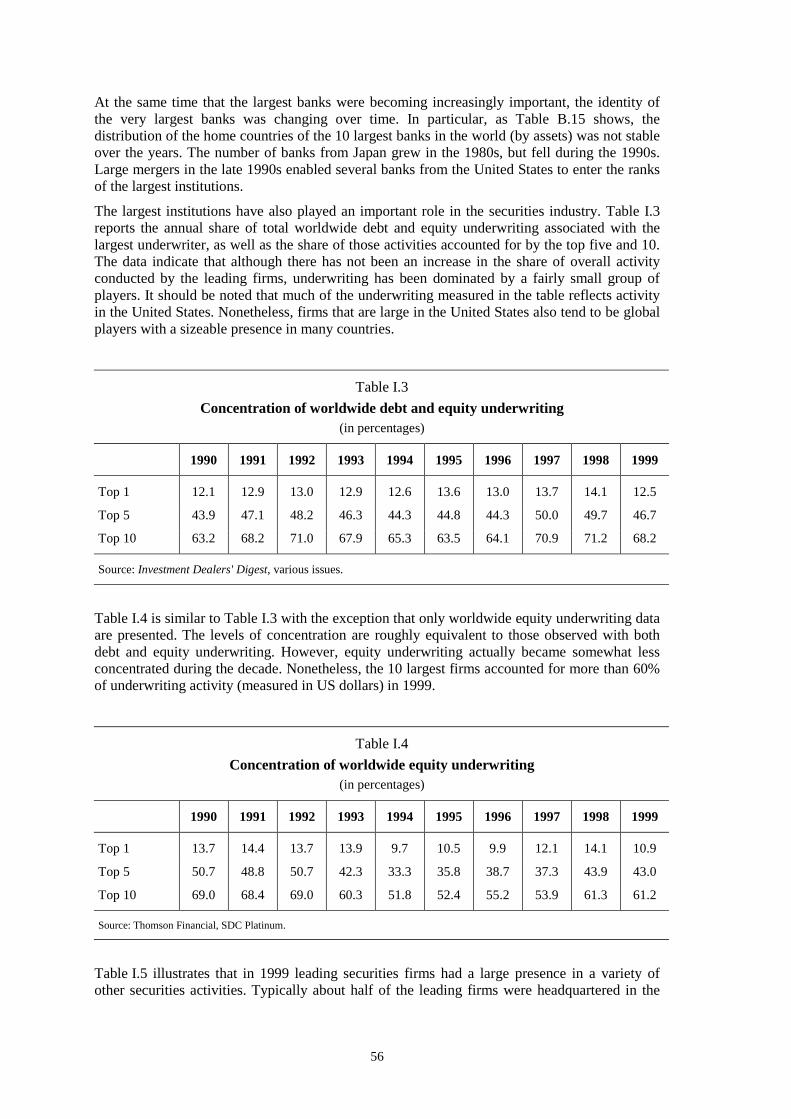
56
At the same time that the largest banks were becoming increasingly important, the identity ofthe very largest banks was changing over time. In particular, as Table B.15 shows, thedistribution of the home countries of the 10 largest banks in the world (by assets) was not stableover the years. The number of banks from Japan grew in the 1980s, but fell during the 1990s.Large mergers in the late 1990s enabled several banks from the United States to enter the ranksof the largest institutions.
The largest institutions have also played an important role in the securities industry. Table I.3reports the annual share of total worldwide debt and equity underwriting associated with thelargest underwriter, as well as the share of those activities accounted for by the top five and 10.The data indicate that although there has not been an increase in the share of overall activityconducted by the leading firms, underwriting has been dominated by a fairly small group ofplayers. It should be noted that much of the underwriting measured in the table reflects activityin the United States. Nonetheless, firms that are large in the United States also tend to be globalplayers with a sizeable presence in many countries.
Table I.3Concentration of worldwide debt and equity underwriting
(in percentages)
1990 1991 1992 1993 1994 1995 1996 1997 1998 1999
Top 1 12.1 12.9 13.0 12.9 12.6 13.6 13.0 13.7 14.1 12.5
Top 5 43.9 47.1 48.2 46.3 44.3 44.8 44.3 50.0 49.7 46.7
Top 10 63.2 68.2 71.0 67.9 65.3 63.5 64.1 70.9 71.2 68.2
Source: Investment Dealers' Digest, various issues.
Table I.4 is similar to Table I.3 with the exception that only worldwide equity underwriting dataare presented. The levels of concentration are roughly equivalent to those observed with bothdebt and equity underwriting. However, equity underwriting actually became somewhat lessconcentrated during the decade. Nonetheless, the 10 largest firms accounted for more than 60%of underwriting activity (measured in US dollars) in 1999.
Table I.4Concentration of worldwide equity underwriting
(in percentages)
1990 1991 1992 1993 1994 1995 1996 1997 1998 1999
Top 1 13.7 14.4 13.7 13.9 9.7 10.5 9.9 12.1 14.1 10.9
Top 5 50.7 48.8 50.7 42.3 33.3 35.8 38.7 37.3 43.9 43.0
Top 10 69.0 68.4 69.0 60.3 51.8 52.4 55.2 53.9 61.3 61.2
Source: Thomson Financial, SDC Platinum.
Table I.5 illustrates that in 1999 leading securities firms had a large presence in a variety ofother securities activities. Typically about half of the leading firms were headquartered in the

57
United States. The names, levels of activity and market shares of the largest firms in theactivities listed below, as well as several other securities activities, are presented in Table B.16.
Table I.5Global concentration of various securities activities, 1999
(in percentages)
Securities activity Top 1 Top 5 Top 10
International equities1 16.2 56.2 75.8
International European equities1 19.2 58.4 81.2
International US equities1 23.9 83.8 96.6
International IPOs1 15.9 59.1 76.1
US Market IPOs2 20.7 67.7 87.3
Syndicated loan arrangers - euromarkets3 8.0 29.8 47.8
Syndicated loan arrangers - US markets3 19.3 59.9 74.0
International bonds1 8.9 37.7 63.3
Public euro and global bonds1 10.0 40.5 67.1
Sources: 1 Capital Data-Bondware. 2 Thomson Financial Securities Data. Data exclude closed-end funds and rankineligible issues. 3 Capital Data-Loanware.
On a global basis, over-the-counter (OTC) derivatives markets are not as highly concentrated assecurities activities. Table I.6 reports various concentration measures for several types of OTCderivatives activities at several points in the late 1990s. Although there are not enough data toidentify a trend, the table indicates that concentration increased between December 1998 andDecember 1999. Not truly global, the data nonetheless reflect the total derivatives volume inseveral large countries (France, Germany, Italy, Japan, Switzerland, the United Kingdom andthe United States).
Table I.6Concentration of various OTC derivatives activities
(in percent)
Instrument type Date Top 3 Top 5 Top 10
Dec 1998 23.5 34.3 55.5June 1999 26.3 38.3 57.4Foreign exchangeDec 1999 29.4 42.0 60.7
Dec 1998 23.9 32.6 50.6June 1999 26.1 35.2 54.4Interest rateDec 1999 27.6 36.7 56.2
Dec 1998 22.3 31.5 48.5June 1999 25.6 34.3 52.7TotalDec 1999 27.2 36.0 54.7
Source: National authorities.

58
Summary of key structural patterns in the financial sector
During the 1990s, several key patterns emerged in the financial sectors of the various countriesincluded in this analysis that suggest that consolidation had a substantial impact. In particular,the banking industry was affected a great deal. First, the number of institutions decreased innearly all countries, as mergers and acquisitions appear to have thinned the ranks. Between 1990and 1999, about half of the countries in this study experienced a decline of greater than 20% inthe total number of banks. During that period, only Belgium, Australia and Japan increased thenumber of banks, and Japan’s increase was due to a definition change while Belgium’s changewas very small.
The second effect of consolidation on various banking industries was that large banks grewrelatively more important, as indicated by growth in various measures of deposit concentration.Such measures increased in all countries except Japan and among the very largest banks in theUnited Kingdom. In Japan, decreasing concentration stemmed from a relatively modest level ofconsolidation activity and the financial distress experienced by the largest banks. Japaneseconcentration may increase in the future if planned mergers among its largest banks arecompleted. Finally, the banking industry grew relative to GDP in all countries except Japan,which experienced the aforementioned financial distress, and the United States, where banksfaced increasing competition from other financial firms such as mutual fund companies andspecialised lenders.
The sizeable increase in concentration in banking that is reported in the tables may actuallyunderstate the growing dominance of leading banks. Concentration measures are based on totaldeposits, and so the influence of off-balance sheet activities is not included. These activities,which increased in level throughout the 1990s, have been and continue to be dominated by largebanks. Therefore, concentration measures that include them, along with traditional bankactivities (ie lending and deposit-taking), would be likely to reflect a higher and faster growinglevel of concentration over the course of the decade. Table B.17 presents data on the notionalsize of global OTC derivatives markets between 1992 and 1999, and the quadrupling of totalnotional size over the period clearly illustrates the rapid growth that has taken place.
The data are less comprehensive and patterns related to consolidation less consistent in theinsurance industry. In both the life and non-life segments, the number of firms showed noconsistent patterns across countries: the number fell in some countries and increased in others.Interestingly, for a given country, the change in the life segment did not appear related to thechange in the non-life segment. Although concentration data lean slightly towards greaterconcentration in both segments, the patterns are very weak and only reflect about half of thecountries. As a result, there is little convincing evidence to suggest that the insurance industrybecame more concentrated in the 1990s. The industry does, however, appear to have grown. Inall countries where data are available for 1990 and 1998, the insurance industry (both life andnon-life) grew relative to GDP.
Although the aforementioned patterns are reflective of patterns observed in the banking andinsurance industries of the 13 countries included in this study, important distinctions amongcountries existed. Individual countries exhibited clear differences in both the level and growthrate of concentration and industry size. However, one must be extremely cautious in makinginternational comparisons, as the data are not well suited to such analysis.
Most of the analysis in this section involves independently looking at the financial sectors ofindividual countries. However, an examination of the largest banks and underwriters in theworld reveals that the largest firms are important on a global basis. Relative to the GDP of the13 countries included in this study, the assets held by the largest 20, 30, 40, and 50 banks in theworld increased a great deal during the 1980s and 1990s. Notably, the composition of the homecountries of the largest 10 banks in the world changed a great deal over time.
Regarding the securities industry, although there was little change in the concentration ofleading worldwide underwriting activity, the largest firms accounted for a substantial share ofactivity. Concentration figures from the end of the decade also reveal that many specific

59
securities activities were largely controlled by a small group of leading institutions. OTCderivatives markets were less concentrated.
5. ConclusionThe 1990s saw dramatic change in the financial services industries of the 13 countries examinedin this study. Much of this change was driven by consolidation in its various forms. Mergers,acquisitions, joint ventures and strategic alliances are the most common methods, with eachinvolving a different level of control and integration and each being preferable in certaincircumstances.
Consolidation activity was brisk during the decade and generally increased throughout. Mostmergers and acquisitions, in terms of both the number and value of deals, involved firms in thesame industry and from the same country. Moreover, banks accounted for a large share of theM&A activity that took place during the 1990s. The level of joint venture and strategicacquisition activity also increased throughout the decade, especially in the last two years. Dealsof this type more often involved firms from the same countries than from different ones, but thisresult is driven by the United States, which accounted for a large share of all ventures,particularly within-border ventures.
M&A activity contributed to a decreased number of banks and increased concentration in thebanking industries of most of the countries included in this study. The insurance industries werenot as clearly influenced by consolidation. During the decade under review, the size of thebanking and insurance industries in most countries tended to increase relative to GDP. Finally,at the end of the decade, worldwide securities activities were largely controlled by a small groupof leading institutions, whereas over-the-counter derivatives markets exhibited more modestlevels of concentration.
Collecting data that are consistent across nations and over time is a very difficult and complextask. Nonetheless, the information that is presented in this chapter can be effectively used toillustrate important patterns that emerged. Certain clear and important distinctions amongcountries can be observed in measures such as the level, growth and nature of consolidationactivity and the level and growth of concentration and industry size. However, data must beanalysed with caution, especially with respect to international comparisons.
60
Annex I.1Securities exchanges and consolidation
United States30
The New York Stock Exchange (NYSE) is the largest stock exchange in the United States.Other smaller stock exchanges include the American Stock Exchange (AMEX), Chicago StockExchange, Philadelphia Stock Exchange, Pacific Stock Exchange, Boston Stock Exchange andCincinnati Stock Exchange. These exchanges are linked by the Intermarket Trading System,which enables market participants at one of the exchanges to direct an order to any of the otherexchanges.
Equities are also traded via the National Association of Securities Dealers Automated QuotationSystem (NASDAQ). Although not a formal exchange, NASDAQ links dealers via a network ofcomputers. Traditionally, nearly all large corporations listed their shares on the NYSE.However, this pattern changed somewhat in recent years, because many firms listed on theNASDAQ operate in the fast-growing high-technology sector and decided to remain listed onNASDAQ as they grew. In fact, some of the largest firms in the world now trade overNASDAQ.
There are three large exchanges that specialise in the trading of futures contracts. They are theChicago Board of Trade, Chicago Mercantile Exchange (CME) and New York MercantileExchange (NYMEX). Securities options are primarily traded on the Chicago Board OptionsExchange, as well as on some other securities exchanges. There are also a number of smallerfutures exchanges.
Consolidation among the leading exchanges in the United States has been fairly modest inrecent years. In 1994, New York’s two largest futures exchanges, NYMEX and the CommodityExchange, combined. In 1998, NASDAQ merged with AMEX to create the NASDAQ-AMEXMarket Group.
There are two primary developments currently taking place among the securities exchanges.First, smaller exchanges have been experiencing difficulties attracting members and facepressure to consolidate. Second, exchanges have moved towards restructuring their corporateforms by converting from mutual to stock ownership. Exchanges believe that being stock-owned will enable them to more easily consolidate and acquire capital for investment intechnology.
Japan
The integration of Japanese regional stock exchanges accelerated in the 1990s. Traditionally,there were nine stock exchanges, but at the end of the decade, there were six. However, onemajor and one minor exchange dominate. About 90% of transactions are carried out on theTokyo Stock Exchange (TSE), and a majority of the other transactions are carried out on theOsaka Securities Exchange (OSE). The concentration of the stock exchanges is mainly a resultof cheaper and simpler communication tools.
The OSE created a new section with NASDAQ in 2000. Although listings were limited in thefirst few months, this new section will enable Japanese venture capital companies to offer theirstocks and it will permit NASDAQ companies to be traded in Japan in the near future. It is alsoplanned that shares of Japanese venture companies will be traded over NASDAQ.
30 The discussion in this section is drawn heavily from Austin (1995).

61
Separate from the stock exchanges, there is JASDAQ, an over-the-counter trading system,managed by Japan Securities Dealers Association. The JASDAQ has operated since 1983, witha computerised system since 1991. At the end of 1999, the total capitalisation of TSE was JPY456 trillion (roughly USD 4 trillion), while the total capitalisation of JASDAQ was JPY 27trillion.
Although affiliation and cooperative agreements between Japanese and foreign exchanges havebeen made, an outright merger has not been pursued. Therefore, the venture between NASDAQand OSE was an exception, rather than a trendsetter, at least until now.
Futures exchanges exhibit more competition than the equity exchanges. The Nikkei 225 futureshave been traded on the OSE, Singapore’s SIMEX and Chicago’s CME. The SIMEX tradingvolumes of Nikkei 225 increased in the early 1990s after transactions costs in Osaka wereincreased. No consolidation is planned among the exchanges that trade futures.
Europe
The integration of organised securities exchanges in Europe gained momentum in recent yearsdue to growing competition between traditional European exchanges and competition both fromforeign exchanges and from private, electronic exchanges like Instinet (the so-called proprietarynetworks). The advent of the euro has played an important catalytic role in this process byeliminating substantial currency risk and thereby encouraging investors to trade assets bysectors rather than by countries and to be more concerned about liquidity. In this morecompetitive environment, agreements and alliances may be critical for achieving full economiesof scale and transforming technological progress into a competitive edge.31
As regards stock exchanges and derivatives markets, the first wave of consolidation, which tookplace in the second half of the 1990s, exhibited a clear regional or domestic flavour. Forinstance, in 1998 the OM Stockholm Stock Exchange32 and the Copenhagen Stock Exchangesigned an agreement to set up a common Nordic market, NOREX, which is based on cross-membership and provided for sharing the SAX-2000 trading system and the same trading rules.In 2000 a letter of intent was signed with an additional five exchanges (Norway, Iceland,Estonia, Latvia and Lithuania). The Deutsche Börse was formed in 1993 by the merger of eightregional stock exchanges in Germany. This new exchange promoted the merger between theGerman and the Swiss derivatives markets in 1996 to form Eurex, the leading Europeanderivatives market. The Dutch and Belgian primary markets merged with their derivativesmarkets and clearing systems, giving way to AEX in 1997 and BEX in 1999, respectively.
The most recent mergers have a more pan-European flavour. The merger between Paris Bourse,the AEX and BEX to form Euronext was completed in September 2000. Euronext isincorporated as a Dutch limited company and offers trading in equities, bonds and derivatives.The structure of Euronext is designed to preserve various subsidiaries and maintain strong linkswith local investors through a decentralised structure. Trading in blue-chip equities is offered inParis, trading in derivatives in Amsterdam, and trading in small or medium-sized companies inBrussels. Trading is based on the French NSC system, already sold worldwide to about 20exchanges.
Despite persistent efforts over the last two years, a pan-European stock exchange has remainedan elusive goal. In May 2000, the London Stock Exchange and Deutsche Börse announced theirplan to merge operations in what was to be a significant step towards the pan-European goal.The two exchanges proposed the adoption of a common trading platform and the concentration
31 See Abraham and Pirard (1999).32 The OM Stockholm Stock Exchange was itself constituted in 1998 by the merger of the Swedish Stock Exchange
with the derivatives exchange OM.

62
of different market segments in one or the other physical location. However, the plan collapsedin September 2000 under the weight of scepticism regarding dual currency listings, the absenceof consolidation of the post-trade settlement systems, and the cost to smaller brokers of adoptinga new platform. As a consequence, both exchanges are likely to pursue independent routes toconsolidation.
Continental European government bond markets were more closely integrated after the adventof the euro. A common trading platform was created for the most liquid government bonds ofseven major euro area issuers (Belgium, Germany, Spain, France, Italy, the Netherlands andAustria). This screen-based system is called Euro-MTS and is based on the Italian system MTS-PCT. This system was recently enhanced so as to enable its participants to trade repurchaseagreements (repos) on different ranges of maturity. Other initiatives have been undertaken suchas Reuters’ development of a trading platform for repurchase agreements. No significantintegration has occurred regarding the infrastructure of corporate bond markets.

63
References
Abraham, Jean-Paul and Anne-Françoise Pirard (1999): “Competition and co-operation amongEuropean Exchanges – The impact of financial globalisation with special reference to smaller-sized exchanges”, working paper prepared for the 1999 Annual Meeting of the EuropeanAssociation of University teachers in Banking and Finance, Lisbon, September.
Austin, Stephanie (1995): “Chapter 12: Securities Markets”, in “Securities Processing”, editedby William L Imhoff, 1995, pp 126-36.
Bank of Japan: Bank of Japan Economic Statistics Quarterly, various years.
Best, A M (1991-99): Best’s Aggregates and Averages, Life-Health, various years.
Best, A M (1991-99): Best’s Aggregates and Averages, Property-Casualty, various years.
Conti, Vittorio and Rony Hamaui (1993): “Financial Markets’ liberalisation and the role ofbanks”, Cambridge University Press.
Dale, Richard (1994): “International Banking Deregulation – The Great Banking Experiment”,Blackwell Finance.
European Central Bank (1999): “Possible Effects of EMU on the EU Banking Systems in theMedium to Long Term”, February.
European Central Bank (2000): “Mergers and Acquisitions Involving the EU Banking Industry– Facts and Implications”, forthcoming.
Genetay, Nadege and Philip Molyneux (1998): “Bancassurance”, MacMillan Press.
Ibca: Ibca CreditDisk, various reports.
International Monetary Fund (2000): Financial Statistics, CD-ROM, March.
Investment Dealers' Digest (1991-2000), various issues.
Ito, T (1992): “The Japanese Economy”, Chapter 5, MIT Press.
Lewis, Alfred and Gioia Pescetto (1996): “EU and US Banking in the 1990s”, Academic PressLimited.
Organisation for Economic Co-operation and Development (1990-97, 1999): InsuranceStatistics Yearbook.
Organisation for Economic Co-operation and Development (1998): Institutional InvestorsStatistical Yearbook.
Organisation for Economic Co-operation and Development (1999): Bank Profitability.
Office for Official Publications of the European Communities (1997): “The Single MarketReview, Subseries II: Impact on Services, Credit Institutions and Banking”.
Office for Official Publications of the European Communities (1998): “The Single MarketReview, Subseries II: Impact on Services, Volume 1: Insurance”.
Office for Official Publications of the European Communities (1998): “The Single MarketReview, Subseries II: Impact on Services, Volume 3: Credit Institutions and Banking”.
The Banker, various issues.
White, William R (1998): “The Coming Transformation of Continental European Banking”,Bank for International Settlements, Working Paper number 54, June.
Williamson, John and Molly Mahar (1998): “A Survey of Financial Liberalization”, Essays inInternational Finance 211, November.


65
Chapter II
Fundamental causes of consolidation
1. IntroductionThis chapter is concerned with the fundamental causes of consolidation.33 To this end, it reviewsand builds upon the extensive body of literature academic scholars and other researchers haveproduced in this field. As generalisations about the main forces driving consolidation aresometimes affected by country-specific circumstances, interviews have been conducted with 45selected industry participants and experts from the G10 countries, Australia and Spain. Theseindividuals have been asked for their opinions on the basis of a common interview guide, whichcovers the issues of each section of the chapter.
The analysis distinguishes between motives for consolidation and the environmental factors thatinfluence the form and pace of consolidation. In practice, motives and environmental factors areintertwined, but for the purposes of this chapter it has proven useful to treat them separately.The environmental factors are divided into two categories: those that encourage consolidationand those that discourage consolidation.
The remainder of the chapter is structured as follows. Section 2 analyses the motives forconsolidation in the financial sector and examines the main empirical studies. Section 3 dealswith the environmental factors encouraging consolidation, which include technological change,deregulation, globalisation, the institutionalisation of savings, and the introduction of the euro.Section 4 discusses the factors that may discourage or impede financial sector consolidation,such as regulations and differences in culture and corporate governance. Section 5 examinesthree possible future scenarios, based mainly on the outcomes of the interviews. Annex II.1contains country synopses based on the interviews, where the country-specific causes ofconsolidation are described. Annex II.2 provides technical information on the structure of theinterviews.
2. Framework
TheoryMergers and acquisitions in the financial sector are undertaken for a wide variety of reasons. Inany given case, more than one motive may underlie the decision to merge. Motives may varywith firm characteristics such as size or organisational structure, over time, across countries,across industry segments, or even across lines of business within a segment. In the frameworkused in this chapter, the motives for mergers and acquisitions are broken down into two basiccategories: value-maximising motives and non-value-maximising motives. In a worldcharacterised by perfect capital markets, all activities of financial institutions would bemotivated by a desire to maximise shareholder value. In the “real” world, while value
33 In this chapter, mergers and acquisitions and consolidation are considered as synonyms. The various forms ofconsolidation are described in more detail in Chapter I.

66
maximisation is an important factor underlying most decisions, other considerations can, andoften do, come into play.
Value-maximising motivesThe value of a financial institution, like any other firm, is determined by the present discountedvalue of expected future profits. Mergers can increase expected future profits either by reducingexpected costs or by increasing expected revenues.
Mergers can lead to reductions in costs for several reasons, including:
• economies of scale (reductions in per-unit cost due to increased scale of operations);
• economies of scope (reductions in per-unit cost due to synergies involved in producingmultiple products within the same firm);
• replacement of inefficient managers with more efficient managers or managementtechniques;
• reduction of risk due to geographic or product diversification;
• reduction of tax obligations;
• increased monopsony power allowing firms to purchase inputs at lower prices;
• allowing a firm to become large enough to gain access to capital markets or to receivea credit rating;
• providing a way for financial firms to enter new geographic or product markets at alower cost than that associated with de novo entry.
Mergers can lead to increased revenues for a variety of reasons, including:
• increased size allowing firms to better serve large customers;
• increased product diversification allowing firms to offer customers “one-stopshopping” for a variety of different products;
• increased product or geographic diversification expanding the pool of potentialcustomers;
• increased size or market share making it easier to attract customers (visibility orreputation effects);
• increased monopoly power allowing firms to raise prices;
• increased size allowing firms to increase the riskiness of their portfolios.
Non-value-maximising motives
Managers’ actions and decisions are not always consistent with the maximisation of firm value.In particular, when the identities of owners and managers differ and capital markets are less thanperfect, managers may take actions that further their own personal goals and are not in theinterests of the firm’s owners. For example, managers may derive satisfaction from controlling alarger organisation or from increasing their own job security. Thus, they might engage inmergers designed to increase the size of the firm or reduce firm risk, even if such mergers donot enhance firm value. Managers may acquire other firms in order to avoid being acquiredthemselves (defensive acquisitions), even if being acquired would benefit the firm’s owners. Insome cases, managers may care about the size of their firm relative to competitors, leading themto engage in consolidation simply because other firms in the industry are doing so.
67
The role of government
Government policy can play an important role in either facilitating or hindering consolidation.Governments sometimes facilitate consolidation in an effort to minimise the social costsassociated with firm failures. In the United States, for example, government agencies providedfinancial assistance to healthy banks that acquired failing banks during the banking crises of the1980s and early 1990s. Financial crises or major problems with large depository institutionsalso contributed to accelerated changes in the banking landscape in France, Japan, Scandinaviaand the United Kingdom. In resolving failed institutions, supervisory authorities have oftenencouraged mergers or forced the liquidation and sale of the weakest institutions. For example,in Japan during the banking crisis of the 1990s, government funds were deployed to supportreconstruction and consolidation of the banking sector. Governments may also promoteconsolidation in an effort to create a “national champion” that can compete effectively in theglobal arena. At the same time, laws requiring regulatory approval of mergers and acquisitionsor prohibiting certain types of mergers and acquisitions (because of their implications forcompetition, financial stability, potential conflicts of interest between commercial andinvestment banking, or other reasons) have the potential to hinder consolidation.
Empirical evidence on the motives for consolidationNumerous empirical studies have attempted to determine the motives for mergers, both withinthe financial services sector and more broadly.34 Unfortunately, the actual motives for mergersare not directly observable and may differ from those stated by management at the time of amerger announcement. Researchers are limited to inferring the motives from observable factorssuch as the relationship between average cost and firm size, the characteristics of firms thatmerge, the effects of mergers on stock prices, and the post-merger performance of cost and pricemeasures.
Economies of scale and economies of scopeMany researchers have estimated the relationship between average cost and firm size or productscope for the banking industry, in an attempt to determine the importance of economies of scaleand economies of scope in banking. Studies of economies of scale and economies of scope infinancial services sectors other than commercial banking are less numerous. Overall, thesestudies seem to support the view that economies of scale may be a motivating factor for mergersinvolving small or medium-sized financial services firms, particularly during the 1990s. Theydo not provide support for the view that economies of scale are an important factor drivingmergers involving the very largest firms in the industry. It should be noted, however, that forvery large diversified firms, economies of scale may be more difficult to detect because theymay be limited to certain product lines and not show up in aggregate, firm-level data. Thus far,there seems to be little or no evidence in support of the importance of economies of scope as amotivator.
Cost efficiency
In some cases, managers do not operate a firm in a manner that minimises the cost of producinggiven quantities and combinations of products. In this case, the firm is said to suffer from costinefficiency. Consolidation can help to eliminate cost inefficiency if the acquiring firm’smanagement is more effective at minimising costs than the target’s management, and is able toeliminate unnecessary costs after the combination takes place. Studies of the characteristics ofthe firms involved in financial sector mergers and acquisitions generally support the view thatefficiency gains motivate consolidation. These studies tend to find that acquiring firms are more
34 See Chapter V for a review of this literature.
68
cost efficient than target firms. However, studies that examine ex post changes in cost efficiencyresulting from mergers and acquisitions generally fail to find any evidence that efficiency gainsare realised. The consistent failure of research to document efficiency gains from mergers mayreflect accounting complexities that make it very difficult to measure changes in cost efficiencyor unanticipated difficulties in achieving post-merger efficiency gains. Nonetheless, thesestudies cast some doubt on the significance of efficiency gains as a motivating factor.
Monopoly powerMergers and acquisitions can sometimes enhance monopoly power, allowing firms to increaseprofits by setting prices that are less favourable to customers. This is particularly true when themerging firms are direct competitors and their combination results in a substantial increase inmarket concentration. Few studies have directly examined the effects of financial sector mergersand acquisitions on prices. Although the findings of these studies are somewhat mixed, thosethat focus on the types of mergers that are most likely to increase market power do findevidence of significant price effects. Numerous studies have examined the effects of bankmergers on profitability. Some have found increased profitability associated with mergers andacquisitions, while others have not. However, increased profitability does not necessarily implyincreased monopoly power, since efficiency gains or cost savings owing to scale or scopeeconomies could also yield improvements in profitability ratios.
Although the evidence is sparse, it seems likely that when direct competitors merge, especiallywhen they already operate in a fairly concentrated market environment, increased monopolypower is one of the factors motivating the consolidation.
Non-value-maximising motivesAs indicated above, when capital markets are imperfect and there is separation of ownershipfrom management, managers may undertake consolidations (or other activities) that are not inthe interest of the acquiring firm’s owners. A number of mechanisms exist to reduce theprobability of managers engaging in activities that are contrary to the interests of the firm’sowners. These include:
• Managerial stock ownership. If managers own a substantial amount of stock in thefirms they run, they are likely to have a personal interest in maximising firm value.
• Concentrated shareholder ownership. If shareholder ownership is highlyconcentrated, shareholders are likely to do a better job of monitoring managerialbehaviour than if shareholder ownership is widely dispersed.
• Presence of independent outsiders on the board of directors. Likewise, monitoring ofmanagerial behaviour is likely to be easier or more effective if there are independentoutsiders on the firm’s board of directors.
Numerous studies of non-financial firms and a few studies of commercial banks have examinedthe extent to which these mechanisms reduce the probability of managers entering into non-value-maximising mergers.35 Although the studies do find evidence that these mechanisms aresomewhat effective, their findings provide support for the view that at least some mergers areundertaken for reasons other than value maximisation.
Evidence from the interviews
In the interviews with financial sector participants and industry experts, a number of questionswere asked about the motives for consolidation, distinguishing within-country from cross-
35 See, for example, Allen and Cebenoyan (1991) and Subrahmanyam, Rangan and Rothstein (1997).
69
border combinations, and within-segment from across-segment combinations. (Responses toquestions about the motives for consolidation are summarised in Chart II.1.) Severalinterviewees indicated that motives differed across industry segments (eg commercial bankingversus investment banking versus insurance) and across product lines (notably betweenwholesale and retail services), as well as with firm size. However, the number of interviews isnot large enough to allow meaningful distinctions to be drawn along these various dimensionsin analysing the responses.
With respect to within-country, within-segment mergers, the single strongest motivating factorappears to be the desire to achieve economies of scale. Thirty-six out of 45 respondentsindicated that economies of scale were “very important” in motivating this type of consolidation(see Chart II.1, panel 1a). This finding contrasts rather sharply with the findings of the academicliterature (particularly on the US financial sector), which suggest fairly limited economies ofscale in financial services. One should bear in mind, though, that this finding may be lessparadoxical than it seems because the econometric studies are backward looking, making itdifficult to achieve reliable estimates of scale economies that can explain the current industryconsolidation. Several interviewees explained, for example, that the large investments requiredto take advantage of the latest technological advances or to develop innovative products couldonly be undertaken by very large organisations. Others noted that mergers provide anopportunity to reduce staffing and eliminate branches, thereby reducing costs.
Other important motivating factors for within-country, within-segment mergers, according tothe interviewees, were revenue enhancement due to increased size and increased market power(see Chart II.1, panels 3a and 7a). Note that most interviewees interpreted market power tomean market share, rather than the ability to influence price. The argument presented was that alarger market share makes a firm more visible and therefore more attractive to potentialcustomers. In Europe, a larger market share may also be a defensive motive to become one ofthe major players in the pan-European market. It was also mentioned that larger banks are betterpositioned to support large bond issues because they have access to a larger capital base,command a more extensive network to place these issues in the market, and have the advantageof name recognition. Risk reduction due to product diversification and change in organisationalfocus were considered largely irrelevant for this type of consolidation (see Chart II.1, panels 5aand 6a), while economies of scope, revenue enhancement due to product diversification, andmanagerial empire building and entrenchment were considered to be slightly important (seeChart II.1, panels 2a, 4a and 8a).
For within-country, across-segment mergers, the most important motive appears to be revenueenhancement due to product diversification, or the ability to offer customers “one-stopshopping” (see Chart II.1, panel 5b). Forty-five per cent of the respondents cited this motive asbeing “very important”, 7% ranked it somewhere between “moderately important” and “veryimportant”, and 27% judged it to be “moderately important”. The desire to achieve economiesof scope was perceived by interviewees to be the second most important motive for this type ofmerger, with 25% of the respondents ranking it as “very important” and 30% classifying it as“moderately important” (see Chart II.1, panel 2b). Economies of scale, revenue enhancementdue to increased size, risk reduction due to product diversification, change in organisation focus,market power, and managerial empire building and entrenchment were all considered to beslightly important factors (see Chart II.1, panels 1b, 3b, 5b, 6b, 7b and 8b).
Many respondents did not provide rankings for the motives for cross-border mergers due to thefairly limited amount of cross-border consolidation that has taken place to date. The responsesthat were provided to these questions suggest that the strongest motives for within-segmentcross-border consolidation were increased market power and revenue enhancement due to bothincreased size and increased product diversification. With regard to cross-segment, cross-borderconsolidation, revenue enhancement was also considered to be a strong motivator, but increasedmarket power was viewed as only slightly important.

70
3. Forces encouraging consolidation
IntroductionThis section is concerned with the external forces that have encouraged consolidation in thefinancial services industry. In some jurisdictions (eg Japan in the 1990s), consolidation has beendriven largely by the need to recapitalise distressed institutions after a major crisis. Moregenerally, much of the ongoing restructuring in financial services has been a strategic responseon the part of market participants to changes in the competitive environment. Among the majorforces creating pressure for change are:
• technological advances;
• deregulation; and
• globalisation of the marketplace.
Just as the motives underlying mergers and acquisitions vary with firm characteristics, etc, thekey external forces also appear to vary across multiple dimensions in their influence. In somecases, the basic structural forces are the same, but the impact differs because of different startingpoints with respect to the number of firms and the range of activities conducted within a givenfirm. Comments received in the interviews suggest that cross-border mergers are more likely forinstitutions located in countries that have already experienced considerable domesticconsolidation, where the scope for further consolidation based on an exclusively domestic focushas either diminished or bumped up against policy limitations. Various respondents suggested,as well, that different categories of institutions might react to different factors. For example, theneed to absorb excess capacity may encourage consolidation among smaller institutions to agreater extent than among larger institutions. Unfortunately, as noted previously, the smallnumber of observations does not permit meaningful distinctions to be drawn along these lines.
Evidence from the interviews does suggest that the influence of the external factors has beensupported in some cases by changes in investor saving patterns and the introduction of the euro,which have served as important catalysts for mergers among institutions in some jurisdictions.In addition, surging stock prices (for acquirers) and low interest rates have provided asupportive environment in which to finance transactions. In sum, technology, deregulation andglobalisation have eased or removed entry barriers and paved the way for increased competitivepressures. Shareholders, meanwhile, have become more active. Corporate governance practicesstill vary across jurisdictions, but the “shareholder value” concept has gained adherents. Thus,as increased competition has squeezed profit margins for many financial institutions, managershave been forced to seek measures to improve performance, including ways to reduce costs,increase revenues, or employ resources more effectively. There are a number of strategicalternatives to achieve these goals, including:
• organic growth;
• de novo entry (especially in niche areas);
• distribution and other strategic alliances; and
• mergers and acquisitions.
All of these strategies have been implemented to varying degrees in most jurisdictions, butmergers and acquisitions have clearly been a big element of the strategic response to date.Going forward, however, the opportunities for online delivery of financial products and servicesmay lead to less emphasis on mergers and acquisitions to achieve entry and increased use ofcooperative agreements such as production partnerships, joint ventures and distributionalliances. This will be further discussed in Section 5 on future trends.

71
Technological changes
Technology has both direct and indirect effects on the restructuring of financial services. Directeffects of technology may include:
• increases in the feasible scale of production of certain products and services (eg creditcards and asset management);
• scale advantages in the production of risk management instruments such as derivativecontracts and other off-balance sheet guarantees; and
• economies of scale in the provision of services such as custody, cash management,back office operations and research.
Many wholesale services, in particular, have high technology investment costs but low margins,given customers’ demands for increasingly sophisticated services at lower prices. Providers ofthese services often pursue mergers and acquisitions as a means of spreading the high set-upcosts of new technological infrastructure over a larger customer base. The same may be true ofproviders of retail products like credit cards. A large firm size helps to counterbalancecompetitive pressures and provides the wherewithal for the continuous technology upgradesnecessary to achieve any unit-cost advantage in pricing services that are basically commodityproducts. Large size may also provide diversification benefits.
Dramatic improvements in the speed and quality of telecommunications, computers andinformation services have helped to lower information and other costs of transacting (see TableII.1). This development has had a dramatic impact on the financial services industry. A few keyexamples are:
• Changes in distribution capacity. As a result of increased speed and lower costs ofcomputing and telecommunications equipment, financial service providers can, withthe appropriate technology infrastructure, offer a broader array of products andservices to larger numbers of clients over wider geographic areas than would havebeen feasible in the past. This process has facilitated the move towards increasinglyglobal connections among financial markets and made a global reach feasible forservice providers.
• Creation of new financial services and products. Technological advances combinedwith innovations in financial engineering techniques have enabled service providers tounbundle and repackage the risks embedded in existing financial products to tailornew products to meet the risk management and investment needs of specificcustomers. Modern technology enables financial institutions to make rapidadjustments in the characteristics of their investment portfolios, including the riskprofile, and facilitates the efforts of non-financial corporations to develop globaloperations by providing for the separation of exchange rate fluctuations and otherfinancial risks from their normal business operations.
• Blurring of distinctions. Technology in conjunction with deregulation of productofferings results in competition on a product-by-product basis. Financial institutions ofall types now offer products and services that not only compete against those offeredby intra-sector competitors, but also against those offered by other categories ofservice providers. Banks are increasingly engaging in non-traditional activities andsecurities firms and non-banking institutions have made inroads in traditional bankingactivities. The same technologies have enabled non-financial entrants to provide arange of banking-type products. In the process, many financial products have beenconverted into commodities, characterised by a high degree of standardisation andcompetition focused on price.
• Data mining. Technological advances have also enabled financial service providers toharness information more productively, which means that differentiated or speciallytailored products can be created and channelled to targeted customers. Technology
72
supports the implementation of strategies based on the marketing and massdistribution of commodity-like products. A prime example is the use of direct mail ortelemarketing campaigns to offer standardised loan products to retail or small businesscustomers that have a certain risk profile, based on assessments from a credit-scoringmodel.
• New entrants. At the retail level, electronic delivery channels such as the internet andautomated lending technology enable service providers to take advantage of theirbrand names and customer databases to reach out to targeted customers, without theneed for a pre-existing physical presence. Although some physical presence in themarket will probably remain a necessary element in the provision of retail bankingservices, these technologies potentially remove one of the main entry barriers to theretail financial services business. Online delivery channels make it possible for out-of-market institutions to compete for retail (and also small business) customers as well.Moreover, sophisticated search engines enable customers to comparison-shop moreeasily, so differences in prices are readily exposed and competitors have a relativelylow-cost channel through which a competing firm’s customers can be reached. Howentry by out-of-market institutions might affect concentration in a financial industry isnot clear-cut. This would in part depend on the form entry would take (eg de novoentry, mergers and acquisitions, cooperative agreements such as strategic alliances).Furthermore, new entry might stimulate a change in the structure of the industry. For amore comprehensive discussion, see Section 5 on future trends.
In short, technological advances have changed the competitive functioning of the financialsector, at both the production and the distribution level, and have created incentives for newoutput efficiencies. As noted in the section on motives, such a restructuring process providesmany opportunities for mergers and acquisitions. In the interviews, technological advances wereconsidered to be an important force encouraging consolidation, especially with respect towithin-country, within-segment combinations. Over 60% of respondents indicated thatimprovements in information and communications technology were “very important” inencouraging this type of merger, while another 20% said they were “moderately important” (seeChart II.2, panel 1a). Fifty-eight per cent of respondents ranked financial innovation as a“moderately important” or “very important” force encouraging within-country, within-segmentconsolidation (see Chart II.2, panel 2a). More than half of the interview respondents viewedeach of these technology-related forces as at least “moderately important” in encouragingdomestic, cross-segment consolidation and cross-border, within-segment consolidation (seeChart II.2, panels 1b, 2b, 1c and 2c). Electronic commerce was viewed as a less important forcewith regard to encouraging all types of consolidation (see Chart II.2, panel 3).
Deregulation
Governments influence the restructuring process in a number of ways:
• through effects on market competition and entry conditions (eg placing limits on orprohibiting cross-border mergers or mergers between banks and other types of serviceproviders);
• through approval/disapproval decisions for individual merger transactions;
• through limits on the range of permissible activities for service providers;
• through public ownership of institutions; and
• through efforts to minimise the social costs of failures.
Over the past two decades, many official barriers to consolidation have been relaxed asgovernments have reconsidered the legal and regulatory framework in which financialinstitutions operate. (See Annex II.3 for a chronological listing of important regulatorychanges.) In a number of countries, regulations in the financial services industry, especially as

73
applied to banking organisations, tended in the past to focus almost entirely on safety (egconsumer protection and prevention of failures). However, financial regulatory frameworks inmost major countries have shifted from systems based on strict regulatory control to systemsbased more on enhancing efficiency through competition, with an emphasis on marketdiscipline, supervision and risk-based capital guidelines. In the new operating environment,public policy is less protective of financial service providers (banks), exposing them to the samesorts of market pressures that have long confronted non-financial businesses.
Mergers and acquisitions have been a major component of the restructuring process. Thisprocess owes in part to deregulation, but it is difficult to disentangle the effects of regulatoryreform in financial services from the effects of advances in technology, innovations in financialengineering and other developments that work in the same direction and may have preceded thechanges in regulation. Deregulation in the financial service industry has often been an inducedresponse by policymakers to technological advances and financial crises. At times, regulatorychanges have merely ratified changes that had been previously implemented by the market. Forexample, there is some evidence that technological innovations in deposit taking and lendingencouraged deregulation in that area, and technological advances were also a factor enablingfinancial institutions in the United States to overcome functional and geographic limitations thathad been designed into their charters.36
The fact that consolidation in some cases has preceded changes in legislation suggests perhapsthat deregulation may not be a strictly necessary factor in the textbook sense. The maininfluence of deregulation appears to be that it enlarges the set of legal tactical manoeuvres,including the types of agreements that can be arranged across sectors and across borders, andthereby gives institutions increased flexibility to respond to competitive impulses.
In the interviews, over half of the respondents indicated that deregulation was at least“moderately important” as a factor encouraging consolidation for domestic, within-segmentinstitutions, with over one third of the respondents ranking it as a “very important” factor (seeChart II.2, panel 4a). Thirty-eight of the respondents assigned a ranking to this factor fordomestic, cross-segment consolidation. As before, about half of the respondents said this factorwas at least “moderately important” in encouraging consolidation (see Chart II.2, panel 4b). Asimilar frequency breakdown occurs in the case of cross-border consolidation, but the totalnumber of respondents is smaller (Chart II.2, panels 4c and 4d).
GlobalisationGlobalisation is in many respects a by-product of technology and deregulation. Technologicaladvances have lowered computing costs and telecommunications, while at the same time greatlyexpanding capacity, making a global reach economically more feasible. Deregulation,meanwhile, has opened up many new markets, both in developed and in transition economies.As a factor encouraging consolidation, globalisation largely affects institutions providingwholesale services. Comments received during the interviews indicate that global corporationsexpect financial service providers to have the necessary expertise and product mix to meet anyinvestment or risk management need in any location in which the corporations haveoperations.37 As non-financial corporations increased the geographic scope of their operations,they created a demand for intermediaries to provide products and services attuned to theinternational nature of their operations. Maintaining a presence in multiple financial marketsand offering a breadth of products and services can entail relatively high fixed costs, creating a
36 See Kane (1999).37 This is one of the basic tenets of client-based universal banking - the service provider chooses the appropriate
products, services and geographical presence to service its client base. For a more complete discussion, seeCalomiris and Karceski (1998).
74
need for large size to achieve scale economies. Nonetheless, interviewees did not rate theglobalisation of the non-financial sector as an important force encouraging financialconsolidation (see Chart II.2, panel 5).
Meanwhile, profit margins in many wholesale business segments have narrowed as a result ofincreased ease of entry and the commodity-like nature of many wholesale financial products.Low margins, in effect, mean that high volumes are necessary to generate higher returns. Thisneed has prompted some firms to opt for mergers and acquisitions as a means of attainingcritical mass. Mergers and acquisitions have also been a frequent option for banks seeking tobuild a global retail system. By acquiring an existing institution in the target market, theacquirer gains a more rapid foothold than would be possible with an organic growth strategy(see Box II.1).
In addition to increasing the need for wholesale service providers to expand the scale of theiroperations, globalisation has helped change the competitive dynamics of other market segments.Many financial products are now offered internationally by efficient global competitors, throughdirect or targeted distribution channels. Some traditional retail banking products and servicesare still provided on a regional or local level, but a few global providers (eg Spanish banks inLatin America) have begun to make competitive inroads in many markets. National and regionalplayers are forced to respond to the threat posed by new entrants either by emulating theirproduct offerings (which results in commoditisation), or by offering better pricing, whichrequires increased efficiency, or by offering better services (eg through customisation orpersonal service).
The globalisation of capital markets also contributes to the shift from a bank-centred system to amarket-based one. As capital markets have expanded and become more liquid and efficient, thehighest-quality credits have turned increasingly to the commercial paper and bond markets inlieu of certain types of traditional bank and insurance products. Margins on loans to the highest-rated investment grade borrowers have been driven down to the point that only the mostefficient institutions are able to provide this form of credit. On the liabilities side of banks’balance sheets, there has been a substantial outflow of deposits to a wide range of competingfinancial products offered by various institutions in different sectors. For insurers, mutual fundsand related products compete against guaranteed investment contracts. In response to theincreased competitive pressures, some institutions have opted to expand via the merger route toreach a perceived threshold size for scale economies (see Chart II.2, panel 6a).
A final influence of globalisation is in the area of corporate governance. As businesses havecrossed international boundaries and their shares have begun to be held by a wider investorclientele, the demand by investors for a more uniform standard of corporate governance has alsoincreased. Generally, the pressure for change has come from shareholders located outside thehome market. A major contributing factor is the ongoing change in investor demographics.
75
Box II.1Spanish banks’ strategy in Latin America
Acquisitions of large shareholdings in the Latin American financial sector by Spanish institutions are aninteresting example of cross-border consolidation. This expansion by the largest Spanish banks wasinitially focused mainly on emulating the Spanish model of retail banking, but lately has also includedthe acquisition of private pension funds. The main countries that have been involved in the region areArgentina, Brazil, Chile, Colombia, Mexico, Peru and Venezuela.
A number of factors have supported these efforts. Most governments in the targeted countries havetaken steps to modernise their economies and, in particular, reform their banking and financial systemsthrough deregulation, restructuring and privatisation, while opening their domestic markets to foreigninstitutions. Other supporting factors include:
• the importance of the common language, historical ties and other cultural factors;
• the strong financial solvency position of the acquiring banks, coupled with the need toimplement strategies that increase shareholder value;
• higher potential growth in these countries compared with the EU owing to a faster rate ofpopulation increase;
• higher intermediation margins in Latin American banking systems compared with those ofmore developed countries (compensating for the reduction in margins that has taken place inSpain due to fierce competition in retail banking and the reduction in interest rates);
• the adaptability of readily available products and delivery systems;
• minimal correlation between the economic cycles of Latin America and Spain, which allowssome risk diversification.
Although there are high risks associated with these investments, given financial sector instability in theregion, the belief is that the immediate introduction of the parents’ management processes, systems andimproved risk management will enhance profitability quickly. This expansion has resulted in strongfranchises, which may prove to be a powerful advantage in coping with expected future consolidation inthe European financial sector.
Shareholder pressuresDifferences in corporate governance standards still exist among major countries, but use of the“shareholder value” concept has become more widespread and with it has come a focus on thereturn on assets and the return on equity (ROE) as benchmarks for performance. This emphasison ROE is most evident in countries where capital markets exert strong competitive pressures,but its importance is spreading rapidly.
One development that has helped to boost the importance of shareholders relative to otherstakeholders is the increased institutionalisation of savings stemming from ageing populationsin most countries.38 Financial assets are increasingly being held by large well-informedinvestors, who base their investment decisions on relative asset returns. Importantly, it hasbecome more common for a large share of the funds institutional investors have undermanagement to be placed with professional fund managers, who develop asset allocationstrategies and make investment decisions on behalf of their institutional investor clients. Fundmanagers actively compete for the opportunity to manage funds from pension plans,foundations, life insurance companies, and so on. Renewal of management contracts and thefund manager’s compensation typically have been based on the fund manager’s relativeinvestment performance. Consequently, professional fund managers have strong incentives to
38 In many countries, ageing and the need for retirement income has prompted growth of private pension plans asalternatives to state-sponsored, pay-as-you-go systems. See, for example, OECD (1998).

76
express their dissatisfaction with low rates of ROE. This increased activism translates intopressure on managers of financial institutions to generate higher levels of profitability. Inresponse, managers have sought ways to increase revenues, create new sources of earnings,generate fee income, reduce cost-to-income ratios, optimally deploy excess capital or, for someinstitutions, recapitalise after a major crisis. These goals can be achieved through businessgains, productivity enhancement or more effective balance sheet management, but mergers andacquisitions appear to be a simpler strategy for many institutions.
In the interviews, the institutionalisation of savings was considered to be a “moderatelyimportant” to “very important” factor encouraging consolidation by 50 to 60% of respondentsfor each type of consolidation considered (see Chart II.2, panel 7).
The introduction of the euro
Another development that has had an impact on the competitive environment for someinstitutions is the creation of the euro. The general view of the euro is that it acts as a catalyst,reinforcing already existing trends in EU banking systems. However, the surge in consolidationactivity in the euro area just prior to and after the euro’s launch leads to some speculation thatthe euro might have independent effects.39 Assessing the specific impact of the euro on financialsector consolidation is, however, rather complex for two reasons. First, by the time the euro wasintroduced, the European financial sector had already undergone several changes dating back tothe end of the 1980s, basically as a result of the harmonisation efforts in the context of thesingle market and the environmental factors outlined in the previous section, supported by ageneral trend towards liberalisation of capital movements. Second, the relationship between theeuro and the consolidation process varies by segment of the financial system (money and capitalmarkets versus retail markets).
Financial marketsSince its inception, the euro has quickly led to an integrated money market, thereby affecting themotives for consolidation in two ways. First, the euro has removed the pricing advantage in the“home” interest rate previously enjoyed by domestic banks specialised in dealing in the relevantcurrency. This change may have put pressure on the profitability of some domestic banks thatwere large in their domestic system but have a much smaller share of the new integrated moneymarket. Second, given the size of the integrated money market, there is a need for providers ofpayment services to smaller banks, which favours larger institutions because the requiredtechnological equipment entails huge installation costs. For these service providers, the degreeof revenue enhancement would be even greater if a synergy were to develop between moneymarket and capital market activities, thus enabling them to provide a wide array ofinterconnected financial services to other financial institutions.
The euro also affects the treasury activities of the corporate sector in the euro area.Internationally operating corporations used to maintain a correspondent banking connection inseveral European countries, but under the single currency these relations have been reducedsignificantly. This development may have encouraged consolidation among banks, because inorder to serve these international corporate clients, particularly the larger ones, size may havebecome more relevant.
39 According to data obtained from Securities Data Corporation and presented in Chapter I, the value of merger andacquisition transactions involving target firms located in the nine European countries included in our studyreached USD 147 billion in 1999, compared with USD 103 billion in 1998 and USD 88 billion in 1997. In 1999,several cross-border mergers took place in the euro area. This process continued in 2000 (eg HSBC-CréditCommercial de France, MeritaNordbanken-UniDanmark).

77
The euro also contributes to more integrated capital markets, although this process proceedswith a lower intensity than in the money market. In general, the integration of capital marketshas three main effects on the motives for bank consolidation:
• it creates the potential for revenue enhancement due to increased size, particularly inthe case of institutional investment;
• there is the potential for economies of scale on the cost side; and
• sufficient size may be required to take full advantage of risk diversification within anindustry throughout the euro area.
The integration of capital markets represents an opportunity for institutional investors to extendtheir activity since the size and liquidity of the markets have grown. It may be argued that onlylarge banks are able to develop knowledge throughout the euro area, together with the pool ofhuman resources and the technological capacity needed to suit the needs of large institutionalinvestors, especially in the fields of underwriting, securitisation, investment banking and assetmanagement. Asset allocation in the euro area is increasingly carried out on an industry basisrather than on a country-by-country basis. Accordingly, analysts are being required to follow alarger number of companies, which may entail economies of scale.
Integration has also proceeded in the government bond markets. A high degree of liquidity isensured for benchmark bonds, whose yield to maturity is nearly uniform across the euro area.Spreads between government bond yields and interbank rates have decreased also as aconsequence of the restructuring of primary markets carried out by several Europeangovernments at the end of the 1990s (eg through the introduction of new competitive auctionprocedures). This process has penalised particularly those banks that depended on the yield ontheir government bond portfolio for a significant share of their income. The resultant pressureon margins could induce these banks to pursue cost savings or ways to enhance income, whichcould lead to merger activity.
In the interviews, roughly 45% of the respondents said the euro was “not a factor” influencingdomestic consolidation and approximately 40% said it was “not a factor” encouraging cross-border consolidation. At the same time, approximately 30% of respondents indicated that theeuro was a “very important” factor encouraging within-segment mergers, both domestic andcross-border (see Chart II.2, panel 8). Respondents’ views of the importance of the euro variedwith their locations. Interviewees from euro area countries tended to rank this factor muchhigher than those outside the euro area did. Numerous respondents indicated that the euro waslikely to become a more significant force in the future than it has been to date.
4. Forces discouraging consolidation
IntroductionThere are many other external factors that affect the way financial institutions respond to thechanges in their operating environment. This section pays attention to those factors thatdiscourage consolidation, such as regulatory regimes, information failures, cultural differences,structures in corporate governance and various other factors. As with the forces encouragingconsolidation, the relative importance of the factors addressed may differ across segments andcountries.
In addition, some factors discourage certain types of consolidation. In particular, hostiletakeovers are impeded much more than friendly mergers, which largely explains the lack ofhostile takeovers in the banking industry. For example, government regulation can make
78
permitted hostile takeovers within commercial banking more expensive and time consumingthan in non-bank sectors.40 Also, ownership structures and corporate governance structures (egthe protection of minority shareholder rights) can make it very difficult to acquire a bankthrough a hostile takeover. Furthermore, as information asymmetries with respect to, forexample, the assessment of the loan book of a bank can be substantial, it may be very risky forthe bidder to perform an acquisition without the cooperation of the target’s management andshareholders. Finally, several interviewees indicated that the lack of hostile takeovers in thebanking sector might also be related to the expectations of the bidders that takeover panels andsupervisory bodies are likely to turn down this form of corporate control. Bearing these pointsin mind, the following paragraphs describe the discouraging factors in a more general context.
Regulation
The legal and regulatory environment represents a substantial potential impediment forconsolidation, as it affects directly the range of permissible activities undertaken by financialfirms and may imply considerable compliance costs. In some countries antitrust laws constitutean important impediment, mainly for domestic consolidation within sectors. Prudentialregulation may hinder cross-border consolidation through differences in capital requirements.Product-based supervision, which exists largely in the insurance sector, may reduce cross-border consolidation by limiting potential cost reduction from economies of scale. Potentialregulatory impediments to consolidation include:
• Protection of “national champions”. In some countries, the government has anexplicit role in approving foreign investment in domestic financial institutions.Governments may protect domestic enterprises by setting high hurdles for foreignbuyers attempting to acquire majority stakes. Conditions in some countries haveenabled some categories of banks to remain insulated from market forces.
• Government ownership of financial institutions. The scope for consolidation issimilarly limited when banks are partially or fully government owned. For theseinstitutions, the consolidation of business activities with others would have to bepreceded by privatisation.
• Competition policies. Competition policies are concerned with the negative welfareeffects stemming from a lack of competition. Some consolidation projects are refusedon the grounds that they would result in market dominance. A further importantdeterrent related to competition policy rules is the fact that some mergers have to passthe test of competition authorities in different countries, which involves long delays,compliance costs and uncertainty.
• Rules on confidentiality. National regulations with regard to data provision andconfidentiality may prevent the consolidation of information platforms on a cross-border and an across-segment basis and, thereby, impede potential cost reductionsfrom technologically induced economies of scale.
Nearly 60% of interviewees viewed legal and regulatory constraints as a “very important”impediment to cross-border mergers, and an additional 15 to 20% viewed them as moderatelyimportant. Respondents considered legal and regulatory constraints to be somewhat lessimportant in discouraging domestic consolidation; nonetheless, more than 60% of them ratedthese factors as at least “moderately important” (see Chart II.3, panel 1). It should be noted that,over time, regulatory differences across countries can be expected diminish, tending to reducebarriers to cross-border consolidation.
40 See Prowse (1997).
79
Cultural differences
Cultural differences appear in the consolidation process on the corporate level, between sectors,across regions or countries and between wholesale and retail businesses. The need for culturalintegration as part of the consolidation process is a multidimensional issue that touches allstakeholders. Cultural differences increase the complexity, and therefore the costs, of managingsize. Post-merger problems have often been ascribed to the underestimation of the difficultiesinvolved in attempts to combine different cultures.
• Differences between countries. The importance of cultural differences is especiallyobvious when a merger crosses national borders or spans geographically distinctregions. Factors that may discourage consolidation include differences in language,communication styles, customer needs and specific established distribution channels.These factors determine the ease, and thus the implicit costs, of a firm’s entry into adifferent country or region.
• Differences in corporate cultures. Strong corporate identities are considered to beparticularly problematic in mergers between equals. Takeover attempts often turnunfriendly when there are large perceived rifts in business cultures between theacquirer and the target. Such differences may impede the exchange of information, thepursuit of common objectives and the development of a coherent corporate identity.Divergent corporate cultures may exist between corporations within the same businesssegment, as well as across business lines (eg commercial and investment bankingactivities that may compete with different products for the same customer base).
Not surprisingly, interviewees indicated that cultural constraints were most important withregard to cross-border consolidation. Approximately two thirds of respondents describedcultural constraints as a very important factor discouraging cross-border mergers, whetherwithin or across segments. Cultural constraints were also viewed as an important impediment todomestic mergers involving firms in different industry segments by 40% of interviewees.Nearly half of all respondents considered cultural constraints at least “moderately important” indeterring within-segment, within-country mergers (see Chart II.3, panel 2).
Inadequate information flowsInadequate information flows are a form of market inefficiency that may increase theuncertainty about the outcome of a merger or acquisition. They may be attributed to incompletedisclosure or large differences in accounting standards across countries and sectors.41 Whenfaced with such an information asymmetry, stakeholders may disapprove of consolidation.
• Lack of comparability of accounting reports. Large variations in accountingprinciples and procedures from country to country or even across sectors can impedeconsolidation, as there may be considerable uncertainty regarding the risk profile andvaluation of the assets of the institutions involved in the transactions. The growingcomplexity of large transactions in recent years has further increased the importanceof reliable and transparent accounting standards in order to conduct adequate duediligence procedures in mergers and acquisitions.
• Difficulties in asset appraisal. The existence of information asymmetries is acommonly acknowledged complication in appraising assets particularly in the contextof bank’s loan books, which include assets for which market liquidity is low. An
41 Due to developments in information technology and the subsequently more widespread implementation ofinternational accounting standards such as the International Accounting Standards and the US GenerallyAccepted Accounting Principles, the spread and quality of financial information available in G10 countries inrecent years have improved.

80
assessment of the loan book of an institution implies the difficult task of judging thequality of risk management of the takeover target, which is especially problematic inthe context of evaluating single loans.
• Lack of transparency. Ex ante pressure from shareholders to justify a merger decisionmay be a discouraging factor in the presence of uncertainty and informationasymmetries. The potential for hidden costs, as a result of a lack of transparency, mayinduce acquiring management and shareholders to be more risk averse whenconsidering an acquisition.
Most interviewees did not view market inefficiencies as a particularly important factorinhibiting consolidation, except in the case of cross-border, within-segment mergers (see ChartII.3, panel 3).
Corporate governance
Corporate governance encompasses the organisational structure and the system of checks andbalances of an institution. There are significant differences in the legislative and regulatoryframeworks across countries as regards the functions of the (“supervisory”) board of directorsand senior management, which affect the interrelation of the two decision-making bodies withinan institution and relations with the firm’s owners and other stakeholders, including employees,customers, the community, rating agencies and governments.
• Ownership structures. The organisational form and rules that govern the strategicbusiness decisions of a company have a large bearing on whether consolidation isdeemed a valid business option. For example, a strong corporate identity can be aneffective defence against surrendering control to outsiders. The “mutual” form ofownership is a special type of ownership structure that may impede consolidation. Insome countries mutuals have a large market share in the life insurance and mortgagebusinesses as well as among depository institutions.
• Capital structure. Corporate governance should not be viewed independently fromcorporate finance. As the way of raising capital varies, so do the possibilities forinfluencing or pressuring the supervisory board with regard to decisions onconsolidation. Such influence appears to be greatest for firms that rely heavily onequity financing and whose shares are widely held. Where there are a few largeshareholders, it is extremely difficult to sway the vote of the governing board withouttheir express approval. Banks that have lent extensively to an enterprise may exercisesimilar de facto corporate control, although they may not be represented on thesupervisory board.
• Existence of defensive strategies. Defences against a takeover are strongest wherefinancing is from private sources and the major share of equities is privately held.Defensive strategies are manifold and include payoff provisions for managers, ie“golden parachutes”, or legal and technical obstacles such as complex ownershipagreements (“poison pills”) or cross-shareholdings with other institutions.
Though not listed separately in the structured interview guide (see Annex II.2), a number ofinterviewees emphasised that differences in corporate governance may discourageconsolidation.
Other discouraging factorsThe process of consolidation is a complex phenomenon and includes judgements aboutinterrelationships among many factors. Two other factors that may discourage firms from goingforward with a merger or acquisition that were mentioned in the interviews are the costsassociated with managing complex institutions and taxation:

81
• Costs of complexity. An important reason for unsuccessful consolidation is likely tobe the underestimation of the costs or the complexity of managing large andheterogeneous institutions and the difficulties of unifying different corporate cultures.For example, a strategy of combining businesses with highly volatile earnings such asinvestment banking with more stable performers such as life insurance or privatebanking might lead to a loss in focus as well as undermine the specific strengths of theconstituents.
• Taxation. Assessing the impact of the various tax regimes on investment decisions is acomplex issue. The tax burden is a cost that is factored into business decisions. Assuch, it influences the choice of location for the different parts of a business. Althoughconsolidation could also result in a reduction of tax obligations, enterprises often feelin practice that the direct and indirect costs imposed by taxation do not justify amerger, be it with a domestic partner or a foreign one. For example, high capital gainstaxes on the sale of corporate holdings may impede the disentanglement of cross-holdings between banks, insurance and industry and, thus, hamper structuraladjustment in the financial and corporate sectors. The absence of double taxationagreements between the two countries where the consolidating entities areheadquartered would also be an impediment to takeovers. From an efficiency point ofview, organisational structures that are optimal from a taxation perspective may beless so from the point of view of production and distribution processes.
5. Future trends
Introduction
The interview results suggest strongly that the consolidation process in the future will vary fromcountry to country and from segment to segment, depending on different starting pointsregarding the number of firms and the range of activities conducted within a given firm. Thepace of consolidation could accelerate in Europe, given that the encouraging impact of the eurohas not yet run its course, while impediments may be reduced as convergence progresses inareas such as regulation and taxation. There is the possibility that a tiered structure mightdevelop in the interbank market in the euro area, whereby a few large banks act as “moneycentre” banks. Under these circumstances, the physical location of banks becomes lessimportant and the necessary size could be achieved through domestic consolidation. In retailmarkets, once physical distribution of the euro currency occurs, there is likely to be greatermobility of depositors and borrowers, which is expected to affect competition in the sector on across-border basis and reinforce the structural decline in traditional interest margins. The eurofavours integration of the retail sector also in an indirect way by exerting pressure on thecompetent Community and national authorities to remove the residual barriers to cross-borderactivity. This would lead to a more competitive environment in which the maintenance ofexcess banking capacity in some European countries is set to become less sustainable. Theintegration of the corporate bond markets may also affect motives for consolidation, if theissuance of bonds or commercial paper becomes a significant alternative for corporations totraditional bank loans. Interest margins could decrease, inducing banks to pursue cost savings orincreased market share through consolidation. It is also noteworthy that, in Europe,concentration in the financial sector is currently much higher in smaller countries such as theNordic countries and the Netherlands than in the rest of continental Europe, particularlyGermany and Italy. Thus, while institutions in the former countries have already engaged incross-border consolidation, consolidation in the other countries is expected to continue at thenational level for a while. In the United States and Japan, where concentration remains lowdespite recent consolidation, we can expect to see increasing concentration in the financialservices sector in the future.

82
In all countries, environmental factors (eg technology, deregulation and investor demographics)will still influence the pace and form of consolidation. A stock market crash – if such were tooccur – might temporarily slow the pace of financial sector consolidation, but would be unlikelyto completely derail it, given the strength of the other underlying forces. The key question,therefore, is not so much whether consolidation will continue in the future, but rather how. Inorder to explore this issue, the remainder of this section considers a number of alternative futurescenarios. It should be noted that these scenarios are not mutually exclusive and could applysimultaneously to different segments of the financial services industry.
Scenarios
Scenario 1: Universal institutionsThe first scenario is a continuation of the current trend towards globally active universal serviceproviders that dominate the wholesale business segment along with other service categories.The “gaps” might be filled in by niche players or regional institutions specialised, for example,in lending to households or to small and medium-sized firms in industries such as agriculture.According to this view of the financial services sector, there would be further consolidation(where legal) between financial and non-financial entities such as internet and communicationsfirms, enabling the financial institutions to secure the advantages of diversification and scaleembodied in new technologies. There are, however, reasons to believe that there are upper limitsto the advantages of creating ever larger, all-encompassing financial institutions. For example,as the size and complexity of institutions increase, so do the difficulties in managing them. Asmanagerial capacity becomes stretched too far, profits suffer, which often leads todeconstruction or other forms of retrenchment.
Scenario 2: Specialised institutions
In the second scenario, the deconstruction process is avoided. Consolidation continues apace,but instead of growth in the number of universal banks, firms specialise as they grow.Differences in the optimal scale pertaining to various activities or limited economies of scopealso appear to justify at least some degree of product specialisation, for example, in eitherwholesale or retail activities. Many wholesale institutions already take a global perspective, butin retail segments a regional presence might suffice as the benefits of scale are limited by greatdifferences in the local cultures served. A number of interviewees suggested, moreover, that theoptimal size and structure of institutions might depend, in part, on the size of the market inwhich the institutions operate. In smaller markets such as Scandinavia, medium-sizedinstitutions of a universal nature might be optimal as the benefits of one-stop shopping in such asituation could outweigh any costs of complexity. In large markets such as the United States,specialisation or looser forms of consolidation (eg strategic alliances or joint ventures) may bemore appropriate as the costs of merging to become “large” start to dominate.
Scenario 3: Contract bankingThe third scenario takes the specialisation process in the preceding scenario one step further. Inaddition to specialisation along functional lines, financial institutions in the future may alsochoose to specialise in certain production technologies. This would entail a radical departurefrom current practices, which generally consist of the joint production of a broad line ofproducts and services, including the production of all sub-components (vertical integration). Inthis respect, a distinction can be made between the manufacture of (components of) financialservices and the delivery of these services to the final customer. The key question is whetherfinancial institutions must manage the entire manufacturing process themselves in order tosecure scale benefits or whether the same benefits may be realised if (part of) the productionprocess is outsourced.
83
In the so-called paradigm of contract banking42 (which applies equally to other segments of thefinancial services industry) the answer to the first part of this question is negative. Dependingon the comparative advantages of a certain bank, it need manufacture only some of the(components of) services it has on offer, obtaining the rest from other specialised producers(whether in or outside the financial sector proper). Competition would take place on the basis ofbrand name, the quality of products and services, and pricing. In the extreme case, relying solelyon its information advantage, a bank would function as a gateway supplying customers with allthe products and advice they need, but doing little more than managing contracts with externalsuppliers (hence the term contract banking). A good example might be internet banking. Bridgesbetween personal financial software and the websites of financial institutions – combined withadvances in reliability, security, digital signatures, etc – could make it possible for the internetto support a full range of financial services. Third parties may actually originate the variousservices or advise customers on where to obtain the cheapest offerings. Thus, supply chainscould be “deconstructed”, as different institutions would specialise in certain aspects of thefinancial intermediation process. Other industries, such as the telecom industry, the automobilesector and the airline industry, are leading the way in this respect. All of these industries havegenerally disintegrated into a constellation of sub-industries, while the individual firms at theend of the production chain maintain a single marketing channel to the customer.
While consolidation among providers of financial services will almost certainly continue in theshort-term, it is possible that in the longer run some of this consolidation will be undone.Experience in other economic sectors suggests that merger waves are sometimes (partially)reversed. Usually, though, a merger wave will have inexorably changed the industry, so that thestarting point will never be regained.
Impact on the consolidation processAlthough the prospects for the contract banking paradigm may appear somewhat remote for thenear future, a few respondents in the interviews indicated that, in some countries, moremoderate forms of specialisation in combination with outsourcing are indeed expected to takeplace (“back to core business”). One policy issue related to this theme is how competition in thefinancial sector might develop if indeed the future has more specialisation in store, as withincertain specialised areas monopoly power might increase.
Specialisation to such an extent would certainly change the pattern of consolidation in thefinancial sector. Consolidation would still occur as firms strove to diversify in terms of bothproducts and markets served, but this process would be accompanied by divestments as theunderlying production chain was (partly) broken. At the same time, the various specialisedproducers, for example in the area of payment processing, might also consolidate. Thus, thestructure of the financial sector would become more layered than it is nowadays.
Between the extremes of a highly concentrated financial sector consisting of predominantlyuniversal institutions and a more specialised financial sector as described above, there is awhole spectrum of possible outcomes. For example, rather than a complete deconstruction ofthe production chain, forms of cooperation may be established between the various suppliers,including strategic alliances and joint ventures. In fact, in the interviews a number of financialsector experts suggested that these forms of collaboration might become more common in thefuture as cross-border and cross-industry cooperation increases, because in those instances moreintense forms of consolidation are relatively difficult to realise or justify. What balance will bestruck will depend, in particular, on the economies of scope that exist between the variousproduction processes as well as the intensity of competition in the financial sector. The fewerthe economies of scope and the higher the level of competition, the greater the pressures
42 The term “contract banking” derives from Llewellyn (1999). However, similar ideas have been expressed inDeloitte Touche Tohmatsu International (1995) and Evans and Wurster (2000).

84
towards deconstruction of the production chain will be. In this respect, financial sectorregulation may also have a role to play by influencing the degree of financial sector competitionfrom both within and outside the financial services industry.
All told, the consolidation trend in the financial sector is likely to continue, given the sustainedpressures on the environment in which financial institutions operate. Simultaneously, there arealso forces at work that may change the organisation of the financial sector. Of course, exactlyhow these myriad forces will balance out in the future remains to be seen.

85
Tables and charts (Chapter II)
Table II.1
Insurance fees – life and property/casualty
Traditional agent USD 400 - 700
Internet USD 200 - 350
Banking costs per transaction
Branch USD 1.07
Telephone USD 0.52
ATM USD 0.27
Proprietary online system USD 0.105
Internet USD 0.01
Costs per bill
Paper
Biller cost USD 1.65 - 2.70
Cost to customer USD 0.42
Bank cost USD 0.15 - 0.20
Internet
Biller cost USD 0.60 - 1.00
Cost to customer USD 0
Bank cost USD 0.05 - 0.10
Source: Emerging Digital Economy, US Department of Commerce, 1998.
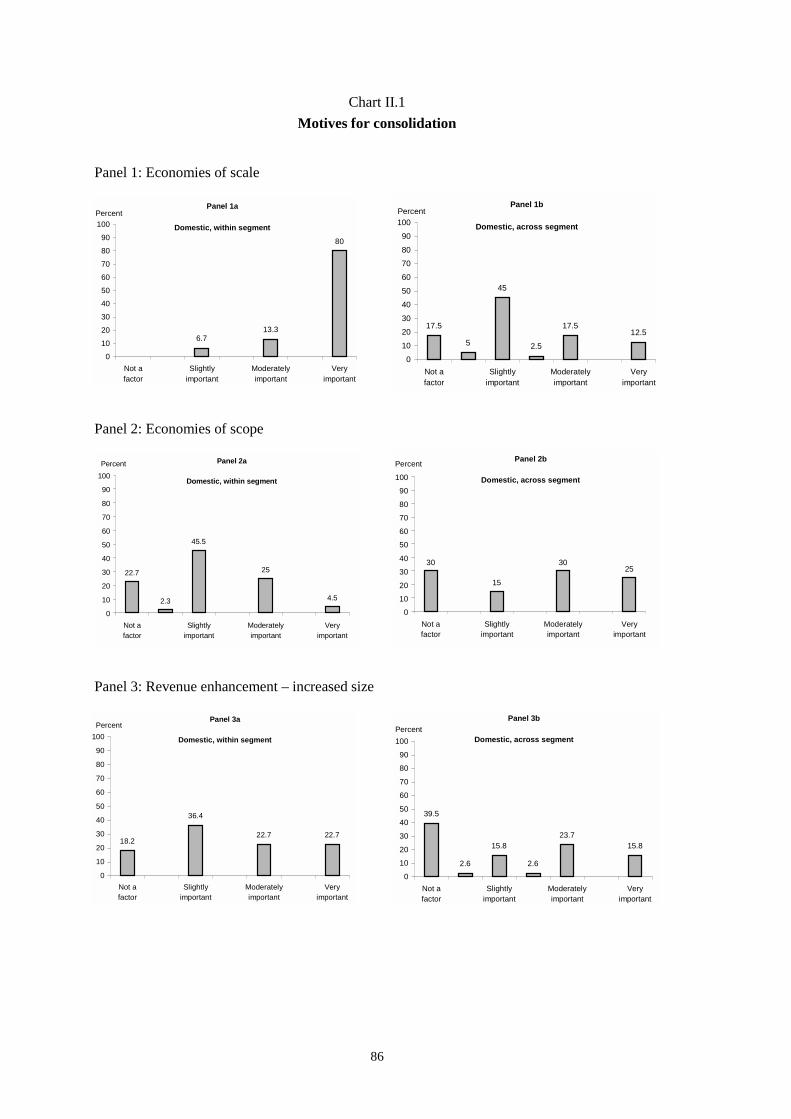
86
Chart II.1Motives for consolidation
Panel 1: Economies of scale
Panel 2: Economies of scope
Panel 3: Revenue enhancement – increased size
Panel 1a
Domestic, within segment
6.713.3
80
0102030405060708090
100
Not afactor
Slightlyimportant
Moderatelyimportant
Veryimportant
PercentPanel 1b
Domestic, across segment
17.5
5
45
2.5
17.512.5
0102030405060708090
100
Not afactor
Slightlyimportant
Moderatelyimportant
Veryimportant
Percent
Panel 3a
Domestic, within segment
18.2
36.4
22.7 22.7
0
10
20
30
40
50
60
70
80
90
100
Not afactor
Slightlyimportant
Moderatelyimportant
Veryimportant
PercentPanel 3b
Domestic, across segment
39.5
2.6
15.8
2.6
23.715.8
0
10
20
30
40
50
60
70
80
90
100
Not afactor
Slightlyimportant
Moderatelyimportant
Veryimportant
Percent
Panel 2b
Domestic, across segment
30
15
3025
0
10
20
30
40
50
60
70
80
90
100
Not afactor
Slightlyimportant
Moderatelyimportant
Veryimportant
PercentPanel 2a
Domestic, within segment
22.7
2.3
45.5
25
4.5
0
10
20
30
40
50
60
70
80
90
100
Not afactor
Slightlyimportant
Moderatelyimportant
Veryimportant
Percent

87
Chart II.1 (continued)
Panel 4: Revenue enhancement – one-stop shopping
Panel 5: Risk reduction: product diversification
Panel 6: Change in organisational focus
Panel 4b
Domestic, across segment
12.57.5
27.5
7.5
45
0102030405060708090
100
Not afactor
Slightlyimportant
Moderatelyimportant
Veryimportant
Percent
Panel 5a
Domestic, within segment
50
2.3
36.4
9.12.3
0
10
20
30
40
50
60
70
80
90
100
Not afactor
Slightlyimportant
Moderatelyimportant
Veryimportant
Percent
Panel 4a
Domestic, within segment
23.3
4.7
34.9
20.916.3
0102030405060708090
100
Not afactor
Slightlyimportant
Moderatelyimportant
Veryimportant
Percent
Panel 5b
Domestic, across segment
3527.5
2.5
2015
0
10
20
30
40
50
60
70
80
90
100
Not afactor
Slightlyimportant
Moderatelyimportant
Veryimportant
Percent
Pane l 6 a
Dome stic , within se gme nt
53.5
4.7
16.3 18.6
7
0
10
20
30
40
50
60
70
80
90
100
Not afactor
Slightlyimportant
Moderatelyimportant
Veryimportant
PercentPanel 6b
Domestic, across segment
36.6 34.1
2.4
19.5
7.3
0
10
20
30
40
50
60
70
80
90
100
Not afactor
Slightlyimportant
Moderatelyimportant
Veryimportant
Percent

88
Chart II.1 (continued)
Panel 7: Increased market power
Panel 8: Managerial empire building
Panel 7a
Domestic, within segment
14
32.6
2.3
18.6
2.3
30.2
0102030405060708090
100
Not afactor
Slightlyimportant
Moderatelyimportant
Veryimportant
PercentPanel 7b
Domestic, across segment
27.532.5
2515
0102030405060708090
100
Not afactor
Slightlyimportant
Moderatelyimportant
Veryimportant
Percent
Panel 8b
Domestic, across segment
35
2.5
27.5
512.5
17.5
0
10
20
30
40
50
60
70
80
90
100
Not afactor
Slightlyimportant
Moderatelyimportant
Veryimportant
PercentPanel 8a
Domestic, within segment
31.140
2.2
13.3 13.3
0
10
20
30
40
50
60
70
80
90
100
Not afactor
Slightlyimportant
Moderatelyimportant
Veryimportant
Percent
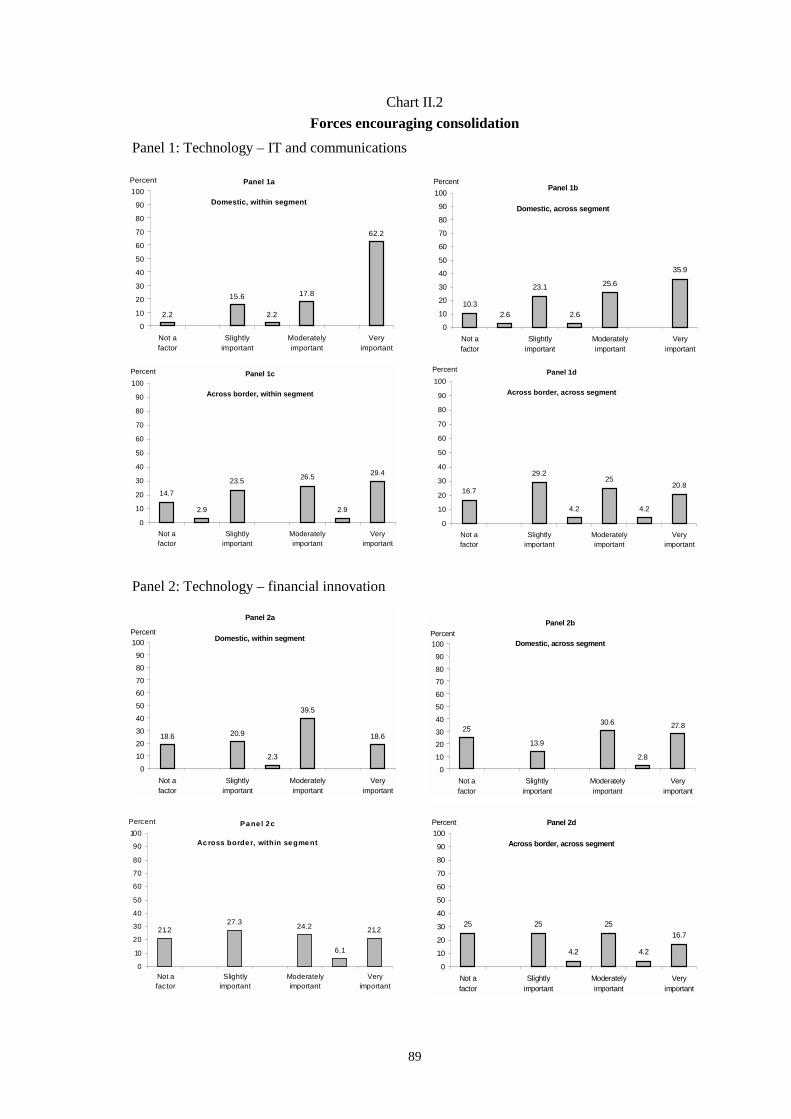
89
Chart II.2Forces encouraging consolidation
Panel 1: Technology – IT and communications
Panel 2: Technology – financial innovation
Panel 1b
Domestic, across segment
10.32.6
23.1
2.6
25.6
35.9
0
10
20
30
40
50
60
70
80
90
100
Not afactor
Slightlyimportant
Moderatelyimportant
Veryimportant
PercentPanel 1a
Domestic, within segment
2.2
15.6
2.2
17.8
62.2
0
10
20
30
40
50
60
70
80
90
100
Not afactor
Slightlyimportant
Moderatelyimportant
Veryimportant
Percent
Panel 2a
Domestic, within segment
18.6 20.9
2.3
39.5
18.6
0102030405060708090
100
Not afactor
Slightlyimportant
Moderatelyimportant
Veryimportant
PercentPanel 2b
Domestic, across segment
25
13.9
30.6
2.8
27.8
0102030405060708090
100
Not afactor
Slightlyimportant
Moderatelyimportant
Veryimportant
Percent
Pa ne l 2c
Ac ross borde r, within se gme nt
21.227.3 24.2
6.1
21.2
0
10
20
30
40
50
60
70
80
90
100
Not afactor
Slightlyimportant
Moderatelyimportant
Veryimportant
Percent Panel 2d
Across border, across segment
25 25
4.2
25
4.2
16.7
0
10
20
30
40
50
60
70
80
90
100
Not afactor
Slightlyimportant
Moderatelyimportant
Veryimportant
Percent
Panel 1c
Across border, within segment
14.7
2.9
23.5 26.5
2.9
29.4
0
10
20
30
40
50
60
70
80
90
100
Not afactor
Slightlyimportant
Moderatelyimportant
Veryimportant
Percent Panel 1d
Across border, across segment
16.7
29.2
4.2
25
4.2
20.8
0
10
20
30
40
50
60
70
80
90
100
Not afactor
Slightlyimportant
Moderatelyimportant
Veryimportant
Percent

90
Chart II.2 (continued)
Panel 3: Technology – electronic commerce
Panel 4: Deregulation
Panel 3a
Domestic, within segment
30 30
15
25
0
10
20
30
40
50
60
70
80
90
100
Not afactor
Slightlyimportant
Moderatelyimportant
Veryimportant
PercentPanel 3b
Domestic, across segment
27 2718.9
27
010
2030
4050
6070
8090
100
Not afactor
Slightlyimportant
Moderatelyimportant
Veryimportant
Percent
Panel 4b
Domestic, across segment
18.4
7.9
21.113.2
2.6
36.8
0
10
20
30
40
50
60
70
80
90
100
Not afactor
Slightlyimportant
Moderatelyimportant
Veryimportant
Percent
Pane l 4 c
Ac ross border, within segment
9.7
29 32.3
6.5
22.6
0
10
20
30
40
50
60
70
80
90
100
Not afactor
Slightlyimportant
Moderatelyimportant
Veryimportant
PercentPanel 4d
Across border, across segment
33.3
20.829.2
4.212.5
0
10
20
30
40
50
60
70
80
90
100
Not afactor
Slightlyimportant
Moderatelyimportant
Veryimportant
Percent
Panel 3c
Across border, within segment
32.3 2919.4 19.4
0
10
20
30
40
50
60
70
80
90
100
Not afactor
Slightlyimportant
Moderatelyimportant
Veryimportant
Percent
P a ne l 4 a
D ome stic , with in se gme nt
22.7
4.5
15.9
2.3
13.6
4.5
36.4
0
10
20
30
40
50
60
70
80
90
100
Not afac tor
Slightlyimportant
Moderatelyimportant
Veryimportant
Percent
Panel 3d
Across border, across segment
37.5
16.725
20.8
0
10
20
30
40
50
60
70
80
90
100
Not afactor
Slightlyimportant
Moderatelyimportant
Veryimportant
Percent

91
Chart II.2 (continued)
Panel 5: Globalisation – non-financial trade
Panel 6: Globalisation – expansion of capital markets
Panel 5a
Domestic, within segment
40 40
12.52.5 5
010203040506070
8090
100
Not afactor
Slightlyimportant
Moderatelyimportant
Veryimportant
Percent Panel 5b
Domestic, across segment
44.4
2.8
25 22.2
5.6
0
10
20
30
40
50
60
70
80
90
100
Not afactor
Slightlyimportant
Moderatelyimportant
Veryimportant
Percent
Panel 5c
Across border, within segment
33.3
3.3
33.3
13.3 16.7
0
10
20
30
40
50
60
70
80
90
100
Not afactor
Slightlyimportant
Moderatelyimportant
Veryimportant
Percent Panel 5d
Across border, across segment
41.7
4.2
25
12.516.7
0
10
20
30
40
50
60
70
80
90
100
Not afactor
Slightlyimportant
Moderatelyimportant
Veryimportant
Percent
Panel 6a
Domestic, within segment
14.619.5
29.3
2.4
34.1
0
10
20
30
40
50
60
70
80
90
100
Not afactor
Slightlyimportant
Moderatelyimportant
Veryimportant
Percent Panel 6b
Domestic, across segment
20.5
2.6
17.9
28.2
2.6
28.2
0
10
20
30
40
50
60
70
80
90
100
Not afactor
Slightlyimportant
Moderatelyimportant
Veryimportant
Percent
Panel 6c
Across border, within segment
12.9 12.9
29
3.2
41.9
0
10
20
30
40
50
60
70
80
90
100
Not afactor
Slightlyimportant
Moderatelyimportant
Veryimportant
Percent Panel 6d
Across border, across segment
32
1220
36
0
10
20
30
40
50
60
70
80
90
100
Not afactor
Slightlyimportant
Moderatelyimportant
Veryimportant
Percent
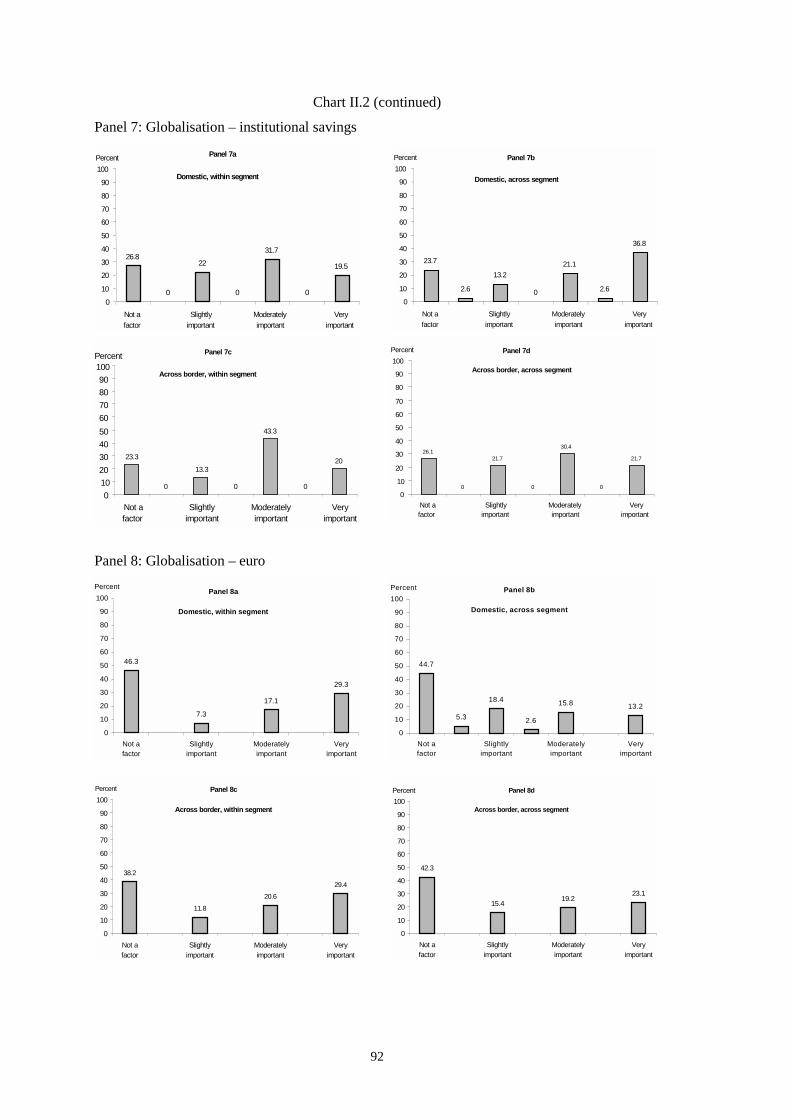
92
Chart II.2 (continued)
Panel 7: Globalisation – institutional savings
Panel 8: Globalisation – euro
Panel 8c
Across border, within segment
38.2
11.820.6
29.4
0
10
20
30
40
50
60
70
80
90
100
Not afactor
Slightlyimportant
Moderatelyimportant
Veryimportant
Percent Panel 8d
Across border, across segment
42.3
15.419.2
23.1
0
10
20
30
40
50
60
70
80
90
100
Not afactor
Slightlyimportant
Moderatelyimportant
Veryimportant
Percent
Panel 8a
Domestic, within segment
46.3
7.3
17.1
29.3
0
10
20
30
40
50
60
70
80
90
100
Not afactor
Slightlyimportant
Moderatelyimportant
Veryimportant
Percent Panel 8b
Domestic, across segment
44.7
5.3
18.4
2.6
15.8 13.2
0
10
20
30
40
50
60
70
80
90
100
Not afactor
Slightlyimportant
Moderatelyimportant
Veryimportant
Percent
Panel 7a
Domestic, within segment
26.8
0
22
0
31.7
0
19.5
0
10
20
30
40
50
60
70
80
90
100
Not afactor
Slightlyimportant
Moderatelyimportant
Veryimportant
Percent
Panel 7c
Across border, within segment
23.3
0
13.3
0
43.3
0
20
0102030405060708090
100
Not afactor
Slightlyimportant
Moderatelyimportant
Veryimportant
Percent
Panel 7b
Domestic, across segment
23.7
2.6
13.2
0
21.1
2.6
36.8
0
10
20
30
40
50
60
70
80
90
100
Not afactor
Slightlyimportant
Moderatelyimportant
Veryimportant
Percent
Panel 7d
Across border, across segment
26.1
0
21.7
0
30.4
0
21.7
0
10
20
30
40
50
60
70
80
90
100
Not afactor
Slightlyimportant
Moderatelyimportant
Veryimportant
Percent

93
Chart II.2 (continued)
Panel 9: Privatisation
Panel 10: Climate of capital markets
Panel 9a
Domestic, within segment
39
4.9
24.4 22
9.8
0
10
20
30
40
50
60
70
80
90
100
Not afactor
Slightlyimportant
Moderatelyimportant
Veryimportant
Percent Panel 9b
Domestic, across segment
57.1
5.7
25.7
11.4
0102030405060708090
100
Not afactor
Slightlyimportant
Moderatelyimportant
Veryimportant
Percent
Panel 9c
Across border, within segment
33.3 33.3
3
18.2
39.1
0
10
20
30
40
50
60
70
80
90
100
Not afactor
Slightlyimportant
Moderatelyimportant
Veryimportant
PercentPanel 9d
Across border, across segment
44
2824
4
0
10
20
30
40
50
60
70
80
90
100
Not afactor
Slightlyimportant
Moderatelyimportant
Veryimportant
Percent
Panel 10a
Domestic, within segment
28.2
2.612.8
7.7
25.6 23.1
0102030405060708090
100
Not afactor
Slightlyimportant
Moderatelyimportant
Veryimportant
Percent Panel 10b
Domestic, across segment
37.5
3.19.4 6.3
34.4
9.4
0102030405060708090
100
Not afactor
Slightlyimportant
Moderatelyimportant
Veryimportant
Percent
Panel 10c
Across border, within segment
36.7
3.3
16.7
3.3
16.723.3
0
10
20
30
40
50
60
70
80
90
100
Not afactor
Slightlyimportant
Moderatelyimportant
Veryimportant
PercentPanel 10d
Across border, across segment
52.2
8.7 13
26.1
0102030405060708090
100
Not afactor
Slightlyimportant
Moderatelyimportant
Veryimportant
Percent
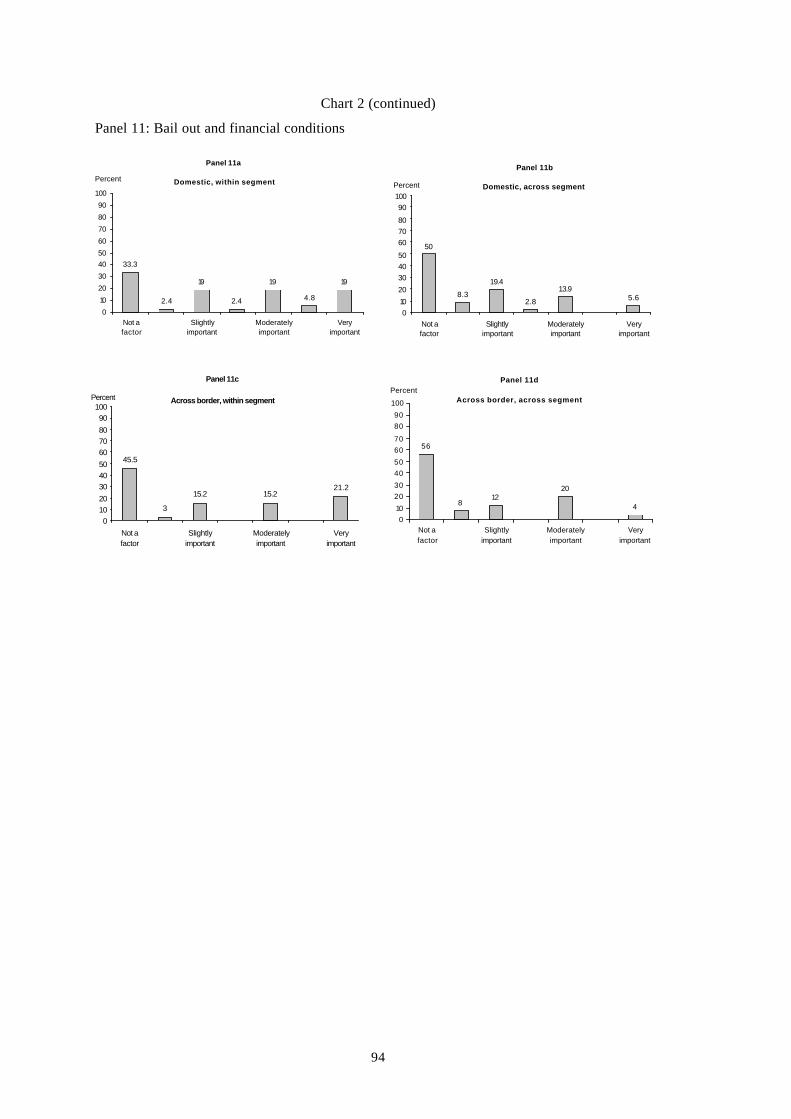
94
Chart 2 (continued)
Panel 11: Bail out and financial conditions
Panel 11a
Domestic, within segment
33.3
2.4
19
2.4
19
4.8
19
0102030405060708090
100
Not afactor
Slightlyimportant
Moderatelyimportant
Veryimportant
PercentPanel 11b
Domestic, across segment
50
8.319.4
2.813.9
5.6
0102030405060708090
100
Not afactor
Slightlyimportant
Moderatelyimportant
Veryimportant
Percent
Panel 11c
Across border, within segment
45.5
3
15.2 15.221.2
0102030405060708090
100
Not afactor
Slightlyimportant
Moderatelyimportant
Veryimportant
Percent
Panel 11d
Across border, across segment
56
812
20
40
102030405060708090
100
Not afactor
Slightlyimportant
Moderatelyimportant
Veryimportant
Percent

95
Chart II.3Forces discouraging consolidation
Panel 1: Legal and regulatory impediments
Panel 2: Cultural constraints
Panel 1a
Domestic, within segment
17.122
26.8
2.4
31.7
0102030405060708090
100
Not afactor
Slightlyimportant
Moderatelyimportant
Veryimportant
Percent Panel 1b
Domestic, across segment
22.2
11.12.8
38.9
25
0102030405060708090
100
Not afactor
Slightlyimportant
Moderatelyimportant
Veryimportant
Percent
Panel 1c
Across border, within segment
8.1 10.818.9
2.7
59.5
0102030405060708090
100
Not afactor
Slightlyimportant
Moderatelyimportant
Veryimportant
PercentPanel 1d
Across border, across segment
11.8 14.7 14.7
58.8
0102030405060708090
100
Not afactor
Slightlyimportant
Moderatelyimportant
Veryimportant
Percent
Panel 2b
Domestic, across segment
14.322.9 22.9
40
0102030405060708090
100
Not afactor
Slightlyimportant
Moderatelyimportant
Veryimportant
PercentPanel 2a
Domestic, within segment
16.7
2.4
31
2.4
1928.6
0102030405060708090
100
Not afactor
Slightlyimportant
Moderatelyimportant
Veryimportant
Percent
Pane l 2c
Across border, within segment
2.9 2.98.6
2.9
14.3
68.6
0102030405060708090
100
Not afactor
Slightlyimportant
Moderatelyimportant
Veryimportant
Percent Panel 2d
Across border, across segment
6.1 9.118.2
66.7
0102030405060708090
100
Not afactor
Slightlyimportant
Moderatelyimportant
Veryimportant
Percent

96
Chart II.3 (continued)
Panel 3: Market inefficiencies
Panel 4: Deconstruction
Panel 3a
Domestic, within segment
40.5
14.323.8 21.4
0102030405060708090
100
Not afactor
Slightlyimportant
Moderatelyimportant
Veryimportant
PercentPanel 3b
Domestic, across segment
47.1
17.6 20.614.7
0102030405060708090
100
Not afactor
Slightlyimportant
Moderatelyimportant
Veryimportant
Percent
Panel 3c
Across border, within segment
22.211.1
36.130.6
0102030405060708090
100
Not afactor
Slightlyimportant
Moderatelyimportant
Veryimportant
Percent
Panel 3d
Across border, across segment
33.321.2 18.2
27.3
0102030405060708090
100
Not afactor
Slightlyimportant
Moderatelyimportant
Veryimportant
Percent
Panel 4a
Domestic, within segment
54.1
2.7
27
2.78.1 5.4
0102030405060708090
100
Not afactor
Slightlyimportant
Moderatelyimportant
Veryimportant
PercentPanel 4b
Domestic, across segment
42.4
6.1
27.315.2
9.1
0102030405060708090
100
Not afactor
Slightlyimportant
Moderatelyimportant
Veryimportant
Percent
Panel 4d
Across border, across segment
57.1
21.4
3.610.7 7.1
010
20
30405060
708090
100
Not afactor
Slightlyimportant
Moderatelyimportant
Veryimportant
PercentPanel 4c
Across border, within segment
55.2
3.4
20.7
3.410.3 6.9
0102030405060708090
100
Not afactor
Slightlyimportant
Moderatelyimportant
Veryimportant
Percent
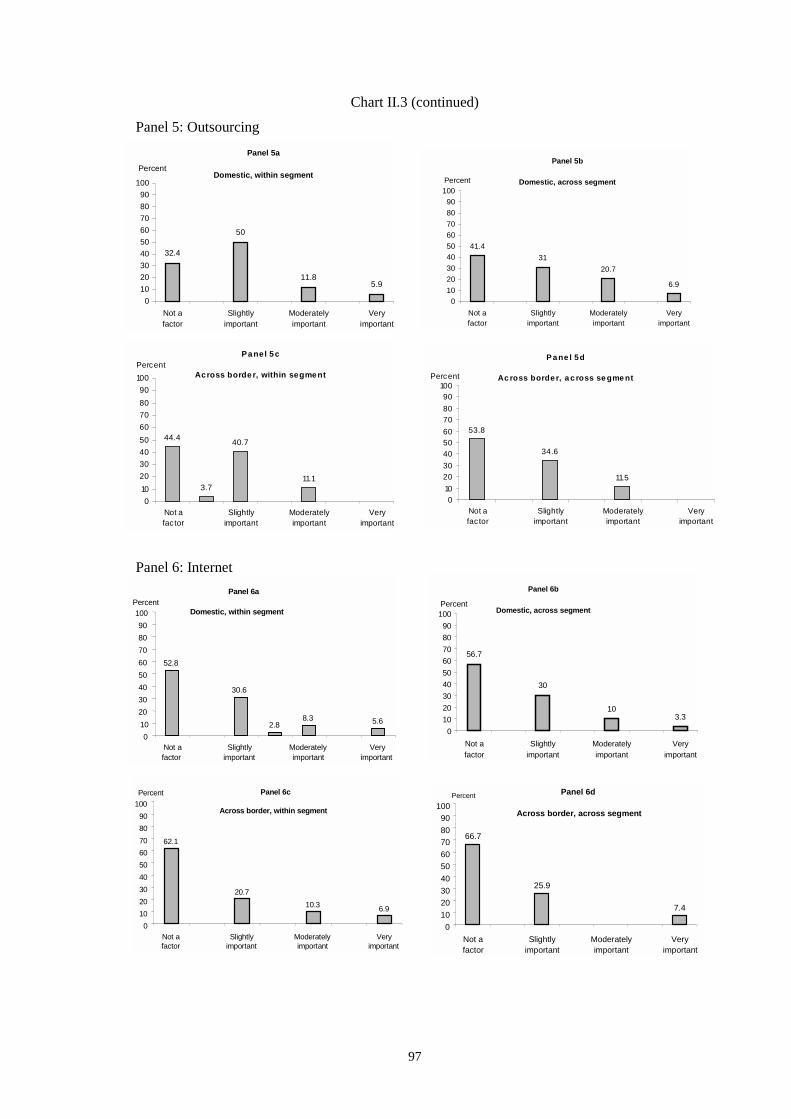
97
Chart II.3 (continued)
Panel 5: Outsourcing
Panel 6: InternetPanel 6b
Domestic, across segment
56.7
30
103.3
0102030405060708090
100
Not afactor
Slightlyimportant
Moderatelyimportant
Veryimportant
Percent
Panel 5a
Domestic, within segment
32.4
11.85.9
50
0102030405060708090
100
Not afactor
Slightlyimportant
Moderatelyimportant
Veryimportant
PercentPanel 5b
Domestic, across segment
41.431
20.7
6.9
0102030405060708090
100
Not afactor
Slightlyimportant
Moderatelyimportant
Veryimportant
Percent
Panel 5c
Across border, within segment
44.4
3.7
40.7
11.1
0102030405060708090
100
Not afactor
Slightlyimportant
Moderatelyimportant
Veryimportant
PercentPa ne l 5d
Ac ross borde r, a c ross se gme nt
53.8
34.6
11.5
0102030405060708090
100
Not afactor
Slightlyimportant
Moderatelyimportant
Veryimportant
Percent
Panel 6d
Across border, across segment
66.7
25.9
7.4
0102030405060708090
100
Not afactor
Slightlyimportant
Moderatelyimportant
Veryimportant
Percent
Panel 6a
Domestic, within segment
52.8
30.6
2.88.3 5.6
0102030405060708090
100
Not afactor
Slightlyimportant
Moderatelyimportant
Veryimportant
Percent
Panel 6c
Across border, within segment
62.1
20.710.3 6.9
0102030405060708090
100
Not afactor
Slightlyimportant
Moderatelyimportant
Veryimportant
Percent

98
Annex II.1Interviews – country synopses
For each G10 country, Australia and Spain a synopsis has been drawn up based on thequalitative assessments of the interviews. These synopses contain information on the motivesfor consolidation, external factors and expectations for the future. The sequence is as follows:
Page
United States 98Canada 99Japan 101France 102Germany 103Italy 104United Kingdom 106Australia 107Belgium 108Netherlands 109Spain 111Sweden 112Switzerland 113
United StatesIn order to develop a picture of financial sector consolidation in the United States, seveninterviews were conducted with various industry experts. The interviewees included a lawyerwho has advised banks on mergers and acquisitions, a senior official with a leading US bank,two banking industry consultants, a senior analyst with an investment bank, and representativesof a thrift industry trade association and an insurance industry trade association.
Motives for consolidation
All but one of the seven US interviewees indicated that cost savings due to economies of scalewere moderately or very important as a driver of within-segment, within-country mergers,although it was noted that anticipated cost savings often were not realised. Cost savings due toeconomies of scale were viewed as slightly important or not a factor in the case of cross-segment mergers and cross-border mergers. Revenue enhancement due to productdiversification was viewed as moderately to very important in motivating cross-segmentmergers, both within and across borders. Five out of seven interviewees considered change inorganisational focus to be unimportant, while one viewed it as very important for cross-segmentmergers and one viewed it as very important for within-segment mergers for small savingsinstitutions. The interviewees varied considerably in their views regarding the importance ofincreased market power and managerial empire building as motives for consolidation.
External factorsFor commercial banks, the most important forces encouraging domestic consolidation (bothwithin and across segments) were improvements in information and communicationstechnology, deregulation (especially interstate banking), bailouts (particularly in the late 1980sand early 1990s) and the climate of capital markets. For cross-border consolidation involvingcommercial banks, expansion of domestic and international capital markets was viewed as animportant factor. Cultural constraints were viewed as a very important factor discouraging

99
cross-border mergers and a moderately important factor discouraging domestic cross-sectormergers. One interviewee indicated that cultural constraints have not played as big a role as theyshould, since firms often have trouble dealing with cultural differences after a merger. Oneinterviewee perceived market inefficiencies to be a very important factor discouraging cross-border consolidation.
For investment banking and asset management companies, the most important factorsencouraging mergers of all types were improvements in information and communicationstechnology, trade in non-financial products, expansion of domestic and international capitalmarkets and the climate of capital markets. Market inefficiencies were viewed as a moderatelyimportant factor encouraging cross-border consolidation, rather than a deterrent toconsolidation. Cultural differences were deemed a very important deterrent to domestic cross-segment mergers and to cross-border mergers. Legal and regulatory constraints were viewed asimportant factors discouraging cross-border mergers.
For insurance firms, the most important factors encouraging within-country mergers were theinstitutionalisation of savings (within segments) and deregulation. Electronic commerce,privatisation, bailouts and the climate of capital markets were viewed as moderately important.For cross-border mergers involving insurance companies, trade in non-financial products andthe creation of the euro were viewed as important factors as well. Legal and regulatoryconstraints were viewed as moderately important factors discouraging consolidation, bothwithin and across borders, and cultural constraints were viewed as very important indiscouraging cross-border mergers.
Expectations for the futureConsolidation is expected to continue in the future, with essentially the same economic factorsdriving deals. The pace of bank-bank consolidation is expected to slow down, especially if theanticipated elimination of pooling-of-interest accounting for mergers is implemented. There islikely to be a substantial increase in insurance company mergers if the economy slows down.The Financial Services Modernisation Act is expected to have a minor impact on consolidation.It is unlikely that there will be many bank-insurance deals. None of the interviewees expect tosee a great deal of cross-border consolidation involving US firms in the near future. Strategicalliances may play a more important role in the future than in the past. There may also be moredisaggregation as firms shed non-core lines of business.
CanadaThis synopsis is based on interviews with a Canadian lawyer who has advised Canadian banksabout their merger objectives, an academic well versed in financial services sector issues, andrepresentatives of two major Canadian banks.
Motives for consolidationThe most important motive for within-country, within-segment consolidation is cost savingsattributable to increased size. Other factors that ranked important or moderately importantinclude revenue enhancement due to increased size, cost savings attributable to productdiversification, and revenue enhancement due to product diversification. Increased marketpower and managerial empire building were said to be not important. In cross-segment mergers,cost savings attributable to increased size were again deemed fairly important, but revenueenhancement due to product diversification was considered the most important motive. Costsavings attributable to product diversification and revenue enhancement due to increased sizewere viewed as moderately important.
Rankings of the motives for cross-border and within-segment consolidation varied across theinterviewees, but it is fair to say that the same general ranking prevailed as above for in-countryconsolidation. Overall, the motives for cross-border and cross-segment consolidation were weak
100
relative to the motives for within-country mergers and relative to the motives for cross-borderwithin-segment mergers.
Interviewees all agreed that motives for consolidation are affected by the size of the financialinstitutions involved. They believed that in the current Canadian regulatory environment,mergers between smaller institutions are more likely to win government approval than mergersinvolving large institutions. Another observation made by the interviewees was thatconsolidation for smaller institutions can lead to an increase in market power, while largerinstitutions see consolidation as providing opportunities to get rid of excess capacity or increaseefficiency.
External factorsAs for forces encouraging consolidation within segments, each of the three technology forceswere ranked as moderately important or very important. Under globalisation, trade in non-financial products and expansion of domestic and international capital markets were ranked asmoderately to very important, and institutionalisation of savings was ranked as moderatelyimportant. The climate of capital markets was also viewed as a moderately important factor.Rankings of forces for consolidation across segments and within the country were quite similar.
Turning to cross-border consolidation within segments, interviewees did not agree on therelative importance of the three technology forces. One thought that they were not at allimportant, while another thought they were very important. Under globalisation, expansion ofdomestic and international capital markets was ranked very important. The institutionalisationof savings was not ranked as a significant force encouraging cross-border consolidation.Creation of the euro and privatisation were viewed as not at all important. Under other forces,the climate of capital markets was regarded as moderately important.
Legal and regulatory constraints were frequently cited as most important among the forcesdiscouraging consolidation in Canada. There was less agreement on the importance of culturalconstraints and market inefficiencies. Outsourcing was mentioned as slightly important by twoof the interviewees. Forces discouraging consolidation across segments within Canada weresaid to be the same as the forces discouraging consolidation within segments. In terms of cross-border transactions, the undervalued Canadian dollar was viewed as a market inefficiency actingas a force discouraging consolidation, as was the high equity price of many US financialinstitutions. As for inbound mergers and acquisitions, Canadian regulation and ownership policyconsiderations were seen as forces discouraging consolidation.
Expectations for the future
Turning to future expectations, interviewees said that a great deal hinges on a change inCanadian government policy. This will come about in time, they believed. Consolidation withinsegments and across segments was seen as a way to enhance the efficiency of Canada’sfinancial sector, and would be in Canada’s national interest. Interviewees agreed that the largestCanadian financial institutions are small players on the world scene and felt they need to bebigger in order to compete more effectively with large foreign counterparts. The intervieweesbelieved that a merger between large Canadian banks may be one or two years away fromhappening, while a merger between a large insurance company and a bank may not occur forpossibly three years. With a change in Canadian government policy, cross-border consolidationbetween US and Canadian firms, in both directions, would be quite probable. Whilst theinterviewees expressed a preference for further consolidation, it should be acknowledged thatthe optimal level of concentration in the Canadian financial sector is a contentious issue. In1998 public authorities denied two merger requests by four of the largest Canadian banks on thebasis of prudential concerns and concerns regarding the level of domestic competition (for acomprehensive discussion of the decision see Annex III.1 of Chapter III).

101
Japan
Interviews in Japan were conducted with four representatives of large investment banking firms.
Motives for consolidationDuring the 1980s, most of the large Japanese banks (like other G10 financial institutions) soughta more active international presence, and expanded their branch networks and businessoperations overseas in an attempt to gain market share.. The bursting of Japan’s asset bubble in1990-91, however, and the rapid deterioration of loan portfolios radically changed the operatingenvironment. There were some cases of bank consolidation in the early to mid-1990s, thepurpose of which was to achieve greater market power, to adapt to a changed regulatoryenvironment, or to effect a “rescue merger” of a smaller, weaker bank with a larger bank. Sincethe late 1990s, the most important aim of financial consolidation has been to cut costs, combinerevenue streams, and achieve economies of scale in order to survive in a new and morecompetitive environment. Although mergers and tie-ups seen thus far may not have an obviousstrategic goal, the general consensus is that “bigger is better”. Through mergers, acquisitionsand shared business operations, Japanese financial institutions are seeking to streamlineoperations, reduce operational redundancies and use the resources from combined revenuestreams to increase spending on information technology (IT) and other crucial infrastructure.The focus of this drive to regain competitiveness is clearly the domestic market. Japanese bankshave been retrenching for several years from their overseas operations. At the same time,foreign banks in Japan are niche players, do not show significant interest in increasing theiremphasis on loan intermediation, and appear unlikely to challenge domestic banks in their mostimportant markets.
External factors
Interviewees all cited bailouts or the financial condition of firms as being a very important forceencouraging consolidation. One of the interviewees said that price deregulation was a veryimportant force encouraging consolidation, while others ranked that factor as either moderatelyor slightly important. Privatisation was rated as slightly important. Information technology wasbelieved to be very important as a force for consolidation by two interviewees and moderatelyimportant by two others. (Japanese financial institutions are behind in IT and consolidation isone way to make the extremely high costs of catch-up more manageable.) Interviewees said thatexpansion of domestic and international capital markets has been slightly important as a forcefor consolidation, while creation of the euro was not a factor in Japanese consolidation. Turningto forces discouraging consolidation, all interviewees rated cultural forces as very important. (Inparticular, the keiretsu model of business group organisation has had a chilling effect onconsolidation, although there is some basis for believing this counterforce has been weakeningrecently.) Market inefficiencies were seen as somewhat important in discouraging consolidation,and legal and regulatory constraints were slightly important. Interviewees ranked other forcesdiscouraging consolidation as not a factor for Japan.
Expectations for the futureLooking to the future, there is anticipation of more consolidation. Lending capacity in Japancontinues to be high relative to GDP. It will probably take years for Japanese banks to regaintheir competitiveness by raising their return on equity and become world-class players with up-to-date, efficient IT systems. With greater market acceptance and greater use of e-banking ande-commerce in Japan, more mergers as well as other types of consolidation (joint ventures,strategic alliances) may develop. Regulatory changes, which allow cross-industry entry throughholding companies, may stimulate cross-segment consolidation. However, the market pressurethat prompted the dramatic waves of structural reform and consolidation of the past two years iswaning, and the pace of change may be slow.
102
France
Two large commercial banks, one large mutual bank and the association representing theinsurance firms were interviewed.
Motives for consolidation
The commercial banks had a broad vision for financial sector consolidation (though somewhatcentred on traditional banking and less so on investment banking) and shared a relativelycommon view, while the views of the mutual banks and the representatives of the insurancefirms emphasised within-sector developments. The dominant motive for consolidation wasthought to be cost cutting. In particular, the greatest scope for cost savings arising fromconsolidation was at the level of “production”; ie the production of instruments, such asmortgages, other specific loans and insurance, as well as back-office functions. Few costsavings were envisaged at the level of distribution, where the development of “brands” wasconsidered to be critical. Moreover, cost savings were considered to be greater among bankswithin the same geographic region. Overall, much less emphasis was placed on revenueenhancement as an important factor, with one bank arguing that consolidation provided no suchadvantage while the other was rather more circumspect. It thought that size (using marketcapitalisation as a proxy) was related to return on equity and therefore the maximisation ofshareholder value.
External factorsTurning to the forces encouraging consolidation, there was general agreement that informationtechnology would produce cost savings but, as it was an expensive purchase, would also play animportant strategic role. In Europe, deregulation and privatisation were considered to be anothermajor force as they provided opportunities for consolidation.
As for factors discouraging consolidation, the most important impediment to cross-borderconsolidation between commercial banks had been moral suasion at the political level, thoughthere is some evidence that this may have been lessening more recently. Another importantimpediment to consolidation through a merger (both cross-border and within-country) is taxconsiderations, especially large capital gains taxes in an asset-heavy industry. As for within-country consolidation, the large share of the banking and insurance sectors controlled bymutuals was said to be another important impediment to consolidation. Mutuals have manyadvantages, including some tax advantages (though these have been diminished in the case ofbanks), dominant local presence in certain rural areas, and, of course, the fact that they cannotbe bought (unless they are demutualised). Mutuals have used these advantages and relativelyhealthy balance sheet positions to purchase listed firms. Most notably, this has occurred in thecase of the two large mutual banks in France.
Expectations for the futureLooking forward, the concept of a universal bank is thought to be out of date, and it isanticipated that financial institutions will specialise, eg in investment banking or in the retailbusiness. Furthermore, the traditional retail bank will need to have access to customers througha multi-channel network, rather than just through its branches. New channels may include theinternet and television.
Cross-border consolidation of retail banks in Europe could circumvent political obstacles boththrough the creation of cross-border alliances and through cross-border mergers of upstreamproduction (as described above) – for which the concentration was expected to be much greaterthan in retail distribution. In many ways this is similar to what has happened in the automobileindustry, where cars of a different brand use similar parts (even engines). The more consolidated(upstream) sectors would probably be controlled by the larger retail banks.

103
The demutualisation of savings and loan banks, which will bring them onto the market ascandidates for takeovers, would be another source for major changes in the financial landscapein Europe. It will have an effect similar to D’Amato’s bank reform in Italy, which transformedthe banking sector there. However, demutualisation is not currently under consideration inFrance. For a mutual to become a large player in it own right, it will need to improve thecentralisation of management decisions, as the structure currently in place assigns manydecision-making functions to regional cooperatives, which can retard the process. In terms ofcross-border consolidation between mutuals, there currently does not exist a pan-Europeandirective concerning the establishment of cross-border mutual subsidiaries.
GermanyInterviews in Germany were conducted with three commercial banks and an investment bank.
Motives for consolidationWith regard to consolidation within segments at the domestic level, cost savings attributable toincreased size (economies of scale) were singled out by all interviewees as the primary motive.This factor is important mainly because of the growing diffusion of technologies. Revenueenhancement due to increased size is frequently underlined as well, thus further confirming thesignificance of scale economies. Besides IT departments, scale economies are deemedparticularly significant with respect to other activities, including research, legal services, riskmanagement, advertising, back-office operations and investment banking.
Increased market power was the second most cited motive. The attainment of a greater volumevia a larger customer base would enable banks to alleviate the impact of declining interestmargins. Another advantage of increased market power is better name recognition, which wouldbe particularly significant for investment banking activities.
The situation is less clear as regards operations across segments, because consolidation hashardly stretched beyond sectoral boundaries in recent years. As a result, the only consistentpattern is the greater importance attributed to economies of scope (cost savings attributable toproduct diversification and revenue enhancement due to product diversification). Consolidationof banks with insurance companies is usually regarded as essential for the improvement of riskmanagement. Moreover, existing alliances (achieved by cross-shareholdings) between these twosectors reduce the scope for full-blown mergers and acquisitions. By contrast, there are someexamples of the acquisition of investment banks by large commercial banks. These are generallyjustified on the ground that they enable the latter to acquire better expertise in securitiesactivities.
With regard to cross-border consolidation, the interviewees generally indicate that the rankingof motives is not fundamentally different from the case of consolidation at the domestic level.As regards the size of firms, economies of scale could be especially important for smaller banks,especially in retail banking (network of branches, development of common platforms) or ininvestment banking.
External factorsAs for forces encouraging consolidation, all interviewees underlined the importance oftechnology for operations within segments at the domestic level. This driving force has a directimpact on economies of scale due to the huge set-up costs and to the importance of spreadingthe costs of technology over a large customer base. Furthermore, technology induces a greatermobility of consumers and enables them, especially corporations, to gain direct access to capitalmarkets. Finally, technology enhances competition because it favours the emergence of newcompetitors targeting new market niches (for instance in the field of remote banking).
The euro was often cited as an important factor as well. The euro mainly acts as a catalyst forchanges through its impact on the integration of capital markets and on price transparency and,
104
therefore, on the degree of competition. Expansion of domestic and international capital marketswas mentioned by all participants. One interviewee referred specifically to the securitisationtrend and the accompanying use of ratings. Other commonly cited forces, albeit to a lesserextent, include the institutionalisation of savings and deregulation.
According to two interviewees, consolidation across segments is characterised by a far lesserrole of technology due to technological discrepancies. Likewise, the euro loses much of itssignificance. As far as cross-border consolidation is concerned, the euro was widely cited as anessential encouraging factor. Deregulation is more important as well in this context. By contrast,the role of technology decreases due to technical incompatibilities from one country to another.Size is an important factor in a country where small banks are very commonplace. Unless theyhave a specialised niche, they are bound to be negatively affected by technology throughstrengthened competition and greater economies of scale.
With respect to the forces discouraging consolidation within segments at the national level, allinterviewees referred to the role played by the segmentation of the German banking market andmore specifically by the cooperative and publicly owned savings banks. In particular, it wasindicated that these banks cannot be acquired by other institutions and are insulated fromcompetitive forces. As regards consolidation across segments, cultural constraints and the factthat informal alliances are already in place reduce the impetus towards the acquisition ofinsurance companies. Cultural and regulatory impediments are especially significant for cross-border consolidation.
Expectations for the future
The interviewees anticipate an increase in the number of mergers, especially on a cross-borderbasis (one interviewee is sceptical in this respect). This evolution could be enhanced by twoother anticipated developments, namely the lifting of remaining regulatory constraints (oneinterviewee is less optimistic in this respect), which is an effect of the introduction of the euro,and a greater openness of the cooperative and savings banks sector. The specialisation and thepolarisation of the German banking sector are liable to increase in a context characterised by thediffusion of technology. Some banks anticipate a re-specialisation of financial institutions and agrowing tendency towards outsourcing.
ItalyThree interviews were conducted with banks, which covered the main segments of the bankingsector in terms of size, and one with a university professor, which covered the insurance sector.
Motives for consolidation
The main motive for consolidation within the banking sector at the domestic level concerns theneed for banks to pursue cost savings attributable to increased size (economies of scale). Anumber of areas were referred to in which economies of scale can be pursued, includinginformation technology, back offices, payment services, general directorates, etc. The objectivesof revenue enhancement due to product diversification and, to a lesser extent, to increased sizewere mentioned as other relevant motives for consolidation. In particular, the need to be able toprovide the whole range of services to customers was regarded as a very important motive.Another relevant motive was the need of banks to increase their market share with the objectiveof enlarging the customer base and diffusing products and services. Among other factors,geographical diversification was mentioned as an important factor for risk diversification andincreased market share.
Regarding operations across segments (bancassurance), the main motive for consolidation is thepursuit of product diversification. This is intended, in the first instance, to provide “one-stopshopping capabilities” and, secondly, an opportunity for risk diversification. For cross-borderoperations within the banking and the insurance sectors, the motive of revenue enhancement due

105
to increased size tends to become more important, whereas the cost saving argument loses someof its relevance. Moreover, the motives based on revenue enhancement through increased sizeand increased market power tend to be more important for large banks, whereas the motivesbased on cost savings through increased size and revenue enhancement through productdiversification appear more relevant for small/medium-sized banks. By contrast, the pursuit ofeconomies of scale is relevant throughout the whole banking sector.
External factorsInformation technology was regarded almost unanimously as a primary encouraging factor. Theintroduction of the euro was a second important factor. The euro was perceived in the strategicplanning of banks as the main driving force to complete the single market and, thus, to achievethe full integration of financial markets. Third, deregulation has also played an important roleover the past years, though it has in current times exhausted its effects. Fourth, privatisation wasregarded as an additional important factor, given the large number of publicly owned banks.Finally, consolidation as a tool for the resolution of banking crises has played an important rolefor both small and large banks.
For operations across segments, the aspect of institutionalisation of savings in particular tends tobecome more important, whereas with regard to cross-border operations some factors becomemore important (eg globalisation), others less (eg privatisation and resolution of crises).Furthermore, technology and financial innovation may represent a threat for small and medium-sized banks that are not dynamic and thus create an incentive for consolidation. By contrast,these two factors may represent an opportunity for those banks that are dynamic to follow nichestrategies and to develop new distribution channels.
Regarding the forces discouraging consolidation in the banking sector at the domestic level, theemphasis was put on legal and cultural constraints. However, this refers mainly to the first partof the reference period (1990s) rather than to more recent years since most of the constraintshave been removed. In this respect, one aspect frequently mentioned was that the publiclyowned banks lacked the necessary managerial mentality and that this tended to discourage theprocess of consolidation. Legal and cultural constraints were regarded as having even morerelevance with regard to operations across segments at the domestic level and on a cross-borderbasis.
Expectations for the future
In the banking sector, the process of consolidation was expected to continue at the national levelbut mainly for small and medium-sized banks. For the largest six or seven banking groups, theincrease in size in the domestic market no longer appears to be a strategic priority, largelybecause it could raise antitrust concerns. The new strategic focus is likely to be the developmentof complementary activities to the traditional banking business, such as asset management andinvestment banking, which generate non-interest income. In these areas, it is possible to set upinternational platforms also through partnerships or strategic alliances with specialisedinstitutions.
As far as the factors affecting consolidation in the banking sector are concerned, the importanceof information technology (internet) was expected to grow. Second, the importance of the euroas a factor encouraging consolidation was also expected to grow through its effects on theintegration of financial markets. Third, further regulatory convergence was expected mainly ona cross-border basis, also partly as a consequence of the pressure exerted by the euro on thecompetent Community and national authorities. Fourth, competition from non-banks wasexpected to increase not only from non-bank financial institutions but also through the provisionof banking services by industrial firms. Fifth, cultural constraints were thought likely todecrease in terms of importance for operations across segments. Finally, outsourcing is expectedto spread further by providing an opportunity to save costs, especially for small banks.However, this was not expected to have a direct effect on consolidation.

106
United Kingdom
Five interviews were conducted in the United Kingdom. Interviewees included a representativeof a large British bank, representatives of a rating agency, a representative of a bank consultingfirm especially knowledgeable about the UK banking sector, a representative of a largesecurities firm, and representatives of a boutique investment bank with expertise in both thebanking and insurance sectors.
Motives for consolidationThe most important motive for consolidation within sectors (banks, investment banks andinsurance firms) has been cost savings attributed to increased size. There has to be a crediblecost savings story about a proposed merger or acquisition in the United Kingdom or the marketwill not ratify the deal. Interviewees also reported revenue enhancement due to increased size asimportant, but secondary to cost savings as a motive for consolidation. Other motives deemedimportant were increased market power and managerial empire building. Motives forconsolidation across sectors yielded a different set of rankings. Revenue enhancement due tosize and due to product diversification were most important; managerial empire buildingcontinued to rate as an important motive. However, cost savings attributable to increased sizedropped to “slightly important”. In investment banking, a few of the biggest players have aglobal strategic focus. Firms in this category believe they can do any kind of deal anywhere inthe world that a customer desires. The market gives special rewards to firms in this “bulgebracket” in terms of much higher trading volumes. (Investment banking capabilities that wereformerly housed in major UK-owned banks have been divested in some cases in order toconcentrate on retail banking services.)
Cross-border consolidation in the banking sector requires a certain leap of faith, as oneinterviewee put it, and those interviewed tended to downgrade the importance of the variousmotives when compared to within-country consolidation. Motives for cross-borderconsolidation in investment banking were deemed stronger than within-country because of adesire by the bulge-bracket firms to offer any service to any firm. Interviewees reported thatmotives for cross-border consolidation within segments in order of importance were revenueenhancement due to increased size and managerial empire building. Interviewees generallyindicated that size matters. For banks, the largest ones have the greatest acquisitionopportunities. For investment banks, smaller firms seeking shelter look for the best deal theycan get; large firms want to be in the bulge bracket.
External factors
Turning to forces encouraging consolidation within segments, information and communicationstechnology and e-commerce, along with expansion of domestic and international capital marketswere ranked highest, while deregulation and privatisation were insignificant. The creation of theeuro has not been a significant force for consolidation up until now. Across segments, forces forconsolidation were rated the same or lower. Across borders, the creation of the euro andinstitutionalisation of savings were ranked highest by all but one interviewee among forces forconsolidation (particularly looking ahead and looking towards Europe), followed by e-commerce, deregulation and privatisation. For banks, size is a factor in determining the numberof potential buyers and sellers. For investment banks, small firms are vulnerable; medium-sizedfirms are attractive to foreign buyers looking for footholds elsewhere.
The most important forces discouraging consolidation within segments were marketinefficiencies and legal and regulatory constraints. Across segments, and across borders, culturalconstraints and legal/regulatory constraints were most important. Two interviewees rated theinternet as a moderately important or very important force discouraging cross-borderconsolidation, while others rated it only “slightly important”. Outsourcing was seen as onlyslightly important. Furthermore, larger firms can more easily fight off within-country or cross-border acquisition attempts. Regulators were perceived as having a home court bias.

107
Expectations for the future
Mergers within segments will continue at a moderate pace in the UK market, particularly inbanking. In investment banking, the few remaining UK-owned firms will continue to diminishas a result of foreign acquisition. In the insurance sector, interviewees believe there is relativelylittle opportunity remaining for consolidation among non-life firms owing to the consolidationthat has already taken place. Further consolidation will result in the comparatively weak UKfirms being acquired by US and/or European firms. Consolidation in the less-concentrated lifeinsurance sector will continue, and European life insurance companies may acquire some ofthese entities. Key variables affecting the pace and nature of consolidation include: investorattitudes; regulatory constraints, where the key concern will be the effects of furtherconsolidation on competition; and the public’s perception of merger problems. Outsourcing,mentioned as a force against consolidation, is still active and could mitigate againstconsolidation in the future. If the United Kingdom decides to join the euro area in the future,and if increasing harmonisation ensues for tax regimes, financial regulation and financialproducts, then there could be much more pan-European financial sector consolidation over time.
Australia
Interviews were conducted with three of the four major banks in Australia about their approachto consolidation.
Motives for consolidationIn the first phase of consolidation – until the mid-1990s – an important motive was riskreduction through geographic (cross-border) diversification, to reduce dependence on economicconditions in Australia. However, the experience of two of the banks in moving offshoreprovides an interesting contrast. One bank began to build up its offshore network, with a focuson the Asian-Pacific region, in the mid 1980s, but withdrew a few years later in response tosubstantial domestic losses and integration difficulties; cultural differences were cited as a majorobstacle. In contrast, the second bank concentrated successfully on retail bank acquisitions inAnglo-Saxon countries and was cautious not to alienate local customers by re-branding bankingproducts.
More recently, consolidation has increasingly been driven by the desire of the banks for revenueenhancement by becoming retailers of a full range of financial services to customers. This isrecognition that, within a relatively mature banking market, funds management and otherfinancial products offer greater potential for earnings than traditional banking. Accordingly, twoof the banks have acquired or are pursuing acquisitions in the funds management area and inother specialised services, such as mortgage processing, as a means of filling gaps in theirproduct ranges. For one bank, the goal is to become a “best of breeds” retail supermarket.
Although not a factor in every acquisition, the banks acknowledged the potential for significantcost savings from economies of scale, particularly in technology. Research and development ofnewer technologies involve substantial fixed costs and risks, which are more easily borne bylarger institutions. Mergers were viewed as a rapid and cost-effective way of increasing sizeboth at home and abroad; organic growth was expensive because of the need to competeaggressively on price to attract customers from other banks.
External factorsGlobalisation was acknowledged as an important factor encouraging consolidation, in at leasttwo respects. The expansion of international capital markets has allowed the banks to fund theirbalance sheet growth well beyond what could be sustained by domestic deposit growth and theAustralian capital market alone. Their size, diversification and strong credit ratings have alsogiven the banks a funding advantage over smaller institutions. Secondly, greater globalcompetition has spurred the banks to shore up their positions by increasing their size and
108
product range through consolidation. Financial innovation, technological change and thecommoditisation of products have fostered the emergence of a competitive fringe of non-bankfinancial institutions in Australia, and made it easier for customers to shop around, placingfurther pressure on profit margins.
Government policy on competition has been a key influence shaping the direction ofconsolidation in Australia. Under the current “four pillars” policy, mergers between the fourmajor banks will not be approved until the Commonwealth Government is satisfied there hasbeen a sufficient strengthening of competition in the Australian banking market. In the absenceof this policy, each of the banks interviewed would be looking to merge with another of themajors in expectation of substantial cost savings through a rationalisation of branch networks aswell as technology and back-office synergies. A further element in competition policy is theapplication of a regional rather than a national definition of the banking market in assessmentsof merger proposals by the Australian competition regulator. This has created some difficultiesfor major banks seeking to merge with smaller banks, which have, nevertheless, sizeablepositions in a regional market.
Aside from competition policy, regulatory and taxation arrangements were not seen as animpediment to consolidation. Nor was outsourcing, because this process was already occurringin the non-core areas of the banks themselves and because outsourcing contracts could alwaysbe paid out or renegotiated. On the other hand, cultural differences have been a barrier,especially across segments. Experience suggests that successful acquisitions have been based ona marriage of similar management philosophies and have been friendly in approach, thusreducing the risk of loss of customers and management. Across borders, the banks believed thatrisk increased with distance from customers – in physical, cultural and language terms.
Expectations for the futureThe banks interviewed expected that the four major banks would continue to dominate financialintermediation in Australia because of their broad-based relationships with customers. Thesebanks will all be seeking to develop the financial services supermarket concept – including astrong move into the management of retirement savings – and will be competing in anincreasingly global market. Looking further ahead, consolidation may also involve mergers oralliances with non-financial institutions specialising in distribution technologies. In thisenvironment, small banks may be able to survive if they can develop expertise in niche marketsand products, buying in technology and other services to benefit from any scale economies ofsuppliers. The banks interviewed thought that the group most at risk from competition ismedium-sized financial institutions, which, in the absence of strategic alliances, face burgeoningtechnology costs and may lack the scale to compete successfully in global markets.
BelgiumThree interviews were conducted in Belgium, two with large financial services groups(including a cross-border financial conglomerate) and one with a medium-sized financial group.
Motives for consolidationDespite the differences that exist between the three financial institutions that were interviewed,it is possible to distinguish several common motives that explain why consolidation hasoccurred. The leading motive was a combination of cost savings and revenue enhancement.Cost savings, particularly in the case of the largest groups, were envisaged through downsizingthe number of branches and staff restructuring. It was mentioned that a merger makes itsomewhat easier from a practical or political perspective to actually realise these cost reductionscompared to a standalone situation. Since much consolidation in Belgium is across segments, itis no surprise that groups expect to enhance their revenues through exploiting the bank-insurance concept. The possibilities of cross-selling (access to distribution channels) and thediversification of products (one-stop shopping and the need to be able to provide the whole

109
range of products to customers) are key in this respect. Revenue enhancement through increasedmarket size and market power tended to be important for the larger groups. Other motives, suchas risk reduction and managerial empire building, were not found to be very relevant in theBelgian case.
External factorsThe introduction of the euro along with the globalisation of capital markets was considered as afactor encouraging consolidation. The euro will integrate European financial markets, makingthem much larger than the markets that existed previously in EMU member states. In order to bea player of some significance – particularly in the wholesale segment – one needs to grow. Inthe case of asset management, consolidation will even accelerate, as this type of business willreceive a stimulus from the demographic changes (ageing) that are taking place. The favourableclimate of capital markets was also seen as a stimulating force, as this facilitates the financing ofmergers and acquisitions. The developments in information technology were mentioned as well,as small and medium-sized firms cannot afford the large investments that are needed, althoughone felt that its impact on mergers and acquisitions should not be overstated. Disintermediation(more than deregulation) was also identified as a factor, since it increases competitive pressuresto which banks must respond.
Differences in culture and corporate governance have been complicating and impedingconsolidation in Belgium to a considerable extent. In fact, these factors largely explain whyconsolidation among large banks took off relatively late. Culture and corporate governance playan even more discouraging role in the cross-border context.
Expectations for the futureAll interviewees anticipate more consolidation, including cross-border consolidation in Europebrought about by the euro and the process of globalisation. Furthermore, one expects that therewill remain room for three or four retail banks in Belgium (domestic players), while there mayemerge a few very large European retail banks, serving Europe and beyond. In order to meetcompetitive pressures from the global wholesale players of the United States, the large universalbanks in Europe may specialise in the future. There will continue to be many niche players andregional players in the wholesale field. Finally, it was recognised that the developments in thefinancial sector are surrounded by a large degree of uncertainty, and that competition willprobably also come from outside the financial sector (eg telecommunications). That may bebehind the strategy of the Belgian banks as they try to diversify their activities across bankingand insurance. Outsourcing may also increase, as it provides opportunities for cost savings.Deconstruction of the financial sector, although not very likely in the short run, may be a threatin some form in the longer run. This will partly depend on the progress in informationtechnology, which is difficult to predict.
NetherlandsThe interviews in the Netherlands were held with four major banks.
Motives for consolidationIncreasing scale appears to be one of the main motives for consolidation in the Dutch financialsector, with an eye on both cost savings and revenue enhancement. Cost savings were related,for example, to overlaps in branch networks and staffing as well as to high investments neededin technology, product innovation and (in the wholesale sector) human capital. Generally, costsavings were thought to be most important in cases of consolidation within industry segments(both domestic and cross-border). With regard to the motive of revenue enhancement throughincreasing scale, a distinction was made between wholesale and retail. In the wholesalesegment, increasing scale was thought to motivate consolidation because a larger equity baseand greater name recognition allow larger customers to be served. In the retail sector, increasing

110
scale was linked to the need to speed up the innovation process and widen distribution channelsin view of the fact that competitors can copy product innovations ever faster due totechnological developments. The desire to extend the retail customer base has stimulated cross-border consolidation, given a mature home market.
Product diversification was cited as another important motive for consolidation, particularly forconsolidation across segments (both domestic and cross-border), though it was connected torevenue enhancement (“one-stop shopping”) rather than to cost savings (economies of scope) orrisk reduction. A key factor in this process has been that customers view financial productsmore and more as substitutes. The interviews indicate that psychological motives have beenmoderately important, particularly the fear of becoming a takeover target oneself. Anothermoderately important motive was said to be shareholder pressures to create value. This alsoindirectly influences institutions that are not publicly held, as it affects the behaviour of theircompetitors. There were different views as to how the size of the firms involved might affect therelative importance of the various motives. Tentatively, it may be concluded that costconsiderations have been particularly relevant to smaller institutions, whereas larger playersmay have had a broader set of objectives, including, for example, change in organisationalfocus.
External factors
All interviewees viewed the development of technology, particularly information andcommunications technology, as one of the main factors encouraging consolidation. It enablessubstantial economies of scale to be achieved (for example concentration of the back office) aswell as efficiency gains (such as a more efficient use of customer data, or data mining), while itis itself also subject to considerable economies of scale. Deregulation was also commonlymentioned as a cause of consolidation both within the Netherlands and across borders. Of thefactors related to globalisation, the introduction of the euro was mentioned by some as anindependent force, particularly for its psychological effect and because the concomitant loss ofrevenue may have stimulated consolidation as a way of achieving cost savings. More value wasattached to the process of European integration in general. Finally, one interviewee mentionedhigh stock prices as a factor in the recent merger and acquisition wave: if an institution’s ownstock price appears overvalued it will be more willing to pay a high price for the target (in caseof an exchange of stock).
The existence of factors discouraging consolidation was emphasised particularly in the contextof cross-border and cross-segment consolidation. The most important ones were legal,regulatory and cultural constraints, including differences with regard to tax systems andcorporate governance and policies promoting national champions. It was noted that the impactof the above-mentioned impediments is more severe in the case of full-fledged mergerscompared to more decentralised types of cooperation such as strategic alliances.
Expectations for the future
It was generally expected that merger and acquisition activity will continue in the coming years.In the retail segment, cross-border consolidation may well increase because of the need to buybrand names and customer bases. One scenario put forth is that in five or 10 years there will beonly a handful of retail banks left in Europe. Some identified certain potential counterforces forthe future. Technological progress and increasing transparency (partly because of the euro) mayundermine the traditional advantages of financial institutions with regard to customerinformation and financial techniques, while at the same time reducing customer loyalty. In thisview, increased competition, especially from outside the financial sector itself, may lead to apartial dissolution of production and distribution chains. Such a scenario was seen as a potentialthreat because institutions might lose control over product development. Others, however,believed that these counterforces would not prove strong enough to significantly weaken thepractice of universal banking.
111
Spain
Four interviews were conducted in Spain: two with commercial banks and two with bankers’associations.
Motives for consolidation
There was agreement that the most important factor in the Spanish domestic process ofconsolidation has been cost savings due to economies of scale. Interviewees considered that costreduction is easier to achieve when mergers and acquisitions take place between institutions ofthe same country. It was also mentioned that it is less painful to undertake these types ofmeasures during an upward economic cycle. Another factor pointed out as very relevant is theattainment of critical mass for three main reasons: to face the upcoming European consolidationthat is expected to take place, to increase market share, notably for certain activities, and todefend against possible hostile acquisitions. The first two reasons were considered to be moreimportant for larger firms and the third for smaller ones.
With regard to cross-border consolidation (the acquisition of Latin American institutions), themain motive cited was revenue enhancement owing to the reduction of margins that has takenplace in Spain. Another factor cited was cost savings (economies of scope) as Spanish banksemulate in Latin America their Spanish model of retail banking. When it comes to riskreduction there were mixed opinions. Some of the interviewees cited the risks involved, whileanother mentioned that the negative correlation between the economic cycles in some LatinAmerican countries and Spain allows some risk reduction.
External factors
Bailouts were mentioned as one of the main forces encouraging domestic consolidation.Deregulation and the creation of the euro were also reported as catalysts for consolidation.Expansion of domestic and international capital markets was also cited, stressing that it is aforce for big banks that want to be players in these markets. The climate of capital markets wasalso mentioned as important because the current situation makes it easier to finance anacquisition. Nevertheless, it could also act as a discouraging factor because the quoted price ofthe target institution could be at a very high level. There were mixed opinions regardingtechnology issues. Technological developments are obliging financial institutions to invest largeamounts and to think about new strategies, especially in the case of small institutions. But it wasnoted that technology is often mentioned for reasons of image, and that it is not encouragingconsolidation.
Regarding cross-border consolidation (the acquisition of Latin American institutions),deregulation, privatisation and bailouts were mentioned as the most important forces. Theinstitutionalisation of savings was included as relevant because it explains why Spanish bankshave acquired sizeable Latin American private pension funds. Regarding technology issues,there were the same mixed opinions that have been noted previously. It was also underlined thatthe only actors in this process were the large institutions. The most important factordiscouraging domestic consolidation mentioned was legal and regulatory constraints. This isbecause Spanish savings banks have a special legal status that makes it difficult for them to beacquired by commercial banks.
Legal and regulatory constraints were cited as a very important factor in the cross-bordercontext – even at the European level – because regulation is still very fragmented and there arealso some political issues. Nevertheless, it was pointed out that these constraints are lessimportant when the target institution is not very big. Market inefficiencies and culturalconstraints were also mentioned as meaningful issues, especially when they referred to thesituation of some Latin American capital markets.
112
Expectations for the future
Every interviewee said that the Spanish banking system is currently consolidated and they didnot expect more mergers and acquisitions between big institutions. Further consolidation willtake place among the medium and small banks and within the savings bank sector. They agreedthat cross-border consolidation in the European Union is expected to be very important in thenext decade. Factors of growing importance will be the impact of the euro, increasedglobalisation and greater use of new technology. Market inefficiencies and regulatoryconstraints will become less important.
Some said that there will be more hostile mergers and acquisitions, and that the role ofinsurance companies will increase. It was also noted that the current cross-border alliances arelikely to be the first place for future mergers, although alliances are difficult to manage and donot add value for shareholders. It was also mentioned that e-business will be crucial in the nearfuture. Financial business will be done more and more by non-financial firms and vice versa.The first step has already taken place with alliances between banks and telecommunicationscompanies. Those investments will only be profitable with a large customer base.
Sweden
The interviews in Sweden were held with two major banks and one investment bank.
Motives for consolidation
Insiders in the industry commonly identified economies of scale as one of the main motives forconsolidation. These have been realised through reductions in personnel, a flat organisationstructure, decentralisation and the use of technology. Scaling up was also thought to bestimulated by shareholder pressures and by the shift to offering retail customers morecomprehensive service and integrated asset and liability management. One relative outsidernoted, though, that there would be limits to the benefits of sizing up further. If Scandinavianinstitutions were to grow much beyond their current medium size, diseconomies of scale mightset in due to a dilution of control as well as cultural differences. Instead of economies of scale,empire building and psychological factors might be the main motives behind the currentconsolidation process.
No clear-cut distinction could be made between consolidation within segments and acrosssegments because of the overriding presence of universal banking. However, it was noted that,if anything, wholesale operations are being scaled down as global enterprises have been lost tolarger, non-Nordic institutions and the capital markets. The concomitant shift in activities fromtraditional lending to advice implied that the need to enhance the capital basis is no longer feltin the wholesale segment. In the context of cross-border consolidation, mention was made ofrevenue enhancement due to geographic expansion.
External factorsAll interviewees mentioned technology as a relevant factor changing the financial landscape,though they judged its importance somewhat differently. One expert downplayed the generalimpact of technology on the financial sector, particularly the retail segment, because the scopeto save costs is limited, for example, by the fact that customers attach value to having access toboth the branch network and electronic distribution channels. In this view, technology did notmuch stimulate consolidation through increasing competition from niche players, since highcustomer loyalty, low margins and high cost efficiency among the incumbents make entrydifficult. The other experts put more weight on technology because of the inherent scaleeconomies. In this context, it was noted that since technology has become a competitive factorin its own right, looser forms of consolidation, such as joint ventures and strategic alliances,may no longer suffice as a foundation for collaboration between smaller or medium-sizedfinancial institutions, thereby stimulating mergers.
113
Globalisation was thought to be a minor factor encouraging consolidation, mainly in assetmanagement due to the institutionalisation of investment. Deregulation and privatisation werenot regarded as important forces encouraging consolidation in the 1990s. Deregulation wascompleted mostly in the 1980s, while state ownership has been of a fairly passive nature. Legalconstraints were identified as important forces discouraging consolidation. One example of alegal constraint was that mergers and acquisitions require the consent of a large majority ofshareholders, far larger than needed to actually exercise control. Generally, cultural differencesbetween firms were also thought to discourage consolidation. With regard to cross-borderconsolidation, the Norwegian policy of promoting national champions was seen as an obstacleto consolidation involving Norwegian institutions, while consolidation with Danish institutionshas been made more difficult by the scattered and opaque structure of share ownership.
Expectations for the futureFor the time being, consolidation is expected to continue on a regional scale. However, it wasexpected that once consolidation at the domestic level has advanced in the rest of Europe,Scandinavian institutions could become takeover targets by institutions from the Europeancontinent. The validity of the universal banking concept was generally upheld in the case ofScandinavia. It was thought that in medium-sized markets, such as Scandinavia, the benefits ofone-stop shopping outweigh the commercial benefits of specialisation. One interviewee stressedthe need to control distribution channels and maintain direct contact with customers. In anycase, the high cost efficiency of the incumbents would continue to thwart entry, including entryby non-financial companies offering competing distribution channels.
SwitzerlandFour interviews were conducted in Switzerland. The interviewees were from two large globallyoperating financial services groups, a regional partially government-owned bank and an industryassociation.
Motives for consolidation
Cost savings attributable to increased size were strongest in retail market consolidation or whena smaller institution within the same segment was involved. Revenue enhancement due toincreased size was not perceived to be a consolidation motive for small banks and reinsurancebusinesses, but was very important across segments among insurance, banking and assetmanagement in view of the requirements of institutional investors. The ability to provide “one-stop shopping” was seen as a very important motive for across-segment consolidation betweennon-life insurance and banking and insurance and asset management. Increased productdiversification and subsequent risk reduction was seen as an important factor for across-segmentconsolidation for the banks but not for large insurance companies. Reaping the benefits of astrong rating was seen as an important motive for acquirers in the banking sector, wheretraditionally solidity and trustworthiness were seen as valuable intangible assets to gain marketshare. Another motive for consolidation may be the ability to gain better ratings due to “too bigto fail” considerations.
External factors
Technological developments were seen as a very important factor for consolidation. Theinterviewees of the large institutions considered the institutionalisation of savings as animportant factor (ability to serve larger customers, ie institutional investors). Deregulation wasdeemed to be a very important factor but has its limits as a one-off effect. Privatisation was seenas moderately important and includes not only the privatisation of financial institutions but theemergence of new large customers as well. The climate of capital markets (eg low interest rates,low volatility in share prices, etc) was considered as a moderately important factor but mostlyfrom the shareholder perspective.
114
Market inefficiencies in terms of information asymmetries were seen as a growing factorimpeding consolidation, as high expectations about the gains from consolidation have often notbeen realised. Legal and regulatory constraints are considered important factors in cross-sectorconsolidation and were seen as even more important in cross-border than domestic cases.Cultural constraints were perceived by the representatives of the larger players to bemanageable on a domestic level and therefore only a slightly important factor. For smallerbanks, cultural impediments were important, especially across segments. Cross-border culturalconstraints were seen as important when European companies were involved. Other importantimpediments included data protection issues and different stock exchange rules.
Expectations for the futureEconomies of scale in information technology have been an important factor for consolidationin the past. Lower production costs lessen the importance of this factor. Changing customerneeds towards convenience and returns, the emergence of large institutional investors due to theinstitutionalisation of savings and new large corporate customers due to privatisation mayfurther revenue enhancement effects. Consolidation in Europe has so far mainly taken placewithin countries. After consolidation opportunities become scarce on a national level, morecross-border consolidation can be expected. Pressure from shareholders is expected to gain evenmore importance in the future. Although the effects due to market inefficiencies are not alwaysstraightforward, on balance this may result in a continuation of consolidation. The segmentationprocess in the industry may gain further momentum, whereas middle-sized companies areconsidered to be prone to consolidation. Deconstruction of institutions along production anddistribution lines was seen as an important potential counterforce, especially in minimising costsof managing large and complex entities. In the Swiss domestic market a continuation of theprivatisation process of the state-owned banks can be expected. This may further the potentialfor domestic consolidation.

115
Annex II.2Interviews – technical appendix
To help gain a better understanding of the motives underlying and factors influencing the formand pace of consolidation in the financial services sector, members of the G10 Task Force onCauses of Financial Sector Consolidation conducted interviews with various market participantsand experts in the G10 countries, Australia and Spain. Among the interviewees wererepresentatives from the banking, insurance and investment banking sectors, as well as legalexperts, consultants, trade associations and academics. The numbers and types of intervieweesvaried across countries.
For purposes of the interviews, consolidation was defined broadly to include all forms ofcooperation, whether through formal mergers and acquisitions or looser arrangements such asdistribution alliances and joint ventures. The interviewees were asked to focus on consolidationthat has occurred since 1990 among major finance industry segments, which were defined asdepository institutions, insurance companies, asset management companies, investmentcompanies and other financial institutions.
In addition to providing a qualitative assessment of the consolidation process (including futureexpectations), participants were asked to rank a number of motives for consolidation, as well asforces encouraging and discouraging consolidation, using the scale shown below.
Rank Assessment
0 Not a factor
1 Slightly important
2 Moderately important
3 Very important
In a number of cases respondents indicated that the value for a particular factor lay between tworank categories (eg 0-1). For purposes of quantitative comparisons, responses given as rangeswere coded at the midpoint of the range (eg 0.5).
For each of the three major categories of questions (motives for consolidation, forcesencouraging consolidation and forces discouraging consolidation), interviewees were asked toconsider consolidation both within and across industry segments as defined above. The samequestions were asked for both domestic and cross-border consolidation. Thus, for each factorthe following grid was obtained:
Within segments Across segments
Domestic consolidation
Cross-border consolidation
There were a total of 45 respondents to the written questionnaires. Generally speaking, a smallernumber of responses were given for consolidation across industry segments compared withrankings assigned for consolidation within industry segments. In a number of cases, respondentsassigned the same rankings to factors motivating or encouraging consolidation across industrysegments as they did to the same factors regarding within-industry consolidation; thus,comparisons along these lines would not be meaningful. The sample size also is too small topermit meaningful comparisons based on the type of institution or firm size. Nonetheless, thebulk of the interview results provide very illustrative and consistent information on theconsolidation process in the financial sector.

116
As for the rows of the response grid for each factor, a larger number of respondents providedrankings for domestic consolidation than for cross-border consolidation. In most instances,those respondents declining to provide rankings for cross-border factors cited the limitedamount of cross-border consolidation that has taken place thus far. In many cases, however, therankings given for cross-border consolidation result in fairly similar frequency distributions asfor domestic consolidation, but are based on a smaller numerical count.
Note that missing values are not included in any of the calculations. Thus, for example, if only41 of the 45 respondents provided rankings for a given factor, frequency tabulations for thatfactor are based on a numerical count of 41. Details shown in the charts may not sum to 100%due to rounding.
The interviews were conducted on the basis of a common interview guide, which listed thefollowing factors.
List of factorsMotives for consolidation Forces encouraging consolidation Forces discouraging consolidation
Cost savings attributable to– increased size
(economies of scale)
– product diversification(economies of scope)
Technology:– information and communications
– financial innovation
– electronic commerce
Market inefficiencies
Revenue enhancement– due to increased size
(ability to serve larger customers)
– due to product diversification (ability to provide “one-stop shopping”)
Globalisation:– expansion of domestic and
international capital markets
– trade in non-financial products
– institutionalisation of savings
– creation of the euro
Legal and regulatory constraints
Risk reduction due to productdiversification
Deregulation Cultural constraints (cross-firm andcross-segment)
Change in organisational focus Privatisation Deconstruction (breaking up ofinstitutions into more specialisedunits)
Increased market power Bailouts or financial conditions offirms
Outsourcing
Managerial empire building andretrenchment
Climate of capital markets Internet

117
Annex II.3Chronological list of key regulatory changes
Australia
• 1979. An open tender system allowing the market to determine the prices ofCommonwealth Government securities was introduced.
• 1980. Interest rate ceilings on all bank deposits were removed.
• September 1981. The practice of issuing credit directives governing the growth ofbanks’ lending ceased.
• December 1983. The Australian dollar was floated and exchange controls were lifted.
• 1984. The Reserve Bank established a banking supervision unit.
• September 1984. Access to the Australian banking market was opened to foreignbanks.
• May 1985. The Liquid and Government Securities Convention (which had requiredbanks to hold around one-fifth of their assets in government securities) was replacedwith a prudentially focused Prime Assets Ratio.
• April 1986. The last interest rate control, a cap on the rate for owner-occupied housingloans, was lifted.
• 1986. Employer-provided superannuation contributions began to be incorporated intothe employment contracts covering a range of private sector industries.
• 1987. The Insurance and Superannuation Commission was established.
• May 1990. The Commonwealth Government stated that mergers would not bepermitted among any of the four major banks or two or three major life insuranceinstitutions (the so-called “six pillars” policy).
• 1991. The Commonwealth Government introduced a mandatory system for employercontributions.
• February 1992. The Government removed the restriction on the number of foreignbanks and allowed such banks to operate as a branch and/or a subsidiary.
• 1992. The state-based regime of supervision of building societies and credit unionswas unified under the Australian Financial Institutions Commission.
• 1995. The Commonwealth Government enhanced incentives for employeecontributions to superannuation.
• March 1997. The Financial System Inquiry (known as the Wallis Committee) releasedits Final Report.
• April 1997. The “six pillars” policy was ended. At the same time, the CommonwealthGovernment indicated that it will not approve mergers between the four major banksuntil it is satisfied there has been a sufficient strengthening of competition in theAustralian banking market (the “four pillars” policy).
• July 1998. An integrated prudential regulator, the Australian Prudential RegulationAuthority (APRA), was established.

118
Canada
• The 1954 Bank Act amendments allowed banks to enter and compete for householdloans.
• The 1967 amendments further enhanced competitive pressures. A ceiling (6%) oninterest rates was eliminated; banks were permitted to finance residential mortgages;and deposit insurance for banks and trust and mortgage loan companies wasintroduced. However, banks were prohibited from owning trust companies and a 10%ownership limit was imposed on shares of banks.
• The 1980 amendments allowed foreign banks to establish subsidiaries in Canada. (Theaggregate size restrictions were removed in 1989 for US banks as part of the Canada-US Free Trade Agreement, in 1994 for Mexican banks of part of NAFTA and in 1995for the rest of the foreign bank subsidiaries). The Canadian Payments Association(CPA) Act was passed and the CPA took over cheque clearing from banks.
• In 1987, restrictions which kept banks out of the securities industry (the Canadianequivalent to the Glass-Steagall Act) were eliminated. From June 1987, there were nolimits on investments in securities firms by Canadian financial institutions; and non-residents were permitted to own up to 50% of a securities firm (100% from 1988).
• In 1992, cross-ownership restrictions on financial institutions were eased and businesspowers were broadened. Corporate governance and rules associated with self-dealingand conflict of interest were strengthened. Federal financial institutions were allowedto diversify into new financial businesses and into limited non-financial services;reserve requirements on banks were phased out to offer a level playing field.
• In 1997, the government announced its intention to allow foreign banks to branchdirectly into Canada.
• In 1998, legislation and regulations were introduced to allow all federally regulatedmutually owned life insurance companies to convert to public stock companies.
• In 1999, the legislation and regulations required to allow foreign banks to establishspecialised, commercially oriented branches in Canada were introduced and passed.
• In 2000, the government introduced legislation to create financial holding companies,to relax the widely held ownership rule for large financial institutions, and to allowclose holding of small- and medium-sized financial institutions, including banks. Theinitiative included non-legislative guidelines for the review of merger proposalsamong major banks.
Continental Europe
France
• 1980. Implementation of the first banking directive.
• 1982. All major banks are nationalised.
• The 1984 Bank Act allows the emergence of universal banks.
• In 1987 and 1993, privatisation of several banks including Banque Nationale de Paris.
• 1989. Implementation in French law of the second banking directive (89/646).
• 1990. The liberalisation of capital movements is completed (Article 67 of the EECTreaty).
• 1995. Implementation of the deposit insurance directive (94/19).

119
Germany
• 1973. Most capital controls are dismantled.
• 1978. Implementation of the first banking directive. The first banking directiveadopted in 1977 established the minimum requirements for licensing and supervisingbanks (the so-called credit institutions) and was a first step towards the principle ofhome country supervision. The requirements for licensing relied on two major criteria,namely a minimum capital requirement and reputable and experienced management(“fit and proper”).
• 1992. Implementation of the second banking directive (89/646). This directive,adopted by the Council of Ministers in June 1989, introduces the so-called singlebanking licence (“European passport”). The latter issued by the home country enablesany bank to establish branches or subsidiaries or to offer a wide range of services inanother EU country.
• 1994. Money market funds are permitted.
Italy
• 1983. Elimination of credit ceilings.
• 1985. Implementation of the first banking directive.
• 1990. Liberalisation of banks’ branching.
• 1990. Foreign exchange and capital controls are eliminated by May 1990.
• 1992. Elimination of floor prices on government bonds.
• 1993. Implementation of the second banking directive. Foreign banks are permitted,the demarcation line between short-term and long-term lending banks is abolished.
• 1993-94. Privatisation of Credito Italiano and some other publicly owned banks.
Japan
• 1979, May. The deposit interest rate is deregulated for negotiable certificates ofdeposit (CDs) of JPY 500 million and above and with a maturity of three to sixmonths.
• 1983, April. Banks started to retail public bonds.
• 1984, January. The minimum CD size with deregulated interest rates was set at JPY300 million. (Between January 1984 and 1994, gradual liberalisation on depositinterest rates on various deposit instruments proceeded.)
• 1984, May. “Real Demand Principle” in foreign exchanges was abolished. Current andcapital accounts are completely liberalised.
• 1984, June. Banks started to deal public bonds.
• 1986, February. Treasury Bills were introduced.
• 1986, December. Tokyo Offshore Markets opened.
• 1986. Asset (pension fund) management companies were allowed to be established bybanks as subsidiaries.
• 1987, November. Banks and securities firms started to deal in CDs.
• 1987, November. Auctions were introduced in 10-year bond issues.

120
• 1988, May. Banks started to deal securities futures and securities firms started to dealfinancial futures.
• 1992, June. A law was passed (to be enacted in 1993): banks would be allowed toestablish a subsidiary for securities business with limited scope of business; banks andsecurities firms would be allowed to establish trust banking subsidiaries with limitedscope of business. Between 1993 and 1996, 19 securities subsidiaries were establishedby banks. Between 1993 and 1995, 17 trust banking subsidiaries were established bybanks and securities firms. Banks would be allowed to set up investment trustmanagement companies.
• 1995, May. A law was passed (to be enacted in 1996): life insurance companies wouldbe able to establish non-life subsidiaries, and non-life insurance companies would beable to establish life subsidiaries.
• 1998. Insurance premiums for non-life insurance policies, such as auto, fire andcasualty, were deregulated.
United Kingdom
• The 1979 Banking Act gave formal responsibility for supervision to the Bank ofEngland. Prior to that the Bank had traditionally exercised informal bankingsupervision powers.
• The 1979 Credit Unions Act provided a statutory framework for the incorporation andregulation of credit unions – small mutual banks serving members.
• The 1982 Insurance Companies Act provides the regulatory framework forauthorisation and prudential supervision of companies carrying on insurance business.An important subsequent amendment was to change the framework so as to complywith requirements of EU Directives on life and non-life insurance business. Somerequirements under the Act affect Lloyd’s of London – though that is largely self-regulated with underpinning from successive Lloyd’s Acts.
• The 1986 Building Societies Act gave societies a legal framework and established theBuilding Societies Commission with regulatory responsibility. It also provided a legalmeans for societies to convert from mutual to plc status. The 1986 Act wasprescriptive about societies’ powers, but these restrictions have largely been removedby the 1997 Act, so societies now have (almost) as much freedom as banks.
• The 1986 Financial Services Act created a two-tier system that split regulatoryresponsibility between the Securities and Investments Board (SIB) and the SelfRegulatory Organisations (SROs), together with the Recognised Professional Bodies(RPBs). The SIB and SROs had the primary responsibility to deliver the standards ofregulation, supervision and investor protection required by the Financial Services Act.This structure was intended to be sufficiently flexible to respond to the regulatoryneeds of the various financial market sectors.
• The 1986 “Big Bang” reforms saw extensive deregulation of the City. Anticompetitivepractices that had restricted the entry of new participants into London’s markets wereabolished.
• The 1987 Banking Act enhanced the supervision of banks, including the establishmentof a Board of Banking Supervision. The Act also reflected the establishment of asingle European market in banking, with recognition of home state responsibility forsupervision.
• The 1992 Friendly Societies Act established the Friendly Societies Commission withregulatory responsibility.
121
• In 1997 the SIB became the FSA. The functions of the SROs and RPBs will beexercised by the FSA. The objectives were to reform the institutional architecture tobring regulation and supervision closer to the changing structure of the financialindustry, to introduce clearer responsibilities and accountability, and to reducecomplexity whilst reducing compliance costs. The FSA regulates and authorises allfinancial business including unit trusts and OEICs, and recognises and supervises allinvestment exchanges and clearing houses.
• In 1997 a memorandum of understanding between HM Treasury, the Bank of Englandand the FSA set out their respective roles in the area of financial stability andestablished a framework for accountability, transparency and information exchange,including for support operations. The Bank of England is responsible for the overallstability of the financial system.
• The 1998 Bank of England Act passed responsibility for banking regulation from theBank of England to the FSA on 1 June 1998.
• The 2000 Financial Services and Markets Act will give the FSA a series of enablingpowers to allow it to act as it considers appropriate in particular cases. The Act alsoplaces a number of obligations on the FSA eg to consult on proposed rules and topublish cost-benefit analyses to ensure proportionality.
Other relevant pieces of UK legislation not specifically targeted at the financial services sectorinclude the Companies Act 1989. The European Union is another source of regulation throughvarious directives such as the Investment Services Directive and the Capital AdequacyDirective.
United States43
Banking
• 1980. The Depository Institutions Deregulation and Monetary Control Act of 1980(DIDMCA) phased out deposit interest rate ceilings, expanded the powers of thriftinstitutions, and increased the limit of deposit insurance from USD 40,000 to USD100,000.
• 1982. The Garn-St. Germain Depository Institutions Act of 1982 authorised moneymarket deposit accounts and net worth certificates for thrifts. It also relaxedrestrictions on commercial lending by thrifts. The law loosened other lendingrestrictions as well.
• 1987. The Competitive Equality Banking Act of 1987 (CEBA) recapitalised the thriftinsurance fund and made other provisions to protect certain depository institutions.
• 1987-96. In 1987, The Federal Reserve Board permitted bank holding companies toexercise limited underwriting and dealing powers with four types of debt in “Section20” subsidiaries. The revenue generated by these activities could not exceed 5% of theorganisation’s total revenues. The powers granted to bank holding companies wereincreased over the years to include more types of debt securities and equity securities.Moreover, the revenue limit was raised to 10% in 1989 and further to 25% in 1996.
43 The primary source for changes in banking legislation is the FDIC Banking Review, Volume II, No 1, 1998.Securities information comes from several sources including “Securities Underwriting” by Samuel L Hayes, III;Andrew D Regan, in Financial Services edited by Samuel L Hayes, III, 1993; and a conversation with MikeSchoenfeld of the Federal Reserve Board.

122
• 1989. The Financial Institutions Reform, Recovery, and Enforcement Act of 1989(FIRREA) authorised the use of taxpayer funds to resolve failed thrifts. The act alsoeliminated the existing thrift regulatory structure, gave FDIC control of thrift depositinsurance, and set deposit insurance reserve levels.
• 1991. The Federal Deposit Insurance Corporation Improvement Act of 1991(FDICIA) was designed in large part to restrict discretion in monitoring and resolvingproblems in the thrift industry.
• 1990s. Most, if not all, individual state legislatures loosened restrictions on intrastatebranching. States also passed legislation allowing increasing levels of interstatebanking. In other words, bank holding companies had an increasing number of optionsregarding potential acquisition targets.
• 1994. The Riegle-Neal Interstate Banking and Branching Efficiency Act of 1994permitted banks to engage in interstate banking and interstate branching.
• 1999. The Gramm-Leach-Bliley Act of 1999 substantially expanded powers forqualifying bank holding companies by repealing existing restrictions on affiliationswith insurance companies and securities firms. Also, firms that met certain criteriacould engage in a broad array of other financially related activities.
Securities
• 1975. The Securities and Exchange Commission (SEC) abolished fixed rate brokeragecommissions, whereby brokers had charged a fixed rate per share traded. After thischange, brokers were free to set the level of their commissions and negotiate withcustomers regarding fees.
• 1982. Securities and Exchange Commission (SEC) Rule 415 of the Securities Act of1933 was introduced in 1982 to enable firms to use shelf registration, which permitscertain firms to register predetermined amounts with the SEC for sale to investors atsome undetermined time in the future.
• 1987-96. Section 20 subsidiaries of bank holding companies (see above).
• 1990. Rule 144A of the Securities Act of 1933 was adopted by the SEC in 1990 toliberalise and enhance the liquidity of the private placement market.
• 1999. Gramm-Leach-Bliley Act (see above).
Insurance
• 1999. Gramm-Leach-Bliley Act (see above).
123
References
Akhavein, J D, A N Berger and D B Humphrey (1997): “The Effects of Megamergers onEfficiency and Prices: Evidence from a Bank Profit Function”, Review of IndustrialOrganisation 12: 95-139.
Allen, L and A S Cebenoyan (1991): “Bank Acquisitions and Ownership Structure: Theory andEvidence”, Journal of Banking and Finance 15: 425-448.
Bank for International Settlements (1999): “The Monetary and Regulatory Implications ofChanges in the Banking Industry”, Conference Papers, vol 7.
Berger, A N, R S Demsetz and P E Strahan, (1999): “The Consolidation of the FinancialServices Industry: Causes, Consequences, and Implications for the Future”, Journal of Bankingand Finance 23: 135-194.
Berger, A N and D B Humphrey (1992): “Megamergers in Banking and the Use of CostEfficiency as an Antitrust Defense”, Antitrust Bulletin 37: 541-600.
Berger, A N and L J Mester (1997): “Inside the Black Box: What Explains Differences in theEfficiencies of Financial Institutions?”, Journal of Banking and Finance 21: 895-947.
Bikker, J A and H J Groeneveld (October, 1998): “Competition and Concentration in the EUBanking Industry”, DNB Staff Reports, Amsterdam.
Boot, A W A (1999): “Consolidation and Strategic Positioning in Banking with Implications forSweden”, in: Swedish Government, Government Inquiry on the International Competitiveness fthe Swedish Financial Sector, Supplement 27, Stockholm: 221-256.
Calomiris, C W and J Karceski (1998): “Is the bank merger wave of the 1990’s efficient?Lessons from nine case studies”, Columbia University Working Paper.
Cummins, J D and H Zi (1998): “Comparison of Frontier Efficiency Methods: An Applicationto the US Life Insurance Industry”, Journal of Productivity Analysis 10: 131-152.
Davis, S I (2000): Bank Mergers: The Lessons of Experience, Macmillan Press, London.
Deloitte Touche Tohmatsu International (1995): The future of retail banking. A globalperspective, London.
Dermine, J (1999): “The Economics of Bank Mergers in the European Union: A review of thePublic Policy Issues”, INSEAD-paper.
Dobson, W (December, 1999): “Prisoners of the Past in a Fast-Forward World: Canada’s PolicyFramework for the Financial Services Sector”, C.D. Howe Institute Commentary, 132, RenoufPublishing Co., Ltd., Ottawa.
Eckl, S, J N Robinson and D C Thomas (1991): Financial Engineering: A Handbook ofDerivative Products, Basil Blackwell, Cambridge.
European Central Bank (July 1999): The effects of technology on the EU banking systems.
Evans, P and T S Wurster (2000): Blown to bits: how the new economics of informationtransforms strategy, Boston.
Focarelli, F, F Panetta and C Salleo (1999): “Why Do Banks Merge?”, Temi di discussione delServizio Studi 361, Banca d’Italia.
Furst K, W Lang and D Nolle, Office of the Comptroller of the Currency (June, 2000): “Whooffers Internet Banking?”, Quarterly Journal, vol 19, no 21-20.
Gardner, L and M F Grace (1993): “X-efficiency in the US Life Insurance Industry”, Journal ofBanking and Finance 17: 497-510.
124
Goldberg, L G, G A Hanweck, M Keenan and A Young (1991): “Economies of Scale and Scopein the Securities Industry”, Journal of Banking and Finance 15: 91-107.
Grace, M F and S G Timme (1992): “An Examination of Cost Economies in the United StatesLife Insurance Industry”, Journal of Risk and Insurance 59: 72-103.
Groeneveld, J M (1999): “The Forces Behind the Consolidation Trend in the European BankingIndustry”, Kredit und Kapital, Heft 3: 369-392.
Kane, E J (1999): “Implications of superhero metaphors for the issue of banking powers”,Journal of Banking and Finance 23: 663-673.
Kwast, M L (November 1999): “United States Banking Consolidation: Current Trend andIssues”, Paper presented to the OECD Committee on Financial Markets, Paris.
Llewellyn, D T (1999): “The new economics of banking”, SUERF Study 5, Amsterdam.
NIBE (1999): De invloed van e-commerce op het bankbedrijf: preadviezen van W L van Dinten,R W J Groenink en A H G Rinnooy Kan (The influence of e-commerce on banking:recommendations by W L van Dinten, R W J Groenink and A H G Rinnooy Kan), Amsterdam.
OECD (1998): “Managing Prosperity in an Ageing Society”, Paris.
Pilloff, S J and A M Santomero (1998): “The Value Effects of Bank Mergers and Acquisitions”,in: Amihud, Y and G Miller, (eds.) Bank Mergers and Acquisitions, Kluwer AcademicPublishers, Boston, MA: 59-78.
Prager, R A and T H Hannan (1998): “Do Substantial Horizontal Mergers Generate SignificantPrice Effects? Evidence from the Banking Industry”, Journal of Industrial Economics 46: 433-452.
Prowse, S (1997): “Corporate Control in Commercial Banks”, Journal of Financial Research20: 509-527.
Rhoades, S A (1998): “The Efficiency Effects of Bank Mergers: An Overview of Case Studiesof Nine Mergers”, Journal of Banking and Finance 22: 273-291.
Sapienza, P (1998): “The Effects of Banking Mergers on Loan Contracts”, Working Paper,Northwestern University, Evanston, IL.
Simons, K and J Stavins (1998): “Has Antitrust Policy in Banking Become Obsolete?”, NewEngland Economic Review, Federal Reserve Bank of Boston, Boston, MA: 13-26.
Smith, R C (1990): “Money Wars”, EP Dutton, New York.
Subrahmanyam, V, N Rangan and S Rosenstein (1997): “The Role of Outside Directors in BankAcquisitions”, Financial Management 26: 23-36.
Swank, J (1995): “Oligopoly in loan and deposit markets: An econometric application to theNetherlands”, De Economist: 353-366.
“A Survey of International Banking”, The Economist, 17 April 1999.
“Online Banking”, The Economist, May 20-26, 2000.
Walter, I and A Boot (1999): “The Future of Banking: Two Essays on the Consolidation in theFinancial Sector”, Amsterdam Center for Corporate Finance, Amsterdam.
White, W R (1998): “The coming transformation of Continental European Banking?”, BISWorking Paper, no 54.
Yuengart, A M (1993): “The Measurement of Efficiency in Life Insurance: Estimates of aMixed Normal-Gamma Error Model”, Journal of Banking and Finance 17: 483-496.

125
Chapter III
Effects of consolidation on financial risk
1. IntroductionThis chapter considers the potential implications of financial consolidation for financial risk.Financial risk is defined to encompass both individual financial institutions and a systemicfinancial crisis.
The chapter’s objective is to assess the impact of consolidation on risk, not to judge whetherconsolidation in combination with other developments has led to a net change in the risk ofeither individual financial institutions or the financial system. Indeed, it is possible to argue thatthe probability that a given shock will either threaten the solvency of a particular firm ordevelop into a systemic event has, on net, declined over the last decade. Many of the reasons forsuch a judgement, such as regulatory reforms designed to increase bank capital and reducemoral hazard, and the development of efficient markets for a variety of financial instruments,probably have little to do with consolidation per se. Others, such as increased geographicdiversification, may have resulted substantially from consolidation. In both cases, this chapterattempts to isolate the “partial” implications of financial consolidation.
As the previous paragraph suggests, the objective of isolating the effects of consolidation ismuch easier to state than to achieve. Consolidation, as discussed in Chapter II, is but one ofseveral powerful forces causing change in the financial system, and each of these forces affectsand is affected by the others.
The chapter begins by specifying a working definition of systemic financial risk (Part 2). Theprimary objective is to provide a common analytical framework for evaluating the potentialimpacts of consolidation. This definition is used throughout both the chapter and the broaderstudy. It emphasises losses of economic value or confidence, as well as the probability ofsignificant adverse effects on the real economy, as defining characteristics of systemic risk. Italso argues that the possibilities for negative real economic effects generally arise fromdisruptions to the payment system and to credit flows, and from the destruction of asset values.However, it should be noted that the systemic risk aspects of the payments system are notdiscussed in this chapter, as this topic is covered in Chapter VI.
Once systemic risk is defined, the potential implications of financial consolidation on individualfirms and systemic risk are discussed for three separate geographic regions: the United States,Europe and Japan (Parts 3, 4, and 5). Annexes focus on the potential effects of consolidation onsystemic risk management in Canada and on the possible effects of strategic alliances onfinancial risk. The geographic distinctions were chosen in large part because each region hasdistinct economic characteristics, including the structure of its financial system, its position inthe macroeconomic cycle, and the nature of its ongoing financial consolidation. Thesecharacteristics could significantly influence the ways in which consolidation is affecting andwill affect financial risk. Each geographic section is organised in a similar manner, although theauthors were given considerable latitude to pursue issues most relevant to their area.
The discussion of individual firm risk focuses on the question: Can we make a judgementregarding whether consolidation has led or will lead to financial institutions that are more or lessrisky on a standalone basis?
The discussion of systemic risk begins by considering whether financial consolidation has, or isexpected to lead to the creation of a new class of firms that are too big to fail, liquidate, or

126
discipline effectively. The analysis of systemic risk then reviews the potential effects ofconsolidation on key characteristics of economic “shocks” that may become a systemic event.These characteristics include: (i) “direct” interdependencies between firms and markets throughinterfirm on- and off-balance sheet exposures, (ii) “indirect” interdependencies throughcorrelated exposures to non-financial sectors and financial markets, and (iii) the degree oftransparency of firms and markets, including the role played by market discipline. For example,consolidation could affect firms’ direct interdependencies through the interbank market byreducing the number of players and counterparties. Consolidation could also affect firms’indirect interdependencies by encouraging greater reliance on markets for funding as well as byencouraging increasingly similar investment objectives; both could result in an increase in thecorrelation of firms’ exposures. Finally, consolidation may induce firms to undertake largercross-border and cross-product activities that may increase their complexity, thereby affectingtheir transparency to markets and regulators. Where relevant, both domestic and cross-bordereffects are discussed. In addition, the importance of both institutions and markets is emphasised.
The final portion of each geographic section identifies the key areas of policy concern raised bythe previous discussion. As is the case with other portions of the study, specific policyrecommendations are not the objective. Rather, identification and perhaps prioritisation of themost important concerns are sought.
2. A working definition of systemic riskSystemic financial risk is the risk that an event will trigger a loss of economic value orconfidence in, and attendant increases in uncertainly about, a substantial portion of the financialsystem that is serious enough to quite probably have significant adverse effects on the realeconomy. Systemic risk events can be sudden and unexpected, or the likelihood of theiroccurrence can build up through time in the absence of appropriate policy responses. Theadverse real economic effects from systemic problems are generally seen as arising fromdisruptions to the payment system, to credit flows, and from the destruction of asset values.
Two related assumptions underlie this definition. First, economic shocks may become systemicbecause of the existence of negative externalities associated with severe disruptions in thefinancial system. If there were no spillover effects, or negative externalities, there would be,arguably, no role for public policy. In all but the most highly concentrated financial systems,systemic risk is normally associated with a contagious loss of value or confidence that spreadsto parts of the financial system well beyond the original location of the precipitating shock. In avery highly concentrated financial system, on the other hand, the collapse of a single firm ormarket may be sufficient to qualify as a systemic event. Second, systemic financial events mustbe very likely to induce undesirable real effects, such as substantial reductions in output andemployment, in the absence of appropriate policy responses. In this definition, a financialdisruption that does not have a high probability of causing a significant disruption of realeconomic activity is not a systemic risk event.
This definition is consistent with most of the definitions of systemic risk proposed in theliterature.44 However, this definition is stricter than most because it explicitly requires (i) thatthe negative externalities of a systemic event extend to the real economy, and (ii) that this ishighly probable to occur. The emphasis on real effects reflects the view that it is the output ofreal goods and services and the accompanying employment implications that are the primaryconcerns of economic policymakers.
Financial institutions and markets can be hit by shocks that originate in the real sector, infinancial markets, or from within the financial industry. When considering a financial shock,
44 See Kaufman (1999) and the Bank for International Settlements (1992).
127
and whether it may have systemic potential, it is useful to distinguish between impact andtransmission effects. In addition, the width of a shock can be defined as the fraction of firms (interms of their market share) or markets simultaneously affected at impact. The depth of a shockcan be defined as the fraction of firms or markets subsequently affected by the shock during thetransmission phase. Thus, a systemic financial risk event can be viewed as a shock whoseimpact and transmission effects are wide and deep enough to severely impair, with highprobability, the allocation of resources and risks throughout the financial and real economicsystems.
Once a financial event has become systemic, effects on the real economy are generally thoughtto occur potentially through three channels. First, payment system disruptions, including bankruns, may cause the failure of illiquid but solvent firms. Second, disruptions in credit flows maycreate severe reductions in the supply of funds to finance profitable investment opportunities inthe non-financial sector. Third, collapses in asset prices, perhaps induced by a drastic decline inthe aggregate money supply caused by bank runs or by a general decline in the liquidity offinancial markets, may induce failures of financial as well as non-financial firms andhouseholds, and decrease economic activity through a decline in wealth and an increase inuncertainty.
Most systemic crises that have occurred in G10 and other countries in the past 50 years haveexhibited at least one of the defining characteristics of systemic risk events just discussed. Inaddition, the economic significance of the real effects of systemic banking problems iswitnessed by the large costs that have been associated with the resolution of banking crises andwind-downs of banking organisations. Such costs have been estimated to range from an averageof about 4% of GDP in developed countries to an average of about 9% in developingeconomies.45
3. Effects of consolidation in the United StatesThis section discusses the potential effects of financial consolidation on the riskiness ofindividual US financial firms and on the potential for a negative economic shock, eitherfinancial or real, to become a systemic financial event in the United States.
Risk of individual financial institutionsThis subsection focuses on the effects of three types of consolidation on the risk of individualfinancial institutions: (i) consolidation of large banking organisations in the United States,(ii) universal-type consolidation between US banking organisations and other types of USfinancial institutions, such as investment banks or insurance companies, and (iii) internationalconsolidation involving US banking organisations. While not a comprehensive list, it covers thesignificant combinations involving those large US banking organisations that may imposesubstantial burdens on the safety net and whose failures may have systemic consequences.
The main topics covered are how consolidation may affect the risk of these institutions byaltering their (a) geographic diversification, (b) product diversification, (c) managerialefficiency, (d) operating risk, and (e) market power rents. Before proceeding, an analyticalframework that links these topics to the risk of an individual financial institution is outlined.
Under the so-called Altman z-score model, risk is measured as the number of standarddeviations an institution’s earnings must drop below its expected value before equity capital is
45 See Caprio et al (1998), Caprio and Kinglebiel (1997) and Lindgren, Garcia and Saal (1996).

128
depleted.46 Although this framework has its limits, it is useful to think of the contributions torisk in terms of factors that affect expected earnings (returns), the variation in earnings, capital,and the institution’s trade-off along the efficient risk-return frontier.47 For example, managerialefficiency and market power rents contribute primarily to expected earnings, whereasgeographic diversification, product diversification, and operating risk primarily contribute to thevariation in earnings.
It is important to recognise the endogeneity of the location of the efficient risk-return frontier,the choice of the point on the frontier, and equity capital k. That is, the changes in expectedearnings and variations in earnings brought about by consolidation through altering managerialefficiency, market power, geographic and product diversification, and operating risk may bethought of as pushing in or out the efficient frontier. For example, a reduction in risk may raisefuture earnings and contribute to capital through retained earnings because a safer bankingorganisation may pay lower risk premiums on debt and other contingent claims, have reducedregulation or supervision costs and an increased capacity to issue credible financial guarantees.Furthermore, as discussed below, the improved geographic diversification brought about bybank mergers and acquisitions (M&As) tends to shift up the efficient frontier (ie lowersvariations in earnings for given expected earning), but also tends to be accompanied by a shiftinto higher earnings, riskier lending (ie raises both expected earnings and variations inearnings).48 Research also suggests that increases in market power rents increase franchisevalue, shift up the frontier, and tend to bring about safer lending and increased equity capital.49
Geographic diversification
To examine the risk implications of geographic diversification, this section focuses on theoryand empirical evidence on the first and third main types of consolidation involving largebanking organisations – consolidation of large banking organisations in the United States (firstsubsection) and international consolidation of US banking organisations (second subsection).
Geographic risk diversification effects of the consolidation of large US banking organisations
Consolidation of US banking institutions often involves geographic diversification, asinstitutions expand into new local markets. Geographic consolidation may diversify risksbecause the returns on loans and other financial instruments issued in different locations mayhave relatively low or negative correlations.
46 To illustrate, let µ ≡ expected earnings, σ ≡ standard deviation of earnings, and k ≡ capital. The z-score ≡ (µ+k)/σis the number of standard deviations below the mean earnings that just wipes out capital. Under standardeconomic theory, a firm trades off between higher expected earnings and lower variation of earnings along its µ-σefficient frontier, as well as choosing its capital k. For a recent empirical analysis of the cross-sectionalrelationships between a z-score measure of insolvency risk, charter value and bank size, see De Nicoló (2000).
47 The z-score may be inadequate for measuring the risk of failure, since the extreme negative tail of the earningsdistribution may not be well approximated by just the mean and standard deviation of the distribution.
48 We also note the possibility that diversification can increase financial institution risk. An institution’s risk mayincrease if the additional assets have low expected returns, low capital or high variation of returns (Haubrich1998). In addition, the expanded institution may choose to take on more risk, for example, by reducing loanmonitoring (Winton 1999).
49 See Keeley (1990). Another potential effect of consolidation on risk not treated here regards the abilities of a firmto engage in credit risk and market risk modelling. On the one hand, lower fixed costs of implementation inducedby consolidation may help a firm to push up its µ - σ efficient frontier and to choose capital k more efficiently.On the other hand, risk modelling might be harder for consolidated institutions involved in a broader range ofactivities, since the complexity of risk modelling might rise substantially, and appropriately aggregating the risksassociated with each activity may be quite difficult.

129
Table III.1 gives information about the distribution of bank earnings across geographic regionsin the United States. The table shows the means and correlations of bank earnings, as measuredby return on equity (ROE), across the eight regions of the United States defined by the Bureauof Economic Analysis over the period 1979-98. These data suggest very strong diversificationpossibilities from cross-regional consolidation that may shift up the efficient risk-return frontier.Bank earnings in many region pairs, particularly when the regions are non-contiguous, havefairly low correlations, including one negative correlation. Consistent with these data, researchgenerally finds that larger, more geographically integrated institutions tend to have betterefficient frontiers.50
There is also some evidence regarding bank M&As that bears on this issue. Acquiring bankstend to bid more for targets when the M&A would lead to significant diversification gains,consistent with a motive to diversify risks.51 Studies have also found that M&As tend toimprove profit X-efficiency,52 and that this improvement could be linked to an increaseddiversification of risks.53 After consolidation, institutions tend to shift their asset portfolios fromsecurities to loans, to have more assets and loans per dollar of equity, and to raise additionaluninsured purchased funds at reduced rates. This evidence is consistent with a more diversifiedportfolio that allows institutions to shift to a higher risk-return frontier. Other studies that do notdirectly focus on M&As have found consistent results.54
This research suggests that consolidation of banks within the United States is likely to lead toreductions in risk due to geographic diversification. However, to the extent that largerorganisations tend to take on larger risk exposures to individual obligors or industries, or tend totake part of the diversification gains as the opportunity to make higher risk investments, thereductions in total risk may be offset. 55
Geographic risk diversification from international consolidation
There may be greater risk diversification benefits, on average, from cross-border consolidationthan from within-nation consolidation, because nations can differ greatly in theirmacroeconomic cycles and their monetary and fiscal policies.
Unfortunately, there is little research that tests whether this potential for diversification benefitshas been exploited. Correlations of bank returns on equity across nations suggest strongdiversification possibilities for US banking organisations venturing abroad. Banksheadquartered in the United States tend to be more profit-efficient than other banks both athome and in other nations. Most of the US efficiency advantage is on the revenue side of theincome statement, rather than the cost side. Although it is difficult to disentangle the causes ofthese efficiencies, the results are consistent with the hypothesis that at least some US bankshave been successful in taking advantage of international risk diversification.56
50 See eg McAllister and McManus (1993), Hughes, Lang, Mester and Moon (1996 and 1999), Demsetz andStrahan (1997) and Hughes and Mester (1998).
51 See Benston, Hunter and Wall (1995).52 X-efficiency measures how close the performance of a firm is to the performance of a best-practice firm facing
the same exogenous conditions.53 See Akhavein, Berger and Humphrey (1997) and Berger (1998).54 See Berger and Mester (1999) and Hughes, Lang, Mester and Moon (1999).55 Note that some of these gains from geographic diversification of risks may be achieved without consolidation.
Institutions may engage in cross-regional lending or investments, or buy and sell financial instruments in nationalsecondary markets (eg mortgage pools, securitised commercial loans and derivatives).
56 See Berger, DeYoung, Genay and Udell (2000).

130
Product diversification
For analysing the effects of product diversification, the focus is on evidence regardinguniversal-type consolidation, where the change in product mix is most substantial. Universal-type consolidation may diversify risks (ie lower variations in earnings for given expectedearnings) because the returns across different financial services industries may be less highlycorrelated than the returns within a single industry alone. However, consolidation with othertypes of financial firms could increase the risk of a banking organisation (ie raise variations inearnings for given expected earnings) if the other activity has low expected earnings, highvariation of earnings, or a low capital ratio.
Again, there is relatively little research on this topic. Some simulation-type studies combine therates of return earned by different types of assets in US institutions and mostly find relativelylimited potential for diversification benefits.57 A study of US banks and bank holding companysecurities affiliates similarly found very limited diversification benefits.58
Managerial efficienciesTo examine the managerial efficiency implications of consolidation, this section reviewsevidence on all three of the main types of consolidation – consolidation of large bankingorganisations in the United States, universal-type consolidation and international consolidationof US banking organisations.
The consolidation of banking organisations can create cost scale efficiency gains through sucheffects as spreading fixed costs over more units of output, taking better advantage oftechnology, and issuing securities in larger sizes. Alternatively, consolidation may result in costscale efficiency losses by creating organisational diseconomies in managing the largerorganisation. Most empirical research has found that the average cost curve in the United Stateshas a relatively flat U-shape, with medium-sized banks slightly more cost scale efficient thaneither large or small banks. For a detailed review of the evidence on scale economies, seeChapter V.
Universal-type consolidation may create the potential for changes in scope efficiency, or howwell joint producers perform relative to specialists under the same exogenous conditions. Costscope efficiency gains from consolidation may for example occur through sharing physicalinputs, information systems, or databases. As noted in Chapter V, research on scope efficiencywithin a single category of financial institution in the US usually finds very little evidence ofsubstantial cost scope economies or diseconomies within the financial sector.
International consolidation may involve any or all of scale, scope, or X-efficiency effects. Asnoted in Chapter V, limited research suggests some international diffusion in efficiency.
Operating risk
The term “operating risk” is a somewhat ambiguous concept that can have a number ofdefinitions. Here the focus is on risks created because senior management cannot fully monitorand control its employees, creating the possibility of losses due to “mistakes” such as operatingerrors, fraud, crime, and unintended credit and market risks. The potential effects ofconsolidation on the operating risk of financial institutions are of concern because operatingfailures can quickly create losses that affect an institution’s financial condition. Nonetheless,operating risk is the least understood and least researched contributor to financial institutionrisk. Also, operating failures occur relatively infrequently, and data on the internal operations of
57 See eg Kwast (1989), Rosen, Lloyd-Davies, Kwast and Humphrey (1989), Boyd, Graham and Hewitt (1993) andSaunders and Walter (1994).
58 See Kwan (1997).
131
a financial institution are typically not publicly available. Studies of bank risk and failuretypically use balance sheet and income statement ratios, which are not useful indicators offinancial institutions’ internal operations.
However, it is reasonable to conjecture that operating risk might increase with all three of themain types of consolidation, ceteris paribus.59 For consolidation of large banking organisationsin the United States, the potential for managerial inefficiencies in operating and monitoring theinstitution arising from the organisational diseconomies associated with size and geographicdistance also apply to operating risk.
As the organisational and geographic distance between senior management and individualemployees grows, additional layers of management and policies and procedures tend to replacedirect supervision, and may reduce managerial control. The disruptions from the M&A processitself may also contribute to difficulties in supervising employees who may not perform exactlyas intended by management.60 These same problems in monitoring and controlling employeeswho may create operational problems might occur for universal-type consolidation.Organisational diseconomies might be relevant for universal banks if senior management teamsstray from their areas of core competency. International consolidation may create the same typesof organisational difficulties in controlling operating risks as domestic consolidation. The largerdistances and differences in time zones associated with operating international organisationsmay exacerbate these problems. Also, differences in language, culture andregulatory/supervisory structures faced by foreign affiliates may make it even more difficult tomonitor and control employees who may create operating failures.
Market power rentsIf consolidation increased a firm’s market power, the resulting increase in franchise value,equivalent to an increase in capital, could lower the firm’s risk profile. Indeed, such a viewseemed to underlay restrictions on competition, such as severe limitations on intra- andinterstate banking, that prevailed in the United States over much of the 20th century. In the longrun, however, it may well be that a competitive and flexible banking and financial system ismore stable.
In any event, research suggests that consolidation of US banking organisations has had and islikely to have only minor effects on market power for three reasons. First, most types of M&Asdo not increase local market concentration significantly, and local markets are where marketpower rents are most likely to occur. Second, antitrust authorities and potential market entrantsare likely to restrain the exercise of substantial market power. Third, deregulation, advances inapplied finance and technological change may be increasing the degree of competition in localbanking markets.61
ConclusionsExisting research suggests some potential for both reductions and increases in the risks ofindividual US financial institutions from consolidation, and thus no unambiguous conclusioncan be drawn. The greatest potential for risk reduction appears to be from geographic
59 As with other types of risk, technological improvements in risk management may offset potential increases inoperating risk. Again, the discussion here is focused on the partial effects of consolidation.
60 As it becomes more difficult to monitor and control individual employees, risks from operating errors, problemsin monitoring the credit risk of counterparties and difficulties in monitoring intraday credit exposures in thepayment system (eg Herstatt risk) might be more severe for large merged institutions. In addition, unintendedoverexposures to one industry, one nation, or one region (eg East Asia in 1997) fraudulent or criminal activities,and large, unauthorised or unwise positions in financial markets might all be more likely to occur.
61 See Chapter V for a more comprehensive discussion of the effects of consolidation on competition.

132
diversification of risks from the consolidation of large banking organisations in the UnitedStates and (especially) international consolidation of US banking organisations. Some limitedbenefits from product diversification may also occur as a result of universal-type consolidation.Modest managerial efficiency gains are also possible from all three types of consolidation,which could lower risk by increasing expected returns, pushing up the efficient risk-returnfrontier, and providing more of a buffer against variation in returns. However, the managerialefficiency benefits appear to be less likely for universal-type consolidation, which could createscope diseconomies if managers stray too far from their areas of core competence. Because itdoes not appear likely that consolidation has led to systematic increases in market power in theUnited States, any resulting economic rents are unlikely to have had substantial effects onindividual bank risk.
Increases in risk from consolidation might arise from operating risks due to the difficulty ofmonitoring and controlling the actions of individual employees in the consolidatedorganisations. This potential for harm might be more likely for universal-type and internationalconsolidation, where there are greater organisational and geographic distances between seniormanagement and employees. Organisations might be vulnerable to this kind of risk throughoperating error, failure to monitor credit risks and risk concentrations, fraudulent or criminalactivities, or through exposures to unintended market risk. Yet, advances in risk managementtechniques brought about by technological progress may counterbalance the potential for anincrease in operating risk following consolidation.
Systemic risk
In the United States, concerns regarding systemic risk have focused traditionally on theimplications of bank deposit runs for the payment system, the money supply and financialintermediation. However, the advent of deposit insurance, an understanding of the need tomaintain an adequate supply of money and money market liquidity, and the development ofprudential supervision and regulation have essentially eliminated the threat of deposit runs byretail customers (primarily households and small businesses) of insured depository institutions(commercial banks, thrifts and credit unions).62 Indeed, systemic deposit runs and flights tocurrency have not occurred in the United States (or any other G10 nation) since World War II.As a result, discussion of systemic risk has shifted more to consideration of issues raised at thewholesale level.63 This refocusing has been reinforced by the forces causing changes in the USand global financial systems discussed in Chapter II. For all of these reasons, the discussionbelow concentrates on attempting to identify the potential effects of financial consolidation onsystemic financial risk that may arise in the institutions and markets that provide wholesalefinancial services.
Creation of firms that may be “too big to fail”, liquidate, or discipline effectivelyThere is no doubt that the evolution of financial institutions and markets, including theirconsolidation as defined in this study, has created larger and more complex bankingorganisations in the United States. Indeed, these developments have caused the Federal Reserve
62 Estimates from the Federal Reserve Board’s 1998 Survey of Consumer Finances indicate that only 2% of UShouseholds that hold deposits have uninsured deposits in US depository institutions. Uninsured deposits areestimated to represent about 14% of total US household deposits. For more details on the 1998 Survey ofConsumer Finances see Kennickell et al (2000).
63 Wholesale financial services generally encompass the provision of intermediation, investment banking, securitiestrading, asset management and payments services to corporations and other institutions. Excellent discussions ofthe changing nature of systemic risk are found in Bank for International Settlements (September 1998) andChapter IV of International Monetary Fund (1999).

133
to define a category of financial institutions called large, complex banking organisations, orLCBOs. In general, LCBOs (i) have significant on- and off-balance sheet risk exposures,(ii) offer a broad range of products and services at the domestic and international levels, (iii) aresubject to multiple supervisors in the United States and abroad, and (iv) participate extensivelyin large-value payment and settlement systems.
The set of LCBO banking organisations is not homogeneous, and even simple comparisonsreveal clear variations in business mix. The LCBOs may be divided roughly into five “peer”groups that also correspond approximately to a declining degree of complexity. “ActiveTrading” firms are distinguished from the others in terms of their trading and derivativesactivities, as well as in other dimensions such as global and custodial activities. Thecharacteristics of “Second Tier” companies resemble some aspects of the Active Trading firms,but with somewhat less across-the-board prominence. A group of “Trust and Custody”organisations have substantial fiduciary businesses and a range of complex trading or otheractivities that support those businesses. A “Cusp” set of banking organisations withpredominantly traditional activities have commenced speciality businesses and expanded inways that make them look somewhat like the Second Tier firms. Lastly, a group of relativelymore “Traditional Intermediaries” continue primarily to fund themselves with deposits andmake loans.
Despite their prominence, it would be seriously misleading to apply the term “too big to fail” tothe LCBOs. It is the explicit policy of the US bank supervisory agencies that no bankingorganisation is too large to fail in the sense that it can be required to contract assets, divestaffiliates, cut dividends, replace management, sell or close offices, and the resultant entity orentities be sold to another institution. Nor is there any commitment to assure payment, let alonefull payment, to any uninsured depositor or other non-deposit creditor of any bank, bankholding company, or financial holding company. Given this policy, the practical challenge facedby US bank supervisors is how to achieve the orderly closure or “wind-down” of a troubledLCBO without raising systemic concerns. The changed nature of the problem is also illustratedby the fact that probably the most complex large banking organisation wound down in theUnited States was the Bank of New England Corp. Its USD 23 billion in total assets (USD27.6 billion in 1999 dollars) in January 1991 when it was taken over by the government pales incomparison to the total assets of the largest contemporary firms (eg in December 1999Citigroup had USD 716.9 billion and Bank of America Corp had USD 632.6 billion).
From the perspective of this section of the study, the key issue is therefore: Has consolidation,defined to include both increases in size and complexity, increased the risk that the failure of anLCBO would be disorderly?64
The answer to this question is complex, and no one can say precisely how the sundry and oftensubtle arguments should be weighed. Indeed, the answer to the question will surely depend onthe exact nature of a given systemic risk event, each of which will inevitably have a number ofidiosyncratic characteristics. Having said this, there are reasons to believe that financialconsolidation as it has evolved in the United States has increased the risks that the failure of anLCBO would be disorderly.
The resolution of LCBOs has become more difficult and uncertain as the corporate structure andrisk management practices of LCBOs have become, at least in part because of consolidationacross product and international borders, more complex. LCBOs frequently define theirprincipal business lines so that the same line is conducted in more than one of an individual
64 Note that the question assumes that an LCBO has failed, or is about to fail. Thus, the discussion here is concernedwith how consolidation has affected the probability of a disorderly workout, but not whether the probability of anLCBO failure has changed. The latter topic was addressed in part 1 of this section.
134
LCBO’s major legal entities.65 The LCBO generally manages those business lines withoutregard to a given line’s location in one or more legal entities, and the supporting managementinformation systems and corporate control functions tend to be structured along business linesand not legal entities. The result may be a financial institution with substantial intragrouptransactions and exposures that may be difficult to disentangle.
The complexities are magnified when the LCBO has significant international activities and themanagement and control structures straddle national borders as well as legal entity lines. Forexample, conflicting approaches to bankruptcy across countries and the possibility that hostcountry supervisors will “ring-fence” portions of troubled institutions are long-standing,unresolved issues. In addition, OTC derivatives and foreign exchange activities may haveoffsetting positions that extend across both domestic and foreign legal entity lines. Anothercomplicating factor is that several large US banks, including several that are LCBOs, are nowowned by foreign banks. Although the US chartered banks would be subject to FDIC insolvencyproceedings in the event of their failure, stresses and conflicts are likely to arise in the event ofthe failure of the parent organisation.
Indeed, the complexity and uncertainty of the overall legal conventions governing a failureresolution in the United States have almost surely been heightened by financial consolidation.While the FDIC will, as always, be the receiver of a failed insured depository institution, theparent holding company and most other non-bank entities, which may have become much moreprominent as a result of consolidation, will be subject to a US Bankruptcy Code proceeding. Anexception is a broker-dealer that is part of a consolidated financial services holding company; itwould be liquidated under the Securities Investor Protection Act. In addition, an EdgeCorporation, which is usually a subsidiary of a bank, could be liquidated under either theBankruptcy Code or the Federal Reserve Act by the Federal Reserve Board. And, as suggestedin the previous paragraph, it is currently unclear whether the foreign branch of a US charteredinsured depository institution would be liquidated by the FDIC or by a separate proceeding inthe nation where the branch is licensed.
The FDIC’s choice of resolution methods is constrained by the least cost resolution standardimposed by the FDIC Improvement Act (FDICIA) of 1991. Under least cost resolution, the totalcost to the FDIC must be the least costly method for meeting the FDIC’s insurance coverageobligations.66 One important factor is the relative size of domestic deposits in total liabilities.Domestic deposits are relevant because of the so-called “domestic depositor preference” of USlaw enacted in 1993. If domestic deposits are substantially less than the estimated realisablevalue of assets, liquidation may produce a net positive balance and thus result in no cost to theFDIC. Although such a scenario would not necessarily require a liquidation under the least costtest, at a minimum it would seem to complicate the choice of resolution methods in a systemicrisk situation.67 As a result, the probability of supervisors needing to invoke FDICIA’s so-called“systemic risk exception”, under which uninsured creditors can be protected, may haveincreased. However, because the exception has never been used, there is considerableuncertainty regarding how and when it might be applied.
65 Under the holding company structure prevalent in the United States, major legal entities are usually separatelyincorporated, but wholly owned subsidiaries of the holding company parent. In bank holding companies, thebank(s) is normally the primary asset of the holding company. As of the end of 1999, banking assets exceeded70% of total bank holding company assets at 17 of the 21 largest US BHCs, all of which were LCBOs. However,banking assets exceeded 95% of total assets at only seven of these institutions.
66 For a brief summary of FDICIA’s major provisions see FDIC (December 1997). Further discussion is containedin Benston and Kaufman (1997).
67 For example, if another resolution method would preserve more franchise value, the net cost to the FDIC could belower.

135
Consolidation across business lines has helped to complicate the failure resolution process inother ways. Historically in the United States, government-led resolution has generally workedwell for traditional banking intermediaries. However, new complications are likely to arise inmanaging some of the more “market-oriented” business lines that have become prominentactivities at some LCBOs, partly as a result of financial consolidation. Such lines would requirethat the resolution process address the fact that they need active day-by-day expert management,continuous access to markets and funding, and a high level of market confidence.
OTC derivatives and foreign exchange trading are probably the most important examples ofwhere resolution difficulties are likely to arise. These activities are highly sensitive to a bank’scredit standing and market sentiment, and thus become increasingly difficult to maintain andmanage as a bank’s financial condition deteriorates. For example, if a bank defaults on any of itsobligations, its counterparties in these markets may very quickly proceed to close out theirtransactions before the bank fails and the FDIC has a chance to intervene. An additionalcomplication arises because derivatives transactions are often booked centrally or in a limitednumber of locations, rather than in the legal entity that originated them.
Extensive participation by LCBOs in securities and insurance underwriting activities wouldfurther complicate the winding down of a troubled institution. For example, the near or actualfailure of an LCBO that was engaged in either or both activities as a major business line wouldraise issues of coordination among diverse supervisors and potentially conflicting supervisorypriorities.
Another reason why the probability of an LCBO resolution being disorderly may have risen isthe increased speed, observed in recent failures or near failures, at which a troubled LCBO islikely to decline. The speed of information dissemination via improved technology, and greaterreliance by LCBOs on capital markets for risk management and funding (markets where pricescan move quite rapidly), are contributing factors to strong and sometime late-emerging forces ofmarket discipline by creditors and counterparties.
Although it is not clear that consolidation per se is a major factor in the increased potential for arapid decline at an LCBO, it is possible that consolidation has played a role. For example, andas discussed in Section 1 of this chapter, the increased size and complexity of institutions mayhave reduced management’s ability, as well as that of the supervisor, to recognise the severity ofa problem and make hard decisions in a timely manner. As a result, problems that are notaddressed promptly have the opportunity to deepen, and now seem to deepen more rapidly.Similar arguments may be made with respect to other market participants. For example,although there have been improvements in the transparency of financial institutions in recentyears, the increased complexity of modern LCBOs can mask the full extent of an institution’sproblems from market participants, especially in the problem’s early stages.68 Such maskingtends to increase the probability of a rapid decline in an LCBO’s financial condition oncemarket participants realise the full extent of the institution’s problems.
Key characteristics of shocks that may become systemicThe likelihood of a shock becoming systemic, and the sizes of its impact and transmissioneffects, depend on firms’ interdependencies. Interdependencies can be classified as direct andindirect. Direct interdependencies arise from inter firm on- and off-balance sheet exposures.Large direct interdependencies, which might occur if firms have large bilateral exposures, maymake the impact and transmission effects of a shock to a set of firms large enough to becomesystemic. Indirect interdependencies can arise from correlated exposures to non-financialsectors and financial markets. If firms have highly correlated exposures to some non-financial
68 The impact of consolidation on the transparency of financial institutions is discussed more fully below.
136
sectors or financial markets, a shock originating in one sector could have an impact largeenough to become systemic.
An assessment of the potential impacts of consolidation on the vulnerability of the financialsystem to systemic risk requires measures of consolidation, measures of financial firms’interdependencies, and some means of relating such measures. As previously observed,detecting the existence of a causal relationship between consolidation and interdependencies isdifficult, since it requires the explicit consideration of all relevant factors that affectinterdependencies. To the best of our knowledge, a detailed analysis of the potential causal linksbetween consolidation and interdependencies is unavailable for US financial firms, and such ananalysis is outside the scope of this study.
Instead, this section focuses on measures of firms’ interdependencies and on their correlationswith a measure of consolidation. The finding of an increase (decrease) in interdependencies maysignal an increase (decrease) in systemic risk. Moreover, if an increase in interdependencies anda positive correlation between interdependencies and consolidation were detected, this findingwould suggest consolidation as a possible driving force of increases in systemic risk.Conversely, discovery of no or negative correlation would be consistent with the view thatsystemic concerns had not increased or had even declined. Although the finding of a significantpositive or negative correlation would not necessarily imply that consolidation is a cause ofinterdependencies, consistently strong correlation results would be quite suggestive.
A sample of US-chartered and -owned LCBOs is considered. As was the case in the previoussubsection, attention is restricted to LCBOs because difficulties at these firms are those mostlikely to raise systemic concerns in the United States today. Data for the LCBO sample extendfrom 1988 to end-1999. Accounting data are taken from the Federal Reserve’s NationalInformation Center (NIC) database at the bank holding company level. Sample selection anddata construction proceeded in two steps. First, the 18 US-chartered and -owned LCBOs inexistence on 31 December 1999 were included. Second, inspection of the sample led to theaddition of four more LCBOs that did not “officially” exist at the end of 1999, but which, in ourjudgement, existed for a long enough proportion of the sample period to be included in thesample.69 The resulting sample consists of 22 LCBOs.
The importance of the sample LCBOs has increased substantially in recent years. For example,their share of assets as a fraction of the assets of US commercial banks and savings and loansgrew steadily from about 21% in 1988 to 54% in 1999. Both the aggregate of the LCBOs andfive subsets are examined, with firms classified according to the five “peer” groups describedpreviously.70
In order to measure consolidation, a proxy measure of consolidation events is constructed and ameasure of consolidation intensity is derived. Consolidation events for an LCBO are measuredby the yearly percentage growth of its assets minus the yearly percentage growth of assets in theentire banking system. For the sample of LCBOs considered, this measure is a good proxy oftheir net acquisition activity since LCBO internal growth is close to the asset growth of theentire banking system.71 Consolidation intensity for an LCBO in a given period is defined as thesum of its consolidation events across all years during the period. Accordingly, consolidationintensity for the LCBO aggregate is measured by the cumulative percentage rate of growth of
69 In order to deter inappropriate comparisons, specific LCBOs are not identified.70 Again, the classification of firms as Active Trading, Second Tier, Trust and Custody, Cusp, and Traditional
Intermediaries can be viewed as roughly ordering firms according to their decreasing degree of complexity.71 For the sample LCBOs considered, inspection of the data indicates that any completed acquisition recorded by
the National Information Center database is matched by a jump at the same date in an acquirer’s yearly assetgrowth. Moreover, estimates of annual rates of growth of LCBO’s assets net of jumps are on average close to andnot greater than the banking system’s asset growth.
137
the group’s assets since 1988 minus the cumulative percentage rate of growth of assets of theentire banking system.72 For the peer groups, consolidation intensity is multiplied by the group’sshare of LCBO assets in order to measure the impact of a group’s consolidation intensityrelative to the consolidation intensity of all LCBOs.
Chart III.1 shows consolidation intensity for the LCBOs (graph 1) and for each peer group(graphs 2-6). As shown in graph 1, LCBO consolidation intensity has steadily increased since1988, with a sizeable jump in 1997. Consolidation intensity has been the highest for ActiveTrading and Second Tier firms (graphs 2 and 3), followed by Cusp and TraditionalIntermediaries (graphs 5 and 6). Consolidation intensity for Trust and Custody firms has beenthe lowest among LCBOs (graph 4).
The next two subsections document the time patterns of various measures of interdependencyduring the 1988-99 period, and examine the correlations between firm consolidation intensityand measures of firm total and direct interdependency. Correlations are measured by correlationcoefficients between consolidation intensity and “gross” measures of interdependency, as wellas between consolidation intensity and the yearly deviations of interdependency measures fromtheir pooled annual means (herein also called “de-meaned” measures).
The correlations between gross measures of interdependency and consolidation intensity embedeffects common to all firms, as well as group- or firm-specific-effects. Because they measuretotal effects, these correlation coefficients are probably the most relevant for assessing thepotential for systemic risk. The correlations between deviations of the interdependencymeasures from their pooled means and consolidation intensity are likely to capture primarilyfirm- or group-specific effects, since effects common to all firms are (partially) embedded in thetime evolution of the pooled annual mean correlation.73
Total interdependencies
Total (direct plus indirect) interdependencies are measured by the cross-correlation structure ofLCBO percentage changes in stock prices. Stock prices are ideally suited to this purpose, sincethey reflect market participants’ collective evaluation of the future prospects of the firm,including the total impact of its interactions with other firms.
For each year in the 1989-99 period, cross-correlations of weekly percentage changes in stockprices (herein also called returns) are computed for each of the 22 sample LCBOs. The averagecross-correlation in each year for LCBOs is given by the average taken over all LCBOs’ cross-correlations. For each of the five peer groups, the average cross-correlation is obtained byaveraging the correlation figures of each firm in a peer group.
Chart III.2 shows the average cross-correlation time series for the LCBOs (graph 1) and for eachpeer group (graphs 2-6). Graphs 2-6 also depict the time series of deviations of a group’scorrelations from the LCBO average, indicated with a dotted line. As may be seen in graph 1,until 1995 average LCBO stock return cross-correlations fluctuated significantly, but overallrose only modestly. Since 1995, however, cross-correlations have increased markedly. Inparticular, the average LCBO stock return cross-correlation jumped about 28%, from an averageof 0.42 during 1989-94 to an average of 0.54 during the 1995-99 period, a difference that isstatistically significant at the 5% level.
72 Consolidation intensity can be also viewed as a proxy of the cumulative change in the market share of LCBOsdue to consolidation, since internal growth and net firms’ entry in the industry during the sample period havebeen approximately constant.
73 Results similar to those presented below were obtained with measures of interdependencies net of the impact ofthe macroeconomic cycle (as measured by levels and variability of GDP growth, inflation and short-and long-term interest rates), as well as with correlations of measures of interdependencies and consolidation intensity bothexpressed in deviations from their pooled annual means.

138
Graphs 2-6 indicate that the dynamics of stock return cross-correlations for each peer group arerather homogeneous. However, cross-correlation levels do differ somewhat across groups. Theaverage deviation from the LCBO average during the entire period is positive for ActiveTrading firms, albeit significant only at the 10% significance level. For Trust and Custodyfirms, average deviations from the LCBO average are negative and significant at a 5%significance level. Notice that the Trust and Custody firms are those that exhibit the lowestconsolidation intensity among LCBOs. For all other groups of LCBOs, average deviations arenot significantly different from zero.
Table III.2 presents correlation statistics between average yearly firm-specific stock returncross-correlations and yearly firm-specific measures of consolidation intensity. As shown incolumn [1], LCBO average stock return cross-correlations are positively and significantlyassociated with consolidation intensity. However, an important difference emerges among peergroups. All peer groups exhibit positive and significant correlations except the Trust andCustody firms, which exhibit a negative and significant correlation. Again, these firms areprecisely those firms whose consolidation intensity is the lowest among LCBOs. Looking at thede-meaned correlations (column [2]), stock return cross-correlations are still positively andsignificantly associated with consolidation intensity for the full LCBO sample. However, suchpositive average correlation mainly captures the positive and significant correlations of ActiveTrading, Second Tier and Traditional Intermediaries firms, since the correlation for Trust andCustody firms is still negative and significant, and that of the Cusp firms is not significantlydifferent from zero. Interestingly, the Active Trading and Second Tier firms are precisely thosefirms whose consolidation intensity is the highest among LCBOs.
On balance, this evidence on total interdependencies suggests three general conclusions. First,total LCBO interdependencies, as captured by stock return cross-correlations, have significantlyincreased on average and for each peer group, particularly since 1995. Second, totalinterdependencies are positively (and significantly) correlated with consolidation intensity forthe aggregate of the LCBOs. Third, the positive correlations between total interdependency andconsolidation intensity appear to be the strongest for those firms where the degrees ofcomplexity and consolidation intensity are greatest.
Direct interdependencies
Direct interdependencies, and their relationship to consolidation, are examined throughmeasures of firms’ exposures to (i) short-term interbank lending, (ii) medium- to longer-terminterbank loans, and (iii) derivatives activities. Interbank lending exposures are clearly apotentially important channel through which difficulties arising in one bank may affect and betransmitted to the financial system with potentially adverse systemic consequences.74
Since 1995 the growth of derivatives markets and banks’ activities in these markets has beendramatic.75 In particular, the global volume of OTC trading of derivatives instruments rose morethan thirtyfold between 1988 and 1998, with explosive growth in the last five years. By contrast,the size of exchange-traded markets increased a still impressive tenfold during 1988-98. Asdetailed in the previous section, OTC derivatives exposures are a likely spot for resolutiondifficulties to arise at large and complex banking organisations.76
74 Furfine (1999) and Bernard and Bisignano (2000) are among recent analyses assessing systemic risk arising indomestic and international interbank markets. Again, the potential effects of consolidation on interdependenciesthat arise through payment and settlement systems are discussed in Chapter VI.
75 See Bank for International Settlements (1999a).76 For an extensive discussion of OTC derivatives markets and their relevance for international financial markets
and systemic risk see Chapter IV, OTC Derivatives Markets, in International Monetary Fund (2000).

139
All measures of exposure are expressed as percentages of equity capital. Since the focus of thischapter is on risk, exposure-capital ratios are a straightforward summary measure of riskassociated with exposure.
Short-term interbank lending
The evolution of short-term interbank lending as a fraction of firms’ total equity capital isillustrated in Chart III.3 for all LCBOs (graph 1) and the peer groups (graphs 2-6). For ease ofcomparison, in graphs 2-6 the total LCBO short-term interbank lending-capital ratio reported ingraph 1 is plotted as a dotted line. The interbank lending-capital ratio for the LCBOs has risensteadily since 1989, increasing about 57% from 70% of capital in 1989 to 110% of capital in1999. It is important to note that total short-term interbank lending exposures have increasinglyconcentrated in LCBOs. In fact, short-term interbank lending-capital of all US commercialbanks has decreased at an average rate of 2% per year during the 1991-99 period. Thus,interbank lending exposures of non-LCBOs have decreased significantly.
Differences among the peer groups are noteworthy. The level of the short-term interbanklending-capital ratio is highest for the Active Trading Firms, followed by the Trust and Custodygroup, and is approximately the same for the remaining three peer groups. Indeed, this ratio hasincreased sharply for the Active Trading firms and mildly for the Second Tier firms, has goneup substantially only in the last four years for the Trust and Custody firms, and has remainedflat for the remaining two groups. Thus, direct interdependencies through short-term interbanklending exposures relative to capital have increased for the highest and medium complexityfirms.
Panel A in Table III.3 reports measures of correlation between consolidation intensity and short-term interbank lending exposures. The correlation between short-term interbank lending-capitalratios and consolidation is positive and significant for the aggregated set of LCBOs (column[1]). Breaking the sample into peer groups, this correlation is positive and significant for SecondTier, Trust and Custody, and Cusp firms, and negative and significant for TraditionalIntermediaries. These relationships hold for both interbank lending-capital ratios and theirdeviations from the pooled annual mean (column [2]) with the exception of Second Tier firms.Thus, the interbank lending-capital ratio is positively and significantly correlated withconsolidation intensity for the peer groups of medium complexity. Note, however, that apositive and significant correlation between short-term interbank lending and consolidationintensity is found both for those peer groups that exhibit a relatively high level of consolidationintensity (Second Tier and Cusp) and for the group with the lowest level of consolidationintensity (Trust and Custody). In addition, the Trust and Custody firms exhibit the highestpositive correlation among groups. This suggests that other factors beyond consolidation mightbe at work as driving forces of trends in short-term interbank lending.
Medium- to longer-term interbank loans
Chart III.4 illustrates the evolution of exposures to medium- to long-term loans to all banks(solid line) and to foreign banks (dotted line), expressed as a percentage of equity capital, for allLCBOs (graph 1) and the peer groups (graphs 2-6). As shown in graph 1, this ratio of loans tobanks-capital has decreased on average. This drop is primarily due to the reduction of loans todomestic banks. The dynamics of these ratios are similar among firms that have lent the most toother banks (Active Trading, Second Tier and Trust and Custody), and are relatively flat for theother two groups, for whom this type of lending activity is quite small.
Panel B of Table III.3 reports measures of correlation between consolidation intensity and theratio of medium- to long-term interbank loans to capital. The data exhibit no positive andsignificant correlations between consolidation intensity and direct interdependencies throughmedium- to long-term lending to banks. Indeed, the gross correlation is significantly negativefor the Active Trading firms. Thus, these results suggest that this measure of interdependencyhas not been affected by consolidation.
140
Derivatives activities
The final measure of direct interdependency uses exposure data on derivatives activities.Derivatives activities include OTC and exchange-traded interest rate, foreign exchange, equityand miscellaneous other contracts. Where relevant, exposures on futures, forwards, options andswaps contracts are included. Up until about 1995 exchange-traded contracts were the mostcommon type, but in the second half of the 1990s, OTC contracts came to dominate. Exposuresare measured by gross positive market values: the sum of the market values of all contracts thatare in a gain position at current market prices as of the reporting date. Thus, gross positivemarket value is a proxy indicator of exposure to counterparty credit risk, because it measures allclaims on counterparties if all of a firm’s outstanding contracts were settled at the reportingdate. As before, exposure is measured relative to a firm’s equity capital.
Chart III.5 shows the ratio of gross positive market value to capital for all LCBOs (graph 1) andthe peer groups (graphs 2-6) for the 1995-99 period, the only period for which data for allLCBOs are available.77 For the LCBOs (graph 1), this ratio increased through 1998 and thendecreased markedly. The decrease is due to the sharp reduction in the ratio of the ActiveTrading firms (graph 2), whose gross positive market value is the bulk of total gross positivemarket value for LCBOs. The 1999 reduction in gross positive market value was caused by asevere reduction in foreign exchange contracts. This reduction was due in part to lower foreignexchange volatility in 1999 compared to 1997 and 1998, as well as to the introduction of theeuro and the unwinding of positions following the Russian crisis in August 1998 and itsinternational repercussions.78
The time pattern of the ratio of gross positive market value to capital of Second Tier and Cuspfirms (graphs 3 and 5) is similar to that of Active Trading firms (graph 2). The time patterns ofTrust and Custody and Traditional Intermediaries ratios differ from those of Active Tradingfirms only in 1999. In addition, although all groups exhibit impressive increases in theirderivatives exposures during 1995-99, relative to capital the Active Trading firms aresubstantially more exposed than the other groups. Still, direct interdependencies throughderivatives exposures have increased substantially across all peer groups in recent years.
Panel C of Table III.3 reports measures of correlation between consolidation intensity and theratio of gross positive market value of derivatives positions to capital. The correlation betweenthis ratio and consolidation intensity (column [1]) is positive and significant for the aggregateLCBO ratio. Such positive correlation is also found for deviations of gross positive marketvalues from the pooled LCBOs’ annual mean (column [2]). As far as peer groups are concerned,the correlation of the ratio of gross positive market value to capital with consolidation intensityis positive and significant only for the Trust and Custody firms and for the Cusp firms. Suchcorrelation is positive only for the former group when the correlation of deviations of this ratiofrom the pooled annual averages is considered.
Summary
The evidence presented here suggests two general observations regarding directinterdependencies among LCBOs. First, average LCBO direct interdependencies through short-term interbank lending and derivatives exposures have increased substantially during the timeperiod considered. Second, there is reason to believe that direct interdependencies aresignificantly and positively related to consolidation through short-term interbank lending andderivatives activities. Such evidence appears particularly robust for firms of mediumcomplexity.
77 For the sake of readability, each graph has a different vertical scale.78 See Bank for International Settlements (1999b).

141
Degree of transparency of firms and markets and the role of market discipline
The evolution of large and increasingly complex financial institutions raises the question ofwhether private market participants’ abilities to assess these firms’ financial conditions havekept pace. The issue is important for at least two reasons. First, efficient financial markets ingeneral, and effective market discipline in particular, require well-informed creditors,counterparties and market-makers. Put differently, high levels of market ignorance anduncertainty can be destabilising under any circumstances. But they can be especially dangerousin a potential systemic risk situation because ignorance and uncertainty increase the probabilityof liability runs, institutional and market illiquidity, and irrational contagion.79 Second, ifsupervisors want to rely in part on market discipline to control risk-taking at financialinstitutions, then it becomes even more critical that market participants be well-informed.
As with all of the topics discussed in this section, it is extremely difficult to identify the “pure”effects of consolidation on firm and market transparency and the associated role of marketdiscipline. On the one hand, the increasing size, complexity and international nature of manyfinancial institutions have sparked widespread recognition of the need for enhancedtransparency, and both the public and private sectors have taken an impressive variety ofinitiatives. On the other hand, discussions with institutional investors and market-makerssuggest considerable room for improvement. In the light of these uncertainties, in mid-1998 theFederal Reserve began a major study of ways to improve public disclosure in banking andthereby augment market discipline. The results of this research were recently published as aStaff Study, and the discussion in this section relies heavily on this effort. 80
Public disclosure in the United States, with its combination of regulatory requirements andprivate sector initiatives, generates a substantial amount of information for assessing thefinancial condition and risk of banking organisations.81 The process has demonstratedresponsiveness in the face of changes in the financial services sector. Indeed, in interviewsconducted for the Federal Reserve Study with securities analysts, institutional investors andrating agencies, respondents tended to compare bank disclosures in the United States favourablywith those of non-banks as well as with those of banks abroad.
Nevertheless, the Federal Reserve Study identified six areas where improved disclosures may beappropriate for banking organisations operating in the United States. These include risksretained in securitisations and loan sales, the distribution of assets by internal risk rating,explanations of loan-loss reserve calculations and adequacy, credit concentrations bycounterparty, industrial sector, or geography, market risk, and risk by legal entity and businessline.
Most of the items on this list appear to have more to do with the increased complexity ofbanking organisations and financial markets, including the ongoing blurring of traditionaldistinctions between different types of financial intermediation, and less to do with increasedsize or even a higher level of international activity. For example, securities analysts stronglyrecommended that banks disclose how much risk they retain in securitisations of bank assetsand loan sales, including information relating to so-called bankruptcy-remote vehiclessponsored by banks. Analysts also recommended that banks report more information abouthedges using credit derivatives, a financial innovation that appears only tangentially related tofinancial consolidation per se. Still, complexity and size can be complementary. For example, itis widely believed that certain complex market activities require a rather large minimum scale tobe viable business lines.
79 Bank for International Settlements (September 1998), pp 27-28 also discuss this point.80 See Board of Governors (March 2000).81 See Board of Governors (March 2000), especially appendices D, E, F and G.

142
As US banks have grown in size and complexity, many of the largest have begun to developincreasingly sophisticated internal systems for rating the credit risk of assets.82 The developmentof such systems can probably be attributed in some degree to financial consolidation, althoughfinancial innovations (such as the increasing ability to separate risk into its component parts)and vast reductions in the cost of data processing have almost certainly played larger roles.Disclosure of the distribution of a bank’s assets, both on- and off-balance sheet, according to itsinternal ratings of risks would provide the market with much more detail of a bank’s assessmentof its risk profile than is currently available. Interestingly, although some of the largest bankingorganisations provide information on the credit quality of their OTC derivatives counterparties,disclosure of comprehensive information on risk categories of loans is unusual.
Another area of bank transparency that has been affected directly by consolidation is the needfor more information on concentrations of exposures by counterparty, by industrial sector andby geographic area. Such disclosures would help market participants determine if financialorganisations that have increased their potential for diversification have in fact become morediversified. A good example is the need for more detailed disclosure of information on thegeographic distribution of assets, especially by large multistate financial institutions in theUnited States.
The growth of financial markets, and particularly the increased level of bank participation inthose markets over the past decade, raises the issue of whether public disclosures of marketactivities by banks and other financial institutions are adequate. A case study conducted toassess financial disclosures of trading activities at nine large bank holding companies andinvestment banks examined the usefulness of the information disclosed on trading accounts inconnection with the financial market turmoil associated with the Russian default in the thirdquarter of 1998.83 The review raised some questions about the current state of public disclosure.First, it is clear that disclosures regarding market risk vary considerably among institutions.Second, there appears to be little connection between the degree of risk as suggested by value-at-risk (VaR) disclosures by firms and their actual trading account performance in the wake ofthe 1998 financial shock. Although this case study is only suggestive, these results appearconsistent with views of market participants.
Similar conclusions were reached by a presidential report.84 It concluded that the central publicpolicy issue raised by the Long-Term Capital Management (LTCM) episode was excessiveleverage. However, it also concluded that another key aspect of the problems raised by LTCMwas the breakdown of market discipline, caused in part by the complexity and the resultingopacity of LTCM. It recommended that both the public and private sectors take action toimprove market discipline by improving the quality of information on the risk profiles of hedgefunds and certain other highly leveraged institutions provided to market participants.
US financial markets demand information both at bank level and by lines of business. Thedemand for bank-level data in part reflects the need by creditors to assess banks as separatelegal entities. As indicated earlier, however, activities of US LCBOs are frequently organised ona line-of-business basis that cuts across legal entities within the holding company. Securitiesanalysts, investors and the rating agencies express a desire for more information related tobusiness lines.85 They emphasise that as large banking organisations expand the scope ofservices they offer, disclosure by business lines is becoming even more crucial for assessingbank and financial services holding companies. This is clearly the case regarding very different
82 See Treacy and Carey (1998) for an excellent discussion of the state of the art in the US.83 See Board of Governors (March 2000), pp 12-13 and Appendix G.84 See United States (1999).85 See Board of Governors (March 2000).
143
activities, such as insurance and commercial lending. However, a problem will arise as theactivities of bank subsidiaries overlap more with the activities of non-bank subsidiaries of thesame holding company. In such cases, disclosures along business lines are less informativeabout the bank subsidiaries.
As US financial institutions and markets have evolved, and especially as banking organisationshave become larger, more complex, and more involved in both domestic and internationalfinancial markets, interest in using market discipline as a supplement to government supervisionand regulation has increased. Indeed, market discipline has been enshrined as one of the “threepillars” for controlling bank risk-taking by United States and other G10 bank supervisors.86
Because market discipline can only be effective if market participants are well-informed,government authorities have expressed considerable interest in improved disclosure.87 Ifinitiatives in this area proceed and are successful, financial consolidation can, at least from thisperspective, be said to have stimulated market discipline.
Another area where the increased breadth and complexity of financial activities have increasedmarket discipline is derivatives and foreign exchange trading. For example, a substantial andgrowing portion of trading activities are subject to mark-to-market collateral agreements,exchange-traded derivatives are subject to margin requirements, and OTC derivatives areincreasingly collateralised. In addition, transactions in the OTC markets (derivatives, repos andsecurities loans) are documented under master netting agreements that allow counterparties toclose out transactions, liquidate collateral, and net the amounts owned if a default occurs.
On balance, a case can be made that financial consolidation has helped to increase the demandfor and the supply of transparency among US LCBOs and to some extent encouraged anincreased degree of market discipline in the United States. The augmented market discipline(and possibly even more market discipline in the future) is likely to have reduced the probabilitythat banking and other financial institutions will take excessive risks. Thus, at least from thisperspective, the chances of maintaining financial stability may have been improved.
However, the net effect of financial consolidation in this area is impossible to judge. Forexample, despite the stated policy of the supervisory authorities, the evolution of the LCBOsthemselves may have increased perceptions that some firms are “too big to fail”, therebyincreasing moral hazard and reducing market discipline. In addition, although market disciplinemay work to improve the chances of maintaining financial stability the vast majority of thetime, these benefits may be partially offset by the risk that even rational markets can, andsometimes do, react in precipitous ways.88 Moreover, it was noted in the section on the creationof firms that may be “too big to fail”, liquidate, or discipline effectively that strong marketdiscipline can emerge well after an LCBO has become financially impaired. Such late-actingdiscipline can result from masking effects caused by the increased complexity of LCBOs.Whether they derive from rational or irrational calculations, such forces could complicate theresolution of a troubled LCBO, and greatly complicate management of a systemic risk event.89
86 See Basel Committee on Banking Supervision (June 1999).87 Another current idea for improving market discipline (and encouraging disclosure) is to require large banks to
issue a minimum amount of subordinated debt. A recent Federal Reserve Staff Study has investigated this issue.See Board of Governors (December 1999). In addition, the Gramm-Leach-Bliley Act, enacted in November 1999,required the Federal Reserve Board and the US Treasury to study the feasibility and appropriateness of requiringlarge insured depository institutions to hold a portion of their capital in subordinated debt. The joint study mustbe submitted to Congress within 18 months of the date of enactment.
88 For an evaluation of the range of ways investors in bank holding company subordinated debt can react see Boardof Governors (December 1999).
89 It can be argued, however, that knowledge of this possibility will give both financial institutions and theirsupervisors incentives to deal quickly with a potentially systemic event, before it gets difficult to manage. Putdifferently, the risk of a rapid and extreme market reaction provides a strong form of market discipline.

144
Potential policy implications
It is important to begin any discussion of potential policy concerns by emphasising thefundamental importance of sound monetary and fiscal policies for achieving financial stability,and thereby minimising the chances that a given adverse economic shock will become asystemic risk event. Financial institutions and markets, like most economic activity, tend tothrive in a positive and stable macroeconomic environment. Indeed, the discussion in thischapter has pointed out that identification of the effects of consolidation (and other factors) inthe United States has sometimes been made more difficult by the long period of strongeconomic growth with low inflation. Such observations are not a complaint, but rather areinforcement of the importance of sound macroeconomic policies.
Market activities tend to play an important role in the activities of the largest US financialinstitutions, in part because these institutions operate in highly developed money and capitalmarkets. Market activities can introduce new risk considerations, such as potentiallyaccelerating the speed of a firm’s deterioration. More broadly, however, financial markets andfinancial institutions are likely to play complementary roles in encouraging financial stability.For example, financial firms’ increased reliance on financial markets may allow them to achievebetter diversification, and developed financial markets foster efficient market discipline. Indeed,there is some evidence that institutions operating in countries with relatively developedfinancial markets may exhibit lower individual risk profiles.90
Assuming the continued existence of federal deposit insurance backed by sound monetary andfiscal policies and supervision of depository institutions, it has been argued here that systemicrisk concerns in the United States should focus on financial institutions and markets that providewholesale financial services. Although wholesale services are provided by more than justbanking organisations, it does not necessarily follow that federal safety net protection should beextended to non-bank financial institutions. Expanding safety net protections to a wider range ofinstitutions would almost surely increase the degree of moral hazard and thereby reduce thelevel of market discipline in the financial system.91 Tilting the trade-off between marketdiscipline and moral hazard in the direction of moral hazard could well increase the degree ofsystemic risk in financial institutions and markets. In addition, such a tilt would befundamentally inconsistent with the direction of US legislation over the past 10 years. Startingwith FDICIA in 1991 and extending through the Gramm-Leach-Bliley Act of 1999, the USCongress and both Republican and Democratic administrations have expressed the intent tonarrow safety net protections and keep them focused on insured depository institutions.
This having been said, it must be acknowledged that the evolution of non-bank financialinstitutions in the United States, including their increasing ability to affiliate with banks, hasreached the point where the scale and level of participation in financial markets of a number ofthese institutions is sufficient to make their financial impairment a potentially systemic event.Indeed, this development was recognised as early as 1991 when FDICIA clarified andsimplified Federal Reserve authority to provide discount window loans to securities firms inemergency situations.92 How best to resolve the resulting inevitable tension between protectingfinancial stability and inducing moral hazard is difficult to say, but clearly an issue thatpolicymakers should address.
One approach that may have promise is to begin with a judgmental assessment of whichmarkets, if disrupted, would pose the greatest risk to the real economy. For each of thesemarkets, it would then be necessary to develop a clear understanding of the role of the key
90 See De Nicoló (2000).91 For an analysis of how the safety net has affected banks’ cost of capital, see Kwast and Passmore (1999).92 This authority is granted under Section 13-3 of the Federal Reserve Act, which allows expanded discount window
lending in unusual and exigent circumstances.

145
institutions providing critical services. Fundamental questions to answer include: Who are themarket-makers and key sources of liquidity? Who are the key providers of financing? How domarket participants manage their risks? What are the main settlement banks and custodians? Ifthere is a clearing mechanism, who are the leading clearing firms?93 Interestingly, questionsvery similar to these were addressed as part of US bank and other financial supervisors’planning for responding to potential disruptions caused by the century data change, or Y2K.Although that effort was in response to a clearly defined specific event, it seems reasonable toargue that planning for less clearly defined systemic events could usefully begin by building onthe lessons learned from the Y2K experience. Still, even this rather modest approach wouldhave its dangers. Considerable care would need to be taken to avoid the impression that safetynet protections had been expanded, moral hazard encouraged, and market discipline deterred.
With respect to the net effects of consolidation on the risk of individual financial institutions,especially LCBOs, existing evidence supports a continued need for vigilance in the supervisionof such organisations. Indeed, research supports the value added of supervision in assessing aninstitution’s risk.94 The fact is that research has not been able to identify with sufficientprecision which types of consolidation or which individual institutions are likely to have thegreatest increases (or decreases) in risk from consolidation. Conventional credit risks clearlyremain a high priority. But market risks, encouraged in part by the consolidation process, havealso certainly become a matter of significant importance. In addition, it appears that supervisionshould, at least in response to the forces of consolidation, give extra attention to systems tocontrol operating risks. For all three types of risks, a supervisory approach that is heavilyfocused on risk measurement, management and accountability seems called for.
These arguments reinforce the view that capital standards, and particularly more risk-basedcapital standards, are a critical complement to supervision. Conventional economic models(including those used in this study) agree that, in a private market economy, private capital isthe first line of defence against incentives for excessive risk-taking by institutions that receivesafety net protections. In addition, capital standards provide an anchor for virtually all othersupervisory and regulatory actions, and can support and improve both supervisory and marketdiscipline. For example, early intervention policies triggered by more accurate capital standardscould prove to be important in crisis prevention.
Financial consolidation, especially the increased complexity and international activity of USLCBOs, appears to have increased the risk that, should it occur, the failure of an LCBO wouldbe disorderly. Thus, consolidation alone provides a powerful case for developing additionalsupervisory and regulatory policies and procedures for winding down an LCBO in ways thatwould minimise disruptive effects.
The empirical analysis conducted for this study strongly reinforces the importance of improvingsupervisory and regulatory policies. This empirical research suggests that consolidation hasprobably increased the degree of systemic risk associated with US LCBOs. The degree of totalinterdependency among US LCBOs appears to have significantly increased since about 1995.Moreover, this increased interdependency is positively correlated with the degree ofconsolidation at LCBOs as a whole, and especially at their most complex peer groups.
With respect to direct interdependencies, empirical analysis indicates that the most likely areasof concern deriving from consolidation are short-term interbank loan exposures and derivativesexposures. Increases in both types of exposures at US LCBOs are positively correlated withconsolidation. These correlations are particularly strong at LCBOs of high and medium degreesof complexity.
93 It is interesting to note that the answers to a number of these questions will involve bank-dominated markets. Seealso the discussion of clearing and settlement issues in Chapter VI.
94 See Berger and Davies (1998) and Flannery and Houston (1999).

146
What are the highest priority areas that policymakers should pursue, given the increase inconsolidation and its correlation with measures of interdependencies documented here? Severalseem worthy of note. First, management of LCBOs should develop contingency plans forwinding down their organisations under conditions of severe stress. It seems likely that suchplans, which should be reviewed as part of the examination process, could greatly reduce thecosts and risks of an actual wind-down. Second, a natural complement to contingency planningby LCBOs is similar planning by bank supervisors. Given the increasing complexity of cross-product and cross-border relationships at LCBOs, a core component of such planning should bethe augmentation of existing communications links, policy understandings and other protocolswithin and among domestic and foreign supervisors. As discussed previously, the extensiveplanning in these (and other) areas conducted as part of the preparations for the Y2K event seemlikely to provide useful experience and models for development.
Third, the organisational complexity of LCBOs, and the fact that safety net guarantees in theUnited States continue to apply only to insured depositories, suggest that both LCBOmanagement and supervisors should be clear regarding the management of business-linestructures that diverge from legal-entity structures. For example, policies and practices shouldbe clear about such things as the role of management and boards of subsidiaries, lines ofaccountability, and the maintenance and sharing of necessary information at the legal entitylevel in easily accessible form.
Fourth, the heightened importance of derivatives, foreign exchange and other market activitiesat LCBOs suggests that policymakers should be clear regarding how such activities would betreated in a distress situation. How to wind down these activities is an obvious example. A lessobvious case is perhaps the need for the Federal Reserve to be prepared both legally andoperationally to make discount window loans to the insured depositories of an LCBO with non-traditional businesses, and therefore potentially non-traditional collateral. More generally, theability to distinguish quickly between a liquidity crisis and an insolvency crisis at one or moreLCBOs will likely be an ongoing challenge for bank supervisors as consolidation proceeds.
Financial consolidation also appears to have increased both the demand for and the supply oftransparency by US financial institutions, particularly LCBOs. The resulting increases indisclosure, combined with other supervisory, regulatory and market developments, haveencouraged an augmented level of market discipline in the United States. Still,counterarguments can be made, and the net effect of consolidation on the ability of marketdiscipline to limit a potentially systemic event is impossible to judge. This is especially truegiven that the long period of economic prosperity in the United States has not, other than duringthe relatively short period of financial market turmoil associated with the Russian default inAugust 1998, forced a test in the United States of new supervisory and regulatory policies andsupporting market developments. Nevertheless, a recent study by the Federal Reserve suggeststhat, on balance, a strong case can be made for encouraging more disclosure by LCBOs.
The judgement that more market discipline should be encouraged derives in part from the viewthat the increasing size and complexity of LCBOs will make it increasingly difficult forsupervisors to assess the financial condition of these organisations in a timely and efficientmanner. Under this view, supervisors would benefit from additional discipline provided by themarket, especially if such discipline were exerted by market participants with risk preferencessimilar to those of supervisors.95 The results of the current study certainly support theconclusion that consolidation has substantially complicated the job of bank supervisors in theUnited States. In this regard, it is important to note that on 27 April 2000 the Federal ReserveBoard, the Office of the Comptroller of the Currency and the Securities and ExchangeCommission jointly announced formation of a private sector working group sponsored by the
95 Such discipline would be likely to be provided in certain circumstances by holders of subordinated debt. SeeBoard of Governors (December 1999).
147
Board to develop options for improving public disclosure of financial information by bankingand securities organisations.
4. Effects of consolidation in EuropeThe process of consolidation in Europe may have implications for both individual firm risk andthe risk to stability of the financial system as a whole, both at the national and the Europeanlevels.
Risk of individual financial institutions
Geographic diversification
It is widely recognised that a larger coverage of geographic areas, industries, types of loans andmaturity structures contributes to reducing the risk of bank insolvency.96 Consolidation thatincreases diversification reduces vulnerability to external shocks and thus improves bank safety,whereas an increase in the size of institutions per se tends to be associated with a greaterappetite for risk and thus a greater probability of insolvency.97 In Europe, most bank mergershave occurred within national borders. In this respect it is important to assess to what extentnational economies offer enough scope for diversification.
The existing evidence concerning Europe is somewhat mixed. While individual economies inEurope are relatively small compared to the United States, as well as being more open tointernational trade, they tend to be quite diversified domestically. On the other hand, in thosecountries that subsequently formed the European Monetary Union (EMU) there wasconsiderable convergence of macroeconomic measures during the 1990s compared with the1980s, as greater coordination of policy reduced the cross-country variation of economic cycles.Looking forward, the single currency in conjunction with the Maastricht Treaty will narrow thescope for national discretion with respect to economic policy.
The same does not hold for finer geographic divisions such as regions within countries. In therun-up to EMU, European regions became less synchronised, indicating that regions havegrown increasingly more specialised in fewer economic sectors.98 This result is consistent withthe notion that with further integration of markets for goods and services within the context ofthe European Union, there is more specialisation at the regional level. It suggests that banks thatremain regional in focus are increasingly susceptible to large non-diversifiable shocks, whilethose that are able to spread their lending across regions – even if they still remain domestic incharacter – should be in a better position to reduce asset risk, at least in principle. This is notnecessarily true, of course, for other types of intermediaries, such as insurance, which areexposed to risk factors that are less correlated with the business cycle. Interestingly, banksmerge largely with other banks within the same country, while mergers by insurance companiesrepresent the largest component of the cross-border transactions.99 By contrast, the influence ofcountry - specific factors dominates the sector-specific factor in the pricing of a sample of952 large individual company stocks in Europe.100 This result is fairly robust over the period
96 See Berger, Demsetz and Stahan (1999), Berger (1998), Mishkin (1998), Pilloff and Santomero (1998).97 See Hughes, Lang, Mester and Moon (1999).98 See Fatas (1997). Forni and Reichlin (1998), using more sophisticated techniques reach a similar conclusion.
Similarly Fuss (1997) has found that heterogeneity among European regions is greater than among Europeancountries.
99 See Berger, DeYoung, Genay and Udell (2000) and Chapter I of this report.100 See Rowenhorst (1999).
148
1978-98 suggesting that, at least based on the pre-EMU period, country-specific shocks andinvestor attitudes are still very important determinants of company stock valuations despite theunderlying process of economic convergence.
A similar conclusion can be drawn from the low cross-country correlations of earnings forEuropean banks.101 Also, empirical research on statistical models on credit risk measurementindicates that cross-border diversification continues to be more relevant.
The contradiction between these two sets of results regarding the scope for geographicdiversification across borders and across regions within the same country can be partiallyreconciled by noting that the first refers to trends in correlations over the recent past, while thesecond focuses more on the levels of these correlations. In other words, while significantasymmetries still exist at a country level, these have tended to decline as economic integrationin the European Union has progressed, and at the same time regions within countries havetended to become more specialised.
These results suggest that it is difficult to derive generalised implications for banks’ portfoliorisk. The answer is dependent on the initial profiles of the merging institutions, the scale of theiroperations and the complementarities in their geographic focus. Moreover, although it is hard todeny the significance of risk factors that are intimately connected to the business cycle for bankprofitability and financial strength, it is important to recognise that financial innovation, in theform of securitisation and credit derivatives, can help institutions to better control theirexposure.
Product diversification
The concept of financial conglomerates and close cooperation (based on formal or informallinks) between providers of different financial services is not a new concept in Europe. Manybanks (often the larger ones) are also engaged directly, through subsidiaries, or throughalliances in the provision of insurance products.102 In this respect, consolidation may notnecessarily add a new qualitative dimension to individual institution risk. However, a number offactors have contributed to the intensification of the desire by institutions to offer a broad arrayof products to their customers, thus multiplying the cases when a main objective of a corporatetransaction becomes the acquisition of productive capacity in another financial sector.103
One such factor that offers the motivation for merger activity among larger banks is the pressurefrom corporate customers, which are themselves growing in size either organically or throughM&As, in combination with the advent of the euro. Companies with a substantial presenceacross several countries in the single currency area have a cost incentive to consolidate theirbanking relationships and probably centralise part, or all, of their treasury and other financialoperations. In order to become (or remain) a reference bank for such clients, it is important forbanks to be able to offer more complex services and operate in a larger number of markets. Asimilar motivation for pursuing growth, and a more relevant one for smaller institutions, is thatan enlarged customer base makes it more economical for banks to offer a wider array ofproducts (cross-selling) and to increase the proportion of their income derived from non-interestsources. In the traditionally bank-oriented European financial systems, asset managementactivity is already performed by large bank institutions, either directly or through subsidiaries.
M&As often result in the creation of financial conglomerates that combine two or more types ofintermediaries (banks, asset management companies, stock brokers, private banking entities,
101 See Berger, DeYoung, Genay and Udell (2000).102 Dinenis and Nurullah (2000) found that all of the 100 largest European banking institutions have some form of
direct involvement in insurance provision.103 For additional discussion of this point see Chapter II.
149
insurance companies). However, mergers across financial sectors in European countries haveoccurred less often than within sector. Nonetheless, conglomeration has sometimes been animportant motivation in European cross-border transactions. A number of conglomerates on across-border basis have been established in recent years (eg Fortis, Dexia, Unidanmark-MeritaNordbanken).
An important development along this dimension is the emergence of the so-calledbancassurance, which combines banking with insurance business. The link is mainlyestablished through the creation or the acquisition of separate corporate entities.104
The limited empirical literature on the implications of the combination of banking and insuranceon individual institution risk presents a relatively sceptical view of the potential for riskreduction. Hypothetical mergers between UK building societies and mutual life insurers wouldbring about significant risk reduction, but the benefits of other combinations of different typesof intermediaries in the United Kingdom would be small or ambiguous.105 Among largeEuropean banks, only in the case of insurance brokerage would hypothetical mergers havepotential benefits in terms of risk reduction.106
The emergence of a stronger “investment culture” among European retail savers, supported byincreasing wealth levels, a benign financial environment and the drive towards funded pensionsystems, has fuelled a record inflow of funds into Europe’s mutual fund industry and a stronginterest in equity investments. Many banking institutions have seized this opportunity toleverage their name recognition and customer franchise, and thus offer asset management andbroker services. Banks in most European countries are the main providers of mutual fundproducts. This shift has helped to reduce their reliance on low-margin traditional deposit takingand lending activities and increase their share of revenue derived from fee-based activities. Atthe same time, however, it has altered the character of risk undertaken by banks, marking a shiftfrom the role of a principal (ie the ultimate bearer of risk) to that of an agent (ie someone actingon behalf of a principal).
A key issue in evaluating the implications of this expansion for the risk profile of institutions iswhether the chosen structure for the corporate umbrella is one that permits explicit cross-subsidisation of different activities. In general, these activities are performed by distinct entities,which are separately capitalised and subject to regulatory requirements specific to the particularindustry. Moreover, since an appropriate European legal structure is lacking, cross-borderoperations have usually been performed through financial holding company structures withsubsidiaries operating along different business lines. It is, however, reasonable to assume thatthe holding company will be proactive in the face of financial troubles in one of its subsidiaries,and it will try to reallocate liquidity and resources within the group to address the problem. Thisis more likely given that one of the motivations for creating a conglomerate is to capitalise onthe brand name, reputation and client base of the holding company.107
Also, as mentioned earlier, the combination of different financial activities under the samecorporate roof may allow for economies of scope in the field of risk management. While thepotential gains from combining portfolios with complementary exposures to risk factors can besignificant, a common problem that newly created conglomerates have to confront from thebeginning is how to merge together the risk control structures of the different businesses. Riskmanagement structures inevitably reflect the realities of the specific environment within which
104 The development of bancassurance is discussed in Chapter I.105 See Brown, Genetay and Molyneux (1996).106 See Dinenis and Nurullah (2000). Their study of actual post-merger performance confirms the above results.107 The readiness of Deutsche Bank to absorb the initial losses of its investment banking operation in the United
Kingdom is a case in point.
150
they were created and tend to differ substantially both at the conceptual and technical levelsacross different business lines. Combining them in a meaningful and consistent way is acomplex task that can easily be underestimated.
Managerial efficiencies
This section deals with the effect of M&A activity on the management of financial institutions.It focuses specifically on the impact such transactions may have on (i) the ability ofmanagement structures to respond to the challenges posed by the fusion of two differentorganisations into one, and (ii) on the incentives of management with respect to financial andother risk.
When the acquired institution is large and is operating in a wide range of markets it can bedifficult to evaluate its fair value and the risk of paying too high a price may materialise. Thismay in turn create the incentive for the management team of the acquiring institution to pursuemore aggressive (and riskier) business strategies in an effort to generate results that will providean ex post justification of the initial valuation.
In general terms, the main risk implicit in M&As is represented by cultural differences betweenthe managerial teams of the banks involved.108 In the European context, most cross-bordertransactions have been mainly intended to acquire financial know how (eg the acquisition offoreign investment banks and private banking entities on behalf of German banks). Merging theoften distinct cultures of two corporate entities is a major managerial challenge, especially asdifferences are particularly pronounced in transactions that are across borders. In the short run,it is important to avoid the risk of disrupting and demotivating staff and management of theacquired institutions, especially in cases where the acquired bank is operating in a field ofactivity in which the acquirer is a relatively new entrant.
The complexity of the post-merger organisation could prevent a clear evaluation of its riskprofile by the market. Market discipline might become ineffective. For this reason, supervisoryauthorities are (or should be) concerned about the completeness of the information flows to thepublic.
Apart from the beneficial diversification effect, consolidation strategies may be connected witha substantial increase in risk-taking, especially when the acquiring bank is entering a newmarket or a market that is characterised by a higher volatility of returns. Moreover, if the initialgoals of the operation become less likely to be achieved, the management could be encouragedto take more risk in order to meet profit objectives.
The effects of M&As on bank performance are also dependent on the characteristics of thelabour market, since rigidities can impede thorough restructuring. For example, in Italyagreements have only recently been reached between banks and trade unions to allow areduction in the number of employees.
Market power rentsFinancial institutions’ incentives for risk taking are powerfully influenced by the presence ofrents derived from market power or other characteristics of the operating environment of thespecific institution. The higher the value of the firm as a going concern for its owners andmanagers, the less likely it is that these decision makers will adopt riskier strategies in theirpursuit of higher yield and profits. In this context, examination of the presence of scaleeconomies (either on the cost or revenue side of the firm’s income statement) is relevant for theassessment of the impact that the merger wave might have on financial risk.
108 See Dierick (1999).
151
As discussed in Chapter V, economies of scale seem to be widespread in Europe amongrelatively small banks. With respect to the impact of M&As on bank performance in Europe,studies generally reject the hypothesis of improved post-merger efficiency but show significantcost cutting and profitability gains in some cases. Bank consolidation and cross-sectoroperations have allowed financial institutions to take advantage of the increasing demand forasset management services and to invest resources into providing low-cost remote bankingservices.
Conclusions
Overall, the evidence suggests that the current merger wave is likely to create value for themerging institutions in ways that have not been observed in past transactions. This is likely tomitigate risk-taking incentives for these institutions and thus counterbalance other factorsdiscussed above that could lead to greater financial risk. This beneficial influence is more likelyto be evident in Europe where there is considerable scope for realising economies given thecurrent structure of the industry. However, the fact that the potential for gains may be greater inEurope does not reduce the significance of inherent risks that are also part of the consolidationprocess. Indeed, as past experience has shown, the planning and execution of a merger is anequal if not more important factor for success as the fundamental economic underpinning of thetransaction. Also, given the diversity of institutions and structural factors that make up theEuropean financial landscape, it would be naïve to assume that the potential for benefits thatmay exist on average will necessarily mean that these benefits will be there for everytransaction. A case by case evaluation of individual deals is therefore warranted both by theprincipals of the individual institutions involved and by the relevant authorities.
Systemic risk
Consolidation in Europe, especially the merging of large financial institutions, has raised theissue of whether some, or more, institutions are now “too big to fail”, ie whether the failure of alarge firm may disrupt the financial system as a whole unless the authorities intervene to eitherkeep it alive or manage its “wind-down”. There is also a question of whether the systemiclinkages of firm failure, both domestically and internationally, have changed because of theongoing consolidation process.
Creation of firms that may be “too big to fail”, liquidate, or discipline effectivelyTraditionally, “too big to fail” applied to large domestic banks mainly because the externalitiesassociated with their failure, particularly due to the central role they play in the domesticpayment and monetary system, were thought to be larger than those associated with non-banks(or foreign-operating banks).109 However, disintermediation has made this distinction less clear,since banks can increasingly be weakened by the failure of non-banks either through directexposures or indirectly through the disruption caused to financial markets (see the subsection onindirect interdependencies below). Moreover, consolidation between traditional banks and non-banks has blurred this distinction, particularly when non-banking activities withinconglomerates cannot be ring-fenced and thus can cause losses to the banking business.
In contrast with the United States, the absence of legal barriers in Europe has meant that theconcepts of both universal and cross-European state banks have long existed. The question hereis whether the recent spate of consolidation has led to a greater emphasis on non-banking andcross-border activity.
109 Because of mismatches between their assets and liabilities, traditional commercial banks are also thought morelikely to fail than other financial firms even when fundamentally solvent following an ill-informed liquidity run.
152
Domestic aspects
Because the adoption of economic union has not been accompanied by political union, financialstability in Europe, as elsewhere, remains primarily a national concern. Consolidation involvingdomestically operating financial institutions (including those acquired by foreigners), and thusfirms whose failure may have implications for domestic systemic stability, is more of a publicpolicy issue for national authorities than domestic firms’ acquisitions of assets in other financialmarkets.110
Table III.4 shows the total value of acquired firms in European countries over the 1985-97period through domestic mergers between banks, securities firms and insurance companies.111
Almost two thirds of the acquired assets involved mergers within the same business lines,particularly mergers between domestic banks. Although part of this merger activity, especiallyin Germany, has involved consolidation among small banks, banking concentration hasincreased in most European countries. The more recent very large merger between NatWest andRoyal Bank of Scotland in the United Kingdom and the abandoned one between Deutsche Bankand Dresdner Bank in Germany suggest that concentration ratios may be rising further in someof the larger European countries. In a number of smaller European countries, concentrationratios have already risen to very high levels. In the Netherlands, for example, three banksaccount for almost 80 % of domestic assets. This increase in consolidation has raised the issueof whether “too big to fail” concerns have increased in some European countries, and if so, whatpolicies should be adopted to prevent or manage large failures to avoid systemic repercussions.
There have also been a number of bank-security firm and bank-insurance (bancassurance)mergers between domestic firms in some European countries in recent years. As shown inTable III.4, such mergers accounted for USD 63 billion of acquired assets over the 1985-97period – around 25% of the total value of acquired firms by domestic buyers. An importantquestion is whether the non-banking activities can be incorporated within conglomerateswithout affecting the banking activities. In principle, an institutional structure consisting ofsubsidiaries with separate capital bases could limit contagion. In practice, there may be largetransactions between subsidiaries and, in any case, there remains the possibility of reputationalcontagion. For example, losses at Barings Brothers were large enough to lead directly to thefailure of Barings Bank, and despite a separate company structure, Deutsche Bank absorbedlosses at Morgan Grenfell Asset Management in order, inter alia, to avoid reputation contagion.In addition, a number of banks are expanding into investment banking where there are thoughtto be economies of scale, particularly in the euro area, and away from traditional retail banking.For example, the aborted merger between Deutsche Bank and Dresdner Bank had planned toconcentrate on asset management and to sell off their retail business. This increase in emphasison investment banking activity may increase the complexity of banks’ balance sheets. Thiswould make it more difficult for public sector authorities to distinguish between illiquidity andinsolvency problems especially in the time frame required and, in the latter case, it wouldcomplicate winddown procedures.
Cross-border aspects
Within Europe
Cross-border consolidation within Europe presents two “too big to fail” policy issues. The firstarises when locally operating branches of foreign banks are more systemically important to thehost country than the home one. For example, the failure of a bank from a large country that hasa branch in a small country may have bigger systemic concerns in the latter – where the branch
110 Although, as discussed in Section 3, below, the latter would have implications for cross-border cooperationbetween national supervisors and central banks (where separate).
111 See Berger et al (2000).
153
may be large in relation to the financial system and economy – than the former. But accordingto “home country rule”, it is the responsibility of the supervisory authorities or central bankfrom the large country to decide whether or not to intervene in the case of the bank’s failure.Therefore, financial stability of smaller countries may be vulnerable to the behaviour of foreignbanks, and domestic authorities may also have limited powers in the event of a systemicsituation. The second policy issue is whether cross-border consolidation will result in theemergence of pan-European banks that are large in relation to the European financial system asa whole.
So far, cross-border activity into most European banking systems has been limited. Forexample, the value of bank acquisitions in Europe by banks from other European countries overthe 1985-97 period was one sixth that of domestic bank acquisitions (see Table III.5). This is incontrast with merger activity amongst insurance companies in Europe, which have occurred asmuch across as within country. Most intra-European banking mergers have occurred in smallercountries or in those on the outskirts of Europe; for example, between Merita (Finland) andNordbanken (Sweden) and between ING (Netherlands) and BBL (Belgium), both in 1997, andbetween BSHC (Spain) and Champalimaud (Portugal) last year. More recently,MeritaNordbanken (Finland and Sweden) has announced a planned merger with Unidanmark, aDanish bank with an insurance subsidiary in Norway.
In most European countries, assets of subsidiaries and branches of foreign-owned banks stillaccount for less than 10% of domestic banking system assets (Table III.6). The main exceptionis the United Kingdom, where foreign banks account for half of domestic banking assets. 112
Despite the important role that foreign banks play in the UK financial system, particularlybranches, individually they remain quite small compared to the main domestic banks. So farthen, the potential threat to domestic systemic stability from the local operation of very largeforeign banks has not materialised.
However, the continued progress to a single market for financial services in Europe, andespecially the euro, may result in large banks, as well as securities firms and insurancecompanies, increasingly regarding the “market” at the European, rather than the national level.This is especially likely in the smaller European countries where the home banking market mayalready be close to saturation point. But in some of the larger countries too, where large parts ofthe banking system are owned by the public sector or on a mutual basis, such as in France orGermany, cross-border acquisitions or alliances may represent the most likely avenue for rapidexpansion.
Outside Europe
Cross-border acquisitions by European banks in recent years have been at least as large outsideEurope as within it, while the assets outstanding of European banks held abroad are, for mostcountries, currently much larger than foreign banks’ assets held domestically. For example, theassets of both German and French banks’ subsidiaries and branches operating abroad in 1997were 30% of total domestic banking assets – seven and three times respectively as large as theassets of foreign banks operating in their domestic markets (see Table III.6).113
This increase in cross-border consolidation involving European banks, albeit gradual in mostcountries, raises issues of whether current cross-border arrangements – both between Europeanauthorities and with those from other countries – are adequate to ensure effective cooperationand information flows between different supervisors (both bank and non-bank), central banks
112 Foreign banks also account for a large share of domestic assets in Luxembourg and Ireland. Of course, a foreignpresence can also arise from foreign banks setting up a subsidiary or branch in another country rather thanthrough M&A activity.
113 See ECB (1999).

154
and governments. The complexity of international conglomerates is also likely to complicatewinding-down procedures, especially since bankruptcy laws differ across European countries.
Key characteristics of shocks that may become systemicSystemic instability can occur either because of a common shock to a number of institutions ormarkets, as occurred to the Scandinavian banks in the early 1990s, or an idiosyncratic shock,such as the failure of Barings in 1995.114 The latter could be caused by an internal weakness,such as fraud, or deterioration in the external environment. As discussed in Section 1, thepotential diversification benefits from consolidation could reduce the probability of firm failurefollowing an adverse shock. However, the mirror image of this is that when a failure does occurthe impact of the shock will be larger than before and may affect more than one business line(conglomerate) or country (cross-border merger). Also, if large firms’ assets are now morecorrelated by instrument or geographical location, then should an adverse shock occur it wouldhurt, on impact, more firms than in the past. The consolidation process may also have increasedthe propagation of shocks – both within national financial systems and across countries –through increasing the extent of contagion.
Authorities in the euro area have limited ability to use macroeconomic policies to offset nation-specific shocks. Monetary policy is set at the euro level based on the average euro-wideinflationary conditions, while national fiscal policies are constrained by Maastricht criteria andthe Pact of Stability and Growth. In principle, therefore, banks whose operations areconcentrated in a single euro area country may be more exposed to nation-specific shocks thanthey were prior to the formation of the economic and monetary union or than banks operating incountries not yet part of the economic and monetary union. In practice, since industrialstructures are similar across countries in the euro system, nation-specific shocks will probablybe rare. Moreover, the discipline imposed by anti-inflationary monetary and fiscal policies inEurope has created a more stable financial environment.
Despite the recent increase in the role of financial market intermediation, the European financialsystem remains largely dependent on bank intermediation. In the euro area, bank assets accountfor more than half of the sum of total bank assets, bonds and equities, compared with less thanone quarter in the United States, and are three times as large in relation to GDP as in the UnitedStates. This suggests, ceteris paribus, that channels of contagion involving banks rather thanmarkets are more likely in Europe than in the United States.
The propagation of an idiosyncratic shock from one bank to another may occur through anumber of channels. On the liability side of a failed bank’s balance sheet, uninsured depositorsmay incur credit losses. Consolidation may have increased the average size of such bilateralexposures.
Also, and despite the universal presence of explicit retail depositor insurance schemes inEurope, it is possible that liquidity runs will cause insolvency rather than the other way aroundbecause of expectations – rightly or wrongly – of insolvency. Although any liquidity runsnowadays are likely to be induced by better (although not perfectly) informed uninsuredwholesale depositors, consolidation may have increased the complexity and thus reduced thetransparency of firms’ activities.
On the asset side, direct interbank loans may be recalled in a crisis, causing liquidity problemsfor the borrowing financial firms. This could have particularly large implications for financialstability through depressing financial prices if the borrowers are themselves important investorsor market-makers in financial markets. In addition, correlated exposures may increase thepropagation of an idiosyncratic shock. For example, a marked decline in asset prices caused by
114 Although the failure of Barings was not considered a systemic threat.
155
heavy selling by a weakened financial firm would hurt indirectly the balance sheets of otherfirms holding the same asset.
Deposit withdrawals will often be based only on partial information of a bank’s creditworthiness. To the extent that such runs are irrational rather than information-based, thisrepresents a market failure that could be reduced through an increase in disclosure on firms’performance (see the section on Potential Policy Implications below).
Direct interdependencies between firms through interfirm exposures
Consolidation may affect the size of interbank exposures. On the one hand, firms’ totalexposures may have fallen to the extent that transactions are internalised within the mergedfirm; on the other hand, the average size of exposures may have increased with fewer firms inthe industry. But the contagious impact will also depend on the distribution of exposures. Asmall number of strong interbank links would affect some counterparties significantly whileleaving others unaffected. Alternatively, a large number of weaker links could individually havemore modest effects but will accumulate with the number of links.
Within Europe, there seems to have been a convergence in the level of interbank lending duringthe 1990s unrelated to changes in concentration (a reasonable proxy for M&A activity – seeChart III.6a). Interbank lending has generally risen relative to capital and as a share of totalassets in the smaller countries, particularly those on the periphery of Europe, where it tended tobe lowest, and fallen in the larger countries. Despite this trend, banking systems with higherlevels of concentration – the smaller countries – still tend to be those weakly associated withlower interbank lending/capital (Charts III.6f-h). One interpretation is that a large degree ofconsolidation, proxied by concentration, results in an internalisation of interbank lending.Alternatively, there may be economies of scale in interbank activity implying that interbanklending (relative to capital) is higher in larger banking systems. Supporting this latter view, atleast in the European context, is the clear positive association between the size of nationalEuropean banking systems – measured by total assets – and interbank lending relative to capital(see Charts III.6i-k). The latter interpretation would suggest that interbank lending relative tocapital, and thus the susceptibility of the system to an interbank shock, might rise with theadvent of the euro as the market is seen increasingly at the European rather than national level.
Although total cross-border interbank lending by EU banks in aggregate has increased onlymodestly (relative to total assets) since 1990, there has been a marked shift towards intra-European lending from less than half the total in 1990 to two thirds at the end of 1998.Moreover, there has also been a steep increase in aggregate intra-euro area interbank lendingsince the introduction of the euro (see Table III.8) and (unsecured) overnight interbank rateshave converged. Thus an unsecured interbank market at the European level has been establishedsince the introduction of the euro. A two-tiered system has developed with the largest banksproviding liquidity across the euro area, and with smaller banks confined mainly to nationalmarkets. However, secured interbank markets remain segmented at national levels.Consolidation in secured money markets is constrained by differences in national tax and legalsystems and a number of infrastructure difficulties including unifying securities settlementsystems and back office functions across institutions.
Nonetheless, interbank exposures with and to banks in other European countries remainsignificantly less than domestic interbank linkages. For example, in Germany and Francedomestic interbank loans remain eight and four times larger than loans to banks in other euroarea countries respectively (see Table III.7). The United Kingdom is an exception where(unconsolidated) cross-border interbank assets in other European countries are about 30% of thetotal assets of the domestic banking system – about the same magnitude as domestic interbankloans – and outside Europe a further 25% of total assets (Table III.8). This suggests thepossibility for international banking contagion following the weakening or failure of UKoperating banks, and that banks operating in the United Kingdom are susceptible to shocksoccurring to banks in other countries. For example, the problems in the Japanese banking
156
system resulted in the failure of Hokkaido-Takushoku Bank and Yamaichi Securities in Londonin November 1997.
Despite the advent of the euro, the bulk of interbank activity in nearly all European countriesremains to a large extent within national borders. Given this situation, the repercussions of bankfailure would likely affect, in the first instance, domestic counterparts. However, the ongoingintegration of European money markets should increase the likelihood of national shocks havingEurope-wide effects. On the other hand, a fully integrated European interbank market wouldreduce the likelihood of national liquidity (as opposed to solvency) failures since banks wouldhave greater access to funding from banks located elsewhere in Europe rather than primarilyfrom the domestic market.
An indication of the interdependencies of financial institutions or their susceptibility to acommon shock is given by the correlation in returns on bank equities. If the market thinks thatbanks have similar asset structures or are highly interconnected, equity returns should be highlycorrelated.
Charts III.7a-m plot the co-movements of stock returns, measured by the average annualcorrelation of weekly changes in share prices, for a selection of banks in 13 banking systems inEurope during the 1990s against bank concentration measured by the combined market shareheld by the five largest firms. The sample consists of large banks – ranked within the top 10 inthe domestic banking system by asset size in 1999 – that are currently traded on the respectivenational stock markets and have been so continuously since the early 1990s. Thus the sample ofbanks varies somewhat across countries and since there are usually only a few banks in thesample, the national banking system correlations should be treated with a degree of caution.115
Bearing this caveat in mind, the charts suggest that correlations in the growth of share prices arequite volatile from year to year in most European countries and there does not appear to be aclear-cut relationship with annual changes in bank concentration. Moreover, there does notappear to be a uniform trend across European countries of correlations in the growth of stockprices during the 1990s. Correlations increased in half the countries and fell in the other halfbetween 1990-94 and 1995-99. The European average of national correlations in bank returnswas little different in the second half of the 1990s than the first half (see Chart III.8).
In order to assess whether there has been a change in interdependencies between banks acrossEuropean countries as a whole, all 45 banks in the 13 countries were correlated against eachother. As expected, the average annual correlation of the growth in bank share prices acrossEurope (0.4, on average, 1990-99) is usually lower than that within each country (0.5, onaverage, 1990-99). Moreover, there is no evidence from these data that correlations in thegrowth of bank share prices across Europe have increased so far with the approach and adoptionof economic and monetary union (see Chart III.9a-b).
In sum, based on the co-movements in the growth of bank share prices on this sample of banks,there is no clear evidence of an increase in total bank interdependencies either within or acrossEuropean banking systems during the 1990s. Moreover, there does not appear to be a clearrelationship in the past between consolidation, proxied by changes in bank concentration, anddirect interdependencies, measured by interbank activity. That said, the more recent introductionof the euro has led to an increase in both interbank lending between large banks across Europeand consolidation, albeit mainly so far at the national level.
115 Adding smaller banks to the sample involves a trade-off. On the one hand, an enlargement of the sample size willincrease the statistical validity. On the other hand, consolidation of very small banks would not be expected toaffect concentration ratios. We found that the level of correlations amongst all available quoted banks in nationalbanking systems were generally lower than amongst the largest banks. However, the movement in correlationsover time were similar to those reported above as are the conclusions drawn.
157
Indirect interdependencies through correlated exposures to non-financial sectors and financialmarkets
The shift towards non-banking activity of large financial conglomerates in Europe discussedabove, particularly towards asset management, has increased financial firms’ exposures tofinancial markets. This could have increased both the impact and propagation of shocks.
An adverse shock to asset prices may directly affect more institutions than in the past becausemany large banks and other financial institutions, such as hedge funds, have grownsimultaneously through increasing trading activities and investing in marketable assets (seeTable III.9). Such shocks are also likely to more quickly impair the creditworthiness of afinancial firm than would occur through the deterioration in a loan book which is not marked tomarket. On the other hand, as banks’ assets have become more liquid and marketable, thelikelihood of underlying illiquidity problems has probably declined.
The combination of consolidation and increased market activity may help an idiosyncraticshock to an individual firm to propagate more widely. For example, if a weakened firm sells alarge quantity of marketable assets this could depress prices significantly, and thus weakeninstitutions that are holding similar assets. Illiquidity of a key market-maker, which could bemore likely following consolidation in the sector, may result in a dislocation of financial assetmarkets which in turn could adversely affect financial firms more generally. Although theprecise role of consolidation in such effects is unclear (see Annex III.3), these kinds of shockshave occurred in the United States (eg the failure of Drexel which was important in the junkbond market, and a number of LTCM’s counterparties were important in the US securitiesmarkets), but not recently to European firms.116
Along with firm consolidation, there is currently a parallel consolidation in European capitalmarkets, particularly since the introduction of the euro. A private sector bond market at theEuropean level is quickly emerging, while in the equity market there have been recentannouncements of the merging of the London Stock Exchange and the Deutsche Börse on theone hand and between the Paris, Amsterdam and Brussels stock markets on the other. This willincrease the ability of large firms, at least, to raise finance from capital markets at a pan-European level. This potential increase in non-bank finance for corporates may reduce thesystemic impact of a bank crisis if it occurs independently from a marked reduction of liquidityin the capital markets (a “market crunch”). On the other hand, European banks are themselvescurrently the largest borrowers from the bond market in Europe, perhaps increasing thepossibility of a combined bank and market crunch in Europe.
Potential policy implicationsThe increase in financial consolidation raises a number of questions for the design of publicsector safety nets.
Consolidation may have increased the number of banks, or possibly non-banks, that are thoughtby the private sector to be “too big to fail”, particularly in some of the smaller Europeancountries where bank concentration is now very high, and in countries where consolidation isnot accompanied by the development of capital markets that would offer borrowers analternative source of funding. Those firms thought covered by the safety net may receive afunding subsidy compared with those that are not. This could affect competitiveness both withinnational financial systems – between large and small banks and between banks and non-bankswhere business overlaps – and across countries between banks depending upon where thefinancial institution is incorporated. The regulatory framework in Europe leaves some discretionto national authorities for interpretation and translation into national legislation. These
116 Johnson Matthey - a key market-maker in the London Gold Market - was supported by the Bank of England in1984 because it was thought that its failure would have disrupted the London financial markets more generally.

158
differences may be positive from a viewpoint of financial stability, since national authoritiesshould be best suited to take into account the specific characteristics of local markets. On theother hand, this could potentially result in regulatory arbitrage and an unlevel playing field.However, the scope for providing risk capital support by governments is very limited in aEuropean context since the European Commission is directly involved in scrutinising whetherstate aid is compatible with the Community’s competition legislation.
In principle, the creation of firms thought by the private sector to be “too big to fail” could makefinancial instability more rather than less likely if firms take more risks in the expectation ofbeing supported by the safety net – the moral hazard problem. But excessive risk-taking couldbe constrained through regulating the activity of risky banks through more intensive inspection,and ensuring that such banks have sufficient capital and adequate risk management systems toabsorb unexpected losses. This is recognised in the proposed changes to the Basel capitalstandards for international banks. Supervision is likely to be increasingly focused on firms’ riskmanagement systems rather than formulaic capital standards. Also, central banks usually makeit transparent that any financial support will be conditional on disciplinary measures on thoseresponsible for the failure, particularly managers and shareholders.
More generally, given that the systemic costs of a firm’s failure, although not the likelihood offailure, have probably increased because of the consolidation process, additional policies maybe required to avoid the need for official emergency support. These could include policieswhich ensure that firms and markets are better able to withstand shocks, reduce the likelycontagion once firms fail, encourage support from the private sector where failed firms arelikely to be systemic and increase transparency (see below). The development of a liquid anddeep pan-European interbank market would reduce the likelihood of national liquidityproblems. The development of a secured rather than unsecured interbank market at theEuropean level, in particular, would also minimise the potential for banking problems to spreadacross banks and country boundaries. This would parallel the increase in safety of the paymentsystem following the introduction of a collateralised European-wide system (TARGET). Also,most central banks and regulators currently try to organise private sector support before riskingpublic funds, such as facilitating liquidity support or organising a takeover in a situation ofinsolvency. In Germany this is formalised with the operation of a semi-private liquidityinstitution (Likobank) which for the past quarter of a century has provided lending ofpenultimate resort to failed illiquid but solvent banks, albeit small ones. There is a question hereof whether a more consolidated financial system increases or reduces the likelihood of supportfrom other banks when a firm fails. This depends on the balance between the costs to otherbanks of a bank failure with the potential competitive benefits and the ability of private banks tocoordinate support where these costs outweigh the benefits. Everything else equal, havingresulted in fewer banks, consolidation may reduce the coordination problem, thus making iteasier for central banks or supervisory authorities to organise private sector support.
Public sector safety nets have traditionally been centred on banks rather than other financialinstitutions. Banks’ expansion into investment banking and trade in securities and derivativesmay reduce the likelihood of true liquidity problems but, on the other hand, may make theirexposures more sensitive to changes in market developments. Conglomeration has blurred, tosome extent, the distinction between banking and other financial activity. The creation ofconglomerates raises two issues for safety net policies. First, it widens the potential safety net,and thus moral hazard, if banking activities cannot be ring-fenced from the non-bank part.Secondly, non-banks that are part of a banking group would gain a competitive advantagecompared with those that are not.
The Scandinavian countries and the United Kingdom have reacted to convergence in financialfirms by creating conglomerate supervisors, while in other European nations cooperationbetween bank supervisors and those of other financial institutions is the preferred model.Nonetheless, central banks still tend to regard the distinction between banks and non-banks assufficiently clear to concentrate any potential central bank liquidity support on banks. But, as inthe case of banks, where non-banks are thought to pose a systemic threat, the central bank or

159
supervisor may attempt to orchestrate private sector support. If current trends continue, thedistinction between banks and non-banks may become increasingly difficult to sustain.
Although monetary policy in the euro area is now set by the euro system of central banks,policies for financial crisis prevention and management remain largely the responsibility ofnational authorities. This is consistent with the principle that the costs of support are borne bythe country which most benefits from the support. Supervision remains the responsibility ofnational authorities whether inside or outside the central bank, whilst lender of last resort(LOLR) to individual institutions remains the responsibility of national central banks. Although,to avoid increasing moral hazard, no central banks in Europe give precise details on the terms,conditions and circumstances in which they would provide LOLR, some make transparent theirgeneral principles, while others deliberately provide no guidelines. There are also widedifferences in the generosity of explicit national deposit insurance schemes above the minimumset by the European Union, while bankruptcy laws and winding-up procedures continue to beset at the national level.
Central banks focus their concerns on liquidity crises whereas consideration of solvencysupport, and thus explicitly using taxpayer money, is also an issue for ministries of finance. Allthe recent episodes of large support operations in Europe have been of the latter type – Nordiccountries in whole banking systems and Credit Lyonnais and Banco di Napoli for largeindividual failures. Consolidation may increase the need for government involvement in crisismanagement. First, the increased complexity of financial firms’ balance sheets and the potentialincreased speed of the development of financial crises, as shown in the Barings failure, make itmore difficult to clearly distinguish a liquidity problem from a solvency one, especially in thetime frame required. Second, the likely increase in size of individual bank failures in the futurewill increase the size of possible losses and thus potential costs to the taxpayer. The current euroarrangements for crisis management are compatible with the possible need for governmentinvolvement in crisis management. Since the responsibility of lender of last resort in the euroarea is at the individual state level, decisions on support are made by those bearing the costs. Inany case, given the potential costs of financial crises, the EU fiscal budget would be too small tofinance such a rescue at the EU level.
Nonetheless, the growing integration of international financial markets and expansion in cross-border merger activity witnessed in the last few years are likely to accelerate following the euro.This may reduce financial risk through the benefits of geographical diversification, but if failureoccurs it is more likely to have a pan-European or even global rather than solely domesticeffect. This could occur either through a common shock hitting financial firms or markets inseveral European countries simultaneously, or through a shock to a firm or market in anindividual European country being more likely to spread to firms or markets in other countries.This emphasises the need for cooperation and information sharing amongst national supervisorsand central banks to prevent the occurrence of such euro-wide crises. It also requiresarrangements to be in place between national central banks, including the European CentralBank, where euro area monetary stability or the payment system are potentially affected, as wellas national supervisors and ministries of finance to manage such crises.
The institutional arrangements in Europe to safeguard financial stability are based, on the onehand, on bilateral agreements that make use of the principle of mutual recognition of nationalregulations, and, on the other hand, on participation in multilateral forums such as the BankingAdvisory Committee and the Banking Supervisory Committee (for EU countries) and theGroupe de Contact (EU countries plus Norway, Iceland and Liechtenstein). In the case of cross-border banks, there is already an extensive set of general bilateral Memoranda of Understanding(MOUs) in place between the respective banking supervisors whereby information is exchangedand meetings are held regularly. There are also some MOUs for specific cross-border financialgroups, in particular between the French and Belgian supervisors with respect to the supervisionof Dexia and among the four banking and insurance supervisors of Belgium and the Netherlandswith respect to the supervision of Fortis. On balance, although institutional arrangements in

160
Europe to maintain financial stability seem adequate at the moment, some improvement may berequired in their practical functioning. Such improvements could include:
More bilateral information sharing and cooperation within countries and across Europe betweenbank supervisors and those of non-banks, and across countries between supervisors and centralbanks such as in surveillance analysis of financial stability;
A convergence in supervisory practices and, for large financial groups at least, an extension ofthe concept of the coordinating supervisor(s) – see Box III.1;
Increased effort to deal with the possibility of Europe-wide financial crises. For example, theBanking Supervision Committee, that consists of senior representatives from both central banksand supervisory bodies, provides a setting for the discussion of macro-prudential and financialstability issues, contributing to prudential bank supervision and financial system stability, andproviding a multilateral forum for the exchange of information and cooperation betweenbanking supervisors of member states;
Convergence in aspects of national legal frameworks, such as bankruptcy legislation, andmarket infrastructure to assist the development of secured pan-European money markets and tofacilitate the possibility of cross-border private sector solutions in cases of bank failure;
Improvement in information flows and coordination between home and host supervisors andcentral banks. Within the European Economic Area, supervision is the responsibility of thehome supervisor which, together with the home central bank (if separate), would be expected totake the lead in the case of problems at branches of home banks located abroad. In order toperform this task the home supervisor may need greater access to carry out examinations ofaffiliates in the host country. On the other hand, the potential systemic threat of bank failure, ifany, may be most acute in the host country. Therefore, an increase in the number of cross-border banks may increase the gap between the costs and benefits of intervention for nationalsupervisors and central banks. This could become a particular problem in small countries ifbranches of foreign banks – European or otherwise – account for a large share of the domesticbanking system. Here the home supervisor and central bank may be willing to accept liquidationwithout taking full account of the systemic consequences in the host country. In this case, therole of the host supervisor and central bank may need to be more active;
Depending on the extent of future integration of pan-European financial markets and theemergence of pan-European financial institutions, there may be an issue of whether crisisprevention and management practices across European countries would need to convergefurther;
Because consolidation is increasing the complexity of financial firm structures across bothsectors and countries, it may increase the need for timely information to assess solvency andpotential systemic risk. This suggests the need to modify approaches to supervision and toincrease market discipline. An increase in market discipline would be useful as a complement tosupervision in crisis prevention. This is recognised in Pillar 3 of the proposed Basel Accord.Also, an increase in the disclosure of firms’ performance and risk profile may enhance marketdiscipline particularly by other financial firms and credit rating agencies. In principle, banksshould be well placed to monitor each other since they operate in the same or similar marketsand share the same information. But it is debatable whether banks have the right incentives forsuch monitoring. An increase in disclosure is more likely to increase market discipline if theprivate sector does not believe that a broad implicit safety net is in place.

161
Box III.1
The ‘Brouwer’ ReportA recent report has been published on regulatory and supervisory structures in the European Union andfinancial stability by a working group of the EU Economic and Financial Committee chaired by theDutch Deputy Governor Henk Brouwer. The Brouwer Report (2000) made the followingrecommendations to enhance the practical functioning of current institutional arrangements:
Strengthening cross-sector cooperation at the international level, since the present supervisoryarrangements are primarily designed to enhance cross-border cooperation. Within the European Union,an important development is that the EU Commission has facilitated a round table discussion amongthe chairs of the supervisory committees of the different disciplines. International cross-sector cooperation could be further improved by clarifying and extending the concept of the coordinatingsupervisor(s) for the large financial groups domiciled in Europe;
Making the exchange of information among different supervisory authorities, and between supervisoryauthorities and central banks, on the major financial institutions and market trends a key feature of thestrengthened cooperation between the authorities involved. In this respect, the Basel Committee onBanking Supervision and the Groupe de Contact can be expected to work in close collaboration.Furthermore, it is important that the ministries of finance and supervisory authorities regularlyexchange views on the adequacy and necessary adjustments of financial regulation in a nationalcontext as well as in the context of the Banking Advisory Committee, the Insurance Committee and theHigh Level Securities Supervisors Committee;
Strengthening cooperation between supervisors and central banks, with a view to ensuring that if theemergence of financial problems at a major group may have contagion effects in other EU-countries,this is reported to the relevant authorities of the countries concerned;
Working on the convergence of supervisory practices, which can significantly enhance the efficiencyof the national supervisory authorities involved in monitoring cross-border financial institutions.
5. Effects of consolidation in JapanDuring the bubble period of the 1980s, financial consolidation in Japan was an event almostexclusively confined to the banking industry. Deposit-taking institutions were motivated to havebigger balance sheets with a view to taking advantage of the then-existing regulatoryframework. The bursting of the bubble and deregulation in preparation for Japan’s Big Banghave led to a sharp increase in consolidation among the different kinds of financial institutions.Table III.10 shows the change in the number of financial institutions during the past decade,which mainly reflects consolidation.
Risk to individual financial institutions
Consolidation during the bubbleUnder the former regulatory framework, Japanese financial institutions were segmentedgeographically and functionally.117 The Ministry of Finance’s branching policy that continueduntil the early 1990s was aimed at preventing excessive regional competition. Such asegregation policy virtually prevented new entrants into the trust and long-term credit bank
117 For example, Japanese banks were segregated by geographic region. City banks had branches in major citieswhile regional banks had branches only in the regions in which they operated. Japanese banks were alsosegregated by function. Long-term credit banks and trust banks specialised in long-term lending for equipmentinvestment, while commercial banks provided short-term working capital.
162
fields.118 In the late 1980s and early 1990s, the booming economy and gradual financialliberalisation promoted mergers among small and medium-sized deposit-taking institutionsbecause mergers were the only way to expand branch networks as well as increase asset size ina short period. 119 A few mergers between relatively small major banks also took place. 120
While these mergers aimed mainly at revenue scope economies, they often duplicatedorganisational and decision-making processes due to the conflict of corporate cultures and lackof well focused strategies. During this period, mainly attributable to the then remainingregulations on banking activities, such as deposit interest rate caps, and a very low rate of creditlosses, the most important criterion generally used in Japan for judging a bank’s performancewas the size of its balance sheet, which was also the major source of revenue. The reducedimportance of asset size as a revenue source, mainly attributable to the non-performing loanproblem, saw an end to such mergers, especially among large banks. As Chart III.10 shows, therelationship between asset size and profitability of the largest 20 Japanese banks has becomeincreasingly negatively correlated since 1994.
Post-bubble consolidationAfter the bursting of the bubble, consolidation among small and medium-sized financialinstitutions continued but a substantial number of them represented failure resolutions. Thewave of very large consolidations which began in 1999 marked an end to the non-performingloan problem among major financial institutions121 (Table III.11) and may be regarded assurvival strategy in response to the likely creation of a competitive environment that will bebrought about by Japan’s Big Bang (deregulation of virtually all existing frameworks that havehitherto prevented free competition) as well as global consolidation trends. It is also propelledby the various safety net frameworks that have been put in place by the government in responseto the financial crisis, including that for the injection of capital using public funds.122 Capitalinjection by the government, which was accompanied by management improvement plans andthe stricter accounting treatment of non-performing loans, not only restored confidence in thesolvency of recipient banks but also acted as a catalyst for consolidation in terms of diminishinginformation asymmetry regarding the financial conditions of merging partners.
Geographic specialisation and diversificationThere are some consolidation cases that aim to benefit from specialisation and others fromdiversification. One major bank envisages becoming a retail bank specialising in the Kansai area(western Japan) by assuming the assets and liabilities of smaller failed regional banks in thesame region; it has withdrawn from all overseas operations. Acquiring failed banks will give the
118 See Koyama (1995).119 Until the early 1990s, new branches were subject to approval that specified the exact location of a branch so that
it would not infringe upon the business territory of others. Moreover, each financial institution was, in principle,allowed to set up only one new full-branch in two years.
120 There were mergers between Taiyo-Kobe Bank and Mitsui Bank (Sakura Bank) in 1990, and Kyowa Bank andSaitama Bank (Asahi Bank) in 1991. The merger of Bank of Tokyo and Mitsubishi Bank (Tokyo-MitsubishiBank) in 1996, although taking place after the bursting of the bubble, could also be regarded as belonging to thiscategory.
121 Regional consolidation by Daiwa Bank, the merger of Tokai Bank and Sanwa Bank, that of IBJ, Fuji Bank andDKB (Mizuho Financial Group), that of Sakura Bank and Sumitomo Bank (Sumitomo-Mitsui Bank), as well asthat of Tokyo-Mitsubishi Bank and Mitsubishi Trust Bank (Mitsubishi-Tokyo Financial Group) belong to thiscategory.
122 In January 1999, the Financial Reconstruction Commission announced basic policies concerning capitalenhancement plans, which state, “financial institutions negligent of consolidation efforts are not eligible forcapital injection”.
163
bank more flexibility in conducting rigorous rationalisation such as closing unprofitablebranches and dismissing excess personnel. If this vertical consolidation materialises, the bank islikely to acquire a strong and cohesive client and depositor base in the region and attain acritical franchise mass. Until the early 1990s, the Japanese regulatory authoritiescompartmentalised the regional customer base into small units for the purpose of restrictingdisorderly competition under the “convoy system”. This merger can perhaps thus be seen to takeadvantage of market power rents stemming from geographical specialisation.
But more importantly, the increase in small (largely insured) local deposits as a result of thismerger will provide the bank with a stable source of funds. From a risk managementperspective, mergers between major banks that are constantly dominant takers of short-terminterbank funds and regional banks that are constantly main providers of short-term interbankfunds could reduce total interbank exposure.
As yet there has not been a typical consolidation case that aims at geographical diversification.While some merger plans between major banks have been unveiled (or actually carried out);these banks have a strong franchise in their respective regions, namely Nagoya (the Tokai area),Osaka (Kansai), and Tokyo (Kanto). The net geographical diversification effect of mergersbetween major banks such as this one is somewhat ambiguous. As Chart III.11 indicates,geographical diversification effects in terms of credit and interest rate risks may be generallylimited because the business cycles of these regions have a high positive correlation. Inaddition, mergers among major banks are not likely to alleviate heavy reliance on interbankborrowing, which could increase potential funding costs.
Indeed, the fact that Asahi opted out of the planned merger with Tokai that was aimed atcreating a supraregional retail bank may suggest the difficulty in exploiting geographicaldiversification effects in Japan, especially by major banks.
Managerial efficienciesMost very large mergers so far observed in Japan seem to aim more at cost scope economies,especially in terms of information technology (IT) investment. In order for a major bank toenjoy cost efficiency gains, it is increasingly important to make large-scale IT investments tohave as high-speed and integrated a computer system as possible, which, judging from theglobal standard, is too costly for major Japanese banks in comparison to their individual profits.For example, most major US banks spend more than JPY 100 billion annually on IT investmentwhile the six largest city banks in Japan spend only JPY 55 billion on average (Chart III.12).After consolidation, the Mizuho Financial Group is expected to invest more than JPY150 billion annually on a consolidated basis. Such large-scale IT investment, coupled withconsolidated customer bases,123 will likely produce a critical mass of customers per unit of ITinvestment and improve cost efficiency of the merged banks.124 However, there are a series ofissues to be tackled. To start with, corporate culture gaps between merging banks cannot beunderestimated. The fact that each bank has its own historical background and establishedrelationships with clients, and also that existing shareholders often have vested interests, arguein favour of strong managerial leadership to promote successful mergers. Japan’s experienceindicates that this is probably more the case for regional banks that have deep roots in the localareas they serve.
Second, in terms of risk management, aggregating similar risk profiles may not in itself reducethe amount of risk in proportion to the increase in size. Management must have clear riskmanagement objectives and make efforts to actively control risks. In addition, if the corporate
123 Although still far down the scale from major US banks that normally have thousands of branches, the MizuhoFinancial Group will have approximately 800 branches at the outset.
124 See eg Atkinson (1998 and 1999b).

164
architecture of a financial conglomerate becomes complex, a small risk could develop into amajor one because the complexity itself may confuse depositors and other creditors. A minorproblem affecting one arm of a financial conglomerate could be interpreted as a problemaffecting the whole conglomerate. At any rate, improvements aimed at attaining a sufficientcompliance function and auditing skills vis-à-vis operational risks may prove to be an importanttask to be achieved by risk management in a large and complex structure. 125
Finally, integration of the computer systems of merging banks is bound to be costly in Japandue to the keiretsu relationships that involve computer companies. For example, in the case ofMizuho, all three banks have different systems provided by different makers (IBJ has HitachiSystem, Fuji IBM, DKB Fujitsu). It is said that it will take almost two years to consolidate theircomputer systems. 126
Product specialisation and diversificationParallel with stabilisation of the financial market, cross-sector alliances are beginning to be seenas an attempt to capture complementarities. These are typically alliances between banks andsecurities companies and between banks and insurance companies. These alliances aim atmerging overlapping functions, each specialising in comparatively competitive fields. They alsoaim at sharing delivery channels. For example, selling fire insurance to mortgage borrowerscould bring in additional revenue.
To what extent such consolidation produces additional synergies is yet to be seen. There is aview that Japanese financial institutions have already engaged in the cross-selling of keyfinancial products through the keiretsu network, and therefore additional synergies in thisrespect are limited.127 If this is the case, there is a risk that a newly created financial group mayonly serve to maintain excess capacity in the industry by subsidising less competitive firms inthe group.
On the other hand, the risk diversification effects of cross-sector consolidation could provepositive, especially between banks and insurance companies whose risk profiles are generallyless correlated. For example, if insurance policies against natural disasters (catastrophe bonds)were mixed in the liabilities of a financial conglomerate, they would contribute to diversifyingrisks since the probability of natural disasters in major countries normally has little correlationwith interest rates and foreign exchange rates.128 It is also pointed out that maturity structures ofassets and liabilities between banks and life insurance companies are broadly complementary.Of course, offsetting risks between banks and insurance companies may not be as easy toachieve in practice as in theory for Japanese financial institutions at this juncture. Morerealistically, managing complex risk profiles to secure competitive returns may prove to be achallenging task for Japanese financial institutions for some time. At any rate, complex riskprofiles are expected to stimulate the development of better risk management techniques andcapabilities.
125 On the other hand, if managerial integration increases across firms in a group, its corporate architecture maybecome simpler. A simple structure could promote assimilation of trading strategies and risk managementmethods across firms in the same group. If scenarios or assumptions underlying these strategies and methodsprove biased or wrong, the group as a whole could incur an unsustainable loss.
126 Many large Japanese banks have built up computer systems with central, large-scale host computers supplied bydifferent manufacturers, making the interfacing and integration of computer systems of merging banks morecomplex and time consuming. By March 2001, individual financial services offered by the three banks involvedin the Mizuho consolidation will be operated by single computer systems, eg retail banking by the DKB system,investment banking by IBJ’s system. By April 2002, an entirely new system will replace all current systems.
127 See eg Atkinson (1999a).128 See eg Morimoto (2000).
165
Platform risk
Some Japanese commercial entities have announced their intention to enter the banking areausing their existing platforms such as internet businesses and supermarket chains.129 Such bankswill try to capture customers from their original commercial businesses to take advantage ofsynergies between the two businesses.
However, some analysts point out that just depending on customers of the original business maynot achieve critical franchise mass to make the banking operation sufficiently profitable. Also,since such banks are physically dependent on the platform (premises, customers,communication networks etc.) of the original business, they are directly exposed toperformance, accident and reputational risks attaching to the original business – this may becalled platform risk. For example, in the case of a supermarket bank, if the business of asupermarket chain were taken over, the bank could lose all the premises immediately. This riskis totally foreign to risks inherent in banking. 130
Cross-border transmission of risksAnother feature of recent financial consolidation is the entry of foreign financial institutions intoretail markets (Table III.12). This is especially true of foreign investment banks and insurancecompanies (for example, the purchase of Yamaichi Securities by Merrill Lynch, the purchase ofNikko Securities by Travelers, and the purchase of Nippon Dantai Life by Axa). They aim tocapture the fruits of Japan’s Big Bang by using the existing branch networks as a platform tosell their products to Japanese customers as well as take advantage of global risk diversificationeffects. Some investment banks also regard such networks as a safety valve to control volatilerevenue flows in terms of transferring a portion of risks (for example, in a repackaged product)to end-investors in exchange for commission fees. While this type of consolidation could bringin new capital, new financial skills, and different management styles, such internationalnetworks might directly channel home-made risks to Japanese financial markets, which wouldpose a challenge for Japan’s financial authorities as host country supervisor.131 In order toforestall such financial contagion, better supervisory coordination and information sharing withhome country supervisors, supported by improved disclosure, is called for.
This said, such direct contagion risk may not be imminent because the purchase of Japanesefinancial institutions by foreign financial institutions will be a gradual process. In fact, most ofthe Japanese financial institutions purchased so far by foreign institutions are those which hadfailed and whose balance sheets were cleaned up by the safety nets. This suggests a generallycautious approach on the part of foreign institutions.
129 Ito-Yokado plans to set up a bank specialising in payment services based on its network of nearly10,000 supermarkets and convenience stores. Moreover, Sony (internet banking) and Japan Railways (paymentservice) are also planning to enter banking.
130 In August 2000, Japan's Financial Supervisory Agency released a guideline concerning the licensing of banksestablished by commercial firms, which also requires banking subsidiaries to take appropriate measures tosegregate risks stemming from the original business of their respective parent firm, as well as to preparecontingency plans to cope with the possible materialisation of such risks.
131 The cases of BCCI and Barings suggest the possibility of risks being transmitted directly from abroad. Thesecases involved risks transmitted through payment systems. BCCI’s Tokyo branch was a member of BOJ-NET(Bank of Japan’s large-value net payment system) and Barings’ Tokyo Branch was a member of the Japanesegovernment bond book-entry system operated by the Bank of Japan. In turn, Japanese financial institutions couldexert adverse effects on foreign markets. One study suggests that Japanese banks’ asset contraction after thebursting of the bubble, which included a sharp curtailment of lending in the United States, contributed to adecline in real economic activity in the commercial real estate sector in the United States (Peek and Rosengren(2000)).
166
Market power rents
Market share will remain an important competitive factor for some time and will increase verylarge financial institutions’ power to become price leaders. However, in the longer term,globalisation may reduce such benefits if outside capital can enter Japan’s financial marketsfreely to supplement reduced supply capacity. Technological improvements such as fasterinformation dissemination and standardised trading and risk management models may, at leastfor the time being, serve to reduce market power rents of the existing large market participantswho used to enjoy profitability derived from superiority in terms of information and technology.
SummaryThe recent consolidations among major banks appear to have noticeable cost saving effects interms of rationalising personnel and branches, integrating customer bases, and improving ITquality. However, mergers with regional banks are called for in order to alleviate heavy relianceon interbank borrowing (which could increase potential funding costs). Overcoming culturalgaps would also be an important cost saving factor. On the revenue side, geographicaldiversification may not result in effective risk diversification due to the highly positive businesscycle correlation among major regions in Japan. Also, establishing an effective riskmanagement system is critical to control risks, thereby stabilising revenue flows.
The net effect of cross-sector consolidation is not clear. The existing keiretsu cooperation mighthave already exploited complementarities deriving from cross-selling, leaving little additionalprofit to be obtained from consolidation. There could be some risk reduction effects betweenbanks and insurance companies but only if risk complementarities between the two businessesare effectively managed. Foreign firms purchasing retail securities and insurance franchises inJapan may enjoy some revenue increase deriving from Japan’s Big Bang as well as some riskreduction effects deriving from global risk diversification and risk transfer to end investors on aglobal scale.
Finally, success of commercial firms entering banking seems to hinge on whether a criticalcustomer mass is attracted from the original business. It should also be noted that banksphysically depending on the original business may be vulnerable to platform risks attaching tothe original business.
Systemic risk
Creation of firms that may be “too big to fail”, liquidate, or discipline effectively
Consolidation has created a number of systemically important financial institutions. Forexample, the Mizuho Financial Group alone has total assets of USD 1,500 billion (30% ofnominal GDP). If such a financial institution were to experience a severe financial problem –insolvency, illiquidity, or operational failure – it could lead to a disorderly resolution processthat could have a serious impact on both domestic and international financial markets. It couldalso cut off the funding sources of borrowers, thus exerting substantial adverse effects on theoverall economy. The loss of the franchise value of such an institution would also result inlarger resolution costs. Given the potential damage to the financial system and economy, itmight be difficult, if not impossible, to allow such a financial institution to fail and at the sametime maintain financial stability.
Japan has faced this trade-off in actuality. To address the situation, Japan’s financial authoritiesallowed internationally active (and thus systemically important), failed financial institutionssuch as LTCB to continue operations and thus to maintain their financial intermediary functionbecause it was considered less expensive than liquidating them and dealing with the financialdisruption that would otherwise have ensued. At the same time, in order to minimise moralhazard and resolution costs, the financial authorities removed management and penalisedshareholders in the form of a capital reduction. This implied, at least from the perspective of
167
management and shareholders, that the bank had failed, although it continued to provide allexisting services. This basic concept in dealing with failed financial institutions was formallylegalised in October 1998 (Financial Stability Early Strengthening Law and FinancialReconstruction Law), and is discussed later.
Key characteristics of shocks that may become systemic
Direct interdependencies between firms and markets through interfirm on- and off-balancesheet exposures
Many analysts agree that consolidation could give the resulting larger financial institutionsgreater ability to absorb shocks. However, at the same time, a reduction in the number of marketparticipants could significantly increase the concentration of risks and mutual dependence incoping with financial risks. For example, an increase in credit exposure among very largefinancial institutions could theoretically increase direct interdependencies. Interestingly though,as a matter of practice, interbank loan exposure is more an issue of indirect interdependencies inJapan, as is pointed out in the following section.
On the other hand, the derivatives positions of Japan’s major financial institutions are, and arelikely to be, principally among major financial institutions, both domestically and globally.Since the derivatives exposures of individual major financial institutions are already colossal,direct interdependencies between merged financial groups will inevitably be systemicallysignificant (Chart III.13).
In the case of LTCB, it was feared that a disorderly collapse might trigger a closeout clause forits global derivative positions worth USD 450 billion in notional principal,132 a substantialamount of which was cross-border. If this had transpired, it was viewed as conceivable that theresulting open positions on the part of its counterparties would disrupt international financialmarkets because those counterparties would try to replace liquidated positions in a concertedmanner. In an effort to prevent this, the Bank of Japan clarified, in a statement issued by theGovernor133 upon the temporary nationalisation of LTCB on 23 October 1998, that “allliabilities of the bank, including derivative transactions, will be smoothly met and the Bank willprovide necessary liquidity to LTCB.” As a result, few institutions closed their position vis-à-visLTCB.
This incident suggests that a disorderly closure of a very large financial institution might disruptglobal financial markets, as shocks would be transmitted across national borders via the directinterdependence of firms at such a speed and magnitude (typically reflected in derivativestransactions) that the authorities would have very limited time to respond. Moreover, althougharrangements like closeout netting would contribute to reducing credit risks, actual executionmay result in higher volatility and thus greater market risk, despite the fact that riskmanagement efforts at individual institutions are completely rational.
Indirect interdependencies through correlated exposures to non-financial sectors and financialmarkets
A typical example of indirect interdependencies through correlated exposure was observedduring the bubble economy of the late 1980s in Japan. During the period, banks in generalexpanded loans to real estate-related industries. Thus, the fall in land prices during the 1990sgradually reduced Japanese banks’ lending capacity and, in turn, exerted a considerable negativeimpact on land prices (Chart III.14). This caused a spiral deterioration in asset quality across the
132 This figure compares to JPY 6 trillion in the Drexel case and Y4 trillion in the Yamaichi case.133 Masaru Hayami, Governor of the Bank of Japan, “Statement by the Governor”, 23 October 1998.
168
banking industry over the decade. Disposal of non-performing loans by one bank also indirectlyaffected other banks’ asset quality in terms of the bankruptcy of common borrowers.
Very large financial mergers in Japan will probably further intensify indirect interdependenciesvia correlated exposures to non-banks and financial markets. For example, on the asset side, thefour very large financial groups now being established are likely to account for approximately50% of the total loans of banks in Japan. In some cases, it may result in the concentration ofcredit risk on a certain borrower or industry (Table III.13). On the liability side, these groupswill likely account for approximately 70% of total short-term borrowings while they account foronly 3% of total short-term loans (Chart III.15) – traditionally in Japan, the short-term moneymarket (call money, certificates of deposit, large-lot deposits) has been an important fundingsource for major banks, and one which accounts for almost 20%, on average, of their liabilities.This means that the failure of one of the major four groups as a borrower in short-term moneymarkets could lead to the failure of common lenders in such money markets, typically regionalbanks and trust funds, which also provide other very large groups with short-term loans. In fact,during the crisis of autumn 1997, the liquidity of short-term money markets nearly dried upreflecting mounting uncertainty over the financial conditions of some major Japanese banks.
Therefore, it is conceivable that consolidated very large financial institutions will inevitably bemotivated to reduce loans to non-banks and minimise funding in the short-term money marketby compressing balance sheet size, for example, through loan liquidation and securitisation.134
Some borrowers may be asked to reduce overall borrowing limits and seek alternative fundingsources in the corporate bond market. In addition, these financial institutions are likely toliquidate a significant portion of their cross-shareholdings (Table III.14) because shareholdingswill become too large for a consolidated financial institution in terms of market risk (measured,for example, in terms of VaR, they correspond to approximately 20%135 of capital). Thus, bystimulating securitisation, corporate bond issuance and the liquidation of cross-shareholdings,very large financial mergers in Japan may trigger the development and substantial growth ofcapital markets which have so far played a complementary role in terms of corporate financingin Japan (Table III.15).
The liquidation of cross-shareholdings that inevitably involves the sale of bank shares by otherkeiretsu firms may also prompt banks to improve return on equity in order to attract a new slateof investors who will agree to enter into long-standing relationships. Such new relationshipswill be based on banks’ profitability rather than stability in supplying industrial funds. 136 Banksmay have to improve lending profitability by, for example, the improved pricing of loans togenerate higher return on equity.137
134 The major four financial groups are reported to be planning to establish a loan liquidation market in order toreduce concentration of risks as a result of consolidation (Nikkei Newspaper, 31 May 2000).
135 VaR here means maximum risk exposure calculated using stock data at the end of the financial year 1996 underthe conditions that the holding period is six months and confidence interval is 99%.
136 Cross-shareholding has been a useful arrangement in which corporate borrowers who are also shareholders of abank focus more on the stable supply of funds from the bank at a relatively cheap cost and less on return onequity. Bank lending, therefore, has not necessarily reflected the credit risk of individual borrowers; the rationaleof banks is to maintain stable and long-term relationships with borrowers based on cross-shareholdings. Whilesuch an arrangement served to channel industrial funds into the corporate sector and thus economic growth, itmay well explain banks’ relatively low profitability on lending as well as low return on equity investment inbanks.
137 The growth of capital markets in Japan (as well as the increased attractiveness of bank stocks, which account forapproximately 10% of the total market value of the Tokyo Stock Exchange) is also expected to stimulate pensionand fund management activity. This, in turn, will probably relieve part of the increased risk concentration in thebanking sector by way of diversifying the channels through which risks are transmitted as well as providing thebanking sector with risk capital from end investors.
169
There may be both costs and benefits from the development of capital markets in Japan.Banking systems have a tendency to temporarily absorb the adverse consequences ofmacroeconomic and financial shocks (such as business and credit booms and busts) byrevaluing assets internally (via provisioning, for example) and usually, more slowly, by usingabundant capital. By contrast, capital markets tend to react more quickly to similar shocks asmarket participants manage and shed risks by trading and repricing assets. Thus, as a financialsystem evolves from one dominated by banks to one with deep and liquid capital markets, priceand financial flow volatility are likely to increase. While this can be costly, a potential benefit isthat financial risks become less concentrated in financial institutions and more widelydistributed among investors who are willing, and potentially able, to shoulder and manage suchrisks. This could serve to prevent potential problems at a single financial institution or groupfrom developing and severely affecting the financial markets and the real economy.
Deposit runs versus deleveraging
The progress of securitisation as a result of financial consolidation appears, in turn, to bepromoting financial consolidation, which is likely to change the nature of systemic risk in thesense that it blurs the demarcation between banking and other financial businesses. Forexample, in order to benefit from the development of the capital markets, major financialinstitutions are trying to develop sophisticated trading and risk management technology tomanage volatile market risks. Consolidation will allow sizeable revenue flows to constantlyfinance the massive IT investment that sophisticated technology requires. Also, some wholesalefinancial institutions are motivated to acquire a retail base in order to increase fee business vis-à-vis end investors as a stable source of revenue as well as to retain core deposits as a stablesource of funding.
In traditional thinking, banks are the only entities that are uniquely systemic in nature becauseof their balance sheet structure (ie short-term funding and long-term lending) and their role inpayment systems. However, consolidation among various types of financial institutions, withthe help of deregulation, is gradually blurring the demarcation of businesses, especially betweenbanking and securities. Indeed, the balance sheet structure of securities firms has graduallybecome more similar to that of banks. For example, securities firms have recently increasedtheir holding of less liquid assets such as securitised loans, high yielding bonds and otherinstruments with derivative features. On the liability side, the recent growth of the repo markethas enabled securities firms to easily obtain liquid funds and leverage their balance sheets.138 Allof this has created systemic problems similar to those that exist in the banking industry.
Meanwhile, bank assets have become more liquid parallel to the development of securitisationand credit derivatives, thereby relieving, at least to some extent, the traditional role of banks intransforming short-term, liquid funds into long-term, illiquid funds. The risk reduction needs ofvery large banks as well as the fusion of banking and securities businesses as a result ofconsolidation will promote such changes and thus reduce the uniqueness of banks.
Moreover, such fusion between the banking and securities businesses will also make market-making an increasingly important means of financial intermediation because more financialinstruments will be either priced or evaluated in the markets. As a result, credit risks willbecome increasingly market-tied and volatile. In contrast to loan-loss provisioning, thecorrection of credit risks in the market could immediately usurp market players’ risk capital, aswas the case during the Asian crisis in 1997. The loss of market-makers’ risk capital would seeliquidity evaporate in the capital markets and intensify the funding difficulties of highlyleveraged institutions because they need to put up additional margin calls, unlike banks whose
138 In fact, in Japan, major securities firms have traditionally been allowed access to the short-term interbank moneymarkets. In retrospect, it may be no coincidence that the financial crisis in autumn 1997 was triggered by thedefault of interbank obligations by Sanyo Securities.

170
funding is protected by deposit insurance.139 Moreover, deleveraging tends to have seriousadverse effects on the real economy because it can create negative equity as a result of plungesin asset values. Indeed, this was one of the reasons the Bank of Japan had to extend liquiditysupport to facilitate the orderly unwinding of Yamaichi Securities.140
On the other hand, development of real-time gross settlement, which is expected to becomeoperational in early 2001, and the introduction of speedy resolution methods to the depositinsurance system scheduled to become effective in April 2001, will make the payment systemmore resistant to a chain reaction or financial risk contagion. In other words, in the future,systemic risks may stem more from deleveraging in the market than deposit runs or the chainreaction stemming from a payment failure.
Potential policy implications
Design and operation of financial safety netsJapan has three consumer protection funds: deposit insurance, the investor protection fund, andthe policyholder protection fund, each respectively covering the banking, securities andinsurance industries. In principle, the deposit insurance system and investor protection systemprotect depositors and investors in securities up to JPY 10 million, while the policyholderprotection system guarantees 90% of insurance companies’ reserves. However, these partialprotection systems were incapable of coping with the post-bubble crisis, and thus temporaryspecial measures were introduced to protect all liabilities of deposit-taking institutions until theend of March 2002, as well as to protect securities investors and insurance policyholders beyondthe limits until the end of March 2001.
Learning from these experiences, in 2000, legislation enabled the deposit insurance system tocommence the resolution of failed depository institutions as early as possible and to expeditebusiness transfer procedures. This framework is aimed at minimising depositor losses andpreserving the liquidity of deposits by maintaining financial functions to the greatest possibleextent so that the possibility of systemic risk is minimised. It was also stipulated that, in theevent of systemic risk, the Deposit Insurance Corporation might be authorised to protect allliabilities of a troubled financial institution as well as to inject capital into undercapitalisedbanks (systemic risk exceptions141).
139 Moreover, if consolidation promotes the dominance of particular trading and risk management practices andmodels, it will tend to increase positive feedback effects and induce herding behaviour, for instance, in terms ofsynchronising dynamic hedging among a number of market participants. As financial institutions have becomelarger, more global and increasingly capable of dominating relatively small financial markets, global portfoliodiversification on a large scale will increase, and, in fact, already appears to be increasing, the risk of positivecorrelation on a global scale in times of stress. For example, the fact that the depreciation of the Russian rouble inAugust 1998 led to a depreciation of the dollar, as well as the fact that bond and stock prices in Russia led to aplunge in stock prices in Latin America and partially in the United States, indicate that international markets havebecome strongly correlated due to the progress of global portfolio diversification.
140 The 1997 financial crisis was first triggered by the default of Sanyo Securities, a medium-sized securities firm, inthe interbank market. As the crisis developed, the Bank of Japan decided to provide liquidity support for theorderly winding down of Yamaichi Securities (one of the big four securities houses in Japan which announced thevoluntary closing of business) with a view to containing systemic risks. Yamaichi was a financial conglomeratethat held securities subsidiaries in nine major financial centers and two banking subsidiaries in Japan and theUnited Kingdom.
141 If the Prime Minister acknowledges the existence of systemic risk after consulting the Conference for FinancialCrisis, the Deposit Insurance Corporation may be authorised to protect all depositors and other creditors of atroubled financial institution by facilitating capital injection, financial assistance beyond the payoff cost limit, ortemporary nationalisation.

171
Japan’s new safety net framework may cope with systemic risk better than before. However,there are issues that require further consideration with regard to the failure of a very large bank.First, a substantial amount of public funds would probably be needed to cover the loss incurredby the failed bank. Obtaining approval from the Diet to appropriate funds might require a longtime during which the franchise value of the failed bank would deteriorate significantly,resulting in further losses. Second, it might not be easy to find a rescuer financial institution in atimely manner, particularly when the troubled bank’s prospects for restoring viability areuncertain. Third, when a financial group is a complex conglomerate comprising a bank andother financial institutions, the collapse of a non-bank firm within the group might threaten theviability of the bank because the counterparties of the financial group may trigger cross-defaultsagainst the bank, particularly when the firewalls among the firms are unclear. Fourth, the Bankof Japan might have to extend bridging loans to allow the failed bank to continue operations inorder to avoid market disruption until funds to cover the loss become available. Fifth, theexpectation of bailout would generate moral hazard on the part of very large banks.
These limitations underscore the importance of early correction rather than an early resolutionin coping with the problems of systemically important financial institutions. This is the rationalebehind the new deposit insurance system being authorised to inject capital into undercapitalisedbanks. However, such public subsidisation should only be allowed in truly exceptional casesbecause it could generate moral hazard and distort competition.
In this respect, the market mechanism remains a crucial tool in assessing the financial soundnessof financial institutions. In order to facilitate market discipline, continuous efforts to improvepublic disclosure are indispensable. Also, accounting rules should be more coordinated to makefinancial conditions with respect to different activities more transparent and comparable. Inaddition, an independent and strong compliance function as well as more developed auditingsystems are called for. For example, a risk-based performance evaluation and intrafirmcompetition between compliance offices related to different activities would probably enhancethe effectiveness of risk controls, although more centralised risk control models might besuitable for more traditional banking activities. Needless to say, there is no “one size fits all”type of risk control system. Each financial conglomerate should develop an original system inaccordance with its own risk profile. It should also be noted that while increased reliance onmarket discipline helps to detect problems earlier, it is like a double-edged sword in the sensethat it leaves only very limited time for the financial authorities to respond once a problemsurfaces and quickly develops in an unfavourable way. The markets might also react excessivelyto such a shock and generate irrational panic from time to time.
Early supervisory intervention could, therefore, be an especially important means to check thehealth of systemically important financial institutions. Effective supervisory intervention at afairly early stage could correct problems even before solvency is questioned. If such earlyintervention were successful, moral hazard could also be effectively checked becausemanagement should face penalties well before the use of public funds is hinted. Such(somewhat draconian) intervention may be justified with respect to systemically importantfinancial institutions because they are too important to be left to market mechanisms alone and,therefore, systemically important financial institutions inevitably remain the largest potentialbeneficiaries of safety nets.
Adequacy of data flowsA major challenge for the supervisory authorities is how to know when to intervene. Needless tosay, one of the methods of correcting problems at individual financial institutions is theenforcement of prompt corrective action (PCA), which was introduced in Japan in 1996. PCAcurrently relies primarily on risk-asset capital ratios but, useful as they may be, risks can bemeasured using different methods. Table III.16 shows the level of leveraging measured invarious ways, which implies that risk amounts of a financial institution can vary greatly inaccordance with measurement methods. These indicators may also prove to be useful insupplementing current PCA.

172
More generally, in order to discover problems at an early stage, supervisors should look intostructural and macroeconomic factors, such as infrastructural impediments, that can distortmarket mechanisms, the creation of irrational expectations that can lead to financial bubbles, inaddition to factors peculiar to individual financial institutions. For example, our experience tellsus that bank behaviour has clearly changed in accordance with the progress of riskaccumulation. Chart III.16 shows the relationship between lending spreads and the lendingattitude of Japanese banks. During the bubble period Japanese banks aggressively expandedlending with little regard to profitability, but this suddenly ended when the financial bubbleburst. Apparently, Japanese banks started to pay attention to lending spreads and becamecautious about asset expansion after stock prices plunged in February 1990.
However, it should be noted that the accumulation of risks could be detected in various aspectsof bank behaviour, and there is no such thing as an omnicompetent early warning indicator thatcan signal a warning for all problems. Thus, simple though it may be, it is important for thefinancial authorities to look carefully at various macro and micro indicators (various interestrates and asset prices, changes in transaction patterns, change in market players etc) that canaffect bank behaviour parallel with developments in economic and monetary conditions. In thisregard, an in-depth study of the past banking crisis may well offer useful insights intodeveloping indicators that capture behavioural changes with respect to financial institutions.142
Role of LOLR assistanceGiven the desirability of early intervention, lender of last resort (LOLR) assistance could proveto be the most effective means to cope with systemic risks, at least under the Japanese safety-netframework. The Bank of Japan has extended LOLR assistance in two different ways. Ex anteLOLR assistance aims at correcting irrational market pessimism by showing the central bank’sbelief that the institution concerned is solvent and viable. Ex post LOLR assistance is extendedto help meet all the liabilities of an institution to reduce panic, regardless of solvency.
Ex ante LOLR assistance relies on announcement effects. It could be extended either directly toan individual financial institution or via the market. In an idealistic environment in which thecentral bank enjoys unshakeable confidence from the market, simply announcing itscommitment to provide liquidity could correct market pessimism due, for example, toinformation asymmetry. Such commitment from the central bank could prove to be the cheapestand the most effective means to deter a self-fulfilling occurrence of systemic risk, sincesuccessful ex ante LOLR assistance could restore the corporate value of the financial institutionin question or conditions of the affected market. It should also be noted that in order to succeedin such ex ante LOLR assistance, the central bank must be seen by the market to be making anindependent decision concerning the solvency of the financial institution in question, unaffectedby political considerations. However, in the Japanese setting, an independent judgement impliesthat the Bank of Japan must be prepared to assume losses should they materialise. Moreover,there could be an instance in which the Bank might still deem it necessary to extend LOLRassistance to maintain financial system stability, even knowing that it could result in a loss witha certain probability.
Also, as one form of ex ante LOLR assistance, the central bank could temporarily supplementthe role of market-makers in terms of providing liquidity to the market as a market-maker of lastresort. For example, the central bank can engage in direct transactions with market participantswhen liquidity in the market dries up due to financial crises that incapacitate private market-makers. This role would be particularly effective if the market were overshooting because ofpanic. For example, during the crisis of the autumn of 1997 when the “Japan premium”increased significantly, the Bank of Japan played a role in intermediating liquidity from foreign
142 See Bank of Japan (2000).
173
banks to Japanese banks in the short-term money market in order to calm financial turmoil.143
As the panic subsided, market pessimism over Japanese banks’ solvency disappeared(Chart III.17).144
An obvious question is how to determine the scope of LOLR in the face of a systemic threat.This is particularly the case in an environment where the emergence of financial conglomeratesis blurring the distinction between banks and other non-bank financial institutions. In thisregard, ex ante LOLR assistance could also prove to be the more effective and a legally morejustifiable means for the central bank to cope with problems of non-bank financial institutionsbecause it aims at correcting market sentiment instead of bailing out non-deposit creditors.Thus, such extension of LOLR could be compatible with the objectives of the central bank thathas responsibility for financial system stability. Furthermore, liquidity can be provided not onlyto troubled financial institutions individually but also to financial markets as a whole throughmarket operations.
Ex post LOLR assistance is often used as a bridge for deposit insurance funds (or the provisionof funds by the government to cover losses) when the deposit insurance system is notsufficiently funded or empowered to design rescue plans for failed financial institutions.145 Expost LOLR assistance may not always be a practical choice to handle a very large financialconglomerate because it is often not realistic for the central bank to provide all the funds neededto meet the drain of liabilities without risking some side effects on monetary policy. Even if thegovernment guarantees repayment, central bank funds might have to be dedicated to the failureresolution for an undesirably long period until the funds are finally repaid, which couldundermine the flexibility of conducting monetary policy. Nevertheless, the central bank couldbe pressed to provide ex post LOLR assistance if the authorities failed to contain the risk at anearly stage.
143 The Bank of Japan provided relatively long-term yen funds to Japanese banks that had funding difficulties whileit absorbed yen funds from foreign banks that wished to invest risk-free yen assets in bills drawn by the Bank ofJapan. By acting as an intermediary between Japanese banks and foreign banks, it supplemented the marketfunction and contributed to alleviating the uneven distribution of funds caused by information asymmetries withrespect to the financial conditions of Japanese banks.
144 See eg Hanajiri (1999).145 At an early stage of the financial crisis in Japan, lack of a sufficient safety net led the Bank of Japan to provide
funds to cover losses in the forms of capital injection and profit support.

174
Table III.1Correlation analysis of bank ROE among US regions
Annual data, 1979-1998
Region(mean ROE)
NewEngland Mideast Great
Lakes Plains Southeast Southwest Rocky Mt Far West
New England 1(0.106949)
Mideast 0.65875 1(0.106738)
Great Lakes 0.02411 0.50080 1(0.120448)
Plains 0.10756 0.44102 0.66704 1(0.131574)
Southeast 0.84124 0.66657 0.25513 0.38250 1(0.126031)
Southwest 0.23662 0.60174 0.25345 0.69174 0.36296 1(0.090953)
Rocky Mt 0.26030 0.48990 0.43650 0.90354 0.46883 0.87720 1(0.121841)
Far West -0.28249 0.28071 0.69177 0.56564 0.07846 0.32124 0.39953 1(0.107647)
Sources: U.S. bank Call Reports, U.S. Bureau of Economic Analysis (BEA), Berger and DeYoung (2000).
Return on equity (ROE) = the aggregate net income for the banks in the region, divided by the aggregate book value of equity for the banksin the region.
Regions: New England (Connecticut, Maine, Massachusetts, New Hampshire, Rhode Island, Vermont); Mideast (Delaware, District ofColumbia, Maryland, New Jersey, New York, Pennsylvania); Great Lakes (Illinois, Indiana, Michigan, Ohio, Wisconsin); Plains (Iowa,Kansas, Minnesota, Missouri, Nebraska, North Dakota, South Dakota); Southeast (Alabama, Arkansas, Florida, Georgia, Kentucky,Louisiana, Mississippi, North Carolina, South Carolina, Tennessee, Virginia, West Virginia); Southwest (Arizona, New Mexico, Oklahoma,Texas); Rocky Mountain (Colorado, Idaho, Montana, Utah, Wyoming); Far West (Alaska, California, Hawaii, Nevada, Oregon,Washington).

175
Table III.2Total interdependencies
Correlation between firm average stock returns cross-correlations and consolidation intensity
Gross1 De-meaned2
LCBOs* coefficient 0.25 0.06t-stat 18.77 4.38
Active trading coefficient 0.36 0.11t-stat 11.64 3.6
Second tier coefficient 0.25 0.10t-stat 7.89 3.15
Trust and custody coefficient -0.07 -0.33t-stat -2.10 -10.66
CUSP coefficient 0.31 -0.02t-stat 10.38 -0.75
Traditional intermediaries coefficient 0.30 0.06t-stat 12.13 2.39
1 Correlation between firm average stock returns cross-correlation and consolidation intensity. 2 Correlation between firm averagedeviations of stock returns cross-correlation from the pooled mean and consolidation intensity.
* Correlations are computed using 474 firm-year observations.Coefficients that are significantly different from zero at a 5% significance level are reported in bold.
Table III.3Direct interdependencies
Correlation between firm measures of direct interdependencies consolidation intensity
Panel A Panel B Panel C
Short-term interbanklending/capital
Medium-to-long-termloans to banks/capital
Gross positive marketvalue/capital
gross1 de-meaned2 gross1 de-meaned2 gross1 de-meaned2
LCBOs* coefficient 0.14 0.08 -0.09 0.02 0.26 0.24t-stat 2.18 1.24 -1.40 0.34 2.80 2.51
Active trading coefficient 0.04 -0.29 -0.45 -0.21 -0.22 -0.47t-stat 0.28 -1.95 -3.22 -1.41 -0.97 -2.25
Second tier coefficient 0.39 0.26 -0.18 0.02 0.25 0.27t-stat 2.65 1.7 -1.15 0.14 1.01 1.1
Trust and custody coefficient 0.77 0.74 -0.19 -0.02 0.60 0.59t-stat 7.84 7.09 -1.29 -0.13 3.17 3.13
CUSP coefficient 0.31 0.32 0.17 0.12 0.51 0.40t-stat 2.08 2.16 1.1 0.76 2.48 1.79
Traditional coefficient -0.45 -0.24 -0.05 0.15 0.20 0.06intermediaries t-stat -4.00 1.98 1.37 1.22 1.07 0.31
1 Correlation between firm average measure of direct interdependencies and consolidation intensity. 2 Correlation between firm averagedeviations of measure of direct interdependencies from the pooled mean and consolidation intensity.
* Correlations are computed using 474 firm-year observations.Coefficients that are significantly different from zero at a 5% significance level are reported in bold.

176
Chart III.1Consolidation intensity
4: Trust and Custody
0
20
40
60
80
100
120
88 90 92 94 96 98
(%)
5: Cusp
0
20
40
60
80
100
120
88 90 92 94 96 98
(%)
6: Traditional Intermediaries
0
20
40
60
80
100
120
88 90 92 94 96 98
(%)
1: LCBOs
0
20
40
60
80
100
120
88 90 92 94 96 98
(%)
2: Active Trading
0
20
40
60
80
100
120
88 90 92 94 96 98
(%)
3: Second Tier
0
20
40
60
80
100
120
88 90 92 94 96 98
(%)

177
Chart III.2Average stock returns cross-correlations
Note: The dotted line depicts the time series of deviations of a group’s correlations from the LCBO average.
1: LCBOs Average
-0.10.00.10.20.30.40.50.60.7
89 91 93 95 97 99
2: Active Trading
-0.10.00.10.20.30.40.50.60.7
89 91 93 95 97 99
3: Second Tier
-0.10.00.10.20.30.40.50.60.7
89 91 93 95 97 99
4: Trust and Custody
-0.10.00.10.20.30.40.50.60.7
89 91 93 95 97 99
5: Cusp
-0.10.00.10.20.30.40.50.60.7
89 91 93 95 97 99
6: Traditional Intermediaries
-0.10.00.10.20.30.40.50.60.7
89 91 93 95 97 99

178
Chart III.3Short-term interbank lending – capital ratios
Note: The total LCBO short-term interbank lending-capital ratio (graph 1) is shown as a dotted line in the other graphs.
1: LCBOs
0
50
100
150
200
250
300
89 91 93 95 97 99
(%)
2: Active Trading
0
50
100
150
200
250
300
89 91 93 95 97 99
(%)
3: Second Tier
0
50
100
150
200
250
300
89 91 93 95 97 99
(%)
4: Trust and Custody
0
50
100
150
200
250
300
89 91 93 95 97 99
(%)
5: Cusp
0
50
100
150
200
250
300
89 91 93 95 97 99
(%)
6: Traditional Intermediaries
0
50
100
150
200
250
300
89 91 93 95 97 99
(%)

179
Chart III.4Medium- to long-term loans to banks – capital ratios
Solid line - medium- to long-term loans to all banks; dotted line - medium- to long-term loans to foreign banks.
1: LCBOs
0
25
50
75
100
89 91 93 95 97 99
(%)
2: Active Trading
0
25
50
75
100
89 91 93 95 97 99
(%)
3: Second Tier
0
25
50
75
100
89 91 93 95 97 99
(%)
4: Trust and Custody
0
25
50
75
100
89 91 93 95 97 99
(%)
5: Cusp
0
25
50
75
100
89 91 93 95 97 99
(%)
6: Traditional Intermediaries
0
25
50
75
100
89 91 93 95 97 99
(%)
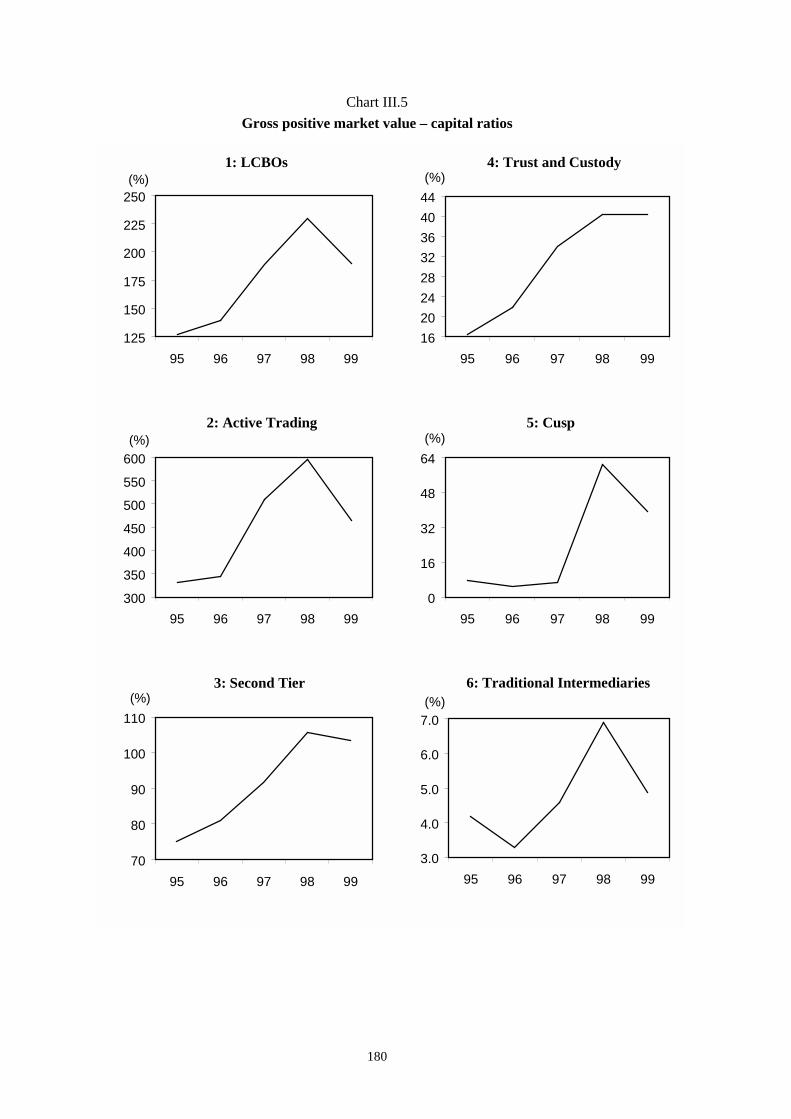
180
Chart III.5Gross positive market value – capital ratios
1: LCBOs
125
150
175
200
225
250
95 96 97 98 99
(%)
2: Active Trading
300
350
400
450
500
550
600
95 96 97 98 99
(%)
3: Second Tier
70
80
90
100
110
95 96 97 98 99
(%)
4: Trust and Custody
1620242832364044
95 96 97 98 99
(%)
5: Cusp
0
16
32
48
64
95 96 97 98 99
(%)
6: Traditional Intermediaries
3.0
4.0
5.0
6.0
7.0
95 96 97 98 99
(%)

181
Table III.4Values of target institutions in domestic European financial services
M&A activity from 1985 to 1997
Target institutionsAcquiring institution
Banks Securities Insurance
Commercial banks 89(36.0%)
9(3.6%)
20(8.1%)
Securities firms 23(9.3%)
19(7.7%)
24(9.7%)
Insurance companies 11(4.4%)
6(2.4%)
46(18.6%)
Sources: Berger et al (2000). Original sources DeLong, Smith and Walter (1998), Berger, Demsetz, and Strahan (1999) and Securities DataCompany. The main number shown in each entry is the sum of the equity values (in billions of USD) of the target institutions. The number inparentheses is the percentage of the total (these sum to 100 for each 3x3 matrix).
Table III.5Values of target institutions in cross-border European financial services
M&A activity from 1985 to 1997
Target institutions
Intra-Europe international M&As Europe - non Europe international M&AsAcquiringinstitution
Banks Securities Insurance Banks Securities Insurance
Commercialbanks
15.0(17.9%)
8.7(10.4%)
0.4(0.5%)
14.5(14.5%)
4.3(4.3%)
0.3(0.3%)
Securitiesfirms
4.3(5.1%)
5.8(6.9%)
1.1(1.3%)
15.6(15.6%)
15.9(15.9%)
12.9(12.9%)
Insurancecompanies
11.2(13.4%)
0.3(0.4%)
37.0(44.2%)
1.0(1.0%)
3.1(3.1%)
32.7(32.6%)
Sources: Berger et al (2000). Original sources DeLong, Smith and Walter (1998), Berger, Demsetz, and Strahan (1999) and Securities DataCompany. The main number shown in each entry is the sum of the equity values (in billions of USD) of the target institutions. The number inparentheses is the percentage of the total (these sum to 100 for each 3x3 matrix).

182
Table III.6Internationalisation of European Banking Systems, 1997
Market share of branches and subsidiaries(% of total domestic assets)
Average size of individual foreign branches and subsidiariesas % of total domestic assets
from EEA from non-EEAin othercountries
fromabroad
o/wbranches
o/wsubsidiaries
from allcountries branches subsidiaries branches subsidiaries
AT n.a 3.4 0.8 2.6 0.09 0.12 0.08 0.05 0.09BE n.a 36.3 15.9 20.4 0.51 0.36 1.20 0.46 0.08DE 27.9 4.2 1.6 2.6 0.03 0.02 0.05 0.02 0.03ES 14.9 11.7 6.4 5.3 0.15 0.15 0.16 0.08 0.32FI 13.1 7.1 7.1 0 0.79 0.79 0.00 0.00 0.00FR 29.2 9.8 5.2 4.6 0.03 0.05 n.a 0.06 n.aIR 34.6 53.6 18.9 34.7 1.09 0.98 1.32 0.40 0.99IT 15.2 6.8 5 1.8 0.11 0.10 0.43 0.08 0.03NL n.a 7.7 2.8 4.9 0.16 0.21 0.38 0.05 0.10SE n.a 1.7 1.4 0.3 0.09 0.09 0.00 0.03 0.20UK n.a 52.1 45.5 6.6 0.13 0.21 0.06 0.15 0.05
Source: ECB (1999) "Possible Effects of EMU on the EU Banking Systems in the Medium to Long Term". Pages 5.1 and 5.2.
Table III.7Interbank loans – domestic/euro-wide, USD billions
(% of total in brackets)
December 1995 December 1998 December 1999
Domestic Euro-area Domestic Euro-area Domestic Euro-area
France 895(78)
260(22)
925(79)
246(21)
n.an.a
n.an.a
Germany 1,408(91)
133(9)
1,757(90)
196(10)
1,500(89)
188(11)
Italy 158(77)
48(23)
159(69)
72(31)
n.an.a
n.an.a
UnitedKingdom
459*(58)
332(42)
520(50)
512(50)
510(48)
544(52)
* Excludes repos and bills. All data are on an unconsolidated basis, as reported in the sources.
Sources: Relazione Annuale 1998 (Italy), Deutsche Bundesbank Monthly Report February 2000 (Germany), Bulletin de la Banque deFrance, Supplément “Statistiques”, 3E Trimestre 1999 (France), Bank of England Monetary and Financial Statistics, February 2000 (UK).

183
Table III.8Cross-border interbank lending of banks operating in European countries
End-September 1996 End-September 1999
Europe1 Non-Europe Europe Non-EuropeCountry
USDbn
% ofGDP
% ofcapital2
% oftotal
assets4
USDbn
% ofGDP
% ofcapital2
% oftotal
assets4
USDbn
% ofGDP3
% ofcapital2
% oftotal
assets4
USDbn
% ofGDP
% ofcapital2
% oftotal
assets4
Austria 36.4 16.5 n.a. 8.4 19.5 8.8 n.a. 4.5 34.3 15.3 n.a. 7.9 19.0 8.5 n.a. 4.4Belgium 90.7 34.9 279.3 12.8 76.8 29.5 236.4 10.8 135.6 51.7 348.4 19.1 20.1 7.7 51.7 2.8Denmark 25.5 14.2 n.a. 13.5 13.2 7.4 n.a. 7.0 33.4 18.3 n.a. 17.7 11.9 6.5 n.a. 6.3Finland 11.6 9.2 n.a. 9.4 4.0 3.2 n.a. 3.3 13.3 10.0 n.a. 10.7 1.2 0.9 n.a. 1.0France 234.3 15.4 209.1 6.9 190.7 12.6 170.1 5.7 264.8 17.4 225.0 7.9 133.5 8.8 113.4 4.0Germany 205.0 8.9 142.9 4.2 127.2 5.5 88.7 2.6 304.8 13.6 173.6 6.3 105.2 4.7 59.9 2.2Ireland 20.5 80.4 n.a 18.9 5.2 20.2 n.a. 4.7 44.4 129.4 n.a. 40.9 12.8 37.2 n.a. 11.8Italy 101.0 8.3 131.3 6.3 34.5 2.8 44.9 2.2 94.6 7.7 114.8 5.9 17.7 1.4 21.5 1.1Luxembourg 187.8 1,100.1 3,654.2 31.8 41.9 245.4 815.0 7.1 204.3 1,119.4 3,541.4 34.6 23.0 126.2 399.4 3.9Netherlands 112.2 29.5 2,132.0 10.4 58.2 15.3 1,107.2 5.4 130.2 32.8 212.6 12.1 39.4 9.9 64.3 3.7Norway 1.8 1.1 n.a. 1.3 1.3 0.8 n.a. 1.0 3.5 2.4 n.a. 2.6 1.5 1.0 n.a. 1.1Spain 73.0 13.0 n.a. 8.2 26.0 4.6 n.a. 2.9 53.1 9.2 n.a. 6.0 13.8 2.4 n.a. 1.5Sweden 29.7 12.1 147.3 11.8 10.7 4.4 53.0 4.2 28.8 12.9 155.1 11.4 6.3 2.8 33.7 2.5Switzerland 341.3 125.6 514.2 28.4 57.4 21.1 86.4 4.8 488.1 175.2 879.5 40.7 115.5 41.5 208.2 9.6UK 388.4 30.3 347.3 20.6 430.7 33.6 385.2 22.9 594.7 42.7 377.0 31.6 460.6 33.1 292.0 24.5
Total Europe 1,859.2 1,097.3 2,427.9 981.5
MEMO
Japan 102.3 2.4 27.9 1.9 558.4 13.0 152.3 10.4 102.1 2.4 28.7 1.9 356.0 8.3 100.0 6.2United States 157.6 2.1 83.7 2.9 332.7 4.3 176.6 6.2 307.1 3.6 118.0 5.7 359.0 4.2 137.9 6.7
1 The countries included in the Europe category are: Austria, Belgium, Denmark, Finland, Germany, Ireland, Italy, Netherlands, Norway, Spain, Sweden, Switzerland and the UK. 2 Capital is defined as the net capitalbase of internationally active banks. The figures used in 1999 are the 1998 figures due to lack of more recent data. 3 The GDP figures used for 1999 are the 1998 figures due to lack of more recent data. 4 Total bankassets are for 1997.
Sources: Capital: Basle Committee on Banking Supervision: The Financial Strength and Performance of Internationally Active Banks (1999). GDP: IMF IFS. Interbank lending: BIS International Loans and Deposits:Geographical Location and Country Analysis Tables DL/1-3 (end-September 1996/1999). Total Assets: OECD Bank Profitability Report.

184
Table III.9Indicators of relative share of traditional and non-traditional banking activity
in (aggregate) European countries reporting to BIS
1990 1997
Loans 51 44Securities 13 22Assets (% of total)
Other 36 34
Interest 70 58Income (% of total) Non-interest 30 42
Source: OECD Bank Profitability 1999.
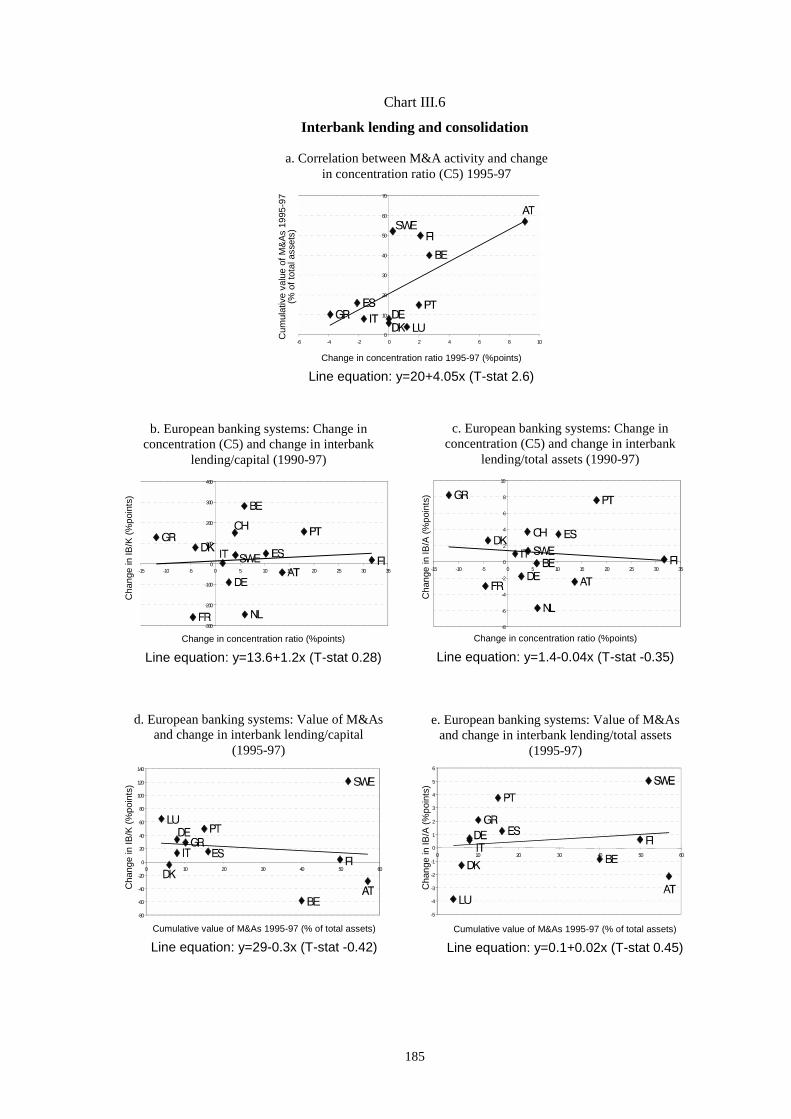
185
Chart III.6
Interbank lending and consolidation
FISWE
LU0
10
20
30
40
50
60
70
-6 -4 -2 0 2 4 6 8 10
Cum
ulat
ive
valu
e of
M&A
s 19
95-9
7(%
of t
otal
ass
ets)
Change in concentration ratio 1995-97 (%points)
Line equation: y=20+4.05x (T-stat 2.6)
a. Correlation between M&A activity and changein concentration ratio (C5) 1995-97
Cha
nge
in IB
/K (%
poin
ts)
Change in concentration ratio (%points)
Line equation: y=13.6+1.2x (T-stat 0.28)
b. European banking systems: Change inconcentration (C5) and change in interbank
lending/capital (1990-97)
CH
FI
-300
-200
-100
0
100
200
300
400
-15 -10 -5 0 5 10 15 20 25 30 35
Cha
nge
in IB
/A (%
poin
ts)
Change in concentration ratio (%points)
Line equation: y=1.4-0.04x (T-stat -0.35)
c. European banking systems: Change inconcentration (C5) and change in interbank
lending/total assets (1990-97)
CH
FI
-8
-6
-4
-2
0
2
4
6
8
10
-15 -10 -5 0 5 10 15 20 25 30 35
Cha
nge
in IB
/K (%
poin
ts)
Cumulative value of M&As 1995-97 (% of total assets)
Line equation: y=29-0.3x (T-stat -0.42)
d. European banking systems: Value of M&Asand change in interbank lending/capital
(1995-97)
FI
SWE
BE
LU
-80
-60
-40
-20
0
20
40
60
80
100
120
140
0 10 20 30 40 50 60
Cha
nge
in IB
/A (%
poin
ts)
Cumulative value of M&As 1995-97 (% of total assets)
Line equation: y=0.1+0.02x (T-stat 0.45)
e. European banking systems: Value of M&Asand change in interbank lending/total assets
(1995-97)
FI
LU-5
-4
-3
-2
-1
0
1
2
3
4
5
6
0 10 20 30 40 50 60

186
Chart III.6 (continued)
IB/K
(%)
Concentration ratioYears: 1990, 1995, 1996 and 1997 (sample period constrained by availability of C5 concentration data)
Line equation: y=602-3.4x (T-stat -1.66)
f. European banking systems: C5 concentration ratios andthe level of interbank lending/capital (all years)
0
200
400
600
800
1000
1200
1400
0 10 20 30 40 50 60 70 80 90 100
IB/K
(%)
Concentration ratio
Line equation: y=602-3.6x (T-stat -0.79)
g. European banking systems: C5 concentration ratios andthe level of interbank lending/capital (1990)
CH
GR
SWE
DK
NL
PT
BE
FR
FIES
AT
IT
DE
0
200
400
600
800
1000
1200
1400
0 10 20 30 40 50 60 70 80 90
IB/K
(%)
Concentration ratio
Line equation: y=610-3.3x (T-stat -0.79)
h. European banking systems: C5 concentration ratios andthe level of interbank lending/capital (1997)
CHSWE
NLPT
DK
GR
FI
BE
AT
ES
FR
IT
UK
DE
0
200
400
600
800
1000
1200
1400
0 10 20 30 40 50 60 70 80 90 100

187
Chart III.6 (continued)i. European banking systems: Level of total banking systems assets
and interbank lending/capital (all years)
IB/K
(%)
0 500 1000 1500 2000 2500 3000 3500
1000
1200
1400
0
200
400
600
800
Total assets (USD bn)Assets converted into national currencies using current (end-year) exchange rates
Line equation: y=298+0.16x (T-stat 4.52)
j. European banking systems: Level of total banking systems assetsand interbank lending/capital (1990)
IB/K
(%)
GR
PT
FIDKSWE
AT
BE
NL
ES
UK
IT
DE
FR
CH
1000
1200
1400
0
200
400
600
800
0 500 1000 1500 2000 2500Total assets (USD bn)
Line equation: y=227+0.3x (T-stat 2.48)
k. European banking systems: Level of total banking systems assetsand interbank lending/capital (1997)
IB/K
(%)
FIGR
DKPTSWE
ESNL
AT
BE
IT
UK
FR
DECH
0 500 1000 1500 2000 2500 3000 3500Total assets (USD bn)
Line equation: y=335+0.11x (T-stat 1.24)
Sources: IB/K, total assets - OECD Bank Profitability Report; Switzerland concentration ratio - BIS Quarterly Review: InternationalBanking and Financial Market Developments (August 1999); all other concentration ratios, value of M&As - ECB Working Groupon Developments in Banking.
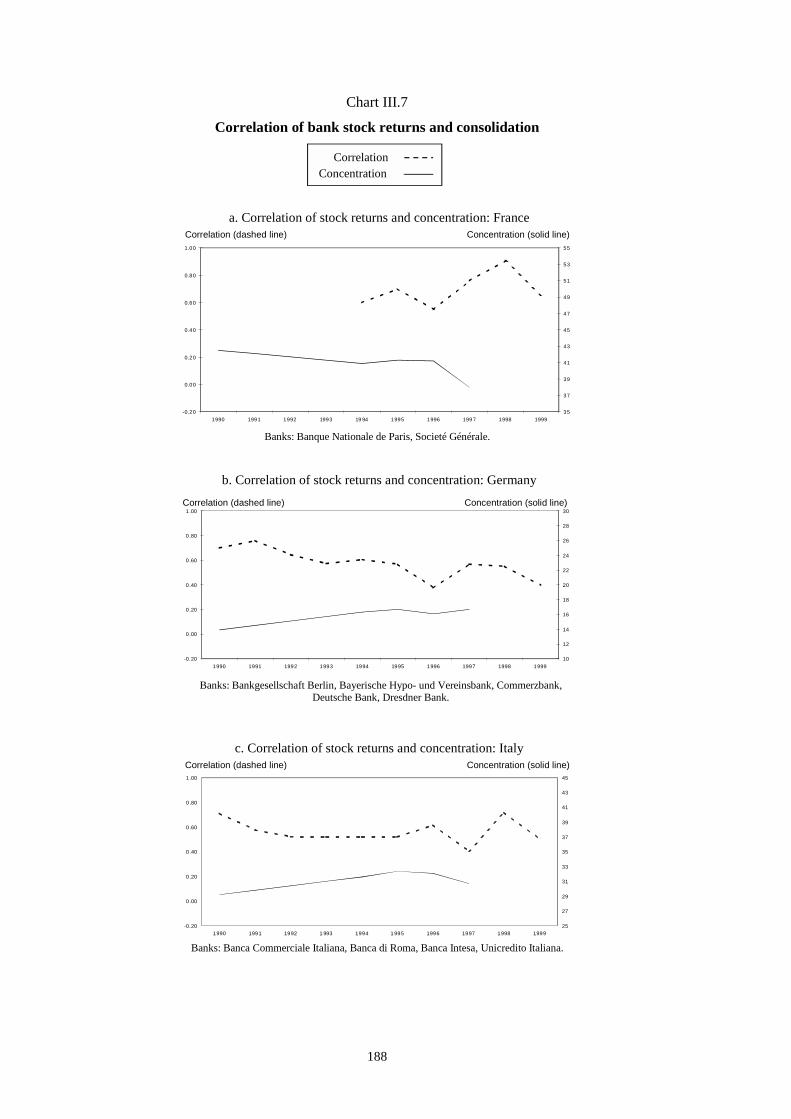
188
Chart III.7
Correlation of bank stock returns and consolidation
CorrelationConcentration
a. Correlation of stock returns and concentration: FranceCorrelation (dashed line) Concentration (solid line)
-0.20
0.00
0.20
0.40
0.60
0.80
1.00
1990 1991 1992 1993 19 94 1995 1996 199 7 1998 199935
37
39
41
43
45
47
49
51
53
55
Banks: Banque Nationale de Paris, Societé Générale.
b. Correlation of stock returns and concentration: GermanyCorrelation (dashed line) Concentration (solid line)
Banks: Bankgesellschaft Berlin, Bayerische Hypo- und Vereinsbank, Commerzbank,Deutsche Bank, Dresdner Bank.
-0.20
0.00
0.20
0.40
0.60
0.80
1.00
1990 1991 1992 1993 1994 1995 1996 1997 1998 199910
12
14
16
18
20
22
24
26
28
30
c. Correlation of stock returns and concentration: ItalyCorrelation (dashed line) Concentration (solid line)
Banks: Banca Commerciale Italiana, Banca di Roma, Banca Intesa, Unicredito Italiana.
-0.20
0.00
0.20
0.40
0.60
0.80
1.00
1990 1991 1992 1 993 1994 1 995 1996 1997 1998 199925
27
29
31
33
35
37
39
41
43
45
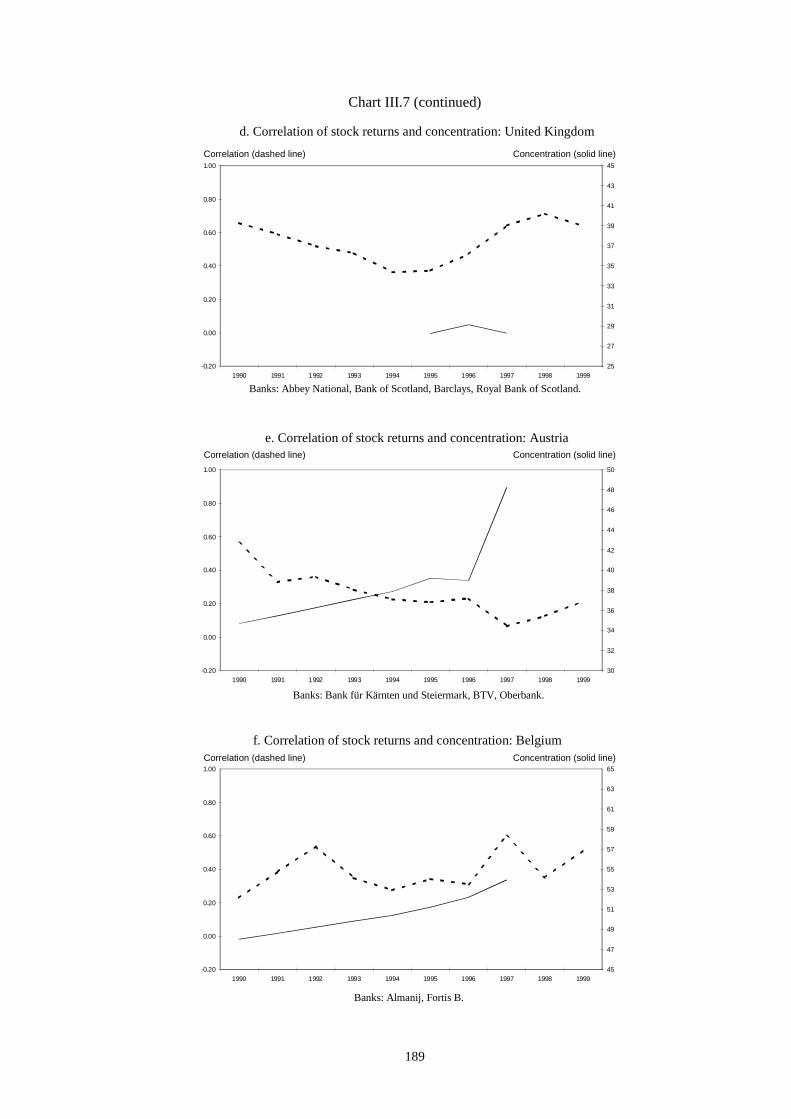
189
Chart III.7 (continued)
-0.20
0.00
0.20
0.40
0.60
0.80
1.00
1990 1991 1992 1993 1994 1995 1996 1997 1998 199945
47
49
51
53
55
57
59
61
63
65
-0.20
0.00
0.20
0.40
0.60
0.80
1.00
1990 1991 1992 1993 1994 1995 1996 1997 1998 199930
32
34
36
38
40
42
44
46
48
50
d. Correlation of stock returns and concentration: United KingdomCorrelation (dashed line) Concentration (solid line)
Banks: Abbey National, Bank of Scotland, Barclays, Royal Bank of Scotland.
e. Correlation of stock returns and concentration: Austria
Banks: Bank für Kärnten und Steiermark, BTV, Oberbank.
f. Correlation of stock returns and concentration: Belgium
Banks: Almanij, Fortis B.
-0.20
0.00
0.20
0.40
0.60
0.80
1.00
1990 1991 1992 1993 1994 1995 1996 1997 1998 199925
27
29
31
33
35
37
39
41
43
45
Correlation (dashed line) Concentration (solid line)
Correlation (dashed line) Concentration (solid line)

190
Chart III.7 (continued)
g. Correlation of stock returns and concentration: DenmarkCorrelation (dashed line) Concentration (solid line)
Banks: Den Danske Bank, Jyske Bank, Sydbank.
h. Correlation of stock returns and concentration: Greece
Banks: Alpha Credit Bank, Commercial Bank of Greece, EFG Eurobank, Ergobank,Macedonia Thrace Bank, National Bank of Greece, Piraeus Bank.
i. Correlation of stock returns and concentration: Ireland
Banks: Allied Irish Banks, Anglo-Irish Bank, Bank of Ireland.
Correlation (dashed line) Concentration (solid line)
Correlation (dashed line) Concentration (solid line)
-0.20
0.00
0.20
0.40
0.60
0.80
1.00
1990 1991 1992 1993 1994 1995 1996 1997 1998 199970
72
74
76
78
80
82
84
86
88
90
-0.20
0.00
0.20
0.40
0.60
0.80
1.00
1990 1991 1992 1993 1994 1995 1996 1997 1998 199970
72
74
76
78
80
82
84
86
88
90
-0.20
0.00
0.20
0.40
0.60
0.80
1.00
1990 1991 1992 1993 1994 1995 1996 1997 1998 199935
37
39
41
43
45
47
49
51
53
55

191
Chart III.7 (continued)
j. Correlation of stock returns and concentration: NetherlandsCorrelation (dashed line) Concentration (solid line)
Banks: Fortis NL, ABN Amro.
k. Correlation of stock returns and concentration: Spain
Banks: Banca Bilbao Viscaya Argentaria, Banco Español de Credito (BANESTO),Banco Popular Español, Banco Santander Central Hispano.
l. Correlation of stock returns and concentration: Sweden
Banks: Skandinaviska Enskilada Banken, Svenska Handelsbanken.
Correlation (dashed line) Concentration (solid line)
Correlation (dashed line) Concentration (solid line)
-0.20
0.00
0.20
0.40
0.60
0.80
1.00
1990 1991 1992 1993 1994 1995 1996 1997 1998 199970
72
74
76
78
80
82
84
86
88
90
-0.20
0.00
0.20
0.40
0.60
0.80
1.00
1990 1991 1992 1993 1994 1995 1996 1997 1998 199930
32
34
36
38
40
42
44
46
48
50
-0.20
0.00
0.20
0.40
0.60
0.80
1.00
1990 1991 1992 1993 1994 1995 1996 1997 1998 199980
82
84
86
88
90
92
94
96
98
100

192
Chart III.7 (continued)
Chart III.8
Correlation of average annual bank stock returnsby country 1990-94 and 1995-99
m. Correlation of stock returns and concentration: SwitzerlandCorrelation (dashed line) Concentration (solid line)
Banks: Banque Cantonale Vaudoise, Credit Suisse, UBS. Concentration data onlyavailable for 1990, 1997.
Note: Throughout Chart III.7 stock returns are measured as the weekly growth in shareprices (taken from Datastream). Correlations are the annual average of the correlation ofweekly stock returns for the banks in the sample.
-0.20
0.00
0.20
0.40
0.60
0.80
1.00
1990 1991 1992 1993 1994 1995 1996 1997 1998 199940
42
44
46
48
50
52
54
56
58
60
Country
France: data only available from 1994; Netherlands: data only available from 1991.
Correlation
0.0
0.1
0.2
0.3
0.4
0.5
0.6
0.7
0.8
0.9
1.0
FR NL CH BEL UK IRE DK GR IT SWE ESP DE AT Total
Av. Annual 90-94Av. Annual 95-99

193
Chart III.9 (a)Average annual national and European-wide
correlation of bank stock returns
-0.2
0.0
0.2
0.4
0.6
0.8
1.0
1990 1991 1992 1993 1994 1995 1996 1997 1998 1999Year
Correlation
Chart III.9 (b)Difference in average annual national and
European-wide correlation of bank stock returns
-0.2
0.0
0.2
0.4
0.6
0.8
1.0
1990 1991 1992 1993 1994 1995 1996 1997 1998 1999Year
Difference inaverage correlation
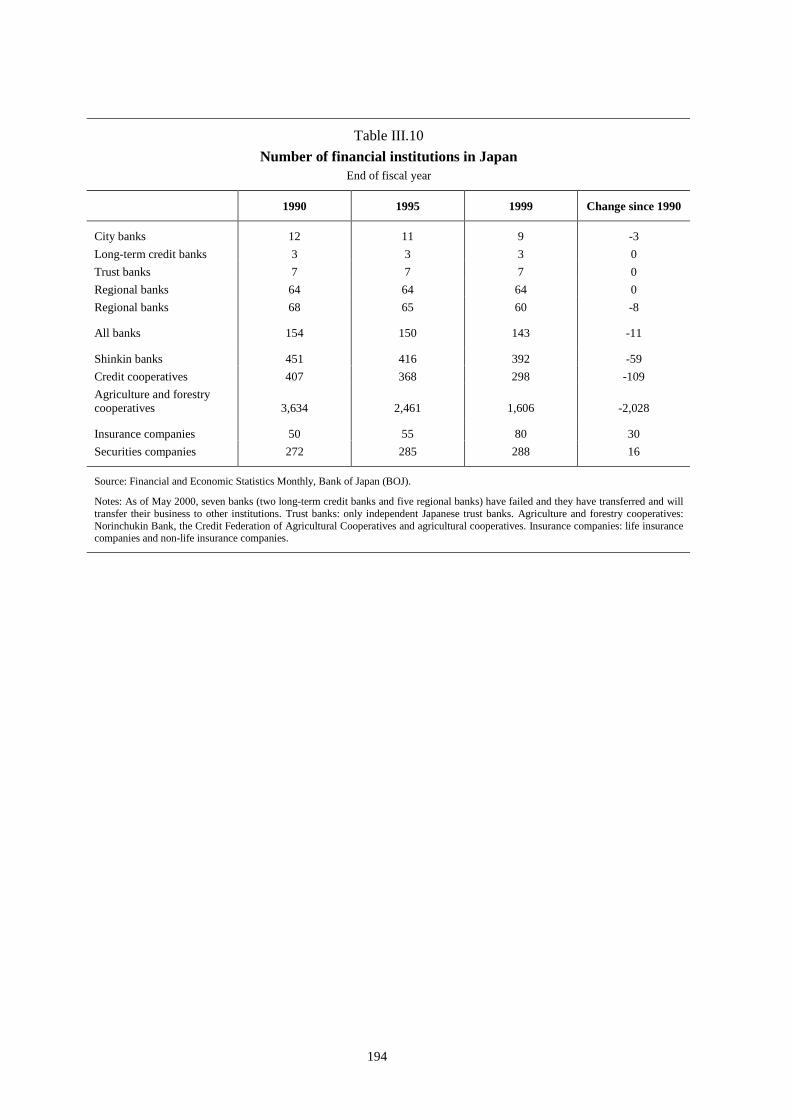
194
Table III.10Number of financial institutions in Japan
End of fiscal year
1990 1995 1999 Change since 1990
City banks 12 11 9 -3Long-term credit banks 3 3 3 0Trust banks 7 7 7 0Regional banks 64 64 64 0Regional banks 68 65 60 -8
All banks 154 150 143 -11
Shinkin banks 451 416 392 -59Credit cooperatives 407 368 298 -109Agriculture and forestrycooperatives 3,634 2,461 1,606 -2,028
Insurance companies 50 55 80 30Securities companies 272 285 288 16
Source: Financial and Economic Statistics Monthly, Bank of Japan (BOJ).
Notes: As of May 2000, seven banks (two long-term credit banks and five regional banks) have failed and they have transferred and willtransfer their business to other institutions. Trust banks: only independent Japanese trust banks. Agriculture and forestry cooperatives:Norinchukin Bank, the Credit Federation of Agricultural Cooperatives and agricultural cooperatives. Insurance companies: life insurancecompanies and non-life insurance companies.

195
Chart III.10
Correlation between asset size and profitability of major Japanese banks
-0.6
-0.4
-0.2
0
0.2
0.4
0.6
0.8
1
1984 1985 1986 1987 1988 1989 1990 1991 1992 1993 1994 1995 1996 1997 1998
Correlation
Source: Annual reports.Notes: 1. Correlation: correlation between asset size and ROE 2. ROE = profit / capital account 3. Major Japanese banks: top 20 banks in terms of asset size

196
Table III.11Recent Financial Consolidation
(1) Initiatives within the same segments
Institutionsinvolved
Type ofconsolidation Effective date Features
Banks Sumitomo Sakura Merger Apr 2001 Merger between banksbelonging to differentformer zaibatsu.
DKB Fuji IBJ Holding company Oct 2000 Resulting bankingorganisation rivals world’stop-tier banks in asset size.
Sanwa Tokai Holding company
Merger
Apr 2001
Apr 2002
Asahi bank left from theconsolidation.
Trust banks Chuo Trust MitsuiTrust
Merger Apr 2000 Fundamental businessreconstruction.
Sumitomo TrustDaiwa
Common subsidiary Oct 2000 Establishment of asubsidiary specialising inpension fund management.
Non-life insurancecompanies
Mitsui Sumitomo Holding company Apr 2002 Top market share.
Securitiescompanies
Universal TaiheiyoTowa Daiichi
Merger Apr 2000 Sanwa Tokai group.(Tsubasa Securities)
(2) Initiatives across segments
Institutions involved Type ofconsolidation Effective date Features
Tokyo Mitsubishi (banking)Mitsubishi Trust (trust)
Holding company Apr 2001 Consolidation of the Mitsubishi group.
IBJ bankingNomura securitiesDaiichilife insurance
Business alliance May 1998 IBJ and Nomura established a joint venturefor derivatives and fund management. IBJand Daiichi cooperate in productdevelopment and sales and entered into across-shareholding arrangement.
Sumitomo bankingDaiwa securities
Subsidiary Apr 1999 Establishment of a joint venture forwholesale securities, derivatives, and fundmanagement.
Source: Bank of Japan
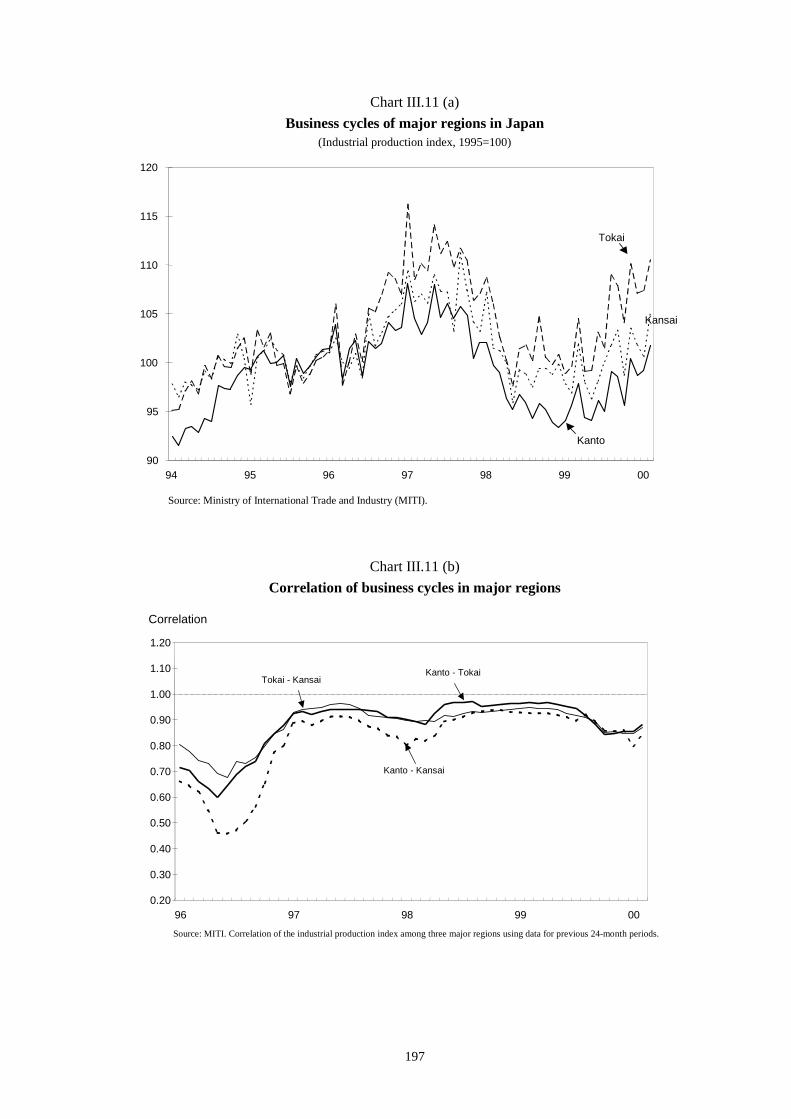
197
Chart III.11 (a)Business cycles of major regions in Japan
(Industrial production index, 1995=100)
Chart III.11 (b)Correlation of business cycles in major regions
90
95
100
105
110
115
120
94 95 96 97 98 99 00
Tokai
Kansai
Kanto
Source: Ministry of International Trade and Industry (MITI).
Correlation
0.20
0.30
0.40
0.50
0.60
0.70
0.80
0.90
1.00
1.10
1.20
96 97 98 99 00
Kanto - Tokai
Kanto - Kansai
Tokai - Kansai
Source: MITI. Correlation of the industrial production index among three major regions using data for previous 24-month periods.
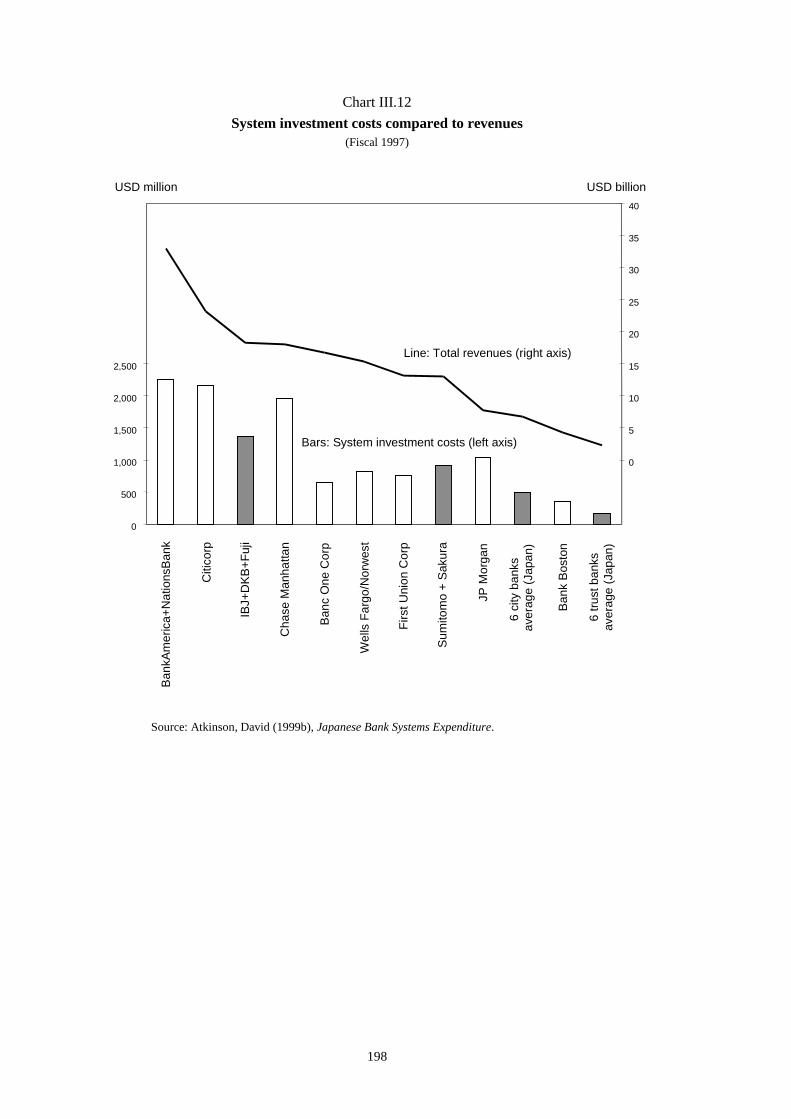
198
Chart III.12System investment costs compared to revenues
(Fiscal 1997)
Source: Atkinson, David (1999b), Japanese Bank Systems Expenditure.
0
500
1,000
1,500
2,000
2,500
0
5
10
15
20
25
30
35
40
Bank
Amer
ica+
Nat
ions
Bank
Citi
corp
IBJ+
DKB
+Fuj
i
Cha
se M
anha
ttan
Banc
One
Cor
p
Wel
ls F
argo
/Nor
wes
t
Firs
t Uni
on C
orp
Sum
itom
o +
Saku
ra
JP M
orga
n
6 c
ity b
anks
av
erag
e (J
apan
)
Bank
Bos
ton
6
trus
t ban
ks
ave
rage
(Jap
an)
Line: Total revenues (right axis)
Bars: System investment costs (left axis)
USD billionUSD million

199
Table III.12Business launches in Japan by foreign financial institutions
Businesssector
Effectivedate
Foreigncompany to
launchbusiness
Principalbusiness ofthe foreigncompany
Japanese companyinvolved Content
Banking Apr 2000 Ripplewood(US)
Privateequity
Long-Term CreditBank of Japan
Purchased Long-Term CreditBank of Japan which is underspecial public administration.
Securities Jul 1998 MerrillLynch (US)
Securities Yamaichi Securities Assumed the business of failedYamaichi.
Jan 1999 Travelers(US)
Insurance,securities
Nikko Securities Established a joint venture fortrusts, and entered into a cross-shareholding arrangement.
Insurance Mar 1998 GE Capital(US)
Non-bankfinance
Toho Mutual LifeInsurance
Established GE Edison LifeInsurance, a joint venture, andassumed the staff as well asbusiness franchise of failed Toho.Toho’s contracts will later beassumed in bulk.
Dec 1999 Artémis(France)
Retail Aoba Life Insurance Purchased failed Aoba from theLife Insurance Association ofJapan.
Apr 2000 Axa(France)
Lifeinsurance
Nippon Dantai LifeInsurance
Took over Nippon Dantai as asubsidiary of a newly establishedinsurance holding company.
Mar 1999 Manulife(Canada)
Lifeinsurance
Dai Hyaku MutualLife Insurance
Assumed the business of DaiHyaku through a newlyestablished joint venture.
Nov 1999 Aetna (US) Lifeinsurance
Heiwa Life Insurance Purchased 33% of Heiwa’s equity.
Non-bankfinance
Mar 1999
Mar 2000
GE Capital(US)
Non-bankfinance
Nippon Lease, Life Assumed the business of NipponLease, a leasing affiliate of LTCB,and will assume the business ofLife, a consumer financecompany.
Nov 1998 GE Capital(US)
Non-bankfinance
Lake Took over Lake, an independentconsumer finance company.
Source: Bank of Japan

200
Chart III.13Derivatives transactions: top four banks in Japan
0
2
4
6
8
10
12
14
16
18
3/97 3/98 3/99 3/000.0
2.0
4.0
6.0
8.0
10.0
12.0
USD trillion World share (%)
World share (right axis)
Notional principal amount (left axis)
Source: Annual reports (Japanese banks; Bank for International Settlements). Figures for 3/00 are reckoned byaggregating ten banks to be consolidated into four groups (Mizuho group, Sumitomo/Sakura, Sanwa/Tokai and Tokyo-Mitsubishi/Mitsubishi Trust). For 3/00, data of the ten banks concerned as of 3/99 are aggregated.

201
Chart III.14Bank loans, land prices and bankruptcies
-6.0%
-4.0%
-2.0%
0.0%
2.0%
4.0%
6.0%
8.0%
10.0%
12.0%
14.0%
1980 1982 1984 1986 1988 1990 1992 1994 1996 1998
-300
-200
-100
0
100
200
300
400
500
600
700
Sources: BOJ, National Land Agency, Tokyo Shoko Research.Bank loans: All Japanese banks (loans in trust accounts included).Land Price Index: price index for all commercial land (1980=100).Bankruptcy Index: index of total debts of firms declared bankrupt (1980=100).
Bank loans (left axis)
% change from previous year
Bankruptcy Index (right axis)
Land Price Index(right axis)
Index (1980=100)
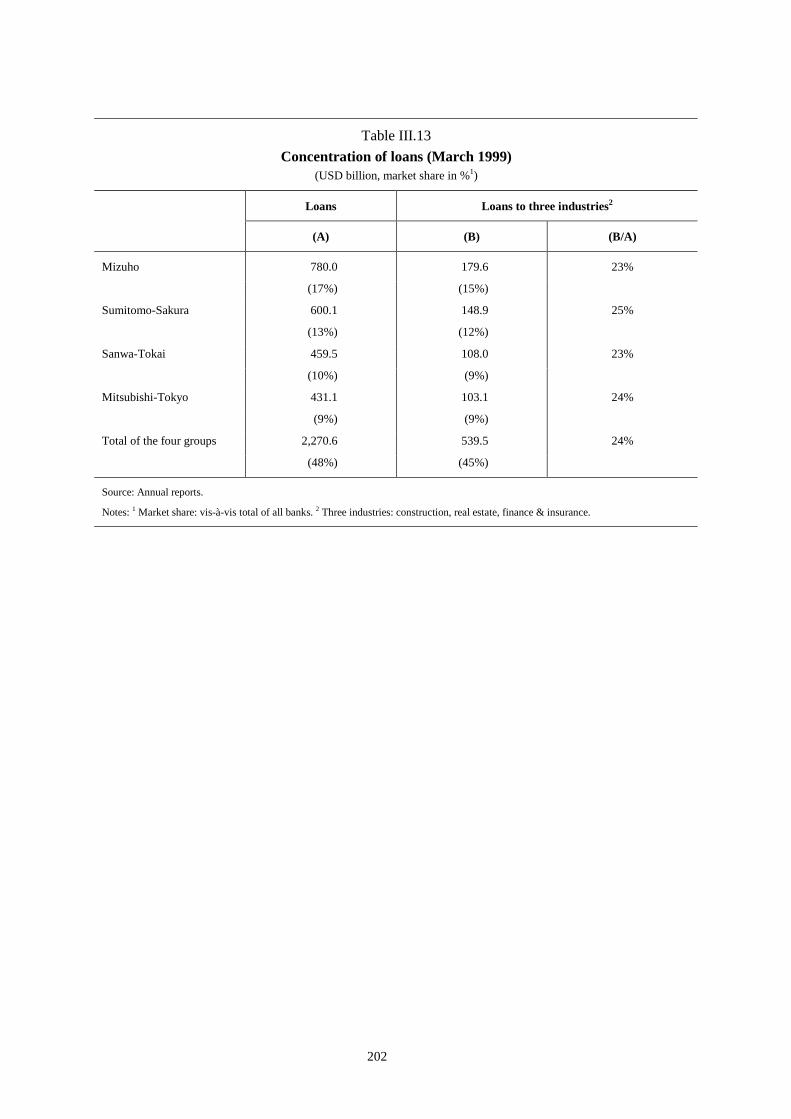
202
Table III.13Concentration of loans (March 1999)
(USD billion, market share in %1)
Loans Loans to three industries2
(A) (B) (B/A)
Mizuho 780.0 179.6 23%
(17%) (15%)
Sumitomo-Sakura 600.1 148.9 25%
(13%) (12%)
Sanwa-Tokai 459.5 108.0 23%
(10%) (9%)
Mitsubishi-Tokyo 431.1 103.1 24%
(9%) (9%)
Total of the four groups 2,270.6 539.5 24%
(48%) (45%)
Source: Annual reports.
Notes: 1 Market share: vis-à-vis total of all banks. 2 Three industries: construction, real estate, finance & insurance.

203
Chart III.15Shares of the top four banks in the call, NCD,
large-lot deposit markets
Source: Figures for fiscal 1999 are reckoned by aggregating banks to be consolidated intofour groups (Mizuho group, Sumitomo/Sakura, Sanwa/Tokai, Tokyo-Mitsubishi/MitsubishiTrust). For fiscal 1999, data of the nine banks concerned for fiscal 1998 are aggregated.Large-lot deposit is aggregated from fiscal 1994.
0
10
20
30
40
50
60
70
80
1982 1983 1984 1985 1986 1987 1988 1989 1990 1991 1992 1993 1994 1995 1996 1997 1998 1999
Borrowing
Lending
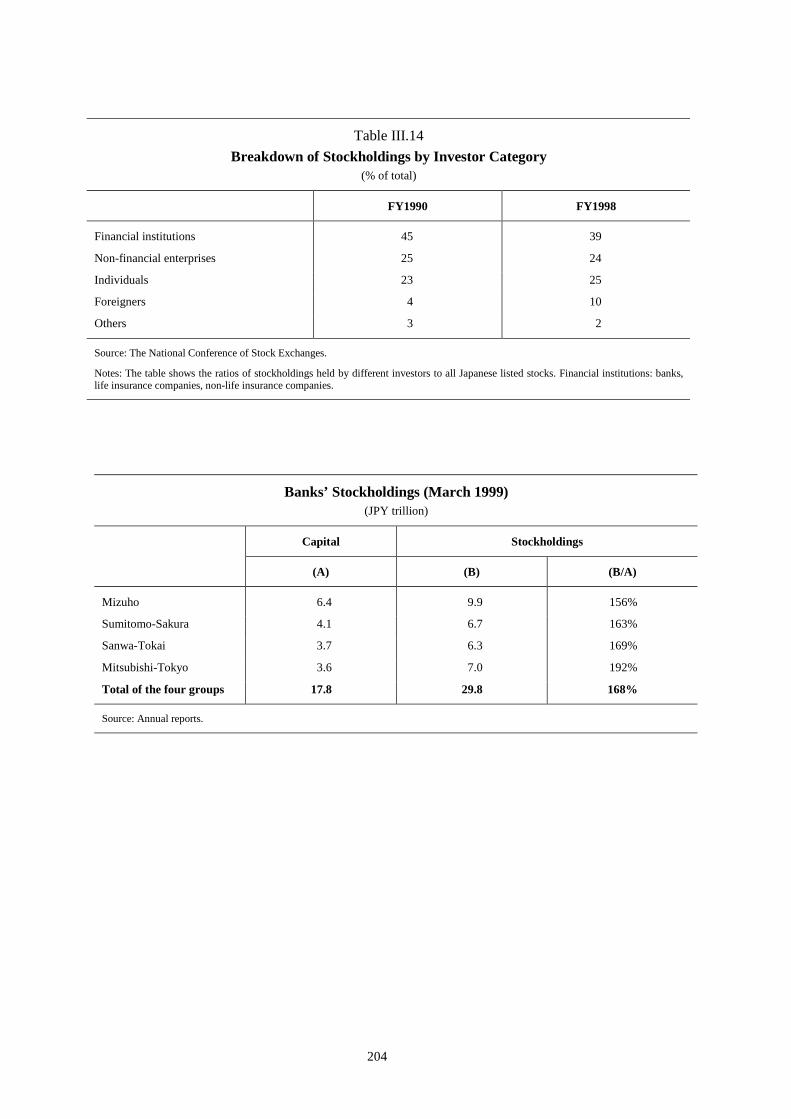
204
Table III.14Breakdown of Stockholdings by Investor Category
(% of total)
FY1990 FY1998
Financial institutions 45 39
Non-financial enterprises 25 24
Individuals 23 25
Foreigners 4 10
Others 3 2
Source: The National Conference of Stock Exchanges.
Notes: The table shows the ratios of stockholdings held by different investors to all Japanese listed stocks. Financial institutions: banks,life insurance companies, non-life insurance companies.
Banks’ Stockholdings (March 1999)(JPY trillion)
Capital Stockholdings
(A) (B) (B/A)
Mizuho 6.4 9.9 156%
Sumitomo-Sakura 4.1 6.7 163%
Sanwa-Tokai 3.7 6.3 169%
Mitsubishi-Tokyo 3.6 7.0 192%
Total of the four groups 17.8 29.8 168%
Source: Annual reports.

205
Table III.15Financial Liabilities and Assets of the Corporate and Household Sectors
(December 1998)(USD billion)
Japan (a) US (b) (b/a)
Financial Liabilities 14,345 100% 28,127 100% 2.0Borrowings 7,809 54% 9,382 33% 1.2Stocks 2,264 16% 11,945 42% 5.3Bonds 745 5% 1,927 7% 2.6Others 3,527 25% 4,873 17% 1.4
Financial Assets 17,955 100% 43,727 100% 2.4Cash & deposits 9,636 54% 6,018 14% 0.6Insurance and pension funds 3,318 18% 11,236 26% 3.4Investment trusts 345 2% 4,145 9% 12.0Securities 1,636 9% 9,700 22% 5.9Other 3,018 17% 12,627 29% 4.2
Source: Comparative Economic and Financial Statistics Japan and Other Major Countries, BOJ.
Notes: Total of non-financial enterprises and the household sector. Borrowings: from banks and other financial institutions.
Table III.16Risks Measured by Various Leverage Ratios
GOBSL (Times) GEL (Times) VL (%) Capital ratio (%)
Dai-Ichi-Kangyo 13.5 62.7 0.90 11.5IBJ 14.1 100.0 0.99 11.3Fuji 12.5 111.0 0.53 11.2Sumitomo 12.8 80.9 0.53 11.0Tokyo-Mitsubishi 14.8 89.9 0.48 10.5
Bankers Trust 21.8 368.3 0.79 14.1BankAmerica 9.8 72.4 0.20 11.6Chase 11.0 247.3 0.22 11.6
Source: Annual reports.
Notes: Japanese banks: Mar 1999; US banks: Dec 1997. Capital ratio: BIS based. VaR of Tokyo-Mitsubishi, Fuji: average of FY1998.VaR of BankAmerica: average of CY1997.
GOBSL: Gross on-balance sheet leverage = Assets/Capital. GEL: Gross economic leverage = (Risk assets + Risk liabilities + Notionalprincipal amounts of derivative transactions)/Capital. Risk assets = Assets – Cash, risk liabilities = Liabilities – Deposits. VL: VaRleverage = VaR/Capital
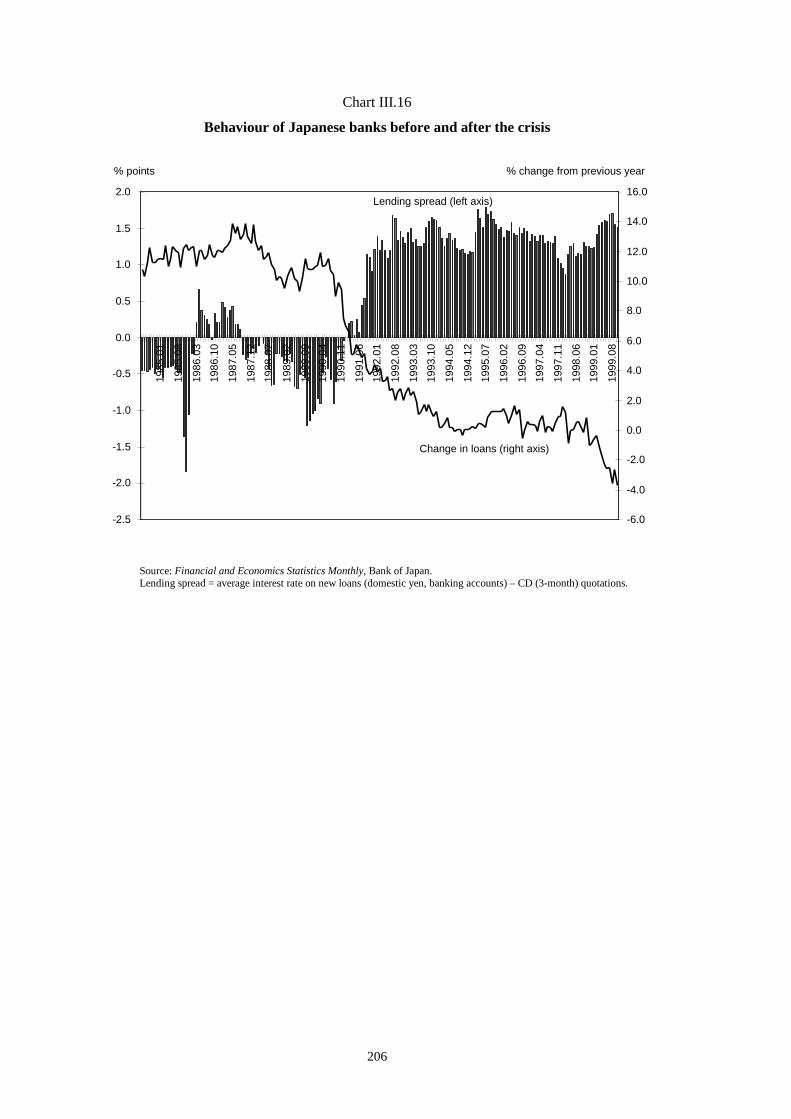
206
Chart III.16
Behaviour of Japanese banks before and after the crisis
Source: Financial and Economics Statistics Monthly, Bank of Japan.Lending spread = average interest rate on new loans (domestic yen, banking accounts) – CD (3-month) quotations.
-2.5
-2.0
-1.5
-1.0
-0.5
0.0
0.5
1.0
1.5
2.0
1985
.01
1985
.08
1986
.03
1986
.10
1987
.05
1987
.12
1988
.07
1989
.02
1989
.09
1990
.04
1990
.11
1991
.06
1992
.01
1992
.08
1993
.03
1993
.10
1994
.05
1994
.12
1995
.07
1996
.02
1996
.09
1997
.04
1997
.11
1998
.06
1999
.01
1999
.08
-6.0
-4.0
-2.0
0.0
2.0
4.0
6.0
8.0
10.0
12.0
14.0
16.0
Change in loans (right axis)
Lending spread (left axis)
% points % change from previous year
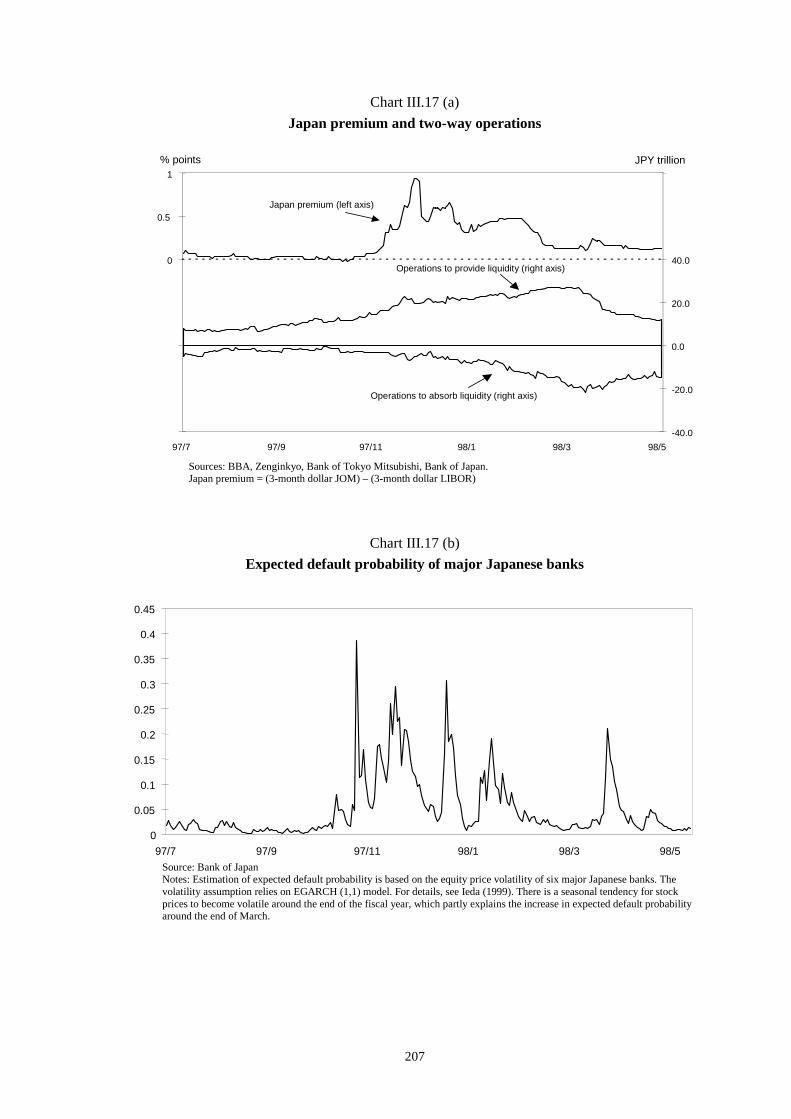
207
Chart III.17 (a)Japan premium and two-way operations
Sources: BBA, Zenginkyo, Bank of Tokyo Mitsubishi, Bank of Japan.Japan premium = (3-month dollar JOM) – (3-month dollar LIBOR)
Chart III.17 (b)Expected default probability of major Japanese banks
Source: Bank of JapanNotes: Estimation of expected default probability is based on the equity price volatility of six major Japanese banks. Thevolatility assumption relies on EGARCH (1,1) model. For details, see Ieda (1999). There is a seasonal tendency for stockprices to become volatile around the end of the fiscal year, which partly explains the increase in expected default probabilityaround the end of March.
0
0.5
1
97/7 97/9 97/11 98/1 98/3 98/5-40.0
-20.0
0.0
20.0
40.0
JPY trillion% points
Japan premium (left axis)
Operations to provide liquidity (right axis)
Operations to absorb liquidity (right axis)
0
0.05
0.1
0.15
0.2
0.25
0.3
0.35
0.4
0.45
97/7 97/9 97/11 98/1 98/3 98/5

208
Annex III.1The effects of consolidation on managing systemicrisk in Canada: the 1998 Bank Merger Decision
In 1998, four of Canada’s largest banks comprising approximately 70% of bank assets inCanada announced their intention to merge. In January 1998, the Royal Bank of Canada and theBank of Montreal made their announcement. This was followed in April of 1998 by theannouncement that the Canadian Imperial Bank of Commerce (CIBC) and TD Bank hadreached an agreement to merge. The Competition Bureau, the Office of the Superintendent ofFinancial Institutions (OSFI) and the Department of Finance examined the merger proposals indepth. On 14 December 1998, the Minister of Finance announced the government’s decision notto allow the two proposed mergers to proceed.
In announcing his decision, the Finance Minister noted that the mergers were not in the bestinterests of Canadians and would not be allowed because they would lead to:
• an unacceptable concentration of economic power in the hands of fewer, very largebanks;
• a significant reduction of competition; and
• reduced policy flexibility for the government to address potential future prudentialconcerns.
Assessment of impacts on the financial systemIn 1998, consolidation in the already very concentrated banking industry in Canada clearlyraised important questions about the potential impact on the overall Canadian financial system.In the context of the review of the merger proposals, the Superintendent of Financial Institutionswas asked to advise the Minister on whether there were prudential reasons why the two bankmerger proposals should not be considered. Specifically, the Superintendent was asked:
1. If the merger proposals were to be allowed, would there be circumstances or issueswhich would be likely to have a material, adverse impact on the financial viability ofeither merged bank going forward, or would there be other material concerns as to thesafety and soundness of either merged bank?
2. If the merger proposals were to be allowed and one of the merged banks were toexperience serious financial problems, would the resolution of those problems be moredifficult than would be the case if any one of the predecessor banks experienced suchproblems?
To develop a view on the prudential aspects of the two merger proposals, OSFI began with ananalysis of the current financial condition and risk profile of each of the merging banks, basedon existing supervisory information. OSFI then considered relevant literature on mergers,consulted with other regulators on their merger experience, and worked with the banks toreview and analyse the merger proposals, financial forecasts and relevant reports, and to discussmerger strategies and integration plans. The views of several banks and federal governmentagencies were also sought on issues to be considered in the resolution of any serious financialproblems encountered by the merged banks.
There were certain limitations on OSFI's review that included the following:
• Canadian experience with large mergers, particularly in the financial sector, waslimited. Therefore, much of the merger literature reviewed by OSFI related toAmerican transactions, and most dealt with acquisitions as distinct from “mergers ofequals”;

209
• There were constraints on the merging banks’ sharing of confidential and proprietaryinformation with their potential merger partners and as a result, detailed integrationplans had not been completed when OSFI’s assessment was underway.
Institution-specific analysisThe Superintendent concluded that it was not possible to make generalised statements as towhether larger banks are financially stronger than smaller banks or whether mergers of financialinstitutions increase or decrease their financial strength. He concluded that the record was mixedand that there were examples of both increased and decreased financial strength.
He did note, however, that mergers of large institutions are difficult to accomplish and createmajor challenges in developing a coherent strategy for the new organisation, and in integratingpeople, processes, technologies and risk management frameworks. The quality of the strategyand the integration process can significantly affect the success of the merger. Because of theimportance of the integration process, the merged institution is at greatest risk in the periodshortly following the merger, during which most of the integration activity takes place.
Despite these evident risks associated with mergers, OSFI did not identify circumstances orissues that would be likely to have a material, adverse impact on the financial viability of eithermerged bank, nor did OSFI identify other material concerns as to the safety and soundness ofthe merged banks. Therefore, OSFI was not able to identify any prudential reasons why the twomerger proposals should not be considered. However, the Superintendent did point out that theincreased size and complexity of the merged banks would create supervisory challenges andcould require new approaches.
In considering the issue of resolving serious financial problems encountered by either of themerged banks, the Superintendent noted that prior experience had to be taken into account.While Canadian financial institutions had experienced problems in the past, in some casesleading to failure, there had been few failures of large financial institutions and, for many years,no failures of major Canadian banks.
The four merging banks had argued that their merger proposals, if allowed, would enhancefinancial strength and reduce the risk of significant financial problems, thus diminishing thepossibility that any resolution issues would arise. The banks and OSFI also discussed strategies,building on the two merger proposals, which would have reduced the risk profiles of the mergedbanks. However, OSFI was not able to conclude, on the basis of existing evidence, that themerged banks arising out of the two merger proposals would necessarily be financially strongerthan their predecessors. They could be stronger, but much would depend on success achieved inintegrating the merging banks and in executing strategies directed at reducing their risk profiles.
System concernsThe Superintendent noted that currently, if a major Canadian bank were to experience seriousfinancial problems, there would be a range of options available to the bank, its shareholders andcreditors as well as OSFI, the Canada Deposit Insurance Corporation and, if necessary, the Bankof Canada, for resolving these problems. These options could include one or more of:
• recapitalisation;
• sale of individual businesses;
• various forms of restructuring;
• liquidation and piecemeal or en bloc sales of individual assets and business lines; and
• an outright sale of the bank to another financial institution.
The Superintendent concluded that if the mergers were approved and one of the merged banksexperienced serious problems, these options would probably remain, but, given the relative size
210
of the institution in relation to potential buyers and investors, some would be more difficult andmore time-consuming to implement, and a “least cost” resolution could be more difficult toachieve. Furthermore, to make full use of certain options, changes to ownership, competitionand other policies might be required.
The decisionIn releasing the government’s decision in 1998, the Minister of Finance noted that theSuperintendent had not ruled out either merger for prudential reasons, but did raise someimportant and legitimate issues about their potential impact on the overall financial system,which the government had to consider.
The Minister noted that when a financial institution gets into trouble, it is vitally important thatthere be as many options as possible available to work out the difficulties and that historically,in Canada, when a financial institution faced difficulties, one possibility was always to sell itsoperations to other, stronger Canadian competitors. After the proposed mergers, if one of thenew merged banks were to experience difficulties, a sale to another domestic firm couldseriously reduce the level of competition within the Canadian sector. If this were not acceptable,the government could be faced with a situation where the only other option would be a sale to aforeign institution. But, given the size of the banks that would result from the proposed mergers,such a sale of assets to a foreign institution would result in a substantial reduction in Canadianownership and control.
Ultimately, the government decided that the sheer size of the institutions that would result fromthe mergers would constrain unacceptably the alternatives available to regulators and to thegovernment in the face of a large financial institution in difficulty.
Conclusion
In June 1999, the government of Canada released a new policy framework for the financialservices industry, which included measures to increase competition in the industry in Canadaand to encourage new entrants. In that document, the government also acknowledged thatmergers among financial institutions were a legitimate business strategy and a new, transparentmerger review process was established to cover mergers involving large Canadian banks withover CAD 5 billion in equity. As part of that process, the Superintendent of FinancialInstitutions will be asked to advise the Minister of Finance regarding any prudential concernsraised by proposed mergers.
The Canadian banking sector remains one of the most concentrated financial sectors in theworld. The failure resolution issue will, therefore, continue to form a part of the government’sconcerns in relation to any future consolidation in the financial sector. The extent of the problemposed by any particular merger proposals will depend on the size and number of partiesinvolved as well as on the overall structure of the industry and the presence and position ofother industry participants that are not involved in the merger.
211
Annex III.2Potential effects of strategic alliances on financial risk
Strategic alliances can be defined as interfirm relationships that involve the creation of tangibleor intangible assets over which each firm has some control. Strategic alliances lie somewherebetween arm’s-length contractual relationships with no direct sharing of decision-making,returns and risk, and mergers and acquisitions with complete sharing of decision-making, riskand reward. A key characteristic that distinguishes strategic alliances from mergers andacquisitions is their lower costs of formation and dissolution. Strategic alliances include (i) jointventures, where firms share costs, rewards and benefits of a focused investment through theformation of a new corporate entity, (ii) operating agreements among firms backed by exchangeof minority equity stakes, and (iii) joint marketing and distribution agreements.
The potential effects of a strategic alliance on firms’ individual risks are in general ambiguous.First, the sharing of risks of a particular business carried out through an alliance, together withthe limited equity stake each firm might commit, could induce alliances to be formed with theaim of investing in highly risky projects. Second, the focus of an alliance on particular businesslines might increase the concentration of lending to or borrowing from particular firms orsectors. Third, if an alliance is formed by firms of different financial strength and the strongestfirm initiates its dissolution, such action might be viewed by the market as a signal of increasedweakness of the other firms, exposing them to reputation risk. In all these cases, the risk profileof one or several members of an alliance could increase, ceteris paribus.
Alliances potentially leading to a reduction of individual firm risk might be those that allowfirms to share costly infrastructures, thereby decreasing their costs and increasing their returns.Joint marketing and distribution agreements might also lead to reduced risk through increases inreturns due to sharing and profiting from individual firms’ common customer bases.Furthermore, alliances may be a low cost device to gauge the profitability and risks involved ina full merger, thereby decreasing the likelihood that a firm undertakes an unprofitable merger oracquisition. Also, the lower cost of dissolving an alliance facilitates opting out of it in the caseof perceived or actual lack of profitability of the joint activity. Thus, individual firms’ riskmight be reduced by the alliance’s low-cost option of divesting a low-return investment. Giventhe great variety of forms alliances can take, a reliable assessment of their effects on anindividual firm’s risk would require a case by case evaluation.
Strategic alliances could increase the potential for systemic risk through increases in firms’direct and indirect interdependencies. For example, alliances backed by cross-shareholdingsmay result in an increase in firms’ direct interdependencies, which might augment the impactand transmission effects of a shock. Indirect interdependencies may also increase throughalliances’ correlated exposures to economic sectors or financial markets. The sharing ofcommon customer bases through alliances might make firms more vulnerable to shocksoriginating in the sectors where these customers operate. Likewise, the impact and transmissioneffects of a shock might increase under alliances that induce firms to provide funds to the samedebtors, thereby increasing the concentration of the exposures of each firm in an alliance.Finally, reputation effects might lead to potential increases in systemic risk, since difficulties ata firm participating in an alliance might be perceived as spilling over to the other firms in thealliance, decreasing market confidence in the financial health of the entire set of allied firms. Atthis point, however, the practical significance of the possibilities is unknown, and thus strategicalliances represent an interesting area of future research.

212
Annex III.3Consolidation and the liquidity of financial markets
For a number of years, observers have noted a trend towards a reduction in the number ofmarket-making institutions in off-exchange traded securities markets (including foreignexchange). Table III.A3.1 suggests that this trend is not uniform. It shows concentration ratiosand Herfindahl indices for interest rate and currency derivatives activity for a group of 100 largeinternationally active banks. The market share of the top five institutions in currency derivativesactivity increased only modestly from 23% to 25% between 1998 and 1999, against a moderatedecline in the overall market size. In contrast, the equivalent measure for interest rate productsjumped from 25% to 32% over the same period, which is also characterised by a markedincrease in the activity of that market. The other measures of market share and the Herfindahlindices show similar patterns.
Table III.A3.1
Concentration in the global derivatives markets
Currency derivatives Interest rate derivatives
1998 1999 1998 1999
Total (USD bn) 33,112 31,034 79,724 105,984
Top 5 (%) 22.9 25.4 25.0 31.9
Top 10 (%) 37.8 40.5 39.1 48.0
Top 20 (%) 59.1 61.9 59.3 67.7
HI 0.0234 0.0255 0.0256 0.0334
Source: Swaps Monitor (various issues).
It is not clear a priori whether increased concentration has a positive or negative effect onfinancial market liquidity.146 On the one hand, an increase in concentration does not necessarilylead to a reduction in market liquidity, as long as the aggregate capital base devoted to market-making is sufficiently large in relation to total trading activity, and if the number of significantplayers remains large and barriers to entry low. Indeed, it can be argued that larger institutionswith more capital (in absolute terms) and a greater number of customers can provide moreefficient order-matching and capitalise on economies of scale and greater flexibility inallocating capital to the market-making function. On the other hand, a smaller number ofparticipating institutions may restrict the ability of each to execute large orders anonymously,possibly reducing overall liquidity, and resulting in an increased cost of execution and highercosts to the end user. Moreover, a reduction in the number of market participants and anincrease in their market shares may result in higher aggregate intra-dealer exposures, and thusthe potential for market disruption may also increase in the event of the failure of a singleinstitution.
The discussion in Chapter IV indicates that central banks have not identified significant effectsof consolidation on either the liquidity or the volatility of financial markets in normal times.However, during periods of stress, such as the failure of one of the main market participants or
146 See Madhavan (2000).

213
in the aftermath of a currency crisis, the risk of a serious disruption to the functioning of themarket may be higher now than it has been in the past.147 The financial market disruptionsduring the autumn of 1998 in both developed and emerging market economies have beenpartially described as the result of major players withdrawing from their market-makingfunctions. A shrinkage in the capital base of these institutions and the impact of uncertaintyregarding effective credit exposures have been offered as explanations for this withdrawal.148
Note, however, that neither of these explanations is necessarily directly related to or caused byconsolidation.
The financial liquidity of emerging market economies might be affected by the consolidation ofG10 financial institutions although, again, the direction of the impact is unclear. On the onehand, consolidation may reduce the number of G10 institutions already operating in thesemarkets. On the other hand, an increase in the number of large institutions in the G10 countriesfollowing consolidation might raise the number of firms that perceive international expansion asa feasible option due to their enlarged size, and induce some to enter these markets. Althoughthe entry of G10 financial institutions in emerging market economies has steadily increased inthe past decade, it is unclear to what extent consolidation per se is a driving force of thisprocess.149 Whatever the motivation for entry, an increase in the number of institutions that haveimportant market-making functions in these markets is, ceteris paribus, likely to foster liquidity.This is because an increased presence of foreign dealers almost surely represents a net increasein risk capital devoted to this activity and also enhances the diversity of market participants.
A substantial presence of foreign banks operating in some small and medium-sized emergingmarkets may make such markets more vulnerable to shocks arising elsewhere, potentiallyexposing these markets to contagious liquidity shocks. A recent study, however, finds anegative relationship between foreign bank presence and the probability that a banking systemwill incur a crisis.150 This result suggests that even in distressed periods the liquidity ofemerging markets might not be adversely affected by the presence of foreign banks.
On balance, neither existing theory nor evidence supports a strong connection between currentlevels of consolidation among G10 banks and reductions in market liquidity. However, the issueis clearly important, particularly during periods of generalised financial stress, and a review thatexpands the list of relevant factors beyond consolidation might prove fruitful.
147 Bank for International Settlements (1992) provides an early presentation of this view. Similar concerns have beenraised in official circles recently with special focus on the foreign exchange market. For a discussion see ChapterV of the Bank for International Settlements Annual Report (June 2000).
148 See International Monetary Fund Capital Markets Report (December 1998), the Bank for InternationalSettlements Annual Report Chapters V and VII (June 1999) and the Committee on the Global Financial SystemReport (1999).
149 See Chapter VI of the International Monetary Fund Capital Markets Report (September 2000).150 Levine (1999).

214
References
Akhavein, Jalal D., Allen N Berger, and David B Humphrey (1997): “The Effects of BankMegamergers on Efficiency and Prices: Evidence from the Profit Function.” Review ofIndustrial Organization, 12: 95-139.
Allen, Linda and Anoop Rai (1996): “Operational Efficiency in Banking: An InternationalComparison.” Journal of Banking and Finance, 20: 655-672.
Allen, Franklin and Douglas Gale (2000): “Financial Contagion”, Journal of PoliticalEconomy, 108: 1-33.
Altunbas, Y, E P M Gardener, P Molyneux and B Moore (1999): “Efficiency in EuropeanBanking”, IEF Working Paper.
Altunbas, Y, D Maude and P Molyneux (1995): “Efficiency and Mergers in the UK (retail)Banking Market”, Bank of England.
Altunbas, Y, P Molyneux and J Thornton (1997): “Big Bank Mergers in Europe – An Analysisof the Cost Implications”, Economica, 64, pp 317-29.
Amihud Y and G Miller (1998): Bank Mergers and Acquisitions, Kluwer Academic Publishers.
Atkinson, David (1998): “Does Japan Need Only 2-4 Major Banks?”, Goldman SachsInvestment Research.
Atkinson, David (1999a): “Bank Mergers That Make Sense; Bank Mergers That Are Just Hype– How to Tell the Difference”, Goldman Sachs Investment Research.
Atkinson, David (1999b): “Japanese Bank Systems Expenditure – Fuji Bank Opens Pandora’sBox”, Goldman Sachs Investment Research.
Bank for International Settlements (CFCS, 1992): “Recent Developments in InternationalInterbank Relations” (The “Promisel Report”).
Bank for International Settlements (CFCS, 1998): “Implications of Structural Change for theNature of Systemic Risk”, September.
Bank for International Settlements (1998): “Implications of Structural Change on the Nature ofSystemic Risk ”.
Bank for International Settlements (1999): The Monetary and Regulatory Implications ofChanges in the Banking Industry, BIS Conference Papers 7.
Bank for International Settlements (1999a): “Central Bank Survey of Foreign Exchange andDerivatives Market Activity”, May.
Bank for International Settlements (1999b): “The Global OTC Derivative Market at End-June1999”, BIS Press Release, November 25.
Bank of Japan (2000): “Changes in Bank Behavior during the Financial Crisis – Experiences ofthe Financial Crisis in Japan”, The Eighth Central Banking Seminar of the IMF.
Basel Committee on Banking Supervision (1999): A New Capital Adequacy Framework,Consultative Paper.
Benston, George J, William C Hunter, and Larry D Wall (1995): “Motivations for BankMergers and Acquisitions: Enhancing the Deposit Insurance Put Option Versus EarningsDiversification.” Journal of Money, Credit, and Banking, 27(3): 777-788.
Benston, George J and George G Kaufman (1997): “FDICIA After Five Years: A Review andEvaluation”, Federal Reserve Bank of Chicago Working Paper (WP-97-1).

215
Berger, Allen N, Gerald A Hanweck, and David B Humphrey (1987): “Competitive Viability inBanking: Scale, Scope, and Product Mix Economies.” Journal of Monetary Economics 20(3):501-520.
Berger, A N, T H Hannan, (1989): The Price-Concentration Relationship in Banking, Review ofEconomics and Statistics, 71, 291-299.
Berger, Allen N, and David B Humphrey (1992): “Megamergers in Banking and the Use ofCost Efficiency as an Antitrust Defense.” Antitrust Bulletin, 37 (Fall), 541-600.
Berger, Allen N., Diana Hancock, and David B. Humphrey (1993): “Bank Efficiency Derivedfrom the Profit Function.” Journal of Banking and Finance, 17(2-3): 317-347.
Berger, Allen N (1995): “The Relationship Between Capital and Earnings in Banking.” Journalof Money, Credit and Banking, 27(2): 432-456.
Berger, Allen N, David B Humphrey, and Lawrence B Pulley (1996): “Do Consumers Pay forOne-Stop Banking? Evidence from an Alternative Revenue Function.” Journal of Banking andFinance 20(9): 1601-1621.
Berger, A N, T H Hannan (1997): Using Measures of Firm Efficiency to Distinguish AmongAlternative Explanations of the Structure-Performance Relationship, Managerial Finance 23, 6-31.
Berger, Allen N, and Loretta J Mester (1997): “Inside the Black Box: What ExplainsDifferences in the Efficiencies of Financial Institutions?” Journal of Banking and Finance, 21:895-947.
Berger, Allen N (1998): “The Efficiency Effects of Bank Mergers and Acquisition: APreliminary Look at the 1990s Data.” In Bank Mergers & Acquisitions, edited by Y Amihud andG Miller. Boston, MA. Kluwer Academic: 79-111.
Berger, A N, Hannan, T H (1998): The Efficiency Cost of Market Power in the BankingIndustry: A Test of the Quiet Life and Related Hypotheses, Review of Economics andStatistics, 80, 454-65.
Berger, Allen N, and Sally M Davies (1998): "The Information Content of Bank Examinations,"Journal of Financial Services Research, 14: 117-144.
Berger A, R De Young, G Udell (2000): “Efficiency Barriers to the Consolidation of theEuropean Financial Services Industry”, forthcoming European Financial Management.
Berger, Demsetz and Strahan (1999): “The Consolidation of the Financial Services Industry:Causes, Consequences and Implications for the Future”, Journal of Banking and Finance.
Berger, Allen N, and Loretta J Mester (1999): “What Explains the Dramatic Changes in Costand Profit Performance of the U.S. Banking Industry?” Board of Governors of the FederalReserve System.
Berger et al. (2000): “Globalization of Financial Institutions: Evidence from Cross-BorderBanking Performance, Brooking-Wharton Papers.
Berger, Allen N, Seth D Bonime, Daniel M Covitz, Diana Hancock (2000): “Why Are BankProfits So Persistent? The Roles of Product Market Competition, Informational Opacity, andRegional/Macroeconomic Shocks.” Journal of Banking and Finance, forthcoming.
Berger, Allen N, Seth D Bonime, Lawrence G Goldberg, Lawrence J White (2000): “TheDynamics of Market Entry: The Effects of Mergers and Acquisitions on De Novo Entry andSmall Business Lending in the Banking Industry.” Board of Governors of the Federal ReserveSystem.
Berger, Allen N, J David Cummins, Mary A Weiss, and Hongmin Zi (2000): “ConglomerationVersus Strategic Focus: Evidence from the Insurance Industry.” Board of Governors of theFederal Reserve System.
216
Berger, Allen N, and Robert DeYoung (2000): “The Financial Performance of Cross-RegionalCommercial Banks in the U.S.: Some Clues Regarding the Eventual Structure of aConsolidating Industry.” Board of Governors of the Federal Reserve System.
Berger, Allen N, Robert DeYoung, Hesna Genay, and Gregory F Udell (2000): “TheGlobalization of Financial Institutions: Evidence from Cross-Border Banking Performance.”Brookings-Wharton Papers on Financial Services, 3.
Bernard, Henri and Joseph Bisignano (2000): “Information, Liquidity and Risk in theInternational Interbank Market: Implicit Guarantees and Private Credit Market Failure”, BISWorking Paper no. 86, March.
Bikker, J A and H J Groeneveld (1998): “Competition and Concentration in the EU BankingIndustry”, De Nederlandsche Bank Staff Reports, pp 1-31.
Board of Governors of the Federal Reserve System (December, 1999): Using SubordinatedDebt as an Instrument of Market Discipline, Staff Study 172.
Board of Governors of the Federal Reserve System (March, 2000): Improving Public Disclosurein Banking, Staff Study 173.
Bowen A, G Hoggarth and D Pain (1999): “The Recent Evolution of the UK Banking Industryand Some Implications for Financial Stability”, in The Monetary and Regulatory Implications ofChanges in the Banking Industry, BIS, Basel.
Boyd, John H, Stanley L Graham, and R Shawn Hewitt (1993): “Bank Holding CompanyMergers with Nonbank Financial Firms: Effects on the Risk of Failure.” Journal of Banking andFinance, 17(1): 43-63.
Brown, M, N Genetay and P Molyneux (1996): “Risk effects of bank diversification into lifeassurance: UK evidence” mimeo University of Wales Bangor.
Calem, Paul, Erik Heitfield, and Stephen Rhoades (2000): “The Persistence of Local MarketProfits in Banking and the Determinants of Persistence, 1972-1997.” Board of Governors of theFederal Reserve System.
Caprio, G Jr, William C Hunter, George G Kaufman, Danny M Leipziger (1998), “PreventingBank Crises: Lessons from Recent Global Bank Failures’’, EDI Development Studies, TheWorld Bank.
Caprio, G Jr and D Klingebiel (1996) “Bank Insolvency: Bad Luck, Bad Policy, or BadBanking?”, Annual World Bank Conference on Development Economics.
Carey, Mark S (forthcoming): “Dimensions of Credit Risk and Their Relationship to EconomicCapital Requirements.” in Frederic S Mishkin, ed., Prudential Supervision: What Works andWhat Doesn't, National Bureau of Economic Research, University of Chicago Press(Chicago, IL), forthcoming.
Clark, Jeffrey and Thomas F Siems (1997): “Competitive Viability in Banking: LookingBeyond the Balance Sheet.” Federal Reserve Bank of Dallas, Financial IndustryStudiesWorking Paper No. 5-97.
Ciocca P, C Guissani and G Lanciotti (1984): “The Determinants of Banking Costs”, Bancad’Italia, Italian Credit Structures: Efficiency, Competition and Controls, London, Euromoney.
Committee for the Global Financial System (1992): “Recent Developments in InternationalInterbank Relations”, Basel. (The “Promisel Report”)
Committee for the Global Financial System (1999): “A Review of Financial Market Evens inthe Autumn of 1998”, Basel.
Committee on the Global Financial System (2000): “Report on Lender of Last Resort”, Bank forInternational Settlements.

217
Conigliani C, R De Bonis, G Motta and G Parigi (1991): “Economie di Scala e diDiversificazione nel Sistema Bancario Italiano”, Banca d'Italia, Temi di discussione, n. 150.
Cordella T and L Yeyati (1997): “Public Disclosures and Bank Failures”, IMF Working PaperWP/97/96, Washington.
Cornett, Marcia Millon, and Hassan Tehranian (1992): “Changes in Corporate PerformanceAssociated with Bank Acquisitions.” Journal of Financial Economics 31(2): 211-234.
Covitz, Daniel M, and Erik A Heitfield (1999): “Monitoring, Moral Hazard, and Market Power:A Model of Bank Lending.” Board of Governors of the Federal Reserve System.
Craig B, and J C dos Santos (1997): “The Risk Effects of Bank Acquisitions”, Federal ReserveBank of Cleveland Economic Review, 33, pp 25-35.
Danthine J P (1999): The Future of European Banking, CEPR, London. (Book)
De Bandt, Oliver and Philipp Hartmann (1998): “What is Systemic Risk Today?’’, Second JointCentral Bank Research Conference on Risk Measurement and Systemic Risk.
DeLong G L, R C Smith and I Walter (1998): “Global Merger and Acquisition Tables 1997.”Solomon Center, New York University.
Demsetz, Rebecca S and Phillip E Strahan (1997): “Diversification, Size, and Risk at BankHolding Companies.” Journal of Money, Credit, and Banking, 29(3): 300-13.
De Nicoló, G, (2000) “Size, Charter Value and Risk in Banking: An International Perspective”,mimeo, Board of Governors of the Federal Reserve System, September.
Dermine, J (1998): “Eurobanking, the Strategic Issues”, Paper prepared for the SUERFColloquium on the Euro: A Challenge and Opportunity for Financial Markets, Frankfurt,Germany, October 15-17.
Dermine, J (1999): “The Economics of Bank Mergers in the European Union, A Review of thePublic Policy Issues”, INSEAD, Fontainbleau.
Dermine, J and P Hillion (ed.) (1999): European Markets with a Single Currency, OxfordUniversity Press.
DeYoung, Robert, and Daniel E Nolle (1996): “Foreign-Owned Banks in the U.S.: EarningMarket Share or Buying It?” Journal of Money, Credit, and Banking, 28(4): 622-636.
DeYoung, Robert (1997): “Bank Mergers, X-Efficiency, and the Market for Corporate Control.”Managerial Finance, 23: 32-47.
Dierick, F (1999): “Concentration in the Belgian Banking Industry: Implications for theSupervisor”, paper presented at the 5th International Bank Research Seminar, Munich, 22-23November.
Dinenis, E and M Nurullah (2000): “Testing return and risk effects of European banks’diversification into insurance business” mimeo City University Business School.
Dornbusch, Rudiger, Yung Chul Park and Stijn Claessens (2000): “Contagion: How It Spreadsand How It Can Be Stopped? “, Washington, DC, mimeo.
European Central Bank (1999): “ Possible Effects of EMU on the EU Banking Systems in theMedium to Long Term” ECB Frankfurt.
European Central Bank (2000): “Mergers and Acquisitions Involving the EU Banking Industry– Facts and Implications”, Draft Report of the Working Group on Developments in Banking.
European Commission (1997): “Impact on Services: Credit Institutions and Banking”, TheSingle Market Review 2:4.
European Union Economic and Financial Committee (2000): “Report on Financial Stability”,Brussels. (Brouwer Report).
218
Fatàs, A (1997): “EMU: Countries or regions? Lessons from the EMS experience” EuropeanEconomic Review, 41 p743-751.
Favero C, X Freixas, T Persson and C Wyplosz (2000): “One Money, Many Countries”, CEPR,London.
FDIC (1997): An Examination of the Banking Crises of the 1980s and Early 1990s, Volume 1,Washington, D.C.
FDIC (August 1998): Managing the Crisis: The FDIC and RTC Experience 1980-1994,Washington, D.C.
Flannery, Mark J, and Joel F Houston (1999): "The Value of a Government Monitor for U.S.Banking Firms," Journal of Money, Credit, and Banking, 31; 14-34.
Focarelli, D, F Panetta and C Salleo (1998): “Why do Banks Merge: Some Empirical EvidenceFrom Italy”, In The Changing European Financial Landscape, European Summer InstituteCentre for Economic Policy Research.
Forbes, Kristin and Roberto Rigobon (1999): “No Contagion, Only Interdependence: MeasuringStock Markets Co-Movements”, NBER Working Paper #7267, July.
Forni, M and L Reichlin (1997): “National policies and local economies, Europe and the UnitedStates” CEPR discussion paper #1632.
Freixas, Xavier, Curzio Giannini, Glenn Hoggarth and Farouk Soussa (1999): “Lender of LastResort: A Review of the Literature”, Financial Stability Review, November: 151-167.
Freixas, Xavier, Bruno Parigi and Jean-Charles Rochet (1999): “Systemic Risk, InterbankRelations and Liquidity Provision by the Central Bank”, CEPR Working Paper #2325.
Freixas, X, C Giannini, G Hoggarth and F Soussa (2000): “Lender of Last Resort: What Havewe Learnt Since Bagehot?” Forthcoming in The Journal of Financial Services Research,Vol. 18.1.
Furfine, Craig (1999): “Interbank Exposures: Quantifying the Risk of Contagion”, BIS WorkingPaper 70.
Fuss, C (1997): “Europe of regions or Europe of nations? A dynamic factor analysis” mimeoDULBEA Université Libre de Bruxelles.
Garcia, G (1999): “Deposit Insurance: Actual and Best Practices” IMF Working PaperWP/99/54, Washington.
Garcia, G (2000): “Deposit Insurance and Crisis Management” IMF Working Paper WP/00/57,Washington.
Goldberg, Lawrence G, Gerald A Hanweck, Michael Keenan, and Allister Young (1991):“Economics of Scale and Scope in the Securities Industry.” Journal of Banking and Finance 15:91-107.
Gordy, Michael B (2000): “Credit VaR Models and Risk-Bucket Capital Rules: AReconciliation.” Board of Governors of the Federal Reserve System.
Groeneveld, J H (1999): “The Forces Behind the Consolidation Trend in the European BankingIndustry” Kredit und Kapital, 3, pp 1-24.
Gropper D (1991): “An Empirical Investigation of Changes in Scale Economies for theCommercial Banking Firm, 1979-1986”, Journal of Money, Credit and Banking, 23, pp 718-27.
Gual, J (1999): “Deregulation, Integration and Market Structure in European Banking” IESE,University of Navarra.

219
Hanajiri, Tetsuro (1999): "Three Japan Premiums in Autumn 1997 and Autumn 1998 – Why didpremiums differ between markets?", Financial Markets Department Working Paper Series 99-E-1, Financial Markets Department, Bank of Japan.
Hannan, Timothy H and John D Wolken (1989): “Returns to Bidders and Targets in theAcquisition Process: Evidence from the Banking Industry.” Journal of Financial ServicesResearch, 3(1): 5-16.
Hannan, T H (1991): Bank Commercial Loan Markets and the Role of Market Structure:Evidence from surveys of commercial lending, Journal of Banking and Finance, 15, 133-149.
Hannan, T H, A N Berger (1991): The Rigidity of Prices: Evidence from the Banking Industry,American Economic Review, 81, 938-945.
Hannan, T H (1997): Market Share Inequality, the Number of Competitors, and the HHI: Anexamination of bank pricing, Review of Industrial Organization, 12, 23-35.
Hannan, T H (1998): Bank Fees and their Variation Across Banks and Locations, Workingpaper, Board of Governors of the Federal Reserve System.
Hasan, Iftekhar and Ana Lozano-Vivas (1998): “Foreign Banks, Production Technology, andEfficiency: Spanish Experience.” Working Paper presented at the Georgia ProductivityWorkshop III, Athens, Georgia.
Haubrich, Joseph (1998): “Bank Diversification: Laws and Fallacies of Large Numbers”, FEDCleveland Economic Review, Second Quarter: 2-9.
Haynes, M, and S Thompson (1999): “The Productivity Effects of Bank Mergers: EvidenceFrom the UK Building Societies”, Journal of Banking and Finance, 23.
Heitfield, Erik A (1999): “What Do Interest Rate Data Say about the Geography of RetailBanking Markets?” Antitrust Bulletin, 44 (Summer), 333-347.
Houston, Joel F, and Michael D Ryngaert (1997): “Equity Issuance and Adverse Selection: ADirect Test Using Conditional Stock Offers.” Journal of Finance, 52(1): 197-219.
Hughes, Joseph P, William Lang, Loretta J Mester, and C G Moon (1996): “Efficient BankingUnder Interstate Branching.” Journal of Money, Credit, and Banking, 28(4): 1043-1071.
Hughes, Joseph P and Loretta J Mester (1998): “Bank Capitalization and Cost: Evidence ofScale Economies in Risk Management and Signaling.” Review of Economics andStatistics, 80(2): 314-325.
Hughes, Joseph P, William Lang, Loretta J Mester, and C G Moon (1999): “The Dollars andSense of Bank Consolidation.” Journal of Banking and Finance, 23(2-4): 291-24.
Hunter, William C, Stephen G Timme and Won Keun Yang (1990): “An Examination of CostSubadditivity and Multiproduct Production in Large U.S. Banks.” Journal of Money, Credit andBanking, 22(4): 504-525.
Hurst, C and R Wagenvoort (ed.) (1999): European Banking after EMU, European InvestmentBank Papers 4(1).
Ieda, Akira (1999): “Estimation of Expected Default Probability, Implied in the BondSecondary Markets, through Credit Risk Pricing Model”, IMES Discussion Paper Series,No. 99-j-18, Bank of Japan.
IMF International Capital Markets Report, (1998): Chapter V* and Annex V, (1999) Annex I.
International Monetary Fund, (1999): International Capital Markets: Developments, Prospectsand Key Policy Issues, World Economic and Financial Surveys (Washington, September).
International Monetary Fund, (2000): International Capital Markets: Developments, Prospectsand Key Policy Issues, World Economic and Financial Surveys (Washington, September).

220
Kaufman, George G (1999): “Banking and Currency Crises and Systemic Risk: A Taxonomyand Review”, Federal Reserve Bank of Chicago Working Paper (WP-99-12).
Keeley, Michael C. (1990): “Deposit Insurance, Risk, and Market Power in Banking.” AmericanEconomic Review, 80: 1183-1200.
Kent and Debelle (1999): “Trends in the Australian Banking System: Implications for FinancialStability and Monetary Policy”, in The Monetary and Regulatory Implications of Changes in theBanking Industry, BIS Conference Papers #7.
Kennickell, Arthur B, Martha Starr-McCluer, and Brian J Surrette (2000): “Recent Changes inU.S. Family Finances: Results from the 1998 Survey of Consumer Finances”, Federal ReserveBulletin 1-29.
Koyama, Yoshiaki (1995): “Ginkou-hou [The Banking Law]”, Okurazaimu-kyoukai [MOFBudget Association].
Kwan, Simon (1997): “Securities Activities by Commercial Banking Firms’ Section 20Subsidiaries: Risk, Return, and Diversification Benefits.” Federal Reserve Bank of SanFrancisco (October).
Kwast, Myron L (1989): “The Impact of Underwriting and Dealing on Bank Returns andRisks.” Journal of Banking and Finance 13(1): 101-125.
Kwast, Myron L and S Wayne Passmore (1999): “The Subsidy Provided by the Federal SafetyNet: Theory and Evidence”, Journal of Financial Services Research, 16:2/3 125-145.
Lang, Gunter and Peter Welzel (1998): “Technology and Cost Efficiency in Universal Banking:A Thick Frontier Approach.” Journal of Productivity Analysis 10(1): 63-84.
Levine, R (1999): “Foreign Bank Entry and Capital Control Liberalization: Effects on Growthand Stability”, mimeo, University of Minnesota.
Linder J C, and D Crane (1993): “Bank Mergers, Integration and Profitability”, Journal ofFinancial Services Research, 7, pp 35-55.
Lindgren, Carl-Johan, Gillian Garcia, Matthew Saal (1996): “Bank Soundness andMacroeconomic Policy”, International Monetary Fund.
Madhavan, A (2000): “Market Microstructure: A Survey”, mimeo, University of SouthernCalifornia, March.
Mahajan, Arvind, Nanda Rangan and Asghar Zardkoohi (1996): “Cost Structures inMultinational and Domestic Banking.” Journal of Banking and Finance, 20(2): 238-306.
McAllister, Patrick H, and Douglas A McManus (1993): “Resolving the Scale Efficiency Puzzlein Banking.” Journal of Banking and Finance 17(2-3): 389-405.
Miller, Stewart R and Arvind Parkhe (1999): “Home-Country Environment as a Source ofInternational Competitiveness: An Analysis of the Global Banking Industry.” Michigan StateUniversity.
Mishkin, F S (1998): “Bank Consolidation: A Central Banker's Perspective”, in Y Amihud andG Miller, Bank Mergers & Acquisitions, Kluwer Academic Publishers.
Molyneux, P (1999): “Increasing Competition and Concentration in European Banking: TheEnd of Anti-Trust?” EIB Papers.
Morimoto, Yuji (2000): “Kinyuu to Hoken no Yugo ni tsuite [Fusion of Banking andInsurance]”, Research Papers released by Institute for Monetary and Economic Studies, Bank ofJapan.
Neumark, D, Sharpe, S A (1992): Market Structure and the Nature of Price Rigidity: Evidencefrom the Market for Consumer Deposits, Quarterly Journal of Economics, 107, 657-80.

221
Noulas, Athanasios G, C Ray Subhash and Stephen M. Miller (1990): “Returns to Scale andInput Substitution for Large U.S. Banks.” Journal of Money, Credit, and Banking, 22(1): 94-108.
Padoa-Schioppa, T (1999): “EMU and Banking Supervision” lecture given to the LondonSchool of Economics, 24 February.
Parkhe, Arvind and Stewart R Miller (1999): “Is There a Liability of Foreignness in GlobalBanking? An Empirical Test of U.S. Banks' X-Efficiency.” Michigan State University.
Parkinson, Patrick M, Associate Director, Division of Research and Statistics, Board ofGovernors of the Federal Reserve System (May 6, 1999): Hedge funds, leverage, and thelessons on Long-Term Capital Management, Testimony before the Committee on Banking andFinancial Services, U.S. House of Representatives.
Pastor, Jose Manuel, Francisco Perez, and Javier Quesada (1997): “Efficiency Analysis inBanking Firms: An International Comparison.” European Journal of Operational Research, 98:396-408.
Peek Joe, & Eric S Rosengren (2000): “Collateral Damage: Effects of the Japanese Bank Crisison Real Activity in the United States”, The American Economic Review, March 2000.
Peristiani, Stavros (1997): “Do Mergers Improve the X-efficiency and Scale Efficiency of U.S.Banks? Evidence from the 1980s.” Journal of Money, Credit, and Banking, 29(3): 326-337.
Piloff, S J, and A M Santomero (1998): “The Value Effects of Bank Mergers and Acquisitions”,in Amihud Y and G Miller, Bank Mergers & Acquisitions, Kluwer Academic Publishers.
Prager, R A, Hannan, T H (1999): Do Substantial Horizontal Mergers Generate SignificantPrice Effects?, Evidence from the Banking Industry, Journal of Industrial Economics, 46, 433-452.
Prati, A, and Schinasi, G (1999): “Financial Stability in European Economic and MonetaryUnion”, Princeton Studies in International Finance, No 86, August.
Pritsker, Matt (2000): “The Channels for Financial Contagion”, Washington DC, mimeo.
Radecki, L J (1998): Small Expanding Geographic Reach of Retail Banking Markets, FederalReserve Bank of New York Economic Policy Review 4, 15-34.
Rhoades, S A (1993): The Efficiency Effects of Horizontal Bank Mergers, Journal of Bankingand Finance 17, 411-22.
Rhoades, S A (1996): Bank Mergers and Industrywide Structure, 1980-94, Board of Governorsof the Federal Reserve System, Staff Study 169.
Rhoades, Stephen A (1998): “The Efficiency Effects of Bank Mergers: An Overview of CaseStudies of Nine Mergers.” Journal of Banking and Finance 22(3): 273-291.
Rochet, Jean-Charles and Jean Tirole (1996): “Interbank Lending and Systemic Risk”, Journalof Money, Credit and Banking.
Rosen, Richard J, Peter R Lloyd-Davies, Myron L Kwast and David B Humphrey (1989): “NewBanking Powers: A Portfolio Analysis of Bank Investment in Real Estate.” Journal of Bankingand Finance, 13: 355-366.
Rouwenhorst, K G (1999): “European equity markets and the EMU” Financial AnalystsJournal, May/June, p 57-64.
Saunders, Anthony and Ingo Walter (1994): Universal Banking in the United States. Oxford:Oxford University Press.
Schinasi, Garry J, and R Todd Smith (1999) “Portfolio Diversification, Leverage, and FinancialContagion”, IMF Working Paper No. WP/99/136 (Washington: International Monetary Fund,October).

222
Sheldon, George and Martin Maurer (1998): “Interbank Lending and Systemic Risk: AnEmpirical Analysis for Switzerland”, Swiss Journal of Economics and Statistics, 134, 4.2:685-704.
Simons, K, J Stavins (1998): Has Antitrust Policy in Banking Become Obsolete? New EnglandEconomic Review, Federal Reserve Bank of Boston, 13-26.
Srinivasan A (1992): “Are There Cost Savings from Bank Mergers”, Federal Reserve Bank ofAtlanta, Economic Review, pp 17-28.
United States (1999): President’s Working Group on Financial Markets. Hedge Funds, and thelessons of Long-Term Capital Management. Report of the President’s Working Group onFinancial Markets (Department of the Treasury, Board of Governors of the Federal ReserveSystem, Securities and Exchange Commission, Commodity Futures Trading Commission).
Vander Vennet, Rudi (1995): “EMU and Bank Consolidation”, CEPS Business Policy Reportno. 4.
Vander Vennet, Rudi (1996): “The Effect of Mergers and Acquisitions on the Efficiency andProfitability of EC Credit Institutions.” Journal of Banking and Finance, 20(9): 1531-1558.
Vander Vennet, Rudi (1999): “Cost and Profit Dynamics in Financial Conglomerates andUniversal Banks in Europe.” University of Ghent. Belgium.
Van Rooij, M C J (1999): “Bank Efficiency and Implications of Bank Mergers”, DeNederlandsche Bank Working Paper.
White, W (1998): “The Coming Transformation of Continental European Banking?” BISWorking Paper, No. 54, Basel.
Winton, Andrew (1999): “Don’t Put All Your Eggs in One Basket? Diversification andSpecialization in Lending”. University of Minnesota, Working Paper 9903.

223
Chapter IV
The impact of financial sector consolidation on monetary policy
1. IntroductionThis chapter examines whether financial sector consolidation has affected the environment inwhich monetary policy decisions are made, how they are put into practice or how they aretransmitted to the rest of the economy, and whether it may do so in the future. Central banksimplement policy by influencing the market for central bank balances in order to maintain aspecific short-term interest rate near a target level. The reactions of financial firms andparticipants in asset markets to changes in current and expected future short-term interest ratesthen lead to changes in longer-term interest rates and asset prices more generally, which in turnaffect spending by firms and households and hence output and prices. The behaviour offinancial firms and markets is therefore a key influence on both the implementation andtransmission of monetary policy. Consolidation within the financial sector may alter thisbehaviour, with potentially important implications for how central banks implement their policydecisions and the impact of those decisions. Moreover, if consolidation affects how financialfirms and markets react to other shocks, that too may need to be taken into account in monetarypolicymaking. Any consequences are likely to depend on the form of consolidation – eg withinindustry, across industries, or across borders – the reasons behind it – eg technological change,economies of scale, or the search for market power – and the initial level of concentration in thefinancial sector.
The following sections consider the economic arguments for thinking that consolidation maymatter, review some of the – admittedly limited – evidence available from relevant empiricalstudies and report the assessments by central banks surveyed. Section 2 focuses on theimplementation of monetary policy and how consolidation might affect the market for centralbank balances and the markets in which monetary policy operations are conducted. Section 3turns to the possible impact of consolidation on the transmission of monetary policy to the restof the economy through various channels. Is it likely that consolidation amplifies or damps theimpact of a given change in the proximate instrument of monetary policy? Might it speed up thetransmission of a policy change or slow it down? Might it change the relative importance ofdifferent channels? Section 4 considers briefly some further possible consequences ofconsolidation for monetary policy, such as changes in the way financial shocks are transmittedacross markets and borders, changes in the liquidity and volatility of financial markets, andchanges in the information content of variables monitored by central banks. Section 5 drawsattention to some important caveats that need to be remembered, pointing out the need forfurther research. Section 6 offers some tentative conclusions.
2. The impact of consolidation on the implementation of monetarypolicy
Whether consolidation within the financial sector affects the implementation of monetary policydepends on whether it affects the market for central bank balances, or the market or marketsused by the central bank to adjust the supply of such balances. Hence any impact on thevolatility and price elasticity of financial firms’ demands for central bank balances, or on thedegree of competition in the relevant markets, could be relevant to monetary policymakers.

224
All the central banks of the G10 economies currently implement monetary policy bymanipulating conditions in the market for central bank balances in order to bring a particularshort-term interest rate in line with their target.151 Central bank regulations with regard toclearing, overdrafts, payment of interest on balances and required minimum levels of balancesall influence deposit-taking institutions’ demand for central bank balances. At the same time,central banks are monopoly suppliers of such balances and adjust that supply throughtransactions with financial firms to set the policy interest rate at the desired level. Thesemonetary policy operations include outright purchases of government securities, term andovernight repurchase agreements, and currency swaps.
In addition to their market operations, many central banks use other mechanisms to limitvolatility in the market for central bank balances. These include standing facilities that help tokeep the overnight interest rate in a desired range. The top of the range is set by the rate on alending facility to which institutions may turn to obtain central bank balances, and the bottomby the rate on a deposit facility that provides an outlet for excess balances. Minimum reserverequirements can also serve to damp volatility in the market for central bank balances byincreasing the willingness of some institutions to adjust their demands within a maintenanceperiod in response to movements in the overnight interest rate. Also, the move towards clearannouncements by central banks of a target value for their policy interest rate has probablyhelped to focus market expectations on the target rate, and thereby increased the influence ofintertemporal arbitrage by financial firms in keeping the actual rate near the target.152
Potential effects of consolidation
Consolidation could affect the key financial markets for the implementation of monetary policy– the market for central bank balances and those in which policy operations are conducted –through two possible routes. First, consolidation could affect the degree of competition. Forexample, a reduction in the number of active participants in the interbank market for centralbank balances could reduce competition if there are barriers to entry. Barriers to entry couldarise due to features of the regulatory environment or other institutional arrangements, orbecause of the search costs or other informational disadvantages facing potential new entrants.In that event, there would be a danger that some market participants might try to exploit theirmarket power or greater knowledge of liquidity conditions, leading to higher costs of liquidityfor other market participants. Such an outcome might impede the arbitraging of rates in themarket for central bank deposits into other markets. Moreover, if the ability of marketparticipants to act in this way depended in part on market conditions, the result could beunexpected volatility in very short-term market rates and a more variable cost of liquidity forother market participants. Similarly, a reduction in the number of counterparties for central bankmonetary policy operations, if it were sufficient to generate some market power for theremaining firms, might allow some counterparties to obtain funds at rates below those thatwould prevail if they were all price-takers. The implementation of monetary policy would bemade more difficult if the cost of liquidity to non-counterparty participants in the interbankmarket became higher or more variable as a result. The importance of these effects woulddepend on the regulatory environment and operating procedures for monetary policy operationsand, over a longer horizon, on whether changes in those regulations and operating procedurescould be implemented to ensure the efficient operation of the markets following consolidation.
151 Borio (1997) presents a very useful summary of the implementation of policy in a variety of industrial nations asof September 1996. Updated descriptions of procedures for the Bank of England, the Swiss National Bank, theBank of Canada and the European Central Bank can be found in Bank of England (1999), Swiss National Bank(1999), Howard (1998) and European Central Bank (1998) respectively.
152 See Borio (1997), p 89.

225
Consolidation could affect the markets involved in the implementation of policy through asecond route if the larger firms created by the consolidation were to behave differently fromtheir smaller predecessors, even aside from any changes in the degree of market competition.For example, a change in the size and number of deposit-taking institutions may affect theability of central banks to estimate the demand for central bank balances and so to supply thefunds necessary to achieve the desired target for the policy rate. Also, by internalising what hadearlier been interbank transactions, consolidation could reduce the liquidity of the market,making it less efficient at reallocating balances across deposit-taking institutions, increasingmarket volatility, and perhaps affecting the extent to which changes in conditions in the marketfor central bank deposits are arbitraged into other short-term markets. If these effects weresufficiently large, consolidation could conceivably cause such arbitrage to break down, therebycutting the link between monetary policy actions and the real economy.153 Even if the marketwere not impaired to that extreme degree, the implementation of monetary policy could becomemore complicated. Central banks are likely to be able to adjust over time to relatively gradualchanges in the level of demand for central bank balances caused by consolidation. But changesin the volatility of demand or the liquidity of the market might lead to increased volatility in thepolicy rate or other short-term market rates. Of course, central banks might be able to combatsuch an increase in volatility by, for example, increasing the frequency of fine-tuningoperations.
Evidence on the effects of consolidationWhile studies have compared the implementation of monetary policy across countries withdifferent degrees of financial sector consolidation, the effects of consolidation on policyimplementation have not been explicitly studied.154 The task force, therefore, circulated aquestionnaire to the central banks of the G10, Australia and Spain, asking for information bothon the effects of consolidation on the implementation of policy over the past decade and theexpected effects in the future. The responses from the central banks indicate that the effects ofconsolidation both on competitive conditions in key financial markets and on the behaviour oflarger market participants have generally been minimal. Consolidation is not expected to pose asignificant problem for the implementation of policy going forward.
Evidence on the market for central bank balancesThe structure of the markets for central bank balances differs widely across countries judging bythe evidence from central bank respondents, with the number of active participants ranging fromjust four or five in a few countries to about 200 (see Table IV.1). Nonetheless, consolidation hasreduced the number of participants in this market in many countries, and it was commonlyexpected to continue to do so. Nearly two thirds of the respondents indicated that consolidationover the past 10 years had caused the number of market participants to decline either somewhator considerably. Over the coming 10 years, a similar fraction expected this pattern to continue.However, several respondents noted that other factors – including financial difficulties at somedeposit-taking institutions, increased concerns about risk and changes in operating procedures –have also contributed to the decline in market participation.
153 See Friedman (1999).154 See eg Borio (1997).

226
Table IV.1Number of firms active in markets relevant for monetary policy implementation
(April 2000)
Interbank market forcentral bank deposits Open market operations
CountryNumber ofactive firms
Central bankestimate of
effectiveminimuma
Number ofcounterparties
Central bankestimate of
effectiveminimum
Australia 52 b n/a c 27 5Belgium 5 d 30 e 15 10-25Canada 15 3 f 13 5-10France 200 g n/a h 65-71 n/aGermany 150 20-30 545 10-25Italy 59 k 30-40 40 >25Japan 40-50 n/a p 50 n/a q
Netherlands 85 i 55-110 j 14 >25Spain 90 n/a 45 n/aSweden 4 3-4 8 <5Switzerland 20 l 10 15 m 10-25UK 15 n 5 20 5-10US 200 o 20-30 29 10-25
n/a = not availablea Responses from euro area central banks generally refer to the minimum number of participants for the euro area asa whole. However, in the case of Germany, the number shown is the estimated number needed in Germany alone.b There are 52 institutions with exchange settlement accounts at the Reserve Bank of Australia. c The minimumnumber of participants is likely to be significantly less than the current number. d Number of firms activelyparticipating in the euro overnight market. e This is an estimate of the number that market participants would preferto have. f The Bank of Canada estimates that at least three participants would be needed and that a somewhat highernumber would be preferable. g Precise figures are not available. Twelve institutions are selected in calculating theEONIA rate; 52 are participants in the TELMA system, which allows them to participate in refinancing operationsof the Eurosystem, and more than 200 institutions participate in the RTGS TBF. h The important point is that noinstitution can be in a position to become a price-maker. I The number of active participants is not known. Currently,85 institutions have reserve requirements and it is likely that all of them participate in the market at least to a certainextent. j The minimum required is 5-10 per euro area country. k There are 24 institutions with a market share of 1%or more. There are 59 with market shares of ½% or more. l Of the 20 participants, two account for the bulk of theactivity. m Fifteen institutions participate on a regular basis, while about 30 more participate on an irregular basis. n Itis difficult to define active participation. About 15 banks made 75% of the total outstanding advances, but only fivesettlement banks offer a meaningful customer settlement service. o About 200 institutions participate in the brokeredfederal funds market. p The number of participants is not the only factor affecting the efficiency with which themarket operates. Others include the institutional framework and the degree of competitiveness among the marketparticipants. q As in note p, factors other than the number of participants also affect the efficient conduct ofoperations.
227
Despite the declining number of participants in this market in the majority of countries, thecentral banks did not appear to be concerned about its efficient operation. Generally, the numberof participants substantially exceeds the central banks’ estimates of the number needed to ensurethe efficient operation of the market, and, even taking into account the expected reductions overthe next decade, the number of participants was expected to remain above that level. Moreover,as some respondents pointed out, the number of participants in a particular country within theeuro area is no longer very important, since there is now a single monetary policy and anintegrated money market, and the total number of participants in the euro area as a whole is verylarge.
The central banks’ estimates of the minimum number of market participants necessary for theefficient functioning of the market also varied widely, ranging from a low of just three to a highof 30. Those countries with relatively few market participants generally also thought that theminimum necessary number was lower. This pattern suggests either that the market can remaincompetitive with relatively few participants, or that those countries with relatively concentratedfinancial sectors have found ways to adjust the markets’ operations in order to ensure that theyremain efficient. An important consideration in this regard is whether the market is contestable– in other words, whether the existing market participants are constrained from setting pricesabove the levels that would prevail in perfectly competitive markets by the knowledge that, ifthey did so, other firms could enter the market quickly and with no sunk costs and would find itprofitable to do so. The Bank of Canada, for example, indicated that the market for central bankbalances would operate properly even with very few participants so long as it remainedcontestable.
Evidence on central bank monetary policy operations
The responses to questions on the effects of consolidation on the efficiency of monetary policyoperations were broadly similar to those about the market for central bank balances. Thenumber of counterparties for such operations differed substantially across central banks. Inseveral countries there were 15 or fewer counterparties last year, and most others had lessthan 100. By contrast, Germany had more than 500 counterparties. Not surprisingly, the share ofthe top five counterparties also varied widely, ranging from less than 20 to 90%. For theEuropean System of Central Banks as a whole, there were more than 800 counterparties, and theshare of the top five was just 12%.155 Nearly half of the respondents reported that consolidationhad reduced the number of counterparties for their monetary policy operations and increased theshare of the top five counterparties either somewhat or considerably over the past 10 years.However, several of the respondents noted that other factors, including changes in operatingmethods, probably contributed to these changes. About half of the respondents thought thatconsolidation would continue to trim their roster of counterparties and boost the share of thelargest counterparties in monetary policy operations over the coming 10 years.
The respondents were not generally worried that there would be too few counterparties to ensurethe efficient conduct of tenders and open market operations. The largest fraction of respondentsreported that a moderate number of counterparties (10-25) would be sufficient, but a couplethought that more were needed and three thought that fewer than 10 would be satisfactory.Again, the minimum number judged necessary fell with the actual number of counterparties,suggesting that fewer counterparties may be necessary than some central banks believe, at leastgiven accommodating adjustments in operating procedures.
155 The number of counterparties reported by the ECB is the sum of the numbers of counterparties reported by thenational central banks, but the same financial firm may be a counterparty of more than one national central bank,so the number is likely to be an overstatement.
228
Effects of consolidation on the behaviour of financial firms
Central banks were also asked about the effects of consolidation on the behaviour of firms in themarket for central bank deposits and in monetary policy operations. The responses suggestedthat consolidation had generally had little effect, and was not expected to do so in future. Thereappears to be little concern about the possibility of firms wielding market power, one of thehypotheses suggested above. Many of the respondents noted that the demand for central bankbalances is essentially zero in their economy (eg Canada) or is virtually entirely determined byreserve requirements (eg the European Central Bank). In such cases, consolidation cannot havea significant effect on the level of demand. A couple of respondents noted that larger banksmight be more efficient at managing reserves, and so consolidation could reduce holdings offree reserves, but they thought this effect was likely to be small.
Respondents reported that consolidation had not influenced borrowing at their lending facilityappreciably in the past and that it was not expected to do so in the future, although a few ofthem indicated that changes in operating procedures in recent years made it difficult to be sure.Some respondents pointed out that, given their operating methods, borrowing is primarilydetermined by the quantity of liquidity provided by the central bank relative to the needs of thebanking system as a whole, and so consolidation cannot have a substantial effect. It was notedthat, in the United States, larger institutions tend to be less willing to borrow. And it waspointed out that, in Australia, larger institutions, while subject to more late-day volatility inpayments flows (which might be expected to boost borrowing needs), also have better creditratings and so are less likely to have to borrow from the central bank.
The central banks also reported that consolidation had not affected the behaviour ofcounterparties for monetary policy operations – including their willingness to participate inoperations and the size of the positions they are willing to take. Only the Swiss National Bankreported an increased willingness to participate in operations over the past 10 years. Similarly,only two of the central banks thought that consolidation would make counterparties morewilling to participate in operations over the coming 10 years. Two respondents argued that thebehaviour of counterparties was determined by the central bank, and that central banks couldencourage participation in central bank operations by making them more attractive sources ofliquidity.
Adjustments made by central banks in response to consolidation
Since most of the central banks thought that consolidation had not had very large effects, fewhad made changes in operating or other procedures as a result, and few expected to do so. Whilemany of the central banks reported having changed monetary policy operating procedures,particularly in the run-up to Stage III of Economic and Monetary Union (EMU) in the euro area,these changes had not usually been made in response to consolidation. The only exception wasSwitzerland, where consolidation had led to substantial changes in operating procedures inrecent years. The Swiss National Bank increased the frequency of tender operations, introducedrepo operations – thereby making it easier for smaller institutions to participate – and changedits rules for counterparties to encourage participation in operations by foreign-relatedinstitutions.156 Looking forward, only one central bank (The Reserve Bank of Australia) thoughtthat, if there were significant further consolidation in the financial services sector, changesmight become necessary, including an increase in the number of fine-tuning operations, changesin the types of operations employed, or changes in the rules for their borrowing facility.
Some of the central banks thought that changes in procedures might be introduced in the eventthat further consolidation reduced the number of counterparties available for monetary policy
156 The Swiss National Bank also shifted from a reserves target to an interest rate target, but the decision to do sowas not the result of consolidation.
229
operations to an unacceptable degree. About half thought that more careful monitoring ofoperations would be either possible or likely – presumably to reduce the possibility of non-competitive behaviour by counterparties. A smaller number thought it likely that their centralbank would increase the openness of the conduct of operations (some of the respondents notedthat their operations were already open) or monitor the activities and financial condition ofcounterparties more carefully. Only two pointed to possible stricter management of credit risk,such as tighter limits on exposures to counterparties. Nearly half of the respondents thought thatnone of these possible responses was likely to be adopted. A few of them commented that aproblem was unlikely to arise in their jurisdiction. In the case of the euro area, in particular, itwas noted that the introduction of the single monetary policy had greatly increased the numberof possible counterparties for operations. One respondent indicated that actions would be takento ensure that operations remained competitive, but did not elaborate.
Another possible response to a substantial reduction in the number of counterparties would be tochange the eligibility criteria for counterparties in order to include a broader range of financialfirms. Doing so might be useful for two reasons. First, it would directly increase the number offirms that could choose to be counterparties, which might be expected to increase the numberdoing so. Second, it might make the pool of counterparties less homogeneous. A broader rangeof counterparties could be helpful in times of stress, since shocks having relatively large adverseeffects on some classes of financial firms – potentially making them less willing to participate inoperations – might leave other types of firms relatively unaffected.
Despite these possible benefits, the central banks surveyed were generally not inclined tochange their eligibility criteria. Only the Swiss National Bank reported having done so,implementing changes allowing participation in operations by foreign institutions. Similarly,only two of the respondents (Spain and Switzerland) thought that it might become important toencourage participation in monetary policy operations by smaller firms in order to offset theeffects of consolidation.157 Indeed, the introduction of repo operations by the Swiss NationalBank had reduced the cost of participation for smaller firms. However, opinion was generallymixed on the desirability of participation by such firms. Three of the central banks thought thatthere should be no preference shown to larger firms in monetary policy operations. Four of themnoted that the efficiency gains from operations with larger counterparties made it necessary tofocus operations on a relatively small number of larger firms, especially in the case of fine-tuning operations. In particular, the ECB noted that its procedures are designed to ensure theparticipation of a broad range of counterparties, but that for technical reasons the EuropeanSystem of Central Banks (ESCB) can select a limited number of counterparties for fine-tuningoperations. (The ECB also noted that fine-tuning operations have played only a very minor rolethus far.) A couple of the respondents pointed to factors other than size that influence theirselection of counterparties, including a firm’s activity in interbank markets. Some also notedthat while operations with very small counterparties were inefficient, medium-sized firms didnot pose a problem.
While many of the respondents reported that their central banks had implemented organisationalchanges over the past 10 years, only two reported that such changes had been undertaken inresponse to consolidation. In France, the relationship between the central bank’s money deskand payment system division was strengthened. In Switzerland, the central bank has organisedteams to monitor monetary policy operations with the largest institutions. The other respondentsreported that no changes in central bank organisation were even being contemplated as a resultof consolidation.
A couple of respondents reported that consolidation had led to changes in risk managementpractices with regard to monetary policy operations. Going forward, five respondents thought
157 However, central banks of several of the smaller countries in the euro area (responses for which were reported bythe ECB) thought that doing so might be desirable.
230
that their central bank might face heightened operational risks. The most common risk notedwas increased moral hazard on the part of borrowers. This moral hazard could take two forms.Most directly, consolidation could allow some financial firms to manipulate monetary policyoperations in order to obtain lower cost funding from the central bank than would otherwisehave been the case. A second possibility is that the larger firms resulting from consolidationcould be seen by investors as very likely to obtain substantial central bank credit in the event offinancial difficulty. As a result, the risk premium on such firms’ obligations would be lowerthan otherwise, encouraging them to take on increased risk. Of course, even in this case,investors would need to be mindful that central banks, particularly the national central banks inthe euro area, cannot be expected to provide emergency liquidity to institutions in allcircumstances regardless of the institutions’ size. In addition to these concerns about moralhazard, two of the central banks thought that consolidation could, by increasing the size oftransactions with the largest firms, increase the credit risks they face, and one of the respondentswas concerned that consolidation could lead to less efficient management of systemic risks.
3. The impact of financial sector consolidation on the transmission ofmonetary policy
Financial sector consolidation may affect the impact of monetary policy by altering themonetary transmission mechanism that links central bank operations in the market for centralbank deposits to output and inflation. Consolidation may therefore be relevant to policymakers’choice of the appropriate setting of monetary policy instruments.
Changes in monetary policy instruments are transmitted to the rest of the economy throughvarious channels. This section considers three of these channels – the “monetary” channel, the“bank lending” channel and the “balance sheet” channel (the latter two being variants of what isoften termed the “credit” channel). It outlines briefly the key characteristics of each channel inorder to identify how consolidation might affect them, and it considers what empirical studiesreveal about whether in fact any effects can be identified. The section also draws on the resultsof a second questionnaire and a series of interviews with central bank staff, which sought to findout to what extent policymakers themselves think that consolidation alters the monetarytransmission mechanism.
The monetary channel
In simple models of the monetary (or interest rate) channel, central bank policy determines theshort-term interest rate. Arbitrage across markets ensures that yields on longer-term financialassets are an appropriately weighted average of current and expected future short-term interestrates, after allowing for the assets’ perceived riskiness. Competition amongst lenders to firmsand households and deposit-takers ensures that interest rates set by banks are determined by theterm structure of market interest rates. In practice, arbitrage is imperfect and depends on,amongst other factors, market liquidity, risk aversion, and the degree of monopoly power. Inthis model, changes in monetary policy affect spending by changing household wealth and theopportunity cost of funds facing firms and households.
The effects of consolidation on the monetary channel: empirical evidence
This view of the traditional monetary channel suggests that one should consider whetherfinancial sector consolidation has affected the pass-through of changes in policy-determinedinterest rates to other interest rates at longer maturities, and asset prices generally. It was arguedabove that in some circumstances consolidation might reduce the level and increase thevolatility of interbank liquidity, impeding arbitrage across financial markets and thus slowingpass-though and reducing its extent. On the other hand, to the extent that large firms are able toprocess information more effectively than small firms, because of the set-up costs and

231
economies of scale in information processing, consolidation may promote more rapid arbitrageof interest rate changes across markets and assets. In addition, consolidation amongst thoselending to firms and households, if it reduced competition, could bring about higher marginsbetween wholesale interest rates and those charged to borrowers. That would cause difficultiesfor monetary policymakers if it was not expected, particularly if the change was observedimperfectly or with a significant lag. Margins could also become more erratic if the number oflenders (and potential lenders) was sufficiently small that they could alter their pricing inresponse to perceived changes in the elasticity of demand for loans, the supply of credit by theircompetitors, and expected changes in monetary policy.
In practice, it is difficult to assess the independent effect of consolidation on pass-through. Inmany countries, consolidation has been accompanied – and, in some cases, encouraged – by theintroduction of new technology, the removal of some barriers to entry (including regulatoryones) and improved access to alternative sources of finance. Hence it has not always led toreductions in liquidity or competition.
Amongst studies of the pass-through of money market rates into retail rates, one considers thepossible role of differences in financial structure across countries.158 It shows that, while in thelong run bank lending rates respond virtually one-for-one to changes in money market rates, thepass-through during the following month is generally much less. Moreover, there isconsiderable cross-country variation, particularly in the short-term responses. But is thatvariation related to differences in the degree of financial sector consolidation? Neither GDP percapita, as a proxy for the overall degree of development of the financial system, nor the marketshare of the largest five banks, as a proxy for the degree of competition within the bankingsystem, were found to be significant. But results with a qualitative index of the existence ofbarriers to entry suggested that lack of contestability of markets, rather than concentration orconsolidation in markets per se, is the critical factor in slowing down pass-through.
Research at the Bank of Canada suggests that consolidation has been accompanied by anincreased responsiveness of mortgage rates to official interest rate changes, although it isdifficult to establish causation (see Box IV.1). In contrast, work on the transmission of officialrates into retail mortgage and saving rates in the United Kingdom suggests that there has beenno significant change in the speed of pass-through over the past 15 years, a period during whichsome consolidation has taken place.159 But other developments may have acted to offset anyimpact on competitive conditions in retail banking markets. In the United Kingdom, forexample, the demutualisation of former building societies, together with the arrival of newentrants, seems to have encouraged greater competition in lending to households. (Also, theCanadian study uses weekly data, so it may have been able to pick up changes that wereunobservable in the monthly data available in the United Kingdom.)
Evidence of an impact of consolidation on bank margins is not strong. Studies have found noeffect of increasing concentration amongst Swiss or Spanish banks on interest rates.160 Instead,increased competition has made the banking system more responsive to monetary policyimpulses over the past decade, and consolidation has not prevented that development. To theextent that increased scale has enabled banks to diversify income streams and squeeze out costs,consolidation amongst institutions has allowed profit margins to be sustained despite thisincreased competition. According to one paper, consolidation in the United States increasedmargins on personal loans, but had no effect on automobile loan margins.161
158 See Cottarelli and Kourelis (1994).159 See Hoffman and Mizen (2000).160 See Braun et al (1999) and Fuentes and Sastre (1999).161 See Kahn et al (2000).

232
Even if other things being equal, consolidation does tend to increase margins, a central bankshould be able to alter its own target interest rate to offset any impact on aggregate demand andasset prices, once it has observed the change in the relationship between its target rate and ratescharged in the market. Thus, although the wider margins would be undesirable because of theireffects on the efficiency of intermediation, they might not have an important effect on monetarypolicy making. However, there might be greater difficulty in setting the appropriate official ratein the transition period during which margins adjusted, depending on how quickly policymakersidentified the phenomenon.
The effects of consolidation on the monetary channel: assessment by central banksCentral banks generally suggested that consolidation alone had not had an important influenceon the pass-through of official interest rate changes to administered rates, such as bank loan anddeposit rates, over the past 10 years. Only the Swedish and Swiss respondents thought that pass-through had become more rapid as a result of consolidation (Table IV.2). A couple ofrespondents indicated that the speed of transmission had increased, but suggested that factorsother than consolidation were likely to have been responsible.
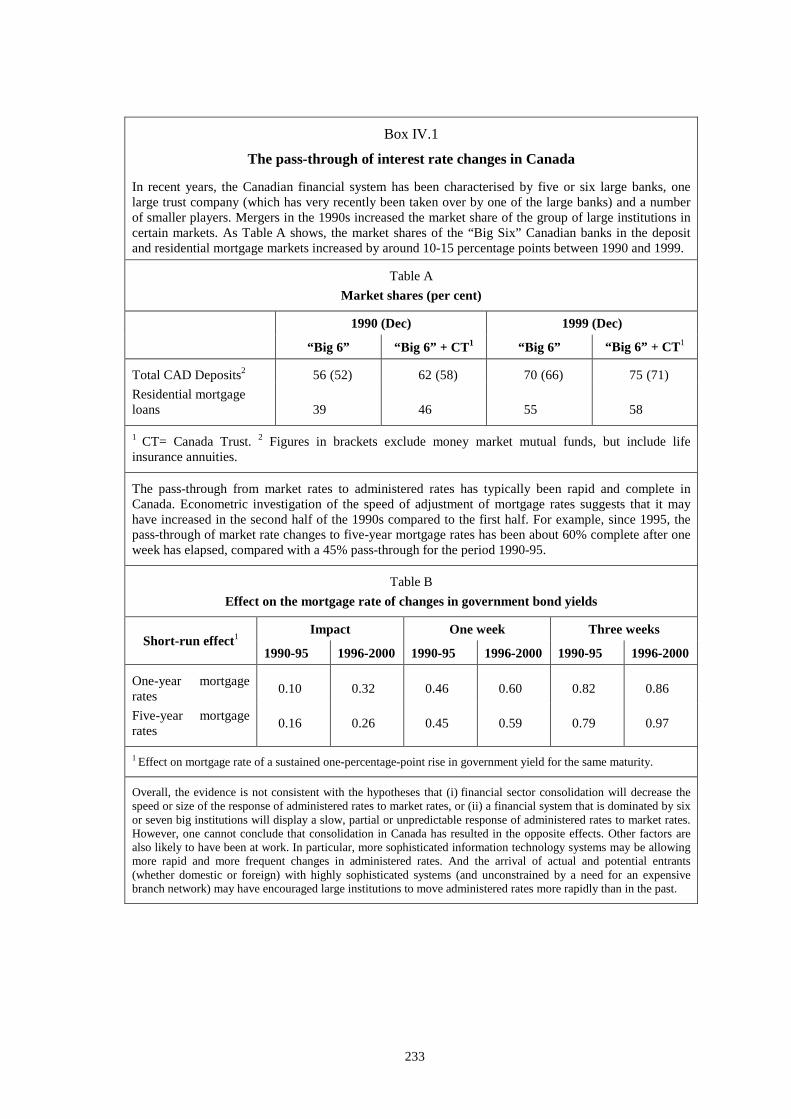
233
Box IV.1
The pass-through of interest rate changes in Canada
In recent years, the Canadian financial system has been characterised by five or six large banks, onelarge trust company (which has very recently been taken over by one of the large banks) and a numberof smaller players. Mergers in the 1990s increased the market share of the group of large institutions incertain markets. As Table A shows, the market shares of the “Big Six” Canadian banks in the depositand residential mortgage markets increased by around 10-15 percentage points between 1990 and 1999.
Table AMarket shares (per cent)
1990 (Dec) 1999 (Dec)
“Big 6” “Big 6” + CT1 “Big 6” “Big 6” + CT1
Total CAD Deposits2 56 (52) 62 (58) 70 (66) 75 (71)Residential mortgageloans 39 46 55 58
1 CT= Canada Trust. 2 Figures in brackets exclude money market mutual funds, but include lifeinsurance annuities.
The pass-through from market rates to administered rates has typically been rapid and complete inCanada. Econometric investigation of the speed of adjustment of mortgage rates suggests that it mayhave increased in the second half of the 1990s compared to the first half. For example, since 1995, thepass-through of market rate changes to five-year mortgage rates has been about 60% complete after oneweek has elapsed, compared with a 45% pass-through for the period 1990-95.
Table BEffect on the mortgage rate of changes in government bond yields
Impact One week Three weeksShort-run effect1
1990-95 1996-2000 1990-95 1996-2000 1990-95 1996-2000
One-year mortgagerates 0.10 0.32 0.46 0.60 0.82 0.86
Five-year mortgagerates 0.16 0.26 0.45 0.59 0.79 0.97
1 Effect on mortgage rate of a sustained one-percentage-point rise in government yield for the same maturity.
Overall, the evidence is not consistent with the hypotheses that (i) financial sector consolidation will decrease thespeed or size of the response of administered rates to market rates, or (ii) a financial system that is dominated by sixor seven big institutions will display a slow, partial or unpredictable response of administered rates to market rates.However, one cannot conclude that consolidation in Canada has resulted in the opposite effects. Other factors arealso likely to have been at work. In particular, more sophisticated information technology systems may be allowingmore rapid and more frequent changes in administered rates. And the arrival of actual and potential entrants(whether domestic or foreign) with highly sophisticated systems (and unconstrained by a need for an expensivebranch network) may have encouraged large institutions to move administered rates more rapidly than in the past.
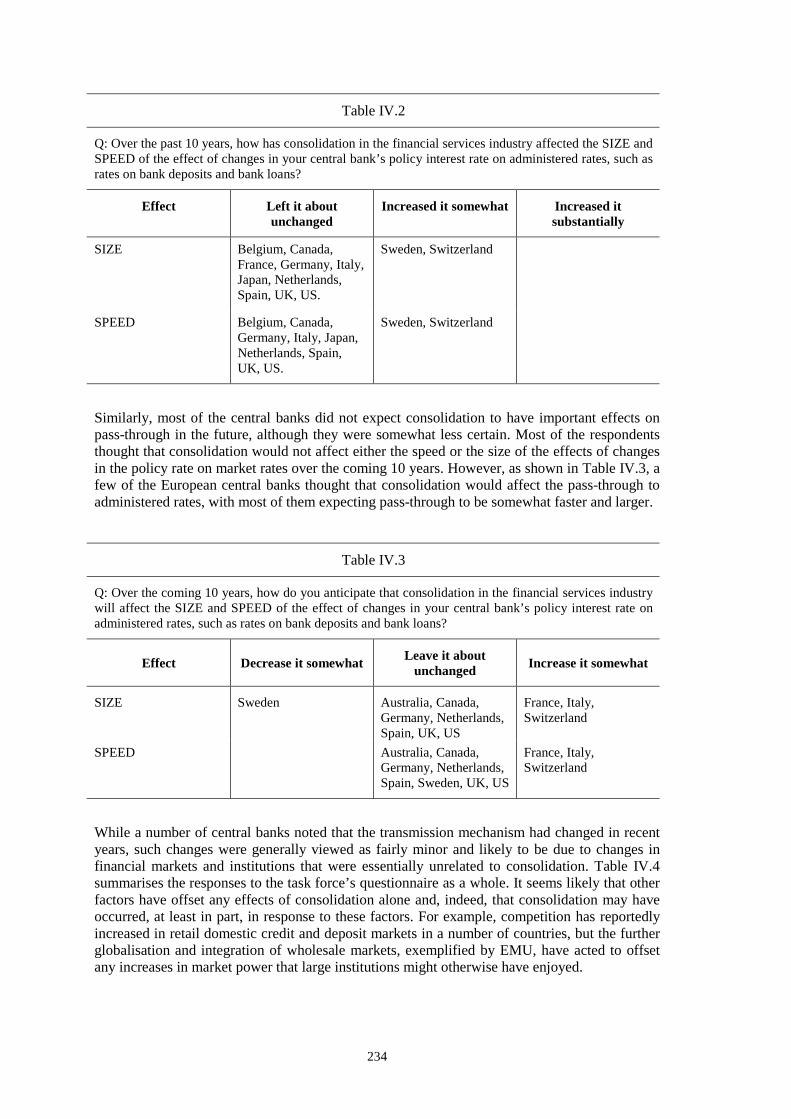
234
Table IV.2
Q: Over the past 10 years, how has consolidation in the financial services industry affected the SIZE andSPEED of the effect of changes in your central bank’s policy interest rate on administered rates, such asrates on bank deposits and bank loans?
Effect Left it aboutunchanged
Increased it somewhat Increased itsubstantially
SIZE Belgium, Canada,France, Germany, Italy,Japan, Netherlands,Spain, UK, US.
Sweden, Switzerland
SPEED Belgium, Canada,Germany, Italy, Japan,Netherlands, Spain,UK, US.
Sweden, Switzerland
Similarly, most of the central banks did not expect consolidation to have important effects onpass-through in the future, although they were somewhat less certain. Most of the respondentsthought that consolidation would not affect either the speed or the size of the effects of changesin the policy rate on market rates over the coming 10 years. However, as shown in Table IV.3, afew of the European central banks thought that consolidation would affect the pass-through toadministered rates, with most of them expecting pass-through to be somewhat faster and larger.
Table IV.3
Q: Over the coming 10 years, how do you anticipate that consolidation in the financial services industrywill affect the SIZE and SPEED of the effect of changes in your central bank’s policy interest rate onadministered rates, such as rates on bank deposits and bank loans?
Effect Decrease it somewhat Leave it aboutunchanged Increase it somewhat
SIZE Sweden Australia, Canada,Germany, Netherlands,Spain, UK, US
France, Italy,Switzerland
SPEED Australia, Canada,Germany, Netherlands,Spain, Sweden, UK, US
France, Italy,Switzerland
While a number of central banks noted that the transmission mechanism had changed in recentyears, such changes were generally viewed as fairly minor and likely to be due to changes infinancial markets and institutions that were essentially unrelated to consolidation. Table IV.4summarises the responses to the task force’s questionnaire as a whole. It seems likely that otherfactors have offset any effects of consolidation alone and, indeed, that consolidation may haveoccurred, at least in part, in response to these factors. For example, competition has reportedlyincreased in retail domestic credit and deposit markets in a number of countries, but the furtherglobalisation and integration of wholesale markets, exemplified by EMU, have acted to offsetany increases in market power that large institutions might otherwise have enjoyed.

235
Table IV.4Impact of financial sector consolidation on the monetary
transmission mechanism (MTM)(summary of questionnaire responses)
Q Effect of consolidation
Aus
tral
ia
Belg
ium
Can
ada
Fran
ce
Ger
man
y
Ital
y
Japa
n
Net
herl
ands
Spai
n
Swed
en
Switz
erla
nd
UK
US
1 Overall impact on policy N N N N N Y? N N N N N N N2 Impact on one or more
specific channel of policyN N N N? ? Y ? N N ? ? N N
3 Distributional effects N N N N N Y N N ? N Y N N4 Impact on financial markets N N N N N N ? N N N N N N5 Impact on information
indicatorsY N N N N N N ? N N Y ? N
6 Changes in monetary policystrategies
N N N N N N N N N N ? N N
7 & 8 Future MTM and policy N ? N ? Y ? ? ? ? N Y ?
Y = explicit effect observed/or expected; N = no evidence of impact; ? = uncertain. The ECB was onlyasked about the prospective effects of consolidation on the MTM (questions 7 & 8). According to theECB, these effects are uncertain.
The bank lending channelMonetary policy may affect the economy via its impact on the scale of bank lending, in additionto its influence over interest rates generally. This channel depends on bonds, bank loans andbank deposits being imperfect substitutes. When interest rates rise, transactions and savingsdeposits at banks are likely to contract, requiring banks to reduce the size of their balance sheetsand hence the stock of lending. This reduction may be larger – particularly in the short run –than the reduction in the demand for loanable funds that would be brought about anyway by theincrease in the central bank’s target interest rate. In that event, a gap would arise between thesupply of and demand for funds, which banks would be able to fill if they could replace thedeposits they had lost with new wholesale funding. Because of information asymmetries,however, banks may be unable to raise wholesale funds at the same rates as they pay ondeposits. As a result, banks may have to increase the wedge between capital market interestrates and the rates they charge their borrowers. The thicker wedge implies that a tightening ofmonetary policy will have a bigger impact on bank-dependent borrowers – includinghouseholds and smaller businesses – than on those borrowers who are able to tap financialmarkets directly.
The effects of consolidation on the bank lending channel: empirical evidenceConsolidation could affect the size of the bank lending channel in two ways. First, larger banksmay have better access to sources of funds other than transactions and savings deposits becauseof improved name recognition, fixed costs, or lower information costs. If so, then the effect of

236
tighter monetary policy on the supply of bank loans is likely to be reduced by consolidation ifconsolidation reduces small banks’ share of the industry.162 Unfortunately, the height of thethreshold that banks need to cross in order to gain improved access to wholesale markets is notclear. Consolidation amongst banks already able to borrow at good rates in wholesale markets isunlikely to have a significant effect; nor is consolidation amongst small banks if it does notcarry the consolidated banks over the relevant threshold. Whatever its current height, thethreshold is likely to fall as a result of the increasing size, depth and integration of capitalmarkets. The second possibility is that consolidation, by allowing stronger banks to take overweaker ones, could strengthen the financial condition of the banking sector. In that case, bankswould also have improved access to alternative sources of funds, the bank lending channelthereby attenuating and reducing the impact of a given change in the proximate instrument ofmonetary policy.
While there is no direct evidence regarding the effect of consolidation on access to markets formanaged liabilities, there is strong circumstantial evidence that larger banks find it easier thansmaller banks to fund loans in periods of tight monetary policy.163 The impact of a policytightening on bank lending is smaller for banks with more liquid balance sheets, where liquidityis measured by the fraction of assets accounted for by securities which can be sold to fundloans. This effect of liquidity is important primarily for smaller banks (those in the bottom 95%of the size distribution), suggesting that these institutions are less able than larger banks to findalternative sources of funds.
However, there is considerable controversy about whether the bank lending channel isempirically important at all. A number of studies report results suggesting an important role forthe bank lending channel in the United States.164 However, drawing on evidence from a varietyof countries, others cast doubt on the existence of this channel.165
In addition, it is difficult to assess the effects of consolidation on the bank lending channel in anindividual country because of the relatively modest amount of consolidation experienced inmany of them. However, there are substantial differences in financial sector concentrationacross countries, and some recent cross-country studies may shed light on the effects ofconsolidation on the bank lending channel. For example, one study tests the hypothesis that theeffects of changes in monetary policy should be larger in countries that have smaller and lessrobust banks, greater dependence on bank finance and smaller firms, because theory suggeststhat the bank lending channel should be stronger in such economies.166 It considers data fromEMU countries on the size and concentration of the banking system, the health of the bankingsystem, the importance of bank finance and the size of firms. Smaller firms were regarded asmore likely to be bank dependent. Using a vector autoregression approach to measure the size ofthe effects of monetary policy, it finds some evidence in support of this hypothesis. This resultsuggests that consolidation in a given country could, by increasing the size of banks and perhapsalso by improving the health of the banking system, reduce the importance of the bank lendingchannel.
162 Note that the effect of consolidation on the bank lending channel depends on how it influences the responsivenessof bank loan supply to changes in policy. The static effect of consolidation on the availability of bank loans tobank-dependent borrowers is discussed in Chapter V.
163 See Kashyap and Stein (2000).164 See Kashyap et al (1986) and Kashyap and Stein (2000).165 See Dale and Haldane (1995), Favero et al (2000), Miron et al (1993) and De Bondt (1998).166 See Cecchetti (1999).
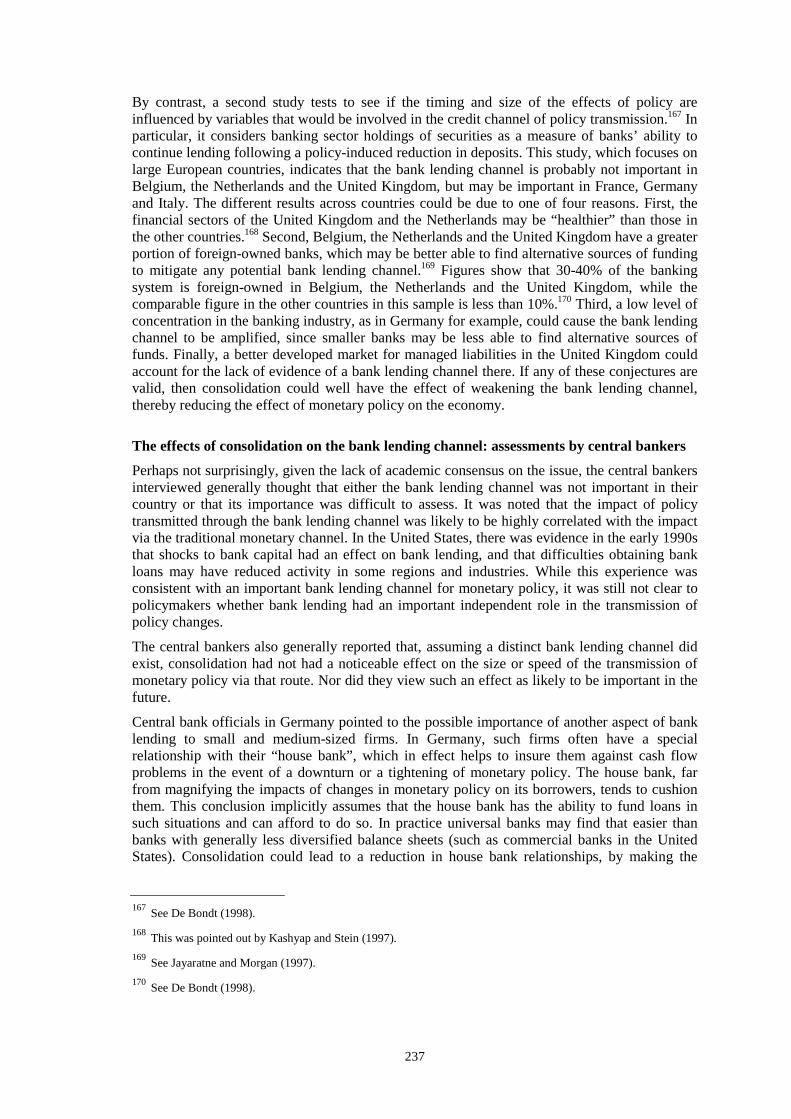
237
By contrast, a second study tests to see if the timing and size of the effects of policy areinfluenced by variables that would be involved in the credit channel of policy transmission.167 Inparticular, it considers banking sector holdings of securities as a measure of banks’ ability tocontinue lending following a policy-induced reduction in deposits. This study, which focuses onlarge European countries, indicates that the bank lending channel is probably not important inBelgium, the Netherlands and the United Kingdom, but may be important in France, Germanyand Italy. The different results across countries could be due to one of four reasons. First, thefinancial sectors of the United Kingdom and the Netherlands may be “healthier” than those inthe other countries.168 Second, Belgium, the Netherlands and the United Kingdom have a greaterportion of foreign-owned banks, which may be better able to find alternative sources of fundingto mitigate any potential bank lending channel.169 Figures show that 30-40% of the bankingsystem is foreign-owned in Belgium, the Netherlands and the United Kingdom, while thecomparable figure in the other countries in this sample is less than 10%.170 Third, a low level ofconcentration in the banking industry, as in Germany for example, could cause the bank lendingchannel to be amplified, since smaller banks may be less able to find alternative sources offunds. Finally, a better developed market for managed liabilities in the United Kingdom couldaccount for the lack of evidence of a bank lending channel there. If any of these conjectures arevalid, then consolidation could well have the effect of weakening the bank lending channel,thereby reducing the effect of monetary policy on the economy.
The effects of consolidation on the bank lending channel: assessments by central bankersPerhaps not surprisingly, given the lack of academic consensus on the issue, the central bankersinterviewed generally thought that either the bank lending channel was not important in theircountry or that its importance was difficult to assess. It was noted that the impact of policytransmitted through the bank lending channel was likely to be highly correlated with the impactvia the traditional monetary channel. In the United States, there was evidence in the early 1990sthat shocks to bank capital had an effect on bank lending, and that difficulties obtaining bankloans may have reduced activity in some regions and industries. While this experience wasconsistent with an important bank lending channel for monetary policy, it was still not clear topolicymakers whether bank lending had an important independent role in the transmission ofpolicy changes.
The central bankers also generally reported that, assuming a distinct bank lending channel didexist, consolidation had not had a noticeable effect on the size or speed of the transmission ofmonetary policy via that route. Nor did they view such an effect as likely to be important in thefuture.
Central bank officials in Germany pointed to the possible importance of another aspect of banklending to small and medium-sized firms. In Germany, such firms often have a specialrelationship with their “house bank”, which in effect helps to insure them against cash flowproblems in the event of a downturn or a tightening of monetary policy. The house bank, farfrom magnifying the impacts of changes in monetary policy on its borrowers, tends to cushionthem. This conclusion implicitly assumes that the house bank has the ability to fund loans insuch situations and can afford to do so. In practice universal banks may find that easier thanbanks with generally less diversified balance sheets (such as commercial banks in the UnitedStates). Consolidation could lead to a reduction in house bank relationships, by making the
167 See De Bondt (1998).168 This was pointed out by Kashyap and Stein (1997).169 See Jayaratne and Morgan (1997).170 See De Bondt (1998).

238
close monitoring on which such relationships depend more difficult to carry out, and byreducing the trust of the borrowers that the implicit contract underlying such relationshipswould be honoured. In that case, banks might allow loan rates to respond more to changes inofficial interest rates, rather than buffering such changes. If that were to happen, those firms thatrely on a continuing relationship with their bank (most typically small and medium-sized firms),and so are limited in the choice of alternative finance sources, would face higher borrowingcosts following a tightening of policy than they do under current arrangements. Such changescould imply an increase in the importance of the bank lending channel. However, as theBundesbank also noted, consolidation has been accompanied and perhaps partly caused byglobalisation, securitisation and disintermediation, all of which facilitate smaller firms’ accessto market-based finance and thereby reduce the strength of the bank lending channel.
The balance sheet or “financial accelerator” channelA second variant of the credit channel of monetary policy is the balance sheet or financialaccelerator channel, which derives from the role of collateral in lending. Lenders may requireborrowers to post collateral if they are uncertain that borrowers would otherwise be able orwilling to repay loans. A tightening of monetary policy is likely to reduce the value of thatcollateral, by reducing demand for the borrower’s products (in the case of a firm) and increasingthe rate at which future service flows generated by the collateral asset are discounted. Areduction in the value of collateral could, in turn, lead to cutbacks in spending, defaults whenexisting loans come up for renewal, and fire sales of collateral assets.
The effect of consolidation on the balance sheet channel: empirical evidence
The key question in this case is whether consolidation eases or aggravates the informationproblems between lenders and borrowers that lead lenders to demand collateral as security forloans. If consolidation makes newly merged lending institutions more efficient assessors ofcredit risk, for example because larger institutions can afford increased investment ininformation technology, then fewer borrowers might be required to provide collateral, and thebalance sheet channel might weaken. If, on the other hand, the larger consolidated institutionsare more remote from borrowers (are less like small “relationship banks”) and rely more onstatistical rules and uniform lending policies, then it is possible that the balance sheet channelmight strengthen. Thus, the effect of consolidation on the balance sheet channel could be eitherpositive or negative. Moreover, either result could be consistent with consolidation having beendriven by competitive pressures.
As with the bank lending variant of the credit channel, there is controversy in the academicliterature about whether this channel is empirically significant at all. A number of studies castdoubt on the existence of a (household) balance sheet channel, at least in some countries.171
But some cross-country studies hint at an important effect in some cases. One finds thatdifferences in the effects of monetary policy on the real economy in a number of Europeancountries may reflect differences in variables intended to proxy for both bank credit and balancesheet channels, in particular, financial structure, levels of household debt and the prevalence ofcollateralised loans.172 Another tests whether the net worth of households and businessesappears to influence the transmission of monetary policy, as one might expect if the balancesheet channel were operating.173 It finds evidence of a household balance sheet channel inGermany, Italy and the Netherlands, but not in Belgium, France or the United Kingdom. It also
171 See eg Jappelli and Pagano (1989), Bachetta and Gerlach (1997) and De Bondt (1998).172 See Dornbusch et al (1998).173 See De Bondt (1998).

239
reports some, but by no means a perfect, correlation of the strength of the balance sheet channel(by this measure) with financial sector concentration. The strength of the balance sheet channelvaries across European countries in a way that is consistent with differences in the efficiency ofthe market for secured lending to households.174 To the extent that consolidation promotesaccess to credit (eg by facilitating mortgage equity withdrawal), it is likely to erode theimportance of balance sheet effects. These cross-country studies suggest, then, thatconsolidation might weaken the strength of the balance sheet channel.
The effects of consolidation on the balance sheet channel: assessment by central bankers
The central bankers interviewed by the task force were unsure of the importance of the balancesheet channel and, assuming that such a channel was operative, they generally did not appear tobelieve that consolidation had had a noticeable effect on its magnitude. However, someconceded that such an effect could manifest itself in future.
Implications of any reduced importance of the credit channels
Since the credit channels are the result of credit market imperfections, if consolidation reducestheir importance, welfare should be improved. However, monetary policymakers may facedifficulties in adjusting to some of the changes. First, easing credit market imperfections maylead to a temporary increase in borrowing and spending, as some who had previously beenconstrained by higher borrowing costs or lack of collateral find themselves able to borrow.Second, any reductions in borrowing constraints may boost equilibrium real interest rates, andpolicymakers will need to take the higher equilibrium rates into account when setting policy.These two effects would probably be similar to those experienced in some countries as a resultof financial liberalisation.175 Finally, the reduction in the size of the credit channel implies that,to attain a particular effect on the real economy, policy instruments will have to be adjustedmore than had previously been the case. Of course, in practice, the effects of consolidation onthe credit channel are likely to emerge only slowly, allowing the central bank to observe theseeffects and allow for them in an orderly way. Indeed, none of the central banks interviewed hadnoticed an effect of consolidation on the monetary transmission mechanism or on thedistribution of the effects of monetary policy across classes of borrowers (eg households versusfirms, small firms versus larger ones, or producers of tradable goods and services versusproducers of non-tradables).
4. Some further possible consequences of consolidation for monetarypolicy
While there is little evidence that consolidation has generally affected either the implementationof policy or the monetary transmission mechanism, it is nonetheless possible that it couldinfluence the setting in which policy is determined. For example, consolidation may affect theimpact of financial shocks and the way that they are transmitted across markets and borders. Tothe extent that consolidation leads to larger firms that have major positions in many markets andcountries, shocks that once might have been isolated in a single market, region or country mayhave broader effects. For example, an economic downturn in one country could, through itseffects on the balance sheets of banks with cross-border operations, cause a tightening oflending standards or terms in other countries. As a result, the appropriate stance of policy in
174 See Iacoviello and Minetti (2000).175 The effects of financial liberalisation on aggregate demand and real interest rates are discussed in G10 (1995),
pp 49-52.

240
those other countries might change. Similarly, losses sustained in one financial market couldlead to movements in prices or liquidity in other financial markets, as firms active in thetroubled market trimmed their positions or cut back on trading and market-making activities asa result of their losses. On the other hand, because such firms are more diversified and mightalso benefit from a cushion of monopoly rents, they may be in a better position to absorb ratherthan transmit shocks, particularly if they perceive them to be temporary. In either case, thedynamics of foreign exchange rate determination would be likely to change if a greaterproportion of cross-border capital flows were internalised by large, global financial firms. Suchan outcome seems unlikely, however, given the declining relative importance of bank lending ininternational capital flows in recent years.
Another way in which consolidation might affect the environment for policy is by decreasingmarket liquidity and boosting volatility. Most simply, consolidation could reduce liquidity if itallowed market-makers in a financial instrument to use their market power to boost bid-askedspreads at the expense of other market participants. Alternatively, liquidity could decline if therestructuring that followed consolidation led to a reduction in the total amount of capitalallocated to trading in, or making markets in, a particular instrument. A related possibility isthat, following consolidation, the total amount of resources dedicated to the analysis andforecasting needed to price an instrument appropriately could decrease. In that case, the marketprice of the instrument could vary more widely around the value justified by fundamentals,directly boosting volatility and increasing trading risk, and perhaps reducing liquidity. Volatilitycould also increase if consolidation resulted in a few very large firms dominating financialmarkets, because in that case a change in the investment strategy of a single firm could have asubstantial impact on asset prices. Moreover, consolidation could increase herding behavioursince departures from the consensus view might be more noticeable, in which case deviations ofmarket prices from fundamentals could increase in size, boosting volatility.176 These factorscould also cause financial markets to respond less predictably to changes in the stance ofmonetary policy, perhaps strengthening the case for gradualism and transparency in policymaking.
As noted in the previous chapter on systemic risk, consolidation could not only affect theliquidity of markets, but might also cause a deterioration in market performance during times ofstress. Such an effect would likely be a greater concern if consolidation led to a small number oflarge firms dominating many important financial markets, especially if differences in outlookamong those firms were, at times, smaller than in the past because their models and tradingstrategies had converged. In such situations, a shock in a particular market could be transmittedacross firms and markets more rapidly and to a greater degree than had previously been thecase. Moreover, subsequent decisions by some firms to reduce their risk exposures – because ofreductions in their capital, reductions in their appetite for risk or counterparties’ concerns abouttheir financial strength – might trim market liquidity and cause further declines in market prices.Indeed, the report by the Committee on the Global Financial System (CGFS) on the financialevents in the autumn of 1998 notes that such factors may have exacerbated the response ofmarkets to shocks at that time.177
Consolidation could also cause markets to be less resilient following a shock if it reduced thelikelihood that financial firms would act to cushion the impact of the shock on borrowers andmarkets. For example, consolidation could result in all of the largest and most importantfinancial firms in an economy participating in the same broad set of financial markets. Clearly,consolidation need not have this effect, and the extent to which it does so would depend on theforces driving the consolidation. Nonetheless, to the extent that consolidation had such aneffect, a major shock in one market could impose substantial losses on virtually all of the large
176 See Scharfstein and Stein (1990) for a model of herding behaviour in financial markets.177 See CGFS (1999), p 14.

241
financial firms. As a result, none of the firms might be willing and able to expand their activitiesto compensate for reductions by the others, thereby amplifying the effect of the shock onmarkets and the real economy relative to the outcome with a more fragmented and diversefinancial sector. Thus, while consolidation might reduce the impact of smaller shocks – sincefinancial firms would be better diversified – it could increase the effects of large shocks becausethe financial sector would be less well diversified. Consolidation could affect the resilience offinancial markets through other channels as well. On the one hand, it could reduce thecompetitive pressures on financial firms to provide finance and market-making in periods ofmarket turbulence. These pressures might be important, since each firm would probably want toreduce its activities if it could do so without the risk of losing future business as a result. On theother hand, if all firms cut back on their activities, they might all be made worse off. If so,consolidation could actually reduce firms’ incentives to pull back, since larger financial firmsmight be more likely to take account of the effects that their own activities could have on themacroeconomic outcome and so on the value of their positions.
In any case, the potential effects of consolidation on the operation of financial markets do notyet appear to have become significant practical concerns. The central bankers who wereinterviewed generally thought that consolidation had not affected the volatility or liquidity offinancial markets. Only in Japan, where significant consolidation of domestic institutions isexpected to take place within the next couple of years, together with increased involvement oflarge overseas institutions in key asset markets, did the central bank think that such effectsmight become an issue in the future. Other central banks were more sanguine. In Europe, it wasevident that the largest institutions were the providers of market liquidity in national markets, inadverse conditions or otherwise. But the introduction of the euro had significantly increased thesize of the market in which they operate. In the United States, it was pointed out thatconsolidation did not necessarily imply any change in the aggregate capital allocated to tradingand market-making. Indeed it was noted that, so long as barriers to entry are not large, theeffects of consolidation on market volatility and liquidity should be small, since increasedvolatility and reduced liquidity relative to their levels in competitive markets would seem tooffer profit opportunities to potential entrants.
Another possible adverse effect of consolidation for monetary policy is that changes in financialstructure might make it more difficult to interpret movements in indicator variables such asyield spreads or the monetary aggregates. There have been instances in the past when financial-sector liberalisation has had unexpected consequences for widely monitored variables(eg monetary aggregates in the United Kingdom in the 1980s), with the consequence that themonetary policy stance has been difficult to assess. Could consolidation have a similar impact?At least thus far, it does not seem to have done so. As noted, the central bankers interviewedgenerally did not believe that consolidation had had noticeable effects on the behaviour offinancial markets, suggesting that indicators based on prices or interest rates have beenessentially unaffected. Similarly, few of those interviewed thought that consolidation hadsignificantly affected the behaviour of monetary aggregates. While a number of central banksnoted that financial market developments more generally had made movements in theaggregates more difficult to predict, only a few of them reported that consolidation had had aninfluence, and its effects were generally thought to have been fairly minor. However, a few ofthe central banks thought that the effects of consolidation on the behaviour of the aggregateswas not yet clear, or thought that such effects could be more significant in the future. If the paceof consolidation were to increase suddenly, that would be more likely to have an effect similarto that of sudden financial liberalisation.
If consolidation led to the development of very large and complex institutions, the failure ofwhich would be particularly difficult to manage, central banks’ lender of last resort andmonetary policy responsibilities would be more challenging. If such firms became troubled, thecentral bank, taking account of the potential moral hazard problems, would have to decide uponthe appropriate magnitude and duration of any provision of emergency liquidity to the affectedfirm or firms. It would also have to carefully consider the possible need to ease the stance of

242
monetary policy both to cushion the real economy from the effects of the resulting stresses infinancial markets – which might include an increased aversion to risk taking and reduced marketliquidity – as well as to potentially reduce those stresses. Such consideration would require thecentral bank to judge the likely duration of the financial market difficulties, their potentialimpact on the economic outlook and the possible downside risks they pose to that outlook.Moreover, if policymakers decided that easier policy were warranted, they would need to beprepared to reverse course once market conditions began to improve. In practice, central bankshave, at times, thought it appropriate to ease monetary policy in response to concerns about thepossible macroeconomic effects of difficulties at financial institutions or in financial markets.For example, in the early 1990s monetary policy in the United States was for a time easier thanit otherwise would have been owing to concerns about the effects on the economy of efforts bymany banks to boost their capital in response to regulatory and market pressures. Moreover,consolidation – by increasing the number of large, complex institutions whose failure mighthave significant macroeconomic effects – might increase the likelihood that monetary policywould have to respond to financial difficulties at a particular firm or firms. In such situations,monetary policymakers would need to take care that their decisions were not unduly influencedby the possible effects of policy changes on the financial condition of the troubled firm or firms,but rather remained focused on the effects of such changes on the economy. In practice,however, the central bankers interviewed did not believe that consolidation had increased thelikelihood that policy would be adversely affected by firm-specific concerns. But some pointedout that this possible distortion made past and present efforts to limit contagion throughimprovements in clearing, payments and settlement systems and tightened capital standardseven more important.
Many of the large and complex financial institutions that might pose challenges to central bankswould have cross-border operations. Difficulties at such firms would raise the additionalquestion of which central bank should provide emergency liquidity assistance should it provenecessary. This issue was considered in the preparations for the century date change, and therewas broad agreement that foreign banking organisations should have the same access asdomestic institutions to normal sources of central bank liquidity, so long as they satisfied thecriteria for such lending (eg quality of collateral and standards of home country supervision).However, more difficult situations could arise if an institution’s collateral proved insufficient orconcerns about its condition meant that the borrowing likely was probably not just to meet atemporary liquidity shortfall, but rather suggested a more substantial problem. In that event, thequestion might no longer be about the appropriate source of liquidity assistance, but rather howto handle an impaired institution. In such cases, it was thought that home and host countrycentral banks and supervisory authorities would need to consult closely and that home countrycentral banks might well be responsible for providing liquidity from the outset or at least verysoon after such support became necessary. It was also noted at that time that the ability to usecollateral in another country to back borrowing from a central bank could be useful for someinstitutions. Of course these issues were discussed in the context of the century date change, andfurther discussion will be needed for the case of lending to large, complex, internationally activebanking institutions.
5. Some caveats and research challengesWhile there is no compelling evidence that consolidation has generally had effects on theimplementation or transmission of monetary policy, it is worth bearing in mind some of thedifficulties in assessing its impact.
First, variation in financial sector concentration over time within most countries has beenrelatively small compared to the variation across countries. Thus, identifying the effects ofconsolidation on monetary policy based on information from individual countries alone may behard. On the other hand, cross-country studies are difficult because of the significant differencesin legal and regulatory frameworks, institutional and market structures, and attitudes and
243
expectations across countries. An additional complication is that central banks may respond toconsolidation by adjusting their operating procedures, thereby offsetting the effects thatconsolidation might otherwise have had.
Second, many of the central banks interviewed noted that consolidation had taken place at thesame time as a number of other important changes in financial markets, including globalisation,deregulation, and substantial improvements in information and communications technology. Asa result, it is difficult to separate the effects of consolidation alone from the effects of otherchanges, and to disentangle cause and effect.
Third, empirical estimates of the effects of monetary policy on the real economy are fairlyimprecise, making it difficult to tell if consolidation has changed the transmission mechanism.And the hypotheses being tested have sometimes not been formulated clearly.
Finally, since most analyses of the effects of monetary policy are based on models that do notinclude many potentially important features of banks and financial markets, they have little tosay about the influence of changes in the industrial structure of the financial sector on the effectsof policy.
This review suggests several avenues of research that might allow a more thorough assessmentof the impact of financial sector consolidation on monetary policy. Further development offormal models of the bank lending and balance sheet channels of the monetary transmissionmechanism, to incorporate a richer characterisation of the financial sector, would help informulating testable hypotheses. Work in a number of other areas would also be helpful.Studying the impact of a reduction in the number of participants on competition and efficiencyin different market and auction settings would help to clarify both how far consolidation can gobefore difficulties in implementing policy are likely to emerge, and what changes in operatingprocedures might help to ameliorate those difficulties. A better understanding of the effects ofheightened volatility in the policy rate on other market interest rates would be important if itwas found that consolidation did in fact tend to raise the volatility of the policy rate. Acrosscountries, the average volatility of a country’s overnight rate is not related to the volatility ofother short-term market rates in the country. This suggests that central banks may be able toallow some rise in volatility in the policy rate without great concern. However, periods ofincreased volatility in a country’s policy rate are associated with periods of higher volatility inother short-term market rates, suggesting that some vigilance is appropriate. 178
6. ConclusionsThus far, financial sector consolidation does not appear to have impeded the implementation ofmonetary policy, even though it has affected the markets in which central banks act in order toset policy. While most of the central banks surveyed reported that the number of participants inthe market for central bank balances and the number of counterparties for monetary policyoperations had declined as a result of consolidation, they generally thought that these numbersremained high enough to ensure that markets were competitive. While many central banks hadmade changes in monetary policy procedures and some had restructured their operations, thesechanges had not generally been undertaken in response to consolidation. Many of the centralbanks were confident that the appropriate regulations and operating procedures could ensureadequate competition going forward. Nonetheless, changes in regulations and procedures maybe necessary to offset adverse effects of further consolidation, and central banks need to be alertto this possibility. For example, competition may be enhanced by promoting the participation ofa wider range of counterparties. Indeed, the Swiss National Bank reported having made some
178 See Borio (1997).

244
changes that had helped to offset undesirable effects of consolidation on participation inmonetary policy operations.
There is little evidence of an effect of consolidation on the monetary transmission mechanism inindividual countries. Central banks generally report that the pass-through of changes in policyrates to market rates and rates on bank deposits and loans had not changed appreciably as aresult of consolidation, and only a few respondents expected effects in the near term. Centralbank staff generally indicated that they had not identified significant changes in the monetarytransmission mechanism in recent years. It seems possible that consolidation might reduce theimportance of the bank lending and balance sheet channels of policy – if indeed they areoperative – because larger banks are likely to find it easier to raise funds in capital markets andto assess credit risk amongst potential borrowers (thus reducing the role of collateral). If so, itwould be likely that the impact of a given change in the monetary policy instrument on outputwould be reduced. A reduction in the importance of these channels would also be expected toaffect the distributional impact of monetary policy changes (eg by putting less of the burden ofadjustment on agents without direct access to capital markets, such as most smaller businessesand the household sector), yet the central banks reported no evidence that the distributionalimpact had, in fact, changed.
However, many of the central banks noted that it was difficult to disentangle the effects ofglobalisation, technical innovation and financial sector consolidation, so that some effect ofconsolidation could not be ruled out. It is quite possible that consolidation has changed theeconomic environment in which central banks operate, but that they have been able to adjustpolicy appropriately without having to identify the reasons for the changes. A few central banksargued that the phenomenon was too recent for them to be able to evaluate its effects with anyconfidence. Some of them also thought that consolidation might be relevant in the future –particularly if its pace picked up relative to that of globalisation. Moreover, studies of cross-country differences in the strength of the monetary transmission mechanism offer some supportfor the existence of financial structure effects on the potency of monetary policy. In short, itshould not be asserted that there is conclusive evidence that financial sector consolidation hashad no effect on monetary policy. Rather the case for such an effect is not proven; it may simplybe too early to tell. Central banks need to be flexible about how they set the proximateinstruments of monetary policy, so that they can respond to any apparent changes in themonetary transmission mechanism. The optimal response will depend upon the reason for thechange. Understanding the potential impact of financial sector consolidation – and indeed ofother factors such as globalisation – should enable central banks to do better than with trial anderror alone. It would be prudent for forward-looking central banks to bear in mind in particularthe possibility that consolidation could, in future, tend to reduce the importance of the so-calledcredit channels of monetary policy transmission – to the extent they are operative – and therebyreduce the impact of changes in monetary policy instruments on the real economy.

245
References
Bachetta, P and S Gerlach (1997): “Consumption and credit constraints: some internationalevidence”, Journal of Monetary Economics, 40, pp 207-238.
Bank for International Settlements (1999): “The monetary and regulatory implications ofchanges in the banking industry”, BIS Conference Papers, Vol 7, March.
Bank of England (1999): “The transmission mechanism of monetary policy”, Report preparedby Bank of England staff under the guidance of the Monetary Policy Committee.
Bernanke, B S and M Gertler (1995): “Inside the black box: the credit channel of monetarypolicy transmission”, Journal of Economic Perspectives, Vol 9, Fall, pp 27-48.
Bernanke, B S and M Gertler (1998): “The financial accelerator in a quantitative business cycleframework”, NBER Working Paper No 6455.
Bernanke, B S, M Gertler and S Gilchrist (1998): “The financial accelerator and the flight toquality”, NBER Working Paper No 4789.
Borio, C (1997): “The implementation of monetary policy in industrial countries: a survey”, BISEconomic Papers No 47.
Braun, C, D Egli, A Fischer, B Rime and C Walker (1999): “The restructuring of the Swissbanking system”, in BIS (1999).
Cecchetti, S G (1999): “Legal structure, financial structure, and the monetary policytransmission mechanism”, NBER Working Paper No 7151.
Cottarelli, C and A Kourelis (1994): “Financial structure, bank lending rates, and thetransmission mechanism of monetary policy”, IMF Staff Papers, Vol 41, No 4, pp 58-623.
Dale, S and A G Haldane (1995): “Interest rates and the channels of monetary transmission:some sectional estimates”, European Economic Review, December, pp 1611-26.
De Bondt, G J (1999): “Financial structure and monetary transmission in Europe: a cross-country study”, University of Amsterdam.
Dornbusch, R, C A Favero and F Giavazzi (1998): “The immediate challenges for the EuropeanCentral Bank”, NBER Working Paper No 6369.
European Central Bank (1998): “The single monetary policy in Stage Three”.
Favero, C A, F Giavazzi and L Flabbi (1999): “The transmission mechanism of monetary policyin Europe: evidence from banks’ balance sheets”, NBER Working Paper No 7231.
Fisher, J (1999): “Credit market imperfections and the heterogeneous responses of firms tomonetary shocks”, Journal of Money, Credit and Banking, 31, pp 187-211.
Friedman, B M (1999): “The future of monetary policy: the central bank as an army with only asignal corps”, NBER Working Paper 7420.
Fuentes, I and T Sastre (1999): “Implications of restructuring in the banking industry: the caseof Spain”, in BIS, (1999).
Ganley, J and C Salmon (1997): “The industrial impact of monetary policy shocks: somestylized facts”, Bank of England working paper No 67.
Gertler, M and S Gilchrist (1994): “Monetary policy, business cycles and the behaviour of smallmanufacturing firms”, Quarterly Journal of Economics, 109(2), May, pp 309-40.
Group of Ten (1995): “Saving, investment and real interest rates”, Rome: Istituto Poligrafico EZecca Dello Stato, October.

246
Hoffman, B and P Mizen (2000): “Evidence of passthrough in UK banks’ and BuildingSocieties’ retail rates”, Bank of England, mimeo.
Howard, D (1998): “A primer on the implementation of monetary policy in the LVTSenvironment”, Bank of Canada Review, Autumn.
Iacoviello, M and R Minetti, (2000): “The credit channel of monetary policy and housingmarkets: international empirical evidence”, Mimeo, LSE.
Jappelli, T and M Pagano (1989): “Consumption and capital market imperfections”, AmericanEconomic Review, 79, pp 1088-1105.
Jayartne, J and D P Morgan, (1997): “Information problems and deposit constraints at banks”,Research paper 9731, Federal Reserve Bank of New York.
Kahn, C, G Pennacchi and B Sopranzetti (2000): “Bank consolidation and consumer loaninterest rates”, unpublished mimeo.
Kashyap, A K (1995): “The impact of monetary policy on bank balance sheets”, Carnegie-Rochester Conference Series on Public Policy, Vol 42, 1995, pp 151-195.
Kashyap, A K and J C Stein (1997): “The role of banks in monetary policy: A survey withimplications for the European Monetary Union”, Economic Perspectives, Vol 22, No 5 FederalReserve Bank of Chicago.
Kashyap, A K and J C Stein (2000): “What do a million observations on banks have to sayabout the transmission of monetary policy?”, American Economic Review, 90.
Kashyap, A K, J C Stein, and D W Wilcox (1993): “Monetary policy and credit conditions:evidence from the composition of external finance”, American Economic Review, 83, pp 78-98.
Kiyotaki, N and J Moore (1997): “Credit cycles“, Journal of Political Economy, 105(2).
Miron, J, C Romer, and D Weil (Also published in Monetary Policy, N. Gregory Mankiw, ed,(Chicago; University of Chicago Press: 1994): “Historical perspectives on the monetarytransmission mechanism”, NBER Working Paper No 4326.
Scharfstein, D S, and J C Stein (1990): “Herd Behaviour and Investment”, American EconomicReview, 80(3), pp 465-480.
Swiss National Bank (1999): “Monetary policy decisions of the Swiss National Bank for 2000(as of December 1999)”.

247
Chapter V
The effects of consolidation on efficiency,
competition and credit flows
1. IntroductionThe liberalisation of financial markets and the accelerating development of informationtechnology have increased competition both within and across industries. In particular, thelowering of geographical barriers and the increasing integration of financial markets pit againsteach other banks, insurance and asset management companies that used to operate in segmentedmarkets. In response to this process, financial institutions attempt to improve the efficiency ofexisting operations and to expand into new markets, trying to build a competitive advantage in anew environment.
Mergers and acquisitions (M&As) allow financial institutions to rapidly increase their size andto improve their knowledge of new products and markets, thereby allowing them to attempt toexploit economies of scale and scope, to preserve falling margins by increasing market shareand to attract new customers. M&As on the scale witnessed by the financial sector in the lastdecade have profound effects on the firms involved, their competitors and their customers, inparticular households and small firms, for whom changing providers of financial services ismore costly.
M&As can result in larger and more diversified firms; however, this does not necessarily meanthat these firms are run more efficiently. In order to assess the impact of consolidation on theperformance of financial institutions, the first section of this chapter defines what is meant byefficiency improvement; it then examines the evidence available regarding the effect ofconsolidation on the efficiency of financial institutions in the G10 countries.
Consolidation might increase the market power of financial institutions, thus leading to pricesabove (and volumes below) those prevailing in a hypothetical situation of perfect competition.The effect of consolidation on competition depends on several factors, such as thecharacteristics of the deal (eg in-market or out-of-market), the type of customers (local orinternational) and the degree of contestability of the markets involved. In the second section, thepossible effects of consolidation on competition are analysed. Particular attention is given toongoing fundamental developments in financial markets that have raised questions about thecontinued importance of the geographic markets identified under traditional antitrust policies.Existing empirical research is examined in order to assess the impact of M&As on competition.In addition, the main features of actual antitrust policy in the G10 countries are reviewed and afew relevant case studies are presented.
In many countries the process of consolidation of the banking system has involved a largenumber of small banks, raising fears that the reduction in the number of these institutions mayaffect the availability of credit to small firms that traditionally rely on bank credit. Whenconsolidation occurs, the larger bank resulting from the merger is able to expand its lendingcapacity with respect to larger borrowers, and it may restructure its portfolio, discontinuingcredit relationships with smaller borrowers.
In the section on the effects of consolidation on the availability of credit flows, the relativeimportance of small firms for G10 countries is briefly examined. After discussing whyconsolidation may adversely affect credit flows to small businesses, the existing empirical

248
evidence is reviewed. The effects of changes in size and organisation that result fromconsolidation on the propensity of participating banks to make small business loans areanalysed, as is the behaviour of other market participants that might provide financing to theborrowers that have been rejected by the banks involved in M&As.
2. Consolidation and efficiencyThe financial services sector is transforming itself in response to fundamental changes inregulation and technology. Financial institutions respond by attempting to improve theirefficiency and by searching for new customers, increasing the range of products they offer andtheir geographical reach.
M&As are one way of implementing these strategies; however, the effect of consolidation onthe performance of the institutions involved is not always clearly positive. After defining whatis generally meant by efficiency improvement, the impact of consolidation on the performanceof financial institutions is gauged on the basis of a review of the evidence available for G10countries regarding the effect of M&As on the efficiency of financial institutions.
How do we measure efficiency?
Efficiency is a broad concept that can be applied to many dimensions of a firm’s activities.According to a narrow technical definition, a firm is cost-efficient if it minimises costs for agiven quantity of output; it is profit-efficient if it maximises profits for a given combination ofinputs and outputs. These definitions take size and technology as given and focus on howproduction factors are combined; they both measure managerial efficiency (the optimisation ofexisting resources), as opposed to the more comprehensive concept of technological efficiency.
Technological efficiency considers scale and scope economies: an efficient firm is one thatreaches the optimal size for its industry (scale) and that produces the optimal mix of productsgiven the prices of their production factors (scope). The minimum efficient size and optimalproduct mix vary with technologies, regulations and consumers’ tastes. Therefore, there shouldbe wide variations in firm structure across time, industries and countries if firms fully exploitscale and scope economies.
The definitions call for different measurement methodologies. The simplest approach consistsof comparing balance sheet ratios that describe costs (eg operating costs over gross income) andprofitability (eg return on assets or on equity). However, this methodology does not fully takeinto account the complexity of the financial industry. More complex analyses measuremanagerial cost and profit efficiency by comparing firms to the best practice of the industry, asdetermined by statistical methods, taking into account for each institution its inputs, outputs andthe prices it faces. A frontier (a combination of the factors just mentioned) along which allefficient firms would operate is estimated, then the distance of each actual firm from the frontieris taken as a measure of its (in)efficiency.179
In order to evaluate economies of scale and scope, the shape of the frontier, given by theexisting technologies, is investigated: if the performance of firms on the frontier (ie firms thatoptimally combine the existing resources) would improve by changing their size or product mix,then there is still room for exploiting economies of scale or scope. 180
179 This method should be considered with a certain degree of caution, given that it is based on the presumption thatthe residuals of the estimated frontier (usually thought of as what cannot be explained) are highly correlated withthe managerial inefficiency of the banks.
180 For a review of estimation techniques, see Berger and Mester (1997).
249
The impact of M&As on firm-level efficiency can be gauged by comparing firms along differentdimensions. For example, several studies investigate the relationship between size and costefficiency. The results provide indirect evidence on the effects of mergers: if larger firms aremore efficient, then presumably mergers will improve performance. This methodology suffers,however, from a weakness: it assumes that merged institutions are largely comparable to otherlarger firms; but the fact that some firms are involved in a merger while others are not is anindication that they may be different in several (possibly unobservable) ways. Analyses thatfocus on the performance of merged institutions compared with the performance of the non-merged ones are more reliable and provide direct evidence on the relationship between M&Asand efficiency.
The two approaches are complementary; both provide information on the consequences of theconsolidation process on competition and efficiency. Research has usually been conducted byanalysing indirect evidence, mainly because of problems of data availability.
Finally, for firms listed on a stock exchange, efficiency gains can be measured on the basis ofstock market performance: a firm is thought to be doing well when its shares outperform a givenbenchmark (the industry average or an index of firms of comparable size). The overallefficiency gains from a merger are evaluated in terms of the sum of the market values of thebidder and the target: if the sum increases, the deal is supposed to create value, and vice versa ifit decreases.
Differences in regulations, institutions and market structure across countries mean thatconclusions drawn from the analysis of one country should be generalised to others only verycarefully. This also means that common patterns that might eventually emerge from aninternational comparison are particularly informative for a policy debate.
Commercial banksBefore analysing the empirical evidence, a few warnings on the commercial banking industryshould be given. First, the industry really consists of two markets, retail and wholesale banking;retail banking is oriented towards households and small firms, while wholesale banking catersto larger firms and other financial institutions. Of course, many banks provide both services, butthis only adds to the complexity of the analysis. In general, research has not distinguishedexplicitly between retail and wholesale banking, although the focus is implicitly on retailbanking, where policy issues regarding competition, regulation and consumer protection aremore relevant. The remainder of the section is mainly concerned with retail banks.
Second, in countries with a heavily bank-oriented financial system, the banking industry mayevolve differently than in countries where there is more scope for securities markets, both interms of products offered and risk management. This should be kept in mind when comparingcost and revenues structures and economies of scale and scope. In countries with well-developed financial markets, banks provide more services than just loans and deposits and aremore able to offload risks, thus maintaining more liquid balance sheets; they may behavedifferently from banks that rely more on the traditional intermediation business.
Finally, because of differences in regulation, in some countries commercial and investmentbanks are (or have been in the past) strictly separated, while in others they can operate jointly asuniversal banks and even have cross-shareholdings with industrial companies. These differencesmake for different market structures and internal organisations, again hampering internationalcomparisons. All these warnings notwithstanding, the banking industries in G10 countries doshare some structural features that emerge from a careful analysis.
As most, although not all, M&A activity has taken place so far within country borders, the largemajority of research is carried out at the domestic level. Most papers deal with efficiency, scaleand scope issues indirectly, by comparing firms of different size; a few papers look directly atthe evidence on mergers, analysing ex post improvements in performance. The following

250
summary of the aggregate data introduces a review of empirical papers that deal with issues ofconsolidation and technical and managerial efficiency for commercial banks.
Aggregate dataSimilarities and differences among North American, European and Japanese banks emerge fromthe comparison of simple balance sheet ratios. The relationship between the cost structure andsize of North American and European commercial banks shows some similarities: the ratio ofoperating costs to gross income is higher for smaller banks (with total assets below USD 5billion) and it decreases from over 60 to around 55% for banks with assets between USD 20 and50 billion (see Table V.1).
Table V.1Size and performance of commercial banks
< USD 5bn USD 5-20bn USD 20-50bn > USD 50bnArea Variables
No Aver-age No Aver-
age No Aver-age No Aver-
age
Non-int. income(% of grossincome)
539 19.2 169 24.6 50 20.2 64 30.8
Operating costs(% of grossincome)
543 63.1 183 61.6 55 55.6 63 65.5Europe
Return on equity 559 7.1 185 7.4 48 7.2 58 8.2
Non-int. income(% of grossincome)
266 21.5 97 29.2 29 28.2 19 53.4
Operating costs(% of grossincome)
266 60.9 96 59.8 29 55.4 19 67.8
NorthAmerica
Return on equity 266 11.2 97 13.5 29 13.5 19 14.1
Non-int. income(% of grossincome)
15 0.4 63 9.2 29 8.9 26 30.0
Operating costs(% of grossincome)
17 76.9 63 69.5 29 67.9 26 60.4Japan
Return on equity 17 1.3 63 0.1 29 0.5 26 3.2
Source: Fitch-IBCA data for commercial banks of G10 countries; banks are ranked by assets in USD billions. All variables areaveraged over the 1994-97 period; the distribution is truncated at the top and bottom 10%.
The largest banks, with assets greater than USD 50 billion, present the highest costs (more than65% of gross income). This pattern points to the existence of economies of scale up to a certainsize, followed by diseconomies for very large banks. However, profitability rises with totalassets: for North American banks the return on equity increases from 11 to 14% from the first tothe fourth class; for European banks it increases from 7 to 8%.181 Higher operating costs are
181 Return on equity, unlike return on assets, is influenced by the capital structure of the bank; however, given thatthe capital structure is endogenously determined by the bank’s management, it can also be considered as part ofthe measurement of efficiency.
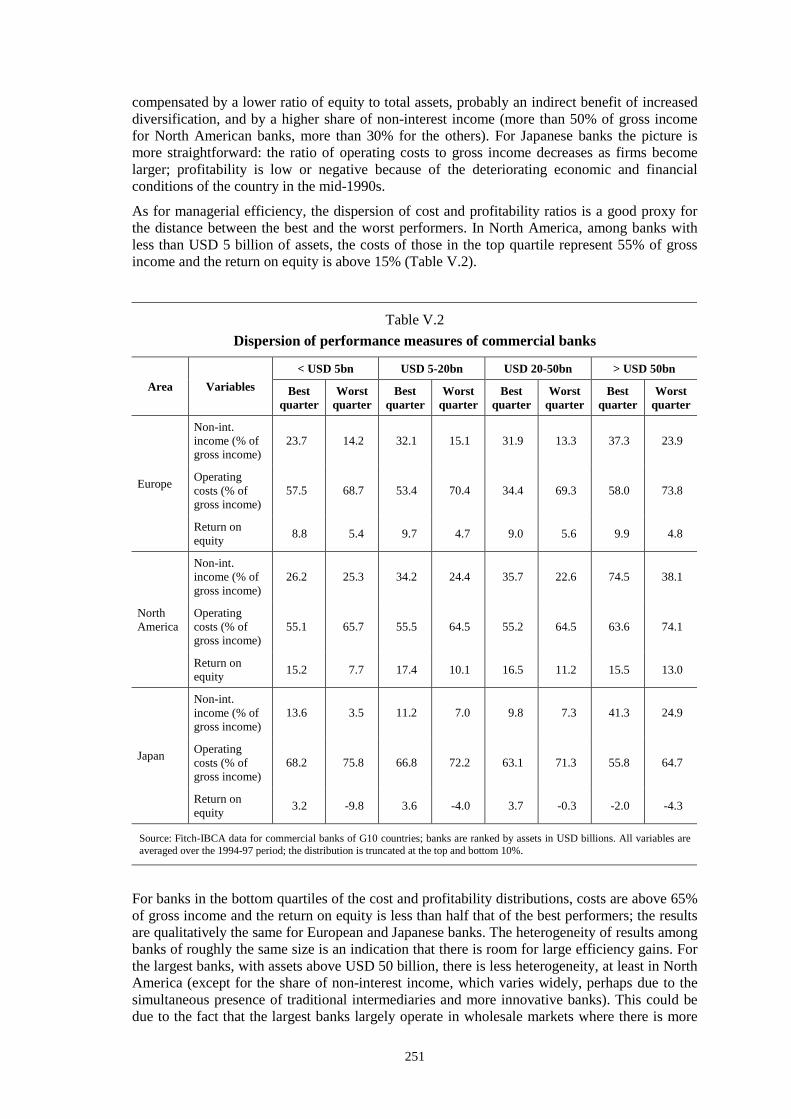
251
compensated by a lower ratio of equity to total assets, probably an indirect benefit of increaseddiversification, and by a higher share of non-interest income (more than 50% of gross incomefor North American banks, more than 30% for the others). For Japanese banks the picture ismore straightforward: the ratio of operating costs to gross income decreases as firms becomelarger; profitability is low or negative because of the deteriorating economic and financialconditions of the country in the mid-1990s.
As for managerial efficiency, the dispersion of cost and profitability ratios is a good proxy forthe distance between the best and the worst performers. In North America, among banks withless than USD 5 billion of assets, the costs of those in the top quartile represent 55% of grossincome and the return on equity is above 15% (Table V.2).
Table V.2Dispersion of performance measures of commercial banks
< USD 5bn USD 5-20bn USD 20-50bn > USD 50bnArea Variables Best
quarterWorst
quarterBest
quarterWorst
quarterBest
quarterWorst
quarterBest
quarterWorst
quarter
Non-int.income (% ofgross income)
23.7 14.2 32.1 15.1 31.9 13.3 37.3 23.9
Operatingcosts (% ofgross income)
57.5 68.7 53.4 70.4 34.4 69.3 58.0 73.8Europe
Return onequity 8.8 5.4 9.7 4.7 9.0 5.6 9.9 4.8
Non-int.income (% ofgross income)
26.2 25.3 34.2 24.4 35.7 22.6 74.5 38.1
Operatingcosts (% ofgross income)
55.1 65.7 55.5 64.5 55.2 64.5 63.6 74.1NorthAmerica
Return onequity 15.2 7.7 17.4 10.1 16.5 11.2 15.5 13.0
Non-int.income (% ofgross income)
13.6 3.5 11.2 7.0 9.8 7.3 41.3 24.9
Operatingcosts (% ofgross income)
68.2 75.8 66.8 72.2 63.1 71.3 55.8 64.7Japan
Return onequity 3.2 -9.8 3.6 -4.0 3.7 -0.3 -2.0 -4.3
Source: Fitch-IBCA data for commercial banks of G10 countries; banks are ranked by assets in USD billions. All variables areaveraged over the 1994-97 period; the distribution is truncated at the top and bottom 10%.
For banks in the bottom quartiles of the cost and profitability distributions, costs are above 65%of gross income and the return on equity is less than half that of the best performers; the resultsare qualitatively the same for European and Japanese banks. The heterogeneity of results amongbanks of roughly the same size is an indication that there is room for large efficiency gains. Forthe largest banks, with assets above USD 50 billion, there is less heterogeneity, at least in NorthAmerica (except for the share of non-interest income, which varies widely, perhaps due to thesimultaneous presence of traditional intermediaries and more innovative banks). This could bedue to the fact that the largest banks largely operate in wholesale markets where there is more
252
competition and less room for complacent behaviour. For European and Japanese banks, thedifferences between the top and bottom quartiles are similar to those recorded for the smallerbanks; again, heterogeneity indicates room for efficiency improvement.
Cost and profit efficiency
Most studies of cost efficiency find that retail banks operate on average at between 10 and 20%below the efficient cost frontier, ie their costs are higher by 10 to 20% than those of the bestinstitutions.182 This result holds across countries, suggesting that the gap between the best andthe average practice is fairly stable. Efficiency is almost always measured relative to a domesticbenchmark, as international comparisons are difficult (because the best banks of each countryoperate with different technologies that are not directly comparable). A study of 2000 Europeanbanks covering the period 1993-97 (ie after the implementation of the European Union’s SecondBanking Directive of 1988 and the adoption of the Single Market of 1992) shows that, onaverage, costs could be reduced by 16%;183 in the period examined, some countries – such asItaly, the Netherlands and the United Kingdom – achieved rapid cost efficiency improvements,while in other countries – such as France and Germany – banks have yet to start slimmingdown.
Estimates of profit efficiency are more dispersed, averaging around 50% (ie the average bankcould be twice as profitable); however, they are also more sensitive to the specification used tomeasure them and are thus less robust. On average, this dispersion suggests that profits are moredriven than costs by firm-specific factors such as management quality or unobservablecharacteristics of local demand.184 Therefore, there is a high potential for improving the overallperformance of an inefficient target by reducing costs or increasing revenues.
The studies that analyse the direct effect of M&As on banks’ efficiency have been performed onthe basis both of balance sheet ratios and of multivariate cost and profit functions. The evidenceon the effects of the deals on cost efficiency varies by country. For the United States there islittle evidence of any improvement in cost efficiency following a merger, although a few studiesthat use more recent data show that there are some gains.185 The evidence for European banks isbroadly consistent with these results: one study finds that domestic mergers among banks ofequal size improve cost efficiency, but this result does not hold for all countries; cross-borderacquisitions are associated with a reduction in the costs of the target, while no effect is found fordomestic M&As.186 The difficulties in improving cost efficiency are related to the obstaclesencountered, especially in continental Europe, to reducing banks’ labour forces. In fact,personnel reductions, one of the main sources of savings, are hardly an option in countries withrigid labour markets.
As for profit efficiency, research performed on US banks finds an improvement, due mainly toan increased diversification of risks.187 Larger banks have more diversified loan portfolios; thismay also be due to the recent lift of the ban on interstate transactions, which allowed banksfrom different states, each with geographically concentrated portfolios, to merge and thus
182 See for example Berger and Humphrey (1997) for the United States and Altunbas, Molyneux andThornton (1997) and Schure and Wagenvoort (1999) for Europe.
183 See Schure and Wagenvoort (1999).184 See Demsetz and Strahan (1997).185 See Berger (1998), Peristiani (1997) and Rhoades (1998).186 See Altunbas, Molyneux and Thornton (1997), Focarelli, Panetta and Salleo (1999) and Vander Vennet (1996).187 See Akhavein, Berger and Humphrey (1997), Berger, Hancock and Humphrey (1993), Berger, Humphrey and
Pulley (1996), Berger and Mester (1997) and Clark and Siems (1997).

253
diversify their holdings.188 The reduction in risk allows them to lend more per unit of equity,thus earning higher returns. In Europe, more efficient banks tend to acquire institutions in worseshape. Mergers have a positive impact on profitability, mainly driven by improvements inoperational efficiency; however, deals that consist of the purchase of the majority of the votingshares of the target do not appear to result in significant improvements.189 One study finds thatItalian banks merge in order to change their business focus towards providing financial servicesand thus increase their non-interest income, rather than to obtain efficiency gains;190 the increaseof profitability that is observed after M&As is related also to a more efficient use of capital.191
The direct evidence on how M&As affect banks’ performance is mixed. In general, better banksacquire banks in worse shape; there is then some improvement, especially on the revenue sideand for the deals of the last decade.192 However, the gains are probably not as large as thoseadvertised by practitioners; more time is needed to fully assess the effects of the more recenttransactions, including those involving very large institutions.
Scale and scope economiesPerhaps the most commonly quoted source of potential gains from M&As is the exploitation ofscale economies. Banks that significantly increase their size by merging with others may havethe opportunity to access cost saving technologies or to spread fixed costs over a larger base,thus reducing average costs and improving profitability. Notice however that many of the samegains could be achieved by outsourcing typical back office functions.
Most research on the existence of scale economies in retail commercial banking finds arelatively flat U-shaped average cost curve,193 with a minimum somewhere around USD 10billion of assets, depending on the sample, country and time period analysed.194 This suggeststhat efficiency gains from the exploitation of scale economies disappear once a certain size isreached and that there might be diseconomies of scale above a particular threshold, presumablydue to the complexity of managing large institutions.
This result is fairly robust and holds again across countries, but it relies mainly on data from the1980s and early 1990s; it might have to be revised due to recent technological changes thatimply large fixed costs and thus have the potential for scale economies even for larger banks.
Probably the second most quoted reason for M&As is the exploitation of synergies, oreconomies of scope: by merging with institutions specialised in different market segments, it isclaimed that banks can improve their production process and cross-sell their products to a largercustomer base. Measuring the existence and extent of economies of scope is especially difficult,
188 Berger and DeYoung (2000) find that some banking organisations are efficiently managed on a cross-regionalbasis.
189 See Vennet (1996).190 See Focarelli, Panetta and Salleo (1999).191 Haynes and Thompson (1999) find significant cost cutting and profitability gains from mergers.192 See eg Berger and Humphrey (1992), DeYoung (1997), Linder and Crane (1993), Peristiani (1997), Rhoades
(1993 and 1998) and Srinivasan (1992).193 For the United States, see eg Berger, Hanweck and Humphrey (1987), Berger and Mester (1997), Hughes and
Mester (1998), Hunter, Timme and Yang (1990) and Noulas, Ray and Miller (1990); for Europe see Altunbas andMolyneux (1996), Salleo (1999) and Schure and Wagenvoort (1999). For a fairly comprehensive review on scaleand scope economies, see Berger, Demsetz and Strahan (1999).
194 For Europe, scale economies are somewhat higher for savings banks, but for all categories of banks they aremuch lower than the cost reduction that can be obtained by improving the quality of management. See Schure andWagenvoort (1999).

254
given that, in theory, the benchmark should consist of single-product firms. The lack of suchfirms casts doubts on the reliability of results in this particular field.
The analysis of universal banking, conducted on European data, searches for complementaritiesbetween loans and investment-related services; there is no strong evidence either in favour oragainst the joint provision of different services, but this might be due to measurement problemsinvolving economies of scope.195 In fact, the true test might be about to come, when a fullyunified European market will see specialised and universal banks compete against each other.
Scale and scope economies are usually mentioned as the main drivers of M&As, but theavailable evidence, although indirect, seems to confirm that there are tangible benefits only forsmaller banks. However, changes in technology and market structure might soon render theseresults obsolete.
Shareholder valueThe last indicator of efficiency gains is the stock market performance of merging banks. Themain finding of the event studies looking at share prices around the time that a deal isannounced is that, on average, total shareholder value (ie the combined value of the bidder andthe target) is not affected by the announcement of the deal, since, on average, the bidder suffersa loss that offsets the gains of the target. Therefore, M&As imply a transfer of wealth from theshareholders of the bidder to those of the target.196
For US banks, one study finds the combined gains to be higher when there is significant overlapbetween institutions, consistent with a market power hypothesis, according to which highermarket share leads to higher profits. Another paper finds, consistent with a diversificationhypothesis according to which geographical diversification leads to a lower variability ofincome, that it is out-of-market transactions that create value for shareholders. 197 In both cases,the market value of the two banks combined should be higher than the sum of their values asseparate entities.
Higher market concentration created by consolidation is likely to lead to an increase in pricesfor retail financial services, leading in turn to an increase in profits. However, it is also true thatfirms operating in more concentrated markets are generally found to be less efficient: this mightoffset the gains from an increase in market power and thus leave unchanged the market value ofthe bank.
A merger could also result in a bank with a different risk profile. Changes can come from manysources: larger banks could develop more sophisticated financial strategies or have morediversified assets and liabilities. Most gains would come from geographical diversification orfrom combining banks with other financial institutions such as securities and insurancecompanies; all this would influence the market value of merging banks. In general, M&As donot seem to generate significant shareholder value; at the moment it is hard to identify patternsthat result in successful deals.
Conclusions
In conclusion, M&As do not significantly improve cost and profit efficiency and, on average, donot generate significant shareholder value. There is evidence in favour of exploiting scale
195 See Allen and Rai (1996) and Lang and Welzel (1998).196 See Hannan and Wolken (1989) and Houston and Ryngaert (1994 and 1997); Cornett and Tehranian (1992) found
positive overall returns from banking M&As. Cybo-Ottone and Murgia (2000) is the only event study of theEuropean market. For a survey of event studies, see Pilloff and Santomero (1998).
197 See Houston and Ryngaert (1994) for the market power hypothesis and Zhang (1995) for the diversificationhypothesis.

255
economies in retail banking up to a certain size (well below that of the most recent very largedeals). Economies of scope are harder to pin down; there is no clear-cut evidence of theirexistence.
Investment banks
M&As involving investment banks, as well as joint ventures and strategic alliances, areincreasingly common, especially between continental European commercial banks and Britishand American investment banks. Firms are using M&As to establish a global presence. Cross-industry M&As involving investment banks and securities dealers have been plentiful, becausewithin the financial services industry the latter is perceived to be a growth business.
There is little analytical evidence to draw on in analysing the impact on efficiency resultingfrom the consolidation process as it relates to investment banks. There are some results from thesecurities portion of the industry, but there is little evidence looking at this industry segment asa whole. Some evidence is also available from case studies that have been carried out on highM&As.198
As a cautionary note, these results are based on US financial data from the 1980s. This is due tothe lack of research on investment banks in other countries and to the fact that, where universalbanking is allowed, investment banks are often divisions of commercial banks with no readilyaccessible separate balance sheets.
Cost and profit efficiencyUnfortunately, there are no studies that look rigorously at the question of the cost and profitperformance of investment banks before and after mergers. A survey of case studies of recentconsolidation transactions involving investment banks suggests that globalisation is the mainforce underlying consolidation. Customer demand is driving the process as businesses arelooking for comprehensive services and solutions from their financial institutions as theyexpand across borders. In this environment, efforts to sustain profitability are leading to theglobalisation of the market segment. Quotes from merging entities suggest that mergers createbusiness synergies in areas of product offerings, product development, distribution and service.Earnings growth is often cited as an important reason for mergers, as is the need for globalindustry knowledge and global distribution, which demands global products, services andintelligence.
In case studies, the sentiment is often expressed that in this industry “size matters”, as it isbelieved to be closely related to prestige. Large organisations with a recognisable brand nameappear to be trusted and to enjoy levels of demand for their services that generate profits even inthe presence of inefficient cost structures. In addition, some commentators have pointed to theincreasing size of deals in recent years and suggested that investment banks need to be large inorder to win business and participate in various large loan syndications and equity and debtunderwriting.
Scale and scope economies
Analytical research is available only for the securities industry. The results indicate thateconomies of scale do exist among smaller securities firms, but are exhausted when the firmreaches between USD 14 and 36 million in total revenue and at about USD 40 million in assetsand USD 4 million in equity.199 Larger firms demonstrate scale diseconomies. It appears,
198 See Pearson (1998).199 See Goldberg, Hanweck, Keenan and Young (1991).

256
therefore, that only very small firms can expand their product mix and level of output, in theaggregate, and lower costs.
Similarly, on the question of economies of scope, research suggests that smaller speciality firmsexhibit economies of scope while large multi-product firms exhibit diseconomies of scope. Theoverall conclusion, however, is that economies of scope do not appear to be important in thesecurities industry. Neither diversified nor speciality firms of minimum optimal scale operate ata cost disadvantage.
The results outlined above might be outdated in the foreseeable future, given the tremendousamount of change that has occurred in this sector in recent years. As a consequence, the efficientscale values found in past research, particularly for securities firms, are likely to change.However, the pattern of economies of scale to a relatively small size threshold appears to hold,as in the case of commercial banks.
Asset management companies
The wave of consolidation in the asset management industry has been widely driven by round-the-clock trading, the internet, globalisation and other technology-driven advances.200
Consolidation is also resulting from consumers’ desire for the convenience of one-stopshopping. Japan and Europe are expected to be growth areas in the future because they havelagged behind the US institutional asset management industry.
Surveys indicate that many mutual fund investors do not know mutual funds charges, which arethe price paid for asset management services. Investors’ ignorance of fees is most likelyattributed to double digit returns seen during good economic times. However, the issue ofmutual funds’ income and expenses will probably become more important during unfavourableconditions in capital markets. As a consequence, the mutual fund industry is likely to undergosome restructuring in the future as individual fund companies start to compete not only inperformance but also in cutting fund charges.
At first glance, there is no strong correlation between fees charged by mutual funds and theirsize, measured by assets under management (see Chart V.1). In the United States, fees aregenerally low and slightly declining with the increase in the size of the funds, suggesting mildeconomies of scale passed on to customers (this, of course, assumes that the industry is highlycompetitive, ie that mutual funds do not exert much market power). In Europe patterns are notas smooth: equity funds are generally more expensive than money market, bond and balancedfunds, as in the United States. Although in many countries the largest funds charge less than thesmallest ones, the trend in the relationship between assets under management and fees is not asclear as in the United States; in fact, it is often funds of intermediate size that seem to offer thebest conditions to customers.
200 See Barbash (1998).
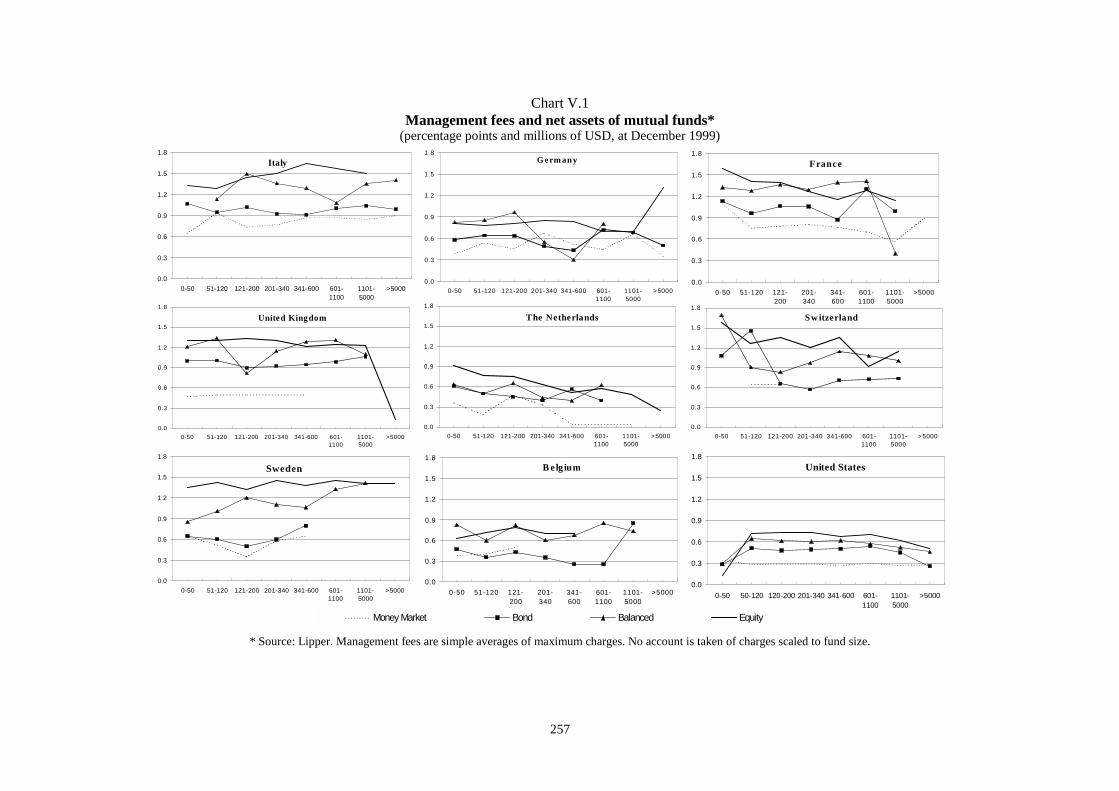
257
Chart V.1Management fees and net assets of mutual funds*
(percentage points and millions of USD, at December 1999)
* Source: Lipper. Management fees are simple averages of maximum charges. No account is taken of charges scaled to fund size.
Money Market Bond Balanced Equity
0.0
0.3
0.6
0.9
1.2
1.5
1.8
0-50 51-120 121-200
201-340
341-600
601-1100
1101-5000
>5000
France
0.0
0.3
0.6
0.9
1.2
1.5
1.8
0-50 51-120 121-200 201-340 341-600 601-1100
1101-5000
>5000
S w itzerland
0.0
0.3
0.6
0.9
1.2
1.5
1.8
0-50 51-120 121-200 201-340 341-600 601-1100
1101-5000
>5000
Sweden
0.0
0.3
0.6
0.9
1.2
1.5
1.8
0-50 51-120 121-200
201-340
341-600
601-1100
1101-5000
>5000
B elg ium
0.0
0.3
0.6
0.9
1.2
1.5
1.8
0-50 50-120 120-200 201-340 341-600 601-1100
1101-5000
>5000
United States
0.0
0.3
0.6
0.9
1.2
1.5
1.8
0-50 51-120 121-200 201-340 341-600 601-1100
1101-5000
>5000
United Kingdom
0.0
0.3
0.6
0.9
1.2
1.5
1.8
0-50 51-120 121-200 201-340 341-600 601-1100
1101-5000
>5000
The Netherlands
0.0
0.3
0.6
0.9
1.2
1.5
1.8
0-50 51-120 121-200 201-340 341-600 601-1100
1101-5000
>5000
Germ any
0.0
0.3
0.6
0.9
1.2
1.5
1.8
0-50 51-120 121-200 201-340 341-600 601-1100
1101-5000
>5000
Italy

258
Economies of scale and scope
The expansion of shareholder services in the 1980s and 1990s, along with growth in newindustries and foreign markets, placed upward pressure on the funds’ expense ratios, because ofthe increased complexity in investing and managing risk. However, in spite of thesedevelopments, operating expenses have decreased, with larger reductions generated by fundswith more assets under management (and thus with a higher probability of offering new servicesat an additional cost).
When the scale of activity of a mutual fund expands, a less than proportional increase in costsmay be recorded both in the area of portfolio management (information technology and securityturnover) and in that of shareholder servicing (record keeping and distribution). However, thiscan happen only if asset growth is not accompanied by a huge increase either in the variety ofsecurities in the portfolio or in the number of accounts.201
For a sample of US mutual funds, economies of scale at the management group level aresignificant, especially for smaller groups. However, if a fund’s size is measured by the numberof accounts, then scale economies are far smaller holding assets per account constant.202 Ingeneral, there are scale economies in administering mutual funds in all size categories and theaverage cost curve of a typical mutual fund is downward sloping over the entire range of fundassets.203 For the United States, the relationship between fund assets and operating expenses,related to the management and administration of funds, declines steadily as assets grow andreaches a low of 70 basis points for the group of funds with over USD 5 billion in assets.204 Ingeneral, large equity funds display significantly lower operating expense ratios than smallfunds; the reductions in fund expenses from efficiency and productivity gains are passed on byservice providers as they expand the scale of their operations. These results are partiallyconsistent with those found for a sample of French open-end mutual funds, for which significantscale economies are detected only for small funds, while larger institutions tend to exhibitdiseconomies of scale.205
There is also some limited econometric evidence on the presence of economies of scope inmutual funds. These results are qualitatively the same as those presented above for scaleeconomies, with one difference noted in the study of French open-end mutual funds. In thatcase, economies of scope were found to be significant for both small and large firms.206
The evidence in favour of the existence of scope economies squares with the latestdevelopments in the industry. Asset management services are often distributed jointly with othertypes of financial products, in order to reap the benefits from cross-selling: in Europe mutualfunds are sold by bank branches, while in the United States fund distribution is concentrated inbroker-dealers and discount brokers.207 Also, life insurance companies tend to have acompetitive advantage as well as other more specialised firms that have established cost-effective channels of distribution by using electronic means. In order to gain access todistribution, fund management expertise and a greater international presence, a number of cross-border M&As involving asset management firms have occurred in recent years (eg Mercury
201 See Baumol (1995).202 See Baumol, Goldfeld, Gordon and Koehn (1990).203 See Latzko (1999).204 See Rea et al (1999).205 See Bonanni, Dermine and Röller (1998) and Dermine and Röller (1992).206 See Bonanni, Dermine and Röller (1998).207 See Walter (1999).

259
Asset Management of the United Kingdom was purchased by Merrill Lynch in 1997). As analternative to M&As, many mutual fund firms have opted for strategic alliances with banks,securities broker-dealers and insurance companies.
To summarise, there is little analytical work available that directly addresses the issue ofefficiency gains from consolidation in investment banking and asset management companies.Some results from the securities portion of the investment banking industry suggest the presenceof economies of scale, but only for smaller securities firms, while there is limited evidence forthe existence of scope economies. With regard to asset management firms, the scarce evidenceavailable suggests that larger mutual funds tend to be more efficient than smaller ones; however,economies of scale and scope are probably significant only up to a certain size threshold.
Insurance companies
The insurance industry remains heavily regulated, both in its life and non-life segments; thiscould be a restraining factor for the consolidation process, decreasing the possibility of reapingeconomies of scale and diversification by discouraging consolidation, in particular cross-borderdeals. Differences in social security systems could also contribute to the internationalsegmentation of the life insurance industry, if firms differentiate themselves in such keyvariables as the age of retirement or the model of funding (defined benefits or definedcontributions). Furthermore, despite a trend towards deregulation, “cross-border trade ininsurance services is limited by differences in culture, consumer protection laws, taxation, andthe need to establish a local presence to process claims and handle administration.”208 However,at least within domestic markets, there is a potential for economies of scale and scope, inparticular with other financial products, such as those offered by banks. These benefits may beobtained through joint ventures or through the combination of banks and insurance companies, agrowing trend especially in Europe. Finally, the proposition that there could be efficiency gainsby letting the best firms take charge of the others is even more true in a sector protected, at leastto an extent, from outside competition. The following sections discuss the available evidence onthe insurance industry, distinguishing between the two main lines of business – life andcasualty/property.
Aggregate dataThe insurance industry seems to exhibit economies of scale, at least judging from a cursoryexamination of firms’ balance sheet ratios. In the North American life insurance segment,management expenses as a fraction of net premiums written decrease from 16% for the smallerfirms to 11% for the larger ones; in Europe the ratio decreases from 9 to 4% (see Table V.3).209
As for the non-life segment of the industry, the ratio decreases from 18 to 16% in NorthAmerica and from 17 to 8% in Europe. In terms of profitability, the same pattern emerges:larger firms are more profitable than smaller ones. In North America, the return on equityincreases from 3 to 13% for the life segment and from 7 to 10% for non-life firms; in Europe, itincreases from 1 to 12% for life insurance companies and from 7 to 11% for the non-life firms.
208 See OECD (1998).209 The difference in cost levels between North America and Europe might depend on different definitions of the
variables. Because of the low number of Japanese firms in the available sample, they are not included in theanalysis.
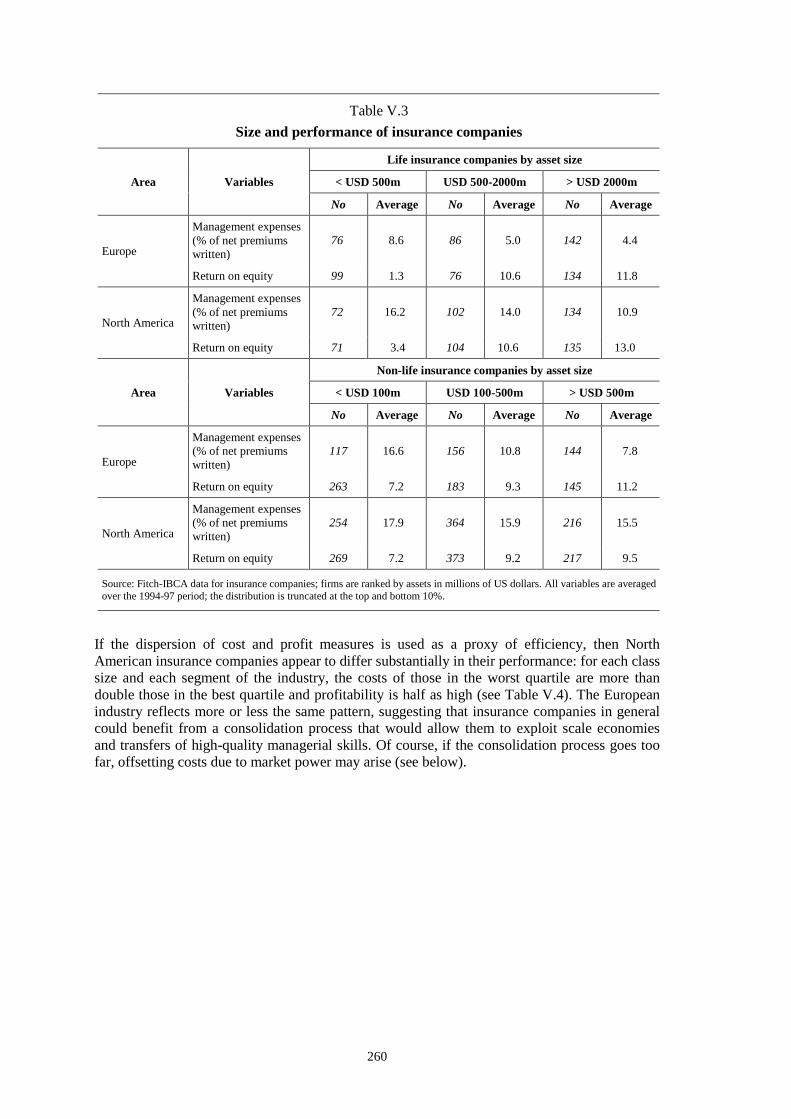
260
Table V.3Size and performance of insurance companies
Life insurance companies by asset size
< USD 500m USD 500-2000m > USD 2000mArea Variables
No Average No Average No Average
Management expenses(% of net premiumswritten)
76 8.6 86 5.0 142 4.4Europe
Return on equity 99 1.3 76 10.6 134 11.8
Management expenses(% of net premiumswritten)
72 16.2 102 14.0 134 10.9North America
Return on equity 71 3.4 104 10.6 135 13.0
Non-life insurance companies by asset size
< USD 100m USD 100-500m > USD 500mArea Variables
No Average No Average No Average
Management expenses(% of net premiumswritten)
117 16.6 156 10.8 144 7.8Europe
Return on equity 263 7.2 183 9.3 145 11.2
Management expenses(% of net premiumswritten)
254 17.9 364 15.9 216 15.5North America
Return on equity 269 7.2 373 9.2 217 9.5
Source: Fitch-IBCA data for insurance companies; firms are ranked by assets in millions of US dollars. All variables are averagedover the 1994-97 period; the distribution is truncated at the top and bottom 10%.
If the dispersion of cost and profit measures is used as a proxy of efficiency, then NorthAmerican insurance companies appear to differ substantially in their performance: for each classsize and each segment of the industry, the costs of those in the worst quartile are more thandouble those in the best quartile and profitability is half as high (see Table V.4). The Europeanindustry reflects more or less the same pattern, suggesting that insurance companies in generalcould benefit from a consolidation process that would allow them to exploit scale economiesand transfers of high-quality managerial skills. Of course, if the consolidation process goes toofar, offsetting costs due to market power may arise (see below).

261
Table V.4Dispersion of performance measures of insurance companies
Life insurance companies by asset size
< USD 500m USD 500-2000m > USD 2000mArea Variables1st
quarter4th
quarter1st
quarter4th
quarter1st
quarter4th
quarter
Management expenses(% of net premiumswritten)
3.4 12.9 2.5 6.7 3.0 5.6Europe
Return on equity 6.7 0.0 13.9 6.2 16.2 6.7
Management expenses(% of net premiumswritten)
10.8 20.6 8.9 17.8 6.5 15.2North America
Return on equity 10.6 0.0 14.7 6.6 17.3 9.1
Non-life insurance companies by asset size
< USD 100m USD 100-500m > USD 500mArea Variables1st
quarter4th
quarter1st
quarter4th
quarter1st
quarter4th
quarter
Management expenses(% of net premiumswritten)
10.0 23.2 4.4 16.1 1.8 12.7Europe
Return on equity 13.3 0.0 13.2 5.2 14.8 8.2
Management expenses(% of net premiumswritten)
13.3 22.2 12.7 18.2 12.5 18.5North America
Return on equity 10.1 4.4 12.9 5.5 12.5 6.1
Source: Fitch-IBCA data for insurance companies; firms are ranked by assets in millions of US dollars. All variables are averagedover the 1994-97 period; the distribution is truncated at the top and bottom 10%.
Cost and profit efficiencyA study performed on the insurance industry in the OECD countries finds that the increase inproductivity observed for insurance companies in all countries is due to technical progress.210
However, efficiency scores vary widely by country, the US firms being, on average, the mostefficient. Efficiency seems positively correlated with the reinsurance rate and negativelycorrelated with the share of life insurance; this can be explained by the national characteristicsof the life insurance market, which deters foreign entry and thus decreases competition,allowing domestic firms to grow complacent.
US non-life insurance companies operate at an efficiency level that varies from 80% of the bestpractice assessed for the medium-sized companies to 90% for the large ones, suggesting thatcompetition keeps them from becoming too inefficient and that improvements from M&As arelikely only for the firms in worst conditions.211 The average inefficiency level in the life
210 See Donni and Fecher (1997).211 See Cummins and Weiss (1993) and Gardner and Grace (1993).
262
segment of the insurance industry is higher, between 35 and 50%.212 Given that M&As improvethe efficiency of targets,213 the foreseeable consolidation process will be beneficial to theindustry by, for example, rationalising the agency distribution system.
The evidence for other countries points towards a larger gap between the best practice firms andthe rest of the industry: the average efficiency level is around 50% for France and Belgium,214
around 50% and growing in Germany215 and a little higher in the British life insuranceindustry.216 Given that efficiency seems to be higher in countries where the regulatory burden islower, deregulation could help close the efficiency gap by introducing more competition.
The insurance industry is still very fragmented because of regulation and the specificity of someof its products (for example, claims settlements). The dispersion of efficiency levels that resultsfrom these barriers to entry could probably be reduced if the better managed firms took over theweaker ones,217 but the lack of evidence for the past and the rapid changes foreseeable in thefuture make it hard to assess the potential efficiency gains from M&As.
Economies of scale and scopeScale economies in the US insurance industry have been studied extensively. Forproperty/casualty insurance companies, there is evidence of scale economies for the small andintermediate size firms; this suggests that consolidation among them may reduce averagecosts.218 On the other hand, larger firms seem to exhibit diseconomies of scale, while there is noevidence of scope economies at any size level.219 As for the life insurance industry, scaleeconomies are found up to USD 15 billion of assets, but it is unclear whether the result holds forlarger firms.220
The evidence for European markets is more mixed, but in general it is in favour of the existenceof scale and scope economies.221 However, most studies refer to data of the early 1990s; thesweeping changes in regulation and technology that took place in recent years might havedeeply affected the cost and revenue structure of the industry. Past results, therefore, should beconsidered with caution. For Japanese insurance companies there seems to be a consensus onthe existence of scale economies, at least for the life industry.222
As in other financial industries, scope economies are more elusive; the coexistence ofspecialised life and non-life insurance companies within insurance conglomerates probably
212 See Yuengert (1993).213 See Cummins, Tennyson and Weiss (1999).214 See Delhausse, Fecher, Perelman and Pestieau (1995).215 See Mahlberg and Url (2000).216 See Rees and Kessner (1999).217 As long as concentration is not so high that firms become complacent or enjoy substantial market power.218 See Cummins and Weiss (1993).219 See Hanweck and Hogan (1996).220 See Yuengert (1993) and Cummins and Zi (1998); Grace and Timme (1992) find evidence of scale economies
throughout their sample, but they do not control for differences in the output of small and large companies.221 See Focarelli (1992) and Prosperetti (1991) for Italy; Focarelli (1992) also finds evidence of scope economies for
the life and non-life segments. Fecher, Perelman and Pestieau (1991) find significant scale economies for theFrench industry, both life and non-life; Mahlberg and Url (2000) find significant scale economies for the Germanmarket; and Kaye (1991) finds them for the British life insurance companies.
222 See Fukuyama (1997).

263
means that there is no single winning strategy (diversifying versus specialising). Diversificationmay be more suited to some firms and countries, while specialisation may be better for others.223
Just as for banks, the smaller insurance companies could probably reduce their costs by takingadvantage of the potential economies of scale, however the benefits are likely to disappear aftera threshold that is well below the size of the largest firms. The existence of economies of scopewith other financial institutions is debated.
Cross-industry and cross-border consolidationResearch on the efficiency effects of M&As across financial industries and across nationalboundaries is scarce, largely because there have been relatively few such acquisitions to date.The primary difference between within- and across-industry M&As is the greater possibility ofscope economies in mergers across industry lines – for example, through sharing physicalinputs, information systems, or databases, or through consumption complementarities. There isalso greater room for scope diseconomies – for example, from senior management straying farfrom its area of core competence.
There is very little research on the revenue scope efficiency effects of universal typeconsolidation. Some inference may be taken from the research on firms producing a singlecategory of financial services. Such research shows that the evidence is ambiguous.224
There are factors that may make the efficiency consequences of international consolidationdifferent to those for domestic M&As. First, there may be some barriers that inhibit foreignfinancial institutions from operating efficiently and competing against domestic institutions.These barriers may include differences in language, culture and regulatory or supervisorystructures, and explicit or implicit rules against foreign competitors. In some cases, theorganisational diseconomies of operating or monitoring from a distance may be exacerbated byhaving to manage institutions many time zones away.
Second, the market conditions and policies of the home nation may affect cross-borderefficiency. In particular, the home market conditions (eg the degree of competition, the marketfor corporate control, or securities market development) and home market policies (eg bankingpowers, prudential regulation and supervision, and safety net guarantees) may affect theefficiency of national institutions abroad.
Studies of cross-border efficiency have usually found that domestic banks are significantly moreefficient than foreign-owned banks.225 In particular, one study found that institutionsheadquartered in the United States tended to be more efficient than other institutions both athome and in other nations.226
SummaryThere seems to be a general consensus that consolidation in the financial industry is beneficialup to a certain (relatively small) size in order to reap economies of scale. Although the evidence
223 See Berger, Cummins and Weiss (1999) and Berger, Cummins, Wiess and Zi (2000).224 Berger, Humphrey and Pulley (1996) found little or no revenue scope economies between bank deposits and
loans. Berger, Cummins, Weiss and Zi (2000) found revenue scope diseconomies on average from providing lifeinsurance and property-liability insurance together. Berger, Hancock and Humphrey (1993) and Berger,Cummins, Weiss and Zi (2000) found that joint production is more efficient for some types of firms andspecialisation is more efficient for others.
225 See eg DeYoung and Nolle (1996) and Mahajan, Rangan and Zardkoohi (1996).226 See Berger, DeYoung, Genay and Udell (2000).

264
is more mixed, there is also little in the way of gains from economies of scope or ofimprovements in managerial efficiency due to the transfer of skills from the bidder to the target.
There is no clear evidence that M&As result in cost reduction. The most recent studies suggestthat consolidation may enhance revenues, although results vary with the countries and dealsanalysed; moreover, the gains appear limited in magnitude. Stock markets also seem sceptical ofM&As: on average, at the announcement of a transaction, the combined value of the firmsinvolved does not vary much, as it should if significant benefits were expected.
Ex post results of M&As seem to contradict the motivations given by practitioners forconsolidation, which are largely related to issues of economies of scale and scope and toimprovements in management quality. However to a certain extent this might be a puzzle inappearance only. The following explanations have been put forward: (i) practitioners considercost reductions or revenue increases per se to be a success, without also taking into accountindustry trends as a benchmark; (ii) there might be a “denominator effect”: a 20% reduction inoperating costs seems larger than an equivalent 0.4% reduction as a fraction of total assets;(iii) the fact that that there are no improvements, on average, means that some institutions dobetter and some do worse; given the inside knowledge of their firm and the arm’s lengthknowledge of competitors, managers might be justified in believing that their institution mightbe among the ones that would benefit from a merger or acquisition; and (iv) deals done in thepast might have suffered from stricter regulation (eg labour laws) that prevented firms involvedin M&As from reaping all of the benefits of the deal.
How innovation will affect the financial industry
The lack of clear-cut results on the efficiency of merged institutions could be traced back to themotivations for M&As. If they are not entirely driven by profit-maximising strategies (seeChapter II), M&As might well turn out to produce mixed results, in accordance with the factthat they were not all meant to increase profits in the first place. Other factors that potentiallyaffect all participants might blur the picture, if their effect is large enough to overshadow thedirect effect of M&As.
The opportunities presented by advances in payments technology, the development of internetbanking and financial-engineering products should benefit all institutions (to the extent that theycan be outsourced), but they are generally more easily exploited by large institutions that areable to invest up-front, postponing returns for longer. These firms also have more complex assetand liability structures that can benefit from sophisticated risk management strategies.
The development of outsourcing might have significant external effects on the financialindustry. If the functions involved are those that exhibit clear economies of scale (eg processingcredit card transactions), there might be a small number of firms performing them and offeringlower rates to all financial institutions; this might, in turn, lower the threshold above which thesmaller firms become viable, by decreasing their costs. The need for a larger size may becounterbalanced for some products by network economies, such as joining a nationwide ATMsystem, that can be obtained even by small banks.
Sales of mutual funds will be influenced even more heavily by branding, advertising anddistribution channels. These developments will probably lead to internal, external and inter-sectoral competition in the asset management industry, promoting market efficiency and lowerfees for consumers. The simultaneous presence of many, diverse institutions should benefitconsumers and improve the dynamic efficiency of the financial industry by fosteringcompetition and innovation.
A general warning with regard to these conclusions should be made, due to the importance ofinnovation itself in shaping firms and markets. On the one hand, innovation may reduce the costof accessing the new technology, and therefore decrease the need for larger size in order tomake its adoption profitable, so that even small intermediaries could handle tasks that today areout of their reach. On the other hand, there might be cases in which new systems are profitable

265
only if applied on a large scale, for example in the field of risk management. In the latter case,the differences between large and small institutions might increase; policymakers and regulatorsshould carefully differentiate their action on the basis of products and markets rather than bycategories of institutions.
3. Consolidation and competitionConsolidation affects competition because it increases market concentration, with the finaleffect dependent both on the likelihood of market entry and on firm behaviour. Market entrymay be limited, for example, by regulation, and oligopolistic behaviour may intensify whenconcentration becomes higher, possibly leading to non-competitive levels of prices (or interestrates) and volumes. In this section these theoretical issues are discussed. Then, existingempirical research is examined in order to assess the practical relevance of the varioustheoretical propositions. Since empirical analysis is inevitably based on the past and thefinancial landscape is changing quickly, the relevance of foreseeable future trends is assessed.Finally, actual antitrust policy is reviewed and some relevant case studies are presented.
Theory
The theoretical analysis starts with two subsections that review the ways in which consolidationmay affect competition. First, the potential of market entry is discussed in order to assess theeffect of consolidation on concentration. Second, firm behaviour is discussed because it maydetermine how concentration affects competition. These subsections are followed by a shortdiscussion of the trade-off between competition, efficiency and financial stability. The finalsubsection discusses the issue of market definition, which is relevant for antitrust purposes.
Market entryAssuming a well-defined market, the standard literature on industrial organisation implies thatthe ease of market entry determines the link between competition and market concentration. In acontestable market, due to the threat of profitable entry, active firms are not able to exploitmarket power. 227 However, contestable markets are an extreme theoretical benchmark: in fact,the conditions that are required for a market to be fully contestable do not hold in the real world.In such a market environment, concentration would increase as a result of consolidation, butthere would be no effect on competition.
In the case of the financial industry, contestability fails to hold as a result of three conceptuallydifferent types of entry barriers: (i) those that are directly caused by regulation, (ii) thoseinherent in firms’ cost structures, and (iii) those that result from (relatively) inelastic customerdemand. Regulatory barriers include specific subsidies or public guarantees. For example,commercial bank deposits are generally insured by the government and may lower banks’capital costs. This gives commercial banks a relative advantage in products markets where non-commercial banks such as investment banks and insurance companies also compete. Anotherexample would be national or state differences in legal frameworks and in their applications,such as differences in the jurisdictional status of contracts in different countries; this isparticularly relevant for the insurance industry. Finally, imposition of host country regulationson foreign competitors can create barriers to entry. For example, foreign institutions may berequired to establish a physical presence in a particular country before authorisation forservicing customers is given.
227 Baumol et al (1982) introduced the concept of market contestability as an extreme example of the concept ofpotential competition introduced by Bain (1956).

266
Entry barriers due to differences in firms’ costs arise where entry requires significant sunk coststhat have to be earned back. This can reduce competitive pressures, at least in the short run.Economies of scale or scope or the necessity to set up a network of branches may create barriersto entry for firms that do not have the necessary size to be economically viable. In addition,unequal access to production technology, production factors, or infrastructure can confer marketpower on favoured firms. Such situations may be difficult to detect because they may involvenon-financial industries. For example, a financial institution might be affiliated vertically with atelecom enterprise, until lately usually a monopoly, that in turn restricts its services to thisinstitution.
The third cause of the lack of contestability is a relatively inelastic customer demand, a causethat may be most significant for retail markets. For example, when customers find it convenientto buy all their financial services at a single financial service provider, they may become lockedin and as a result less inclined to switch to other providers in response to favourable price offersby competitors. Cross-sector consolidation may foster the bundling of products, thus increasingswitching costs and the rigidity of demand for financial products. In the case of banking, forexample, the lack of a legal requirement that account numbers as well as the associatedtransaction data in an electronic bank account be transferable to another bank may increasebarriers to entry by making it more cumbersome for customers to switch banks. Another sourceof rigidity of demand is the complexity of products, which may increase the difficulty ofcomparing the services of different providers.
Market behaviour
The effect of concentration on competition depends, among other variables, on whether firmscompete on quantities or prices. In the first case, it is straightforward to show that the marketoutcome is closer to the monopoly result the smaller the number of firms. In the second case,the effect depends on the heterogeneity of products; the more heterogeneous the products are,the greater is the market power of firms. Firms tend to adopt niche strategies, in order todifferentiate products beyond their essential characteristics. This may ultimately lead to masscustomisation, whereby technology improvements allow firms to tailor their standardisedproducts to the specific needs of individual customers.
There might be instances in which the financial industry presents the characteristics of a naturalmonopoly, with the regulatory consequences emphasised by the traditional industrialorganisation literature. For example, with respect to payment services of banks, there may benetwork effects, possibly implying natural monopoly or oligopoly (see the following chapter),with the potential to set prices at non-competitive levels.228 Concentration of payment servicesin a non-contestable market environment increases the probability of market power abuse.
Linked oligopoly theory hypothesises that firms that compete simultaneously in many marketsmay recognise their interdependence and determine that aggressive behaviour in one marketmay lead to retaliation in the others; as a consequence firms may reduce competition in theaffected markets. Multi-market contacts may lead to higher prices and lower quantities than thecompetitive outcome.229 By increasing contact points among firms, cross-border and cross-sector consolidation in the financial services sector may reduce competition.
The theories on relationship lending emphasise the crucial role of financial institutions infinancing customers that do not have direct access to capital markets. Such theories focus on thescreening and monitoring function of financial institutions and hypothesise adverse effects ofcompetition on users of financial services. These arise, among other reasons, because of the
228 See McAndrews (1995).229 Linked oligopoly theory was introduced by Edwards (1955) and was developed theoretically by Bernheim and
Whinston (1990) among others.

267
inability of financial firms to subsidise new firms at the expense of established borrowers.230 Itmay be the case that bank loans to small firms are better available in more concentrated marketsthan in competitive markets. However, as will be discussed extensively in the section onConsolidation and the availability of credit flows, consolidation may be detrimental to smallbusiness lending.
Does consolidation create a trade-off between efficiency and financial stability?
In general, in a competitive environment only the most efficient and innovative firms survive,thus ensuring that the industry remains healthy and that firms pass on the benefits ofcompetition and innovation to their customers. However, for the financial sector there might beinstances in which competition may have a negative impact on stability, as the least efficientfirms may have an incentive to increase their risk in order to reach the industry profitabilitylevel (the so-called incentive to “gamble for resurrection”). If these firms are large, financialstability may be threatened (see Chapter III).
The role of consolidation in altering the balance between competition and stability isambiguous; M&As among large banks create institutions whose failure is potentially morethreatening to the stability of the industry. However, if the new entities are managed moreefficiently or if they benefit from economies of scale or scope, there should be both benefits forthe consumers (to the extent that the improvements are passed on) and no particular negativeeffect on financial stability.
Prudential supervision and regulation, in particular liquidation procedures and coordinationamong supervisors of different industries and from different countries, should ensure that thestability of the financial industry is not threatened by the external effects of competition.
Market definition
The preceding discussion assumed that the relevant market was already defined, but empiricalwork must start with a workable market definition. This subsection investigates the theorybehind the definition of markets for purposes of antitrust regulation.
One may define a relevant product market as a market that comprises all products and servicesthat are viewed by consumers as similar or equivalent because of their properties, price andpurpose. The relevant geographic market is the territory including the firms that imposecompetitive constraints on each other. For example, one definition of a market used in antitrustanalyses is “a product or group of products and a geographic area in which it is produced or soldsuch that a hypothetical profit-maximising [monopoly] firm, not subject to price regulation …likely would impose at least a ‘small but significant and non-transitory’ increase in price.”231 Asecond, closely related definition that emphasises market structure more than conduct, is: “Therelevant geographic market comprises the area in which the undertakings concerned areinvolved in the supply and demand of products and services, in which the conditions ofcompetition are sufficiently homogeneous and which can be distinguished from neighbouringareas because the conditions of competition are appreciably different in those areas.”232 In somecountries, the relevant geographic markets are identified by the antitrust authorities withadministrative areas (eg regions or provinces; see Annex V.1).
In defining product markets, the substitutability of different products may vary across buyers ofthat product. For example, commercial bank transactions accounts and investment bank money
230 For an overview, see Boot (2000).231 See US Department of Justice and Federal Trade Commission (1992), p 7.232 “European Commission Notice on the definition of the relevant market for the purpose of Community
Competition Law”, Official Journal of the European Communities, Series C, no 372, 9 September 1997.

268
management accounts have many similar features that may make them part of the same marketfor some consumers. On the other hand, bank accounts may be insured by government, whileinvestment bank accounts typically are not insured. This may place these products in separatemarkets in the view of more risk-averse customers. Product market definitions also depend onthe extent to which different goods are complements that are purchased together. In addition,convenience considerations may lead consumers to bundle their purchases of different goods orservices. The extent of such clustering, and the resulting scope of the relevant product market, isan empirical question.
The geographic market indicates the extent to which consumers will travel to complete atransaction. This depends on the size of travel costs and other transaction costs relative to theutility gained from purchasing the product. As a generalisation, low-value goods that arepurchased frequently tend to have smaller geographic markets than expensive goods that arepurchased only rarely. Thus, wholesale markets will generally cover larger geographic areasthan retail markets, and non-fiduciary financial services (such as mortgages) generally will havelarger geographic markets than fiduciary services (such as deposits).
Empirical evidence
This section analyses the existing studies that have examined the extent to which theconsolidation of financial markets has affected competition. The first empirical issue addressedis the empirical definition of the relevant markets. Subsequently, the main findings of theempirical studies on the effect of consolidation on competition are discussed. It is important tobe aware that this literature uses data that do not represent the most recent technologicaldevelopments.
Market definition
A recent examination of the suppliers of financial services shows that individual US firms aresupplying more and more products over broader geographic areas.233 The fact that firms haveincreased both their product selection and their geographic reach does not necessarily imply,however, that markets have expanded. Firms often operate in many different markets. Also,some traditional financial business processes are now split into functions that can be offered inseparate markets. An example is lending, where origination, securitisation and interest rate orforeign exchange swaps split the lending process into separate components that may beconducted by different firms. In addition, on the demand side, some claim that consumers offinancial products want bundled products to a lesser extent than they once did.
In research and policy analysis, markets are defined in terms of products and geographical areas.In the first respect, surveys of household and small-business bank customers show evidence ofclustering around the principal transactions account, but credit cards, mortgage and other loans,and other financial services are often purchased elsewhere.234
Insurance product markets tend to be defined more narrowly, as developing expertise in anyproduct line implies substantial costs, even for producers that are already active in otherbusiness segments.235 In the non-life sector, customers generally feel that insurance products fordifferent types of risks (health, property and casualty, travel etc) are not substitutable.Moreover, legal rules are often structured by type of risk, licensing for new types of risk is
233 See Berger, DeYoung, Genay and Udell (1999).234 According to Kwast, Starr-McCluer and Wolken (1997), households tend to cluster the following products with
their checking account: savings accounts, MMDAs, lines of credit and certificates of deposits. For smallbusinesses, the clustered products are savings accounts, lines of credit, mortgages and cash management services.
235 See Chidambaran, Pugel and Saunders (1997).

269
generally a slow process, and certain combinations of risk may be legally prohibited.236
Therefore, the products of non-insurance firms are usually not included in the market definitionof non-life insurance products.237
As an example of a stance taken by an antitrust authority, the European Commission in severalcases has had to decide whether credit insurance in the areas of domestic use and export ofcapital goods can be considered a substitute for banking services such as factoring and letters ofcredit. While acknowledging that certain banking products are increasingly entering the marketas competitors of credit insurance products, the Commission has concluded, on the basis ofproduct characteristics and prices, that credit insurance and factoring are still different productmarkets.238
With respect to life insurance, it has to be noted that products generally carry a large savingscomponent. Therefore, the relevant market may also include non-insurance companies (egpension funds) that offer long-term savings products.239 As insurance products compete little ornot at all with each other, the empirical literature tends to treat each of them as a separatemarket, even if they are offered jointly by the same companies.240
Turning to the geographic market definition, markets for some bank products appear to remainlocal, while others are national or international in scope. Among the latter are the markets forlarge commercial loans and credit card loans, secondary loan markets and other wholesalemarkets, while the local markets include household and small-business transactions accounts,small business lending and some types of consumer lending.
In empirical research, local markets are usually approximated by areas such as provinces, ruralcounties, cantons or metropolitan areas.241 For the United States, this assumption is supportedby survey evidence indicating that both consumers and small businesses overwhelminglyprocure banking services from suppliers located within a few miles of the customer. It is stillrare to bank with institutions that can be reached only via the telephone or internet. In fact, somerecent articles in the popular press suggest that firms that have attempted to stress internet-basedbanking are retrenching.242 Thus, on the demand side, markets for some bank products appear tobe local.243
Retail bank product markets are also local in Europe.244 Despite the development of electronicbanking and other advances, “there are still high ‘transport costs’ in retail banking and this
236 One of the major barriers to entry for firms that want to expand their insurance activities is the often limitedavailability of knowledge on loss statistics. This should be properly taken into account when defining relevantmarkets for competition purposes.
237 The factors that induce the fragmentation of the non-life insurance market are only partially mitigated by thesimilarities between the technologies used by banks and insurance companies (information processing, riskmanagement, etc) that imply the possibility of including a broader range of institutions in the market definition.
238 Case Comp/M. 1082 - Allianz/AGF, OJ C 246/4; 6.8. 1998; case Comp/M. 1101 - Hermes/Sampo, OJ C 212/6,8.7. 1998; case Comp/M. 1661 - Crédit Lyonnais/Allianz-Euler/JV, OJ C 285/6, 7.10. 1999.
239 See Table 4 in OECD (1998).240 For example, Cummins, Tennyson and Weiss (1999) split the industry into five product markets.241 See Egli and Rime (2000) for Switzerland; MacKay (1998) for Canada; Rhoades (1996) for the United States;
Sapienza (1998) for Italy; and the Wallas Committee (1997) for Australia.242 See Costanzo (2000), Day (2000), Julavits (2000a and 2000b), Snel (2000) and Toonkel (2000).243 See Kwast, McCluer and Wolken (1997).244 See Dermine (1999).

270
means that entry into foreign markets must be based largely on the opening (or acquisition) of abranch network.”245
Also, on the supply side there is evidence that some banking markets are local. The number ofbank branches in most countries continues to increase despite a consolidation process that hasreduced the number of independent banking organisations and legal changes that have largelyremoved legal constraints on bank geographic expansion. This indicates that firms continue tofeel the need for a local presence.246 Continental Europe has a greater density of branches thanEnglish speaking countries, an indication of local markets and that technology has not yet led toa reduction in the number of branches.247 While cross-border banking is growing, it is still at alow level.248
For wholesale banking products, the introduction of the euro has increased the geographic scopeof the European market since it has eliminated foreign exchange risk. Bond markets have tendedto be national in scope, but have expanded with the adoption of the euro; cross-bordercompetition should also increase for services like correspondent banking. The geographic scopeof the activities is national or international also in the case of financial markets, and in particularmoney market trading, foreign exchange trading, derivative trading and asset management.249
On the contrary, for other services in the corporate banking sector – especially those provided inconnection with exports – the Commission has found that the activity is predominantly national inscope, since it usually requires a close relationship between a bank and its customers in order tomeet the particular needs of the clients.250 Investment banking services, which usually require aknowledge of national corporate law and the company structure as well as of accounting principlesand the local market habits, are also considered to be national in scope.251 In general, whileacknowledging that many M&As are cross-border, the Commission has distinguished betweenthe activity, which may be international in scope, and the service provided, which is mainlynational in scope and may require that the principal advisor be physically established in thecountry where the target company is situated.
Geographic markets for most insurance and securities activities appear to be national in scope(or statewide for the United States). For example, for products like automobile insurance,consumers generally search only within the state or nation and the degree of regulation variessubstantially across states and countries.252 Nevertheless, some argue that barriers to enteringgeographic markets are low relative to the barriers to entering different product lines.253
245 See Gual (1999) and Vives (1999).246 Local geographic markets for banking are not universally accepted. Hannan and Strahan (2000) find that
geographic markets for certain banking products under a certain size limit may be broader than the typically localmarket. They find that, in most cases, markets that correspond to US states explain price variations better thanlocal markets.
247 See Barth, Nolle and Rice (1997) and European Central Bank (1999).248 See White (1998).249 See European Commission, case M. 597 - Swiss Bank Corporation/S.G. Warburg, OJ C 180, 14.7. 1995, and case
no IV/M 1043 - B.A.T./Zurich.250 Case No IV/M. 596 - Mitsubishi Bank/Bank of Tokyo.251 See case Comp/M. 319 - BHF/CCF/Charterhouse, paras 6 and 9.252 See Bajtelsmit and Bouzouita (1997).253 See Chidambaran, Pugel and Saunders (1997).

271
How consolidation affects prices
Banking
In general, competition in the banking industry has increased in the last few years due toderegulation and technological innovation.254 Consolidation might affect prices, especially inlocal markets that witness significant increases in concentration, but these might be unusualcases given the decisions of antitrust authorities that have blocked altogether mergers that wouldhave sharply reduced competition (eg Canada) or demanded compensatory measures such as thesale of branches in markets where the increase in market share resulting from the deal wouldhave been threatening to consumers (see Annex V.1). In fact, the pre-emptive action of antitrustauthorities limits the possibility that merging intermediaries could take advantage of theirincreased market share, thus reducing ex ante the incentives to merge in order to exert marketpower.
In the United States, for example, four bank mergers have been denied on competitive groundsin the last decade, and branch divestitures have been negotiated in more than 50 cases. In Italy,the Bank of Italy (the antitrust authority for the banking sector) demanded in 10 cases the sale orclosing of branches as a condition to allow mergers. In the case of the Bank Austria-Creditanstalt merger, undertakings were required by the European Commission beforeauthorising the deal. The Swiss Federal Competition Commission authorised the UBS mergerconditional on some limitations, among them the divestiture of 25 branches (see Annex V.2). InCanada in 1998, proposed mergers involving four banks accounting for 70% of bank assetswere rejected; one concern cited in the rejection was that the mergers would have led to asubstantial lessening of competition that would have caused higher prices and lower levels ofservice. In January 2000, the acquisition of Canada Trust by TD Bank was approved, but thedivestiture of 13 branches and the Canada Trust MasterCard portfolio were conditions of theapproval. In addition, in each country an unknown number of merger proposals have beenaborted due to competitive concerns raised by antitrust authorities.
The effects of consolidation on competition can be evaluated indirectly in cross-sectionalstudies comparing markets with different degrees of concentration at a point in time.Alternatively, they can be examined directly, by studying markets that have experiencedconsolidation. Studies using the former, indirect approach with European data generally findthat higher concentration leads to less favourable conditions for bank customers.255 The USevidence is consistent with that for Europe, indicating the existence of market power inconnection with prices for small business loans and retail deposits.256 Studies using data fromthe 1990s indicate that the connection between concentration and retail deposit rates hasdissipated somewhat relative to the previous decade.257 Examination of fees instead of interestrates shows that the degree of market power for retail deposits and payment services isrelatively low.258 Nonetheless, there is some empirical evidence which finds that competition
254 For example, Angelini and Cetorelli (1999) show that the Italian banking system has become highly competitivein the 1990s. For similar studies see also De Bandt and Davis (1999) and Shaffer (1994).
255 De Bonis and Ferrando (1997) find a positive relationship between concentration and interest rates on loans inItaly. A similar result is obtained by Egli and Rime (2000) for Switzerland. Swank (1995) finds inverserelationships between concentration and price-competitiveness in Dutch markets for savings deposits andmortgages.
256 See Berger and Hannan (1989) and Hannan (1991).257 See Hannan (1997) and Radecki (1998).258 See Hannan (1998).
272
has not been offset by consolidation even though an increase in concentration has beenobserved.259
Indirect evidence on cross-sector competition can be drawn from the change in banks’behaviour when their borrowers become listed on a stock exchange. A study of IPOs in Italyfinds that after being listed, firms pay lower interest rates, receive more credit and increase thenumber of banks that lend to them.260 This means that the availability of diverse sources offinancing (in this case because of listing, but this might be also true in the case of competitionfrom other players, including non-banks) causes banks to react, to the benefit of their customers.
Direct studies confirm that M&As may influence market prices. In the United States, areduction in the interest rate on deposits is detected in markets that have been affected byconsolidation.261 A study of Italian M&As finds that loan rates increase when the market shareof the acquired bank is large.262 Estimates of the impact of mergers on prices for the Swiss retailbanking market indicate that concentration may have a negative effect on prices.263
In conclusion, the empirical evidence suggests that there are entry barriers for banking marketsand that market structure affects prices. While legal barriers to entry have been reduced over thelast few decades, economic barriers such as economies of scale (although minimum efficientsize is relatively small: see the section on consolidation and efficiency), switching costs andinformational asymmetries remain important. Tests of the multi-market contact hypothesis donot find significant evidence of collusion among firms that compete against each other indifferent geographic markets;264 competition issues seem limited to in-market behaviour.
Investment banks
The investment banking industry is highly internationalised: among the largest firms in eachgeographic area are institutions from the United States, the United Kingdom, Japan, France,Germany, the Netherlands etc. This indicates that the market is international in scope. However,the same firms dominate product markets in most geographical areas: in equity underwriting,the top five firms consistently have a market share above 50%, be it initial public offerings(IPOs) or secondary offerings (see the tables in Chapter I). Moreover, the top ten firms,although with different rankings, come up in almost all “league tables”, confirming the generalimpression that the industry is in fact highly concentrated, even at a supranational level. Thesame can be said of M&As advisory services, both for the United States and the Europeanmarkets (see the tables in Chapter I). The US syndicated loan market and the debt underwritingmarket are less concentrated (see the tables in Chapter I), mainly because of competition fromcommercial banks.
There has been almost no analysis on competition for the investment banking sector. In Italy athorough examination was performed by the antitrust authorities; it concluded that even thoughthe market for investment banking was dominated by a small number of firms, there was noevidence of abuses.265
259 In Fuentes and Sastre (1998) for Spain, using the dispersion of interest rates as a proxy for competition, it isfound that consolidation has not negatively affected the heightening competition which has developed in Spanishbank markets during the nineties.
260 See Pagano, Panetta and Zingales (1998).261 See Prager and Hannan (1998) and Simons and Stavins (1998).262 See Sapienza (1998).263 See Egli and Rime (2000).264 See De Bonis and Ferrando (2000) for Italy and Pilloff (1999) for the United States.265 See Banca d’Italia and Autorità Garante della Concorrenza e del Mercato (1997).
273
A study of the US market for IPOs found that underwriting commissions cluster at 7% forissues below USD 100 million, while they are lower by half in other countries.266 A possibleexplanation is that investment banks recognise that if they undercut each other they wouldcollectively end up with lower profits; this behaviour is only possible if they have some form ofmarket power, due, for example, to barriers to entry.267
One analysis of the US market for corporate securities underwriting finds that entry ofcommercial banks has significantly reduced underwriter commissions in the corporate debtmarket.268 The reduction is strongest in those market segments in which banks’ market sharewas larger. This suggests that entry of banks into the corporate securities market hassignificantly enhanced competition relative to the previous situation, in which only investmentbanks were active.
There is little or no research on the effects of M&As on prices and availability of investmentbanking services. However, the indirect evidence mentioned above suggests that in-marketconsolidation among important players might result in a significant increase of market power,thus harming customers. In fact, the sector is highly concentrated, and research for the UnitedStates – the largest world market – suggests that in some segments firms may already beexerting significant market power. Moreover, barriers to entry are likely to survive thetechnological developments foreseeable in the near future, as they are mainly due to theimportance of reputation and to the placing power of underwriters. 269 However, at the moment,the consolidation process involving investment banks is mainly cross-sector, aiming at creatingfinancial conglomerates with commercial banks, asset management and insurance companies, sothat it may not represent a clear threat of anticompetitive behaviour.
Insurance companies
Two studies of insurance markets in the United States find higher prices in more concentratedmarkets. A study of a cross section of state markets for automobile insurance finds higherpremiums in states with more concentrated industries.270 An examination of a cross section of18 types of insurance finds higher premiums in those insurance lines with higher four-firmconcentration ratios.271
The last few years have witnessed considerable consolidation in the insurance industry,particularly in the United States and Europe, including large mergers between banks andinsurance companies. Nonetheless, according to an OECD report,272 the insurance market iscompetitive, although the extent of competition seems to vary significantly from product toproduct and from country to country.
266 See Chen and Ritter (2000).267 This case is similar to that of market-makers in stock markets. In 1998, NASDAQ market-makers agreed to pay a
large fine in a settlement that followed the suspicion that they were colluding in fixing the bid-ask spreads.Although the issue did not involve consolidation, it is still suggestive of behaviours that might intensify as M&Asreduce the number of players in reputation-sensitive industries.
268 See Gande, Puri and Saunders (1999). The study finds that the reduction in underwriting spreads has not beencompensated by higher yield spreads; on the contrary, yield spreads have also declined.
269 There is some evidence that a security’s features and the underwriter’s reputation influence the level ofunderwriting commissions. See Carow (1999).
270 See Bajtelsmit and Bouzouita (1998).271 See Chidambaran, Pugel and Saunders (1997).272 See OECD (1998).

274
Mutual funds
At first glance, there seems to be a negative relationship between market concentration and feesin the European mutual funds industry, in particular for money market, bond and equityproducts (see Chart V.2). This suggests either that market power is not a relevant issue in thisindustry, or that the possible existence of market power is more than offset by efficiency gainsor scale economies that are passed on to consumers. However, given that most countries havesimilar levels of concentration but different average fees, the explanation for the cost andrevenues structure might be country-specific for each segment of the mutual funds industry.

275
Chart V.2Management fees and concentration in mutual funds industry
(percentage points and Herfindahl-Hirschman index)
Source: Lipper. Management fees (vertical axis) are simple averages of maximum charges. The Herfindahl-Hirschman index (horizontal axis; monopolistic market=1) refers to market shares of the ultimate parent companiesof fund management groups.
Balanced
0.0
0.2
0.4
0.6
0.8
1.0
1.2
1.4
1.6
0.0 0.2 0.4 0.6 0.8 1.0
CH
BE
SW
NL
IT
FR
DE
UK
Equity
0.0
0.2
0.4
0.6
0.8
1.0
1.2
1.4
1.6
1.8
0.0 0.2 0.4 0.6 0.8 1.0
FR
CHSW
UK
BE
IT
DE NL
Bond
0.0
0.2
0.4
0.6
0.8
1.0
1.2
0.0 0.2 0.4 0.6 0.8 1.0
UK
IT FR
DE
NL
BE
CH
SW
Money market
0.0
0.2
0.4
0.6
0.8
1.0
0.0 0.2 0.4 0.6 0.8 1.0
ITFR
UK
SW
DE
BENL

276
Conclusion
Overall, the evidence favours the hypothesis that more concentrated markets are lesscompetitive and that large in-market mergers may significantly increase market power, thusharming customers, especially in retail banking markets and markets for some investmentbanking services. However, technological changes and product innovations may alter the resultsbased largely on data from a few countries and referring to the early 1990s or earlier.
The future impact of technologyThe diffusion of the internet and of electronic commerce could have major implications for thegeographic market definition and therefore for the relationship between M&As and competition.Although electronic finance is not yet widespread, forecasts suggest a rapid growth in the nearfuture; the penetration of online banking in Europe is projected to grow from 8% in 2000 to22% in 2003; in the United States it should grow from 15 to 33%.273 If financial services can bepurchased or supplied effectively by electronic means, geographic limits to market expansionmay disappear, increasing the competition from firms located in other areas. Developments inelectronic technology could also reduce entry barriers by reducing search costs for consumers,for example by facilitating the development of third-party information brokers. Languagebarriers may become more significant than entry barriers due to geographic distance. On theother hand, technology could increase barriers to entry due to the large fixed costs of adoptingmany new computer technologies.
The short- and medium-term impact of e-finance, however, should not be exaggerated forseveral reasons. First, it is still relatively costly for consumers: the need for a personal computeror mobile telephone to access the internet, and the ability to use these tools still constitute abarrier to its diffusion. Second, electronic banking does not reduce information costs forproducts where the bank has to rely on information about local markets. Furthermore, newentrants may be forced to back up their internet entry with massive advertising outlays beforethey can effectively compete. Finally, for some products, customers may demand more thanonline contracts, however customised. Examples are high-value, infrequently bought items suchas life insurance and mortgages, for which one might research terms and conditions online butmay wish some personal advice before buying them.274 These reasons may induce customers tokeep using local suppliers, even if some services can be purchased electronically from a distantfirm.
The picture might change considerably if intermediaries that operate exclusively on the internetemerge. Such firms may be able to offer more attractive conditions than those offered bytraditional firms, since they do not need to support a branch network. At the moment, however,the legal framework for such firms is missing, in particular with regard to consumer protectionand money laundering. Moreover, in many countries, a customer still has to show up personallyin order to open a bank account. In addition, in their lending activity banks may want tocontinue to rely heavily on local information in the future, as offering some products (egmortgages) on the internet is considered highly risky.
However, there are also reasons for which the development of e-finance may reduce, rather thanincrease, competition. The typical financial institution increasingly operates in multiple markets,partly in an attempt to sell bundles of products to customers. Due to technological progress,
273 A forecast of the penetration of online financial services in Europe in 2003 shows that around 20% of mutualfunds and credit cards will be acquired online, while less than 10% of mortgages and life and pension productswill be, even though internet users will represent more than a third of the total population. See JP Morgan (2000),p 29 and 37.
274 JP Morgan (2000), p 6 and 25.

277
these bundles may become increasingly customised for a large number of customers. As aresult, switching costs would increase and customers may become locked in to their existingsuppliers, thereby reducing potential market entry. Finally, due to technological advances, newways of distributing financial services may be created which might only be exploited by verticalconsolidation of financial institutions with non-financial partners such as telecom and mediaenterprises. From this perspective, competition in non-financial markets may also becomerelevant.
Antitrust policy
In this subsection, the antitrust rules that are applied in cases of financial sector consolidation,as well as experiences with their implementation, are described for a sample of G10 countries.The regulatory record on antitrust regulation of financial markets is not complete. In manycountries, antitrust concerns have not played a prominent role in regulating mergers to date.
All of the countries covered by this study examine both the structural effects of proposedmergers and the behavioural aspects that may mitigate the anticompetitive effects of structuralchanges. Large countries with many local banking markets tend to have specific structural rulesthat serve as screens to determine whether a proposed merger might be anticompetitive in aparticular market. If the structural effects of a merger exceed that screen, the merger isexamined more closely and behavioural aspects are taken into account.
Smaller countries and countries in which there is not a long history of mergers among financialinstitutions, such as Japan and most European countries, do not have structural screens forprocessing mergers. Because of a lower volume of mergers, each proposed merger in thesecountries can be examined more intensively. An annex to this chapter contains the details of therules and implementation of antitrust policies in individual countries.
Consolidation in the European Union is an example of the problems that might arise for antitrustauthorities if financial institutions continue merging across borders and sectors. Of the decisionstaken concerning the banking sector, the only case which gave rise to potential difficulties wasthe merger between Bank Austria and Creditanstalt.275 The merged entity would have becomenot only the leading supplier of banking services in Austria, but also the only bank withsignificant market shares in all relevant product segments. However, Bank Austria gaveundertakings to the European Commission that eliminated the competitive concerns relating tothe proposed merger.
Other banking cases reviewed by the European Union did not present competitive concerns forone or more of the following reasons. First, for wholesale banking or financial services relatedto capital markets, there are large numbers of international suppliers – that is, the market ingeneral is not highly concentrated and market shares are rather fragmented. Consequently,customers have had sufficient choice and, barring unlawful collusion, there are no concerns asto restrictions of competition. This conclusion was drawn for example in the merger betweenSchweizerische Bankgesellschaft and Schweizerischer Bankverein to create UBS, at the timethe largest banking institution in Europe. Second, several banking consolidations assessed bythe Commission have involved companies which had no activities or only limited activities inthe European Economic Area (eg Kyowa/Saitama or BankAmerica/Nationsbank). Finally, in anumber of cases (such as the Deutsche Bank/Bankers Trust merger) the operations in questionwere largely complementary in nature, since there were no substantial overlaps in the activitiesof the companies.
275 All other banking M&As of which authorities were notified were cleared within the statutory four-week period.

278
4. Consolidation and the availability of credit flowsConsolidation in the banking industry has raised concerns of a reduction in the availability ofcredit to small and medium-sized enterprises due to the decrease in the number of small banksthat specialise in this type of lending.
There are two sets of arguments as to why this may occur. According to the first, larger andmore complex credit institutions have a lower propensity to lend to small firms. Hence, if theindustry moves towards a structure with a small number of large banks, credit flows to smallborrowers may be reduced. The second argument emphasises the dynamics of consolidation,which may cause a permanent disruption of credit relationships. To the extent that creditrelationships between banks and small firms are characterised by soft information, which is lesstransferable than hard information such as balance sheet and income statements, small firmscould face difficulties in finding credit from other sources.
When assessing the effects of M&As on credit flows to small firms, it is necessary to analysealso the behaviour of other market participants, since borrowers that are dismissed by themerging banks may be served by other banks or financial institutions. The effect of the spreadof new technologies should also be taken into account because it may have an impact on thelending practices of banks, large or small, and provide new ways of dealing with theinformation asymmetries that are a fundamental aspect of lending relationships with smallfirms.
In this section, the relative weight of small firms for G10 countries is briefly examined. Afterdiscussing reasons why consolidation may adversely affect credit flows to small firms, theexisting analytical evidence is summarised.
The importance of small business credit
Small and medium-sized enterprises (SMEs) make a substantial contribution to national outputand job creation. In 1996, on average, they accounted for 66% of total employment in Europe(Table V.5), ranging from 57% in the United Kingdom to 80% in Italy. SMEs are also veryimportant in the United States and Canada, although slightly less than in Europe, as they stillrepresent more than 50% of the labour force. In Japan, SMEs appear to have the highest relativeweight in all sectors of the economy compared to the United States and the 15 nations of theEuropean Union, but the data are distorted by the fact that the national statistics are based onestablishments rather than enterprises or enterprise groups.

279
Table V.5Share of employment accounted for by SMEs
Industryand
energyConstruction
Trade,hotels,
restaurantsAll sectors
Belgium 1995 55.9 93.7 90.4 72.6
Canada 1994 44.3 89.3 75.6 52.1
France 1995 51.2 84.9 81.3 65.9
Germany 1995 37.6 87.1 73.3 57.7
Italy 1994 74.1 95.2 94.8 79.9
Japan 1993 66.9 95.4 83.9 76.5
Netherlands 1994 49.9 85.2 77.9 66.4
Sweden 1995 46.8 70.9 79.5 60.9
Switzerland 1995 62.2 90.4 76.7 68.8
United Kingdom 1995 47.9 88.2 58.1 56.8
United States 1993 37.5 88.9 58.5 52.9
EU 15 1995 52.6 87.7 78.9 65.7
Source: Eurostat; Enterprises in Europe. For an enterprise to be classified as an SME it must have no more than 249employees, its annual balance-sheet total must not exceed ECU 27 million, no more than 25 percent of the capital of theenterprise must be controlled by one or more other enterprises, and its annual turnover must not exceed ECU 40 million. Onlyenterprises with at least one employee are included.
Economic performance may benefit from the presence of SMEs because they tend to be moreflexible than larger firms, thus reducing the costs of organisational changes and innovation.Moreover, SMEs are characterised by high rates of entry and exit: failing enterprises are morequickly replaced in sectors where small businesses are widely represented. Thus, a sound smallbusiness sector, especially during downturns, may contribute substantially to the process of jobcreation.
SMEs tend to rely more on debt financing relative to large firms (see Chart V.3) with theexception of the United States, where firms face fewer difficulties in accessing equity marketsand where the venture capital industry is more developed.276 Another explanation could be thatthe aggregate data reflect the sectoral composition of SMEs in each country, as differentindustries have different financial needs in terms of the mix between equity and different kindsof debt financing.
Breaking down financial debt by source shows that SMEs are mainly financed by banks (TableV.6) and hold a share of bank credit that is significantly higher than that of large enterprises.The only countries that are exceptions to this rule are Japan, where large firms have strong tieswith credit institutions, and Belgium. Small firms are very highly dependent on banks inGermany and Italy.
In conclusion, bank credit flows to SMEs appear to be very important in all G10 countries,particularly in Europe. Currently, SMEs are highly dependent on banks but the total availabilityof funds for them depends not just on consolidation but on all future developments of the
276 For example, in the European Union or Japan, the concept of stock markets specialising in SMEs is a rather newphenomenon, whereas the American Nasdaq was created in the early 1970s.
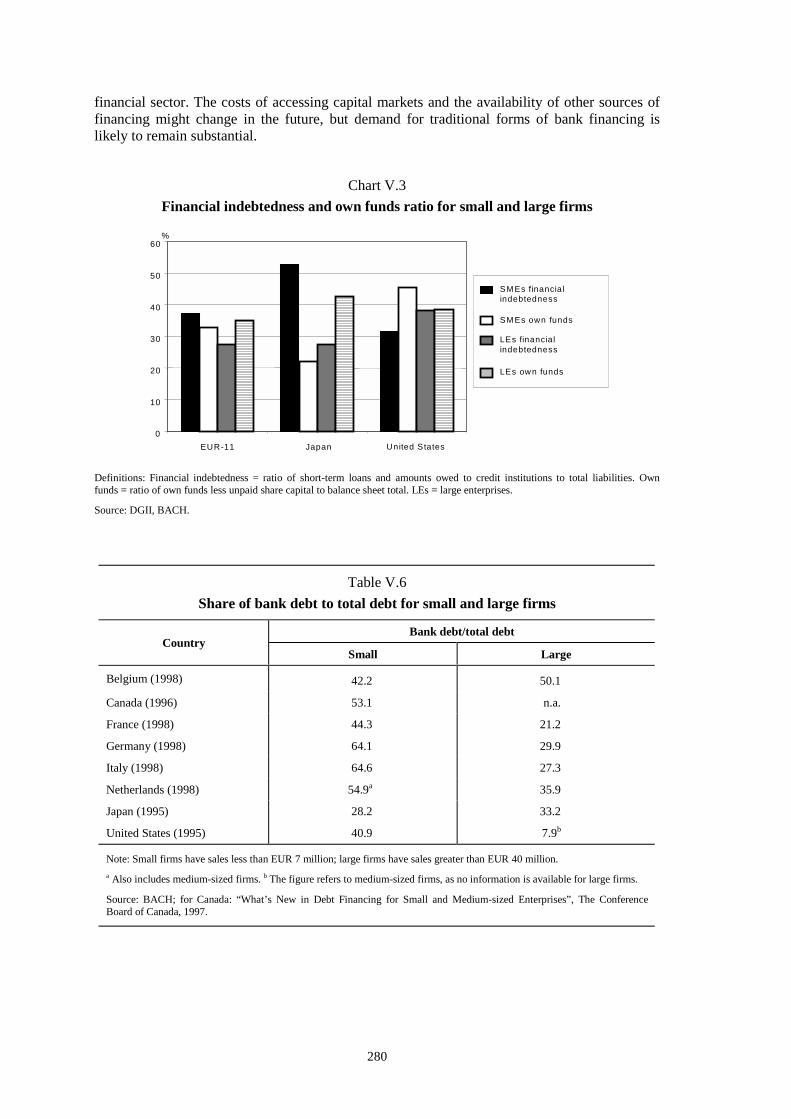
280
financial sector. The costs of accessing capital markets and the availability of other sources offinancing might change in the future, but demand for traditional forms of bank financing islikely to remain substantial.
Chart V.3Financial indebtedness and own funds ratio for small and large firms
0
10
20
30
40
50
60
EUR-11 Japan United States
SM Es financialindebtedness
SM Es own funds
LEs financialindebtedness
LEs own funds
%
Definitions: Financial indebtedness = ratio of short-term loans and amounts owed to credit institutions to total liabilities. Ownfunds = ratio of own funds less unpaid share capital to balance sheet total. LEs = large enterprises.
Source: DGII, BACH.
Table V.6Share of bank debt to total debt for small and large firms
Bank debt/total debtCountry
Small Large
Belgium (1998) 42.2 50.1
Canada (1996) 53.1 n.a.
France (1998) 44.3 21.2
Germany (1998) 64.1 29.9
Italy (1998) 64.6 27.3
Netherlands (1998) 54.9a 35.9
Japan (1995) 28.2 33.2
United States (1995) 40.9 7.9b
Note: Small firms have sales less than EUR 7 million; large firms have sales greater than EUR 40 million.a Also includes medium-sized firms. b The figure refers to medium-sized firms, as no information is available for large firms.
Source: BACH; for Canada: “What’s New in Debt Financing for Small and Medium-sized Enterprises”, The ConferenceBoard of Canada, 1997.
281
Why consolidation may (not) reduce credit flows to small firms
The impact of consolidation on small business lendingConsolidation increases the size and complexity of the credit institutions involved. There areseveral arguments as to why this may reduce the provision of credit to small firms.
Smaller banks are constrained in lending to large firms, while large banks have access to awider pool of borrowers and to a different mix of assets and financial products.277 Once the sizeconstraint is eased, banks might shift their portfolios of loans in favour of larger borrowers oreven shift their assets composition away from traditional lending activities.
A second reason could be that in providing credit to small borrowers, characterised by largeinformation asymmetries, small banks enjoy a cost advantage over other banks both in loanorigination and monitoring. Therefore, once small banks are replaced by larger ones, a decreasein small business credit may be observed because loans that were profitable are no longer so.
Small firms are considered significantly more opaque than larger ones; since they do not havetraded securities on public markets and the requirements on their financial statements are looser,their quality may be more difficult to assess. Banks develop relationships that allow them toovercome asymmetric information problems because detailed knowledge of the firms is gainedover time through contact with them.
Small banks may have a comparative advantage in issuing relationship-based loans and inmonitoring small firms’ activities. Due to their knowledge of the community in which the firmoperates, they may have access to soft information on the entrepreneur and on local marketconditions. As banks consolidate, their organisational structure tends to become more complex,and the lending decisions may be made at corporate headquarters located at a distance from thefirms’ activities. It may not be efficient to combine the provision of retail services to smallcustomers with the provision of wholesale capital market services to large customers.278
Moreover, M&As usually involve deep restructuring and changes of branch managers. Thereassessment of the loan portfolio by new managers who might not possess this soft informationmay imply the interruption of some of the existing relationships. Borrowers demandingrelationship-based credit will find it difficult to convey their quality to other banks, due toadverse selection problems, and may end up being rationed.
On the other hand, there are reasons why these concerns may be unjustified and small firmsmight not face problems due to the creation of larger and more complex banking institutions andmay even benefit from them. Larger banks or bank holding companies may act as efficientinternal capital markets and allocate financial resources to their best use (although internaladministrative allocation has problems of its own). In addition, having access to greaterdiversification opportunities, they can fund a larger number of small and riskier firms.Moreover, during periods of financial stress, large and diversified financial institutions may bestronger and more able to keep providing services to their customers than small, non-diversifiedlocal banks. Therefore, the ultimate effect of M&As on small business lending has to beevaluated on empirical grounds.
277 In most countries there are regulatory limits on loan concentration; even in the absence of such limits a bankwould not issue loans that account for a high proportion of its capital.
278 See Berger and Udell (1996b).

282
The impact of changes in the degree of competition
Consolidation may also influence the provision of credit to small firms if it changes the degreeof competition in the banking sector. Two opposite mechanisms are likely to be relevant.
Abstracting from informational asymmetries, a less competitive banking system should increasethe cost and decrease the supply of credit for all categories of borrowers, thus resulting in lessfavourable conditions. As small firms make extensive use of bank credit, a decrease incompetition may generate significant problems.
An alternative view, which takes into account information asymmetries, suggests that a morecompetitive banking system may be detrimental to borrowers, such as new and small firms, forwhom “soft information”, as discussed above, is likely to be of significance.279 The reason isthat a highly competitive environment may discourage intermediaries from investing in long-term relationships, which requires a degree of market power. If the bank expects to be able toextract rents in the future, it will offer lower rates to a borrower facing temporary creditproblems. Hence, a reduction in market power of banks in these circumstances may lead to areduced availability of credit to small firms or new borrowers.
How competitors react to mergers and acquisitions
The total change in the supply of small-business credit resulting from M&As also depends onthe reactions of other lenders and on broader developments in the financial sector. Even if abank reduces its supply of relationship-based loans because it faces diseconomies associatedwith supplying transaction-based services, other banks that are not burdened by thesediseconomies may expand their own supply.
The development of new banks, which are a source of borrowing for small firms, should also beconsidered. Since de novo banks are small, they issue business loans to small firms. In addition,these new banks may have been created by loan officers who have left consolidatinginstitutions, taking some of their relationship-based loan portfolios with them, or who believethat they possess above average screening capabilities based on knowledge of the local market.
Of course, it may be the case that even if borrowers dropped by consolidating banks are pickedup by other lenders, the conditions they will face may be worse (ie higher rates or morecollateral). Moreover, the possibility of finding another lender is likely to be influenced by thestructure of the banking industry: if the industry is highly concentrated it may be difficult for asmall business to find alternatives. If, instead, there are many banks even after theconsolidation, it may be relatively easier to shift.
The overall impact on small firms of changes in the supply of bank credit resulting from M&Aswill also depend on the availability to these firms of non-bank sources of funding. These includeequity finance, trade credit and funding by non-bank financial institutions. The access to thesealternative sources of finance may vary with the earnings profile of the firm and the category ofbusiness in which it operates. Small firms in high-growth, high-risk sectors are more likely toobtain external private equity (ie “angels” and venture capitalists), while firms with steadierincome flows and tangible assets more easily obtain external debt finance from banks and otherfinancial institutions because they have collateral.
In countries with particularly concentrated banking sectors (eg Australia, Canada and theNetherlands) consolidation may raise particular concerns for marginal small business borrowers
279 See Sharpe (1990) and Petersen and Rajan (1995). According to this view, the relationship between competitionin banking and the availability of credit to new firms is likely to be affected by the informational structure of themarket: the ability of banks to obtain information about their clients’ creditworthiness, the extent to which thatinformation is appropriable, the presence of credit rating agencies, and the degree of heterogeneity of borrowersand their ability to signal their creditworthiness.

283
that may be too risky for some, but not all, financial services providers. For many smallbusinesses seeking financing, there is value in having more rather than less choice. Having awide range of alternatives for bank financing, credit advice and a variety of other servicesoffered by the banks is particularly important to marginal borrowers because it increases theprobability that they will be seen as an attractive business opportunity by at least one serviceprovider. For these borrowers, the question of the availability of financing options is not only amatter of obtaining competitive rates but a question of enhancing the chances of getting a loanat all. In these countries, leaving decisions on credit allocation in the hands of even fewer, largerinstitutions raises serious concerns that go beyond the issue of competition to the availability ofcredit at any price.
In Canada, for example, in 1998 four banks accounting for 70% of bank assets announced theirintention to merge into two firms. One of the concerns cited in the rejection of the proposalswas that the range of remaining alternatives for bank financing and banking services (especiallyfor marginal small firms) would be reduced. The government felt that the question of theavailability of financing options is not just a question of competitive rates but a question ofenhancing the chances of getting a loan at all.280 Unlike in the United States, the emergence oflocal small business lenders to fill the gap left by a merger among traditional small businessfinance providers may not be likely.281
The impact of technologyA consideration of increasing importance for banks’ propensity to lend to small firms is theimpact of technological change. Large banks are increasingly able to use credit scoring to makesmall-business loans and to process applications using automated and centralised systems. Scaleeconomies allow these banks to generate large volumes of small-business loans at low cost, andimproved technology and marketing, which change the delivery of financial services to smallcustomers, make this possible even in areas where they do not have branch offices.282 Creditscoring may also encourage more small-business lending because it gives banks a tool forpricing risk more accurately and makes the securitisation of these loans more feasible than inthe past.283
A key issue, however, is that information technology is expected to reduce the cost ofprocessing hard information. Therefore, it will benefit mainly “transaction-type” loans, which,like credit card loans, do not need much information-intensive credit evaluation beyond what isdone in a credit scoring model based on quantitative data. It will not necessarily reduce the cost,and indeed may increase the relative cost, of processing the sort of information typical ofrelationship lending.284
An important implication of this is that small customers with strong financial statements andvaluable collateral should not experience a reduction in credit availability. On the other hand,small borrowers who do not qualify for a sufficiently high credit score will continue to dependheavily on small banks, which offer traditional relationship-based loans. Hence, they may facean increased cost of funds or a reduced availability if credit scoring practices become dominantin the industry.
280 Statement by the Honorable Paul Martin, Minister of Finance, Ottawa, Canada, 14 December 1998.281 See McFetridge (1998).282 See Mester (1999); see also Berger, Saunders, Scalise and Udell (1998).283 The securitisation of small-business loans has usually been limited, not least because of their heterogeneous
nature. Credit scoring will tend to increase the standardisation of loans.284 See Petersen (1999).

284
The empirical evidence
Empirical research on consolidation and small-business lending has followed two approaches.The first one infers indirectly the effects of M&As in the financial industry by analysing therelationship between firm size and bank size, using both market-level and bank-level data. Thesecond one examines directly the changes that occur in small-business lending by theinstitutions involved in M&As. The majority of the existing literature is based on US data; someevidence exists for Italy.
Indirect evidence: bank size and small-business lending
Evidence shows that larger banks have a lower share of small-business loans to total loans. Thisis usually interpreted as evidence that consolidation may harm small-business lending.285
The effects of bank size on small-business lending have also been studied employing market-level data. The relative weight of small banks in local credit markets has not been found toinfluence the probability of a small firm having a line of credit from a bank. Some short-rundisruption may occur, but firms in areas with fewer small banks do not appear to be more creditconstrained.286
The hypothesis that increased organisational complexity may negatively affect the propensity tolend to small firms has found some support in the empirical literature. Results frominvestigating loan contract data suggest that larger banks tend to issue many fewer loans to theseborrowers, although they charge lower rates and require less collateral. A similar result holds forbanks with greater organisational complexity, as measured by proxies of the holding companystructure.287
Direct evidence on M&As and small-business lendingConsolidating banks often reduce their total small-business lending. Several explanations havebeen suggested for this result. A first explanation is that the bidder tends to drive the share ofsmall-business lending in the portfolio of the merged bank towards the share that the bidder heldprior to the merger.288 Since the bidders are usually larger than the targets and hence have asmaller share of small-business loans, on average, M&As tend to reduce the availability ofcredit to small firms.
A study on the effects of bank M&As in Italy finds that banks involved reduce their share ofcredit to small firms.289 The reduction does not seem to be associated with organisationalproblems, because it follows M&As that generate differing levels of complexity for theintegration of the banks involved. It does not appear to be related to loss of information either,because M&As are not followed by a reduction in the number of employees. In fact, thereduction of the share of credit to small firms seems part of a broader strategy of asset allocationthat changes the composition of the loan portfolio towards larger, less risky borrowers andreduces credit to low-quality firms. This is consistent with the results of another study whichfinds that small borrowers who maintain their relationship with the consolidated bank are thoseleast harmed by increases in interest rates.290 At the local (provincial) level the temporary
285 See Berger, Kashyap and Scalise (1995).286 See Jayaratne and Wolken (1999).287 Berger and Udell (1996a) test whether large and complex banks supply less credit to small business borrowers
relative to smaller, less complex banks.288 See Berger, Saunders, Scalise and Udell (1998), Peek and Rosengren (1998) and Walraven (1997).289 See Focarelli, Panetta and Salleo (1999).290 See Sapienza (1998).

285
reduction in lending to small firms is comparable in size to the reduction of lending to all firms,thus confirming that consolidation determines a general revision of the loan portfolios;borrowers in good standing (including small ones) do not appear to be negatively affected byconsolidation.291
Overall, the evidence discussed above suggests that consolidating banks do adjust their small-business lending strategy after consolidation. The direction is generally towards a reduction, butthere are cases in which the change is in the opposite direction, as in the case of a small bankbuying a larger one. Therefore, from a policy standpoint, the main finding of the paperssummarised in the previous sections cannot be used as an accurate predictor of what will occurin the future and in different countries, since the impact of M&As on small-business lendingdepends crucially on the motivations of the deal and on the type of banks involved. Moreover,what is relevant is the total availability of credit to small borrowers; accordingly, some studies(discussed below) do not focus exclusively on consolidating banks but extend the analysis to thebehaviour of other institutions in the same markets.
The reaction of competitorsEven if consolidation involves the interruption of some relationships, if the borrowers are ableto find other lenders at the same cost there would be no effect on total lending. Other banks orother providers of financial services may pick up small-business loans dropped by mergingbanks, if these loans are profitable.
Some evidence on a positive reaction by the competitors of consolidating banks that reducesmall-business loans has been found in US data.292 One study examined the effect of M&As onthe small-business lending of other banks in the same local markets and found that they tend tooffset the reduction in the supply of credit to small firms by the consolidating banks. Anotherstudy employing market-level data finds that in markets where consolidation reduces small-business lending other institutions tend to increase it.293
Finally, de novo banks tend to lend more to small firms than other banks of similar size,294 soentry may be another source of substitutes. However, de novo banks are generally small;therefore, their effect is likely to be felt in the long term. Consolidation may be itself adeterminant of entry in local markets as the structure of the banking sector changes; lending tosmall firms may shift across different categories of banks.295 One problem with the existingstudies is that only the quantity of credit issued is examined but no information is available onrates and other contract terms.
Impact on birth rates of firms
As discussed previously, consolidation changes the competitiveness of the banking sector, thusindirectly influencing credit allocation. Several studies have investigated the relationshipbetween the degree of competition and the availability of credit to small firms.296
In more concentrated banking markets commercial loan interest rates tend to be higher,especially for small firms that face higher switching costs.297 Other research has found, instead,
291 See Bonaccorsi di Patti and Gobbi (2000).292 See Berger, Saunders, Scalise and Udell (1998).293 See Avery and Samolyk (1999).294 See DeYoung (1998) and Goldberg and White (1998).295 See Berger, Bonime, Goldberg and White (1999).296 See Petersen and Rajan (1994).

286
evidence of the positive effect of market power described by the theory on relationship lending:young firms in concentrated markets receive more credit than do similar firms in competitivemarkets, but such difference tends to disappear as firms become older.298
Concentration has been found to have a strong negative effect on the aggregate rate of birth offirms. Another study has found that in local banking markets the relationship betweenconcentration and the rate of birth of firms differs across industries. Specifically, concentrationappears to be relatively beneficial (or less unfavourable) for firms in highly opaque industries,as these industries have relatively higher rates of firm birth.299
ConclusionsEmpirical evidence suggests that consolidation may have diverse effects on small-businesslending. Although there are reasons for concern that the reduction in the number of smallerinstitutions may harm small-business lending, there is no evidence on the quality of borrowersthat are discontinued credit. What appears to be most relevant is how permanent changes inmarket structure affect the competitiveness and efficiency of the industry, and how these factorswill affect allocative choices of banks across different segments of borrowers. In addition, thereis little evidence yet on how technology and the blurring of boundaries across financial productschange relative costs and revenues from servicing different types of borrowers.
5. Policy issues
Competition policyPolicymakers and regulators should take into account how competition is affected by theongoing consolidation process and changes in technology, in particular with regard to theevaluation of the benefits to the consumer and the burden laid on the industry.
There is little evidence on the benefits of consolidation (if any, they seem to be smaller forlarger firms) and there are concerns about possible abuses of market power, especially byinvestment banks and by providers of local bank products such as small-business lending andfinancial services for households. Therefore, when proposing transactions, supervisors offinancial institutions should carefully examine claims of efficiency improvements (mainly costreductions to be passed on to consumers) that firms believe they will generate. This is especiallyimportant in cases in which a merger could raise significant issues of market power, such as formarkets with significant economic or regulatory barriers to entry, or that are highlyconcentrated.
The impact of consolidation on competition can be assessed only by using an empiricallysupported definition of the relevant product and geographical markets. For example, electroniccommerce and electronic banking may increase competition by enlarging the marketsgeographically; on the other hand, they could facilitate consumer lock-in by increasingswitching costs, thus changing the definition of the relevant bundle of products to be analysed.Since financial markets are constantly changing, their definition has to be scrutinised regularly,taking into account the differential impact on different classes of consumers, such ashouseholds, small and large firms etc.
297 See eg Hannan (1991).298 See Petersen and Rajan (1994 and 1995).299 See Bonaccorsi di Patti and Dell’Ariccia (2000).

287
In particular, the impact of technological changes could be more powerful for households thanfor small firms, since standardised techniques such as credit scoring models are more suited tothe former. The analysis of the relevant markets for antitrust purposes should focus less oninstitutional categories, such as administrative boundaries (provinces, counties etc) or classes offirms (banks, insurance companies etc); it should take more into account changes in thegeographic and the product dimension as well as changes in demand. In any case, the goal ofantitrust authorities should be to maintain competitively structured markets.
In order to increase competition in an environment subject to mergers that significantly reducethe number of providers of financial services, obstacles to the mobility of customers should beremoved. This could be done for example by setting and enforcing transparency rules regardingproducts and prices, or by simplifying the process of changing providers, eg by allowingcustomers to keep their account numbers and by enforcing the transfer of historical transactioninformation between intermediaries. Better flows of information between customers andfinancial institutions could also decrease the asymmetric information problems between smallfirms and banks; this in turn would limit the probability of credit rationing and relax one of theconstraints set by regulators on M&As.
Alternative sources of financeThe problems faced by small firms in funding their projects might be alleviated if alternativesources of finance, both in terms of providers and products, are developed. This is particularlyrelevant for countries where firms rely more heavily on bank finance; the diversification offirms’ financial structure could be encouraged, for example, by moving towards fiscal neutralitybetween debt and equity, by increasing the protection of minority shareholders, by fostering thedevelopment of equity markets or by decreasing the costs of being listed.
Alternative sources of finance, which include venture capital, private equity markets, specialisedfinancial institutions and stock markets for small firms, may become more available asinformation generating and storing costs decrease and expertise in this field becomes morewidespread, especially in Europe and Japan. Policies that encourage transparency and promoteawareness of financial markets (such as, for example, incentives for individual pension plansand the diffusion of ratings) would be helpful in this respect.
Cross-industry competition may be beneficial to consumers both indirectly, by improving theiroutside options, and directly, by competing with existing products and by offering new productsthat increase consumers’ choice. Eliminating policies that limit cross-industry competitionwould have a beneficial effect. In countries with particularly concentrated market segments,however, the costs and benefits associated with cross-industry M&As would have to beevaluated with special care.
Adequacy of data flowsAntitrust policy needs data on market shares, prices, and volumes of activity in key financialservices business lines in order to be enforced efficiently. The financial services industryalready regularly provides some of the relevant data; however it would be advisable to enrichthe available information, especially at the firm level. The burden of these added reportingrequirements should be minimised; authorities should explore ways to encourage financialinstitutions to contribute the needed data on an ongoing basis, possibly by publishing in returnthe aggregate data they collect for policy purposes.
In order to limit unjustified costs to the industry, authorities could focus on collecting data onlyin areas where the consolidation of the financial sector is likely to have significant effects, suchas small-business lending and retail branch banking services. In some countries it might bepossible to rely on sample surveys of financial institutions rather than having the entire financialservices industry report data.

288
In general it is important to consider what kind of information should always be readilyavailable so that the impact of M&As can be quickly assessed. In the area of small-businesslending, for example, it is essential that governments and regulators be able to assess theimpacts of financial sector consolidation on the availability of credit for small firms. At themoment, in many countries there is a lack of specific data on small-business lending and otherforms of debt financing such as leasing, as well as little information on the availability of equityfinancing (eg venture capital).
Technology and consolidation
Technological progress is changing the landscape of the financial industry. It may increase theimportance of economies of scale and scope, raising the minimum efficient size for financialinstitutions. This means that larger institutions could achieve cost reductions and pass them onto consumers, as long as markets remain sufficiently competitive. However, technologicalprogress can also decrease competition by contributing, for example, to locking in consumersthrough increased switching costs. In this case, larger, more technologically sophisticatedinstitutions could take advantage of their customers. Antitrust authorities should therefore focuson anticompetitive behaviour at least as much as on changes in market structure and onefficiency gains when analysing the potential effects of M&As.

289
Annex V.1Antitrust rules and their implementation in specific countries
Australia
RulesCompetition policy in Australia is governed by the Trade Practices Act of 1974. The Actprohibits M&As that have the effect, or likely effect, of substantially lessening competition in amarket. The Australian Competition and Consumer Commission (ACCC) is responsible foradministering the Act.
ImplementationTo determine whether a merger breaches the Act, the ACCC must define the relevant marketand judge whether the merger would substantially lessen competition.
In defining a market, the ACCC takes into account the availability of substitutes, thegeographical area over which an individual firm could exercise market power and the length oftime that it may take other suppliers to develop substitutes for the merged firm’s products. In itsassessment of recent applications for banking mergers, the ACCC has indicated that it considersmarkets for wholesale banking (such as corporate fund raising and derivatives trading) to benational in scope; however, a more narrow, regional or state-based market has been applied toretail banking.
In assessing whether a proposed merger would substantially lessen competition, the ACCCtakes into account such factors as market concentration, import competition, barriers to entry,the presence of vigorous and effective competitors, and the pace of product innovation in themarket.
In assessing market concentration, the ACCC considers both the merged firm’s market shareand the share of the four largest institutions in the market. If the post-merger combined marketshare of the four largest firms is 75% or more, and the merged firm’s share is 15% or more, theACCC will need to consider other factors before permitting the merger. If the merged firm’smarket share exceeds 40% (regardless of the market share of the four largest firms) this alsoprompts further scrutiny by the ACCC.
In addition to the requirements set out in the Act, the Commonwealth Government has indicatedthat mergers amongst the four largest banks will not be permitted until competition in thefinancial industry, particularly in small-business lending, has substantially increased.
Belgium
RulesSince 1991, the protection of economic competition in Belgium has been based mainly ontheoretical foundations identical to EU competition law. According to the law of 5 August 1991on the Protection of Economic Competition, as changed in 1999, three authorities oversee itsapplication: the Commission of Competition (advisory body on general competition policy), theService of Competition (the public administration charged with inquiries and the follow-up ofthe law’s application) and the Council of Competition (an administrative judicial body thatensures the law’s application and sanctions offences). They are the competent authorities for alleconomic sectors; for the financial sector, there is an ex ante authorisation of the Commission ofBanking and Finance (CBF), the supervisory authority for the banking and financing sector.Under articles 30 and 31 of the law of 22 March 1993 on the establishment and supervision of

290
financial institutions, by and large all M&A operations in the financial sector must ask for thisprior authorisation.
ImplementationIn the recent past, Belgium has experienced a number of large M&As in the financial sector.The CBF has only three months to investigate a case and is presumed to approve any operationunless otherwise stated. It is also restricted in its disapproval to the evaluation of the sound andprudent management of the financial institutions concerned. The CBF has never refused itsapproval. Neither has the Council of Competition found any infringements, though this may bedue in part to a difficult working situation, culminating in its temporary resignation from officein 1997, and a changing legal framework.
Canada
RulesGenerally, mergers are not challenged on the basis of concerns relating to the unilateral exerciseof market power where the post-merger market share of the merging parties would be less than35%. Mergers are not challenged on the basis of concerns relating to the interdependent exerciseof market power where the share of the market accounted for by the four largest firms in themarket after the merger would be less than 65%, and the merging parties would hold less than10% of the market.
ImplementationFirst, the Competition Bureau, a federal agency within the Department of Industry, defines therelevant product and geographic markets. Second, it examines the parties’ market shares andoverall industry concentration. Third, the Bureau assesses key evaluative factors listed inSection 93 of the Competition Act, such as foreign competition, availability of acceptablesubstitutes, barriers to entry, change and innovation, removal of an effective competitor,business failure and exit, and the effectiveness of remaining competitors. All of these are usedto determine the likelihood that prices will rise or service decline after the merger. Finally,efficiencies are examined if it is concluded that the merger results in a substantial lessening orprevention of competition. The Competition Act provides that a merger may proceed if (i) theseefficiencies represent cost savings that would not be attained if a remedial order against themerger were made, and (ii) the cost savings represent real savings in economic resources. Theanalytical framework used by the Competition Bureau is described in the Merger EnforcementGuidelines as Applied to a Bank Merger released on 15 July 1998.
European Union
RulesThe approach of the European Community to merger control is part of a competition policy thathas developed separately from equivalent national policies. It has been designed not only toensure the objective contained in the Treaty of Rome that competition “in the common market isnot distorted”, but also as an instrument to facilitate integration and the development of theinternal market. The Merger Regulation, which came into force in September 1990 and wasmodified in 1997, extended and clarified the Community’s responsibilities concerning mergercontrol.
The Merger Regulation gives the European Commission exclusive responsibility to controlmergers with a Community dimension. The procedure is initiated by mandatory notification bythe parties concerned. Smaller mergers remain in principle under the control of nationalauthorities. The division of responsibility is made on the basis of the turnover of the enterprises

291
involved. The starting point for establishing whether a consolidation is considered to have aCommunity dimension is that:
∙ the aggregate worldwide turnover of all the undertakings concerned is more thanEUR 5 billion; and
∙ the aggregate Community-wide turnover of each of at least two of the undertakingsconcerned is more than EUR 250 million, unless each of the undertakings concernedachieves more than two thirds of its aggregated Community-wide turnover within onemember state;
∙ A concentration that does not meet the above-mentioned thresholds has a Communitydimension where: (i) the combined aggregate worldwide turnover of all theundertakings concerned is more than ECU 2,500 million; (ii) in each of at least threemember states, the combined aggregate turnover of all the undertakings concerned ismore than ECU 100 million; (iii) in each of at least three member states included forthe purpose of point (ii), the aggregate turnover of each of at least two of theundertakings concerned is more than ECU 25 million; and (iv) the aggregateCommunity-wide turnover of each of at least two of the undertakings concerned ismore than ECU 100 million, unless each of the undertakings concerned achieves morethan two thirds of its aggregate Community-wide turnover within one and the samemember state.
In the context of exclusive Commission responsibility for dealing with mergers with aCommunity dimension, the Regulation states that no member state can apply its nationallegislation on competition to such cases unless it is to protect legitimate interests, which aredefined as public security, plurality of the media and prudential rules.
ImplementationThe Commission adopted over 160 decisions on mergers in the financial sector (includingbanking, insurance and pension funds) between January 1991 and mid-May 2000. Almost all ofthose examinations have been of cross-border operations, involving companies from at least twodifferent EU member states or companies located in third countries, generating a certainturnover within the European Union. This relatively low number of decisions reflects the factthat, to date, most mergers in the financial sector have been domestic and have lacked aCommunity dimension, so that the examination has been left to the member state concerned.The trend towards cross-border consolidation is stronger in smaller member states, in particularin the Benelux countries. Of the 90 Commission decisions on banking mergers, for example,20 cases concerned Belgian and 12 Dutch firms. A similar trend can be observed in the Nordiccountries.300 This may be explained by the fact that credit institutions in smaller markets aremore dependent on international expansion to achieve a critical mass. Language and culturalsimilarities may also be a factor.
France
RulesFor M&As among banks which do not fall under European Community regulation, and in thepresent state of French competition legislation (which is not completely clear on this subject),takeovers in the banking sector seem to be out of the jurisdiction of competition authorities,although some aspects of financial competition are within their jurisdiction.
300 These include, for example, Royale Belge/Anhyp, Kredietbank/Cera/Fidelitas/ABB, Paribas Belgique/ParibasNederland, Merita/Nordbanken, Merita Nordbanken/Unidanmark and Föreningssparbanken/FI-Holding/FIH.

292
On the financial legislation side, there is no explicit disposition in the Banking Act that givesfinancial authorities the responsibility for monitoring concentration. However, a bank willing totake over another bank has to obtain authorisation from the Comité des établissements de créditet des entreprises d’investissement (CECEI), which checks the compatibility of such anoperation with the smooth functioning of the banking system and the safety of the customers.Therefore, when the CECEI approves a deal, it takes into account, in some way, itsconsequences on competition. However, the CECEI would not base a refusal on competitiveconsiderations alone.
ImplementationIn 1998, when CIC was privatised, five institutions were candidates for the takeover. Theauthorities examined the market shares that would result in each case. In four cases, theexpected market shares of the new entities were quite significant in some market segments, butwere deemed acceptable. In 1999, during the BNP-SocGen-Paribas affair, the CECEI lookedclosely at the effects of the proposed operations on the market shares of the resulting entities.
Germany
Rules
In Germany, the act prohibiting barriers to competition (Gesetz gegenWettbewerbsbeschränkungen) provides the legal basis for regulating mergers. The essentialcriterion for a merger is met if a controlling entrepreneurial, or competitively significant,influence on the target enterprise would be attained through the acquisition of capital. Suchinfluence may even be exercised through a minority stake if this is accompanied by specialrights to information, co-determination or control on the part of the acquiring party.
The Federal Cartel Office (Bundeskartellamt) is primarily responsible for monitoring corporatemergers. It intervenes in mergers if the enterprises involved have reached certain turnoverthresholds and merger control does not fall within the jurisdiction of the European Commission.Thus, mergers are generally subject to domestic supervision only if all the enterprises involvedhave achieved a total prior-year turnover of at least DEM 1 billion and if at least one of themhas recorded a turnover in Germany of more than DEM 50 million for the preceding year. In thecase of credit institutions, the total amount of receipts less the taxes that are paid directly fromthis source is used instead of turnover. The domicile of the enterprise is immaterial.
Implementation
The enterprises involved must report an intended merger to the Bundeskartellamt prior to theactual merger (preventive merger control). On receipt of notification, a preliminary procedurebegins in which the Office decides within one month whether the merger is unobjectionable orwhether it will proceed to examine the merger (main examinational procedure). During the mainexaminational procedure, the Office decides within four months whether it will allow themerger to proceed (possibly, subject to certain conditions), or prohibit it.
The Bundeskartellamt will prohibit a merger if it is expected to constitute, or bolster, a positionof market dominance on the part of the enterprises involved. In examining market dominance,the relevant market first has to be defined and then market concentrations are determined basedon the market structure (actual and potential competition from domestic and foreign rivals).

293
Italy
RulesItalian antitrust regulation was introduced with the law number 287 in 1990. The objective ofthe law is to guarantee the functioning of the competitive process by prohibiting: (i) agreementsthat have the goal or effect of impeding, restricting or distorting competition; (ii) the abuse ofdominant positions; and (iii) operation of consolidations that create or strengthen a dominantposition which eliminates or substantially reduces competition.
The application of the law, which has to be carried out in accordance with the principles of theEEC regulation in the same domain, is the responsibility of the Autorità Garante dellaConcorrenza e del Mercato (AGCM). An exception is the banking sector: the law attributes tothe Bank of Italy the application of the antitrust regulation to banks. The Bank of Italy adopts itsown decisions after having heard the opinion (which is not binding) of the AGCM; anagreement was signed in 1996 on the means and terms of cooperation between the twoauthorities. Another exception is the insurance sector. The AGCM adopts its decisions afterhearing from ISVAP, the supervisory authority for insurance companies.
Implementation
When the competent authority finds a potential violation of the antitrust law, a file is opened.From the approval of the law in 1990 to May 2000, the Bank of Italy, in its antitrust function,has opened 33 files: 16 were on consolidations, five on abuse of dominant positions, and 12(plus one currently under examination) on anticompetitive agreements.
As far as consolidations are concerned, the main element for the assessment of the impact oncompetition is the definition of the relevant market, both geographically and in terms ofproducts. The Bank of Italy usually defines the province as the relevant market for deposits andthe region for loans. In many of the files on consolidation, the Bank of Italy has imposedcompensatory structural measures, such as the sale or closure of branches in the local marketsaffected. Also, behavioural measures have been imposed in certain cases, for example,prohibiting the banks involved, for a given period of time, from opening new branches in themarkets believed to be critical from the competitive point of view.
Growing importance is given to the control of anticompetitive agreements and abuses ofdominant positions. The files opened until now by the Bank of Italy on agreements have beenrelated to the behaviour of individual banks and business associations. The Bank hasinvestigated agreements that could harm competition by fixing prices or other sales conditionsof given products, and agreements on the territorial sharing of markets. The Bank of Italy hasopened five files on the behaviour of the Italian Bankers Association with regard to thedefinition of uniform tariffs, specifically in the payment system area, and the suggestion ofuniform mechanisms for the definition of pricing strategies on exchange rate fees. Recently, afine of ITL 30 billion was imposed on 13 large banks that had agreed to exchange proprietaryinformation and fix prices of given banking services, thus distorting competition.
Japan
Rules
The Anti-Monopoly Law prohibits any consolidation where “the effect of a merger may be tosubstantially restrain competition in any particular field of trade”. This is determined by theposition of the merging companies in an industry (as measured by their market shares, ranks, theextent to which they compete etc) and by market conditions (as measured by the number ofcompetitors, degree of concentration, entry, competition from imports, and the financialcondition of the firms).

294
Implementation
The Japanese Fair Trade Commission is in charge of Japanese competition policy. TheCommission implements the Anti-Monopoly Law and formulates guidelines for itsimplementation in order to make the law more transparent. The Commission also reviewsgovernment regulations and exemptions from the Anti-Monopoly Law. In practice, antitrust lawworks in tandem with efforts to deregulate the economy in order to increase competition inJapanese markets.
Netherlands
RulesThe antitrust legislation of the European Community overrides Dutch legislation if a particularintended consolidation has a “Community dimension” (see above). The Dutch legislation onlyapplies to consolidations above a particular size (firms with a global turnover higher thanNLG 250 million, of which at least two have a turnover of at least NLG 30 million in theNetherlands).
Consolidation is prohibited between firms (financial and non-financial), without giving priornotification to the Dutch competition authority, the Nederlandse Mededingings Autoriteit(NMA). The NMA subsequently determines whether concentration may pose a threat tocompetition and if it does, research is undertaken by the NMA, ultimately resulting in rejection,acceptance or the start of licence procedure (see below).
After notification is received, the NMA has a maximum of four weeks to determine whether alicence is required; if nothing happens, the consolidation may proceed. During these four weeks,the NMA investigates whether there is a chance of unacceptable market power as a result of theconsolidation. If this is the case, a licence procedure is started, lasting a maximum of 13 weeks.The NMA investigates the nature of the relevant market, the market shares of the firmsinvolved, the possibility of new entry and the degree of dependency of external stakeholders(suppliers, clients). This research determines whether or not a licence is issued and whetherconditions will be attached. In exceptional cases the Ministry of Economic Affairs may overridea rejection by the NMA, if the “general good” is endangered.
To deal with particular, financial sector specific situations, two exceptions to the procedureabove are allowed. First, an exception has been created with respect to this notificationprocedure in case a consolidation would prevent bankruptcy of a financial institution, andthereby avoid severe consequences. In such a case, the relevant financial supervisor(s) and theNMA investigate, confidentially and without loss of time, whether consolidation between theproblem institution and another would solve the problems without harming competition. In casethe NMA disagrees with the preferred solution of the financial supervisor(s), the Minister ofEconomic Affairs may be asked to give a decision.
Second, when a consolidation, valid according to the NMA, would threaten the goals offinancial regulation, the Minister of Finance, after consulting the relevant financialsupervisor(s), may block the concentration.
Implementation
The rules as listed above have only been effective in the financial sector since 1 January 2000;for the non-financial sector, they have been effective since 1998. Since that time, there have notyet been situations in which the NMA has been actively involved in financial sectorconsolidation.

295
Spain
RulesSpanish legislation, which is only applicable to consolidations that do not have a Communitydimension (see Rules of the European Community in this annex), is laid down in CompetitionLaw 16/1989 of 17 July 1989 (Articles 14 to 18), which contemplates the existence of twospecialised administrative bodies: the Competition Service, which is responsible for initiatingproceedings and implementing decisions, and the Competition Court, which submits reports andproposals to the Government. Both bodies cooperate with the European Commission inCommunity proceedings.
ImplementationConsolidations in excess of given thresholds, based on a definition of concentration similar tothat laid down in Community legislation, are required to notify the Service. These thresholds areset according to market share (25% of the national market or of a distinct geographical marketwithin a member state) and sales volume (aggregate amount of ESP 40 billion andESP 10 billion in each of at least two of the undertakings concerned). The Service shall benotified of consolidations prior to, or not more than one month after, the conclusion of anagreement to combine, though notifications shall not imply the suspension of the operation.Whenever the Service considers that the consolidation may impede competition, theGovernment shall request a non-binding report of the aforementioned Court and may decide,within three months of the date of receipt of the report, to attach conditions to the consolidationor to impose appropriate measures to restore effective competition, including a reversal of themerger. The decisions of the Government may be brought before the Spanish Courts of Justice.
Sweden
RulesAccording to the Competition Act, the Competition Authority must be notified of any merger ifit creates an entity with a turnover greater than SEK 4 billion and the acquired firm has aturnover greater than SEK 100 million. A merger may be challenged if it results in a dominantmarket position or further strengthens an already dominant market position. Mergers may alsobe challenged on the basis of concerns regarding the resulting market concentration (collectivemarket dominance). In general, mergers in the financial sector are treated in the same way asthose in any other industry.
ImplementationWhen it is notified of a merger, the Competition Authority makes a preliminary investigation todetermine whether there is cause for concern regarding the resulting market power or marketconcentration. If this is the case, the Competition Authority initiates a full investigationaddressing issues regarding the possible effects on efficiency, competition, prices, quality ofservices etc. If necessary, the Competition Authority might then challenge the merger in civilcourt.
Switzerland
Rules
The Federal Competition Commission must be notified of a merger if the situation reaches thefollowing thresholds during the financial year preceding the merger: (i) the aggregate worldwideturnover of the companies concerned amounted to at least CHF 2 billion or the aggregateturnover of the companies within Switzerland amounted to at least CHF 500 million, and (ii) the
296
aggregate turnover in Switzerland by each of at least two of the companies concerned amountedto at least CHF 100 million. For banks, turnover is replaced by 10% of total assets, and forinsurance companies, the thresholds are calculated with reference to aggregate annual grosspremiums. In addition, the Federal Competition Commission must be notified if a participatingfirm holds a dominant position in a market in Switzerland and if the merger involves either thatmarket, a related market, or an upstream or downstream market.
ImplementationMerger control is governed by the Federal Law on ‘Cartels and other Restrictions ofCompetition’ of 1995. The law is applied by the Federal Competition Commission and itsSecretariat. The Secretariat investigates proposed mergers and the Commission determineswhether they should be allowed. Banks are basically treated like other industries, with theexception that the Swiss Federal Bank Commission takes the place of the CompetitionCommission if a merger is seen to protect the interests of creditors. This is expected to be theexception and has not yet occurred since the Act entered into force.
On receipt of the notification, the Secretariat starts a preliminary investigation by examiningwhether the merger might create or strengthen a dominant position liable to eliminate effectivecompetition. If so, the Commission initiates a regular investigation. The duration of thepreliminary investigation is limited to one month, that of the regular investigation to fourmonths.
The main patterns of the examination are (i) the relevant markets, (ii) current competition inthese markets, (iii) potential competition, and (iv) countervailing powers of customers.
United States
Rules
The competitive effects of all mergers and acquisitions are reviewed by either the Department ofJustice (DOJ) or the Federal Trade Commission. The DOJ has traditionally had jurisdiction overmergers among financial services providers.
The DOJ applies a structural screen to mergers and closely examines those mergers that violatethis screen. The screen is stated in terms of the level of the Herfindahl-Hirschman index (HHI)and the change in this index resulting from the proposed merger.301 In most industries, mergersare examined closely if they would increase the HHI by more than 100 points to a level above1000 or by more than 50 points to a level above 1800. In banking, the DOJ applies a morelenient standard, requiring an increase in the HHI of over 200 to a level above 1800 to conduct amore thorough review. This relaxed standard for banking is meant to reflect the competitionbanks face from non-bank financial institutions that are not included explicitly in the HHIcalculation. US antitrust authorities define banking markets as clusters of services offered bybanks to all customers (Federal Reserve Board) or to small businesses (DOJ).302 It is implicit inthese definitions that markets for products supplied to large businesses are geographicallylarger. These wholesale markets may also be narrower in product space since large firms mayfind it easier to purchase individual products from different suppliers. US antitrust authoritieshave not actively challenged mergers in the securities or insurance industries, and thus have nottaken a formal position on the product or geographic markets in these industries. There is noexemption for mergers among firms under any size threshold.
301 The HHI is the sum of the squares of the market shares of all firms in the market, with the market sharesmeasured as percentages.
302 See Amel (1997).

297
Mergers among banks are also subject to review by federal bank regulators and by stategovernments. The three federal bank regulatory agencies tend to use the same structuralstandards as the DOJ, though they differ in the weight they give to factors that may mitigate thestructural effects of mergers. State Attorneys General rarely challenge mergers among financialinstitutions.
Implementation
Most large US bank mergers have involved both expansion into new geographic regions and in-market, horizontal effects in some local banking markets. In most cases, the merging partieshave been willing to divest branches in those local markets in which structural changes wouldbe so great as to cause concerns to antitrust enforcement agencies. Thus, structural effects oflarge bank mergers generally have not been so large as to cause competitive effects in localbanking markets. In those rare cases in which smaller mergers have substantially increasedconcentration, there have been adverse effects on prices.303
303 See Prager and Hannan (1998).

298
Annex V.2Case studies
The UBS merger
The merger was announced on 12 January 1998. On 2 February the Federal CompetitionCommission decided to open a regular investigation. On 20 April the Commission cleared themerger subject to some conditions.
The Commission investigated the markets for mortgage loans and commercial loans. It reachedthe conclusion that the merger would not affect competition in the mortgage loan market sincethe new UBS was expected to face strong competition from either local banks or Credit Suisse.For the commercial loan market, the Commission restricted the investigation to loans of up toCHF 2 million.
Considering the geographic market, the Commission defined the markets for loans to small andmedium-sized firms as regional markets, which roughly coincided with Swiss cantons. TheCommission focused its investigation on eight regional markets where the new UBS marketshare would be above 30% and found that the countervailing power of customers was weak inthose markets. Furthermore, it was possible that the merger could lead to a collusive dominantposition. Thus, the Commission imposed the following remedies to stimulate competition:(i) UBS had to divest, upon approval by the Commission, 25 branches distributed overSwitzerland as well as two subsidiary banks; (ii) Corporate credit facilities cumulated in thenew bank but not exceeding CHF 4 million had to be maintained until the end of 2004; and(iii) UBS was not allowed to give up membership in several joint ventures with other Swissbanks for several years.
The sale of branches turned out to be difficult. No single buyer could be found. Eventually,Migros Bank and Coop Bank (two banks belonging to the two major food and non-foodretailers) each bought 11 branches, and three other branches were sold to three regional banks.
The merger of Banco Bilbao with TelefonicaIn February 2000, the Spanish Banco Bilbao Vizcaya Argentaria (BBV) announced an alliancewith Telefonica, the largest Spanish telecom company, in order to develop online banking ande-commerce services for the Spanish-speaking world. This alliance covers a series of jointventures linked to internet-based financial services. The move is similar to recent “new-technology” alliances between AOL and Time Warner and Vodafone, AirTouch and BSCH.
The Spanish antitrust authority has investigated the case and required that the new grouprestructure, amongst others, its media holdings.
BSCH/ChampalimaudOn 3 August 1999, the European Commission approved an agreement by which BancoSantander Central Hispano (BSCH)304 would have acquired control over the Portuguesefinancial group Champalimaud. The Portuguese authorities had opposed the plannedconcentration by a decision taken on 18 June 1999, based on the need to protect nationalinterests and strategic sectors of the national economy.
304 Banco Santander Central Hispano is the leading Spanish bank. It was created through the merger of BancoSantander and Banco Central Hispano at the beginning of 1999.

299
The Commission was concerned that the decision of the Portuguese authorities was not justifiedon prudential grounds and therefore violated EU rules on freedom of establishment and the freemovement of capital. It decided therefore to open formal infringement proceedings againstPortugal. It also took action against the Portuguese measures by two decisions based on the ECMerger Regulation that grants the Commission exclusive powers to assess consolidationshaving a Community dimension. With the first decision of 20 July 1999, the Commissionrequested the suspension of the decision by the Portuguese Minister of Finance to oppose theoperation and the measures deriving therefrom, such as the suspension of voting rights of BSCHand Champalimaud in Mundial Confiança, because the Portuguese authorities had failed tonotify their decision to the Commission. With the second decision adopted on 20 October, theCommission indicated that the measures of the Portuguese authorities could not be regarded asprotecting legitimate interests within the meaning of the Merger Regulation and were thusincompatible with Community law. The Portuguese authorities challenged both Commissiondecisions before the Court of Justice and did not comply with the Commission’s request tosuspend their decision to oppose the acquisition.
Subsequently, BSCH and Champalimaud concluded a new agreement which replaced theprevious one and according to which BSCH acquired Banco Totta & Açores and Banco deCrédito Prédial Português belonging to the Champalimaud group. This new agreement wasreported to the Commission on 29 November 1999, and authorised by the Commission on11 January 2000, and was not opposed by the Portuguese authorities.
The Champalimaud case is important for Community law and the business community as itreaffirmed the exclusive jurisdiction of the Commission for mergers having a Communitydimension. This case also raised the question of the application and interpretation of “prudentialrules” in consolidations in the banking sector. Under the Second Council Directive 89/646/EECof 15 December 1989, on the coordination of laws, regulations and administrative provisionsrelating to the taking up and pursuit of the business of credit institutions, a potential buyer of aqualifying holding in a credit institution has to inform the competent authorities of the memberstate. The competent authorities have three months to oppose such a plan if, in view of the needto ensure sound and prudent management of the credit institution, they are not satisfied as to thesuitability of the potential acquirer. In the Champalimaud case, the Commission made clear thatany intervention by member states concerning mergers that have a Community dimension andtherefore fall within Commission jurisdiction, has to be reported to the Commission and has tobe based on one of the recognised “legitimate interests” (public security, plurality of the mediaand prudential rules) mentioned in the Merger Regulation. The Portuguese authorities wereconsidered to fall short on both of these accounts.
CGU/Norwich UnionThe merger of the two British-based insurance companies was announced on 21 February 2000and reported to the European Commission on 15 March 2000. After examination, theCommission cleared the merger on 13 April 2000, concluding that the reported agreement,which had a Community dimension, was compatible with the common market and with thefunctioning of the European Economic Area agreement.
CGU provided all classes of general insurance and life insurance throughout the world. Themain activities of Norwich Union were the provision of general insurance, life insurance andpension and investment products. Both had activities in the United Kingdom, Ireland,continental Europe, North America and Australia. However, the only member states in whicheither party had a significant market presence and where there was a significant overlap betweenthe parties’ activities were the United Kingdom and Ireland, where the new entity would havebecome the largest insurer in the general insurance sector.
The Commission practice of defining the relevant product market in the insurance sector is tomake a distinction between general insurance, life insurance and reinsurance. General and lifeinsurance can be divided into as many product markets as there are different kinds of risks
300
covered. However, in the assessment of this case as on several other occasions, the Commissiondid not deem it necessary to define conclusively the relevant product and geographic market.This was possible because the Commission concluded that, even when applying the narrowestmarket definition, the consolidation would not have created or strengthened a dominant positionas a result of which effective competition would have been significantly impeded.
Having examined the various market segments of the United Kingdom and Irish generalinsurance sector, the Commission concluded that the combined entity would face strongcompetition across all lines of business from a significant number of well establishedcompetitors with comparable financial strength including Allianz, AXA, Royal & Sun andEagle Star (Allied Zurich). Moreover there would also be a number of strong companies, inparticular brokers and financial institutions, active in the distribution channels, creatingcompetitive pressures for insurers.
Fortis/G-Bank
On 24 June 1998, the Commission cleared the acquisition by Fortis group, the Belgian-Dutchinsurance and banking group, of the whole of Generale Bank, the largest Belgian bank alsoactive in life and non-life insurance.
The integration of Generale Bank and Fortis would create an international conglomerate activein banking and insurance and operating mainly in Belgium and the Netherlands, with relativelyhigh market shares in Belgium. However, the Commission authorised the deal, taking intoconsideration that there would remain strong competitors in Belgium both in banking(BBL/ING, Kredietbank, Bacob) and in insurance (Groupe Royale Belge, AXA, Assubel/AGF,SMAP).
In its assessment of the merger, the Commission regarded the relevant geographic market asbeing national in scope for retail banking and for small and medium-sized corporate clients, andinternational for large corporate clients and for financial markets. Nevertheless it consideredthat certain assets of the merging companies, such as the strength of their distribution network,needed to be analysed at a smaller level, that is on a regional or local level. As strong marketoverlaps existed in Belgium, the Commission examined the network effect of the merger in allthe Belgian provinces and regions. Even though the new entity would have the strongest marketnetwork in Belgium, the Commission concluded that this would not confer on it a dominantposition since consumers would have sufficient competing banking outlets at hand. In itsassessment, the Commission also ruled that the existence of electronic cash dispensers,electronic banking and telephone banking minimised the effect of any strong position in thisrespect.
Generali/INA
On 12 January 2000, the Commission cleared, subject to a number of commitments given by theparties concerned, the proposed acquisition by Generali, a company active in the insurancesector both in Italy and abroad, of INA, one of the largest Italian insurers. According to thecommitments, Generali would divest its controlling stakes in three subsidiaries active in the lifeinsurance sector, its shareholding in Fondiaria and INA’s controlling interests in BNL Vita andBanco di Napoli. Moreover, Generali would eliminate the interlocking directorships betweenthe Board of Directors and Executive Committee of INA and reduce significantly those betweenits own Board and Executive Committee.
In investigating this case, the Commission cooperated closely with the Italian AntitrustAuthority and with ISVAP, the Italian surveillance authority in the insurance sector. As regardsthe substantive aspects of the case, the Commission found that the consolidation, as originallyproposed, could have led to the creation or strengthening of a dominant position in the Italianlife insurance sector. The combined entity’s market power would have been fostered by thestrength of its distribution network, which is the main driver of competition in the insurance

301
sector. The new group would have been stronger than its competitors in the most importantdistribution channels, ie in the agency and banking channels. As regards the latter, theCommission’s preliminary investigation indicated that this channel has grown rapidly in the lastfew years. About 70% of new policies concluded in 1999 were estimated to have been soldthrough banks. The merged entity would have controlled approximately one quarter of theexisting bank outlets in Italy.
Bank Austria/Creditanstalt-BankvereinOn 11 March 1997, the Commission approved the acquisition of Creditanstalt-Bankverein byBank Austria Aktiengesellschaft, following undertakings given by Bank Austria that eliminatedthe identified competitive concerns. Bank Austria and Creditanstalt were both universal banksthat had their main focus of activity in Austria. Measured by the balance sheet total, the newentity would have been approximately five times larger than the next largest Austrian bank.
In assessing the implications of the proposed consolidation, the Commission found that, afterthe merger, the new entity would not only have been the leading supplier of banking services inAustria, but also the only bank with significant market shares in all relevant product segments.The Commission also found that, both in consumer and business customer banking services inAustria, the parties (together with GiroCredit, in which Bank Austria had a major holding) wouldhave attained significant market shares. These would have been several times higher than those ofthe next largest competitor in a number of product segments, including credit business, stocks andshares and deposits. In addition to the high market shares, the Commission considered that Austrianbanking markets were characterised by market access barriers that, in retail banking in particular,resulted from the need to be present locally through an extensive network of branches. It heldthat consumers usually maintained a link with only one bank because they incurred bothinformation and transaction costs when changing banks. The mobility of bank customers wasconsidered to be further reduced by the fact that maintaining several banking links, and dividingdeposits between banks, reduces the chances of getting a loan. The Commission also consideredthat the foreign banks active in Austria had, despite many years’ presence in some cases,achieved only very small market shares and were collectively too insignificant to be able toexert a decisive competitive influence in the medium term. Further competitive concernsstemmed from the addition of the holdings of Bank Austria and Creditanstalt in the specialisedbanks Österreichische Kontrollbank (OeKB) and Österreichische Investitionskredit AG, twoinstitutions active in the public interest (ie export insurance, financing and processing andsubsidised lending). The Commission thought therefore that there was a risk of the creation orreinforcement of a dominant position.
In order to meet the competition concerns expressed by the Commission, the parties offered certaincommitments. Bank Austria agreed to sell its stake in GiroCredit. In addition, it undertook toreduce the global participation of Bank Austria and Creditanstalt in OeKB to the level ofparticipation that Bank Austria and GiroCredit held together prior to consolidation. Furthermore,Bank Austria agreed not to extend its influence in Investkredit beyond the level of influence that ithad, together with GiroCredit, prior to the concentration. These undertakings were consideredappropriate to completely resolve the competitive concerns raised by the Commission and led to theapproval of the proposed merger in its modified form.

302
References
Akhavein, Jalal D, Allen N Berger and David B Humphrey (1997): “The Effects ofMegamergers on Efficiency and Prices: Evidence from a Bank Profit Function”, Review ofIndustrial Organisation, 12, 95-139.
Allen, Linda and Anoop Rai (1996): “Operational Efficiency in Banking: An InternationalComparison”, Journal of Banking and Finance, 18 (6), 655-672.
Altunbas, Yener and Philip Molyneux (1996): “Economies of Scale and Scope in EuropeanBanking”, Applied Financial Economics, 6 (4), 367-375.
Altunbas, Yener, Philip Molyneux, and John Thornton (1997) “Big-Bank Mergers in Europe:An Analysis of the Cost Implications”, Economica 64 (264), 317-329.
Amel, Dean F (1997): “Antitrust Policy in Banking: Current Status and Future Prospects”,Proceeding of a Conference on Bank Structure and Competition, Federal Reserve Bank ofChicago, May 1997, pp 166-179.
Amihud, Y and G Miller (editors), (1998): Bank Mergers and Acquisitions, Kluwer AcademicPublishers, Boston.
Angelini, Paolo and Nicola Cetorelli (1999): “Banking Competition and Regulatory Reform:The Case of the Italian Banking Industry”, Federal Reserve Bank of Chicago, Working PaperNo 32.
Avery, R and K Samolyk (1999): “Bank Consolidation and Small Business Lending Patterns”,mimeo Federal Reserve Board and FDIC.
Bain, Joe S, (1956): Barriers to New Competition, Harvard University Press, Cambridge.
Bajtelsmit, Vickie L and Raja Bouzouita (1998): “Market Structure and Performance in PrivatePassenger Automobile Insurance”, Journal of Risk and Insurance, 65, 503-514.
Barbash, B P (1998): “Mutual Fund Consolidation: Challenges for the Future”, speech by SECstaff to the Mutual Fund and Investment Management Conference on 23 March.
Barth, J, D Nolle and T Rice (1997): “Commercial Banking Structure, Regulation andPerformance: An International Comparison”, Office of the Comptroller of the Currency,Working Paper 6.
Baumol, William J (1995): “Economies of scale in Financial Activities”, The New Palgrave’sDictionary of Money and Finance, 726-728.
Baumol, William J, Michael F Koehn, Stephen M Goldfeld and Lilli A Gordon (1990): “TheEconomics of Mutual Funds Markets: Competition Versus Regulation”, Rochester Studies inEconomics and Policy Issues, Kluwer, Boston.
Baumol, William J, John C Panzar and Robert D Willig (1982): Contestable Markets and theTheory of Industry Structure, New York, Harcourt Brace Jovanovich.
Berger, Allen N (1998): “The Efficiency Effects of Bank Mergers and Acquisitions: APreliminary Look at the 1990s Data”, in Bank Mergers and Acquisitions, Y Amihud and GMiller eds, Kluwer Academic, Boston, 79-111.
Berger, Allen N, S D Bonime, L G Goldberg and L J White, (1999): “The Dynamics of MarketEntry: The Effects of Mergers and Acquisitions on De Novo Entry and Small Business Lendingin the Banking Industry”, Finance and Economics Discussion Series, Board of Governors of theFederal Reserve System.
Berger, Allen N, David J Cummins, Mary A Weiss and Hongmin Zi (2000): “Conglomerationversus Strategic Focus: Evidence from the Insurance Industry”, Board of Governors of theFederal Reserve System.
303
Berger, Allen N, R Demsetz, and P Strahan (1999): “The Consolidation of the FinancialServices Industry: Causes, Consequences, and Implications for the Future”, Journal of Bankingand Finance, 23, 2-4: 135-194.
Berger, Allen N and Robert De Young (2000): “The Financial Performance of Cross-RegionalCommercial Banks in the US: Some Clues Regarding the Eventual Structure of a ConsolidatingIndustry”, Board of Governors of the Federal Reserve System.
Berger, Allen N, Robert De Young, Genay Hesna and Gregory F Udell (1999): “Globalisationof Financial Institutions: Evidence from Cross-Border Banking Performance”, Federal ReserveBank of Chicago, Working Paper 99-25.
Berger, Allen N, Diana Hancock and David B Humphrey (1993): “Bank Efficiency Derivedfrom the Profit Function”, Journal of Banking and Finance, 17 (2-3), 317-347.
Berger, Allen N, and Timothy H Hannan (1989): “The Price-Concentration Relationship inBanking”, Review of Economics and Statistics, 71, 291-299.
Berger, Allen N, Gerald A Hanweck and David B Humphrey (1987): “Competitive Viability inBanking: Scale, Scope and Product Mix Economies”, Journal of Monetary Economics, 20 (3),501-520.
Berger, Allen N and David B Humphrey (1992): “Measurement and Efficiency Issues inCommercial Banking”, in Output Measurement in the Service Sectors, Zvi Griliches ed, NBERStudies in Income and Wealth, Vol 56, University of Chicago press, Chicago and London, 245-279.
Berger, Allen N and David B Humphrey (1997): “Efficiency of Financial Institutions:International Survey and Directions for Future Research”, Board of Governors of the FederalReserve System, Finance and Economics Discussion Paper Series, No 11, February 1997.
Berger, Allen N, David B Humphrey and Lawrence B Pulley (1996): “Do Consumers Pay forOne-Stop Banking? Evidence from an Alternative Revenue Function”, Journal of Banking andFinance, 20 (9), 160-201.
Berger, Allen N, A Kashyap and J Scalise (1995): “The transformation of the US bankingindustry: What a long, strange trip it’s been”, Brookings Papers on Economic Activity (2), 55-218.
Berger, Allen N and Loretta J Mester (1997): “Inside the Black Box: What Explains theDifferences in the Efficiencies of Financial Institutions?”, Journal of Banking and Finance, 21,p 895-947.
Berger, Allen N, A Saunders, J Scalise and G Udell (1998): “The effects of bank mergers andacquisitions on small business lending”, Journal of Financial Economics, 50, 187-229.
Berger, Allen N and G Udell (1996a): “Relationship Lending and Lines of Credit in Small FirmFinance”, Journal of Business, 68 (July): 351-82.
Berger, Allen N and G Udell (1996b): “Universal Banking and the future of small businesslending”, in A Saunders and I Walter, eds, Financial System Design: The Case for UniversalBanking, Burr Ridge, IL, Irwin, 559-627.
Bernheim, B. Douglas and Michael D. Whinston (1990): “Multimarket Contact and CollusiveBehaviour”, Rand Journal of Economics, 21, 1-26.
Bonaccorsi di Patti, Emilia, and Giovanni P Dell’Ariccia (2000): “Bank Competition and FirmCreation”, mimeo Bank of Italy and IMF.
Bonaccorsi di Patti, Emilia and Giorgio Gobbi (2000): “The Effects of Bank Consolidation onSmall Business Lending: Evidence from Market and Firm Data”, mimeo Banca d’Italia.
Bonanni, C, J Dermine, and L H Roller (1998): “Some Evidence on Customer ‘Lock-In’ in theFrench Mutual Funds Industry”, Applied Economics Letters, 5 (5), 275-279.

304
Carow, Kenneth A (1999): “Evidence of Early-Mover Advantages in Underwriting Spreads”,Journal of Financial Services Research, 15 (1), 37-55.
Chen, Hsuan-Chi and Jay R Ritter (2000): “The Seven per Cent Solution”, Journal ofFinance, 55 (3), 1105-1131.
Chidambaran, N K, Thomas A Pugel and Anthony Saunders (1997): “An Investigation of thePerformance of the US Property-Liability Insurance Industry”, Journal of Risk andInsurance, 64, 371-381.
Clark, Jeffrey A. and Thomas F Siems (1997): “Rethinking Bank Efficiency and Regulation:How Off-Balance Sheet Activities Make a Difference”, Financial Industry Studies, Dec 1997,1-12.
Cornett, Marcia Millon and Hassan Tehranian (1992): “Changes in Corporate PerformanceAssociated With Bank Acquisitions”, Journal of Financial Economics, 31 (2), 211234.
Costanzo, Chris (2000): “Internet-Only a Hard Sell, Says Canada’s Royal Bank”, AmericanBanker, 15 March 2000.
Cummins, J David, Sharon Tennyson and Mary A Weiss (1999): “Consolidation and Efficiencyin the US Life Insurance Industry”, Journal of Banking and Finance, 23, 325-357.
Cummins, J David and Mary A Weiss (1993): “Measuring Cost Efficiency in the Property-Liability Insurance Industry”, Journal of Banking and Finance, 17 (2-3), 463-482.
Cummins, J David and Hongmin Zi (1998): “Comparison of Frontier Efficiency Methods: AnApplication to the US Life Insurance Industry”, Journal of Productivity Analysis, 10 (2), 131-152.
Cybo-Ottone, Alberto and Maurizio Murgia (2000): “Mergers and Shareholder Wealth inEuropean Banking”, Journal of Banking and Finance, 24 (6), 831-859.
Day, Kathleen (2000): “Web-Only Banks Start to Get Real”, The Washington Post, 31 March2000.
De Bandt, Olivier, and E Philip Davis (1999): “A Cross-Country Comparison of MarketStructures in European Banking”, European Central Bank Working Paper No 7.
De Bonis, Riccardo and Annalisa Ferrando (1997): “Da Che Cosa Dipendono i Tassi d’Interessenelle province”, Banca d’Italia, Temi di Discussione n. 319.
De Bonis, Riccardo and Annalisa Ferrando (2000): “The Italian Banking Structure in the 1990s:Testing the Multi-Market Contact Hypothesis”, Economic Notes, 29 (2), 215-241.
De Young, Robert (1997): “Bank Mergers, X-Efficiency and the Market for Corporate Control”,Managerial Finance, 23, 32-47.
De Young, Robert (1998): “De Novo Banks and Lending to Small Businesses: An EmpiricalAnalysis: Comment”, Journal of Banking and Finance, 22 (6-8), 868-872.
De Young, Robert and Daniel E Nolle (1996): “Foreign-Owned Banks in the US: EarningMarket Share or Buying It?”, Journal of Money, Credit and Banking, 28 (4), 622-636.
Delhausse, B, Fabienne Fecher, Sergio Perelman and Pierre Pestieau (1995): “MeasuringProductive Performance in the Non-Life Insurance Industry: The Case of French and BelgianMarkets”, Tijdschrift voor Economie en Management, 40, 47-69.
Demsetz, Rebecca S and Philip E Strahan (1997): “Diversification, Size, and Risk at BankHolding Companies”, Journal of Money, Credit and Banking, 29 (3), 300-313.
Dermine, Jean (1999): “The Economics of Bank Mergers in the European Union: A Review ofthe Public Policy Issues”, OECD Committee on Financial Markets.
305
Donni, Olivier and Fabienne Fecher (1997): “Efficiency and Productivity of the InsuranceIndustry in the OECD countries”, Geneva Papers on Risk and Insurance, 22 (85), 523-535.
Edwards, Corwin D (1955): “Conglomerate Bigness as a Source of Power”, in National Bureauof Economic Research Concentration and Price Policy (Princeton University Press. Princeton).
Egli, Dominik and Bertrand Rime (2000): “The UBS-SBC Merger and Competition in theSwiss Retail Banking Sector”, Studienzentrum Gerzensee, Working Paper 00.02.
European Central Bank (1999): “The Effects of Technology on the EU Banking Systems”.
European Commission, Fifth Report “Enterprises in Europe”, Luxembourg.
Fecher, Fabienne, Sergio Perelman and Pierre Pestieau (1991): “Scale Economies andPerformance in the French Insurance Industry”, Geneva Papers on Risk and Insurance, 16 (60),315-326.
Focarelli, Dario (1992): “Economie di Scala e della Diversificazione Produttiva nel SettoreAssicurativo”, Rivista di Politica Economica, 82 (4), 23-44.
Focarelli, D, F Panetta and C Salleo (1999): “Why Do Banks Merge?”, Bank of Italy, Temi diDiscussione n. 361.
Fuentes Ignacio and Teresa Sastre (1998): “Implications of Restructuring in the BankingIndustry: The Case of Spain”, BIS Conference Papers, Vol 7, 98-120.
Fukuyama, Hirofumi (1997): “Investigating Productive Efficiency and Productivity Changes ofJapanese Life Insurance Companies”, Pacific Basin Finance Journal, 5 (4), 481-509.
Gande, Amar, Manju Puri and Anthony Saunders (1999): “Bank Entry, Competition, and theMarket for Corporate Securities Underwriting”, Journal of Financial Economics, 54(2), 165-95.
Gardner, Lisa A and Martin F Grace (1993): “X-Efficiency in the US Life Insurance Industry”,Journal of Banking and Finance, 17 (2-3), 497-510.
Goldberg, L G, G A Hanweck, M Keenan, and A. Young, (1991), “Economies of Scale andScope in the Securities Industry”, in Journal of Banking and Finance, 15.
Goldberg, L, and L White (1998): “De Novo Banks and Lending to Small Businesses: AnEmpirical Analysis”, Journal of Banking and Finance, 22, 851-867.
Grace, Martin F and Stephen G Timme (1992): “An Examination of Cost Economies in the USLife Insurance Industry”, Journal of Risk and Insurance, 59 (1), 72-103.
Gual, Jordi (1999): “Deregulation, Integration and Market Structure in European Banking”,Unpublished paper, University of Navarra.
Hannan, Timothy H (1991): “Bank Commercial Loan Markets and the Role of MarketStructure: Evidence form Surveys of Commercial Lending”, Journal of Banking andFinance, 15, 133-149.
Hannan, Timothy H (1997): “Market Share Inequality, the Number of Competitors, and theHHI: An Examination of Bank Pricing”, Review of Industrial Organisation, 12, 23-35.
Hannan, Timothy H and Allen N Berger (1991): “The Rigidity of Prices: Evidence form theBanking Industry”, American Economic Review, 81, 938-945.
Hannan, Timothy H and J Nellie Liang (1993): “Inferring Market Power from Time-SeriesData: The Case of the Banking Firm”, International Journal of Industrial Organisation, 11,205-218.
Hannan, Timothy H and Philip E Strahan (2000): “Are Bank Loan Markets Really Local?”,Unpublished paper, Federal Reserve Board and Federal Reserve Bank of New York.

306
Hannan, Timothy H and John D Wolken (1989): “Returns to Bidders and Targets in theAcquisition Process: Evidence from the Banking Industry”, Journal of Financial ServicesResearch, 3 (1), 5-16.
Hanweck, Gerald A and Arthur M B Hogan (1996): “The Structure of the Property/CasualtyInsurance Industry”, Journal of Economics and Business, 48 (2), 141-155.
Haynes, Michelle and Steve Thompson (1999): “The Productivity Effects of Bank Mergers:Evidence from the UK Building Societies”, Journal of Banking and Finance, 23 (5), 825-846.
Houston, Joel F and Michael D Ryngaert (1994): “The Overall Gains From Large BankMergers”, Journal of Banking and Finance, 18 (6), 1155-1176.
Houston, Joel F and Michael D Ryngaert (1997): “Equity Issuance and Adverse Selection: ADirect Test Using Conditional Stock Offers”, Journal of Finance, 52 (1), 197-219.
Hughes, Joseph P and Loretta J Mester (1998): “Bank Capitalisation and Cost: Evidence ofScale Economies in Risk Management and Signaling”, Review of Economics andStatistics, 80 (2), 314-325.
Hunter, William C, Stephen G Timme and Won-Keun Yang (1990): “An Examination of CostSub-Additivity and Multiproduct Production in large US Banks”, Journal of Money, Credit andBanking, 22 (4), 1990, 504-525.
JP Morgan (2000): Online Finance Europe, 2 June 2000.
Jayaratne, J and J Wolken (1999): “How important are small banks to small business lending?New evidence from a survey of small firms”, Journal of Banking and Finance, 23, 427-458.
Julavits, Robert (2000a): “Mortgage.com Quits Marketing to Consumers, Targets Firms”,American Banker, 2 March 2000.
Julavits, Robert (2000b): “Studies: People Unwilling to Close Loans On-Line”, AmericanBanker, 10 March 2000.
Kaye, Geraldine (1991): “Economies of Scale in U.K: Life Insurance Companies: An EmpiricalApproach”, Geneva Papers on Risk and Insurance, 16 (60), 302-314.
Kwast, Myron L, Martha Starr-McCluer and John D. Wolken (1997): “Market Definition andthe Analysis of Antitrust in Banking”, The Antitrust Bulletin, 42, 973-995.
Lang, Gunter and Peter Welzel (1998): “Technology and Cost Efficiency in Universal Banking;A ‘Thick-Frontier’ Analysis of the German Banking Industry”, Journal of ProductivityAnalysis, 10 (1), 63-84.
Latzko, David A (1999): “Economies of Scale in Mutual Fund Administration”, Journal ofFinancial Research, 22 (3), 331-339.
Linder, Jane C and Dwight B Crane (1993): “Bank Mergers: Integration and Profitability”,Journal of Financial Services Research, 7 (1), 35-55.
MacKay, H (1998): The Task Force on the Canadian Financial Services Sector.
Mahajan, Arvind, Nanda Rangan and Ashgar Zardkoohi (1996): “Cost Structures inMultinational and Domestic Banking”, Journal of Banking and Finance, 20 (2), 238-306.
McAndrews, James (1995): “Antitrust Issues in Payment Systems: Bottlenecks, Access andEssential Facilities”, Federal Reserve Bank of Philadelphia, Business Review,September/October.
McFetridge, Donald (1998), “Competition Policy Issues”, Task Force on the Future of theCanadian Financial Services Sector (Ottawa, September).
Mester, L J (1999): “Banking Industry Consolidation: What’s a Small Business to Do?”,Business Review, Federal Reserve Bank of Philadelphia January/February, 3-15.
307
Noulas, Athanasios G, Subash C Ray, and Stephen M Miller (1990): “Returns to Scale andInput Substitution for Large US Banks”, Journal of Money, Credit and Banking, 22 (1), 94-108.
OECD (1998): “Competition and Related Regulation Issues in the Insurance Sector”,DAFFE/CLP (98) (20).
Pagano M, F Panetta and Zingales, L, (1998): “Why Do Firms Go Public?”, Journal ofFinance, 53-1, 27-64.
Pearson, Michael (1998): “Mergers and Acquisitions in Financial Services: A Global Analysisof M&As and Corporate Strategies in the 1990s”, Lafferty Publications Ltd., Dublin.
Peek, J and E.S. Rosengren (1998): “Bank Consolidation and Small Business Lending: It’s NotJust Bank Size That Matters”, Journal of Banking and Finance, 22, 799-819.
Peristiani, Stavros (1997): “Do Mergers Improve the X-Efficiency and Scale Efficiency of USBanks? Evidence from the 80s”, Journal of Money, Credit and Banking, 29 (3), 326-337.
Petersen, M A (1999): “Banks and the Role of Lending Relationships: Evidence from the USExperience”, mimeo Kellogg School of Management, Northwestern University.
Petersen, M A and R Rajan (1994): “The Benefits of Lending Relationships: Evidence fromSmall Business Data”, Journal of Finance, 49, 3-37.
Petersen, M A and R Rajan (1995): “The Effect of Credit Market Competition on LendingRelationships”, Quarterly Journal of Economics, 110, 407-443.
Pilloff, Steven J (1999): “Multimarket Contact in Banking”, Review of IndustrialOrganisation, 14, 163-82.
Piloff, Steven J and Anthony M. Santomero (1998): “The Value Effect of Bank Mergers andAcquisitions”, in Y Amihud and G Miller, eds: Bank Mergers and Acquisitions (KluwerAcademic Publishers, Boston).
Prager, R A and Hannan, T H (1998), “Do Substantial Horizontal Mergers Generate SignificantPrice Effects? Evidence from the Banking Industry”, Journal of Industrial Economics, 46, 433-52.
Prosperetti, Luigi (1991): “Economies of Scale in Italian Non-Life Insurance”, Geneva Paperson Risk and Insurance, 16 (60), 282-292.
Radecki, Lawrence J (1998): “The Expanding Geographic Reach of Retail Banking Markets”,FRBY Economic Policy Review (June), 15-34.
Rea, J D, B K Reid and Miller K W (1999), “Operating Expense Ratios, Assets, and Economiesof Scale in Equity Mutual Funds”, in Investment Company Institute, Vol 5, No 5, December.
Rees, Ray and Ekkehard Kessner (1999) “Regulation and Efficiency in European InsuranceMarkets”, Economic Policy: A European Forum, 0 (29), 363-392.
Rhoades, Stephen A (1993): “Efficiency Effects of Horizontal (In-Market) Bank Mergers”,Journal of Banking and Finance, 17 (2-3), 411-422.
Rhoades, Stephen A (1996): “Competition and Bank Mergers: Directions for Analysis fromAvailable Evidence”, The Antitrust Bulletin, 41, 689-705.
Rhoades, Stephen A (1998): “The Efficiency Effects of Bank Mergers: An Overview of CaseStudies of Nine Mergers”, Journal of Banking and Finance, 22, 273-91.
Salleo, Carmelo (1999): “Efficiency and Economies of Scale: The Case of Italian Banks”, inEssays in Banking and Corporate Finance, PhD Dissertation, Harvard University.
Sapienza, P (1998), “The effects of bank mergers on loan contracts”, Northwestern UniversityWorking Paper.
308
Shaffer, Sherrill (1994): “Bank Competition in Concentrated Markets”, Federal Reserve Bankof Philadelphia Business Review, March-April 1994, 3-16.
Sharpe, Steven A (1990), “Asymmetric Information, Bank Lending and Implicit Contracts: AStylised Model of Customer Relationships”, Journal of Finance, 45 (4), 1069-1087.
Simons, Katerina and Joanna Stavins (1998): “Has Antitrust Policy in Banking BecomeObsolete?”, New England Economic Review, Federal Reserve Bank of Boston, 13-26.
Snel, Ross (2000): “On-Line Bill Payment Is Falling Short of Promise”, American Banker, 6March 2000.
Srinivasan, Aruna (1992): “Are There Cost Savings from Bank Mergers?”, EconomicReview, 77 (2), Federal Reserve Bank of Atlanta, 17-28.
Swank, Job (1995): “Oligopoly in Loan and Deposit Markets: An Econometric Application tothe Netherlands”, De Economist, 143 (3), 353-366.
Toonkel, Jessica (2000): “Compubank, Failing to Excite Public, Eyes On-Line Service forBusinesses”, American Banker, 3 March 2000.
US Department of Justice and Federal Trade Commission (1992): Horizontal MergerGuidelines.
Vennet, V R (1996): “The Effect of M&As on the Efficiency and Profitability of EC CreditInstitutions”, Journal of Banking and Finance, 20, pp 1531-1558.
Vives, Xavier (1999): “Banking Supervision in the European Monetary Union”, Unpublishedpaper, Institut d’Analisi Economica.
Wallas Committee (1997): “Financial System Inquiry: Final Report”, (Australian GovernmentPrinting Co, Canberra).
Walraven, N (1997): “Small business lending by banks involved in mergers”, Finance andEconomics Discussion Series, 97-25, Board of Governors of the Federal Reserve System.
Walter, I (1999): “The Global Asset Management Industry: Competitive Structure andPerformance”, in Financial Markets, Institutions and Instruments, 8(1).
Whalen, G (1995): “Out-of-state holding company affiliation and small business lending”,Economic and Policy Analysis Working Paper, 95-4, Office of the Comptroller of the Currency(September).
Yuengert, Andrew W (1993): “The Measurement of Efficiency in Life Insurance: Estimates of aMixed Normal-Gamma Error Model”, Journal of Banking and Finance, 17 (2-3), 483-496.
Zhang, Hao (1995): “Wealth Effects of US Bank Takeovers”, Applied FinancialEconomics, 5 (5), 329336.

309
Chapter VI
The effects of consolidation on payment and settlement systems
1. IntroductionThis chapter consists of three sections. Section 2 reviews the types of consolidation identified inChapter I and discusses applications to payment systems. Section 3 provides a review of themain causes of and obstacles to consolidation covered in Chapter II in the context of paymentsystems. Section 4 analyses efficiency, competition, risk and oversight aspects of theconsolidation of the financial industry on payment and settlement systems. The chapter endswith some preliminary conclusions concerning those issues that deserve further considerationfrom a policy perspective.
2. Types of consolidationConsolidation in a payment and settlement context includes both mergers and acquisitions(M&As) and other developments within the financial industry, such as alliances, joint venturesand the outsourcing of payment processing, that result in a higher degree of concentration ofpayment and securities settlement activities. In addition, reorganisation measures withinindividual financial institutions and the consolidation of market infrastructures havesignificantly influenced the structure and dynamics of the payment and securities settlementindustry.
Institutional consolidation
Merger decisions are generally not driven by payment or securities settlement considerations.Nevertheless, M&As often have important implications for payment and securities settlementactivities: they are usually followed by internal reorganisation and consolidation of informationtechnology (IT) infrastructures, payment functions and accounting systems. They may alsostimulate a rationalisation of the payment and securities settlement policy of the banksconcerned.
Specialisation, outsourcing, alliances and joint ventures
Consolidation in the payment and securities settlement industry also occurs through structuraland business developments such as alliances, specialisation, joint ventures and outsourcing. At adomestic level, cooperative joint ventures, outsourcing and specialisation have been thepredominant forces of concentration. At the international level, fewer correspondent banks (dueto industry consolidation) and the emergence of new cross-border infrastructures have been keyfactors.
At the domestic level, cooperational approaches in the G10 countries have a long tradition,particularly in the savings, cooperative and community banking sectors. Small and medium-sized savings and cooperative banks often outsource payment activities or securities-relatedback office activities to sector-specific cooperative interbank clearing mechanisms. In Germany,for example, the savings and cooperative banking sectors have established their own gironetworks based on internally agreed exchange and settlement procedures. In the United States,credit unions often clear some of their payments through a network of so-called corporate credit
310
unions and a central corporate credit union. Corporate credit unions are cooperative entitiesowned by the credit unions and chartered to supply transaction services to the credit unions.Similarly, in the US community banking sector, payment transactions may flow throughbankers’ banks owned by several community banks.
Another domestic development is the emergence in Europe of transaction banks (sometimesalso called “white-label providers”) that specialise in the provision of payment or back officeservices to other banks. These banks are often established as separate legal entities, even whenthey are sponsored by one large bank. This ensures confidentiality of operations, which is animportant condition for being chosen as a service provider by other banks, and leaves open thepossibility for other banks to become shareholders. In the United States, specialised banksknown as bankers’ banks provide a wide array of payment and settlement services to otherbanks.305
Another domestic phenomenon, particularly in the United States, is the outsourcing of paymentand securities clearing to a third party, which may be a bank or a non-bank entity. Banksincreasingly have recourse to such entities, allowing them to specialise in the “sales function”(covering direct relations with customers, including account holding) while outsourcing the“production function”, ie the processing of payments and securities, to third-party serviceproviders. In the United States, for example, the top five non-bank service providers alreadyaccount for nearly 20% of the outsourcing market. Third-party service providers are confidentthat the rapid convergence of financial services providers will increase their business evenfurther in the coming years. These companies forecast that traditional financial institutions, suchas banks, will increasingly focus on offering existing and new products that are in line with theircore competencies rather than expending effort on conquering the more repetitive back officetasks.
At the international level, consolidation is leading to an increasing concentration ofcorrespondent banking306 and custody services307 in a smaller number of large market players.Correspondent and global custody institutions are normally selected by other banks according tothe range of products they offer, the ease of access to their services (including the issue of howthe exchange of payment and securities settlement-related information between the serviceprovider and the customer is handled), the payment and settlement systems in which theyparticipate, their financial standing and their ability to raise liquidity.
The role of traditional correspondent banks is also changing with consolidation. Mostinternational banks have reviewed and reduced the number of nostro accounts they maintainwith other banks and correspondent relationships based on reciprocity are largely being replacedby commercially based relationships, joint ventures or alliances. In addition, the emergence ofcross-border settlement mechanisms, such as TARGET,308 the Euro Banking Association’s(EBA) Euro 1 system and the impending CLS Bank, are eroding the traditional payment“bridging” function of international correspondents. Networks have also been established forthe purpose of making low-value cross-border retail payments in Europe. TIPA, for example, isa network of correspondent banks, mainly from the cooperative banking sector, which hold
305 See “Bankers’ Banks: A Correspondent Alternative for Community Banks”, Camden R Fine, Thesis, StonierGraduate School of Banking, American Bankers Association, June 1992.
306 The term “correspondent banking” describes an arrangement where one bank provides payment and otherservices to another bank. Payments through correspondents are often executed through reciprocal accounts(“nostro” and “loro” accounts), to which standing credit lines may be attached. Correspondent banking servicesare primarily provided across national boundaries.
307 Custody services include the safekeeping and administration of securities and financial instruments on behalf ofothers.
308 The information on TARGET can be found in the annex to this chapter.

311
accounts for each other and which have thereby established a multilateral correspondentarrangement. Via the receiving correspondents, the respective local payment systems can beaccessed. S-Interpay is a network founded in 1994 by the German savings banks to facilitatecross-border retail payments. The system consists of a network of correspondent banks, most ofthem also from the savings bank sector, in different countries.
Economic and monetary union (EMU), for example, has substantially reduced the number ofcorrespondent relationships needed to operate in Europe and, as a result, has accelerated thetrend towards concentration of the correspondent banking business. In Japan some of the largestbanks have gained most of the yen payment and securities settlement business originating fromsmall or medium-sized banks located in the United States and Europe. Similarly, several largeUS banks indicated that they have consolidated their correspondent and custody banks to theextent that they use only one or two local correspondents in each major currency. With regard toglobal custody, the assets held in custody by the 20 largest global custodians increased by morethan 80% between 1996 and 1999.309
Internal consolidationInternal consolidation describes a reorganisation process within an individual financialinstitution (or within a banking group) that leads to the concentration of payment and securities-related processing and back office activities within a few processing centres. This evolution is incontrast with the traditional organisation of major international banks, where payment andsecurities settlement business is distributed among their branches and subsidiaries abroad, eachof them having responsibility for settlements in the local currencies. Large international banksnow tend to concentrate most of their worldwide payment activities in one (or a few) processingcentre(s). The future establishment of the Continuous Linked Settlement (CLS) mechanism,which is intended to limit foreign exchange settlement risks, is likely to support this trend.
In the case of banking groups consisting of legally independent banks controlled by a holdingcompany, consolidation is sometimes achieved by centralising a number of payment-relatedactivities (eg direct access to payment systems, liquidity management for the group as a whole,correspondent banking and custody services) at the holding company or at one of the banks ofthe group. Centralisation of access to large-value payment systems and liquidity managementmay provide significant cost savings as well as greater efficiency in liquidity management.
Furthermore, individual systems, including those that are run by central banks, may be subjectto some form of internal consolidation. For example, in the United States, the IT platformsupporting the Fedwire funds and securities transfer systems has been consolidated from 12district data processing centres and four backup locations into three sites. In the euro area, theEurosystem has started discussions on how to overcome the difficulties related to thefragmented nature of the present TARGET system.
Consolidation of market infrastructuresConsolidation concerns not only financial institutions, but also the market infrastructures formaking payments and settling securities transactions. Market participants are increasinglyseeking to produce interbank payment and securities settlement services in a cost-minimisingapproach, leaving the creation of value added payment services to the commercial relationshipbetween a bank and its customer. In this respect, a global trend towards consolidation isobservable both at the horizontal level (eg the merger of two securities settlement systems) andat the vertical level (eg in the securities industry, the integration of trading, clearing, settlementand custody services within a single institution).
309 Institutional Investor, September 1999, volume 24, issue 9, pp 199-200.

312
Securities settlement in the United States offers a good example of horizontal and verticalconsolidation. First, the Depository Trust Company (DTC), the largest securities depository inUnited States, merged with two regional depositories, the Midwest Securities Trust Companyand the Philadelphia Depository Trust Company, resulting in a single central securitiesdepository (CSD); second, in 1999, DTC and the National Securities Clearing Corporation,which compares and nets almost all broker-to-broker corporate and municipal securities tradesin the United States, affiliated their organisations under a common holding company, theDepository Trust and Clearing Corporation.
In the European Union (EU) the consolidation of the securities settlement industry hasaccelerated since the start of Stage Three of EMU. It is taking place through the merging ofCSDs that operate securities settlement systems. In January 2000 the owners of Cedelbank, theLuxembourg-based international central securities depository (ICSD), and the owners ofDeutsche Börse Clearing, the German CSD, set up a new holding company called ClearstreamInternational, which owns both depository institutions. These have been renamed ClearstreamBanking S.A. and Clearstream Banking AG respectively. The legally separate entities will use acommon technical infrastructure and intend to create a pan-European clearing house. In March2000 the boards of Euroclear, the Belgium-based ICSD, and Sicovam, the French CSD, alsoannounced their agreement in principle to merge fully the two organisations. The agreementstates that Euroclear will take over Sicovam and that it has an option of taking an ownershipinterest of up to 20% in Clearnet, the Paris Bourse’s subsidiary for clearing and netting. In turn,Sicovam will receive a certain share in Euroclear.
Consolidation, in the form of international joint ventures, is also occurring among securitiesclearing organisations. An example is the establishment of the European Securities ClearingCorporation (ESCC). The ESCC is a pan-European clearing house, which was set up byEuroclear and the US Government Securities Clearing Corporation (GSCC) to provide tradecomparison and netting services for European government debt securities. The London ClearingHouse (LCH) has joined this partnership.
3. Causes of and obstacles to consolidation
Causes of consolidationAlthough consolidation in the financial sector is driven by a variety of factors (see Chapter II),two have been the main driving forces behind the consolidation of payment and securitiesprocessing: cost reduction and leveraging specialised business opportunities. For banks, it isbecoming increasingly important that the provision of payment and securities settlementservices is produced at minimal cost due to increased competition as a result of EMU andnationwide banking in the United States. In addition, increased concentration in processingpayments will drive the demand for rationalisation of market infrastructures.
A move towards consolidation of payment and settlement processes, for example, is one naturalconsequence of the European integration process stemming from the introduction of the euro.This integration process will allow banks, whether based in Europe or not, to take full advantageof economies of scale and scope inherent in the payment and settlement business. Major playersin the financial markets, especially, tend to ask for a higher degree of harmonisation of thedifferent domestic systems or even to require a consolidation of infrastructures across borders inorder to save costs. For example, in the securities industry, the introduction of the euro and theelimination of currency risk permit investors to adjust their portfolios by targeting new financialinstruments and markets. The increasing importance of cross-border trades, in turn, has putpressure on service providers to integrate their infrastructures in order to provide cost-efficientmechanisms for the transfer of cash and of securities. An outgrowth of these pressures has beenthe creation of the European Central Securities Depository Association (ECSDA), which islooking at methods of integrating or linking European central securities depositories. As banks

313
globalise, their need for more efficient payment and settlement processes has also manifesteditself in the growing demand for direct remote access310 to payment and settlement systems anda global collateral pool.311
On the business opportunity side, the interviews indicate that, as cross-border mergers occur inorder to diversify business portfolios, international banks also want the ability to offer a widerange of payment and settlement services to sophisticated customers. Such services arecomplementary, and in some cases essential, in order to seize business opportunities in suchareas as asset management, global custody and corporate cash management services.
Closely related to technology investment is the requirement for real-time payment processing.Furthermore, providers of payment and securities settlement services have to accommodaterequests for more sophisticated services, such as intraday (or even real-time) delivery versuspayment (DVP) settlement (ie the simultaneous settlement of the securities leg and the cash legof a securities market transaction), cash management services and related information services.Other requirements stem from the goal to increase processing efficiency through systemsintegration and straight-through processing. The Global Straight Through ProcessingAssociation (GSTPA), for example, is an initiative set up by financial intermediaries composedof broker/dealers, global custodians and investment managers involved in the processing ofcross-border securities trades. The primary objective of the GSTPA is to reduce the risks andcosts of cross-border trade activities by accelerating the flow of cross-border trade informationand reducing the number of failed trades.
On the other hand, technological progress has also reduced processing costs and made manyoptions more affordable to all market participants, irrespective of size. Several intervieweesexpect certain non-bank institutions to provide payment-related services via the internet in thecoming years and thus to become direct competitors of banks.
Obstacles to consolidationIn the field of cross-border consolidation, the political and regulatory environment has thepotential to increase the difficulties facing mergers and internal consolidation of payment andsecurities settlement processes. Certain tax regulations, different legal frameworks (eg withregard to employment law, bookkeeping rules and the nature of the legal title to securities indifferent countries, such as bearer versus registration) and differences in reporting requirementshave been the main impediments to consolidation. A higher degree of harmonisation in thesefields – if desired – would probably not be easy to achieve. Moreover, restrictions concerningdirect remote access to payment and settlement systems or to intraday and overnight centralbank credit (including the issue of locally accepted collateral) often make it necessary for banksto continue to rely on foreign subsidiaries or branches or correspondents in order to have accessto the respective systems.
The existence of non-harmonised internal IT platforms may prevent banks from consolidatingtheir payment and back office activities at fewer locations, whether domestically or cross-border. The general lack of standardisation (with regard to message formats, etc) betweenpayment and settlement systems in different countries causes similar problems. Banks, however,might now be expected to make greater efforts to streamline their internal systems and
310 Direct remote access to an interbank funds transfer system (IFTS) is the ability of a credit institution establishedin one country (“home country”) to become a direct participant in an established IFTS in another country (“hostcountry”) and, for that purpose, to have a settlement account in its own name with the central bank (or, moregenerally, with the settlement agent) in the host country without necessarily having established a legal physicalpresence in the host country.
311 A global collateral pool would contain collateral denominated in several currencies, which would be accepted byseveral central banks for the collateralisation of intraday and/or overnight credit provided to their eligiblecounterparties.

314
procedures given the end of Year 2000 transition efforts, which hampered the consolidationprocess.
On the other hand, advances in information and network technology have also reduced theobstacles to consolidation in the payment and securities settlement industry. Decliningtechnology costs and increasing technological capabilities have allowed for the emergence ofnew payment and settlement processing arrangements. For example, centralised processing andremote access through telecommunications networks have reduced geographical barriers. As aresult, for those banks that have or can attract a critical mass of transactions, the provision ofpayment and securities services can leverage their business opportunities across other bankingservices (eg credit provision, custody services, information services, cash management services,etc). At the international level, specialised correspondent and custodian banks acting on a globalbasis may seek to provide payment and settlement services. For those institutions without acritical mass of transactions, technology has also enabled them to outsource their payment andsettlement activities to other processors that can capture economies of scale. One of the mainadvantages for the outsourcing bank is that it shifts the investment costs (as well as theoperational risk) to the service provider and converts fixed costs to variable costs. In thisrespect, consolidation is a rational outcome made possible by declining technology costs andincreasing technological capabilities.
4. The effects of consolidationThis section analyses the efficiency, competition, risk and oversight aspects of the consolidationof payment and settlement systems. It concentrates on the major issues related to consolidationand does not attempt to describe all possible implications of all the different types ofconsolidation.
Effects on efficiencyConsolidation has an impact on the efficiency of payment and securities settlement since itaffects the way in which these activities are conducted and thus the resources that are used forthe provision of the respective services. A first effect is related to the fact that consolidationtends to lead to a greater concentration of payment and settlement flows among fewer partieswithin the financial sector. For example, in the United States the top five originators ofautomated clearing house (ACH) transactions accounted for 49% of total ACH transactions in1998, compared with only 25% in 1989. At the international level, regional or global banks thatspecialise in correspondent banking are emerging, while banks of a smaller size are tending toabandon this activity, for which the profit margins are shrinking. Evidence from US commercialbanks suggests that concentrations of correspondent deposits have increased over the last fiveyears among both the 10 largest banks and the next 90 largest banks by asset size. By contrast,the share of correspondent deposits at other US banks declined sharply from around 38% in1995 to some 16% in 1999.
As a result of such concentration, a greater number of transactions are internalised within fewerinstitutions. Interbank transactions become intrabank transactions which do not involve externalexchanges of payment messages via an interbank funds transfer system (IFTS) and hence tendto be cheaper to process.312 The degree of payment internalisation, however, is dependent uponfactors such as the type of businesses in which each entity participated prior to theconsolidation, the extent to which the merged institutions consolidate their internal paymentprocessing, and the existing concentration within the market. In Switzerland, for example, two
312 A comprehensive description of, inter alia, the effects of consolidation on payment system efficiency is providedin the text by Berger, Demsetz and Strahan (1999).

315
large banks, prior to their merger, had similar types of businesses and nearly the same dailyturnover in the national real-time gross settlement (RTGS) system. After the merger and theconsolidation of the two RTGS accounts, the turnover of the new institution was roughly thesame size as that of one of the pre-merger banks. The total volume and value of paymentsprocessed in the RTGS system decreased by around 25%. By contrast, owing to the largenumber of depository institutions in the United States, the two largest mergers in the fourthquarter of 1999 reduced the overall average value of daily Fedwire flows by less than 0.4%.
Large banks that have specialised in payment processing now increasingly compete directlywith interbank systems. Large banks have two main advantages over their smaller competitorswith regard to efficiency in payment and securities settlement. First, they typically have thefinancial strength to invest in new, sometimes costly, technologies that may increase efficiencyand reduce risk in payment and securities settlement. Second, their high market share in thepayment business enables them to decrease unit costs by capturing economies of scale. Lowerunit costs may attract additional volume and increase profits. In the case of specialisation andoutsourcing, the market power of the service provider and the contestability of the outsourcingmarket largely determine whether such efficiencies result in lower prices for downstream usersor increased profits for service providers.
Similarly to consolidation in the form of specialisation and outsourcing, internal consolidationmay yield scale efficiencies. The cost savings that financial institutions can realise throughinternal consolidation may sometimes be so great that internal consolidation even becomes analternative to outsourcing. The cost savings through internal reorganisation also apply topayment and settlement systems: for instance, when the Federal Reserve consolidated the ITplatforms that supported Fedwire operations, it was able to eliminate redundant resources andreduce operating costs. These efficiencies permitted dramatic Fedwire fee reductions over athree-year period (a 50% reduction for funds transfers, and a 25% reduction for securitiestransfers). A recent study found substantial long-run benefits in terms of economies of scale andan improvement in the cost efficiency of Fedwire as a result of consolidation, although therewere significant transition costs.313 Consequences of consolidation for the efficiency of apayment system can also be found in a study314 of the Federal Reserve’s costs of processingcheques, ACH transfers and wire transfers. Both electronic services, ACH and Fedwire, werefound to have significant economies of scale. The electronic services have also experiencedrapid technological change over the last five years. This finding is consistent with the rapiddecline in the prices of computer and communications equipment. Cheque processing, on theother hand, has shown little measurable progress over time. This may, in part, have been due tothe fact that easier-to-process items such as payroll cheques may have tended to migrate toACH. The results of both studies may carry over to consolidation of private sector processors.
The concentration of payment and settlement flows within fewer institutions might also lead toincreased efficiency because a reduction in the number of banks can facilitate agreements ontechnical standards and market conventions. In fact, one study found that countries with moreconsolidated banking systems have greater use of electronic payments and attributed this to thegreater ease experienced in agreeing on common standards, technology and the use ofcentralised account information.315 However, there are also examples of countries with a lessconsolidated banking industry where interbank cooperation in the field of payment systems(including standardisation issues) works well owing to the fact that banking associations – orsimilar common entities – have been given a mandate by their member banks to act on theirbehalf in this special area. Furthermore, in cases where a few large institutions dominate the
313 Hancock, Humphrey and Wilcox (1999).314 Bauer and Ferrier (1996).315 Humphrey, Pulley and Vesala (1996).

316
market, each with a legacy system geared to a somewhat different standard, ultimate agreementon common standards and conventions might not be quickly attained.
Finally, financial sector consolidation leads to the emergence of large market players that oftenhave very demanding business needs with regard to the functionality of interbank payment andsettlement systems. This is the case at the domestic level, and even more so at the internationallevel. Global players normally participate in several systems and would thus prefer a higherdegree of cross-system standardisation. The demand for standardisation includes technicalaspects, such as message formats, as well as support for global cash management, DVPprocedures and professional information systems. Thus, under the pressure from global marketplayers, the system operators need to enhance market infrastructures continuously. An exampleof this phenomenon is the efforts of the Federal Reserve, CHIPS and SWIFT over the years tomaintain compatible funds transfer message formats (ie an ability to map fields betweenformats) in order to facilitate straight through processing of cross-system domestic and cross-border payments. With regard to TARGET, in particular large banks operating in several EUcountries request a higher degree of harmonisation of the service provided by the differentRTGS systems participating in TARGET. The requests from these banks range from theharmonisation of message formats to the provision of a uniform service throughout TARGET.Another example is the work undertaken by ECSDA to standardise the procedures andmessages for securities settlement.
Effects on competitionAs described in the previous section, the consolidation processes in the financial industry havethe potential to increase the efficiency of payment and settlement activities. In many cases, thesebenefits come from a reduction in the number of market participants. There might, however, bea limit to concentration beyond which the reduction in the number of institutions involved inpayment and settlement activities results in reduced competition. This may in turn have negativeeffects, such as increased prices for settlement services and lower incentives for innovation.
Consolidation also concerns the number of institutions with access to interbank infrastructures(interbank funds transfer systems, securities settlement systems, etc) and the volume of traffic inthe systems. Should the volumes processed via traditional IFTSs (or the number of participants)decrease substantially, processing fees might have to be increased in order to ensure costrecovery. As a result, smaller participants may face higher fees or be forced to become indirectparticipants in the system via the large participants, running higher credit and liquidity risksthan is currently the case.
The overall effects of consolidation on competition are likely to vary according to the type ofconsolidation being considered (eg consolidation of financial institutions or marketinfrastructures), the definition of the market (ie local, national or global) as well as itscontestability, the extent of existing market concentration, and the legal and policy frameworkgoverning competition.
With regard to the definition of the relevant market, it would, for example, be inappropriate forthe evaluation of the competitive situation in global correspondent banking to assess the marketpower of a global player which is active in that field against one of the smaller, domesticallyoriented institutions in its home market. Depending on how the relevant market has beendefined, the number of banks that are active in that market or their competitive strengths mightdiffer considerably. It is also interesting to note that, as recent developments in the custodybusiness have shown, two institutions can be both partners in some countries and competitors inothers.
As mentioned above, whether consolidation leads to a decrease in competition depends largelyon the contestability of the market. If the market is easily accessible to new entrants and thereare no sunk costs from entry, the incumbent will not be able to reap excessive profits if it wantsto remain in the market. Some of the entry barriers to a market, or barriers to continuingparticipation by smaller participants, may include the criteria for access to payment and

317
settlement systems, the fee structures of interbank systems, high fixed costs, switching costs,compliance costs and critical mass of participants and transaction volume to capture economiesof scale. These considerations may reduce the contestability of the payment processing market.One response to fears about excessive market concentration has been reasonably open andobjective criteria for direct access to interbank facilities.
Most of the banks that were interviewed expect that, despite consolidation, competition in theprovision of payment and settlement services will increase in the coming years. One of thereasons is that an increasing number of banks and non-banks are establishing transaction banksintended to act as new third-party service providers. In addition, the possibilities offered by theinternet and other technological advances will lower the cost barriers to entering the processingbusiness, and will probably increasingly foster disintermediation of the traditional bankingactivities, leading to a more pronounced distinction between “sales banks” and “productionbanks”. In general, market participants expect competition to be more intense in the fields ofservice level and innovation than in the field of pricing policy. Non-price features are, however,often difficult to compare across organisations, so it is difficult to assess the degree ofcompetition in a specific market.
Despite these market expectations, policymakers should be aware that competition is a dynamicprocess. Competition effects observed over the short term may not be indicative of competitionover the longer term. In particular, an increase in competition as a result of consolidation mayexist only for an interim period. The picture may change once the market situation has becomemore stable and the remaining institutions exercise their market power. In short, policymakersshould always make sure that a market is contestable.
In this framework, consolidation among payment and settlement infrastructures may represent aspecial, albeit complex, case. Consolidation among infrastructure systems seems to be drivenlargely by economies of scale, network effects, and consolidation in the banking industry. Forexample, banking consolidation increases the likelihood of common membership between twosystems. To the extent that two systems have common membership, those common membersmay seek to achieve cost savings by consolidating systems. These cost savings would arise fromelimination of redundant costs and economies of scale. In addition, consolidation wouldprobably expand the network of participants served by the system and provide a larger financingbase for investments in new products and technologies. Three policy views of systemconsolidation exist in the literature – a competing network model, a public utility model, and amodel for promoting intra-network competition.316 The competing network model is premisedon the assumption of sufficient transaction volume to sustain multiple networks in a region andthat banks have a choice as to which network they can join. Under these assumptions, interbankpayment networks would compete on both a price and non-price basis, thus motivatingefficiency and innovation. The public utility model sees interbank payment systems as essentialfacilities that should have open access in order to provide a level playing field for the provisionof downstream payment services by the participating banks. In the United States, the publicutility model generally exists at the wholesale level for the clearance and settlement of securitiestransactions. Central securities depositories and clearing organisations, for example, are highlyregulated by federal authorities. In a public utility model, efficiency and innovation is achievedthrough greater economies of scale and network effects, and greater investment capacityresulting from network consolidation. The intra-system competition model also assumes openaccess and equitable governance that allows all participants a common infrastructure on whichto base downstream services and products. For example, in ATM networks, consolidation mayenhance competition for retail deposits by allowing small and large banks equal access to alarge number of ATM locations.
316 See Robert Anderson and Brian Rivard: “The Competition Policy Treatment of Shared EFT Networks”, andDavid Balto and James McAndrews: “Joint Venture Payment Networks and Public Policy”, Proceedings of theBank Structure and Competition Conference, Federal Reserve Bank of Chicago.

318
The competitive effects of system consolidation, however, largely depend on such factors as thegovernance structure of the surviving system, access criteria, market demand for downstreamservices, and economies of scale levels. For example, if the governance structure acts to restrictaccess, limit the introduction of innovative services by the system, or implementanticompetitive pricing schemes, then overall competition may be adversely affected.Determining the competitive effects of system consolidation (ie the social welfare effects) is acomplex task requiring the evaluation of highly uncertain costs and benefits.317
The multidimensional effects of consolidation on competition are not limited to retail payments,but also apply to wholesale payments and securities settlement. However, in the latter field,system consolidation seems generally to be regarded as having positive competitive effects. Inthe current restructuring process of the respective European systems, which is, however, a veryspecific case owing to the introduction of the euro only one and a half years ago, most largebanks are in favour of a higher degree of consolidation. In certain fields, such as securitiessettlement and the settlement of foreign exchange transactions, several interviewees evenexpressed their preference for monopolies. With regard to securities settlement systems, sometook the view that it could be useful to separate the business into areas that could be monopolies(eg registration of ownership) and areas where competition might be favourable (eg transfer ofownership). Others were, however, of the opinion that competing utilities would be preferable,since advances in technology increasingly allow the different systems to connect to each other.This connection was seen as an opportunity to combine the advantages of a more integratedgeneral infrastructure with those of competition between different systems.
The overall market infrastructure should always be considered from the standpoint of risk,competitiveness and cost efficiency. The ownership structure and the governance of a specificsystem also play an important role in this respect. In some systems, control is vested in thelargest users. These large users may not be sympathetic to the needs of smaller users. Othersystems may operate on a shared basis or a more representative governance basis. Whether asystem is organised on a profit or non-profit basis may also influence competition effects.
Effects on financial, operational and systemic risk
Consolidation in the financial sector may affect the nature and the size of risks associated withpayment and securities settlement activities in four areas – transparency, scope, concentrationand incentives. These effects may necessitate changes in risk management within individualfinancial institutions and payment and settlement systems, as well as changes in oversight andsupervisory practices.
Settlement risks, for example, may become less transparent as risks shift from rule-basedinterbank systems with relatively open disclosure to large private sector payment serviceproviders with more discretionary credit management practices and less transparency. Criticaloperational “choke points” may shift from well recognised and understood interbank systems toprivate sector firms whose payment and settlement roles may not be recognised fully by marketparticipants or authorities. Risks must be identified and monitored as a first step in riskmanagement. To the degree that consolidation makes settlement risks less transparent tocounterparties and the markets by shifting transactions to private systems, risk management maybe weakened.
On the more positive side, consolidation also has the potential to improve the scope, integrationand coverage of an institution’s settlement risk management across settlement transactions such
317 For opposing views on the effects of ATM network consolidation in the United States, see Elizabeth S Laderman:“The Public Policy Implications of State Laws Pertaining to Automated Teller Machines”, Federal Reserve Bankof San Francisco Economic Review (Winter 1990), and Robin A Prager: “ATM network mergers and the creationof market power”, The Antitrust Bulletin (Summer 1999).

319
as foreign exchange, domestic large-value payments and securities. Some banks, for example,have or intend to implement a single global operations, treasury or risk management centreworking on a 24-hour basis, especially to meet the requirements stemming from the use of theCLS system. Some large international banks, such as Chase, Bankers Trust and Deutsche Bank,already have regional or global centres. Consolidations among institutions may also reduce thenumber of counterparties a large bank must assess for settlement risk purposes, but may alsocomplicate assessment due to the increased complexity of larger, merged institutions.
Chapter III discusses the possibility that consolidation may create firms that may be too large tofail, liquidate, or discipline effectively. One important attribute of such large, complex firms istheir extensive participation in large-value payment and securities settlement systems.Consolidation of payment and settlement activity within such firms will also consolidatesettlement risks (credit and liquidity risks) and operational risk. In particular, those large,complex firms that specialise in trading, settlement, correspondent banking or custody activitiesare likely to be the most intertwined with the global payment and settlement infrastructure andbecome the focal points for much of the settlement activity. The key question, therefore, is: hasconsolidation increased the risk that the failure or operational disruption of a large, complexfirm would be disorderly to the payment or securities settlement systems? Consolidation ofpayment flows among a few major processors may lead to a significant shift of credit risk frominterbank settlement systems that are relatively transparent public utilities to private firms thatare relatively more opaque. In particular, financial firms may be extending to or receiving froma large private sector payment processing firm a significant amount of intraday and overnightcredit. As a consequence, the failure or disruption of a large payment provider in terms of creditrisk could be significant.318 Furthermore, by shifting credit risk from interbank settlementmechanisms to private firms, the financial markets may forgo some of the risk managementbenefits of interbank settlement mechanisms, such as settlement guarantees, backup liquidityfacilities and settlement failure resolution procedures that help to mitigate the effects of creditrisks and buffer systemic shocks.319 In order to properly manage this shift in settlement risk,bank and non-bank service providers need to have well developed securities settlement andpayment risk control mechanisms in place, including adequate liquidity, monitoring of intradayexposures, and counterparty/customer credit and liquidity risk assessments.
With regard to the effects of consolidation on liquidity risk, it is not clear whether positive ornegative effects prevail. For example, as payment flows become more concentrated amongfewer participants, the likelihood of offsetting incoming and outgoing payments for anyparticular participant increases. Therefore, there are indications that concentration may facilitatebanks’ intraday liquidity management and reduce intraday liquidity tensions in a given paymentsystem.
Nevertheless, consolidation may also negatively affect the general liquidity situation in theinterbank market. Should the local money market, for instance, be dominated by one or twobanks, the possibility of disrupting banks’ liquidity management may increase (and, in fact, thedominant participant might also have difficulty investing a large amount of excess reserves inthe local money market), as experience in some countries such as Switzerland has shown. Forexample, if such a major market player fails or, owing to a malfunctioning of its internal IT
318 In the global custody business, the risk situation might be somewhat different, because securities owned bycustomers are typically segregated from the custodians’ own assets. In this case, the customer may be betterprotected in the event of the failure of the custodian than in the case of deposit balances with a settlement agent.
319 The issue of risks within payment and settlement systems has been extensively studied by central banks,especially with regard to RTGS systems, hybrid and net settlement systems, DVP securities settlement systemsand foreign exchange settlements. Several central bank reports have outlined procedures for reducing ormanaging risks in these systems (eg Lamfalussy standards and the Core Principles for Systemically ImportantPayment Systems). See the website of the Bank for International Settlements for a listing of the relevant reports(www.bis.org).

320
systems, is no longer able to process payment orders, this may give rise to serious repercussionsnot only for the liquidity situation of individual market participants which do not receiveexpected incoming funds, but also for the money, capital and foreign exchange markets ingeneral.
A particular consolidation issue at the international level is the emergence of globalcorrespondent banks that participate directly in multiple foreign payment systems and processhigh payment volumes in the respective currencies, but which have only limited liquidityresources (eg collateral) in these currencies. Liquidity problems may arise, especially when fullcollateralisation of central bank credit is required. In the past, these banks usually relied onlocally based correspondents that had ample home country assets to pledge for liquiditypurposes. Some institutions consider the establishment of a multi-country common collateralpool to be a possible solution to this problem. Such a global collateral pool (see footnote 5) mayreduce liquidity cost, since the same collateral could be used for central bank credit in severalcurrencies. In the context of CLS, where banks will have to issue payments in several currenciessimultaneously, a global collateral pool might facilitate their operations considerably.Establishing such a common collateral pool, however, would raise important monetary policy,legal and technical issues which would need to be resolved. Another alternative would be forindividual central banks (or other liquidity providers) to accept a broader range of collateral. Inparticular, instruments denominated in foreign currencies might be accepted, subject to anappropriate haircut to cover currency risk. This is, in fact, the approach being followed in thedevelopment of the US dollar clearing system in Hong Kong, where the settlement institutionproposes to accept certain Hong Kong dollar instruments as collateral for US dollar credit.
Consolidation also affects operational risk. In the short term, banks indicated that operationalrisk tends to increase after a merger of two financial institutions, until the IT platforms of thetwo institutions can be integrated.320 In the longer term, to avoid the liquidity problems linked toa malfunctioning in the internal IT systems of a major player (see above), banks should haverobust backup systems and contingency arrangements that are reviewed and enhanced on anongoing basis. To the extent that consolidation results in the emergence of certain keyoperational “choke points” in the payment system, public authorities may wish to increase theirsupervision and monitoring of financial institutions’ backup systems and contingencyarrangements with an emphasis on the continuity of payment operations.
Finally, consolidation may also affect systemic risk. The stability of the financial system can beendangered when the failure of a financial institution leads to considerable adverse effects onone or several other financial institutions.321 Payment and securities settlement systemsdetermine to an important extent the exposures among and linkages between financialinstitutions, because they provide the technical infrastructure through which market transactionsare settled. Therefore, they are one of the channels through which contagion effects can betransferred through the financial system. One basic premise is that the greater the degree ofconsolidation, the more concentrated payment flows will be among fewer, larger institutionsand the greater the adverse effects on other financial institutions from the failure to settle ofanother financial institution.322 It is not clear, however, what net effect consolidation will haveon the settlement risk profile of individual institutions. As mentioned previously, consolidation
320 In this report, the term “operational risk” mainly refers to major failures of information technology systems. In abroader sense, however, operational risk also includes breakdowns in internal controls and corporate governance.Such breakdowns - which might also be more likely to occur in the restructuring phase after a merger - can leadto financial losses through error, fraud or failure to perform in a timely manner. A detailed analysis of this issue isprovided in the Report on Operational Risk Management of the Basel Committee on Banking Supervision (1998).
321 This is a narrow definition of systemic events or systemic risk. For a comprehensive analysis of the concept ofsystemic risk, see de Bandt and Hartmann (1998).
322 See also Berger, Demsetz and Strahan (1999).

321
may allow institutions to improve their risk management practices by getting a morecomprehensive picture of their settlement exposures across multiple markets and systems.Larger institutions would also have the resources to invest in more sophisticated riskmanagement systems. On the other hand, consolidation may shift payment flows and theirattendant risks from relatively transparent, rule-based interbank systems to more opaque,discretionary private institutions.
Second, it should also be considered that a smaller number of market players might facilitate themonitoring of risks by supervisors and counterparties. On the other hand, the structure of amerged institution may be so complex, at least in the initial period after the merger, that it raisesadditional concerns and makes supervision more difficult (this is especially true for cross-bordermergers). In any case, it is clear that even if consolidation does not necessarily increase theprobability that individual institutions will fail, it makes the consequences of the failure morelikely to have wide-ranging systemic effects.
Third, the rapid changes in the financial markets and organisations as a result of consolidationcoupled with technological changes and the entry of non-banks into payment and settlementactivities might also have systemic risk implications. Supervision of the credit, liquidity andoperational risks posed by non-bank service providers of payment services is still an evolvingissue. Organisational change, unless managed proactively, can pose significant risks.Technology can be a powerful tool or a significant risk, depending on the level of understandingof the issues by management.
Fourth, a shift of settlement activity from interbank settlement mechanisms with risk-adverseobjectives to private sector firms with a more positive risk appetite, in the aggregate, mayincrease systemic risk. The incentives for risk management, particularly under adverse marketconditions, may shift from the collective protection of the clearing house to the protection of anindividual firm. Such a shift in incentives may be destabilising during a market crisis aspayment service providers look to the protection of their firm first. Since robust interbankpayment systems play a role in buffering credit and liquidity shocks by dampening theirtransmission to other market participants, the shock absorber role may be minimised or forgoneas consolidation progresses. To the extent that most payment flows continue to go throughinterbank systems, systemic effects depend largely on the design and the robustness of thepayment system’s risk controls. A payment system can function in a neutral way as a simpletransmitter of contagion effects, increase contagion effects or, by contrast, act as a shockabsorber, depending on its approach to settlement risk management. Central banks haveundertaken several major efforts in the past two decades to strengthen risk management insystems and to reduce and contain systemic risk. For example, they have promoted and operatedRTGS systems and insisted on the implementation of risk control measures in net settlementsystems. RTGS systems, for instance, can offer a powerful mechanism for limiting systemicrisks in the interbank settlement process, because they can effect final settlement of individualfunds transfers on a continuous basis during the processing day. With regard to public andprivate net settlement systems, the Lamfalussy standards (ie minimum standards for the designand operation of netting schemes) define one basis for effective risk control. Systems fulfillingthe Lamfalussy standards will be able, at the very least, to withstand the failure of theparticipant with the largest single net debit position. Due to the risk control measures in such asystem (eg limit systems, collateral requirements and loss-sharing agreements), this isindependent of the size of an individual participant. For example, after a merger of twoparticipants in the same system, the new institution might have higher limits in the system, butwill also have to provide more collateral to cover the higher exposure. It is, however, also truethat, in the event of the failure of a participant during the settlement day, counterparties in bothan RTGS system and a net settlement system complying with the Lamfalussy standards wouldnot receive expected incoming funds from the failed participant if the failed participant had notsubmitted the payments to the system prior to its failure.

322
Finally, consolidation as it affects the size of a participant, its settlement business or the role ofinterbank payment systems may have implications from a systemic risk perspective.323
For example, certain developments at the level of both financial institutions and payment andsettlement systems may increase systemic risks by increasing the dependencies betweensystems. Interdependencies between systems have increased as a result of the emergence ofmultinational institutions and specialised service providers that have access to several paymentand securities settlement systems in different countries. Furthermore, consolidation has causedan increasing interdependence between different systems as evidenced by the development ofsystems such as CLS or by the implementation of DVP procedures. On the one hand, DVPmechanisms, for example, eliminate principal risk in securities settlement. On the other hand, byconnecting payment and securities settlement systems, they may accelerate the transmission ofsettlement problems from one system to another.324 Likewise, CLS acts as a bridge mechanismbetween multiple payment systems, potentially increasing the operational and liquidityinterdependencies between such payment systems. These examples indicate the growingimportance of payment and settlement systems in the potential transmission of contagion effectscaused by consolidation among participants and systems. Finally, market participants mayassume that global correspondent and custodian banks are “too big to fail” from the perspectiveof settlement system and financial system stability. Market participants may also mistakenlybelieve that settlements on the books of these institutions have the same quality as settlementson the books of a central bank. Consequently, a moral hazard problem might occur not onlywith regard to the global clearing and custodian banks themselves, but also with regard to othermarket participants.
In conclusion, financial consolidation may shift credit and liquidity settlement risks fromrelatively transparent, risk-adverse interbank utilities to more opaque, risk-taking private firms.At the same time, operational “choke points” in the payment system may shift from wellrecognised and understood systems to private firms whose role in the payment system may notbe fully recognised by market participants or authorities. Consolidation may shift riskmanagement incentives from a risk-avoidance, collective protection to a risk-taking, individualfirm protection bias. Such a shift may be destabilising during a market crisis as individualpayment processors seek to protect their firm interests first. Finally, consolidation may beincreasing the interdependencies and linkages between payment and settlement systems. Takentogether, these effects may create additional opportunities for spillover effects or negativeexternalities to arise.325 Consolidation’s effect on financial, operational and systemic risks in aparticular venue, however, depends in part on the initial conditions of the banking system in thatvenue regarding payment flows, concentrations and merger patterns.
Effects on the oversight role of central banksConsolidation processes lead to the expansion of very large institutions with a high share of in-house payment and settlement transactions. Many of these institutions provide payment servicesto other banks or other payment intermediaries by effecting payments between the accounts ofthese entities in their books. To some extent, these institutions can be considered alternatives fortraditional payment and settlement channels. As consolidation progresses, the concentration ofpayment activity among a few large institutions will challenge the traditional oversight role of
323 See Chapter III for a working definition of systemic risk.324 However, DVP is often achieved via systems where the securities settlement system also settles the cash leg of a
transaction through its own processing system. In such a system design, the interdependencies between paymentand securities settlement systems are significantly reduced.
325 Spillover effects, negative externalities and interdependencies are key components of systemic risk as defined inChapter III.

323
central banks over the payment system and the bank supervisors’ role over individualinstitutions. Central banks will need to better understand the role played by key institutions inthe flow of payments and bank supervisors will need to analyse whether existing supervisorytools are suited to coping with institutions’ growing role in the payment and settlement business.New cooperative arrangements between banking supervisors and overseers may be needed toidentify and analyse the interactions, dynamics and risk at both the institutional and systemlevels. With regard to major payment systems, the Core Principles for Systemically ImportantPayment Systems now provide a key set of evaluative standards for the relevant authorities.326
Moreover, the increasing importance of cross-border consolidation may require anintensification of cross-border cooperation between payment and settlement systems overseersand banking supervisory authorities and securities supervisory authorities. Examples in thisdirection include the joint IOSCO/CPSS working group to develop standards for securitiessettlement systems and the joint IOSCO/CPSS effort to establish a disclosure framework forsecurities settlement systems.
Finally, the expected increased entrance of non-banks in payment and settlement-relatedactivities might present a further challenge to central banks and bank supervisors. Most of theinterviewees did not express a general concern about this fact, although they expect increasedcompetition. However, what the banks clearly have requested is a level playing field betweenthemselves and any kind of new market participant.
5. ConclusionsThe current situation of the financial industry in the G10 countries is characterised by anaccelerated consolidation process, not only changing the banking structures through M&As, butalso affecting the market infrastructures for payment and securities settlement and banks’internal systems and procedures for payment and back office activities. In parallel, the globalcorrespondent banking and the global custody businesses are tending to be concentrated amonga smaller number of large market players and, at the domestic level, banks are increasinglystarting to outsource payment and settlement activities to bank and non-bank payment serviceproviders.
The emergence of large, specialised service providers is driven primarily by both the benefits ofsize and, consequently, of the potential to make large investments in the necessaryIT infrastructure, and the internationalisation of the interbank and capital markets. The latterfactor has been made possible by a general trend towards deregulation and liberalisation offinancial markets and is connected with sharply increasing cost-cutting pressure. Global players,in turn, are becoming more demanding vis-à-vis market infrastructures in terms of their businessneeds for efficiency of payment and securities processing. Consequently, they are often themain drivers of a greater harmonisation and consolidation of systems, both domestically andacross borders.
All the types of consolidation analysed in this report affect efficiency, competition, risk and theoversight role of central banks. Many of these effects can be considered to be quite positive andmay, for instance, lead to lower prices for payment and securities transactions for banks as wellas for customers. M&As may result in stronger financial institutions, which are able to invest inrisk-reducing technologies, and internal consolidation may allow banks to manage credit andliquidity risk better. However, there are also possible long-term negative effects with regard tocompetition, which are difficult to predict today. It cannot be ruled out that a decrease in thenumber of financial institutions or payment and settlement systems competing in the relevant
326 See Committee on Payment and Settlement Systems, Consultative Report on Core Principles for SystemicallyImportant Payment Systems, Part 2 - Implementing the Core Principles, page 3.

324
markets may ultimately result in higher prices for settlement services and lower rates ofinnovation. Moreover, certain changes in the role of financial institutions in the field of paymentand securities processing have the potential to affect the nature and the size of risks arising inconnection with these activities which, in turn, may require oversight and supervisoryauthorities to adapt their policies.
The complexity and different effects of the consolidation processes taking place within thepayment and settlement industry make it impossible to categorise consolidation either as purelypositive or as purely negative from a social welfare viewpoint. Furthermore, consolidationcannot be analysed only from a payment and securities settlement or even central bankperspective. In general, at the present stage, it does not seem to be advisable for publicauthorities to interfere with the market competition between financial institutions or betweenpayment and settlement systems. In fact, public authorities, as a public policy objective, maywish to remove potential obstacles to the consolidation process when it enables the market todevelop initiatives aimed at reducing risks and enhancing efficiency in the field of payment andsecurities settlement.
However, authorities should carefully monitor the impact of consolidation in the field ofpayment and settlement businesses from a risk, efficiency and competition viewpoint.Authorities should not refrain from defining safety or access standards when appropriate,especially regarding the potential risks stemming, on the one hand, from very large playersparticipating in payment systems and, on the other hand, from the emergence of consolidatedsystems. There are some issues related to consolidation of the payment and settlement systemthat might become key areas of interest for central banks in the coming years and which they –or public authorities in general – might need to examine more closely. First, the providers ofpayment and securities settlement systems (including central banks as providers of RTGSsystems) might face an increasing demand for remote access from large correspondent andcustody banks operating on a global basis. Closely related to the issue of remote access are theideas of a global collateral pool and of an extension of the range of eligible collateral acceptedby individual central banks, both of which are aimed at avoiding temporary liquidity tensionswithin and across payment systems, eg in connection with the operation of CLS.
Second, the increased entrance of non-bank service providers into a market which used to beoccupied only by banks, and the development of the internet and e-commerce mightincreasingly affect central banks in discharging their responsibility to ensure the soundness andthe efficiency of the payment system. Although the current developments might be regarded asimproving competition, banks expect public authorities to ensure a level playing field in thisarea in terms of safety and soundness.
Third, the provision of payment and settlement services usually requires significant ITinvestments. This fosters the emergence of large, specialised service providers that, to someextent, can be considered as alternatives to traditional interbank payment and settlementsystems. Consequently, there might be a shift from risks within interbank settlement systems torisks between customer banks and service providers. Banks should be aware of these risks andneed to have well developed risk control mechanisms in place. A failure of a large serviceprovider, or even a temporary technical problem in one of its IT systems, might have serioussystemic liquidity and credit effects.
Fourth, a closely related issue is the fact that customer banks might perceive globalcorrespondent and custodian banks as “too big to fail”. Consequently, moral hazard problemsmight occur in the market. This is an additional reason for central banks to insist on effectiverisk management procedures.
Fifth, the emergence of large bank and non-bank service providers and concentrated paymentflows through these providers raises a question concerning the respective roles of overseers andbanking supervisors and the suitability of the tools they currently use to fulfil theirresponsibilities. This issue has both functional and, owing to the increased cross-borderconsolidation, jurisdictional aspects. The appropriateness of the current cooperative

325
arrangements between central banks and supervisors – domestically and cross-border – shouldbe carefully analysed to ensure the soundness and the efficiency of the payment and settlementsystems and, at the same time, to strive for synergies.
326
Annex VI.1: TARGET327
Before the start of economic and monetary union (EMU), separate RTGS systems existed in theEU countries. Some of them had been operating for several years, others were established onlyrecently in view of the requirements of EMU. With the introduction of the euro, these individualRTGS systems were interconnected to form one single system: TARGET. TARGET is adecentralised system consisting of 15 national RTGS systems, the European Central Bankpayment mechanism (EPM) and the Interlinking system, which is a telecommunicationsnetwork (S.W.I.F.T.) interconnecting these systems. TARGET is needed under EMU in order toachieve – between the national central banks of the euro area – the same easy transferability ofcentral bank money which had previously existed within the individual countries. Theintegration of the euro money market, made possible by TARGET, is a prerequisite for a singlemonetary stance in the euro area. Apart from the monetary policy considerations, TARGET alsoreflects the central banks’ willingness, during the 1990s, to develop RTGS systems as a safeway of processing payments, minimising systemic risk and promoting the efficiency of cross-border payments.
The TARGET experience provides several lessons regarding the consolidation of paymentinfrastructure in the areas of market demands for further infrastructure consolidation,implications for liquidity management, and operational risks arising from interdependencies.
Today, participants consider TARGET to be one system rather than a hotchpotch of 15 differentones and they have requested further harmonisation. In particular larger banks (representing 70to 80% of payment flows), which typically access TARGET through more than one nationalRTGS system, are strongly in favour of a more uniform service level. As consolidation in theEuropean banking sector progresses, the pressures for further harmonisation of the TARGETsystem are likely to increase. The Eurosystem has recently started a discussion on the long-termevolution of TARGET in order to eliminate some existing shortcomings of the present systemand to be able to adapt the system to meet future developments in technology and the financialsector in general.
The TARGET experience has also shown that banks needed some time to learn to manage theirliquidity efficiently across several interlinked large-value payment systems operating in euros.Market conventions concerning the efficient movement of funds that, prior to TARGET, existedonly at the national levels had to be developed for the euro area level. Further developments inliquidity management are expected as banks gain experience in euro markets.
In addition to changes in liquidity management, it became clear that consolidation raisedimportant operational issues. An incident in one component of TARGET or at a major bank, forexample, has repercussions across borders, given the interdependencies that exist. For instance,in 1999 there was a system error at one of the very large banks, which resulted in a breakdownin the control system for online applications on the mainframe. As a result, payment orders forforeign exchange and money market transactions, securities settlement and customer paymentscould not be processed. The backup system of this bank could not be used since it exhibited thesame software error. As a consequence, various emergency and manual procedures were used.However, they were not sufficient to cope with the number of payments to be processed and, asa result, the execution of many large-value payment and securities orders had to be postponeduntil the next business day.
327 TARGET is the Trans-European Automated Real-time Gross settlement Express Transfer system. It processesover 190,000 payments each day valued at over EUR 1 trillion, of which more than 41,000 payments valued atover EUR 450 billion were cross-border payments.

327
TARGET represents a specific form of consolidation that originated from the central banks,rather than the markets, in order to facilitate the implementation of the single monetary policy ofthe Eurosystem. The TARGET experience demonstrates some of the implications from cross-border consolidation of national payment systems such as liquidity effects and operationaldependencies. As consolidation of financial services continues, market participants are likely toput increasing pressure on the Eurosystem to further harmonise TARGET. Despite TARGET’scentral bank origins and objectives, the Eurosystem is being responsive to market needs bycontinuously seeking input and feedback on TARGET-related issues from the banking andfinancial community. At the national level this is done through regular TARGET User Groupmeetings. At the euro area level the Eurosystem has regular discussions with European bankingassociations and representatives of individual financial institutions.

328
References
Anderson, Robert and Brian Rivard (1998): “The Competition Policy Treatment of Shared EFTNetworks”, Proceedings of the Bank Structure and Competition Conference, Federal ReserveBank of Chicago.
Balto, David and James McAndrews (1998): “Joint Venture Payment Networks and PublicPolicy”, Proceedings of the Bank Structure and Competition Conference, Federal Reserve Bankof Chicago.
Bank for International Settlements (1990): “Report of the Committee on Interbank NettingSchemes of the Central Banks of the Group of Ten Countries”.
Basel Committee on Banking Supervision (1998): “Report on Operational Risk Management”.
Bauer, Paul W and Gary D Ferrier (1996): “Scale Economies, Cost Efficiencies andTechnological Change in Federal Reserve Payments Processing”, Journal of Money, Credit andBanking, 28: 1004-1039.
Berger, Allen N, Rebecca S. Demsetz and Philip E. Strahan (1999): “The Consolidation of theFinancial Services Industry: Causes, Consequences and Implication for the Future”, Journal ofBanking and Finance, 23(2-4): 135-94.
Committee on Payment and Settlement Systems (2000): “Consultative Report on CorePrinciples for Systemically Important Payment Systems”.
de Bandt, O and Ph. Hartmann (1998): “What is systemic risk today?”, paper prepared for theSecond Joint Central Bank Research Conference “Risk Measurement and Systemic Risk”, Bankof Japan.
Fine, Camden R (1992): “Bankers’ Banks: A Correspondent Alternative for CommunityBanks”, Thesis, Stonier Graduate School of Banking, American Bankers Association.
Humphrey, David, Moshe Kim and Bent Vale (1998): “Realizing the Gains from ElectronicPayments: Costs, Pricing and Payment Choice”, Arbeidsnotat Research Department, NorgesBank.
Humphrey, David B, Lawrence B Pulley and Jukka M Vesala (1996): “Cash, paper andelectronic payments: a cross-country analysis”, Journal of Money, Credit and Banking, 28: 914-939.
Institutional Investor (September 1999): “The world’s largest global custodians”, volume 24,issue 9: 199-200.
Laderman, Elizabeth S (1990): “The Public Policy Implications of State Laws Pertaining toAutomated Teller Machines”, Federal Reserve Bank of San Francisco Economic Review.
Prager, Robin A (1999): “ATM network mergers and the creation of market power”, TheAntitrust Bulletin.
329
Working Party on Financial Sector Consolidation
Chair: Roger W Ferguson, Jr, Board of Governors of the Federal Reserve System
Task force on the patterns of consolidation
Chair: Takatoshi Ito (Ministry of Finance, Japan)
Members: Mauro Grande (European Central Bank)Paul Habeshaw (Ministry of Finance, Tokyo)Ritha Khemani (International Monetary Fund)John Laker (Reserve Bank of Australia)Magnus Petrelius (Ministry of Finance, Sweden)Steven J. Pilloff (Board of Governors of the Federal Reserve System)Kostas Tsatsaronis (Bank for International Settlements)
The task force is especially appreciative of the assistance received from Banca d'Italia inhelping it assemble transactions data. Dario Focarelli played a particularly large role in assistingthe task force. The task force is also grateful for the help of the OECD, especially that of AyseBertrand.
Task force on the fundamental causes of consolidationChair: Age Bakker (Netherlands Bank)
Members: Martin Gisiger (Federal Department of Finance, Switzerland)Mauro Grande (European Central Bank)John Laker (Reserve Bank of Australia)Stephen Lumpkin (Organisation for Economic Co-operation and
Development)Wilbur Monroe (Department of the Treasury, United States)Paul Mylonas (Organisation for Economic Co-operation andDevelopment)Robin A. Prager (Board of Governors of the Federal Reserve System)Luis Rodriguez (Bank of Spain)
The task force is grateful for Secretariat support provided by Irene de Greef and Marc de Vor,both from the Netherlands Bank.
Task force on the impact of financial consolidation on financial riskChair: Myron L. Kwast (Board of Governors of the Federal Reserve System)
Members: Gianni De Nicoló (Board of Governors of the Federal Reserve System)Werner Gehring (Deutsche Bundesbank)Glenn Hoggarth (Bank of England)Hiroshi Nakaso (Bank of Japan)Kazunari Ohashi (Bank of Japan)Paolo Marullo Reedtz (Bank of Italy)Garry J. Schinasi (International Monetary Fund)Konstantinos Tsatsaronis (Bank for International Settlements)

330
Part of the work was carried out in task groups, which were chaired by Glenn Hoggarth, MyronL. Kwast and Hiroshi Nakaso. Colleen Barnes (Department of Finance, Canada) prepared theCanada annex.
The task force is grateful for Secretariat support provided by Linda Pitts (Board of Governors ofthe Federal Reserve System).
Task force on the impact of financial consolidation on monetary policyChair: Alex Bowen (Bank of England)
Members: Agathe Côté (Bank of Canada)William B. English (Board of Governors of the Federal Reserve System)Isao Hishikawa (Bank of Japan)Mike Kennedy (Organisation for Economic Co-operation and
Development)Ivo Maes (National Bank of Belgium)Paul Mylonas (Organisation for Economic Co-operation and
Development)Yves Nachbaur (Bank of France)Dominique Servais (National Bank of Belgium)
Task force on the effects of consolidation on efficiency, competition and credit flowsChair: Fabio Panetta (Bank of Italy)
Members: Dean F. Amel (Board of Governors of the Federal Reserve System)Martin Andersson (Sveriges Riksbank)Colleen Barnes (Department of Finance, Canada)Emilia Bonaccorsi di Patti (Bank of Italy)Dominik Egli (Swiss National Bank)Frédéric Fouqet (Bank of France)Carmelo Salleo (Bank of Italy)Dirk Schoenmaker (Ministry of Finance, Netherlands)John Watson (European Commission)
The task force is grateful for research assistance provided by Roberto Felici (Bank of Italy).
Task force on the effects of consolidation on payment and settlement systems
Chair: Jean-Michel Godeffroy (European Central Bank)
Members: Shuhei Aoki (Bank of Japan)Hans-Jürgen Friederich (Deutsche Bundesbank)Daniel Heller (Swiss National Bank)Marc Hollanders (Bank for International Settlements)Jacqueline Lacoste (Bank of France)Tony Latter (Hong Kong Monetary Authority)Dieter Reichwein (European Central Bank)Martin Santema (Netherlands Bank)Ferdinando Sasso (Bank of Italy)Jeff Stehm (Board of Governors of the Federal Reserve System)
Significant contributions were also made by Elias Kazarian (European Central Bank) and BirgitZeitschel (Deutsche Bundesbank).

331
Other members of the Working Party
Hervé Carré (European Commission)Steve French (The Treasury, Australia)Ray Jones (The Treasury, Australia)Martin Noréus (Bank of Sweden)Gerry Salembier (Department of Finance, Canada)Beat Siegenthaler (Federal Department of Finance, Switzerland)
Secretariat
Secretaries to the Group of Ten: Gavin BinghamRitha KhemaniPaul Mylonas/Sveinbjörn Blöndal
The Secretariat was assisted by Paul Moser-Boehm and Fang Yang.
Editorial committee
The Summary of the report was drafted under the oversight of Roger Ferguson by a committeechaired by Myron Kwast that included the task force chairs and Gavin Bingham. FederalReserve Board staff members of the working party also assisted in drafting the Summary.
The integration of the individual chapters into a coherent whole was done under the guidance ofDean Amel and benefited from the efforts of Age Bakker, Gavin Bingham, Alex Bowen, Jean-Michel Godeffroy, Takatoshi Ito, Myron Kwast and Fabio Panetta.


333
Data Annex A: Patterns in consolidation transactions
The data presented in this annex were obtained from the Securities Data Company (SDC)Merger and Acquisition (M&A) Database, which is produced by Thomson Financial SecuritiesServices. The SDC database attempts to cover all transactions that involve at least 5% of one ofthe parties participating in the transaction. Before 1992, only transactions with no reported valueor a reported value of at least USD 1 million were included in the sample, but no such limit hasbeen used since that date. This methodological change may contribute to the observed rise inconsolidation activity over the decade.
The information used to compile the database is collected regularly by SDC from prospectuses,more than 200 English and foreign language news sources, company regulatory filings, directcontact with financial institutions, and surveys of investment banks, lawyers and other advisers.Besides typical mergers and acquisitions of entire, healthy firms, the M&A database alsoincludes some other deals such as spin-offs, purchases of failing firms and privatisations ofstate-owned institutions.
Only transactions announced between 1990 and 1999 were included in the analysis. The yearthat the deal was announced is used as the year of the merger, acquisition, joint venture orstrategic alliance. Only deals that were completed or pending as of May 2000 were included inthe sample. Transactions that were cancelled after being announced were excluded. If a dealinvolved more than two financial firms, it would typically be listed as several two-firm deals.
For inclusion in the tables, mergers and acquisitions were restricted to transactions that involvedfinancial firms only. Likewise, joint ventures and strategic alliances were limited to deals wherethe jointly controlled entity was a financial firm. The industry of the “parents” was not takeninto account, as the data do not lend themselves well to assessing the industries of the firms thatown and control a joint venture.
Financial firms involved in mergers and acquisitions are classified as belonging to one of threesegments of the financial sector: banking, insurance or securities/other. Banking comprisescommercial banks, bank holding companies, credit institutions, real estate mortgage bankersand brokers, and savings and mutual savings banks. Insurance includes both life and non-lifeinsurance firms. Lastly, as the name indicates, the third group consists of securities firms,including investment banks, securities and commodities firms, and all other financial firms,such as exchanges. With the joint venture and strategic alliance data, no distinction was madeamong the three categories of financial firms.
It should be noted that inspection of the M&A data revealed that some firms were not classifiedin the most appropriate groups. In large transactions where problems were identified,corrections were made to reflect the appropriate industry. However, it is highly likely that atleast some firms are still improperly classified. Reported figures may also be influenced bysimilar problems with the country of transaction participants. Specifically, some firms may beclassified as being located in the wrong country. As a result of improper classifications andother issues associated with obtaining accurate and consistent data, some of the figures reportedin the tables in Annex A exhibit minor inconsistencies.
Two sets of tables are presented in this annex. The first and much larger set reports data onmergers and acquisitions. These transactions are defined as deals characterised by SDC as eithermergers or acquisitions of majority interest (ie the acquirer’s ownership share of the targetexceeded 50% as a result of the transaction). The second set of tables presents data on jointventures and strategic alliances. Such deals are defined as agreements where two or moreentities combined resources to form a new, mutually advantageous business arrangement toachieve predetermined objectives.
An important issue that may affect figures in the table is the lack of information on thetransaction values for some deals. In the context of this chapter, deal value is a somewhat
334
ambiguous term, as SDC obtains its estimates from announcements available from publicsources. In the case of share exchanges, deal value is based on the market price of shares. In thecase of a merger of equals, transaction value is calculated as the value of shares that areexchanged. Values are also not necessarily based on a consistent date relative to the mergerprocess, as the recorded transaction value may vary during the period between announcementand consummation of a deal as information becomes available or deal terms are changed duringpost-announcement negotiations. As a result of these issues surrounding value estimates, suchfigures are best used as indicators of the size of deals and the relative level of merger activity.
In about 40% of the cases that are included in our analysis of M&A activity, SDC was not ableto collect data on the value of the deal. Therefore, that information is not included in theanalysis for those transactions, even though the transactions themselves are included. Thus, inthe mergers and acquisitions tables, reported figures for the total value of transactions actuallyrefer to the total value for the subset of transactions for which values was reported. As a result,reported figures should understate the true total value. However, it is likely that theunderstatement is modest, because values should be available for most large deals.
Average value is based on the number of deals with an associated value. All deal values arereported in USD millions, with the exchange rate conversion based on the exchange rate at thetime the deals were announced. In addition, value is reported in nominal terms, so changes overtime are influenced at least somewhat by inflation. No deal value or analogous measure isavailable for joint ventures and strategic alliances.
Using a single database for all of the transactions data provides some consistency acrosscountries and segments of the financial sector. However, consistency may come at the price ofcoverage not being universal or uniform across countries. Thomson relies on companydisclosures and press reports to collect data, and although these sources are relatively thorough,they do not cover every transaction. As a result, smaller deals, which are less likely to becovered by the media or followed closely by investors and analysts, are more likely to beinadvertently excluded. In addition, differences in the nature of business reporting mayinfluence the extent of coverage in different countries.
Although efforts are made to ensure that transactions data for each country are comparable, sucha task is inherently difficult given differences in various financial sectors. Therefore, besidesdifferences in coverage and ability to obtain value estimates, additional differences amongcountries may exist in the ability of SDC to consistently identify and classify deals.

335
Table A.1All countries
All values in USD millionsDeals classified by country and sector of target firm
1990 1991 1992 1993 1994 1995 1996 1997 1998 1999 Total
Deal type
Number 213 403 473 532 583 605 602 635 620 594 5260Total value 17762.5 32606.4 31340.5 53605.7 43621.0 127777.9 73039.3 221869.8 354225.2 271276.8 1227125.1
Withinborder/withinindustry
Ave value 158.6 174.4 141.2 169.1 114.5 350.1 202.3 514.8 803.2 788.6 388.2
Number 53 78 83 90 112 135 140 147 121 172 1131Total value 12295.8 4399.0 3604.7 6125.6 3679.8 8857.5 7174.3 38203.0 107903.6 21957.2 214200.5
Withinborder/crossindustry
Ave value 396.6 125.7 94.9 113.4 62.4 142.9 99.6 444.2 1332.1 196.0 340.0
Number 39 45 44 46 59 87 75 87 96 90 668Total value 6407.0 812.5 1291.5 5008.0 5074.9 11629.4 13353.2 25714.2 24975.5 48661.4 142927.6
Cross-border/withinindustry
Ave value 400.4 67.7 86.1 263.6 169.2 290.7 381.5 547.1 480.3 1013.8 455.2
Number 19 23 16 14 19 29 25 32 37 31 245Total value 1536.4 382.0 2122.6 542.8 1027.3 3342.3 3410.0 7187.3 8011.5 11275.5 38837.7
Cross-border/crossindustry
Ave value 192.1 42.4 235.8 90.5 114.1 222.8 284.2 378.3 320.5 593.4 296.5
Deal typeNumber 266 481 556 622 695 740 742 782 741 766 6391Total value 30058.3 37005.4 34945.2 59731.3 47300.8 136635.4 80213.6 260072.8 462128.8 293234.0 1441325.6
Withinborder
Ave value 210.2 166.7 134.4 161.0 107.5 320.0 185.3 503.0 885.3 643.1 380.2
Number 58 68 60 60 78 116 100 119 133 121 913Total value 7943.4 1194.5 3414.1 5550.8 6102.2 14971.7 16763.2 32901.5 32987.0 59936.9 181765.3
Cross-border
Ave value 331.0 56.9 142.3 222.0 156.5 272.2 356.7 498.5 428.4 894.6 408.5
Deal typeNumber 252 448 517 578 642 692 677 722 716 684 5928Total value 24169.5 33418.9 32632.0 58613.7 48695.9 139407.3 86392.5 247584.0 379200.7 319938.2 1370052.7
Withinindustry
Ave value 188.8 167.9 137.7 174.4 118.5 344.2 218.2 518.0 769.2 816.2 394.3
Number 72 101 99 104 131 164 165 179 158 203 1376Total value 13832.2 4781.0 5727.3 6668.4 4707.1 12199.8 10584.3 45390.3 115915.1 33232.7 253038.2
Crossindustry
Ave value 354.7 108.7 121.9 111.1 69.2 158.4 126.0 432.3 1093.5 253.7 332.5
IndustryNumber 199 311 381 461 525 532 480 534 533 488 4444Total value 31041.2 31535.2 26653.4 29707.3 34556.7 136241.4 46370.9 187074.1 373030.6 270277.9 1166488.7
Banking
Ave value 250.3 193.5 131.9 98.4 95.2 404.3 149.6 482.1 921.1 826.5 399.3
Number 54 89 102 87 80 123 149 145 146 103 1078Total value 5039.5 3409.9 9003.8 16945.7 11499.1 6968.9 32966.7 55064.5 89270.8 44506.5 274675.4
Insurance
Ave value 210.0 106.6 191.6 434.5 267.4 131.5 439.6 724.5 1115.9 927.2 531.3
Number 71 149 133 134 168 201 213 222 195 296 1782Total value 1921.0 3254.8 2702.1 18629.1 7347.2 8396.8 17639.2 50835.7 32814.4 38386.5 181926.8
Securities/Other
Ave value 101.1 67.8 77.2 338.7 100.6 91.3 185.7 427.2 287.8 259.4 228.0
Number 324 549 616 682 773 856 842 901 874 887 7304Total value 38001.7 38199.9 38359.3 65282.1 53403.0 151607.1 96976.8 292974.3 495115.8 353170.9 1623090.9Ave value 227.6 157.2 135.1 164.9 111.5 314.5 202.0 502.5 826.6 675.3 383.2
GDP 16147400 17041128 18265215 18447147 19726512 21571033 21637942 21242306 21480085 22549762 198108531
Total
Value/GDP 0.24% 0.22% 0.21% 0.35% 0.27% 0.70% 0.45% 1.38% 2.30% 1.57% 0.82%

336
Deals classified by country and sector of target firm
1990 1991 1992 1993 1994 1995 1996 1997 1998 1999 Total
BankingNumber 139 244 318 390 433 435 395 425 417 367 3563Total value 16765.9 27738.3 23652.0 26683.8 31016.0 122349.5 38919.3 172040.5 257247.1 241114.2 957526.6
Withinborder/withinindustry
Ave value 182.2 216.7 135.9 100.7 97.2 429.3 148.0 529.4 781.9 976.2 394.5
Number 37 39 40 45 59 58 53 71 62 79 543Total value 10663.5 2999.9 922.7 1443.8 1539.6 4787.2 1653.0 4214.5 99532.1 8270.7 136027.0
Withinborder/crossindustry
Ave value 484.7 136.4 54.3 55.5 57.0 171.0 55.1 110.9 2211.8 162.2 444.5
Number 14 18 14 19 24 30 21 30 36 29 235Total value 2343.5 562.8 229.7 1159.7 1846.3 8511.8 3172.2 5699.9 13484.1 13790.1 50800.1
Cross-border/withinindustry
Ave value 390.6 70.4 76.6 165.7 153.9 472.9 288.4 335.3 749.1 766.1 430.5
Number 9 10 9 7 9 9 11 8 18 13 103Ttl value 1268.3 234.2 1849.0 420.0 154.8 592.9 2626.4 5119.2 2767.3 7102.9 22135.0
Cross-border/crossindustry
Ave value 317.1 46.8 264.1 105.0 31.0 98.8 437.7 639.9 212.9 645.7 320.8
InsuranceNumber 30 56 63 57 46 68 89 72 83 44 608Total value 896.6 1836.6 5940.3 12296.4 8031.4 2534.0 25312.2 23363.1 71013.9 16374.0 167598.5
Withinborder/withinindustry
Ave value 69.0 87.5 220.0 558.9 308.9 70.4 575.3 599.1 1775.3 861.8 584.0
Number 4 14 21 11 11 23 27 27 18 27 183Total value 17.6 1259.9 2124.3 1262.8 512.1 925.6 2513.1 18198.0 4401.8 585.5 31800.7
Withinborder/crossindustry
Ave value 17.6 180.0 212.4 140.3 73.2 154.3 147.8 1299.9 440.2 45.0 338.3
Number 17 15 16 16 21 30 30 39 40 27 251Total value 4032.7 211.2 939.2 3375.4 2929.6 1553.0 5019.3 13434.2 10023.4 27139.9 68657.9
Cross-border/withinindustry
Ave value 448.1 105.6 93.9 482.2 325.5 172.6 386.1 639.7 371.2 2087.7 572.1
Number 3 4 2 3 2 2 3 7 5 5 36Total value 92.6 102.2 0.0 11.1 26.0 1956.3 122.1 69.2 3831.7 407.1 6618.3
Cross-border/crossindustry
Ave value 92.6 51.1 0.0 11.1 26.0 978.2 122.1 34.6 1277.2 135.7 413.6
Securities/Other
Number 44 103 92 85 104 102 118 138 120 183 1089Total value 100.0 3031.5 1748.2 14625.5 4573.6 2894.4 8807.8 26466.2 25964.2 13788.6 102000.0
Withinborder/withinindustry
Ave value 14.3 79.8 87.4 487.5 127.0 65.8 163.1 395.0 360.6 176.8 228.7
Number 12 25 22 34 42 54 60 49 41 66 540Total value 1614.7 139.2 557.7 3419.0 1628.1 3144.7 3008.2 15790.5 3969.7 13101.0 46372.8
Withinborder/crossindustry
Ave value 201.8 23.2 50.7 179.9 65.1 112.3 120.3 464.4 152.7 272.9 201.6
Number 8 12 14 11 14 27 24 18 20 34 182Total value 30.8 38.5 122.6 472.9 299.0 1564.6 5161.7 6580.1 1468.0 7731.4 23469.6
Cross-border/Withinindustry
Ave value 30.8 19.3 61.3 94.6 33.2 120.4 469.2 731.1 209.7 454.8 308.8
Number 7 9 5 4 8 18 11 17 14 13 106Total value 175.5 45.6 273.6 111.7 846.5 793.1 661.5 1998.9 1412.5 3765.5 10084.4
Cross-border/crossindustry
Ave value 58.5 22.8 136.8 111.7 282.2 113.3 132.3 222.1 156.9 753.1 219.2
Number 324 549 616 682 773 856 842 901 874 887 7304Total value 38001.7 38199.9 38359.3 65282.1 53403.0 151607.1 96976.8 292974.3 495115.8 353170.9 1623090.9
Total
Ave value 227.6 157.2 135.1 164.9 111.5 314.5 202.0 502.5 826.6 675.3 383.2

337
Deals classified by country and sector of acquiring firm
1990 1991 1992 1993 1994 1995 1996 1997 1998 1999 Total
Deal typeNumber 213 403 473 532 583 605 602 635 620 594 5260Total value 17762.5 32606.4 31340.5 53605.7 43621.0 127777.9 73039.3 221869.8 354225.2 271276.8 1227125.1
Withinborder/withinindustry
Ave value 158.6 174.4 141.2 169.1 114.5 350.1 202.3 514.8 803.2 788.6 388.2
Number 53 78 83 90 112 135 140 147 121 172 1131Total value 12295.8 4399.0 3604.7 6125.6 3679.8 8857.5 7174.3 38203.0 107903.6 21957.2 214200.5
Withinborder/crossindustry
Ave value 396.6 125.7 94.9 113.4 62.4 142.9 99.6 444.2 1332.1 196.0 340.0
Number 51 58 53 54 79 121 103 112 138 146 915Total value 6923.0 914.4 3044.9 5298.1 4805.8 13366.1 15400.9 30063.1 28258.1 59362.8 167437.2
Cross-border/withinindustry
Ave value 329.7 57.2 152.2 252.3 145.6 252.2 358.2 556.7 387.1 791.5 409.4
Number 20 26 21 16 18 40 33 42 54 58 328Total value 1698.4 441.9 2270.2 712.6 950.1 3600.3 3763.0 8836.6 8601.5 16403.6 47278.2
Cross-border/crossindustry
Ave value 212.3 36.8 206.4 79.2 158.4 211.8 313.6 401.7 253.0 431.7 279.8
Deal typeNumber 266 481 556 622 695 740 742 782 741 766 6391Total value 30058.3 37005.4 34945.2 59731.3 47300.8 136635.4 80213.6 260072.8 462128.8 293234.0 1441325.6
Withinborder
Ave value 210.2 166.7 134.4 161.0 107.5 320.0 185.3 503.0 885.3 643.1 380.2
Number 71 84 74 70 97 161 136 154 192 204 1243Total value 8621.4 1356.3 5315.1 6010.7 5755.9 16966.4 19163.9 38899.7 36859.6 75766.4 214715.4
Cross-border
Ave value 297.3 48.4 171.5 200.4 147.6 242.4 348.4 511.8 344.5 670.5 371.5
Deal typeNumber 264 461 526 586 662 726 705 747 758 740 6175Total value 24685.5 33520.8 34385.4 58903.8 48426.8 141144.0 88440.2 251932.9 382483.3 330639.6 1394562.3
Withinindustry
Ave value 185.6 165.1 142.1 174.3 117.0 337.7 218.9 519.4 744.1 789.1 390.6
Number 73 104 104 106 130 175 173 189 175 230 1459Total value 13994.2 4840.9 5874.9 6838.2 4629.9 12457.8 10937.3 47039.6 116505.1 38360.8 261478.7
Crossindustry
Ave value 358.8 103.0 119.9 108.5 71.2 157.7 130.2 435.6 1013.1 255.7 327.3
IndustryNumber 180 297 366 454 503 552 504 533 528 506 4423Total value 20028.0 29421.9 25430.6 32582.2 34189.3 135338.0 50166.6 204302.6 279260.5 274660.1 1085379.8
Banking
Ave value 180.4 202.9 136.0 109.0 97.7 398.1 158.8 527.9 710.6 805.5 378.3
Number 69 98 97 94 100 142 147 148 163 124 1182Total value 14913.0 2750.1 7486.0 16820.6 12391.7 5736.3 30853.9 52278.5 162714.5 59019.5 364964.1
Insurance
Ave value 451.9 83.3 149.7 410.3 229.5 92.5 489.7 697.0 1892.0 1035.4 658.8
Number 88 170 167 144 189 207 227 255 242 340 2029Total value 3738.7 6189.7 7343.7 16339.2 6475.7 12527.5 18357.0 42391.4 57013.4 35320.8 205697.1
Securities/Other
Ave value 133.5 86.0 138.6 267.9 87.5 131.9 168.4 323.6 380.1 206.6 217.9
Number 337 565 630 692 792 901 878 936 933 970 7634Total value 38679.7 38361.7 40260.3 65742.0 53056.7 153601.8 99377.5 298972.5 498988.4 369000.4 1656041.0Ave value 224.9 153.4 138.4 163.9 110.8 309.1 203.6 504.2 793.3 648.5 379.0
GDP 16147400 17041128 18265215 18447147 19726512 21571033 21637942 21242306 21480085 22549762 198108531
Total
Value/GDP 0.24% 0.23% 0.22% 0.36% 0.27% 0.71% 0.46% 1.41% 2.32% 1.64% 0.84%

338
Deals classified by country and sector of acquiring firm
1990 1991 1992 1993 1994 1995 1996 1997 1998 1999 Total
BankingNumber 139 244 318 390 433 435 395 425 417 367 3563Total value 16765.9 27738.3 23652.0 26683.8 31016.0 122349.5 38919.3 172040.5 257247.1 241114.2 957526.6
Withinborder/withinindustry
Ave value 182.2 216.7 135.9 100.7 97.2 429.3 148.0 529.4 781.9 976.2 394.4
Number 13 25 22 35 36 52 60 49 45 72 409Total value 251.9 1126.5 516.0 4490.7 770.7 2088.4 5061.3 20339.0 5668.4 9705.2 50018.1
Withinborder/crossindustry
Ave value 42.0 160.9 86.0 204.1 40.6 90.8 163.3 598.2 195.5 194.1 220.3
Number 22 20 19 22 25 44 34 42 51 50 329Total value 2834.7 368.3 989.0 1276.7 1652.6 10249.4 5122.3 10702.7 15498.3 20255.4 68949.4
Cross-border/withinindustry
Ave value 283.5 61.4 197.8 141.9 150.2 379.6 301.3 509.7 596.1 613.8 415.4
Number 6 8 7 7 9 21 15 17 15 17 122Total value 175.5 188.8 273.6 131.0 750.0 650.7 1063.7 1220.4 846.7 3585.3 8885.7
Cross-border/crossindustry
Ave value 58.5 47.2 136.8 43.7 750.0 130.1 212.7 174.3 94.1 325.9 177.7
InsuranceNumber 30 56 63 57 46 68 89 72 83 44 608Total value 896.6 1836.6 5940.3 12296.4 8031.4 2534.0 25312.2 23363.1 71013.9 16374.0 167598.5
Withinborder/withinindustry
Ave value 69.0 87.5 220.0 558.9 308.9 70.4 575.3 599.1 1775.3 861.8 584.0
Number 13 9 11 17 20 23 13 20 12 17 155Total value 9107.5 227.1 532.2 508.5 1339.8 1402.4 212.2 9193.7 80912.7 5854.9 109291.0
Withinborder/crossindustry
Ave value 1011.9 75.7 66.5 56.5 89.3 175.3 212.2 1021.5 13485.5 650.5 1419.4
Number 21 26 20 18 33 46 39 48 57 53 361Total value 4052.5 536.7 992.6 3478.7 2960.6 1772.7 5251.0 12793.2 9442.3 31305.9 72586.2
Cross-border/withinindustry
Ave value 450.3 89.5 82.7 434.8 246.7 110.8 328.2 609.2 269.8 1361.1 459.4
Number 5 7 3 2 1 5 6 8 11 10 58Total value 856.4 149.7 20.9 537.0 59.9 27.2 78.5 6928.5 1345.6 5484.7 15488.4
Cross-border/crossindustry
Ave value 428.2 49.9 7.0 268.5 59.9 13.6 39.3 1154.8 269.1 914.1 484.0
Securities/Other
Number 44 103 92 85 104 102 118 138 120 183 1089Total value 100.0 3031.5 1748.2 14625.5 4573.6 2894.4 8807.8 26466.2 25964.2 13788.6 102000.0
Withinborder/withinindustry
Ave value 14.3 79.8 87.4 487.5 127.0 65.8 163.1 395.0 360.6 176.8 228.7
Number 27 44 50 38 56 60 67 78 64 83 567Total value 2936.4 3045.4 2556.5 1126.4 1569.3 5366.7 1900.8 8670.3 21322.5 6397.1 54891.4
Withinborder/crossindustry
Ave value 183.5 121.8 106.5 49.0 62.8 173.1 47.5 201.6 463.5 120.7 168.4
Number 8 12 14 14 21 31 30 22 30 43 225Total value 35.8 9.4 1063.3 542.7 192.6 1344.0 5027.6 6567.2 3317.5 7801.5 25901.6
Cross-border/withinindustry
Ave value 17.9 2.4 354.4 135.7 21.4 134.4 502.8 547.3 276.5 410.6 304.7
Number 9 11 11 7 8 14 12 17 28 31 148Total value 666.5 103.4 1975.7 44.6 140.2 2922.4 2620.8 687.7 6409.2 7333.6 22904.1
Cross-border/crossindustry
Ave value 222.2 20.7 329.3 11.2 35.1 292.2 524.2 76.4 320.5 349.2 263.3
Number 337 565 630 692 792 901 878 936 933 970 7634Total value 38679.7 38361.7 40260.3 65742.0 53056.7 153601.8 99377.5 298972.5 498988.4 369000.4 1656041.0
Total
Ave value 224.9 153.4 138.4 163.9 110.8 309.1 203.6 504.2 793.3 648.5 379.0
Source: Thomson Financial, SDC Platinum.

339
Table A.2All North American countries
All values in USD millionsDeals classified by country and sector of target firm
1990 1991 1992 1993 1994 1995 1996 1997 1998 1999 Total
Deal type
Number 152 204 293 373 412 453 418 469 435 301 3510Total value 4839.7 21792.7 18773.4 29314.2 30706.6 71258.7 44591.6 171470.8 284734.3 76733.3 754215.3
Withinborder/withinindustry
Ave value 56.9 162.6 103.7 111.5 95.1 230.6 154.8 477.6 818.2 335.1 299.4
Number 25 28 33 41 47 57 60 76 78 88 533Total value 392.2 659.6 2092.7 3675.6 1965.1 5803.8 4196.7 19806.3 87786.8 11889.6 138268.4
Withinborder/crossindustry
Ave value 28.0 34.7 130.8 141.4 67.8 181.4 119.9 430.6 1567.6 201.5 416.5
Number 14 11 6 12 11 19 19 21 27 26 166Total value 1487.0 291.2 9.8 815.7 1393.8 3974.2 8667.4 9035.8 15401.9 30935.1 72011.9
Cross-border/withinindustry
Ave value 247.8 58.2 4.9 116.5 154.9 331.2 619.1 645.4 855.7 1933.4 699.1
Number 9 5 5 2 3 5 4 8 6 9 56Total value 49.0 48.5 88.2 25.8 789.7 2244.9 2801.6 2012.2 533.1 3447.3 12040.3
Cross-border/crossindustry
Ave value 24.5 24.3 29.4 25.8 263.2 748.3 700.4 335.4 106.6 689.5 354.1
Deal type
Number 177 232 326 414 459 510 478 545 513 389 4043Total value 5231.9 22452.3 20866.1 32989.8 32671.7 77062.5 48788.3 191277.1 372521.1 88622.9 892483.7
Withinborder
Ave value 52.8 146.7 105.9 114.2 92.8 226.0 151.0 472.3 922.1 307.7 313.0
Number 23 16 11 14 14 24 23 29 33 35 222Total value 1536.0 339.7 98.0 841.5 2183.5 6219.1 11469.0 11048.0 15935.0 34382.4 84052.2
Cross-border
Ave value 192.0 48.5 19.6 105.2 182.0 414.6 637.2 552.4 692.8 1637.3 613.5
Deal type
Number 166 215 299 385 423 472 437 490 462 327 3676Total value 6326.7 22083.9 18783.2 30129.9 32100.4 75232.9 53259.0 180506.6 300136.2 107668.4 826227.2
Withinindustry
Ave value 69.5 158.9 102.6 111.6 96.7 234.4 176.4 483.9 820.0 439.5 315.1
Number 34 33 38 43 50 62 64 84 84 97 589Total value 441.2 708.1 2180.9 3701.4 2754.8 8048.7 6998.3 21818.5 88319.9 15336.9 150308.7
Crossindustry
Ave value 27.6 33.7 114.8 137.1 86.1 230.0 179.4 419.6 1447.9 239.6 410.7
Industry
Number 136 164 247 333 369 396 348 397 362 261 3013Total value 5153.1 21045.6 15075.4 18784.7 23204.4 73568.7 35076.8 139274.0 300112.2 80384.8 711679.7
Banking
Ave value 56.6 175.4 93.1 74.8 75.6 263.7 134.9 428.5 965.0 370.4 306.4
Number 26 39 48 39 41 59 74 64 79 50 519Total value 1451.8 1262.0 4986.9 6279.6 5792.5 5119.4 14752.4 19364.1 59114.2 23217.9 141340.8
Insurance
Ave value 121.0 63.1 172.0 314.0 231.7 142.2 335.3 586.8 1257.7 829.2 480.8
Number 38 45 42 56 63 79 79 113 105 113 733Total value 163.0 484.4 901.8 8767.0 5858.3 4593.5 10428.1 43687.0 29229.7 19402.6 123515.4
Securities/Other
Ave value 40.8 24.2 82.0 337.2 183.1 112.0 281.8 652.0 423.6 303.2 332.9
Number 200 248 337 428 473 534 501 574 546 424 4265Total value 6767.9 22792.0 20964.1 33831.3 34855.2 83281.6 60257.3 202325.1 388456.1 123005.3 976535.9Ave value 63.3 142.5 103.8 113.9 95.8 233.9 176.7 476.1 909.7 398.1 326.8
GDP 6384403 6582621 6897278 7204432 7616368 7988801 8424152 8935031 9368628 9901033 79302747
Total
Value/GDP 0.11% 0.35% 0.30% 0.47% 0.46% 1.04% 0.72% 2.26% 4.15% 1.24% 1.23%
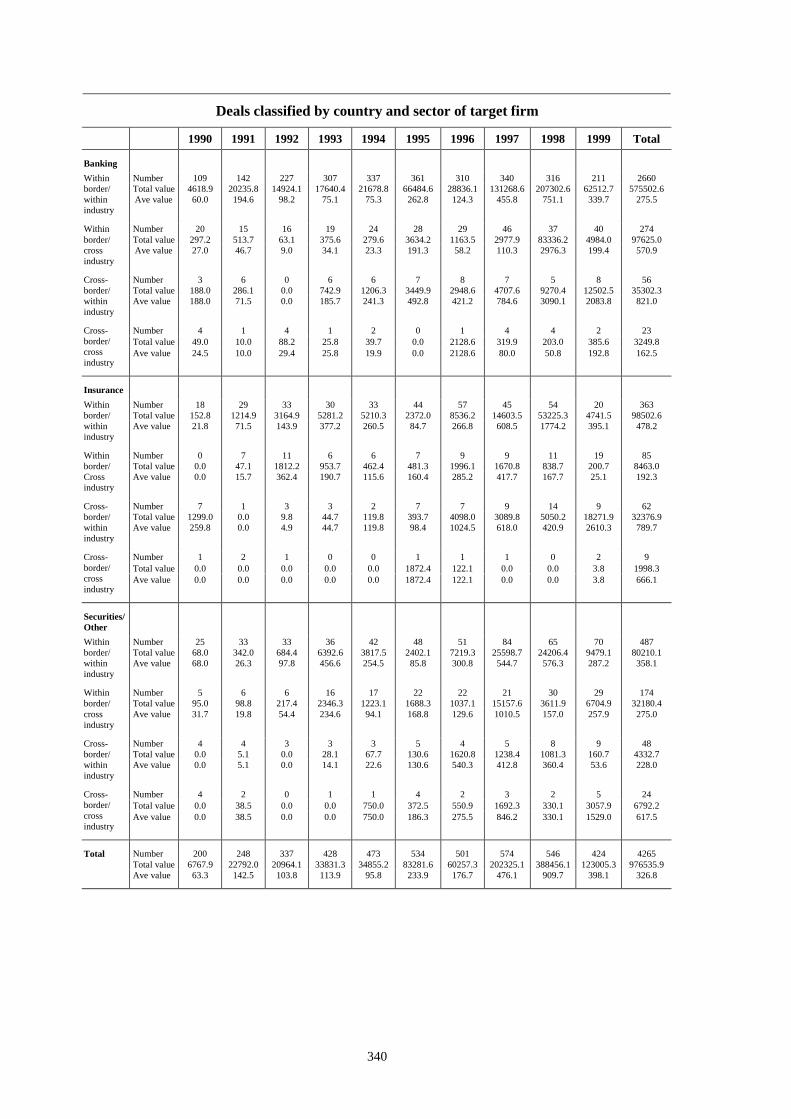
340
Deals classified by country and sector of target firm
1990 1991 1992 1993 1994 1995 1996 1997 1998 1999 Total
BankingNumber 109 142 227 307 337 361 310 340 316 211 2660Total value 4618.9 20235.8 14924.1 17640.4 21678.8 66484.6 28836.1 131268.6 207302.6 62512.7 575502.6
Withinborder/withinindustry
Ave value 60.0 194.6 98.2 75.1 75.3 262.8 124.3 455.8 751.1 339.7 275.5
Number 20 15 16 19 24 28 29 46 37 40 274Total value 297.2 513.7 63.1 375.6 279.6 3634.2 1163.5 2977.9 83336.2 4984.0 97625.0
Withinborder/crossindustry
Ave value 27.0 46.7 9.0 34.1 23.3 191.3 58.2 110.3 2976.3 199.4 570.9
Number 3 6 0 6 6 7 8 7 5 8 56Total value 188.0 286.1 0.0 742.9 1206.3 3449.9 2948.6 4707.6 9270.4 12502.5 35302.3
Cross-border/withinindustry
Ave value 188.0 71.5 0.0 185.7 241.3 492.8 421.2 784.6 3090.1 2083.8 821.0
Number 4 1 4 1 2 0 1 4 4 2 23Total value 49.0 10.0 88.2 25.8 39.7 0.0 2128.6 319.9 203.0 385.6 3249.8
Cross-border/crossindustry
Ave value 24.5 10.0 29.4 25.8 19.9 0.0 2128.6 80.0 50.8 192.8 162.5
InsuranceNumber 18 29 33 30 33 44 57 45 54 20 363Total value 152.8 1214.9 3164.9 5281.2 5210.3 2372.0 8536.2 14603.5 53225.3 4741.5 98502.6
Withinborder/withinindustry
Ave value 21.8 71.5 143.9 377.2 260.5 84.7 266.8 608.5 1774.2 395.1 478.2
Number 0 7 11 6 6 7 9 9 11 19 85Total value 0.0 47.1 1812.2 953.7 462.4 481.3 1996.1 1670.8 838.7 200.7 8463.0
Withinborder/Crossindustry
Ave value 0.0 15.7 362.4 190.7 115.6 160.4 285.2 417.7 167.7 25.1 192.3
Number 7 1 3 3 2 7 7 9 14 9 62Total value 1299.0 0.0 9.8 44.7 119.8 393.7 4098.0 3089.8 5050.2 18271.9 32376.9
Cross-border/withinindustry
Ave value 259.8 0.0 4.9 44.7 119.8 98.4 1024.5 618.0 420.9 2610.3 789.7
Number 1 2 1 0 0 1 1 1 0 2 9Total value 0.0 0.0 0.0 0.0 0.0 1872.4 122.1 0.0 0.0 3.8 1998.3
Cross-border/crossindustry
Ave value 0.0 0.0 0.0 0.0 0.0 1872.4 122.1 0.0 0.0 3.8 666.1
Securities/Other
Number 25 33 33 36 42 48 51 84 65 70 487Total value 68.0 342.0 684.4 6392.6 3817.5 2402.1 7219.3 25598.7 24206.4 9479.1 80210.1
Withinborder/withinindustry
Ave value 68.0 26.3 97.8 456.6 254.5 85.8 300.8 544.7 576.3 287.2 358.1
Number 5 6 6 16 17 22 22 21 30 29 174Total value 95.0 98.8 217.4 2346.3 1223.1 1688.3 1037.1 15157.6 3611.9 6704.9 32180.4
Withinborder/crossindustry
Ave value 31.7 19.8 54.4 234.6 94.1 168.8 129.6 1010.5 157.0 257.9 275.0
Number 4 4 3 3 3 5 4 5 8 9 48Total value 0.0 5.1 0.0 28.1 67.7 130.6 1620.8 1238.4 1081.3 160.7 4332.7
Cross-border/withinindustry
Ave value 0.0 5.1 0.0 14.1 22.6 130.6 540.3 412.8 360.4 53.6 228.0
Number 4 2 0 1 1 4 2 3 2 5 24Total value 0.0 38.5 0.0 0.0 750.0 372.5 550.9 1692.3 330.1 3057.9 6792.2
Cross-border/crossindustry
Ave value 0.0 38.5 0.0 0.0 750.0 186.3 275.5 846.2 330.1 1529.0 617.5
Number 200 248 337 428 473 534 501 574 546 424 4265Total value 6767.9 22792.0 20964.1 33831.3 34855.2 83281.6 60257.3 202325.1 388456.1 123005.3 976535.9
Total
Ave value 63.3 142.5 103.8 113.9 95.8 233.9 176.7 476.1 909.7 398.1 326.8

341
Deals classified by country and sector of acquiring firm
1990 1991 1992 1993 1994 1995 1996 1997 1998 1999 Total
Deal typeNumber 152 204 293 373 412 453 418 469 434 301 3509Total value 4839.7 21792.7 18773.4 29314.2 30706.6 71258.7 44591.6 171470.8 284684.3 76733.3 754165.3
Withinborder/withinindustry
Ave value 56.9 162.6 103.7 111.5 95.1 230.6 154.8 477.6 820.4 335.1 299.5
Number 25 28 33 41 46 57 60 76 78 88 532Total value 392.2 659.6 2092.7 3675.6 1965.1 5803.8 4196.7 19806.3 87786.8 11889.6 138268.4
Withinborder/crossindustry
Ave value 28.0 34.7 130.8 141.4 67.8 181.4 119.9 430.6 1567.6 201.5 416.5
Number 9 15 7 17 23 37 32 46 57 37 280Total value 636.0 502.4 922.8 401.8 1121.7 4727.1 1390.3 10647.3 8395.3 8138.5 36883.2
Cross-border/withinindustry
Ave value 127.2 71.8 307.6 67.0 112.2 278.1 106.9 409.5 299.8 406.9 273.2
Number 6 3 7 5 6 6 8 14 20 16 91Total value 254.6 10.6 264.1 27.0 39.7 222.0 693.0 1851.5 2870.5 2440.5 8673.5
Cross-border/crossindustry
Ave value 254.6 5.3 132.1 6.8 19.9 111.0 173.3 205.7 179.4 221.9 163.7
Deal typeNumber 177 232 326 414 458 510 478 545 512 389 4041Total value 5231.9 22452.3 20866.1 32989.8 32671.7 77062.5 48788.3 191277.1 372471.1 88622.9 892433.7
Withinborder
Ave value 52.8 146.7 105.9 114.2 92.8 226.0 151.0 472.3 924.2 307.7 313.1
Number 15 18 14 22 29 43 40 60 77 53 371Total value 890.6 513.0 1186.9 428.8 1161.4 4949.1 2083.3 12498.8 11265.8 10579.0 45556.7
Cross-border
Ave value 148.4 57.0 237.4 42.9 96.8 260.5 122.5 357.1 256.0 341.3 242.3
Deal typeNumber 161 219 300 390 435 490 450 515 491 338 3789Total value 5475.7 22295.1 19696.2 29716.0 31828.3 75985.8 45981.9 182118.1 293079.6 84871.8 791048.5
Withinindustry
Ave value 60.8 158.1 107.0 110.5 95.6 233.1 152.8 473.0 781.5 340.9 298.2
Number 31 31 40 46 52 63 68 90 98 104 623Total value 646.8 670.2 2356.8 3702.6 2004.8 6025.8 4889.7 21657.8 90657.3 14330.1 146941.9
Crossindustry
Ave value 43.1 31.9 130.9 123.4 64.7 177.2 125.4 393.8 1259.1 204.7 381.7
IndustryNumber 120 154 238 336 360 391 351 383 375 263 2971Total value 5233.6 20600.3 15197.0 21166.8 23082.4 71463.5 33481.0 143345.9 213168.8 74644.1 621383.4
Banking
Ave value 63.8 182.3 98.0 83.7 76.2 266.7 131.3 450.8 685.4 334.7 272.4
Number 24 38 39 41 48 71 73 76 84 41 535Total value 374.8 1612.8 3372.6 5460.2 6248.9 3245.7 8831.2 24935.1 138680.0 9076.8 201838.1
Insurance
Ave value 34.1 76.8 124.9 303.3 215.5 83.2 245.3 656.2 2666.9 394.6 686.5
Number 48 58 63 59 79 91 94 146 130 138 906Total value 514.1 752.2 3483.4 6791.6 4501.8 7302.4 8559.4 35494.9 31888.1 15481.0 114768.9
Securities/Other
Ave value 42.8 26.9 174.2 242.6 140.7 137.8 174.7 422.6 379.6 212.1 247.9
Number 192 250 340 436 487 553 518 605 589 442 4412Total value 6122.5 22965.3 22053.0 33418.6 33833.1 82011.6 50871.6 203775.9 383736.9 99201.9 937990.4Ave value 58.3 141.8 109.2 111.8 92.9 227.8 149.6 463.1 858.5 311.0 308.8
GDP 6384403 6582621 6897278 7204432 7616368 7988801 8424152 8935031 9368628 9901033 79302747
Total
Value/GDP 0.10% 0.35% 0.32% 0.46% 0.44% 1.03% 0.60% 2.28% 4.10% 1.00% 1.18%

342
Deals classified by country and sector of acquiring firm
1990 1991 1992 1993 1994 1995 1996 1997 1998 1999 Total
BankingNumber 109 142 227 307 338 361 310 340 316 211 2661Total value 4618.9 20235.8 14924.1 17640.4 21678.8 66484.6 28836.1 131268.6 207302.6 62512.7 575502.6
Withinborder/withinindustry
Ave value 60.0 194.6 98.2 75.1 75.3 262.8 124.3 455.8 751.1 339.7 275.5
Number 5 5 7 18 15 17 25 20 34 37 183Total value 95.0 78.4 24.5 3182.8 470.6 1602.2 3019.9 7224.9 3315.5 6541.4 25555.2
Withinborder/crossindustry
Ave value 31.7 15.7 12.3 265.2 42.8 228.9 232.3 516.1 132.6 225.6 211.2
Number 4 7 1 8 6 11 13 18 22 12 102Total value 519.7 286.1 0.0 324.3 933.0 3376.7 952.0 3953.2 2491.3 4901.7 17738.0
Cross-border/withinindustry
Ave value 259.9 71.5 0.0 81.1 233.3 422.1 136.0 304.1 311.4 612.7 305.8
Number 2 0 3 3 1 2 3 5 3 3 25Total value 0.0 0.0 248.4 19.3 0.0 0.0 673.0 899.2 59.4 688.3 2587.6
Cross-border/crossindustry
Ave value 0.0 0.0 248.4 9.7 0.0 0.0 224.3 299.7 29.7 344.2 199.0
InsuranceNumber 18 29 33 30 32 44 57 45 53 20 361Total value 152.8 1214.9 3164.9 5281.2 5210.3 2372.0 8536.2 14603.5 53175.3 4741.5 98452.6
Withinborder/withinindustry
Ave value 21.8 71.5 143.9 377.2 260.5 84.7 266.8 608.5 1833.6 395.1 480.3
Number 2 3 4 6 8 10 5 9 7 7 61Total value 110.7 186.7 197.9 176.6 892.9 426.5 0.0 9044.0 80829.5 1608.8 93473.6
Withinborder/crossindustry
Ave value 55.4 93.4 66.0 58.9 148.8 85.3 0.0 1808.8 16165.9 402.2 2670.7
Number 3 5 2 5 8 17 10 19 20 13 102Total value 111.3 211.2 9.8 2.4 145.7 447.2 295.0 763.2 4603.5 2726.5 9315.8
Cross-border/withinindustry
Ave value 55.7 105.6 4.9 2.4 48.6 74.5 73.8 109.0 306.9 389.5 190.1
Number 1 1 0 0 0 0 1 3 4 1 11Total value 0.0 0.0 0.0 0.0 0.0 0.0 0.0 524.4 71.7 0.0 596.1
Cross-border/crossindustry
Ave value 0.0 0.0 0.0 0.0 0.0 0.0 0.0 262.2 23.9 0.0 119.2
Securities/Other
Number 25 33 33 36 42 48 51 84 65 70 487Total value 68.0 342.0 684.4 6392.6 3817.5 2402.1 7219.3 25598.7 24206.4 9479.1 80210.1
Withinborder/withinindustry
Ave value 68.0 26.3 97.8 456.6 254.5 85.8 300.8 544.7 576.3 287.2 358.1
Number 18 20 22 17 23 30 30 47 37 44 288Total value 186.5 394.5 1870.3 316.2 601.6 3775.1 1176.8 3537.4 3641.8 3739.4 19239.6
Withinborder/crossindustry
Ave value 20.7 32.9 170.0 28.7 50.1 188.8 53.5 131.0 140.1 143.8 109.3
Number 2 3 4 4 9 9 9 9 15 12 76Total value 5.0 5.1 913.0 75.1 43.0 903.2 143.3 5930.9 1300.5 510.3 9829.4
Cross-border/withinindustry
Ave value 5.0 5.1 913.0 75.1 14.3 301.1 71.7 988.5 260.1 102.1 351.1
Number 3 2 4 2 5 4 4 6 13 12 55Total value 254.6 10.6 15.7 7.7 39.7 222.0 20.0 427.9 2739.4 1752.2 5489.8
Cross-border/crossindustry
Ave value 254.6 5.3 15.7 3.9 19.9 111.0 20.0 107.0 249.0 194.7 156.9
Number 192 250 340 436 487 553 518 605 589 442 4412Total value 6122.5 22965.3 22053.0 33418.6 33833.1 82011.6 50871.6 203775.9 383736.9 99201.9 937990.4
Total
Ave value 58.3 141.8 109.2 111.8 92.9 227.8 149.6 463.1 858.5 311.0 308.8
Source: Thomson Financial, SDC Platinum.

343
Table A.3All Pacific Rim countriesAll values in USD millions
Deals classified by country and sector of target firm
1990 1991 1992 1993 1994 1995 1996 1997 1998 1999 Total
Deal typeNumber 10 18 6 22 12 20 27 43 44 112 314Total value 8242.9 421.7 5.4 196.9 2074.0 34524.3 2896.8 1413.6 1661.2 78164.2 129601.0
Withinborder/withinindustry
Ave value 1648.6 84.3 5.4 24.6 345.7 4315.5 482.8 176.7 103.8 2233.3 1322.5
Number 3 3 2 4 5 8 10 12 7 25 79Total value 221.3 164.7 34.1 998.9 160.9 202.5 666.5 848.6 239.8 1281.7 4819.0
Withinborder/crossindustry
Ave value 73.8 82.4 34.1 249.7 40.2 101.3 133.3 121.2 60.0 91.6 104.8
Number 1 6 7 3 7 12 7 5 7 12 67Total value 0.0 33.4 216.1 116.9 196.5 1515.5 124.2 62.8 1002.2 2305.8 5573.4
Cross-border/withinindustry
Ave value 0.0 33.4 72.0 116.9 49.1 378.9 62.1 20.9 501.1 288.2 199.1
Number 0 2 0 3 1 8 4 3 6 3 30Total value 0.0 7.1 0.0 8.0 36.6 32.4 83.2 17.2 673.5 1388.3 2246.3
Cross-border/crossindustry
Ave value 0.0 7.1 0.0 4.0 36.6 8.1 41.6 8.6 168.4 694.2 124.8
Deal typeNumber 13 21 8 26 17 28 37 55 51 137 393Total value 8464.2 586.4 39.5 1195.8 2234.9 34726.8 3563.3 2262.2 1901.0 79445.9 134420.0
Withinborder
Ave value 1058.0 83.8 19.8 99.7 223.5 3472.7 323.9 150.8 95.1 1621.3 933.5
Number 1 8 7 6 8 20 11 8 13 15 97Total value 0.0 40.5 216.1 124.9 233.1 1547.9 207.4 80.0 1675.7 3694.1 7819.7
Cross-border
Ave value 0.0 20.3 72.0 41.6 46.6 193.5 51.9 16.0 279.3 369.4 170.0
Deal typeNumber 11 24 13 25 19 32 34 48 51 124 381Total value 8242.9 455.1 221.5 313.8 2270.5 36039.8 3021.0 1476.4 2663.4 80470.0 135174.4
Withinindustry
Ave value 1648.6 75.9 55.4 34.9 227.1 3003.3 377.6 134.2 148.0 1871.4 1072.8
Number 3 5 2 7 6 16 14 15 13 28 109Total value 221.3 171.8 34.1 1006.9 197.5 234.9 749.7 865.8 913.3 2670.0 7065.3
Crossindustry
Ave value 73.8 57.3 34.1 167.8 39.5 39.2 107.1 96.2 114.2 166.9 110.4
IndustryNumber 12 12 3 18 9 20 23 27 23 58 205Total value 8463.9 32.2 0.0 526.4 2246.5 35251.4 2817.2 1816.6 1392.9 76182.2 128729.3
Banking
Ave value 1209.1 16.1 0.0 52.6 374.4 3916.8 402.5 227.1 154.8 3312.3 1589.3
Number 1 4 5 4 2 8 5 5 6 12 52Total value 0.0 164.7 162.1 0.0 0.5 952.0 302.8 29.1 1946.9 3210.7 6768.8
Insurance
Ave value 0.0 82.4 54.0 0.0 0.5 317.3 151.4 29.1 486.7 535.1 307.7
Number 1 13 7 10 14 20 20 31 35 82 233Total value 0.3 430.0 93.5 794.3 221.0 71.3 650.7 496.5 236.9 3747.1 6741.6
Securities/Other
Ave value 0.3 86.0 46.8 158.9 27.6 11.9 108.5 45.1 18.2 124.9 77.5
Number 14 29 15 32 25 48 48 63 64 152 490Total value 8464.2 626.9 255.6 1320.7 2468.0 36274.7 3770.7 2342.2 3576.7 83140.0 142239.7Ave value 1058.0 69.7 51.1 88.0 164.5 2015.3 251.4 117.1 137.6 1409.2 748.6
GDP 3290581 3719670 4024401 4584213 5037737 5521440 5015633 4626124 4189702 4759985 44769487
Total
Value/GDP 0.26% 0.02% 0.01% 0.03% 0.05% 0.66% 0.08% 0.05% 0.09% 1.75% 0.32%
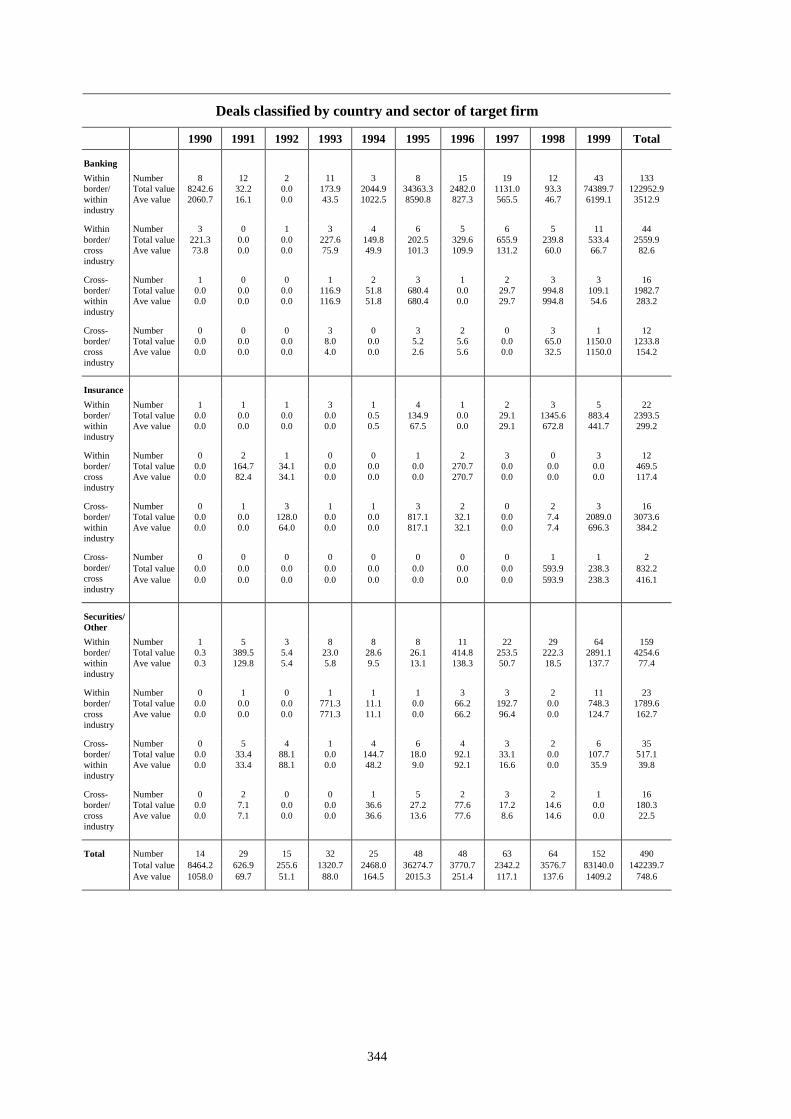
344
Deals classified by country and sector of target firm
1990 1991 1992 1993 1994 1995 1996 1997 1998 1999 Total
BankingNumber 8 12 2 11 3 8 15 19 12 43 133Total value 8242.6 32.2 0.0 173.9 2044.9 34363.3 2482.0 1131.0 93.3 74389.7 122952.9
Withinborder/withinindustry
Ave value 2060.7 16.1 0.0 43.5 1022.5 8590.8 827.3 565.5 46.7 6199.1 3512.9
Number 3 0 1 3 4 6 5 6 5 11 44Total value 221.3 0.0 0.0 227.6 149.8 202.5 329.6 655.9 239.8 533.4 2559.9
Withinborder/crossindustry
Ave value 73.8 0.0 0.0 75.9 49.9 101.3 109.9 131.2 60.0 66.7 82.6
Number 1 0 0 1 2 3 1 2 3 3 16Total value 0.0 0.0 0.0 116.9 51.8 680.4 0.0 29.7 994.8 109.1 1982.7
Cross-border/withinindustry
Ave value 0.0 0.0 0.0 116.9 51.8 680.4 0.0 29.7 994.8 54.6 283.2
Number 0 0 0 3 0 3 2 0 3 1 12Total value 0.0 0.0 0.0 8.0 0.0 5.2 5.6 0.0 65.0 1150.0 1233.8
Cross-border/crossindustry
Ave value 0.0 0.0 0.0 4.0 0.0 2.6 5.6 0.0 32.5 1150.0 154.2
InsuranceNumber 1 1 1 3 1 4 1 2 3 5 22Total value 0.0 0.0 0.0 0.0 0.5 134.9 0.0 29.1 1345.6 883.4 2393.5
Withinborder/withinindustry
Ave value 0.0 0.0 0.0 0.0 0.5 67.5 0.0 29.1 672.8 441.7 299.2
Number 0 2 1 0 0 1 2 3 0 3 12Total value 0.0 164.7 34.1 0.0 0.0 0.0 270.7 0.0 0.0 0.0 469.5
Withinborder/crossindustry
Ave value 0.0 82.4 34.1 0.0 0.0 0.0 270.7 0.0 0.0 0.0 117.4
Number 0 1 3 1 1 3 2 0 2 3 16Total value 0.0 0.0 128.0 0.0 0.0 817.1 32.1 0.0 7.4 2089.0 3073.6
Cross-border/withinindustry
Ave value 0.0 0.0 64.0 0.0 0.0 817.1 32.1 0.0 7.4 696.3 384.2
Number 0 0 0 0 0 0 0 0 1 1 2Total value 0.0 0.0 0.0 0.0 0.0 0.0 0.0 0.0 593.9 238.3 832.2
Cross-border/crossindustry
Ave value 0.0 0.0 0.0 0.0 0.0 0.0 0.0 0.0 593.9 238.3 416.1
Securities/Other
Number 1 5 3 8 8 8 11 22 29 64 159Total value 0.3 389.5 5.4 23.0 28.6 26.1 414.8 253.5 222.3 2891.1 4254.6
Withinborder/withinindustry
Ave value 0.3 129.8 5.4 5.8 9.5 13.1 138.3 50.7 18.5 137.7 77.4
Number 0 1 0 1 1 1 3 3 2 11 23Total value 0.0 0.0 0.0 771.3 11.1 0.0 66.2 192.7 0.0 748.3 1789.6
Withinborder/crossindustry
Ave value 0.0 0.0 0.0 771.3 11.1 0.0 66.2 96.4 0.0 124.7 162.7
Number 0 5 4 1 4 6 4 3 2 6 35Total value 0.0 33.4 88.1 0.0 144.7 18.0 92.1 33.1 0.0 107.7 517.1
Cross-border/withinindustry
Ave value 0.0 33.4 88.1 0.0 48.2 9.0 92.1 16.6 0.0 35.9 39.8
Number 0 2 0 0 1 5 2 3 2 1 16Total value 0.0 7.1 0.0 0.0 36.6 27.2 77.6 17.2 14.6 0.0 180.3
Cross-border/crossindustry
Ave value 0.0 7.1 0.0 0.0 36.6 13.6 77.6 8.6 14.6 0.0 22.5
Number 14 29 15 32 25 48 48 63 64 152 490Total value 8464.2 626.9 255.6 1320.7 2468.0 36274.7 3770.7 2342.2 3576.7 83140.0 142239.7
Total
Ave value 1058.0 69.7 51.1 88.0 164.5 2015.3 251.4 117.1 137.6 1409.2 748.6

345
Deals classified by country and sector of acquiring firm
1990 1991 1992 1993 1994 1995 1996 1997 1998 1999 Total
Deal typeNumber 10 18 6 22 12 20 27 42 44 112 313Total value 8242.9 421.7 5.4 196.9 2074.0 34524.3 2896.8 1413.6 1661.2 78164.2 129601.0
Withinborder/withinindustry
Ave value 1648.6 84.3 5.4 24.6 345.7 4315.5 482.8 176.7 103.8 2233.3 1322.5
Number 3 3 2 4 5 8 10 12 7 25 79Total value 221.3 164.7 34.1 998.9 160.9 202.5 666.5 848.6 239.8 1281.7 4819.0
Withinborder/crossindustry
Ave value 73.8 82.4 34.1 249.7 40.2 101.3 133.3 121.2 60.0 91.6 104.8
Number 5 4 7 5 6 10 8 5 7 12 69Total value 1661.2 3.4 980.8 34.6 137.2 1826.1 1316.9 1296.1 77.7 224.3 7558.3
Cross-border/withinindustry
Ave value 553.7 3.4 326.9 17.3 34.3 456.5 439.0 648.1 25.9 44.9 251.9
Number 2 1 0 3 0 7 2 1 5 4 25Total value 48.0 0.0 0.0 25.8 0.0 103.4 77.6 9.3 3904.1 160.9 4329.1
Cross-border/crossindustry
Ave value 48.0 0.0 0.0 25.8 0.0 25.9 77.6 9.3 976.0 160.9 333.0
Deal typeNumber 13 21 8 26 17 28 37 54 51 137 392Total value 8464.2 586.4 39.5 1195.8 2234.9 34726.8 3563.3 2262.2 1901.0 79445.9 134420.0
Withinborder
Ave value 1058.0 83.8 19.8 99.7 223.5 3472.7 323.9 150.8 95.1 1621.3 933.5
Number 7 5 7 8 6 17 10 6 12 16 94Total value 1709.2 3.4 980.8 60.4 137.2 1929.5 1394.5 1305.4 3981.8 385.2 11887.4
Cross-border
Ave value 427.3 3.4 326.9 20.1 34.3 241.2 348.6 435.1 568.8 64.2 276.5
Deal typeNumber 15 22 13 27 18 30 35 47 51 124 382Total value 9904.1 425.1 986.2 231.5 2211.2 36350.4 4213.7 2709.7 1738.9 78388.5 137159.3
Withinindustry
Ave value 1238.0 70.9 246.6 23.2 221.1 3029.2 468.2 271.0 91.5 1959.7 1071.6
Number 5 4 2 7 5 15 12 13 12 29 104Total value 269.3 164.7 34.1 1024.7 160.9 305.9 744.1 857.9 4143.9 1442.6 9148.1
Crossindustry
Ave value 67.3 82.4 34.1 204.9 40.2 51.0 124.0 107.2 518.0 96.2 155.1
IndustryNumber 11 13 3 16 5 17 23 25 13 59 185Total value 9848.0 32.2 809.1 979.2 2096.7 36243.9 4103.7 2611.0 93.3 75142.9 131960.0
Banking
Ave value 1969.6 16.1 809.1 163.2 698.9 5177.7 586.2 522.2 46.7 3954.9 2315.1
Number 5 2 3 4 5 9 5 5 8 12 58Total value 137.6 0.0 83.6 0.0 14.8 162.1 109.7 47.2 1977.0 1010.7 3542.7
Insurance
Ave value 45.9 0.0 83.6 0.0 4.9 40.5 54.9 15.7 494.3 336.9 154.0
Number 4 11 9 14 13 19 19 30 42 82 243Total value 187.8 557.6 127.6 277.0 260.6 250.3 744.4 909.4 3812.5 3677.5 10804.7
Securities/Other
Ave value 47.0 92.9 42.5 30.8 32.6 35.8 124.1 90.9 181.5 111.4 101.0
Number 20 26 15 34 23 45 47 60 63 153 486Total value 10173.4 589.8 1020.3 1256.2 2372.1 36656.3 4957.8 3567.6 5882.8 79831.1 146307.4Ave value 847.8 73.7 204.1 83.7 169.4 2036.5 330.5 198.2 217.9 1451.5 782.4
GDP 3290581 3719670 4024401 4584213 5037737 5521440 5015633 4626124 4189702 4759985 44769487
Total
Value/GDP 0.31% 0.02% 0.03% 0.03% 0.05% 0.66% 0.10% 0.08% 0.14% 1.68% 0.33%

346
Deals classified by country and sector of acquiring firm
1990 1991 1992 1993 1994 1995 1996 1997 1998 1999 Total
BankingNumber 8 12 2 11 3 8 15 19 12 43 133Total value 8242.6 32.2 0.0 173.9 2044.9 34363.3 2482.0 1131.0 93.3 74389.7 122952.9
Withinborder/withinindustry
Ave value 2060.7 16.1 0.0 43.5 1022.5 8590.8 827.3 565.5 46.7 6199.1 3512.9
Number 0 0 0 1 0 2 4 2 1 12 22Total value 0.0 0.0 0.0 771.3 0.0 0.0 336.9 183.9 0.0 748.3 2040.4
Withinborder/crossindustry
Ave value 0.0 0.0 0.0 771.3 0.0 0.0 168.5 183.9 0.0 124.7 204.0
Number 3 0 1 3 2 4 4 4 0 2 23Total value 1605.4 0.0 809.1 34.0 51.8 1808.1 1284.8 1296.1 0.0 4.9 6894.2
Cross-border/withinindustry
Ave value 1605.4 0.0 809.1 34.0 51.8 904.1 642.4 648.1 0.0 4.9 626.7
Number 0 1 0 1 0 3 0 0 0 2 7Total value 0.0 0.0 0.0 0.0 0.0 72.5 0.0 0.0 0.0 0.0 72.5
Cross-border/crossindustry
Ave value 0.0 0.0 0.0 0.0 0.0 72.5 0.0 0.0 0.0 0.0 72.5
InsuranceNumber 1 1 1 3 1 4 1 2 3 5 22Total value 0.0 0.0 0.0 0.0 0.5 134.9 0.0 29.1 1345.6 883.4 2393.5
Withinborder/withinindustry
Ave value 0.0 0.0 0.0 0.0 0.5 67.5 0.0 29.1 672.8 441.7 299.2
Number 1 1 0 0 2 2 0 2 1 2 11Total value 64.6 0.0 0.0 0.0 11.1 0.0 0.0 8.8 0.0 0.0 84.5
Withinborder/crossindustry
Ave value 64.6 0.0 0.0 0.0 11.1 0.0 0.0 8.8 0.0 0.0 28.2
Number 1 0 2 1 2 1 2 0 3 4 16Total value 25.0 0.0 83.6 0.0 3.2 0.0 32.1 0.0 3.0 127.3 274.2
Cross-border/withinindustry
Ave value 25.0 0.0 83.6 0.0 3.2 0.0 32.1 0.0 3.0 127.3 45.7
Number 2 0 0 0 0 2 2 1 1 1 9Total value 48.0 0.0 0.0 0.0 0.0 27.2 77.6 9.3 628.4 0.0 790.5
Cross-border/crossindustry
Ave value 48.0 0.0 0.0 0.0 0.0 13.6 77.6 9.3 628.4 0.0 131.8
Securities/Other
Number 1 5 3 8 8 8 11 21 29 64 158Total value 0.3 389.5 5.4 23.0 28.6 26.1 414.8 253.5 222.3 2891.1 4254.6
Withinborder/withinindustry
Ave value 0.3 129.8 5.4 5.8 9.5 13.1 138.3 50.7 18.5 137.7 77.4
Number 2 2 2 3 3 4 6 8 5 11 46Total value 156.7 164.7 34.1 227.6 149.8 202.5 329.6 655.9 239.8 533.4 2694.1
Withinborder/crossindustry
Ave value 78.4 82.4 34.1 75.9 49.9 101.3 109.9 131.2 60.0 66.7 81.6
Number 1 4 4 1 2 5 2 1 4 6 30Total value 30.8 3.4 88.1 0.6 82.2 18.0 0.0 0.0 74.7 92.1 389.9
Cross-border/withinindustry
Ave value 30.8 3.4 88.1 0.6 41.1 9.0 0.0 0.0 37.4 30.7 30.0
Number 0 0 0 2 0 2 0 0 4 1 9Total value 0.0 0.0 0.0 25.8 0.0 3.7 0.0 0.0 3275.7 160.9 3466.1
Cross-border/crossindustry
Ave value 0.0 0.0 0.0 25.8 0.0 3.7 0.0 0.0 1091.9 160.9 577.7
Number 20 26 15 34 23 45 47 60 63 153 486Total value 10173.4 589.8 1020.3 1256.2 2372.1 36656.3 4957.8 3567.6 5882.8 79831.1 146307.4
Total
Ave value 847.8 73.7 204.1 83.7 169.4 2036.5 330.5 198.2 217.9 1451.5 782.4
Source: Thomson Financial, SDC Platinum.
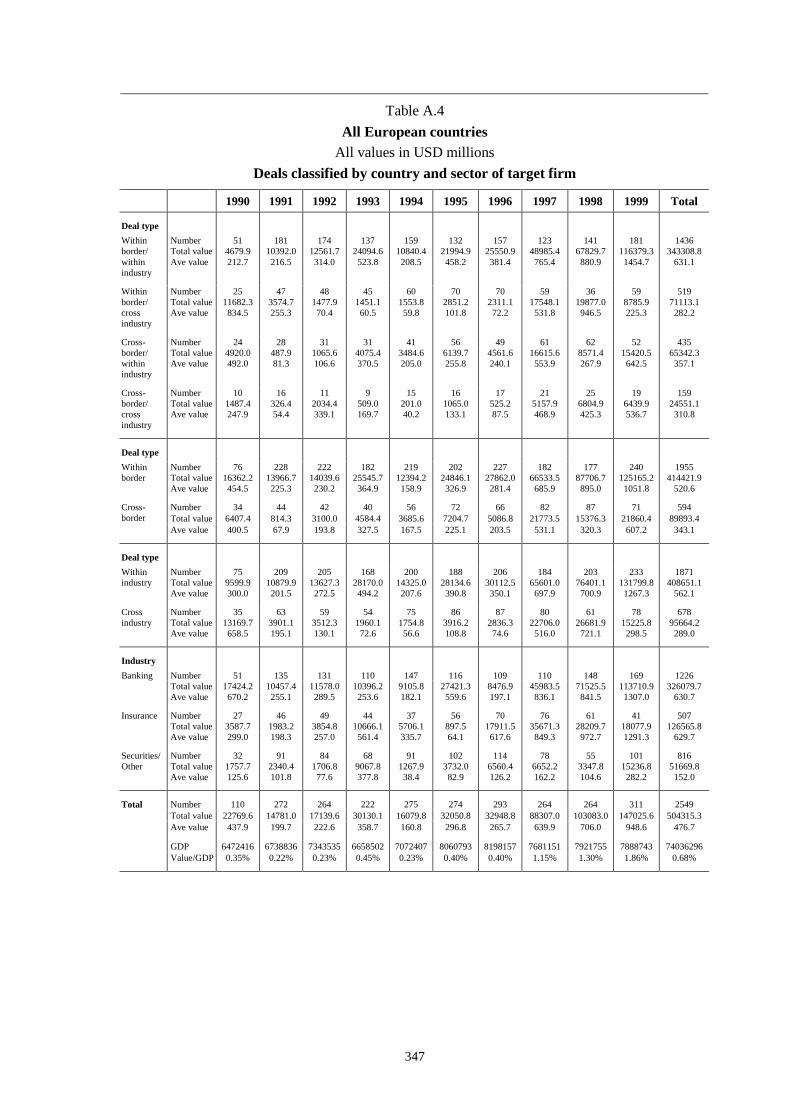
347
Table A.4All European countries
All values in USD millionsDeals classified by country and sector of target firm
1990 1991 1992 1993 1994 1995 1996 1997 1998 1999 Total
Deal typeNumber 51 181 174 137 159 132 157 123 141 181 1436Total value 4679.9 10392.0 12561.7 24094.6 10840.4 21994.9 25550.9 48985.4 67829.7 116379.3 343308.8
Withinborder/withinindustry
Ave value 212.7 216.5 314.0 523.8 208.5 458.2 381.4 765.4 880.9 1454.7 631.1
Number 25 47 48 45 60 70 70 59 36 59 519Total value 11682.3 3574.7 1477.9 1451.1 1553.8 2851.2 2311.1 17548.1 19877.0 8785.9 71113.1
Withinborder/crossindustry
Ave value 834.5 255.3 70.4 60.5 59.8 101.8 72.2 531.8 946.5 225.3 282.2
Number 24 28 31 31 41 56 49 61 62 52 435Total value 4920.0 487.9 1065.6 4075.4 3484.6 6139.7 4561.6 16615.6 8571.4 15420.5 65342.3
Cross-border/withinindustry
Ave value 492.0 81.3 106.6 370.5 205.0 255.8 240.1 553.9 267.9 642.5 357.1
Number 10 16 11 9 15 16 17 21 25 19 159Total value 1487.4 326.4 2034.4 509.0 201.0 1065.0 525.2 5157.9 6804.9 6439.9 24551.1
Cross-border/crossindustry
Ave value 247.9 54.4 339.1 169.7 40.2 133.1 87.5 468.9 425.3 536.7 310.8
Deal typeNumber 76 228 222 182 219 202 227 182 177 240 1955Total value 16362.2 13966.7 14039.6 25545.7 12394.2 24846.1 27862.0 66533.5 87706.7 125165.2 414421.9
Withinborder
Ave value 454.5 225.3 230.2 364.9 158.9 326.9 281.4 685.9 895.0 1051.8 520.6
Number 34 44 42 40 56 72 66 82 87 71 594Total value 6407.4 814.3 3100.0 4584.4 3685.6 7204.7 5086.8 21773.5 15376.3 21860.4 89893.4
Cross-border
Ave value 400.5 67.9 193.8 327.5 167.5 225.1 203.5 531.1 320.3 607.2 343.1
Deal typeNumber 75 209 205 168 200 188 206 184 203 233 1871Total value 9599.9 10879.9 13627.3 28170.0 14325.0 28134.6 30112.5 65601.0 76401.1 131799.8 408651.1
Withinindustry
Ave value 300.0 201.5 272.5 494.2 207.6 390.8 350.1 697.9 700.9 1267.3 562.1
Number 35 63 59 54 75 86 87 80 61 78 678Total value 13169.7 3901.1 3512.3 1960.1 1754.8 3916.2 2836.3 22706.0 26681.9 15225.8 95664.2
Crossindustry
Ave value 658.5 195.1 130.1 72.6 56.6 108.8 74.6 516.0 721.1 298.5 289.0
IndustryNumber 51 135 131 110 147 116 109 110 148 169 1226Total value 17424.2 10457.4 11578.0 10396.2 9105.8 27421.3 8476.9 45983.5 71525.5 113710.9 326079.7
Banking
Ave value 670.2 255.1 289.5 253.6 182.1 559.6 197.1 836.1 841.5 1307.0 630.7
Number 27 46 49 44 37 56 70 76 61 41 507Total value 3587.7 1983.2 3854.8 10666.1 5706.1 897.5 17911.5 35671.3 28209.7 18077.9 126565.8
Insurance
Ave value 299.0 198.3 257.0 561.4 335.7 64.1 617.6 849.3 972.7 1291.3 629.7
Number 32 91 84 68 91 102 114 78 55 101 816Total value 1757.7 2340.4 1706.8 9067.8 1267.9 3732.0 6560.4 6652.2 3347.8 15236.8 51669.8
Securities/Other
Ave value 125.6 101.8 77.6 377.8 38.4 82.9 126.2 162.2 104.6 282.2 152.0
Number 110 272 264 222 275 274 293 264 264 311 2549Total value 22769.6 14781.0 17139.6 30130.1 16079.8 32050.8 32948.8 88307.0 103083.0 147025.6 504315.3Ave value 437.9 199.7 222.6 358.7 160.8 296.8 265.7 639.9 706.0 948.6 476.7
GDP 6472416 6738836 7343535 6658502 7072407 8060793 8198157 7681151 7921755 7888743 74036296
Total
Value/GDP 0.35% 0.22% 0.23% 0.45% 0.23% 0.40% 0.40% 1.15% 1.30% 1.86% 0.68%

348
Deals classified by country and sector of target firm
1990 1991 1992 1993 1994 1995 1996 1997 1998 1999 Total
Banking
Number 22 90 89 72 93 66 70 66 89 113 770Total value 3904.4 7470.3 8727.9 8869.5 7292.3 21501.6 7601.2 39640.9 49851.2 104211.8 259071.1
Withinborder/withinindustry
Ave value 354.9 339.6 396.7 341.1 251.5 767.9 271.5 1132.6 977.5 2043.4 855.0
Number 14 24 23 23 31 24 19 19 20 28 225Total value 10145.0 2486.2 859.6 840.6 1110.2 950.5 159.9 580.7 15956.1 2753.3 35842.1
Withinborder/crossindustry
Ave value 1268.1 226.0 86.0 70.1 92.5 135.8 22.8 96.8 1227.4 153.0 344.6
Number 10 12 14 12 16 20 12 21 28 18 163Total value 2155.5 276.7 229.7 299.9 588.2 4381.5 223.6 962.6 3218.9 1178.5 13515.1
Cross-border/withinindustry
Ave value 431.1 69.2 76.6 150.0 98.0 438.2 55.9 96.3 229.9 117.9 198.8
Number 5 9 5 3 7 6 8 4 11 10 68Total value 1219.3 224.2 1760.8 386.2 115.1 587.7 492.2 4799.3 2499.3 5567.3 17651.4
Cross-border/crossindustry
Ave value 609.7 56.1 440.2 386.2 38.4 146.9 123.1 1199.8 357.0 695.9 430.5
Insurance
Number 11 26 29 24 12 20 31 25 26 19 223Total value 743.8 621.7 2775.4 7015.2 2820.6 27.1 16776.0 8730.5 16443.0 10749.1 66702.4
Withinborder/withinindustry
Ave value 124.0 155.4 555.1 876.9 564.1 4.5 1398.0 623.6 2055.4 2149.8 913.7
Number 4 5 9 5 5 15 16 15 7 5 86Total value 17.6 1048.1 278.0 309.1 49.7 444.3 246.3 16527.2 3563.1 384.8 22868.2
Withinborder/crossindustry
Ave value 17.6 524.1 69.5 77.3 16.6 148.1 27.4 1652.7 712.6 77.0 497.1
Number 10 13 10 12 18 20 21 30 24 15 173Total value 2733.7 211.2 801.4 3330.7 2809.8 342.2 889.2 10344.4 4965.8 6779.0 33207.4
Cross-border/withinindustry
Ave value 683.4 105.6 133.6 555.1 351.2 85.6 111.2 646.5 354.7 2259.7 467.7
Number 2 2 1 3 2 1 2 6 4 2 25Total value 92.6 102.2 0.0 11.1 26.0 83.9 0.0 69.2 3237.8 165.0 3787.8
Cross-border/crossindustry
Ave value 92.6 51.1 0.0 11.1 26.0 83.9 0.0 34.6 1618.9 165.0 344.3
Securities/Other
Number 18 65 56 41 54 46 56 32 26 49 443Total value 31.7 2300.0 1058.4 8209.9 727.5 466.2 1173.7 614.0 1535.5 1418.4 17535.3
Withinborder/withinindustry
Ave value 6.3 104.5 88.2 684.2 40.4 33.3 43.5 40.9 85.3 59.1 105.0
Number 7 18 16 17 24 31 35 25 9 26 208Total value 1519.7 40.4 340.3 301.4 393.9 1456.4 1904.9 440.2 357.8 5647.8 12402.8
Withinborder/crossindustry
Ave value 303.9 40.4 48.6 37.7 35.8 80.9 119.1 25.9 119.3 353.0 121.6
Number 4 3 7 7 7 16 16 10 10 19 99Total value 30.8 0.0 34.5 444.8 86.6 1416.0 3448.8 5308.6 386.7 7463.0 18619.8
Cross-border/withinindustry
Ave value 30.8 0.0 34.5 148.3 28.9 141.6 492.7 1327.2 96.7 678.5 423.2
Number 3 5 5 3 6 9 7 11 10 7 66Total value 175.5 0.0 273.6 111.7 59.9 393.4 33.0 289.4 1067.8 707.6 3111.9
Cross-border/crossindustry
Ave value 58.5 0.0 136.8 111.7 59.9 131.1 16.5 57.9 152.5 235.9 115.3
Number 110 272 264 222 275 274 293 264 264 311 2549Total value 22769.6 14781.0 17139.6 30130.1 16079.8 32050.8 32948.8 88307.0 103083.0 147025.6 504315.3
Total
Ave value 437.9 199.7 222.6 358.7 160.8 296.8 265.7 639.9 706.0 948.6 476.7

349
Deals classified by country and sector of acquiring firm
1990 1991 1992 1993 1994 1995 1996 1997 1998 1999 Total
Deal type
Number 51 181 174 137 159 132 157 124 142 181 1438Total value 4679.9 10392.0 12561.7 24094.6 10840.4 21994.9 25550.9 48985.4 67879.7 116379.3 343358.8
Withinborder/withinindustry
Ave value 212.7 216.5 314.0 523.8 208.5 458.2 381.4 765.4 870.3 1454.7 630.0
Number 25 47 48 45 61 70 70 59 36 59 520Total value 11682.3 3574.7 1477.9 1451.1 1553.8 2851.2 2311.1 17548.1 19877.0 8785.9 71113.1
Withinborder/crossindustry
Ave value 834.5 255.3 70.4 60.5 59.8 101.8 72.2 531.8 946.5 225.3 282.2
Number 37 39 39 32 50 74 63 61 74 97 566Total value 4625.8 408.6 1141.3 4861.7 3546.9 6812.9 12693.7 18119.7 19785.1 51000.0 122995.7
Cross-border/withinindustry
Ave value 355.8 51.1 81.5 374.0 186.7 212.9 470.1 696.9 471.1 1020.0 504.1
Number 12 22 14 8 12 27 23 27 29 38 212Total value 1395.8 431.3 2006.1 659.8 910.4 3274.9 2992.4 6975.8 1826.9 13802.2 34275.6
Cross-border/crossindustry
Ave value 232.6 43.1 222.9 165.0 227.6 297.7 427.5 581.3 130.5 530.9 332.8
Deal type
Number 76 228 222 182 220 202 227 183 178 240 1958Total value 16362.2 13966.7 14039.6 25545.7 12394.2 24846.1 27862.0 66533.5 87756.7 125165.2 414471.9
Withinborder
Ave value 454.5 225.3 230.2 364.9 158.9 326.9 281.4 685.9 886.4 1051.8 520.0
Number 49 61 53 40 62 101 86 88 103 135 778Total value 6021.6 839.9 3147.4 5521.5 4457.3 10087.8 15686.1 25095.5 21612.0 64802.2 157271.3
Cross-border
Ave value 316.9 46.7 136.8 324.8 193.8 234.6 461.4 660.4 385.9 852.7 453.2
Deal type
Number 88 220 213 169 209 206 220 185 216 278 2004Total value 9305.7 10800.6 13703.0 28956.3 14387.3 28807.8 38244.6 67105.1 87664.8 167379.3 466354.5
Withinindustry
Ave value 265.9 192.9 253.8 490.8 202.6 360.1 406.9 745.6 730.5 1287.5 591.1
Number 37 69 62 53 73 97 93 86 65 97 732Total value 13078.1 4006.0 3484.0 2110.9 2464.2 6126.1 5303.5 24523.9 21703.9 22588.1 105388.7
Crossindustry
Ave value 653.9 166.9 116.1 75.4 82.1 157.1 136.0 545.0 620.1 347.5 296.9
Industry
Number 49 130 125 102 138 144 130 125 140 184 1267Total value 4946.4 8789.4 9424.5 10436.2 9010.2 27630.6 12581.9 58345.7 65998.4 124873.1 332036.4
Banking
Ave value 206.1 293.0 304.0 260.9 204.8 425.1 233.0 911.7 825.0 1261.3 625.3
Number 40 58 55 49 47 62 69 67 71 71 589Total value 14400.6 1137.3 4029.8 11360.4 6128.0 2328.5 21913.0 27296.2 22057.5 48932.0 159583.3
Insurance
Ave value 757.9 94.8 183.2 493.9 278.5 122.6 876.5 802.8 735.3 1578.5 673.3
Number 36 101 95 71 97 97 114 79 70 120 880Total value 3036.8 4879.9 3732.7 9270.6 1713.3 4974.8 9053.2 5987.1 21312.8 16162.3 80123.5
Securities/Other
Ave value 253.1 128.4 124.4 386.3 50.4 142.1 167.7 161.8 473.6 248.7 214.2
Number 125 289 275 222 282 303 313 271 281 375 2736Total value 22383.8 14806.6 17187.0 31067.2 16851.5 34933.9 43548.1 91629.0 109368.7 189967.4 571743.2
Ave value 407.0 185.1 204.6 357.1 166.8 293.6 327.4 678.7 705.6 974.2 499.8GDP 6472416 6738836 7343535 6658502 7072407 8060793 8198157 7681151 7921755 7888743 74036296
Total
Value/GDP 0.35% 0.22% 0.23% 0.47% 0.24% 0.43% 0.53% 1.19% 1.38% 2.41% 0.77%

350
Deals classified by country and sector of acquiring firm
1990 1991 1992 1993 1994 1995 1996 1997 1998 1999 Total
Banking
Number 22 90 89 72 92 66 70 66 89 113 769Total value 3904.4 7470.3 8727.9 8869.5 7292.3 21501.6 7601.2 39640.9 49851.2 104211.8 259071.1
Withinborder/withinindustry
Ave value 354.9 339.6 396.7 341.1 251.5 767.9 271.5 1132.6 977.5 2043.4 852.2
Number 8 20 15 16 21 33 31 27 10 23 204Total value 156.9 1048.1 491.5 536.6 300.1 486.2 1704.5 12930.2 2352.9 2415.5 22422.5
Withinborder/crossindustry
Ave value 52.3 524.1 122.9 59.6 37.5 30.4 106.5 680.5 588.2 161.0 233.6
Number 15 13 17 11 17 29 17 20 29 36 204Total value 709.6 82.2 179.9 918.4 667.8 5064.6 2885.5 5453.4 13007.0 15348.8 44317.2
Cross-border/withinindustry
Ave value 101.4 41.1 45.0 229.6 111.3 297.9 360.7 908.9 722.6 639.5 456.9
Number 4 7 4 3 8 16 12 12 12 12 90Total value 175.5 188.8 25.2 111.7 750.0 578.2 390.7 321.2 787.3 2897.0 6225.6
Cross-border/crossindustry
Ave value 58.5 47.2 25.2 111.7 750.0 144.6 195.4 80.3 112.5 321.9 172.9
Insurance
Number 11 26 29 24 13 20 31 25 27 19 225Total value 743.8 621.7 2775.4 7015.2 2820.6 27.1 16776.0 8730.5 16493.0 10749.1 66752.4
Withinborder/withinindustry
Ave value 124.0 155.4 555.1 876.9 564.1 4.5 1398.0 623.6 1832.6 2149.8 902.1
Number 10 5 7 11 10 11 8 9 4 8 83Total value 8932.2 40.4 334.3 331.9 435.8 975.9 212.2 140.9 83.2 4246.1 15732.9
Withinborder/crossindustry
Ave value 1488.7 40.4 66.9 55.3 54.5 325.3 212.2 47.0 83.2 849.2 403.4
Number 17 21 16 12 23 28 27 29 34 36 243Total value 3916.2 325.5 899.2 3476.3 2811.7 1325.5 4923.9 12030.0 4835.8 28452.1 62996.2
Cross-border/withinindustry
Ave value 652.7 81.4 99.9 496.6 351.5 132.6 447.6 859.3 254.5 1896.8 611.6
Number 2 6 3 2 1 3 3 4 6 8 38Total value 808.4 149.7 20.9 537.0 59.9 0.0 0.9 6394.8 645.5 5484.7 14101.8
Cross-border/crossindustry
Ave value 808.4 49.9 7.0 268.5 59.9 0.0 0.9 2131.6 645.5 914.1 671.5
Securities/Other
Number 18 65 56 41 54 46 56 33 26 49 444Total value 31.7 2300.0 1058.4 8209.9 727.5 466.2 1173.7 614.0 1535.5 1418.4 17535.3
Withinborder/withinindustry
Ave value 6.3 104.5 88.2 684.2 40.4 33.3 43.5 40.9 85.3 59.1 105.0
Number 7 22 26 18 30 26 31 23 22 28 233Total value 2593.2 2486.2 652.1 582.6 817.9 1389.1 394.4 4477.0 17440.9 2124.3 32957.7
Withinborder/crossindustry
Ave value 518.6 226.0 54.3 64.7 81.8 154.3 26.3 407.0 1090.1 111.8 281.7
Number 5 5 6 9 10 17 19 12 11 25 119Total value 0.0 0.9 62.2 467.0 67.4 422.8 4884.3 636.3 1942.3 7199.1 15682.3
Crossborder/Withinindustry
Ave value 0.0 0.5 62.2 233.5 16.9 84.6 610.5 106.1 388.5 654.5 356.4
Number 6 9 7 3 3 8 8 11 11 18 84Total value 411.9 92.8 1960.0 11.1 100.5 2696.7 2600.8 259.8 394.1 5420.5 13948.2
Crossborder/Crossindustry
Ave value 206.0 30.9 392.0 11.1 50.3 385.2 650.2 52.0 65.7 492.8 303.2
Number 125 289 275 222 282 303 313 271 281 375 2736Total value 22383.8 14806.6 17187.0 31067.2 16851.5 34933.9 43548.1 91629.0 109368.7 189967.4 571743.2
Total
Ave value 407.0 185.1 204.6 357.1 166.8 293.6 327.4 678.7 705.6 974.2 499.8
Source: Thomson Financial, SDC Platinum.

351
Table A.5Country: United States
All values in USD millionsDeals classified by country and sector of target firm
1990 1991 1992 1993 1994 1995 1996 1997 1998 1999 Total
Deal type
Number 145 192 280 358 401 441 401 437 414 273 3342Total value 4117.6 21742.1 18743.4 28702.8 30683.4 71135.4 43697.9 167025.3 284220.7 70105.0 740173.6
Withinborder/withinindustry
Ave value 50.2 167.2 105.9 111.7 95.6 234.0 153.3 485.5 851.0 323.1 302.0
Number 21 17 28 36 42 52 50 65 68 77 456Total value 338.4 335.3 1870.8 3285.6 1665.7 5541.9 3627.0 19727.2 87616.8 9672.7 133681.4
Withinborder/crossindustry
Ave value 28.2 30.5 143.9 136.9 61.7 178.8 134.3 458.8 1788.1 193.5 465.8
Number 13 9 4 10 9 14 15 20 19 23 136Total value 1379.2 291.2 9.8 770.2 1267.7 3697.9 8530.4 9005.5 14124.1 28209.2 67285.2
Cross-border/withinindustry
Ave value 275.8 58.2 4.9 154.0 181.1 369.8 775.5 692.7 1086.5 2169.9 801.0
Number 7 5 5 2 3 5 3 7 6 7 50Total value 49.0 48.5 88.2 25.8 789.7 2244.9 2679.5 1986.9 533.1 3438.7 11884.3
Cross-border/crossindustry
Averagevalue
24.5 24.3 29.4 25.8 263.2 748.3 893.2 397.4 106.6 859.7 383.4
Deal type
Number 166 209 308 394 443 493 451 502 482 350 3798Total value 4456.0 22077.4 20614.2 31988.4 32349.1 76677.3 47324.9 186752.5 371837.5 79777.7 873855.0
Withinborder
Ave value 47.4 156.6 108.5 113.8 93.0 228.9 151.7 482.6 970.9 298.8 319.2
Number 20 14 9 12 12 19 18 27 25 30 186Total value 1428.2 339.7 98.0 796.0 2057.4 5942.8 11209.9 10992.4 14657.2 31647.9 79169.5
Cross-border
Ave value 204.0 48.5 19.6 132.7 205.7 457.1 800.7 610.7 814.3 1861.6 688.4
Deal type
Number 158 201 284 368 410 455 416 457 433 296 3478Total value 5496.8 22033.3 18753.2 29473.0 31951.1 74833.3 52228.3 176030.8 298344.8 98314.2 807458.8
Withinindustry
Ave value 63.2 163.2 104.8 112.5 97.4 238.3 176.4 493.1 859.8 427.5 318.5
Number 28 22 33 38 45 57 53 72 74 84 506Total value 387.4 383.8 1959.0 3311.4 2455.4 7786.8 6306.5 21714.1 88149.9 13111.4 145565.7
Crossindustry
Ave value 27.7 29.5 122.4 132.5 81.8 229.0 210.2 452.4 1632.4 242.8 457.8
Industry
Number 131 152 243 326 365 390 334 374 348 248 2911Total value 4413.9 20780.1 15046.4 18540.0 23204.4 73260.7 34942.2 136957.6 299610.0 70414.5 697169.8
Banking
Ave value 50.2 183.9 93.5 74.8 75.6 266.4 138.7 439.0 998.7 340.2 308.1
Number 23 36 46 36 37 56 66 56 69 47 472Total value 1329.4 1262.0 4986.9 5744.6 5656.8 4973.7 13635.1 17218.1 58583.0 23172.1 136561.7
Insurance
Ave value 132.9 63.1 172.0 337.9 245.9 142.1 349.6 573.9 1394.8 891.2 503.9
Number 32 35 28 44 53 66 69 99 90 85 601Total value 140.9 375.0 678.9 8499.8 5545.3 4385.7 9957.5 43569.2 28301.7 17839.0 119293.0
Securities/Other
Ave value 47.0 25.0 135.8 386.4 198.0 115.4 284.5 691.6 479.7 349.8 374.0
Number 186 223 317 406 455 512 469 529 507 380 3984Total value 5884.2 22417.1 20712.2 32784.4 34406.5 82620.1 58534.8 197744.9 386494.7 111425.6 953024.5Ave value 58.3 151.5 106.2 114.2 96.1 237.4 179.6 488.3 963.8 392.3 334.0
GDP 5803250 5986225 6318950 6642325 7054300 7400550 7813175 8300725 8759950 9256150 73335600
Total
Value/GDP 0.10% 0.37% 0.33% 0.49% 0.49% 1.12% 0.75% 2.38% 4.41% 1.20% 1.30%
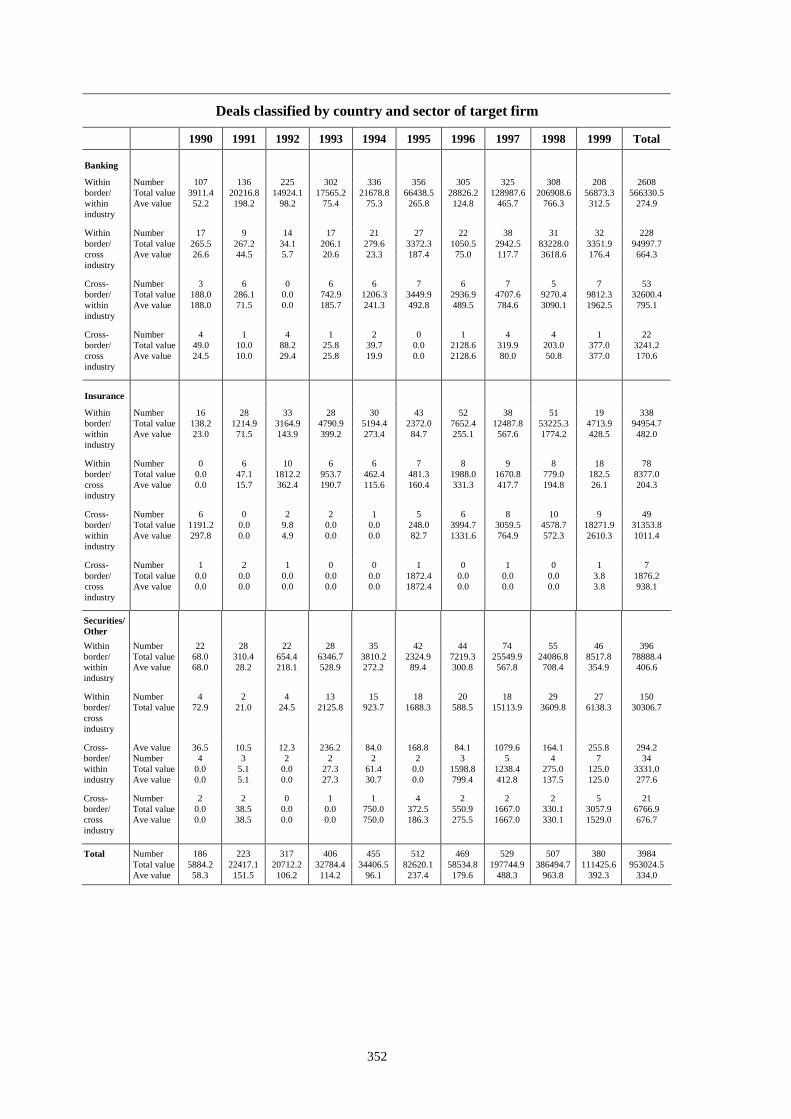
352
Deals classified by country and sector of target firm
1990 1991 1992 1993 1994 1995 1996 1997 1998 1999 Total
Banking
Number 107 136 225 302 336 356 305 325 308 208 2608Total value 3911.4 20216.8 14924.1 17565.2 21678.8 66438.5 28826.2 128987.6 206908.6 56873.3 566330.5
Withinborder/withinindustry
Ave value 52.2 198.2 98.2 75.4 75.3 265.8 124.8 465.7 766.3 312.5 274.9
Number 17 9 14 17 21 27 22 38 31 32 228Total value 265.5 267.2 34.1 206.1 279.6 3372.3 1050.5 2942.5 83228.0 3351.9 94997.7
Withinborder/crossindustry
Ave value 26.6 44.5 5.7 20.6 23.3 187.4 75.0 117.7 3618.6 176.4 664.3
Number 3 6 0 6 6 7 6 7 5 7 53Total value 188.0 286.1 0.0 742.9 1206.3 3449.9 2936.9 4707.6 9270.4 9812.3 32600.4
Cross-border/withinindustry
Ave value 188.0 71.5 0.0 185.7 241.3 492.8 489.5 784.6 3090.1 1962.5 795.1
Number 4 1 4 1 2 0 1 4 4 1 22Total value 49.0 10.0 88.2 25.8 39.7 0.0 2128.6 319.9 203.0 377.0 3241.2
Cross-border/crossindustry
Ave value 24.5 10.0 29.4 25.8 19.9 0.0 2128.6 80.0 50.8 377.0 170.6
Insurance
Number 16 28 33 28 30 43 52 38 51 19 338Total value 138.2 1214.9 3164.9 4790.9 5194.4 2372.0 7652.4 12487.8 53225.3 4713.9 94954.7
Withinborder/withinindustry
Ave value 23.0 71.5 143.9 399.2 273.4 84.7 255.1 567.6 1774.2 428.5 482.0
Number 0 6 10 6 6 7 8 9 8 18 78Total value 0.0 47.1 1812.2 953.7 462.4 481.3 1988.0 1670.8 779.0 182.5 8377.0
Withinborder/crossindustry
Ave value 0.0 15.7 362.4 190.7 115.6 160.4 331.3 417.7 194.8 26.1 204.3
Number 6 0 2 2 1 5 6 8 10 9 49Total value 1191.2 0.0 9.8 0.0 0.0 248.0 3994.7 3059.5 4578.7 18271.9 31353.8
Cross-border/withinindustry
Ave value 297.8 0.0 4.9 0.0 0.0 82.7 1331.6 764.9 572.3 2610.3 1011.4
Number 1 2 1 0 0 1 0 1 0 1 7Total value 0.0 0.0 0.0 0.0 0.0 1872.4 0.0 0.0 0.0 3.8 1876.2
Cross-border/crossindustry
Ave value 0.0 0.0 0.0 0.0 0.0 1872.4 0.0 0.0 0.0 3.8 938.1
Securities/Other
Number 22 28 22 28 35 42 44 74 55 46 396Total value 68.0 310.4 654.4 6346.7 3810.2 2324.9 7219.3 25549.9 24086.8 8517.8 78888.4
Withinborder/withinindustry
Ave value 68.0 28.2 218.1 528.9 272.2 89.4 300.8 567.8 708.4 354.9 406.6
Number 4 2 4 13 15 18 20 18 29 27 150Withinborder/crossindustry
Total value 72.9 21.0 24.5 2125.8 923.7 1688.3 588.5 15113.9 3609.8 6138.3 30306.7
Ave value 36.5 10.5 12.3 236.2 84.0 168.8 84.1 1079.6 164.1 255.8 294.2Number 4 3 2 2 2 2 3 5 4 7 34Total value 0.0 5.1 0.0 27.3 61.4 0.0 1598.8 1238.4 275.0 125.0 3331.0
Cross-border/withinindustry Ave value 0.0 5.1 0.0 27.3 30.7 0.0 799.4 412.8 137.5 125.0 277.6
Number 2 2 0 1 1 4 2 2 2 5 21Total value 0.0 38.5 0.0 0.0 750.0 372.5 550.9 1667.0 330.1 3057.9 6766.9
Cross-border/crossindustry
Ave value 0.0 38.5 0.0 0.0 750.0 186.3 275.5 1667.0 330.1 1529.0 676.7
Number 186 223 317 406 455 512 469 529 507 380 3984Total value 5884.2 22417.1 20712.2 32784.4 34406.5 82620.1 58534.8 197744.9 386494.7 111425.6 953024.5
Total
Ave value 58.3 151.5 106.2 114.2 96.1 237.4 179.6 488.3 963.8 392.3 334.0

353
Deals classified by country and sector of acquiring firm
1990 1991 1992 1993 1994 1995 1996 1997 1998 1999 Total
Deal type
Number 145 192 280 358 401 441 401 437 413 272 3340Total value 4117.6 21742.1 18743.4 28702.8 30683.4 71135.4 43697.9 167025.3 284170.7 70105.0 740123.6
Withinborder/withinindustry
Ave value 50.2 167.2 105.9 111.7 95.6 234.0 153.3 485.5 853.4 323.1 302.1
Number 21 17 28 36 41 52 50 65 68 77 455Total value 338.4 335.3 1870.8 3285.6 1665.7 5541.9 3627.0 19727.2 87616.8 9672.7 133681.4
Withinborder/crossindustry
Ave value 28.2 30.5 143.9 136.9 61.7 178.8 134.3 458.8 1788.1 193.5 465.8
Number 7 9 5 15 18 35 29 32 44 31 225Total value 448.0 437.2 922.8 397.4 747.8 4727.1 1182.2 8161.3 6537.9 8098.0 31659.7
Cross-border/withinindustry
Ave value 112.0 109.3 307.6 79.5 93.5 278.1 107.5 583.0 311.3 449.9 301.5
Number 4 3 4 3 5 4 5 12 18 16 74Total value 254.6 10.6 248.4 19.3 10.6 222.0 3.0 1755.6 2807.2 2440.5 7771.8
Cross-border/crossindustry
Ave value 254.6 5.3 248.4 9.7 10.6 111.0 3.0 219.5 187.1 221.9 176.6
Deal type
Number 166 209 308 394 442 493 451 502 481 349 3795Total value 4456.0 22077.4 20614.2 31988.4 32349.1 76677.3 47324.9 186752.5 371787.5 79777.7 873805.0
Withinborder
Ave value 47.4 156.6 108.5 113.8 93.0 228.9 151.7 482.6 973.3 298.8 319.3
Number 11 12 9 18 23 39 34 44 62 47 299Total value 702.6 447.8 1171.2 416.7 758.4 4949.1 1185.2 9916.9 9345.1 10538.5 39431.5
Cross-border
Ave value 140.5 74.6 292.8 59.5 84.3 260.5 98.8 450.8 259.6 363.4 264.6
Deal type
Number 152 201 285 373 419 476 430 469 457 303 3565Total value 4565.6 22179.3 19666.2 29100.2 31431.2 75862.5 44880.1 175186.6 290708.6 78203.0 771783.3
Withinindustry
Ave value 53.1 165.5 109.3 111.1 95.5 236.3 151.6 489.3 821.2 332.8 302.1
Number 25 20 32 39 46 56 55 77 86 93 529Total value 593.0 345.9 2119.2 3304.9 1676.3 5763.9 3630.0 21482.8 90424.0 12113.2 141453.2
Crossindustry
Ave value 45.6 26.6 151.4 127.1 59.9 174.7 129.6 421.2 1412.9 198.6 427.4
Industry
Number 113 142 235 327 356 381 339 361 362 255 2871Total value 4316.0 20471.0 15197.0 20866.7 22528.9 71417.4 32239.6 138935.1 212713.0 68393.8 607078.5
Banking
Ave value 55.3 191.3 98.0 83.8 75.1 269.5 129.5 460.1 702.0 315.2 272.8
Number 22 34 37 38 43 67 67 61 74 36 479Total value 360.2 1426.1 3179.7 4800.4 6113.2 2983.8 7844.1 22494.4 136854.6 7685.6 193742.1
Insurance
Ave value 36.0 75.1 127.2 320.0 226.4 78.5 237.7 703.0 2975.1 366.0 728.4
Number 42 45 45 47 66 84 79 124 107 105 744Total value 482.4 628.1 3408.7 6738.0 4465.4 7225.2 8426.4 35239.9 31565.0 14236.8 112415.9
Securities/Other
Ave value 43.9 29.9 243.5 280.8 148.8 141.7 200.6 469.9 457.5 245.5 284.6
Number 177 221 317 412 465 532 485 546 543 396 4094Total value 5158.6 22525.2 21785.4 32405.1 33107.5 81626.4 48510.1 196669.4 381132.6 90316.2 913236.5Ave value 52.1 153.2 112.3 112.5 92.7 230.6 149.7 480.9 911.8 305.1 316.4
GDP 5803250 5986225 6318950 6642325 7054300 7400550 7813175 8300725 8759950 9256150 73335600
Total
Value/GDP 0.09% 0.38% 0.34% 0.49% 0.47% 1.10% 0.62% 2.37% 4.35% 0.98% 1.25%

354
Deals classified by country and sector of acquiring firm
1990 1991 1992 1993 1994 1995 1996 1997 1998 1999 Total
Banking
Number 107 136 225 302 337 356 305 325 308 208 2609Total value 3911.4 20216.8 14924.1 17565.2 21678.8 66438.5 28826.2 128987.6 206908.6 56873.3 566330.5
Withinborder/withinindustry
Ave value 52.2 198.2 98.2 75.4 75.3 265.8 124.8 465.7 766.3 312.5 274.9
Number 4 3 6 15 13 14 22 19 32 34 162Total value 72.9 28.2 24.5 2962.3 171.2 1602.2 2563.2 7224.9 3253.7 5956.6 23859.7
Withinborder/crossindustry
Ave value 36.5 9.4 12.3 269.3 19.0 228.9 233.0 516.1 141.5 229.1 220.9
Number 2 3 1 7 5 11 11 13 19 10 82Total value 331.7 226.0 0.0 319.9 678.9 3376.7 847.2 1823.4 2491.3 4875.6 14970.7
Crossborder/withinindustry
Ave value 331.7 113.0 0.0 106.6 226.3 422.1 141.2 227.9 311.4 696.5 325.5
Number 0 0 3 3 1 0 1 4 3 3 18Total value 0.0 0.0 248.4 19.3 0.0 0.0 3.0 899.2 59.4 688.3 1917.6
Cross-border/crossindustry
Ave value 0.0 0.0 248.4 9.7 0.0 0.0 3.0 299.7 29.7 344.2 174.3
Insurance
Number 16 28 33 28 29 43 52 38 50 19 336Total value 138.2 1214.9 3164.9 4790.9 5194.4 2372.0 7652.4 12487.8 53175.3 4713.9 94904.7
Withinborder/withinindustry
Ave value 23.0 71.5 143.9 399.2 273.4 84.7 255.1 567.6 1833.6 428.5 484.2
Number 2 0 2 5 8 8 5 6 7 5 48Total value 110.7 0.0 5.0 7.1 892.9 164.6 0.0 9000.3 80829.5 245.2 91255.3
Withinborder/crossindustry
Ave value 55.4 0.0 5.0 3.6 148.8 41.2 0.0 2250.1 16165.9 81.7 3379.8
Number 3 5 2 5 6 16 9 14 14 11 85Total value 111.3 211.2 9.8 2.4 25.9 447.2 191.7 481.9 2778.1 2726.5 6986.0
Cross-border/withinindustry
Ave value 55.7 105.6 4.9 2.4 13.0 74.5 63.9 120.5 308.7 389.5 183.8
Number 1 1 0 0 0 0 1 3 3 1 10Total value 0.0 0.0 0.0 0.0 0.0 0.0 0.0 524.4 71.7 0.0 596.1
Cross-border/crossindustry
Ave value 0.0 0.0 0.0 0.0 0.0 0.0 0.0 262.2 23.9 0.0 119.2
Securities/Other
Number 22 28 22 28 35 42 44 74 55 45 395Total value 68.0 310.4 654.4 6346.7 3810.2 2324.9 7219.3 25549.9 24086.8 8517.8 78888.4
Withinborder/withinindustry
Ave value 68.0 28.2 218.1 528.9 272.2 89.4 300.8 567.8 708.4 354.9 406.6
Number 15 14 20 16 20 30 23 40 29 38 245Total value 154.8 307.1 1841.3 316.2 601.6 3775.1 1063.8 3502.0 3533.6 3470.9 18566.4
Withinborder/crossindustry
Ave value 19.4 38.4 184.1 28.7 50.1 188.8 66.5 140.1 168.3 165.3 122.1
Number 2 1 2 3 7 8 9 5 11 10 58Total value 5.0 0.0 913.0 75.1 43.0 903.2 143.3 5856.0 1268.5 495.9 9703.0
Cross-border/withinindustry
Ave value 5.0 0.0 913.0 75.1 14.3 301.1 71.7 2928.0 317.1 124.0 462.0
Number 3 2 1 0 4 4 3 5 12 12 46Total value 254.6 10.6 0.0 0.0 10.6 222.0 0.0 332.0 2676.1 1752.2 5258.1
Cross-border/crossindustry
Ave value 254.6 5.3 0.0 0.0 10.6 111.0 0.0 110.7 267.6 194.7 187.8
Number 177 221 317 412 465 532 485 546 543 396 4094Total value 5158.6 22525.2 21785.4 32405.1 33107.5 81626.4 48510.1 196669.4 381132.6 90316.2 913236.5TotalAve value 52.1 153.2 112.3 112.5 92.7 230.6 149.7 480.9 911.8 305.1 316.4
Source: Thomson Financial, SDC Platinum.

355
Table A.6Country: Canada
All values in USD millionsDeals classified by country and sector of target firm
1990 1991 1992 1993 1994 1995 1996 1997 1998 1999 Total
Deal type
Number 7 12 13 15 11 12 17 32 21 28 168Total value 722.1 50.6 30.0 611.4 23.2 123.3 893.7 4445.5 513.6 6628.3 14041.7
Withinborder/withinindustry
Ave value 240.7 12.7 7.5 101.9 11.6 24.7 297.9 296.4 36.7 552.4 206.5
Number 4 11 5 5 5 5 10 11 10 11 77Total value 53.8 324.3 221.9 390.0 299.4 261.9 569.7 79.1 170.0 2216.9 4587.0
Withinborder/crossindustry
Ave value 26.9 40.5 74.0 195.0 149.7 261.9 71.2 26.4 24.3 246.3 101.9
Number 1 2 2 2 2 5 4 1 8 3 30Total value 107.8 0.0 0.0 45.5 126.1 276.3 137.0 30.3 1277.8 2725.9 4726.7
Cross-border/withinindustry
Ave value 107.8 0.0 0.0 22.8 63.1 138.2 45.7 30.3 255.6 908.6 248.8
Number 2 0 0 0 0 0 1 1 0 2 6Total value 0.0 0.0 0.0 0.0 0.0 0.0 122.1 25.3 0.0 8.6 156.0
Cross-border/crossindustry
Ave value 0.0 0.0 0.0 0.0 0.0 0.0 122.1 25.3 0.0 8.6 52.0
Deal type
Number 11 23 18 20 16 17 27 43 31 39 245Total value 775.9 374.9 251.9 1001.4 322.6 385.2 1463.4 4524.6 683.6 8845.2 18628.7
Withinborder
Ave value 155.2 31.2 36.0 125.2 80.7 64.2 133.0 251.4 32.6 421.2 164.9
Number 3 2 2 2 2 5 5 2 8 5 36Total value 107.8 0.0 0.0 45.5 126.1 276.3 259.1 55.6 1277.8 2734.5 4882.7
Cross-border
Ave value 107.8 0.0 0.0 22.8 63.1 138.2 64.8 27.8 255.6 683.6 221.9
Deal type
Number 8 14 15 17 13 17 21 33 29 31 198Total value 829.9 50.6 30.0 656.9 149.3 399.6 1030.7 4475.8 1791.4 9354.2 18768.4
Withinindustry
Ave value 207.5 12.7 7.5 82.1 37.3 57.1 171.8 279.7 94.3 623.6 215.7
Number 6 11 5 5 5 5 11 12 10 13 83Total value 53.8 324.3 221.9 390.0 299.4 261.9 691.8 104.4 170.0 2225.5 4743.0
Crossindustry
Ave value 26.9 40.5 74.0 195.0 149.7 261.9 76.9 26.1 24.3 222.6 98.8
Industry
Number 5 12 4 7 4 6 14 23 14 13 102Total value 739.2 265.5 29.0 244.7 0.0 308.0 134.6 2316.4 502.2 9970.3 14509.9
Banking
Ave value 246.4 37.9 29.0 81.6 0.0 77.0 16.8 178.2 45.7 997.0 241.8
Number 3 3 2 3 4 3 8 8 10 3 47Total value 122.4 0.0 0.0 535.0 135.7 145.7 1117.3 2146.0 531.2 45.8 4779.1
Insurance
Ave value 61.2 0.0 0.0 178.3 67.9 145.7 223.5 715.3 106.2 22.9 207.8
Number 6 10 14 12 10 13 10 14 15 28 132Total value 22.1 109.4 222.9 267.2 313.0 207.8 470.6 117.8 928.0 1563.6 4222.4
Securities/Other
Ave value 22.1 21.9 37.2 66.8 78.3 69.3 235.3 29.5 92.8 120.3 81.2
Number 14 25 20 22 18 22 32 45 39 44 281Total value 883.7 374.9 251.9 1046.9 448.7 661.5 1722.5 4580.2 1961.4 11579.7 23511.4Ave value 147.3 31.2 36.0 104.7 74.8 82.7 114.8 229.0 75.4 463.2 174.2
GDP 581153 596396 578328 562107 562068 588251 610977 634306 608678 644883 5967147
Total
Value/GDP 0.15% 0.06% 0.04% 0.19% 0.08% 0.11% 0.28% 0.72% 0.32% 1.80% 0.39%

356
Deals classified by country and sector of target firm
1990 1991 1992 1993 1994 1995 1996 1997 1998 1999 Total
Banking
Number 2 6 2 5 1 5 5 15 8 3 52Total value 707.5 19.0 0.0 75.2 0.0 46.1 9.9 2281.0 394.0 5639.4 9172.1
Withinborder/withinindustry
Ave value 353.8 9.5 0.0 37.6 0.0 15.4 9.9 207.4 65.7 2819.7 316.3
Number 3 6 2 2 3 1 7 8 6 8 46Total value 31.7 246.5 29.0 169.5 0.0 261.9 113.0 35.4 108.2 1632.1 2627.3
Withinborder/crossindustry
Ave value 31.7 49.3 29.0 169.5 0.0 261.9 18.8 17.7 21.6 272.0 93.8
Number 0 0 0 0 0 0 2 0 0 1 3Total value 0.0 0.0 0.0 0.0 0.0 0.0 11.7 0.0 0.0 2690.2 2701.9
Cross-border/withinindustry
Ave value 0.0 0.0 0.0 0.0 0.0 0.0 11.7 0.0 0.0 2690.2 1351.0
Number 0 0 0 0 0 0 0 0 0 1 1Total value 0.0 0.0 0.0 0.0 0.0 0.0 0.0 0.0 0.0 8.6 8.6
Cross-border/crossindustry
Ave value 0.0 0.0 0.0 0.0 0.0 0.0 0.0 0.0 0.0 8.6 8.6
Insurance
Number 2 1 0 2 3 1 5 7 3 1 25Total value 14.6 0.0 0.0 490.3 15.9 0.0 883.8 2115.7 0.0 27.6 3547.9
Withinborder/withinindustry
Ave value 14.6 0.0 0.0 245.2 15.9 0.0 441.9 1057.9 0.0 27.6 394.2
Number 0 1 1 0 0 0 1 0 3 1 7Total value 0.0 0.0 0.0 0.0 0.0 0.0 8.1 0.0 59.7 18.2 86.0
Withinborder/crossindustry
Ave value 0.0 0.0 0.0 0.0 0.0 0.0 8.1 0.0 59.7 18.2 28.7
Number 1 1 1 1 1 2 1 1 4 0 13Total value 107.8 0.0 0.0 44.7 119.8 145.7 103.3 30.3 471.5 0.0 1023.1
Cross-border/withinindustry
Ave value 107.8 0.0 0.0 44.7 119.8 145.7 103.3 30.3 117.9 0.0 102.3
Number 0 0 0 0 0 0 1 0 0 1 2Total value 0.0 0.0 0.0 0.0 0.0 0.0 122.1 0.0 0.0 0.0 122.1
Cross-border/crossindustry
Ave value 0.0 0.0 0.0 0.0 0.0 0.0 122.1 0.0 0.0 0.0 122.1
Securities/Other
Number 3 5 11 8 7 6 7 10 10 24 91Total value 0.0 31.6 30.0 45.9 7.3 77.2 0.0 48.8 119.6 961.3 1321.7
Withinborder/withinindustry
Ave value 0.0 15.8 7.5 23.0 7.3 38.6 0.0 24.4 15.0 106.8 44.1
Number 1 4 2 3 2 4 2 3 1 2 24Total value 22.1 77.8 192.9 220.5 299.4 0.0 448.6 43.7 2.1 566.6 1873.7
Withinborder/crossindustry
Ave value 22.1 25.9 96.5 220.5 149.7 0.0 448.6 43.7 2.1 283.3 133.8
Number 0 1 1 1 1 3 1 0 4 2 14Total value 0.0 0.0 0.0 0.8 6.3 130.6 22.0 0.0 806.3 35.7 1001.7
Cross-border/withinindustry
Ave value 0.0 0.0 0.0 0.8 6.3 130.6 22.0 0.0 806.3 17.9 143.1
Number 2 0 0 0 0 0 0 1 0 0 3Total value 0.0 0.0 0.0 0.0 0.0 0.0 0.0 25.3 0.0 0.0 25.3
Cross-border/crossindustry
Ave value 0.0 0.0 0.0 0.0 0.0 0.0 0.0 25.3 0.0 0.0 25.3
Number 14 25 20 22 18 22 32 45 39 44 281Total value 883.7 374.9 251.9 1046.9 448.7 661.5 1722.5 4580.2 1961.4 11579.7 23511.4
Total
Ave value 147.3 31.2 36.0 104.7 74.8 82.7 114.8 229.0 75.4 463.2 174.2
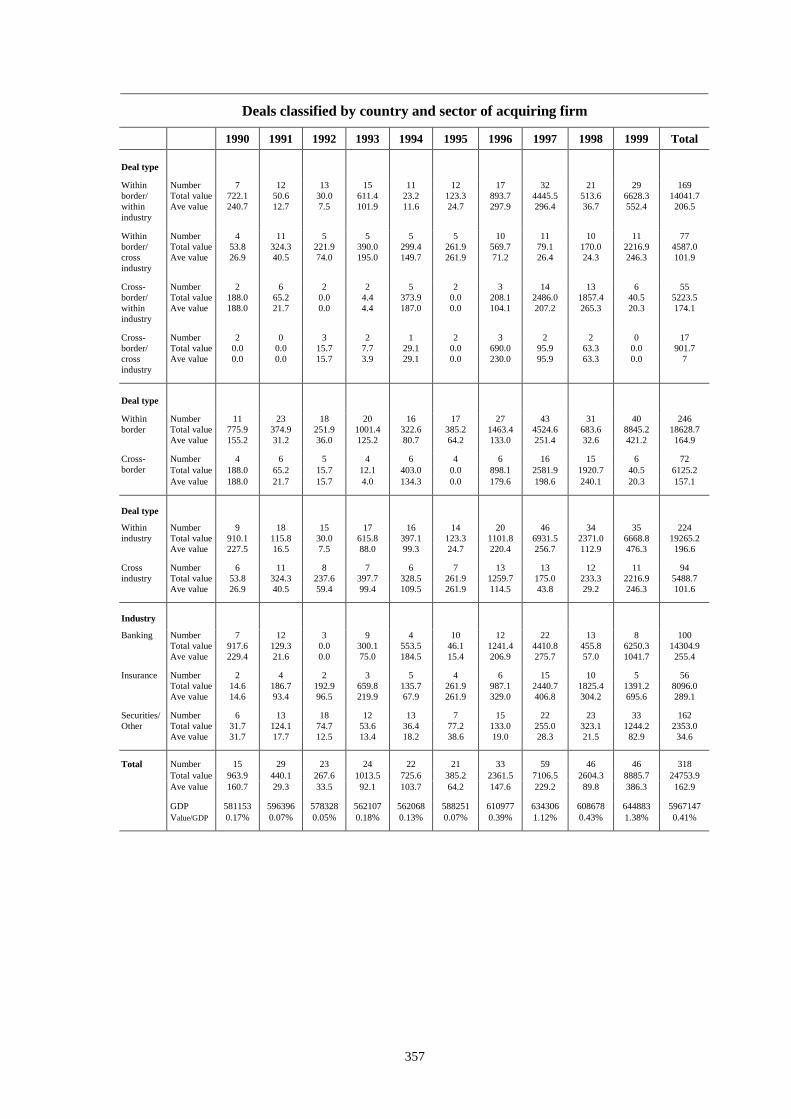
357
Deals classified by country and sector of acquiring firm
1990 1991 1992 1993 1994 1995 1996 1997 1998 1999 Total
Deal type
Number 7 12 13 15 11 12 17 32 21 29 169Total value 722.1 50.6 30.0 611.4 23.2 123.3 893.7 4445.5 513.6 6628.3 14041.7
Withinborder/withinindustry
Ave value 240.7 12.7 7.5 101.9 11.6 24.7 297.9 296.4 36.7 552.4 206.5
Number 4 11 5 5 5 5 10 11 10 11 77Total value 53.8 324.3 221.9 390.0 299.4 261.9 569.7 79.1 170.0 2216.9 4587.0
Withinborder/crossindustry
Ave value 26.9 40.5 74.0 195.0 149.7 261.9 71.2 26.4 24.3 246.3 101.9
Number 2 6 2 2 5 2 3 14 13 6 55Total value 188.0 65.2 0.0 4.4 373.9 0.0 208.1 2486.0 1857.4 40.5 5223.5
Cross-border/withinindustry
Ave value 188.0 21.7 0.0 4.4 187.0 0.0 104.1 207.2 265.3 20.3 174.1
Number 2 0 3 2 1 2 3 2 2 0 17Total value 0.0 0.0 15.7 7.7 29.1 0.0 690.0 95.9 63.3 0.0 901.7
Cross-border/crossindustry
Ave value 0.0 0.0 15.7 3.9 29.1 0.0 230.0 95.9 63.3 0.0 7
Deal type
Number 11 23 18 20 16 17 27 43 31 40 246Total value 775.9 374.9 251.9 1001.4 322.6 385.2 1463.4 4524.6 683.6 8845.2 18628.7
Withinborder
Ave value 155.2 31.2 36.0 125.2 80.7 64.2 133.0 251.4 32.6 421.2 164.9
Number 4 6 5 4 6 4 6 16 15 6 72Total value 188.0 65.2 15.7 12.1 403.0 0.0 898.1 2581.9 1920.7 40.5 6125.2
Cross-border
Ave value 188.0 21.7 15.7 4.0 134.3 0.0 179.6 198.6 240.1 20.3 157.1
Deal type
Number 9 18 15 17 16 14 20 46 34 35 224Total value 910.1 115.8 30.0 615.8 397.1 123.3 1101.8 6931.5 2371.0 6668.8 19265.2
Withinindustry
Ave value 227.5 16.5 7.5 88.0 99.3 24.7 220.4 256.7 112.9 476.3 196.6
Number 6 11 8 7 6 7 13 13 12 11 94Total value 53.8 324.3 237.6 397.7 328.5 261.9 1259.7 175.0 233.3 2216.9 5488.7
Crossindustry
Ave value 26.9 40.5 59.4 99.4 109.5 261.9 114.5 43.8 29.2 246.3 101.6
Industry
Number 7 12 3 9 4 10 12 22 13 8 100Total value 917.6 129.3 0.0 300.1 553.5 46.1 1241.4 4410.8 455.8 6250.3 14304.9
Banking
Ave value 229.4 21.6 0.0 75.0 184.5 15.4 206.9 275.7 57.0 1041.7 255.4
Number 2 4 2 3 5 4 6 15 10 5 56Total value 14.6 186.7 192.9 659.8 135.7 261.9 987.1 2440.7 1825.4 1391.2 8096.0
Insurance
Ave value 14.6 93.4 96.5 219.9 67.9 261.9 329.0 406.8 304.2 695.6 289.1
Number 6 13 18 12 13 7 15 22 23 33 162Total value 31.7 124.1 74.7 53.6 36.4 77.2 133.0 255.0 323.1 1244.2 2353.0
Securities/Other
Ave value 31.7 17.7 12.5 13.4 18.2 38.6 19.0 28.3 21.5 82.9 34.6
Number 15 29 23 24 22 21 33 59 46 46 318Total value 963.9 440.1 267.6 1013.5 725.6 385.2 2361.5 7106.5 2604.3 8885.7 24753.9Ave value 160.7 29.3 33.5 92.1 103.7 64.2 147.6 229.2 89.8 386.3 162.9
GDP 581153 596396 578328 562107 562068 588251 610977 634306 608678 644883 5967147
Total
Value/GDP 0.17% 0.07% 0.05% 0.18% 0.13% 0.07% 0.39% 1.12% 0.43% 1.38% 0.41%

358
Deals classified by country and sector of acquiring firm
1990 1991 1992 1993 1994 1995 1996 1997 1998 1999 Total
BankingNumber 2 6 2 5 1 5 5 15 8 3 52Tot Value 707.5 19.0 0.0 75.2 0.0 46.1 9.9 2281.0 394.0 5639.4 9172.1
Withinborder/withinindustry
Ave Value 353.8 9.5 0.0 37.6 0.0 15.4 9.9 207.4 65.7 2819.7 316.3
Number 1 2 1 3 2 3 3 1 2 3 21Tot Value 22.1 50.2 0.0 220.5 299.4 0.0 456.7 0.0 61.8 584.8 1695.5
Withinborder/crossindustry
Ave Value 22.1 25.1 0.0 220.5 149.7 0.0 228.4 0.0 30.9 194.9 130.4
Number 2 4 0 1 1 0 2 5 3 2 20Tot Value 188.0 60.1 0.0 4.4 254.1 0.0 104.8 2129.8 0.0 26.1 2767.3
Cross-border/withinindustry
Ave Value 188.0 30.1 0.0 4.4 254.1 0.0 104.8 426.0 0.0 26.1 230.6
Number 2 0 0 0 0 2 2 1 0 0 7Tot Value 0.0 0.0 0.0 0.0 0.0 0.0 670.0 0.0 0.0 0.0 670.0
Cross-border/crossindustry
Ave Value 0.0 0.0 0.0 0.0 0.0 0.0 335.0 0.0 0.0 0.0 335.0
InsuranceNumber 2 1 0 2 3 1 5 7 3 1 25Tot Value 14.6 0.0 0.0 490.3 15.9 0.0 883.8 2115.7 0.0 27.6 3547.9
Withinborder/withinindustry
Ave Value 14.6 0.0 0.0 245.2 15.9 0.0 441.9 1057.9 0.0 27.6 394.2
Number 0 3 2 1 0 2 0 3 0 2 13Tot Value 0.0 186.7 192.9 169.5 0.0 261.9 0.0 43.7 0.0 1363.6 2218.3
Withinborder/crossindustry
Ave Value 0.0 93.4 96.5 169.5 0.0 261.9 0.0 43.7 0.0 1363.6 277.3
Number 0 0 0 0 2 1 1 5 6 2 17Tot Value 0.0 0.0 0.0 0.0 119.8 0.0 103.3 281.3 1825.4 0.0 2329.8
Cross-border/withinindustry
Ave Value 0.0 0.0 0.0 0.0 119.8 0.0 103.3 93.8 304.2 0.0 211.8
Number 0 0 0 0 0 0 0 0 1 0 1Tot Value 0.0 0.0 0.0 0.0 0.0 0.0 0.0 0.0 0.0 0.0 0.0
Cross-border/crossindustry
Ave Value 0.0 0.0 0.0 0.0 0.0 0.0 0.0 0.0 0.0 0.0 0.0
Securities/Other
Number 3 5 11 8 7 6 7 10 10 25 92Total value 0.0 31.6 30.0 45.9 7.3 77.2 0.0 48.8 119.6 961.3 1321.7
Withinborder/withinindustry
Ave Value 0.0 15.8 7.5 23.0 7.3 38.6 0.0 24.4 15.0 106.8 44.1
Number 3 6 2 1 3 0 7 7 8 6 43Total value 31.7 87.4 29.0 0.0 0.0 0.0 113.0 35.4 108.2 268.5 673.2
Withinborder/crossindustry
Ave Value 31.7 21.9 29.0 0.0 0.0 0.0 18.8 17.7 21.6 53.7 28.1
Number 0 2 2 1 2 1 0 4 4 2 18Total value 0.0 5.1 0.0 0.0 0.0 0.0 0.0 74.9 32.0 14.4 126.4
Cross-border/withinindustry
Ave Value 0.0 5.1 0.0 0.0 0.0 0.0 0.0 18.7 32.0 14.4 18.1
Number 0 0 3 2 1 0 1 1 1 0 9Total value 0.0 0.0 15.7 7.7 29.1 0.0 20.0 95.9 63.3 0.0 231.7
Cross-border/crossindustry
Ave Value 0.0 0.0 15.7 3.9 29.1 0.0 20.0 95.9 63.3 0.0 33.1
Number 15 29 23 24 22 21 33 59 46 46 318Total value 963.9 440.1 267.6 1013.5 725.6 385.2 2361.5 7106.5 2604.3 8885.7 24753.9
Total
Ave Value 160.7 29.3 33.5 92.1 103.7 64.2 147.6 229.2 89.8 386.3 162.9
Source: Thomson Financial, SDC Platinum.

359
Table A.7Country: Japan
All values in USD millionsDeals classified by country and sector of target firm
1990 1991 1992 1993 1994 1995 1996 1997 1998 1999 TotalDeal type
Number 4 9 4 7 2 7 15 29 27 94 198Total Value 8092.5 0.0 0.0 0.0 2000.3 33797.5 0.0 0.0 81.1 75931.7 119903.1
Withinborder/Withinindustry
Ave Value 8092.5 0.0 0.0 0.0 2000.3 16898.8 0.0 0.0 13.5 3615.8 3867.8
Number 1 2 0 2 0 1 2 1 2 12 23Total Value 66.1 164.7 0.0 961.9 0.0 0.0 14.7 0.0 0.0 27.3 1234.7
Withinborder/Crossindustry
Ave Value 66.1 82.4 0.0 481.0 0.0 0.0 14.7 0.0 0.0 9.1 137.2
Number 0 0 1 0 1 1 0 1 4 3 11Total Value 0.0 0.0 0.0 0.0 2.3 0.0 0.0 0.0 1002.2 2024.4 3028.9
Crossborder/Withinindustry
Ave Value 0.0 0.0 0.0 0.0 2.3 0.0 0.0 0.0 501.1 1012.2 605.8
Number 0 0 0 0 0 0 1 1 2 2 6Total Value 0.0 0.0 0.0 0.0 0.0 0.0 0.0 0.0 593.9 1388.3 1982.2
Crossborder/Crossindustry
Ave Value 0.0 0.0 0.0 0.0 0.0 0.0 0.0 0.0 593.9 694.2 660.7
Deal type
Number 5 11 4 9 2 8 17 30 29 106 221Total Value 8158.6 164.7 0.0 961.9 2000.3 33797.5 14.7 0.0 81.1 75959.0 121137.8
Withinborder
Ave Value 4079.3 82.4 0.0 481.0 2000.3 16898.8 14.7 0.0 13.5 3165.0 3028.4
Number 0 0 1 0 1 1 1 2 6 5 17Total Value 0.0 0.0 0.0 0.0 2.3 0.0 0.0 0.0 1596.1 3412.7 5011.1
Crossborder
Ave Value 0.0 0.0 0.0 0.0 2.3 0.0 0.0 0.0 532.0 853.2 626.4
Deal type
Number 4 9 5 7 3 8 15 30 31 97 209Total Value 8092.5 0.0 0.0 0.0 2002.6 33797.5 0.0 0.0 1083.3 77956.1 122932.0
Withinindustry
Ave Value 8092.5 0.0 0.0 0.0 1001.3 16898.8 0.0 0.0 135.4 3389.4 3414.8
Number 1 2 0 2 0 1 3 2 4 14 29Total Value 66.1 164.7 0.0 961.9 0.0 0.0 14.7 0.0 593.9 1415.6 3216.9
Cross-industry
Ave Value 66.1 82.4 0.0 481.0 0.0 0.0 14.7 0.0 593.9 283.1 268.1
Industry
Number 5 8 2 6 1 4 9 14 10 49 108Total Value 8158.6 0.0 0.0 190.6 2000.3 33787.7 14.7 0.0 994.8 75617.0 120763.7
Banking
Ave Value 4079.3 0.0 0.0 190.6 2000.3 33787.7 14.7 0.0 994.8 4726.1 5250.6
Number 0 2 0 0 0 0 2 2 3 7 16Total Value 0.0 164.7 0.0 0.0 0.0 0.0 0.0 0.0 601.3 2192.7 2958.7
Insurance
Ave Value 0.0 82.4 0.0 0.0 0.0 0.0 0.0 0.0 300.7 1096.4 493.1
Number 0 1 3 3 2 5 7 16 22 55 114Total Value 0.0 0.0 0.0 771.3 2.3 9.8 0.0 0.0 81.1 1562.0 2426.5
Securities/Other
Ave Value 0.0 0.0 0.0 771.3 2.3 9.8 0.0 0.0 13.5 156.2 127.7
Number 5 11 5 9 3 9 18 32 35 111 238Total Value 8158.6 164.7 0.0 961.9 2002.6 33797.5 14.7 0.0 1677.2 79371.7 126148.9Ave Value 4079.3 82.4 0.0 481.0 1001.3 16898.8 14.7 0.0 186.4 2834.7 2628.1
GDP 2982567 3408808 3719360 4287023 4698160 5157826 4607412 4217808 3824738 4365415 41269118
Total
Value/GDP 0.27% 0.00% 0.00% 0.02% 0.04% 0.66% 0.00% 0.00% 0.04% 1.82% 0.31%

360
Deals classified by country and sector of target firm
1990 1991 1992 1993 1994 1995 1996 1997 1998 1999 TotalBanking
Number 4 8 2 5 1 4 7 13 8 42 94Total Value 8092.5 0.0 0.0 0.0 2000.3 33787.7 0.0 0.0 0.0 74369.7 118250.2
Withinborder/Withinindustry
Ave Value 8092.5 0.0 0.0 0.0 2000.3 33787.7 0.0 0.0 0.0 6760.9 8446.4
Number 1 0 0 1 0 0 1 0 0 5 8Total Value 66.1 0.0 0.0 190.6 0.0 0.0 14.7 0.0 0.0 27.3 298.7
Withinborder/Crossindustry
Ave Value 66.1 0.0 0.0 190.6 0.0 0.0 14.7 0.0 0.0 9.1 49.8
Number 0 0 0 0 0 0 0 1 2 1 4Total Value 0.0 0.0 0.0 0.0 0.0 0.0 0.0 0.0 994.8 70.0 1064.8
Crossborder/Withinindustry
Ave Value 0.0 0.0 0.0 0.0 0.0 0.0 0.0 0.0 994.8 70.0 532.4
Number 0 0 0 0 0 0 1 0 0 1 2Total Value 0.0 0.0 0.0 0.0 0.0 0.0 0.0 0.0 0.0 1150.0 1150.0
Crossborder/Crossindustry
Ave Value 0.0 0.0 0.0 0.0 0.0 0.0 0.0 0.0 0.0 1150.0 1150.0
Insurance
Number 0 0 0 0 0 0 1 1 1 2 5Total Value 0.0 0.0 0.0 0.0 0.0 0.0 0.0 0.0 0.0 0.0 0.0
Withinborder/Withinindustry
Ave Value 0.0 0.0 0.0 0.0 0.0 0.0 0.0 0.0 0.0 0.0 0.0
Number 0 2 0 0 0 0 1 1 0 3 7Total Value 0.0 164.7 0.0 0.0 0.0 0.0 0.0 0.0 0.0 0.0 164.7
Withinborder/Crossindustry
Ave Value 0.0 82.4 0.0 0.0 0.0 0.0 0.0 0.0 0.0 0.0 82.4
Number 0 0 0 0 0 0 0 0 1 1 2Total Value 0.0 0.0 0.0 0.0 0.0 0.0 0.0 0.0 7.4 1954.4 1961.8
Crossborder/Withinindustry
Ave Value 0.0 0.0 0.0 0.0 0.0 0.0 0.0 0.0 7.4 1954.4 980.9
Number 0 0 0 0 0 0 0 0 1 1 2Total Value 0.0 0.0 0.0 0.0 0.0 0.0 0.0 0.0 593.9 238.3 832.2
Crossborder/Crossindustry
Ave Value 0.0 0.0 0.0 0.0 0.0 0.0 0.0 0.0 593.9 238.3 416.1
Securities/Other
Number 0 1 2 2 1 3 7 15 18 50 99Total Value 0.0 0.0 0.0 0.0 0.0 9.8 0.0 0.0 81.1 1562.0 1652.9
Withinborder/Withinindustry
Ave Value 0.0 0.0 0.0 0.0 0.0 9.8 0.0 0.0 13.5 156.2 97.2
Number 0 0 0 1 0 1 0 0 2 4 8Total Value 0.0 0.0 0.0 771.3 0.0 0.0 0.0 0.0 0.0 0.0 771.3
Withinborder/Crossindustry
Ave Value 0.0 0.0 0.0 771.3 0.0 0.0 0.0 0.0 0.0 0.0 771.3
Number 0 0 1 0 1 1 0 0 1 1 5Total Value 0.0 0.0 0.0 0.0 2.3 0.0 0.0 0.0 0.0 0.0 2.3
Crossborder/Withinindustry
Ave Value 0.0 0.0 0.0 0.0 2.3 0.0 0.0 0.0 0.0 0.0 2.3
Number 0 0 0 0 0 0 0 1 1 0 2Total Value 0.0 0.0 0.0 0.0 0.0 0.0 0.0 0.0 0.0 0.0 0.0
Crossborder/Crossindustry
Ave Value 0.0 0.0 0.0 0.0 0.0 0.0 0.0 0.0 0.0 0.0 0.0
Number 5 11 5 9 3 9 18 32 35 111 238Total Value 8158.6 164.7 0.0 961.9 2002.6 33797.5 14.7 0.0 1677.2 79371.7 126148.9
Total
Ave Value 4079.3 82.4 0.0 481.0 1001.3 16898.8 14.7 0.0 186.4 2834.7 2628.1

361
Deals classified by country and sector of acquiring firm
1990 1991 1992 1993 1994 1995 1996 1997 1998 1999 Total
Deal typeNumber 4 9 4 7 2 7 15 28 27 94 197Total Value 8092.5 0.0 0.0 0.0 2000.3 33797.5 0.0 0.0 81.1 75931.7 119903.1
Withinborder/Withinindustry
Ave Value 8092.5 0.0 0.0 0.0 2000.3 16898.8 0.0 0.0 13.5 3615.8 3867.8
Number 1 2 0 2 0 1 2 1 2 12 23Total Value 66.1 164.7 0.0 961.9 0.0 0.0 14.7 0.0 0.0 27.3 1234.7
Withinborder/Crossindustry
Ave Value 66.1 82.4 0.0 481.0 0.0 0.0 14.7 0.0 0.0 9.1 137.2
Number 0 1 1 3 2 1 1 1 7 4 21Total Value 0.0 0.0 0.0 34.6 24.5 0.0 0.0 0.0 77.7 0.2 137.0
Crossborder/Withinindustry
Ave Value 0.0 0.0 0.0 17.3 24.5 0.0 0.0 0.0 25.9 0.2 19.6
Number 1 1 0 1 0 0 0 0 0 2 5Total Value 0.0 0.0 0.0 0.0 0.0 0.0 0.0 0.0 0.0 0.0 0.0
Crossborder/Crossindustry
Ave Value 0.0 0.0 0.0 0.0 0.0 0.0 0.0 0.0 0.0 0.0 0.0
Deal typeNumber 5 11 4 9 2 8 17 29 29 106 220Total Value 8158.6 164.7 0.0 961.9 2000.3 33797.5 14.7 0.0 81.1 75959.0 121137.8
Withinborder
Ave Value 4079.3 82.4 0.0 481.0 2000.3 16898.8 14.7 0.0 13.5 3165.0 3028.4
Number 1 2 1 4 2 1 1 1 7 6 26Total Value 0.0 0.0 0.0 34.6 24.5 0.0 0.0 0.0 77.7 0.2 137.0
Crossborder
Ave Value 0.0 0.0 0.0 17.3 24.5 0.0 0.0 0.0 25.9 0.2 19.6
Deal typeNumber 4 10 5 10 4 8 16 29 34 98 218Total Value 8092.5 0.0 0.0 34.6 2024.8 33797.5 0.0 0.0 158.8 75931.9 120040.1
Withinindustry
Ave Value 8092.5 0.0 0.0 17.3 1012.4 16898.8 0.0 0.0 17.6 3451.5 3159.0
Number 2 3 0 3 0 1 2 1 2 14 28Total Value 66.1 164.7 0.0 961.9 0.0 0.0 14.7 0.0 0.0 27.3 1234.7
Crossindustry
Ave Value 66.1 82.4 0.0 481.0 0.0 0.0 14.7 0.0 0.0 9.1 137.2
Industry
Number 4 9 2 9 2 6 8 14 9 48 111Total Value 8092.5 0.0 0.0 805.3 2000.3 33787.7 0.0 0.0 0.0 74369.7 119055.5
Banking
Ave Value 8092.5 0.0 0.0 402.7 2000.3 33787.7 0.0 0.0 0.0 6760.9 7441.0
Number 1 0 0 0 0 0 1 1 5 6 14Total Value 0.0 0.0 0.0 0.0 0.0 0.0 0.0 0.0 3.0 0.0 3.0
Insurance
Ave Value 0.0 0.0 0.0 0.0 0.0 0.0 0.0 0.0 3.0 0.0 3.0
Number 1 4 3 4 2 3 9 15 22 58 121Total Value 66.1 164.7 0.0 191.2 24.5 9.8 14.7 0.0 155.8 1589.5 2216.3
Securities/Other
Ave Value 66.1 82.4 0.0 95.6 24.5 9.8 14.7 0.0 19.5 113.5 73.9
Number 6 13 5 13 4 9 18 30 36 112 246Total Value 8158.6 164.7 0.0 996.5 2024.8 33797.5 14.7 0.0 158.8 75959.2 121274.8Ave Value 4079.3 82.4 0.0 249.1 1012.4 16898.8 14.7 0.0 17.6 3038.4 2580.3
GDP 2982567 3408808 3719360 4287023 4698160 5157826 4607412 4217808 3824738 4365415 41269118
Total
Value/GDP 0.27% 0.00% 0.00% 0.02% 0.04% 0.66% 0.00% 0.00% 0.00% 1.74% 0.29%
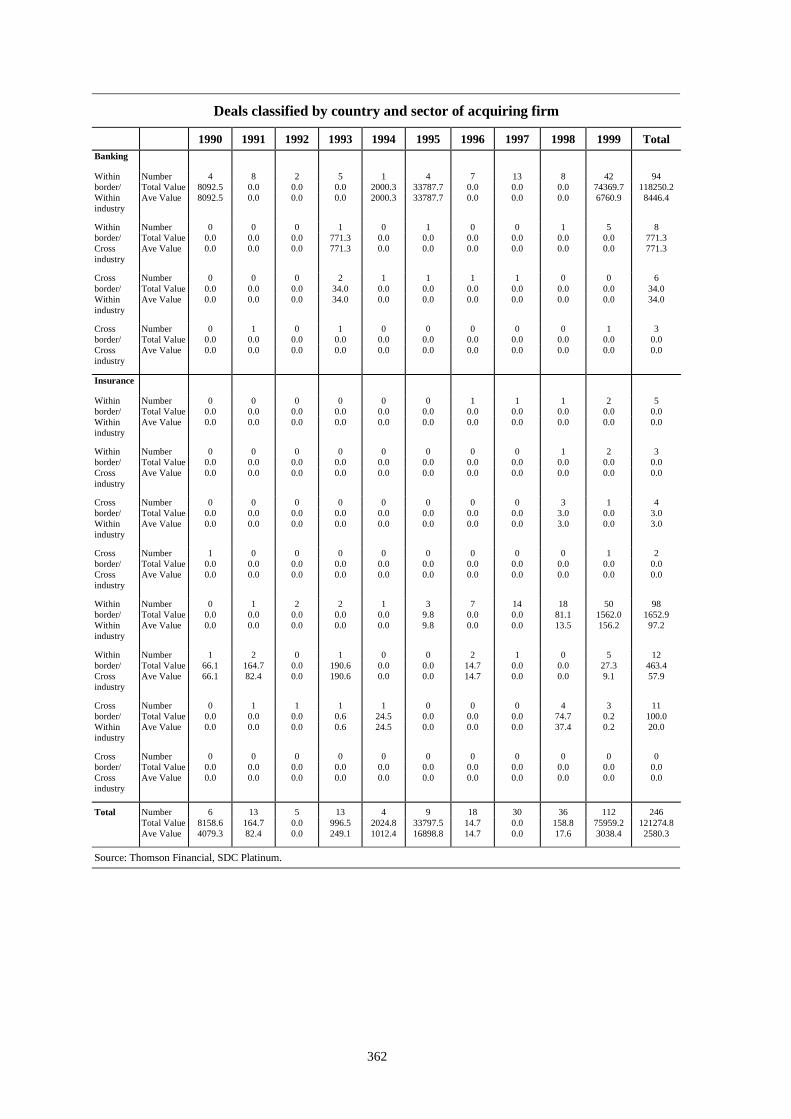
362
Deals classified by country and sector of acquiring firm
1990 1991 1992 1993 1994 1995 1996 1997 1998 1999 TotalBanking
Number 4 8 2 5 1 4 7 13 8 42 94Total Value 8092.5 0.0 0.0 0.0 2000.3 33787.7 0.0 0.0 0.0 74369.7 118250.2
Withinborder/Withinindustry
Ave Value 8092.5 0.0 0.0 0.0 2000.3 33787.7 0.0 0.0 0.0 6760.9 8446.4
Number 0 0 0 1 0 1 0 0 1 5 8Total Value 0.0 0.0 0.0 771.3 0.0 0.0 0.0 0.0 0.0 0.0 771.3
Withinborder/Crossindustry
Ave Value 0.0 0.0 0.0 771.3 0.0 0.0 0.0 0.0 0.0 0.0 771.3
Number 0 0 0 2 1 1 1 1 0 0 6Total Value 0.0 0.0 0.0 34.0 0.0 0.0 0.0 0.0 0.0 0.0 34.0
Crossborder/Withinindustry
Ave Value 0.0 0.0 0.0 34.0 0.0 0.0 0.0 0.0 0.0 0.0 34.0
Number 0 1 0 1 0 0 0 0 0 1 3Total Value 0.0 0.0 0.0 0.0 0.0 0.0 0.0 0.0 0.0 0.0 0.0
Crossborder/Crossindustry
Ave Value 0.0 0.0 0.0 0.0 0.0 0.0 0.0 0.0 0.0 0.0 0.0
Insurance
Number 0 0 0 0 0 0 1 1 1 2 5Total Value 0.0 0.0 0.0 0.0 0.0 0.0 0.0 0.0 0.0 0.0 0.0
Withinborder/Withinindustry
Ave Value 0.0 0.0 0.0 0.0 0.0 0.0 0.0 0.0 0.0 0.0 0.0
Number 0 0 0 0 0 0 0 0 1 2 3Total Value 0.0 0.0 0.0 0.0 0.0 0.0 0.0 0.0 0.0 0.0 0.0
Withinborder/Crossindustry
Ave Value 0.0 0.0 0.0 0.0 0.0 0.0 0.0 0.0 0.0 0.0 0.0
Number 0 0 0 0 0 0 0 0 3 1 4Total Value 0.0 0.0 0.0 0.0 0.0 0.0 0.0 0.0 3.0 0.0 3.0
Crossborder/Withinindustry
Ave Value 0.0 0.0 0.0 0.0 0.0 0.0 0.0 0.0 3.0 0.0 3.0
Number 1 0 0 0 0 0 0 0 0 1 2Total Value 0.0 0.0 0.0 0.0 0.0 0.0 0.0 0.0 0.0 0.0 0.0
Crossborder/Crossindustry
Ave Value 0.0 0.0 0.0 0.0 0.0 0.0 0.0 0.0 0.0 0.0 0.0
Number 0 1 2 2 1 3 7 14 18 50 98Total Value 0.0 0.0 0.0 0.0 0.0 9.8 0.0 0.0 81.1 1562.0 1652.9
Withinborder/Withinindustry
Ave Value 0.0 0.0 0.0 0.0 0.0 9.8 0.0 0.0 13.5 156.2 97.2
Number 1 2 0 1 0 0 2 1 0 5 12Total Value 66.1 164.7 0.0 190.6 0.0 0.0 14.7 0.0 0.0 27.3 463.4
Withinborder/Crossindustry
Ave Value 66.1 82.4 0.0 190.6 0.0 0.0 14.7 0.0 0.0 9.1 57.9
Number 0 1 1 1 1 0 0 0 4 3 11Total Value 0.0 0.0 0.0 0.6 24.5 0.0 0.0 0.0 74.7 0.2 100.0
Crossborder/Withinindustry
Ave Value 0.0 0.0 0.0 0.6 24.5 0.0 0.0 0.0 37.4 0.2 20.0
Number 0 0 0 0 0 0 0 0 0 0 0Total Value 0.0 0.0 0.0 0.0 0.0 0.0 0.0 0.0 0.0 0.0 0.0
Crossborder/Crossindustry
Ave Value 0.0 0.0 0.0 0.0 0.0 0.0 0.0 0.0 0.0 0.0 0.0
Number 6 13 5 13 4 9 18 30 36 112 246Total Value 8158.6 164.7 0.0 996.5 2024.8 33797.5 14.7 0.0 158.8 75959.2 121274.8
Total
Ave Value 4079.3 82.4 0.0 249.1 1012.4 16898.8 14.7 0.0 17.6 3038.4 2580.3
Source: Thomson Financial, SDC Platinum.
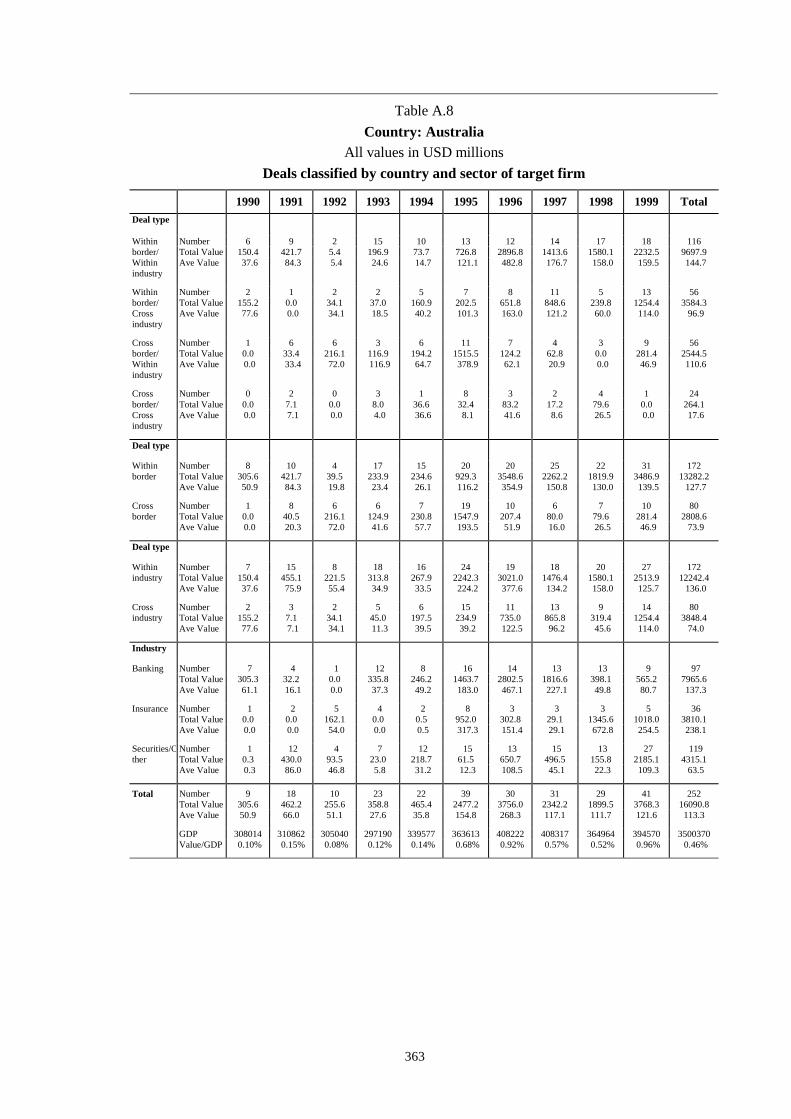
363
Table A.8Country: Australia
All values in USD millionsDeals classified by country and sector of target firm
1990 1991 1992 1993 1994 1995 1996 1997 1998 1999 TotalDeal type
Number 6 9 2 15 10 13 12 14 17 18 116Total Value 150.4 421.7 5.4 196.9 73.7 726.8 2896.8 1413.6 1580.1 2232.5 9697.9
Withinborder/Withinindustry
Ave Value 37.6 84.3 5.4 24.6 14.7 121.1 482.8 176.7 158.0 159.5 144.7
Number 2 1 2 2 5 7 8 11 5 13 56Total Value 155.2 0.0 34.1 37.0 160.9 202.5 651.8 848.6 239.8 1254.4 3584.3
Withinborder/Crossindustry
Ave Value 77.6 0.0 34.1 18.5 40.2 101.3 163.0 121.2 60.0 114.0 96.9
Number 1 6 6 3 6 11 7 4 3 9 56Total Value 0.0 33.4 216.1 116.9 194.2 1515.5 124.2 62.8 0.0 281.4 2544.5
Crossborder/Withinindustry
Ave Value 0.0 33.4 72.0 116.9 64.7 378.9 62.1 20.9 0.0 46.9 110.6
Number 0 2 0 3 1 8 3 2 4 1 24Total Value 0.0 7.1 0.0 8.0 36.6 32.4 83.2 17.2 79.6 0.0 264.1
Crossborder/Crossindustry
Ave Value 0.0 7.1 0.0 4.0 36.6 8.1 41.6 8.6 26.5 0.0 17.6
Deal type
Number 8 10 4 17 15 20 20 25 22 31 172Total Value 305.6 421.7 39.5 233.9 234.6 929.3 3548.6 2262.2 1819.9 3486.9 13282.2
Withinborder
Ave Value 50.9 84.3 19.8 23.4 26.1 116.2 354.9 150.8 130.0 139.5 127.7
Number 1 8 6 6 7 19 10 6 7 10 80Total Value 0.0 40.5 216.1 124.9 230.8 1547.9 207.4 80.0 79.6 281.4 2808.6
Crossborder
Ave Value 0.0 20.3 72.0 41.6 57.7 193.5 51.9 16.0 26.5 46.9 73.9
Deal type
Number 7 15 8 18 16 24 19 18 20 27 172Total Value 150.4 455.1 221.5 313.8 267.9 2242.3 3021.0 1476.4 1580.1 2513.9 12242.4
Withinindustry
Ave Value 37.6 75.9 55.4 34.9 33.5 224.2 377.6 134.2 158.0 125.7 136.0
Number 2 3 2 5 6 15 11 13 9 14 80Total Value 155.2 7.1 34.1 45.0 197.5 234.9 735.0 865.8 319.4 1254.4 3848.4
Crossindustry
Ave Value 77.6 7.1 34.1 11.3 39.5 39.2 122.5 96.2 45.6 114.0 74.0
Industry
Number 7 4 1 12 8 16 14 13 13 9 97Total Value 305.3 32.2 0.0 335.8 246.2 1463.7 2802.5 1816.6 398.1 565.2 7965.6
Banking
Ave Value 61.1 16.1 0.0 37.3 49.2 183.0 467.1 227.1 49.8 80.7 137.3
Number 1 2 5 4 2 8 3 3 3 5 36Total Value 0.0 0.0 162.1 0.0 0.5 952.0 302.8 29.1 1345.6 1018.0 3810.1
Insurance
Ave Value 0.0 0.0 54.0 0.0 0.5 317.3 151.4 29.1 672.8 254.5 238.1
Number 1 12 4 7 12 15 13 15 13 27 119Total Value 0.3 430.0 93.5 23.0 218.7 61.5 650.7 496.5 155.8 2185.1 4315.1
Securities/Other
Ave Value 0.3 86.0 46.8 5.8 31.2 12.3 108.5 45.1 22.3 109.3 63.5
Number 9 18 10 23 22 39 30 31 29 41 252Total Value 305.6 462.2 255.6 358.8 465.4 2477.2 3756.0 2342.2 1899.5 3768.3 16090.8Ave Value 50.9 66.0 51.1 27.6 35.8 154.8 268.3 117.1 111.7 121.6 113.3
GDP 308014 310862 305040 297190 339577 363613 408222 408317 364964 394570 3500370
Total
Value/GDP 0.10% 0.15% 0.08% 0.12% 0.14% 0.68% 0.92% 0.57% 0.52% 0.96% 0.46%
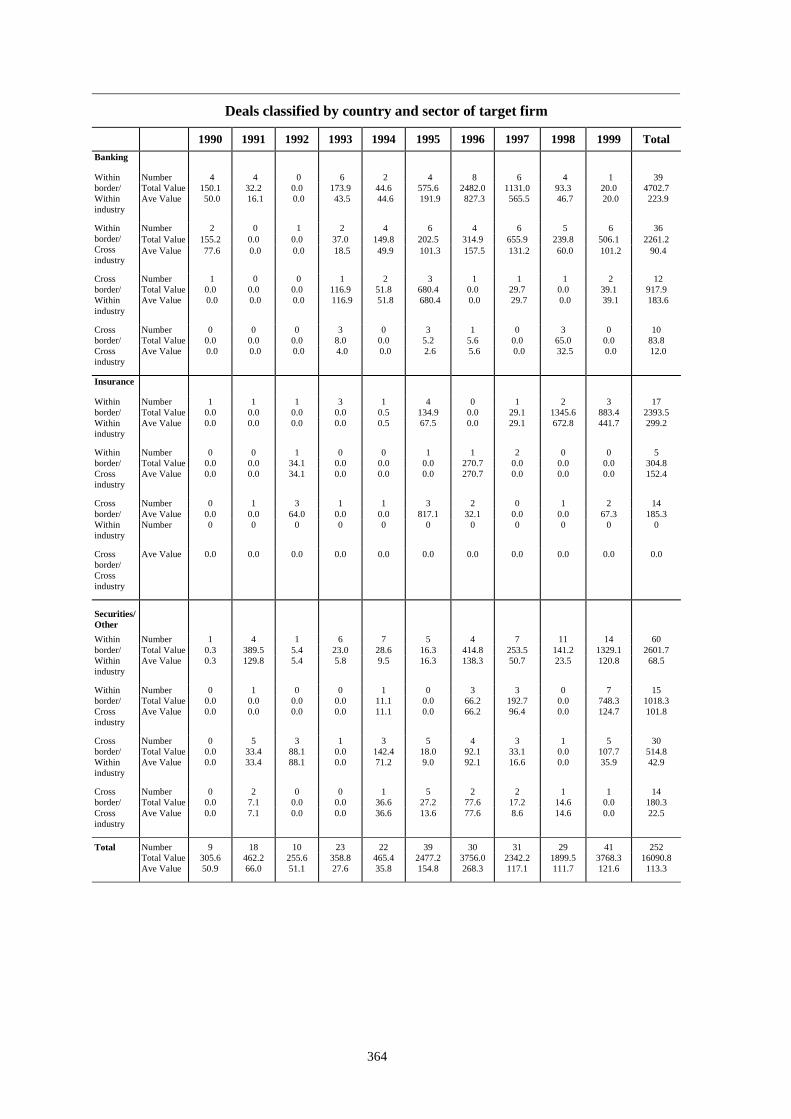
364
Deals classified by country and sector of target firm
1990 1991 1992 1993 1994 1995 1996 1997 1998 1999 TotalBanking
Number 4 4 0 6 2 4 8 6 4 1 39Total Value 150.1 32.2 0.0 173.9 44.6 575.6 2482.0 1131.0 93.3 20.0 4702.7
Withinborder/Withinindustry
Ave Value 50.0 16.1 0.0 43.5 44.6 191.9 827.3 565.5 46.7 20.0 223.9
Number 2 0 1 2 4 6 4 6 5 6 36Total Value 155.2 0.0 0.0 37.0 149.8 202.5 314.9 655.9 239.8 506.1 2261.2
Withinborder/Crossindustry
Ave Value 77.6 0.0 0.0 18.5 49.9 101.3 157.5 131.2 60.0 101.2 90.4
Number 1 0 0 1 2 3 1 1 1 2 12Total Value 0.0 0.0 0.0 116.9 51.8 680.4 0.0 29.7 0.0 39.1 917.9
Crossborder/Withinindustry
Ave Value 0.0 0.0 0.0 116.9 51.8 680.4 0.0 29.7 0.0 39.1 183.6
Number 0 0 0 3 0 3 1 0 3 0 10Total Value 0.0 0.0 0.0 8.0 0.0 5.2 5.6 0.0 65.0 0.0 83.8
Crossborder/Crossindustry
Ave Value 0.0 0.0 0.0 4.0 0.0 2.6 5.6 0.0 32.5 0.0 12.0
Insurance
Number 1 1 1 3 1 4 0 1 2 3 17Total Value 0.0 0.0 0.0 0.0 0.5 134.9 0.0 29.1 1345.6 883.4 2393.5
Withinborder/Withinindustry
Ave Value 0.0 0.0 0.0 0.0 0.5 67.5 0.0 29.1 672.8 441.7 299.2
Number 0 0 1 0 0 1 1 2 0 0 5Total Value 0.0 0.0 34.1 0.0 0.0 0.0 270.7 0.0 0.0 0.0 304.8
Withinborder/Crossindustry
Ave Value 0.0 0.0 34.1 0.0 0.0 0.0 270.7 0.0 0.0 0.0 152.4
Number 0 1 3 1 1 3 2 0 1 2 14Ave Value 0.0 0.0 64.0 0.0 0.0 817.1 32.1 0.0 0.0 67.3 185.3
Crossborder/Withinindustry
Number 0 0 0 0 0 0 0 0 0 0 0
Crossborder/Crossindustry
Ave Value 0.0 0.0 0.0 0.0 0.0 0.0 0.0 0.0 0.0 0.0 0.0
Securities/Other
Number 1 4 1 6 7 5 4 7 11 14 60Total Value 0.3 389.5 5.4 23.0 28.6 16.3 414.8 253.5 141.2 1329.1 2601.7
Withinborder/Withinindustry
Ave Value 0.3 129.8 5.4 5.8 9.5 16.3 138.3 50.7 23.5 120.8 68.5
Number 0 1 0 0 1 0 3 3 0 7 15Total Value 0.0 0.0 0.0 0.0 11.1 0.0 66.2 192.7 0.0 748.3 1018.3
Withinborder/Crossindustry
Ave Value 0.0 0.0 0.0 0.0 11.1 0.0 66.2 96.4 0.0 124.7 101.8
Number 0 5 3 1 3 5 4 3 1 5 30Total Value 0.0 33.4 88.1 0.0 142.4 18.0 92.1 33.1 0.0 107.7 514.8
Crossborder/Withinindustry
Ave Value 0.0 33.4 88.1 0.0 71.2 9.0 92.1 16.6 0.0 35.9 42.9
Number 0 2 0 0 1 5 2 2 1 1 14Total Value 0.0 7.1 0.0 0.0 36.6 27.2 77.6 17.2 14.6 0.0 180.3
Crossborder/Crossindustry
Ave Value 0.0 7.1 0.0 0.0 36.6 13.6 77.6 8.6 14.6 0.0 22.5
Number 9 18 10 23 22 39 30 31 29 41 252Total Value 305.6 462.2 255.6 358.8 465.4 2477.2 3756.0 2342.2 1899.5 3768.3 16090.8
Total
Ave Value 50.9 66.0 51.1 27.6 35.8 154.8 268.3 117.1 111.7 121.6 113.3
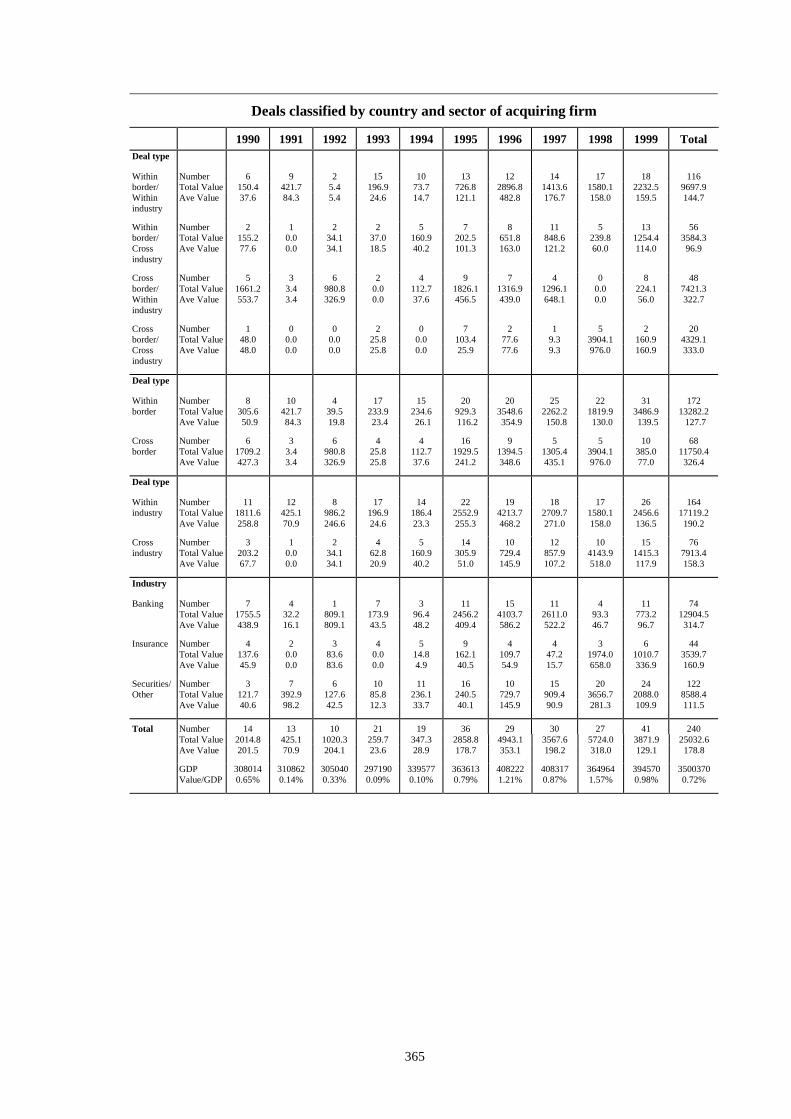
365
Deals classified by country and sector of acquiring firm
1990 1991 1992 1993 1994 1995 1996 1997 1998 1999 TotalDeal type
Number 6 9 2 15 10 13 12 14 17 18 116Total Value 150.4 421.7 5.4 196.9 73.7 726.8 2896.8 1413.6 1580.1 2232.5 9697.9
Withinborder/Withinindustry
Ave Value 37.6 84.3 5.4 24.6 14.7 121.1 482.8 176.7 158.0 159.5 144.7
Number 2 1 2 2 5 7 8 11 5 13 56Total Value 155.2 0.0 34.1 37.0 160.9 202.5 651.8 848.6 239.8 1254.4 3584.3
Withinborder/Crossindustry
Ave Value 77.6 0.0 34.1 18.5 40.2 101.3 163.0 121.2 60.0 114.0 96.9
Number 5 3 6 2 4 9 7 4 0 8 48Total Value 1661.2 3.4 980.8 0.0 112.7 1826.1 1316.9 1296.1 0.0 224.1 7421.3
Crossborder/Withinindustry
Ave Value 553.7 3.4 326.9 0.0 37.6 456.5 439.0 648.1 0.0 56.0 322.7
Number 1 0 0 2 0 7 2 1 5 2 20Total Value 48.0 0.0 0.0 25.8 0.0 103.4 77.6 9.3 3904.1 160.9 4329.1
Crossborder/Crossindustry
Ave Value 48.0 0.0 0.0 25.8 0.0 25.9 77.6 9.3 976.0 160.9 333.0
Deal type
Number 8 10 4 17 15 20 20 25 22 31 172Total Value 305.6 421.7 39.5 233.9 234.6 929.3 3548.6 2262.2 1819.9 3486.9 13282.2
Withinborder
Ave Value 50.9 84.3 19.8 23.4 26.1 116.2 354.9 150.8 130.0 139.5 127.7
Number 6 3 6 4 4 16 9 5 5 10 68Total Value 1709.2 3.4 980.8 25.8 112.7 1929.5 1394.5 1305.4 3904.1 385.0 11750.4
Crossborder
Ave Value 427.3 3.4 326.9 25.8 37.6 241.2 348.6 435.1 976.0 77.0 326.4
Deal type
Number 11 12 8 17 14 22 19 18 17 26 164Total Value 1811.6 425.1 986.2 196.9 186.4 2552.9 4213.7 2709.7 1580.1 2456.6 17119.2
Withinindustry
Ave Value 258.8 70.9 246.6 24.6 23.3 255.3 468.2 271.0 158.0 136.5 190.2
Number 3 1 2 4 5 14 10 12 10 15 76Total Value 203.2 0.0 34.1 62.8 160.9 305.9 729.4 857.9 4143.9 1415.3 7913.4
Crossindustry
Ave Value 67.7 0.0 34.1 20.9 40.2 51.0 145.9 107.2 518.0 117.9 158.3
Industry
Number 7 4 1 7 3 11 15 11 4 11 74Total Value 1755.5 32.2 809.1 173.9 96.4 2456.2 4103.7 2611.0 93.3 773.2 12904.5
Banking
Ave Value 438.9 16.1 809.1 43.5 48.2 409.4 586.2 522.2 46.7 96.7 314.7
Number 4 2 3 4 5 9 4 4 3 6 44Total Value 137.6 0.0 83.6 0.0 14.8 162.1 109.7 47.2 1974.0 1010.7 3539.7
Insurance
Ave Value 45.9 0.0 83.6 0.0 4.9 40.5 54.9 15.7 658.0 336.9 160.9
Number 3 7 6 10 11 16 10 15 20 24 122Total Value 121.7 392.9 127.6 85.8 236.1 240.5 729.7 909.4 3656.7 2088.0 8588.4
Securities/Other
Ave Value 40.6 98.2 42.5 12.3 33.7 40.1 145.9 90.9 281.3 109.9 111.5
Number 14 13 10 21 19 36 29 30 27 41 240Total Value 2014.8 425.1 1020.3 259.7 347.3 2858.8 4943.1 3567.6 5724.0 3871.9 25032.6Ave Value 201.5 70.9 204.1 23.6 28.9 178.7 353.1 198.2 318.0 129.1 178.8
GDP 308014 310862 305040 297190 339577 363613 408222 408317 364964 394570 3500370
Total
Value/GDP 0.65% 0.14% 0.33% 0.09% 0.10% 0.79% 1.21% 0.87% 1.57% 0.98% 0.72%
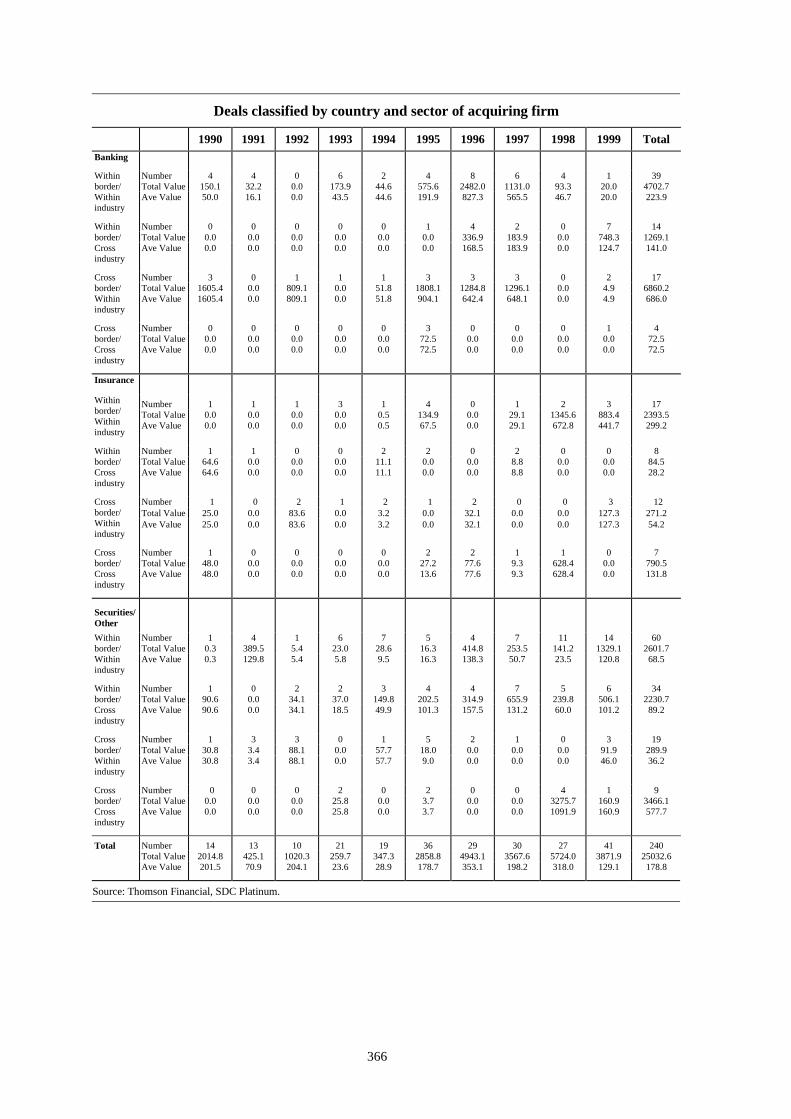
366
Deals classified by country and sector of acquiring firm
1990 1991 1992 1993 1994 1995 1996 1997 1998 1999 TotalBanking
Number 4 4 0 6 2 4 8 6 4 1 39Total Value 150.1 32.2 0.0 173.9 44.6 575.6 2482.0 1131.0 93.3 20.0 4702.7
Withinborder/Withinindustry
Ave Value 50.0 16.1 0.0 43.5 44.6 191.9 827.3 565.5 46.7 20.0 223.9
Number 0 0 0 0 0 1 4 2 0 7 14Total Value 0.0 0.0 0.0 0.0 0.0 0.0 336.9 183.9 0.0 748.3 1269.1
Withinborder/Crossindustry
Ave Value 0.0 0.0 0.0 0.0 0.0 0.0 168.5 183.9 0.0 124.7 141.0
Number 3 0 1 1 1 3 3 3 0 2 17Total Value 1605.4 0.0 809.1 0.0 51.8 1808.1 1284.8 1296.1 0.0 4.9 6860.2
Crossborder/Withinindustry
Ave Value 1605.4 0.0 809.1 0.0 51.8 904.1 642.4 648.1 0.0 4.9 686.0
Number 0 0 0 0 0 3 0 0 0 1 4Total Value 0.0 0.0 0.0 0.0 0.0 72.5 0.0 0.0 0.0 0.0 72.5
Crossborder/Crossindustry
Ave Value 0.0 0.0 0.0 0.0 0.0 72.5 0.0 0.0 0.0 0.0 72.5
Insurance
Number 1 1 1 3 1 4 0 1 2 3 17Total Value 0.0 0.0 0.0 0.0 0.5 134.9 0.0 29.1 1345.6 883.4 2393.5
Withinborder/Withinindustry
Ave Value 0.0 0.0 0.0 0.0 0.5 67.5 0.0 29.1 672.8 441.7 299.2
Number 1 1 0 0 2 2 0 2 0 0 8Total Value 64.6 0.0 0.0 0.0 11.1 0.0 0.0 8.8 0.0 0.0 84.5
Withinborder/Crossindustry
Ave Value 64.6 0.0 0.0 0.0 11.1 0.0 0.0 8.8 0.0 0.0 28.2
Number 1 0 2 1 2 1 2 0 0 3 12Total Value 25.0 0.0 83.6 0.0 3.2 0.0 32.1 0.0 0.0 127.3 271.2
Crossborder/Withinindustry
Ave Value 25.0 0.0 83.6 0.0 3.2 0.0 32.1 0.0 0.0 127.3 54.2
Number 1 0 0 0 0 2 2 1 1 0 7Total Value 48.0 0.0 0.0 0.0 0.0 27.2 77.6 9.3 628.4 0.0 790.5
Crossborder/Crossindustry
Ave Value 48.0 0.0 0.0 0.0 0.0 13.6 77.6 9.3 628.4 0.0 131.8
Securities/Other
Number 1 4 1 6 7 5 4 7 11 14 60Total Value 0.3 389.5 5.4 23.0 28.6 16.3 414.8 253.5 141.2 1329.1 2601.7
Withinborder/Withinindustry
Ave Value 0.3 129.8 5.4 5.8 9.5 16.3 138.3 50.7 23.5 120.8 68.5
Number 1 0 2 2 3 4 4 7 5 6 34Total Value 90.6 0.0 34.1 37.0 149.8 202.5 314.9 655.9 239.8 506.1 2230.7
Withinborder/Crossindustry
Ave Value 90.6 0.0 34.1 18.5 49.9 101.3 157.5 131.2 60.0 101.2 89.2
Number 1 3 3 0 1 5 2 1 0 3 19Total Value 30.8 3.4 88.1 0.0 57.7 18.0 0.0 0.0 0.0 91.9 289.9
Crossborder/Withinindustry
Ave Value 30.8 3.4 88.1 0.0 57.7 9.0 0.0 0.0 0.0 46.0 36.2
Number 0 0 0 2 0 2 0 0 4 1 9Total Value 0.0 0.0 0.0 25.8 0.0 3.7 0.0 0.0 3275.7 160.9 3466.1
Crossborder/Crossindustry
Ave Value 0.0 0.0 0.0 25.8 0.0 3.7 0.0 0.0 1091.9 160.9 577.7
Number 14 13 10 21 19 36 29 30 27 41 240Total Value 2014.8 425.1 1020.3 259.7 347.3 2858.8 4943.1 3567.6 5724.0 3871.9 25032.6
Total
Ave Value 201.5 70.9 204.1 23.6 28.9 178.7 353.1 198.2 318.0 129.1 178.8
Source: Thomson Financial, SDC Platinum.

367
Table A.9Country: Belgium
All values in USD millionsDeals classified by country and sector of target firm
1990 1991 1992 1993 1994 1995 1996 1997 1998 1999 TotalDeal type
Number 0 4 4 1 2 4 4 2 5 6 32Total Value 0.0 21.3 0.0 0.0 0.0 0.0 0.0 0.0 7335.5 37.7 7394.5
Withinborder/Withinindustry
Ave Value 0.0 21.3 0.0 0.0 0.0 0.0 0.0 0.0 1833.9 18.9 1056.4
Number 1 5 1 2 3 2 0 1 2 2 19Total Value 0.0 0.0 0.0 2.3 57.7 15.3 0.0 0.0 12298.5 93.6 12467.4
Withinborder/Crossindustry
Ave Value 0.0 0.0 0.0 2.3 57.7 15.3 0.0 0.0 12298.5 93.6 2493.5
Number 1 4 3 7 4 3 4 1 6 4 37Total Value 2269.8 25.8 140.7 279.8 184.8 197.1 3119.8 6.7 912.9 49.1 7186.5
Crossborder/Withinindustry
Ave Value 2269.8 25.8 70.4 70.0 92.4 98.6 1559.9 6.7 912.9 49.1 422.7
Number 1 1 0 2 1 2 1 1 4 0 13Total Value 131.0 40.4 0.0 386.2 0.0 0.0 0.0 4516.0 823.6 0.0 5897.2
Crossborder/Crossindustry
Ave Value 131.0 40.4 0.0 386.2 0.0 0.0 0.0 4516.0 411.8 0.0 982.9
Deal type
Number 1 9 5 3 5 6 4 3 7 8 51Total Value 0.0 21.3 0.0 2.3 57.7 15.3 0.0 0.0 19634.0 131.3 19861.9
Withinborder
Ave Value 0.0 21.3 0.0 2.3 57.7 15.3 0.0 0.0 3926.8 43.8 1655.2
Number 2 5 3 9 5 5 5 2 10 4 50Total Value 2400.8 66.2 140.7 666.0 184.8 197.1 3119.8 4522.7 1736.5 49.1 13083.7
Crossborder
Ave Value 1200.4 33.1 70.4 133.2 92.4 98.6 1559.9 2261.4 578.8 49.1 568.9
Deal type
Number 1 8 7 8 6 7 8 3 11 10 69Total Value 2269.8 47.1 140.7 279.8 184.8 197.1 3119.8 6.7 8248.4 86.8 14581.0
Withinindustry
Ave Value 2269.8 23.6 70.4 70.0 92.4 98.6 1559.9 6.7 1649.7 28.9 607.5
Number 2 6 1 4 4 4 1 2 6 2 32Total Value 131.0 40.4 0.0 388.5 57.7 15.3 0.0 4516.0 13122.1 93.6 18364.6
Crossindustry
Ave Value 131.0 40.4 0.0 194.3 57.7 15.3 0.0 4516.0 4374.0 93.6 1669.5
Industry
Number 0 3 3 4 4 7 3 4 8 6 42Total Value 0.0 61.7 140.7 406.3 18.8 212.4 50.0 4522.7 20276.0 49.1 25737.7
Banking
Ave Value 0.0 30.9 70.4 203.2 18.8 70.8 50.0 2261.4 4055.2 49.1 1354.6
Number 1 5 2 5 3 1 4 0 4 3 28Total Value 2269.8 25.8 0.0 259.7 166.0 0.0 0.0 0.0 912.9 93.6 3727.8
Insurance
Ave Value 2269.8 25.8 0.0 86.6 166.0 0.0 0.0 0.0 912.9 93.6 466.0
Number 2 6 3 3 3 3 2 1 5 3 31Total Value 131.0 0.0 0.0 2.3 57.7 0.0 3069.8 0.0 181.6 37.7 3480.1
Securities/Other
Ave Value 131.0 0.0 0.0 2.3 57.7 0.0 3069.8 0.0 90.8 18.9 435.0
Number 3 14 8 12 10 11 9 5 17 12 101Total Value 2400.8 87.5 140.7 668.3 242.5 212.4 3119.8 4522.7 21370.5 180.4 32945.6Ave Value 1200.4 29.2 70.4 111.4 80.8 70.8 1559.9 2261.4 2671.3 45.1 941.3
GDP 197942 202715 226620 215192 233668 275781 268210 243686 250640 248505 2362960
Total
Value/GDP 1.21% 0.04% 0.06% 0.31% 0.10% 0.08% 1.16% 1.86% 8.53% 0.07% 1.39%
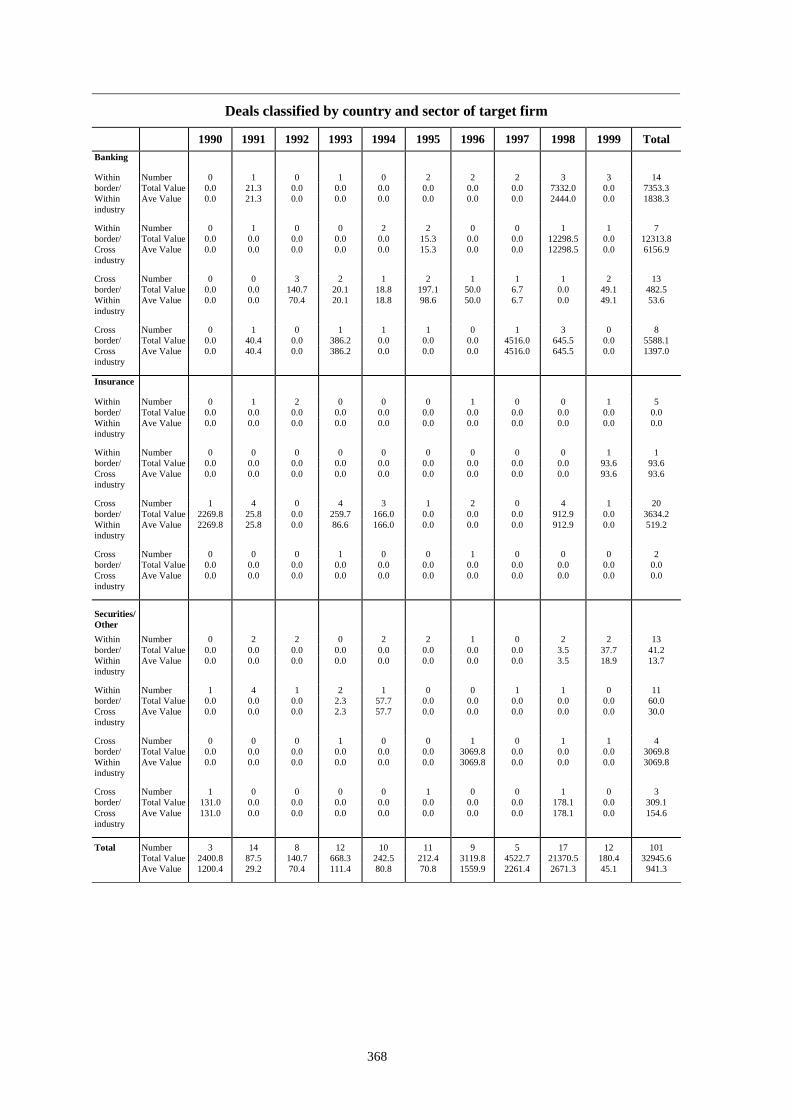
368
Deals classified by country and sector of target firm
1990 1991 1992 1993 1994 1995 1996 1997 1998 1999 TotalBanking
Number 0 1 0 1 0 2 2 2 3 3 14Total Value 0.0 21.3 0.0 0.0 0.0 0.0 0.0 0.0 7332.0 0.0 7353.3
Withinborder/Withinindustry
Ave Value 0.0 21.3 0.0 0.0 0.0 0.0 0.0 0.0 2444.0 0.0 1838.3
Number 0 1 0 0 2 2 0 0 1 1 7Total Value 0.0 0.0 0.0 0.0 0.0 15.3 0.0 0.0 12298.5 0.0 12313.8
Withinborder/Crossindustry
Ave Value 0.0 0.0 0.0 0.0 0.0 15.3 0.0 0.0 12298.5 0.0 6156.9
Number 0 0 3 2 1 2 1 1 1 2 13Total Value 0.0 0.0 140.7 20.1 18.8 197.1 50.0 6.7 0.0 49.1 482.5
Crossborder/Withinindustry
Ave Value 0.0 0.0 70.4 20.1 18.8 98.6 50.0 6.7 0.0 49.1 53.6
Number 0 1 0 1 1 1 0 1 3 0 8Total Value 0.0 40.4 0.0 386.2 0.0 0.0 0.0 4516.0 645.5 0.0 5588.1
Crossborder/Crossindustry
Ave Value 0.0 40.4 0.0 386.2 0.0 0.0 0.0 4516.0 645.5 0.0 1397.0
Insurance
Number 0 1 2 0 0 0 1 0 0 1 5Total Value 0.0 0.0 0.0 0.0 0.0 0.0 0.0 0.0 0.0 0.0 0.0
Withinborder/Withinindustry
Ave Value 0.0 0.0 0.0 0.0 0.0 0.0 0.0 0.0 0.0 0.0 0.0
Number 0 0 0 0 0 0 0 0 0 1 1Total Value 0.0 0.0 0.0 0.0 0.0 0.0 0.0 0.0 0.0 93.6 93.6
Withinborder/Crossindustry
Ave Value 0.0 0.0 0.0 0.0 0.0 0.0 0.0 0.0 0.0 93.6 93.6
Number 1 4 0 4 3 1 2 0 4 1 20Total Value 2269.8 25.8 0.0 259.7 166.0 0.0 0.0 0.0 912.9 0.0 3634.2
Crossborder/Withinindustry
Ave Value 2269.8 25.8 0.0 86.6 166.0 0.0 0.0 0.0 912.9 0.0 519.2
Number 0 0 0 1 0 0 1 0 0 0 2Total Value 0.0 0.0 0.0 0.0 0.0 0.0 0.0 0.0 0.0 0.0 0.0
Crossborder/Crossindustry
Ave Value 0.0 0.0 0.0 0.0 0.0 0.0 0.0 0.0 0.0 0.0 0.0
Securities/Other
Number 0 2 2 0 2 2 1 0 2 2 13Total Value 0.0 0.0 0.0 0.0 0.0 0.0 0.0 0.0 3.5 37.7 41.2
Withinborder/Withinindustry
Ave Value 0.0 0.0 0.0 0.0 0.0 0.0 0.0 0.0 3.5 18.9 13.7
Number 1 4 1 2 1 0 0 1 1 0 11Total Value 0.0 0.0 0.0 2.3 57.7 0.0 0.0 0.0 0.0 0.0 60.0
Withinborder/Crossindustry
Ave Value 0.0 0.0 0.0 2.3 57.7 0.0 0.0 0.0 0.0 0.0 30.0
Number 0 0 0 1 0 0 1 0 1 1 4Total Value 0.0 0.0 0.0 0.0 0.0 0.0 3069.8 0.0 0.0 0.0 3069.8
Crossborder/Withinindustry
Ave Value 0.0 0.0 0.0 0.0 0.0 0.0 3069.8 0.0 0.0 0.0 3069.8
Number 1 0 0 0 0 1 0 0 1 0 3Total Value 131.0 0.0 0.0 0.0 0.0 0.0 0.0 0.0 178.1 0.0 309.1
Crossborder/Crossindustry
Ave Value 131.0 0.0 0.0 0.0 0.0 0.0 0.0 0.0 178.1 0.0 154.6
Number 3 14 8 12 10 11 9 5 17 12 101Total Value 2400.8 87.5 140.7 668.3 242.5 212.4 3119.8 4522.7 21370.5 180.4 32945.6
Total
Ave Value 1200.4 29.2 70.4 111.4 80.8 70.8 1559.9 2261.4 2671.3 45.1 941.3

369
Deals classified by country and sector of acquiring firm
1990 1991 1992 1993 1994 1995 1996 1997 1998 1999 TotalDeal type
Number 0 4 4 1 2 4 4 3 5 6 33Total Value 0.0 21.3 0.0 0.0 0.0 0.0 0.0 0.0 7335.5 37.7 7394.5
Withinborder/Withinindustry
Ave Value 0.0 21.3 0.0 0.0 0.0 0.0 0.0 0.0 1833.9 18.9 1056.4
Number 1 5 1 2 4 2 0 1 2 2 20Total Value 0.0 0.0 0.0 2.3 57.7 15.3 0.0 0.0 12298.5 93.6 12467.4
Withinborder/Crossindustry
Ave Value 0.0 0.0 0.0 2.3 57.7 15.3 0.0 0.0 12298.5 93.6 2493.5
Number 2 5 0 2 2 5 4 1 5 10 36Total Value 0.0 0.0 0.0 20.1 0.0 928.2 175.4 0.0 912.9 10175.0 12211.6
Crossborder/Withinindustry
Ave Value 0.0 0.0 0.0 20.1 0.0 309.4 87.7 0.0 912.9 1695.8 939.4
Number 1 0 0 0 0 2 2 2 1 3 11Total Value 0.0 0.0 0.0 0.0 0.0 133.3 0.0 0.0 645.5 61.1 839.9
Crossborder/Crossindustry
Ave Value 0.0 0.0 0.0 0.0 0.0 133.3 0.0 0.0 645.5 30.6 210.0
Deal type
Number 1 9 5 3 6 6 4 4 7 8 53Total Value 0.0 21.3 0.0 2.3 57.7 15.3 0.0 0.0 19634.0 131.3 19861.9
Withinborder
Ave Value 0.0 21.3 0.0 2.3 57.7 15.3 0.0 0.0 3926.8 43.8 1655.2
Number 3 5 0 2 2 7 6 3 6 13 47Total Value 0.0 0.0 0.0 20.1 0.0 1061.5 175.4 0.0 1558.4 10236.1 13051.5
Crossborder
Ave Value 0.0 0.0 0.0 20.1 0.0 265.4 87.7 0.0 779.2 1279.5 767.7
Deal type
Number 2 9 4 3 4 9 8 4 10 16 69Total Value 0.0 21.3 0.0 20.1 0.0 928.2 175.4 0.0 8248.4 10212.7 19606.1
Withinindustry
Ave Value 0.0 21.3 0.0 20.1 0.0 309.4 87.7 0.0 1649.7 1276.6 980.3
Number 2 5 1 2 4 4 2 3 3 5 31Total Value 0.0 0.0 0.0 2.3 57.7 148.6 0.0 0.0 12944.0 154.7 13307.3
Crossindustry
Ave Value 0.0 0.0 0.0 2.3 57.7 74.3 0.0 0.0 6472.0 51.6 1478.6
Industry
Number 2 10 1 4 0 7 5 5 6 8 48Total Value 0.0 21.3 0.0 22.4 0.0 1061.5 50.0 0.0 7332.0 1220.4 9707.6
Banking
Ave Value 0.0 21.3 0.0 11.2 0.0 265.4 50.0 0.0 2444.0 305.1 647.2
Number 1 1 2 1 3 2 4 0 4 7 25Total Value 0.0 0.0 0.0 0.0 57.7 0.0 125.4 0.0 1558.4 2884.6 4626.1
Insurance
Ave Value 0.0 0.0 0.0 0.0 57.7 0.0 125.4 0.0 779.2 961.5 660.9
Number 1 3 2 0 5 4 1 2 3 6 27Total Value 0.0 0.0 0.0 0.0 0.0 15.3 0.0 0.0 12302.0 6262.4 18579.7
Securities/Other
Ave Value 0.0 0.0 0.0 0.0 0.0 15.3 0.0 0.0 6151.0 1565.6 2654.2
Number 4 14 5 5 8 13 10 7 13 21 100Total Value 0.0 21.3 0.0 22.4 57.7 1076.8 175.4 0.0 21192.4 10367.4 32913.4Ave Value 0.0 21.3 0.0 11.2 57.7 215.4 87.7 0.0 3027.5 942.5 1134.9
GDP 197942 202715 226620 215192 233668 275781 268210 243686 250640 248505 2362960
Total
Value/GDP 0.00% 0.01% 0.00% 0.01% 0.02% 0.39% 0.07% 0.00% 8.46% 4.17% 1.39%
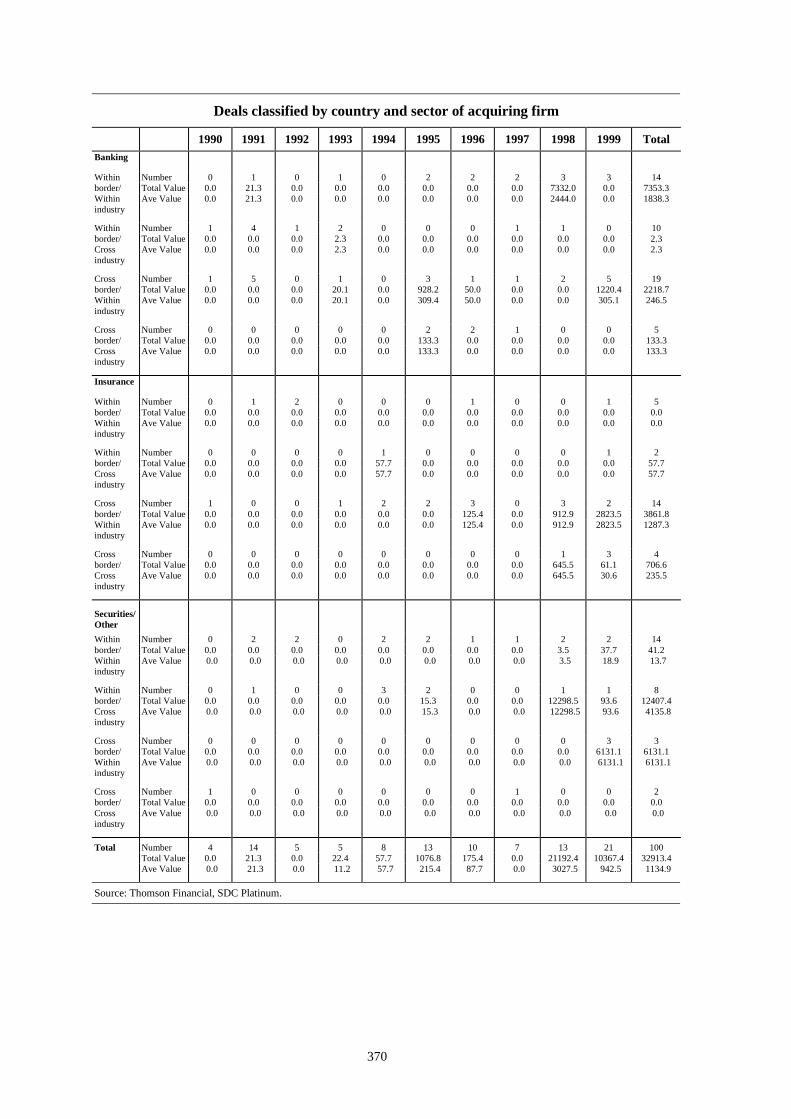
370
Deals classified by country and sector of acquiring firm
1990 1991 1992 1993 1994 1995 1996 1997 1998 1999 TotalBanking
Number 0 1 0 1 0 2 2 2 3 3 14Total Value 0.0 21.3 0.0 0.0 0.0 0.0 0.0 0.0 7332.0 0.0 7353.3
Withinborder/Withinindustry
Ave Value 0.0 21.3 0.0 0.0 0.0 0.0 0.0 0.0 2444.0 0.0 1838.3
Number 1 4 1 2 0 0 0 1 1 0 10Total Value 0.0 0.0 0.0 2.3 0.0 0.0 0.0 0.0 0.0 0.0 2.3
Withinborder/Crossindustry
Ave Value 0.0 0.0 0.0 2.3 0.0 0.0 0.0 0.0 0.0 0.0 2.3
Number 1 5 0 1 0 3 1 1 2 5 19Total Value 0.0 0.0 0.0 20.1 0.0 928.2 50.0 0.0 0.0 1220.4 2218.7
Crossborder/Withinindustry
Ave Value 0.0 0.0 0.0 20.1 0.0 309.4 50.0 0.0 0.0 305.1 246.5
Number 0 0 0 0 0 2 2 1 0 0 5Total Value 0.0 0.0 0.0 0.0 0.0 133.3 0.0 0.0 0.0 0.0 133.3
Crossborder/Crossindustry
Ave Value 0.0 0.0 0.0 0.0 0.0 133.3 0.0 0.0 0.0 0.0 133.3
Insurance
Number 0 1 2 0 0 0 1 0 0 1 5Total Value 0.0 0.0 0.0 0.0 0.0 0.0 0.0 0.0 0.0 0.0 0.0
Withinborder/Withinindustry
Ave Value 0.0 0.0 0.0 0.0 0.0 0.0 0.0 0.0 0.0 0.0 0.0
Number 0 0 0 0 1 0 0 0 0 1 2Total Value 0.0 0.0 0.0 0.0 57.7 0.0 0.0 0.0 0.0 0.0 57.7
Withinborder/Crossindustry
Ave Value 0.0 0.0 0.0 0.0 57.7 0.0 0.0 0.0 0.0 0.0 57.7
Number 1 0 0 1 2 2 3 0 3 2 14Total Value 0.0 0.0 0.0 0.0 0.0 0.0 125.4 0.0 912.9 2823.5 3861.8
Crossborder/Withinindustry
Ave Value 0.0 0.0 0.0 0.0 0.0 0.0 125.4 0.0 912.9 2823.5 1287.3
Number 0 0 0 0 0 0 0 0 1 3 4Total Value 0.0 0.0 0.0 0.0 0.0 0.0 0.0 0.0 645.5 61.1 706.6
Crossborder/Crossindustry
Ave Value 0.0 0.0 0.0 0.0 0.0 0.0 0.0 0.0 645.5 30.6 235.5
Securities/Other
Number 0 2 2 0 2 2 1 1 2 2 14Total Value 0.0 0.0 0.0 0.0 0.0 0.0 0.0 0.0 3.5 37.7 41.2
Withinborder/Withinindustry
Ave Value 0.0 0.0 0.0 0.0 0.0 0.0 0.0 0.0 3.5 18.9 13.7
Number 0 1 0 0 3 2 0 0 1 1 8Total Value 0.0 0.0 0.0 0.0 0.0 15.3 0.0 0.0 12298.5 93.6 12407.4
Withinborder/Crossindustry
Ave Value 0.0 0.0 0.0 0.0 0.0 15.3 0.0 0.0 12298.5 93.6 4135.8
Number 0 0 0 0 0 0 0 0 0 3 3Total Value 0.0 0.0 0.0 0.0 0.0 0.0 0.0 0.0 0.0 6131.1 6131.1
Crossborder/Withinindustry
Ave Value 0.0 0.0 0.0 0.0 0.0 0.0 0.0 0.0 0.0 6131.1 6131.1
Number 1 0 0 0 0 0 0 1 0 0 2Total Value 0.0 0.0 0.0 0.0 0.0 0.0 0.0 0.0 0.0 0.0 0.0
Crossborder/Crossindustry
Ave Value 0.0 0.0 0.0 0.0 0.0 0.0 0.0 0.0 0.0 0.0 0.0
Number 4 14 5 5 8 13 10 7 13 21 100Total Value 0.0 21.3 0.0 22.4 57.7 1076.8 175.4 0.0 21192.4 10367.4 32913.4
Total
Ave Value 0.0 21.3 0.0 11.2 57.7 215.4 87.7 0.0 3027.5 942.5 1134.9
Source: Thomson Financial, SDC Platinum.
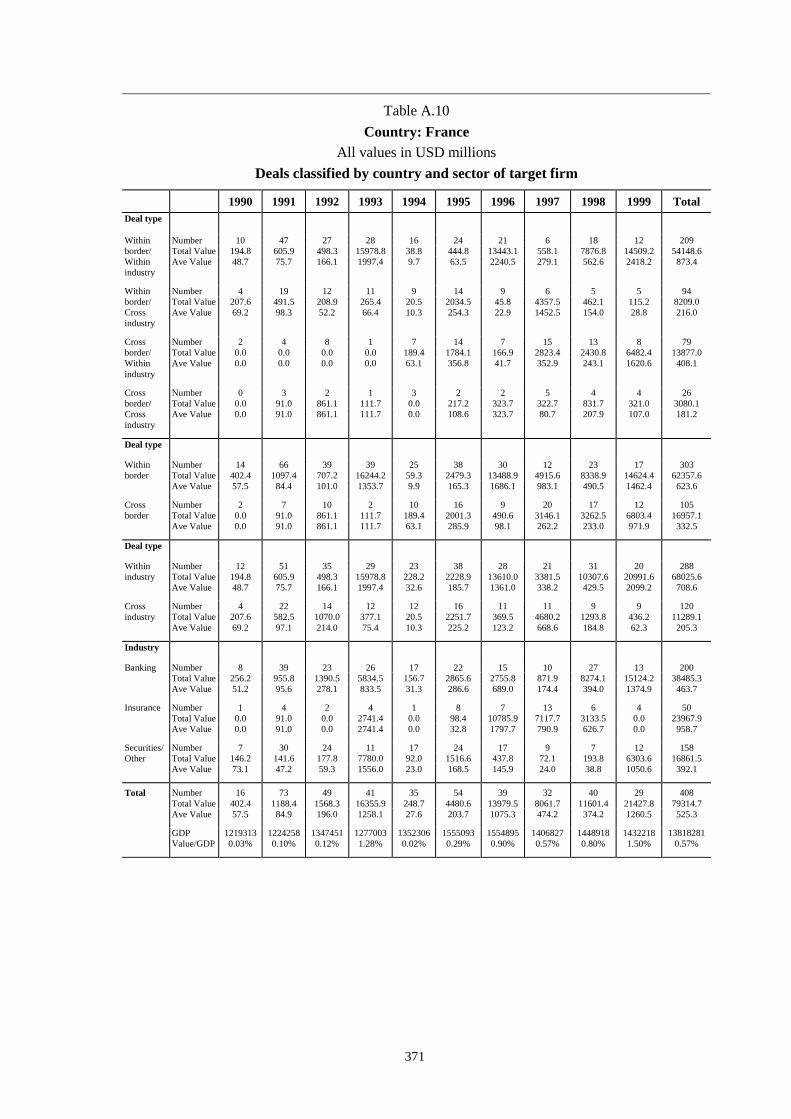
371
Table A.10Country: France
All values in USD millionsDeals classified by country and sector of target firm
1990 1991 1992 1993 1994 1995 1996 1997 1998 1999 TotalDeal type
Number 10 47 27 28 16 24 21 6 18 12 209Total Value 194.8 605.9 498.3 15978.8 38.8 444.8 13443.1 558.1 7876.8 14509.2 54148.6
Withinborder/Withinindustry
Ave Value 48.7 75.7 166.1 1997.4 9.7 63.5 2240.5 279.1 562.6 2418.2 873.4
Number 4 19 12 11 9 14 9 6 5 5 94Total Value 207.6 491.5 208.9 265.4 20.5 2034.5 45.8 4357.5 462.1 115.2 8209.0
Withinborder/Crossindustry
Ave Value 69.2 98.3 52.2 66.4 10.3 254.3 22.9 1452.5 154.0 28.8 216.0
Number 2 4 8 1 7 14 7 15 13 8 79Total Value 0.0 0.0 0.0 0.0 189.4 1784.1 166.9 2823.4 2430.8 6482.4 13877.0
Crossborder/Withinindustry
Ave Value 0.0 0.0 0.0 0.0 63.1 356.8 41.7 352.9 243.1 1620.6 408.1
Number 0 3 2 1 3 2 2 5 4 4 26Total Value 0.0 91.0 861.1 111.7 0.0 217.2 323.7 322.7 831.7 321.0 3080.1
Crossborder/Crossindustry
Ave Value 0.0 91.0 861.1 111.7 0.0 108.6 323.7 80.7 207.9 107.0 181.2
Deal type
Number 14 66 39 39 25 38 30 12 23 17 303Total Value 402.4 1097.4 707.2 16244.2 59.3 2479.3 13488.9 4915.6 8338.9 14624.4 62357.6
Withinborder
Ave Value 57.5 84.4 101.0 1353.7 9.9 165.3 1686.1 983.1 490.5 1462.4 623.6
Number 2 7 10 2 10 16 9 20 17 12 105Total Value 0.0 91.0 861.1 111.7 189.4 2001.3 490.6 3146.1 3262.5 6803.4 16957.1
Crossborder
Ave Value 0.0 91.0 861.1 111.7 63.1 285.9 98.1 262.2 233.0 971.9 332.5
Deal type
Number 12 51 35 29 23 38 28 21 31 20 288Total Value 194.8 605.9 498.3 15978.8 228.2 2228.9 13610.0 3381.5 10307.6 20991.6 68025.6
Withinindustry
Ave Value 48.7 75.7 166.1 1997.4 32.6 185.7 1361.0 338.2 429.5 2099.2 708.6
Number 4 22 14 12 12 16 11 11 9 9 120Total Value 207.6 582.5 1070.0 377.1 20.5 2251.7 369.5 4680.2 1293.8 436.2 11289.1
Crossindustry
Ave Value 69.2 97.1 214.0 75.4 10.3 225.2 123.2 668.6 184.8 62.3 205.3
Industry
Number 8 39 23 26 17 22 15 10 27 13 200Total Value 256.2 955.8 1390.5 5834.5 156.7 2865.6 2755.8 871.9 8274.1 15124.2 38485.3
Banking
Ave Value 51.2 95.6 278.1 833.5 31.3 286.6 689.0 174.4 394.0 1374.9 463.7
Number 1 4 2 4 1 8 7 13 6 4 50Total Value 0.0 91.0 0.0 2741.4 0.0 98.4 10785.9 7117.7 3133.5 0.0 23967.9
Insurance
Ave Value 0.0 91.0 0.0 2741.4 0.0 32.8 1797.7 790.9 626.7 0.0 958.7
Number 7 30 24 11 17 24 17 9 7 12 158Total Value 146.2 141.6 177.8 7780.0 92.0 1516.6 437.8 72.1 193.8 6303.6 16861.5
Securities/Other
Ave Value 73.1 47.2 59.3 1556.0 23.0 168.5 145.9 24.0 38.8 1050.6 392.1
Number 16 73 49 41 35 54 39 32 40 29 408Total Value 402.4 1188.4 1568.3 16355.9 248.7 4480.6 13979.5 8061.7 11601.4 21427.8 79314.7Ave Value 57.5 84.9 196.0 1258.1 27.6 203.7 1075.3 474.2 374.2 1260.5 525.3
GDP 1219313 1224258 1347451 1277003 1352306 1555093 1554895 1406827 1448918 1432218 13818281
Total
Value/GDP 0.03% 0.10% 0.12% 1.28% 0.02% 0.29% 0.90% 0.57% 0.80% 1.50% 0.57%
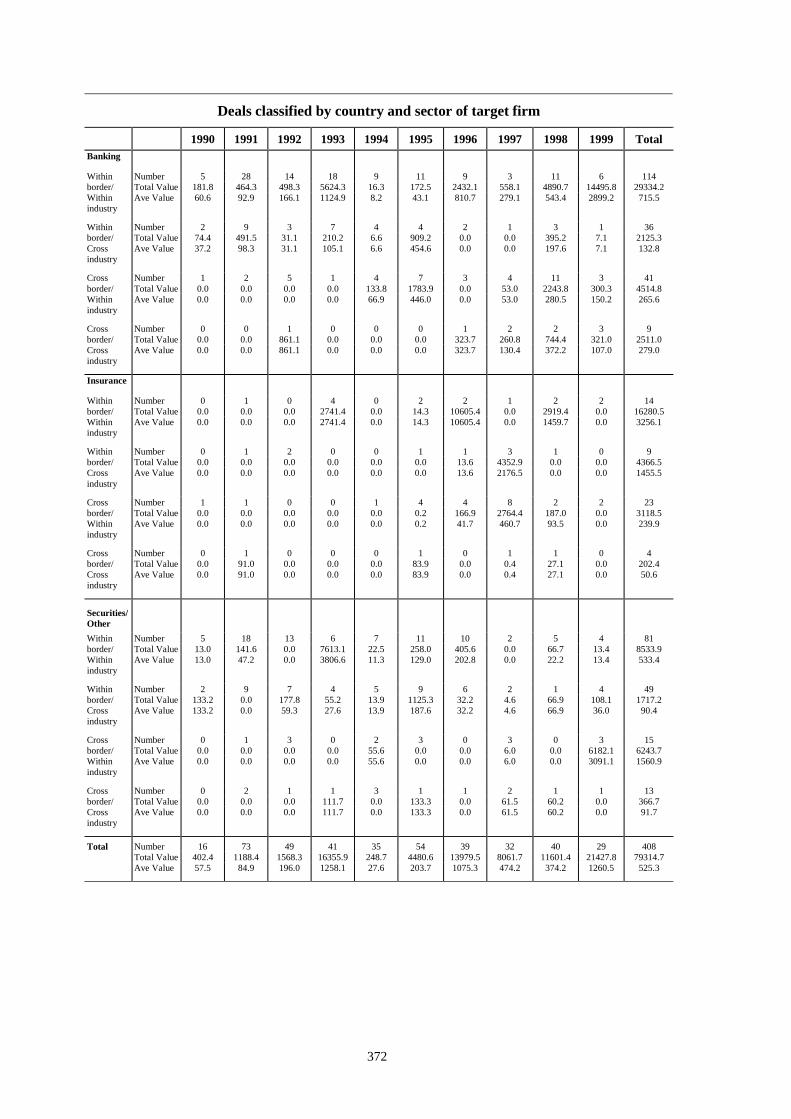
372
Deals classified by country and sector of target firm
1990 1991 1992 1993 1994 1995 1996 1997 1998 1999 TotalBanking
Number 5 28 14 18 9 11 9 3 11 6 114Total Value 181.8 464.3 498.3 5624.3 16.3 172.5 2432.1 558.1 4890.7 14495.8 29334.2
Withinborder/Withinindustry
Ave Value 60.6 92.9 166.1 1124.9 8.2 43.1 810.7 279.1 543.4 2899.2 715.5
Number 2 9 3 7 4 4 2 1 3 1 36Total Value 74.4 491.5 31.1 210.2 6.6 909.2 0.0 0.0 395.2 7.1 2125.3
Withinborder/Crossindustry
Ave Value 37.2 98.3 31.1 105.1 6.6 454.6 0.0 0.0 197.6 7.1 132.8
Number 1 2 5 1 4 7 3 4 11 3 41Total Value 0.0 0.0 0.0 0.0 133.8 1783.9 0.0 53.0 2243.8 300.3 4514.8
Crossborder/Withinindustry
Ave Value 0.0 0.0 0.0 0.0 66.9 446.0 0.0 53.0 280.5 150.2 265.6
Number 0 0 1 0 0 0 1 2 2 3 9Total Value 0.0 0.0 861.1 0.0 0.0 0.0 323.7 260.8 744.4 321.0 2511.0
Crossborder/Crossindustry
Ave Value 0.0 0.0 861.1 0.0 0.0 0.0 323.7 130.4 372.2 107.0 279.0
Insurance
Number 0 1 0 4 0 2 2 1 2 2 14Total Value 0.0 0.0 0.0 2741.4 0.0 14.3 10605.4 0.0 2919.4 0.0 16280.5
Withinborder/Withinindustry
Ave Value 0.0 0.0 0.0 2741.4 0.0 14.3 10605.4 0.0 1459.7 0.0 3256.1
Number 0 1 2 0 0 1 1 3 1 0 9Total Value 0.0 0.0 0.0 0.0 0.0 0.0 13.6 4352.9 0.0 0.0 4366.5
Withinborder/Crossindustry
Ave Value 0.0 0.0 0.0 0.0 0.0 0.0 13.6 2176.5 0.0 0.0 1455.5
Number 1 1 0 0 1 4 4 8 2 2 23Total Value 0.0 0.0 0.0 0.0 0.0 0.2 166.9 2764.4 187.0 0.0 3118.5
Crossborder/Withinindustry
Ave Value 0.0 0.0 0.0 0.0 0.0 0.2 41.7 460.7 93.5 0.0 239.9
Number 0 1 0 0 0 1 0 1 1 0 4Total Value 0.0 91.0 0.0 0.0 0.0 83.9 0.0 0.4 27.1 0.0 202.4
Crossborder/Crossindustry
Ave Value 0.0 91.0 0.0 0.0 0.0 83.9 0.0 0.4 27.1 0.0 50.6
Securities/Other
Number 5 18 13 6 7 11 10 2 5 4 81Total Value 13.0 141.6 0.0 7613.1 22.5 258.0 405.6 0.0 66.7 13.4 8533.9
Withinborder/Withinindustry
Ave Value 13.0 47.2 0.0 3806.6 11.3 129.0 202.8 0.0 22.2 13.4 533.4
Number 2 9 7 4 5 9 6 2 1 4 49Total Value 133.2 0.0 177.8 55.2 13.9 1125.3 32.2 4.6 66.9 108.1 1717.2
Withinborder/Crossindustry
Ave Value 133.2 0.0 59.3 27.6 13.9 187.6 32.2 4.6 66.9 36.0 90.4
Number 0 1 3 0 2 3 0 3 0 3 15Total Value 0.0 0.0 0.0 0.0 55.6 0.0 0.0 6.0 0.0 6182.1 6243.7
Crossborder/Withinindustry
Ave Value 0.0 0.0 0.0 0.0 55.6 0.0 0.0 6.0 0.0 3091.1 1560.9
Number 0 2 1 1 3 1 1 2 1 1 13Total Value 0.0 0.0 0.0 111.7 0.0 133.3 0.0 61.5 60.2 0.0 366.7
Crossborder/Crossindustry
Ave Value 0.0 0.0 0.0 111.7 0.0 133.3 0.0 61.5 60.2 0.0 91.7
Number 16 73 49 41 35 54 39 32 40 29 408Total Value 402.4 1188.4 1568.3 16355.9 248.7 4480.6 13979.5 8061.7 11601.4 21427.8 79314.7
Total
Ave Value 57.5 84.9 196.0 1258.1 27.6 203.7 1075.3 474.2 374.2 1260.5 525.3

373
Deals classified by country and sector of acquiring firm
1990 1991 1992 1993 1994 1995 1996 1997 1998 1999 TotalDeal type
Number 10 47 27 28 16 24 21 6 18 12 209Total Value 194.8 605.9 498.3 15978.8 38.8 444.8 13443.1 558.1 7876.8 14509.2 54148.6
Withinborder/WithinIndustry
Ave Value 48.7 75.7 166.1 1997.4 9.7 63.5 2240.5 279.1 562.6 2418.2 873.4
Number 3 19 12 11 9 14 9 6 5 5 93Total Value 74.4 491.5 208.9 265.4 20.5 2034.5 45.8 4357.5 462.1 115.2 8075.8
Withinborder/Crossindustry
Ave Value 37.2 98.3 52.2 66.4 10.3 254.3 22.9 1452.5 154.0 28.8 218.3
Number 11 4 8 9 7 10 8 8 16 10 91Total Value 315.2 82.2 79.0 3435.6 674.4 1193.7 3368.0 80.6 1899.5 2932.1 14060.3
Crossborder/Withinindustry
Ave Value 78.8 41.1 39.5 1145.2 168.6 199.0 842.0 40.3 211.1 488.7 334.8
Number 4 5 4 1 1 3 8 8 4 4 42Total Value 586.4 102.2 918.3 0.0 0.0 244.2 15.5 275.2 278.9 300.6 2721.3
Crossborder/Crossindustry
Ave Value 146.6 51.1 306.1 0.0 0.0 122.1 15.5 91.7 93.0 150.3 136.1
Deal type
Number 13 66 39 39 25 38 30 12 23 17 302Total Value 269.2 1097.4 707.2 16244.2 59.3 2479.3 13488.9 4915.6 8338.9 14624.4 62224.4
Withinborder
Ave Value 44.9 84.4 101.0 1353.7 9.9 165.3 1686.1 983.1 490.5 1462.4 628.5
Number 15 9 12 10 8 13 16 16 20 14 133Total Value 901.6 184.4 997.3 3435.6 674.4 1437.9 3383.5 355.8 2178.4 3232.7 16781.6
Crossborder
Ave Value 112.7 46.1 199.5 1145.2 168.6 179.7 676.7 71.2 181.5 404.1 270.7
Deal type
Number 21 51 35 37 23 34 29 14 34 22 300Total Value 510.0 688.1 577.3 19414.4 713.2 1638.5 16811.1 638.7 9776.3 17441.3 68208.9
Withinindustry
Ave Value 63.8 68.8 115.5 1764.9 89.2 126.0 1681.1 159.7 425.1 1453.4 655.9
Number 7 24 16 12 10 17 17 14 9 9 135Total Value 660.8 593.7 1127.2 265.4 20.5 2278.7 61.3 4632.7 741.0 415.8 10797.1
Crossindustry
Ave Value 110.1 84.8 161.0 66.4 10.3 227.9 20.4 772.1 123.5 69.3 189.4
Industry
Number 13 40 26 24 17 26 22 13 22 14 217Total Value 484.4 637.5 601.0 5636.4 49.0 1015.4 2464.3 1373.0 6700.0 14906.7 33867.7
Banking
Ave Value 60.6 79.7 120.2 939.4 12.3 78.1 616.1 228.8 418.8 1490.7 423.3
Number 7 4 4 12 6 8 6 8 9 6 70InsuranceAve Value 69.8 0.0 43.4 1012.4 215.5 322.0 3631.6 108.2 737.6 983.1 773.2
Number 8 31 21 13 10 17 18 7 12 11 148Total Value 476.9 644.3 929.8 7968.8 38.2 1291.9 3513.4 3682.0 866.8 984.2 20396.3
Securities/Other
Ave Value 159.0 71.6 309.9 2656.3 12.7 258.4 585.6 1841.0 96.3 164.0 416.3
Number 28 75 51 49 33 51 46 28 43 31 435Total Value 1170.8 1281.8 1704.5 19679.8 733.7 3917.2 16872.4 5271.4 10517.3 17857.1 79006.0Ave Value 83.6 75.4 142.0 1312.0 73.4 170.3 1297.9 527.1 362.7 992.1 490.7
GDP 1219313 1224258 1347451 1277003 1352306 1555093 1554895 1406827 1448918 1432218 13818281
Total
Value/GDP 0.10% 0.10% 0.13% 1.54% 0.05% 0.25% 1.09% 0.37% 0.73% 1.25% 0.57%
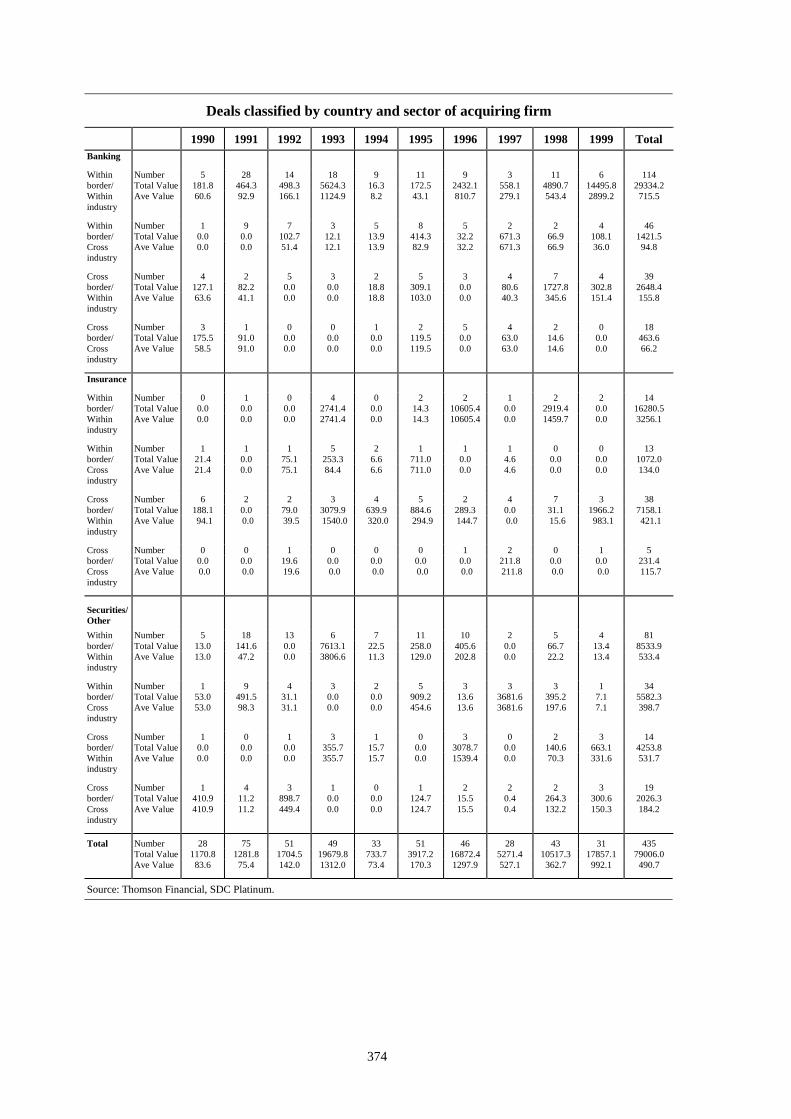
374
Deals classified by country and sector of acquiring firm
1990 1991 1992 1993 1994 1995 1996 1997 1998 1999 TotalBanking
Number 5 28 14 18 9 11 9 3 11 6 114Total Value 181.8 464.3 498.3 5624.3 16.3 172.5 2432.1 558.1 4890.7 14495.8 29334.2
Withinborder/Withinindustry
Ave Value 60.6 92.9 166.1 1124.9 8.2 43.1 810.7 279.1 543.4 2899.2 715.5
Number 1 9 7 3 5 8 5 2 2 4 46Total Value 0.0 0.0 102.7 12.1 13.9 414.3 32.2 671.3 66.9 108.1 1421.5
Withinborder/Crossindustry
Ave Value 0.0 0.0 51.4 12.1 13.9 82.9 32.2 671.3 66.9 36.0 94.8
Number 4 2 5 3 2 5 3 4 7 4 39Total Value 127.1 82.2 0.0 0.0 18.8 309.1 0.0 80.6 1727.8 302.8 2648.4
Crossborder/Withinindustry
Ave Value 63.6 41.1 0.0 0.0 18.8 103.0 0.0 40.3 345.6 151.4 155.8
Number 3 1 0 0 1 2 5 4 2 0 18Total Value 175.5 91.0 0.0 0.0 0.0 119.5 0.0 63.0 14.6 0.0 463.6
Crossborder/Crossindustry
Ave Value 58.5 91.0 0.0 0.0 0.0 119.5 0.0 63.0 14.6 0.0 66.2
Insurance
Number 0 1 0 4 0 2 2 1 2 2 14Total Value 0.0 0.0 0.0 2741.4 0.0 14.3 10605.4 0.0 2919.4 0.0 16280.5
Withinborder/Withinindustry
Ave Value 0.0 0.0 0.0 2741.4 0.0 14.3 10605.4 0.0 1459.7 0.0 3256.1
Number 1 1 1 5 2 1 1 1 0 0 13Total Value 21.4 0.0 75.1 253.3 6.6 711.0 0.0 4.6 0.0 0.0 1072.0
Withinborder/Crossindustry
Ave Value 21.4 0.0 75.1 84.4 6.6 711.0 0.0 4.6 0.0 0.0 134.0
Number 6 2 2 3 4 5 2 4 7 3 38Total Value 188.1 0.0 79.0 3079.9 639.9 884.6 289.3 0.0 31.1 1966.2 7158.1
Crossborder/Withinindustry
Ave Value 94.1 0.0 39.5 1540.0 320.0 294.9 144.7 0.0 15.6 983.1 421.1
Number 0 0 1 0 0 0 1 2 0 1 5Total Value 0.0 0.0 19.6 0.0 0.0 0.0 0.0 211.8 0.0 0.0 231.4
Crossborder/Crossindustry
Ave Value 0.0 0.0 19.6 0.0 0.0 0.0 0.0 211.8 0.0 0.0 115.7
Securities/Other
Number 5 18 13 6 7 11 10 2 5 4 81Total Value 13.0 141.6 0.0 7613.1 22.5 258.0 405.6 0.0 66.7 13.4 8533.9
Withinborder/Withinindustry
Ave Value 13.0 47.2 0.0 3806.6 11.3 129.0 202.8 0.0 22.2 13.4 533.4
Number 1 9 4 3 2 5 3 3 3 1 34Total Value 53.0 491.5 31.1 0.0 0.0 909.2 13.6 3681.6 395.2 7.1 5582.3
Withinborder/Crossindustry
Ave Value 53.0 98.3 31.1 0.0 0.0 454.6 13.6 3681.6 197.6 7.1 398.7
Number 1 0 1 3 1 0 3 0 2 3 14Total Value 0.0 0.0 0.0 355.7 15.7 0.0 3078.7 0.0 140.6 663.1 4253.8
Crossborder/Withinindustry
Ave Value 0.0 0.0 0.0 355.7 15.7 0.0 1539.4 0.0 70.3 331.6 531.7
Number 1 4 3 1 0 1 2 2 2 3 19Total Value 410.9 11.2 898.7 0.0 0.0 124.7 15.5 0.4 264.3 300.6 2026.3
Crossborder/Crossindustry
Ave Value 410.9 11.2 449.4 0.0 0.0 124.7 15.5 0.4 132.2 150.3 184.2
Number 28 75 51 49 33 51 46 28 43 31 435Total Value 1170.8 1281.8 1704.5 19679.8 733.7 3917.2 16872.4 5271.4 10517.3 17857.1 79006.0
Total
Ave Value 83.6 75.4 142.0 1312.0 73.4 170.3 1297.9 527.1 362.7 992.1 490.7
Source: Thomson Financial, SDC Platinum.

375
Table A.11Country: Germany
All values in USD millionsDeals classified by country and sector of target firm
1990 1991 1992 1993 1994 1995 1996 1997 1998 1999 Total
Deal typeNumber 6 12 18 14 36 29 30 21 28 44 238Total Value 787.2 1575.0 2547.8 0.0 2826.2 0.0 223.9 11063.1 24.3 310.5 19358.0
Withinborder/Withinindustry
Ave Value 393.6 787.5 509.6 0.0 942.1 0.0 112.0 5531.6 24.3 103.5 967.9
Number 1 2 5 6 15 17 9 7 6 8 76Total Value 0.0 0.0 556.8 452.3 49.6 425.2 0.0 0.0 2076.7 337.1 3897.7
Withinborder/Crossindustry
Ave Value 0.0 0.0 185.6 226.2 16.5 425.2 0.0 0.0 2076.7 337.1 354.3
Number 0 3 2 4 2 5 2 3 8 8 37Total Value 0.0 0.0 407.7 0.0 0.0 377.2 122.5 5075.1 313.7 1162.9 7459.1
Crossborder/Withinindustry
Ave Value 0.0 0.0 407.7 0.0 0.0 94.3 122.5 5075.1 313.7 290.7 621.6
Number 1 0 1 1 4 4 4 3 1 3 22Total Value 0.0 0.0 888.4 0.0 0.0 124.7 0.0 194.8 0.0 4040.8 5248.7
Crossborder/Crossindustry
Ave Value 0.0 0.0 888.4 0.0 0.0 124.7 0.0 194.8 0.0 2020.4 1049.7
Deal type
Number 7 14 23 20 51 46 39 28 34 52 314Total Value 787.2 1575.0 3104.6 452.3 2875.8 425.2 223.9 11063.1 2101.0 647.6 23255.7
Withinborder
Ave Value 393.6 787.5 388.1 226.2 479.3 425.2 112.0 5531.6 1050.5 161.9 750.2
Number 1 3 3 5 6 9 6 6 9 11 59Total Value 0.0 0.0 1296.1 0.0 0.0 501.9 122.5 5269.9 313.7 5203.7 12707.8
Crossborder
Ave Value 0.0 0.0 648.1 0.0 0.0 100.4 122.5 2635.0 313.7 867.3 747.5
Deal typeNumber 6 15 20 18 38 34 32 24 36 52 275Total Value 787.2 1575.0 2955.5 0.0 2826.2 377.2 346.4 16138.2 338.0 1473.4 26817.1
Withinindustry
Ave Value 393.6 787.5 492.6 0.0 942.1 94.3 115.5 5379.4 169.0 210.5 838.0
Number 2 2 6 7 19 21 13 10 7 11 98Total Value 0.0 0.0 1445.2 452.3 49.6 549.9 0.0 194.8 2076.7 4377.9 9146.4
Crossindustry
Ave Value 0.0 0.0 361.3 226.2 16.5 275.0 0.0 194.8 2076.7 1459.3 571.7
Industry
Number 6 10 13 13 33 24 23 21 31 44 218Total Value 202.8 0.0 1064.4 432.4 126.0 124.7 127.2 7001.2 24.3 4493.2 13596.2
Banking
Ave Value 202.8 0.0 354.8 432.4 42.0 124.7 63.6 7001.2 24.3 641.9 679.8Number 1 3 7 7 6 15 8 8 9 8 72Total Value 584.4 0.0 2706.0 19.9 2738.0 558.4 219.2 9137.0 2390.4 963.0 19316.3
Insurance
Ave Value 584.4 0.0 541.2 19.9 1369.0 279.2 219.2 4568.5 1195.2 963.0 1136.3
Number 1 4 6 5 18 16 14 5 3 11 83Total Value 0.0 1575.0 630.3 0.0 11.8 244.0 0.0 194.8 0.0 395.1 3051.0
Securities/Other
Ave Value 0.0 787.5 315.2 0.0 11.8 81.3 0.0 194.8 0.0 197.6 277.4
Number 8 17 26 25 57 55 45 34 43 63 373Total Value 787.2 1575.0 4400.7 452.3 2875.8 927.1 346.4 16333.0 2414.7 5851.3 35963.5Ave Value 393.6 787.5 440.1 226.2 479.3 154.5 115.5 4083.3 804.9 585.1 749.2
GDP 1679079 1780793 2021775 1955203 2095849 2459378 2384235 2119601 2151383 2108903 20756200
Total
Value/GDP 0.05% 0.09% 0.22% 0.02% 0.14% 0.04% 0.01% 0.77% 0.11% 0.28% 0.17%

376
Deals classified by country and sector of target firm
1990 1991 1992 1993 1994 1995 1996 1997 1998 1999 TotalBanking
Number 4 8 8 6 21 15 18 16 22 33 151Total Value 202.8 0.0 8.0 0.0 97.3 0.0 4.7 7001.2 24.3 252.5 7590.8
Withinborder/Withinindustry
Ave Value 202.8 0.0 8.0 0.0 97.3 0.0 4.7 7001.2 24.3 126.3 948.9
Number 1 1 3 3 8 7 0 5 3 4 35Total Value 0.0 0.0 168.0 432.4 28.7 0.0 0.0 0.0 0.0 0.0 629.1
Withinborder/Crossindustry
Ave Value 0.0 0.0 168.0 432.4 14.4 0.0 0.0 0.0 0.0 0.0 157.3
Number 0 1 1 3 2 0 1 0 5 4 17Total Value 0.0 0.0 0.0 0.0 0.0 0.0 122.5 0.0 0.0 199.9 322.4
Crossborder/Withinindustry
Ave Value 0.0 0.0 0.0 0.0 0.0 0.0 122.5 0.0 0.0 66.6 80.6
Number 1 0 1 1 2 2 4 0 1 3 15Total Value 0.0 0.0 888.4 0.0 0.0 124.7 0.0 0.0 0.0 4040.8 5053.9
Crossborder/Crossindustry
Ave Value 0.0 0.0 888.4 0.0 0.0 124.7 0.0 0.0 0.0 2020.4 1263.5
Insurance
Number 1 0 5 4 4 7 6 5 4 5 41Total Value 584.4 0.0 2046.9 0.0 2717.1 0.0 219.2 4061.9 0.0 0.0 9629.5
Withinborder/Withinindustry
Ave Value 584.4 0.0 682.3 0.0 2717.1 0.0 219.2 4061.9 0.0 0.0 1375.6
Number 0 1 1 2 1 6 2 0 2 0 15Total Value 0.0 0.0 251.4 19.9 20.9 425.2 0.0 0.0 2076.7 0.0 2794.1
Withinborder/Crossindustry
Ave Value 0.0 0.0 251.4 19.9 20.9 425.2 0.0 0.0 2076.7 0.0 558.8
Number 0 2 1 1 0 2 0 2 3 3 14Total Value 0.0 0.0 407.7 0.0 0.0 133.2 0.0 5075.1 313.7 963.0 6892.7
Crossborder/Withinindustry
Ave Value 0.0 0.0 407.7 0.0 0.0 133.2 0.0 5075.1 313.7 963.0 1378.5
Number 0 0 0 0 1 0 0 1 0 0 2Total Value 0.0 0.0 0.0 0.0 0.0 0.0 0.0 0.0 0.0 0.0 0.0
Crossborder/Crossindustry
Ave Value 0.0 0.0 0.0 0.0 0.0 0.0 0.0 0.0 0.0 0.0 0.0
Securities/Other
Number 1 4 5 4 11 7 6 0 2 6 46Total Value 0.0 1575.0 492.9 0.0 11.8 0.0 0.0 0.0 0.0 58.0 2137.7
Withinborder/Withinindustry
Ave Value 0.0 787.5 492.9 0.0 11.8 0.0 0.0 0.0 0.0 58.0 427.5
Number 0 0 1 1 6 4 7 2 1 4 26Total Value 0.0 0.0 137.4 0.0 0.0 0.0 0.0 0.0 0.0 337.1 474.5
Withinborder/Crossindustry
Ave Value 0.0 0.0 137.4 0.0 0.0 0.0 0.0 0.0 0.0 337.1 237.3
Number 0 0 0 0 0 3 1 1 0 1 6Total Value 0.0 0.0 0.0 0.0 0.0 244.0 0.0 0.0 0.0 0.0 244.0
Crossborder/Withinindustry
Ave Value 0.0 0.0 0.0 0.0 0.0 81.3 0.0 0.0 0.0 0.0 81.3
Number 0 0 0 0 1 2 0 2 0 0 5Total Value 0.0 0.0 0.0 0.0 0.0 0.0 0.0 194.8 0.0 0.0 194.8
Crossborder/Crossindustry
Ave Value 0.0 0.0 0.0 0.0 0.0 0.0 0.0 194.8 0.0 0.0 194.8
Number 8 17 26 25 57 55 45 34 43 63 373Total Value 787.2 1575.0 4400.7 452.3 2875.8 927.1 346.4 16333.0 2414.7 5851.3 35963.5
Total
Ave Value 393.6 787.5 440.1 226.2 479.3 154.5 115.5 4083.3 804.9 585.1 749.2
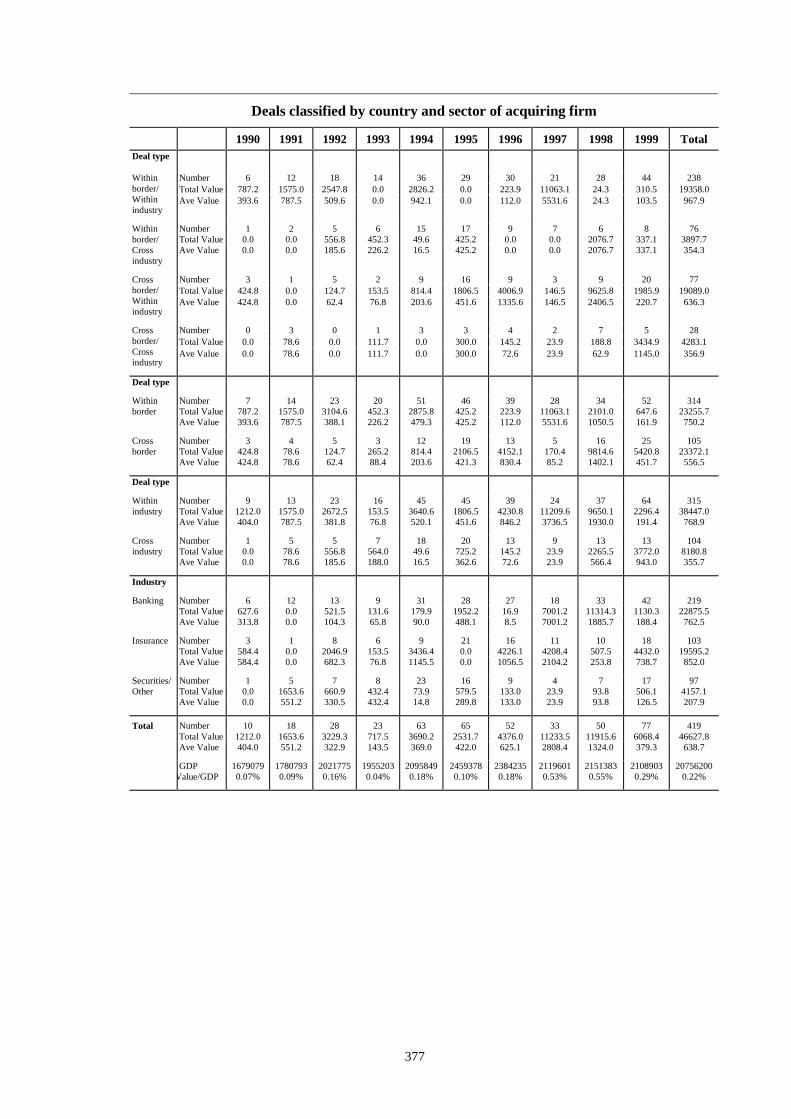
377
Deals classified by country and sector of acquiring firm
1990 1991 1992 1993 1994 1995 1996 1997 1998 1999 TotalDeal type
Number 6 12 18 14 36 29 30 21 28 44 238Total Value 787.2 1575.0 2547.8 0.0 2826.2 0.0 223.9 11063.1 24.3 310.5 19358.0
Withinborder/Withinindustry
Ave Value 393.6 787.5 509.6 0.0 942.1 0.0 112.0 5531.6 24.3 103.5 967.9
Number 1 2 5 6 15 17 9 7 6 8 76Total Value 0.0 0.0 556.8 452.3 49.6 425.2 0.0 0.0 2076.7 337.1 3897.7
Withinborder/Crossindustry
Ave Value 0.0 0.0 185.6 226.2 16.5 425.2 0.0 0.0 2076.7 337.1 354.3
Number 3 1 5 2 9 16 9 3 9 20 77Total Value 424.8 0.0 124.7 153.5 814.4 1806.5 4006.9 146.5 9625.8 1985.9 19089.0
Crossborder/Withinindustry
Ave Value 424.8 0.0 62.4 76.8 203.6 451.6 1335.6 146.5 2406.5 220.7 636.3
Number 0 3 0 1 3 3 4 2 7 5 28Total Value 0.0 78.6 0.0 111.7 0.0 300.0 145.2 23.9 188.8 3434.9 4283.1
Crossborder/Crossindustry
Ave Value 0.0 78.6 0.0 111.7 0.0 300.0 72.6 23.9 62.9 1145.0 356.9
Deal type
Number 7 14 23 20 51 46 39 28 34 52 314Total Value 787.2 1575.0 3104.6 452.3 2875.8 425.2 223.9 11063.1 2101.0 647.6 23255.7
Withinborder
Ave Value 393.6 787.5 388.1 226.2 479.3 425.2 112.0 5531.6 1050.5 161.9 750.2
Number 3 4 5 3 12 19 13 5 16 25 105Total Value 424.8 78.6 124.7 265.2 814.4 2106.5 4152.1 170.4 9814.6 5420.8 23372.1
Crossborder
Ave Value 424.8 78.6 62.4 88.4 203.6 421.3 830.4 85.2 1402.1 451.7 556.5
Deal type
Number 9 13 23 16 45 45 39 24 37 64 315Total Value 1212.0 1575.0 2672.5 153.5 3640.6 1806.5 4230.8 11209.6 9650.1 2296.4 38447.0
Withinindustry
Ave Value 404.0 787.5 381.8 76.8 520.1 451.6 846.2 3736.5 1930.0 191.4 768.9
Number 1 5 5 7 18 20 13 9 13 13 104Total Value 0.0 78.6 556.8 564.0 49.6 725.2 145.2 23.9 2265.5 3772.0 8180.8
Crossindustry
Ave Value 0.0 78.6 185.6 188.0 16.5 362.6 72.6 23.9 566.4 943.0 355.7
Industry
Number 6 12 13 9 31 28 27 18 33 42 219Total Value 627.6 0.0 521.5 131.6 179.9 1952.2 16.9 7001.2 11314.3 1130.3 22875.5
Banking
Ave Value 313.8 0.0 104.3 65.8 90.0 488.1 8.5 7001.2 1885.7 188.4 762.5
Number 3 1 8 6 9 21 16 11 10 18 103Total Value 584.4 0.0 2046.9 153.5 3436.4 0.0 4226.1 4208.4 507.5 4432.0 19595.2
Insurance
Ave Value 584.4 0.0 682.3 76.8 1145.5 0.0 1056.5 2104.2 253.8 738.7 852.0
Number 1 5 7 8 23 16 9 4 7 17 97Total Value 0.0 1653.6 660.9 432.4 73.9 579.5 133.0 23.9 93.8 506.1 4157.1
Securities/Other
Ave Value 0.0 551.2 330.5 432.4 14.8 289.8 133.0 23.9 93.8 126.5 207.9
Number 10 18 28 23 63 65 52 33 50 77 419Total Value 1212.0 1653.6 3229.3 717.5 3690.2 2531.7 4376.0 11233.5 11915.6 6068.4 46627.8Ave Value 404.0 551.2 322.9 143.5 369.0 422.0 625.1 2808.4 1324.0 379.3 638.7
GDP 1679079 1780793 2021775 1955203 2095849 2459378 2384235 2119601 2151383 2108903 20756200
Total
Value/GDP 0.07% 0.09% 0.16% 0.04% 0.18% 0.10% 0.18% 0.53% 0.55% 0.29% 0.22%
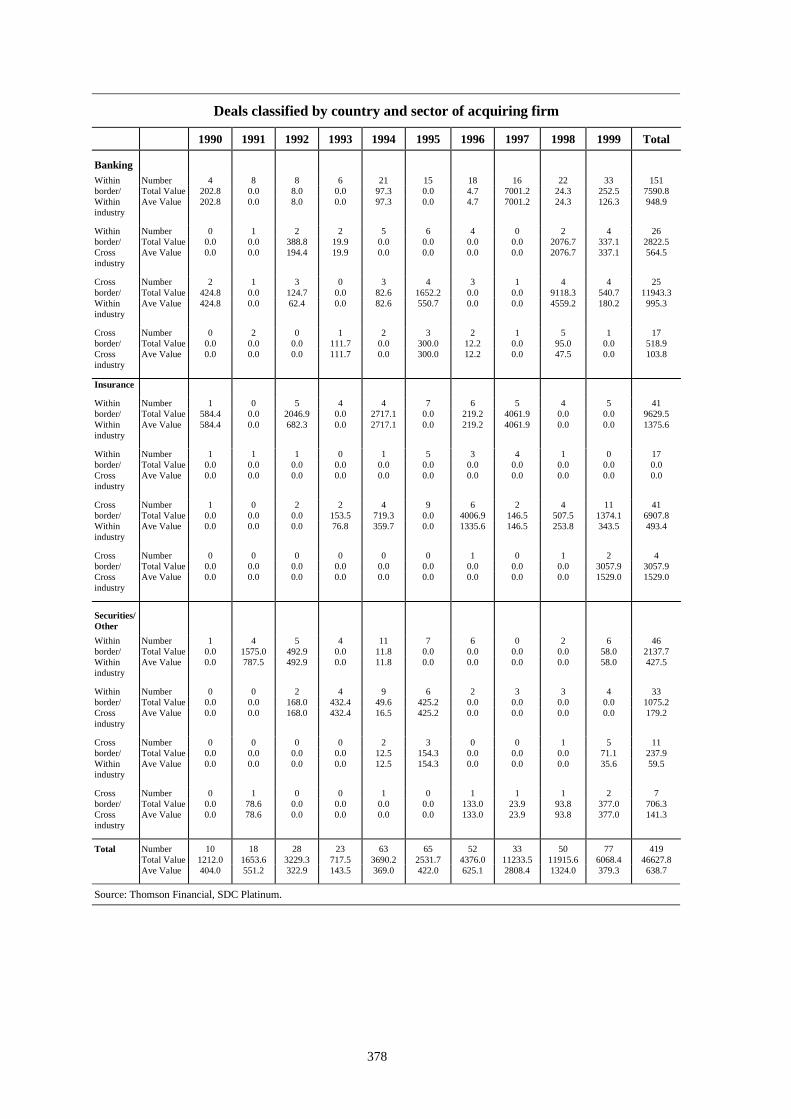
378
Deals classified by country and sector of acquiring firm
1990 1991 1992 1993 1994 1995 1996 1997 1998 1999 Total
BankingNumber 4 8 8 6 21 15 18 16 22 33 151Total Value 202.8 0.0 8.0 0.0 97.3 0.0 4.7 7001.2 24.3 252.5 7590.8
Withinborder/Withinindustry
Ave Value 202.8 0.0 8.0 0.0 97.3 0.0 4.7 7001.2 24.3 126.3 948.9
Number 0 1 2 2 5 6 4 0 2 4 26Total Value 0.0 0.0 388.8 19.9 0.0 0.0 0.0 0.0 2076.7 337.1 2822.5
Withinborder/Crossindustry
Ave Value 0.0 0.0 194.4 19.9 0.0 0.0 0.0 0.0 2076.7 337.1 564.5
Number 2 1 3 0 3 4 3 1 4 4 25Total Value 424.8 0.0 124.7 0.0 82.6 1652.2 0.0 0.0 9118.3 540.7 11943.3
Crossborder/Withinindustry
Ave Value 424.8 0.0 62.4 0.0 82.6 550.7 0.0 0.0 4559.2 180.2 995.3
Number 0 2 0 1 2 3 2 1 5 1 17Total Value 0.0 0.0 0.0 111.7 0.0 300.0 12.2 0.0 95.0 0.0 518.9
Crossborder/Crossindustry
Ave Value 0.0 0.0 0.0 111.7 0.0 300.0 12.2 0.0 47.5 0.0 103.8
Insurance
Number 1 0 5 4 4 7 6 5 4 5 41Total Value 584.4 0.0 2046.9 0.0 2717.1 0.0 219.2 4061.9 0.0 0.0 9629.5
Withinborder/Withinindustry
Ave Value 584.4 0.0 682.3 0.0 2717.1 0.0 219.2 4061.9 0.0 0.0 1375.6
Number 1 1 1 0 1 5 3 4 1 0 17Total Value 0.0 0.0 0.0 0.0 0.0 0.0 0.0 0.0 0.0 0.0 0.0
Withinborder/Crossindustry
Ave Value 0.0 0.0 0.0 0.0 0.0 0.0 0.0 0.0 0.0 0.0 0.0
Number 1 0 2 2 4 9 6 2 4 11 41Total Value 0.0 0.0 0.0 153.5 719.3 0.0 4006.9 146.5 507.5 1374.1 6907.8
Crossborder/Withinindustry
Ave Value 0.0 0.0 0.0 76.8 359.7 0.0 1335.6 146.5 253.8 343.5 493.4
Number 0 0 0 0 0 0 1 0 1 2 4Total Value 0.0 0.0 0.0 0.0 0.0 0.0 0.0 0.0 0.0 3057.9 3057.9
Crossborder/Crossindustry
Ave Value 0.0 0.0 0.0 0.0 0.0 0.0 0.0 0.0 0.0 1529.0 1529.0
Securities/Other
Number 1 4 5 4 11 7 6 0 2 6 46Total Value 0.0 1575.0 492.9 0.0 11.8 0.0 0.0 0.0 0.0 58.0 2137.7
Withinborder/Withinindustry
Ave Value 0.0 787.5 492.9 0.0 11.8 0.0 0.0 0.0 0.0 58.0 427.5
Number 0 0 2 4 9 6 2 3 3 4 33Total Value 0.0 0.0 168.0 432.4 49.6 425.2 0.0 0.0 0.0 0.0 1075.2
Withinborder/Crossindustry
Ave Value 0.0 0.0 168.0 432.4 16.5 425.2 0.0 0.0 0.0 0.0 179.2
Number 0 0 0 0 2 3 0 0 1 5 11Total Value 0.0 0.0 0.0 0.0 12.5 154.3 0.0 0.0 0.0 71.1 237.9
Crossborder/Withinindustry
Ave Value 0.0 0.0 0.0 0.0 12.5 154.3 0.0 0.0 0.0 35.6 59.5
Number 0 1 0 0 1 0 1 1 1 2 7Total Value 0.0 78.6 0.0 0.0 0.0 0.0 133.0 23.9 93.8 377.0 706.3
Crossborder/Crossindustry
Ave Value 0.0 78.6 0.0 0.0 0.0 0.0 133.0 23.9 93.8 377.0 141.3
Number 10 18 28 23 63 65 52 33 50 77 419Total Value 1212.0 1653.6 3229.3 717.5 3690.2 2531.7 4376.0 11233.5 11915.6 6068.4 46627.8
Total
Ave Value 404.0 551.2 322.9 143.5 369.0 422.0 625.1 2808.4 1324.0 379.3 638.7
Source: Thomson Financial, SDC Platinum.

379
Table A.12Country: Italy
All values in USD millionsDeals classified by country and sector of target firm
1990 1991 1992 1993 1994 1995 1996 1997 1998 1999 Total
Deal typeNumber 7 28 37 20 35 21 20 14 22 27 231Total Value 2616.7 6163.8 2056.7 5755.5 3446.4 1074.1 1532.1 5425.6 31736.9 33116.9 92924.7
Withinborder/Withinindustry
Ave Value 523.3 474.1 257.1 959.3 382.9 153.4 170.2 678.2 1983.6 2759.7 999.2
Number 4 3 9 8 11 5 14 9 6 13 82Total Value 96.5 78.3 256.7 262.1 590.6 0.0 777.6 73.8 557.9 1257.3 3950.8
Withinborder/Crossindustry
Ave Value 96.5 78.3 85.6 65.5 73.8 0.0 194.4 36.9 186.0 157.2 116.2
Number 3 3 2 4 6 5 2 7 3 4 39Total Value 80.3 44.0 0.0 279.8 750.3 154.3 376.4 375.2 64.3 156.8 2281.4
Crossborder/Withinindustry
Ave Value 80.3 44.0 0.0 279.8 187.6 154.3 376.4 125.1 32.2 156.8 152.1
Number 1 3 2 1 2 2 0 3 2 2 18Total Value 0.0 0.0 273.6 0.0 26.0 175.7 0.0 0.0 237.2 750.6 1463.1
Crossborder/Crossindustry
Ave Value 0.0 0.0 136.8 0.0 26.0 175.7 0.0 0.0 237.2 750.6 243.9
Deal type
Number 11 31 46 28 46 26 34 23 28 40 313Total Value 2713.2 6242.1 2313.4 6017.6 4037.0 1074.1 2309.7 5499.4 32294.8 34374.2 96875.5
Withinborder
Ave Value 452.2 445.9 210.3 601.8 237.5 153.4 177.7 549.9 1699.7 1718.7 762.8
Number 4 6 4 5 8 7 2 10 5 6 57Total Value 80.3 44.0 273.6 279.8 776.3 330.0 376.4 375.2 301.5 907.4 3744.5
Crossborder
Ave Value 80.3 44.0 136.8 279.8 155.3 165.0 376.4 125.1 100.5 453.7 178.3
Deal type
Number 10 31 39 24 41 26 22 21 25 31 270Total Value 2697.0 6207.8 2056.7 6035.3 4196.7 1228.4 1908.5 5800.8 31801.2 33273.7 95206.1
Withinindustry
Ave Value 449.5 443.4 257.1 862.2 322.8 153.6 190.9 527.3 1766.7 2559.5 881.5
Number 5 6 11 9 13 7 14 12 8 15 100Total Value 96.5 78.3 530.3 262.1 616.6 175.7 777.6 73.8 795.1 2007.9 5413.9
Crossindustry
Ave Value 96.5 78.3 106.1 65.5 68.5 175.7 194.4 36.9 198.8 223.1 135.3
Industry
Number 7 20 32 20 34 21 17 15 26 36 228Total Value 2632.1 5790.4 2309.0 2915.9 3778.8 1234.4 1002.1 5096.3 32322.7 24423.3 81505.0
Banking
Ave Value 526.4 723.8 256.6 364.5 343.5 176.3 143.2 566.3 1795.7 1436.7 823.3
Number 7 2 6 4 6 5 11 11 3 3 58Total Value 161.4 473.3 2.3 3378.6 853.8 0.0 896.6 778.3 65.9 10187.5 16797.7
Insurance
Ave Value 80.7 236.7 2.3 1689.3 170.8 0.0 224.2 194.6 22.0 5093.8 671.9
Number 1 15 12 9 14 7 8 7 4 7 84Total Value 0.0 22.4 275.7 2.9 180.7 169.7 787.4 0.0 207.7 670.8 2317.3
Securities/Other
Ave Value 0.0 4.5 91.9 2.9 30.1 84.9 262.5 0.0 207.7 223.6 96.6
Number 15 37 50 33 54 33 36 33 33 46 370Total Value 2793.5 6286.1 2587.0 6297.4 4813.3 1404.1 2686.1 5874.6 32596.3 35281.6 100620.0Ave Value 399.1 419.1 199.0 572.5 218.8 156.0 191.9 451.9 1481.7 1603.7 679.9
GDP 1105131 1163743 1236492 995684 1026576 1097756 1233298 1165163 1192002 1171635 11387480
Total
Value/GDP 0.25% 0.54% 0.21% 0.63% 0.47% 0.13% 0.22% 0.50% 2.73% 3.01% 0.88%

380
Deals classified by country and sector of target firm
1990 1991 1992 1993 1994 1995 1996 1997 1998 1999 TotalBanking
Number 5 15 28 16 29 19 12 11 22 25 182Total Value 2535.6 5668.1 2054.6 2617.2 3359.5 1058.7 997.7 5055.6 31736.9 22937.3 78021.2
Withinborder/Withinindustry
Ave Value 633.9 944.7 293.5 523.4 419.9 176.5 166.3 722.2 1983.6 2085.2 1026.6
Number 2 1 4 2 4 1 4 3 2 7 30Total Value 96.5 78.3 254.4 18.9 419.3 0.0 4.4 39.2 348.6 578.6 1838.2
Withinborder/Crossindustry
Ave Value 96.5 78.3 127.2 9.5 139.8 0.0 4.4 39.2 348.6 144.7 114.9
Number 0 2 0 2 1 0 1 1 1 3 11Total Value 0.0 44.0 0.0 279.8 0.0 0.0 0.0 1.5 0.0 156.8 482.1
Crossborder/Withinindustry
Ave Value 0.0 44.0 0.0 279.8 0.0 0.0 0.0 1.5 0.0 156.8 120.5
Number 0 2 0 0 0 1 0 0 1 1 5Total Value 0.0 0.0 0.0 0.0 0.0 175.7 0.0 0.0 237.2 750.6 1163.5
Crossborder/Crossindustry
Ave Value 0.0 0.0 0.0 0.0 0.0 175.7 0.0 0.0 237.2 750.6 387.8
Insurance
Number 2 2 3 3 2 0 6 1 0 1 20Total Value 81.1 473.3 0.0 3138.3 86.9 0.0 508.4 370.0 0.0 10179.6 14837.6
Withinborder/Withinindustry
Ave Value 81.1 236.7 0.0 3138.3 86.9 0.0 254.2 370.0 0.0 10179.6 1648.6
Number 2 0 2 1 1 2 4 4 1 1 18Total Value 0.0 0.0 2.3 240.3 21.6 0.0 11.8 34.6 1.6 7.9 320.1
Withinborder/Crossindustry
Ave Value 0.0 0.0 2.3 240.3 21.6 0.0 11.8 34.6 1.6 7.9 45.7
Number 2 0 1 0 2 3 1 6 2 1 18Total Value 80.3 0.0 0.0 0.0 719.3 0.0 376.4 373.7 64.3 0.0 1614.0
Crossborder/Withinindustry
Ave Value 80.3 0.0 0.0 0.0 359.7 0.0 376.4 186.9 32.2 0.0 201.8
Number 1 0 0 0 1 0 0 0 0 0 2Total Value 0.0 0.0 0.0 0.0 26.0 0.0 0.0 0.0 0.0 0.0 26.0
Crossborder/Crossindustry
Ave Value 0.0 0.0 0.0 0.0 26.0 0.0 0.0 0.0 0.0 0.0 26.0
Securities/Other
Number 0 11 6 1 4 2 2 2 0 1 29Total Value 0.0 22.4 2.1 0.0 0.0 15.4 26.0 0.0 0.0 0.0 65.9
Withinborder/Withinindustry
Ave Value 0.0 4.5 2.1 0.0 0.0 15.4 26.0 0.0 0.0 0.0 8.2
Number 0 2 3 5 6 2 6 2 3 5 34Total Value 0.0 0.0 0.0 2.9 149.7 0.0 761.4 0.0 207.7 670.8 1792.5
Withinborder/Crossindustry
Ave Value 0.0 0.0 0.0 2.9 37.4 0.0 380.7 0.0 207.7 223.6 163.0
Number 1 1 1 2 3 2 0 0 0 0 10Total Value 0.0 0.0 0.0 0.0 31.0 154.3 0.0 0.0 0.0 0.0 185.3
Crossborder/Withinindustry
Ave Value 0.0 0.0 0.0 0.0 15.5 154.3 0.0 0.0 0.0 0.0 61.8
Number 0 1 2 1 1 1 0 3 1 1 11Total Value 0.0 0.0 273.6 0.0 0.0 0.0 0.0 0.0 0.0 0.0 273.6
Crossborder/Crossindustry
Ave Value 0.0 0.0 136.8 0.0 0.0 0.0 0.0 0.0 0.0 0.0 136.8
Number 15 37 50 33 54 33 36 33 33 46 370Total Value 2793.5 6286.1 2587.0 6297.4 4813.3 1404.1 2686.1 5874.6 32596.3 35281.6 100620.0
Total
Ave Value 399.1 419.1 199.0 572.5 218.8 156.0 191.9 451.9 1481.7 1603.7 679.9

381
Deals classified by country and sector of acquiring firm
1990 1991 1992 1993 1994 1995 1996 1997 1998 1999 Total
Deal typeNumber 7 28 37 20 34 21 20 14 22 27 230Total Value 2616.7 6163.8 2056.7 5755.5 3446.4 1074.1 1532.1 5425.6 31736.9 33116.9 92924.7
Withinborder/Withinindustry
Ave Value 523.3 474.1 257.1 959.3 382.9 153.4 170.2 678.2 1983.6 2759.7 999.2
Number 4 3 9 8 11 5 14 8 6 13 81Total Value 96.5 78.3 256.7 262.1 590.6 0.0 777.6 73.8 557.9 1257.3 3950.8
Withinborder/Crossindustry
Ave Value 96.5 78.3 85.6 65.5 73.8 0.0 194.4 36.9 186.0 157.2 116.2
Number 2 6 8 4 7 7 2 7 5 5 53Total Value 285.0 0.0 448.4 279.8 1164.5 0.0 6.4 7039.7 1715.4 156.8 11096.0
Crossborder/Withinindustry
Ave Value 285.0 0.0 224.2 279.8 1164.5 0.0 6.4 1005.7 571.8 156.8 652.7
Number 0 1 3 0 1 0 0 2 1 2 10Total Value 0.0 38.5 862.1 0.0 59.9 0.0 0.0 49.0 1.2 1389.5 2400.2
Crossborder/Crossindustry
Ave Value 0.0 38.5 431.1 0.0 59.9 0.0 0.0 49.0 1.2 694.8 300.0
Deal type
Number 11 31 46 28 45 26 34 22 28 40 311Total Value 2713.2 6242.1 2313.4 6017.6 4037.0 1074.1 2309.7 5499.4 32294.8 34374.2 96875.5
Withinborder
Ave Value 452.2 445.9 210.3 601.8 237.5 153.4 177.7 549.9 1699.7 1718.7 762.8
Number 2 7 11 4 8 7 2 9 6 7 63Total Value 285.0 38.5 1310.5 279.8 1224.4 0.0 6.4 7088.7 1716.6 1546.3 13496.2
Crossborder
Ave Value 285.0 38.5 327.6 279.8 612.2 0.0 6.4 886.1 429.2 515.4 539.8
Deal type
Number 9 34 45 24 41 28 22 21 27 32 283Total Value 2901.7 6163.8 2505.1 6035.3 4610.9 1074.1 1538.5 12465.3 33452.3 33273.7 104020.7
Withinindustry
Ave Value 483.6 474.1 250.5 862.2 461.1 153.4 153.9 831.0 1760.6 2559.5 945.6
Number 4 4 12 8 12 5 14 10 7 15 91Total Value 96.5 116.8 1118.8 262.1 650.5 0.0 777.6 122.8 559.1 2646.8 6351.0
Crossindustry
Ave Value 96.5 58.4 223.8 65.5 72.3 0.0 194.4 40.9 139.8 264.7 151.2
Industry
Number 7 18 37 23 36 25 21 18 28 35 248Total Value 2535.6 5706.6 2095.3 3140.2 3474.1 1058.7 1558.7 5456.0 31946.2 24080.3 81051.7
Banking
Ave Value 633.9 815.2 261.9 392.5 315.8 176.5 194.8 606.2 1774.8 1416.5 844.3
Number 3 7 6 5 10 3 7 7 3 3 54Total Value 366.1 473.3 408.7 3148.4 1468.6 0.0 720.6 7043.9 66.8 10218.6 23915.0
Insurance
Ave Value 183.1 236.7 204.4 1574.2 244.8 0.0 240.2 1006.3 33.4 5109.3 854.1
Number 3 13 14 4 7 5 8 6 3 9 72Total Value 96.5 100.7 1119.9 8.8 318.7 15.4 36.8 88.2 1998.4 1621.6 5405.0
Securities/Other
Ave Value 96.5 16.8 224.0 8.8 159.4 15.4 12.3 44.1 666.1 405.4 193.0
Number 13 38 57 32 53 33 36 31 34 47 374Total Value 2998.2 6280.6 3623.9 6297.4 5261.4 1074.1 2316.1 12588.1 34011.4 35920.5 110371.7Ave Value 428.3 418.7 241.6 572.5 276.9 153.4 165.4 699.3 1478.8 1561.8 726.1
GDP 1105131 1163743 1236492 995684 1026576 1097756 1233298 1165163 1192002 1171635 11387480
Total
Value/GDP 0.27% 0.54% 0.29% 0.63% 0.51% 0.10% 0.19% 1.08% 2.85% 3.07% 0.97%

382
Deals classified by country and sector of acquiring firm
1990 1991 1992 1993 1994 1995 1996 1997 1998 1999 TotalBanking
Number 5 15 28 16 28 19 12 11 22 25 181Total Value 2535.6 5668.1 2054.6 2617.2 3359.5 1058.7 997.7 5055.6 31736.9 22937.3 78021.2
Withinborder/Withinindustry
Ave Value 633.9 944.7 293.5 523.4 419.9 176.5 166.3 722.2 1983.6 2085.2 1026.6
Number 2 2 3 5 5 4 8 5 4 5 43Total Value 0.0 0.0 0.0 243.2 114.6 0.0 561.0 34.6 209.3 678.7 1841.4
Withinborder/Crossindustry
Ave Value 0.0 0.0 0.0 121.6 38.2 0.0 280.5 34.6 104.7 169.7 131.5
Number 0 0 5 2 3 2 1 1 2 4 20Total Value 0.0 0.0 40.7 279.8 0.0 0.0 0.0 365.8 0.0 156.8 843.1
Crossborder/Withinindustry
Ave Value 0.0 0.0 40.7 279.8 0.0 0.0 0.0 365.8 0.0 156.8 210.8
Number 0 1 1 0 0 0 0 1 0 1 4Total Value 0.0 38.5 0.0 0.0 0.0 0.0 0.0 0.0 0.0 307.5 346.0
Crossborder/Crossindustry
Ave Value 0.0 38.5 0.0 0.0 0.0 0.0 0.0 0.0 0.0 307.5 173.0
Insurance
Number 2 2 3 3 2 0 6 1 0 1 20Total Value 81.1 473.3 0.0 3138.3 86.9 0.0 508.4 370.0 0.0 10179.6 14837.6
Withinborder/Withinindustry
Ave Value 81.1 236.7 0.0 3138.3 86.9 0.0 254.2 370.0 0.0 10179.6 1648.6
Number 0 0 0 2 3 0 1 0 1 2 9Total Value 0.0 0.0 0.0 10.1 157.3 0.0 212.2 0.0 0.0 39.0 418.6
Withinborder/Crossindustry
Ave Value 0.0 0.0 0.0 10.1 52.4 0.0 212.2 0.0 0.0 39.0 69.8
Number 1 5 2 0 4 3 0 6 2 0 23Total Value 285.0 0.0 407.7 0.0 1164.5 0.0 0.0 6673.9 66.8 0.0 8597.9
Crossborder/Withinindustry
Ave Value 285.0 0.0 407.7 0.0 1164.5 0.0 0.0 1112.3 33.4 0.0 781.6
Number 0 0 1 0 1 0 0 0 0 0 2Total Value 0.0 0.0 1.0 0.0 59.9 0.0 0.0 0.0 0.0 0.0 60.9
Crossborder/Crossindustry
Ave Value 0.0 0.0 1.0 0.0 59.9 0.0 0.0 0.0 0.0 0.0 30.5
Securities/Other
Number 0 11 6 1 4 2 2 2 0 1 29Total Value 0.0 22.4 2.1 0.0 0.0 15.4 26.0 0.0 0.0 0.0 65.9
Withinborder/Withinindustry
Ave Value 0.0 4.5 2.1 0.0 0.0 15.4 26.0 0.0 0.0 0.0 8.2
Number 2 1 6 1 3 1 5 3 1 6 29Total Value 96.5 78.3 256.7 8.8 318.7 0.0 4.4 39.2 348.6 539.6 1690.8
Withinborder/Crossindustry
Ave Value 96.5 78.3 85.6 8.8 159.4 0.0 4.4 39.2 348.6 179.9 120.8
Number 1 1 1 2 0 2 1 0 1 1 10Total Value 0.0 0.0 0.0 0.0 0.0 0.0 6.4 0.0 1648.6 0.0 1655.0
Crossborder/Withinindustry
Ave Value 0.0 0.0 0.0 0.0 0.0 0.0 6.4 0.0 1648.6 0.0 827.5
Number 0 0 1 0 0 0 0 1 1 1 4Total Value 0.0 0.0 861.1 0.0 0.0 0.0 0.0 49.0 1.2 1082.0 1993.3
Crossborder/Crossindustry
Ave Value 0.0 0.0 861.1 0.0 0.0 0.0 0.0 49.0 1.2 1082.0 498.3
Number 13 38 57 32 53 33 36 31 34 47 374Total Value 2998.2 6280.6 3623.9 6297.4 5261.4 1074.1 2316.1 12588.1 34011.4 35920.5 110371.7
Total
Ave Value 428.3 418.7 241.6 572.5 276.9 153.4 165.4 699.3 1478.8 1561.8 726.1
Source: Thomson Financial, SDC Platinum.
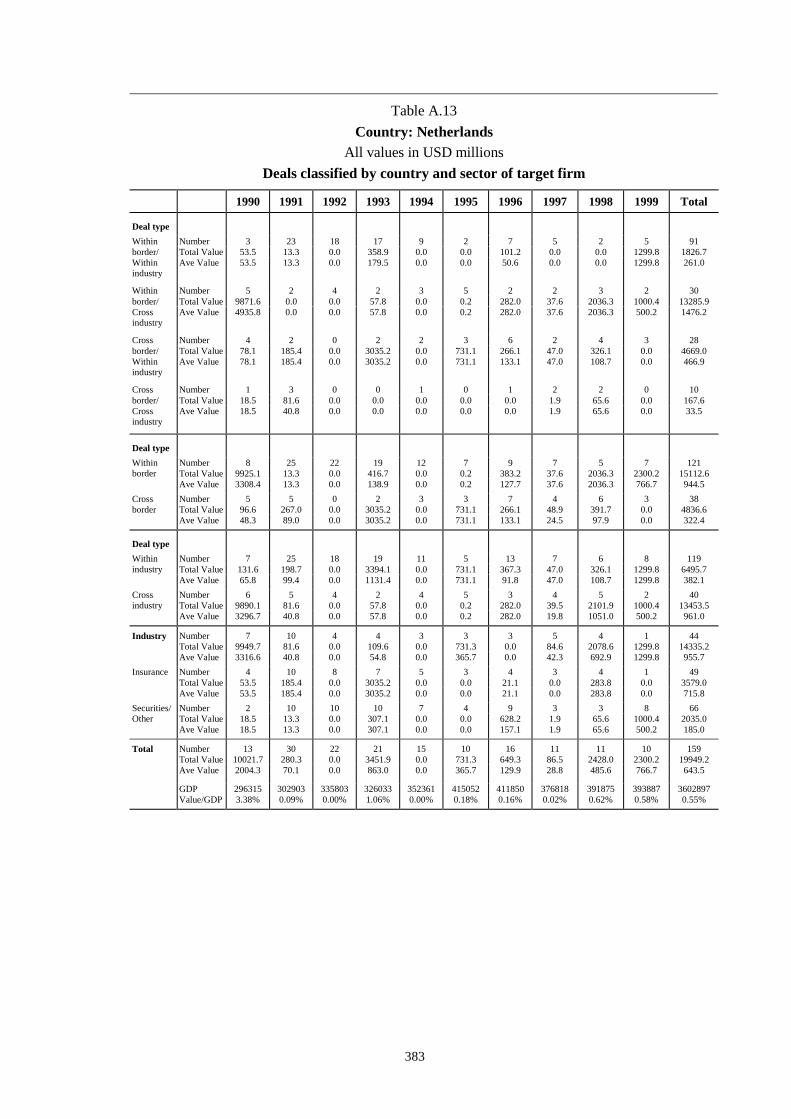
383
Table A.13Country: Netherlands
All values in USD millionsDeals classified by country and sector of target firm
1990 1991 1992 1993 1994 1995 1996 1997 1998 1999 Total
Deal typeNumber 3 23 18 17 9 2 7 5 2 5 91Total Value 53.5 13.3 0.0 358.9 0.0 0.0 101.2 0.0 0.0 1299.8 1826.7
Withinborder/Withinindustry
Ave Value 53.5 13.3 0.0 179.5 0.0 0.0 50.6 0.0 0.0 1299.8 261.0
Number 5 2 4 2 3 5 2 2 3 2 30Total Value 9871.6 0.0 0.0 57.8 0.0 0.2 282.0 37.6 2036.3 1000.4 13285.9
Withinborder/Crossindustry
Ave Value 4935.8 0.0 0.0 57.8 0.0 0.2 282.0 37.6 2036.3 500.2 1476.2
Number 4 2 0 2 2 3 6 2 4 3 28Total Value 78.1 185.4 0.0 3035.2 0.0 731.1 266.1 47.0 326.1 0.0 4669.0
Crossborder/Withinindustry
Ave Value 78.1 185.4 0.0 3035.2 0.0 731.1 133.1 47.0 108.7 0.0 466.9
Number 1 3 0 0 1 0 1 2 2 0 10Total Value 18.5 81.6 0.0 0.0 0.0 0.0 0.0 1.9 65.6 0.0 167.6
Crossborder/Crossindustry
Ave Value 18.5 40.8 0.0 0.0 0.0 0.0 0.0 1.9 65.6 0.0 33.5
Deal typeNumber 8 25 22 19 12 7 9 7 5 7 121Total Value 9925.1 13.3 0.0 416.7 0.0 0.2 383.2 37.6 2036.3 2300.2 15112.6
Withinborder
Ave Value 3308.4 13.3 0.0 138.9 0.0 0.2 127.7 37.6 2036.3 766.7 944.5Number 5 5 0 2 3 3 7 4 6 3 38Total Value 96.6 267.0 0.0 3035.2 0.0 731.1 266.1 48.9 391.7 0.0 4836.6
Crossborder
Ave Value 48.3 89.0 0.0 3035.2 0.0 731.1 133.1 24.5 97.9 0.0 322.4
Deal typeNumber 7 25 18 19 11 5 13 7 6 8 119Total Value 131.6 198.7 0.0 3394.1 0.0 731.1 367.3 47.0 326.1 1299.8 6495.7
Withinindustry
Ave Value 65.8 99.4 0.0 1131.4 0.0 731.1 91.8 47.0 108.7 1299.8 382.1Number 6 5 4 2 4 5 3 4 5 2 40Total Value 9890.1 81.6 0.0 57.8 0.0 0.2 282.0 39.5 2101.9 1000.4 13453.5
Crossindustry
Ave Value 3296.7 40.8 0.0 57.8 0.0 0.2 282.0 19.8 1051.0 500.2 961.0
Number 7 10 4 4 3 3 3 5 4 1 44Total Value 9949.7 81.6 0.0 109.6 0.0 731.3 0.0 84.6 2078.6 1299.8 14335.2
Industry
Ave Value 3316.6 40.8 0.0 54.8 0.0 365.7 0.0 42.3 692.9 1299.8 955.7Number 4 10 8 7 5 3 4 3 4 1 49Total Value 53.5 185.4 0.0 3035.2 0.0 0.0 21.1 0.0 283.8 0.0 3579.0
Insurance
Ave Value 53.5 185.4 0.0 3035.2 0.0 0.0 21.1 0.0 283.8 0.0 715.8Number 2 10 10 10 7 4 9 3 3 8 66Total Value 18.5 13.3 0.0 307.1 0.0 0.0 628.2 1.9 65.6 1000.4 2035.0
Securities/Other
Ave Value 18.5 13.3 0.0 307.1 0.0 0.0 157.1 1.9 65.6 500.2 185.0
Number 13 30 22 21 15 10 16 11 11 10 159Total Value 10021.7 280.3 0.0 3451.9 0.0 731.3 649.3 86.5 2428.0 2300.2 19949.2Ave Value 2004.3 70.1 0.0 863.0 0.0 365.7 129.9 28.8 485.6 766.7 643.5
GDP 296315 302903 335803 326033 352361 415052 411850 376818 391875 393887 3602897
Total
Value/GDP 3.38% 0.09% 0.00% 1.06% 0.00% 0.18% 0.16% 0.02% 0.62% 0.58% 0.55%

384
Deals classified by country and sector of target firm
1990 1991 1992 1993 1994 1995 1996 1997 1998 1999 Total
BankingNumber 1 5 2 2 1 0 2 2 1 1 17Total Value 0.0 0.0 0.0 51.8 0.0 0.0 0.0 0.0 0.0 1299.8 1351.6
Withinborder/Withinindustry
Ave Value 0.0 0.0 0.0 51.8 0.0 0.0 0.0 0.0 0.0 1299.8 675.8
Number 4 2 2 2 1 1 1 1 1 0 15Total Value 9871.6 0.0 0.0 57.8 0.0 0.2 0.0 37.6 2036.3 0.0 12003.5
Withinborder/Crossindustry
Ave Value 4935.8 0.0 0.0 57.8 0.0 0.2 0.0 37.6 2036.3 0.0 2000.6
Number 2 1 0 0 0 2 0 2 2 0 9Total Value 78.1 0.0 0.0 0.0 0.0 731.1 0.0 47.0 42.3 0.0 898.5
Crossborder/Withinindustry
Ave Value 78.1 0.0 0.0 0.0 0.0 731.1 0.0 47.0 21.2 0.0 179.7
Number 0 2 0 0 1 0 0 0 0 0 3Total Value 0.0 81.6 0.0 0.0 0.0 0.0 0.0 0.0 0.0 0.0 81.6
Crossborder/Crossindustry
Ave Value 0.0 40.8 0.0 0.0 0.0 0.0 0.0 0.0 0.0 0.0 40.8
InsuranceNumber 2 9 7 5 2 1 1 2 1 0 30Total Value 53.5 0.0 0.0 0.0 0.0 0.0 0.0 0.0 0.0 0.0 53.5
Withinborder/Withinindustry
Ave Value 53.5 0.0 0.0 0.0 0.0 0.0 0.0 0.0 0.0 0.0 53.5
Number 1 0 1 0 1 1 0 0 0 0 4Total Value 0.0 0.0 0.0 0.0 0.0 0.0 0.0 0.0 0.0 0.0 0.0
Withinborder/Crossindustry
Ave Value 0.0 0.0 0.0 0.0 0.0 0.0 0.0 0.0 0.0 0.0 0.0
Number 1 1 0 2 2 1 2 0 2 1 12Total Value 0.0 185.4 0.0 3035.2 0.0 0.0 21.1 0.0 283.8 0.0 3525.5
Crossborder/Withinindustry
Ave Value 0.0 185.4 0.0 3035.2 0.0 0.0 21.1 0.0 283.8 0.0 881.4
Number 0 0 0 0 0 0 1 1 1 0 3Total Value 0.0 0.0 0.0 0.0 0.0 0.0 0.0 0.0 0.0 0.0 0.0
Crossborder/Crossindustry
Ave Value 0.0 0.0 0.0 0.0 0.0 0.0 0.0 0.0 0.0 0.0 0.0
Securities/Other
Number 0 9 9 10 6 1 4 1 0 4 44Total Value 0.0 13.3 0.0 307.1 0.0 0.0 101.2 0.0 0.0 0.0 421.6
Withinborder/Withinindustry
Ave Value 0.0 13.3 0.0 307.1 0.0 0.0 50.6 0.0 0.0 0.0 105.4
Number 0 0 1 0 1 3 1 1 2 2 11Total Value 0.0 0.0 0.0 0.0 0.0 0.0 282.0 0.0 0.0 1000.4 1282.4
Withinborder/Crossindustry
Ave Value 0.0 0.0 0.0 0.0 0.0 0.0 282.0 0.0 0.0 500.2 427.5
Number 1 0 0 0 0 0 4 0 0 2 7Total Value 0.0 0.0 0.0 0.0 0.0 0.0 245.0 0.0 0.0 0.0 245.0
Crossborder/Withinindustry
Ave Value 0.0 0.0 0.0 0.0 0.0 0.0 245.0 0.0 0.0 0.0 245.0
Number 1 1 0 0 0 0 0 1 1 0 4Total Value 18.5 0.0 0.0 0.0 0.0 0.0 0.0 1.9 65.6 0.0 86.0
Crossborder/Crossindustry
Ave Value 18.5 0.0 0.0 0.0 0.0 0.0 0.0 1.9 65.6 0.0 28.7
Number 13 30 22 21 15 10 16 11 11 10 159Total Value 10021.7 280.3 0.0 3451.9 0.0 731.3 649.3 86.5 2428.0 2300.2 19949.2
Total
Ave Value 2004.3 70.1 0.0 863.0 0.0 365.7 129.9 28.8 485.6 766.7 643.5
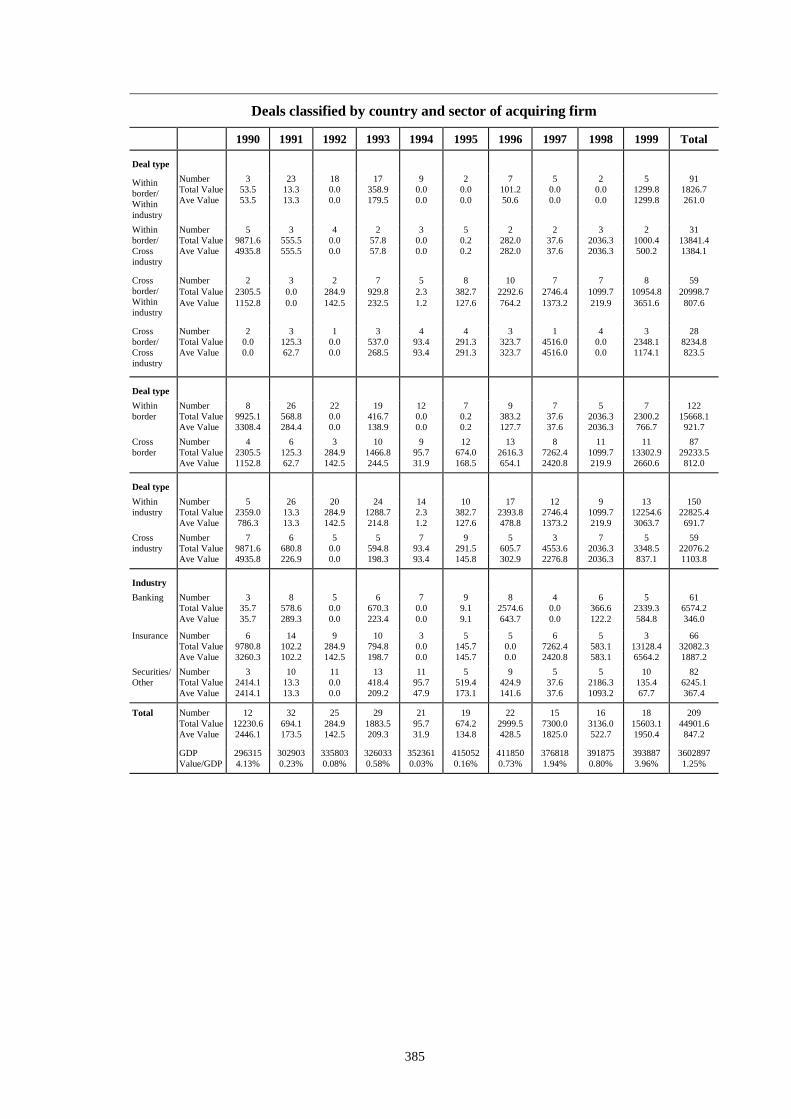
385
Deals classified by country and sector of acquiring firm
1990 1991 1992 1993 1994 1995 1996 1997 1998 1999 Total
Deal typeNumber 3 23 18 17 9 2 7 5 2 5 91Total Value 53.5 13.3 0.0 358.9 0.0 0.0 101.2 0.0 0.0 1299.8 1826.7
Withinborder/Withinindustry
Ave Value 53.5 13.3 0.0 179.5 0.0 0.0 50.6 0.0 0.0 1299.8 261.0
Number 5 3 4 2 3 5 2 2 3 2 31Total Value 9871.6 555.5 0.0 57.8 0.0 0.2 282.0 37.6 2036.3 1000.4 13841.4
Withinborder/Crossindustry
Ave Value 4935.8 555.5 0.0 57.8 0.0 0.2 282.0 37.6 2036.3 500.2 1384.1
Number 2 3 2 7 5 8 10 7 7 8 59Total Value 2305.5 0.0 284.9 929.8 2.3 382.7 2292.6 2746.4 1099.7 10954.8 20998.7
Crossborder/Withinindustry
Ave Value 1152.8 0.0 142.5 232.5 1.2 127.6 764.2 1373.2 219.9 3651.6 807.6
Number 2 3 1 3 4 4 3 1 4 3 28Total Value 0.0 125.3 0.0 537.0 93.4 291.3 323.7 4516.0 0.0 2348.1 8234.8
Crossborder/Crossindustry
Ave Value 0.0 62.7 0.0 268.5 93.4 291.3 323.7 4516.0 0.0 1174.1 823.5
Deal typeNumber 8 26 22 19 12 7 9 7 5 7 122Total Value 9925.1 568.8 0.0 416.7 0.0 0.2 383.2 37.6 2036.3 2300.2 15668.1
Withinborder
Ave Value 3308.4 284.4 0.0 138.9 0.0 0.2 127.7 37.6 2036.3 766.7 921.7Number 4 6 3 10 9 12 13 8 11 11 87Total Value 2305.5 125.3 284.9 1466.8 95.7 674.0 2616.3 7262.4 1099.7 13302.9 29233.5
Crossborder
Ave Value 1152.8 62.7 142.5 244.5 31.9 168.5 654.1 2420.8 219.9 2660.6 812.0
Deal typeNumber 5 26 20 24 14 10 17 12 9 13 150Total Value 2359.0 13.3 284.9 1288.7 2.3 382.7 2393.8 2746.4 1099.7 12254.6 22825.4
Withinindustry
Ave Value 786.3 13.3 142.5 214.8 1.2 127.6 478.8 1373.2 219.9 3063.7 691.7Number 7 6 5 5 7 9 5 3 7 5 59Total Value 9871.6 680.8 0.0 594.8 93.4 291.5 605.7 4553.6 2036.3 3348.5 22076.2
Crossindustry
Ave Value 4935.8 226.9 0.0 198.3 93.4 145.8 302.9 2276.8 2036.3 837.1 1103.8
IndustryNumber 3 8 5 6 7 9 8 4 6 5 61Total Value 35.7 578.6 0.0 670.3 0.0 9.1 2574.6 0.0 366.6 2339.3 6574.2
Banking
Ave Value 35.7 289.3 0.0 223.4 0.0 9.1 643.7 0.0 122.2 584.8 346.0
Number 6 14 9 10 3 5 5 6 5 3 66Total Value 9780.8 102.2 284.9 794.8 0.0 145.7 0.0 7262.4 583.1 13128.4 32082.3
Insurance
Ave Value 3260.3 102.2 142.5 198.7 0.0 145.7 0.0 2420.8 583.1 6564.2 1887.2Number 3 10 11 13 11 5 9 5 5 10 82Total Value 2414.1 13.3 0.0 418.4 95.7 519.4 424.9 37.6 2186.3 135.4 6245.1
Securities/Other
Ave Value 2414.1 13.3 0.0 209.2 47.9 173.1 141.6 37.6 1093.2 67.7 367.4
Number 12 32 25 29 21 19 22 15 16 18 209Total Value 12230.6 694.1 284.9 1883.5 95.7 674.2 2999.5 7300.0 3136.0 15603.1 44901.6Ave Value 2446.1 173.5 142.5 209.3 31.9 134.8 428.5 1825.0 522.7 1950.4 847.2
GDP 296315 302903 335803 326033 352361 415052 411850 376818 391875 393887 3602897
Total
Value/GDP 4.13% 0.23% 0.08% 0.58% 0.03% 0.16% 0.73% 1.94% 0.80% 3.96% 1.25%
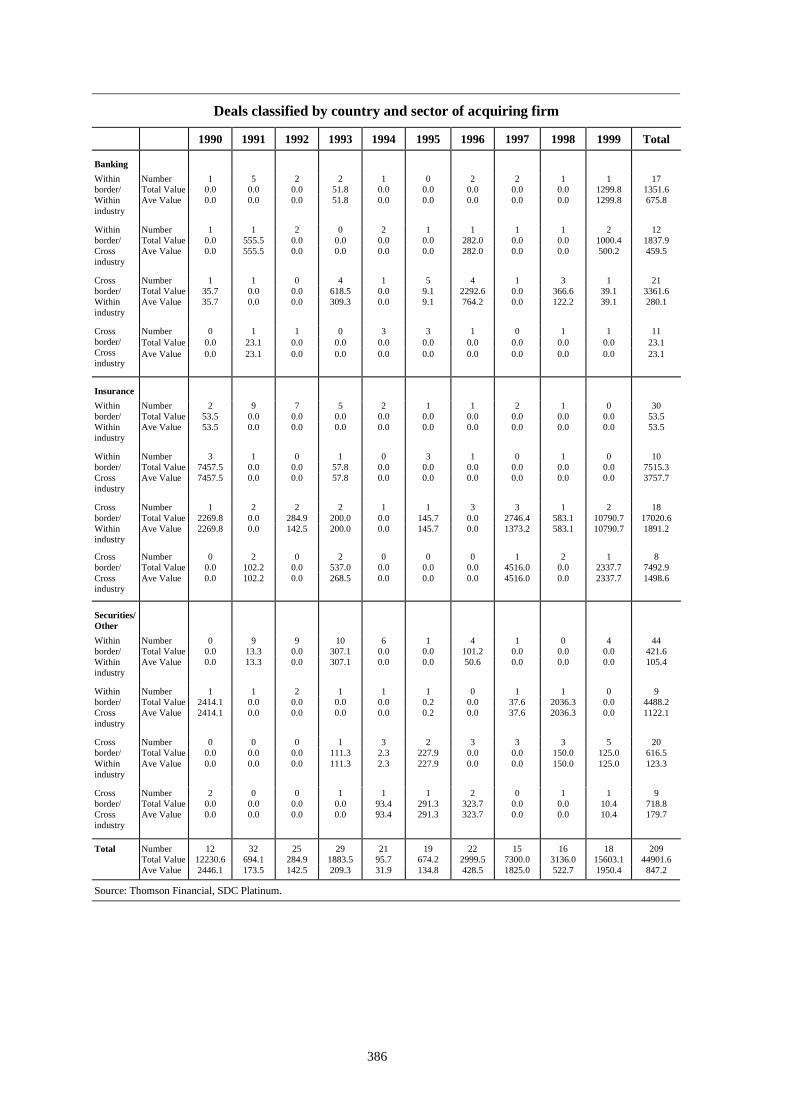
386
Deals classified by country and sector of acquiring firm
1990 1991 1992 1993 1994 1995 1996 1997 1998 1999 Total
BankingNumber 1 5 2 2 1 0 2 2 1 1 17Total Value 0.0 0.0 0.0 51.8 0.0 0.0 0.0 0.0 0.0 1299.8 1351.6
Withinborder/Withinindustry
Ave Value 0.0 0.0 0.0 51.8 0.0 0.0 0.0 0.0 0.0 1299.8 675.8
Number 1 1 2 0 2 1 1 1 1 2 12Total Value 0.0 555.5 0.0 0.0 0.0 0.0 282.0 0.0 0.0 1000.4 1837.9
Withinborder/Crossindustry
Ave Value 0.0 555.5 0.0 0.0 0.0 0.0 282.0 0.0 0.0 500.2 459.5
Number 1 1 0 4 1 5 4 1 3 1 21Total Value 35.7 0.0 0.0 618.5 0.0 9.1 2292.6 0.0 366.6 39.1 3361.6
Crossborder/Withinindustry
Ave Value 35.7 0.0 0.0 309.3 0.0 9.1 764.2 0.0 122.2 39.1 280.1
Number 0 1 1 0 3 3 1 0 1 1 11Total Value 0.0 23.1 0.0 0.0 0.0 0.0 0.0 0.0 0.0 0.0 23.1
Crossborder/Crossindustry
Ave Value 0.0 23.1 0.0 0.0 0.0 0.0 0.0 0.0 0.0 0.0 23.1
InsuranceNumber 2 9 7 5 2 1 1 2 1 0 30Total Value 53.5 0.0 0.0 0.0 0.0 0.0 0.0 0.0 0.0 0.0 53.5
Withinborder/Withinindustry
Ave Value 53.5 0.0 0.0 0.0 0.0 0.0 0.0 0.0 0.0 0.0 53.5
Number 3 1 0 1 0 3 1 0 1 0 10Total Value 7457.5 0.0 0.0 57.8 0.0 0.0 0.0 0.0 0.0 0.0 7515.3
Withinborder/Crossindustry
Ave Value 7457.5 0.0 0.0 57.8 0.0 0.0 0.0 0.0 0.0 0.0 3757.7
Number 1 2 2 2 1 1 3 3 1 2 18Total Value 2269.8 0.0 284.9 200.0 0.0 145.7 0.0 2746.4 583.1 10790.7 17020.6
Crossborder/Withinindustry
Ave Value 2269.8 0.0 142.5 200.0 0.0 145.7 0.0 1373.2 583.1 10790.7 1891.2
Number 0 2 0 2 0 0 0 1 2 1 8Total Value 0.0 102.2 0.0 537.0 0.0 0.0 0.0 4516.0 0.0 2337.7 7492.9
Crossborder/Crossindustry
Ave Value 0.0 102.2 0.0 268.5 0.0 0.0 0.0 4516.0 0.0 2337.7 1498.6
Securities/Other
Number 0 9 9 10 6 1 4 1 0 4 44Total Value 0.0 13.3 0.0 307.1 0.0 0.0 101.2 0.0 0.0 0.0 421.6
Withinborder/Withinindustry
Ave Value 0.0 13.3 0.0 307.1 0.0 0.0 50.6 0.0 0.0 0.0 105.4
Number 1 1 2 1 1 1 0 1 1 0 9Total Value 2414.1 0.0 0.0 0.0 0.0 0.2 0.0 37.6 2036.3 0.0 4488.2
Withinborder/Crossindustry
Ave Value 2414.1 0.0 0.0 0.0 0.0 0.2 0.0 37.6 2036.3 0.0 1122.1
Number 0 0 0 1 3 2 3 3 3 5 20Total Value 0.0 0.0 0.0 111.3 2.3 227.9 0.0 0.0 150.0 125.0 616.5
Crossborder/Withinindustry
Ave Value 0.0 0.0 0.0 111.3 2.3 227.9 0.0 0.0 150.0 125.0 123.3
Number 2 0 0 1 1 1 2 0 1 1 9Total Value 0.0 0.0 0.0 0.0 93.4 291.3 323.7 0.0 0.0 10.4 718.8
Crossborder/Crossindustry
Ave Value 0.0 0.0 0.0 0.0 93.4 291.3 323.7 0.0 0.0 10.4 179.7
Number 12 32 25 29 21 19 22 15 16 18 209Total Value 12230.6 694.1 284.9 1883.5 95.7 674.2 2999.5 7300.0 3136.0 15603.1 44901.6
Total
Ave Value 2446.1 173.5 142.5 209.3 31.9 134.8 428.5 1825.0 522.7 1950.4 847.2
Source: Thomson Financial, SDC Platinum.

387
Table A.14Country: Spain
All values in USD millionsDeals classified by country and sector of target firm
1990 1991 1992 1993 1994 1995 1996 1997 1998 1999 Total
Deal typeNumber 3 14 23 6 3 4 7 17 17 16 110Total Value 21.3 1164.3 991.1 172.1 2287.1 928.1 506.5 118.0 4131.7 23762.4 34082.6
Withinborder/Withinindustry
Ave Value 10.7 291.1 247.8 57.4 2287.1 309.4 126.6 14.8 590.2 3960.4 811.5
Number 0 3 4 1 1 3 1 3 1 3 20Total Value 0.0 555.5 148.9 102.8 0.0 13.4 0.0 30.5 50.6 248.8 1150.5
Withinborder/Crossindustry
Ave Value 0.0 555.5 49.6 102.8 0.0 13.4 0.0 30.5 50.6 248.8 127.8
Number 4 5 7 3 4 3 3 4 5 8 46Total Value 336.3 38.2 383.4 0.0 469.7 0.0 0.0 359.5 59.5 608.3 2254.9
Crossborder/Withinindustry
Ave Value 336.3 38.2 95.9 0.0 234.9 0.0 0.0 179.8 29.8 101.4 125.3
Number 1 0 2 3 1 0 0 0 2 3 12Total Value 410.9 0.0 1.0 11.1 93.4 0.0 0.0 0.0 109.5 33.0 658.9
Crossborder/Crossindustry
Ave Value 410.9 0.0 1.0 11.1 93.4 0.0 0.0 0.0 54.8 33.0 94.1
Deal typeNumber 3 17 27 7 4 7 8 20 18 19 130Total Value 21.3 1719.8 1140.0 274.9 2287.1 941.5 506.5 148.5 4182.3 24011.2 35233.1
Withinborder
Ave Value 10.7 344.0 162.9 68.7 2287.1 235.4 126.6 16.5 522.8 3430.2 690.8
Number 5 5 9 6 5 3 3 4 7 11 58Total Value 747.2 38.2 384.4 11.1 563.1 0.0 0.0 359.5 169.0 641.3 2913.8
Crossborder
Ave Value 373.6 38.2 76.9 11.1 187.7 0.0 0.0 179.8 42.3 91.6 116.6
Deal type
Number 7 19 30 9 7 7 10 21 22 24 156Total Value 357.6 1202.5 1374.5 172.1 2756.8 928.1 506.5 477.5 4191.2 24370.7 36337.5
Withinindustry
Ave Value 119.2 240.5 171.8 57.4 918.9 309.4 126.6 47.8 465.7 2030.9 605.6
Number 1 3 6 4 2 3 1 3 3 6 32Total Value 410.9 555.5 149.9 113.9 93.4 13.4 0.0 30.5 160.1 281.8 1809.4
Crossindustry
Ave Value 410.9 555.5 37.5 57.0 93.4 13.4 0.0 30.5 53.4 140.9 113.1
Industry
Number 2 14 18 8 6 6 6 6 11 12 89Total Value 410.9 1202.5 384.6 271.2 2574.6 928.1 477.5 413.7 4203.5 23807.0 34673.6
Banking
Ave Value 410.9 240.5 64.1 90.4 858.2 309.4 159.2 103.4 467.1 3401.0 788.0
Number 3 6 11 4 3 4 5 7 12 9 64Total Value 348.4 555.5 1110.0 14.8 275.6 13.4 29.0 38.7 101.6 130.5 2617.5
Insurance
Ave Value 174.2 555.5 222.0 7.4 275.6 13.4 29.0 9.7 50.8 65.3 124.6
Number 3 2 7 1 0 0 0 11 2 9 35Total Value 9.2 0.0 29.8 0.0 0.0 0.0 0.0 55.6 46.2 715.0 855.8
Securities/Other
Ave Value 9.2 0.0 29.8 0.0 0.0 0.0 0.0 18.5 46.2 143.0 77.8
Number 8 22 36 13 9 10 11 24 25 30 188Total Value 768.5 1758.0 1524.4 286.0 2850.2 941.5 506.5 508.0 4351.3 24652.5 38146.9Ave Value 192.1 293.0 127.0 57.2 712.6 235.4 126.6 46.2 362.6 1760.9 501.9
GDP 515624 552741 604403 501850 506180 584887 608914 558806 583037 596094 5612537
Total
Value/GDP 0.15% 0.32% 0.25% 0.06% 0.56% 0.16% 0.08% 0.09% 0.75% 4.14% 0.68%

388
Deals classified by country and sector of target firm
1990 1991 1992 1993 1994 1995 1996 1997 1998 1999 TotalBanking
Number 0 12 11 4 3 4 5 3 8 8 58Total Value 0.0 1164.3 234.7 168.4 2287.1 928.1 477.5 54.2 4131.7 23756.3 33202.3
Withinborder/Withinindustry
Ave Value 0.0 291.1 117.4 84.2 2287.1 309.4 159.2 27.1 590.2 4751.3 1144.9
Number 0 1 4 1 1 0 1 1 0 1 10Total Value 0.0 0.0 148.9 102.8 0.0 0.0 0.0 0.0 0.0 0.0 251.7
Withinborder/Crossindustry
Ave Value 0.0 0.0 49.6 102.8 0.0 0.0 0.0 0.0 0.0 0.0 62.9
Number 1 1 2 2 1 2 0 2 2 2 15Total Value 0.0 38.2 0.0 0.0 194.1 0.0 0.0 359.5 8.5 50.7 651.0
Crossborder/Withinindustry
Ave Value 0.0 38.2 0.0 0.0 194.1 0.0 0.0 179.8 8.5 25.4 93.0
Number 1 0 1 1 1 0 0 0 1 1 6Total Value 410.9 0.0 1.0 0.0 93.4 0.0 0.0 0.0 63.3 0.0 568.6
Crossborder/Crossindustry
Ave Value 410.9 0.0 1.0 0.0 93.4 0.0 0.0 0.0 63.3 0.0 142.2
Insurance
Number 1 1 6 1 0 0 2 5 8 5 29Total Value 12.1 0.0 726.6 3.7 0.0 0.0 29.0 38.7 0.0 6.1 816.2
Withinborder/Withinindustry
Ave Value 12.1 0.0 726.6 3.7 0.0 0.0 29.0 9.7 0.0 6.1 90.7
Number 0 1 0 0 0 3 0 0 1 0 5Total Value 0.0 555.5 0.0 0.0 0.0 13.4 0.0 0.0 50.6 0.0 619.5
Withinborder/Crossindustry
Ave Value 0.0 555.5 0.0 0.0 0.0 13.4 0.0 0.0 50.6 0.0 206.5
Number 2 4 5 1 3 1 3 2 3 3 27Total Value 336.3 0.0 383.4 0.0 275.6 0.0 0.0 0.0 51.0 124.4 1170.7
Crossborder/Withinindustry
Ave Value 336.3 0.0 95.9 0.0 275.6 0.0 0.0 0.0 51.0 124.4 146.3
Number 0 0 0 2 0 0 0 0 0 1 3Total Value 0.0 0.0 0.0 11.1 0.0 0.0 0.0 0.0 0.0 0.0 11.1
Crossborder/Crossindustry
Ave Value 0.0 0.0 0.0 11.1 0.0 0.0 0.0 0.0 0.0 0.0 11.1
Securities/Other
Number 2 1 6 1 0 0 0 9 1 3 23Total Value 9.2 0.0 29.8 0.0 0.0 0.0 0.0 25.1 0.0 0.0 64.1
Withinborder/Withinindustry
Ave Value 9.2 0.0 29.8 0.0 0.0 0.0 0.0 12.6 0.0 0.0 16.0
Number 0 1 0 0 0 0 0 2 0 2 5Total Value 0.0 0.0 0.0 0.0 0.0 0.0 0.0 30.5 0.0 248.8 279.3
Withinborder/Crossindustry
Ave Value 0.0 0.0 0.0 0.0 0.0 0.0 0.0 30.5 0.0 248.8 139.7
Number 1 0 0 0 0 0 0 0 0 3 4Total Value 0.0 0.0 0.0 0.0 0.0 0.0 0.0 0.0 0.0 433.2 433.2
Crossborder/Withinindustry
Ave Value 0.0 0.0 0.0 0.0 0.0 0.0 0.0 0.0 0.0 144.4 144.4
Number 0 0 1 0 0 0 0 0 1 1 3Total Value 0.0 0.0 0.0 0.0 0.0 0.0 0.0 0.0 46.2 33.0 79.2
Crossborder/Crossindustry
Ave Value 0.0 0.0 0.0 0.0 0.0 0.0 0.0 0.0 46.2 33.0 39.6
Number 8 22 36 13 9 10 11 24 25 30 188Total Value 768.5 1758.0 1524.4 286.0 2850.2 941.5 506.5 508.0 4351.3 24652.5 38146.9
Total
Ave Value 192.1 293.0 127.0 57.2 712.6 235.4 126.6 46.2 362.6 1760.9 501.9

389
Deals classified by country and sector of acquiring firm
1990 1991 1992 1993 1994 1995 1996 1997 1998 1999 TotalDeal Type
Number 3 14 23 6 3 4 7 17 17 16 110Total Value 21.3 1164.3 991.1 172.1 2287.1 928.1 506.5 118.0 4131.7 23762.4 34082.6
Withinborder/Withinindustry
Ave Value 10.7 291.1 247.8 57.4 2287.1 309.4 126.6 14.8 590.2 3960.4 811.5
Number 0 2 4 1 1 3 1 3 1 3 19Total Value 0.0 0.0 148.9 102.8 0.0 13.4 0.0 30.5 50.6 248.8 595.0
Withinborder/Crossindustry
Ave Value 0.0 0.0 49.6 102.8 0.0 13.4 0.0 30.5 50.6 248.8 74.4
Number 2 6 1 0 3 5 6 4 8 8 43Total Value 0.0 0.0 72.7 0.0 0.0 534.9 427.6 32.6 1749.5 1880.7 4698.0
Crossborder/Withinindustry
Ave Value 0.0 0.0 72.7 0.0 0.0 178.3 106.9 16.3 349.9 470.2 247.3
Number 0 0 2 0 0 2 2 0 4 4 14Total Value 0.0 0.0 168.4 0.0 0.0 135.2 378.5 0.0 675.7 1886.6 3244.4
Crossborder/Crossindustry
Ave Value 0.0 0.0 84.2 0.0 0.0 67.6 378.5 0.0 225.2 471.7 270.4
Deal type
Number 3 16 27 7 4 7 8 20 18 19 129Total Value 21.3 1164.3 1140.0 274.9 2287.1 941.5 506.5 148.5 4182.3 24011.2 34677.6
Withinborder
Ave Value 10.7 291.1 162.9 68.7 2287.1 235.4 126.6 16.5 522.8 3430.2 693.6
Number 2 6 3 0 3 7 8 4 12 12 57Total Value 0.0 0.0 241.1 0.0 0.0 670.1 806.1 32.6 2425.2 3767.3 7942.4
Crossborder
Ave Value 0.0 0.0 80.4 0.0 0.0 134.0 161.2 16.3 303.2 470.9 256.2
Deal type
Number 5 20 24 6 6 9 13 21 25 24 153Total Value 21.3 1164.3 1063.8 172.1 2287.1 1463.0 934.1 150.6 5881.2 25643.1 38780.6
Withinindustry
Ave Value 10.7 291.1 212.8 57.4 2287.1 243.8 116.8 15.1 490.1 2564.3 635.7
Number 0 2 6 1 1 5 3 3 5 7 33Total Value 0.0 0.0 317.3 102.8 0.0 148.6 378.5 30.5 726.3 2135.4 3839.4
Crossindustry
Ave Value 0.0 0.0 63.5 102.8 0.0 49.5 378.5 30.5 181.6 427.1 192.0
Industry
Number 2 14 12 4 4 10 9 7 17 19 98Total Value 0.0 1164.3 259.9 168.4 2287.1 1450.3 1245.4 111.7 6556.9 27751.5 40995.5
Banking
Ave Value 0.0 291.1 86.6 84.2 2287.1 290.1 207.6 27.9 437.1 2134.7 773.5
Number 1 6 7 1 2 1 6 6 10 7 47Total Value 12.1 0.0 799.3 3.7 0.0 12.7 67.2 38.7 0.0 6.1 939.8
Insurance
Ave Value 12.1 0.0 399.7 3.7 0.0 12.7 22.4 9.7 0.0 6.1 72.3
Number 2 2 11 2 1 3 1 11 3 5 41Total Value 9.2 0.0 321.9 102.8 0.0 148.6 0.0 30.7 50.6 20.9 684.7
Securities/Other
Ave Value 9.2 0.0 64.4 102.8 0.0 49.5 0.0 10.2 50.6 20.9 45.6
Number 5 22 30 7 7 14 16 24 30 31 186Total Value 21.3 1164.3 1381.1 274.9 2287.1 1611.6 1312.6 181.1 6607.5 27778.5 42620.0Ave Value 10.7 291.1 138.1 68.7 2287.1 179.1 145.8 16.5 413.0 1851.9 526.2
GDP 515624 552741 604403 501850 506180 584887 608914 558806 583037 596094 5612537
Total
Value/GDP 0.00% 0.21% 0.23% 0.05% 0.45% 0.28% 0.22% 0.03% 1.13% 4.66% 0.76%

390
Deals classified by country and sector of acquiring firm
1990 1991 1992 1993 1994 1995 1996 1997 1998 1999 Total
BankingNumber 0 12 11 4 3 4 5 3 8 8 58Total Value 0.0 1164.3 234.7 168.4 2287.1 928.1 477.5 54.2 4131.7 23756.3 33202.3
Withinborder/Withinindustry
Ave Value 0.0 291.1 117.4 84.2 2287.1 309.4 159.2 27.1 590.2 4751.3 1144.9
Number 0 1 0 0 0 2 0 2 0 2 7Total Value 0.0 0.0 0.0 0.0 0.0 0.0 0.0 30.5 0.0 248.8 279.3
Withinborder/Crossindustry
Ave Value 0.0 0.0 0.0 0.0 0.0 0.0 0.0 30.5 0.0 248.8 139.7
Number 2 1 0 0 1 4 2 2 6 5 23Total Value 0.0 0.0 0.0 0.0 0.0 522.2 389.4 27.0 1749.5 1859.8 4547.9
Crossborder/Withinindustry
Ave Value 0.0 0.0 0.0 0.0 0.0 261.1 194.7 27.0 349.9 619.9 349.8
Number 0 0 1 0 0 0 2 0 3 4 10Total Value 0.0 0.0 25.2 0.0 0.0 0.0 378.5 0.0 675.7 1886.6 2966.0
Crossborder/Crossindustry
Ave Value 0.0 0.0 25.2 0.0 0.0 0.0 378.5 0.0 225.2 471.7 329.6
InsuranceNumber 1 1 6 1 0 0 2 5 8 5 29Total Value 12.1 0.0 726.6 3.7 0.0 0.0 29.0 38.7 0.0 6.1 816.2
Withinborder/Withinindustry
Ave Value 12.1 0.0 726.6 3.7 0.0 0.0 29.0 9.7 0.0 6.1 90.7
Number 0 0 0 0 0 0 0 0 0 0 0Total Value 0.0 0.0 0.0 0.0 0.0 0.0 0.0 0.0 0.0 0.0 0.0
Withinborder/Crossindustry
Ave Value 0.0 0.0 0.0 0.0 0.0 0.0 0.0 0.0 0.0 0.0 0.0
Number 0 5 1 0 2 1 4 1 2 2 18Total Value 0.0 0.0 72.7 0.0 0.0 12.7 38.2 0.0 0.0 0.0 123.6
Crossborder/Withinindustry
Ave Value 0.0 0.0 72.7 0.0 0.0 12.7 19.1 0.0 0.0 0.0 30.9
Number 0 0 0 0 0 0 0 0 0 0 0Total Value 0.0 0.0 0.0 0.0 0.0 0.0 0.0 0.0 0.0 0.0 0.0
Crossborder/Crossindustry
Ave Value 0.0 0.0 0.0 0.0 0.0 0.0 0.0 0.0 0.0 0.0 0.0
Securities/Other
Number 2 1 6 1 0 0 0 9 1 3 23Total Value 9.2 0.0 29.8 0.0 0.0 0.0 0.0 25.1 0.0 0.0 64.1
Withinborder/Withinindustry
Ave Value 9.2 0.0 29.8 0.0 0.0 0.0 0.0 12.6 0.0 0.0 16.0
Number 0 1 4 1 1 1 1 1 1 1 12Total Value 0.0 0.0 148.9 102.8 0.0 13.4 0.0 0.0 50.6 0.0 315.7
Withinborder/Crossindustry
Ave Value 0.0 0.0 49.6 102.8 0.0 13.4 0.0 0.0 50.6 0.0 52.6
Number 0 0 0 0 0 0 0 1 0 1 2Total Value 0.0 0.0 0.0 0.0 0.0 0.0 0.0 5.6 0.0 20.9 26.5
Crossborder/Withinindustry
Ave Value 0.0 0.0 0.0 0.0 0.0 0.0 0.0 5.6 0.0 20.9 13.3
Number 0 0 1 0 0 2 0 0 1 0 4Total Value 0.0 0.0 143.2 0.0 0.0 135.2 0.0 0.0 0.0 0.0 278.4
Crossborder/Crossindustry
Ave Value 0.0 0.0 143.2 0.0 0.0 67.6 0.0 0.0 0.0 0.0 92.8
Number 5 22 30 7 7 14 16 24 30 31 186Total Value 21.3 1164.3 1381.1 274.9 2287.1 1611.6 1312.6 181.1 6607.5 27778.5 42620.0
Total
Ave Value 10.7 291.1 138.1 68.7 2287.1 179.1 145.8 16.5 413.0 1851.9 526.2
Source: Thomson Financial, SDC Platinum.

391
Table A.15Country: Sweden
All values in USD millionsDeals classified by country and sector of target firm
1990 1991 1992 1993 1994 1995 1996 1997 1998 1999 Total
Deal typeNumber 1 8 9 8 8 4 10 8 6 5 67Total Value 0.0 0.0 135.2 24.4 539.6 182.0 3450.4 2723.7 1250.2 288.0 8593.5
Withinborder/Withinindustry
Ave Value 0.0 0.0 67.6 12.2 134.9 60.7 862.6 389.1 250.0 144.0 296.3
Number 1 7 4 3 3 1 4 2 1 2 28Total Value 0.0 1904.5 234.1 211.9 409.3 172.5 208.4 2262.3 0.0 34.3 5437.3
Withinborder/Crossindustry
Ave Value 0.0 476.1 234.1 211.9 204.7 172.5 69.5 1131.2 0.0 34.3 362.5
Number 1 0 2 0 2 2 0 2 2 2 13Total Value 0.0 0.0 0.0 0.0 0.3 0.0 0.0 284.5 6.4 490.1 781.3
Crossborder/Withinindustry
Ave Value 0.0 0.0 0.0 0.0 0.3 0.0 0.0 284.5 3.2 245.1 130.2
Number 0 0 0 0 1 1 0 2 0 1 5Total Value 0.0 0.0 0.0 0.0 7.1 119.5 0.0 31.2 0.0 269.1 426.9
Crossborder/Crossindustry
Ave Value 0.0 0.0 0.0 0.0 7.1 119.5 0.0 15.6 0.0 269.1 85.4
Deal typeNumber 2 15 13 11 11 5 14 10 7 7 95Total Value 0.0 1904.5 369.3 236.3 948.9 354.5 3658.8 4986.0 1250.2 322.3 14030.8
Withinborder
Ave Value 0.0 476.1 123.1 78.8 158.2 88.6 522.7 554.0 250.0 107.4 318.9
Number 1 0 2 0 3 3 0 4 2 3 18Total Value 0.0 0.0 0.0 0.0 7.4 119.5 0.0 315.7 6.4 759.2 1208.2
Crossborder
Ave Value 0.0 0.0 0.0 0.0 3.7 119.5 0.0 105.2 3.2 253.1 109.8
Deal typeNumber 2 8 11 8 10 6 10 10 8 7 80Total Value 0.0 0.0 135.2 24.4 539.9 182.0 3450.4 3008.2 1256.6 778.1 9374.8
Withinindustry
Ave Value 0.0 0.0 67.6 12.2 108.0 60.7 862.6 376.0 179.5 194.5 267.9
Number 1 7 4 3 4 2 4 4 1 3 33Total Value 0.0 1904.5 234.1 211.9 416.4 292.0 208.4 2293.5 0.0 303.4 5864.2
Crossindustry
Ave Value 0.0 476.1 234.1 211.9 138.8 146.0 69.5 573.4 0.0 151.7 293.2
Industry
Number 1 8 9 5 6 2 7 8 4 4 54Total Value 0.0 1864.1 234.1 0.0 435.6 155.9 3452.6 2814.5 822.4 908.5 10687.7
Banking
Ave Value 0.0 621.4 117.1 0.0 108.9 78.0 863.2 469.1 274.1 227.1 381.7
Number 2 1 2 0 0 2 1 1 2 0 11Total Value 0.0 0.0 0.0 0.0 0.0 0.0 153.5 2204.2 425.6 0.0 2783.3
Insurance
Ave Value 0.0 0.0 0.0 0.0 0.0 0.0 153.5 2204.2 212.8 0.0 695.8
Number 0 6 4 6 8 4 6 5 3 6 48Total Value 0.0 40.4 135.2 236.3 520.7 318.1 52.7 283.0 8.6 173.0 1768.0
Securities/Other
Ave Value 0.0 40.4 135.2 78.8 130.2 106.0 26.4 56.6 4.3 86.5 76.9
Number 3 15 15 11 14 8 14 14 9 10 113Total Value 0.0 1904.5 369.3 236.3 956.3 474.0 3658.8 5301.7 1256.6 1081.5 15239.0Ave Value 0.0 476.1 123.1 78.8 119.5 94.8 522.7 441.8 179.5 180.3 277.1
GDP 238444 248486 256736 192684 207289 240682 261813 237474 237789 238579 2359974
Total
Value/GDP 0.00% 0.77% 0.14% 0.12% 0.46% 0.20% 1.40% 2.23% 0.53% 0.45% 0.65%

392
Deals classified by country and sector of target firm
1990 1991 1992 1993 1994 1995 1996 1997 1998 1999 Total
BankingNumber 0 3 5 3 1 2 6 6 3 1 30Total Value 0.0 0.0 0.0 0.0 38.8 155.9 3449.4 2530.0 822.4 183.4 7179.9
Withinborder/Withinindustry
Ave Value 0.0 0.0 0.0 0.0 38.8 78.0 1149.8 506.0 274.1 183.4 448.7
Number 1 5 4 2 2 0 1 0 1 1 17Total Value 0.0 1864.1 234.1 0.0 389.4 0.0 3.2 0.0 0.0 34.3 2525.1
Withinborder/Crossindustry
Ave Value 0.0 621.4 234.1 0.0 389.4 0.0 3.2 0.0 0.0 34.3 360.7
Number 0 0 0 0 2 0 0 2 0 1 5Total Value 0.0 0.0 0.0 0.0 0.3 0.0 0.0 284.5 0.0 421.7 706.5
Crossborder/Withinindustry
Ave Value 0.0 0.0 0.0 0.0 0.3 0.0 0.0 284.5 0.0 421.7 235.5
Number 0 0 0 0 1 0 0 0 0 1 2Total Value 0.0 0.0 0.0 0.0 7.1 0.0 0.0 0.0 0.0 269.1 276.2
Crossborder/Crossindustry
Ave Value 0.0 0.0 0.0 0.0 7.1 0.0 0.0 0.0 0.0 269.1 138.1
Insurance
Number 1 1 0 0 0 0 0 0 1 0 3Total Value 0.0 0.0 0.0 0.0 0.0 0.0 0.0 0.0 422.3 0.0 422.3
Withinborder/Withinindustry
Ave Value 0.0 0.0 0.0 0.0 0.0 0.0 0.0 0.0 422.3 0.0 422.3
Number 0 0 0 0 0 0 1 1 0 0 2Total Value 0.0 0.0 0.0 0.0 0.0 0.0 153.5 2204.2 0.0 0.0 2357.7
Withinborder/Crossindustry
Ave Value 0.0 0.0 0.0 0.0 0.0 0.0 153.5 2204.2 0.0 0.0 1178.9
Number 1 0 2 0 0 2 0 0 1 0 6Total Value 0.0 0.0 0.0 0.0 0.0 0.0 0.0 0.0 3.3 0.0 3.3
Crossborder/Withinindustry
Ave Value 0.0 0.0 0.0 0.0 0.0 0.0 0.0 0.0 3.3 0.0 3.3
Number 0 0 0 0 0 0 0 0 0 0 0Total Value 0.0 0.0 0.0 0.0 0.0 0.0 0.0 0.0 0.0 0.0 0.0
Crossborder/Crossindustry
Ave Value 0.0 0.0 0.0 0.0 0.0 0.0 0.0 0.0 0.0 0.0 0.0
Securities/Other
Number 0 4 4 5 7 2 4 2 2 4 34Total Value 0.0 0.0 135.2 24.4 500.8 26.1 1.0 193.7 5.5 104.6 991.3
Withinborder/Withinindustry
Ave Value 0.0 0.0 135.2 12.2 166.9 26.1 1.0 96.9 5.5 104.6 82.6
Number 0 2 0 1 1 1 2 1 0 1 9Total Value 0.0 40.4 0.0 211.9 19.9 172.5 51.7 58.1 0.0 0.0 554.5
Withinborder/Crossindustry
Ave Value 0.0 40.4 0.0 211.9 19.9 172.5 51.7 58.1 0.0 0.0 92.4
Number 0 0 0 0 0 0 0 0 1 1 2Total Value 0.0 0.0 0.0 0.0 0.0 0.0 0.0 0.0 3.1 68.4 71.5
Crossborder/Withinindustry
Ave Value 0.0 0.0 0.0 0.0 0.0 0.0 0.0 0.0 3.1 68.4 35.8
Number 0 0 0 0 0 1 0 2 0 0 3Total Value 0.0 0.0 0.0 0.0 0.0 119.5 0.0 31.2 0.0 0.0 150.7
Crossborder/Crossindustry
Ave Value 0.0 0.0 0.0 0.0 0.0 119.5 0.0 15.6 0.0 0.0 50.2
Number 3 15 15 11 14 8 14 14 9 10 113Total Value 0.0 1904.5 369.3 236.3 956.3 474.0 3658.8 5301.7 1256.6 1081.5 15239.0
Total
Ave Value 0.0 476.1 123.1 78.8 119.5 94.8 522.7 441.8 179.5 180.3 277.1

393
Deals classified by country and sector of acquiring firm
1990 1991 1992 1993 1994 1995 1996 1997 1998 1999 TotalDeal type
Number 1 8 9 8 8 4 10 8 6 4 66Total Value 0.0 0.0 135.2 24.4 539.6 182.0 3450.4 2723.7 1250.2 288.0 8593.5
Withinborder/Withinindustry
Ave Value 0.0 0.0 67.6 12.2 134.9 60.7 862.6 389.1 250.0 144.0 296.3
Number 1 7 4 3 3 1 4 2 1 2 28Total Value 0.0 1904.5 234.1 211.9 409.3 172.5 208.4 2262.3 0.0 34.3 5437.3
Withinborder/Crossindustry
Ave Value 0.0 476.1 234.1 211.9 204.7 172.5 69.5 1131.2 0.0 34.3 362.5
Number 2 3 0 0 2 1 1 4 3 3 19Total Value 34.7 1.3 0.0 0.0 0.0 810.6 0.0 4292.0 67.2 4030.0 9235.8
Crossborder/Withinindustry
Ave Value 34.7 0.7 0.0 0.0 0.0 810.6 0.0 4292.0 22.4 2015.0 923.6
Number 1 3 0 0 0 0 0 1 0 6 11Total Value 808.4 43.4 0.0 0.0 0.0 0.0 0.0 0.0 0.0 2714.1 3565.9
Crossborder/Crossindustry
Ave Value 808.4 21.7 0.0 0.0 0.0 0.0 0.0 0.0 0.0 678.5 509.4
Deal type
Number 2 15 13 11 11 5 14 10 7 6 94Total Value 0.0 1904.5 369.3 236.3 948.9 354.5 3658.8 4986.0 1250.2 322.3 14030.8
Withinborder
Ave Value 0.0 476.1 123.1 78.8 158.2 88.6 522.7 554.0 250.0 107.4 318.9
Number 3 6 0 0 2 1 1 5 3 9 30Total Value 843.1 44.7 0.0 0.0 0.0 810.6 0.0 4292.0 67.2 6744.1 12801.7
Crossborder
Ave Value 421.6 11.2 0.0 0.0 0.0 810.6 0.0 4292.0 22.4 1124.0 753.0
Deal typeNumber 3 11 9 8 10 5 11 12 9 7 85Total Value 34.7 1.3 135.2 24.4 539.6 992.6 3450.4 7015.7 1317.4 4318.0 17829.3
Withinindustry
Ave Value 34.7 0.7 67.6 12.2 134.9 248.2 862.6 877.0 164.7 1079.5 457.2
Number 2 10 4 3 3 1 4 3 1 8 39Total Value 808.4 1947.9 234.1 211.9 409.3 172.5 208.4 2262.3 0.0 2748.4 9003.2
Crossindustry
Ave Value 808.4 324.7 234.1 211.9 204.7 172.5 69.5 1131.2 0.0 549.7 409.2
Industry
Number 1 5 5 4 2 3 7 12 3 5 47Total Value 34.7 0.0 0.0 211.9 58.7 966.5 3501.1 9084.3 822.4 366.1 15045.7
Banking
Ave Value 34.7 0.0 0.0 211.9 29.4 322.2 875.3 1135.5 274.1 183.1 601.8
Number 3 5 2 1 1 1 1 1 3 1 19Total Value 808.4 81.3 234.1 0.0 0.0 172.5 0.0 0.0 486.4 3847.3 5630.0
Insurance
Ave Value 808.4 27.1 234.1 0.0 0.0 172.5 0.0 0.0 162.1 3847.3 563.0
Number 1 11 6 6 10 2 7 2 4 9 58Total Value 0.0 1867.9 135.2 24.4 890.2 26.1 157.7 193.7 8.6 2853.0 6156.8
Securities/Other
Ave Value 0.0 373.6 135.2 12.2 222.6 26.1 52.6 96.9 4.3 475.5 236.8
Number 5 21 13 11 13 6 15 15 10 15 124Total Value 843.1 1949.2 369.3 236.3 948.9 1165.1 3658.8 9278.0 1317.4 7066.4 26832.5Ave Value 421.6 243.7 123.1 78.8 158.2 233.0 522.7 927.8 164.7 785.2 439.9
GDP 238444 248486 256736 192684 207289 240682 261813 237474 237789 238579 2359974
Total
Value/GDP 0.35% 0.78% 0.14% 0.12% 0.46% 0.48% 1.40% 3.91% 0.55% 2.96% 1.14%

394
Deals classified by country and sector of acquiring firm
1990 1991 1992 1993 1994 1995 1996 1997 1998 1999 TotalBanking
Number 0 3 5 3 1 2 6 6 3 1 30Total Value 0.0 0.0 0.0 0.0 38.8 155.9 3449.4 2530.0 822.4 183.4 7179.9
Withinborder/Withinindustry
Ave Value 0.0 0.0 0.0 0.0 38.8 78.0 1149.8 506.0 274.1 183.4 448.7
Number 0 1 0 1 1 0 1 2 0 1 7Total Value 0.0 0.0 0.0 211.9 19.9 0.0 51.7 2262.3 0.0 0.0 2545.8
Withinborder/Crossindustry
Ave Value 0.0 0.0 0.0 211.9 19.9 0.0 51.7 1131.2 0.0 0.0 509.2
Number 1 1 0 0 0 1 0 3 0 2 8Total Value 34.7 0.0 0.0 0.0 0.0 810.6 0.0 4292.0 0.0 182.7 5320.0
Crossborder/Withinindustry
Ave Value 34.7 0.0 0.0 0.0 0.0 810.6 0.0 4292.0 0.0 182.7 1330.0
Number 0 0 0 0 0 0 0 1 0 1 2Total Value 0.0 0.0 0.0 0.0 0.0 0.0 0.0 0.0 0.0 0.0 0.0
Crossborder/Crossindustry
Ave Value 0.0 0.0 0.0 0.0 0.0 0.0 0.0 0.0 0.0 0.0 0.0
Insurance
Number 1 1 0 0 0 0 0 0 1 0 3Total Value 0.0 0.0 0.0 0.0 0.0 0.0 0.0 0.0 422.3 0.0 422.3
Withinborder/Withinindustry
Ave Value 0.0 0.0 0.0 0.0 0.0 0.0 0.0 0.0 422.3 0.0 422.3
Number 0 2 2 1 0 1 1 0 0 0 7Total Value 0.0 40.4 234.1 0.0 0.0 172.5 0.0 0.0 0.0 0.0 447.0
Withinborder/Crossindustry
Ave Value 0.0 40.4 234.1 0.0 0.0 172.5 0.0 0.0 0.0 0.0 149.0
Number 1 1 0 0 1 0 0 1 2 1 7Total Value 0.0 0.5 0.0 0.0 0.0 0.0 0.0 0.0 64.1 3847.3 3911.9
Crossborder/Withinindustry
Ave Value 0.0 0.5 0.0 0.0 0.0 0.0 0.0 0.0 32.1 3847.3 978.0
Number 1 1 0 0 0 0 0 0 0 0 2Total Value 808.4 40.4 0.0 0.0 0.0 0.0 0.0 0.0 0.0 0.0 848.8
Crossborder/Crossindustry
Ave Value 808.4 40.4 0.0 0.0 0.0 0.0 0.0 0.0 0.0 0.0 424.4
Securities/Other
Number 0 4 4 5 7 2 4 2 2 3 33Total Value 0.0 0.0 135.2 24.4 500.8 26.1 1.0 193.7 5.5 104.6 991.3
Withinborder/Withinindustry
Ave Value 0.0 0.0 135.2 12.2 166.9 26.1 1.0 96.9 5.5 104.6 82.6
Number 1 4 2 1 2 0 2 0 1 1 14Total Value 0.0 1864.1 0.0 0.0 389.4 0.0 156.7 0.0 0.0 34.3 2444.5
Withinborder/Crossindustry
Ave Value 0.0 621.4 0.0 0.0 389.4 0.0 78.4 0.0 0.0 34.3 349.2
Number 0 1 0 0 1 0 1 0 1 0 4Total Value 0.0 0.8 0.0 0.0 0.0 0.0 0.0 0.0 3.1 0.0 3.9
Crossborder/Withinindustry
Ave Value 0.0 0.8 0.0 0.0 0.0 0.0 0.0 0.0 3.1 0.0 2.0
Number 0 2 0 0 0 0 0 0 0 5 7Total Value 0.0 3.0 0.0 0.0 0.0 0.0 0.0 0.0 0.0 2714.1 2717.1
Crossborder/Crossindustry
Ave Value 0.0 3.0 0.0 0.0 0.0 0.0 0.0 0.0 0.0 678.5 543.4
Number 5 21 13 11 13 6 15 15 10 15 124Total Value 843.1 1949.2 369.3 236.3 948.9 1165.1 3658.8 9278.0 1317.4 7066.4 26832.5
Total
Ave Value 421.6 243.7 123.1 78.8 158.2 233.0 522.7 927.8 164.7 785.2 439.9
Source: Thomson Financial, SDC Platinum.

395
Table A.16Country: Switzerland
All values in USD millionsDeals classified by country and sector of target firm
1990 1991 1992 1993 1994 1995 1996 1997 1998 1999 Total
Deal typeNumber 3 12 16 12 18 6 8 5 2 5 87Total Value 0.0 36.5 129.3 1356.5 1034.3 637.4 102.7 23036.5 0.0 95.2 26428.4
Withinborder/Withinindustry
Ave Value 0.0 36.5 32.3 339.1 129.3 318.7 34.2 7678.8 0.0 47.6 978.8
Number 0 1 1 0 2 3 3 2 0 1 13Total Value 0.0 0.0 0.0 0.0 61.0 0.0 0.0 9661.7 0.0 943.8 10666.5
Withinborder/Crossindustry
Ave Value 0.0 0.0 0.0 0.0 61.0 0.0 0.0 9661.7 0.0 943.8 3555.5
Number 4 1 1 2 3 5 7 6 4 6 39Total Value 104.6 0.0 0.0 0.0 1164.5 48.9 0.2 0.0 0.0 0.0 1318.2
Crossborder/Withinindustry
Ave Value 104.6 0.0 0.0 0.0 1164.5 48.9 0.2 0.0 0.0 0.0 329.6
Number 2 2 1 1 1 2 1 2 0 1 13Total Value 0.0 0.0 0.0 0.0 59.9 0.0 20.0 0.0 0.0 0.0 79.9
Crossborder/Crossindustry
Ave Value 0.0 0.0 0.0 0.0 59.9 0.0 20.0 0.0 0.0 0.0 40.0
Deal type
Number 3 13 17 12 20 9 11 7 2 6 100Total Value 0.0 36.5 129.3 1356.5 1095.3 637.4 102.7 32698.2 0.0 1039.0 37094.9
Withinborder
Ave Value 0.0 36.5 32.3 339.1 121.7 318.7 34.2 8174.6 0.0 346.3 1236.5
Number 6 3 2 3 4 7 8 8 4 7 52Total Value 104.6 0.0 0.0 0.0 1224.4 48.9 20.2 0.0 0.0 0.0 1398.1
Crossborder
Ave Value 104.6 0.0 0.0 0.0 612.2 48.9 10.1 0.0 0.0 0.0 233.0
Deal type
Number 7 13 17 14 21 11 15 11 6 11 126Total Value 104.6 36.5 129.3 1356.5 2198.8 686.3 102.9 23036.5 0.0 95.2 27746.6
Withinindustry
Ave Value 104.6 36.5 32.3 339.1 244.3 228.8 25.7 7678.8 0.0 47.6 895.1
Number 2 3 2 1 3 5 4 4 0 2 26Total Value 0.0 0.0 0.0 0.0 120.9 0.0 20.0 9661.7 0.0 943.8 10746.4
Crossindustry
Ave Value 0.0 0.0 0.0 0.0 60.5 0.0 20.0 9661.7 0.0 943.8 2149.3
Industry
Number 7 12 19 13 19 6 10 11 3 7 107Total Value 104.6 0.0 129.3 255.4 1034.3 637.4 120.9 23036.5 0.0 1039.0 26357.4
Banking
Ave Value 104.6 0.0 32.3 85.1 129.3 318.7 40.3 7678.8 0.0 346.3 976.2
Number 1 2 0 1 1 3 3 3 2 3 19Total Value 0.0 0.0 0.0 1101.1 1164.5 0.0 0.0 9661.7 0.0 0.0 11927.3
Insurance
Ave Value 0.0 0.0 0.0 1101.1 1164.5 0.0 0.0 9661.7 0.0 0.0 3975.8
Number 1 2 0 1 4 7 6 1 1 3 26Total Value 0.0 36.5 0.0 0.0 120.9 48.9 2.0 0.0 0.0 0.0 208.3
Securities/Other
Ave Value 0.0 36.5 0.0 0.0 60.5 48.9 1.0 0.0 0.0 0.0 34.7
Number 9 16 19 15 24 16 19 15 6 13 152Total Value 104.6 36.5 129.3 1356.5 2319.7 686.3 122.9 32698.2 0.0 1039.0 38493.0Ave Value 104.6 36.5 32.3 339.1 210.9 228.8 24.6 8174.6 0.0 346.3 1069.3
GDP 229998 232928 244140 236850 262286 307784 296128 256204 262572 259092 2587982
Total
Value/GDP 0.05% 0.02% 0.05% 0.57% 0.88% 0.22% 0.04% 12.76% 0.00% 0.40% 1.49%

396
Deals classified by country and sector of target firm
1990 1991 1992 1993 1994 1995 1996 1997 1998 1999 TotalBanking
Number 2 9 16 11 16 2 4 5 1 4 70Total Value 0.0 0.0 129.3 255.4 1034.3 637.4 100.9 23036.5 0.0 95.2 25289.0
Withinborder/Withinindustry
Ave Value 0.0 0.0 32.3 85.1 129.3 318.7 50.5 7678.8 0.0 47.6 1053.7
Number 0 1 1 0 1 2 2 1 0 1 9Total Value 0.0 0.0 0.0 0.0 0.0 0.0 0.0 0.0 0.0 943.8 943.8
Withinborder/Crossindustry
Ave Value 0.0 0.0 0.0 0.0 0.0 0.0 0.0 0.0 0.0 943.8 943.8
Number 3 0 1 2 2 2 3 5 2 2 22Total Value 104.6 0.0 0.0 0.0 0.0 0.0 0.0 0.0 0.0 0.0 104.6
Crossborder/Withinindustry
Ave Value 104.6 0.0 0.0 0.0 0.0 0.0 0.0 0.0 0.0 0.0 104.6
Number 2 2 1 0 0 0 1 0 0 0 6Total Value 0.0 0.0 0.0 0.0 0.0 0.0 20.0 0.0 0.0 0.0 20.0
Crossborder/Crossindustry
Ave Value 0.0 0.0 0.0 0.0 0.0 0.0 20.0 0.0 0.0 0.0 20.0
Insurance
Number 0 1 0 1 0 2 2 0 1 0 7Total Value 0.0 0.0 0.0 1101.1 0.0 0.0 0.0 0.0 0.0 0.0 1101.1
Withinborder/Withinindustry
Ave Value 0.0 0.0 0.0 1101.1 0.0 0.0 0.0 0.0 0.0 0.0 1101.1
Number 0 0 0 0 0 0 0 1 0 0 1Total Value 0.0 0.0 0.0 0.0 0.0 0.0 0.0 9661.7 0.0 0.0 9661.7
Withinborder/Crossindustry
Ave Value 0.0 0.0 0.0 0.0 0.0 0.0 0.0 9661.7 0.0 0.0 9661.7
Number 1 1 0 0 1 1 1 0 1 3 9Total Value 0.0 0.0 0.0 0.0 1164.5 0.0 0.0 0.0 0.0 0.0 1164.5
Crossborder/Withinindustry
Ave Value 0.0 0.0 0.0 0.0 1164.5 0.0 0.0 0.0 0.0 0.0 1164.5
Number 0 0 0 0 0 0 0 2 0 0 2Total Value 0.0 0.0 0.0 0.0 0.0 0.0 0.0 0.0 0.0 0.0 0.0
Crossborder/Crossindustry
Ave Value 0.0 0.0 0.0 0.0 0.0 0.0 0.0 0.0 0.0 0.0 0.0
Securities/Other
Number 1 2 0 0 2 2 2 0 0 1 10Total Value 0.0 36.5 0.0 0.0 0.0 0.0 1.8 0.0 0.0 0.0 38.3
Withinborder/Withinindustry
Ave Value 0.0 36.5 0.0 0.0 0.0 0.0 1.8 0.0 0.0 0.0 19.2
Number 0 0 0 0 1 1 1 0 0 0 3Total Value 0.0 0.0 0.0 0.0 61.0 0.0 0.0 0.0 0.0 0.0 61.0
Withinborder/Crossindustry
Ave Value 0.0 0.0 0.0 0.0 61.0 0.0 0.0 0.0 0.0 0.0 61.0
Number 0 0 0 0 0 2 3 1 1 1 8Total Value 0.0 0.0 0.0 0.0 0.0 48.9 0.2 0.0 0.0 0.0 49.1
Crossborder/Withinindustry
Ave Value 0.0 0.0 0.0 0.0 0.0 48.9 0.2 0.0 0.0 0.0 24.6
Number 0 0 0 1 1 2 0 0 0 1 5Total Value 0.0 0.0 0.0 0.0 59.9 0.0 0.0 0.0 0.0 0.0 59.9
Crossborder/Crossindustry
Ave Value 0.0 0.0 0.0 0.0 59.9 0.0 0.0 0.0 0.0 0.0 59.9
Number 9 16 19 15 24 16 19 15 6 13 152Total Value 104.6 36.5 129.3 1356.5 2319.7 686.3 122.9 32698.2 0.0 1039.0 38493.0
Total
Ave Value 104.6 36.5 32.3 339.1 210.9 228.8 24.6 8174.6 0.0 346.3 1069.3

397
Deals classified by country and sector of acquiring firm
1990 1991 1992 1993 1994 1995 1996 1997 1998 1999 TotalDeal type
Number 3 12 16 12 18 6 8 5 2 5 87Total Value 0.0 36.5 129.3 1356.5 1034.3 637.4 102.7 23036.5 0.0 95.2 26428.4
Withinborder/Withinindustry
Ave Value 0.0 36.5 32.3 339.1 129.3 318.7 34.2 7678.8 0.0 47.6 978.8
Number 1 1 1 0 2 3 3 3 0 1 15Total Value 133.2 0.0 0.0 0.0 61.0 0.0 0.0 9661.7 0.0 943.8 10799.7
Withinborder/Crossindustry
Ave Value 133.2 0.0 0.0 0.0 61.0 0.0 0.0 9661.7 0.0 943.8 2699.9
Number 3 5 3 4 4 5 5 9 5 12 55Total Value 0.0 324.0 0.0 0.0 275.6 6.9 461.7 539.5 2252.2 197.1 4057.0
Crossborder/Withinindustry
Ave Value 0.0 162.0 0.0 0.0 275.6 6.9 230.9 539.5 563.1 65.7 289.8
Number 2 3 1 3 1 4 0 6 5 2 27Total Value 0.0 0.0 0.0 11.1 750.0 1872.4 0.0 1923.3 12.8 675.0 5244.6
Crossborder/Crossindustry
Ave Value 0.0 0.0 0.0 11.1 750.0 1872.4 0.0 641.1 6.4 675.0 582.7
Deal type
Number 4 13 17 12 20 9 11 8 2 6 102Total Value 133.2 36.5 129.3 1356.5 1095.3 637.4 102.7 32698.2 0.0 1039.0 37228.1
Withinborder
Ave Value 133.2 36.5 32.3 339.1 121.7 318.7 34.2 8174.6 0.0 346.3 1200.9
Number 5 8 4 7 5 9 5 15 10 14 82Total Value 0.0 324.0 0.0 11.1 1025.6 1879.3 461.7 2462.8 2265.0 872.1 9301.6
Crossborder
Ave Value 0.0 162.0 0.0 11.1 512.8 939.7 230.9 615.7 377.5 218.0 404.4
Deal type
Number 6 17 19 16 22 11 13 14 7 17 142Total Value 0.0 360.5 129.3 1356.5 1309.9 644.3 564.4 23576.0 2252.2 292.3 30485.4
Withinindustry
Ave Value 0.0 120.2 32.3 339.1 145.5 214.8 112.9 5894.0 563.1 58.5 743.5
Number 3 4 2 3 3 7 3 9 5 3 42Total Value 133.2 0.0 0.0 11.1 811.0 1872.4 0.0 11585.0 12.8 1618.8 16044.3
Crossindustry
Ave Value 133.2 0.0 0.0 11.1 405.5 1872.4 0.0 2896.3 6.4 809.4 1234.2
Industry
Number 4 10 19 14 21 6 6 14 2 8 104Total Value 133.2 0.0 129.3 255.4 1845.3 637.4 100.9 32954.5 2.0 774.5 36832.5
Banking
Ave Value 133.2 0.0 32.3 85.1 184.5 318.7 50.5 5492.4 2.0 193.6 1116.1
Number 2 6 1 3 1 5 5 6 7 7 43Total Value 0.0 324.0 0.0 1101.1 275.6 0.0 461.7 2206.5 2252.2 1068.2 7689.3
Insurance
Ave Value 0.0 162.0 0.0 1101.1 275.6 0.0 230.9 1103.3 563.1 534.1 549.2
Number 3 5 1 2 3 7 5 3 3 5 37Total Value 0.0 36.5 0.0 11.1 0.0 1879.3 1.8 0.0 10.8 68.4 2007.9
Securities/Other
Ave Value 0.0 36.5 0.0 11.1 0.0 939.7 1.8 0.0 10.8 68.4 286.8
Number 9 21 21 19 25 18 16 23 12 20 184Total Value 133.2 360.5 129.3 1367.6 2120.9 2516.7 564.4 35161.0 2265.0 1911.1 46529.7Ave Value 133.2 120.2 32.3 273.5 192.8 629.2 112.9 4395.1 377.5 273.0 861.7
GDP 229998 232928 244140 236850 262286 307784 296128 256204 262572 259092 2587982
Total
Value/GDP 0.06% 0.15% 0.05% 0.58% 0.81% 0.82% 0.19% 13.72% 0.86% 0.74% 1.80%

398
Deals classified by country and sector of acquiring firm
1990 1991 1992 1993 1994 1995 1996 1997 1998 1999 Total
BankingNumber 2 9 16 11 16 2 4 5 1 4 70Total Value 0.0 0.0 129.3 255.4 1034.3 637.4 100.9 23036.5 0.0 95.2 25289.0
Withinborder/Withinindustry
Ave Value 0.0 0.0 32.3 85.1 129.3 318.7 50.5 7678.8 0.0 47.6 1053.7
Number 1 0 0 0 1 1 1 1 0 0 5Total Value 133.2 0.0 0.0 0.0 61.0 0.0 0.0 9661.7 0.0 0.0 9855.9
Withinborder/Crossindustry
Ave Value 133.2 0.0 0.0 0.0 61.0 0.0 0.0 9661.7 0.0 0.0 3285.3
Number 0 0 2 1 3 1 1 5 0 3 16Total Value 0.0 0.0 0.0 0.0 0.0 0.0 0.0 0.0 0.0 4.3 4.3
Crossborder/Withinindustry
Ave Value 0.0 0.0 0.0 0.0 0.0 0.0 0.0 0.0 0.0 4.3 4.3
Number 1 1 1 2 1 2 0 3 1 1 13Total Value 0.0 0.0 0.0 0.0 750.0 0.0 0.0 256.3 2.0 675.0 1683.3
Crossborder/Crossindustry
Ave Value 0.0 0.0 0.0 0.0 750.0 0.0 0.0 128.2 2.0 675.0 336.7
InsuranceNumber 0 1 0 1 0 2 2 0 1 0 7Total Value 0.0 0.0 0.0 1101.1 0.0 0.0 0.0 0.0 0.0 0.0 1101.1
Withinborder/Withinindustry
Ave Value 0.0 0.0 0.0 1101.1 0.0 0.0 0.0 0.0 0.0 0.0 1101.1
Number 0 0 0 0 0 0 0 1 0 1 2Total Value 0.0 0.0 0.0 0.0 0.0 0.0 0.0 0.0 0.0 943.8 943.8
Withinborder/Crossindustry
Ave Value 0.0 0.0 0.0 0.0 0.0 0.0 0.0 0.0 0.0 943.8 943.8
Number 2 4 1 2 1 2 3 4 5 6 30Total Value 0.0 324.0 0.0 0.0 275.6 0.0 461.7 539.5 2252.2 124.4 3977.4
Crossborder/Withinindustry
Ave Value 0.0 162.0 0.0 0.0 275.6 0.0 230.9 539.5 563.1 124.4 361.6
Number 0 1 0 0 0 1 0 1 1 0 4Total Value 0.0 0.0 0.0 0.0 0.0 0.0 0.0 1667.0 0.0 0.0 1667.0
Crossborder/Crossindustry
Ave Value 0.0 0.0 0.0 0.0 0.0 0.0 0.0 1667.0 0.0 0.0 1667.0
Securities/Other
Number 1 2 0 0 2 2 2 0 0 1 10Total Value 0.0 36.5 0.0 0.0 0.0 0.0 1.8 0.0 0.0 0.0 38.3
Withinborder/Withinindustry
Ave Value 0.0 36.5 0.0 0.0 0.0 0.0 1.8 0.0 0.0 0.0 19.2
Number 0 1 1 0 1 2 2 1 0 0 8Total Value 0.0 0.0 0.0 0.0 0.0 0.0 0.0 0.0 0.0 0.0 0.0
Withinborder/Crossindustry
Ave Value 0.0 0.0 0.0 0.0 0.0 0.0 0.0 0.0 0.0 0.0 0.0
Number 1 1 0 1 0 2 1 0 0 3 9Total Value 0.0 0.0 0.0 0.0 0.0 6.9 0.0 0.0 0.0 68.4 75.3
Crossborder/Withinindustry
Ave Value 0.0 0.0 0.0 0.0 0.0 6.9 0.0 0.0 0.0 68.4 37.7
Number 1 1 0 1 0 1 0 2 3 1 10Total Value 0.0 0.0 0.0 11.1 0.0 1872.4 0.0 0.0 10.8 0.0 1894.3
Crossborder/Crossindustry
Ave Value 0.0 0.0 0.0 11.1 0.0 1872.4 0.0 0.0 10.8 0.0 631.4
Number 9 21 21 19 25 18 16 23 12 20 184Total Value 133.2 360.5 129.3 1367.6 2120.9 2516.7 564.4 35161.0 2265.0 1911.1 46529.7
Total
Ave Value 133.2 120.2 32.3 273.5 192.8 629.2 112.9 4395.1 377.5 273.0 861.7
Source: Thomson Financial, SDC Platinum.

399
Table A.17Country: United KingdomAll values in USD millions
Deals classified by country and sector of target firm
1990 1991 1992 1993 1994 1995 1996 1997 1998 1999 Total
Deal typeNumber 18 33 22 31 32 38 50 45 41 61 371Total Value 1006.4 811.9 6203.3 448.4 668.0 18728.5 6191.0 6060.4 15474.3 42959.6 98551.8
Withinborder/Withinindustry
Ave Value 125.8 45.1 443.1 21.4 29.0 720.3 167.3 178.2 515.8 933.9 383.5
Number 9 5 8 12 13 20 28 27 12 23 157Total Value 1506.6 544.9 72.5 96.5 365.1 190.1 997.3 1124.7 2394.9 4755.4 12048.0
Withinborder/Crossindustry
Ave Value 188.3 181.6 10.4 9.7 40.6 12.7 45.3 48.9 217.7 237.8 94.1
Number 5 6 6 8 11 16 18 21 17 9 117Total Value 2050.9 194.5 133.8 480.6 725.6 2847.0 509.7 7644.2 4457.7 6470.9 25514.9
Crossborder/Withinindustry
Ave Value 410.2 97.3 44.6 96.1 181.4 284.7 63.7 588.0 405.2 1078.5 380.8
Number 3 4 3 0 1 3 8 3 10 5 40Total Value 927.0 113.4 10.3 0.0 14.6 427.9 181.5 91.3 4737.3 1025.4 7528.7
Crossborder/Crossindustry
Ave Value 309.0 56.7 10.3 0.0 14.6 142.6 45.4 45.7 789.6 256.4 289.6
Deal typeNumber 27 38 30 43 45 58 78 72 53 84 528Total Value 2513.0 1356.8 6275.8 544.9 1033.1 18918.6 7188.3 7185.1 17869.2 47715.0 110599.8
Withinborder
Ave Value 157.1 64.6 298.8 17.6 32.3 461.4 121.8 126.1 435.8 723.0 287.3
Number 8 10 9 8 12 19 26 24 27 14 157Total Value 2977.9 307.9 144.1 480.6 740.2 3274.9 691.2 7735.5 9195.0 7496.3 33043.6
Crossborder
Ave Value 372.2 77.0 36.0 96.1 148.0 251.9 57.6 515.7 540.9 749.6 355.3
Deal type
Number 23 39 28 39 43 54 68 66 58 70 488Total Value 3057.3 1006.4 6337.1 929.0 1393.6 21575.5 6700.7 13704.6 19932.0 49430.5 124066.7
Withinindustry
Ave Value 235.2 50.3 372.8 35.7 51.6 599.3 148.9 291.6 486.1 950.6 382.9
Number 12 9 11 12 14 23 36 30 22 28 197Total Value 2433.6 658.3 82.8 96.5 379.7 618.0 1178.8 1216.0 7132.2 5780.8 19576.7
Crossindustry
Ave Value 221.2 131.7 10.4 9.7 38.0 34.3 45.3 48.6 419.5 240.9 127.1
Industry
Number 13 19 10 17 25 25 25 30 34 46 244Total Value 3867.9 501.3 5925.4 170.9 981.0 20531.5 490.8 2142.1 3523.9 42566.8 80701.6
Banking
Ave Value 386.8 45.6 658.4 11.4 65.4 1080.6 25.8 93.1 141.0 1182.4 443.4
Number 7 13 11 12 12 15 27 30 19 10 156Total Value 170.2 652.2 36.5 115.4 508.2 227.3 5806.2 6733.7 20896.0 6703.3 41849.0
Insurance
Ave Value 34.0 163.1 9.1 14.4 72.6 28.4 387.1 320.7 1607.4 837.9 450.0
Number 15 16 18 22 20 37 52 36 27 42 285Total Value 1452.8 511.2 458.0 739.2 284.1 1434.7 1582.5 6044.8 2644.3 5941.2 21092.8
Securities/Other
Ave Value 161.4 51.1 38.2 56.9 18.9 53.1 42.8 215.9 132.2 185.7 103.9
Number 35 48 39 51 57 77 104 96 80 98 685Total Value 5490.9 1664.7 6419.9 1025.5 1773.3 22193.5 7879.5 14920.6 27064.2 55211.3 143643.4Ave Value 228.8 66.6 256.8 28.5 47.9 411.0 111.0 207.2 466.6 726.5 300.5
GDP 990570 1030268 1070115 958004 1035891 1124381 1178814 1316570 1403540 1439832 11547985
Total
Value/GDP 0.55% 0.16% 0.60% 0.11% 0.17% 1.97% 0.67% 1.13% 1.93% 3.83% 1.24%
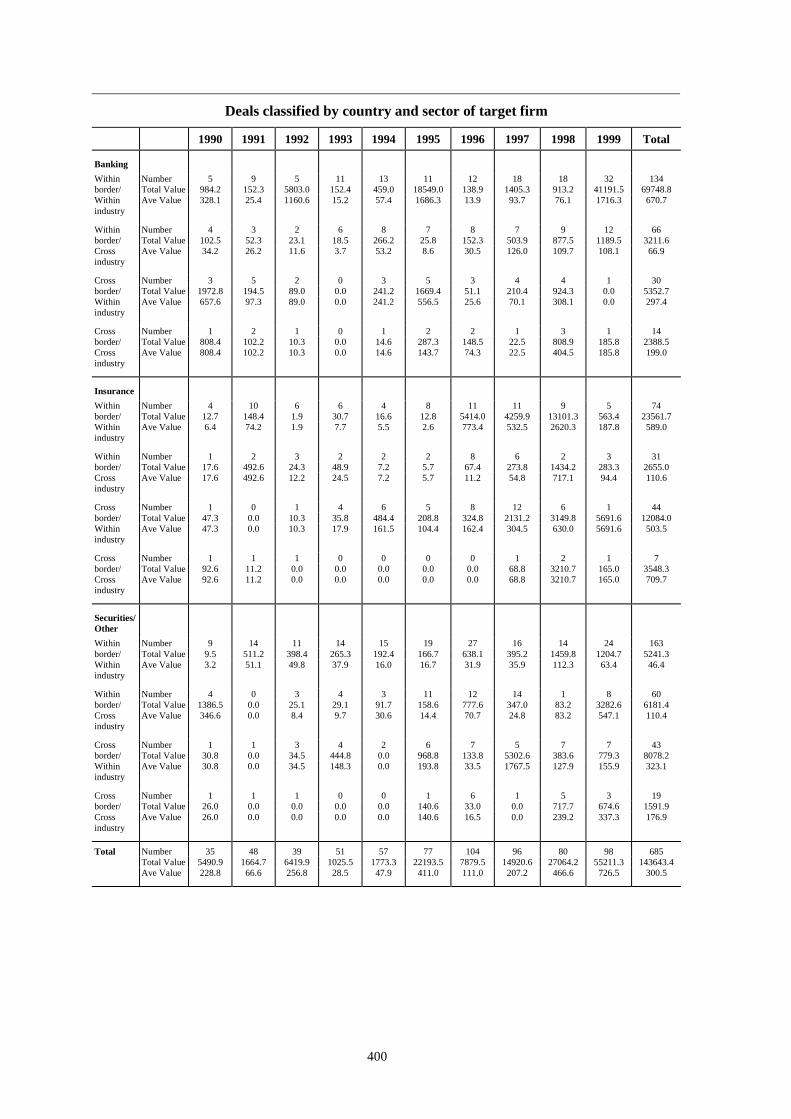
400
Deals classified by country and sector of target firm
1990 1991 1992 1993 1994 1995 1996 1997 1998 1999 Total
BankingNumber 5 9 5 11 13 11 12 18 18 32 134Total Value 984.2 152.3 5803.0 152.4 459.0 18549.0 138.9 1405.3 913.2 41191.5 69748.8
Withinborder/Withinindustry
Ave Value 328.1 25.4 1160.6 15.2 57.4 1686.3 13.9 93.7 76.1 1716.3 670.7
Number 4 3 2 6 8 7 8 7 9 12 66Total Value 102.5 52.3 23.1 18.5 266.2 25.8 152.3 503.9 877.5 1189.5 3211.6
Withinborder/Crossindustry
Ave Value 34.2 26.2 11.6 3.7 53.2 8.6 30.5 126.0 109.7 108.1 66.9
Number 3 5 2 0 3 5 3 4 4 1 30Total Value 1972.8 194.5 89.0 0.0 241.2 1669.4 51.1 210.4 924.3 0.0 5352.7
Crossborder/Withinindustry
Ave Value 657.6 97.3 89.0 0.0 241.2 556.5 25.6 70.1 308.1 0.0 297.4
Number 1 2 1 0 1 2 2 1 3 1 14Total Value 808.4 102.2 10.3 0.0 14.6 287.3 148.5 22.5 808.9 185.8 2388.5
Crossborder/Crossindustry
Ave Value 808.4 102.2 10.3 0.0 14.6 143.7 74.3 22.5 404.5 185.8 199.0
InsuranceNumber 4 10 6 6 4 8 11 11 9 5 74Total Value 12.7 148.4 1.9 30.7 16.6 12.8 5414.0 4259.9 13101.3 563.4 23561.7
Withinborder/Withinindustry
Ave Value 6.4 74.2 1.9 7.7 5.5 2.6 773.4 532.5 2620.3 187.8 589.0
Number 1 2 3 2 2 2 8 6 2 3 31Total Value 17.6 492.6 24.3 48.9 7.2 5.7 67.4 273.8 1434.2 283.3 2655.0
Withinborder/Crossindustry
Ave Value 17.6 492.6 12.2 24.5 7.2 5.7 11.2 54.8 717.1 94.4 110.6
Number 1 0 1 4 6 5 8 12 6 1 44Total Value 47.3 0.0 10.3 35.8 484.4 208.8 324.8 2131.2 3149.8 5691.6 12084.0
Crossborder/Withinindustry
Ave Value 47.3 0.0 10.3 17.9 161.5 104.4 162.4 304.5 630.0 5691.6 503.5
Number 1 1 1 0 0 0 0 1 2 1 7Total Value 92.6 11.2 0.0 0.0 0.0 0.0 0.0 68.8 3210.7 165.0 3548.3
Crossborder/Crossindustry
Ave Value 92.6 11.2 0.0 0.0 0.0 0.0 0.0 68.8 3210.7 165.0 709.7
Securities/Other
Number 9 14 11 14 15 19 27 16 14 24 163Total Value 9.5 511.2 398.4 265.3 192.4 166.7 638.1 395.2 1459.8 1204.7 5241.3
Withinborder/Withinindustry
Ave Value 3.2 51.1 49.8 37.9 16.0 16.7 31.9 35.9 112.3 63.4 46.4
Number 4 0 3 4 3 11 12 14 1 8 60Total Value 1386.5 0.0 25.1 29.1 91.7 158.6 777.6 347.0 83.2 3282.6 6181.4
Withinborder/Crossindustry
Ave Value 346.6 0.0 8.4 9.7 30.6 14.4 70.7 24.8 83.2 547.1 110.4
Number 1 1 3 4 2 6 7 5 7 7 43Total Value 30.8 0.0 34.5 444.8 0.0 968.8 133.8 5302.6 383.6 779.3 8078.2
Crossborder/Withinindustry
Ave Value 30.8 0.0 34.5 148.3 0.0 193.8 33.5 1767.5 127.9 155.9 323.1
Number 1 1 1 0 0 1 6 1 5 3 19Total Value 26.0 0.0 0.0 0.0 0.0 140.6 33.0 0.0 717.7 674.6 1591.9
Crossborder/Crossindustry
Ave Value 26.0 0.0 0.0 0.0 0.0 140.6 16.5 0.0 239.2 337.3 176.9
Number 35 48 39 51 57 77 104 96 80 98 685Total Value 5490.9 1664.7 6419.9 1025.5 1773.3 22193.5 7879.5 14920.6 27064.2 55211.3 143643.4
Total
Ave Value 228.8 66.6 256.8 28.5 47.9 411.0 111.0 207.2 466.6 726.5 300.5

401
Deals classified by country and sector of acquiring firm
1990 1991 1992 1993 1994 1995 1996 1997 1998 1999 TotalDeal type
Number 18 33 22 31 33 38 50 45 42 62 374Total Value 1006.4 811.9 6203.3 448.4 668.0 18728.5 6191.0 6060.4 15524.3 42959.6 98601.8
Withinborder/Withinindustry
Ave Value 125.8 45.1 443.1 21.4 29.0 720.3 167.3 178.2 500.8 933.9 382.2
Number 9 5 8 12 13 20 28 27 12 23 157Total Value 1506.6 544.9 72.5 96.5 365.1 190.1 997.3 1124.7 2394.9 4755.4 12048.0
Withinborder/Crossindustry
Ave Value 188.3 181.6 10.4 9.7 40.6 12.7 45.3 48.9 217.7 237.8 94.1
Number 10 6 12 4 11 17 18 18 16 21 133Total Value 1260.6 1.1 131.6 42.9 615.7 1149.4 1955.1 3242.4 462.9 18687.6 27549.3
Crossborder/Withinindustry
Ave Value 315.2 0.6 26.3 21.5 88.0 104.5 244.4 324.2 57.9 1168.0 377.4
Number 2 4 3 0 2 9 4 5 3 9 41Total Value 1.0 43.3 57.3 0.0 7.1 298.5 2129.5 188.4 24.0 992.3 3741.4
Crossborder/Crossindustry
Ave Value 1.0 21.7 28.7 0.0 7.1 99.5 1064.8 62.8 24.0 165.4 178.2
Deal typeNumber 27 38 30 43 46 58 78 72 54 85 531Total Value 2513.0 1356.8 6275.8 544.9 1033.1 18918.6 7188.3 7185.1 17919.2 47715.0 110649.8
Withinborder
Ave Value 157.1 64.6 298.8 17.6 32.3 461.4 121.8 126.1 426.6 723.0 286.7
Number 12 10 15 4 13 26 22 23 19 30 174Total Value 1261.6 44.4 188.9 42.9 622.8 1447.9 4084.6 3430.8 486.9 19679.9 31290.7
Crossborder
Ave Value 252.3 11.1 27.0 21.5 77.9 103.4 408.5 263.9 54.1 894.5 332.9
Deal type
Number 28 39 34 35 44 55 68 63 58 83 507Total Value 2267.0 813.0 6334.9 491.3 1283.7 19877.9 8146.1 9302.8 15987.2 61647.2 126151.1
Withinindustry
Ave Value 188.9 40.7 333.4 21.4 42.8 537.2 181.0 211.4 409.9 994.3 381.1
Number 11 9 11 12 15 29 32 32 15 32 198Total Value 1507.6 588.2 129.8 96.5 372.2 488.6 3126.8 1313.1 2418.9 5747.7 15789.4
Crossindustry
Ave Value 167.5 117.6 14.4 9.7 37.2 27.1 130.3 50.5 201.6 221.1 106.0
IndustryNumber 11 13 7 14 20 30 25 34 23 48 225Total Value 1095.2 681.1 5817.5 199.6 1116.1 19479.5 1070.0 2365.0 958.0 52304.0 85086.0
Banking
Ave Value 156.5 85.1 969.6 15.4 79.7 721.5 46.5 78.8 63.9 1341.1 467.5
Number 14 14 16 10 12 16 19 22 20 19 162Total Value 2639.3 156.5 82.2 84.3 243.2 387.7 5417.3 6319.9 13652.6 11380.6 40363.6
Insurance
Ave Value 329.9 39.1 10.3 12.0 30.4 35.2 601.9 451.4 1137.7 948.4 434.0
Number 14 21 22 23 27 38 56 39 30 48 318Total Value 40.1 563.6 565.0 303.9 296.6 499.3 4785.6 1931.0 3795.5 3710.3 16490.9
Securities/Other
Ave Value 6.7 43.4 40.4 23.4 16.5 29.4 129.3 74.3 158.1 100.3 80.4
Number 39 48 45 47 59 84 100 95 73 115 705Total Value 3774.6 1401.2 6464.7 587.8 1655.9 20366.5 11272.9 10615.9 18406.1 67394.9 141940.5Ave Value 179.7 56.0 230.9 17.8 41.4 370.3 163.4 151.7 360.9 765.9 295.7
GDP 990570 1030268 1070115 958004 1035891 1124381 1178814 1316570 1403540 1439832 11547985
Total
Value/GDP 0.38% 0.14% 0.60% 0.06% 0.16% 1.81% 0.96% 0.81% 1.31% 4.68% 1.23%

402
Deals classified by country and sector of acquiring firm
1990 1991 1992 1993 1994 1995 1996 1997 1998 1999 Total
BankingNumber 5 9 5 11 13 11 12 18 18 32 134Total Value 984.2 152.3 5803.0 152.4 459.0 18549.0 138.9 1405.3 913.2 41191.5 69748.8
Withinborder/Withinindustry
Ave Value 328.1 25.4 1160.6 15.2 57.4 1686.3 13.9 93.7 76.1 1716.3 670.7
Number 2 1 0 3 2 11 11 13 0 5 48Total Value 23.7 492.6 0.0 47.2 90.7 71.9 777.6 269.8 0.0 42.4 1815.9
Withinborder/Crossindustry
Ave Value 11.9 492.6 0.0 15.7 45.4 6.5 70.7 20.8 0.0 10.6 38.6
Number 4 2 2 0 4 4 2 2 5 8 33Total Value 87.3 0.0 14.5 0.0 566.4 833.2 153.5 688.0 44.8 11042.2 13429.9
Crossborder/Withinindustry
Ave Value 43.7 0.0 14.5 0.0 141.6 208.3 76.8 688.0 14.9 1380.3 537.2
Number 0 1 0 0 1 4 0 1 0 3 10Total Value 0.0 36.2 0.0 0.0 0.0 25.4 0.0 1.9 0.0 27.9 91.4
Crossborder/Crossindustry
Ave Value 0.0 36.2 0.0 0.0 0.0 25.4 0.0 1.9 0.0 9.3 15.2
InsuranceNumber 4 10 6 6 5 8 11 11 10 5 76Total Value 12.7 148.4 1.9 30.7 16.6 12.8 5414.0 4259.9 13151.3 563.4 23611.7
Withinborder/Withinindustry
Ave Value 6.4 74.2 1.9 7.7 5.5 2.6 773.4 532.5 2191.9 187.8 575.9
Number 5 0 3 2 3 1 1 3 1 4 23Total Value 1453.3 0.0 25.1 10.7 214.2 92.4 0.0 136.3 83.2 3263.3 5278.5
Withinborder/Crossindustry
Ave Value 363.3 0.0 8.4 10.7 71.4 92.4 0.0 68.2 83.2 1087.8 293.3
Number 4 2 6 2 4 5 6 8 8 9 54Total Value 1173.3 1.0 54.9 42.9 12.4 282.5 2.4 1923.7 418.1 7525.9 11437.1
Crossborder/Withinindustry
Ave Value 586.7 1.0 18.3 21.5 6.2 56.5 2.4 480.9 83.6 1505.2 381.2
Number 1 2 1 0 0 2 1 0 1 1 9Total Value 0.0 7.1 0.3 0.0 0.0 0.0 0.9 0.0 0.0 28.0 36.3
Crossborder/Crossindustry
Ave Value 0.0 7.1 0.3 0.0 0.0 0.0 0.9 0.0 0.0 28.0 9.1
Securities/Other
Number 9 14 11 14 15 19 27 16 14 25 164Total Value 9.5 511.2 398.4 265.3 192.4 166.7 638.1 395.2 1459.8 1204.7 5241.3
Withinborder/Withinindustry
Ave Value 3.2 51.1 49.8 37.9 16.0 16.7 31.9 35.9 112.3 63.4 46.4
Number 2 4 5 7 8 8 16 11 11 14 86Total Value 29.6 52.3 47.4 38.6 60.2 25.8 219.7 718.6 2311.7 1449.7 4953.6
Withinborder/Crossindustry
Ave Value 14.8 26.2 11.9 6.4 15.1 8.6 20.0 89.8 231.2 111.5 78.6
Number 2 2 4 2 3 8 10 8 3 4 46Total Value 0.0 0.1 62.2 0.0 36.9 33.7 1799.2 630.7 0.0 119.5 2682.3
Crossborder/Withinindustry
Ave Value 0.0 0.1 62.2 0.0 36.9 16.9 359.8 126.1 0.0 39.8 149.0
Number 1 1 2 0 1 3 3 4 2 5 22Total Value 1.0 0.0 57.0 0.0 7.1 273.1 2128.6 186.5 24.0 936.4 3613.7
Crossborder/Crossindustry
Ave Value 1.0 0.0 57.0 0.0 7.1 136.6 2128.6 93.3 24.0 468.2 328.5
Number 39 48 45 47 59 84 100 95 73 115 705Total Value 3774.6 1401.2 6464.7 587.8 1655.9 20366.5 11272.9 10615.9 18406.1 67394.9 141940.5
Total
Ave Value 179.7 56.0 230.9 17.8 41.4 370.3 163.4 151.7 360.9 765.9 295.7
Source: Thomson Financial, SDC Platinum.
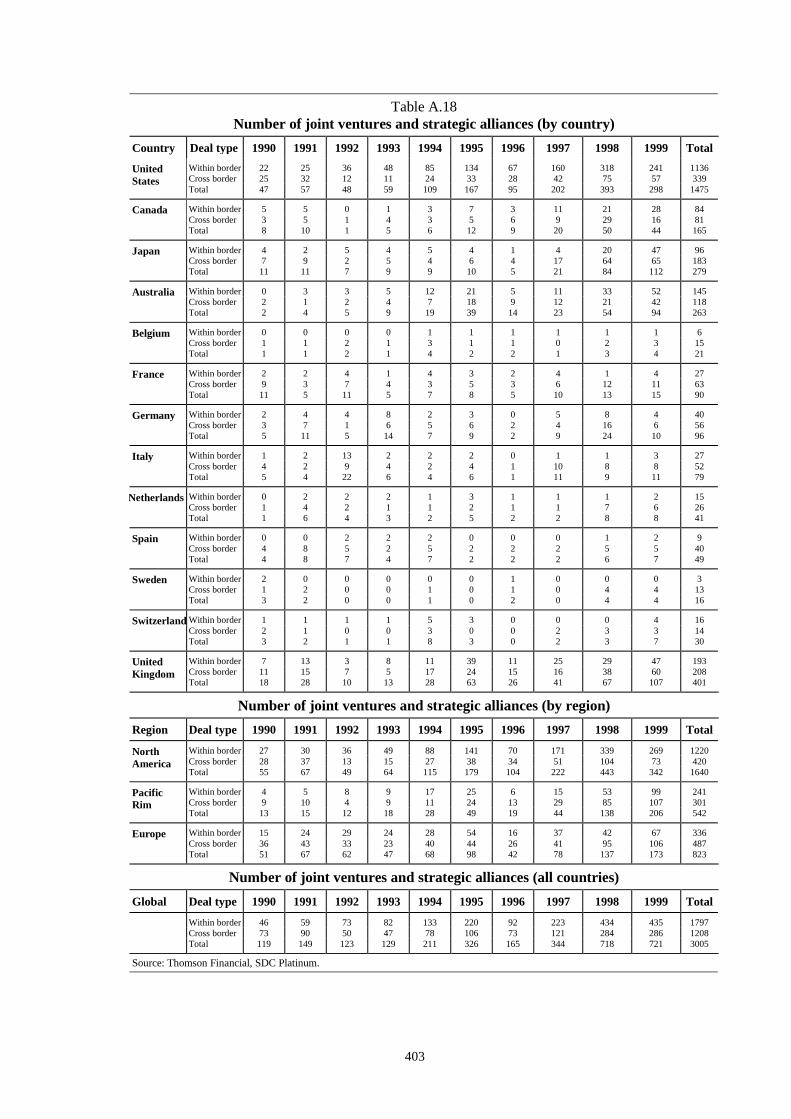
403
Table A.18Number of joint ventures and strategic alliances (by country)
Country Deal type 1990 1991 1992 1993 1994 1995 1996 1997 1998 1999 TotalWithin border 22 25 36 48 85 134 67 160 318 241 1136Cross border 25 32 12 11 24 33 28 42 75 57 339
UnitedStates
Total 47 57 48 59 109 167 95 202 393 298 1475
Within border 5 5 0 1 3 7 3 11 21 28 84Cross border 3 5 1 4 3 5 6 9 29 16 81
Canada
Total 8 10 1 5 6 12 9 20 50 44 165
Within border 4 2 5 4 5 4 1 4 20 47 96Cross border 7 9 2 5 4 6 4 17 64 65 183
Japan
Total 11 11 7 9 9 10 5 21 84 112 279
Within border 0 3 3 5 12 21 5 11 33 52 145Cross border 2 1 2 4 7 18 9 12 21 42 118
Australia
Total 2 4 5 9 19 39 14 23 54 94 263
Within border 0 0 0 0 1 1 1 1 1 1 6Cross border 1 1 2 1 3 1 1 0 2 3 15
Belgium
Total 1 1 2 1 4 2 2 1 3 4 21
Within border 2 2 4 1 4 3 2 4 1 4 27Cross border 9 3 7 4 3 5 3 6 12 11 63
France
Total 11 5 11 5 7 8 5 10 13 15 90
Within border 2 4 4 8 2 3 0 5 8 4 40Cross border 3 7 1 6 5 6 2 4 16 6 56
Germany
Total 5 11 5 14 7 9 2 9 24 10 96
Within border 1 2 13 2 2 2 0 1 1 3 27Cross border 4 2 9 4 2 4 1 10 8 8 52
Italy
Total 5 4 22 6 4 6 1 11 9 11 79
Within border 0 2 2 2 1 3 1 1 1 2 15Cross border 1 4 2 1 1 2 1 1 7 6 26
Netherlands
Total 1 6 4 3 2 5 2 2 8 8 41
Within border 0 0 2 2 2 0 0 0 1 2 9Cross border 4 8 5 2 5 2 2 2 5 5 40
Spain
Total 4 8 7 4 7 2 2 2 6 7 49
Within border 2 0 0 0 0 0 1 0 0 0 3Cross border 1 2 0 0 1 0 1 0 4 4 13
Sweden
Total 3 2 0 0 1 0 2 0 4 4 16
Within border 1 1 1 1 5 3 0 0 0 4 16Cross border 2 1 0 0 3 0 0 2 3 3 14
Switzerland
Total 3 2 1 1 8 3 0 2 3 7 30
Within border 7 13 3 8 11 39 11 25 29 47 193Cross border 11 15 7 5 17 24 15 16 38 60 208
UnitedKingdom
Total 18 28 10 13 28 63 26 41 67 107 401
Number of joint ventures and strategic alliances (by region)Region Deal type 1990 1991 1992 1993 1994 1995 1996 1997 1998 1999 Total
Within border 27 30 36 49 88 141 70 171 339 269 1220Cross border 28 37 13 15 27 38 34 51 104 73 420
NorthAmerica
Total 55 67 49 64 115 179 104 222 443 342 1640
Within border 4 5 8 9 17 25 6 15 53 99 241Cross border 9 10 4 9 11 24 13 29 85 107 301
PacificRim
Total 13 15 12 18 28 49 19 44 138 206 542
Within border 15 24 29 24 28 54 16 37 42 67 336Cross border 36 43 33 23 40 44 26 41 95 106 487
Europe
Total 51 67 62 47 68 98 42 78 137 173 823
Number of joint ventures and strategic alliances (all countries)Global Deal type 1990 1991 1992 1993 1994 1995 1996 1997 1998 1999 Total
Within border 46 59 73 82 133 220 92 223 434 435 1797Cross border 73 90 50 47 78 106 73 121 284 286 1208Total 119 149 123 129 211 326 165 344 718 721 3005
Source: Thomson Financial, SDC Platinum.

405
Data Annex B: Patterns in the structure of the financial sector
The primary data used to prepare most of the tables in this annex provide information on thebanking and insurance industries in each of the 13 reference countries. The data are orientedtowards measuring the number, condition and performance of the institutions in thoseindustries.
Data were obtained from a variety of sources. Much of the banking and insurance informationwas collected from the 1999 edition of Bank Profitability, the 1998 edition of InstitutionalInvestors Statistical Yearbook and Insurance Statistics Yearbook 1990-1997. All three of thesepublications are compiled annually by the Organisation for Economic Co-operation andDevelopment (OECD). The most recent information in the publications generally reflects 1997or 1998.
The OECD, acting on behalf of the Patterns task force, also requested additional data from itscontacts. These data tended to be either from more recent years than the information availablefrom the publications or were items not reported in those publications. Although OECD sourcesprovided much of the banking and insurance data in the annex, some data were obtained directlyfrom national authorities without the assistance of the OECD, and certain other data werecollected from miscellaneous publications.
Unless noted otherwise, banking and insurance definitions and classifications are generallyconsistent with the three OECD publications. Concentration data are measured by deposits forbanks and, unless noted otherwise, by assets for insurance companies. Data are generally notaggregated to the organisation level: each institution, regardless of any common ownership, isexamined independently. Gross domestic product figures were obtained from the InternationalMonetary Fund’s International Financial Statistics, May 2000.
The data are not well suited for extensive international comparisons. The OECD states in BankProfitability that “international comparisons in the field of income and expenditure accounts ofbanks are particularly difficult due to considerable differences in OECD countries as regardsstructural and regulatory features of national banking systems, accounting rules and practices,and reporting methods.”328 Comparisons of insurance data are similarly difficult.
Some specific notes must be made regarding the data collected for individual countries. In somecases, financial figures for Japanese commercial banks exceed those for all Japanese banks. Thisapparent contradiction arises due to the data coming from different sources. The figures forJapanese commercial and large commercial banks come from the OECD, whereas the all banksfigures were complied by the Bank of Japan from the Bank of Japan Economic StatisticsQuarterly. It is noted that the figures up to 1994 were for “all banks”, but that after that, thefigures are for “domestically licensed banks”. They define “all banks” as member banks of theFederation of Bankers Associations of Japan (excluding Trust Banks that opened in or afterOctober 1993) and “domestically licensed banks” as banks which are established and licensedunder Japanese legislation.
In the United States, all banks include all insured commercial banks and thrifts. Commercialbanks include commercial banks, private banks and non-deposit trust companies. Thrifts includesavings banks and savings and loan associations. The number of new bank entrants is thenumber of new charters granted to FDIC-insured commercial banks and savings institutions.The number of branches is the number of offices, which equals the number of branches plus thenumber of institutions (the methodology implicitly assumes that each bank has one head office,which is not classified as a branch). Concentration data take into account common ownership.
328 OECD (1999a).

406
Insurance data were collected from various years of Best’s Aggregates and Averages, Life-Health and Best’s Aggregates and Averages, Property-Casualty, which are published by AMBest. Life insurance includes life and health companies, and non-life insurance includesproperty and casualty companies. In Canada, both all banks and all commercial banks includeall domestic and foreign banks.
Finally, different data were collected for the last two tables of the annex. First, data werecollected from various issues of The Banker to identify the home countries of the world’s largestbanking organisations. Rankings were based on year-end asset figures. Second, estimates of thenotional size of the global OTC derivatives market were obtained from Swaps Monitor. Thesefigures were rounded to the nearest USD 0.1 trillion and reflect balances as of year-end.Currency forwards include unmatured spot transactions and other derivatives consist of equity,commodity and credit swaps, options and forwards. Excluded from the numbers are exchange-traded instruments and internal trades. All numbers have been adjusted to eliminate double-counting.

407
Table B.1Country: United States
(concentration figures in percent, monetary values in USD billion)
1980 1990 1991 1992 1993 1994 1995 1996 1997 1998 1999
All BanksNumber of institutions 18,711 15,304 15,043 13,859 13,090 12,422 11,790 11,280 10,758 10,305 10070Number of new entrants 171 107 73 67 59 111 156 200 222Number of branches 58,491 72,346 76,484 72,082 71,546 73,397 74,637 75,768 76,753 77,796 78,928Number of employees 1863,000 1785,000 1766,000 1769,000 1731,000 1711,000 1719,000 1760,000 1841,000 1876,000Total deposits 2109.8 3664.2 3591.9 3517.7 3505.1 3572.3 3717.3 3876.7 4076.1 4,326 4472.6Year-end total assets 2614.3 4,691 4553.4 4535.2 4686.9 4,976 5273.8 5542.6 5972.8 6449.8 6783.5Average total assets 2505.8 4750.5 4622.2 4544.3 4,611 4831.4 5124.9 5408.2 5757.7 6211.3 6616.6Year-end capital andreserves
148.9 264 293.2 329.9 365.7 387.4 430.1 455.2 501.3 550.1 567.2
Deposits to assets 80.7% 78.1% 78.9% 77.6% 74.8% 71.8% 70.5% 69.9% 68.2% 67.1% 65.9%Capital to assets 5.7% 5.6% 6.4% 7.3% 7.8% 7.8% 8.2% 8.2% 8.4% 8.5% 8.4%Pre-tax income 19 18.67 26.03 48.75 66.9 71.42 79.56 85.48 96.32 98.28 116.31Pre-tax ROAA 0.76% 0.39% 0.56% 1.07% 1.45% 1.48% 1.55% 1.58% 1.67% 1.58% 1.76%Gross Domestic Product(GDP) 2795.6 5803.2 5986.2 6318.9 6642.3 7054.3 7,400.5 7813.2 8300.8 8,759.9 9,248.45Year-end assets to GDP 93.5% 80.8% 76.1% 71.8% 70.6% 70.5% 71.3% 70.9% 72.0% 73.6% 73.3%
Large Commercial BanksNumber of institutions 100 100 100 100 100 100 100 100 100 100 100Number of new entrantsNumber of branches 10,330 15,833 16,733 17,616 18,572 19,998 21,321 24,321 29,325 31,778 32,827Number of employees 578 662 649 667 695 696 722 781 885 992 1030Total deposits 759.4 1251.8 1266.1 1282.1 1355.4 1467.1 1575.8 1807.7 2126.4 2367.7 2505.9Year-end total assets 1,007 1713.6 1735.8 1809.7 1984.5 2234.6 2467.4 2807.1 3366.9 3761.5 3995.2Average total assets 962.1 1694.7 1724.7 1772.7 1897.1 2109.5 2351 2637.2 3087 3564.2 3878.3Year-end capital andreserves
44 92.8 99.8 123.7 146.7 158.5 180.6 210.1 259 300.6 318.2
Deposits to assets 75.4% 73.1% 72.9% 70.8% 68.3% 65.7% 63.9% 64.4% 63.2% 62.9% 62.7%Capital to assets 4.4% 5.4% 5.7% 6.8% 7.4% 7.1% 7.3% 7.5% 7.7% 8.0% 8.0%Pre-tax income 8.27 9.27 10.65 22.77 33.96 36.1 42.37 48.32 59.93 61.92 78.26Pre-tax ROAA 0.86% 0.55% 0.62% 1.28% 1.79% 1.71% 1.80% 1.83% 1.94% 1.74% 2.02%Gross Domestic Product(GDP)
2795.6 5803.2 5986.2 6318.9 6642.3 7054.3 7400.5 7813.2 8300.8 8759.9 9248.45
Year-end assets to GDP 36.0% 29.5% 29.0% 28.6% 29.9% 31.7% 33.3% 35.9% 40.6% 42.9% 43.2%
Sources: See notes to Annex B.

408
Table B.1 (continued)Country: United States
(concentration figures in percent, monetary values in USD billion)
1980 1990 1991 1992 1993 1994 1995 1996 1997 1998 1999
All Commercial BanksNumber of institutions 14,406 12,195 11,791 11,348 10,867 10,359 9,854 9,446 9,065 8,698 8,505Number of new entrants 205 165 106 72 61 50 102 145 188 194 n/aNumber of branches 50,804 61,377 62,494 62,842 63,317 65,211 66,518 67,389 69,185 70,304 71,383Number of employees 1,478 1,500 1,471 1,462 1478 1,471 1466 1,469 1,518 1,607 1,635Total deposits 1475.7 2,624.9 2665.5 2674.8 2730.1 2845.7 2996.5 3,163 3387.5 3640.1 3780.2Year-end total assets 1848.9 3,359 3403.4 3475.8 3673.8 3972.1 4,270 4523.6 4955.2 5370.2 5643.4Average total assets 1767.4 3,317.1 3381.2 3439.6 3574.8 3822.9 4,121 4369.8 4739.4 5162.7 5506.8Year-end capital andreserves
107.1 216.3 229.3 260.7 293.6 308.8 345.8 370.2 412 455.5 472.2
Deposits to assets 79.8% 78.1% 78.3% 77.0% 74.3% 71.6% 70.2% 69.9% 68.4% 67.8% 67.0%Capital to assets 5.8% 6.4% 6.7% 7.5% 8.0% 7.8% 8.1% 8.2% 8.3% 8.5% 8.4%Pre-tax income 18.55 23.44 25.84 46.04 62.42 66.54 74.3 79.75 89.72 92.05 109.08Pre-tax ROAA 1.05% 0.71% 0.76% 1.34% 1.75% 1.74% 1.80% 1.83% 1.89% 1.78% 1.98%Gross Domestic Product(GDP)
2,795.6 5,803.2 5986.2 6318.9 6642.3 7054.3 7400.5 7813.2 8300.8 8759.9 9248.45
Year-end assets to GDP 66.1% 57.9% 56.9% 55.0% 55.3% 56.3% 57.7% 57.9% 59.7% 61.3% 61.0%
Concentration-BanksLargest 4.23 3.73 4.02 4.04 4.2 4.45 4.68 4.94 4.87 8.57 8.18Largest 5 14.24 11.3 13.92 15.14 15.89 16.52 16.66 19.87 20.61 26.19 26.56Largest 10 20.32 17.27 20.11 21.21 23.02 24.24 25.23 28.86 29.31 35.63 36.7Largest 15 24.2 22.08 24.86 25.83 27.89 29.61 31.25 34.76 35.43 41.38 42.55
Sources: See notes to Annex B
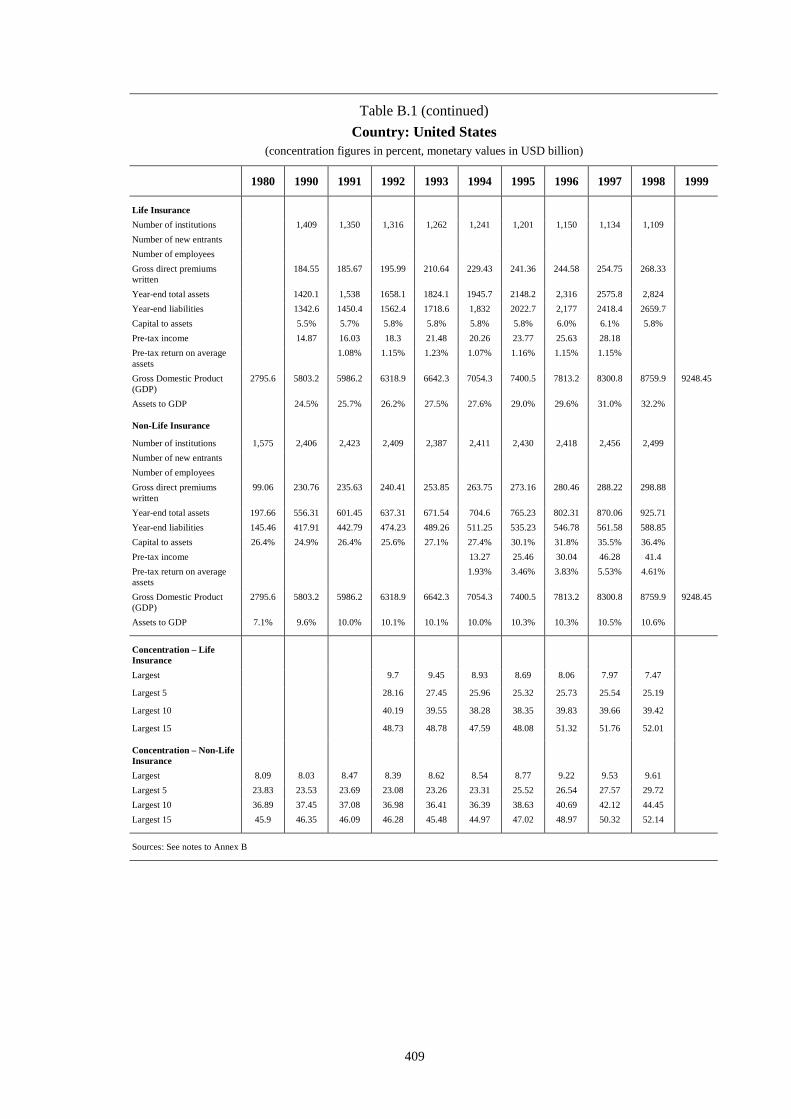
409
Table B.1 (continued)Country: United States
(concentration figures in percent, monetary values in USD billion)
1980 1990 1991 1992 1993 1994 1995 1996 1997 1998 1999
Life InsuranceNumber of institutions 1,409 1,350 1,316 1,262 1,241 1,201 1,150 1,134 1,109Number of new entrantsNumber of employeesGross direct premiumswritten
184.55 185.67 195.99 210.64 229.43 241.36 244.58 254.75 268.33
Year-end total assets 1420.1 1,538 1658.1 1824.1 1945.7 2148.2 2,316 2575.8 2,824Year-end liabilities 1342.6 1450.4 1562.4 1718.6 1,832 2022.7 2,177 2418.4 2659.7Capital to assets 5.5% 5.7% 5.8% 5.8% 5.8% 5.8% 6.0% 6.1% 5.8%Pre-tax income 14.87 16.03 18.3 21.48 20.26 23.77 25.63 28.18Pre-tax return on averageassets
1.08% 1.15% 1.23% 1.07% 1.16% 1.15% 1.15%
Gross Domestic Product(GDP)
2795.6 5803.2 5986.2 6318.9 6642.3 7054.3 7400.5 7813.2 8300.8 8759.9 9248.45
Assets to GDP 24.5% 25.7% 26.2% 27.5% 27.6% 29.0% 29.6% 31.0% 32.2%
Non-Life Insurance
Number of institutions 1,575 2,406 2,423 2,409 2,387 2,411 2,430 2,418 2,456 2,499Number of new entrantsNumber of employeesGross direct premiumswritten
99.06 230.76 235.63 240.41 253.85 263.75 273.16 280.46 288.22 298.88
Year-end total assets 197.66 556.31 601.45 637.31 671.54 704.6 765.23 802.31 870.06 925.71Year-end liabilities 145.46 417.91 442.79 474.23 489.26 511.25 535.23 546.78 561.58 588.85Capital to assets 26.4% 24.9% 26.4% 25.6% 27.1% 27.4% 30.1% 31.8% 35.5% 36.4%Pre-tax income 13.27 25.46 30.04 46.28 41.4Pre-tax return on averageassets
1.93% 3.46% 3.83% 5.53% 4.61%
Gross Domestic Product(GDP)
2795.6 5803.2 5986.2 6318.9 6642.3 7054.3 7400.5 7813.2 8300.8 8759.9 9248.45
Assets to GDP 7.1% 9.6% 10.0% 10.1% 10.1% 10.0% 10.3% 10.3% 10.5% 10.6%
Concentration – LifeInsuranceLargest 9.7 9.45 8.93 8.69 8.06 7.97 7.47
Largest 5 28.16 27.45 25.96 25.32 25.73 25.54 25.19
Largest 10 40.19 39.55 38.28 38.35 39.83 39.66 39.42
Largest 15 48.73 48.78 47.59 48.08 51.32 51.76 52.01
Concentration – Non-LifeInsuranceLargest 8.09 8.03 8.47 8.39 8.62 8.54 8.77 9.22 9.53 9.61Largest 5 23.83 23.53 23.69 23.08 23.26 23.31 25.52 26.54 27.57 29.72Largest 10 36.89 37.45 37.08 36.98 36.41 36.39 38.63 40.69 42.12 44.45Largest 15 45.9 46.35 46.09 46.28 45.48 44.97 47.02 48.97 50.32 52.14
Sources: See notes to Annex B
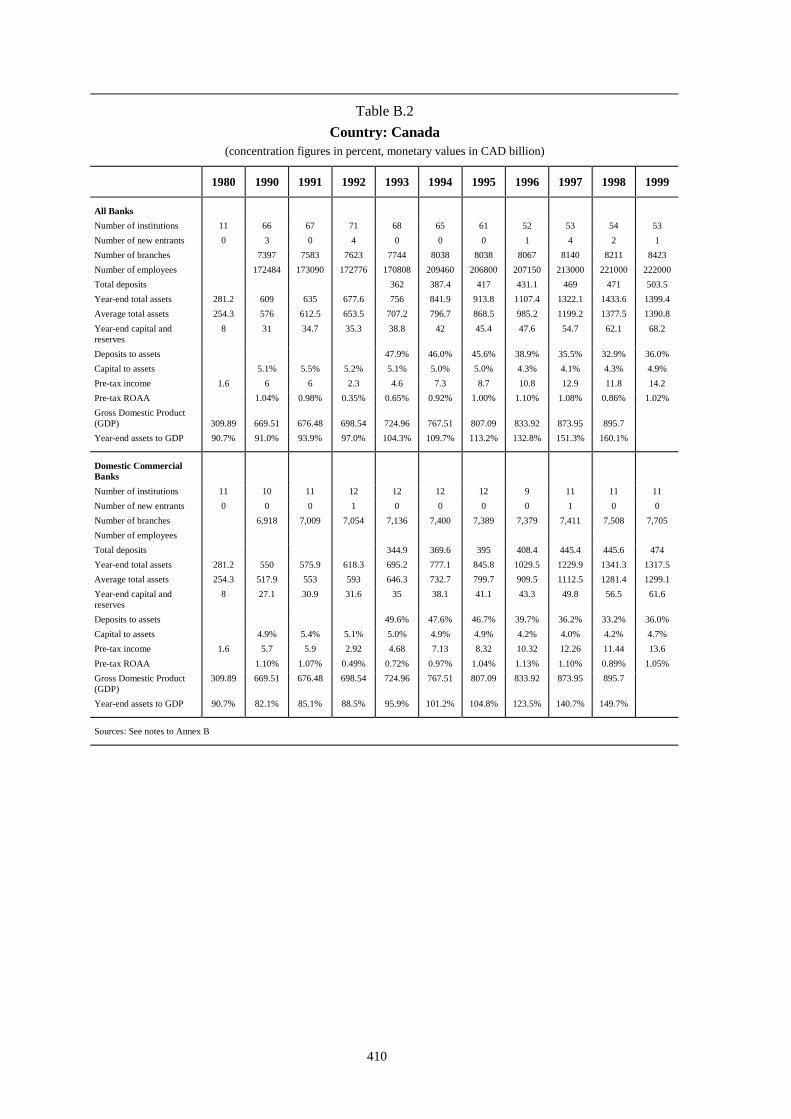
410
Table B.2Country: Canada
(concentration figures in percent, monetary values in CAD billion)
1980 1990 1991 1992 1993 1994 1995 1996 1997 1998 1999
All BanksNumber of institutions 11 66 67 71 68 65 61 52 53 54 53Number of new entrants 0 3 0 4 0 0 0 1 4 2 1Number of branches 7397 7583 7623 7744 8038 8038 8067 8140 8211 8423Number of employees 172484 173090 172776 170808 209460 206800 207150 213000 221000 222000Total deposits 362 387.4 417 431.1 469 471 503.5Year-end total assets 281.2 609 635 677.6 756 841.9 913.8 1107.4 1322.1 1433.6 1399.4Average total assets 254.3 576 612.5 653.5 707.2 796.7 868.5 985.2 1199.2 1377.5 1390.8Year-end capital andreserves
8 31 34.7 35.3 38.8 42 45.4 47.6 54.7 62.1 68.2
Deposits to assets 47.9% 46.0% 45.6% 38.9% 35.5% 32.9% 36.0%Capital to assets 5.1% 5.5% 5.2% 5.1% 5.0% 5.0% 4.3% 4.1% 4.3% 4.9%Pre-tax income 1.6 6 6 2.3 4.6 7.3 8.7 10.8 12.9 11.8 14.2Pre-tax ROAA 1.04% 0.98% 0.35% 0.65% 0.92% 1.00% 1.10% 1.08% 0.86% 1.02%Gross Domestic Product(GDP) 309.89 669.51 676.48 698.54 724.96 767.51 807.09 833.92 873.95 895.7Year-end assets to GDP 90.7% 91.0% 93.9% 97.0% 104.3% 109.7% 113.2% 132.8% 151.3% 160.1%
Domestic CommercialBanksNumber of institutions 11 10 11 12 12 12 12 9 11 11 11Number of new entrants 0 0 0 1 0 0 0 0 1 0 0Number of branches 6,918 7,009 7,054 7,136 7,400 7,389 7,379 7,411 7,508 7,705Number of employeesTotal deposits 344.9 369.6 395 408.4 445.4 445.6 474Year-end total assets 281.2 550 575.9 618.3 695.2 777.1 845.8 1029.5 1229.9 1341.3 1317.5Average total assets 254.3 517.9 553 593 646.3 732.7 799.7 909.5 1112.5 1281.4 1299.1Year-end capital andreserves
8 27.1 30.9 31.6 35 38.1 41.1 43.3 49.8 56.5 61.6
Deposits to assets 49.6% 47.6% 46.7% 39.7% 36.2% 33.2% 36.0%Capital to assets 4.9% 5.4% 5.1% 5.0% 4.9% 4.9% 4.2% 4.0% 4.2% 4.7%Pre-tax income 1.6 5.7 5.9 2.92 4.68 7.13 8.32 10.32 12.26 11.44 13.6Pre-tax ROAA 1.10% 1.07% 0.49% 0.72% 0.97% 1.04% 1.13% 1.10% 0.89% 1.05%Gross Domestic Product(GDP)
309.89 669.51 676.48 698.54 724.96 767.51 807.09 833.92 873.95 895.7
Year-end assets to GDP 90.7% 82.1% 85.1% 88.5% 95.9% 101.2% 104.8% 123.5% 140.7% 149.7%
Sources: See notes to Annex B
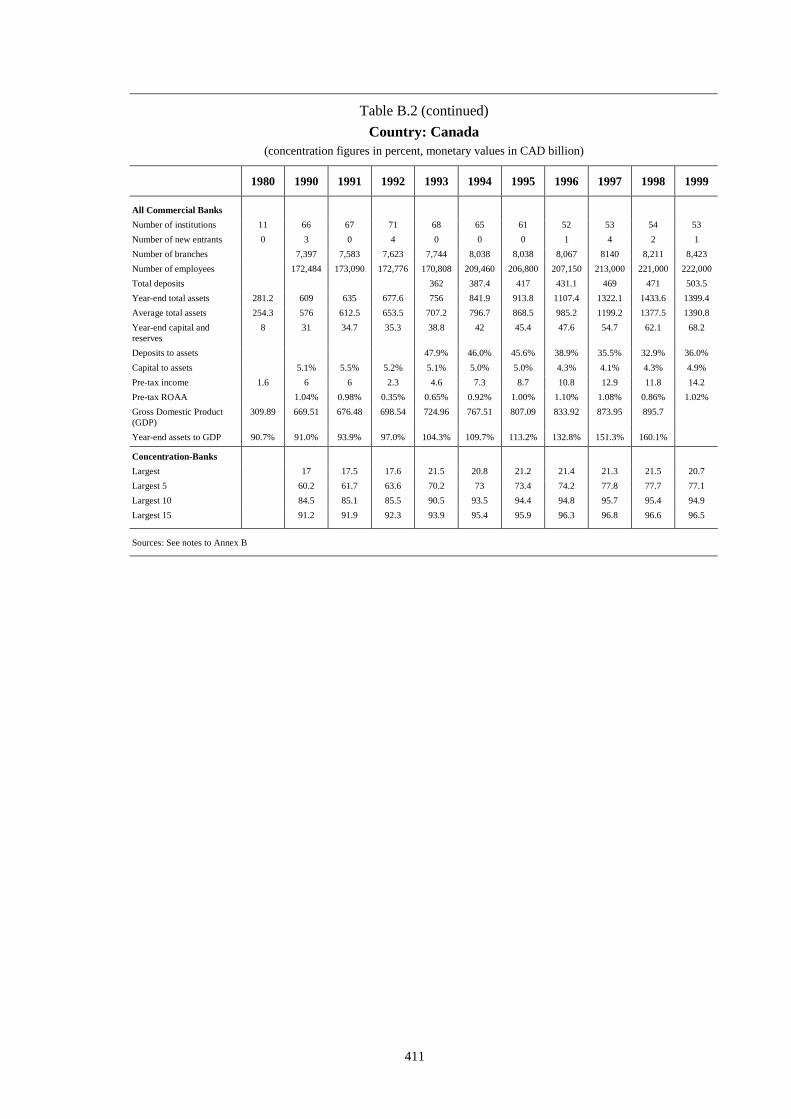
411
Table B.2 (continued)Country: Canada
(concentration figures in percent, monetary values in CAD billion)
1980 1990 1991 1992 1993 1994 1995 1996 1997 1998 1999
All Commercial BanksNumber of institutions 11 66 67 71 68 65 61 52 53 54 53Number of new entrants 0 3 0 4 0 0 0 1 4 2 1Number of branches 7,397 7,583 7,623 7,744 8,038 8,038 8,067 8140 8,211 8,423Number of employees 172,484 173,090 172,776 170,808 209,460 206,800 207,150 213,000 221,000 222,000Total deposits 362 387.4 417 431.1 469 471 503.5Year-end total assets 281.2 609 635 677.6 756 841.9 913.8 1107.4 1322.1 1433.6 1399.4Average total assets 254.3 576 612.5 653.5 707.2 796.7 868.5 985.2 1199.2 1377.5 1390.8Year-end capital andreserves
8 31 34.7 35.3 38.8 42 45.4 47.6 54.7 62.1 68.2
Deposits to assets 47.9% 46.0% 45.6% 38.9% 35.5% 32.9% 36.0%Capital to assets 5.1% 5.5% 5.2% 5.1% 5.0% 5.0% 4.3% 4.1% 4.3% 4.9%Pre-tax income 1.6 6 6 2.3 4.6 7.3 8.7 10.8 12.9 11.8 14.2Pre-tax ROAA 1.04% 0.98% 0.35% 0.65% 0.92% 1.00% 1.10% 1.08% 0.86% 1.02%Gross Domestic Product(GDP)
309.89 669.51 676.48 698.54 724.96 767.51 807.09 833.92 873.95 895.7
Year-end assets to GDP 90.7% 91.0% 93.9% 97.0% 104.3% 109.7% 113.2% 132.8% 151.3% 160.1%
Concentration-BanksLargest 17 17.5 17.6 21.5 20.8 21.2 21.4 21.3 21.5 20.7Largest 5 60.2 61.7 63.6 70.2 73 73.4 74.2 77.8 77.7 77.1Largest 10 84.5 85.1 85.5 90.5 93.5 94.4 94.8 95.7 95.4 94.9Largest 15 91.2 91.9 92.3 93.9 95.4 95.9 96.3 96.8 96.6 96.5
Sources: See notes to Annex B

412
Table B.2 (continued)Country: Canada
(concentration figures in percent, monetary values in CAD billion)
1980 1990 1991 1992 1993 1994 1995 1996 1997 1998 1999
Life InsuranceNumber of institutions 147 146 151 150 146Number of new entrants 3 5 1 1Number of employeesGross direct premiumswritten
33.91 34.56 36.18 33.55 36.61 38.47 42.32
Year-end total assets 233.7 236.79 241.25 256.23 263.74 279.92 280.48Year-end liabilities 181.14 185.2 189.02 195.41 219.87 231.07 231.16Capital to assets 22.5% 21.8% 21.6% 23.7% 16.6% 17.5%Pre-tax income 2.22 2.50 3.27 3.62 4.27 3.47 5.19Pre-tax return on averageassets
1.90% 1.06% 1.37% 1.46% 1.64% 1.28%
Gross Domestic Product(GDP)
309.89 669.51 676.48 698.54 724.96 767.51 807.09 833.92 873.95 895.7
Assets to GDP 32.2% 30.9% 29.9% 30.7% 30.2% 31.3%
Non-Life InsuranceNumber of institutions 212 224 218 213 210Number of new entrants 12 4 2 4Number of employeesGross direct premiumswritten
12.67 12.77 13.16 13.5 14.32 15.84 16.11 16.42 16.62 16.83
Year-end total assets 29.75 30.59 31.04 32.6 34.21 37.11 45.93 48.45 50.68 53.68Year-end liabilities 18.83 19.46 20.06 20.69 21.57 23 30.03 31.41 32.62 34.28Capital to assets 36.5% 36.9% 38.0% 34.6% 35.2% 35.6%Pre-tax income 1.07 1.05 0.87 1.25 0.92 1.73 2.38 2.71 1.52 1.47Pre-tax return on averageassets
3.93% 2.75% 4.85% 5.73% 5.74% 3.07%
Gross Domestic Product(GDP)
309.89 669.51 676.48 698.54 724.96 767.51 807.09 833.92 873.95 895.7
Assets to GDP 4.4% 4.5% 4.4% 4.5% 4.5% 4.6% 5.5% 5.5% 5.7%
Concentration – LifeInsuranceLargest 17.9 18.9 18.6 18.5 18.6
Largest 5 65.6 68.4 70.6 73.1 73.3
Largest 10 82.8 86.1 80.0 82.0 82.1
Largest 15 86.9 89.5 83.1 85.1 85.0
Concentration – Non-LifeInsuranceLargest
Largest 5
Largest 10
Largest 15
Sources: See notes to Annex B

413
Table B.3Country: Japan
(concentration figures in percent, monetary values in JPY billion)
1980 1990 1991 1992 1993 1994 1995 1996 1997 1998 1999
All Banks
Number of institutions 157 154 153 151 150 150 173 175 174 170
Number of new entrants
Number of branches
Number of employees
Total deposits 186,300 462,400 450,300 432,300 454,200 458,500 504,500 507,100 512,100 518,800
Year-end total assets 272,400 746,600 745,900 718,400 719,500 719,300 745,800 746,700 772,400 763,900
Average total assets 251,400 736,800 746,300 732,200 719,000 719,400 732,600 746,300 759,600 768,200
Year-end capital andreserves
8,150 28,600 30,100 30,950 31,620 32,110 31,810 28,970 28,790 35,660
Deposits to assets 68.4% 61.9% 60.4% 60.2% 63.1% 63.7% 67.6% 67.9% 66.3% 67.9%
Capital to assets 3.0% 3.8% 4.0% 4.3% 4.4% 4.5% 4.3% 3.9% 3.7% 4.7%
Pre-tax income 570 3370 2930 2210 1510 800
Pre-tax ROAA 0.23% 0.46% 0.39% 0.30% 0.21% 0.11% 0.00% 0.00% 0.00% 0.00%
Gross Domestic Product(GDP) 240,176 430,040 458,299 471,064 475,381 479,260 483,220 500,310 507,852 495211Year-end assets to GDP 113.4% 173.6% 162.8% 152.5% 151.4% 150.1% 154.3% 149.2% 152.1% 154.3%
Large Commercial BanksNumber of institutions 13 12 11 11 11 11 11 10 9 9Number of new entrantsNumber of branches 2,751 3,249 3,280 3,293 3,238 3,224 3,199 3,174 2,955 2,807Number of employees 172,647 152,000 154,000 157,000 158,000 155,000 149,000 139,400 128,600 124,525Total deposits 113,200 353,600 329,200 308,800 306,000 303,500 306,900 307,300 288,900 264,100Year-end total assets 158,000 491,600 475,000 436,100 425,800 419,300 426,300 434,000 427,200 389,600Average total assets 151,700 500,000 483,300 455,500 431,000 422,600 422,800 430,200 430,600 408,400Year-end capital andreserves
3,240 14,410 14,850 14,990 15,220 14,960 13,140 13,430 10,330 17,710
Deposits to assets 71.6% 71.9% 69.3% 70.8% 71.9% 72.4% 72.0% 70.8% 67.6% 67.8%Capital to assets 2.1% 2.9% 3.1% 3.4% 3.6% 3.6% 3.1% 3.1% 2.4% 4.5%Pre-tax income 240 1,640 1,440 940 560 60 -1340 20 -2,830 -4,040Pre-tax ROAA 0.16% 0.33% 0.30% 0.21% 0.13% 0.01% -0.32% 0.00% -0.66% -0.99%Gross Domestic Product(GDP)
240,176 430,040 458,299 471,064 475,381 479,260 483,220 500,310 507,852 495,211
Year-end assets to GDP 65.8% 114.3% 103.6% 92.6% 89.6% 87.5% 88.2% 86.7% 84.1% 78.7%
Sources: See notes to Annex B

414
Table B.3 (continued)Country: Japan
(concentration figures in percent, monetary values in JPY billion)
1980 1990 1991 1992 1993 1994 1995 1996 1997 1998 1999
All Commercial Banks
Number of institutions 147 144 143 141 140 140 139 136 136 130Number of new entrantsNumber of branches 14,325 14,632 14,782 14,804 14,823 14,693 14,597 14,395 13,817Number of employees 399,000 406,000 412,000 417,000 414,000 399,600 383,000 367,100 350,879Total deposits 201,700 573,700 555,400 535,700 536,300 539,400 541,300 542,200 522,100 495,500Year-end total assets 264,100 753,300 744,700 699,600 692,400 688,800 696,100 702,000 696,500 655,000Average total assets 253,800 758,300 749,000 722,100 696,000 690,600 692,500 699,100 699,300 675,800Year-end capital andreserves
6,740 23,970 24,900 25,390 25,860 25,800 23,310 23,890 19,650 28,600
Deposits to assets 76.4% 76.2% 74.6% 76.6% 77.5% 78.3% 77.8% 77.2% 75.0% 75.6%Capital to assets 2.6% 3.2% 3.3% 3.6% 3.7% 3.7% 3.3% 3.4% 2.8% 4.4%Pre-tax income 470 2,710 2,370 1,870 1,290 790 -1170 2370 -3480 -5120Pre-tax ROAA 0.19% 0.36% 0.32% 0.26% 0.19% 0.11% -0.17% 0.34% -0.50% -0.76%Gross Domestic Product(GDP)
240,176 430,040 458,299 471,064 475,381 479,260 483,220 500,310 507,852 495,211
Year-end assets to GDP 110.0% 175.2% 162.5% 148.5% 145.7% 143.7% 144.1% 140.3% 137.1% 132.3%
Concentration-BanksLargest 6.3 7.1 7 6.7 6.3 6.5 6.5 6.2 8.3 8.9 8.4Largest 5 28.5 31.8 31.7 30.7 30.2 30.3 29.5 29.2 31 30.9 29.8Largest 10 49 52.3 53.8 53 51.8 51.7 51 50.6 52.3 51 48.8Largest 15 61.7 64 63.7 63.2 61.8 61.3 61 60.4 60 58.2 56
Sources: See notes to Annex B

415
Table B.3 (continued)Country: Japan
(concentration figures in percent, monetary values in JPY billion)
1980 1990 1991 1992 1993 1994 1995 1996 1997 1998 1999
Life Insurance
Number of institutions 22 30 30 30 30 31 31 44 45 46 47Number of new entrants 1 0 0 0 0 1 0 13 1 1 2Number of employees 397,862 447,000 571,000 548,000 672,225 655,871 655,449 858,875 1151969 1070601Gross direct premiumswritten
8,230 27,170 28,210 29,500 30,360 30,450 30,720 29,310 30320 28840
Year-end total assetsYear-end liabilitiesCapital to assetsPre-tax incomePre-tax return on averageassetsGross Domestic Product(GDP)
240,176 430,040 458,299 471,064 475,381 479,260 483,220 500,310 507852 495211
Assets to GDP
Non-Life InsuranceNumber of institutions 62 59 59 58 55 56 58 64 65 65 64Number of new entrants 1 0 2 0 0 1 2 7 1 3 2Number of employees 793,938 1150,000 1217,000 1227,000 1165,990 1195,637 1191,987 1286,662 1272078 1279957Gross direct premiumswritten
5,580 9,100 9,380 9,530 10,140 10,180 10470 10,900 10600 10500
Year-end total assetsYear-end liabilitiesCapital to assetsPre-tax incomePre-tax return on averageassetsGross Domestic Product(GDP)
240,176 430,040 458,299 471,064 475,381 479,260 483,220 500,310 507852 495211
Assets to GDP
Concentration – LifeInsuranceLargest 23.8 21.1 20.8 20.8 20.8 20.9 21.1 21.2 22.2 22.6Largest 5 66.9 63.9 63.6 63.8 63.8 64.1 64.2 63.7 65.1 53.8Largest 10 88.6 85.4 85.1 84.9 84.7 84.8 84.8 83.7 85.0 73.6Largest 15 97.5 96.6 96.6 96.6 96.6 96.6 96.4 94.8 94.9 82.8
Concentration – Non-LifeInsuranceLargest 17.1 17.4 17.3 17.4 17.1 16.9 17.0 16.9 17.2 17.3Largest 5 48.7 55.2 55.0 54.6 54.0 53.8 53.9 53.6 53.7 53.7Largest 10 74.5 79.7 79.3 78.9 78.5 78.5 78.7 77.9 77.4 77.2
Largest 15 92.7 94.3 94.2 94.2 94.2 94.3 94.4 93.3 92.4 92.2
Sources: See notes to Annex B

416
Table B.4Country: Australia
(concentration figures in percent, monetary values in AUD billion)
1980 1990 1991 1992 1993 1994 1995 1996 1997 1998 1999
All Banks
Number of institutions 16 34 31 31 33 42 42 42 42 45 44Number of new entrants 1 2 13 3 6 5 5Number of branches 5,900 6,921 6,917 6,920 7,064 6,747 6,655 6,508 6,121 5,615 5,358Number of employeesTotal deposits 48 195.4 201.1 217.7 229.4 253.3 276.9 304.6 324.8 355.7 392.1Year-end total assets 59 348.8 360.7 374.2 393.8 426.2 472.7 520.3 569.4 629.4 697.1Average total assets 354.75 367.45 384 410 449.45 496.5 544.85 599.4 663.25Year-end capital andreserves
4 23.3 26.7 28.1 29.1 30.1 31.8 35.5 36 37.1
Deposits to assets 81.4% 56.0% 55.8% 58.2% 58.3% 59.4% 58.6% 58.5% 57.0% 56.5% 56.2%Capital to assets 6.8% 6.7% 7.4% 7.5% 7.4% 7.1% 6.7% 6.8% 6.3% 5.9%Pre-tax income 0.8 3.3 3.3 1.3 4.1 5.8 5.9 7.9 7.9 8.5Pre-tax ROAA 0.93% 0.35% 1.07% 1.41% 1.31% 1.59% 1.45% 1.42%Gross Domestic Product(GDP) 137.23 393.66 399.89 416.11 438.11 464.14 491.59 521.7 549.29 579.14Year-end assets to GDP 43.0% 88.6% 90.2% 89.9% 89.9% 91.8% 96.2% 99.7% 103.7% 108.7%
Large Commercial BanksNumber of institutions 6 4 4 4 4 4 4 4 4 4 4Number of new entrantsNumber of branches 4,500 4,961 5,481 5,626 5,468 5,125 4,966 4,783 4,398 4,147 3,960Number of employeesTotal deposits 38.7 127.5 144.6 150.1 154.7 164.9 176.1 192.1 206.7 231.3 256.0Year-end total assets 42.7 227.1 259.0 256.2 263.6 279.0 307.1 334.5 363.6 410.6 455.1Average total assets 243.05 257.60 259.90 271.30 293.05 320.80 349.05 387.10 432.85Year-end capital andreserves
3.0 19.0 22.0 23.2 23.4 24.1 25.7 26.5 25.0 27.1
Deposits to assets 90.6% 56.1% 55.8% 58.6% 58.7% 59.1% 57.3% 57.4% 56.8% 56.3% 56.3%Capital to assets 7.0% 8.4% 8.5% 9.1% 8.9% 8.6% 8.4% 7.9% 6.9% 6.6%Pre-tax income 0.8 3.6 2.4 0.7 2.9 4.6 4.5 6.2 6.5 7.0Pre-tax ROAA 0.99% 0.27% 1.12% 1.70% 1.54% 1.93% 1.86% 1.81%Gross Domestic Product(GDP)
137.23 393.66 399.89 416.11 438.11 464.14 491.59 521.7 549.29 579.14
Year-end assets to GDP 31.1% 57.7% 64.8% 61.6% 60.2% 60.1% 62.5% 64.1% 66.2% 70.9%
Sources: See notes to Annex B

417
Table B.4 (continued)Country: Australia
(concentration figures in percent, monetary values in AUD billion)
1980 1990 1991 1992 1993 1994 1995 1996 1997 1998 1999
All Commercial Banks
Number of institutions
Number of new entrants
Number of branches
Number of employees
Total deposits
Year-end total assets
Average total assets
Year-end capital andreservesDeposits to assets
Capital to assets
Pre-tax income
Pre-tax ROAA
Gross Domestic Product(GDP)
137.23 393.66 399.89 416.11 438.11 464.14 491.59 521.7 549.29 579.14
Year-end assets to GDP
Concentration-BanksLargest 27.3 19.8 25.5 23.4 23.4 21.8 20.3 20.5 20.4 20.8 21.2Largest 5 76.5 72.1 75.1 73.0 71.8 69.5 67.8 68.6 75.0 73.9 73.9Largest 10 96.7 85.1 86.5 86.8 85.0 83.2 81.7 83.7 86.7 86.5 87.0Largest 15 99.7 91.0 91.8 92.7 92.0 89.8 88.5 89.6 91.7 91.9 92.8
Sources: See notes to Annex B

418
Table B.4 (continued)Country: Australia
(concentration figures in percent, monetary values in AUD billion)
1980 1990 1991 1992 1993 1994 1995 1996 1997 1998 1999
Life InsuranceNumber of institutions 48 60 59 54 48 50 50 50 48 46Number of new entrants 1 2 1 2Number of employeesGross direct premiumswritten
2.2 18.9 18.1 18 19.9 25.3 20.8 21.2 29.2 35.2
Year-end total assets 18.6 77.9 85.3 92.9 99.2 101.4 109.3 115.1 166 164.6Year-end liabilities 148.6 153Capital to assets 10.5% 7.0%Pre-tax income 3.2 25.3 24.6 24.7 26.1 31.5 27.7 28.7 49.3 48.5Pre-tax return on averageassets
30.15% 27.72% 27.17% 31.41% 26.29% 25.58% 35.08% 29.34%
Gross Domestic Product(GDP)
137.23 393.66 399.89 416.11 438.11 464.14 491.59 521.7 549.29 579.14
Assets to GDP 13.6% 19.8% 21.3% 22.3% 22.6% 21.8% 22.2% 22.1% 30.2% 28.4%
Non-Life InsuranceNumber of institutions 201 166 157 160 161 162 166 170 172 172Number of new entrants 5 17 6 6 11 10 12 4Number of employeesGross direct premiumswritten
2.7 8.1 8.1 8.4 8.9 10.1 10.9 12.0 15.5 16.1
Year-end total assets 5.7 20.0 22.2 23.2 31.5 34.3 38.0 42.9 50.8 56.2
Year-end liabilities 4.4 14.5 15.5 16.7 22.6 25.2 27.7 31.4 37.0 42.1
Capital to assets 27.2% 25.1%
Pre-tax income 0.1 0.4 0.5 0.6 1.3 0.1 1.1 1.4 2.4 0.3
Pre-tax return on averageassets
2.37% 2.64% 4.75% 0.30% 3.04% 3.46% 5.12% 0.56%
Gross Domestic Product(GDP)
137.23 393.66 399.89 416.11 438.11 464.14 491.59 521.7 549.29 579.14
Assets to GDP 4.2% 5.1% 5.6% 5.6% 7.2% 7.4% 7.7% 8.2% 9.2% 9.7%
Concentration – LifeInsuranceLargest 37.2 32.4 33.0 28.3 28.9 26.6 27.2 25.9 32.7 27.9
Largest 5 82.2 73.5 70.9 65.8 64.1 61.5 60.0 58.3 61.6 60.0
Largest 10 91.8 87.1 85.0 81.5 80.6 78.4 76.2 76.3 76.9 76.3
Largest 15 94.9 92.6 91.8 90.7 90.5 88.3 86.7 87.2 87.1 87.7
Concentration – Non-LifeInsuranceLargest 9.9 12.0 13.9 11.5 11.5 11.7 11.3 11.3 11.2
Largest 5 34.2 31.9 38.7 28.5 29.3 26.5 26.3 27.1 26.6
Largest 10 48.7 41.7 44.2 39.9 44.7 41.2 40.8 37.5 40.9
Largest 15 58.9 55.2 75.2 62.4 57.4 51.7 52.3 50.3 50.9
Sources: See notes to Annex B

419
Table B.5Country: Belgium
(concentration figures in percent, monetary values in BEF billion)
1980 1990 1991 1992 1993 1994 1995 1996 1997 1998 1999
All Banks
Number of institutions 115 119 121 150 147 143 140 131 119 117
Number of new entrants
Number of branches 18,389 17,078 16,405 19,888 19,159 18,304 17,963 17,259
Number of employees 79,000 77,000 76,000 76,300 76,200 76,500 76,900 76,900
Total deposits 6,366 6,807 7,410 7,488 7,759 8,255 9,182 10,321 10,972 11,635
Year-end total assets 18,695 19,162 20,445 22,709 23,374 24,852 27,062 29,205 29,349 31,102
Average total assets 18,150 18,928 19,804 22,338 23,450 24,804 26,844 29,991 30,197 31,384
Year-end capital andreserves
632.7 722.0 809.0 577.6 606.3 632.5 682.4 759.0 904.9 959.4
Deposits to assets 34.1% 35.5% 36.2% 33.0% 33.2% 33.2% 33.9% 35.3% 37.4% 37.4%
Capital to assets 3.4% 3.8% 4.0% 2.5% 2.6% 2.5% 2.5% 2.6% 3.1% 3.1%
Pre-tax income 52.5 46.8 46.1 81.6 80.2 81.6 104.2 114.8 132.7
Pre-tax ROAA 0.29% 0.25% 0.23% 0.37% 0.34% 0.33% 0.39% 0.38% 0.44%
Gross Domestic Product(GDP) 3508.4 6,593 6,909 7,273 7431 7,793 8,129 8,304 8712 9,089Year-end assets to GDP 283.6% 277.3% 281.1% 305.6% 299.9% 305.7% 325.9% 335.2% 322.9%
Large Commercial Banks
Number of institutions 7 7 7 7 7 6 5
Number of new entrants
Number of branches
Number of employees
Total deposits 5,198 5,421 5,828 6,515 7,603 7,960 8,330
Year-end total assets 13,004 13,898 15,588 17,514 19,715 21,067 23,941
Average total assets 12,833 13,802 15,117 17,008 19,657 21,137 23,693
Year-end capital andreserves
363.1 385.6 408.7 451.9 538.3 667.3 728.3
Deposits to assets 40.0% 39.0% 37.4% 37.2% 38.6% 37.8% 34.8%
Capital to assets 2.8% 2.8% 2.6% 2.6% 2.7% 3.2% 3.0%
Pre-tax income 51.1 52.2 60.4 75.4 82.2 90.9
Pre-tax ROAA 0.40% 0.38% 0.40% 0.44% 0.42% 0.43%
Gross Domestic Product(GDP)
3508.4 6,593 6,909 7,273 7431 7793 8129 8304 8712 9,089
Year-end assets to GDP 175.0% 178.3% 191.8% 210.9% 226.3% 231.8%
Sources: See notes to Annex B
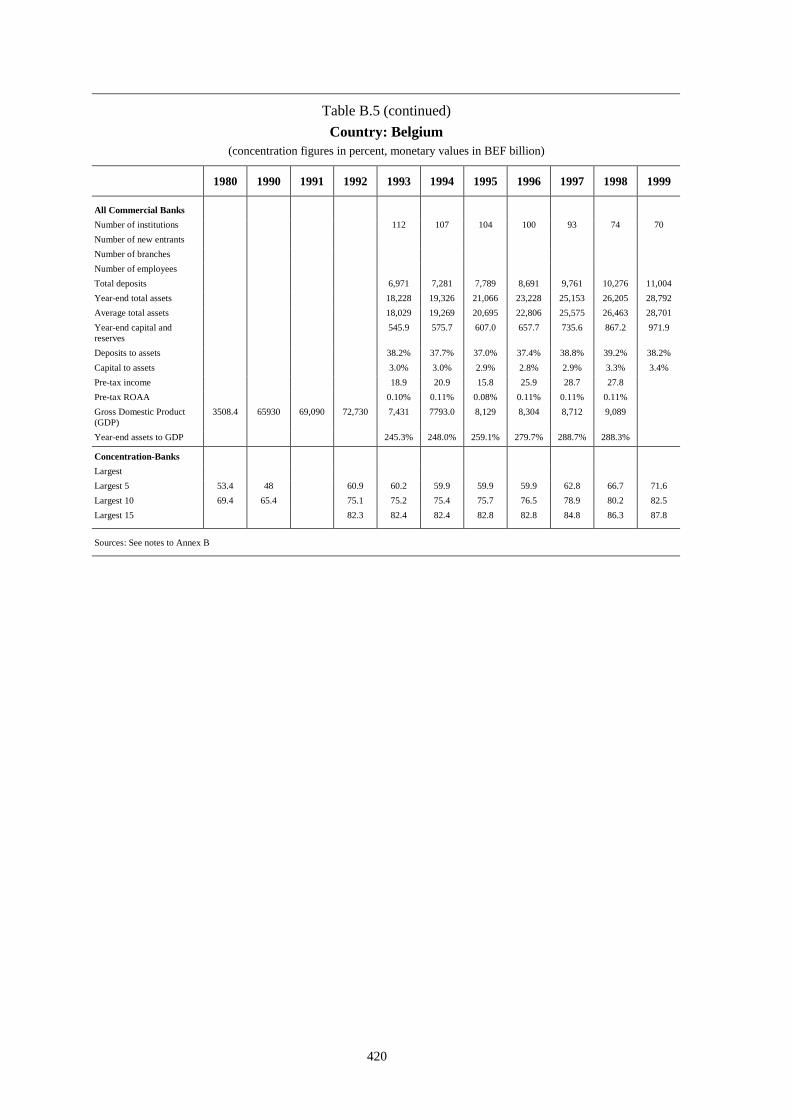
420
Table B.5 (continued)Country: Belgium
(concentration figures in percent, monetary values in BEF billion)
1980 1990 1991 1992 1993 1994 1995 1996 1997 1998 1999
All Commercial BanksNumber of institutions 112 107 104 100 93 74 70Number of new entrantsNumber of branchesNumber of employeesTotal deposits 6,971 7,281 7,789 8,691 9,761 10,276 11,004Year-end total assets 18,228 19,326 21,066 23,228 25,153 26,205 28,792Average total assets 18,029 19,269 20,695 22,806 25,575 26,463 28,701Year-end capital andreserves
545.9 575.7 607.0 657.7 735.6 867.2 971.9
Deposits to assets 38.2% 37.7% 37.0% 37.4% 38.8% 39.2% 38.2%Capital to assets 3.0% 3.0% 2.9% 2.8% 2.9% 3.3% 3.4%Pre-tax income 18.9 20.9 15.8 25.9 28.7 27.8Pre-tax ROAA 0.10% 0.11% 0.08% 0.11% 0.11% 0.11%Gross Domestic Product(GDP)
3508.4 65930 69,090 72,730 7,431 7793.0 8,129 8,304 8,712 9,089
Year-end assets to GDP 245.3% 248.0% 259.1% 279.7% 288.7% 288.3%
Concentration-BanksLargestLargest 5 53.4 48 60.9 60.2 59.9 59.9 59.9 62.8 66.7 71.6Largest 10 69.4 65.4 75.1 75.2 75.4 75.7 76.5 78.9 80.2 82.5Largest 15 82.3 82.4 82.4 82.8 82.8 84.8 86.3 87.8
Sources: See notes to Annex B

421
Table B.5 (continued)Country: Belgium
(concentration figures in percent, monetary values in BEF billion)
1980 1990 1991 1992 1993 1994 1995 1996 1997 1998 1999
Life Insurance
Number of institutions 38 40 43 42 31 30 27 27
Number of new entrants
Number of employees
Gross direct premiumswritten
104.7 114.3 122.4 137 161.9 184.4 214.3 254.3
Year-end total assets
Year-end liabilities
Capital to assets
Pre-tax income
Pre-tax return on averageassetsGross Domestic Product(GDP)
3508.4 6,593 6,909 7,273 7,431 7,793 8,129 8,304 8,712 9,089
Assets to GDP
Non-Life Insurance
Number of institutions 176 176 169 163 93 90 92 93
Number of new entrants
Number of employees
Gross direct premiumswritten
200.2 214.4 233.9 244.6 241.7 248.3 252.6 249.4
Year-end total assets
Year-end liabilities
Capital to assets
Pre-tax income
Pre-tax return on averageassetsGross Domestic Product(GDP)
3508.4 6,593 6,909 7,273 7,431 7,793 8,129 8,304 8,712 9,089
Assets to GDP
Concentration – LifeInsuranceLargest
Largest 5
Largest 10
Largest 15
Concentration – Non-LifeInsuranceLargest
Largest 5
Largest 10
Largest 15
Sources: See notes to Annex B
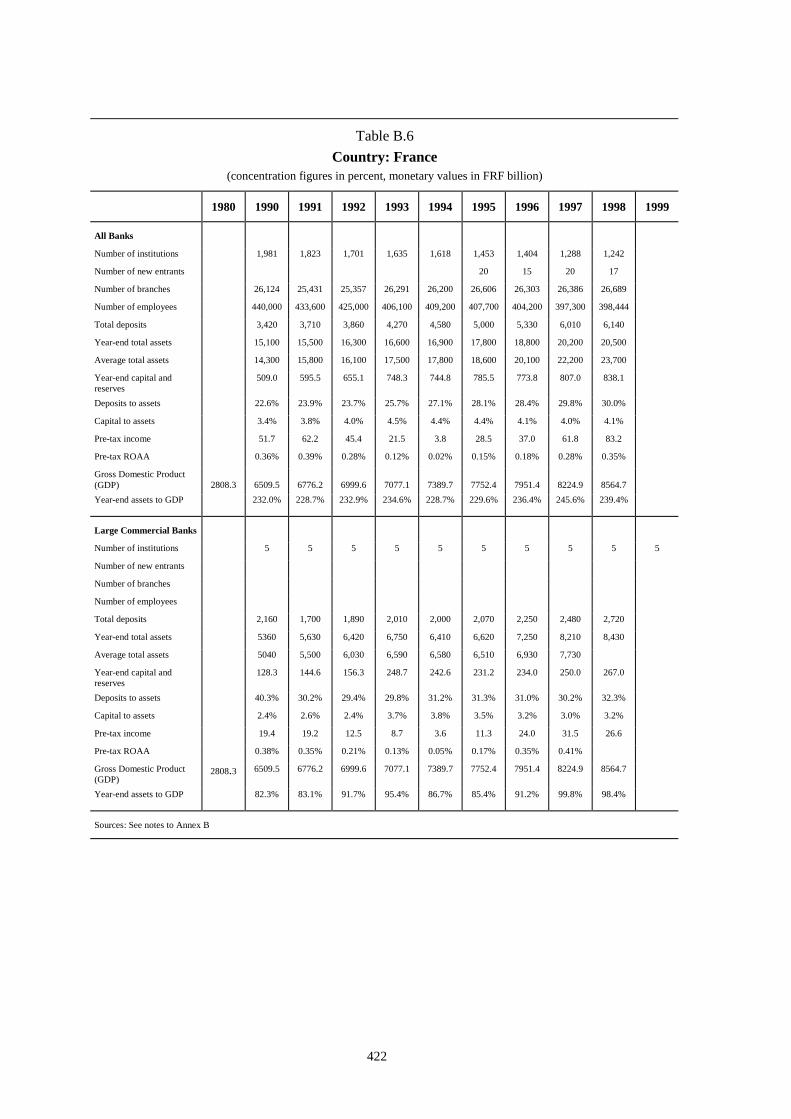
422
Table B.6Country: France
(concentration figures in percent, monetary values in FRF billion)
1980 1990 1991 1992 1993 1994 1995 1996 1997 1998 1999
All Banks
Number of institutions 1,981 1,823 1,701 1,635 1,618 1,453 1,404 1,288 1,242
Number of new entrants 20 15 20 17
Number of branches 26,124 25,431 25,357 26,291 26,200 26,606 26,303 26,386 26,689
Number of employees 440,000 433,600 425,000 406,100 409,200 407,700 404,200 397,300 398,444
Total deposits 3,420 3,710 3,860 4,270 4,580 5,000 5,330 6,010 6,140
Year-end total assets 15,100 15,500 16,300 16,600 16,900 17,800 18,800 20,200 20,500
Average total assets 14,300 15,800 16,100 17,500 17,800 18,600 20,100 22,200 23,700
Year-end capital andreserves
509.0 595.5 655.1 748.3 744.8 785.5 773.8 807.0 838.1
Deposits to assets 22.6% 23.9% 23.7% 25.7% 27.1% 28.1% 28.4% 29.8% 30.0%
Capital to assets 3.4% 3.8% 4.0% 4.5% 4.4% 4.4% 4.1% 4.0% 4.1%
Pre-tax income 51.7 62.2 45.4 21.5 3.8 28.5 37.0 61.8 83.2
Pre-tax ROAA 0.36% 0.39% 0.28% 0.12% 0.02% 0.15% 0.18% 0.28% 0.35%
Gross Domestic Product(GDP) 2808.3 6509.5 6776.2 6999.6 7077.1 7389.7 7752.4 7951.4 8224.9 8564.7Year-end assets to GDP 232.0% 228.7% 232.9% 234.6% 228.7% 229.6% 236.4% 245.6% 239.4%
Large Commercial Banks
Number of institutions 5 5 5 5 5 5 5 5 5 5
Number of new entrants
Number of branches
Number of employees
Total deposits 2,160 1,700 1,890 2,010 2,000 2,070 2,250 2,480 2,720
Year-end total assets 5360 5,630 6,420 6,750 6,410 6,620 7,250 8,210 8,430
Average total assets 5040 5,500 6,030 6,590 6,580 6,510 6,930 7,730
Year-end capital andreserves
128.3 144.6 156.3 248.7 242.6 231.2 234.0 250.0 267.0
Deposits to assets 40.3% 30.2% 29.4% 29.8% 31.2% 31.3% 31.0% 30.2% 32.3%
Capital to assets 2.4% 2.6% 2.4% 3.7% 3.8% 3.5% 3.2% 3.0% 3.2%
Pre-tax income 19.4 19.2 12.5 8.7 3.6 11.3 24.0 31.5 26.6
Pre-tax ROAA 0.38% 0.35% 0.21% 0.13% 0.05% 0.17% 0.35% 0.41%
Gross Domestic Product(GDP)
2808.3 6509.5 6776.2 6999.6 7077.1 7389.7 7752.4 7951.4 8224.9 8564.7
Year-end assets to GDP 82.3% 83.1% 91.7% 95.4% 86.7% 85.4% 91.2% 99.8% 98.4%
Sources: See notes to Annex B

423
Table B.6 (continued)Country: France
(concentration figures in percent, monetary values in FRF billion)
1980 1990 1991 1992 1993 1994 1995 1996 1997 1998 1999
All Commercial Banks
Number of institutions 408 414 409 415 421 413 400 398 383
Number of new entrants
Number of branches 10,166 10,177 10,081 10,451 10,131 10,320 10,240 9,983 10,118
Number of employees 243,100 238,700 232,300 219,200 218,000 213600 208,700 207,900 206,630
Total deposits 1,660 1,770 1,840 2,000 2,060 2,240 2,420 2,860 2,910
Year-end total assets 7,890 8,060 9,000 9,190 9,080 9,430 10,160 11,590 11,570
Average total assets 7,490 8,190 8,580 10,070 10,190 10,400 11,270 13,420 15,040
Year-end capital andreserves
203.7 235.3 276.2 303.9 308.2 307.6 315.2 340.0 394.5
Deposits to assets 21.0% 22.0% 20.4% 21.8% 22.7% 23.8% 23.8% 24.7% 25.2%
Capital to assets 2.6% 2.9% 3.1% 3.3% 3.4% 3.3% 3.1% 2.9% 3.4%
Pre-tax income 16.04 20.08 5.52 -3.01 -18.82 9.80 3.81 15.47 27.58
Pre-tax ROAA 0.21% 0.25% 0.06% -0.03% -0.18% 0.09% 0.03% 0.12% 0.18%
Gross Domestic Product(GDP)
2808.3 6509.5 6776.2 6999.6 7077.1 7389.7 7752.4 7951.4 8224.9 8564.7
Year-end assets to GDP 121.2% 118.9% 128.6% 129.9% 122.9% 121.6% 127.8% 140.9% 135.1%
Concentration-Banks
Largest
Largest 5 51.9 67.8 67.2 67.5 68.1 68.1 68.8 70.2 70.2 69.3
Largest 10 65.6 82.8 82.5 83.4 84.1 84.1 84.6 85.3 85.2 84.6
Largest 15
Sources: See notes to Annex B

424
Table B.6 (continued)Country: France
(concentration figures in percent, monetary values in FRF billion)
1980 1990 1991 1992 1993 1994 1995 1996 1997 1998 1999
Life InsuranceNumber of institutions 80 141 149 147 143 138 138 140 138 135 126Number of new entrantsNumber of employeesGross direct premiumswritten
29.5 206.3 235.3 269.7 331.9 399.1 443.1 493.6 539.4 458.6 524.1
Year-end total assets 115.3 970.0 1,188.1 1,391.7 1,691.9 2,002.4 2,259.9 2,722.9 3,199.8 3,586.4 4,251.1Year-end liabilities 112.1 927.5 1,129.4 1,335.7 1,620.7 1,905.9 2,266.2 2,680.9 3,158.7 3,529.4 4,076.5Capital to assets 4.4% 4.9% 4.0% 4.2% 4.8% -0.3% 1.5% 1.3% 1.6%Pre-tax income 1.5 9.2 10.1 9.8 9.7 9.0 8.1 8.7 14.0 15.2 19.5Pre-tax return on averageassets
1.70% 0.94% 0.76% 0.63% 0.49% 0.38% 0.35% 0.47% 0.45% 0.50%
Gross Domestic Product(GDP)
2808.3 6509.5 6776.2 6999.6 7077.1 7389.7 7752.4 7951.4 8224.9 8564.7
Assets to GDP 4.1% 14.9% 17.5% 19.9% 23.9% 27.1% 29.2% 34.2% 38.9% 41.9%
Non-Life InsuranceNumber of institutions 388 463 489 467 466 356 345 343 312 307 300Number of new entrantsNumber of employeesGross direct premiumswritten
86.1 201.8 214.6 234.2 250.8 268.9 278.2 277.6 274.4 271.2 278.0
Year-end total assets 108.2 364.6 386.9 431.3 456.3 486.3 465.0 479.7 550.6 553.7 596.0Year-end liabilities 126.3 323.5 339.4 383.4 401.8 415.1 432.4 448.3 470.6 492.7 550.8Capital to assets 11.3% 12.3% 11.1% 11.9% 14.6% 7.0% 6.5% 14.5% 11.0%Pre-tax income 1.7 12.2 5.2 1.6 1.5 1.0 7.3 14.0 15.1 8.6 11.0Pre-tax return on averageassets
5.16% 1.38% 0.39% 0.34% 0.21% 1.53% 2.96% 2.93% 1.56% 1.91%
Gross Domestic Product(GDP)
2808.3 6509.5 6776.2 6999.6 7077.1 7389.7 7752.4 7951.4 8224.9 8564.7
Assets to GDP 3.9% 5.6% 5.7% 6.2% 6.4% 6.6% 6.0% 6.0% 6.7% 6.5%
Concentration – LifeInsuranceLargest 12.8 15.0 15.6 18.0 17.8 18.4 19.8 19.7 22.0 20.0
Largest 5 48.2 48.9 51.3 49.2 48.5 49.6 53.9 53.2 58.4 56.0
Largest 10 68.3 68.8 75.5 69.7 68.9 69.7 73.4 75.5 80.2 79.0
Largest 15 78.9 79.3 87.5 80.3 79.8 81.8 84.8 86.5 91.6 90.0
Concentration – Non-LifeInsuranceLargest 10.0 9.9 9.9 9.4 9.8 10.7 16.4 16.7 15.5 16.0
Largest 5 41.6 41.1 40.6 39.9 40.9 42.9 46.1 56.2 58.0 56.0
Largest 10 62.0 61.4 60.1 59.2 60.6 65.4 66.8 75.5 77.0 75.0
Largest 15 76.2 75.5 73.5 72.9 74.4 80.2 80.6 85.0 86.5 85.0
1 Estimate.
Sources: See notes to Annex B

425
Table B.7Country: Germany
(concentration figures in percent, monetary values in DEM billion)
1980 1990 1991 1992 1993 1994 1995 1996 1997 1998 1999
All BanksNumber of institutions 4,719 4,460 4,200 4,038 3,872 3,784 3,674 3,577 3,403 3,167Number of new entrants 9 21Number of branches 44,345 44,863 49,186 49,118 48,721 48,224 47,741 47,026 45,227 44,443Number of employees 695,900 756,100 750,100 751,100 750,800Total deposits 2,010 2,198 2,354 2,784 2,850 3,002 3,286 3,567 3,820Year-end total assets 3,861 4,202 4,573 5,451 5,812 6,380 7,083 7,909 8,734Average total assets 3,626 3,993 4,360 5,062 5561 5,951 6,693 7,507 8,388Year-end capital andreserves
146.4 161.7 187.4 217.6 246.5 267.6 287.9 321.6 340.7
Deposits to assets 52.1% 52.3% 51.5% 51.1% 49.0% 47.1% 46.4% 45.1% 43.7%Capital to assets 3.8% 3.8% 4.1% 4.0% 4.2% 4.2% 4.1% 4.1% 3.9%Pre-tax income 17.47 23.30 24.67 29.58 29.04 33.63 35.43 35.06 59.21Pre-tax ROAA 0.48% 0.58% 0.57% 0.58% 0.52% 0.57% 0.53% 0.47% 0.71%Gross Domestic Product(GDP) 1470.9 2429.40 2936.87 3075.60 3234.74 3394.32 3520.52 3584.62 3667.23 3784.37Year-end assets to GDP 158.9% 143.1% 148.7% 168.5% 171.2% 181.2% 197.6% 215.7% 230.8%
Large Commercial Banks
Number of institutions 6 4 4 3 3 3 3 3 4 4Number of new entrants 1Number of branches 3,105 3,043 3,036 3,598 3,621 3,624 3,579 3,553 4,353Number of employeesTotal deposits 343.8 402.1 423.6 473.3 431.9 473.1 570.8 682.3 719.9Year-end total assets 604.3 670.3 717.3 808.2 851.6 988.6 1149.9 1412.9 1738.9Average total assets 563.2 641.3 694.4 768.8 829.9 911.8 1099.4 1340.1 1665.6Year-end capital andreserves
31.3 34.26 38.06 42.12 46.45 50.52 55.27 65.15 67.36
Deposits to assets 56.9% 60.0% 59.1% 58.6% 50.7% 47.9% 49.6% 48.3% 41.4%Capital to assets 5.2% 5.1% 5.3% 5.2% 5.5% 5.1% 4.8% 4.6% 3.9%Pre-tax income 4.67 4.79 4.88 4.40 4.81 4.24 5.47 3.80 22.42Pre-tax ROAA 0.83% 0.75% 0.70% 0.57% 0.58% 0.47% 0.50% 0.28% 1.35%Gross Domestic Product(GDP)
1470.9 2429.40 2936.87 3075.6 3234.74 3394.32 3520.52 3584.62 3667.23 3784.37
Year-end assets to GDP 24.9% 22.8% 23.3% 25.0% 25.1% 28.1% 32.1% 38.5% 45.9%
Sources: See notes to Annex B
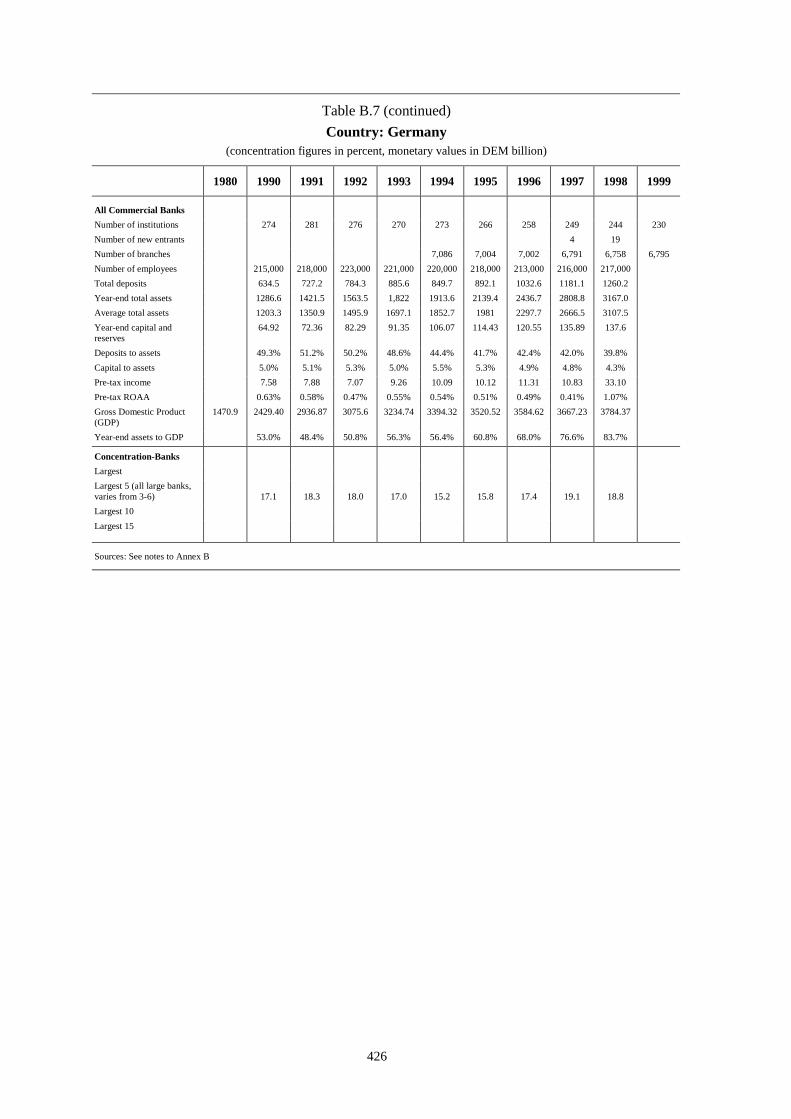
426
Table B.7 (continued)Country: Germany
(concentration figures in percent, monetary values in DEM billion)
1980 1990 1991 1992 1993 1994 1995 1996 1997 1998 1999
All Commercial BanksNumber of institutions 274 281 276 270 273 266 258 249 244 230Number of new entrants 4 19Number of branches 7,086 7,004 7,002 6,791 6,758 6,795Number of employees 215,000 218,000 223,000 221,000 220,000 218,000 213,000 216,000 217,000Total deposits 634.5 727.2 784.3 885.6 849.7 892.1 1032.6 1181.1 1260.2Year-end total assets 1286.6 1421.5 1563.5 1,822 1913.6 2139.4 2436.7 2808.8 3167.0Average total assets 1203.3 1350.9 1495.9 1697.1 1852.7 1981 2297.7 2666.5 3107.5Year-end capital andreserves
64.92 72.36 82.29 91.35 106.07 114.43 120.55 135.89 137.6
Deposits to assets 49.3% 51.2% 50.2% 48.6% 44.4% 41.7% 42.4% 42.0% 39.8%Capital to assets 5.0% 5.1% 5.3% 5.0% 5.5% 5.3% 4.9% 4.8% 4.3%Pre-tax income 7.58 7.88 7.07 9.26 10.09 10.12 11.31 10.83 33.10Pre-tax ROAA 0.63% 0.58% 0.47% 0.55% 0.54% 0.51% 0.49% 0.41% 1.07%Gross Domestic Product(GDP)
1470.9 2429.40 2936.87 3075.6 3234.74 3394.32 3520.52 3584.62 3667.23 3784.37
Year-end assets to GDP 53.0% 48.4% 50.8% 56.3% 56.4% 60.8% 68.0% 76.6% 83.7%
Concentration-BanksLargestLargest 5 (all large banks,varies from 3-6) 17.1 18.3 18.0 17.0 15.2 15.8 17.4 19.1 18.8Largest 10Largest 15
Sources: See notes to Annex B

427
Table B.7 (continued)Country: Germany
(concentration figures in percent, monetary values in DEM billion)
1980 1990 1991 1992 1993 1994 1995 1996 1997 1998 1999
Life Insurance
Number of institutions 381 338 342 326 327 319 323 320 319 318 314Number of new entrants 4 n/a n/a n/a 3 3 7 5 4 4 5Number of employees 64,792 68,462 66,492 66,926 64,145 62,822 63,350 57,733 60,023 61,838Gross direct premiumswritten
32.63 60.10 67.60 72.84 80.16 87.46 92.26 97.63 102.27 106.66 116.47
Year-end total assets 207.10 531.12 584.34 619.72 680.11 739.58 801.80 875.34 948.72 1027.10 1116.98Year-end liabilities 192.42 510.43 562.65 600.13 656.77 715.97 778.29 848.15 919.94 994.14 1074.17Capital to assets 7.1% 3.9% 3.7% 3.2% 3.4% 3.2% 2.9% 3.1% 3.0% 3.2% 3.8%Pre-tax income 0.72 1.00 1.00 1.00 2.00 2.00 2.00 3.00 3.00 2.31Pre-tax return on averageassets
0.23% 0.24% 0.19% 0.26% 0.26% 0.18% 0.28% 0.29% 0.22%
Gross Domestic Product(GDP)
1470.90 2429.40 2936.87 3075.60 3234.74 3394.32 3520.52 3584.62 3667.23 3784.37
Assets to GDP 14.1% 21.9% 19.9% 20.1% 21.0% 21.8% 22.8% 24.4% 25.9% 27.1%
Non-Life InsuranceNumber of institutions 395 399 407 410 403 334 337 334 331 328 327Number of new entrants 7 n/a n/a n/a 6 7 3 8 5 12 8Number of employees n/a 158,966 181,014 183,207 183,246 181,510 164,531 155,122 152,733 150,858 160,398Gross direct premiumswritten
46.24 83.48 97.29 106.78 117.87 126.79 134.18 136.69 138.39 137.73 144.59
Year-end total assets 60.66 132.88 141.10 153.47 169.76 190.68 216.23 242.34 265.89 289.83 312.09Year-end liabilities 47.94 132.97 144.53 157.58 174.14 192.67 215.99 241.02 263.02 283.7 305.22Capital to assets 21.0% -0.1% -2.4% -2.7% -2.6% -1.0% 0.1% 0.5% 1.1% 2.1% 2.2%Pre-tax income n/a 3.874 2.674 2.928 4.120 5.456 6.946 8.122 9.208 9.744 11.518Pre-tax return on averageassets
1.95% 1.99% 2.55% 3.03% 3.41% 3.54% 3.62% 3.51% 3.83%
Gross Domestic Product(GDP)
1470.90 2429.40 2936.87 3075.60 3234.74 3394.32 3520.52 3584.62 3667.23 3784.37
Assets to GDP 4.1% 5.5% 4.8% 5.0% 5.2% 5.6% 6.1% 6.8% 7.3% 7.7%
Concentration – LifeInsuranceLargest 12.1 11.7 11.8 12.3 12.4 12.3 12.2 12.2 13.4 13.2Largest 5 29.9 29.1 29.4 29.6 29.5 29.5 29.1 28.9 29.9 29.4Largest 10 43.9 42.5 43.4 43.6 43.5 44.3 43.9 43.6 45.5 43.8Largest 15 54.2 52.5 53.4 54.2 54.2 54.9 54.0 54.2 55.8 54.6
Concentration – Non-LifeInsuranceLargest 8.2 8.0 7.6 7.5 7.4 7.1 7.1 6.9 9.2 9.1Largest 5 20.5 20.0 19.7 19.5 19.5 19.4 19.9 20.1 22.7 22.5Largest 10 31.7 31.3 30.9 30.8 31.1 31.1 31.4 31.3 33.1 33.5Largest 15 40.3 40.1 40.0 40.0 40.5 40.2 40.0 39.7 41.0 41.3
Sources: See notes to Annex B

428
Table B.8Country: Italy
(concentration figures in percent, monetary values in ITL billion)
1980 1990 1991 1992 1993 1994 1995 1996 1997 1998 1999
All Banks
Number of institutions 379 368 351 335 284 271 264 255 248 239
Number of new entrants
Number of branches 14,711 16,309 17,582 18,926 19,925 20,840 21,438 22,323 23,217 24,048
Number of employees 330,900 336,600 337,300 340,000 338,500 337,500 327,100 322,200 316,600 311,000
Total deposits 751,260 819,280 851,220 919,110 922,390 934,380 949,690 880,490 876,194 898,900
Year-end total assets 1699,000 1938,100 2254,100 2412,200 2464,900 2530,000 2680,600 2810,600 2859,700 3046,200
Average total assets 1547,600 1705,300 2033,400 2250,000 2363,900 2408,600 2504,100 2658,200 2807,000 2844,300
Year-end capital andreserves
92,700 122,100 147,900 155,300 165,600 164,300 168,800 174,800 186,900 201,800
Deposits to assets 44.2% 42.3% 37.8% 38.1% 37.4% 36.9% 35.4% 31.3% 30.6% 29.5%
Capital to assets 5.5% 6.3% 6.6% 6.4% 6.7% 6.5% 6.3% 6.2% 6.5% 6.6%
Pre-tax income 15,460 159,90 14,290 18,200 6,590 8,620 12480 8730 25,200 29,300
Pre-tax ROAA 1.00% 0.94% 0.70% 0.81% 0.28% 0.36% 0.50% 0.33% 0.90% 1.03%
Gross Domestic Product(GDP) 387,670 1310,660 1427,570 1502,490 1550,300 1638,670 1772,250 1872,630 1950,680 2034,560Year-end assets to GDP 129.6% 135.8% 150.0% 155.6% 150.4% 142.8% 143.1% 144.1% 140.6%
Large Commercial Banks
Number of institutions 26 25 26 26 26 24 24 24 24 24
Number of new entrants
Number of branches 7,059 7,976 8,939 10,088 10,881 11,456 11,803 12,334 12,566 12,770
Number of employees 184,100 190,200 193,600 194,300 200,500 205,900 201,700 195,300 191,400 184,000
Total deposits 387,176 425,571 453,402 463,734 518,852 546,011 569,070 535,553 540,420 549,670
Year-end total assets 851,326 941,527 1131,501 1200,268 1347,600 1528,410 1635,772 1700,250 1745,496 1868,810
Average total assets 829,485 696,427 1036,514 1165,885 1273,934 1455,612 1545,469 1620,708 1708,720 1775,870
Year-end capital andreserves
47,161 68,188 82,951 86,394 93,758 94,432 98,466 101,642 108,230 118,384
Deposits to assets 45.5% 45.2% 40.1% 38.6% 38.5% 35.7% 34.8% 31.5% 31.0% 29.4%
Capital to assets 5.5% 7.2% 7.3% 7.2% 7.0% 6.2% 6.0% 6.0% 6.2% 6.3%
Pre-tax income 7,105 7,074 5,901 8,709 1,996 2,802 4,960 1870 15,982 20,549
Pre-tax ROAA 0.86% 1.02% 0.57% 0.75% 0.16% 0.19% 0.32% 0.12% 0.94% 1.16%
Gross Domestic Product(GDP)
387,670 1310,660 1427,570 1502,490 1550,300 1638,670 1772,250 1872,630 1950,680 2034,560
Year-end assets to GDP 65.0% 66.0% 75.3% 77.4% 82.2% 86.2% 87.4% 87.2% 85.8%
Sources: See notes to Annex B

429
Table B.8 (continued)Country: Italy
(concentration figures in percent, monetary values in ITL billion)
1980 1990 1991 1992 1993 1994 1995 1996 1997 1998 1999
All Commercial Banks
Number of institutions
Number of new entrants
Number of branches
Number of employees
Total deposits
Year-end total assets
Average total assets
Year-end capital andreservesDeposits to assets
Capital to assets
Pre-tax income
Pre-tax ROAA
Gross Domestic Product(GDP)
387,670 1310,660 1427,570 1502,490 1550,300 1638,670 1772,250 1872,630 1950,680 2034,560
Year-end assets to GDP
Concentration-BanksLargestLargest 5 25.9 26.9 27.7 33.8 33.6 32.8 38.3 39.3Largest 10 37.5 38.5 40.1 49.7 50.0 48.8 54.6 56.7Largest 15 46.2 47.3 48.8 58.4 59.1 57.8 62.3 65.0
Sources: See notes to Annex B

430
Table B.8 (continued)Country: Italy
(concentration figures in percent, monetary values in ITL billion)
1980 1990 1991 1992 1993 1994 1995 1996 1997 1998 1999
Life Insurance
Number of institutions 62 71 74 76 77 83 87
Number of new entrants
Number of employees
Gross direct premiumswritten
8.677 10.957 12.508 15.143 18.625 23.055 25.817 36.682
Year-end total assets
Year-end liabilities
Capital to assets
Pre-tax income
Pre-tax return on averageassetsGross Domestic Product(GDP)
387,670 1310,660 1427,570 1502,490 1550,300 1638,670 1772,250 1872,630 1950,680 2034,560
Assets to GDP
Non-Life Insurance
Number of institutions 164 166 162 166 155 154 156 143
Number of new entrants
Number of employees
Gross direct premiumswritten
25.509 29.157 32.845 35.110 36.793 38.761 40.855 43.618
Year-end total assets
Year-end liabilities
Capital to assets
Pre-tax income
Pre-tax return on averageassetsGross Domestic Product(GDP)
387,670 1310,660 1427,570 1502,490 1550,300 1638,670 1772,250 1872,630 1950,680 2034,560
Assets to GDP
Concentration – LifeInsuranceLargest
Largest 5
Largest 10
Largest 15
Concentration – Non-LifeInsuranceLargest
Largest 5
Largest 10
Largest 15
Sources: See notes to Annex B
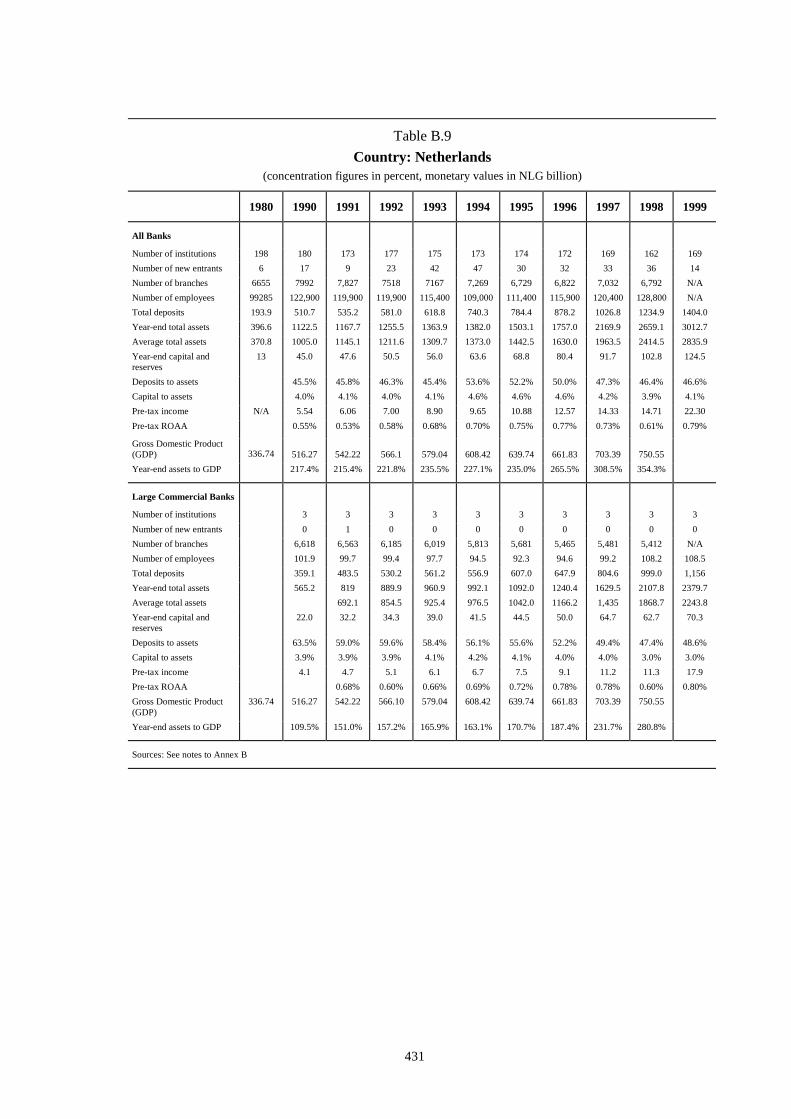
431
Table B.9Country: Netherlands
(concentration figures in percent, monetary values in NLG billion)
1980 1990 1991 1992 1993 1994 1995 1996 1997 1998 1999
All Banks
Number of institutions 198 180 173 177 175 173 174 172 169 162 169Number of new entrants 6 17 9 23 42 47 30 32 33 36 14Number of branches 6655 7992 7,827 7518 7167 7,269 6,729 6,822 7,032 6,792 N/ANumber of employees 99285 122,900 119,900 119,900 115,400 109,000 111,400 115,900 120,400 128,800 N/ATotal deposits 193.9 510.7 535.2 581.0 618.8 740.3 784.4 878.2 1026.8 1234.9 1404.0Year-end total assets 396.6 1122.5 1167.7 1255.5 1363.9 1382.0 1503.1 1757.0 2169.9 2659.1 3012.7Average total assets 370.8 1005.0 1145.1 1211.6 1309.7 1373.0 1442.5 1630.0 1963.5 2414.5 2835.9Year-end capital andreserves
13 45.0 47.6 50.5 56.0 63.6 68.8 80.4 91.7 102.8 124.5
Deposits to assets 45.5% 45.8% 46.3% 45.4% 53.6% 52.2% 50.0% 47.3% 46.4% 46.6%Capital to assets 4.0% 4.1% 4.0% 4.1% 4.6% 4.6% 4.6% 4.2% 3.9% 4.1%Pre-tax income N/A 5.54 6.06 7.00 8.90 9.65 10.88 12.57 14.33 14.71 22.30Pre-tax ROAA 0.55% 0.53% 0.58% 0.68% 0.70% 0.75% 0.77% 0.73% 0.61% 0.79%
Gross Domestic Product(GDP) 336.74 516.27 542.22 566.1 579.04 608.42 639.74 661.83 703.39 750.55Year-end assets to GDP 217.4% 215.4% 221.8% 235.5% 227.1% 235.0% 265.5% 308.5% 354.3%
Large Commercial Banks
Number of institutions 3 3 3 3 3 3 3 3 3 3Number of new entrants 0 1 0 0 0 0 0 0 0 0Number of branches 6,618 6,563 6,185 6,019 5,813 5,681 5,465 5,481 5,412 N/ANumber of employees 101.9 99.7 99.4 97.7 94.5 92.3 94.6 99.2 108.2 108.5Total deposits 359.1 483.5 530.2 561.2 556.9 607.0 647.9 804.6 999.0 1,156Year-end total assets 565.2 819 889.9 960.9 992.1 1092.0 1240.4 1629.5 2107.8 2379.7Average total assets 692.1 854.5 925.4 976.5 1042.0 1166.2 1,435 1868.7 2243.8Year-end capital andreserves
22.0 32.2 34.3 39.0 41.5 44.5 50.0 64.7 62.7 70.3
Deposits to assets 63.5% 59.0% 59.6% 58.4% 56.1% 55.6% 52.2% 49.4% 47.4% 48.6%Capital to assets 3.9% 3.9% 3.9% 4.1% 4.2% 4.1% 4.0% 4.0% 3.0% 3.0%Pre-tax income 4.1 4.7 5.1 6.1 6.7 7.5 9.1 11.2 11.3 17.9Pre-tax ROAA 0.68% 0.60% 0.66% 0.69% 0.72% 0.78% 0.78% 0.60% 0.80%Gross Domestic Product(GDP)
336.74 516.27 542.22 566.10 579.04 608.42 639.74 661.83 703.39 750.55
Year-end assets to GDP 109.5% 151.0% 157.2% 165.9% 163.1% 170.7% 187.4% 231.7% 280.8%
Sources: See notes to Annex B

432
Table B.9 (continued)Country: Netherlands
(concentration figures in percent, monetary values in NLG billion)
1980 1990 1991 1992 1993 1994 1995 1996 1997 1998 1999
All Commercial Banks
Number of institutions
Number of new entrants
Number of branches
Number of employees
Total deposits
Year-end total assets
Average total assets
Year-end capital andreservesDeposits to assets
Capital to assets
Pre-tax income
Pre-tax ROAA
Gross Domestic Product(GDP)
336.74 516.27 542.22 566.1 579.04 608.42 639.74 661.83 703.39 750.55
Year-end assets to GDP
Concentration-BanksLargest 50.0 66.4 66.9 66.2 65.7 65.4 64.7 67.7 70.7 69.1Largest 5 73.7 77.9 77.9 77.0 76.7 76.1 75.4 79.4 81.7 82.2Largest 10 84.0 85.8 86.8 86.2 86.2 85.6 84.9 87.9 90.2 90.8Largest 15 87.8 89.3 90.7 90.1 90.2 89.7 89.6 92.0 93.9 94.1
Sources: See notes to Annex B

433
Table B.9 (continued)Country: Netherlands
(concentration figures in percent, monetary values in NLG billion)
1980 1990 1991 1992 1993 1994 1995 1996 1997 1998 1999
Life Insurance
Number of institutions 84 96 96 97 98 95 96 99 107 108 109Number of new entrants 2 0 4 2 5 5 3 6 9 3 4Number of employeesGross direct premiumswritten
7.29 21.08 24.10 25.15 25.50 27.47 30.13 33.18 37.54 42.75
Year-end total assets 67.86 190.46 215.15 235.14 267.02 286.19 315.49 351.92 402.71 458.00Year-end liabilities 63.04 178.26 199.95 218.36 242.81 262.42 285.83 311.27 351.59 394.82Capital to assetsPre-tax income 1.24 1.95 2.19 2.37 2.62 2.87 3.67 4.25 4.79 5.20Pre-tax return on averageassetsGross Domestic Product(GDP)
336.74 516.27 542.22 566.1 579.04 608.42 639.74 661.83 703.39 750.55
Assets to GDP 20.2 36.9 39.7 41.5 46.1 47.0 49.3 53.2 57.3 61.0
Non-Life Insurance
Number of institutions 372 385 385 391 393 314 280 288 286 294 291Number of new entrants 5 12 9 11 9 19 10 16 8 15 11Number of employees
Gross direct premiumswritten
8.58 19.65 20.23 22.09 23.96 26.08 27.38 28.74 30.08 31.93
Year-end total assets 10.52 29.60 31.56 33.38 36.66 39.87 46.47 53.03 59.94 65.54
Year-end liabilities 8.01 20.58 21.65 22.77 25.05 27.70 33.03 36.85 40.24 42.96
Capital to assets
Pre-tax income 0.84 1.17 1.39 1.05 0.57 0.95 2.00 2.04 2.460 1.75
Pre-tax return on averageassetsGross Domestic Product(GDP)
336.74 516.27 542.22 566.10 579.04 608.42 639.74 661.83 703.39 750.55
Assets to GDP 3.1 5.7 5.8 5.9 6.3 6.6 7.3 8.0 8.5 8.7
Concentration – LifeInsuranceLargest 25.9 25.0 25.7 25.9 26.2 25.4 26.5 26.0 26.3
Largest 5 65.7 63.3 63.6 63.3 63.1 61.4 60.5 59.0 57.7
Largest 10 77.5 75.3 76.1 75.9 76.0 74.6 74.3 73.0 71.7
Largest 15 83.5 81.6 82.8 83.2 83.8 82.9 82.8 81.3 79.8
Concentration – Non-LifeInsuranceLargest 13.2 12.1 11.6 10.3 9.3 10.4 11.0 11.5 11.8
Largest 5 38.7 35.4 33.9 30.1 27.2 29.1 29.6 31.1 30.1
Largest 10 57.5 52.6 50.4 44.7 40.5 42.5 43.0 44.0 43.1
Largest 15 70.9 64.9 62.1 55.1 49.9 51.3 52.4 53.2 52.3
Sources: See notes to Annex B
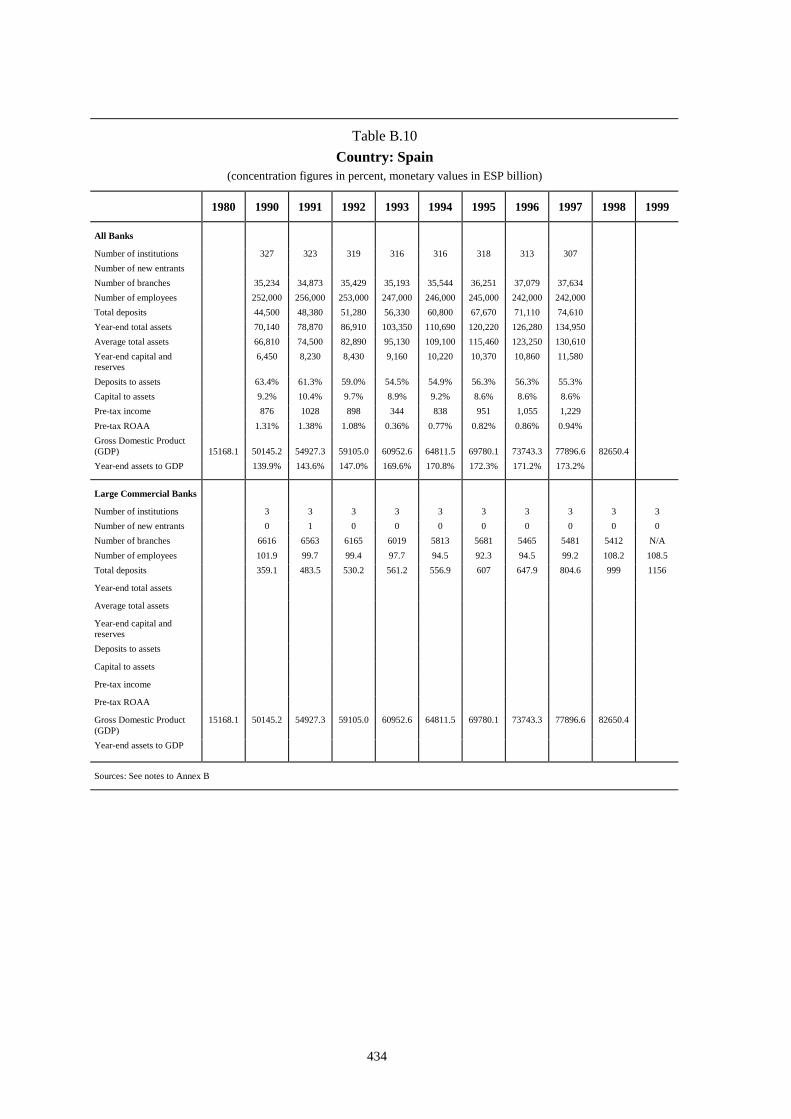
434
Table B.10Country: Spain
(concentration figures in percent, monetary values in ESP billion)
1980 1990 1991 1992 1993 1994 1995 1996 1997 1998 1999
All Banks
Number of institutions 327 323 319 316 316 318 313 307Number of new entrantsNumber of branches 35,234 34,873 35,429 35,193 35,544 36,251 37,079 37,634Number of employees 252,000 256,000 253,000 247,000 246,000 245,000 242,000 242,000Total deposits 44,500 48,380 51,280 56,330 60,800 67,670 71,110 74,610Year-end total assets 70,140 78,870 86,910 103,350 110,690 120,220 126,280 134,950Average total assets 66,810 74,500 82,890 95,130 109,100 115,460 123,250 130,610Year-end capital andreserves
6,450 8,230 8,430 9,160 10,220 10,370 10,860 11,580
Deposits to assets 63.4% 61.3% 59.0% 54.5% 54.9% 56.3% 56.3% 55.3%Capital to assets 9.2% 10.4% 9.7% 8.9% 9.2% 8.6% 8.6% 8.6%Pre-tax income 876 1028 898 344 838 951 1,055 1,229Pre-tax ROAA 1.31% 1.38% 1.08% 0.36% 0.77% 0.82% 0.86% 0.94%Gross Domestic Product(GDP) 15168.1 50145.2 54927.3 59105.0 60952.6 64811.5 69780.1 73743.3 77896.6 82650.4Year-end assets to GDP 139.9% 143.6% 147.0% 169.6% 170.8% 172.3% 171.2% 173.2%
Large Commercial Banks
Number of institutions 3 3 3 3 3 3 3 3 3 3Number of new entrants 0 1 0 0 0 0 0 0 0 0Number of branches 6616 6563 6165 6019 5813 5681 5465 5481 5412 N/ANumber of employees 101.9 99.7 99.4 97.7 94.5 92.3 94.5 99.2 108.2 108.5Total deposits 359.1 483.5 530.2 561.2 556.9 607 647.9 804.6 999 1156
Year-end total assets
Average total assets
Year-end capital andreservesDeposits to assets
Capital to assets
Pre-tax income
Pre-tax ROAA
Gross Domestic Product(GDP)
15168.1 50145.2 54927.3 59105.0 60952.6 64811.5 69780.1 73743.3 77896.6 82650.4
Year-end assets to GDP
Sources: See notes to Annex B

435
Table B.10 (continued)Country: Spain
(concentration figures in percent, monetary values in ESP billion)
1980 1990 1991 1992 1993 1994 1995 1996 1997 1998 1999
All Commercial Banks
Number of institutions 154 160 164 164 165 170 165 159
Number of new entrants
Number of branches 16,917 17,824 18,058 17,636 17,557 17,842 17,674 17,530
Number of employees 157,000 162,000 159,000 153,000 151,000 149,000 143,000 139,000
Total deposits 23,800 26,140 26,650 28,840 30,470 34,550 34,920 36,360
Year-end total assets 42,640 49,690 53,530 66,710 70,400 75,960 78,050 82,950
Average total assets 40,690 46,160 51,610 60,120 70,630 73,180 77,000 80,500
Year-end capital andreserves
4,230 5,720 5,640 6,000 6,640 6,560 6,560 6,740
Deposits to assets 55.8% 52.6% 49.8% 43.2% 43.3% 45.5% 44.7% 43.8%
Capital to assets 9.9% 11.5% 10.5% 9.0% 9.4% 8.6% 8.4% 8.1%
Pre-tax income 620 720 580 6 480 530 560 640
Pre-tax ROAA 1.52% 1.56% 1.12% 0.01% 0.68% 0.72% 0.73% 0.80%
Gross Domestic Product(GDP)
15168.1 50145.2 54927.3 59105.0 60952.6 64811.5 69780.1 73743.3 77896.6 82650.4
Year-end assets to GDP 85.0% 90.5% 90.6% 109.4% 108.6% 108.9% 105.8% 106.5%
Concentration-Banks
Largest
Largest 5 38.1 38.3 46.3 45.6 43.6 48.5 48.2 48.4 47.2
Largest 10 56.4 60.2 58.3 61.8 61.3 60.4 62.0 62.0 62.4 61.8
Largest 15
Sources: See notes to Annex B

436
Table B.10 (continued)Country: Spain
(concentration figures in percent, monetary values in ESP billion)
1980 1990 1991 1992 1993 1994 1995 1996 1997 1998 1999
Life Insurance
Number of institutions 72 75 68 61 62 59 58 57
Number of new entrants
Number of employees
Gross direct premiumswritten
546.9 767.0 811.8 878.3 1441.6 1372.6 1635.6 1908.0
Year-end total assets
Year-end liabilities
Capital to assets
Pre-tax income
Pre-tax return on averageassetsGross Domestic Product(GDP)
15168.1 50145.2 54927.3 59105.0 60952.6 64811.5 69780.1 73743.3 77896.6 82650.4
Assets to GDP
Non-Life Insurance
Number of institutions 294 338 315 299 278 254 246 236Number of new entrantsNumber of employeesGross direct premiumswritten
1225.1 1398.6 1606.2 1742.1 1865.0 1980.7 2080.5 2122.9
Year-end total assetsYear-end liabilitiesCapital to assetsPre-tax incomePre-tax return on averageassetsGross Domestic Product(GDP)
15168.1 50145.2 54927.3 59105.0 60952.6 64811.5 69780.1 73743.3 77896.6 82650.4
Assets to GDP
Concentration – LifeInsuranceLargest
Largest 5
Largest 10
Largest 15
Concentration – Non-LifeInsuranceLargest
Largest 5
Largest 10
Largest 15
Sources: See notes to Annex B

437
Table B.11Country: Sweden
(concentration figures in percent, monetary values in SEK billion)
1980 1990 1991 1992 1993 1994 1995 1996 1997 1998 1999
All Banks
Number of institutions 598 498 450 108 109 112 116 124 124 126Number of new entrants 1 1 7 7 6 3 4Number of branches 3,659 3,251 3,064 2,910 2,825 2,690 2,601 2,530 2,522 2,197Number of employees 45,329 45,520 44,216 41,329 43,203 43,305 43,328 43,201 43,531Total deposits 666 702 705 735 752 765 838 904 947Year-end total assets 1,630 1,596 1,519 1,455 1,457 1,585 1,862 2,145 2,410Average total assets 1,536 1,593 1,577 1,482 1,491 1,515 1,799 2,047 2,353Year-end capital andreserves
97 87 75 83 82 97 98 122 129
Deposits to assets 40.9% 44.0% 46.4% 50.5% 51.6% 48.3% 45.0% 42.1% 39.3%Capital to assets 6.0% 5.5% 4.9% 5.7% 5.6% 6.1% 5.3% 5.7% 5.4%Pre-tax income 3 49 13 5 16 21 23 14 21Pre-tax ROAA 0.20% 3.08% 0.82% 0.34% 1.07% 1.39% 1.28% 0.68% 0.89%Gross Domestic Product(GDP)
528.26 1359.88 1447.33 1441.72 1446.20 1531.10 1649.90 1688.20 1738.90 1800.58
Year-end assets to GDP 119.9% 110.3% 105.4% 100.6% 95.2% 96.1% 110.3% 123.4% 133.8%
Large Commercial Banks
Number of institutions
Number of new entrants
Number of branches
Number of employees
Total deposits
Year-end total assets
Average total assets
Year-end capital andreservesDeposits to assets
Capital to assets
Pre-tax income
Pre-tax ROAA
Gross Domestic Product(GDP)
528.26 1359.88 1447.33 1441.72 1446.20 1531.10 1649.90 1688.20 1738.90 1800.58
Year-end assets to GDP
Sources: See notes to Annex B

438
Table B.11 (continued)Country: Sweden
(concentration figures in percent, monetary values in SEK billion)
1980 1990 1991 1992 1993 1994 1995 1996 1997 1998 1999
All Commercial Banks
Number of institutions 14 12 9 8 9 10 13 15 15 16
Number of new entrants 0 0 0 0 0 2 3 1 1 1
Number of branches 1,493 1,345 1,288 1,872 2,474 2,327 2,239 2,202 2,165 1,823
Number of employees 20,058 25,000 25,100 28,400 37,200 39,100 39,000 39,000 39,200 38,647
Total deposits 165 440.7 504 536 717.8 731.9 754.9 788.3 860.7 866.1
Year-end total assets 297 1264.6 1207.7 1153.5 1353.8 1344.6 1459.4 1730.4 1987 2188.6
Average total assets 1202.6 1254.8 1209.5 1383.1 1383.4 1431.4 1670.2 1897.4 2153.1
Year-end capital andreserves
13 71.3 65.4 52.9 73.3 72.5 86 85 105.6 109.9
Deposits to assets 34.8% 41.7% 46.5% 53.0% 54.4% 51.7% 45.6% 43.3% 39.6%
Capital to assets 5.6% 5.4% 4.6% 5.4% 5.4% 5.9% 4.9% 5.3% 5.0%
Pre-tax income 0.8 2.6 35.7 3 2.1 13.5 19 21.7 11.8 19.1
Pre-tax ROAA 0.22% 2.85% 0.25% 0.15% 0.98% 1.33% 1.30% 0.62% 0.89%
Gross Domestic Product(GDP)
528.26 1359.88 1447.33 1441.72 1446.2 1531.1 1649.9 1688.2 1738.9 1800.58
Year-end assets to GDP 56.2% 93.0% 83.4% 80.0% 93.6% 87.8% 88.5% 102.5% 114.3% 121.5%
Concentration-Banks
Largest 22 18 19 22 22 24 21 21 26 22Largest 5 62 67 86 85 86 84 81 87 84Largest 10 76 83 93 93 93 92 90 91 90Largest 15 82 90 95 95 95 94 92 93 92
Sources: See notes to Annex B
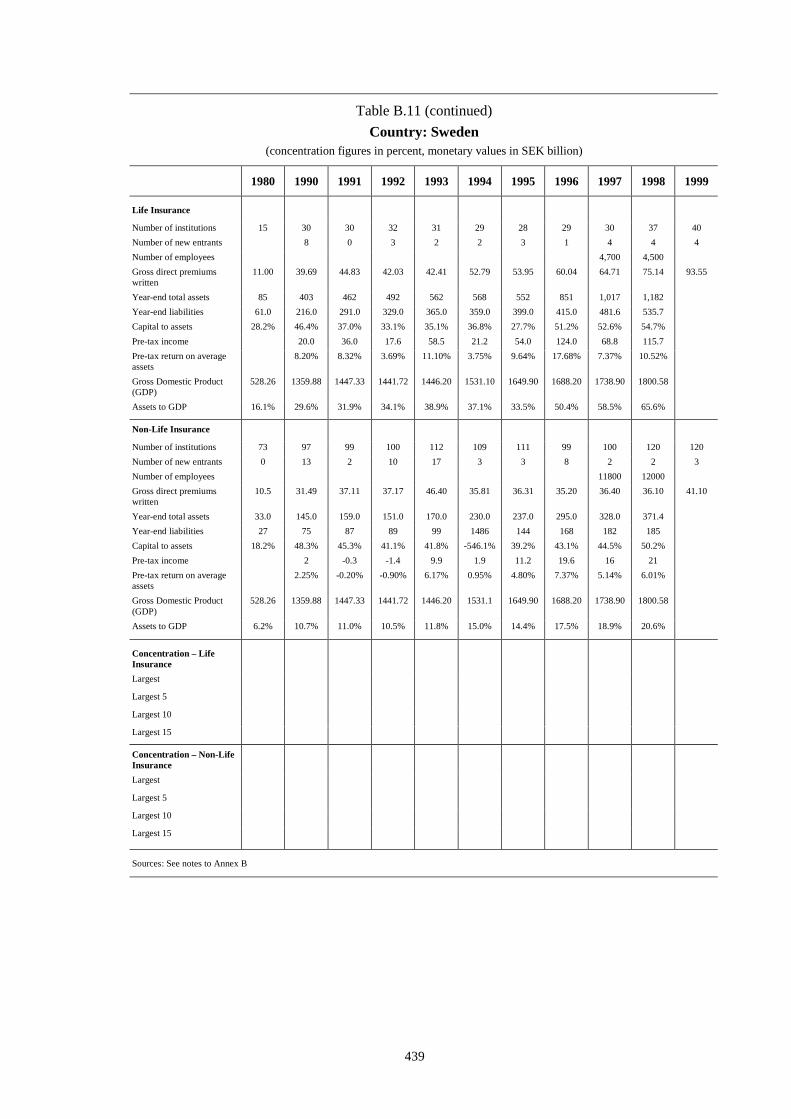
439
Table B.11 (continued)Country: Sweden
(concentration figures in percent, monetary values in SEK billion)
1980 1990 1991 1992 1993 1994 1995 1996 1997 1998 1999
Life Insurance
Number of institutions 15 30 30 32 31 29 28 29 30 37 40Number of new entrants 8 0 3 2 2 3 1 4 4 4Number of employees 4,700 4,500Gross direct premiumswritten
11.00 39.69 44.83 42.03 42.41 52.79 53.95 60.04 64.71 75.14 93.55
Year-end total assets 85 403 462 492 562 568 552 851 1,017 1,182Year-end liabilities 61.0 216.0 291.0 329.0 365.0 359.0 399.0 415.0 481.6 535.7Capital to assets 28.2% 46.4% 37.0% 33.1% 35.1% 36.8% 27.7% 51.2% 52.6% 54.7%Pre-tax income 20.0 36.0 17.6 58.5 21.2 54.0 124.0 68.8 115.7Pre-tax return on averageassets
8.20% 8.32% 3.69% 11.10% 3.75% 9.64% 17.68% 7.37% 10.52%
Gross Domestic Product(GDP)
528.26 1359.88 1447.33 1441.72 1446.20 1531.10 1649.90 1688.20 1738.90 1800.58
Assets to GDP 16.1% 29.6% 31.9% 34.1% 38.9% 37.1% 33.5% 50.4% 58.5% 65.6%
Non-Life Insurance
Number of institutions 73 97 99 100 112 109 111 99 100 120 120Number of new entrants 0 13 2 10 17 3 3 8 2 2 3Number of employees 11800 12000Gross direct premiumswritten
10.5 31.49 37.11 37.17 46.40 35.81 36.31 35.20 36.40 36.10 41.10
Year-end total assets 33.0 145.0 159.0 151.0 170.0 230.0 237.0 295.0 328.0 371.4Year-end liabilities 27 75 87 89 99 1486 144 168 182 185Capital to assets 18.2% 48.3% 45.3% 41.1% 41.8% -546.1% 39.2% 43.1% 44.5% 50.2%Pre-tax income 2 -0.3 -1.4 9.9 1.9 11.2 19.6 16 21Pre-tax return on averageassets
2.25% -0.20% -0.90% 6.17% 0.95% 4.80% 7.37% 5.14% 6.01%
Gross Domestic Product(GDP)
528.26 1359.88 1447.33 1441.72 1446.20 1531.1 1649.90 1688.20 1738.90 1800.58
Assets to GDP 6.2% 10.7% 11.0% 10.5% 11.8% 15.0% 14.4% 17.5% 18.9% 20.6%
Concentration – LifeInsuranceLargest
Largest 5
Largest 10
Largest 15
Concentration – Non-LifeInsuranceLargest
Largest 5
Largest 10
Largest 15
Sources: See notes to Annex B
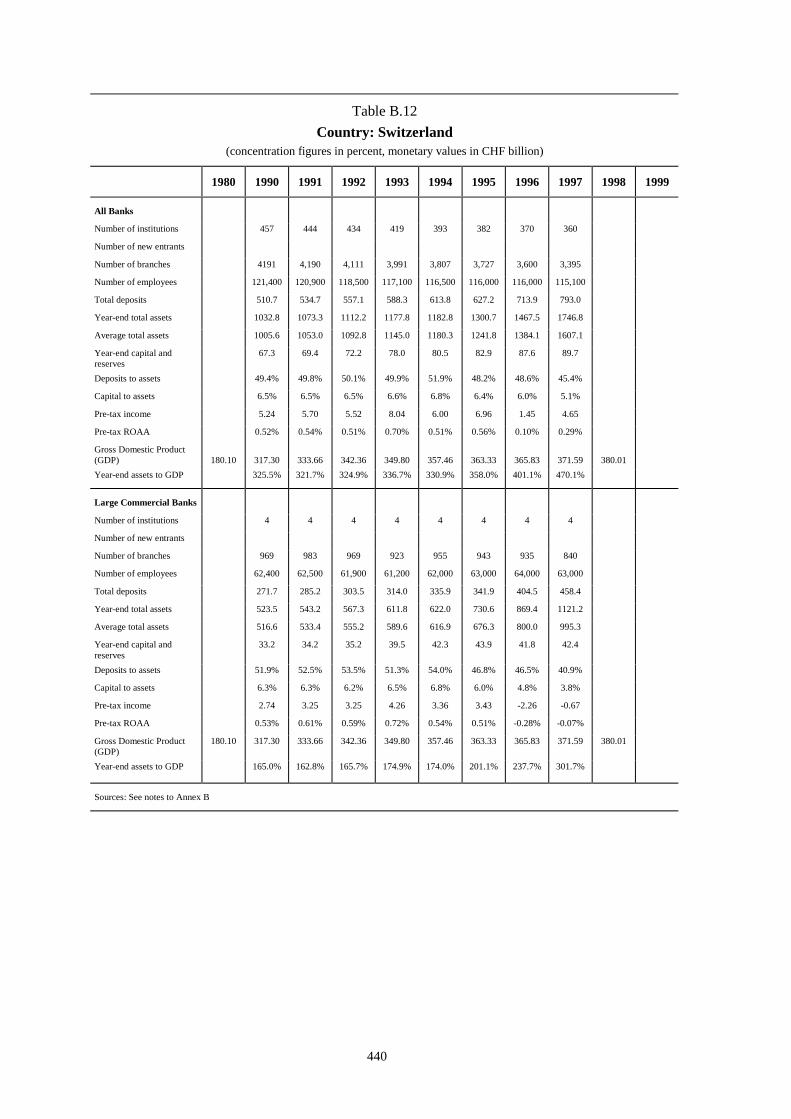
440
Table B.12Country: Switzerland
(concentration figures in percent, monetary values in CHF billion)
1980 1990 1991 1992 1993 1994 1995 1996 1997 1998 1999
All Banks
Number of institutions 457 444 434 419 393 382 370 360
Number of new entrants
Number of branches 4191 4,190 4,111 3,991 3,807 3,727 3,600 3,395
Number of employees 121,400 120,900 118,500 117,100 116,500 116,000 116,000 115,100
Total deposits 510.7 534.7 557.1 588.3 613.8 627.2 713.9 793.0
Year-end total assets 1032.8 1073.3 1112.2 1177.8 1182.8 1300.7 1467.5 1746.8
Average total assets 1005.6 1053.0 1092.8 1145.0 1180.3 1241.8 1384.1 1607.1
Year-end capital andreserves
67.3 69.4 72.2 78.0 80.5 82.9 87.6 89.7
Deposits to assets 49.4% 49.8% 50.1% 49.9% 51.9% 48.2% 48.6% 45.4%
Capital to assets 6.5% 6.5% 6.5% 6.6% 6.8% 6.4% 6.0% 5.1%
Pre-tax income 5.24 5.70 5.52 8.04 6.00 6.96 1.45 4.65
Pre-tax ROAA 0.52% 0.54% 0.51% 0.70% 0.51% 0.56% 0.10% 0.29%
Gross Domestic Product(GDP) 180.10 317.30 333.66 342.36 349.80 357.46 363.33 365.83 371.59 380.01Year-end assets to GDP 325.5% 321.7% 324.9% 336.7% 330.9% 358.0% 401.1% 470.1%
Large Commercial Banks
Number of institutions 4 4 4 4 4 4 4 4
Number of new entrants
Number of branches 969 983 969 923 955 943 935 840
Number of employees 62,400 62,500 61,900 61,200 62,000 63,000 64,000 63,000
Total deposits 271.7 285.2 303.5 314.0 335.9 341.9 404.5 458.4
Year-end total assets 523.5 543.2 567.3 611.8 622.0 730.6 869.4 1121.2
Average total assets 516.6 533.4 555.2 589.6 616.9 676.3 800.0 995.3
Year-end capital andreserves
33.2 34.2 35.2 39.5 42.3 43.9 41.8 42.4
Deposits to assets 51.9% 52.5% 53.5% 51.3% 54.0% 46.8% 46.5% 40.9%
Capital to assets 6.3% 6.3% 6.2% 6.5% 6.8% 6.0% 4.8% 3.8%
Pre-tax income 2.74 3.25 3.25 4.26 3.36 3.43 -2.26 -0.67
Pre-tax ROAA 0.53% 0.61% 0.59% 0.72% 0.54% 0.51% -0.28% -0.07%
Gross Domestic Product(GDP)
180.10 317.30 333.66 342.36 349.80 357.46 363.33 365.83 371.59 380.01
Year-end assets to GDP 165.0% 162.8% 165.7% 174.9% 174.0% 201.1% 237.7% 301.7%
Sources: See notes to Annex B

441
Table B.12 (continued)Country: Switzerland
(concentration figures in percent, monetary values in CHF billion)
1980 1990 1991 1992 1993 1994 1995 1996 1997 1998 1999
All Commercial BanksNumber of institutions 222 226 231 234 230 229 226 218Number of new entrantsNumber of branches 1,556 1,590 1,561 1,501 1,516 1,507 1,488 1,390Number of employees 91,300 90,600 88,700 87,900 88,600 89,000 90,000 89,000Total deposits 335.6 352.9 372.8 389.6 412.0 419.8 495.4 564.8Year-end total assets 691.2 715.4 744.0 798.6 806.1 917.1 1077.0 1349.7Average total assets 677.3 703.4 729.7 771.4 802.4 861.6 997.1 1213.4Year-end capital andreserves
53.2 54.8 57.0 62.4 64.9 67.0 66.8 67.7
Deposits to assets 48.6% 49.3% 50.1% 48.8% 51.1% 45.8% 46.0% 41.8%Capital to assets 7.7% 7.7% 7.7% 7.8% 8.1% 7.3% 6.2% 5.0%Pre-tax income 4.16 4.68 4.93 7.08 5.35 5.92 0.41 3.39Pre-tax ROAA 0.61% 0.67% 0.68% 0.92% 0.67% 0.69% 0.04% 0.28%Gross Domestic Product(GDP)
180.10 317.30 333.66 342.36 349.80 357.46 363.33 365.83 371.59 380.01
Year-end assets to GDP 217.8% 214.4% 217.3% 228.3% 225.5% 252.4% 294.4% 363.2%
Concentration-BanksLargestLargest 5 53.2 53.3 54.5 53.4 54.7 54.5 56.7 57.8Largest 10Largest 15
Sources: See notes to Annex B

442
Table B.12 (continued)Country: Switzerland
(concentration figures in percent, monetary values in CHF billion)
1980 1990 1991 1992 1993 1994 1995 1996 1997 1998 1999
Life InsuranceNumber of institutions 29 29 30 30 30 31 31 32 31 32Number of new entrantsNumber of employees 16,269 17,579 15,031Gross direct premiumswritten
14.21 15.86 17.00 18.94 21.09 24.10 27.16 30.87 34.96
Year-end total assets 210.56 231.05 259.19Year-end liabilitiesCapital to assetsPre-tax incomePre-tax return on averageassetsGross Domestic Product(GDP)
180.1 317.30 333.66 342.36 349.80 357.46 363.33 365.83 371.59 380.01
Assets to GDP 57.6% 62.2% 68.2%
Non-Life Insurance
Number of institutions 89 93 93 95 98 96 96 100 105 106
Number of new entrants
Number of employees 58,609 41,093 35,973
Gross direct premiumswritten
11.23 11.77 12.36 12.81 13.20 13.44 13.62 13.37 13.17
Year-end total assets 73.06 78.15 80.06
Year-end liabilities
Capital to assets
Pre-tax income
Pre-tax return on averageassetsGross Domestic Product(GDP)
180.1 317.30 333.66 342.36 349.80 357.46 363.33 365.83 371.59 380.01
Assets to GDP 20.0% 21.0% 21.1%
Concentration – LifeInsuranceLargest
Largest 5
Largest 10
Largest 15
Concentration – Non-LifeInsuranceLargest
Largest 5
Largest 10
Largest 15
Sources: See notes to Annex B

443
Table B.13Country: United Kingdom
(concentration figures in percent, monetary values in GBP billion)
1980 1990 1991 1992 1993 1994 1995 1996 1997 1998 1999
All Banks
Number of institutions 346 507 491 469 462 458 484 467 468 448 418Number of new entrants 15 25 26 10 11 13 15 18 10 11Number of branchesNumber of employeesTotal deposits 197 868 843 977 1,039 1,097 1,261 1,198 1,486 1,579 1,590Year-end total assets 303 1266 1,224 1,398 1,459 1,552 1,767 1,877 2449 2,587 2,640Average total assets 284 1250 1,245 1,311 1,428 1,505 1,659 1,822 2,163 2,518 2,614Year-end capital andreserves
16 82 85 90 94 101 109 117 195 213 224
Deposits to assets 65.0% 68.6% 68.9% 69.9% 71.2% 70.7% 71.4% 63.8% 60.7% 61.0% 60.2%Capital to assets 5.3% 6.5% 6.9% 6.4% 6.4% 6.5% 6.2% 6.2% 8.0% 8.2% 8.5%Pre-tax income 9.3 6.6 13.6 8.5 17.3 13.5 14.0 16.8 23.0Pre-tax ROAA 0.74% 0.53% 1.04% 0.60% 1.15% 0.81% 0.77% 0.78% 0.91%Gross Domestic Product(GDP)
229.58 554.49 582.95 606.58 637.82 676.04 712.55 754.6 803.89 843.73
Year-end assets to GDP 132.0% 228.3% 210.0% 230.5% 228.7% 229.6% 248.0% 248.7% 304.6% 306.6%
Large Commercial Banks
Number of institutions 47 41 39 37 37 40 44 44 44 42
Number of new entrants
Number of branches 12,994 12,306 11,751 11,445 11,075 10,601 12,070 11,743 11,479 11274
Number of employees 411,500 399,900 401,200 371,700 386,500 382,700 416,100 41,4100 40,4700 409825
Total deposits 453.1 465.4 476.2 493.9 379.6 420.5 548.6 593.3 622.2 665.5
Year-end total assets 515.4 532.4 646.9 690.1 721.9 806.2 1015.1 1129.5 1198.8 1298.9
Average total assets 504.1 523.9 589.6 668.5 706.0 763.9 952.6 1072.3 1164.2 1167.1
Year-end capital andreserves
24.6 24.4 24.5 26.2 29.5 31.3 43.5 47.9 51.0 57.7
Deposits to assets 87.9% 87.4% 73.6% 71.6% 52.6% 52.2% 54.0% 52.5% 51.9% 51.2%
Capital to assets 4.8% 4.6% 3.8% 3.8% 4.1% 3.9% 4.3% 4.2% 4.3% 4.4%
Pre-tax income 3.54 2.10 1.80 5.05 8.08 8.94 11.13 12.37 14.26 16.92
Pre-tax ROAA 0.70% 0.40% 0.31% 0.76% 1.14% 1.17% 1.17% 1.15% 1.22%
Gross Domestic Product(GDP)
229.58 554.49 582.95 606.58 637.82 676.04 712.55 754.60 803.89 843.73
Year-end assets to GDP 93.0% 91.3% 106.6% 108.2% 106.8% 113.1% 134.5% 140.5% 142.1%
Sources: See notes to Annex B
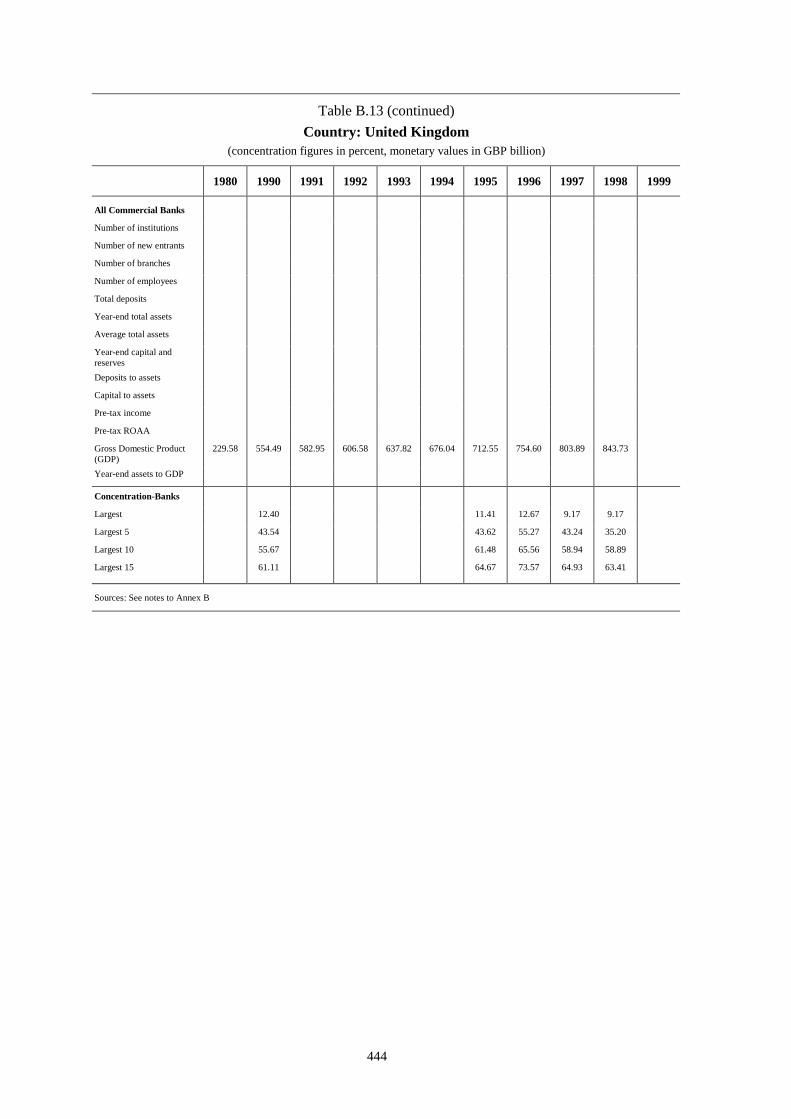
444
Table B.13 (continued)Country: United Kingdom
(concentration figures in percent, monetary values in GBP billion)
1980 1990 1991 1992 1993 1994 1995 1996 1997 1998 1999
All Commercial Banks
Number of institutions
Number of new entrants
Number of branches
Number of employees
Total deposits
Year-end total assets
Average total assets
Year-end capital andreservesDeposits to assets
Capital to assets
Pre-tax income
Pre-tax ROAA
Gross Domestic Product(GDP)
229.58 554.49 582.95 606.58 637.82 676.04 712.55 754.60 803.89 843.73
Year-end assets to GDP
Concentration-Banks
Largest 12.40 11.41 12.67 9.17 9.17
Largest 5 43.54 43.62 55.27 43.24 35.20
Largest 10 55.67 61.48 65.56 58.94 58.89
Largest 15 61.11 64.67 73.57 64.93 63.41
Sources: See notes to Annex B

445
Table B.13 (continued)Country: United Kingdom
(concentration figures in percent, monetary values in GBP billion)
1980 1990 1991 1992 1993 1994 1995 1996 1997 1998 1999
Life InsuranceNumber of institutions 205 202 196 194 191 174 177 177 176Number of new entrants 9 4 3 4 2 6 2 2 121
Number of employees 240.3 246.9 234.2 222.0 219.7 213.2 213.6 228.5 230.8Gross direct premiumswritten
33.6 39.6 43.4 46.3 43.1 44.9 53.9 61.4 72.4
Year-end total assets 256.3 306.4 364.6 464.4 465.4 554.8 601.9 718.8 827.0Year-end liabilities 224.3 266.9 317.7 391.5 418.1 482.5 539.4 637.5 739.3Capital to assetsPre-tax incomePre-tax return on averageassetsGross Domestic Product(GDP)
2795.6 5803.2 5986.2 6318.9 6642.3 7054.3 7400.5 7813.2 8300.8 8759.9 9248.45
Assets to GDP 4.4% 5.1% 5.8% 7.0% 6.6% 7.5% 7.7% 8.7% 9.4%
Non-Life InsuranceNumber of institutions 570 571 566 576 574 594 578 599 594Number of new entrants 15 8 8 18 3 1 11 5 121
Number of employees 240.3 246.9 234.2 222.0 219.7 213.2 213.6 228.5 230.8Gross direct premiumswritten
30.7 34.7 40.8 42.1 42.1 41.6 39.6 41.2 40.9
Year-end total assets 52.3 56.6 66.7 74.8 77.1 87.1 88.8 100.4 113.2Year-end liabilitiesCapital to assetsPre-tax incomePre-tax return on averageassetsGross Domestic Product(GDP)
2795.6 5803.2 5986.2 6318.9 6642.3 7054.3 7400.5 7813.2 8300.8 8759.9 9248.45
Assets to GDP 0.9% 0.9% 1.1% 1.1% 1.1% 1.2% 1.1% 1.2% 1.3%
Concentration – LifeInsuranceLargest 13.0 12.1 13.6 13.3 14.6 13.0 15.2 13.4 13.2Largest 5 36.3 35.3 34.2 38.1 35.9 34.7 35.6 34.8 38.6Largest 10 50.5 50.5 49.5 53.5 51.3 49.1 52.1 51.1 58.0Largest 15 62.3 61.8 60.5 64.4 62.2 61 63.2 61 72.8
Concentration – Non-LifeInsuranceLargest 12.7 11.8 11.4 11.6 11.6 12.9 18.1 17.9 24.0Largest 5 48.0 48.8 48.2 49.9 49.6 50.4 54.3 53.7 68.1Largest 10 65.6 68.0 65.7 66.1 65.4 65.3 66.0 65.5 77.7Largest 15 73.1 75.4 72.8 72.9 71.6 71.1 71.9 70.5 82.8
1 Sector total (no separation available)
Sources: See notes to Annex B
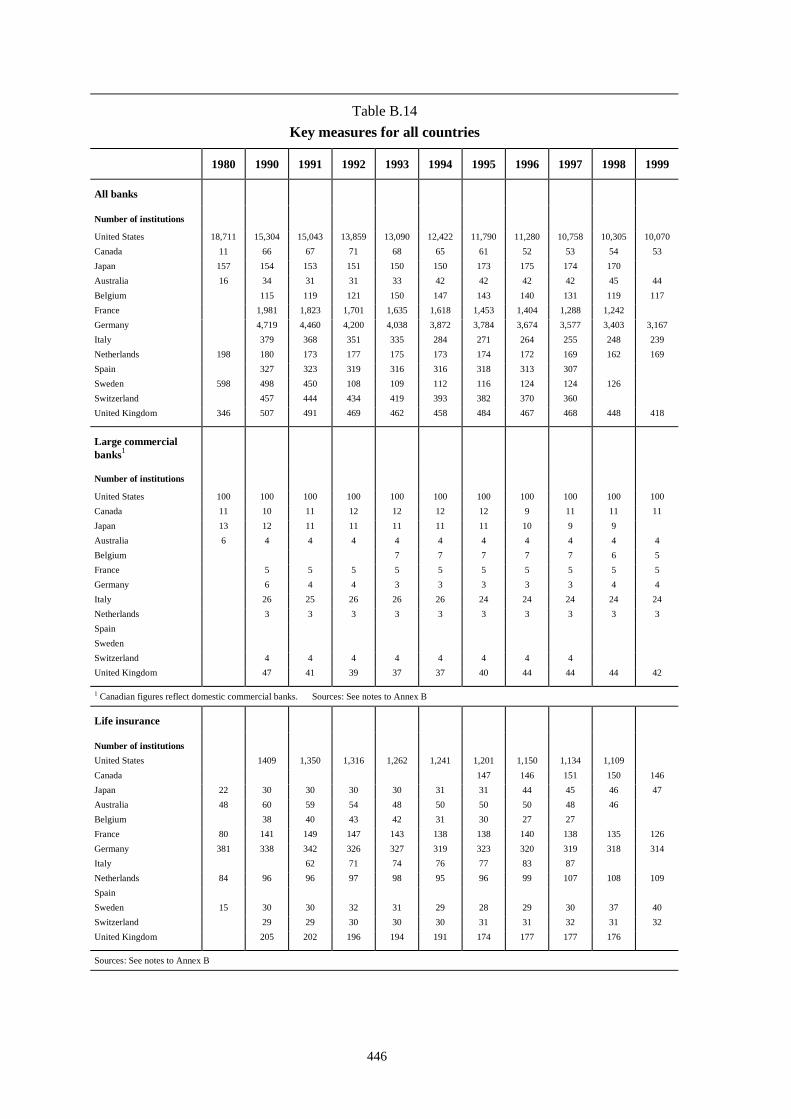
446
Table B.14Key measures for all countries
1980 1990 1991 1992 1993 1994 1995 1996 1997 1998 1999
All banks
Number of institutions
United States 18,711 15,304 15,043 13,859 13,090 12,422 11,790 11,280 10,758 10,305 10,070Canada 11 66 67 71 68 65 61 52 53 54 53Japan 157 154 153 151 150 150 173 175 174 170Australia 16 34 31 31 33 42 42 42 42 45 44Belgium 115 119 121 150 147 143 140 131 119 117France 1,981 1,823 1,701 1,635 1,618 1,453 1,404 1,288 1,242Germany 4,719 4,460 4,200 4,038 3,872 3,784 3,674 3,577 3,403 3,167Italy 379 368 351 335 284 271 264 255 248 239Netherlands 198 180 173 177 175 173 174 172 169 162 169Spain 327 323 319 316 316 318 313 307Sweden 598 498 450 108 109 112 116 124 124 126Switzerland 457 444 434 419 393 382 370 360United Kingdom 346 507 491 469 462 458 484 467 468 448 418
Large commercialbanks1
Number of institutions
United States 100 100 100 100 100 100 100 100 100 100 100Canada 11 10 11 12 12 12 12 9 11 11 11Japan 13 12 11 11 11 11 11 10 9 9Australia 6 4 4 4 4 4 4 4 4 4 4Belgium 7 7 7 7 7 6 5France 5 5 5 5 5 5 5 5 5 5Germany 6 4 4 3 3 3 3 3 4 4Italy 26 25 26 26 26 24 24 24 24 24Netherlands 3 3 3 3 3 3 3 3 3 3SpainSwedenSwitzerland 4 4 4 4 4 4 4 4United Kingdom 47 41 39 37 37 40 44 44 44 42
1 Canadian figures reflect domestic commercial banks. Sources: See notes to Annex B
Life insurance
Number of institutionsUnited States 1409 1,350 1,316 1,262 1,241 1,201 1,150 1,134 1,109Canada 147 146 151 150 146Japan 22 30 30 30 30 31 31 44 45 46 47Australia 48 60 59 54 48 50 50 50 48 46Belgium 38 40 43 42 31 30 27 27France 80 141 149 147 143 138 138 140 138 135 126Germany 381 338 342 326 327 319 323 320 319 318 314Italy 62 71 74 76 77 83 87Netherlands 84 96 96 97 98 95 96 99 107 108 109SpainSweden 15 30 30 32 31 29 28 29 30 37 40Switzerland 29 29 30 30 30 31 31 32 31 32United Kingdom 205 202 196 194 191 174 177 177 176
Sources: See notes to Annex B
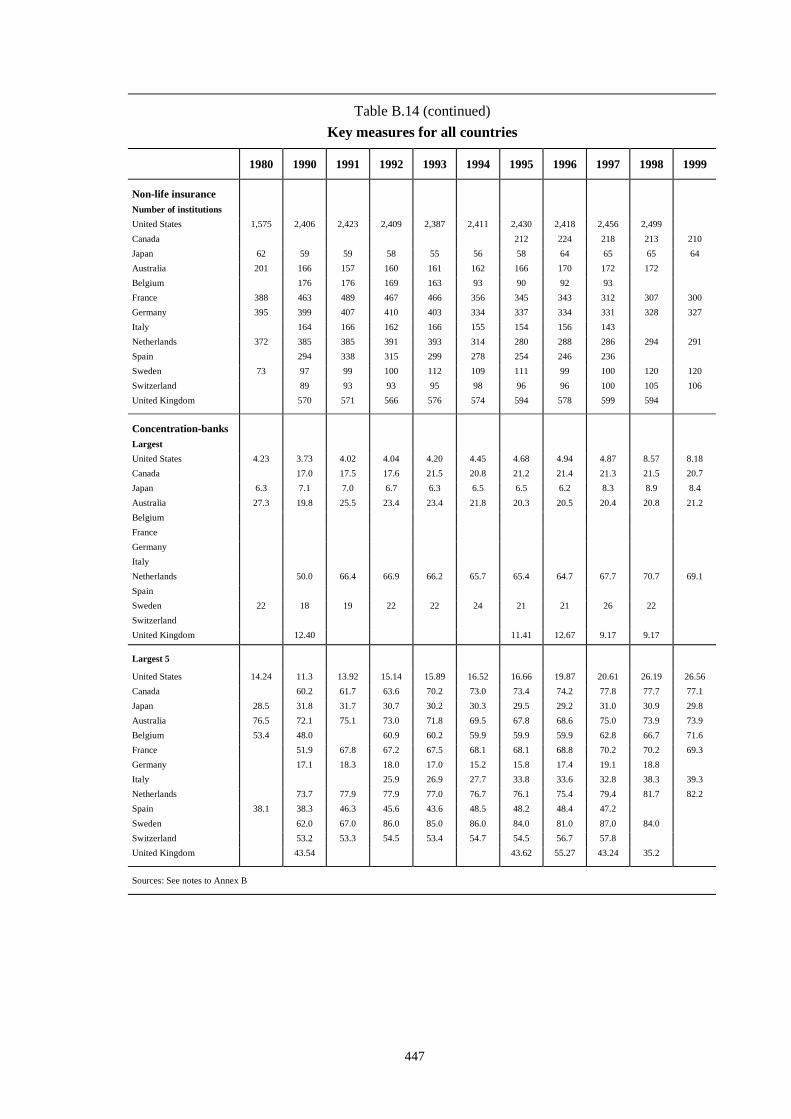
447
Table B.14 (continued)Key measures for all countries
1980 1990 1991 1992 1993 1994 1995 1996 1997 1998 1999
Non-life insuranceNumber of institutionsUnited States 1,575 2,406 2,423 2,409 2,387 2,411 2,430 2,418 2,456 2,499Canada 212 224 218 213 210Japan 62 59 59 58 55 56 58 64 65 65 64Australia 201 166 157 160 161 162 166 170 172 172Belgium 176 176 169 163 93 90 92 93France 388 463 489 467 466 356 345 343 312 307 300Germany 395 399 407 410 403 334 337 334 331 328 327Italy 164 166 162 166 155 154 156 143Netherlands 372 385 385 391 393 314 280 288 286 294 291Spain 294 338 315 299 278 254 246 236Sweden 73 97 99 100 112 109 111 99 100 120 120Switzerland 89 93 93 95 98 96 96 100 105 106United Kingdom 570 571 566 576 574 594 578 599 594
Concentration-banksLargestUnited States 4.23 3.73 4.02 4.04 4.20 4.45 4.68 4.94 4.87 8.57 8.18Canada 17.0 17.5 17.6 21.5 20.8 21.2 21.4 21.3 21.5 20.7Japan 6.3 7.1 7.0 6.7 6.3 6.5 6.5 6.2 8.3 8.9 8.4Australia 27.3 19.8 25.5 23.4 23.4 21.8 20.3 20.5 20.4 20.8 21.2BelgiumFranceGermanyItalyNetherlands 50.0 66.4 66.9 66.2 65.7 65.4 64.7 67.7 70.7 69.1SpainSweden 22 18 19 22 22 24 21 21 26 22SwitzerlandUnited Kingdom 12.40 11.41 12.67 9.17 9.17
Largest 5
United States 14.24 11.3 13.92 15.14 15.89 16.52 16.66 19.87 20.61 26.19 26.56Canada 60.2 61.7 63.6 70.2 73.0 73.4 74.2 77.8 77.7 77.1Japan 28.5 31.8 31.7 30.7 30.2 30.3 29.5 29.2 31.0 30.9 29.8Australia 76.5 72.1 75.1 73.0 71.8 69.5 67.8 68.6 75.0 73.9 73.9Belgium 53.4 48.0 60.9 60.2 59.9 59.9 59.9 62.8 66.7 71.6France 51.9 67.8 67.2 67.5 68.1 68.1 68.8 70.2 70.2 69.3Germany 17.1 18.3 18.0 17.0 15.2 15.8 17.4 19.1 18.8Italy 25.9 26.9 27.7 33.8 33.6 32.8 38.3 39.3Netherlands 73.7 77.9 77.9 77.0 76.7 76.1 75.4 79.4 81.7 82.2Spain 38.1 38.3 46.3 45.6 43.6 48.5 48.2 48.4 47.2Sweden 62.0 67.0 86.0 85.0 86.0 84.0 81.0 87.0 84.0Switzerland 53.2 53.3 54.5 53.4 54.7 54.5 56.7 57.8United Kingdom 43.54 43.62 55.27 43.24 35.2
Sources: See notes to Annex B
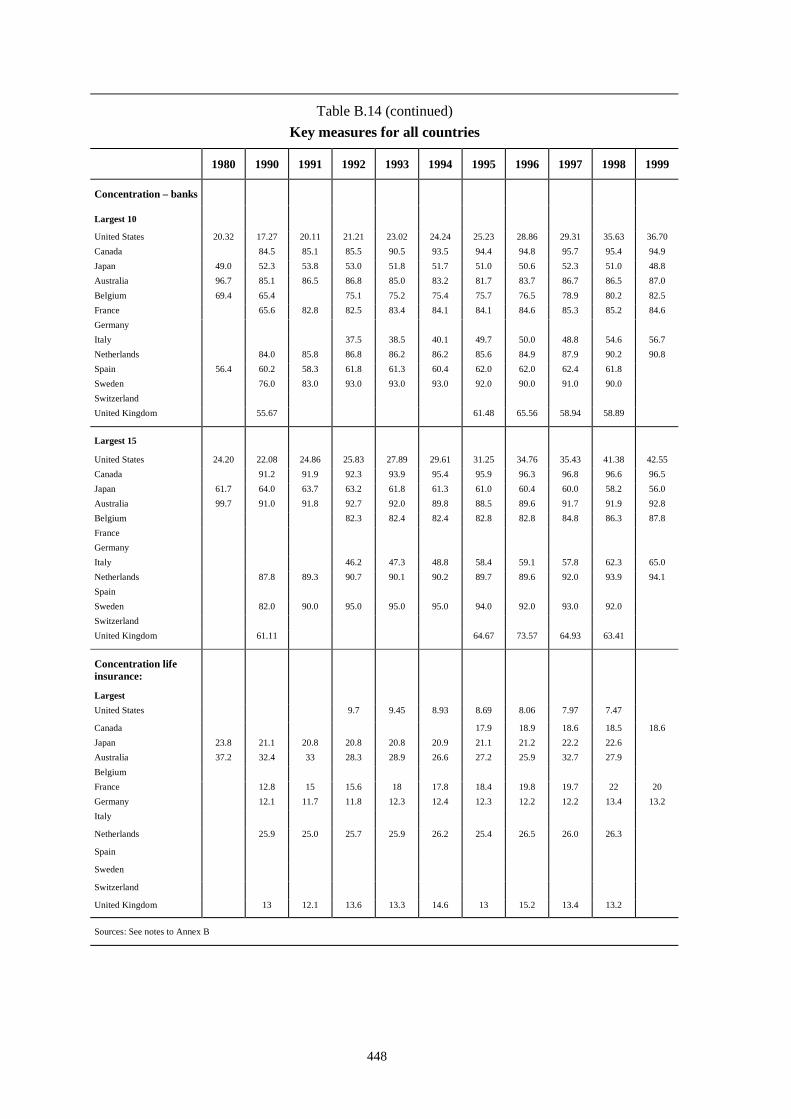
448
Table B.14 (continued)Key measures for all countries
1980 1990 1991 1992 1993 1994 1995 1996 1997 1998 1999
Concentration – banks
Largest 10
United States 20.32 17.27 20.11 21.21 23.02 24.24 25.23 28.86 29.31 35.63 36.70Canada 84.5 85.1 85.5 90.5 93.5 94.4 94.8 95.7 95.4 94.9Japan 49.0 52.3 53.8 53.0 51.8 51.7 51.0 50.6 52.3 51.0 48.8Australia 96.7 85.1 86.5 86.8 85.0 83.2 81.7 83.7 86.7 86.5 87.0Belgium 69.4 65.4 75.1 75.2 75.4 75.7 76.5 78.9 80.2 82.5France 65.6 82.8 82.5 83.4 84.1 84.1 84.6 85.3 85.2 84.6GermanyItaly 37.5 38.5 40.1 49.7 50.0 48.8 54.6 56.7Netherlands 84.0 85.8 86.8 86.2 86.2 85.6 84.9 87.9 90.2 90.8Spain 56.4 60.2 58.3 61.8 61.3 60.4 62.0 62.0 62.4 61.8Sweden 76.0 83.0 93.0 93.0 93.0 92.0 90.0 91.0 90.0SwitzerlandUnited Kingdom 55.67 61.48 65.56 58.94 58.89
Largest 15
United States 24.20 22.08 24.86 25.83 27.89 29.61 31.25 34.76 35.43 41.38 42.55Canada 91.2 91.9 92.3 93.9 95.4 95.9 96.3 96.8 96.6 96.5Japan 61.7 64.0 63.7 63.2 61.8 61.3 61.0 60.4 60.0 58.2 56.0Australia 99.7 91.0 91.8 92.7 92.0 89.8 88.5 89.6 91.7 91.9 92.8Belgium 82.3 82.4 82.4 82.8 82.8 84.8 86.3 87.8FranceGermanyItaly 46.2 47.3 48.8 58.4 59.1 57.8 62.3 65.0Netherlands 87.8 89.3 90.7 90.1 90.2 89.7 89.6 92.0 93.9 94.1SpainSweden 82.0 90.0 95.0 95.0 95.0 94.0 92.0 93.0 92.0SwitzerlandUnited Kingdom 61.11 64.67 73.57 64.93 63.41
Concentration lifeinsurance:
LargestUnited States 9.7 9.45 8.93 8.69 8.06 7.97 7.47
Canada 17.9 18.9 18.6 18.5 18.6Japan 23.8 21.1 20.8 20.8 20.8 20.9 21.1 21.2 22.2 22.6Australia 37.2 32.4 33 28.3 28.9 26.6 27.2 25.9 32.7 27.9BelgiumFrance 12.8 15 15.6 18 17.8 18.4 19.8 19.7 22 20Germany 12.1 11.7 11.8 12.3 12.4 12.3 12.2 12.2 13.4 13.2Italy
Netherlands 25.9 25.0 25.7 25.9 26.2 25.4 26.5 26.0 26.3
Spain
Sweden
Switzerland
United Kingdom 13 12.1 13.6 13.3 14.6 13 15.2 13.4 13.2
Sources: See notes to Annex B

449
Table B.14 (continued)Key measures for all countries
1980 1990 1991 1992 1993 1994 1995 1996 1997 1998 1999
Concentration – lifeinsuranceLargest 5United States 28.16 27.45 25.96 25.32 25.73 25.54 25.19Canada 65.6 68.4 70.6 73.1 73.3Japan 66.9 63.9 63.6 63.8 63.8 64.1 64.2 63.7 65.1 53.8Australia 82.2 73.5 70.9 65.8 64.1 61.5 60 58.3 61.6 60BelgiumFrance 48.2 48.9 51.3 49.2 48.5 49.6 53.9 53.2 58.4 56Germany 29.9 29.1 29.4 29.6 29.5 29.5 29.1 28.9 29.9 29.4ItalyNetherlands 65.7 63.3 63.6 63.3 63.1 61.4 60.5 59.0 57.7SpainSwedenSwitzerlandUnited Kingdom 36.3 35.3 34.2 38.1 35.9 34.7 35.6 34.8 38.6
Largest 10United States 40.19 39.55 38.28 38.35 39.83 39.66 39.42Canada 82.8 86.1 80.0 82.0 82.1Japan 88.6 85.4 85.1 84.9 84.7 84.8 84.8 83.7 85 73.6Australia 91.8 87.1 85 81.5 80.6 78.4 76.2 76.3 76.9 76.3BelgiumFrance 68.3 68.8 75.5 69.7 68.9 69.7 73.4 75.5 80.2 79Germany 43.9 42.5 43.4 43.6 43.5 44.3 43.9 43.6 45.5 43.8ItalyNetherlands 77.5 75.3 76.1 75.9 76.0 74.6 74.3 73.0 71.7SpainSwedenSwitzerlandUnited Kingdom 50.5 50.5 49.5 53.5 51.3 49.1 52.1 51.1 58
Largest 15United States 48.73 48.78 47.59 48.08 51.32 51.76 52.01Canada 86.9 89.5 83.1 85.1 85.0Japan 97.5 96.6 96.6 96.6 96.6 96.6 96.4 94.8 94.9 82.8Australia 94.9 92.6 91.8 90.7 90.5 88.3 86.7 87.2 87.1 87.7BelgiumFrance 78.9 79.3 87.5 80.3 79.8 81.8 84.8 86.5 91.6 90Germany 54.2 52.5 53.4 54.2 54.2 54.9 54 54.2 55.8 54.6ItalyNetherlands 83.5 81.6 82.8 83.2 83.8 82.9 82.8 81.3 79.8SpainSwedenSwitzerlandUnited Kingdom 62.3 61.8 60.5 64.4 62.2 61 63.2 61 72.8
Sources: See notes to Annex B
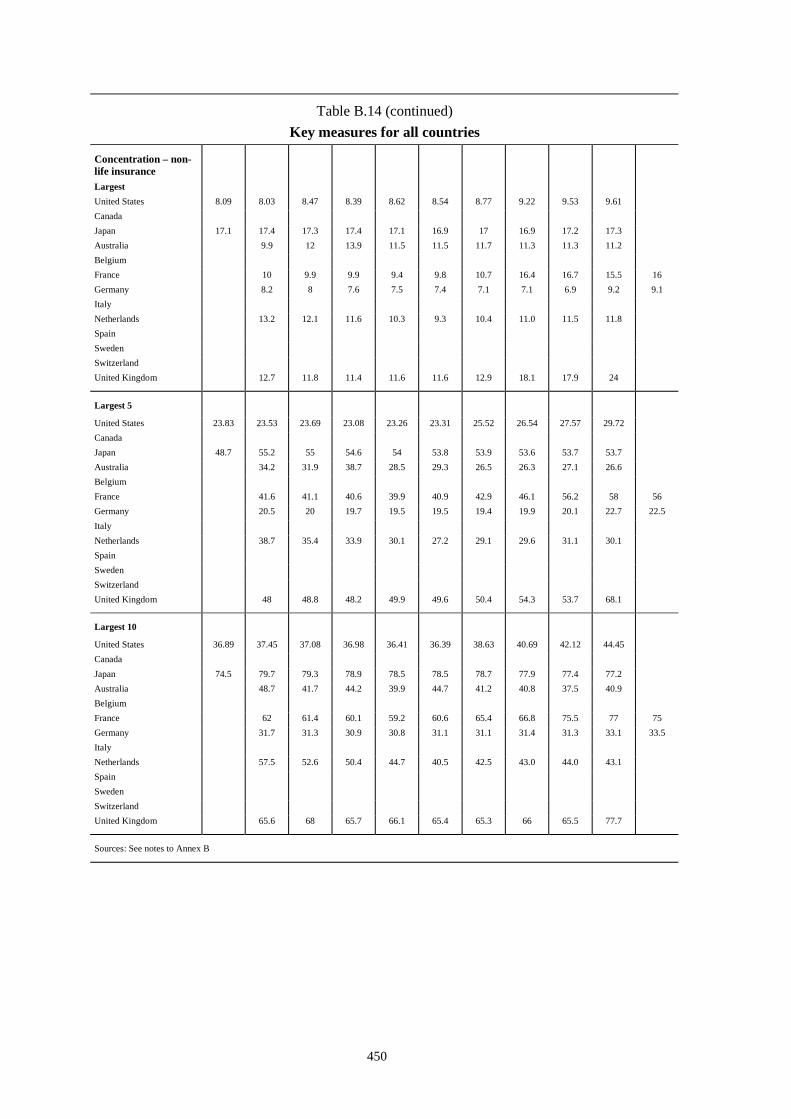
450
Table B.14 (continued)Key measures for all countries
Concentration – non-life insuranceLargestUnited States 8.09 8.03 8.47 8.39 8.62 8.54 8.77 9.22 9.53 9.61CanadaJapan 17.1 17.4 17.3 17.4 17.1 16.9 17 16.9 17.2 17.3Australia 9.9 12 13.9 11.5 11.5 11.7 11.3 11.3 11.2BelgiumFrance 10 9.9 9.9 9.4 9.8 10.7 16.4 16.7 15.5 16Germany 8.2 8 7.6 7.5 7.4 7.1 7.1 6.9 9.2 9.1ItalyNetherlands 13.2 12.1 11.6 10.3 9.3 10.4 11.0 11.5 11.8SpainSwedenSwitzerlandUnited Kingdom 12.7 11.8 11.4 11.6 11.6 12.9 18.1 17.9 24
Largest 5
United States 23.83 23.53 23.69 23.08 23.26 23.31 25.52 26.54 27.57 29.72CanadaJapan 48.7 55.2 55 54.6 54 53.8 53.9 53.6 53.7 53.7Australia 34.2 31.9 38.7 28.5 29.3 26.5 26.3 27.1 26.6BelgiumFrance 41.6 41.1 40.6 39.9 40.9 42.9 46.1 56.2 58 56Germany 20.5 20 19.7 19.5 19.5 19.4 19.9 20.1 22.7 22.5ItalyNetherlands 38.7 35.4 33.9 30.1 27.2 29.1 29.6 31.1 30.1SpainSwedenSwitzerlandUnited Kingdom 48 48.8 48.2 49.9 49.6 50.4 54.3 53.7 68.1
Largest 10
United States 36.89 37.45 37.08 36.98 36.41 36.39 38.63 40.69 42.12 44.45CanadaJapan 74.5 79.7 79.3 78.9 78.5 78.5 78.7 77.9 77.4 77.2Australia 48.7 41.7 44.2 39.9 44.7 41.2 40.8 37.5 40.9BelgiumFrance 62 61.4 60.1 59.2 60.6 65.4 66.8 75.5 77 75Germany 31.7 31.3 30.9 30.8 31.1 31.1 31.4 31.3 33.1 33.5ItalyNetherlands 57.5 52.6 50.4 44.7 40.5 42.5 43.0 44.0 43.1SpainSwedenSwitzerlandUnited Kingdom 65.6 68 65.7 66.1 65.4 65.3 66 65.5 77.7
Sources: See notes to Annex B

451
Table B.14 (continued)Key measures for all countries
1980 1990 1991 1992 1993 1994 1995 1996 1997 1998 1999
Concentration non-lifeinsurance
Largest 15
United States 45.9 46.35 46.09 46.28 45.48 44.97 47.02 48.97 50.32 52.14CanadaJapan 92.7 94.3 94.2 94.2 94.2 94.3 94.4 93.3 92.4 92.2Australia 58.9 55.2 75.2 62.4 57.4 51.7 52.3 50.3 50.9BelgiumFrance 76.2 75.5 73.5 72.9 74.4 80.2 80.6 85 86.5 85Germany 40.3 40.1 40 40 40.5 40.2 40 39.7 41 41.3ItalyNetherlands 70.9 64.9 62.1 55.1 49.9 51.3 52.4 53.2 52.3SpainSwedenSwitzerlandUnited Kingdom 73.1 75.4 72.8 72.9 71.6 71.1 71.9 70.5 82.8
All Banks
Year-end assets to GDP
United States 93.5 80.8 76.1 71.8 70.6 70.5 71.3 70.9 72.0 73.6 73.3Canada 90.7 91.0 93.9 97.0 104.3 109.7 113.2 132.8 151.3 160.1
Japan 113.4 173.6 162.8 152.5 151.4 150.1 154.3 149.2 152.1 154.3
Australia 43.0 88.6 90.2 89.9 89.9 91.8 96.2 99.7 103.7 108.7
Belgium 283.6 277.3 281.1 305.6 299.9 305.7 325.9 335.2 322.9
France 232.0 228.7 232.9 234.6 228.7 229.6 236.4 245.6 239.4
Germany 158.9 143.1 148.7 168.5 171.2 181.2 197.6 215.7 230.8
Italy 129.6 135.8 150.0 155.6 150.4 142.8 143.1 144.1 140.6
Netherlands 117.8 217.4 215.4 221.8 235.5 227.1 235.0 265.5 308.5 354.3
Spain 139.9 143.6 147.0 169.6 170.8 172.3 171.2 173.2
Sweden 119.9 110.3 105.4 100.6 95.2 96.1 110.3 123.4 133.8
Switzerland 325.5 321.7 324.9 336.7 330.9 358.0 401.1 470.1
United Kingdom 132.0 228.3 210.0 230.5 228.7 229.6 248.0 248.7 304.6 306.6
Sources: See notes to Annex B

452
Table B.14 (continued)Key measures for all countries
(in percent)
1980 1990 1991 1992 1993 1994 1995 1996 1997 1998 1999
Large commercialbanksYear-end assets to GDPUnited States 36.0 29.5 29.0 28.6 29.9 31.7 33.3 35.9 40.6 42.9 43.2Canada 90.7 82.1 85.1 88.5 95.9 101.2 104.8 123.5 140.7 149.7
Japan 65.8 114.3 103.6 92.6 89.6 87.5 88.2 86.7 84.1 78.7
Australia 31.1 57.7 64.8 61.6 60.2 60.1 62.5 64.1 66.2 70.9
Belgium 175.0 178.3 191.8 210.9 226.3 231.8
France 82.3 83.1 91.7 95.4 86.7 85.4 91.2 99.8 98.4
Germany 24.9 22.8 23.3 25.0 25.1 28.1 32.1 38.5 45.9
Italy 65.0 66.0 75.3 77.4 82.2 86.2 87.4 87.2 85.8
Netherlands 109.5 151.0 157.2 165.9 163.1 170.7 187.4 231.7 280.8
Spain
Sweden
Switzerland 165.0 162.8 165.7 174.9 174.0 201.1 237.7 301.7
United Kingdom 93.0 91.3 106.6 108.2 106.8 113.1 134.5 140.5 142.1
Life insuranceAssets to GDPUnited States 24.5 25.7 26.2 27.5 27.6 29.0 29.6 31.0 32.2
Canada 32.2 30.9 29.9 30.7 30.2 31.3
Japan
Australia 13.6 19.8 21.3 22.3 22.6 21.8 22.2 22.1 30.2 28.4
Belgium
France 4.1 14.9 17.5 19.9 23.9 27.1 29.2 34.2 38.9 41.9
Germany 14.1 21.9 19.9 20.1 21.0 21.8 22.8 24.4 25.9 27.1
Italy
Netherlands 20.2 36.9 39.7 41.5 46.1 47.0 49.3 53.2 57.3 61.0
Spain
Sweden 16.1 29.6 31.9 34.1 38.9 37.1 33.5 50.4 58.5 65.6
Switzerland 57.6 62.2 68.2
United Kingdom 4.4 5.1 5.8 7.0 6.6 7.5 7.7 8.7 9.4
Non-life insuranceAssets to GDPUnited States 7.1 9.6 10.0 10.1 10.1 10.0 10.3 10.3 10.5 10.6Canada 4.4 4.5 4.4 4.5 4.5 4.6 5.5 5.5 5.7JapanAustralia 4.2 5.1 5.6 5.6 7.2 7.4 7.7 8.2 9.2 9.7BelgiumFrance 3.9 5.6 5.7 6.2 6.4 6.6 6.0 6.0 6.7 6.5Germany 4.1 5.5 4.8 5.0 5.2 5.6 6.1 6.8 7.3 7.7ItalyNetherlands 3.1 5.7 5.8 5.9 6.3 6.6 7.3 8.0 8.5 8.7SpainSweden 6.2 10.7 11.0 10.5 11.8 15.0 14.4 17.5 18.9 20.6Switzerland 20.0 21.0 21.1United Kingdom 0.9 0.9 1.1 1.1 1.1 1.2 1.1 1.2 1.3
Sources: See notes to Annex B
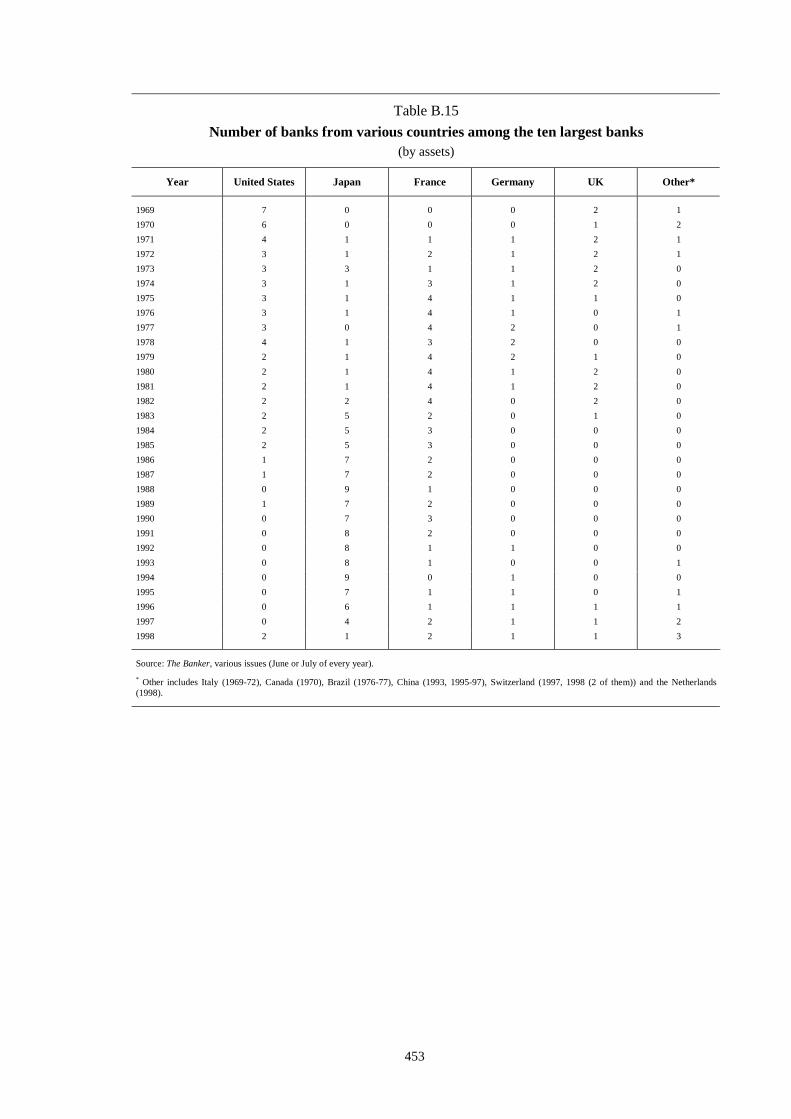
453
Table B.15Number of banks from various countries among the ten largest banks
(by assets)
Year United States Japan France Germany UK Other*
1969 7 0 0 0 2 11970 6 0 0 0 1 21971 4 1 1 1 2 11972 3 1 2 1 2 11973 3 3 1 1 2 01974 3 1 3 1 2 01975 3 1 4 1 1 01976 3 1 4 1 0 11977 3 0 4 2 0 11978 4 1 3 2 0 01979 2 1 4 2 1 01980 2 1 4 1 2 01981 2 1 4 1 2 01982 2 2 4 0 2 01983 2 5 2 0 1 01984 2 5 3 0 0 01985 2 5 3 0 0 01986 1 7 2 0 0 01987 1 7 2 0 0 01988 0 9 1 0 0 01989 1 7 2 0 0 01990 0 7 3 0 0 01991 0 8 2 0 0 01992 0 8 1 1 0 01993 0 8 1 0 0 11994 0 9 0 1 0 01995 0 7 1 1 0 11996 0 6 1 1 1 11997 0 4 2 1 1 21998 2 1 2 1 1 3
Source: The Banker, various issues (June or July of every year).* Other includes Italy (1969-72), Canada (1970), Brazil (1976-77), China (1993, 1995-97), Switzerland (1997, 1998 (2 of them)) and the Netherlands(1998).

454
Table B.16Activity levels and market shares of various securities markets, 1999
(Values are in USD million, shares are in percent and based on value)
International Equities
Bank Name Value Number Share
Morgan Stanley Dean Witter 24,059.66 79 16.22Goldman Sachs & Co 22,197.88 91 14.96Merrill Lynch & Co 16,286.10 85 10.98Credit Suisse First Boston 11,309.10 130 7.62Warburg Dillon Read 9,585.89 50 6.46Salomon Smith Barney Int 7,352.32 36 4.96Deutsche Bank 7,268.58 67 4.90Lehman Brothers 5,377.54 50 3.62ABN AMRO 4,653.17 39 3.14Dresdner Kleinwort Benson 4,324.06 29 2.91
International European Equities
Morgan Stanley Dean Witter 15,895.55 27 19.17Goldman Sachs & Co 11,621.10 40 14.01Merrill Lynch & Co 8,017.31 26 9.67Deutsche Bank 6,520.87 38 7.86Credit Suisse First Boston 6,396.87 36 7.71Warburg Dillon Read 6,368.04 29 7.68Dresdner Kleinwort Benson 3,961.34 26 4.78HSBC 3,287.05 16 3.96Lehman Brothers 2,657.83 18 3.20ABN AMRO 2,626.44 33 3.17
International US Equities
Morgan Stanley Dean Witter 3,667.70 39 23.85Credit Suisse First Boston 3,213.19 78 20.89Goldman Sachs & Co 3,012.60 30 19.59Merrill Lynch & Co 2,297.11 25 14.93Deutsche Bank 703.45 28 4.57Salomon Smith Barney Int 687.93 11 4.47Lehman Brothers 472.11 16 3.07JP Morgan 363.34 5 2.36Bear Stearns & Co 259.05 6 1.68Toronto-Dominion Bank 176.40 1 1.15
Source: Capital Data – Bondware.

455
Table B.16 (continued)Activity levels and market shares of various securities markets, 1999
(Values are in USD million, shares are in percent and based on value)
International IPOs
Bank Name Value Number Share
Merrill Lynch & Co 7,795.87 32 15.90Goldman Sachs & Co 7,663.52 38 15.63Morgan Stanley Dean Witter 5,491.35 35 11.20Credit Suisse First Boston 4,359.81 76 8.89Warburg Dillon Read 3,648.56 15 7.44Deutsche Bank 2,127.57 44 4.34Mediobanca 1,774.57 2 3.62Lehman Brothers 1,712.20 27 3.49Credit Lyonnais 1,463.89 5 2.99Salomon Smith Barney Int 1,283.60 11 2.62
Source: Capital Data – Bondware
US market IPOs1
Goldman Sachs & Co 12,912.00 53 20.70Morgan Stanley Dean Witter 12,836.00 47 20.50Merrill Lynch & Co 6,826.00 36 10.90Credit Suisse First Boston 5,872.00 58 9.40Donaldson Lufkin & Jenrette 3,892.00 39 6.20Lehman Brothers 2,854.00 30 4.60Fleet Boston 2,696.00 45 4.30Salomon Smith Barney Int 2,531.00 22 4.10Deutsche Bank 2,088.00 27 3.30Bear Stearns & Co 2,087.00 26 3.30
1 Data for 1997 exclude closed-end funds and unit issues; data for 1999 exclude closed-end funds and rank ineligible issues.
Source: Thomson Financial Securities Data
Top financial advisers in M&As (all completed involving US targets)
Bank Name Value Number Share
Goldman Sachs & Co 612,482.60 222 47.60MSDW 355,500.50 189 27.60Merrill Lynch & Co 295,620.80 169 23.00DLJ 253,386.80 228 19.70Salomon Smith Barney Int 223,797.60 170 17.40CSFB 221,275.70 139 17.20JP Morgan 178,586.60 75 13.90Lehman Brothers 78,206.80 118 6.10Chase Manhattan Corp 77,278.50 114 6.00Bear Stearns & Co 68,251.00 74 5.30Deutsche Bank 61,374.40 101 4.80Wasserstein Perella 48,892.20 42 3.80Lazard Houses 38,016.70 44 3.00Warburg Dillon Read 31,756.40 58 2.50Houlihan L, H, & Zukin 23,940.20 71 1.90
Source: Investment Dealers’ Digest.
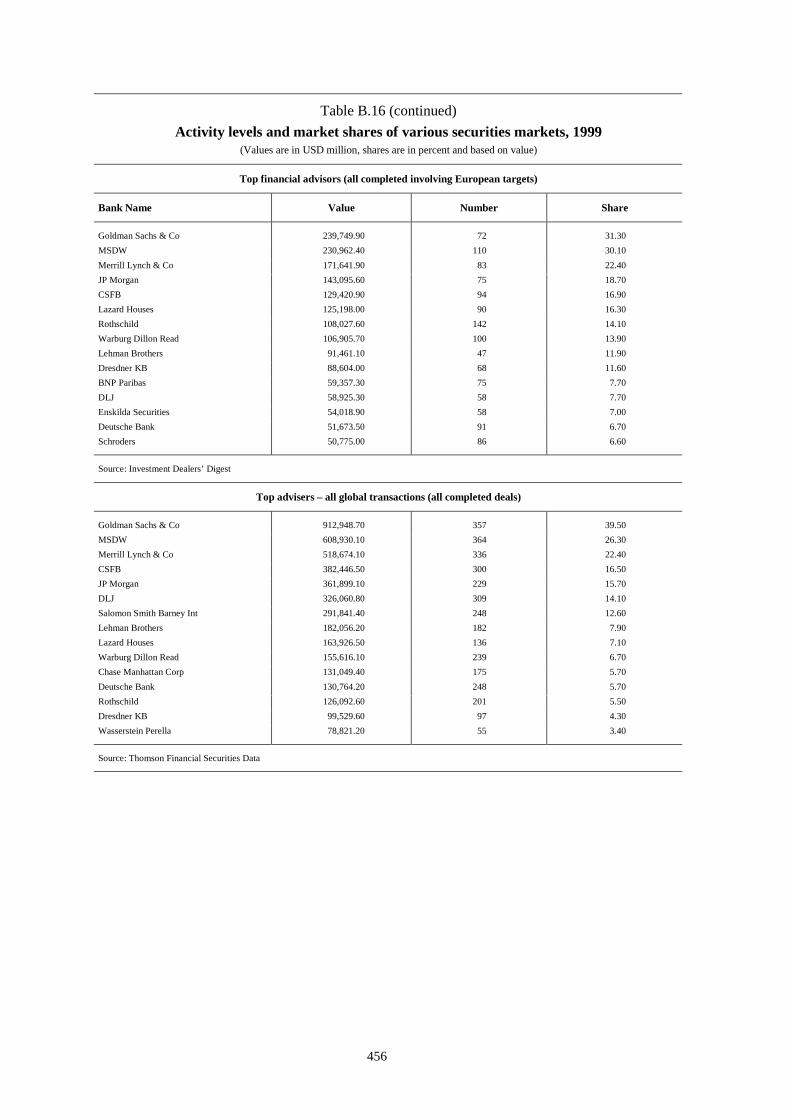
456
Table B.16 (continued)Activity levels and market shares of various securities markets, 1999
(Values are in USD million, shares are in percent and based on value)
Top financial advisors (all completed involving European targets)
Bank Name Value Number Share
Goldman Sachs & Co 239,749.90 72 31.30MSDW 230,962.40 110 30.10Merrill Lynch & Co 171,641.90 83 22.40JP Morgan 143,095.60 75 18.70CSFB 129,420.90 94 16.90Lazard Houses 125,198.00 90 16.30Rothschild 108,027.60 142 14.10Warburg Dillon Read 106,905.70 100 13.90Lehman Brothers 91,461.10 47 11.90Dresdner KB 88,604.00 68 11.60BNP Paribas 59,357.30 75 7.70DLJ 58,925.30 58 7.70Enskilda Securities 54,018.90 58 7.00Deutsche Bank 51,673.50 91 6.70Schroders 50,775.00 86 6.60
Source: Investment Dealers’ Digest
Top advisers – all global transactions (all completed deals)
Goldman Sachs & Co 912,948.70 357 39.50MSDW 608,930.10 364 26.30Merrill Lynch & Co 518,674.10 336 22.40CSFB 382,446.50 300 16.50JP Morgan 361,899.10 229 15.70DLJ 326,060.80 309 14.10Salomon Smith Barney Int 291,841.40 248 12.60Lehman Brothers 182,056.20 182 7.90Lazard Houses 163,926.50 136 7.10Warburg Dillon Read 155,616.10 239 6.70Chase Manhattan Corp 131,049.40 175 5.70Deutsche Bank 130,764.20 248 5.70Rothschild 126,092.60 201 5.50Dresdner KB 99,529.60 97 4.30Wasserstein Perella 78,821.20 55 3.40
Source: Thomson Financial Securities Data
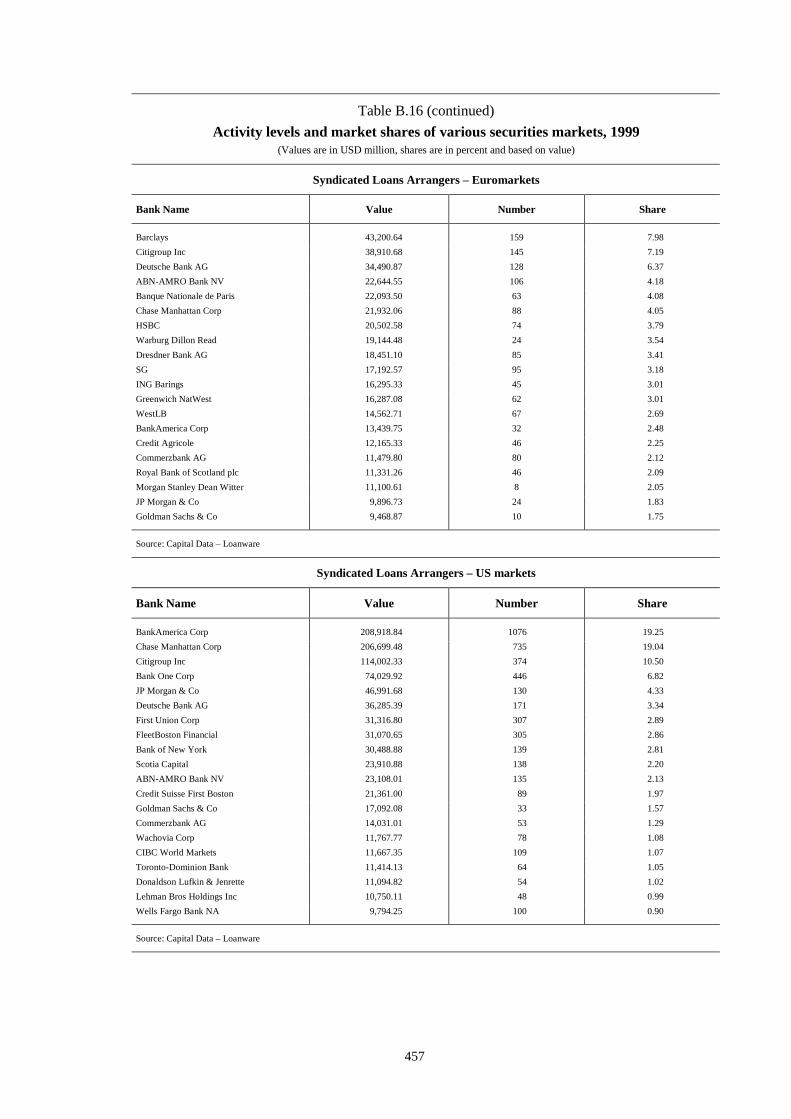
457
Table B.16 (continued)Activity levels and market shares of various securities markets, 1999
(Values are in USD million, shares are in percent and based on value)
Syndicated Loans Arrangers – Euromarkets
Bank Name Value Number Share
Barclays 43,200.64 159 7.98Citigroup Inc 38,910.68 145 7.19Deutsche Bank AG 34,490.87 128 6.37ABN-AMRO Bank NV 22,644.55 106 4.18Banque Nationale de Paris 22,093.50 63 4.08Chase Manhattan Corp 21,932.06 88 4.05HSBC 20,502.58 74 3.79Warburg Dillon Read 19,144.48 24 3.54Dresdner Bank AG 18,451.10 85 3.41SG 17,192.57 95 3.18ING Barings 16,295.33 45 3.01Greenwich NatWest 16,287.08 62 3.01WestLB 14,562.71 67 2.69BankAmerica Corp 13,439.75 32 2.48Credit Agricole 12,165.33 46 2.25Commerzbank AG 11,479.80 80 2.12Royal Bank of Scotland plc 11,331.26 46 2.09Morgan Stanley Dean Witter 11,100.61 8 2.05JP Morgan & Co 9,896.73 24 1.83Goldman Sachs & Co 9,468.87 10 1.75
Source: Capital Data – Loanware
Syndicated Loans Arrangers – US markets
Bank Name Value Number Share
BankAmerica Corp 208,918.84 1076 19.25Chase Manhattan Corp 206,699.48 735 19.04Citigroup Inc 114,002.33 374 10.50Bank One Corp 74,029.92 446 6.82JP Morgan & Co 46,991.68 130 4.33Deutsche Bank AG 36,285.39 171 3.34First Union Corp 31,316.80 307 2.89FleetBoston Financial 31,070.65 305 2.86Bank of New York 30,488.88 139 2.81Scotia Capital 23,910.88 138 2.20ABN-AMRO Bank NV 23,108.01 135 2.13Credit Suisse First Boston 21,361.00 89 1.97Goldman Sachs & Co 17,092.08 33 1.57Commerzbank AG 14,031.01 53 1.29Wachovia Corp 11,767.77 78 1.08CIBC World Markets 11,667.35 109 1.07Toronto-Dominion Bank 11,414.13 64 1.05Donaldson Lufkin & Jenrette 11,094.82 54 1.02Lehman Bros Holdings Inc 10,750.11 48 0.99Wells Fargo Bank NA 9,794.25 100 0.90
Source: Capital Data – Loanware

458
Table B.16 (continued)Activity levels and market shares of various securities markets, 1999
(Values are in USD million, shares are in percent and based on value)
International bonds
Bank Name Value Number Share
Merrill Lynch & Co 123.48 612 8.94Morgan Stanley Dean Witter 110.73 517 8.02Deutsche Bank 104.62 548 7.57Salomon Smith Barney Int 102.50 295 7.42Credit Suisse First Boston 79.77 292 5.77Goldman Sachs & Co 77.37 194 5.60Warburg Dillon Read 77.22 400 5.59JP Morgan 69.65 218 5.04Lehman Brothers 68.87 248 4.99ABN AMRO 59.73 263 4.32Dresdner Kleinwort Benson 57.02 303 4.13Paribas 42.07 164 3.05Barclays Capital 37.89 168 2.74Commerzbank AG 28.72 170 2.08Bear Stearns & Co 27.24 76 1.97HypoVereinsbank 24.54 166 1.78CDC Marches 20.47 96 1.48Nomura Securities Co Ltd 19.38 96 1.40HSBC 18.01 110 1.30Chase Manhattan Corp 17.09 67 1.24
Source: Capital Data – Loanware
Public euro and global bonds
Bank Name Value Number Share
Merrill Lynch & Co 123.20 462 10.02Morgan Stanley Dean Witter 106.35 406 8.65Salomon Smith Barney Int 101.64 285 8.27Deutsche Bank 88.48 389 7.20Goldman Sachs & Co 78.22 195 6.36Credit Suisse First Boston 73.41 254 5.97JP Morgan 69.68 215 5.67Lehman Brothers 68.67 252 5.59Warburg Dillon Read 68.44 274 5.57ABN AMRO 46.39 168 3.77Paribas 41.45 148 3.37Dresdner Kleinwort Benson 39.90 150 3.25Barclays Capital 35.28 154 2.87Bear Stearns & Co 27.24 76 2.22Nomura Securities Co Ltd 18.21 93 1.48Commerzbank AG 17.55 63 1.43Societe Generale 17.03 70 1.39Chase Manhattan Corp 15.01 66 1.22CDC Marches 14.61 48 1.19HSBC 13.52 53 1.10
Source: Capital Data – Loanware

459
Table B.17Notional Size of the OTC Derivatives Markets (in USD trillions)
1992 1993 1994 1995 1996 1997 1998 1999
Interest rate derivatives Swaps 7.4 9.7 14.0 18.4 24.0 30.2 47.0 52.0Options 2.1 3.3 4.0 5.2 6.9 8.3 12.0 12.3Forwards 2.9 3.2 4.4 4.5 5.0 6.1 7.0 8.3
Currency derivatives Swaps 1.3 1.5 1.7 2.0 2.4 2.6 3.2 3.6Options 1.6 1.7 2.2 2.8 3.6 5.0 4.3 3.1Forwards 9.1 10.2 12.4 11.8 13.3 13.5 13.3 11.0
Other OTC derivatives Total 0.2 0.3 0.6 0.9 1.4 1.9 3.4 4.3
Currency derivatives Total 12.4 16.2 22.4 28.1 35.9 44.6 66.0 72.6Interest rate derivatives Total 12.0 13.4 16.3 16.6 19.3 21.1 20.8 17.7Other OTC derivatives Total 0.2 0.3 0.6 0.9 1.4 1.9 3.4 4.3
All OTC derivatives Total 24.6 29.9 39.3 45.6 56.6 67.6 90.2 94.6
Source: Swaps Monitor estimates.
Related Documents