Report on Canadian Beef Supply and Disposition with Beef Quality Categorization L. Young D. Barber G. Fetterly June 1997

Welcome message from author
This document is posted to help you gain knowledge. Please leave a comment to let me know what you think about it! Share it to your friends and learn new things together.
Transcript
Report on Canadian Beef Supply and Dispositionwith Beef Quality Categorization
L. YoungD. BarberG. Fetterly
June 1997
Report on Canadian Beef Supply andDisposition with Beef Quality Categorization
Larry YoungDoug BarberGord Fetterly
Economic and Policy Analysis DirectorateJune 1997
The views expressed in this publication do not necessarilyreflect Departmental policy.
To obtain additional copies, contact:
Information Management GroupEconomic and Policy Analysis DirectoratePolicy BranchAgriculture and Agri-Food CanadaOttawa, OntarioK1A 0C5Tel. (613) 759-7419Fax: (613) 759-7236e-mail: [email protected]
Publication No. 1941E
Aussi disponible en français sous le titre de :Rapport sur l’offre et l’utilisation du boeufcanadien par niveau de qualité

Report on Canadian Beef Supply and Disposition with Beef Quality Categorization
Page i
TABLE OF CONTENTS
Background . . . . . . . . . . . . . . . . . . . . . . . . . . . . . . . . . . . . . . . . . . . . . . . . . . . . . . . . . . . 1
Objective . . . . . . . . . . . . . . . . . . . . . . . . . . . . . . . . . . . . . . . . . . . . . . . . . . . . . . . . . . . . . 2
Overview of Methodology . . . . . . . . . . . . . . . . . . . . . . . . . . . . . . . . . . . . . . . . . . . . . . 2Product Weight and Composition . . . . . . . . . . . . . . . . . . . . . . . . . . . . . . . . . . 2Definitions of Beef Quality Types . . . . . . . . . . . . . . . . . . . . . . . . . . . . . . . . . . . 3Stocks . . . . . . . . . . . . . . . . . . . . . . . . . . . . . . . . . . . . . . . . . . . . . . . . . . . . . . . . . . 3Imports . . . . . . . . . . . . . . . . . . . . . . . . . . . . . . . . . . . . . . . . . . . . . . . . . . . . . . . . . 3
Components of Beef Supply & Disposition (1990-1996 & Forecast to 1999) . . . . . . 3Production . . . . . . . . . . . . . . . . . . . . . . . . . . . . . . . . . . . . . . . . . . . . . . . . . . . . . . 4Beef Imports . . . . . . . . . . . . . . . . . . . . . . . . . . . . . . . . . . . . . . . . . . . . . . . . . . . . . 6Stocks . . . . . . . . . . . . . . . . . . . . . . . . . . . . . . . . . . . . . . . . . . . . . . . . . . . . . . . . . . 7
Disposition of Beef . . . . . . . . . . . . . . . . . . . . . . . . . . . . . . . . . . . . . . . . . . . . . . . . . . . . . 7Exports . . . . . . . . . . . . . . . . . . . . . . . . . . . . . . . . . . . . . . . . . . . . . . . . . . . . . . . . . 7Stocks . . . . . . . . . . . . . . . . . . . . . . . . . . . . . . . . . . . . . . . . . . . . . . . . . . . . . . . . . 12Consumption . . . . . . . . . . . . . . . . . . . . . . . . . . . . . . . . . . . . . . . . . . . . . . . . . . . 12
Conclusions . . . . . . . . . . . . . . . . . . . . . . . . . . . . . . . . . . . . . . . . . . . . . . . . . . . . . . . . . 13
Data Sources . . . . . . . . . . . . . . . . . . . . . . . . . . . . . . . . . . . . . . . . . . . . . . . . . . . . . . . . . . 14
Appendix A (Tables) . . . . . . . . . . . . . . . . . . . . . . . . . . . . . . . . . . . . . . . . . . . . . . . . . . . . . . . A.1
Appendix B (Domestic Beef Production by Quality Type) . . . . . . . . . . . . . . . . . . . . . . . . B.1
Appendix C (Updated Beef Trade Quality Factors 1994 and 1995, Paul D. MacInnes andAssociates, Supply and Disposition of Canadian Beef, 1994 and 1995,April 30, 1996 (Original study completed March 23, 1995) . . . . . . . . . . . . . C.1

Report on Canadian Beef Supply and Disposition with Beef Quality Categorization
Page ii
TABLE OF CONTENTS
Tables
Table 1. Domestic Beef Production . . . . . . . . . . . . . . . . . . . . . . . . . . . . . . . . . . . . . . . . . 4Table 2. Fed and Non-Fed Beef Production as Percent Category . . . . . . . . . . . . . . . . . 5Table 3. Imports of Fresh, Chilled and Frozen Beef . . . . . . . . . . . . . . . . . . . . . . . . . . . 6Table 4. Total Imports of Beef . . . . . . . . . . . . . . . . . . . . . . . . . . . . . . . . . . . . . . . . . . . . . . 8Table 5. Beginning Frozen Beef Stocks . . . . . . . . . . . . . . . . . . . . . . . . . . . . . . . . . . . . . . 9Table 6. Exports of Fresh/Chilled and Frozen Beef . . . . . . . . . . . . . . . . . . . . . . . . . . 10Table 7. Total Exports of Beef . . . . . . . . . . . . . . . . . . . . . . . . . . . . . . . . . . . . . . . . . . . . . 11Table 8. Beef Consumption . . . . . . . . . . . . . . . . . . . . . . . . . . . . . . . . . . . . . . . . . . . . . . . 12
Appendix A
Table A.1 Domestic Beef Production . . . . . . . . . . . . . . . . . . . . . . . . . . . . . . . . . . . . . . . A.1Table A.2 Imports of Fresh/Chilled and Frozen Beef . . . . . . . . . . . . . . . . . . . . . . . . . A.2Table A.3 Non-NAFTA Beef Imports . . . . . . . . . . . . . . . . . . . . . . . . . . . . . . . . . . . . . . . A.3Table A.4 Imports of Prepared and Cured Beef . . . . . . . . . . . . . . . . . . . . . . . . . . . . . . A.3Table A.5 Total Imports of Fresh/Chilled, Frozen, Prepared and Cured Beef . . . . . . A.4Table A.6 Beginning Frozen Beef Stocks . . . . . . . . . . . . . . . . . . . . . . . . . . . . . . . . . . . . A.5Table A.7 Beef Supply . . . . . . . . . . . . . . . . . . . . . . . . . . . . . . . . . . . . . . . . . . . . . . . . . . . A.6Table A.8 Exports of Fresh, Chilled and Frozen Beef . . . . . . . . . . . . . . . . . . . . . . . . . . A.7Table A.9 Exports of Prepared and Cured Beef . . . . . . . . . . . . . . . . . . . . . . . . . . . . . . . A.8Table A.10 Total Exports of Fresh/Chilled, Frozen, Prepared and Cured Beef . . . . . . A.8Table A.11 Ending Frozen Beef Stocks . . . . . . . . . . . . . . . . . . . . . . . . . . . . . . . . . . . . . . . A.9

Report on Canadian Beef Supply and Disposition with Beef Quality Categorization
Page 1
Background
The Canadian beef industry has undergone extensive structural change during the past tenyears. There has been a significant westward shift of production, primarily from Ontarioand Manitoba to Alberta. Cattle feeding and slaughter activities have concentrated inAlberta with producing units becoming larger in size and fewer in number. Internationaltrade has become an increasingly important component of the Canadian market with beefimports almost doubling in the 1988-1994 period while beef exports essentially tripledduring the same time span. Live cattle imports and exports more than doubled in the 1988-1994 period, however cattle imports are small relative to exports.
During the past five years, Canadian imports of high quality beef, mainly from the UnitedStates, increased dramatically. This development can be attributed, in large part, to thebenefits of trade. The major consumption centres in eastern Canada (Montreal andToronto), are located closer to U.S. beef production centres than to Alberta, Canada’s majorproducing region. Conversely, Alberta is closer to U.S. west coast and central beefconsumption centres than the major U.S. production centres are. Regional differences intastes and preferences also provide incentives to trade. For example, Select and No-rollproduct from the United States, which is discounted in the U.S. relative to Choice grade onthe basis of lack of fat marbling, has found a market in Canada where it competes in the lean end of the domestic fed beef market.
The development of a more open international trading environment, primarily resultingfrom the Uruguay Round, CUSTA and NAFTA agreements, has resulted in a more openand competitive North American beef market. Canada’s imports of beef from the U.S. haveincreased in recent years compared to the levels of the late 1980s. Non-NAFTA beefimports, mainly lower quality manufacturing cuts and grinding meat from Oceania,increased sharply in 1993 - 1994 when access to the U.S. market was more restricted buthave since declined as North American manufacturing beef production has increased.
The pressures for changes in beef trade policy from different segments of the Canadian beefindustry gave rise to the need for a better understanding of the domestic supply anddisposition of beef by major quality types. The initial results of the work on this projectwere reported to the Beef Industry Trade and Development Committee which wasresponsible for making recommendations to the Minister of Agriculture on Canada’s beeftrade policy. This current project builds on the initial work that was reported to thecommittee.
Report on Canadian Beef Supply and Disposition with Beef Quality Categorization
Page 2
Objective
The primary objective of this project is to develop an accounting system which providesestimates of Canadian beef production, imports, exports, stocks, and consumptionclassified by three major quality types: High Quality, Manufacturing Cuts and Grindingbeef.
The main outputs of this report are results of the calculations for the components of thesupply and disposition for the period 1990 -1996 and a forecast for these components forthe 1997 - 1999 period.
Overview of Methodology
The calculations are based on the estimates of the supply and disposition of Canadian beefwhich are published annually by Statistics Canada (STC), Catalogue 23-603. The STC beefsupply and disposition calculation is based primarily on survey data with beefconsumption being calculated as the residual of supply minus exports and ending stocks.The supply and disposition calculations developed in this project mirror the STCcalculations with the additional feature that each of the components is resolved into itsthree quality components, plus fat trim and bone. The results are reported on a productweight basis.
Product Weight and Composition
The definition of beef used in this project does not include veal. These calculations aremade on a “product weight equivalent” basis whereas the STC calculations are based on a“cold carcass weight” basis. Carcass weight specification has some advantages when thefocus of analysis is on production at the farm or slaughter plant level. The initial use ofthese calculations was for trade policy development, therefore it was decided to use theproduct weight basis which closely approximates the “as shipped” weight reported by STCfor international trade. This allows users to view the total product flow for the industry onthe same basis as international trade is reported. This served to facilitate the use of thiswork for policy development related to the beef Tariff Rate Quota. The conversion of beefcarcasses to product (cuts and grinding meat) results in an average of approximately 25%of the carcass weight being removed as fat and bone. The trade data is factored into thethree quality types using the relative proportions developed by Paul D. MacInnes &Associates and reported in Supply & Disposition of Canadian Beef, March 23, 1995 and inthe update to this study dated April 30, 1996. For more details on this aspect of thecalculations, see Appendix C.
Report on Canadian Beef Supply and Disposition with Beef Quality Categorization
Page 3
Definitions of Beef Quality Types
High Quality - beef which generally comes from youthful, grain fed cattle and ispredominantly used for high quality table cuts.
Manufacturing - beef which is produced from cull cattle, grass fed youthful cattle and lowerquality cuts from grain fed cattle. Manufacturing beef is further classified into two maingroups:
a) Manufacturing Cuts which are processed into deli meats and cuts such as thoseused to produce prepared meals.
b) Grinding beef which is used mainly in hamburger patties, ground beef andfurther processed products such as wieners, sausages and soups.
Stocks
It was assumed that frozen stocks were made up of manufacturing cuts and grinding beef.The proportions of manufacturing cuts and grinding beef in stocks of domestic origin wasassumed to be the same as the ratio of these types of beef in domestic production. In thecase of stocks of imported beef, the proportions were assumed to be the same as thosefound in fresh and frozen beef imports.
Imports
The dressed beef import and export quality factors were determined by an independentconsulting firm using industry surveys. The data which was reported represented over80% of the total for both the imports and exports of fresh/chilled and frozen beef. Thepercentage distribution for each of the qualities of beef was calculated from this data andthen applied to the volume of beef imports as reported by Statistics Canada.
Components of Beef Supply and Disposition (1990-1996 & Forecastto 1999)
A summary of the results of the calculations are presented below in the section titled “BeefSupply and Beef Disposition” with more detailed results in Appendix A. The calculationsare based on annual data for the historical period 1990 - 1996 (Tables A1 -A11) and theforecast period 1997 - 1999 (Tables 1-8). Please refer to Appendix B for more detailedexplanations on methodology and data used in the production calculations.
Report on Canadian Beef Supply and Disposition with Beef Quality Categorization
Page 4
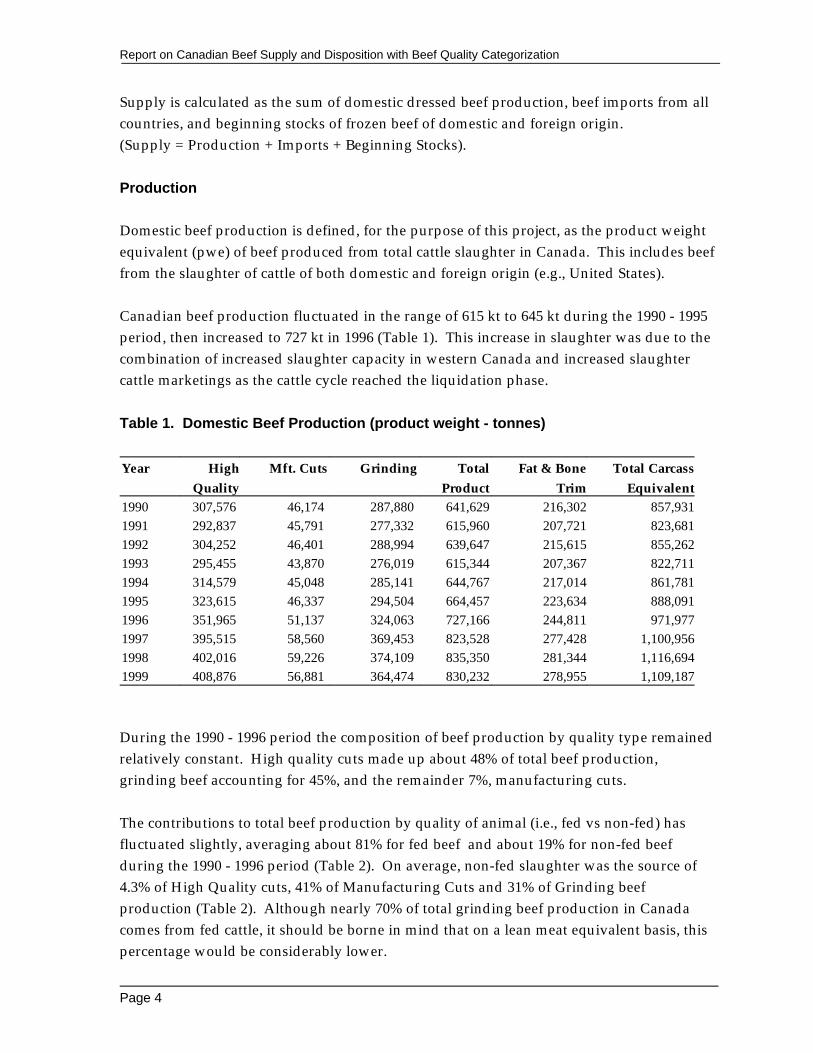
Supply is calculated as the sum of domestic dressed beef production, beef imports from allcountries, and beginning stocks of frozen beef of domestic and foreign origin. (Supply = Production + Imports + Beginning Stocks).
Production
Domestic beef production is defined, for the purpose of this project, as the product weightequivalent (pwe) of beef produced from total cattle slaughter in Canada. This includes beeffrom the slaughter of cattle of both domestic and foreign origin (e.g., United States).
Canadian beef production fluctuated in the range of 615 kt to 645 kt during the 1990 - 1995period, then increased to 727 kt in 1996 (Table 1). This increase in slaughter was due to thecombination of increased slaughter capacity in western Canada and increased slaughtercattle marketings as the cattle cycle reached the liquidation phase.
Table 1. Domestic Beef Production (product weight - tonnes)
Year High Mft. Cuts Grinding Total Fat & Bone Total CarcassQuality Product Trim Equivalent
1990 307,576 46,174 287,880 641,629 216,302 857,9311991 292,837 45,791 277,332 615,960 207,721 823,6811992 304,252 46,401 288,994 639,647 215,615 855,2621993 295,455 43,870 276,019 615,344 207,367 822,7111994 314,579 45,048 285,141 644,767 217,014 861,7811995 323,615 46,337 294,504 664,457 223,634 888,0911996 351,965 51,137 324,063 727,166 244,811 971,9771997 395,515 58,560 369,453 823,528 277,428 1,100,9561998 402,016 59,226 374,109 835,350 281,344 1,116,6941999 408,876 56,881 364,474 830,232 278,955 1,109,187
During the 1990 - 1996 period the composition of beef production by quality type remainedrelatively constant. High quality cuts made up about 48% of total beef production,grinding beef accounting for 45%, and the remainder 7%, manufacturing cuts.
The contributions to total beef production by quality of animal (i.e., fed vs non-fed) hasfluctuated slightly, averaging about 81% for fed beef and about 19% for non-fed beefduring the 1990 - 1996 period (Table 2). On average, non-fed slaughter was the source of4.3% of High Quality cuts, 41% of Manufacturing Cuts and 31% of Grinding beefproduction (Table 2). Although nearly 70% of total grinding beef production in Canadacomes from fed cattle, it should be borne in mind that on a lean meat equivalent basis, thispercentage would be considerably lower.

Report on Canadian Beef Supply and Disposition with Beef Quality Categorization
Page 5
Table 2. Fed and Non-Fed Beef Production as Percent Category
High Quality Mft. Cuts Grinding Total
Year Non-fed Fed Non-fed Fed Non-fed Fed Non-fed Fed
1990 4.5 95.5 41.3 58.7 31.7 68.3 19.4 80.61991 4.8 95.2 43.9 56.1 32.8 67.2 20.4 79.61992 4.4 95.6 42.2 57.8 32.7 67.3 19.9 80.11993 4.2 95.8 40.5 59.5 31.5 68.5 19.0 81.01994 3.9 96.1 38.0 62.0 29.2 70.8 17.4 82.61995 3.8 96.2 38.0 62.0 29.4 70.6 17.6 82.41996 4.0 96.0 39.0 61.0 30.3 69.7 18.2 81.81997 4.2 95.8 40.2 59.8 31.4 68.6 19.0 81.01998 4.2 95.8 39.9 60.1 31.1 68.9 18.7 81.31999 3.5 96.5 35.9 64.1 27.6 72.4 16.3 83.7
The Canadian cattle herd was in the expansion phase of the cattle cycle during the 1987-1995 period, resulting in a reduced rate of female marketings as cow culling was curtailedand heifers were diverted from the slaughter stream to the breeding herd. Steer marketingsbegan to increase in 1992, however heifer marketings did not show marked increases until1996 when their retention for breeding purposes began to decline. Cull cattle marketingswere low during the 1993 - 1995 period as beef producers extended the production life oftheir mature cows in order to more quickly increase their feeder calf output. The cost offeed grains began to increase in 1994 and trended upward until the fall of 1996. As a result,the cost of cattle feeding escalated, initiating a sharp decline in feeder prices which curtailedthe expansion of the breeding herd. Additional heifers were directed to the fed cattleproduction stream as retention rates declined. At the same time, increased cow cullingcontributed to non-fed beef output.
The 1997- 1999 data is based on AAFC forecasts. It is assumed that Canadian cattleslaughter will increase through the forecast period, given the current expansion of domesticslaughter capacity and the expected high level of cattle marketings as the industry reachesthe peak in the cattle production cycle later in the decade. Assuming that feed grain pricesreturn to trend line averages, beef herd rebuilding is expected to commence again in 1999,resulting in declines in both slaughter cattle marketings and domestic beef production. Beef production is forecasted to continue to increase, reaching a peak in 1998, after which itis expected to decline as the liquidation phase ends (Table 1).
Report on Canadian Beef Supply and Disposition with Beef Quality Categorization
Page 6
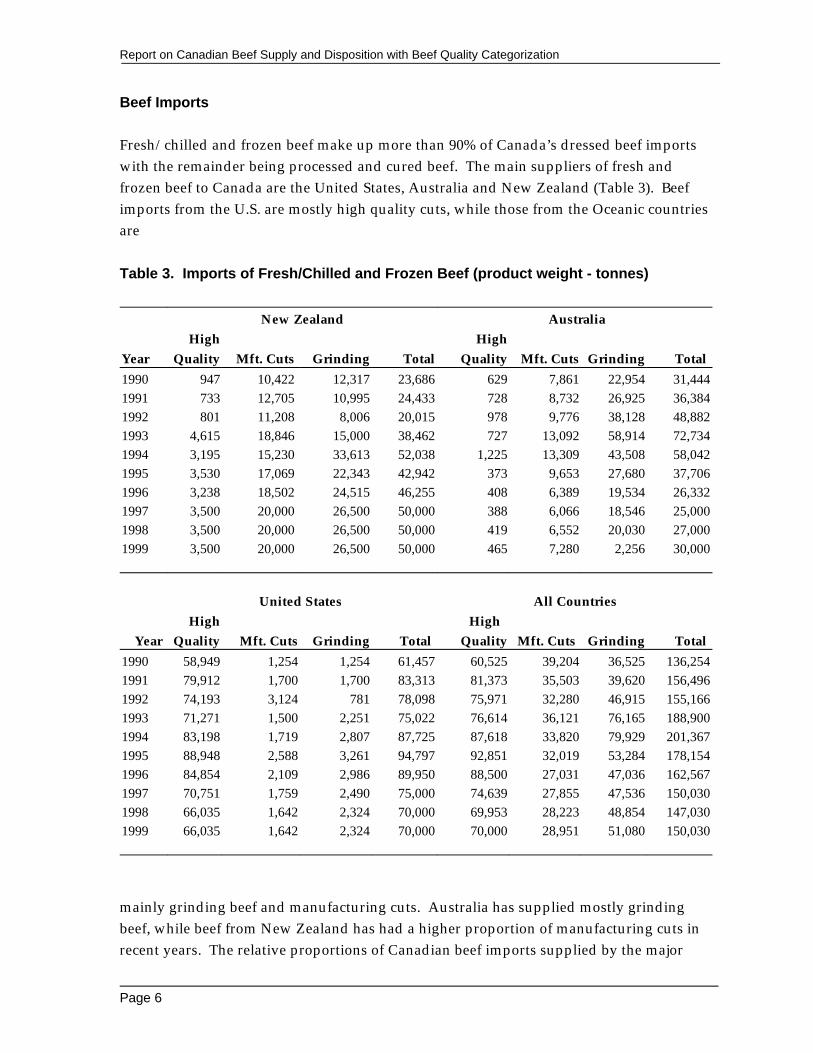
Beef Imports
Fresh/chilled and frozen beef make up more than 90% of Canada’s dressed beef importswith the remainder being processed and cured beef. The main suppliers of fresh andfrozen beef to Canada are the United States, Australia and New Zealand (Table 3). Beefimports from the U.S. are mostly high quality cuts, while those from the Oceanic countriesare
Table 3. Imports of Fresh/Chilled and Frozen Beef (product weight - tonnes)
New Zealand Australia High High
Year Quality Mft. Cuts Grinding Total Quality Mft. Cuts Grinding Total
1990 947 10,422 12,317 23,686 629 7,861 22,954 31,4441991 733 12,705 10,995 24,433 728 8,732 26,925 36,3841992 801 11,208 8,006 20,015 978 9,776 38,128 48,8821993 4,615 18,846 15,000 38,462 727 13,092 58,914 72,7341994 3,195 15,230 33,613 52,038 1,225 13,309 43,508 58,0421995 3,530 17,069 22,343 42,942 373 9,653 27,680 37,7061996 3,238 18,502 24,515 46,255 408 6,389 19,534 26,3321997 3,500 20,000 26,500 50,000 388 6,066 18,546 25,0001998 3,500 20,000 26,500 50,000 419 6,552 20,030 27,0001999 3,500 20,000 26,500 50,000 465 7,280 2,256 30,000
United States All Countries
High High Year Quality Mft. Cuts Grinding Total Quality Mft. Cuts Grinding Total
1990 58,949 1,254 1,254 61,457 60,525 39,204 36,525 136,2541991 79,912 1,700 1,700 83,313 81,373 35,503 39,620 156,4961992 74,193 3,124 781 78,098 75,971 32,280 46,915 155,1661993 71,271 1,500 2,251 75,022 76,614 36,121 76,165 188,9001994 83,198 1,719 2,807 87,725 87,618 33,820 79,929 201,3671995 88,948 2,588 3,261 94,797 92,851 32,019 53,284 178,1541996 84,854 2,109 2,986 89,950 88,500 27,031 47,036 162,5671997 70,751 1,759 2,490 75,000 74,639 27,855 47,536 150,0301998 66,035 1,642 2,324 70,000 69,953 28,223 48,854 147,0301999 66,035 1,642 2,324 70,000 70,000 28,951 51,080 150,030
mainly grinding beef and manufacturing cuts. Australia has supplied mostly grindingbeef, while beef from New Zealand has had a higher proportion of manufacturing cuts inrecent years. The relative proportions of Canadian beef imports supplied by the major

Report on Canadian Beef Supply and Disposition with Beef Quality Categorization
Page 7
source countries have fluctuated widely, averaging about 19% from New Zealand, 28%from Australia and 48% from the U.S. during 1990-1995. The U.S. was the main source ofhigh quality imports with manufacturing type beef coming primarily from Oceania. Thewide variations of volumes, particularly from Oceanic countries is evident in Table 3.
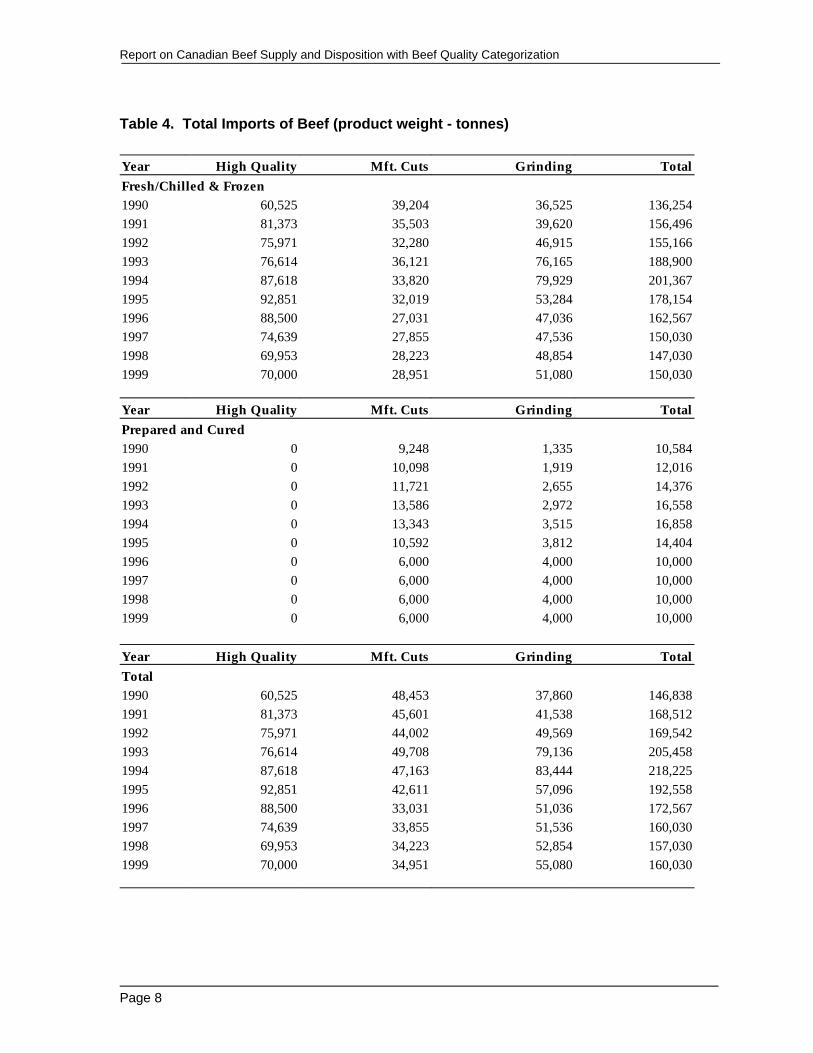
Beef imports increased sharply in the 1993-1994 period, averaging about 211 kt per yearcompared to 147 kt in 1990 (Table 4). Canada’s beef safeguard, which came into effect mid-1993, set a tariff rate quota of 48,014 tonnes for the period of May 1 to December 31, 1993. This quota was filled by July 14, after which a 25% ad valorem surtax was imposed on non-NAFTA beef imports. The safeguard set the 1994 tariff rate quota at 72,021 tonnes,however additional imports under supplementary import permits and beef imported withsurtax brought the total to near 114 kt. On January 1, 1995, the GATT Tariff Rate Quota(76,409 tonnes) was implemented with an over-quota tariff rate of 30.3%. No over-quotatariffs were paid on beef imports for either 1995 and 1996.
Imports for the forecast period were assumed to be on a declining trend due primarily tothe increased domestic beef production that is expected to take place in western Canada.This scenario would result in beef imports declining from a peak of 218 kt in 1994 to about160 kt in 1999 (Table 4).
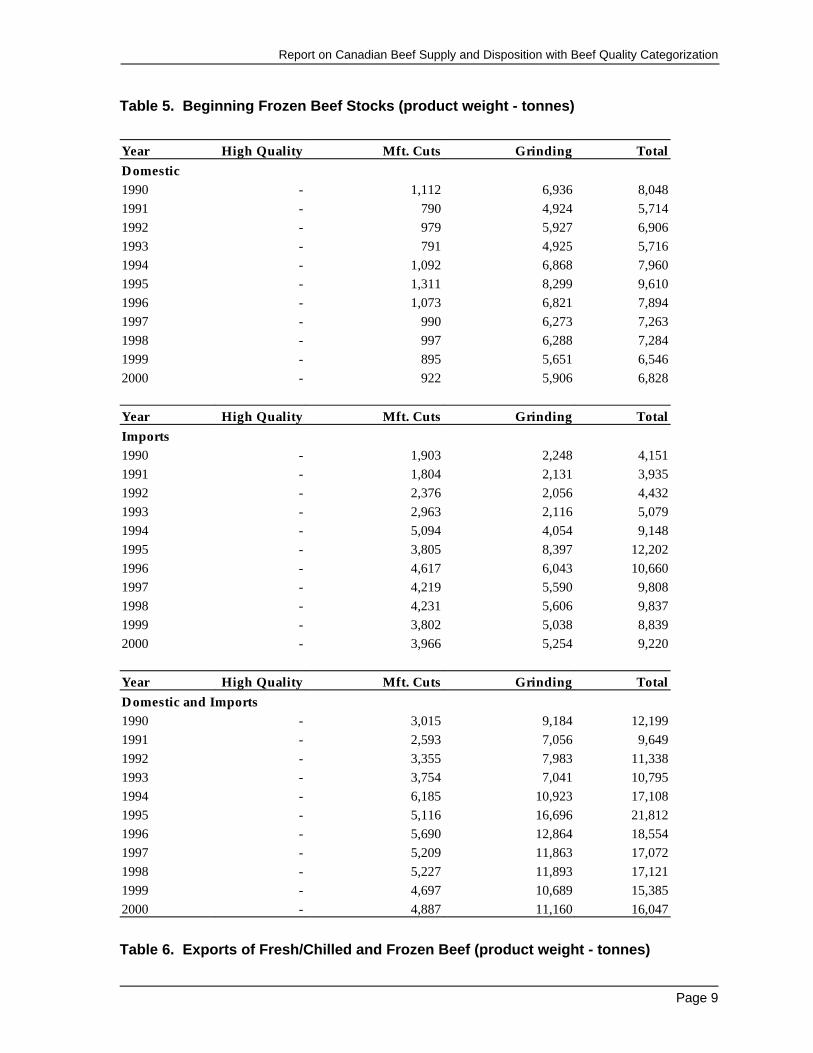
Stocks
Beginning stocks of frozen beef of both domestic and foreign origin have been relativelysmall, increasing in 1994 and 1995 as market uncertainty increased during the period ofdevelopment of beef trade policy (Table 5).
Disposition of Beef
Disposition is defined as the sum of ending stocks, exports and domestic disappearance(consumption) (Disposition = Ending Stocks + Exports +Disappearance).The balance sheet requires that disposition be equal to supply. Given that production,imports, exports and stocks are reported to statistical agencies, domestic disappearance canbe calculated from the balance sheet as the residual of supply minus exports minus endingstocks of frozen beef.
Exports
Canadian exports of fresh, chilled and frozen beef grew at higher rates than imports, morethan doubling in the 1990 - 1995 period, reaching 189 kt in 1996 which surpassed imports(Table 6). Exports of prepared and cured beef have been very small, representing less than
Report on Canadian Beef Supply and Disposition with Beef Quality Categorization
Page 8
Table 4. Total Imports of Beef (product weight - tonnes)
Year High Quality Mft. Cuts Grinding TotalFresh/Chilled & Frozen1990 60,525 39,204 36,525 136,2541991 81,373 35,503 39,620 156,4961992 75,971 32,280 46,915 155,1661993 76,614 36,121 76,165 188,9001994 87,618 33,820 79,929 201,3671995 92,851 32,019 53,284 178,1541996 88,500 27,031 47,036 162,5671997 74,639 27,855 47,536 150,0301998 69,953 28,223 48,854 147,0301999 70,000 28,951 51,080 150,030
Year High Quality Mft. Cuts Grinding TotalPrepared and Cured1990 0 9,248 1,335 10,5841991 0 10,098 1,919 12,0161992 0 11,721 2,655 14,3761993 0 13,586 2,972 16,5581994 0 13,343 3,515 16,8581995 0 10,592 3,812 14,4041996 0 6,000 4,000 10,0001997 0 6,000 4,000 10,0001998 0 6,000 4,000 10,0001999 0 6,000 4,000 10,000
Year High Quality Mft. Cuts Grinding TotalTotal 1990 60,525 48,453 37,860 146,8381991 81,373 45,601 41,538 168,5121992 75,971 44,002 49,569 169,5421993 76,614 49,708 79,136 205,4581994 87,618 47,163 83,444 218,2251995 92,851 42,611 57,096 192,5581996 88,500 33,031 51,036 172,5671997 74,639 33,855 51,536 160,0301998 69,953 34,223 52,854 157,0301999 70,000 34,951 55,080 160,030
Report on Canadian Beef Supply and Disposition with Beef Quality Categorization
Page 9
Table 5. Beginning Frozen Beef Stocks (product weight - tonnes)
Year High Quality Mft. Cuts Grinding TotalDomestic1990 - 1,112 6,936 8,0481991 - 790 4,924 5,7141992 - 979 5,927 6,9061993 - 791 4,925 5,7161994 - 1,092 6,868 7,9601995 - 1,311 8,299 9,6101996 - 1,073 6,821 7,8941997 - 990 6,273 7,2631998 - 997 6,288 7,2841999 - 895 5,651 6,5462000 - 922 5,906 6,828
Year High Quality Mft. Cuts Grinding TotalImports1990 - 1,903 2,248 4,1511991 - 1,804 2,131 3,9351992 - 2,376 2,056 4,4321993 - 2,963 2,116 5,0791994 - 5,094 4,054 9,1481995 - 3,805 8,397 12,2021996 - 4,617 6,043 10,6601997 - 4,219 5,590 9,8081998 - 4,231 5,606 9,8371999 - 3,802 5,038 8,8392000 - 3,966 5,254 9,220
Year High Quality Mft. Cuts Grinding TotalDomestic and Imports1990 - 3,015 9,184 12,1991991 - 2,593 7,056 9,6491992 - 3,355 7,983 11,3381993 - 3,754 7,041 10,7951994 - 6,185 10,923 17,1081995 - 5,116 16,696 21,8121996 - 5,690 12,864 18,5541997 - 5,209 11,863 17,0721998 - 5,227 11,893 17,1211999 - 4,697 10,689 15,3852000 - 4,887 11,160 16,047
Table 6. Exports of Fresh/Chilled and Frozen Beef (product weight - tonnes)

Report on Canadian Beef Supply and Disposition with Beef Quality Categorization
Page 10
U.S. JapanHigh High
Year Quality Mft. Cuts Grinding Total Quality Mft. Cuts Grinding Total1990 23,964 6,740 40,438 71,142 1,036 1,838 267 3,141 1991 24,426 6,870 40,455 71,751 1,349 1,263 172 2,785 1992 36,927 11,078 60,315 108,320 1,369 1,369 - 2,739 1993 58,015 10,413 63,965 132,392 849 849 - 1,699 1994 60,877 21,306 66,637 148,820 2,573 495 1,354 4,422 1995 53,687 18,921 74,745 147,353 3,864 689 1,709 6,262 1996 74,500 16,108 86,581 177,189 4,422 819 2,136 7,377 1997 96,938 20,960 112,658 230,556 5,753 1,066 2,779 9,598 1998 101,549 21,379 114,911 237,839 5,868 1,087 2,835 9,790 1999 101,549 21,379 114,911 237,839 5,868 1,087 2,835 9,790
Other Countries All CountriesHigh High
Year Quality Mft. Cuts Grinding Total Quality Mft. Cuts Grinding Total1990 177 288 543 1,007 25,176 8,866 41,248 75,290 1991 70 287 276 633 25,845 8,420 40,903 75,169 1992 109 722 18 849 38,406 13,169 60,333 111,908 1993 389 374 89 851 59,253 11,636 64,054 134,942 1994 1,969 467 474 2,910 65,419 22,268 68,465 156,152 1995 2,453 448 623 3,524 60,003 20,059 77,077 157,138 1996 2,822 593 736 4,151 81,744 17,520 89,453 188,717 1997 3,672 772 957 5,402 106,364 22,797 116,394 245,555 1998 3,746 787 977 5,510 111,163 23,253 118,722 253,139 1999 3,746 787 977 5,510 111,163 23,253 118,722 253,139
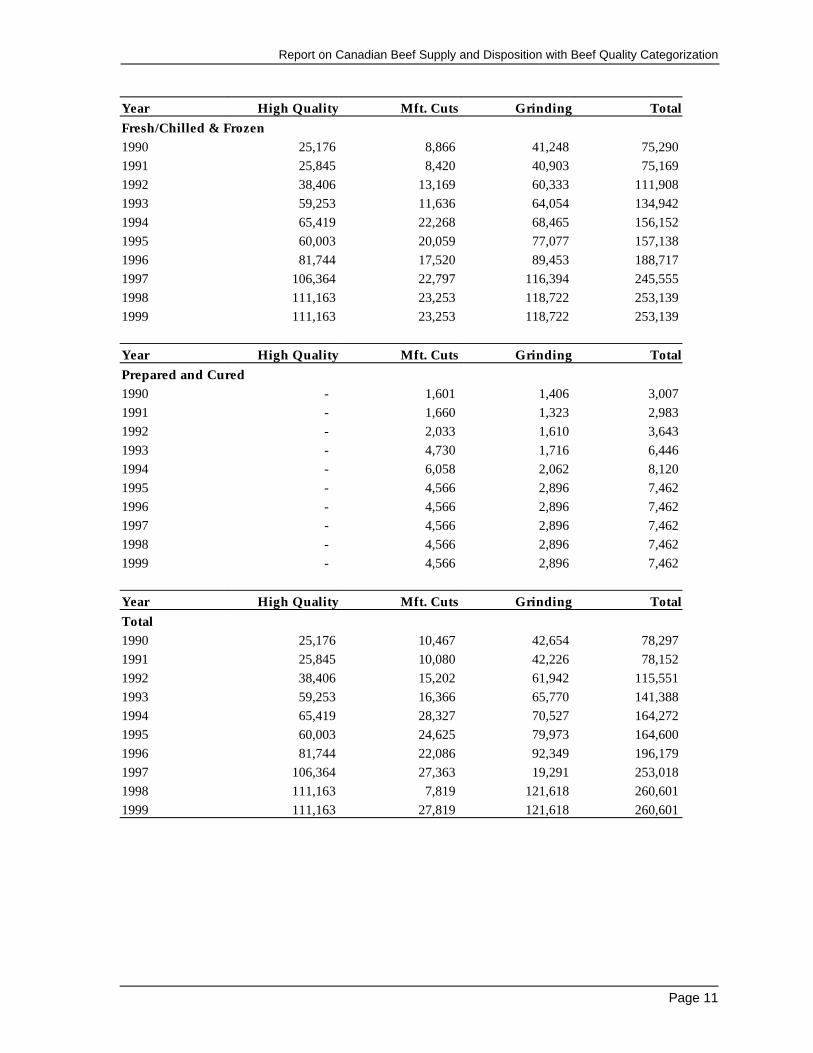
5% of total beef exports (Table 7). Almost all of Canada’s beef exports go to the U.S. withalmost half the total being high quality beef. Given that beef production in Canada wasrelatively constant and consumption declined slightly in the 1990 - 1994 period, increasedexports were tied closely to increased imports. This situation is expected to changesignificantly in the forecast period when slaughter cattle marketings, domestic beefproduction, and beef exports are forecasted to increase. Imports are expected to decline tothe levels of the early 1990s. The major factors in this switch from being a net importer ofdressed beef to becoming a net exporter are the increase in modern slaughtering andprocessing capacity and higher slaughter cattle marketings.
Table 7. Total Exports of Beef (product weight - tonnes)
Report on Canadian Beef Supply and Disposition with Beef Quality Categorization
Page 11
Year High Quality Mft. Cuts Grinding TotalFresh/Chilled & Frozen1990 25,176 8,866 41,248 75,290 1991 25,845 8,420 40,903 75,169 1992 38,406 13,169 60,333 111,908 1993 59,253 11,636 64,054 134,942 1994 65,419 22,268 68,465 156,152 1995 60,003 20,059 77,077 157,138 1996 81,744 17,520 89,453 188,717 1997 106,364 22,797 116,394 245,555 1998 111,163 23,253 118,722 253,139 1999 111,163 23,253 118,722 253,139
Year High Quality Mft. Cuts Grinding TotalPrepared and Cured1990 - 1,601 1,406 3,007 1991 - 1,660 1,323 2,983 1992 - 2,033 1,610 3,643 1993 - 4,730 1,716 6,446 1994 - 6,058 2,062 8,120 1995 - 4,566 2,896 7,462 1996 - 4,566 2,896 7,462 1997 - 4,566 2,896 7,462 1998 - 4,566 2,896 7,462 1999 - 4,566 2,896 7,462
Year High Quality Mft. Cuts Grinding TotalTotal 1990 25,176 10,467 42,654 78,297 1991 25,845 10,080 42,226 78,152 1992 38,406 15,202 61,942 115,551 1993 59,253 16,366 65,770 141,388 1994 65,419 28,327 70,527 164,272 1995 60,003 24,625 79,973 164,600 1996 81,744 22,086 92,349 196,179 1997 106,364 27,363 19,291 253,018 1998 111,163 7,819 121,618 260,601 1999 111,163 27,819 121,618 260,601

Report on Canadian Beef Supply and Disposition with Beef Quality Categorization
Page 12
Stocks
Ending stocks of frozen beef are taken to be identical to the beginning stocks of thefollowing year.
Consumption
Total consumption of beef in Canada declined in the 1990 - 1993 period, then was relativelyflat in the 1994 - 1996 period. The composition of consumption appears to have changedover the 1990 - 1996 period, with both high quality and manufacturing beef declining whilegrinding beef consumption remained relatively flat (Table 8).
Table 8. Beef Consumption (product weight - tonnes)
Year High Quality Mft. Cuts Grinding TotalAll Sources1990 342,925 84,581 285,214 712,720 1991 348,365 80,551 275,716 704,632 1992 341,818 74,801 277,563 694,182 1993 312,816 74,780 285,504 673,101 1994 336,778 64,955 292,284 694,016 1995 356,463 63,749 275,459 695,672 1996 358,722 62,563 283,751 705,036 1997 363,790 65,033 301,668 730,491 1998 360,805 66,161 306,549 733,515 1999 367,713 64,013 297,935 729,661
Errors in estimating the consumption of the three types of beef are sensitive to the errors inthe estimates in the proportions in imports and exports in addition to the errors inestimating the proportions in domestic production. Although the breakout of carcassesinto cuts and trim is probably quite constant, economics will determine whether certaincuts are marketed as cuts or as grinding meat. The effects of relative beef prices andsupplies on the proportions of grinding beef derived from a carcass have not beendetermined in this work, therefore the combined effect will show up as errors inconsumption.
Report on Canadian Beef Supply and Disposition with Beef Quality Categorization
Page 13
Conclusions
The period from 1990 to 1995 provided Canadian beef producers with challenges,particularly with respect to imports of manufacturing beef. Disagreements arose within theindustry as to the need for imports of non-NAFTA manufacturing beef above the level(76,409 tonnes) established by the tariff rate quota in accordance with the most recent GATTagreement. Cattle producers took the position that there was enough beef being producedto satisfy domestic demand, while further processors maintained that the particular typeand quality of beef required for their products was not available in sufficient quantitiesfrom domestic sources. The resultant policy development process required a moredefinitive assessment of the supply and disposition of beef in the Canadian market thanhad been made to date. This S&D calculation which included three quality types of beefwas initially a product of that process. Inputs came from industry, government and privateconsultants, however the responsibility for errors and omissions which may have occurredare borne by the authors. Despite the faults inherent in a complicated calculation whichrequires many inputs of a judgmental nature, we hope that this project has furthered theknowledge that is available on the Canadian beef industry. The addition of the forecast isour attempt to extend the utility of the project, but is of course limited by the uncertainty ofthe assumptions which form the basis of projections.
Report on Canadian Beef Supply and Disposition with Beef Quality Categorization
Page 14
Report on Canadian Beef Supply and Disposition with Beef Quality Categorization
Page 15
Data Sources
Total Cattle Slaughter, Statistics Canada, Agriculture Division
Federally Inspected Slaughter by Sex & Average Carcass Weights, Agriculture and Agri-FoodCanada, Food Production and Inspection Branch; and Statistics Canada, AgricultureDivision.
Carcass Subprimal Yield Factors, Agriculture and Agri-Food Canada, Lacombe ResearchStation and Paul D. MacInnes and Associates.
Beef Quality Yield Factors, Paul D. MacInnes and Associates.
Average Head Meat Weight, Statistics Canada, Agriculture Division.
Beef Trade Statistics, Statistics Canada, International Trade Division, Trade Tapes.
Beef Trade Quality factors 1990-1993, Paul D. MacInnes & Associates, Supply & Dispositionof Canadian Beef, March 23, 1995.
Updated Beef Trade Quality Factors 1994 & 1995, Paul D. MacInnes & Associates, Supply &Disposition of Canadian Beef 1994 & 1995 April 30, 1996.
Frozen Beef Stocks, Statistics Canada, Catalogue 23 - 603.
Report on Canadian Beef Supply and Disposition with Beef Quality Categorization
Page A.1
Appendix A(Tables A.1 -A.11)
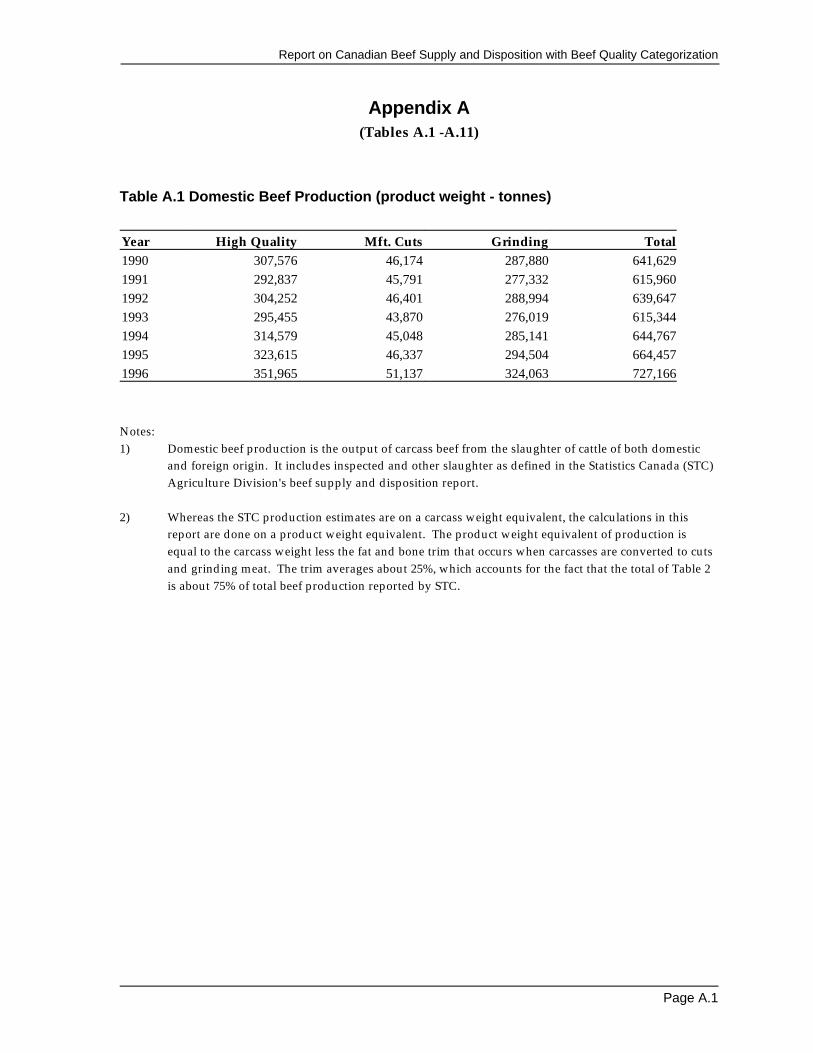
Table A.1 Domestic Beef Production (product weight - tonnes)
Year High Quality Mft. Cuts Grinding Total1990 307,576 46,174 287,880 641,6291991 292,837 45,791 277,332 615,9601992 304,252 46,401 288,994 639,6471993 295,455 43,870 276,019 615,3441994 314,579 45,048 285,141 644,7671995 323,615 46,337 294,504 664,4571996 351,965 51,137 324,063 727,166
Notes:1) Domestic beef production is the output of carcass beef from the slaughter of cattle of both domestic
and foreign origin. It includes inspected and other slaughter as defined in the Statistics Canada (STC)Agriculture Division's beef supply and disposition report.
2) Whereas the STC production estimates are on a carcass weight equivalent, the calculations in thisreport are done on a product weight equivalent. The product weight equivalent of production isequal to the carcass weight less the fat and bone trim that occurs when carcasses are converted to cutsand grinding meat. The trim averages about 25%, which accounts for the fact that the total of Table 2is about 75% of total beef production reported by STC.
Report on Canadian Beef Supply and Disposition with Beef Quality Categorization
Page A.2
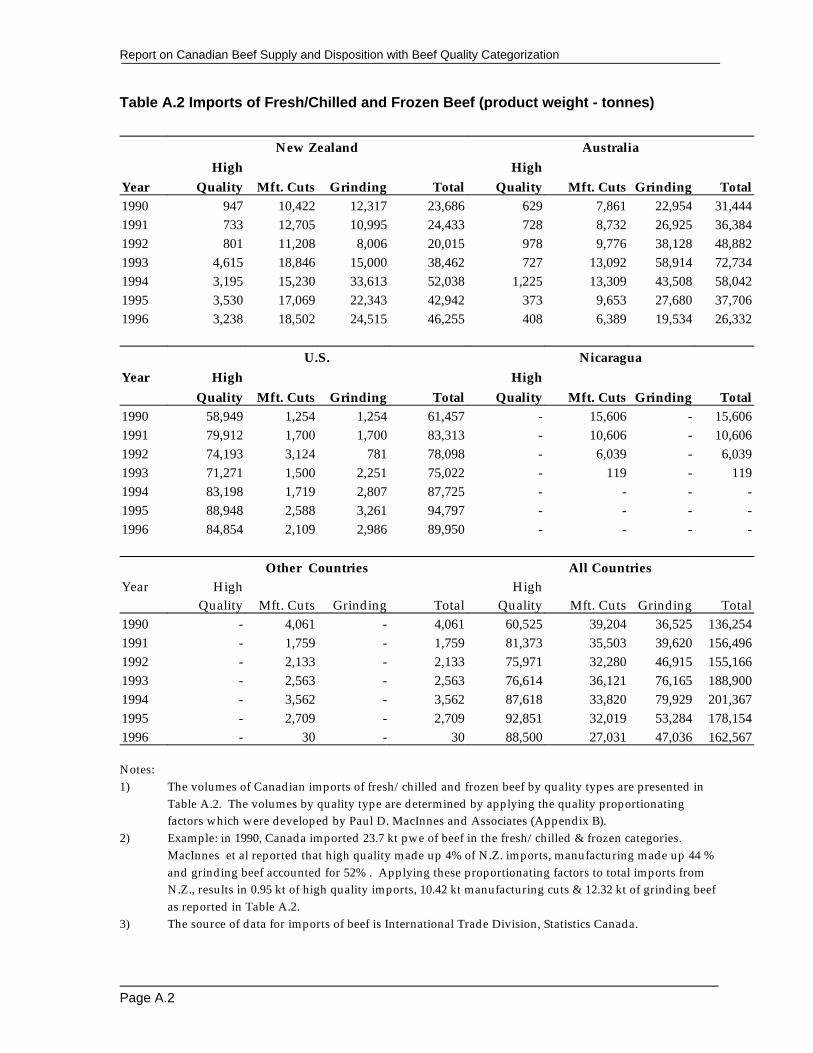
Table A.2 Imports of Fresh/Chilled and Frozen Beef (product weight - tonnes)
New Zealand Australia
Year Quality Mft. Cuts Grinding Total Quality Mft. Cuts Grinding TotalHigh High
1990 947 10,422 12,317 23,686 629 7,861 22,954 31,4441991 733 12,705 10,995 24,433 728 8,732 26,925 36,3841992 801 11,208 8,006 20,015 978 9,776 38,128 48,8821993 4,615 18,846 15,000 38,462 727 13,092 58,914 72,7341994 3,195 15,230 33,613 52,038 1,225 13,309 43,508 58,0421995 3,530 17,069 22,343 42,942 373 9,653 27,680 37,7061996 3,238 18,502 24,515 46,255 408 6,389 19,534 26,332
U.S. NicaraguaYear High High
Quality Mft. Cuts Grinding Total Quality Mft. Cuts Grinding Total1990 58,949 1,254 1,254 61,457 - 15,606 - 15,6061991 79,912 1,700 1,700 83,313 - 10,606 - 10,6061992 74,193 3,124 781 78,098 - 6,039 - 6,0391993 71,271 1,500 2,251 75,022 - 119 - 1191994 83,198 1,719 2,807 87,725 - - - -1995 88,948 2,588 3,261 94,797 - - - -1996 84,854 2,109 2,986 89,950 - - - -
Other Countries All CountriesYear High High
Quality Mft. Cuts Grinding Total Quality Mft. Cuts Grinding Total1990 - 4,061 - 4,061 60,525 39,204 36,525 136,2541991 - 1,759 - 1,759 81,373 35,503 39,620 156,4961992 - 2,133 - 2,133 75,971 32,280 46,915 155,1661993 - 2,563 - 2,563 76,614 36,121 76,165 188,9001994 - 3,562 - 3,562 87,618 33,820 79,929 201,3671995 - 2,709 - 2,709 92,851 32,019 53,284 178,1541996 - 30 - 30 88,500 27,031 47,036 162,567
Notes:1) The volumes of Canadian imports of fresh/chilled and frozen beef by quality types are presented in
Table A.2. The volumes by quality type are determined by applying the quality proportionatingfactors which were developed by Paul D. MacInnes and Associates (Appendix B).
2) Example: in 1990, Canada imported 23.7 kt pwe of beef in the fresh/chilled & frozen categories. MacInnes et al reported that high quality made up 4% of N.Z. imports, manufacturing made up 44 %and grinding beef accounted for 52% . Applying these proportionating factors to total imports fromN.Z., results in 0.95 kt of high quality imports, 10.42 kt manufacturing cuts & 12.32 kt of grinding beefas reported in Table A.2.
3) The source of data for imports of beef is International Trade Division, Statistics Canada.
Report on Canadian Beef Supply and Disposition with Beef Quality Categorization
Page A.3
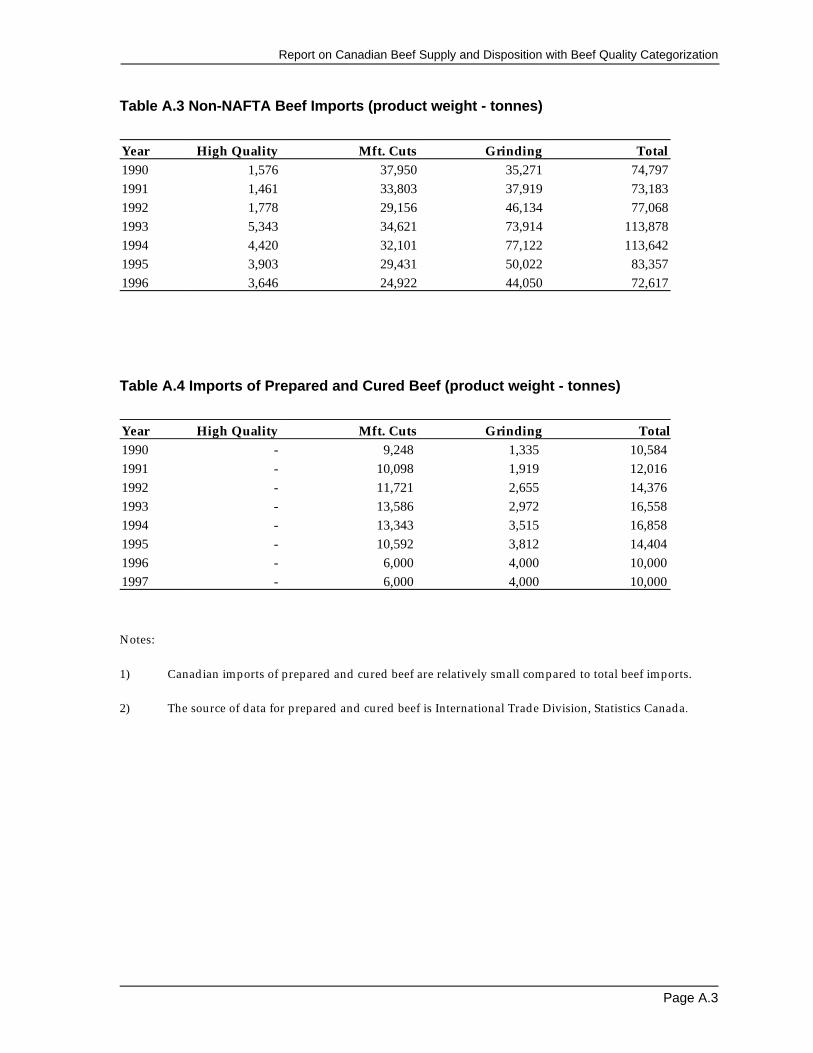
Table A.3 Non-NAFTA Beef Imports (product weight - tonnes)
Year High Quality Mft. Cuts Grinding Total1990 1,576 37,950 35,271 74,7971991 1,461 33,803 37,919 73,1831992 1,778 29,156 46,134 77,0681993 5,343 34,621 73,914 113,8781994 4,420 32,101 77,122 113,6421995 3,903 29,431 50,022 83,3571996 3,646 24,922 44,050 72,617
Table A.4 Imports of Prepared and Cured Beef (product weight - tonnes)
Year High Quality Mft. Cuts Grinding Total1990 - 9,248 1,335 10,584 1991 - 10,098 1,919 12,016 1992 - 11,721 2,655 14,376 1993 - 13,586 2,972 16,558 1994 - 13,343 3,515 16,858 1995 - 10,592 3,812 14,404 1996 - 6,000 4,000 10,000 1997 - 6,000 4,000 10,000
Notes:
1) Canadian imports of prepared and cured beef are relatively small compared to total beef imports.
2) The source of data for prepared and cured beef is International Trade Division, Statistics Canada.
Report on Canadian Beef Supply and Disposition with Beef Quality Categorization
Page A.4
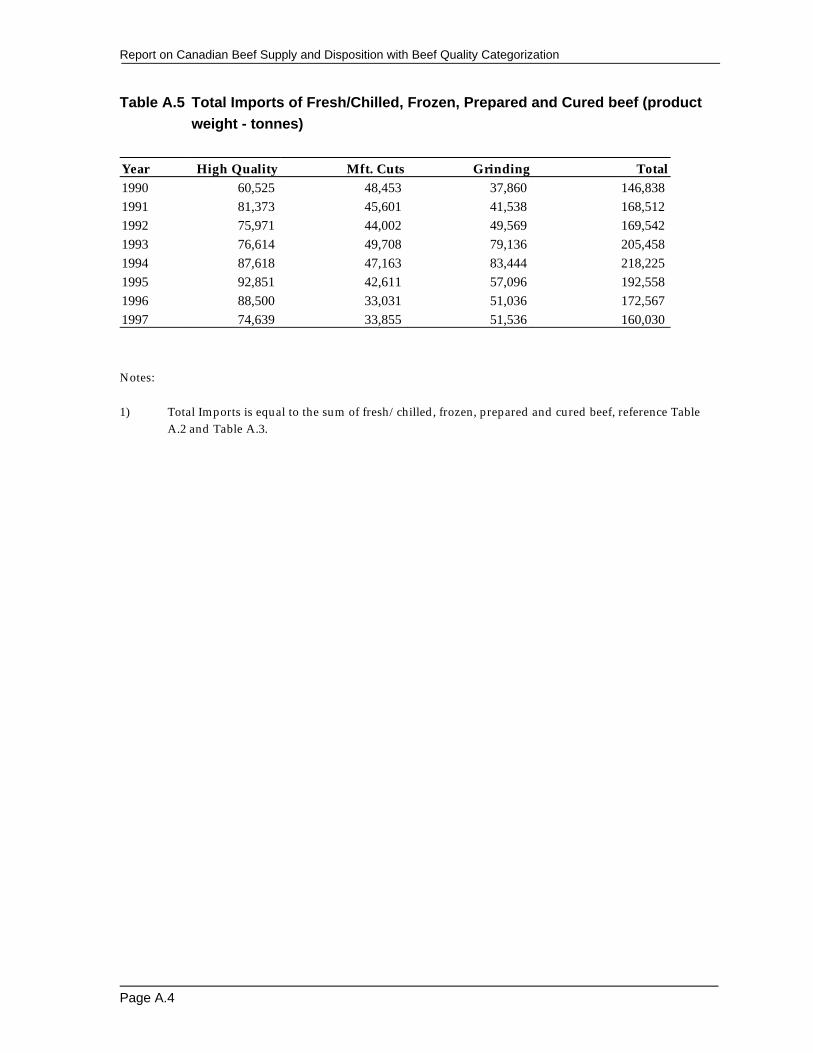
Table A.5 Total Imports of Fresh/Chilled, Frozen, Prepared and Cured beef (product
weight - tonnes)
Year High Quality Mft. Cuts Grinding Total1990 60,525 48,453 37,860 146,838 1991 81,373 45,601 41,538 168,512 1992 75,971 44,002 49,569 169,542 1993 76,614 49,708 79,136 205,458 1994 87,618 47,163 83,444 218,225 1995 92,851 42,611 57,096 192,558 1996 88,500 33,031 51,036 172,567 1997 74,639 33,855 51,536 160,030
Notes:
1) Total Imports is equal to the sum of fresh/chilled, frozen, prepared and cured beef, reference TableA.2 and Table A.3.
Report on Canadian Beef Supply and Disposition with Beef Quality Categorization
Page A.5
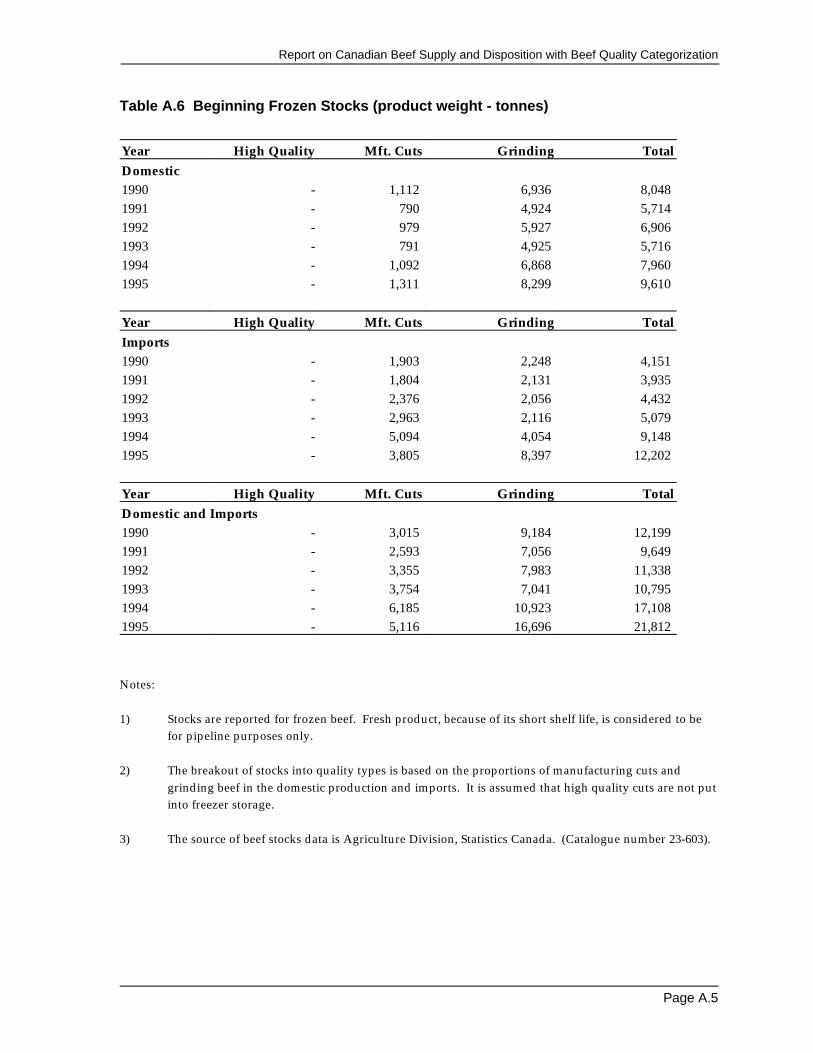
Table A.6 Beginning Frozen Stocks (product weight - tonnes)
Year High Quality Mft. Cuts Grinding TotalDomestic1990 - 1,112 6,936 8,048 1991 - 790 4,924 5,714 1992 - 979 5,927 6,906 1993 - 791 4,925 5,716 1994 - 1,092 6,868 7,960 1995 - 1,311 8,299 9,610
Year High Quality Mft. Cuts Grinding TotalImports1990 - 1,903 2,248 4,151 1991 - 1,804 2,131 3,935 1992 - 2,376 2,056 4,432 1993 - 2,963 2,116 5,079 1994 - 5,094 4,054 9,148 1995 - 3,805 8,397 12,202
Year High Quality Mft. Cuts Grinding TotalDomestic and Imports1990 - 3,015 9,184 12,199 1991 - 2,593 7,056 9,649 1992 - 3,355 7,983 11,338 1993 - 3,754 7,041 10,795 1994 - 6,185 10,923 17,108 1995 - 5,116 16,696 21,812
Notes:
1) Stocks are reported for frozen beef. Fresh product, because of its short shelf life, is considered to befor pipeline purposes only.
2) The breakout of stocks into quality types is based on the proportions of manufacturing cuts andgrinding beef in the domestic production and imports. It is assumed that high quality cuts are not putinto freezer storage.
3) The source of beef stocks data is Agriculture Division, Statistics Canada. (Catalogue number 23-603).
Report on Canadian Beef Supply and Disposition with Beef Quality Categorization
Page A.6
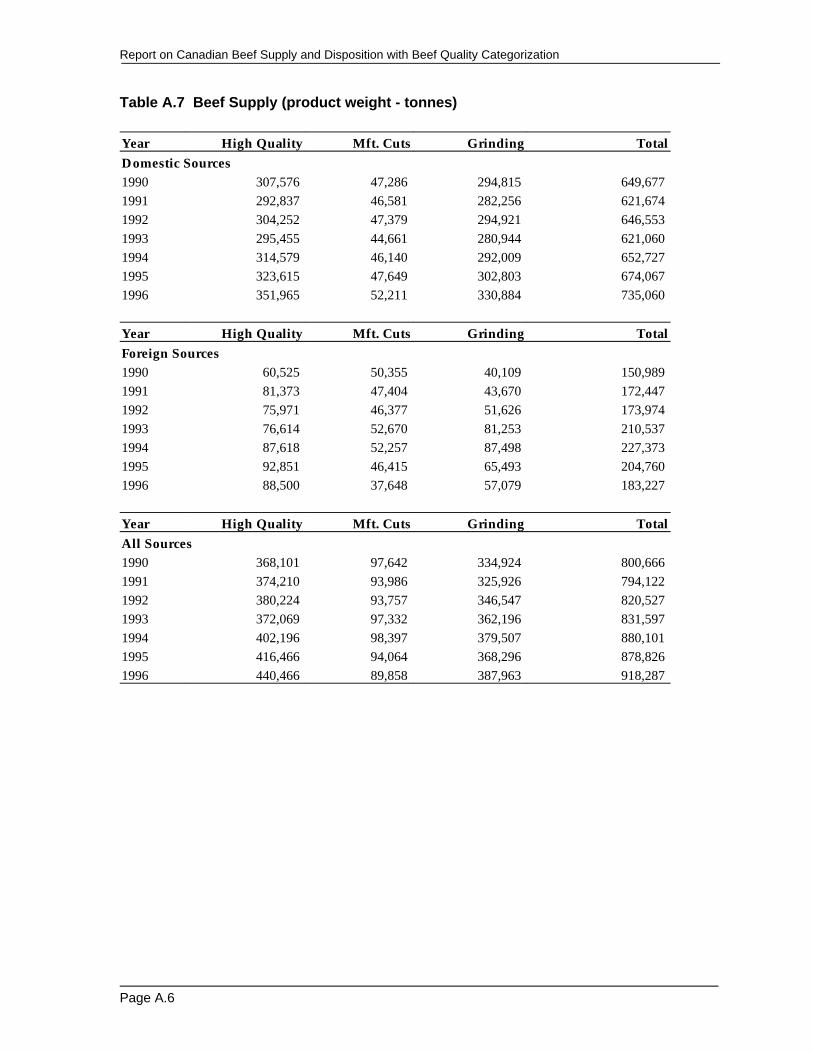
Table A.7 Beef Supply (product weight - tonnes)
Year High Quality Mft. Cuts Grinding TotalDomestic Sources1990 307,576 47,286 294,815 649,677 1991 292,837 46,581 282,256 621,674 1992 304,252 47,379 294,921 646,553 1993 295,455 44,661 280,944 621,060 1994 314,579 46,140 292,009 652,727 1995 323,615 47,649 302,803 674,067 1996 351,965 52,211 330,884 735,060
Year High Quality Mft. Cuts Grinding TotalForeign Sources1990 60,525 50,355 40,109 150,989 1991 81,373 47,404 43,670 172,447 1992 75,971 46,377 51,626 173,974 1993 76,614 52,670 81,253 210,537 1994 87,618 52,257 87,498 227,373 1995 92,851 46,415 65,493 204,760 1996 88,500 37,648 57,079 183,227
Year High Quality Mft. Cuts Grinding TotalAll Sources1990 368,101 97,642 334,924 800,666 1991 374,210 93,986 325,926 794,122 1992 380,224 93,757 346,547 820,527 1993 372,069 97,332 362,196 831,597 1994 402,196 98,397 379,507 880,101 1995 416,466 94,064 368,296 878,826 1996 440,466 89,858 387,963 918,287
Report on Canadian Beef Supply and Disposition with Beef Quality Categorization
Page A.7
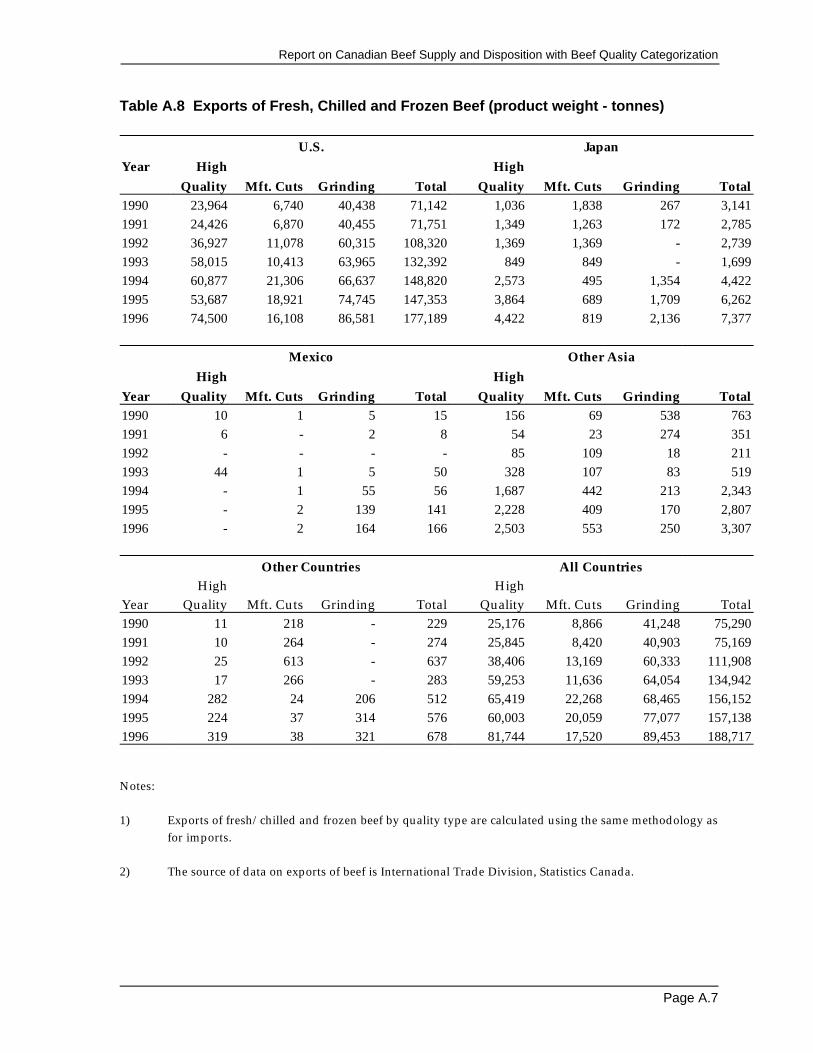
Table A.8 Exports of Fresh, Chilled and Frozen Beef (product weight - tonnes)
U.S. JapanYear High High
Quality Mft. Cuts Grinding Total Quality Mft. Cuts Grinding Total1990 23,964 6,740 40,438 71,142 1,036 1,838 267 3,1411991 24,426 6,870 40,455 71,751 1,349 1,263 172 2,7851992 36,927 11,078 60,315 108,320 1,369 1,369 - 2,7391993 58,015 10,413 63,965 132,392 849 849 - 1,6991994 60,877 21,306 66,637 148,820 2,573 495 1,354 4,4221995 53,687 18,921 74,745 147,353 3,864 689 1,709 6,2621996 74,500 16,108 86,581 177,189 4,422 819 2,136 7,377
Mexico Other Asia
Year Quality Mft. Cuts Grinding Total Quality Mft. Cuts Grinding TotalHigh High
1990 10 1 5 15 156 69 538 7631991 6 - 2 8 54 23 274 3511992 - - - - 85 109 18 2111993 44 1 5 50 328 107 83 5191994 - 1 55 56 1,687 442 213 2,3431995 - 2 139 141 2,228 409 170 2,8071996 - 2 164 166 2,503 553 250 3,307
Other Countries All Countries
Year Quality Mft. Cuts Grinding Total Quality Mft. Cuts Grinding TotalHigh High
1990 11 218 - 229 25,176 8,866 41,248 75,2901991 10 264 - 274 25,845 8,420 40,903 75,1691992 25 613 - 637 38,406 13,169 60,333 111,9081993 17 266 - 283 59,253 11,636 64,054 134,9421994 282 24 206 512 65,419 22,268 68,465 156,1521995 224 37 314 576 60,003 20,059 77,077 157,1381996 319 38 321 678 81,744 17,520 89,453 188,717
Notes:
1) Exports of fresh/chilled and frozen beef by quality type are calculated using the same methodology asfor imports.
2) The source of data on exports of beef is International Trade Division, Statistics Canada.
Report on Canadian Beef Supply and Disposition with Beef Quality Categorization
Page A.8
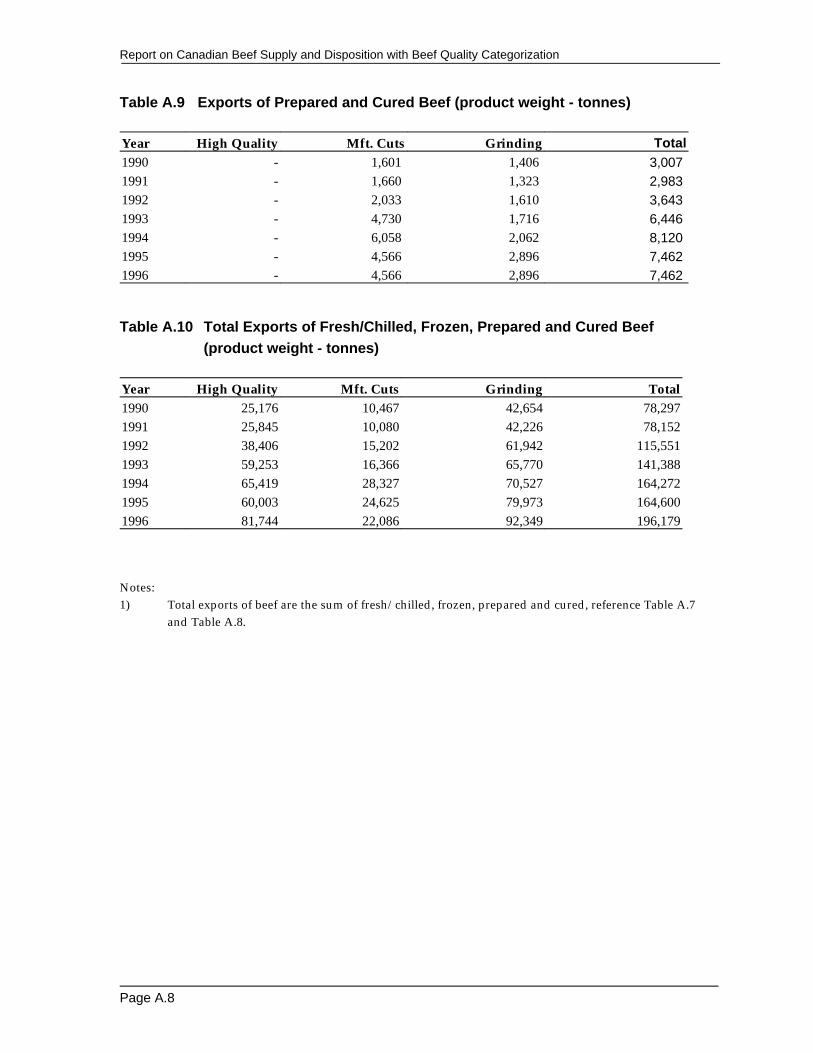
Table A.9 Exports of Prepared and Cured Beef (product weight - tonnes)
Year High Quality Mft. Cuts Grinding Total1990 - 1,601 1,406 3,007 1991 - 1,660 1,323 2,983 1992 - 2,033 1,610 3,643 1993 - 4,730 1,716 6,446 1994 - 6,058 2,062 8,120 1995 - 4,566 2,896 7,462 1996 - 4,566 2,896 7,462
Table A.10 Total Exports of Fresh/Chilled, Frozen, Prepared and Cured Beef
(product weight - tonnes)
Year High Quality Mft. Cuts Grinding Total1990 25,176 10,467 42,654 78,2971991 25,845 10,080 42,226 78,1521992 38,406 15,202 61,942 115,5511993 59,253 16,366 65,770 141,3881994 65,419 28,327 70,527 164,2721995 60,003 24,625 79,973 164,6001996 81,744 22,086 92,349 196,179
Notes:1) Total exports of beef are the sum of fresh/chilled, frozen, prepared and cured, reference Table A.7
and Table A.8.

Report on Canadian Beef Supply and Disposition with Beef Quality Categorization
Page A.9
Table A.11 Ending Frozen Beef Stocks (product weight - tonnes)
Year High Quality Mft. Cuts Grinding TotalDomestic1990 - 790 4,924 5,7141991 - 979 5,927 6,9061992 - 791 4,925 5,7161993 - 1,092 6,868 7,9601994 - 1,311 8,299 9,6101995 - 1,073 6,821 7,8941996 - 990 6,273 7,263
Year High Quality Mft. Cuts Grinding TotalImports1990 - 1,804 2,131 3,9351991 - 2,376 2,056 4,4321992 - 2,963 2,116 5,0791993 - 5,094 4,054 9,1481994 - 3,805 8,397 12,2021995 - 4,617 6,043 10,6601996 - 4,219 5,590 9,808
Year High Quality Mft. Cuts Grinding TotalTotal - Domestic & Imports1990 - 2,593 7,056 9,6491991 - 3,355 7,983 11,3381992 - 3,754 7,041 10,7951993 - 6,185 10,923 17,1081994 - 5,116 16,696 21,8121995 - 5,690 12,864 18,5541996 - 5,209 11,863 17,072
Report on Canadian Beef Supply and Disposition with Beef Quality Categorization
Page B.1
Appendix B
B1) Domestic Beef Production by Quality Types
Total Canadian production of beef by the three qualities (High Quality, ManufacturingCuts & Grinding) was determined by calculating the carcass weight equivalent of beefproduced from domestically slaughtered cattle, then factoring this production into the threequalities of beef. A description of this methodology is described below:
1) Total production of beef was taken to be that reported by Statistics Canada (STC),Livestock Division, Catalogue 23-603.
2) Production of beef by type was calculated for each of steer, heifer, cow (D1, D2, D3 &D4) and mature bull carcasses. The calculation of production of beef by each carcasstype (steer, heifer, etc) requires having the number of steers, heifers, bulls and D1, D2,D3 & D4 cows in the total slaughter as well as the average carcass weights for each ofthese carcass types.
3) Total cattle slaughter was taken to be that reported by STC, Catalogue 23-603. Since thisslaughter is not reported on a sex of slaughter basis, it is necessary to make estimates ofthe number of carcasses produced by sex types (steers, heifers, etc.) with cows beingsubdivided by grade. Cattle slaughter reported by STC was then proportioned intofederally and provincially inspected (FP&I*) slaughter and other slaughter (mainlyuninspected). Slaughter by sex type is reported only for FP&I slaughter, whichrequired that estimates of the composition by sex type be made for “other” slaughter. Itwas assumed that the mix of carcass types in “other” slaughter was in the sameproportions as occurred in provincially inspected slaughter.
4) The majority of cow slaughter is ungraded. It was therefore required that estimates bemade of the proportions of D1,D2, D3 & D4 carcasses produced from ungraded cowslaughter. These factors were provided by Paul D. MacInnes & Associates (September,1995).
5) In order to calculate total dressed beef production, average carcass weights wereapplied to the total number slaughtered for each of the carcass types (steers, heifers,etc.). Beef quality yield factors were then applied to each of these production classesgiving the production of high quality, manufacturing cuts and grinding beef for each ofsteer, heifer, cow and bull slaughter. Head meat, which is assumed to be of grindingquality, was then added to the production of grinding beef from carcasses.*Beef Grading Agency.
Appendix C
Supply and Disposition of CanadianBeef 1994 and 1995
Document prepared forAgriculture and Agri-Food Canada
byPaul MacInnes
Paul D. MacInnes and Associates Ltd.
April 30, 1997
Page C.1
SUPPLY AND DISPOSITION OF CANADIAN BEEF 1994 & 1995
EXECUTIVE SUMMARY
The objective of this study was to provide percentage breakouts of Canada’s imports andexports of beef into the three qualities of high, manufacturing cuts and grinding for the1994 and 1995 calendar years. The study provides an update to a similar project undertakenin early 1995 for the time period January 1, 1988 to September 30, 1994.
The purpose of the study was simply to provide the data and explain the methodologyused to arrive at it.
The major challenge was to source the above data from a multitude of private firms in atimely manner while ensuring a high degree of accuracy.
An industry survey was used to collect the data. The survey was sent to over 100 firms whorepresent a broad cross section of importing and exporting companies and account for over90% of Canadian beef imports and exports.
Every effort was made to ensure data integrity. Follow up phone interviews wereconducted with participants and where possible secondary industry sources were used forverification.
The information supplied by industry accounted for 90 % and 86 % of Canadian beefimports and exports respectively for the study period.
The data generated by this study is displayed in Attachments A through N.
Page C.2
SUPPLY AND DISPOSITION OF CANADIAN BEEF 1994 & 1995
STUDY OBJECTIVES
Prior to this and it’s predecessor study information available to Agriculture and Agri-FoodCanada (IAPAD) did not separate imported and exported beef into the three qualities ofhigh, manufacturing cuts and grinding beef.
For the purpose of this study the qualities were defined by usage. Respondents were askedto classify the product they imported or exported into the three qualities as defined by theend use rather than it’s origin. This is important because the same cut from the same type ofanimal can be used differently. For instance a brisket point from a youthful grain fed steeror heifer could be used in all three quality ranges. It could be sold to a retailer who wouldin turn sell it as a roast of beef to a consumer. It could also be sold to a manufacturer whereit would be used to make corned beef brisket. At certain times of the year it could be sold toa patty manufacturer for grinding.
The three qualities were defined by usage as follows:
1. High - used for steaks, roasts, stirfrys, kabobs, consumer made stews, etc.2. Manufacturing - cuts sold to further processors for the manufacture of roast,
cooked, corned, or smoked beef, deli meats, pastrami, soups, stews, entrees, etc.3. Grinding - any beef that will be ground prior to consumption .i.e. for hamburg
patties and ground beef.
The objectives of this study were to:
C provide percentage breakouts of Canada’s imports and exports of beef into the threequalities for calendar 1994 & 1995.
C where veal was include in the statistics determine the percentage and deduct it toarrive at the net quantity of beef
CC provide country specific information for the imports from Australia, New Zealand,U.S.A. and the exports to U.S.A., Japan, other Asia and Mexico.
CC break down the total import and export volumes into the major beef cuts andCC provide percentages of the cuts by the three qualities
Page C.3
SUPPLY AND DISPOSITION OF CANADIAN BEEF 1994 & 1995
METHODOLOGY
Introduction
The chosen vehicle to achieve the study’s objective was to survey a broad cross section ofCanada’s meat import and export trade. There are well over 100 firms in Canada that dealin imported beef and/or export beef. The quantity and quality of statistics available withinthese firms varies widely. Some firms needed to spent a great deal of time to complete thesurvey. The consultant received excellent cooperation from the Canadian meat trade.
Data Available
Agriculture Canada provided the consultant with Statistics Canada import and exportstatistics. The import data consisted of the Canada Customs Tariff Classification. The exportdata was the Canadian Export Classification for all countries.
During the course of the 1995 study it was determined that while the total import andexport volumes were fairly accurate the data describing volumes of particular cuts was not.This finding was confirmed in the early stages of this study. Therefore the cut volumesshown in this report are extrapolated from the industry survey.
*NOTE- in the case of exports to Mexico the industry survey volume was substantiallyhigher than the Statistics Canada data. There are therefore two sheets for the Mexico data.Attachment “L” details the exports to Mexico based on The Statistics Canada total whileAttachment “L.1” shows the same exports based on the Industry survey volume.
Survey Development
As this was a follow up study to one undertaken in 1995 lessons learned during that studywere used to adapt the survey form to make it more user friendly and to provide animproved level of accuracy. In developing the survey form the objectives were;
1. a high response rate so as to account for over 80 % of imports and exports

Page C.4
2. user friendliness3. accuracy4. brevity and 5. capturing the data required
The major change in format from the 1995 form was that respondents were asked to categorize theindividual cuts by quality as opposed to just the totalvolumes.
The survey was developed by the consultant and then tested and improved with feedbackfrom selected respondents. The survey form was then sent to Agriculture and Agri-FoodCanada for final changes and approval.
Survey List
The survey list was developed to
C cover in excess of 80% of beef import and export volumeC include all major importers and exportersC comprise the various industry sectors andC include Canada’s geographic regions
The final list included 100 firms.
Survey Distribution And Follow Up
The survey was faxed out in early March. Follow up phone calls were made throughoutMarch and in early April.

Page C.5
SUPPLY AND DISPOSITION OF CANADIAN BEEF 1994 & 1995
STUDY RESULTS
Thanks to the excellent co-operation received from the firms within the Canadian meatindustry we were able to achieve results which accounted for 86 % of exports and 90 % ofimports.
The results which are tabled in attachments A through N break out Canada’s beef importsand exports for 1994 & 1995 by cuts and qualities.
Related Documents