National Council for the Evaluation of Social Development Policy Report of Poverty in Mexico The Country, Its Federal Entities and Its Municipalities 2010

Welcome message from author
This document is posted to help you gain knowledge. Please leave a comment to let me know what you think about it! Share it to your friends and learn new things together.
Transcript

National Council for the Evaluation of
Social Development Policy
Report of Poverty in
Mexico
The Country, Its Federal Entities and Its Municipalities
2010


National Council for the Evaluation
of Social Development Policy
Report of Poverty in
Mexico
The Country, Its Federal Entities and Its Municipalities
2010

ORGANIZATIONAL STRUCTURE
Academic researchers
María del Rosario Cárdenas Elizalde Universidad Autónoma Metropolitana
Fernando Alberto Cortés Cáceres El Colegio de México
Agustín Escobar Latapí
Centro de Investigaciones y Estudios Superiores en Antropología Social-Occidente
Salomón Nahmad Sittón
Centro de Investigaciones y Estudios Superiores en Antropología Social Pacífico Sur
John Scott Andretta Centro de Investigación y Docencia Económicas
Graciela María Teruel Belismelis Universidad Iberoamericana
Executive Secretariat
Gonzalo Hernández Licona Executive Secretary
Ricardo C. Aparicio Jiménez Deputy General Director of Poverty Analysis
Thania P. de la Garza Navarrete Deputy General Director of Evaluation
Edgar A. Martínez Mendoza Deputy General Director of Coordination
Daniel Gutiérrez Cruz Deputy General Director of Administration
Contributors
Technical Team
María del Rosario Cárdenas Elizalde
Fernando Alberto Cortés Cáceres
Carlos Mora Jurado
Sergio Ulises Andraca Castillo
Rodrigo Aranda Balcázar
David Ricardo Escamilla Guerrero
Gerardo Antonio Escaroz Cetina
Jorge Fernando González Moreno
José Martín Lima Velázquez
Enrique Eliseo Minor Campa
Martha Moreno Pérez
Diana Negrete González
Cristina Hayde Pérez González
Nayeli Noyolitzin Salgado Granados
Norma Alejandra Vergara Lope Gracia
Ricardo C. Aparicio Jiménez
Report of Poverty in Mexico 2010: The Country, Its States and Its Municipalities.
First edition, August 2012
National Council for the Evaluation of Social Development Policy
Boulevard Adolfo López Mateos 160
Colonia San Ángel Inn
CP. 01060
Delegación Álvaro Obregón
Mexico, Federal District
Printed and made in Mexico
ISBN: 978-607-95482-9-2
Suggested citation:
National Council for the Evaluation of Social Development Policy. Report of Poverty in Mexico 2010: The
Country, Its States and Its Municipalities. Mexico, Federal District, CONEVAL, 2012.
The Council acknowledges the valuable contribution of the technical team to the concise estimations project coordinated by the College of Mexico, composed by the national and international researchers and research assistants: Delfino Vargas, Jorge de la Vega, Nicolaos Tzavidis, Luis Enrique Nieto, Gonzalo Pérez de la Cruz, Christian Carmona and Jesús Luján. The participation of Ignacio Méndez, Hortensia Moreno, Christopher Brunsdon, Jae Kwang-Kim and Rafael Pérez-Abreu in the seminaries of small divisions. The suggestions provided by Rosa María Rubalcava and the technical team that started the municipal estimations project in 2009, Víctor Pérez, Dulce Cano and Rocío Espinosa.


5
CONTENTS
Abbreviations and Acronyms .......................................................................................................................... 8
Glossary ............................................................................................................................................................ 9
Presentation .................................................................................................................................................... 11
Executive Summary ........................................................................................................................................ 13
Introduction ..................................................................................................................................................... 17
1. Poverty in Mexico, 2010 ........................................................................................................................... 21
1.1 Incidence of Poverty.................................................................................................................... 22
1.1.1 National Poverty .......................................................................................................... 23
1.1.2 Rural and Urban Poverty ............................................................................................. 27
1.1.3 Poverty by Federal Entity ............................................................................................. 30
1.1.4 Distribution of Population Living in Poverty by Federal Entity ....................................... 35
1.2 Depth and Intensity of Poverty .................................................................................................... 37
1.2.1 Depth of Poverty .......................................................................................................... 38
1.2.2 Intensity of Poverty ...................................................................................................... 40
1.2.3 Depth and Intensity of Poverty by Federal Entity ......................................................... 41
1.2.4 Contribution of Each Deprivation Indicator to the Intensity of Poverty .......................... 44
2. Poverty in Mexico, 2008-2010 .................................................................................................................. 47
2.1 Poverty ....................................................................................................................................... 48
2.2 Extreme Poverty ......................................................................................................................... 55
2.3 Vulnerable Due to Social Deprivation .......................................................................................... 55
6
2.4 Vulnerable Due to Income .......................................................................................................... 56
2.5 The Social Rights Space ............................................................................................................ 58
2.6 Access to Social Security ........................................................................................................... 58
2.7 Access to Health Services .......................................................................................................... 59
2.8 Access to Food ........................................................................................................................... 61
2.9 Educational Gap ......................................................................................................................... 62
2.10 Basic Services in the Dwelling .................................................................................................... 63
2.11 Quality and Spaces of the Dwelling ............................................................................................ 64
3. Measurement of Poverty at Municipal Level .......................................................................................... 67
3.1 Poverty at Municipal Level .......................................................................................................... 68
3.2 Distribution of Population Living in Poverty at Municipal Level .................................................... 77
3.3 Depth and Intensity of Poverty at Municipal Level ....................................................................... 79
4. The Social Rights Space .......................................................................................................................... 83
4.1 Educational Gap ......................................................................................................................... 86
4.2 Access to Health Services .......................................................................................................... 89
4.3 Access to Social Security ........................................................................................................... 93
4.4 Quality and Spaces of the Dwelling ............................................................................................ 97
4.5 Access to Basic Services in the Dwelling .................................................................................. 102
4.6 Access to Food ......................................................................................................................... 107
5. The Economic Wellbeing Space............................................................................................................ 113
5.1 Household Income.................................................................................................................... 114
5.2 Current Income of The population in a Poverty and Vulnerability Situation ............................... 120

7
5.3 Effect of Transfers on Income ................................................................................................... 123
5.4 Income from Men and Women .................................................................................................. 128
5.5 Income of Indigenous Population .............................................................................................. 129
6. The Territorial Context Space ................................................................................................................ 131
6.1 Indicators Associated with the Territory ..................................................................................... 132
6.2 Geographical Distribution of the Gini Coefficient ....................................................................... 134
6.3 Geographical Distribution of the Income Ratio........................................................................... 137
6.4 Geographical Distribution of Social Polarization ........................................................................ 139
6.5 Geographical Distribution of Social Networks ............................................................................ 140
6.6 The Four Indicators in the Federal Entities ................................................................................ 141
6.7 Poverty and Social Cohesion .................................................................................................... 143
References .................................................................................................................................................... 146
List of Charts, Figures, Graphs and Maps .................................................................................................. 153
Statistical Annex ........................................................................................................................................... 161

8
Abbreviations and Acronyms
AFORE Retirement Fund Administrators
CDI National Commission for the Development of Indigenous People
CONEVAL National Council for the Evaluation of Social Development Policy
CONAPO National Population Council
ENIGH National Survey of Income and Expenditure at Households
TPCCI Total per capita current income
IMSS Mexican Social Security Institute
INEGI National Statistics and Geography Institute
ISSSTE Institute for Social Security and Services for State Workers
LGDS General Law of Social Development
MCS-ENIGH Socioeconomic Conditions Module of the National Survey of Income and Expenditure at Households
EWL Economic Wellbeing Line
MWL Minimum Wellbeing Line
EMSA Mexican Food Security Scale
Pemex Petróleos Mexicanos
Procampo Cropland Direct Support Program

9
Glossary
Food basket: A set of food, the value of which is used in order to define the minimum wellbeing
line.
Gini coefficient: An income concentration measurement. This index considers values from 0 to 1;
the higher it is (near 1), there more inequality there is regarding income distribution.
Incidence: The percentage of the population, or from a specific population group, that exhibits
some sort of economic or social deprivation.
Social networks perception index: It is defined as the degree of perception of easiness or
difficulty that people aged 12 years old or more bear regarding to obtaining help of social networks
in diverse hypothetical situations.
Social Deprivation Index: It is defined from the sum of the six indicators associated with social
deprivations, that is, the number of deprivations a person has (educational gap, access to health
services, access to social security, quality and spaces of the dwelling, access to basic services in
the dwelling, and access to food).
Wellbeing line: Monetary value of a food, goods, and basic services basket.
Minimum wellbeing line: Monetary value of the food basket.
Population living in poverty: Population whose income is below the wellbeing line and that
endures at least one social deprivation.
Population living in extreme poverty: Population that endures three or more social deprivations
and whose income is below the minimum wellbeing line.
Population living in moderate poverty: Population whose income is above or equal to the
minimum wellbeing line, but below the wellbeing line and that endures at least one social
deprivation; or the population whose income is below the minimum wellbeing line and that endures
one or two social deprivations.

10
Non multidimensional poor and non vulnerable population: Population with no social
deprivations and whose income is above or equal to the wellbeing line.
Vulnerable population due to social deprivations: Population with one or more social
deprivations and whose income is above or equal to the wellbeing line.
Vulnerable population due to income: Population with no social deprivations and whose income
is below the wellbeing line.
Income ratio: It is defined as the proportion of the average total per capita current income of the
population living in extreme poverty in relation to the average total per capita current income of the
non multidimensional poor and non vulnerable population.
Rural areas: Localities with less than 2,500 inhabitants.
Urban areas: Localities with over 2,500 inhabitants.

11
Presentation
Poverty is a social issue that imposes serious limitations regarding the physical, intellectual, and
social development of the people who suffer from it. Likewise, it hinders the equality of opportunities
among individuals and evinces gaps related to the exercise of human, economic and social rights of
a society.
In order to fight poverty, by means of its laws the Mexican State has undertaken the compromise of
compliance with human rights and the access to full social development for all the population. The
constitutional reforms approved in 2011 establish the express recognition of human rights and the
obligation of the State itself to promote them, respect them, protect them and ensure them through
all of its authorities in accordance with the principles of universality, interdependency, indivisibility,
and progressiveness.
In this sense, the National Council for the Evaluation of Social Development Policy (CONEVAL)
designed a work schedule in order to comply with two of the activities ordered by the General Law
of Social Development (LGDS). On the one hand, to define, identify and measure the population
living in poverty at national and state level every two years and, on the other hand, to carry out this
same practice in all the municipalities of the county every five years.
CONEVAL carried out diverse research activities, and the results were made public through several
publications, among which the following stand out: General guidelines and criteria for the definition,
identification and measurement of poverty and the Methodology for multidimensional poverty
measurement in Mexico. Besides, the results of poverty measurements at national and state level
for 2008 were presented, which use, for the first time, the multidimensional approach as stipulated
in the General Law of Social Development. The Report on Multidimensional Poverty in Mexico,
2008, accounted for these activities and became the first issue of a series of documents intended to
provide elements in order to know the situation and evolution of poverty in Mexico.
Poverty estimations at municipal level which are presented in this report are the result of an
intensive research process for which some of the most outstanding national and international
specialists on the field of poverty measurement contributed. This is the first time the country has
information on the poverty conditions of the population, as stipulated by the LGDS, for the 2,456
municipalities of the country existing in 2010. With the information from 2015, when the next
poverty measurement at municipal level is made, it will be possible to compare the changes
regarding poverty in the municipal scenery presented in this report.

12
With this publication, CONEVAL provides society with integrated information on the results of the
poverty measurement in 2010 at national and state level which was made public in July, 2011, and
the changes in the life conditions of the population between 2008 and 2010. Likewise, the
multidimensional poverty measurement by municipality in the country is provided, the results of
which were made public in December, 2011. This information contributes to identify advances and
challenges on the social development field and favors, with relevant and timely information, the
evaluation and design of the public policies intended to overcome poverty and drive the economic
and social wellbeing of the population.
Gonzalo Hernández Licona
Executive Secretary

13
Executive Summary
For the first time, Mexico has official poverty estimations for the 2,456 municipalities that composed
our country in 2010. These estimations meet the requirements of the LGDS regarding time
considerations and measurement indicators. According to this law, official measurements must be
taken every two years at national and state scale, and every five years at municipal scale. Likewise,
the law indicates that information sources must be provided by the National Statistics and
Geography Institute (INEGI) and that the measurement shall consider at least the following
indicators: per capita current income, educational gap; access to health services; access to social
security; quality and spaces of the dwelling; access to basic services in the dwelling, access to
food, and the degree of social cohesion.
The Socioeconomic Conditions Module of the National Survey of Income and Expenditure at
Households 2010 (MCS-ENIGH) allowed knowing the percentage and number of people living in
poverty and vulnerability due to social or income deprivations at national and state scale, as well as
knowing for the first time the changes between 2008 and 2010. Nevertheless, in order to carry out
poverty estimations by municipality it was necessary to use, apart from the MCS-ENIGH 2010, the
General Census of Population and Housing 2010 sample. Since disaggregation of information in
the former is only representative at national and state scale, but not by municipality, it was
necessary to use statistical models that allowed having knowledge of municipal poverty figures and
their contribution to the total at state scale. One of the favorable aspects of the methodology is that
it allows calculating the contribution of population groups to the total of poverty, and the contribution
of politic-administrative disaggregation. In this sense, state poverty figures allowed estimating the
percentage and number of people living in poverty and vulnerability in the federal entities, as well
as their contribution to national poverty. With the publication of municipal estimations it is also
possible to know the distribution and contribution of municipalities to poverty in their entities and,
therefore, to national poverty.
The objective of this report is to present the main results of poverty and their components for 2010
and make a diagnosis of some economic and social conditions of the people living in the
municipalities of the country.
In order to measure poverty, CONEVAL classifies the population in the following groups according
to their income and the social deprivations they have. In this manner, a person

14
can only be classified in one of them: the person is considered poor if he/she has an income below
the wellbeing line and has at least one social deprivation; the person is extremely poor if he/she has
an income below the minimum wellbeing line and also has three or more social deprivations; the
person is moderately poor if he/she is poor but not extremely poor; the person is vulnerable due to
social deprivations if he/she has an income above the wellbeing line but has one or more social
deprivations; the person is vulnerable due to income when he/she does not have any social
deprivations but his/her income is below the wellbeing line, and is non multidimensional poor and
non vulnerable if he/she does not have any social deprivations and his/her income is above the
wellbeing line.1
RESULTS OF THE POVERTY MEASUREMENT IN 20102
In 2010, nearly half of Mexican people were living in poverty, one out of three people was living in
moderate poverty and over a tenth was living in extreme poverty. Besides, almost three out of ten
people were vulnerable due to social deprivations, one out of seventeen was vulnerable due to
income and around a fifth of the population was not poor or vulnerable.
States with the highest percentages of population living in poverty were Chiapas (78.5); Guerrero
(67.6); Oaxaca (67.4); Puebla (61.2); and Tlaxcala (60.6). On the other hand, the entities with the
lowest incidence were Nuevo Leon (21.2); Coahuila (28.0); Federal District (28.7); Baja California
Sur (30.9); and Baja California (32.1).
Municipalities with the highest percentage of population in poverty were the following: San Juan
Tepeuxila, Oaxaca (97.4); Aldama, Chiapas (97.30); San Juan Cancuc, Chiapas (97.3); Mixtla de
Altamirano, Veracruz (97.0); Chalchihuitán, Chiapas (96.8); Santiago Textitlán, Oaxaca (96.6); San
Andrés Duraznal, Chiapas (96.5); Santiago el Pinar, Chiapas (96.5); Sitala, Chiapas (96.5); and
San Simón Chumatlán, Oaxaca (96.4).
In eight of the municipalities above, 70 percent or more of their population were indigenous-
language speakers, that is, they were indigenous municipalities. In San Juan Tepeuxila the
percentage of indigenous-language speakers was of 57 percent and in Santiago Textitlán 14
percent.
The municipalities with the lowest percentage of people in poverty were the following: Benito
Juárez, Federal District (8.7); San Nicolás de los Garza, Nuevo León (12.8); Guadalupe, Nuevo
León (13.2); Miguel Hidalgo, Federal District (14.3); San Pedro Garza García, Nuevo Leon (15.2);
San Sebastián Tutla, Oaxaca (16.7); San Pablo Etla, Oaxaca (17.); Apodaca, Nuevo León (18.0);
Corregidora, Querétaro (18.7); and San Juan de Sabinas, Coahuila (19.0). The presence of
indigenous population in these municipalities was below 10 percent.
1 For further details, you are suggested to see the Methodology for Multidimensional Poverty Measurement in Mexico
and the Report on Multidimensional Poverty in Mexico, 2008; both documents can be found on CONEVAL's web
page: www.coneval.gob.mx 2 The results of poverty measurement at state scale were published in July and the results at municipal scale were
published in December, 2011.

15
While the municipalities with the highest percentage of population in poverty are rural, the
municipalities with the highest amount of people in poverty are urban. Among the former, the ones
that stand out are San Juan Tepexuila, Oaxaca; Aldama, Chiapas; San Juan Cancún, Chiapas; and
Mixtla de Altamirano, Veracruz. Among the latter, the ones that stand out are Puebla, Puebla;
Iztapalapa, Federal District; Ecatepec de Morelos, Mexico; and León, Guanajuato.
The number of poor people in the country is the result of summing up the amount of poor people in
the federal entities, and the national percentage is equal to the weighted average of state
percentages. In the same way, the amount of poor people in the states is the result of summing up
the number of poor people in their municipalities and the weighed municipal incidences of poverty
reconstitute the incidence of poverty in each state.
The percentage of the population suffering from at least one social deprivation was 75 percent, that
is, three out of four Mexican people suffered from deprivation in one or some of their social rights.
In rural areas, incidence was of 94.1 percent, while seven out of ten people residing in urban
localities had at least one social deprivation.
Regarding the social rights space in 2010, six out of ten Mexican people did not have access to
social security; one third of the population was deprived of access to health services; one out of
four people was deprived of access to food; almost one out of four people was deprived of access
to basic services in the dwelling; one out of five people had an educational gap, and the least
incident deprivation was that of quality and spaces of the dwelling, with 15.2 percent.
In 93.4 percent of the municipalities of the country, over half its population did not have access to
social security. In one out of two municipalities (48 percent) over half the population did not have
access to basic services in the dwelling. In about one out of six municipalities, 50 percent of the
population or more did not have access to health services.
On the other hand, in one out of ten municipalities above half the population was deprived due to
the quality and spaces of the dwelling. Two thirds of the municipalities with deprivation due to
access to food had incidences between 20 and 40 percent of their population with this sort of
deprivation. Finally, 96.5 percent of the municipalities had incidences due to an educational gap
below 50 percent.
In regards to the economic wellbeing space, in 2010 almost one out of five people had an income
that did not allowed acquiring the food basket, which in August 2010 was valued in 978 pesos for
urban areas and in 684 pesos for rural areas. Likewise, over half the population had an income
lower than 2,114 pesos in urban areas and lower than 1,329 pesos in rural areas, that is, an
insufficient income to acquire the food and non-food basket.

16
CHANGES IN THE POPULATION LIVING IN POVERTY AND
VULNERABILITY BETWEEN 2008 AND 20103
The population in poverty in Mexico increased in over three million people between 2008 and 2010
going from 48.8 million to 52.0 million. Only in four entities (Puebla, Coahuila, Morelos and
Michoacán) the number of people in this condition decreased. In spite of this, the average number
of deprivations of the population living in poverty and extreme poverty decreased, in the first case
from 2.7 to 2.5 deprivations and, in the second case, from 3.9 to 3.7 deprivations.
In the social rights space, the number and the percentage of people for five out of the six social
deprivations decreased. Between 2008 and 2010, only the access to food increased in the number
of people who endured this deprivation due to the increase of international prices of food and the
decrease of the family income.
Despite the reduction in the number of average deprivations, the drop in income resulted in more
people unable to fulfill their basic needs of food, clothing, transportation, health, education and
recreation, among others.
Poverty in rural and urban areas increased: in the first ones it passed from 62.4 to 64.5 percent, this
is, from 15.9 to 17 million people; in the second it passed from 39.1 to 40.5 percent in number of
people, which represented an increase from 32.9 to 35 million. Of the 52 million of poor people, two
thirds resided in urban localities and one third in rural localities.
Despite the fact that poverty increased among the general population and that its proportion among
the population aged under 18 is ten percentage points greater compared to the total population, the
number of girls, boys and adolescents did not increase. Between 2008 and 2010, child and
adolescent population in poverty passed from 21.5 million to 21.4 million.
From 2008 to 2010, there was a generalized drop of income, which affected the purchasing power
of the population. The gap between the first and last decile of the population according to their
income level increased from 2008 to 2010: while in 2008 the difference was 33.7-fold between one
and the other, for 2010 this difference increased 35.6-fold.
3 Poverty estimations for 2008 and 2010 were made without the variable of cooking fuel, because in 2008 the MCS-
ENIGH questionnaire did not include such information. Nevertheless, according to the General guidelines and criteria
for the definition, identification and measurement of poverty, published in the Official Journal of the Federation on
June 16, 2010, the variable was included in the questionnaire for 2010 and it was used for calculating the indicator of
basic services in the dwelling.

17
Introduction
The Methodology for multidimensional poverty measurement in México and the MCS-ENIGH
allowed CONEVAL to carry out poverty measurements at national and state scale in 2008 and
2010. This time, apart from the information regarding the changes in the poverty situation of the
Mexican population between the aforementioned years, the results of poverty measurement for the
2,456 municipalities of the country existing in 2010 are presented.
Poverty measurement at municipal scale involved a set of challenges that had to be faced by
CONEVAL. In regards to information sources, although the MCS-ENIGH allows carrying out
poverty estimations by taking into account the indicators listed by the LGDS (per capita current
income, educational gap, access to health services, access to social security, quality and spaces of
the dwelling, access to basic services in the dwelling and access to food, as well as the degree of
social cohesion) the results are only representative at national and state scale, including the rural
and urban spheres. In fact, our country does not have any information source that allows estimating
poverty at municipal scale in a direct manner.
The General Census of Population and Housing 2010, conducted by the INEGI, does contain
information about the national population at municipal scale, but it is possible to directly calculate
two of the dimensions of poverty: the educational gap and deprivation due to lack of access to
health services. Besides, in association with the census, a sample was taken with an extended
questionnaire to go into detail regarding the socioeconomic conditions of Mexican households and
their members, which allows acknowledging the deprivations at municipal scale, not only for
education and health indicators but also for quality and spaces of the dwelling and access to basic
services in the dwelling indicators. However, the census sample does not contain enough
information to directly calculate the indicators of access to social security, access to food and total
per capita current income of households.
Due to this, CONEVAL, in its capacity as an institution in charge of defining the guidelines and
criteria for definition, identification and measurement of poverty in Mexico, engaged in the task of
exploring and analyzing since 2009 a set of international existing methodologies by means of which
it would be possible to estimate the variables to calculate poverty at municipal level. In applying
these methodologies there was the intention to meet the requirements established by the LGDS.

18
The purpose of this report is to present the information of poverty measurement at municipal scale
in 2010 and account for what happened in the national and state environment spheres 2008 and
2010.
In this way, the country has for the first time disaggregated information about the poverty and
vulnerability conditions at national, state and municipal scale for poverty and all its components.
Thus, it will be possible to identify more accurately the regions and places where the action of
public policy regarding education, health, social security, improvement in housing conditions and its
services, as well as access to food and employment creation, and family income are more urgent.
CONEVAL classifies the population in five groups according to their income and the social
deprivations they have. In this manner, a person can only be classified in one of the following
groups: the person is considered poor if he/she has an income below the wellbeing line and has at
least one social deprivation; the person is extremely poor if he/she has an income below the
minimum wellbeing line and also has three or more social deprivations; the person is vulnerable
due to social deprivations if he/she has an income above the wellbeing line but has one or more
social deprivations; the person is vulnerable due to income when he/she does not have any social
deprivations but his/her income is below the wellbeing line, and is non multidimensional poor and
non vulnerable if he/she does not have any social deprivations and his/her income is above the
wellbeing line.
Distribution of poverty in our country shows a homogeneous assortment and allows identifying, in
2010, 2,012 municipalities with poverty levels above 50 percent, that is, 82 percent of the
municipalities in the county where most of the population had an income below the wellbeing line
and had at least one social deprivation. On the other hand, more than half the people living in
poverty concentrated in 190 municipalities in the country, mainly urban and metropolitan ones.
Regarding extreme poverty, there are 1,037 municipalities where one out of four people lived with
an income below the minimum wellbeing line and had three or more social deprivations. Population
distribution at territory level indicates that more than half the people living in extreme poverty were
concentrated in only 265 of the municipalities in the country.
On the other hand, at the end of 2008 and the beginning of 2009 the world experienced a deep
economic crisis and the increase of international prices for food. In our country these situations
caused that the levels of economic activity had a significant deterioration, and, consequently, in
2009, the Gross Domestic Product experienced a recession compared to 2008 by 6.3 percent,
additional to the increase of the price for the food basic basket.

19
Changes in the poverty conditions of the population between 2008 and 2010 are reviewed in this
report: it can be said that in spite of the advances regarding the resources of infrastructure and
basic services, poverty in the country increased in the period by nearly 3.2 million people, which
meant that 46.2 percent of the population lived under those conditions in 2010, that is, over 52
million of Mexican people.
The information of the report is structured in six chapters. The first chapter provides an overview of
the poverty conditions of the Mexican population in 2010, and information is disaggregated at
national level for rural areas, urban areas and each federal entity. The second chapter describes
changes in the poverty situation of the population between 2008 and 2010 with the previous
disaggregation levels. The third chapter presents the results of poverty estimations at municipal
scale in 2010. The fourth, fifth and sixth chapters present the results of the social rights, economic
wellbeing and territorial context spaces, respectively. The analysis of these spaces is described at
national, state and municipal scale.


1. Poverty in Mexico, 2010

22
Re
po
rt o
f P
ove
rty in
Me
xic
o 2
010
: Th
e C
ou
ntr
y, It
s Sta
tes
an
d Its
Mu
nic
ipa
litie
s •
PO
VER
TY IN
MEX
ICO
2010
Poverty in Mexico, 2010
The results of this first report of municipal poverty in Mexico allow analyzing the different population
groups that inhabit the municipalities in the country. Thus, there is information by strata such as age,
sex, if they are indigenous people or not, if the inhabit a rural or urban community, etc., which
constitutes useful input for the people in charge of formulating public policies.
Poverty is heterogeneously distributed in the national territory, although there are very important
concentrations of poor municipalities in the states located in the south and mountain ranges. An
overall advance in the rendering of services on basic infrastructure across the country is perceived.
Nevertheless, there are aspects still with important gaps such as the access to social security and the
access to well-paid jobs in order to gain a sufficient income for the acquisition of the basic basket per
individual.
The analysis in each of the dimensions composing poverty allows the follow-up of advances or
recessions at national level and by federal entity. In this way, regional convergence or divergence
processes as well as the gaps between population groups and federal entities can be inspected. In
2015, when the next estimations at municipal scale are available, it will be possible to carry out the
study of the changes in poverty figures for each municipality. This chapter presents the results of
poverty estimations 2010 at national level, in the rural and urban spheres and by federal entity.
1.1 INCIDENCE OF POVERTY
Throughout this chapter, information regarding the economic wellbeing and social rights spaces is
presented. The analysis of these spaces allows classifying people in one of the following groups:
extreme poverty, moderate poverty; vulnerable due to social deprivations, vulnerable due to income,
or non multidimensional poor and non vulnerable. The information results include the percentage and
number of people under such condition, the average number of social deprivations and their average
ratio, as well as the total number of social deprivations and the ratio of deprivations of the population
in poverty in relation to the potential maximum that may be experienced by the population in Mexico.

23
From this classification, the actions, programs, and results of the social development policy
implemented in the county and in the three government branches can be evaluated.
1.1.1 NATIONAL POVERTY
The analysis of results of poverty measurement in 2010 allows pointing out that the population under
this condition amounted to 46.3 percent, that is, there were 52.1 million people living with at least one
social deprivation who had an insufficient income to acquire the basic basket. The vulnerable
population due to social deprivations represented 28.8 percent of the population, which meant that
32.4 million people had at least one social deprivation and their income was above the Economic
Wellbeing Line (EWL).
On the other hand, the vulnerable population due to income —the one that did not have social
deprivations but whose income level was below the EWL— was of 5.7 percent in 2010, that is, 6.4
million people. Finally, the population that was not poor or vulnerable amounted to 19.3 percent,
which is equivalent to 21.7 million people.
GRAPH 1.1 POPULATION'S DISTRIBUTION ACCORDING TO THE POVERTY
STATUS, MEXICO, 2010
Source: estimates from CONEVAL based on the MCS-ENIGH 2010.
The total amount of poor people (46.3 percent) in 2010 is comprised of 11.4 percent of people living
in extreme poverty, and 34.9 percent of people living in moderate poverty, which are equivalent to
52.1, 12.8 and 39.3 million people, respectively (graphs 1.1 and 1.2).
Population living in moderate poverty, 34.9%
Population living in extreme poverty, 11.4%
Population
living in
poverty, 46.3%
Non
multidimensio
nal poor
population, 53.7%
Vulnerable population due to social deprivations, 28.8%
Non multidimensional poor and non vulnerable population, 19.3%
Vulnerable population due to income, 5.7%

24
Re
po
rt o
f P
ove
rty in
Me
xic
o 2
010
: Th
e C
ou
ntr
y, It
s Sta
tes
an
d Its
Mu
nic
ipa
litie
s •
PO
VER
TY IN
MEX
ICO
2010
Graph 1.2 NUMBER OF PEOPLE ACCORDING TO POVERTY STATUS, MEXICO,
2010
Source: estimates from CONEVAL based on the MCS-ENIGH 2010.
Within the social rights space, the circumstances at national level are as follows: the highest
incidence due to social deprivations in the population was in the access to social security indicator
which amounted to 60.7 percent; in the access to health services it was 31.8 percent; with deprivation
regarding access to food, 24.9 percent; with deprivation regarding basic services in the dwelling, 23.0
percent; with an educational gap, 20.6 percent and, finally, with deprivation regarding the quality and
spaces of the dwelling, 15.2 percent at national level.
It is worth clarifying that the variable "cooking fuel" was incorporated into the basic services in the
dwelling indicator. This variable makes a distinction among several types of fuel (gas, electricity,
charcoal or firewood) and if the dwelling, that has a firewood or charcoal stove, also has a chimney.
This variable was incorporated for the first time in the General Census of Population and Housing
2010 and in the MCS-ENIGH 2010. Consequently, the measurement from 2008 does not include this
variable.
In regards to the educational gap indicator, apart from taking into consideration primary and
secondary education, for the measurement presented in this report pre-school education was
incorporated.4
4 On November 12, 2002, the Constitutional Reform to Article Third was published in the Official Journal of the
Federation (OJF). This reform establishes pre-school education as part of the basic mandatory education.
Population living in moderate
poverty, 39.3 million
Population living in extreme poverty, 12.8 million
Population
living in
poverty, 52.1 million
Non
multidimens
ional poor
population,
60.5 million
Vulnerable people due to social deprivations, 32.4 million
Non multidimensional poor and
non vulnerable population, 27.1 million
Vulnerable population due to income, 6.4 million
25
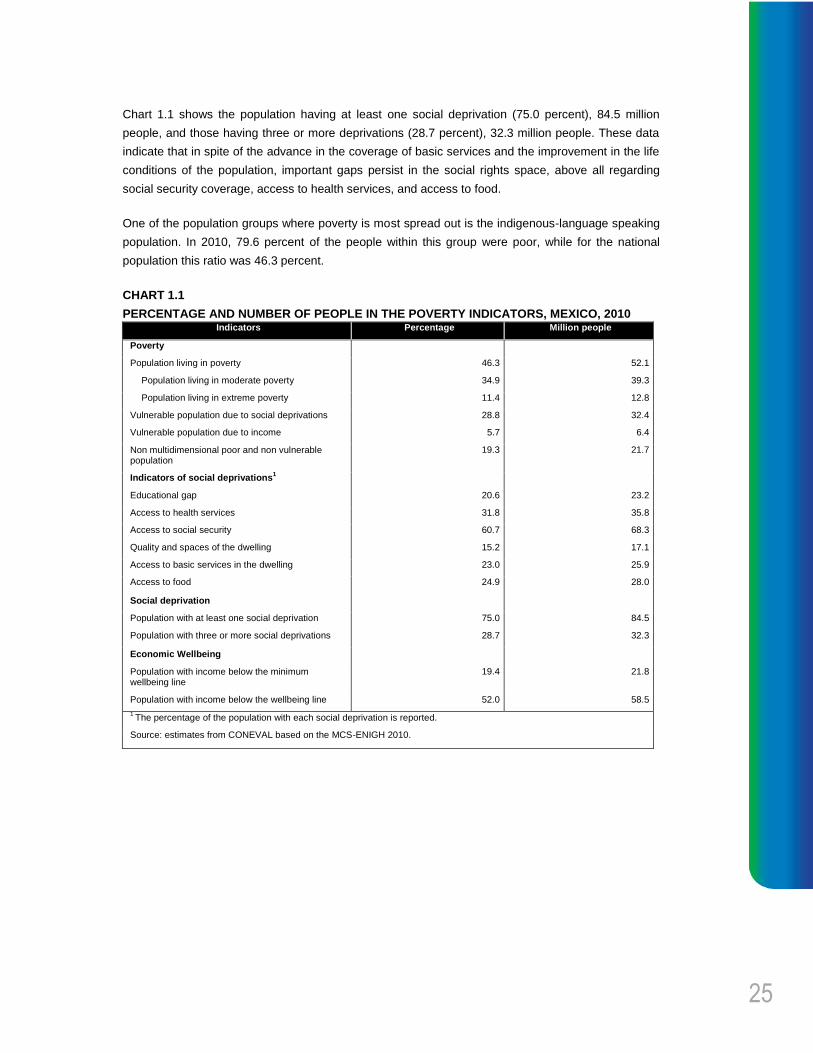
Chart 1.1 shows the population having at least one social deprivation (75.0 percent), 84.5 million
people, and those having three or more deprivations (28.7 percent), 32.3 million people. These data
indicate that in spite of the advance in the coverage of basic services and the improvement in the life
conditions of the population, important gaps persist in the social rights space, above all regarding
social security coverage, access to health services, and access to food.
One of the population groups where poverty is most spread out is the indigenous-language speaking
population. In 2010, 79.6 percent of the people within this group were poor, while for the national
population this ratio was 46.3 percent.
CHART 1.1
PERCENTAGE AND NUMBER OF PEOPLE IN THE POVERTY INDICATORS, MEXICO, 2010 Indicators Percentage Million people
Poverty
Population living in poverty 46.3 52.1
Population living in moderate poverty 34.9 39.3
Population living in extreme poverty 11.4 12.8
Vulnerable population due to social deprivations 28.8 32.4
Vulnerable population due to income 5.7 6.4
Non multidimensional poor and non vulnerable population
19.3 21.7
Indicators of social deprivations1
Educational gap 20.6 23.2
Access to health services 31.8 35.8
Access to social security 60.7 68.3
Quality and spaces of the dwelling 15.2 17.1
Access to basic services in the dwelling 23.0 25.9
Access to food 24.9 28.0
Social deprivation
Population with at least one social deprivation 75.0 84.5
Population with three or more social deprivations 28.7 32.3
Economic Wellbeing
Population with income below the minimum wellbeing line
19.4 21.8
Population with income below the wellbeing line 52.0 58.5
1 The percentage of the population with each social deprivation is reported.
Source: estimates from CONEVAL based on the MCS-ENIGH 2010.

26
Re
po
rt o
f P
ove
rty in
Me
xic
o 2
010
: Th
e C
ou
ntr
y, It
s Sta
tes
an
d Its
Mu
nic
ipa
litie
s •
PO
VER
TY IN
MEX
ICO
2010
CHART 1.2
PERCENTAGE, NUMBER OF PEOPLE AND AVERAGE DEPRIVATIONS IN THE POVERTY
INDICATORS IN THE INDIGENOUS-LANGUAGE SPEAKING POPULATION, MEXICO, 2010
Indicators
Indigenous-language speaking population Non-indigenous-language speaking population
Percentage Million people
Average deprivations
Percentage Million people
Average deprivations
Poverty
Population living in poverty
79.6 5.4 3.6 44.1 46.7 2.5
Population living in moderate poverty
34.8 2.4 3.0 34.9 36.9 2.2
Population living in extreme poverty
44.7 3.0 4.0 9.2 9.8 3.7
Vulnerable population due to social deprivations
16.7 1.1 2.6 29.5 31.2 1.9
Vulnerable population due to income
0.7 0.0 0.0 6.0 6.4 0.0
Non multidimensional poor and non vulnerable population
3.0 0.2 0.0 20.3 21.5 0.0
Social deprivation
Population with at least one social deprivation
96.3 6.5 3.4 73.7 77.9 2.3
Population with three or more social deprivations
72.2 4.9 4.0 25.9 27.4 3.6
Indicators of social deprivation
Educational gap 48.6 3.3 3.9 18.9 19.9 3.0
Deprivation due to access to health services
37.3 2.5 4.1 31.4 33.2 2.8
Deprivation due to access to social security
83.5 5.7 3.6 59.3 62.7 2.5
Deprivation due to quality and spaces of the dwelling
42.0 2.8 4.2 13.5 14.3 3.5
Deprivation due to access to basic services in the dwelling
74.4 5.0 3.7 19.7 20.8 3.3
27
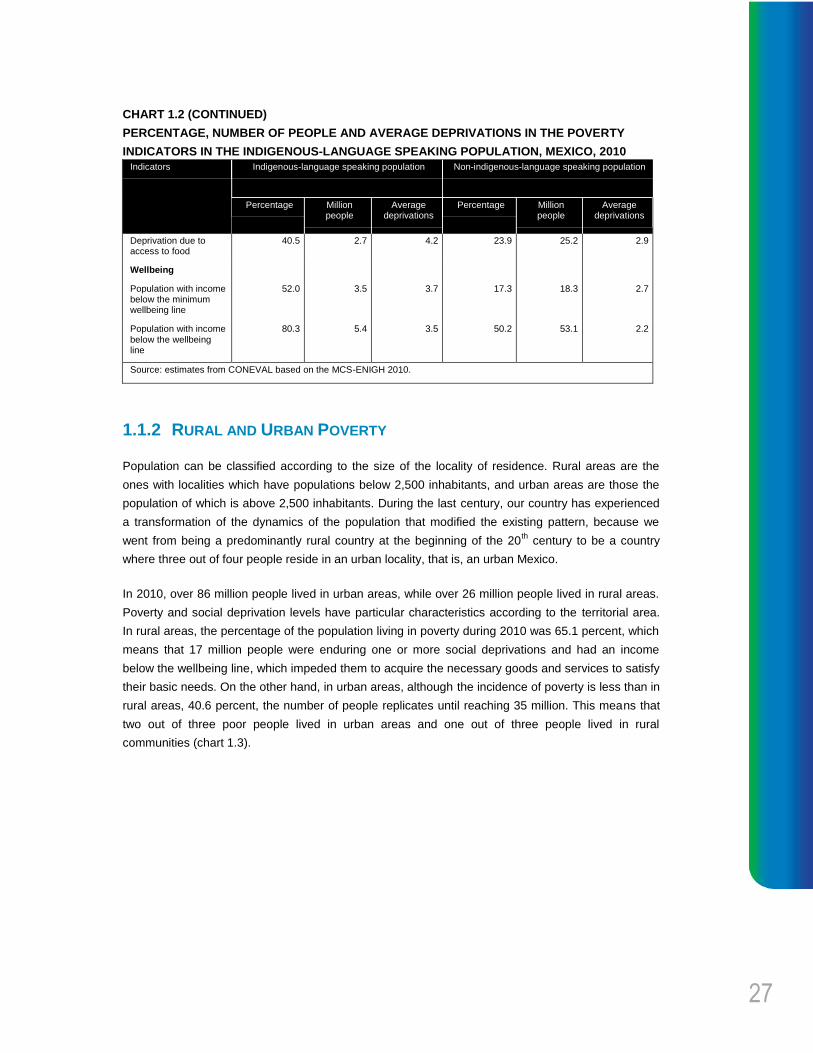
CHART 1.2 (CONTINUED)
PERCENTAGE, NUMBER OF PEOPLE AND AVERAGE DEPRIVATIONS IN THE POVERTY
INDICATORS IN THE INDIGENOUS-LANGUAGE SPEAKING POPULATION, MEXICO, 2010
Indicators Indigenous-language speaking population Non-indigenous-language speaking population
Percentage Million people
Average deprivations
Percentage Million people
Average deprivations
Deprivation due to access to food
40.5 2.7 4.2 23.9 25.2 2.9
Wellbeing
Population with income below the minimum wellbeing line
52.0 3.5 3.7 17.3 18.3 2.7
Population with income below the wellbeing line
80.3 5.4 3.5 50.2 53.1 2.2
Source: estimates from CONEVAL based on the MCS-ENIGH 2010.
1.1.2 RURAL AND URBAN POVERTY
Population can be classified according to the size of the locality of residence. Rural areas are the
ones with localities which have populations below 2,500 inhabitants, and urban areas are those the
population of which is above 2,500 inhabitants. During the last century, our country has experienced
a transformation of the dynamics of the population that modified the existing pattern, because we
went from being a predominantly rural country at the beginning of the 20th
century to be a country
where three out of four people reside in an urban locality, that is, an urban Mexico.
In 2010, over 86 million people lived in urban areas, while over 26 million people lived in rural areas.
Poverty and social deprivation levels have particular characteristics according to the territorial area.
In rural areas, the percentage of the population living in poverty during 2010 was 65.1 percent, which
means that 17 million people were enduring one or more social deprivations and had an income
below the wellbeing line, which impeded them to acquire the necessary goods and services to satisfy
their basic needs. On the other hand, in urban areas, although the incidence of poverty is less than in
rural areas, 40.6 percent, the number of people replicates until reaching 35 million. This means that
two out of three poor people lived in urban areas and one out of three people lived in rural
communities (chart 1.3).

28
Re
po
rt o
f P
ove
rty in
Me
xic
o 2
010
: Th
e C
ou
ntr
y, It
s Sta
tes
an
d Its
Mu
nic
ipa
litie
s •
PO
VER
TY IN
MEX
ICO
2010
CHART 1.3
PERCENTAGE, NUMBER OF PEOPLE AND AVERAGE DEPRIVATIONS IN THE POVERTY
INDICATORS IN THE POPULATION LIVING IN RURAL AND URBAN AREAS, MEXICO, 2010
Indicators
Rural Urban
Percentage Million people
Average deprivations
Percentage Million people
Average deprivations
Poverty
Population living in poverty
65.1 17.0 3.2 40.6 35.1 2.3
Population living in moderate poverty
38.5 10.1 2.7 33.8 29.2 2.1
Population living in extreme poverty
26.6 6.9 3.9 6.8 5.9 3.7
Vulnerable population due to social deprivations
29.0 7.6 2.3 28.7 24.8 1.8
Vulnerable population due to income
1.0 0.3 0.0 7.1 6.2 0.0
Non multidimensional poor and non vulnerable population
5.0 1.3 0.0 23.6 20.4 0.0
Population with at least one social deprivation
94.1 24.6 2.9 69.3 59.9 2.1
Population with three or more social deprivations
56.2 14.7 3.8 20.4 17.6 3.5
Educational gap 33.9 8.9 3.6 16.6 14.4 2.8
Deprivation due to access to health services
32.2 8.4 3.7 31.6 27.3 2.6
Deprivation due to access to social security
81.9 21.4 3.1 54.3 46.9 2.3
Deprivation due to quality and spaces of the dwelling
29.2 7.6 4.0 11.0 9.5 3.3
Deprivation due to access to basic services in the dwelling
63.5 16.6 3.4 10.7 9.3 3.3

29
CHART 1.3 (CONTINUED)
PERCENTAGE, NUMBER OF PEOPLE AND AVERAGE DEPRIVATIONS IN THE POVERTY
INDICATORS IN THE POPULATION LIVING IN RURAL AND URBAN AREAS, MEXICO, 2010
Indicators
Rural Urban
Percentage Million people
Average deprivations
Percentage Million people
Average deprivations
Deprivation due to access to food
33.6 8.8 3.8 22.2 19.2 2.7
Population with income below the minimum wellbeing line
35.0 9.1 3.4 14.7 12.7 2.5
Population with income below the wellbeing line
66.0 17.3 3.1 47.7 41.3 2.0
Source: estimates from CONEVAL based on the MCS-ENIGH 2010.
Extreme poverty has different characteristics in rural and urban areas. In rural areas, the population
living in extreme poverty had an incidence of 26.6 percent, which means that almost seven million
people lived with an income below the minimum wellbeing line and with three or more social
deprivations, while in urban areas the incidence of extreme poverty was 6.8 percent, that is, over six
million people.
If the percentage of people who had at least one social deprivation is analyzed, we can see that 94.1
percent of the rural population endured at least one deprivation in the social rights space, while seven
out of ten people residing in urban localities had at least one social deprivation. In total, the amount of
24.6 million people with at least one deprivation in rural areas and the 59.9 million of deprived people
in urban areas meant that three out of four Mexican people endured deprivation in at least one of the
social deprivations indicators included in poverty measurement.
In the rural sphere, social deprivations had duplicated incidences of population, and in some cases
they increased five-fold in comparison to those observed in urban areas. For example, access to
social security was the deprivation with the highest incidence in rural areas (81.9 percent) and urban
areas (54.3 percent). On the other hand, the incidence of deprived population due to access to basic
services in the dwelling in urban areas was 10.7 percent, while in rural areas it was 63.5 percent.
This means the coverage regarding basic infrastructure (water, drainage system, electricity and
above all the fuel used for cooking) is still a pending issue in the latter. A similar situation happened
with the indicator of deprivation due to quality and spaces of the dwelling, the incidence of which in
the population from urban areas was 11 percent and 29.2 in the case of rural areas. This means in
rural areas there were more houses with dirt floors, non-recommendable construction materials and
more people living in overcrowded conditions.

30
Re
po
rt o
f P
ove
rty in
Me
xic
o 2
010
: Th
e C
ou
ntr
y, It
s Sta
tes
an
d Its
Mu
nic
ipa
litie
s •
PO
VER
TY IN
MEX
ICO
2010
1.1.3 POVERTY BY FEDERAL ENTITY
Poverty at state level in 2010 was distributed as follows: 13 entities had an incidence above 50
percent, that is, one out of two people in those entities had at least one social deprivation and his/her
income was so limited that he/she could not range above the economic wellbeing line. In this group,
the following states stand out due to their high incidence: Chiapas (78.5 percent); Guerrero (67.6);
Oaxaca (67.4); Puebla (61.2); and Tlaxcala (60.6). On the other hand, the entities with the lowest
incidence of poverty were Nuevo León (21.2); Coahuila (28); Federal District (28.7); Baja California
Sur (30.9), and Baja California (32.1 percent).
CHART 1.4
DISTRIBUTION OF THE POPULATION ACCORDING TO THEIR POVERTY AND
VULNERABILITY CONDITIONS AND NON MULTIDIMENSIONAL POOR AND NON
VULNERABLE POPULATION BY FEDERAL ENTITY, MEXICO, 2010
Entity code
Federal Entity
Population living in poverty
Total
Vulnerable population
Non multidimensional poor
and non vulnerable population
Total
Extreme Moderate
Due to social
deprivation
Due to income
01 Aguascalientes 3.7 34.6 38.3 27.0 7.9 26.8 100.0
02 Baja California 3.5 28.6 32.1 39.3 6.1 22.6 100.0
03 Baja California Sur 4.6 26.3 30.9 33.6 4.5 31.1 100.0
04 Campeche 13.6 36.7 50.3 25.6 4.3 19.8 100.0
05 Coahuila 3.0 25.0 28.0 26.5 12.6 32.9 100.0
06 Colima 2.5 32.3 34.7 34.1 4.9 26.3 100.0
07 Chiapas 38.3 40.2 78.5 13.2 2.3 5.9 100.0
08 Chihuahua 6.6 32.6 39.2 23.5 12.6 24.6 100.0
09 Federal District 2.2 26.5 28.7 35.6 5.2 30.5 100.0
10 Durango 10.3 41.0 51.3 21.4 8.8 18.5 100.0
11 Guanajuato 8.4 40.1 48.6 29.5 5.6 16.3 100.0
12 Guerrero 31.6 36.0 67.6 23.2 2.0 7.3 100.0
13 Hidalgo 13.5 41.4 54.9 28.1 3.9 13.1 100.0
14 Jalisco 5.2 31.8 37.0 34.4 6.0 22.6 100.0
15 State of Mexico 8.6 34.4 43.0 33.0 5.5 18.6 100.0
16 Michoacán 13.5 41.3 54.8 28.9 4.2 12.1 100.0
17 Morelos 7.0 36.6 43.7 34.4 5.4 16.5 100.0
18 Nayarit 8.2 33.1 41.3 33.7 4.3 20.6 100.0

31
CHART 1.4 (CONTINUED)
DISTRIBUTION OF THE POPULATION ACCORDING TO THEIR POVERTY AND
VULNERABILITY CONDITIONS AND NON MULTIDIMENSIONAL POOR AND NON
VULNERABLE POPULATION BY FEDERAL ENTITY, MEXICO, 2010
Entity code
Federal Entity
Population living in poverty
Total
Vulnerable population
Non multidimensional poor
and non vulnerable population
Total
Extreme Moderate
Due to social
deprivation
Due to income
19 Nuevo León 1.9 19.2 21.2 33.0 8.1 37.8 100.0
20 Oaxaca 29.8 37.6 67.4 22.4 1.2 9.0 100.0
21 Puebla 16.7 44.5 61.2 22.0 5.5 11.3 100.0
22 Querétaro 7.4 34.1 41.5 32.6 4.8 21.0 100.0
23 Quintana Roo 6.3 28.3 34.6 37.2 4.6 23.6 100.0
24 San Luis Potosí 15.5 37.1 52.6 21.6 6.9 19.0 100.0
25 Sinaloa 5.4 31.1 36.5 33.8 7.6 22.1 100.0
26 Sonora 5.3 28.5 33.8 32.8 6.4 27.0 100.0
27 Tabasco 13.6 43.7 57.3 27.6 4.0 11.1 100.0
28 Tamaulipas 5.6 33.7 39.4 27.9 9.0 23.7 100.0
29 Tlaxcala 10.0 50.6 60.6 20.0 7.0 12.5 100.0
30 Veracruz 19.3 39.2 58.5 24.1 4.2 13.3 100.0
31 Yucatán 11.7 36.8 48.5 26.4 6.2 18.8 100.0
32 Zacatecas 10.8 49.4 60.2 18.7 6.8 14.3 100.0
Mexican United States
11.4 34.9 46.3 28.8 5.7 19.3 100.0
Source: estimates from CONEVAL based on the MCS-ENIGH 2010.
Incidence of poverty at state level had a heterogeneous space distribution that can be observed in
the following maps: in map 1.1 it can be seen that the states in the south of the country concentrated
the highest levels; whereas the states in the north, apart from Jalisco, Colima, Aguascalientes,
Federal District and Quintana Roo concentrated the lowest levels.

32
Re
po
rt o
f P
ove
rty in
Me
xic
o 2
010
: Th
e C
ou
ntr
y, It
s Sta
tes
an
d Its
Mu
nic
ipa
litie
s •
PO
VER
TY IN
MEX
ICO
2010
MAP 1.1 PERCENTAGE OF POPULATION LIVING IN POVERTY
PER FEDERAL ENTITY, MEXICO, 2010
Source: estimates from CONEVAL based on the MCS-ENIGH 2010.
Map 1.2 presents the incidence of extreme poverty in the country, with the following states standing
out due to their high incidence: Chiapas, Guerrero, Puebla, Oaxaca, Veracruz and San Luis Potosí.
On the contrary, the states in the north of the country, west region, and the lowland, apart from the
Federal District and Quintana Roo, have less than 10 percent of their population living in extreme
poverty.
Ranges
Total entities

33
MAP 1.2 PERCENTAGE OF POPULATION LIVING IN EXTREME
POVERTY PER FEDERAL ENTITY, MEXICO, 2010
Source: estimates from CONEVAL based on the MCS-ENIGH 2010.
The information displayed in map 1.3 shows that the incidence of moderate poverty was higher in
Tlaxcala, Zacatecas, Puebla, Tabasco, Hidalgo, Michoacán, Durango and Chiapas.
MAP 1.3 PERCENTAGE OF POPULATION LIVING IN
MODERATE POVERTY PER FEDERAL ENTITY, MEXICO, 2010
Source: estimates from CONEVAL based on the MCS-ENIGH 2010.
Ranges
Total entities
Ranges
Total entities

34
Re
po
rt o
f P
ove
rty in
Me
xic
o 2
010
: Th
e C
ou
ntr
y, It
s Sta
tes
an
d Its
Mu
nic
ipa
litie
s •
PO
VER
TY IN
MEX
ICO
2010
The following maps show the distribution in the national territory of the vulnerable population either
due to social deprivations or income. Their distribution is very different and heterogeneous compared
to what is observed in poverty maps. The vulnerable population due to social deprivations has more
incidence in the northeast region of the country, the western region and the State of Mexico,
Querétaro, Federal District, Morelos, Nuevo León and Quintana Roo.
MAP 1.4 PERCENTAGE OF VULNERABLE POPULATION PER
FEDERAL ENTITY, MEXICO, 2010
(a) Vulnerable population due to social deprivations
Source: estimates from CONEVAL based on the MCS-ENIGH 2010.
Ranges
Total
entities

35
MAP 1.4 (continued) PERCENTAGE OF VULNERABLE POPULATION PER
FEDERAL ENTITY, MEXICO, 2010
(b) Vulnerable population due to income
Source: estimates from CONEVAL based on the MCS-ENIGH 2010.
The vulnerable population due to income is concentrated in the northeast region of the country, and
the following states stand out: Chihuahua with 12.6 percent, Coahuila (12.6), Tamaulipas (9.0),
Durango (8.8) and Nuevo León with 8.1 percent. The entities with the lowest incidence were Oaxaca,
Guerrero, Chiapas and Hidalgo with percentages below four percent.
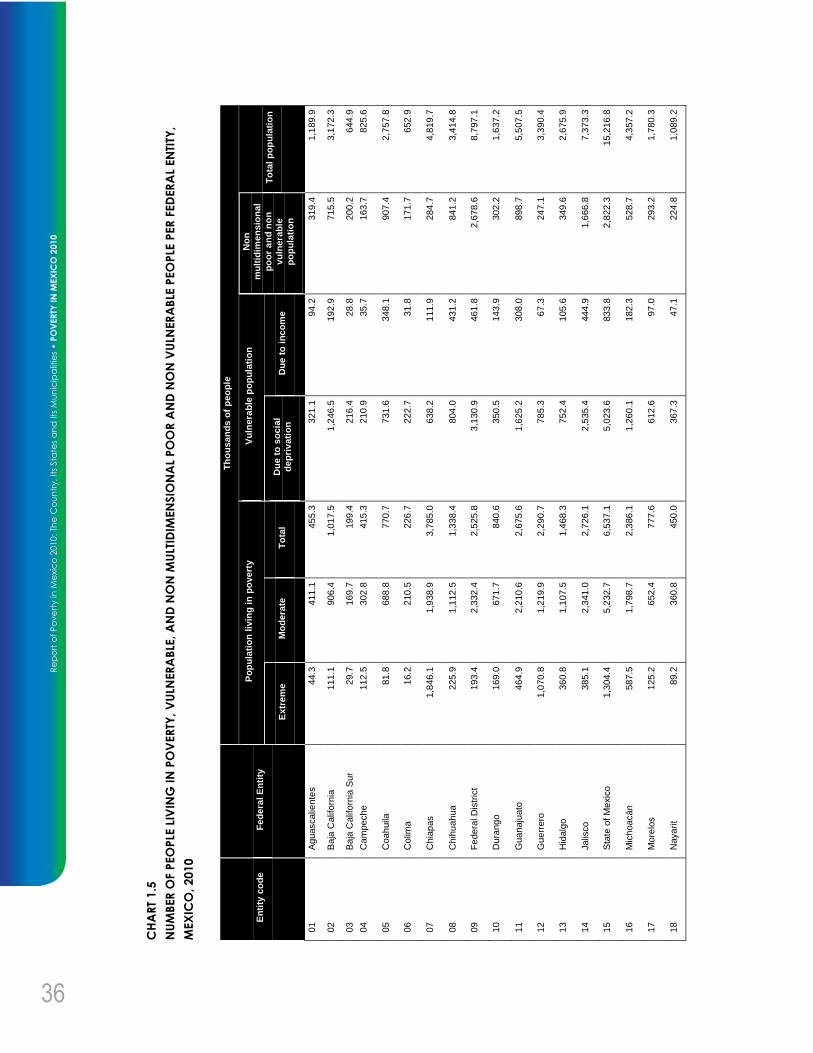
1.1.4 DISTRIBUTION OF POPULATION LIVING IN
POVERTY BY FEDERAL ENTITY
At aggregated level, in 2010 the country had a total of 52.1 million people living in poverty; the
distribution across the territory can be observed in the state and municipal maps. Furthermore, the
volume of people living in poverty that each state contributes to the country as a whole is an element
to be taken into account for the preparation of public policies, and therefore it is necessary to
acknowledge their number by federal entity.
Chart 1.5 shows the total number of people living in poverty by each federal entity. The State of
Mexico, Veracruz, Chiapas, Puebla and Jalisco stand out with over 21 million people living in poverty
taken as a set.
Ranges
Total entities
36
Re
po
rt o
f P
ove
rty in
Me
xic
o 2
010
: Th
e C
ou
ntr
y, It
s Sta
tes
an
d Its
Mu
nic
ipa
litie
s •
PO
VER
TY IN
MEX
ICO
2010
CH
AR
T 1
.5
NU
MB
ER
OF P
EO
PLE
LIV
ING
IN
PO
VER
TY,
VU
LNER
AB
LE, A
ND
NO
N M
ULT
IDIM
EN
SIO
NA
L P
OO
R A
ND
NO
N V
ULN
ER
AB
LE P
EO
PLE
PER
FED
ER
AL
EN
TITY
,
MEX
ICO
, 2
010
Th
ou
sa
nd
s o
f p
eo
ple
To
tal
po
pu
lati
on
1,1
89.9
3,1
72.3
644
.9
825
.6
2,7
57.8
652
.9
4,8
19.7
3,4
14.8
8,7
97.1
1,6
37.2
5,5
07.5
3,3
90.4
2,6
75.9
7,3
73.3
15,2
16
.8
4,3
57.2
1,7
80.3
1,0
89.2
No
n
mu
ltid
imen
sio
nal
po
or
an
d n
on
vu
lnera
ble
po
pu
lati
on
319
.4
715
.5
200
.2
163
.7
907
.4
171
.7
284
.7
841
.2
2,6
78.6
302
.2
898
.7
247
.1
349
.6
1,6
66.8
2,8
22.3
528
.7
293
.2
224
.8
Vu
lnera
ble
po
pu
lati
on
Du
e t
o i
nc
om
e
94.2
192
.9
28.8
35.7
348
.1
31.8
111
.9
431
.2
461
.8
143
.9
308
.0
67.3
105
.6
444
.9
833
.8
182
.3
97.0
47.1
Du
e t
o s
ocia
l d
ep
riv
ati
on
321
.1
1,2
46.5
216
.4
210
.9
731
.6
222
.7
638
.2
804
.0
3,1
30.9
350
.5
1,6
25.2
785
.3
752
.4
2,5
35.4
5,0
23.6
1,2
60.1
612
.6
367
.3
Po
pu
lati
on
liv
ing
in
po
vert
y
To
tal 4
55
.3
1,0
17.5
199
.4
415
.3
770
.7
226
.7
3,7
85.0
1,3
38.4
2,5
25.8
840
.6
2,6
75.6
2,2
90.7
1,4
68.3
2,7
26.1
6,5
37.1
2,3
86.1
777
.6
450
.0
Mo
dera
te
411
.1
906
.4
169
.7
302
.8
688
.8
210
.5
1,9
38.9
1,1
12.5
2,3
32.4
671
.7
2,2
10.6
1,2
19.9
1,1
07.5
2,3
41.0
5,2
32.7
1,7
98.7
652
.4
360
.8
Extr
em
e 44.3
111
.1
29.7
112
.5
81.8
16.2
1,8
46.1
225
.9
193
.4
169
.0
464
.9
1,0
70.8
360
.8
385
.1
1,3
04.4
587
.5
125
.2
89.2
Fe
dera
l E
nti
ty
Aguascalie
nte
s
Baja
Calif
orn
ia
Baja
Calif
orn
ia S
ur
Cam
peche
Coah
uila
Colim
a
Chia
pas
Chih
uah
ua
Fe
dera
l D
istr
ict
Dura
ng
o
Gua
naju
ato
Gue
rrero
Hid
alg
o
Jalis
co
Sta
te o
f M
exic
o
Mic
hoacán
More
los
Naya
rit
En
tity
co
de
01
02
03
04
05
06
07
08
09
10
11
12
13
14
15
16
17
18

37
CH
AR
T 1
.5 (
CO
NTI
NU
ED
)
NU
MB
ER
OF P
EO
PLE
LIV
ING
IN
PO
VER
TY,
VU
LNER
AB
LE, A
ND
NO
N M
ULT
IDIM
EN
SIO
NA
L P
OO
R A
ND
NO
N V
ULN
ER
AB
LE P
EO
PLE
PER
FED
ER
AL
EN
TITY
,
MEX
ICO
, 2
01
0
To
tal
po
pu
lati
on
4,6
63.1
3,8
07.8
5,7
92.6
1,8
34.9
1,3
40.9
2,5
88.8
2,7
69.8
2,6
69.9
2,2
45.4
3,2
78.4
1,1
75.7
7,6
43.4
1,9
56.3
1,4
93.5
112
,56
3.3
Sourc
e:
estim
ate
s f
rom
CO
NE
VA
L b
ased o
n t
he
MC
S-E
NIG
H 2
010
.
No
n
mu
ltid
imen
sio
nal
po
or
an
d n
on
vu
lnera
ble
po
pu
lati
on
1,7
60.1
343
.2
652
.3
386
.0
316
.5
491
.3
610
.9
720
.8
249
.3
777
.7
146
.3
1,0
15.4
368
.2
214
.1
21,6
67
.9
Vu
lnera
ble
po
pu
lati
on
Du
e t
o i
nc
om
e
377
.8
45.8
318
.1
88.4
61.2
179
.0
211
.6
171
.0
89.9
296
.5
82.2
318
.5
121
.9
100
.9
6,4
29.1
Th
ou
sa
nd
s o
f p
eo
ple
Du
e t
o s
ocia
l d
ep
riv
ati
on
1,5
39.2
852
.7
1,2
75.9
599
.0
498
.9
558
.2
936
.3
875
.4
620
.1
913
.8
234
.9
1,8
41.8
517
.0
279
.0
32,3
76
.7
Po
pu
lati
on
liv
ing
in
po
vert
y
To
tal 9
86
.1
2,5
66.2
3,5
46.3
761
.5
464
.3
1,3
60.3
1,0
11.0
902
.6
1,2
86.2
1,2
90.3
712
.3
4,4
67.7
949
.1
899
.6
52,0
89
.5
Mo
dera
te
897
.2
1,4
30.9
2,5
78.1
624
.8
379
.7
960
.2
860
.8
760
.7
980
.7
1,1
05.7
594
.8
2,9
94.9
719
.4
738
.2
39,2
94
.5
Extr
em
e 88.9
1,1
35.2
968
.2
136
.7
84.6
400
.1
150
.2
141
.9
305
.4
184
.7
117
.4
1,4
72.9
229
.7
161
.4
12,7
95
.1
En
tity
Nuevo L
eó
n
Oaxa
ca
Puebla
Que
réta
ro
Quin
tan
a R
oo
San L
uis
Poto
sí
Sin
alo
a
Sono
ra
Ta
basco
Ta
ma
ulip
as
Tla
xcala
Vera
cru
z
Yucatá
n
Zacate
cas
Mex
ican
Un
ite
d S
tate
s
En
tity
co
de
19
20
21
22
23
24
25
26
27
28
29
30
31
32
1.2

38
Re
po
rt o
f P
ove
rty in
Me
xic
o 2
010
: Th
e C
ou
ntr
y, It
s Sta
tes
an
d Its
Mu
nic
ipa
litie
s •
PO
VER
TY IN
MEX
ICO
2010
DEPTH AND INTENSITY OF POVERTY
1.2.1 DEPTH OF POVERTY
Once the figures of incidence and number of people living in poverty are known, then depth
measures regarding the economic wellbeing and social rights spaces are reported.
In the case of the economic wellbeing space, the FTG (Foster, Greer and Thorbecke, 1984) index, a
measurement quantifying the depth of poverty by income, is reported. It represents the average
distance between income and the economic wellbeing line of the population deprived in this space.
This index was calculated for the population whose income is below the economic wellbeing line and
according to the number of social deprivations per individual. Chart 1.6 shows that as the number of
social deprivations per individual increases, depth also increases; this means the more deprivations
an individual has, the farther the income of the individuals is from the wellbeing line.
CHART 1.6
DEPTH OF POVERTY IN THE ECONOMIC WELLBEING SPACE AT NATIONAL SCALE, BY
NUMBER OF SOCIAL DEPRIVATIONS, MEXICO, 2010
Number of social deprivations
Depth of poverty Average income
0 0.290 1,477
1 0.368 1,267
2 0.419 1,124
3 0.475 958
4 0.530 811
5 0.576 700
6 0.603 643
Total 0.434 1,080
Note: the depth measurement takes into account the population with an income below the wellbeing line.
Source: estimates from CONEVAL based on the MCS-ENIGH 2010.

39
Depth measurements in the social rights space are the average number of deprivations and the
average ratio of social deprivations. Chart 1.7 shows the figures of the average number of
deprivations by population groups in 2010. The total population in the country had an average of 1.8
social deprivations, the population living in poverty a mean of 2.6 deprivations, people living in
extreme poverty 3.8 deprivations, and people living in moderate poverty 2.2 deprivations. The
population with at least one social deprivation and the vulnerable population due to social
deprivations had 2.3 and 1.9 social deprivations average, respectively.
CHART 1.7
DEPTH OF POVERTY IN THE SOCIAL RIGHTS SPACE: AVERAGE NUMBER OF SOCIAL
DEPRIVATIONS AT NATIONAL SCALE, PER SELECTED POPULATION GROUPS, MEXICO,
2010
Depth indicators Number of deprivations1
2010
Total population 1.8
Population living in poverty 2.6
Population living in moderate poverty 2.2
Population living in extreme poverty 3.8
Population with at least one social deprivation 2.3
Vulnerable population due to social deprivations 1.9
1 The average number of social deprivations (educational gap, access to health services, access to social security, quality and
spaces of the dwelling, access to basic services in the dwelling and access to food) of the reference group is reported.
Source: estimates from CONEVAL based on the MCS-ENIGH 2010.

40
Re
po
rt o
f P
ove
rty in
Me
xic
o 2
010
: Th
e C
ou
ntr
y, It
s Sta
tes
an
d Its
Mu
nic
ipa
litie
s •
PO
VER
TY IN
MEX
ICO
2010
The percentage distribution of population according to the social deprivation index (graph 1.3) shows
that only one out of four Mexican people was living without the social deprivations used in order to
measure poverty.
GRAPH 1.3 PERCENTAGE DISTRIBUTION OF POPULATION PER NUMBER OF
SOCIAL DEPRIVATIONS, MEXICO, 2010
Number of social deprivations
Source: estimates from CONEVAL based on the MCS-ENIGH 2010.
1.2.2 INTENSITY OF POVERTY
In the social rights space, apart from the depth measurements previously stated, an intensity
measure can also be calculated, which is an adaptation of Alkire and Foster methodology (2007) that
measures the ratio of deprivations in a specific aggregate regarding the maximum possible amount of
deprivations that may be experienced by the total population of a country.
Taking into account the total number of poor people in the country, 52.1 million people and the
average of social deprivations 2.6 that each one had in 2010, it was estimated that there were 135.46
million social deprivations among the population living in poverty. Based on these results, poverty
intensity was of about 0.20, which resulted from dividing 135.46 million social deprivations by a total
of 675.36 million, the maximum amount of deprivations that may be experienced by the Mexican
population as a whole.
Pe
rce
nta
ge

41
1.2.3 DEPTH AND INTENSITY OF POVERTY BY FEDERAL
ENTITY
The average number of social deprivations was calculated by federal entity. The states with the
population living in poverty that registered the highest number of social deprivations average were
Guerrero (3.4), Oaxaca and Chiapas (3.2). On the other hand, the states of Coahuila, Aguascalientes
and Nuevo León had among their population living in poverty the lowest average number of social
deprivations; around two of them.
Regarding population living in extreme poverty, the states of Guerrero, Oaxaca, Puebla and Chiapas
registered about four social deprivations average.
In the country, the vulnerable population due to social deprivation had an average of 1.9 deprivations,
and at state level Guerrero, Oaxaca, Veracruz, Michoacán, Puebla and Chiapas were the states with
the highest contribution to depth by registering between 2.2 and 2.5 deprivations average.

42
Re
po
rt o
f P
ove
rty in
Me
xic
o 2
010
: Th
e C
ou
ntr
y, It
s Sta
tes
an
d Its
Mu
nic
ipa
litie
s •
PO
VER
TY IN
MEX
ICO
2010
CHART 1.8
DEPTH OF POVERTY IN THE SOCIAL RIGHTS SPACE: AVERAGE NUMBER OF SOCIAL
DEPRIVATIONS OF THE POPULATION LIVING IN POVERTY PER FEDERAL ENTITY, MEXICO,
2010
Entity code
Federal Entity Total
population
Population living in poverty Population with at least one
social deprivation
Vulnerable population due
to a social deprivation Extreme Moderate Total
01 Aguascalientes 1.2 3.4 1.8 1.9 1.8 1.7
02 Baja California 1.4 3.4 2.0 2.2 2.0 1.8
03 Baja California Sur
1.3 3.8 2.0 2.3 2.1 1.8
04 Campeche 1.9 3.8 2.4 2.8 2.6 2.1
05 Coahuila 1.0 3.4 1.7 1.9 1.8 1.7
06 Colima 1.3 3.7 2.0 2.2 1.9 1.7
07 Chiapas 2.8 3.9 2.4 3.2 3.0 2.2
08 Chihuahua 1.2 3.7 1.8 2.1 1.9 1.5
09 Federal District 1.2 3.5 2.0 2.1 1.9 1.8
10 Durango 1.5 3.6 1.9 2.3 2.1 1.8
11 Guanajuato 1.7 3.5 2.1 2.4 2.1 1.8
12 Guerrero 2.9 4.1 2.8 3.4 3.1 2.5
13 Hidalgo 2.0 3.7 2.3 2.6 2.4 2.1
14 Jalisco 1.5 3.7 2.0 2.3 2.1 2.0
15 State of Mexico 1.7 3.6 2.2 2.5 2.3 2.0
16 Michoacán 2.2 3.9 2.5 2.8 2.6 2.2
17 Morelos 1.8 3.7 2.1 2.4 2.2 2.1
18 Nayarit 1.6 3.9 2.0 2.3 2.1 1.8
19 Nuevo León 1.0 3.5 1.8 2.0 1.8 1.7
20 Oaxaca 2.7 4.0 2.6 3.2 3.0 2.3
21 Puebla 2.2 3.9 2.4 2.8 2.7 2.2
22 Querétaro 1.5 3.6 2.0 2.2 2.1 1.9
23 Quintana Roo 1.6 3.6 2.2 2.4 2.2 2.0
24 San Luis Potosí 1.8 3.8 2.2 2.6 2.4 1.9
25 Sinaloa 1.4 3.6 2.0 2.2 2.0 1.9
26 Sonora 1.4 3.8 2.2 2.4 2.1 1.8
27 Tabasco 2.1 3.7 2.4 2.7 2.5 2.1
28 Tamaulipas 1.3 3.6 1.9 2.1 1.9 1.6
29 Tlaxcala 1.7 3.5 2.0 2.2 2.1 1.8
30 Veracruz 2.2 3.9 2.4 2.9 2.7 2.2
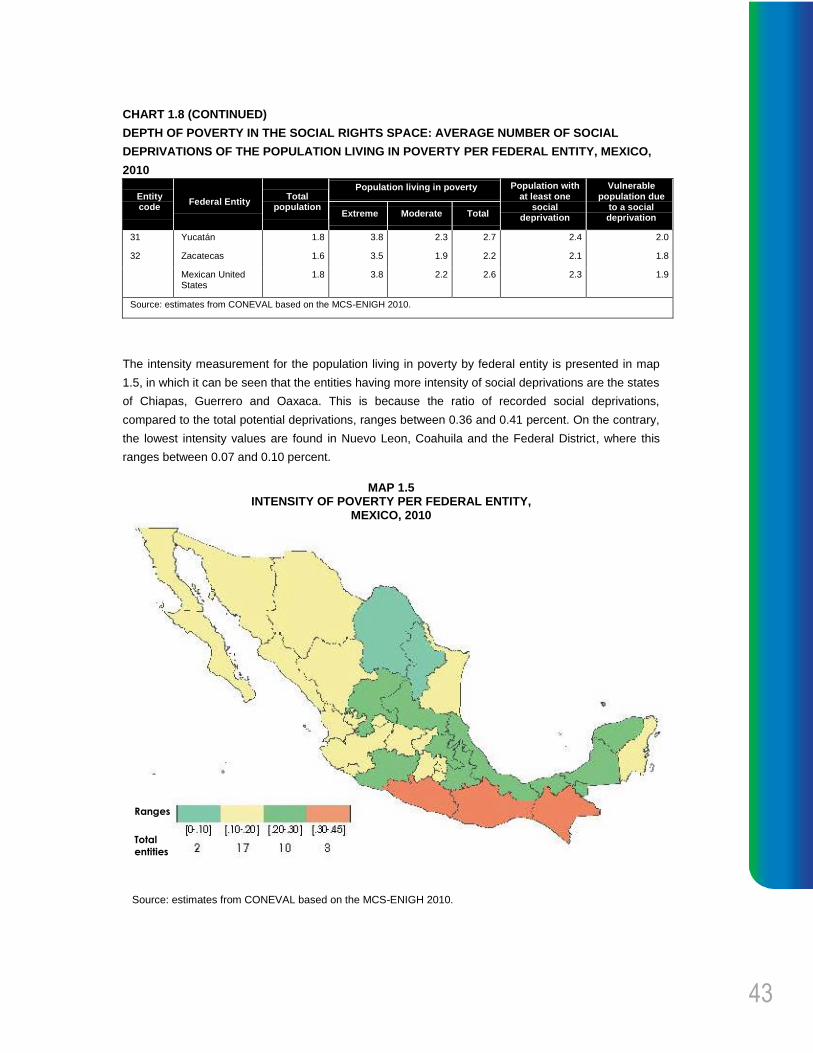
43
CHART 1.8 (CONTINUED)
DEPTH OF POVERTY IN THE SOCIAL RIGHTS SPACE: AVERAGE NUMBER OF SOCIAL
DEPRIVATIONS OF THE POPULATION LIVING IN POVERTY PER FEDERAL ENTITY, MEXICO,
2010
Entity code
Federal Entity Total
population
Population living in poverty Population with at least one
social deprivation
Vulnerable population due
to a social deprivation Extreme Moderate Total
31 Yucatán 1.8 3.8 2.3 2.7 2.4 2.0
32 Zacatecas 1.6 3.5 1.9 2.2 2.1 1.8
Mexican United States
1.8 3.8 2.2 2.6 2.3 1.9
Source: estimates from CONEVAL based on the MCS-ENIGH 2010.
The intensity measurement for the population living in poverty by federal entity is presented in map
1.5, in which it can be seen that the entities having more intensity of social deprivations are the states
of Chiapas, Guerrero and Oaxaca. This is because the ratio of recorded social deprivations,
compared to the total potential deprivations, ranges between 0.36 and 0.41 percent. On the contrary,
the lowest intensity values are found in Nuevo Leon, Coahuila and the Federal District, where this
ranges between 0.07 and 0.10 percent.
MAP 1.5 INTENSITY OF POVERTY PER FEDERAL ENTITY,
MEXICO, 2010
Source: estimates from CONEVAL based on the MCS-ENIGH 2010.
Ranges
Total
entities

44
Re
po
rt o
f P
ove
rty in
Me
xic
o 2
010
: Th
e C
ou
ntr
y, It
s Sta
tes
an
d Its
Mu
nic
ipa
litie
s •
PO
VER
TY IN
MEX
ICO
2010
1.2.4 CONTRIBUTION OF EACH DEPRIVATION
INDICATOR TO THE INTENSITY OF POVERTY
The contribution of each one of the social deprivations to the incidence of poverty by federal entity
allows a more detailed examination of the composition of social deprivations in the social rights
space. In graph 1.4 it can be seen that the deprivation due to access to social security is the category
with most contribution to the intensity of poverty in all federal entities, and, on the contrary, the quality
and spaces of the dwelling is the deprivation with least contribution.

45
GR
AP
H 1
.4 C
ON
TR
IBU
TIO
N O
F E
AC
H S
OC
IAL
DE
PR
IVA
TIO
N I
ND
ICA
TO
R T
O T
HE
IN
TE
NS
ITY
OF
PO
VE
RT
Y P
ER
FE
DE
RA
L E
NT
ITY
, M
EX
ICO
, 2
01
0
Sourc
e: estim
ate
s f
rom
CO
NE
VA
L b
ased o
n t
he M
CS
-EN
IGH
2010.
Zacatecas
Yucatán
Veracruz
Tlaxcala
Tamaulipas
Tabasco
Sonora
Sinaloa
San Luis Potosí
Quintana Roo
Querétaro
Puebla
Oaxaca
Nuevo León
Nayarit
Morelos
Michoacán
State of Mexico
Jalisco
Hidalgo
Guerrero
Guanajuato
Mexican United States
Durango
Federal District
Chihuahua
Chiapas
Colima
Coahuila
Campeche
Baja California Sur
Baja California
Aguascalientes
Ed
uc
atio
na
l g
ap
Qu
ality
an
d s
pa
ce
s o
f th
e d
we
llin
g
Ac
ce
ss t
o h
ea
lth
se
rvic
es
Ba
sic
se
rvic
es
in t
he
dw
ellin
g
Ac
ce
ss t
o s
oc
ial se
cu
rity
Ac
ce
ss t
o f
oo
d


2. Poverty in Mexico, 2008-2010

48
Re
po
rt o
f P
ove
rty in
Me
xic
o 2
010
: Th
e C
ou
ntr
y, It
s Sta
tes
an
d Its
Mu
nic
ipa
litie
s •
PO
VER
TY IN
MEX
ICO
2008-2
010
Poverty in Mexico, 2008-2010
In July 2011, CONEVAL submitted the poverty estimations for 2010 at national level and by federal
entity. In this way, the country has information to assess changes in the indicators, analytical spaces,
population groups, and federal entities regarding the evolution of poverty since 2008. Besides, in
December 2011, CONEVAL made public the estimation of poverty for each of the 2,456
municipalities composing the Mexican Republic.
The purpose of this chapter is to present an overview of the changes that took place in the country
between 2008 and 2010 regarding the life conditions of the population according to their poverty
condition and some of their economic and social conditions. The information is presented at national,
rural and urban level, for each federal entity and some age groups. For comparison purposes and
given that in the MCS-ENIGH 2008 the question about cooking fuel is not available, the results
presented in this section on the estimations of poverty in 2010 vary in comparison to the figures
reported in the previous chapter as well as in the subsequent chapters.
2.1 POVERTY
According to the official definition, poor people are those who have at least one social deprivation and
an income below the wellbeing line. Between 2008 and 2010, some dimensions of poverty had an
improvement, while others had a recession, which negatively affected the evolution of poverty (chart
2.1).
The population living in poverty in Mexico increased in over three million people between 2008 and
2010 going from 48.8 million to 52.0 million.5 Only in four entities the number of people in this
condition decreased: Puebla, Coahuila, Morelos and Michoacán. In spite of this, the average number
of deprivations of the population living in poverty and extreme poverty decreased, in the first case
from 2.7 to 2.5 deprivations and, in the second case, from 3.9 to 3.7 deprivations.
5 Poverty estimations for 2008 and 2010 were made without the variable of cooking fuel, because in 2008 the MCS-
ENIGH questionnaire did not include such information, and it was included until 2010.

49
CHART 2.1
PERCENTAGE, NUMBER OF PEOPLE AND AVERAGE DEPRIVATIONS IN THE POVERTY
INDICATORS, MEXICO, 2008-2010
Indicators
Mexican United States
Percentage Million people Average
deprivations
2008 2010 2008 2010 2008 2010
Poverty
Population living in poverty 44.5 46.2 48.8 52.0 2.7 2.5
Population living in moderate poverty 33.9 35.8 37.2 40.3 2.3 2.1
Population living in extreme poverty 10.6 10.4 11.7 11.7 3.9 3.7
Vulnerable population due to social deprivations 33.0 28.7 36.2 32.3 2.0 1.9
Vulnerable population due to income 4.5 5.8 4.9 6.5 0.0 0.0
Non multidimensional poor and non vulnerable population
18.0 19.3 19.7 21.8 0.0 0.0
Social deprivation
Population with at least one social deprivation 77.5 74.9 85.0 84.3 2.4 2.3
Population with at least three social deprivations 31.1 26.6 34.1 29.9 3.7 3.6
Indicators of social deprivation
Educational gap 21.9 20.6 24.1 23.2 3.2 3.0
Deprivation due to access to health services 40.8 31.8 44.8 35.8 2.9 2.8
Deprivation due to access to social security 65.0 60.7 71.3 68.3 2.6 2.5
Deprivation due to quality and spaces of the dwelling 17.7 15.2 19.4 17.1 3.6 3.5
Deprivation due to access to basic services in the dwelling
19.2 16.5 21.1 18.5 3.5 3.3
Deprivation due to access to food 21.7 24.9 23.8 28.0 3.3 3.0
Wellbeing
Population with income below the minimum wellbeing line
16.7 19.4 18.4 21.8 3.0 2.7
Population with income below the wellbeing line 49.0 52.0 53.7 58.5 2.5 2.2
Source: estimates from CONEVAL based on the MCS-ENIGH 2008 and 2010.
Note: Estimates for 2008 and 2010 use the expansion factors adjusted to the final results from the General Census of Population and Housing 2010, estimated by INEGI.

50
Re
po
rt o
f P
ove
rty in
Me
xic
o 2
010
: Th
e C
ou
ntr
y, It
s Sta
tes
an
d Its
Mu
nic
ipa
litie
s •
PO
VER
TY IN
MEX
ICO
2008-2
010
CH
AR
T 2
.2
PER
CEN
TAG
E,
NU
MB
ER
OF P
EO
PLE
AN
D A
VER
AG
E D
EPR
IVA
TIO
NS IN
TH
E P
OV
ER
TY IN
DIC
ATO
RS IN
TH
E P
OPU
LATI
ON
LIV
ING
IN
RU
RA
L O
R U
RB
AN
AR
EA
S, M
EX
ICO
, 2008
-2010
Avera
ge d
ep
rivati
on
s
201
0
2.3
2.0
3.6
1.8
0.0
0.0
2.1
3.4
2.7
2.6
2.3
3.2
3.2
2.7
200
8
2.4
2.2
3.7
1.8
0.0
0.0
2.2
3.5
2.8
2.7
2.4
3.3
3.3
2.9
Urb
an
Milli
on
pe
op
le
201
0
35.0
29.6
5.5
24.8
6.2
20.4
59.8
16.7
14.4
27.3
46.9
9.5
6.3
19.2
200
8
32.9
27.9
5.0
27.7
4.7
18.8
60.7
18.7
14.8
32.5
49.3
10.3
7.9
15.6
Perc
en
tag
e
201
0
40.5
34.2
6.3
28.6
7.2
23.6
69.2
19.4
16.6
31.6
54.3
11.0
7.3
22.2
200
8
39.1
33.2
5.9
32.9
5.6
22.3
72.1
22.2
17.6
38.6
58.6
12.2
9.4
18.5
Avera
ge d
ep
rivati
on
s
201
0
3.0
2.5
3.9
2.2
0.0
0.0
2.8
3.7
3.4
3.6
2.9
3.8
3.4
3.6
200
8
3.3
2.8
4.0
2.5
0.0
0.0
3.0
3.9
3.7
3.6
3.2
4.0
3.7
3.9
Ru
ral
Milli
on
pe
op
le
201
0
17.0
10.7
6.3
7.5
0.3
1.4
24.5
13.1
8.9
8.4
21.4
7.6
12.2
8.8
200
8
15.9
9.2
6.7
8.4
0.2
1.0
24.3
15.4
9.2
12.3
21.9
9.1
13.2
8.3
Perc
en
tag
e
201
0
64.9
40.9
23.9
28.8
1.1
5.2
93.6
50.3
33.9
32.2
81.9
29.2
46.6
33.6
200
8
62.4
36.2
26.2
33.1
0.7
3.8
95.6
60.6
36.3
48.2
86.2
35.9
51.7
32.6
Ind
icato
rs
Po
vert
y
Popula
tio
n liv
ing in
pove
rty
Popula
tio
n liv
ing in
mod
era
te p
overt
y
Popula
tio
n liv
ing in
extr
em
e p
ove
rty
Vuln
era
ble
pop
ula
tion
du
e t
o s
ocia
l de
privations
Vuln
era
ble
pop
ula
tion
du
e t
o in
co
me
Non m
ultid
imensio
nal p
oo
r a
nd n
on v
uln
era
ble
pop
ula
tion
So
cia
l d
ep
riv
ati
on
Popula
tio
n w
ith a
t le
ast
one
socia
l dep
rivatio
n
Popula
tio
n w
ith a
t le
ast th
ree s
ocia
l d
epriva
tio
ns
Ind
icato
rs o
f so
cia
l d
ep
riva
tio
n
Educa
tion
al gap
Depri
vation d
ue to
access t
o h
ealth s
erv
ices
Depri
vation d
ue to
access t
o s
ocia
l security
Depri
vation d
ue to
qualit
y a
nd s
paces o
f th
e
dw
elli
ng
Depri
vation d
ue to
access t
o b
asic
se
rvic
es in
th
e
dw
elli
ng
Depri
vation d
ue to
access t
o f
oo
d

51
CH
AR
T 2
.2 (
CO
NTI
NU
ED
)
PER
CEN
TAG
E,
NU
MB
ER
OF P
EO
PLE
AN
D A
VER
AG
E D
EPR
IVA
TIO
NS IN
TH
E P
OV
ER
TY IN
DIC
ATO
RS IN
TH
E P
OPU
LATI
ON
LIV
ING
IN
RU
RA
L O
R U
RB
AN
AR
EA
S, M
EX
ICO
, 2008
-2010
Avera
ge d
ep
rivati
on
s
201
0
2.4
1.9
Sourc
e:
estim
ate
s f
rom
CO
NE
VA
L b
ased o
n t
he
MC
S-E
NIG
H 2
008
an
d 2
01
0.
Note
: E
stim
ate
s f
or
20
08 a
nd 2
01
0 u
se
the
expan
sio
n fa
cto
rs a
dju
ste
d to
th
e fin
al re
sults f
rom
the G
enera
l C
ensus o
f P
opula
tio
n a
nd H
ou
sin
g 2
010
, e
stim
ate
d b
y I
NE
GI.
200
8
2.6
2.1
Urb
an
Milli
on
pe
op
le
201
0
12.7
41.3
200
8
10.0
37.7
Perc
en
tag
e
201
0
14.7
47.7
200
8
11.9
44.8
Avera
ge
de
pri
vati
on
s
201
0
3.2
2.9
200
8
3.6
3.3
Ru
ral
Milli
on
pe
op
le
201
0
9.1
17.3
200
8
8.4
16.1
Perc
en
tag
e
201
0
35.0
66.0
200
8
32.8
63.1
Ind
icato
rs
Well
bein
g
Popula
tio
n w
ith incom
e b
elo
w th
e m
inim
um
w
ellb
ein
g lin
e
Popula
tio
n w
ith incom
e b
elo
w th
e w
ellb
ein
g lin
e

52
Re
po
rt o
f P
ove
rty in
Me
xic
o 2
010
: Th
e C
ou
ntr
y, It
s Sta
tes
an
d Its
Mu
nic
ipa
litie
s •
PO
VER
TY IN
MEX
ICO
2008-2
010
CH
AR
T 2
.3
PER
CEN
TAG
E,
NU
MB
ER
OF P
EO
PLE
AN
D A
VER
AG
E D
EPR
IVA
TIO
NS IN
TH
E P
OV
ER
TY IN
DIC
ATO
RS IN
TH
E P
OPU
LATI
ON
UN
DER
18 A
ND
AG
ED
18 O
R
OV
ER
, M
EX
ICO
, 2008-2
010
Po
pu
lati
on
ag
ed
18 o
r o
ver
Avera
ge
de
pri
vati
on
s
201
0
2.5
2.2
3.8
1.9
0.0
0.0
2.3
3.6
2.9
2.8
2.5
3.6
3.4
3.0
200
8
2.8
2.4
3.9
2.0
0.0
0.0
2.4
3.7
3.1
2.9
2.7
3.8
3.6
3.3
Mil
lio
n p
eo
ple
201
0
30.6
24.0
6.6
23.3
3.7
15.2
53.9
19.0
19.3
23.9
42.9
9.1
10.7
16.3
200
8
27.3
20.9
6.4
24.6
3.0
14.5
51.9
20.6
19.8
28.3
41.5
10.1
11.7
13.5
Perc
en
tag
e
201
0
42.0
32.9
9.1
32.0
5.0
20.9
74.1
26.1
26.5
32.9
58.9
12.5
14.7
22.3
200
8
39.4
30.2
9.2
35.4
4.4
20.9
74.8
29.7
28.5
40.8
59.8
14.6
16.9
19.5
Po
pu
lati
on
un
der
18 y
ears
-old
Avera
ge
de
pri
vati
on
s
201
0
2.4
2.0
3.7
1.9
0.0
0.0
2.3
3.5
3.2
2.9
2.4
3.3
3.2
2.9
200
8
2.6
2.3
3.8
2.0
0.0
0.0
2.4
3.6
3.4
3.0
2.5
3.5
3.4
3.2
Milli
on
pe
op
le
201
0
21.4
16.3
5.1
9.0
2.9
6.5
30.3
10.9
3.9
11.9
25.4
8.0
7.9
11.7
200
8
21.5
16.2
5.3
11.6
1.9
5.3
33.1
13.5
4.2
16.5
29.7
9.3
9.3
10.3
Perc
en
tag
e
201
0
53.8
41.0
12.8
22.5
7.2
16.5
76.3
27.4
9.8
29.8
64.0
20.1
19.8
29.5
200
8
53.5
40.3
13.2
28.8
4.6
13.1
82.3
33.4
10.5
41.0
73.9
23.0
23.2
25.7
Ind
icato
rs
Po
vert
y
Popula
tio
n liv
ing in
pove
rty
Popula
tio
n liv
ing in
mod
era
te p
overt
y
Popula
tio
n liv
ing in
extr
em
e p
ove
rty
Vuln
era
ble
pop
ula
tion
du
e t
o s
ocia
l de
privations
Vuln
era
ble
pop
ula
tion
du
e t
o in
co
me
Non m
ultid
imensio
nal p
oo
r a
nd n
on v
uln
era
ble
pop
ula
tion
So
cia
l d
ep
riv
ati
on
Popula
tio
n w
ith a
t le
ast
one
socia
l dep
rivatio
n
Popula
tio
n w
ith a
t le
ast th
ree s
ocia
l d
epriva
tio
ns
Ind
icato
rs o
f so
cia
l d
ep
riva
tio
n
Educa
tion
al gap
Depri
vation d
ue to
access t
o h
ealth s
erv
ices
Depri
vation d
ue to
access t
o s
ocia
l security
Depri
vation d
ue to
qualit
y a
nd s
paces o
f th
e d
welli
ng
Depri
vation d
ue to
access t
o b
asic
hou
seh
old
serv
ices
Depri
vation d
ue to
access t
o f
oo
d

53
CH
AR
T 2
.3 (
CO
NTI
NU
ED
)
PER
CEN
TAG
E,
NU
MB
ER
OF P
EO
PLE
AN
D A
VER
AG
E D
EPR
IVA
TIO
NS IN
TH
E P
OV
ER
TY IN
DIC
ATO
RS IN
TH
E P
OPU
LATI
ON
UN
DER
18 A
ND
AG
ED
18 O
R
OV
ER
, M
EX
ICO
, 2008-2
010
Po
pu
lati
on
ag
ed
18 o
r o
ver
Avera
ge
de
pri
vati
on
s
201
0
2.8
2.3
Sourc
e:
estim
ate
s f
rom
CO
NE
VA
L b
ased o
n t
he
MC
S-E
NIG
H 2
008
an
d 2
01
0.
Note
: E
stim
ate
s f
or
20
08 a
nd 2
01
0 u
se
the
expan
sio
n fa
cto
rs a
dju
ste
d to
th
e fin
al re
sults f
rom
the G
enera
l C
ensus o
f P
opula
tio
n a
nd H
ou
sin
g 2
010
, e
stim
ate
d b
y I
NE
GI.
200
8
3.1
2.5
Milli
on
pe
op
le
201
0
12.0
34.3
200
8
9.8
30.4
Perc
en
tag
e
201
0
16.5
47.1
200
8
14.1
43.7
Po
pu
lati
on
un
der
18 y
ears
-old
Avera
ge
de
pri
vati
on
s
201
0
2.6
2.1
200
8
2.9
2.4
Milli
on
pe
op
le
201
0
9.8
24.2
200
8
8.6
23.4
Perc
en
tag
e
201
0
24.7
61.0
200
8
21.3
58.1
Ind
icato
rs
Well
bein
g
Popula
tio
n w
ith incom
e b
elo
w th
e m
inim
um
wellb
ein
g lin
e
Popula
tio
n w
ith incom
e b
elo
w th
e w
ellb
ein
g lin
e

54
Re
po
rt o
f P
ove
rty in
Me
xic
o 2
010
: Th
e C
ou
ntr
y, It
s Sta
tes
an
d Its
Mu
nic
ipa
litie
s •
PO
VER
TY IN
MEX
ICO
2008-2
010
Despite the reduction in the number of average deprivations, the drop in income resulted in more
people unable to fulfill their most basic needs of food, clothing, transportation, health, education and
recreation, among others.
Between 2008 and 2010, poverty in rural and urban areas also increased. In the first ones passed
from 62.4 to 64.5 percent, this is, from 15.9 to 17 million people; in the second it passed from 39.1 to
40.5 percent, in number of people it represented an increase from 32.9 to 35 million. Thus, from the
52 million poor people, two thirds were urban poor and one third, rural poor.
Despite the fact that poverty increased among the general population and that its proportion among
the population aged under 18 is ten percentage points greater compared to the population in general,
the number of girls, boys and adolescents did not increase. Between 2008 and 2010, child and
adolescent population in poverty passed from 21.5 to 21.4 million (chart 2.3). This may be explained,
on one hand, by the percentage decrease of social deprivations (mainly in the access to health
services, access to social security and educational gap), since it was greater among the child
population than among the general population; and on the other hand, due to a lower increase in the
deprivation due to income in child population than in the total population.
MAP 2.1 CHANGES IN THE PERCENTAGE OF POPULATION IN POVERTY PER FEDERAL ENTITY, MEXICO, 2008-2010
Source: estimates from CONEVAL based on the MCS-ENIGH 2008 and 2010.
Ranges
Total
entities
Significant
increase
Non-significant
change Significant
decrease

55
Map 2.1 shows the changes that were statistically significant in the percentage of population in
poverty. Nine entities had an increase, 21 states did not have changes, and only Morelos and
Coahuila had a statistically significant decrease.
2.2 EXTREME POVERTY
The population living in extreme poverty increased by 38 thousand people from 2008 to 2010, this
represented a total of 11.7 million people in this condition. At state level, only 15 entities decreased
the number of people living in extreme poverty, while 17 had an increase.
2.3 VULNERABLE DUE TO SOCIAL DEPRIVATION
Despite the increase of poverty, the country as a whole had a reduction in the number of vulnerable
people due to social deprivations; this is, those who despite having an income above the wellbeing
line, had one or more social deprivations. From 36.2 million people in that condition in 2008, the
country went to 32.3 million people in 2010. Only four federal entities (Quintana Roo, Morelos,
Guerrero and Coahuila) had an increase in the number of vulnerable people due to social
deprivations.
MAP 2.2 CHANGES IN THE PERCENTAGE OF VULNERABLE POPULATION DUE TO SOCIAL DEPRIVATIONS PER
FEDERAL ENTITY, MEXICO, 2008-2010
Source: estimates from CONEVAL based on the MCS-ENIGH 2008 and 2010.
Ranges
Total entities
Significant
increase Non-significant
change
Significant
decrease

56
Re
po
rt o
f P
ove
rty in
Me
xic
o 2
010
: Th
e C
ou
ntr
y, It
s Sta
tes
an
d Its
Mu
nic
ipa
litie
s •
PO
VER
TY IN
MEX
ICO
2008-2
010
Map 2.2 shows that only the north region of the country, except for Coahuila, and states like Tlaxcala,
Veracruz, Tabasco, Campeche, Yucatán and Colima, between 2008 and 2010, had a statistically
significant reduction in the percentage of vulnerable population due to social deprivation.
2.4 VULNERABLE DUE TO INCOME
In the income field the situation was different, since people without any social deprivation but whose
income was not enough to acquire the basic basket passed from 4.9 to 6.5 million. All the entities
registered an increase of vulnerable people due to income and the State of Mexico registered the
greatest increase with 249 thousand people, Chihuahua 196 thousand, Sinaloa 120 thousand,
Puebla 109 thousand and Veracruz 103 thousand more people.
MAP 2.3 CHANGES IN THE PERCENTAGE OF VULNERABLE
POPULATION DUE TO INCOME PER FEDERAL ENTITY, MEXICO, 2008-2010
Source: estimates from CONEVAL based on the MCS-ENIGH 2008 and 2010.
The map shows that ten federal entities had a statistically significant increase in the percentage of
vulnerable people due to income. Although there is no homogeneous spatial pattern, there are two
regions where this problem increased: in the north-east part (Sonora, Chihuahua and Sinaloa) and in
the central region of the country, except for the Federal District.
Ranges
Total
entities
Significant
increase
Non-significant
change
Significant
decrease
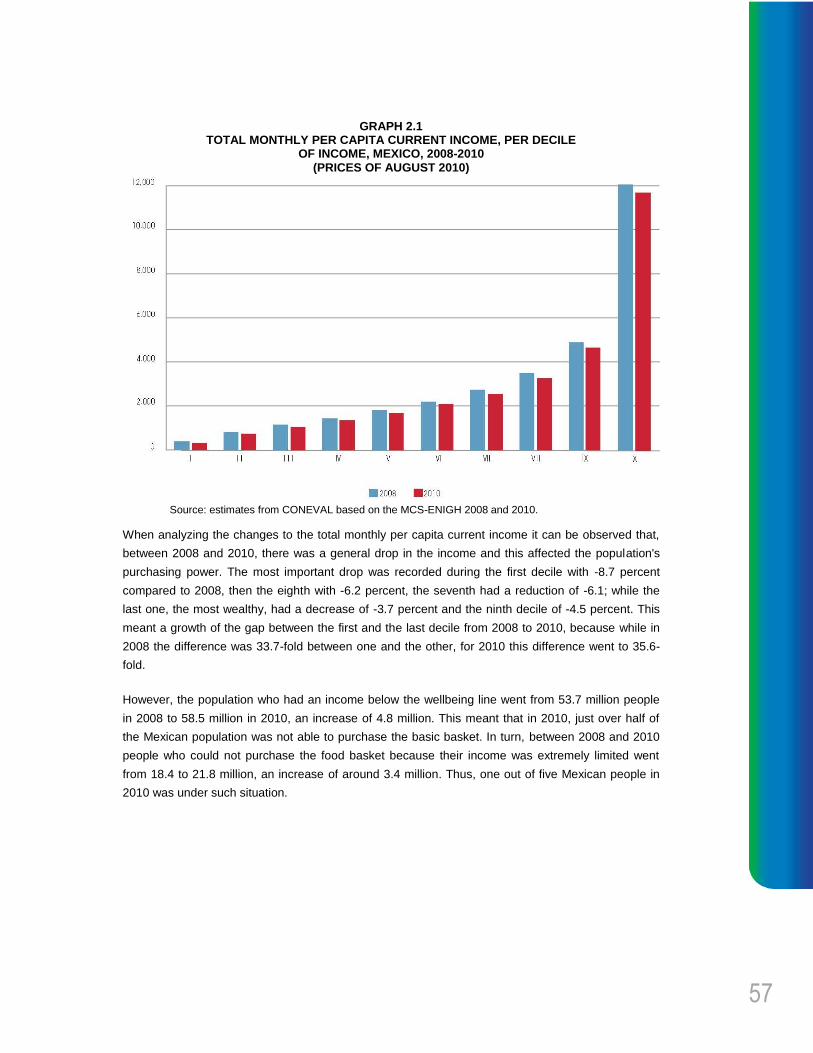
57
GRAPH 2.1 TOTAL MONTHLY PER CAPITA CURRENT INCOME, PER DECILE
OF INCOME, MEXICO, 2008-2010 (PRICES OF AUGUST 2010)
Source: estimates from CONEVAL based on the MCS-ENIGH 2008 and 2010.
When analyzing the changes to the total monthly per capita current income it can be observed that,
between 2008 and 2010, there was a general drop in the income and this affected the population's
purchasing power. The most important drop was recorded during the first decile with -8.7 percent
compared to 2008, then the eighth with -6.2 percent, the seventh had a reduction of -6.1; while the
last one, the most wealthy, had a decrease of -3.7 percent and the ninth decile of -4.5 percent. This
meant a growth of the gap between the first and the last decile from 2008 to 2010, because while in
2008 the difference was 33.7-fold between one and the other, for 2010 this difference went to 35.6-
fold.
However, the population who had an income below the wellbeing line went from 53.7 million people
in 2008 to 58.5 million in 2010, an increase of 4.8 million. This meant that in 2010, just over half of
the Mexican population was not able to purchase the basic basket. In turn, between 2008 and 2010
people who could not purchase the food basket because their income was extremely limited went
from 18.4 to 21.8 million, an increase of around 3.4 million. Thus, one out of five Mexican people in
2010 was under such situation.

58
Re
po
rt o
f P
ove
rty in
Me
xic
o 2
010
: Th
e C
ou
ntr
y, It
s Sta
tes
an
d Its
Mu
nic
ipa
litie
s •
PO
VER
TY IN
MEX
ICO
2008-2
010
Chiapas was the entity where more people, both, in 2008 and 2010, did not have enough money to
fulfill their needs.6 In 2008, 78.5 percent of the population in Chiapas had an income below the
wellbeing line: for 2010 this percentage increased to 80.9. Likewise, in 2008, 48.2 percent of the
people from Chiapas had an income below the minimum wellbeing line and, in 2010, the percentage
increased up to 50.9.
Besides Chiapas, other 12 entities had, in 2010, incidences of population above the national average
who could not acquire the food basket and 11 entities that could not acquire the food and non-food
basket.
2.5 THE SOCIAL RIGHTS SPACE
In the social rights space, the number and the percentage of people for five out of the six social
deprivations decreased. Between 2008 and 2010, only the access to food increased in the number of
people who endured this deprivation due to the increase of international prices of food, which raised
the price of the basic food basket and also due to the drop of the family income.
Despite the national progress in the reduction of social deprivations, in 2010 almost 85 million people,
this is, three out of four Mexican people had at least one social deprivation and about 30 million, this
is, one out of four Mexican people had three or more social deprivations. This means an important
challenge for the Mexican State in ensuring the exercise of social rights and the improvement of the
living conditions of the population.
Each one of the six social deprivations that the LGDS stipulates must be considered to measure
poverty, are analyzed as follows. For presentation purposes, social deprivations have been organized
in descending order according to the number of people who experienced them.
2.6 ACCESS TO SOCIAL SECURITY
The access to social security is still being the field where more Mexican people have problems by not
having access to this right. Between 2008 and 2010, the number of people without access to social
security went from 71.3 to 68.3 million; however, the percentage is high, as six out of ten people in
the country did not have social security.
The most laggard entities in terms of percentage of population with access to social security in 2010
were Chiapas (82.4), Oaxaca (79.7) and Guerrero (78.4); also, 26 entities had percentages of
population greater than 50 percent with this deprivation. It is important to
6 For more detail on the fields that compose the food and non-food basket, check Annex A of Methodology for the
multidimensional poverty measurement in Mexico available on www.coneval.gob.mx

59
point out that only six entities (Aguascalientes, Baja California Sur, Coahuila, Chihuahua, Nuevo
León and Sonora) had percentages ranging between 34.3 and 49.1, this is, lower than 50 percent.
MAP 2.4 PERCENTAGE OF POPULATION WITH DEPRIVATION
DUE TO ACCESS TO SOCIAL SECURITY PER FEDERAL ENTITY, MEXICO, 2010
Source: estimates from CONEVAL based on the MCS-ENIGH 2010.
The State of Mexico is still the entity with more people without access to social security even when
between 2008 and 2010 its number decreased and went from 10.1 to 8.9 million. The other entities
with more people deprived of social security were Veracruz, the Federal District, Puebla, Jalisco and
Chiapas. The last ones together with the State of Mexico totaled more than thirty million people
without social security.
2.7 ACCESS TO HEALTH SERVICES
The access to health services was the second deprivation most Mexican people had problems with
by not having a public or private institution that guaranteed them medical care. In spite of the
reduction of 9 million people between 2008 and 2010 who did not have access to health services, as
well as the broad registration in the Popular Insurance, in 2010 still 35.8 million people did not have
access to these services; this is, almost one third of the Mexican population.
Ranges
Total
entities

60
Re
po
rt o
f P
ove
rty in
Me
xic
o 2
010
: Th
e C
ou
ntr
y, It
s Sta
tes
an
d Its
Mu
nic
ipa
litie
s •
PO
VER
TY IN
MEX
ICO
2008-2
010
The federal entities with a higher percentage reduction in this deprivation were San Luis Potosi
(42.3), Chihuahua (35.4), Hidalgo (35.3), Michoacán (31.6) and Guerrero (31.4). Sonora was the only
entity where this deprivation increased 3.7 percent.
At state level, the federal entities lagging behind the most were Puebla, Oaxaca, Guerrero and
Michoacán, with incidences close to 40 percent. On the other hand, the entities with a higher
coverage of health services were Colima, Coahuila, Campeche and Chihuahua, where about 80
percent of their population already had access to these services.
Six entities concentrated just over half the total population deprived of access to health services: the
State of Mexico with 5.41 million people was the one with the highest contribution; followed by the
Federal District with 3.14 million; Veracruz with 2.82 million; Jalisco with 2.59 million; Puebla with
2.42 million, and Chiapas with 1.76 million people.
MAP 2.5 PERCENTAGE OF POPULATION WITH DEPRIVATION
DUE TO ACCESS TO HEALTH SERVICES PER FEDERAL ENTITY, MEXICO, 2010
Source: estimates from CONEVAL based on the MCS-ENIGH 2010.
Ranges
Total entities

61
2.8 ACCESS TO FOOD
The percentage of people with deprivation due to lack of access to food went from 21.7 percent in
2008 (23.8 million) to 24.9 percent in 2010 (28.0 million) an increase of 4.2 million people. This
means that a quarter of the Mexican population had deprivation due to lack of access to food in 2010.
In 26 entities, the number of people who between 2008 and 2010 had problems regarding the access
to food increased, and only six entities had a reduction (Guanajuato, Michoacán, Oaxaca, Morelos,
Durango and Tabasco).
The federal entities with the greatest percentage increases in the deprivation due to lack of access to
food were Baja California Sur (68.1), Campeche (53.7), State of Mexico (49.2), Quintana Roo (47.2)
and Nuevo León (45.9).
Between 2008 and 2010, the entities with the highest increases in the number of people with
deprivation in food were the State of Mexico with almost 1.7 million people; Jalisco with 345 thousand
people; Guerrero with 300 thousand people; Nuevo León with 248 thousand people, and Chiapas
with 244 thousand more people.
MAP 2.6 PERCENTAGE OF POPULATION WITH DEPRIVATION DUE TO ACCESS TO FOOD PER FEDERAL ENTITY,
MEXICO, 2010
Source: estimates from CONEVAL based on the MCS-ENIGH 2010.
Ranges
Total entities

62
Re
po
rt o
f P
ove
rty in
Me
xic
o 2
010
: Th
e C
ou
ntr
y, It
s Sta
tes
an
d Its
Mu
nic
ipa
litie
s •
PO
VER
TY IN
MEX
ICO
2008-2
010
Six entities had incidences above 30 percent in this deprivation: Guerrero (42.6), Tabasco (33.3),
State of Mexico (31.6), Campeche (31.1 percent), Chiapas (30.3 percent) and San Luis Potosí (30.1).
Twenty entities had incidences between 20 and 30 percent and only six states had incidences below
20 percent (Colima, Chihuahua, Baja California, Nuevo León, Federal District and Tamaulipas).
The entities that concentrated the greatest number of people who experienced restrictions in the
access to food in 2010 were the State of Mexico (4.8 million), Veracruz (two million), Jalisco (1.6
million), Puebla (1.6 million) and Chiapas (1.5 million).
2.9 EDUCATIONAL GAP
The deprivation due to educational gap takes the fourth place, according to the percentage and
number of people who experience this condition in the country. Between 2008 and 2010 this
percentage decreased and went from 21.9 to 20.6 percent. This meant a reduction of about 820
thousand people, after having 24 million people with this deprivation in 2008, in 2010 it decreased to
23.2 million. The foregoing means that in 2010 a fifth of the population in the country still had an
educational gap.
The entities that had a reduction in the number of people with educational gap between 2008 and
2010 were 23; among these, the following stood out: Veracruz with almost 140 thousand people; the
Federal District, 94 thousand; Guanajuato, 80 thousand; Chiapas, 75 thousand; and Tamaulipas, 74
thousand people.
On the other hand, in nine federal entities the educational gap grew during these two years. The
three entities with the greatest increase are pointed out as follows: in the State of Mexico it increased
in 45 thousand people; in Campeche, 16 thousand; and in Hidalgo, 14 thousand more people.
The entities with greater percentages of population with educational gap in 2010 were located in the
south part of the country, Chiapas stood out with 35 percent; Oaxaca and Michoacán had 30 percent
each one; Guerrero, 28.3 percent; Veracruz, 26.1 percent; and Puebla 25 percent. On the opposite
side was the Federal District, as the entity with the lowest percentage of population with educational
gap, with 9.5 percent.

63
MAP 2.7 PERCENTAGE OF POPULATION WITH DEPRIVATION DUE TO EDUCATIONAL GAP PER FEDERAL ENTITY,
MEXICO, 2010
Source: estimates from CONEVAL based on the MCS-ENIGH 2010.
2.10 BASIC SERVICES IN THE DWELLING7
Deprivation in access to basic services in the dwelling was placed as the fifth social deprivation most
endured by the Mexican people between 2008 and 2010. At national level, this deprivation went from
19.2 to 16.5 percent, equivalent to a sixth part of the Mexican population (18.5 million people) not
having in 2010 the minimum necessary conditions in their households due to the lack of basic
services.
The federal entities that had a greater decrease in this deprivation were Nuevo León (66.4 percent),
Chihuahua (44 percent) and Puebla (29.8 percent), while the entities with the greater increments
were Tamaulipas (30.9 percent), Tabasco (17 percent) and Sonora (16 percent).
Despite the reduction in the incidence of this deprivation among the Mexican population between
2008 and 2010, there are still important gaps in several federal entities.
7 In order to compare this social deprivation between 2008 and 2010, this indicator was built without the variable of
cooking fuel because in 2008 the MCS-ENIGH did not include it. In the other chapters of this report, the data with
cooking fuel are used; therefore the figures vary from those compared here.
Ranges
Total
entities

64
Re
po
rt o
f P
ove
rty in
Me
xic
o 2
010
: Th
e C
ou
ntr
y, It
s Sta
tes
an
d Its
Mu
nic
ipa
litie
s •
PO
VER
TY IN
MEX
ICO
2008-2
010
MAP 2.8 PERCENTAGE OF POPULATION DEPRIVED IN
ACCESS TO BASIC SERVICES IN THE DWELLING PER FEDERAL ENTITY, MEXICO, 2010
Source: estimates from CONEVAL based on the MCS-ENIGH 2010.
For example, in 2010, Oaxaca and Guerrero had percentages above 40 percent of their population
with this deprivation; Chiapas had a third part of its population under this condition and Veracruz
almost 30 percent. On the other hand, eleven entities had percentages below ten percent of their
population without access to basic services in the dwelling.
Entities with more people without access to basic services in the dwelling in 2010 were Veracruz and
the State of Mexico with more than two million; Chiapas, Oaxaca, Guerrero and Puebla with more
than one million. While entities with less than one hundred thousand people with this deprivation
were Colima, Aguascalientes, Baja California Sur, Quintana Roo and Tlaxcala.
2.11 QUALITY AND SPACES OF THE DWELLING
In relation to deprivation in quality and spaces of the dwelling, there was a reduction at national level,
between 2008 and 2010, of little more than two million people, going from 19.4 million (17.7 percent)
to 17.1 million people (15.2 percent).
Ranges
Total entities

65
The federal entities with the highest percentage decrease in this deprivation were Chihuahua (43.1),
Sinaloa (41.1) and Zacatecas (38.8), while those that had the greatest increases were Baja California
(27.2), Tabasco (24.8) and the Federal District (19.7).
MAP 2.9 PERCENTAGE OF POPULATION WITH DEPRIVATION IN THE QUALITY AND SPACES OF THE DWELLING
PER FEDERAL ENTITY, MEXICO, 2010
Source: estimates from CONEVAL based on the MCS-ENIGH 2010.
While it is true that 24 entities had, in 2010, incidences under 20 percent in this deprivation, there
were also five entities (Quintana Roo, Tabasco, Campeche, Michoacán and Veracruz) which had
between 21.6 and 24.5 percent of their population with this deprivation. Besides, three entities:
Chiapas (33.3 percent), Oaxaca (34.1 percent) and Guerrero (40.6 percent) were at the top of the list
of entities with most precarious and overcrowded dwellings.
From the 17.1 million people in the country with this social deprivation in 2010, just over the half were
concentrated in six entities: the State of Mexico (1.9 million), Veracruz (1.8 million), Chiapas (1.6
million), Guerrero (1.3 million), Oaxaca (1.3 million) and Puebla (1.1 million).
Ranges
Total entities


3. Measurement of Poverty at Municipal Level
68
Re
po
rt o
f P
ove
rty in
Me
xic
o 2
010
: Th
e C
ou
ntr
y, It
s Sta
tes
an
d Its
Mu
nic
ipa
litie
s •
MEA
SU
REM
EN
T O
F P
OV
ER
TY A
T M
UN
ICIP
AL
LEV
EL
Measurement of Poverty at Municipal Level
This chapter presents the estimates of poverty at municipal level in Mexico, which consider besides
the income, other indicators related to education, health, social security, dwelling and food. In this
way, the country has disaggregated information on the conditions of poverty at municipal level. The
analysis of socio-economic conditions of the people, in each municipality of the country, will allow a
follow-up of the social deprivation and income dynamic. Thus, the estimates included in this report
will help the evaluation of the performance of social programs, their coverage and impact in the living
conditions of the population.
With this information it is possible to spatially identify the municipalities where the highest levels of
poverty are concentrated, as well as the vulnerable population due to social deprivations or due to
income. In this way, the public policy may be implemented in a most suitable way by giving priority to
the efforts in matter of expense according to the diagnosis of each municipality.
Due to the fact that the information from MCS-ENIGH is representative only at state level and not at
municipal level, and to the fact that the Sample of the General Census of Population and Housing
2010 only allows the calculation of four out of the six social deprivations and one part from income, it
was necessary to estimate both, the income and the access to food and the social security using
statistical techniques known as estimates in small areas or synthetic estimates.8
3.1 POVERTY AT MUNICIPAL LEVEL
The municipalities that in 2010 had the greatest percentage of population in poverty were the
following: San Juan Tepeuxila, Oaxaca (97.4); Aldama, Chiapas (97.3); San Juan Cancuc, Chiapas
(97.3); Mixtla de Altamirano, Veracruz (97.0); Chalchihuitán, Chiapas (96.8); Santiago Textitlán,
Oaxaca (96.6); San Andres Duraznal, Chiapas (96.5); Santiago el Pinar, Chiapas (96.5); Sitala,
Chiapas (96.5), and San Simón Zahuatlán, Oaxaca (96.4). From these, in eight of them 70 percent or
more of their population speaks an indigenous language, that is, they are indigenous municipalities.
Moreover, in San Juan Tepeuxila the
8 The Technical note explaining the procedure carried out by CONEVAL to calculate poverty at municipal level is
available at the electronic address: www.coneval.gob.mx

69
percentage of indigenous-language speakers is 57 percent, and in Santiago Textitlán 14 percent of
the population.
On the other hand, the municipalities with the lowest percentage of population in poverty were the
following: Benito Juárez, Federal District (8.7); San Nicolás de los Garza, Nuevo León (12.8);
Guadalupe, Nuevo León (13.2); Miguel Hidalgo, Federal District (14.3); San Pedro Garza García,
Nuevo León (15.2); San Sebastián Tutla, Oaxaca (16.7); San Pablo Etla, Oaxaca (17.3); Apodaca,
Nuevo León (18.0); Corregidora, Querétaro (18.7) and San Juan de Sabinas, Coahuila (19.0). In
these, less than 10 percent of their population is indigenous.
The 257 indigenous municipalities had poverty percentages above 55 percent. Six recorded
percentages of poverty between 55 and 70 percent, and in the remaining 251 municipalities, it was
above 70 percent.
MAP 3.1 PERCENTAGE OF POPULATION LIVING IN POVERTY
BY MUNICIPALITY, MEXICO, 2010
Source: estimates from CONEVAL based on the MCS-ENIGH 2010 and the sample of the General Census of Population and Housing 2010
Map 3.1 shows that from 2,456 municipalities in the country, only in 444, this is, 18 percent, the
incidence of population in poverty was lower than 50 percent. In the other 2,012 municipalities, the
remaining 82 percent, more than 50 percent of the population was poor.
Ranges
Total municipalities

70
Re
po
rt o
f P
ove
rty in
Me
xic
o 2
010
: Th
e C
ou
ntr
y, It
s Sta
tes
an
d Its
Mu
nic
ipa
litie
s •
MEA
SU
REM
EN
T O
F P
OV
ER
TY A
T M
UN
ICIP
AL
LEV
EL
CH
AR
T 3
.1
DIS
TRIB
UTI
ON
OF M
UN
ICIP
ALI
TIES A
CC
OR
DIN
G T
O T
HE P
ER
CEN
TAG
E O
F P
EO
PLE
LIV
ING
IN
PO
VER
TY IN
MEX
ICO
, 2010
No
n m
ult
idim
en
sio
nal
po
or
an
d n
on
vu
lnera
ble
po
pu
lati
on
Pe
rce
nta
ge
78.0
12.4
6.4
2.6
0.5
0.1
0.0
0.0
0.0
0.0
100
.0
Sourc
e:
estim
ate
s f
rom
CO
NE
VA
L b
ased o
n M
CS
-EN
IGH
20
10 a
nd th
e s
am
ple
of
the G
ene
ral C
ensus o
f P
op
ula
tion a
nd
Ho
usin
g 2
01
0.
Note
s:
Th
e m
unic
ipalit
ies o
f P
esqu
eri
a in N
ue
vo L
eo
n (
19
041
) and
Gu
err
ero
in T
am
aulipas (
280
14
), a
s r
ep
ort
ed b
y I
NE
GI,
do n
ot h
ave
a s
uffic
ien
t sa
mple
siz
e t
o g
ene
rate
accu
rate
estim
ate
s.
Accord
ing
to t
he p
ove
rty m
easu
rem
ent
meth
odolo
gy p
ublis
hed in th
e O
ffic
ial Journ
al of th
e F
ed
era
tion
on J
une 1
6, 2
010 t
he r
epo
rte
d e
stim
ate
s o
f p
ove
rty c
onsid
er
the v
ari
able
of
co
okin
g f
uel an
d if th
e
hou
seh
old
ha
s c
him
ney in th
e k
itche
n in th
e d
efinitio
n o
f th
e I
ndic
ato
r of
depri
vatio
n d
ue t
o a
cce
ss t
o b
asic
serv
ices in
the
dw
elli
ng
.
Th
e p
ove
rty e
stim
ate
s 2
01
0 u
se t
he
expan
sio
n facto
rs a
dju
ste
d to t
he S
ocio
econo
mic
Con
ditio
ns M
odule
of
EN
IGH
2010
.
Som
e fig
ure
s m
ay v
ary
due t
o r
ou
ndin
g.
Mu
nic
ipa
liti
es
1,9
16
305
158
63
12
2
0
0
0
0
2,4
56
Vu
lnera
ble
du
e t
o i
nc
om
e
Pe
rce
nta
ge
95.9
4.1
0.0
0.0
0.0
0.0
0.0
0.0
0.0
0.0
100
.0
Mu
nic
ipa
liti
es
2,3
54
101
1
0
0
0
0
0
0
0
2,4
56
Vu
lnera
ble
du
e t
o s
ocia
l
de
pri
vati
on
Pe
rce
nta
ge
11.1
30.5
32.8
20.6
4.0
1.0
0.1
0.0
0.0
0.0
100
.0
Mu
nic
ipa
liti
es
272
748
806
505
99
24
2
0
0
0
2,4
56
Mo
dera
te p
ov
ert
y
Pe
rce
nta
ge
0.0
1.4
10.5
22.8
43.6
19.5
2.0
0.2
0.0
0.0
100
.0
Mu
nic
ipa
liti
e
s
1
34
257
560
1,0
71
479
50
4
0
0
2,4
56
Extr
em
e p
ov
ert
y
Pe
rce
nta
ge
28.2
22.7
14.8
12.4
8.1
7.7
4.6
1.3
0.2
0.0
100
.0
Mu
nic
ipa
liti
es
692
558
363
305
200
190
113
31
4
0
2,4
56
Po
vert
y
Pe
rce
nta
ge
0.0
0.6
3.3
6.3
7.9
14.2
18.0
19.7
21.1
9.0
100
.0
Mu
nic
ipa
liti
e
s
1
15
81
154
193
349
441
483
518
221
2,4
56
Ind
icato
r
ran
ge
Mu
nic
ipa
liti
e
s
[ 0-
10
]
[ 10
- 2
0 ]
[ 20
- 3
0 ]
[ 30
- 4
0 ]
[ 40
- 5
0 ]
[ 50
- 6
0 ]
[ 60
- 7
0 ]
[ 70
- 8
0 ]
[ 80
- 9
0 ]
[ 90
- 1
00
]
To
tal

71
MAP 3.2 MUNICIPALITIES WITH FIFTY PERCENT OR MORE OF
THEIR POPULATION LIVING IN POVERTY, MEXICO, 2010
Source: estimates from CONEVAL based on MCS-ENIGH 2010 and the sample of the General Census of Population and Housing 2010
The distribution of poverty in the country is very heterogeneous and at municipal level it is even more.
However, there are 2,012 municipalities that had an incidence of poverty greater than 50 percent of
their population. Within this group, the following stand out ranked according to the state: Chiapas with
117 municipalities, Guerrero with 80, Puebla with 213, Oaxaca with 537, Tabasco with 16, Durango
with 36, Michoacán with 104 and San Luis Potosí with 53. In nine out of 10 municipalities from these
entities, the population had poverty levels above 50 percent.
Moreover, in the municipalities were 70 percent or more of their population is indigenous-language
speaking —257— the incidence of poverty of the population was above 50 percent.
Total
municipalities

72
Re
po
rt o
f P
ove
rty in
Me
xic
o 2
010
: Th
e C
ou
ntr
y, It
s Sta
tes
an
d Its
Mu
nic
ipa
litie
s •
MEA
SU
REM
EN
T O
F P
OV
ER
TY A
T M
UN
ICIP
AL
LEV
EL
MAP 3.3 PERCENTAGE OF POPULATION LIVING IN POVERTY
IN RURAL AND URBAN MUNICIPALITIES, MEXICO, 2010
(a) Rural municipalities
(b) Urban municipalities
Source: estimates from CONEVAL based on MCS-ENIGH 2010 and the sample of the General Census of Population and Housing 2010.
Ranges
Total
municipalities
Ranges
Total
municipalities

73
By analyzing the rural and urban municipalities, the following situation is identified: from the 1,389
rural municipalities, 91.8 percent, that is, 1,275 municipalities had half their population or more living
in poverty in 2010. Meanwhile, from the 1,067 urban municipalities, in 69.1 percent —737
municipalities—, 50 percent or more of their population was poor in 2010.
MAP 3.4 PERCENTAGE OF POPULATION LIVING IN EXTREME
POVERTY BY MUNICIPALITY, MEXICO, 2010
Source: estimates from CONEVAL based on MCS-ENIGH 2010 and the sample of the General Census of Population and Housing 2010.
Map 3.4 shows the territorial distribution of extreme poverty in the municipalities of the country. The
greatest incidences were located in the states of Oaxaca, Guerrero, Chiapas, Veracruz, Puebla and
San Luis Potosí.
The municipalities with the greatest percentage of population living in extreme poverty were the
following: Cochoapa el Grande, Guerrero (82.6); San Simón Zahuatlán, Oaxaca (80.8); San Juan
Cancuc, Chiapas (80.5); Mixtla de Altamirano, Veracruz (80.3); Chalchihuitán, Chiapas (79.8);
Coicoyán de las Flores, Oaxaca (79.7); Aldama, Chiapas (78.8); Santos Reyes Yucuna, Oaxaca
(77.4); San Juan Petlapa, Oaxaca (77.2), and Metlatónoc, Guerrero (77.0). The 70 percent or more
of the population in these municipalities speaks an indigenous language; therefore, they may be
classified as indigenous.
Ranges
Total
municipalities

74
Re
po
rt o
f P
ove
rty in
Me
xic
o 2
010
: Th
e C
ou
ntr
y, It
s Sta
tes
an
d Its
Mu
nic
ipa
litie
s •
MEA
SU
REM
EN
T O
F P
OV
ER
TY A
T M
UN
ICIP
AL
LEV
EL
In the following municipalities or delegations, the percentage of population living in extreme poverty
was lower than one percent: Benito Juárez, Federal District; San Pedro Garza García, Nuevo León;
San Nicolás de los Garza, Nuevo León; Miguel Hidalgo, Federal District; Huepac, Sonora; Villa de
Álvarez, Colima; Guadalupe, Nuevo León; Allende, Coahuila; Corregidora, Querétaro, and
Azcapotzalco, Federal District.
MAP 3.5 MUNICIPALITIES WITH 25 PERCENT OR MORE OF
THEIR POPULATION LIVING IN EXTREME POVERTY, MEXICO 2010
Source: estimates from CONEVAL based on MCS-ENIGH 2010 and the sample of the General Census of Population and Housing 2010.
Map 3.5 identifies the municipalities (1,037) that had 25 percent or above of the population living in
extreme poverty, which is equal to 42.3 percent of the national total; the remaining 1,419 had
percentages below 25 percent. It should be noted that the following states: Aguascalientes, Baja
California, Baja California Sur, Coahuila, Colima, the Federal District and Nuevo León did not have
any municipality with levels above 25 percent of the population living in extreme poverty.
Total
municipalities
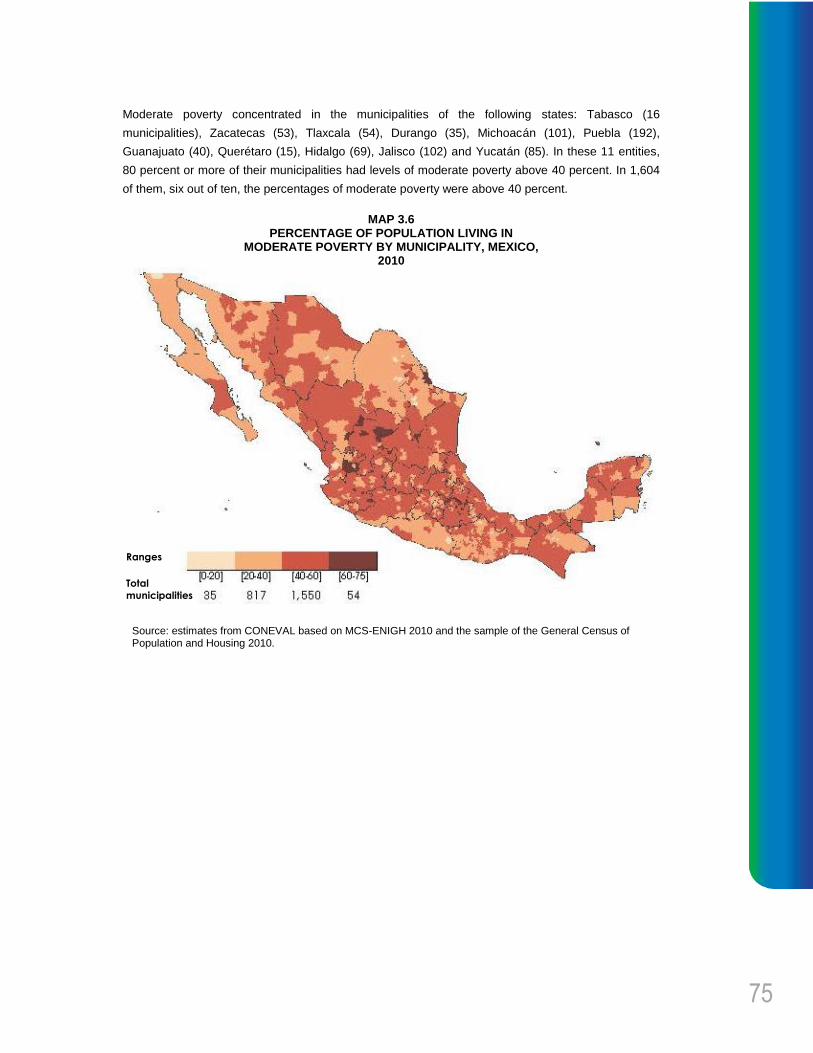
75
Moderate poverty concentrated in the municipalities of the following states: Tabasco (16
municipalities), Zacatecas (53), Tlaxcala (54), Durango (35), Michoacán (101), Puebla (192),
Guanajuato (40), Querétaro (15), Hidalgo (69), Jalisco (102) and Yucatán (85). In these 11 entities,
80 percent or more of their municipalities had levels of moderate poverty above 40 percent. In 1,604
of them, six out of ten, the percentages of moderate poverty were above 40 percent.
MAP 3.6 PERCENTAGE OF POPULATION LIVING IN
MODERATE POVERTY BY MUNICIPALITY, MEXICO, 2010
Source: estimates from CONEVAL based on MCS-ENIGH 2010 and the sample of the General Census of Population and Housing 2010.
Ranges
Total
municipalities

76
Re
po
rt o
f P
ove
rty in
Me
xic
o 2
010
: Th
e C
ou
ntr
y, It
s Sta
tes
an
d Its
Mu
nic
ipa
litie
s •
MEA
SU
REM
EN
T O
F P
OV
ER
TY A
T M
UN
ICIP
AL
LEV
EL
MAP 3.7 PERCENTAGE OF VULNERABLE POPULATION BY
MUNICIPALITY, MEXICO, 2010
(a) Vulnerable population due to social deprivations
(b) Vulnerable population due to income
Source: estimates from CONEVAL based on MCS-ENIGH 2010 and the sample of the General Census of Population and Housing 2010.
Ranges
Total
municipalities
Ranges
Total
municipalities

77
In three out of four municipalities, the population had percentages below 30 percent of vulnerability
due to social deprivation, that is, 1,826 municipalities had this level of incidence. In the remaining
630, the percentage of people in social vulnerability fluctuated between 30 to a slightly over 60
percent (map 3.7a).
On the other hand, map 3.7b shows the levels of vulnerability due to income in each municipality;
thus, in 2010, about 95.9 percent of the municipalities in the country (2,354) had percentages of
population with vulnerability due to income below 10 percent and the remaining 4.1 percent, this is
102 of them, between 10 and 21 percent.
3.2 DISTRIBUTION OF POPULATION LIVING IN POVERTY
AT MUNICIPAL LEVEL
The municipalities with the greatest number of people living in poverty were the following: Puebla,
Puebla (732,154); Iztapalapa, Federal District (727,128); Ecatepec de Morelos, Mexico (723,559);
León, Guanajuato (600,145); Tijuana, Baja California (525,769); Juárez, Chihuahua (494,726);
Nezahualcóyotl, Mexico (462,405); Toluca, Mexico (407,691); Acapulco de Juárez, Guerrero
(405,499), and Gustavo A. Madero, Federal District (356,328).

78
Re
po
rt o
f P
ove
rty in
Me
xic
o 2
010
: Th
e C
ou
ntr
y, It
s Sta
tes
an
d Its
Mu
nic
ipa
litie
s •
MEA
SU
REM
EN
T O
F P
OV
ER
TY A
T M
UN
ICIP
AL
LEV
EL
Half the population living in poverty concentrated in 190 municipalities in the country. From them, 166
had a limited presence of indigenous population; 16 have moderate presence of the latter, and the
remaining eight have primarily indigenous population.
MAP 3.8 MUNICIPALITIES WHERE OVER HALF THE PEOPLE
LIVING IN POVERTY ARE CONCENTRATED, MEXICO, 2010
Source: estimates from CONEVAL based on MCS-ENIGH 2010 and the sample of the General Census of Population and Housing 2010.
In 2010, 88 municipalities and delegations had more than 100 thousand people living in poverty, who
were located in the states of Mexico (16); Federal District (10); Jalisco (6); Chiapas, Tabasco and
Veracruz (5); Guanajuato, Sinaloa and Tamaulipas (4); Baja California (3); Chihuahua, Coahuila,
Durango, Guerrero, Michoacán, Nuevo León, Puebla, Quintana Roo, San Luis Potosí and Sonora
(2), and Aguascalientes, Morelos, Oaxaca, Querétaro, Yucatán and Zacatecas with one; together
they totaled 18.6 million people living in poverty conditions.
The municipalities that had the highest number of people living in extreme poverty were the following:
Ocosingo, Chiapas (144,088); Puebla, Puebla (110,012); Acapulco de Juárez, Guerrero (107,048);
Ecatepec de Morelos, State of Mexico (107,023); Chilón, Chiapas (87,519); Las Margaritas, Chiapas
(75,339); Toluca, State of Mexico (66,938); León, Guanajuato (66,687); Iztapalapa, Federal District
(63,017), and Juárez, Chihuahua (62,822).
Total
municipalities

79
3.3 DEPTH AND INTENSITY OF POVERTY AT MUNICIPAL
LEVEL
The measurements of depth and intensity of poverty in the municipalities of the country show in detail
the level of deprivation existing inside the federal entities. The 15 ones with the greatest number of
average deprivations (between 4.3 and 4.9) of the population living in poverty are indigenous people
(where more than 70 percent of the population speaks an indigenous language). Furthermore, there
are other 53 that also ranged between 4.0 and 4.9 average deprivations of the population living in
poverty (map 3.9). These municipalities are located in six states: Oaxaca with 37, Guerrero with ten,
Chiapas with three, and the states of Chihuahua, Puebla and Veracruz with one. It should be noted
that the municipality with the highest number of average deprivations was Cochoapa el Grande,
Guerrero, for both, poor population (4.86) and extremely poor population (4.90).
On the other hand, the municipalities with the greatest number of average deprivations of poor
population —between one and two— were 197. States of Chihuahua, Jalisco, Sonora, Coahuila and
Nuevo León had the greatest number of these municipalities (map 3.9).
MAP 3.9 NUMBER OF AVERAGE DEPRIVATIONS OF THE
POPULATION LIVING IN POVERTY BY MUNICIPALITY, MEXICO, 2010
Source: estimates from CONEVAL based on MCS-ENIGH 2010 and the sample of the General Census of
Population and Housing 2010.
Average
deprivations
Total
municipalities

80
Re
po
rt o
f P
ove
rty in
Me
xic
o 2
010
: Th
e C
ou
ntr
y, It
s Sta
tes
an
d Its
Mu
nic
ipa
litie
s •
MEA
SU
REM
EN
T O
F P
OV
ER
TY A
T M
UN
ICIP
AL
LEV
EL
The population living in extreme poverty is, by definition, the one with three or more social
deprivations and whose income is below the minimum wellbeing line. There could be hypothetically
one municipality whose population could have up to six average deprivations; however, the results of
the estimates in 2010, as shown in map 3.10, indicate that the maximum number of average
deprivations of the population living in extreme poverty was lower than five (Cochoapa el Grande,
Guerrero 4.90). The municipalities with the greatest number of average deprivations are ranked
fourth in the map —between 4.5 and 5 deprivations— and these are the following: Cochoapa el
Grande, Guerrero (4.90); San Juan Petlapa, Oaxaca (4.64); San Miguel Tilquiápam, Oaxaca (4.63);
Metlatónoc, Guerrero (4.58); Tlacoapa, Guerrero (4.58); Guachochi, Chihuahua (4.57); Santiago
Juxtlahuaca, Oaxaca (4.55); San Martín Itunyoso, Oaxaca (4.52), and Tehuipango, Veracruz (4.52).
From the total municipalities (1,767) with population living in extreme poverty, 72 percent have about
3.5 to 4 average deprivations.
MAP 3.10 NUMBER OF AVERAGE DEPRIVATIONS OF THE POPULATION LIVING IN EXTREME POVERTY BY
MUNICIPALITY, MEXICO, 2010
Source: estimates from CONEVAL based on MCS-ENIGH 2010 and the sample of the General Census of Population and Housing 2010.
Average deprivations
Total municipalities

81
The intensity of poverty by municipality is shown in map 3.11. The municipalities with the greatest
intensity are the following: Cochoapa el Grande, Guerrero (0.78); San Juan Petlapa, Oaxaca (0.72);
San Miguel Tilquiápam, Oaxaca (0.71); Metlatónoc, Guerrero (0.71), and Tehuipango, Veracruz
(0.70).
MAP 3.11 INTENSITY OF POVERTY AT MUNICIPAL LEVEL,
MEXICO, 2010
Source: estimates from CONEVAL based on MCS-ENIGH 2010 and the sample of the General Census of
Population and Housing 2010.
On the other hand, the delegations and municipalities with the lowest intensity of poverty were:
Benito Juárez, Federal District (0.03); San Nicolás de los Garza, Nuevo León (0.04); San Pedro
Garza García, Nuevo León (0.04); Miguel Hidalgo, Federal District (0.04), and Guadalupe, Nuevo
León (0.04).
Ranges
Total
municipalities


4. The Social Rights Space

84
Re
po
rt o
f P
ove
rty in
Me
xic
o 2
010
: Th
e C
ou
ntr
y, It
s Sta
tes
an
d Its
Mu
nic
ipa
litie
s. •
TH
E S
OC
IAL
RIG
HTS
SPA
CE
The Social Rights Space
The official methodology to measure poverty in Mexico is based on the LGDS, which states that in
order to build the social rights space and its six dimensions, the educational gap, access to health
services, access to social security, quality and spaces of the dwelling, access to basic services in the
dwelling, and access to food must be considered.
The results for each one of the six dimensions and the variables used for each indicator are
presented below. The information shows the incidence and the number of people with deprivation in
each dimension, taking into account the whole country and then disaggregating the information per
federal entity and per municipality. The analysis of each dimension allows observing the
heterogeneity in terms of social deprivations is present in the country.

85
CH
AR
T 4
.1
DIS
TRIB
UTI
ON
OF M
UN
ICIP
ALI
TIES A
CC
OR
DIN
G T
O T
HE P
ER
CEN
TAG
E O
F P
EO
PLE
PER
TY
PE O
F S
OC
IAL
DEPR
IVA
TIO
N,
MEX
ICO
, 2010
Dep
rivati
on
du
e t
o a
cce
ss
to f
oo
d
Pe
rce
nta
ge
1.4
18.4
42.4
24.3
9.3
3.1
0.9
0.1
0.0
0.0
100
.0
Sourc
e:
estim
ate
s f
rom
CO
NE
VA
L b
ased o
n M
CS
-EN
IGH
20
10 a
nd th
e s
am
ple
of
the G
ene
ral C
ensus o
f P
op
ula
tion a
nd
Ho
usin
g 2
01
0.
Note
s:
Th
e m
unic
ipalit
ies o
f P
esqu
eri
a in N
ue
vo L
eo
n (
19
041
) and
Gu
err
ero
in T
am
aulip
as (
280
14
), a
s r
ep
ort
ed b
y I
NE
GI,
do n
ot h
ave
a s
uffic
ien
t sa
mple
siz
e t
o g
ene
rate
accu
rate
estim
ate
s.
Accord
ing
to t
he p
ove
rty m
easu
rem
ent
meth
odolo
gy p
ublis
hed in th
e O
ffic
ial Journ
al of th
e F
ed
era
tion
on J
une 1
6, 2
010 t
he r
epo
rte
d e
stim
ate
s o
f p
ove
rty c
onsid
er
the v
ari
able
of
co
okin
g f
uel an
d if th
e
hou
seh
old
ha
s c
him
ney in th
e k
itche
n in th
e d
efinitio
n o
f th
e I
ndic
ato
r of
depri
vatio
n d
ue t
o a
cce
ss t
o b
asic
serv
ices in
the
dw
elli
ng
.
Th
e p
ove
rty e
stim
ate
s 2
01
0 u
se t
he
expan
sio
n facto
rs a
dju
ste
d to t
he S
ocio
econo
mic
Con
ditio
ns M
odule
of
EN
IGH
2010
.
Som
e fig
ure
s m
ay v
ary
due t
o r
ou
ndin
g.
Mu
nic
ipa
liti
es
35
453
1,0
42
597
229
75
22
3
0
0
2,4
56
Dep
rivati
on
du
e t
o a
cce
ss
to b
asic
serv
ice
s i
n t
he
dw
ellin
g
Pe
rce
nta
ge
11
.9
13.2
9.7
8.9
8.4
9.0
8.5
9.0
9.0
12.4
100
.0
Mu
nic
ipa
liti
es
29
1
323
239
218
206
222
209
222
221
305
2,4
56
Dep
rivati
on
du
e t
o q
uali
ty
an
d s
pa
ce
s o
f th
e
dw
ellin
g
Pe
rce
nta
ge
20
.2
25.3
19.6
15.6
10.1
5.1
2.9
0.9
0.2
0.0
100
.0
Mu
nic
ipa
liti
es
49
5
621
482
384
249
125
72
23
5
0
2,4
56
Dep
rivati
on
du
e t
o a
cce
ss
to s
ocia
l s
ec
uri
ty
Pe
rce
nta
ge
0.0
0.0
0.5
1.4
4.6
7.5
10.1
19.1
28.3
28.4
100
.0
Mu
nic
ipa
liti
es
0
0
13
35
114
185
247
470
695
697
2,4
56
Dep
rivati
on
du
e t
o a
cce
ss
to h
ealt
h s
erv
ice
s
Pe
rce
nta
ge
3.3
16.9
25.9
22.4
14.3
7.9
3.5
2.8
1.8
1.2
100
.0
Mu
nic
ipa
liti
es
82
416
637
549
352
193
85
69
43
30
2,4
56
Ed
ucati
on
al g
ap
Pe
rce
nta
ge
1.0
16.9
32.0
0
30.7
15.8
3.1
0.5
0.0
0.0
0.0
100
.0
Mu
nic
ipa
liti
es
24
416
787
753
389
75
12
0
0
0
2,4
56
Ed
ucati
on
al
ga
p
[ 0 -
10
]
[ 10
- 2
0 ]
[ 20
- 3
0 ]
[ 30
- 4
0 ]
[ 40
- 5
0 ]
[ 50
- 6
0 ]
[ 60
- 7
0 ]
[ 70
- 8
0 ]
[ 80
- 9
0 ]
[ 90
- 1
00
]
To
tal

86
Re
po
rt o
f P
ove
rty in
Me
xic
o 2
010
: Th
e C
ou
ntr
y, It
s Sta
tes
an
d Its
Mu
nic
ipa
litie
s. •
TH
E S
OC
IAL
RIG
HTS
SPA
CE
4.1 EDUCATIONAL GAP
Education in Mexico is a right guaranteed by the Constitution and the laws resulting thereof. Since
the laws in education matter and the enforceability of the different education levels have changed
during the last years, in order to build the indicator for educational gap, different age groups,
according to the applicable law at the moment in which such group of population was in school age,
were considered. For further details on the construction of the dimensions and indicators, consult the
Methodology for the multidimensional poverty measurement in Mexico (www.coneval.gob.mx).
The country as a whole had an incidence of deprivation due to educational gap in 2010 of 20.6
percent, equivalent to 23.23 million people. Chiapas, Michoacán and Oaxaca had the greatest
incidences in this deprivation, with over 30 percent of their population (map 4.1 and chart 4.2). On the
other hand, the federal entities with the lowest incidence where the Federal District, Coahuila, Nuevo
León, and Sonora (chart 4.2).
CHART 4.2
PERCENTAGE AND NUMBER OF PEOPLE WITH DEPRIVATION DUE TO EDUCATIONAL GAP
PER FEDERAL ENTITY, MEXICO, 2010
Federal Entity Percentage Million people
Federal Entity Percentage Million people
Aguascalientes 17.2 0.20 Morelos 19.4 0.35
Baja California 17.1 0.54 Nayarit 20.1 0.22
Baja California Sur 16.9 0.11 Nuevo León 13.1 0.61
Campeche 23.9 0.20 Oaxaca 30.3 1.15
Coahuila 12.1 0.33 Puebla 25.0 1.45
Colima 18.7 0.12 Querétaro 19.5 0.36
Chiapas 35.0 1.69 Quintana Roo 18.2 0.24
Chihuahua 17.5 0.60 San Luis Potosí 22.2 0.57
Federal District 9.5 0.84 Sinaloa 19.2 0.53
Durango 18.6 0.31 Sonora 14.0 0.37
Guanajuato 23.6 1.30 Tabasco 19.9 0.45
Guerrero 28.3 0.96 Tamaulipas 14.5 0.48
Hidalgo 23.4 0.63 Tlaxcala 15.6 0.18
Jalisco 20.2 1.49 Veracruz 26.1 2.00
State of Mexico 18.5 2.81 Yucatán 24.7 0.48
Michoacán 30.4 1.33 Zacatecas 22.8 0.34
Mexican United States 20.6 23.23
Source: estimates from CONEVAL based on the MCS-ENIGH 2010.

87
In relation to total population, the federal entities that concentrated the greatest number of people
with educational gap were the State of Mexico (2.81 million), Veracruz (2.0 million), Chiapas (1.69
million) and Jalisco (1.49 million). On the opposite side, the states with less population with
deprivation in education were Baja California Sur (0.11 million), Colima (0.12 million), Tlaxcala (0.18
million) and Campeche (0.20 million).
MAP 4.1 PERCENTAGE OF POPULATION WITH DEPRIVATION DUE TO EDUCATIONAL GAP PER FEDERAL ENTITY,
MEXICO, 2010
Source: estimates from CONEVAL based on the MCS-ENIGH 2010.
Map 4.1 shows the spatial distribution of the educational gap per federal entity. Five states from the
south part of the country stand out with the greatest percentages of population with educational gap
(Chiapas, Oaxaca, Guerrero, Michoacán and Veracruz). On the other hand, entities with the lowest
educational gap in 2010 were the Federal District, Coahuila, Nuevo León, Sonora and Tamaulipas.
Map 4.2 shows the spatial distribution of this deprivation per municipality, and the heterogeneity that
exists at national level and inside each federal entity can be observed in greater detail. 87 out of the
2,456 municipalities, this is, 3.5 percent, had over 50 percent of their population with educational gap
and were located in the following states: Oaxaca with 68; Chiapas with nine; Guerrero and Puebla
with three; Veracruz with two; and Michoacán and Yucatán with one.
Ranges
Total entities
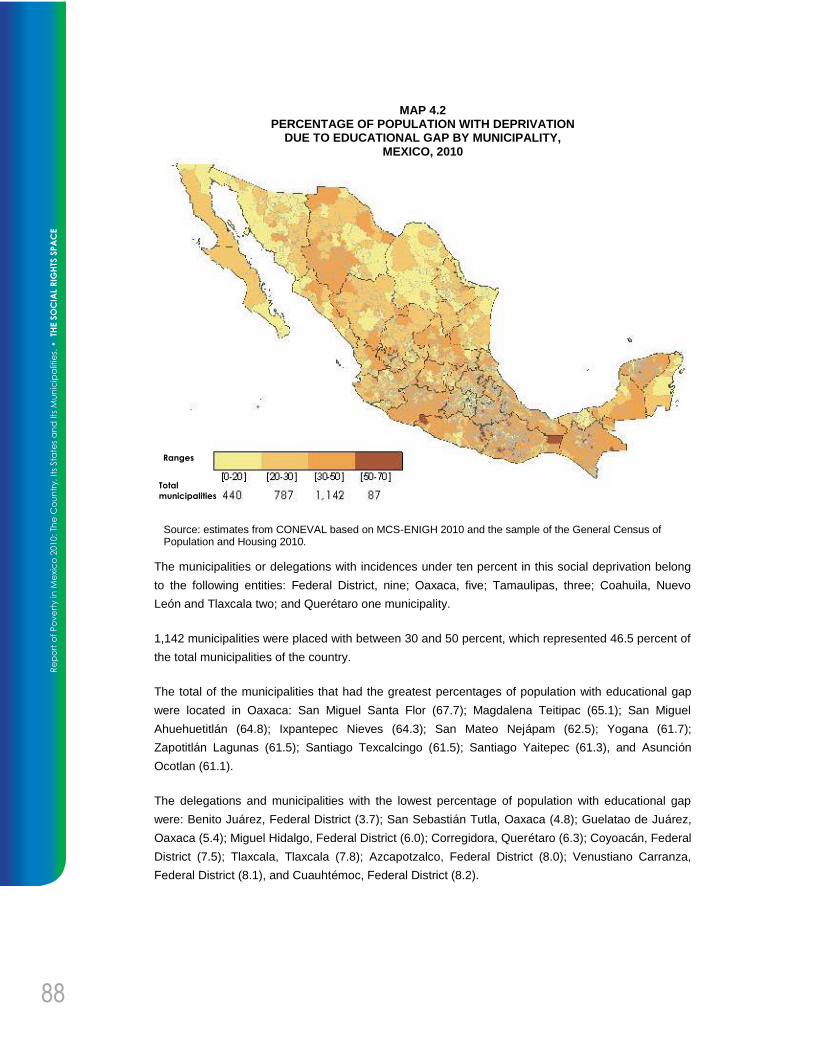
88
Re
po
rt o
f P
ove
rty in
Me
xic
o 2
010
: Th
e C
ou
ntr
y, It
s Sta
tes
an
d Its
Mu
nic
ipa
litie
s. •
TH
E S
OC
IAL
RIG
HTS
SPA
CE
MAP 4.2 PERCENTAGE OF POPULATION WITH DEPRIVATION
DUE TO EDUCATIONAL GAP BY MUNICIPALITY, MEXICO, 2010
Source: estimates from CONEVAL based on MCS-ENIGH 2010 and the sample of the General Census of Population and Housing 2010.
The municipalities or delegations with incidences under ten percent in this social deprivation belong
to the following entities: Federal District, nine; Oaxaca, five; Tamaulipas, three; Coahuila, Nuevo
León and Tlaxcala two; and Querétaro one municipality.
1,142 municipalities were placed with between 30 and 50 percent, which represented 46.5 percent of
the total municipalities of the country.
The total of the municipalities that had the greatest percentages of population with educational gap
were located in Oaxaca: San Miguel Santa Flor (67.7); Magdalena Teitipac (65.1); San Miguel
Ahuehuetitlán (64.8); Ixpantepec Nieves (64.3); San Mateo Nejápam (62.5); Yogana (61.7);
Zapotitlán Lagunas (61.5); Santiago Texcalcingo (61.5); Santiago Yaitepec (61.3), and Asunción
Ocotlan (61.1).
The delegations and municipalities with the lowest percentage of population with educational gap
were: Benito Juárez, Federal District (3.7); San Sebastián Tutla, Oaxaca (4.8); Guelatao de Juárez,
Oaxaca (5.4); Miguel Hidalgo, Federal District (6.0); Corregidora, Querétaro (6.3); Coyoacán, Federal
District (7.5); Tlaxcala, Tlaxcala (7.8); Azcapotzalco, Federal District (8.0); Venustiano Carranza,
Federal District (8.1), and Cuauhtémoc, Federal District (8.2).
Ranges
Total
municipalities
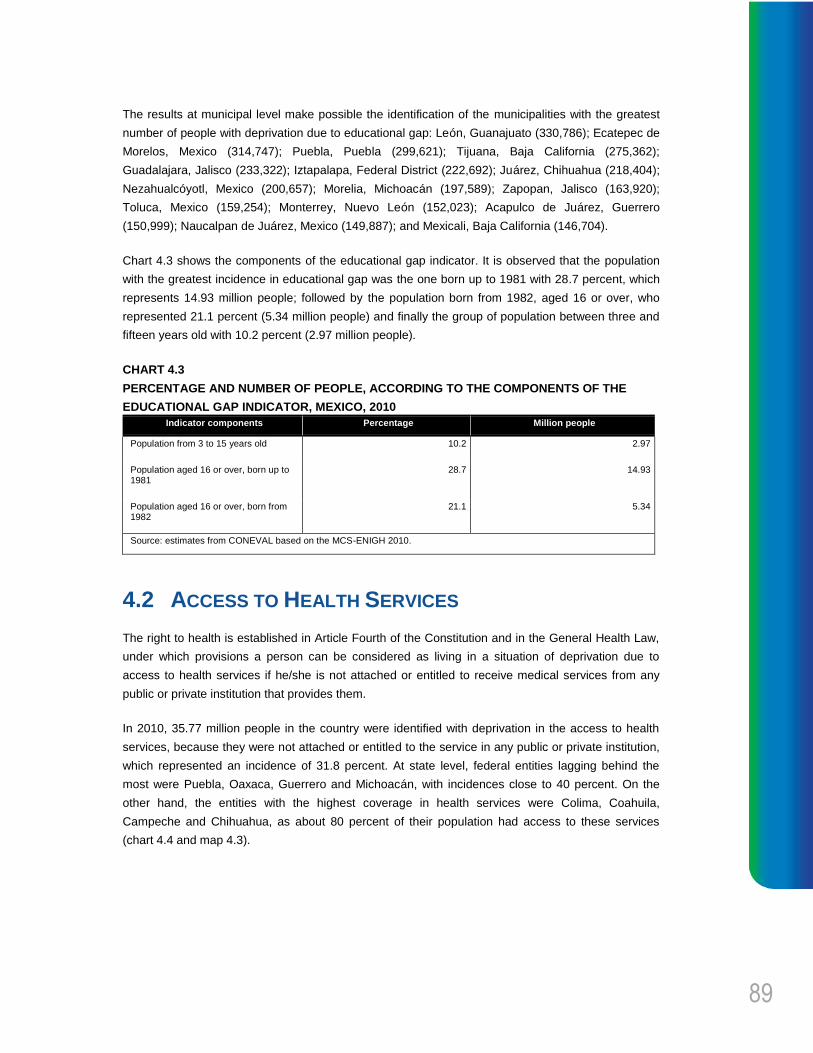
89
The results at municipal level make possible the identification of the municipalities with the greatest
number of people with deprivation due to educational gap: León, Guanajuato (330,786); Ecatepec de
Morelos, Mexico (314,747); Puebla, Puebla (299,621); Tijuana, Baja California (275,362);
Guadalajara, Jalisco (233,322); Iztapalapa, Federal District (222,692); Juárez, Chihuahua (218,404);
Nezahualcóyotl, Mexico (200,657); Morelia, Michoacán (197,589); Zapopan, Jalisco (163,920);
Toluca, Mexico (159,254); Monterrey, Nuevo León (152,023); Acapulco de Juárez, Guerrero
(150,999); Naucalpan de Juárez, Mexico (149,887); and Mexicali, Baja California (146,704).
Chart 4.3 shows the components of the educational gap indicator. It is observed that the population
with the greatest incidence in educational gap was the one born up to 1981 with 28.7 percent, which
represents 14.93 million people; followed by the population born from 1982, aged 16 or over, who
represented 21.1 percent (5.34 million people) and finally the group of population between three and
fifteen years old with 10.2 percent (2.97 million people).
CHART 4.3
PERCENTAGE AND NUMBER OF PEOPLE, ACCORDING TO THE COMPONENTS OF THE
EDUCATIONAL GAP INDICATOR, MEXICO, 2010
Indicator components Percentage Million people
Population from 3 to 15 years old 10.2 2.97
Population aged 16 or over, born up to 1981
28.7 14.93
Population aged 16 or over, born from 1982
21.1 5.34
Source: estimates from CONEVAL based on the MCS-ENIGH 2010.
4.2 ACCESS TO HEALTH SERVICES
The right to health is established in Article Fourth of the Constitution and in the General Health Law,
under which provisions a person can be considered as living in a situation of deprivation due to
access to health services if he/she is not attached or entitled to receive medical services from any
public or private institution that provides them.
In 2010, 35.77 million people in the country were identified with deprivation in the access to health
services, because they were not attached or entitled to the service in any public or private institution,
which represented an incidence of 31.8 percent. At state level, federal entities lagging behind the
most were Puebla, Oaxaca, Guerrero and Michoacán, with incidences close to 40 percent. On the
other hand, the entities with the highest coverage in health services were Colima, Coahuila,
Campeche and Chihuahua, as about 80 percent of their population had access to these services
(chart 4.4 and map 4.3).

90
Re
po
rt o
f P
ove
rty in
Me
xic
o 2
010
: Th
e C
ou
ntr
y, It
s Sta
tes
an
d Its
Mu
nic
ipa
litie
s. •
TH
E S
OC
IAL
RIG
HTS
SPA
CE
CHART 4.4
PERCENTAGE AND NUMBER OF PEOPLE WITH DEPRIVATION DUE TO ACCESS TO HEALTH
SERVICES PER FEDERAL ENTITY, MEXICO, 2010
Federal Entity Percentage Million people Federal Entity Percentage Million people
Aguascalientes 22.0 0.26 Morelos 31.7 0.57
Baja California 35.2 1.12 Nayarit 24.1 0.26
Baja California Sur 22.6 0.15 Nuevo León 22.4 1.04
Campeche 20.8 0.17 Oaxaca 39.9 1.52
Coahuila 20.1 0.55 Puebla 41.8 2.42
Colima 17.8 0.12 Querétaro 24.4 0.45
Chiapas 36.5 1.76 Quintana Roo 27.8 0.37
Chihuahua 20.9 0.71 San Luis Potosí 21.0 0.54
Federal District 35.7 3.14 Sinaloa 23.1 0.64
Durango 29.1 0.48 Sonora 26.5 0.71
Guanajuato 27.1 1.49 Tabasco 25.6 0.58
Guerrero 39.6 1.34 Tamaulipas 23.1 0.76
Hidalgo 31.7 0.85 Tlaxcala 35.0 0.41
Jalisco 35.2 2.59 Veracruz 36.9 2.82
State of Mexico 35.5 5.41 Yucatán 22.4 0.44
Michoacán 39.4 1.71 Zacatecas 27.0 0.40
Mexican United States 31.8 35.77
Source: estimates from CONEVAL based on the MCS-ENIGH 2010.
Approximately six entities concentrated just over half the total population deprived of access to health
services: the State of Mexico with 5.41 million people was the one with the highest contribution,
followed by the Federal District with 3.14 million, Veracruz with 2.82 million, Jalisco with 2.59 million,
Puebla with 2.42 million and Chiapas with 1.76 million people. The remaining 26 entities contributed
with the other half of people deprived of health.

91
MAP 4.3 PERCENTAGE OF POPULATION WITH DEPRIVATION
DUE TO ACCESS TO HEALTH SERVICES PER FEDERAL ENTITY, MEXICO, 2010
Source: estimates from CONEVAL based on the MCS-ENIGH 2010.
From the 2,456 municipalities, 420, this is, 17.1 percent, had more than 50 percent of their population
without access to health services. The following federal entities concentrated these municipalities.
Oaxaca is ranked first with 194; followed by Puebla with 60; Veracruz 46; Michoacán 29; Guerrero
23; Chiapas 18; Hidalgo nine; Tlaxcala eight; Jalisco, Mexico and Sonora six; Chihuahua four; San
Luis Potosí and Zacatecas three; Durango two, and the Federal District, Morelos and Yucatán one
each (map 4.3).
The municipalities with the highest percentage of their population with deprivation due to access to
health services were the following: San Juan Yatzona, Oaxaca (98.4); Abejones, Oaxaca (98.1); San
Juan Teita, Oaxaca (98.0); Santiago Nundiche, Oaxaca (97.6); San Andrés Yaá, Oaxaca (96.9); San
Bartolomé Yucuañe, Oaxaca (96.8); Santa Ana Yareni, Oaxaca (96.0); San Felipe Tepatlán, Puebla
(95.8); Santa Maria Zoquitlán, Oaxaca (95.6), and Santo Domingo Tlatayápam, Oaxaca (95.5). It
should be noted that all of them, except for one, are located in Oaxaca.
The municipalities with the smallest percentage of population with deprivation due to access to health
services were the following: Santo Domingo Albarradas, Oaxaca (1.4); San Mateo Tlapiltepec,
Oaxaca (2.4); Tecoh, Yucatán (2.6); San Sebastián Nicananduta, Oaxaca (2.8); Bokobá, Yucatán
(4.2); San Francisco Cahuacua, Oaxaca (4.3); Jaumave, Tamaulipas (4.4); Xochihuehuetlán,
Guerrero (4.7); San Mateo Yucutindo, Oaxaca (4.7), and San Antonino Monte Verde, Oaxaca (4.7).
Ranges
Total entities

92
Re
po
rt o
f P
ove
rty in
Me
xic
o 2
010
: Th
e C
ou
ntr
y, It
s Sta
tes
an
d Its
Mu
nic
ipa
litie
s. •
TH
E S
OC
IAL
RIG
HTS
SPA
CE
MAP 4.4 PERCENTAGE OF POPULATION WITH DEPRIVATION
DUE TO ACCESS TO HEALTH SERVICES BY MUNICIPALITY, MEXICO, 2010
Source: estimates from CONEVAL based on MCS-ENIGH 2010 and the sample of the General Census of Population and Housing 2010.
The municipalities with the greatest number of people with deprivation in the access to health
services in 2010 were the following: Iztapalapa, Federal District (804,277); Ecatepec de Morelos,
State of Mexico (713,991); Puebla, Puebla (711,224); Tijuana, Baja California (657,444);
Guadalajara, Jalisco (546,295); Nezahualcóyotl, Mexico (445,934); León, Guanajuato (442,068);
Zapopan, Jalisco (437,656); Morelia, Michoacán (350,124); Gustavo A. Madero, Federal District
(332,779); Juárez, Chihuahua (326,185); Toluca, Mexico (313,846); Naucalpan de Juárez, Mexico
(309,379); Acapulco de Juárez, Guerrero (308,942), and Monterrey, Nuevo León (303,425).
In relation to the disaggregation of the indicator of access to health services, chart 4.5 shows the
percentages and the number of people who did have access to them. Through the Popular
Insurance, 30.5 percent of the population obtained it; by IMSS, 28.8 percent; by insurance institutions
and social services of State's employees, at federal level or in the federal entities around 6.9 percent;
through Pemex, the Defense or the Navy 0.9 percent, and 1.1 percent through other institutions.
Ranges
Total municipalities
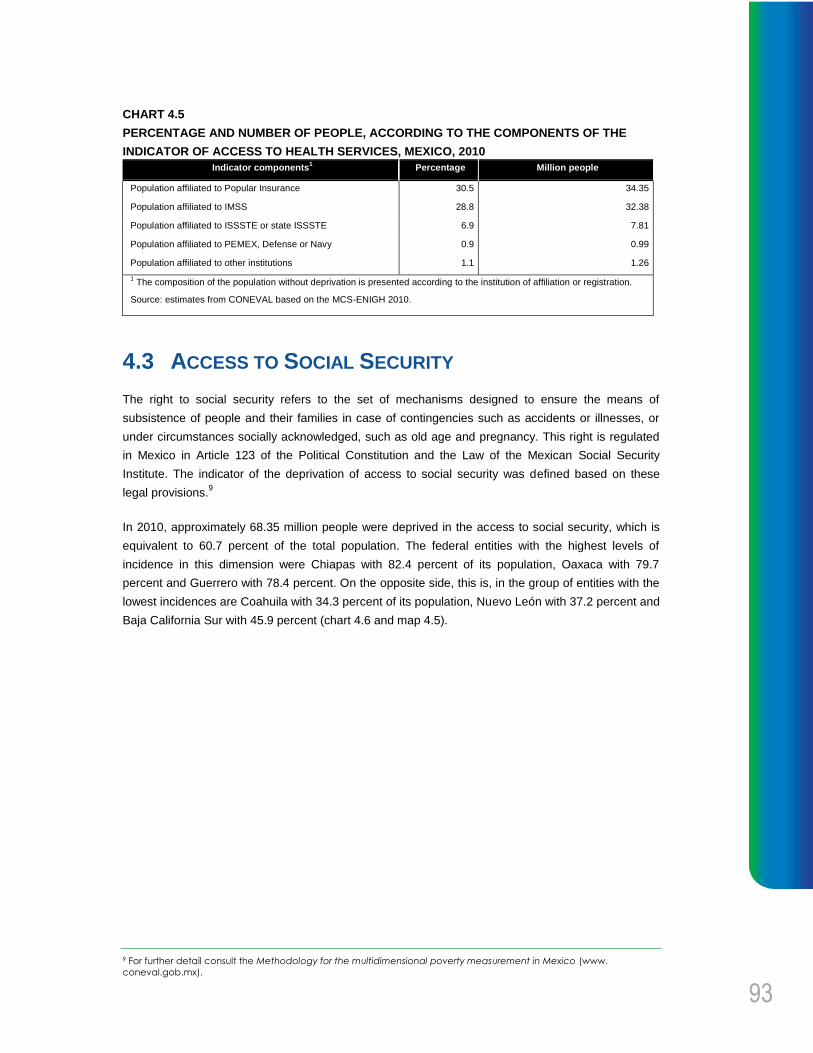
93
CHART 4.5
PERCENTAGE AND NUMBER OF PEOPLE, ACCORDING TO THE COMPONENTS OF THE
INDICATOR OF ACCESS TO HEALTH SERVICES, MEXICO, 2010
Indicator components1 Percentage Million people
Population affiliated to Popular Insurance 30.5 34.35
Population affiliated to IMSS 28.8 32.38
Population affiliated to ISSSTE or state ISSSTE 6.9 7.81
Population affiliated to PEMEX, Defense or Navy 0.9 0.99
Population affiliated to other institutions 1.1 1.26
1 The composition of the population without deprivation is presented according to the institution of affiliation or registration.
Source: estimates from CONEVAL based on the MCS-ENIGH 2010.
4.3 ACCESS TO SOCIAL SECURITY
The right to social security refers to the set of mechanisms designed to ensure the means of
subsistence of people and their families in case of contingencies such as accidents or illnesses, or
under circumstances socially acknowledged, such as old age and pregnancy. This right is regulated
in Mexico in Article 123 of the Political Constitution and the Law of the Mexican Social Security
Institute. The indicator of the deprivation of access to social security was defined based on these
legal provisions.9
In 2010, approximately 68.35 million people were deprived in the access to social security, which is
equivalent to 60.7 percent of the total population. The federal entities with the highest levels of
incidence in this dimension were Chiapas with 82.4 percent of its population, Oaxaca with 79.7
percent and Guerrero with 78.4 percent. On the opposite side, this is, in the group of entities with the
lowest incidences are Coahuila with 34.3 percent of its population, Nuevo León with 37.2 percent and
Baja California Sur with 45.9 percent (chart 4.6 and map 4.5).
9 For further detail consult the Methodology for the multidimensional poverty measurement in Mexico (www.
coneval.gob.mx).

94
Re
po
rt o
f P
ove
rty in
Me
xic
o 2
010
: Th
e C
ou
ntr
y, It
s Sta
tes
an
d Its
Mu
nic
ipa
litie
s. •
TH
E S
OC
IAL
RIG
HTS
SPA
CE
CHART 4.6
PERCENTAGE AND NUMBER OF PEOPLE WITH DEPRIVATION DUE TO ACCESS TO SOCIAL
SECURITY PER FEDERAL ENTITY, MEXICO, 2010
Federal Entity Percentage Million people Federal Entity Percentage Million people
Aguascalientes 49.1 0.58 Morelos 64.9 1.15
Baja California 54.9 1.74 Nayarit 61.5 0.67
Baja California Sur 45.9 0.30 Nuevo León 37.2 1.74
Campeche 59.6 0.49 Oaxaca 79.7 3.03
Coahuila 34.3 0.95 Puebla 71.9 4.16
Colima 55.6 0.36 Querétaro 60.7 1.11
Chiapas 82.4 3.97 Quintana Roo 53.6 0.72
Chihuahua 48.5 1.66 San Luis Potosí 57.2 1.48
Federal District 52.4 4.61 Sinaloa 53.4 1.48
Durango 58.2 0.95 Sonora 46.5 1.24
Guanajuato 65.7 3.62 Tabasco 73.3 1.65
Guerrero 78.4 2.66 Tamaulipas 51.2 1.68
Hidalgo 71.9 1.92 Tlaxcala 71.1 0.84
Jalisco 54.8 4.04 Veracruz 69.9 5.34
State of Mexico 58.9 8.97 Yucatán 56.8 1.11
Michoacán 72.0 3.14 Zacatecas 66.4 0.99
Mexican United States 60.7 68.35
Source: estimates from CONEVAL based on the MCS-ENIGH 2010.
The lack of access to security was the social deprivation with the greatest incidence in the country
(60.7 percent). Map 4.5 shows that the entities form the south part of the country had incidences
greater than the national average and only 6 entities (Aguascalientes, Baja California Sur, Coahuila,
Chihuahua, Nuevo León and Sonora) were below 50 percent.
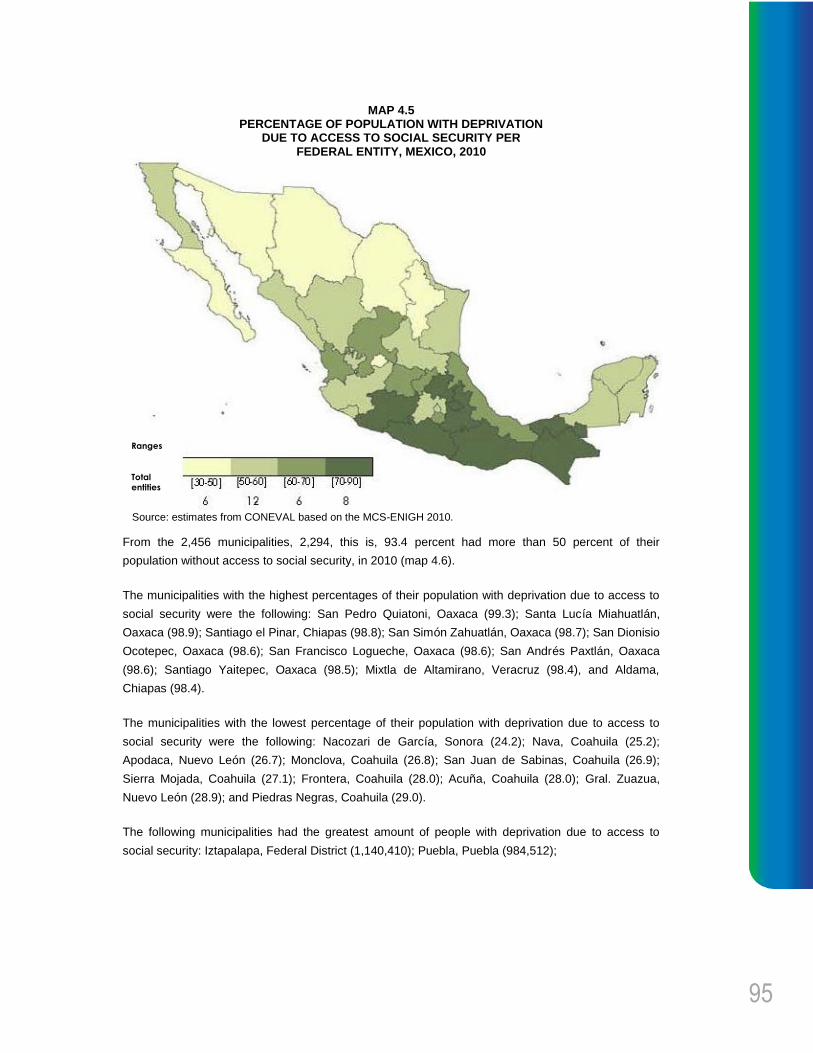
95
MAP 4.5 PERCENTAGE OF POPULATION WITH DEPRIVATION
DUE TO ACCESS TO SOCIAL SECURITY PER FEDERAL ENTITY, MEXICO, 2010
Source: estimates from CONEVAL based on the MCS-ENIGH 2010.
From the 2,456 municipalities, 2,294, this is, 93.4 percent had more than 50 percent of their
population without access to social security, in 2010 (map 4.6).
The municipalities with the highest percentages of their population with deprivation due to access to
social security were the following: San Pedro Quiatoni, Oaxaca (99.3); Santa Lucía Miahuatlán,
Oaxaca (98.9); Santiago el Pinar, Chiapas (98.8); San Simón Zahuatlán, Oaxaca (98.7); San Dionisio
Ocotepec, Oaxaca (98.6); San Francisco Logueche, Oaxaca (98.6); San Andrés Paxtlán, Oaxaca
(98.6); Santiago Yaitepec, Oaxaca (98.5); Mixtla de Altamirano, Veracruz (98.4), and Aldama,
Chiapas (98.4).
The municipalities with the lowest percentage of their population with deprivation due to access to
social security were the following: Nacozari de García, Sonora (24.2); Nava, Coahuila (25.2);
Apodaca, Nuevo León (26.7); Monclova, Coahuila (26.8); San Juan de Sabinas, Coahuila (26.9);
Sierra Mojada, Coahuila (27.1); Frontera, Coahuila (28.0); Acuña, Coahuila (28.0); Gral. Zuazua,
Nuevo León (28.9); and Piedras Negras, Coahuila (29.0).
The following municipalities had the greatest amount of people with deprivation due to access to
social security: Iztapalapa, Federal District (1,140,410); Puebla, Puebla (984,512);
Ranges
Total entities

96
Re
po
rt o
f P
ove
rty in
Me
xic
o 2
010
: Th
e C
ou
ntr
y, It
s Sta
tes
an
d Its
Mu
nic
ipa
litie
s. •
TH
E S
OC
IAL
RIG
HTS
SPA
CE
Ecatepec de Morelos, Mexico (980,002); Tijuana, Baja California (895,956); León, Guanajuato
(843,651); Nezahualcóyotl, Mexico (677,070); Guadalajara, Jalisco (671,754); Zapopan, Jalisco
(616,805); Gustavo A. Madero, Federal District (578,313); Juárez, Chihuahua (573,183); Toluca,
Mexico (533,915); Morelia, Michoacán (519,658); Monterrey, Nuevo León (493,227); Acapulco de
Juárez, Guerrero (490,549), and Mexicali, Baja California (480,330).
MAP 4.6 PERCENTAGE OF PEOPLE WITH DEPRIVATION DUE
TO ACCESS TO SOCIAL SECURITY BY MUNICIPALITY, MEXICO, 2010
Source: estimates from CONEVAL based on MCS-ENIGH 2010 and the sample of the General Census of Population and Housing 2010.
Employed population without access to social security was the 62.2 percent, equivalent to 27.8
million people. Non-economically active population deprived of social security was 52.7 percent and,
finally, the elderly population deprived in this field had an incidence of 28.8 percent (chart 4.7).
Ranges
Total
municipalities
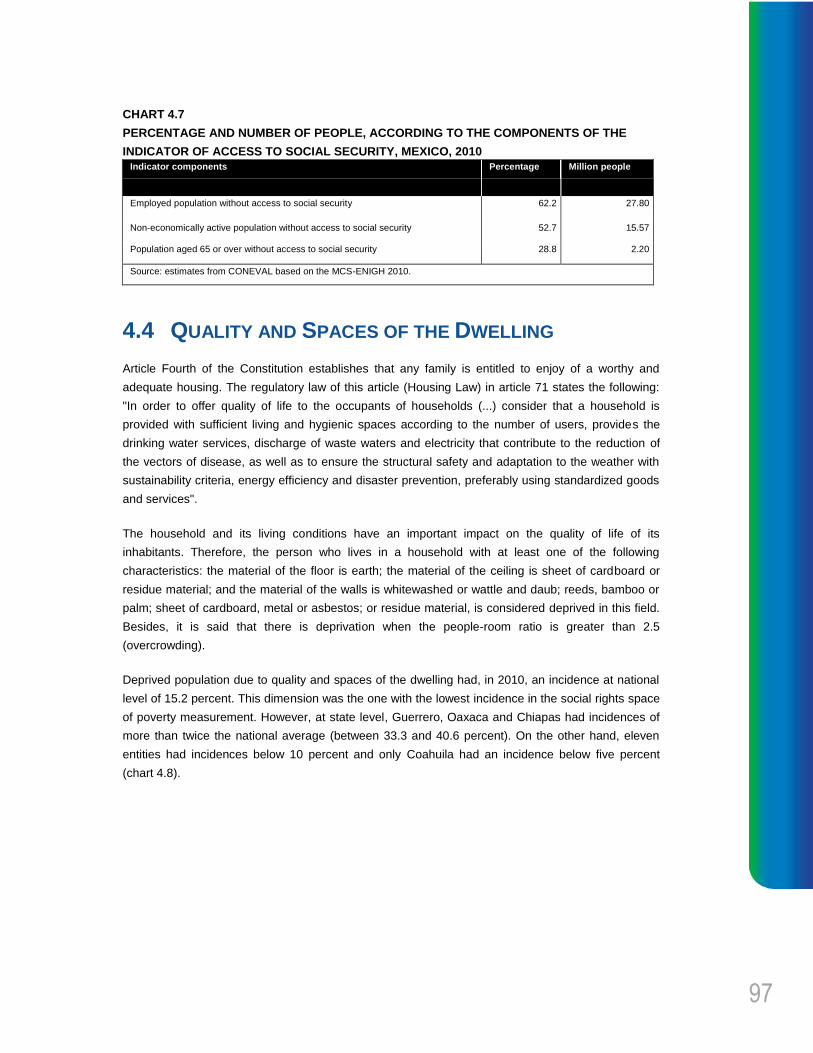
97
CHART 4.7
PERCENTAGE AND NUMBER OF PEOPLE, ACCORDING TO THE COMPONENTS OF THE
INDICATOR OF ACCESS TO SOCIAL SECURITY, MEXICO, 2010
Indicator components Percentage Million people
Employed population without access to social security 62.2 27.80
Non-economically active population without access to social security 52.7 15.57
Population aged 65 or over without access to social security 28.8 2.20
Source: estimates from CONEVAL based on the MCS-ENIGH 2010.
4.4 QUALITY AND SPACES OF THE DWELLING
Article Fourth of the Constitution establishes that any family is entitled to enjoy of a worthy and
adequate housing. The regulatory law of this article (Housing Law) in article 71 states the following:
"In order to offer quality of life to the occupants of households (...) consider that a household is
provided with sufficient living and hygienic spaces according to the number of users, provides the
drinking water services, discharge of waste waters and electricity that contribute to the reduction of
the vectors of disease, as well as to ensure the structural safety and adaptation to the weather with
sustainability criteria, energy efficiency and disaster prevention, preferably using standardized goods
and services".
The household and its living conditions have an important impact on the quality of life of its
inhabitants. Therefore, the person who lives in a household with at least one of the following
characteristics: the material of the floor is earth; the material of the ceiling is sheet of cardboard or
residue material; and the material of the walls is whitewashed or wattle and daub; reeds, bamboo or
palm; sheet of cardboard, metal or asbestos; or residue material, is considered deprived in this field.
Besides, it is said that there is deprivation when the people-room ratio is greater than 2.5
(overcrowding).
Deprived population due to quality and spaces of the dwelling had, in 2010, an incidence at national
level of 15.2 percent. This dimension was the one with the lowest incidence in the social rights space
of poverty measurement. However, at state level, Guerrero, Oaxaca and Chiapas had incidences of
more than twice the national average (between 33.3 and 40.6 percent). On the other hand, eleven
entities had incidences below 10 percent and only Coahuila had an incidence below five percent
(chart 4.8).
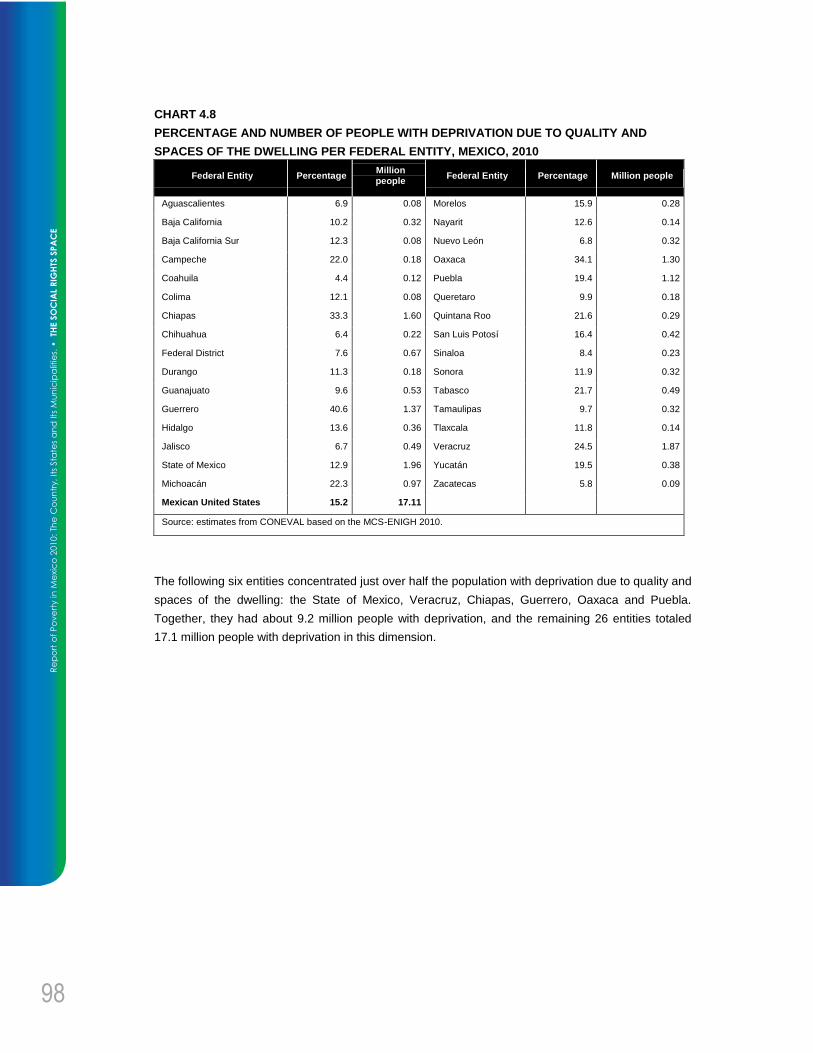
98
Re
po
rt o
f P
ove
rty in
Me
xic
o 2
010
: Th
e C
ou
ntr
y, It
s Sta
tes
an
d Its
Mu
nic
ipa
litie
s. •
TH
E S
OC
IAL
RIG
HTS
SPA
CE
CHART 4.8
PERCENTAGE AND NUMBER OF PEOPLE WITH DEPRIVATION DUE TO QUALITY AND
SPACES OF THE DWELLING PER FEDERAL ENTITY, MEXICO, 2010
Federal Entity Percentage Million people
Federal Entity Percentage Million people
Aguascalientes 6.9 0.08 Morelos 15.9 0.28
Baja California 10.2 0.32 Nayarit 12.6 0.14
Baja California Sur 12.3 0.08 Nuevo León 6.8 0.32
Campeche 22.0 0.18 Oaxaca 34.1 1.30
Coahuila 4.4 0.12 Puebla 19.4 1.12
Colima 12.1 0.08 Queretaro 9.9 0.18
Chiapas 33.3 1.60 Quintana Roo 21.6 0.29
Chihuahua 6.4 0.22 San Luis Potosí 16.4 0.42
Federal District 7.6 0.67 Sinaloa 8.4 0.23
Durango 11.3 0.18 Sonora 11.9 0.32
Guanajuato 9.6 0.53 Tabasco 21.7 0.49
Guerrero 40.6 1.37 Tamaulipas 9.7 0.32
Hidalgo 13.6 0.36 Tlaxcala 11.8 0.14
Jalisco 6.7 0.49 Veracruz 24.5 1.87
State of Mexico 12.9 1.96 Yucatán 19.5 0.38
Michoacán 22.3 0.97 Zacatecas 5.8 0.09
Mexican United States 15.2 17.11
Source: estimates from CONEVAL based on the MCS-ENIGH 2010.
The following six entities concentrated just over half the population with deprivation due to quality and
spaces of the dwelling: the State of Mexico, Veracruz, Chiapas, Guerrero, Oaxaca and Puebla.
Together, they had about 9.2 million people with deprivation, and the remaining 26 entities totaled
17.1 million people with deprivation in this dimension.

99
MAP 4.7 PERCENTAGE OF POPULATION WITH DEPRIVATION DUE TO QUALITY AND SPACES OF THE DWELLING
PER FEDERAL ENTITY, MEXICO, 2010
Source: estimates from CONEVAL based on the MCS-ENIGH 2010.
Map 4.7 shows that the entities form the south part of the country (Guerrero, Oaxaca and Chiapas)
had the highest incidences —between 30 and 41 percent— in deprivation due to quality and spaces
of the dwelling. In the southeast part of the country and in Michoacán, incidences with a value ranged
between 20 and 30 percent (Veracruz, Tabasco, Campeche and Quintana Roo) were registered.
When analyzing each one of the components comprising the indicator of deprivation due to quality
and spaces of the dwelling, it can be observed that from the 17.1 million people who experienced it,
3.9 percent had a household which construction materials were deficient regarding the floor, walls
and ceiling. Besides, they lived in overcrowded conditions, in other words, they experienced
deprivation in all the concepts measured by the indicator. Overcrowding afflicted 69.4 percent of the
individuals who had deprivation due to quality and spaces of the dwelling; from this percentage, 51.5
percent had only this deprivation, while 8.1 percent, besides living in overcrowded conditions, lived in
dwellings with earth floor and 5.9 percent in a place where the quality of the ceiling and walls was
weak (graph 4.1).
Ranges
Total entities

100
Re
po
rt o
f P
ove
rty in
Me
xic
o 2
010
: Th
e C
ou
ntr
y, It
s Sta
tes
an
d Its
Mu
nic
ipa
litie
s. •
TH
E S
OC
IAL
RIG
HTS
SPA
CE
GRAPH 4.1 COMPONENTS OF THE INDICATOR FOR THE POPULATION WITH
DEPRIVATION DUE TO QUALITY AND SPACES OF THE DWELLING, MEXICO, 2010
Source: estimates from CONEVAL based on the MCS-ENIGH 2010.
Disaggregation at municipal level enables the observation of the spatial distribution of this deprivation
in the country. The following entities concentrated the greatest number of municipalities with over 50
percent of the population with this deprivation: Oaxaca had 139; Guerrero 29; Veracruz and Chiapas
17; San Luis Potosí eight; Michoacán six; Puebla four; Nayarit and Yucatán two, and Durango one
(map 4.8).
From the 2456 municipalities, 225 municipalities, this is, 9.2 percent, had over 50 percent of the
population with deprivation due to quality and spaces of the dwelling.
The municipalities with the greatest percentage of the population with deprivation due to quality and
spaces of the dwelling were the following: San Miguel Piedras, Oaxaca (88.1); San Pedro Mártir,
Oaxaca (85.8); San Mateo del Mar, Oaxaca (84.5); San José Tenango, Oaxaca (81.8); Tanlajas, San
Luis Potosí (81.3); San Bartolomé Ayautla, Oaxaca (79.9); Cochoapa el Grande, Guerrero (79.1);
San Miguel Coatlán, Oaxaca (77.5); San Martín Itunyoso, Oaxaca (77.4), and Chalchihuitán, Chiapas
(77.2).
Ceilings and/or walls
11.1%
Overcrowding 14.1%
Floors

101
The municipalities with the lowest percentage of population with deprivation due to quality and
spaces of the dwelling were the following: Santa Magdalena Jicotlán, Oaxaca without population with
this deprivation; Atil, Sonora (0.8); Santa Isabel, Chihuahua (1.1); San Julián, Jalisco (1.2); Valle de
Guadalupe, Jalisco (1.5); Cusihuiriachi, Chihuahua (1.7); Ignacio Zaragoza, Chihuahua (1.7);
Corregidora, Querétaro (1.8); Mier, Tamaulipas (1.8), and Abasolo, Coahuila (1.8).
MAP 4.8 PERCENTAGE OF POPULATION WITH DEPRIVATION DUE TO QUALITY AND SPACES OF THE DWELLING
BY MUNICIPALITY, MEXICO, 2010
Source: estimates from CONEVAL based on MCS-ENIGH 2010 and the sample of the General Census of Population and Housing 2010.
It should be highlighted that 1,116 municipalities, this is, 45.4 percent of the national total had
incidences in this deprivation lower than 20 percent and that these municipalities are located mainly
in the north part of the country.
The following municipalities had the greatest amount of people with deprivation due to quality and
spaces of the dwelling: Acapulco de Juárez, Guerrero (254,046); Puebla, Puebla (202,960);
Ecatepec de Morelos, Mexico (172,080); Tijuana, Baja California (166,737); Iztapalapa, Federal
District (156,058); Nezahualcóyotl, Mexico (121,803); Benito Juárez, Quintana Roo (117,393);
Chimalhuacán, Mexico (114,577); León, Guanajuato (110,489); Centro, Tabasco (108,471);
Naucalpan de Juárez, Mexico (101,573); Morelia, Michoacán (100,213); Veracruz, Veracruz
(88,663); Ixtapaluca, Mexico (86,330), and Ocosingo, Chiapas (86,134).
Ranges
Total municipalities

102
Re
po
rt o
f P
ove
rty in
Me
xic
o 2
010
: Th
e C
ou
ntr
y, It
s Sta
tes
an
d Its
Mu
nic
ipa
litie
s. •
TH
E S
OC
IAL
RIG
HTS
SPA
CE
Chart 4.9 shows each one of the components that comprise the indicator of the quality and spaces of
the dwelling. At national level, it is noted that from all the components that comprise this dimension,
the population living in overcrowding conditions was the component with the highest percentage
(10.6 percent) and it affected 11.88 million people; then there was the population in dwelling with floor
material below the threshold (4.8 percent), ceiling material (2.5 percent) and wall material (1.9
percent).
CHART 4.9
PERCENTAGE AND NUMBER OF PEOPLE, ACCORDING TO THE COMPONENTS OF THE
INDICATOR OF QUALITY AND SPACE OF THE DWELLING, MEXICO, 2010
Indicator components Percentage Million people
Population in housing with floor material under threshold 4.8 5.40
Population in housing with ceiling material under threshold 2.5 2.81
Population in housing with wall material under threshold 1.9 2.13
Population in overcrowded housing 10.6 11.88
Source: estimates from CONEVAL based on the MCS-ENIGH 2010.
4.5 ACCESS TO BASIC SERVICES IN THE DWELLING
Though having a house built with solid materials that suitably protect its inhabitants is an essential
element, the provision of basic services has a strong impact on the sanitary conditions and the
activities that the household members may develop inside and outside it.
People who do not have access to, at least, one of the following services in their household are
considered deprived in this dimension: electricity, sewage service, potable water and, if the cooking
fuel is wood or charcoal and the stove used for cooking does not have a chimney.
At national level, 23 percent of the people did not have access to basic services in the dwelling; this
is equal to one out of four individuals in the country having deprivation in this dimension. The federal
entities with the greatest incidence were Chiapas, Oaxaca and Guerrero, where more than half the
population experienced this deprivation. On the other end, there were eight states, the incidences of
which were below 10 percent; Nuevo León stood out with 3.2 percent, the Federal District 3.9 percent
and Aguascalientes with 4.5 percent (chart 4.10 and map 4.9).

103
CHART 4.10
PERCENTAGE AND NUMBER OF PEOPLE WITH DEPRIVATION DUE TO ACCESS TO BASIC
SERVICES IN THE DWELLING PER FEDERAL ENTITY, MEXICO, 2010
Federal Entity Percentage Million people Federal Entity Percentage Million people
Aguascalientes 4.5 0.05 Morelos 21.3 0.38
Baja California 7.1 0.22 Nayarit 16.1 0.18
Baja California Sur 9.3 0.06 Nuevo León 3.2 0.15
Campeche 36.2 0.30 Oaxaca 58.7 2.24
Coahuila 6.0 0.16 Puebla 36.8 2.13
Colima 9.5 0.06 Querétaro 17.7 0.32
Chiapas 60.7 2.93 Quintana Roo 14.8 0.20
Chihuahua 7.0 0.24 San Luis Potosí 32.4 0.84
Federal District 3.9 0.34 Sinaloa 15.4 0.43
Durango 17.6 0.29 Sonora 15.6 0.42
Guanajuato 18.0 0.99 Tabasco 39.0 0.88
Guerrero 56.1 1.90 Tamaulipas 17.4 0.57
Hidalgo 31.7 0.85 Tlaxcala 13.8 0.16
Jalisco 12.4 0.91 Veracruz 40.4 3.09
State of Mexico 15.8 2.41 Yucatán 37.4 0.73
Michoacán 26.8 1.17 Zacatecas 17.8 0.27
Mexican United States 23.0 25.86
Source: estimates from CONEVAL based on the MCS-ENIGH 2010.

104
Re
po
rt o
f P
ove
rty in
Me
xic
o 2
010
: Th
e C
ou
ntr
y, It
s Sta
tes
an
d Its
Mu
nic
ipa
litie
s. •
TH
E S
OC
IAL
RIG
HTS
SPA
CE
MAP 4.9 PERCENTAGE OF POPULATION WITH DEPRIVATION
DUE TO ACCESS TO BASIC SERVICES IN THE DWELLING PER FEDERAL ENTITY, MEXICO, 2010
Source: estimates from CONEVAL based on the MCS-ENIGH 2010.
Five federal entities (Veracruz, Chiapas, Mexico, Oaxaca and Puebla) concentrated almost half the
population deprived basic services in the dwelling with approximately 13 million people. On the other
end, the states with less population deprived in this dimension were Aguascalientes, Baja California
Sur and Colima.
Ranges
Total
entities
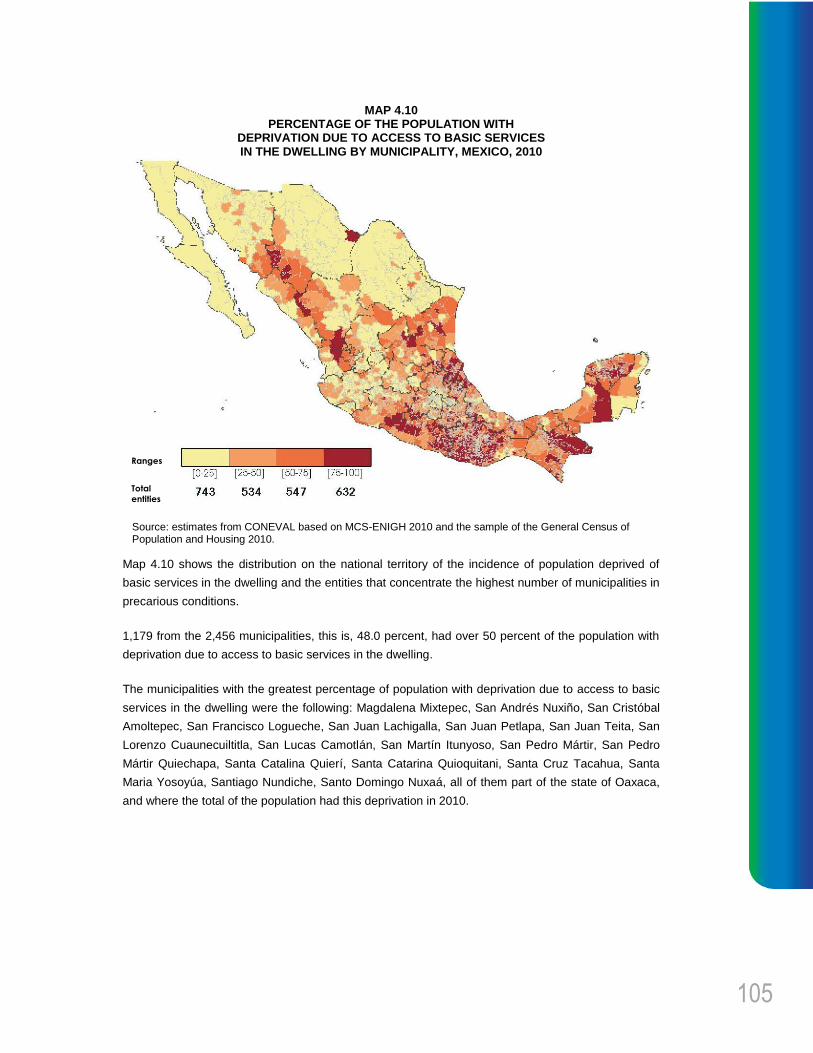
105
MAP 4.10 PERCENTAGE OF THE POPULATION WITH
DEPRIVATION DUE TO ACCESS TO BASIC SERVICES IN THE DWELLING BY MUNICIPALITY, MEXICO, 2010
Source: estimates from CONEVAL based on MCS-ENIGH 2010 and the sample of the General Census of Population and Housing 2010.
Map 4.10 shows the distribution on the national territory of the incidence of population deprived of
basic services in the dwelling and the entities that concentrate the highest number of municipalities in
precarious conditions.
1,179 from the 2,456 municipalities, this is, 48.0 percent, had over 50 percent of the population with
deprivation due to access to basic services in the dwelling.
The municipalities with the greatest percentage of population with deprivation due to access to basic
services in the dwelling were the following: Magdalena Mixtepec, San Andrés Nuxiño, San Cristóbal
Amoltepec, San Francisco Logueche, San Juan Lachigalla, San Juan Petlapa, San Juan Teita, San
Lorenzo Cuaunecuiltitla, San Lucas Camotlán, San Martín Itunyoso, San Pedro Mártir, San Pedro
Mártir Quiechapa, Santa Catalina Quierí, Santa Catarina Quioquitani, Santa Cruz Tacahua, Santa
Maria Yosoyúa, Santiago Nundiche, Santo Domingo Nuxaá, all of them part of the state of Oaxaca,
and where the total of the population had this deprivation in 2010.
Ranges
Total
entities

106
Re
po
rt o
f P
ove
rty in
Me
xic
o 2
010
: Th
e C
ou
ntr
y, It
s Sta
tes
an
d Its
Mu
nic
ipa
litie
s. •
TH
E S
OC
IAL
RIG
HTS
SPA
CE
The municipalities with the lowest percentage of the population with deprivation due to access to
basic services in the dwelling were the following: San Nicolás de los Garza, Nuevo León (0.1); Benito
Juárez, Federal District (0.1); Miguel Hidalgo, Federal District (0.1); San Pedro Garza García, Nuevo
León (0.2); Coacalco de Berriozábal, Mexico (0.2); Venustiano Carranza, Federal District (0.3);
Guadalajara, Jalisco (0.4); Iztacalco, Federal District (0.5); Apodaca, Nuevo León (0.6), and
Azcapotzalco, Federal District (0.6).
In absolute terms, the municipalities having more people with deprivation in basic services in the
dwelling were the following: Puebla, Puebla (303,395); Acapulco de Juárez, Guerrero (289,647);
Ocosingo, Chiapas (203,649); Toluca, Mexico (195,944); León, Guanajuato (189,265); Tlajomulco de
Zúñiga, Jalisco (143,405); Tuxtla Gutiérrez, Chiapas (132,790); Cárdenas, Tabasco (132,312);
Morelia, Michoacán (124,031); Tlalpan, Federal District (123,507); Papantla, Veracruz (123,123);
Huimanguillo, Tabasco (119,428); Tapachula, Chiapas (118,436); Chilón, Chiapas (113,574), and
Nicolás Romero, Mexico (112,775).
Nevertheless, from the 25.9 million people with deprivation due to access to basic services in the
dwelling, 59.7 percent, this is, 15.4 million people are deprived due to the fact that the cooking fuel is
wood or charcoal and the kitchen is not provided with a chimney; from this percentage, 28.4 percent
only had deprivation due to fuel, while 29.1 percent besides deprivation due to fuel, did not have
access to water and sewage service. Another outstanding characteristic is the fact that the population
deprived due to electricity is about 3.7 percent of the 25.9 million people deprived in the dimension of
the access to basic services in the dwelling.
GRAPH 4.2 COMPONENTS OF THE INDICATOR FOR THE POPULATION WITH
DEPRIVATION DUE TO ACCESS TO BASIC SERVICES IN THE DWELLING, MEXICO, 2010
Source: estimates from CONEVAL based on the MCS-ENIGH 2010.
Water and/or sewage
Fuel Electricity

107
The analysis of each component of the indicator of basic services in the dwelling shows that the
cooking fuel was the one with the greatest incidence with 13.7 percent, followed by sewage service,
water and finally electricity with 0.9 percent.
CHART 4.11
PERCENTAGE AND NUMBER OF PEOPLE, ACCORDING TO THE COMPONENTS OF THE
INDICATOR OF BASIC SERVICES IN THE DWELLING, MEXICO, 2010 Indicator components Percentage Million people
Population in housing with access to water under threshold 9.3 10.42
Population in housing with sewage under threshold 10.8 12.11
Population in housing with electricity under threshold 0.9 0.96
Population in housing with cooking fuel under threshold 13.7 15.44
Source: estimates from CONEVAL based on the MCS-ENIGH 2010.
4.6 ACCESS TO FOOD
The construction of this dimension is based on the Mexican Food Security Scale (MFSS), which
allows identifying the changes in the quality and quantity of food and even hunger experiences
among the members of the households. This scale measures the security and three levels of food
insecurity: mild, moderate and severe. For poverty measuring purposes, the people who live in
homes with a moderate or severe degree of food insecurity are considered deprived due lack of
access to food.
Chart 4.12 shows the incidence of population with deprivation due to lack of access to food, in 2010.
This chart shows that 24.9 per cent of the Mexican population suffered this deprivation, which meant
that 27.98 million people suffered for not having full access to food; it is almost a fourth of all Mexican
population. Six entities had incidences above 30 per cent in this deprivation: Guerrero (42.6 percent),
Tabasco (33.3 percent), State of Mexico (31.6 percent), Campeche (31.1 percent), Chiapas (30.3
percent) and San Luis Potosí (30.1 percent). Twenty entities had incidences between 20 and 30
percent and only six states had incidences below 20 percent (Colima, Chihuahua, Baja California,
Nuevo León, Federal District and Tamaulipas) (map 4.11).

108
Re
po
rt o
f P
ove
rty in
Me
xic
o 2
010
: Th
e C
ou
ntr
y, It
s Sta
tes
an
d Its
Mu
nic
ipa
litie
s. •
TH
E S
OC
IAL
RIG
HTS
SPA
CE
CHART 4.12
PERCENTAGE AND NUMBER OF PEOPLE DEPRIVED DUE TO LACK OF ACCESS TO FOOD
PER FEDERAL ENTITY, MEXICO, 2010
Federal Entity Percentage Million people Federal Entity
Percentage Million people
Aguascalientes 20.2 0.24 Morelos 22.0 0.39
Baja California 16.6 0.53 Nayarit 23.5 0.26
Baja California Sur 25.9 0.17 Nuevo León 15.7 0.73
Campeche 31.1 0.26 Oaxaca 26.6 1.01
Coahuila 20.8 0.57 Puebla 27.4 1.59
Colima 19.8 0.13 Querétaro 21.4 0.39
Chiapas 30.3 1.46 Quintana Roo 21.7 0.29
Chihuahua 17.7 0.60 San Luis Potosí
30.1 0.78
Federal District 15.5 1.37 Sinaloa 24.4 0.67
Durango 20.1 0.33 Sonora 26.0 0.69
Guanajuato 23.7 1.31 Tabasco 33.3 0.75
Guerrero 42.6 1.44 Tamaulipas 13.8 0.45
Hidalgo 29.0 0.78 Tlaxcala 24.2 0.28
Jalisco 22.1 1.63 Veracruz 26.5 2.02
State of Mexico 31.6 4.81 Yucatán 21.4 0.42
Michoacán 28.8 1.25 Zacatecas 24.8 0.37
Mexican United States 24.9 27.98
Source: estimates from CONEVAL based on the MCS-ENIGH 2010.
The entities where the biggest number of people deprived due to lack of access to food lived in 2010,
were the State of Mexico (4.81 million), Veracruz (2.02 million), Jalisco (1.63 million) and Puebla
(1.59 million), all together concentrated a bit more than the third part of the country's population with
this deprivation. On the opposite side were Colima, Baja California Sur and Aguascalientes, which
exhibited the lowest volume of affected people (between 130 and 240 thousand people).

109
MAP 4.11 PERCENTAGE OF POPULATION WITH DEPRIVATION DUE TO ACCESS TO FOOD PER FEDERAL ENTITY,
MEXICO, 2010
Source: estimates from CONEVAL based on the MCS-ENIGH 2010.
Four percent of the total municipalities had percentages higher than 50 percent of their population
deprived from food, that is, a hundred municipalities (map 4.12).
The following 10 municipalities had the highest percentages of this deprivation: San Bartolomé
Ayautla, Oaxaca (78.4); San Cristóbal Amatlán, Oaxaca (76.5); San Martín Itunyoso, Oaxaca (74.2);
San Miguel Chicahua, Oaxaca (69.5); Yaxe, Oaxaca (68.6); Chanal, Chiapas (68.0); Huautepec,
Oaxaca (66.9); San Pedro Coxcaltepec Cántaros, Oaxaca (66.6); Santa Cruz Acatepec, Oaxaca
(66.6), and San Miguel Huautla, Oaxaca (66.5). As it can be appreciated, all of them except one are
found in Oaxaca.
The municipalities that had the lowest percentage of their population deprived due to lack of access
to food were: Ciénega de Zimatlán, Oaxaca (4.2); San Juan Evangelista Analco, Oaxaca (4.2), Dr.
Belisario Domínguez, Chihuahua (4.5); Parás, Nuevo León (4.7); San Miguel Tulancingo, Oaxaca
(4.8); Dr. Coss, Nuevo León (4.9); Los Aldamas, Nuevo León (4.9); San Juan Achiutla, Oaxaca (5.7);
San Francisco de Borja, Chihuahua (5.7), and Benito Juárez, Federal District (6.5).
Ranges
Total entities

110
Re
po
rt o
f P
ove
rty in
Me
xic
o 2
010
: Th
e C
ou
ntr
y, It
s Sta
tes
an
d Its
Mu
nic
ipa
litie
s. •
TH
E S
OC
IAL
RIG
HTS
SPA
CE
MAP 4.12 PERCENTAGE OF POPULATION WITH DEPRIVATION
DUE TO ACCESS TO FOOD PER MUNICIPALITY, MEXICO, 2010
Source: estimates from CONEVAL based on MCS-ENIGH 2010 and the sample of the General Census of Population and Housing 2010.
The following municipalities had the greatest amount of people deprived due to lack of access to
food: Ecatepec de Morelos, Mexico (550,683); Puebla, Puebla (517,593); Iztapalapa, Federal District
(378,774); Toluca, Mexico (328,718); Acapulco de Juárez, Guerrero (320,979); León, Guanajuato
(315,938); Nezahualcóyotl, Mexico (311,761); Guadalajara, Jalisco (289,893); Tijuana, Baja
California (255,725); Juárez, Chihuahua (247,268); Naucalpan de Juárez, Mexico (240,702); Morelia,
Michoacán (226,808); Monterrey, Nuevo León (189,977); Centro, Tabasco (184,168), and Ixtapaluca,
Mexico (184,034).
Ranges
Total municipalities

111
CHART 4.13
PERCENTAGE AND NUMBER OF PEOPLE, ACCORDING THEIR LOCATION, IN RELATION TO
THE MEXICAN FOOD INSECURITY SCALE, MEXICO, 2010 Mexican Food Security Scale
1 Percentage Million people
Food security 55.7 62.67
Food insecurity mild degree 19.5 21.91
Food insecurity moderate degree 14.0 15.80
Food insecurity severe degree 10.8 12.18
1The four levels of the scale are presented.
Source: estimates from CONEVAL based on the MCS-ENIGH 2010.
The four levels of the food insecurity scale allow identifying with greater precision the deprivation
degree of the people in this area. In 2010, 55.7 percent of the population did not suffer any degree of
food insecurity; 19.5 had a mild degree, 14 a moderate degree and 10.8 percent a severe degree
(chart 4.13).


5. The Economic Wellbeing Space

114
Re
po
rt o
f P
ove
rty in
Me
xic
o 2
010
: Th
e C
ou
ntr
y, It
s Sta
tes
an
d Its
Mu
nic
ipa
litie
s. •
TH
E E
CO
NO
MIC
WELL
BEIN
G S
PA
CE
The Economic Wellbeing Space
The official poverty measure in Mexico, until 2008, was based exclusively in the income of people
and their capacity to satisfy their needs with these resources. With the creation of CONEVAL and the
elaboration of the methodology to perform multidimensional poverty estimates, the traditional
approach changed and a measure was designed, which not only takes into consideration the income,
main element of wellbeing of the people and their families, but also includes the social deprivations
and social cohesion, resulting in the combination of three analytical spaces.
The definition of poverty, as it has been pointed out, indicates that poor people are those who have at
least one social deprivation and lower income than the wellbeing line. The progresses in the social
deprivations indicators and particularly in supplying greater infrastructure and access to basic
coverage from 2008 to 2010 could not resist the fall in income and, therefore, the increase in poverty.
In the economic crisis context, the real income of the country's households was reduced, especially
in urban areas.
5.1 HOUSEHOLD INCOME
This section analyzes the wellbeing space and the importance of income in the lives of people to
acquire the food and non-food baskets; the latter includes fields about expenses in transportation,
household cleaning and maintenance, personal care, education, communications and vehicle
services, housing, clothes and shoes, household utensils, health care, home appliances and housing
maintenance, entertainment, among others.
The construction of the income indicator used for poverty measurement takes into consideration the
following criteria:
∙ Only the monetary and non-monetary flows that do not put at risk or decrease the heritage of
households are considered.

115
∙ The frequency of transfers is taken into consideration and those that are not recurrent are
eliminated.
∙ The estimate of lease or imputed rent is not included as part of the income.
∙ The scale economies and equivalence scales within households are taken into
consideration.10
The methodology to measure poverty includes two income thresholds: the first one is the wellbeing
line (WL), which is defined as the sum of the food and the non-food basket costs; and the minimum
wellbeing line (MWL) which is equivalent to the food basket cost. These lines enable to value the
percentage of people with insufficient income to meet their basic needs.
In August 2010, the wellbeing line value was 2,114 pesos monthly per person in urban areas, and
1,329 pesos in rural areas. The corresponding values to the minimum wellbeing line were 978 and
684 pesos, respectively.
CHART 5.1
NATIONAL, RURAL AND URBAN TOTAL MONTHLY PER CAPITA CURRENT INCOME,
MEXICO 2010
Income category
National Rural Urban
Pesos Percentage Pesos Percentage Pesos Percentage
Total current income 2,916 100.0 1,397 100.0 3,375 100.0
Current monetary income
2,731 93.7 1,295 92.7 3,166 93.8
Remunerations for subordinate labor
1,862 63.9 720 51.5 2,208 65.4
Income from independent labor
280 9.6 206 14.8 302 8.9
Income from property rental
146 5.0 24 1.7 182 5.4
Other labor incomes 89 3.0 68 4.8 95 2.8
Transfers 355 12.2 277 19.8 379 11.2
Current non-monetary income
188 6.5 104 7.4 214 6.3
Payment in kind 83 2.8 41 2.9 95 2.8
Transfers in kind 105 3.6 63 4.5 118 3.5
Source: estimates from CONEVAL based on the MCS-ENIGH 2010.
10 CONEVAL (2010), Methodology for the multidimensional poverty measurement in Mexico. See Annex A.

116
Re
po
rt o
f P
ove
rty in
Me
xic
o 2
010
: Th
e C
ou
ntr
y, It
s Sta
tes
an
d Its
Mu
nic
ipa
litie
s. •
TH
E E
CO
NO
MIC
WELL
BEIN
G S
PA
CE
The average total per capita current income (TPCCI) nationwide in 2010 was of 2,916 pesos per
month; in the rural sphere it was of 1,397 pesos and in urban sphere it was 3,375 pesos. This is
equivalent to a difference of 2.4 fold between the first and second. In chart 5.1, it can be observed
that the remunerations for subordinate labor were the source of income both nationwide and in all
residence areas, independently of the size of the population inhabiting such areas. The income from
transfers ranked in second place and the income from independent labor came in third.
The population distribution according to income deciles shows that the total per capita current income
of the first decile (326 pesos) is 35-fold lower than that of the last decile (11,609 pesos) and nine-fold
that of the national mean (2,916 pesos). These differences show that the income distribution in
Mexico is quite polarized.
Likewise, the composition per income sources varies between deciles. For instance, the first decile
has transfers as its main income source, followed by remunerations from insubordinate labor and
then income from independent labor. On the other hand, the tenth decile has as main source of
income the remunerations from subordinate labor, transfers in second and the income from rental of
property in third (chart 5.2).
On the territory level, the average income was distributed in a differentiated manner within each
federal entity: there were four entities (Chiapas, Oaxaca, Guerrero and Tlaxcala) with an income level
within the range of one thousand to two thousand pesos per capita; sixteen states with an TPCCI
between 2,000 and 3,000 pesos; nine states with 3,000 and 4,000 pesos, and three entities (Baja
California, Nuevo León and the Federal District) with incomes between 4,000 and 5,000 pesos.
The difference between Chiapas —whose income was of 1,353 pesos— and the Federal District —
with an income of 4,946 pesos— was 3.7-fold, and between Chiapas and the national mean (2,916
pesos) of 2.2-fold. It is worth mentioning that the income of the Federal District represented 1.7-fold
more than the average national income (map 5.1).
The municipalities that had the highest total current income per capita were as follows: Benito Juárez,
Federal District (8,902 pesos); San Pedro Garza García, Nuevo León (7,070 pesos); Miguel Hidalgo,
Federal District (6,950 pesos); Cuajimalpa de Morelos,

117
CH
AR
T 5
.2
TOTA
L M
ON
THLY
PER
CA
PIT
A C
UR
REN
T IN
CO
ME B
Y D
EC
ILE, M
EX
ICO
20
10
Nati
on
al
2,9
16
2,7
31
1,8
62
280
146
89
355
188
83
105
Sourc
e:
estim
ate
s f
rom
CO
NE
VA
L b
ased o
n t
he
MC
S-E
NIG
H 2
010
.
Decil
e
X
11,6
09
10,7
43
7,1
99
871
1,0
99
207
1,3
67
866
383
484
IX 4,6
20
4,3
27
3,1
32
428
148
126
494
293
163
130
VIII 3,2
44
3,0
46
2,1
73
354
68
111
340
199
93
105
VII
2,5
26
2,3
78
1,7
16
273
44
94
249
149
66
84
VI 2,0
68
1,9
47
1,3
71
221
32
84
239
122
47
74
V 1,6
64
1,5
75
1,0
78
191
27
74
206
90
31
59
IV
1,3
36
1,2
73
861
153
16
64
179
64
19
45
III
1,0
34
987
598
142
12
53
183
48
15
33
II 731
696
377
103
8
47
161
35
8
27
I 326
313
98
57
2
27
130
17
2
15
Inc
om
e c
ate
go
ry
To
tal
cu
rren
t in
co
me
Cu
rren
t m
on
eta
ry i
nc
om
e
Rem
un
era
tion
s fo
r sub
ord
ina
te labo
r
Inco
me
fro
m ind
ep
end
en
t la
bo
r
Inco
me
fro
m p
rop
ert
y r
enta
l
Oth
er
labo
r in
co
mes
Tra
nsfe
rs
Cu
rren
t n
on
-mo
neta
ry i
nc
om
e
Paym
ent in
kin
d
Tra
nsfe
rs in k
ind

118
Re
po
rt o
f P
ove
rty in
Me
xic
o 2
010
: Th
e C
ou
ntr
y, It
s Sta
tes
an
d Its
Mu
nic
ipa
litie
s. •
TH
E E
CO
NO
MIC
WELL
BEIN
G S
PA
CE
MAP 5.1 TOTAL MONTHLY PER CAPITA CURRENT INCOME
BY FEDERAL ENTITY, MEXICO 2010
Source: estimates from CONEVAL based on the MCS-ENIGH 2010.
Federal District (6,449 pesos); Orizaba, Veracruz (5,985 pesos); Coyoacán, Federal District (5,674
pesos); Corregidora, Querétaro (5,515 pesos); San Sebastián Tutla, Oaxaca (5,352 pesos);
Guadalupe, Nuevo León (5,312 pesos); San Pablo Etla, Oaxaca (5,263 pesos); San Nicolás de los
Garza, Nuevo León (5,119 pesos); Cuauhtémoc, Federal District (5,042 pesos); Tlalpan, Federal
District (4,871 pesos); Cuernavaca, Morelos (4,869 pesos), and San Andrés Huayapam, Oaxaca
(4,785 pesos).
TPCCI Monthly
Total entities
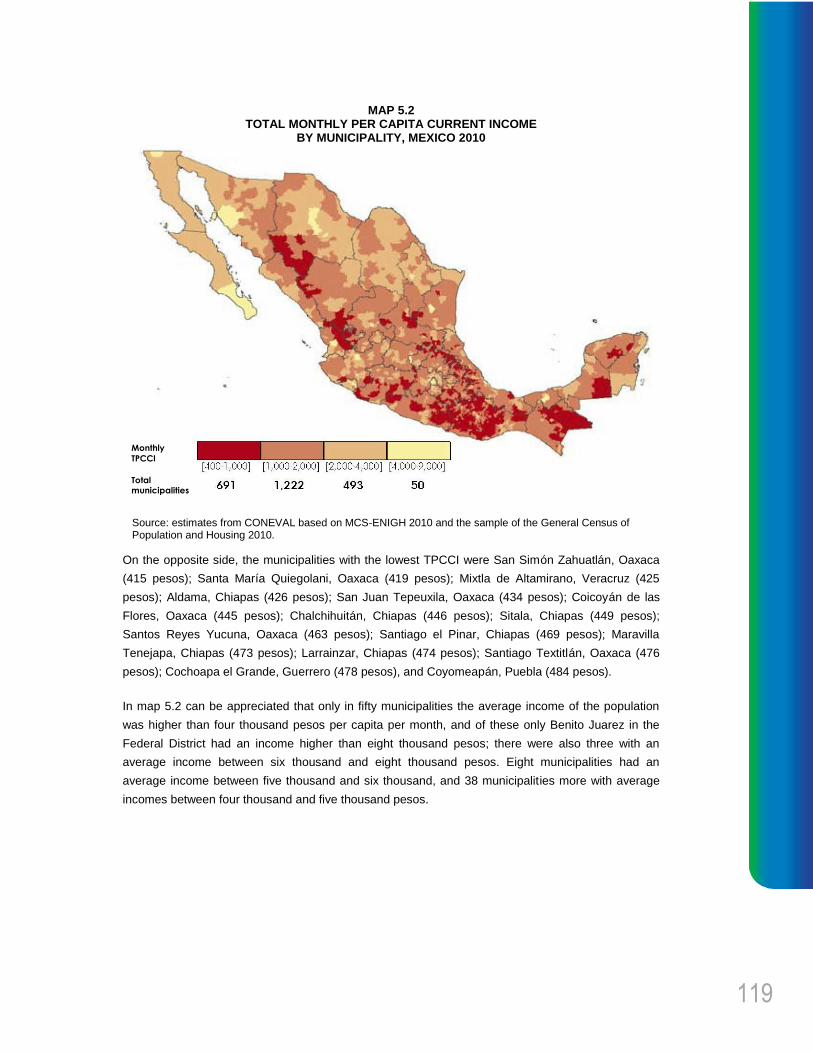
119
MAP 5.2 TOTAL MONTHLY PER CAPITA CURRENT INCOME
BY MUNICIPALITY, MEXICO 2010
Source: estimates from CONEVAL based on MCS-ENIGH 2010 and the sample of the General Census of Population and Housing 2010.
On the opposite side, the municipalities with the lowest TPCCI were San Simón Zahuatlán, Oaxaca
(415 pesos); Santa María Quiegolani, Oaxaca (419 pesos); Mixtla de Altamirano, Veracruz (425
pesos); Aldama, Chiapas (426 pesos); San Juan Tepeuxila, Oaxaca (434 pesos); Coicoyán de las
Flores, Oaxaca (445 pesos); Chalchihuitán, Chiapas (446 pesos); Sitala, Chiapas (449 pesos);
Santos Reyes Yucuna, Oaxaca (463 pesos); Santiago el Pinar, Chiapas (469 pesos); Maravilla
Tenejapa, Chiapas (473 pesos); Larrainzar, Chiapas (474 pesos); Santiago Textitlán, Oaxaca (476
pesos); Cochoapa el Grande, Guerrero (478 pesos), and Coyomeapán, Puebla (484 pesos).
In map 5.2 can be appreciated that only in fifty municipalities the average income of the population
was higher than four thousand pesos per capita per month, and of these only Benito Juarez in the
Federal District had an income higher than eight thousand pesos; there were also three with an
average income between six thousand and eight thousand pesos. Eight municipalities had an
average income between five thousand and six thousand, and 38 municipalities more with average
incomes between four thousand and five thousand pesos.
Monthly
TPCCI
Total municipalities

120
Re
po
rt o
f P
ove
rty in
Me
xic
o 2
010
: Th
e C
ou
ntr
y, It
s Sta
tes
an
d Its
Mu
nic
ipa
litie
s. •
TH
E E
CO
NO
MIC
WELL
BEIN
G S
PA
CE
In addition, there are 1,913 municipalities that are 77.9 percent of the total, which had an average
income below two thousand pesos per month. Of this group, 691 had an average income below one
thousand pesos, which is equivalent to 28.1 percent of the country's municipalities.
Finally, 493 municipalities, one out of five, had an average monthly per capita income within the
range of two thousand and four thousand pesos per month.
5.2 CURRENT INCOME OF THE POPULATION IN A
POVERTY AND VULNERABILITY SITUATION
Nationwide, the average income of the non multidimensional poor and non vulnerable population was
of 5,972 pesos, and that of the poor population was 1,031 pesos, that is, people who are not poor
have 5.8-fold more income than poor people. In addition, when comparing the income of the former
and that of the vulnerable population due to income (1,477 pesos) it can be observed that this
difference is four-fold and 1.4-fold regarding the vulnerable population due to social deprivations
(4,189 pesos).
GRAPH 5.1 TOTAL MONTHLY PER CAPITA CURRENT INCOME ACCORDING TO POVERTY OR VULNERABILITY CONDITION AND PLACE OF
RESIDENCE, MEXICO, 2010
Source: estimates from CONEVAL based on the MCS-ENIGH 2010.
Vulnerable due to social deprivation
National: 4,189 pesos
Rural: 2,603 pesos Urban: 4,673 pesos
Poor people
National: 1,031 pesos
Rural: 659 pesos Urban 1,211 pesos
Non multidimensional
poor and non
vulnerable
population
National: 5,972 pesos
Rural: 4,106 pesos
Urban 6,091 pesos
Vulnerable due to
income
National: 1,477 pesos
Rural: 980 pesos
Urban: 1,498 pesos
Deprivations
Social Rights
Ec
on
om
ic w
ellb
ein
g
Inc
om
e
EWL
MWL

121
On the other hand, when comparing incomes it can be seen in the rural field that the gaps in the
TPCCI get broader between the non multidimensional poor and non vulnerable population (4,106
pesos) and poor people (659 pesos), since the income of the first group is equivalent to 6.2-fold the
income of the second. In the urban field, the difference between people not living in poverty (6,091
pesos) and poor people (1,211 pesos) was five-fold.
It had been established already that the composition of the TPCCI among the poor population
nationwide had as income source (58.3 percent) the remunerations from subordinate labor. In urban
areas this percentage was 62.3 percent and in rural areas it was 43.2 percent. The second source of
income nationwide were the transfers (16.3 percent); in rural areas were the transfers as well (31.0
percent) ---among these stand out those from government (23 percent) and partly the remittances
(3.6 percent) ---, and in urban localities the second source was the income from independent labor
(13.5 percent).
The vulnerable population due to income, which is the population that does not have social
deprivations but its income is lower than the EWL, in 2010 had as main TPCCI source, nationwide
and in the urban and rural areas, the remunerations from subordinate work (around 75 percent); the
second source of income were the transfers (nationwide 13 percent, rural 17.7 percent and urban
12.9 percent). It is worth mentioning that government transfers to rural areas represented almost 10
percent of its income, and the third source was the income from independent labor (a bit more than 4
percent).
The population group that has an income higher than the WL but also has one or more social
deprivations (vulnerable due to deprivations) has as main income source the remunerations from
subordinate labor; the resources obtained in this field in the urban area (2,718 pesos) exceed the
wellbeing line and in the rural area (1,321 pesos) they are eight pesos away from reaching it. The
second source of income for this population group was the income from independent labor, which
represents 12.5 percent at the urban level and 17.2 percent at the rural level. The third source of
income in this group was the transfers (chart 5.3).
Finally, the people not living in poverty and not vulnerable had in the remunerations from subordinate
labor their main source of income (around 72 percent), followed by transfers with a little bit more than
ten percent and, lastly, the income from independent labor.

122
Re
po
rt o
f P
ove
rty in
Me
xic
o 2
010
: Th
e C
ou
ntr
y, It
s Sta
tes
an
d Its
Mu
nic
ipa
litie
s. •
TH
E E
CO
NO
MIC
WELL
BEIN
G S
PA
CE
CH
AR
T 5
.3
TOTA
L M
ON
THLY
PER
CA
PIT
A C
UR
REN
T M
ON
THLY
IN
CO
ME A
CC
OR
DIN
G T
O P
OV
ER
TY O
R V
ULN
ER
AB
ILIT
Y C
ON
DIT
ION
, M
EX
ICO
, 2010
No
n m
ult
idim
en
sio
nal
po
or
an
d n
on
vu
lnera
ble
po
pu
lati
on
Nati
on
al
5,9
72
5,6
43
4,3
16
269
253
102
704
27
12
329
172
157
Sourc
e:
estim
ate
s f
rom
CO
NE
VA
L b
ased o
n t
he
MC
S-E
NIG
H 2
010
.
Ru
ral
4,1
06
3,9
29
2,8
87
316
119
174
434
63
26
177
91
87
Urb
an
6,0
91
5,7
52
4,4
08
266
261
97
721
24
11
339
177
162
Vu
lnera
ble
du
e t
o s
ocia
l d
ep
riv
ati
on
Nati
on
al
4,1
89
3,8
52
2,3
91
553
311
144
453
63
60
338
143
195
Ru
ral
2,6
03
2,3
53
1,3
21
448
56
113
415
160
103
251
107
144
Urb
an
4,6
73
4,3
11
2,7
18
585
389
153
465
34
47
364
154
210
Vu
lnera
ble
du
e t
o i
nc
om
e
Nati
on
al
1,4
77
1,4
27
1,1
18
64
14
38
192
25
4
54
20
33
Ru
ral
980
962
720
39
1
28
174
95
12
19
8
12
Urb
an
1,4
98
1,4
46
1,1
35
65
15
39
193
22
4
55
21
34
Po
vert
y
Nati
on
al
1,0
31
980
601
141
14
56
168
83
18
53
16
37
Ru
ral
659
626
286
93
3
40
204
151
24
34
8
26
Urb
an
1,2
11
1,1
52
754
164
19
63
151
50
15
63
20
43
Inc
om
e c
ate
go
ry
To
tal
cu
rren
t in
co
me
Cu
rren
t m
on
eta
ry i
nc
om
e
Rem
un
era
tion
s fo
r sub
ord
ina
te labo
r
Inco
me
fro
m ind
ep
end
en
t la
bo
r
Inco
me
fro
m p
rop
ert
y r
enta
l
Oth
er
labo
r in
co
mes
Tra
nsfe
rs
Gove
rnm
ent tr
ansfe
rs
Rem
itta
nces
Cu
rren
t n
on
-mo
neta
ry i
nc
om
e
Paym
ent in
kin
d
Tra
nsfe
rs in k
ind

123
5.3 EFFECT OF TRANSFERS ON INCOME
Monetary transfers in rural areas represented 21.4 percent of the current per capita monetary income
per month. For the first decile they meant around 50 percent, and of that percentage the biggest
source of income were the government transfers, especially those from the Human Development
Program Oportunidades (Opportunities). It is worth mentioning that from decile one to six, the latter
represented more than half of the transfers received from the government. On the other hand, the
benefits of the Cropland Direct Support Program (Procampo) were the second source of government
transfers and were inversely distributed according to the income deciles. So, the first decile received
from Procampo 11.8 percent of the transfers given by the government and the tenth decile received
61.7 percent. In third place came Program 70 and Over, which had a participation of 9 percent in the
first decile and six percent in the last one; however, deciles seven and eight were the ones with the
highest percentages with approximately 17 and 19 percent respectively.
In the rural context, after the government transfers (53.8 percent), the income from remittances (16.9
percent) was the most important. The deciles that obtained the most resources, in relative terms,
through remittances were from the fifth to the ninth. Finally, the third and fourth sources of income
from transfers in the rural area were the retirements (13.1 percent) and monetary donations from
other households (12.4 percent). Retirements had more relative importance in deciles seventh to
tenth, and donations had it in deciles seventh, eighth and ninth.
In urban areas, the participation of transfers in current monetary income was equivalent to 12
percent. In order of importance, the income that stood out was that from retirements originated in the
country (55.5 percent) as the main source of transfers; in second place came the monetary donations
from other households (22.9 percent), in third place were the government transfers (9.8 percent) and
in fourth came the remittances (5.9 percent).
In the decile distribution of urban areas, the retirements show that the relative amount of perceived
resources is directly proportional to the income decile, that is, in decile one the income percentage
from retirements was 7.4 percent and increases as the income level does, until reaching the tenth
decile where its participation was of 67.8 percent. The government transfers behave oppositely; the
lesser income level the highest is the percentage of government transfers. Therefore, the first decile
had from government transfers 62.7 percent, whereas the tenth decile had 2.7 percent.

124
Re
po
rt o
f P
ove
rty in
Me
xic
o 2
010
: Th
e C
ou
ntr
y, It
s Sta
tes
an
d Its
Mu
nic
ipa
litie
s. •
TH
E E
CO
NO
MIC
WELL
BEIN
G S
PA
CE
Regarding the government transfers, the first place in relative terms was occupied by income from
the Opportunities program; then from government scholarships, followed by the Seventy and Over
Program, as well as other programs for the elderly. The Procampo program was located in fifth place
and in sixth came the income from other social programs (chart 5.4).
The Opportunities program, in its decile distribution in urban areas, shows a behavior inversely
proportional to the income level. In this manner, the first decile has a participation of 63.3 percent and
the last decile of 2.6 percent. Government scholarships behave oppositely, so the first decile had a
participation of 5.9 percent that came from scholarships in the total of transfers received from the
government, while the tenth decile had a participation of 61.1 percent.
In graph 5.2 can be seen the distribution of the total per capita current income including and
excluding the resources received by transfers, government transfers and remittances in the
population that is below the wellbeing line. The total monetary transfers nationwide represented
around 12 percent of the total income of people; in the rural field the percentage increased to 19.7
percent and in the urban field it meant 11.1 percent. The transfers provided by the government were
approximately 10.5 percent of people's income in the rural context, whereas nationwide it reached
two percent and in the urban field it was one percent. Finally, remittances also have major impact on
the rural field since they represented 3.2 percent of total income.
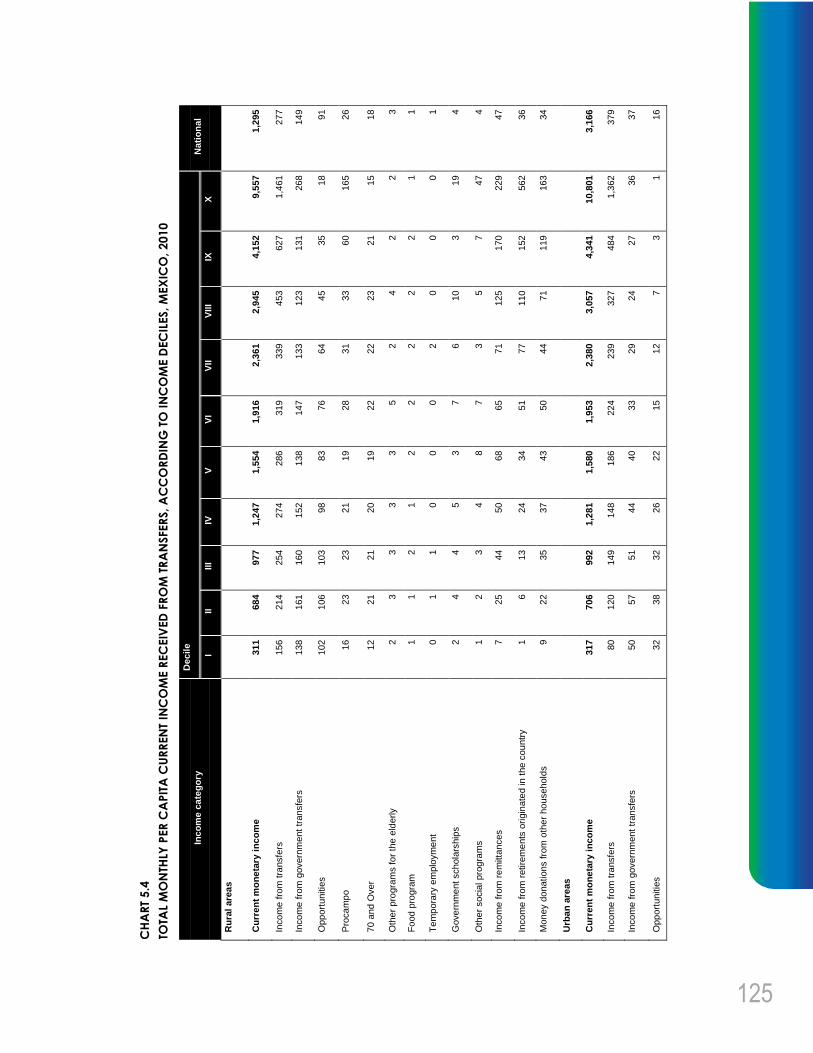
125
CH
AR
T 5
.4
TOTA
L M
ON
THLY
PER
CA
PIT
A C
UR
REN
T IN
CO
ME R
EC
EIV
ED
FR
OM
TR
AN
SFER
S, A
CC
OR
DIN
G T
O IN
CO
ME D
EC
ILES, M
EX
ICO
, 2010
Nati
on
al
1,2
95
277
149
91
26
18
3
1
1
4
4
47
36
34
3,1
66
379
37
16
Decil
e
X
9,5
57
1,4
61
268
18
165
15
2
1
0
19
47
229
562
163
10,8
01
1,3
62
36
1
IX
4,1
52
627
131
35
60
21
2
2
0
3
7
170
152
119
4,3
41
484
27
3
VIII
2,9
45
453
123
45
33
23
4
2
0
10
5
125
110
71
3,0
57
327
24
7
VII
2,3
61
339
133
64
31
22
2
2
2
6
3
71
77
44
2,3
80
239
29
12
VI
1,9
16
319
147
76
28
22
5
2
0
7
7
65
51
50
1,9
53
224
33
15
V
1,5
54
286
138
83
19
19
3
2
0
3
8
68
34
43
1,5
80
186
40
22
IV
1,2
47
274
152
98
21
20
3
1
0
5
4
50
24
37
1,2
81
148
44
26
III
977
254
160
103
23
21
3
2
1
4
3
44
13
35
992
149
51
32
II
684
214
161
106
23
21
3
1
1
4
2
25
6
22
706
120
57
38
I
311
156
138
102
16
12
2
1
0
2
1
7
1
9
317
80
50
32
Inc
om
e c
ate
go
ry
Ru
ral
are
as
Cu
rren
t m
on
eta
ry i
nc
om
e
Inco
me
fro
m t
ransfe
rs
Inco
me
fro
m g
overn
ment
transfe
rs
Opp
ort
unitie
s
Pro
ca
mp
o
70 a
nd
Over
Oth
er
pro
gra
ms fo
r th
e e
lderly
Fo
od p
rogra
m
Te
mp
ora
ry e
mplo
ym
ent
Gove
rnm
ent schola
rship
s
Oth
er
socia
l pro
gra
ms
Inco
me
fro
m r
em
itta
nces
Inco
me
fro
m r
etire
me
nts
ori
gin
ate
d in t
he c
ou
ntr
y
Mon
ey d
onations fro
m o
ther
ho
usehold
s
Urb
an
are
as
Cu
rren
t m
on
eta
ry i
nc
om
e
Inco
me
fro
m t
ransfe
rs
Inco
me
fro
m g
overn
ment
transfe
rs
Opp
ort
unitie
s
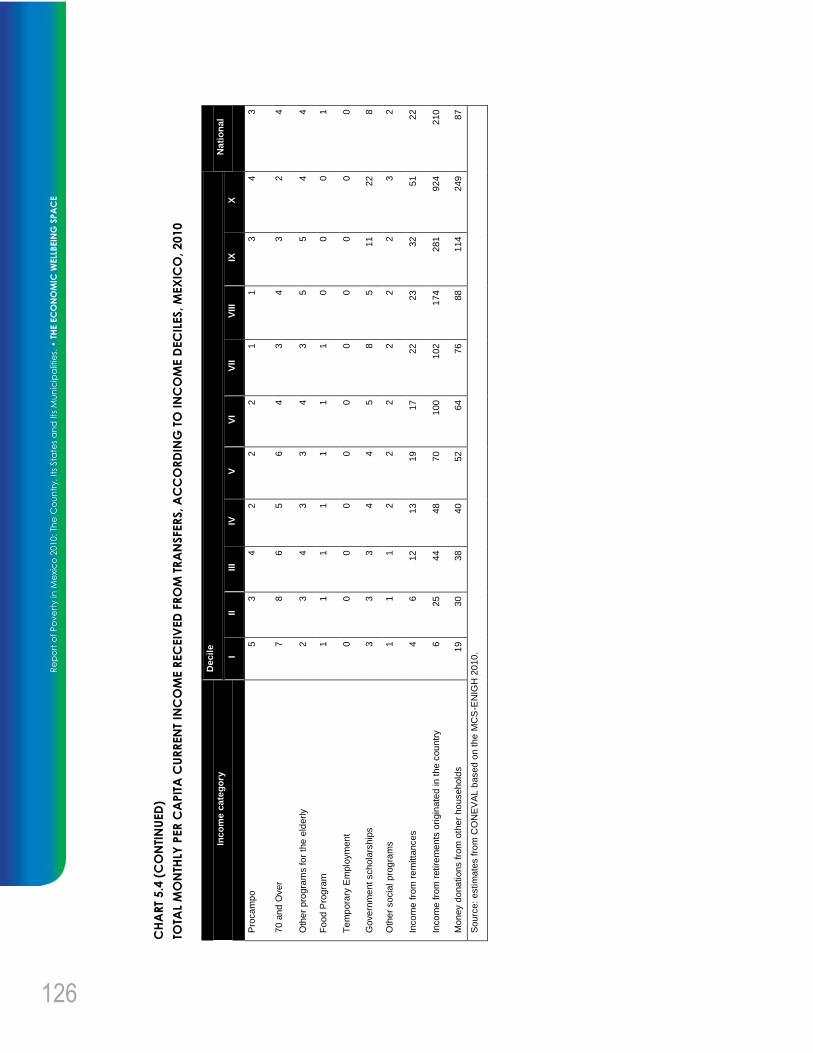
126
Re
po
rt o
f P
ove
rty in
Me
xic
o 2
010
: Th
e C
ou
ntr
y, It
s Sta
tes
an
d Its
Mu
nic
ipa
litie
s. •
TH
E E
CO
NO
MIC
WELL
BEIN
G S
PA
CE
CH
AR
T 5
.4 (
CO
NTI
NU
ED
)
TOTA
L M
ON
THLY
PER
CA
PIT
A C
UR
REN
T IN
CO
ME R
EC
EIV
ED
FR
OM
TR
AN
SFER
S, A
CC
OR
DIN
G T
O IN
CO
ME D
EC
ILES, M
EX
ICO
, 2010
Nati
on
al
3
4
4
1
0
8
2
22
210
87
Sourc
e:
estim
ate
s f
rom
CO
NE
VA
L b
ased o
n t
he
MC
S-E
NIG
H 2
010
.
Decil
e
X
4
2
4
0
0
22
3
51
924
249
IX
3
3
5
0
0
11
2
32
281
114
VIII
1
4
5
0
0
5
2
23
174
88
VII
1
3
3
1
0
8
2
22
102
76
VI
2
4
4
1
0
5
2
17
100
64
V
2
6
3
1
0
4
2
19
70
52
IV
2
5
3
1
0
4
2
13
48
40
III
4
6
4
1
0
3
1
12
44
38
II
3
8
3
1
0
3
1
6
25
30
I
5
7
2
1
0
3
1
4
6
19
Inc
om
e c
ate
go
ry
Pro
ca
mp
o
70 a
nd
Over
Oth
er
pro
gra
ms fo
r th
e e
lderly
Fo
od P
rog
ram
Te
mp
ora
ry E
mplo
ym
ent
Gove
rnm
ent schola
rship
s
Oth
er
socia
l pro
gra
ms
Inco
me
fro
m r
em
itta
nces
Inco
me
fro
m r
etire
me
nts
ori
gin
ate
d in t
he c
ou
ntr
y
Mon
ey d
onations fro
m o
ther
ho
usehold
s
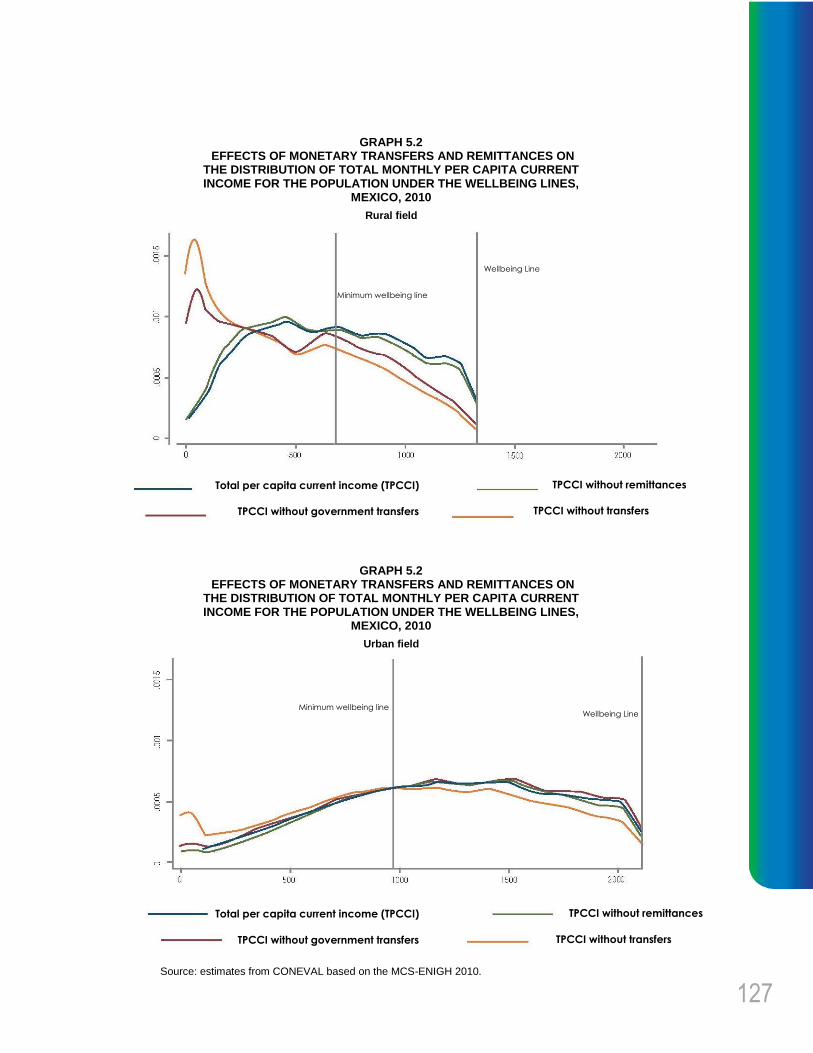
127
GRAPH 5.2 EFFECTS OF MONETARY TRANSFERS AND REMITTANCES ON
THE DISTRIBUTION OF TOTAL MONTHLY PER CAPITA CURRENT INCOME FOR THE POPULATION UNDER THE WELLBEING LINES,
MEXICO, 2010
Rural field
GRAPH 5.2 EFFECTS OF MONETARY TRANSFERS AND REMITTANCES ON
THE DISTRIBUTION OF TOTAL MONTHLY PER CAPITA CURRENT INCOME FOR THE POPULATION UNDER THE WELLBEING LINES,
MEXICO, 2010
Urban field
Source: estimates from CONEVAL based on the MCS-ENIGH 2010.
Minimum wellbeing line
Wellbeing Line
Total per capita current income (TPCCI)
TPCCI without government transfers
TPCCI without remittances
TPCCI without transfers
Minimum wellbeing line Wellbeing Line
Total per capita current income (TPCCI)
TPCCI without government transfers
TPCCI without remittances
TPCCI without transfers

128
Re
po
rt o
f P
ove
rty in
Me
xic
o 2
010
: Th
e C
ou
ntr
y, It
s Sta
tes
an
d Its
Mu
nic
ipa
litie
s. •
TH
E E
CO
NO
MIC
WELL
BEIN
G S
PA
CE
5.4 INCOME FROM MEN AND WOMEN
The TPCCI distribution according to people's sex shows that the male population had in average an
income of 2,981 pesos, whereas women earned an average of 2,854 pesos, that is, a difference of
127 pesos. The women obtained more than men only in the monetary and non-monetary transfers
field (chart 5.5).
On a state level, there are 26 federal entities where the average income of men is higher than the
average income women receive, and only in six entities the opposite happens. The states with the
broadest gaps in income between men and women were, in 2010, the following: Baja California (525
pesos of difference), Nuevo Leon (607 pesos), Queretaro (263 pesos), Colima (243 pesos) and
Quintana Roo (264 pesos); in all of them men obtained in average more resources than women.
The six entities where women obtained more income in average are: Yucatan, Guerrero, Zacatecas,
Coahuila, San Luis Potosi and Campeche.
The three federal entities with the lowest income in both men and women were Chiapas, Oaxaca,
Guerrero and Tlaxcala, in all of them the income were less than two thousand pesos. On the opposite
side there were Baja California Sur, Baja California, the Federal District and Nuevo Leon with
average incomes between four thousand and five thousand pesos.
CHART 5.5
TOTAL MONTHLY PER CAPITA CURRENT INCOME PER SEX, MEXICO, 2010
Income category
Female population Male population
Pesos Percentage Pesos Percentage
Total current income 2,854 100.0 2,981 100.0
Current monetary income 2,667 93.5 2,799 93.9
Remunerations for subordinate labor
1,804 63.2 1,924 64.5
Income from independent labor 271 9.5 289 9.7
Income from property rental 129 4.5 163 5.5
Other labor incomes 85 3.0 93 3.1
Transfers 378 13.2 331 11.1
Current non-monetary income 191 6.7 185 6.2
Payment in kind 79 2.8 87 2.9
Transfers in kind 112 3.9 99 3.3
Source: estimates from CONEVAL based on the MCS-ENIGH 2010.

129
5.5 INCOME OF INDIGENOUS POPULATION
According to the National Commission for the Development of Indigenous People (CDI), it is
considered as indigenous all people within an indigenous household, where the head of the house,
his or her spouse or any of the ancestors speaks an indigenous language. It also includes the people
that declare being fluent in an indigenous language even when they are not members of these
households.
In chart 5.6 can be observed the comparison between the total per capita current income and its
components both in the population that speaks an indigenous language and in the population that
does not. The average TPCCI of the indigenous population was located in 1,247 pesos per month,
whereas the income of non-indigenous population is 3,072 pesos, which represents a factor of 2.5-
fold the income of the latter regarding the former. By disaggregating both the monetary and non-
monetary income fields, there still are income gaps between one population and other. For instance,
the income from property rental is 9.5-fold greater in the non-indigenous population than among
indigenous population; the remunerations for subordinate labor are 3.1-fold higher, monetary
transfers are 1.5-fold higher and transfers in kind are 2.1-fold higher.
CHART 5.6
TOTAL MONTHLY PER CAPITA CURRENT INCOME OF THE INDIGENOUS-LANGUAGE
SPEAKING POPULATION, MEXICO, 2010
Income category
Indigenous Population Non-indigenous population
Pesos Percentage Pesos Percentage
Total current income 1,247 100.0 3,072 100.0
Current monetary income 1,147 92.0 2,882 93.8
Remunerations for subordinate labor 642 51.4 1,968 64.1
Income from independent labor 189 15.1 290 9.4
Income from property rental 17 1.3 158 5.2
Other labor incomes 49 4.0 92 3.0
Transfers 251 20.1 373 12.2
Current non-monetary income 101 8.1 194 6.3
Payment in kind 48 3.9 85 2.8
Transfers in kind 53 4.2 109 3.6
Source: estimates from CONEVAL based on the MCS-ENIGH 2010.

6. TheTerritorial
Context Space

132
Re
po
rt o
f P
ove
rty in
Me
xic
o 2
010
: Th
e C
ou
ntr
y, It
s Sta
tes
an
d Its
Mu
nic
ipa
litie
s. •
TH
E T
ER
RIT
OR
IAL
CO
NTE
XT
SPA
CE
The Territorial Context Space
Social cohesion has four essential characteristics: a) unlike economic wellbeing and social rights, the
analysis units of which are the individuals or their households, this refers to social groups located in
the territory; b) it is not part of the proposals of current general theories about poverty, so it opens up
to the dilemma of explaining if it belongs to a different conceptual field or if it is another dimension,
which is necessary to conceptually account for the phenomenon; c) it is a relational concept built to
account for the social links among people, communities and social groups; and d) a more balanced
society generates a favorable environment to develop social cohesion among its members.
From these features that describe the concept and available information, social cohesion was
measured through the following indicators: the Gini coefficient, the income ratio, the social
polarization degree and the social networks perception index.11
6.1 INDICATORS ASSOCIATED WITH THE TERRITORY
In 2010, the indicator that accounted for income concentration, that is, the Gini coefficient, registered
nationwide a value of 0.509, which reflects a high inequality in income distribution when compared to
northern Europe countries (Norway, Sweden, Finland), where the Gini coefficient values are below
0.3 according to the Human Development Report of 2010 (PNUD, 2010). When the comparison is
made between Latin American countries, the income concentration in Mexico is similar to that of
Chile, Argentina and Brazil.12
11 For further information about the indicators associated with the territory context, we suggest to check Annex B of the
Methodology for multidimensional poverty measurement in Mexico. Available in the following website:
www.coneval.gob.mx 12 The way to calculate the income in different countries can fluctuate due to variables taken into consideration, but
the available information can provide an outlook of how income is distributed within the various countries.

133
In this report the income ratio is used to make a comparison of the income of people who are
extremely poor and those who are not poor or vulnerable.13
This allows knowing the gap that
separates the income level, measured by the total per capita current income of a group relative to the
other. In 2010, this difference nationwide was of 0.08, which meant that for each peso owned by the
people who were not poor or vulnerable, the people in extreme poverty only had eight cents (chart
6.1)
Social polarization is the third indicator of social cohesion. To calculate this indicator, the
Marginalization Index by federal entity and municipality of 2010, of the National Population Council
(CONAPO, 2011) was used. This information allows having four categories according to the next
criteria:
One entity is polarized if less than 20 percent of its population lives in municipalities with a "Medium"
marginalization degree, and more than 30 percent in each end ("High" or "Too high" and "Low" or
"Too low" marginalization, respectively).
An entity has a left pole (of high marginalization) if it concentrates more than seventy percent of its
population in municipalities with a "High" or "Too high" degree of marginalization.
An entity has a right pole (of low marginalization) if it concentrates more than seventy percent of its
population in municipalities with a "Low" or "Too low" degree of marginalization.
An entity is considered without poles if it cannot be classified in any of the previous categories.
According to chart 6.1, three percent of the country's population lived in polarized entities (only the
state of Guerrero had this feature), there was no entity with a high marginalization pole; almost six
out of ten people lived in entities with a right or low marginalization pole and almost four out of ten
people lived in non-polarized entities.
13 Usually, the income ratio is used to compare the average income of the tenth decile relative to the first.

134
Re
po
rt o
f P
ove
rty in
Me
xic
o 2
010
: Th
e C
ou
ntr
y, It
s Sta
tes
an
d Its
Mu
nic
ipa
litie
s. •
TH
E T
ER
RIT
OR
IAL
CO
NTE
XT
SPA
CE
CHART 6.1
INDICATORS ASSOCIATED TO THE TERRITORY CONTEXT, MEXICO 2010
Indicators of social cohesion Value
Gini coefficient 0.509
Income ratio between extremely poor population and the non multidimensional poor and non vulnerable population
0.08
Social polarization degree 1/2/3
Population in polarized entities 3.0
Population in entities with a high marginalization pole -
Population in entities with a low marginalization pole 57.2
Population in entities without pole 39.8
Social networks perception index 3/4
Population in entities with a high degree of social network perception 9.9
Population in entities with a medium degree of social network perception 68.8
Population in entities with a low degree of social network perception 21.3
Notes:
1 It is defined as the equal distribution of population into two poles of the marginalization scale in a specific space.
2 The Marginalization Index by federal entity and municipality of 2010 from CONAPO is used for these calculations.
3 The population percentage is reported.
4 It is defined as the degree of perception of easiness or difficulty that people aged 12 years old or more bear regarding to
obtaining help of social networks in hypothetical situations.
Source: estimates from CONEVAL based on the MCS-ENIGH 2010.
On the other hand, the ease people have or do not have to obtain help from their most immediate
surroundings regarding different hypothetical situations such as: getting a loan, help for a job, child
care, go to the doctor or cooperate to improve their neighborhood or district, constitute elements that
form the social networks. In 2010, nationwide only four entities had a high social networks perception
index, which represented 9.9 percent of the total population of the country; 24 states had a medium
index (68.8 percent of the total population) and the remaining four entities had a low index, that is,
21.3 percent of the total population of the country.
6.2 GEOGRAPHICAL DISTRIBUTION OF THE GINI
COEFFICIENT
The Gini coefficient14
—that measures the income concentration—, allows identifying that the
greatest economic inequality forms a manifestation of lower social cohesion to the extent that a small
percentage of the population comprises an important part of the total income of a society.
14 The values taken by the Gini coefficient go from zero to one, when the value is close to zero it indicates that there is
less income concentration in the society and when the values tend to one it means that the society is more unequal
and there is a big income concentration in few people.

135
At state level, the Gini coefficient distribution shows that there is great territory heterogeneity
regarding income inequality. Map 6.1 shows that there are 11 entities whose Gini coefficients vary
between 0.49 and 0.55: in this group are most noticeable states are Chiapas, Veracruz, Zacatecas
and the Federal District with the highest levels of economic resources concentration; it is worth
mentioning that the Federal District is the entity with highest income level in the country and, on the
other hand, Chiapas is the one with the lowest level of income. It is quite revealing that in the three
entities with the lowest income levels (Chiapas, Oaxaca and Guerrero) the Gini coefficient is quite
high — between 0.51 and 0.54—, this means that, on one hand, low income levels in most of the
population coexist with a large concentration in few people.
MAP 6.1 GINI COEFFICIENT PER FEDERAL ENTITY, MEXICO,
2010
Source: estimates from CONEVAL based on the MCS-ENIGH 2010.
In 2010, 10 entities had a Gini coefficient between 0.47 and 0.49, 11 entities had coefficients
between 0.41 and 0.47. The ones that had the lowest income concentration were Colima, Morelos,
Tlaxcala, Guanajuato and Tamaulipas.
In map 6.2 the Gini coefficient information per municipality is presented. Those that had the lowest
income concentration were 81 and had a Gini coefficient between 0.20 and 0.35. On the other hand,
the more unequal municipalities, that is, where the income was more concentrated were 392 with
coefficients between 0.45 and 0.60. There were also 62
Gini
coefficient
Total entities

136
Re
po
rt o
f P
ove
rty in
Me
xic
o 2
010
: Th
e C
ou
ntr
y, It
s Sta
tes
an
d Its
Mu
nic
ipa
litie
s. •
TH
E T
ER
RIT
OR
IAL
CO
NTE
XT
SPA
CE
municipalities with coefficients higher than 0.50 and are located in the following states: 12 in
Guerrero; eight in Chiapas; six in Oaxaca, Sonora and Veracruz; four in Jalisco and Puebla; three in
Durango and State of Mexico; two in Michoacán, and Chihuahua, Coahuila, Colima, Guanajuato,
Hidalgo, Morelos, San Luis Potosí and Zacatecas with one each.
MAP 6.2 GINI COEFFICIENT PER MUNICIPALITY, MEXICO,
2010
Source: estimates from CONEVAL based on the MCS-ENIGH 2010.
The municipalities with the highest income concentration, according to the Gini coefficient, were the
following: Armería, Colima (0.591); General Plutarco Elías Calles, Sonora (0.567); Zongolica,
Veracruz (0.558); Constancia del Rosario, Oaxaca (0.554); Yajalón, Chiapas (0.551); Carbó, Sonora
(0.550); Atlatlahucán, Morelos (0.550); Guachochi, Chihuahua (0.549); Altamirano, Chiapas (0.548),
and San Juan Yucuita, Oaxaca (0.547).
The municipalities that on the other hand had the lowest income concentration are located in Oaxaca:
Santiago Tepetlapa (0.286), San Juan Yatzona (0.307), Santo Domingo Tonaltepec (0.309), Santo
Domingo Tlatayápam (0.310), Santa Magdalena Jicotlán (0.311), San Antonio Acutla (0.311), San
Juan Evangelista Analco (0.314), San Mateo Tlapiltepec (0.315), San Juan Achiutla (0.317), and
Telchac Puerto, in Yucatán (0.324).
Gini
coefficient
Total municipalities

137
6.3 GEOGRAPHICAL DISTRIBUTION OF THE INCOME
RATIO
The income ratio between the people in extreme poverty and the non multidimensional poor and non
vulnerable population is an alternative way to study inequality; the broader this gap is, the greater will
the inequality be and there will be less conditions to generate social cohesion within the society.
In map 6.3 can be seen the income ratio distribution of the federal entities and the heterogeneity that
exists throughout the national territory. However, there seems to be a very close relationship between
the Gini coefficient and the income ratio, in this sense Chiapas, Zacatecas, Campeche, Oaxaca and
Veracruz have at the same time a high Gini coefficient (between 0.511 and 0.541) and the gap that
separates people in the extreme poverty group and those in the non multidimensional poor and non
vulnerable population is high, the former have between 7.5 and 8 cents for each peso the latter
possess.
MAP 6.3 INCOME RATIO PER FEDERAL ENTITY, MEXICO, 2010
Source: estimates from CONEVAL based on the MCS-ENIGH 2010.
Income
ratio
Total entities

138
Re
po
rt o
f P
ove
rty in
Me
xic
o 2
010
: Th
e C
ou
ntr
y, It
s Sta
tes
an
d Its
Mu
nic
ipa
litie
s. •
TH
E T
ER
RIT
OR
IAL
CO
NTE
XT
SPA
CE
Chiapas is a particular case since not only it is the entity with the lowest income level (1,353 pesos)
and the highest percentage of poor people in the country (78 percent), but it is also the one that
shows the greatest income concentration by having the highest Gini coefficient (0.541) and the
lowest income ratio (0.075); for each peso that the non multidimensional poor and non vulnerable
population had in 2010, the group of people in extreme poverty barely had 7.5 cents.
In map 6.3 can be seen that there are 13 entities whose income ratio was located between 8.5 and
10 cents for people in extreme poverty regarding each peso that the non multidimensional poor and
non vulnerable population had. Finally, in a third group there were the nine entities whose income
ratio was the highest, between 10 and 13 cents for each peso.
After analyzing these results, it can be concluded that the gap separating the income of people in
extreme poverty from people who are not poor or vulnerable is quite high, and that inequality in
income levels is accompanied by a high concentration of wealth in few people, especially in the
poorest entities.
On a municipal scale, the income ratio analysis shows that there are 151 municipalities for which this
indicator is not reported given that, according to the estimates, they do not have population living in
poverty or vulnerability. In addition, there is no population vulnerable due to income as well, since
most of its population is poor, with average incidences higher than 85 percent.
On the other hand, the municipalities of Pesqueria in Nuevo Leon (19041) and Guerrero in
Tamaulipas (28014), as reported by INEGI, do not have a sufficient number of observations in the
sample of the General Census of Population and Housing 2010 to generate accurate estimates. The
municipalities in black on map 6.4 are those which do not have an income ratio or do not have a
sufficient sample to generate a statistically significant estimate.
In map 6.4 we can see that 1,587 municipalities, that is, 64.6 percent of the total, had an income ratio
between 0.10 and 0.16. This means that for each peso the non multidimensional poor and non
vulnerable population had, the extremely poor people had between ten and sixteen cents.
In the first range 325 municipalities were located —13.2 percent of the total— which were the ones
with the broadest gap between the income of people in extreme poverty and the non
multidimensional poor and non vulnerable population, with a ratio ranging from 0.04 to 0.10. The
entities that provided the most municipalities to this range were Oaxaca with 57; Veracruz with 51;
Guerrero with 50; Chiapas with 43; Puebla with 31; San Luis Potosi with 14; the State of Mexico with
12 and Michoacán with 11. There were seventeen entities with less than ten municipalities in this
range.

139
MAP 6.4 INCOME RATIO PER MUNICIPALITY, MEXICO, 2010
Source: estimates from CONEVAL based on MCS-ENIGH 2010 and the sample of the General Census of Population and Housing 2010.
6.4 GEOGRAPHICAL DISTRIBUTION OF SOCIAL
POLARIZATION
Guerrero was the only polarized entity, according to the Marginalization Index per federal entity and
municipality 2010 (CONAPO, 2011), since 46.1 percent of its population lived in municipalities with
very high and high marginalization, and 38.1 percent of its population lived in municipalities with low
and very low marginalization; that is, the population living in the municipalities of this state was
concentrated in both poles.
On the other hand, no federal entity had a left or high marginalization pole and this meant that no
state had more than 70 percent of its population in municipalities with high or very high
marginalization.
Ranges
Total municipalities

140
Re
po
rt o
f P
ove
rty in
Me
xic
o 2
010
: Th
e C
ou
ntr
y, It
s Sta
tes
an
d Its
Mu
nic
ipa
litie
s. •
TH
E T
ER
RIT
OR
IAL
CO
NTE
XT
SPA
CE
MAP 6.5 SOCIAL POLARIZATION PER FEDERAL ENTITY,
MEXICO, 2010
Source: estimates from CONEVAL based on the Marginalization Index per federal entity and municipality 2010 of CONAPO.
In 18 entities more than 70 percent of its population lived in municipalities with low or very low
marginalization, which meant that social polarization was not too high. In this group, the northern
region of the country along with some western states, the center and the state of Quintana Roo can
be found.
6.5 GEOGRAPHICAL DISTRIBUTION OF SOCIAL
NETWORKS
The social networks perception index registers the easiness or difficulty that people have to obtain
support through their closest relationships in different hypothetical situations: ask somebody for an
amount of money that is earned in his or her household in a month, ask to be taken care of during
sickness, ask help to get a job, ask someone to go with you to the doctor, ask people to cooperate in
order to improve the neighborhood or locality, and according to the case, ask someone to help him or
her take care of the children at home.
Social
polarization
Total
entities
Polarized No pole Right pole
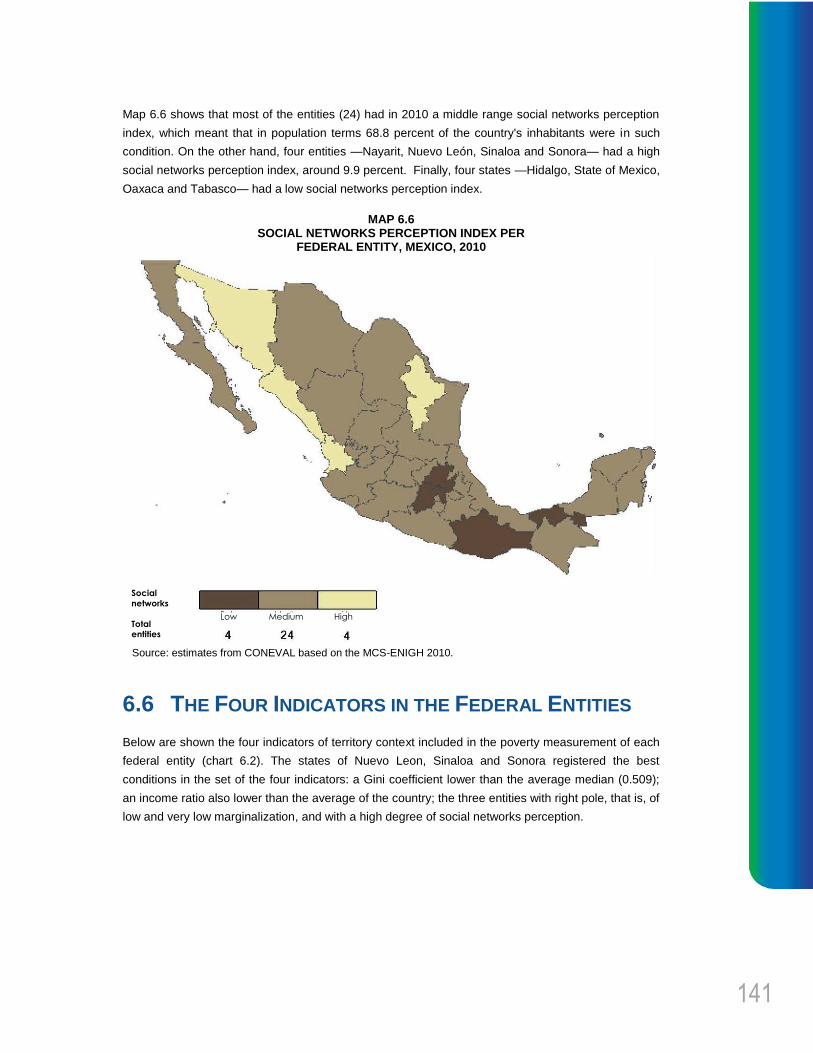
141
Map 6.6 shows that most of the entities (24) had in 2010 a middle range social networks perception
index, which meant that in population terms 68.8 percent of the country's inhabitants were in such
condition. On the other hand, four entities —Nayarit, Nuevo León, Sinaloa and Sonora— had a high
social networks perception index, around 9.9 percent. Finally, four states —Hidalgo, State of Mexico,
Oaxaca and Tabasco— had a low social networks perception index.
MAP 6.6 SOCIAL NETWORKS PERCEPTION INDEX PER
FEDERAL ENTITY, MEXICO, 2010
Source: estimates from CONEVAL based on the MCS-ENIGH 2010.
6.6 THE FOUR INDICATORS IN THE FEDERAL ENTITIES
Below are shown the four indicators of territory context included in the poverty measurement of each
federal entity (chart 6.2). The states of Nuevo Leon, Sinaloa and Sonora registered the best
conditions in the set of the four indicators: a Gini coefficient lower than the average median (0.509);
an income ratio also lower than the average of the country; the three entities with right pole, that is, of
low and very low marginalization, and with a high degree of social networks perception.
Social
networks
Total entities
Low Medium High

142
Re
po
rt o
f P
ove
rty in
Me
xic
o 2
010
: Th
e C
ou
ntr
y, It
s Sta
tes
an
d Its
Mu
nic
ipa
litie
s. •
TH
E T
ER
RIT
OR
IAL
CO
NTE
XT
SPA
CE
CHART 6.2
INDICATORS ASSOCIATED TO THE TERRITORY CONTEXT PER FEDERAL ENTITY, MEXICO
2010
Federal Entity Gini coefficient Income ratio1 Social polarization degree
2/3
Social networks perception index
4
National 0.509 0.08
Aguascalientes 0.507 0.09 Low marginalization pole Medium
Baja California 0.506 0.09 Low marginalization pole Medium
Baja California Sur 0.486 0.08 Low marginalization pole Medium
Campeche 0.513 0.08 No pole Medium
Coahuila 0.477 0.09 Low marginalization pole Medium
Colima 0.419 0.09 Low marginalization pole Medium
Chiapas 0.541 0.08 No pole Medium
Chihuahua 0.473 0.09 Low marginalization pole Medium
Federal District 0.517 0.09 Low marginalization pole Medium
Durango 0.469 0.11 Low marginalization pole Medium
Guanajuato 0.433 0.11 No pole Medium
Guerrero 0.514 0.08 Polarized Medium
Hidalgo 0.465 0.10 No pole Low
Jalisco 0.460 0.09 Low marginalization pole Medium
State of Mexico 0.468 0.11 Low marginalization pole Low
Michoacán 0.487 0.09 No pole Medium
Morelos 0.420 0.11 Low marginalization pole Medium
Nayarit 0.487 0.08 No pole High
Nuevo León 0.498 0.09 Low marginalization pole High
Oaxaca 0.511 0.08 No pole Low
Puebla 0.482 0.09 No pole Medium
Querétaro 0.487 0.09 Low marginalization pole Medium
Quintana Roo 0.475 0.08 Low marginalization pole Medium
San Luis Potosí 0.508 0.08 No pole Medium
Sinaloa 0.465 0.10 Low marginalization pole High
Sonora 0.479 0.09 Low marginalization pole High
Tabasco 0.478 0.10 No pole Low
Tamaulipas 0.450 0.11 Low marginalization pole Medium
Tlaxcala 0.425 0.13 Low marginalization pole Medium
Veracruz 0.534 0.08 No pole Medium
Yucatán 0.462 0.11 No pole Medium
Zacatecas 0.521 0.08 No pole Medium
Notes:
1 It is defined as the proportion of the total per capita current income of the population living in extreme poverty in relation to the total per
capita current income of the non multidimensional poor and non vulnerable population.
2 It is defined as the equal distribution of population into two poles of the marginalization scale in a specific space.
3 The Marginalization Index by federal entity and municipality of 2010 from CONAPO is used for these calculations.
4 It is defined as the degree of perception of easiness or difficulty that people aged 12 years old or more bear regarding to obtaining help of
social networks in hypothetical situations.
Source: estimates from CONEVAL based on the MCS-ENIGH 2010.

143
On the other hand, Colima, Morelos and Tlaxcala had the lowest values of the Gini coefficient; an
income ratio lower than the national median, a low degree of polarization and a medium degree of
social networks perception.
Guerrero was classified as polarized, with a Gini coefficient higher than the national median and with
a medium degree of social networks perception.
6.7 POVERTY AND SOCIAL COHESION
Starting from the perception that any practice excluding or marginalizing broad population groups
may put the social fabric at risk (Rubalcava, 2001), this report presents a classification of the entities
in high or low social cohesion through the use of the social polarization indicator.
According to the Marginalization Index per federal entity and municipality of 2010 prepared by the
CONAPO, and based on the social polarization criteria (CONEVAL, 2010: 113,114), only Guerrero
had, in 2010, low social cohesion. 3.0 percent of the population, that is, 3.39 million people lived in
this entity. 109.17 million people (97 percent of the total population) lived in the 31 entities classified
with high social cohesion. It is important to point out that no entity was classified with a left pole or of
high marginalization.
CHART 6.3
PERCENTAGE DISTRIBUTION AND NUMBER OF PEOPLE IN FEDERAL ENTITIES WITH HIGH
AND LOW SOCIAL COHESION, MEXICO, 2010
Social cohesion degree1
Number of entities People
federal Percentage Million
High social cohesion 31 97.0 109.17
Low social cohesion 1 3.0 3.39
Total 32 100.0 112.56
1 The states with right pole (low marginalization) or without pole are considered of high social cohesion, and the polarized
states or with a left pole (high marginalization) are considered of low social cohesion.
Source: estimates from CONEVAL based on the MCS-ENIGH 2010 and the Marginalization Index per federal entity and municipality 2010 of CONAPO.
144
Re
po
rt o
f P
ove
rty in
Me
xic
o 2
010
: Th
e C
ou
ntr
y, It
s Sta
tes
an
d Its
Mu
nic
ipa
litie
s. •
TH
E T
ER
RIT
OR
IAL
CO
NTE
XT
SPA
CE
The states with right pole (low marginalization) or without pole are considered of high social
cohesion, and the polarized states or with a left pole (high marginalization) are considered of low
social cohesion.
Finally, according to the Marginalization Index per locality of 2010 (CONAPO, 2012) it was possible
to locate the position of each municipality of the country according to the degree of social polarization
and thus estimate the social cohesion per municipality. The results were as follows: there were one
hundred polarized municipalities, 1,164 with a high marginalization pole, 518 with a low
marginalization pole and 674 without pole.
The municipalities with high social cohesion (right pole or without pole) were 1,192 and represented
48.5 percent of the country's total and those that had low social cohesion (left pole or polarized) were
1,264, that is, 51.5 percent of the total.

145

146
References
Alkire, Sabina y James, Foster. (2007).Counting and Multidimensional Poverty Measurement. OPHI
Working Papers Series, Oxford Poverty & Human Development Iniative (OPHI). Oxford, (OPHI
Working Paper, 7).
Aparicio, Ricardo, Villarespe, Verónica y Urzúa, Carlos M. (Coords.) (2009). Pobreza en México:
magnitudes y perfiles, México, D.F. CONEVAL, UNAM, ITESM.
Aragon, Y., Casanova, S., Chambers, R. y Leconte, E. (2005). “Conditional Ordering Using Non-
parametric Expectiles”. Journal of Official Statistics, 21. (pp. 617-633).
Banerjee, S., Gelfand, A. E. y Carlin, B. P. (2003). Hierarchical Modeling and Analysis for Spatial
Data. New York: Chapman & Hall/CRC.
Battesse, G.E., Harter, R,M., y Fuller, W.A. (1988). “An Error Component Model for Prediction of
County Crop Areas Using Survey and Satellite Data”. Journal of the American Statistical As-
sociation, 83. (pp. 28-36).
Bernardo, J.M. y Smith, A.F.M. (2000). Bayesian Theory. New York: Wiley.
Breckling, J. y Chambers, R. (1988). “M-quantiles”. Biometrika, 75, (pp. 761-771).
Bowman, A.W., Hall, P. y Prvan, T. (1998). “Bandwidth Selection for the Smoothing of Distribu-tion
Functions”. Biometrika, 85, (pp. 799-808).
Brunsdon, C.F., Fotheringham, A.S. y Charlton, M. (1996). “Geographically Weighted Regres-sion-A
Method for Exploring Spatial Non-Stationarity.” Geographical Analysis, 28. (pp. 281- 298).
Chambers, R. (1986). “Outlier Robust Finite Population Estimation”. Journal of the American
Statistical Association, 81. (pp. 1063-1069).
Chambers, R., Chandra, H. y Tzavidis, N. (2010). “On Robust Mean Squared Error Estimation for
Linear Predictors for Domains”. [Under review, Invited to review and resubmit].
Chambers, R., Dorfman, A.H. y Hall, P. (1992). “Properties of Estimators of the Finite Population
Distribution Function”. Biometrika, 79. (pp. 577-582).

147
Chambers, R., Dorfman, A.H. y Wehrly, T.E. (1993). “Bias Robust Estimation in Finite Populations
Using Nonparametric Calibration ”. Journal of the American Statistical Association, 88. (pp. 268-277).
Chambers, R. y Dunstan, R. (1986). Estimating Distribution Functions From Survey Data. Biometrika,
73. (pp. 597-604).
Chambers, R. y Tzavidis, N. (2006). “M-quantile Models for Small Area Estimation”. Biometrika, 93.
(pp. 255-268).
Chantala, K. (2001). Using STATA To Analyze Data from a Sample Survey. UNC Chapel Hill.
Carolina Population Center.
CONAPO. (2011). Índice de Marginación por entidad federativa y municipio 2010. México, CONAPO.
. (2012). Índice de Marginación por localidad 2010. México, CONAPO.
CONEVAL. (2007). Los mapas de Pobreza en México. Anexo técnico metodológico. México,
CONEVAL.
. (2010). Metodología para la medición multidimensional de la pobreza en
México. México, CONEVAL.
Datta, G.S., Fay, R.E. y Ghosh, M. (1991). “Hierarchical and Empirical Bayes Multivariate Analy-sis in
Small Area Estimation”. Proceedings of Bureau of the Census 1991 Annual Research Conference.
U.S. Bureau of the Census. Washington, DC. (pp. 63-79).
Deville, J. C. y C. E. Särndal (1992). “Calibration Estimators in Survey Sampling”. Journal of the
American Statistical Assosiation, (Vol. 87), No. 418. (pp. 376-382).
Diario Oficial de la Federación. (25 de junio de 2002). Ley de los Derechos de las Personas Adultas
Mayores. México. Consultado el 7 de septiembre 2010 en http://www.diputados.
gob.mx/LeyesBiblio/pdf/245.pdf
. (20 de enero de 2004). Ley General de Desarrollo Social. México. Consultado
el 20 de marzo 2007 en http://www.diputados.gob.mx/LeyesBiblio/pdf/264.pdf

148
. (17 de enero de 2006), Ley Federal del Trabajo. México. Consultado el 27 de
julio 2007 en http://www.diputados.gob.mx/LeyesBiblio/pdf/125.pdf
. (18 de enero de 2006). Reglamento de la Ley General de Desarrollo Social.
México. Consultado el 30 de julio 2007 en de http://www.diputados.gob.mx/Le-
yesBiblio/regley/Reg_LGDS.pdf
___________________. (27 de junio de 2006). Ley de Vivienda. México. Consultado el 18 de junio
2008 en http://www.diputados.gob.mx/LeyesBiblio/doc/LViv.doc
. (11 de agosto de 2006). Ley del Seguro Social. México. Consultado el 2 de
marzo 2007 en http://www.diputados.gob.mx/LeyesBiblio/pdf/92.pdf
. (02 de enero de 2007). Ley General de Educación. México. Consultado el18
de junio 2008 en http://www.diputados.gob.mx/LeyesBiblio/doc/137.doc
. (19 de junio de 2007). Ley General de Salud. México. Consultado el 18 de
julio 2007 en http://www.diputados.gob.mx/LeyesBiblio/pdf/142.pdf
. (02 de agosto de 2007). Constitución Política de los Estados Unidos
Mexicanos. México. Consultado el 27 de julio 2007 en http://www.diputados.gob.mx/
LeyesBiblio/doc/1.doc
. (16 de junio de 2010). Lineamientos y criterios generales para la definición,
identificación y medición de la pobreza. México. Consultado el 22 de noviembre 2011 en
http://dof.gob.mx/nota_detalle.php?codigo=5146940&fecha=16/06/2010
Dijkstra, E. W. (1959). “A Note on two Problems in Connexion with Graphs”. Numerische Mathematik,
1. (pp. 269–271).
Duan, N. (1983). “Smearing Estimate: A Nonparametric Retransformation Method”. Journal of the
American Statistical Association, 78. (pp. 605-610).
Elbers, Chris, J.O. Lanjouw, y P. Lanjouw. (2003). “Micro-level Estimation of Poverty and Inequality”.
Econometrica, ( Vol. 71), No. 1. (pp. 355-364).
Fay, R.E. y Herriot, R.A. (1979). “Estimation of Income from Small Places: an Application of James-
Stein Procedures to Census data”. Journal of the American Statistical Association, 74. (pp. 269-277).
Foster, James, Joel Greer y Erik Thorbecke. (1984). “A Class of Decomposable Poverty Measures”.
Econometrica, (vol. 52), No. 3. (pp. 761-766).

149
Ghosh, M., Natarajan, K., Stroud, T.W.F., y Carlin, B.P. (1998). “Generalized Linear Models for Small
Area Estimation”. Journal of the American Statistical Association, 93. (pp. 273-281).
Ghosh, M., Natarajan, K., Waller, L.A., y Kim, D. (1999). “Hierarchical bayes GLMs for the Analysis of
Spatial Data: An Application to Disease Mapping”. Journal of Statistical Planning and Inference, 75.
(pp. 305-318).
Ghosh, M. y Rao, J.N.K. (1994). “Small area Estimation : an Appraisal ( with discussion)”. Statistical
Science, 9. (pp. 65-93).
González-Manteiga, W., Lombardía, M.J., Molina, I., Morales, D., and Santamaría, L. (2008).
“Bootstrap Mean Square Error of a Small-area EBLUP”. Journal of Statistical Computation and
Simulation, 78. (pp. 443-462).
Gutiérrez-Peña, E. (1997). Métodos computacionales en la inferencia Bayesiana. Monografía IIMAS-
UNAM, (Vol. 6), No. 15.
Hagenaars, Jacques y Allan McCutcheon. (2002). Applied Latent Class Analysis. Reino Unido,
Cambridge University Press.
Instituto Nacional de Estadística y Geografía (INEGI). (2007). Encuesta Nacional de Ingresos y
Gastos de los Hogares (ENIGH) 2006. México.
. (2009). Encuesta Nacional de Ingresos y Gastos de los Hogares (ENIGH)
2008. México.
. (2011a). Encuesta Nacional de Ingresos y Gastos de los Hogares (ENIGH)
2010. México.
. (2011b). Censo de Población y Vivienda 2010. México.
Instituto Nacional de Estadística y Geografía y Consejo Nacional de Evaluación de la Política de
Desarrollo Social (INEGI-CONEVAL). (2008). Módulo de Condiciones Socioeconómicas – Encuesta
Nacional de Ingresos y Gastos de los Hogares (MCS-ENIGH). México.
. (2010), Módulo de Condiciones Socioeconómicas – Encuesta Nacional de
Ingresos y Gastos de los Hogares (MCS-ENIGH). México.
Kokic, P., Chambers, R., Breckling, J. y Beare, S. (1997). “A Measure of Production Performance”.
Journal of Business and Economic Statistics, 15. (pp. 445-451).

150
Koenker, R. (2005). Quantile Regression. New York: Cambridge University Press.
Koenker, R. y Bassett, G. (1978). “Regression quantiles”. Econometrica, 46. (pp. 33-50).
Koenker, R. y D’OREY, V. (1987). “Computing Regression Quantiles”. Journal of the Royal Statistical
Society Series C, 36. (pp. 383-393).
Li, Q. y Racine, J.S. (2007). Nonparametric Econometrics: Theory and Practice. Princeton University
Press.
Lombardia M.J., Gonzalez-Manteiga, W. y Prada-Sanchez, J.M. (2003). “Bootstrapping the Dor-
fman-Hall-Chambers-Dunstan Estimator of a Finite Population Distribution Function”. Journal of
Nonparametric Statistics, 16,.(pp. 63-90).
Molina, I. y Rao, J.N.K. (2010). “Small Area Estimation of Poverty Indicators”. To Appear in the
Canadian Journal of Statistics.
Muthén, Linda y Bengt, Muthén. (2010). Mplus. Statistical Analysis With Latent Variables. User’s
Guide. Estados Unidos, Muthén & Muthén.
Nieto, Luis Enrique (2011). “Método bayesiano”. Delfino Vargas y colaboradores. Metodología de
ajustes e imputación de indicadores de la pobreza por ingreso en áreas pequeñas. México. El
Colegio de México y CONEVAL, mimeo.
Pfefferman, D. (2002). “Small Area Estimation. New Developments and Directions”. International
Statistical Review. 79. (pp. 125-143).
Prasad, N.G.N y Rao, J.N.K. (1990). “The Estimation of the Mean Squared Error of Small Area
Estimators”. Journal of the American Statistical Association, 85. (pp. 163-171).
Pratesi, M., Tzavidis, N., Molina, I., Salvati, N., Marchetti, S., Giusti, C. y Domingo, M. (2010).
“Recent Advances in Model-based Small Area Estimation of Poverty Indicators”.Working Paper.
Programa de las Naciones Unidas para el Desarrollo (PNUD-ONU). (2010). Informe sobre de-sarrollo
humano 2010. La verdadera riqueza de las naciones: Caminos al desarrollo. Nueva York .ONU.
Rao, J. N. K. (2003). Small Area Estimation. Estados Unidos. John Wiley & Sons, Inc.
Rao, J.N.K., Kovar, J.G. y Mantel, H.J. (1990). “On estimating distribution functions and quan-tiles
from survey data using auxiliary information”. Biometrika, 77. (pp. 365-375).

151
Raudenbusch, Stephen W. y Bryk, Anthony S. (2002). Hierarchical Linear Models. Applications and
Data Analysis Methods. Second Edition. Estados Unidos. Sage Publications, Inc.
Raudenbusch, Stephen, et al. (2011). HLM: Hierarchical Linear and Nonlinear Modeling. Es-tados
Unidos. Scientific Software International, Inc.
Richardson, A.M. (1997). “Bounded Influence Estimation in the Mixed Linear Model”. Journal of the
American Statistical Association, 92. (pp. 154-161).
Richardson, A.M. y Welsh, A.H. (1995). “Robust Estimation in the Mixed Linear Model”. Biometrics,
51. (pp. 1429-1439).
Rowe, D. B. (2003). Multivariate Bayesian Statistics. Ney York. Chapman and Hall.
Royall, R.M. and Cumberland, W.G. (1978). “Variance Estimation in Finite Population Sampling”.
Journal of the American Statistical Association, 73. (pp. 351-358).
Rubalcava, Rosa María. (2001). “Marginación, hogares y cohesión social”. De Maria y Campos M. y
Georgina Sánchez (Eds.). ¿Estamos unidos mexicanos? Los límites de la cohesión social en México.
México. Planeta.
Särndal, C. E., Swensson, B. y Wretman, J. (2003). Model Assited Survey Sampling. Estados
Unidos. Springer-Verlag.
Salvati, N., Tzavidis, N., Chambers, R. y Pratesi, M. (2010). “M-quantile Geographically Weight-ed
Regression for Small Area Estimation”. [Invited to review and resubmit].
Sarndal, C.E., Swenson, B., y Wretman, J. (1997). Model Assisted Survey Sampling. Springer.
Sen, Amartya, (1976). “Poverty: An Ordinal Approach to Measurement”. Econometrica, (vol. 44),
No.2. (pp.219-231).
Sharon, L. (1999). Muestreo Diseño y Análisis. International Thomson Editores.
Spector, Phil. (2008). Data Manipulation with R. Estados Unidos. Springer Sciencie+Business Media,
LLC.
Stata Press .(2011). Stata Programming Reference Manual. Release 12. Estados Unidos. Stata
Press.
Tello, Carlos. (2010). Sobre la desigualdad en México. México. Facultad de Economía, UNAM.

152
Tzavidis, Nikolaos. (2011). “Método mejor predictor empírico”. Delfino Vargas y colaboradores.
Metodología de ajustes e imputación de indicadores de la pobreza por ingreso en áreas pequeñas.
México. El Colegio de México y CONEVAL. Mimeo.
Vargas, Delfino y colaboradores. (2011). “Calibración de indicadores socioeconómicos”. Delfino
Vargas y colaboradores. Metodología de ajustes e imputación de indicadores de la pobreza por
ingreso en áreas pequeñas. México. El Colegio de México y CONEVAL. Mimeo.
Vilma, N. Small area estimation in practice. Vilnius Gediminas Technical University. Statistics
Lithuania, Lithuania e-mail: [email protected]
Wang, S. y Dorfman, A.H. (1996). “A New Estimator of the Finite Population Distribution Func-tion”.
Biometrika, 83, (pp. 639-652).
Welsh, A.H. y Ronchetti, E. (1998). “Bias-calibrated Estimation from Sample Surveys Contain-ing
Outliers”. Journal of the Royal Statistical Society Series B, 60. (pp. 413-428).
You, Y. y Rao, J.N.K. (2002). “A pseudo-Empirical Best Linear Unbiased Prediction Approach to
Small Area Estimation Using Survey Weights”. Canadian Journal of Statistics, 30. (pp. 431-439).

153
List of Charts, Figures, Graphs and Maps
Chapter 1
CHARTS
1.1 Percentage and number of people in the poverty indicators, Mexico, 2010
1.2 Percentage, number of people and average deprivations in the poverty indicators in the
indigenous-language speaking population, Mexico, 2010
1.3 Percentage, number of people and average deprivations in the poverty indicators in the
population living in rural and urban areas, Mexico 2010
1.4 Distribution of population according to their poverty and vulnerability conditions and non
multidimensional poor and non vulnerable population, by federal entity, Mexico, 2010
1.5 Number of people living in poverty, vulnerable and vulnerable, and non multidimensional
poor and non vulnerable people per federal entity, Mexico, 2010
1.6 Depth of poverty in the economic wellbeing space at national scale, by number of social
deprivations, Mexico, 2010
1.7 Depth of poverty in the social rights space: average number of social deprivations at
national scale, per selected population groups, Mexico, 2010
1.8 Depth of poverty in the social rights space: average number of social deprivations of the
population living in poverty, per federal entity, Mexico, 2010

154
GRAPHS
1.1 Population distribution according to the poverty status, Mexico, 2010
1.2 Number of people according to the poverty status, Mexico, 2010
1.3 Percentage distribution of population per number of social deprivations, Mexico, 2010
1.4 Contribution of each social deprivation indicator to the intensity of poverty per federal
entity, Mexico, 2010
MAPS
1.1 Percentage of population living in poverty per federal entity, Mexico, 2010
1.2 Percentage of population living in extreme poverty per federal entity, Mexico, 2010
1.3 Percentage of population living in moderate poverty per federal entity, Mexico, 2010
1.4 Percentage of vulnerable population per federal entity, Mexico, 2010
1.5 Intensity of poverty per federal entity, Mexico, 2010
Chapter 2
CHARTS
2.1 Percentage, number of people and average deprivations in the poverty indicators, Mexico,
2008-2010
2.2 Percentage, number of people and average deprivations in the poverty indicators in the
population living in rural or urban areas, Mexico 2008-2010
2.3 Percentage, number of people and average deprivations in the poverty indicators in the
population under 18 and aged 18 or over, Mexico, 2008-2010

155
GRAPHS
2.1 Total monthly per capita current income, per decile of income, Mexico, 2008-2010 (price of
August 2010)
MAPS
2.1 Changes in the percentage of population in poverty per federal entity, Mexico, 2008-2010
2.2 Changes in the percentage of vulnerable population due to social deprivations per federal
entity, Mexico, 2008-2010
2.3 Changes in the percentage of vulnerable population due to income per federal entity,
Mexico, 2008-2010
2.4 Percentage of population with deprivation due to access to social security per federal
entity, Mexico, 2010
2.5 Percentage of population with deprivation due to access to health services per federal
entity, Mexico, 2010
2.6 Percentage of population with deprivation due to access to food per federal entity, Mexico,
2010
2.7 Percentage of population with deprivation due to educational gap per federal entity,
Mexico, 2010
2.8 Percentage of population with deprivation due to access to basic services in the dwelling
per federal entity, Mexico, 2010
2.9 Percentage of population with deprivation in the quality and spaces of the dwelling per
federal entity, Mexico, 2010
Chapter 3
CHART
3.1 Distribution of municipalities according to the percentage of people living in poverty in
Mexico, 2010

156
MAPS
3.1 Percentage of population living in poverty by municipality, Mexico, 2010
3.2 Municipalities with fifty percent or more of their population living in poverty, Mexico, 2010
3.3 Percentage of population living in poverty in rural and urban municipalities, Mexico, 2010
3.4 Percentage of population living in extreme poverty by municipality, Mexico, 2010
3.5 Municipalities with 25 percent or more of their population living in extreme poverty, Mexico,
2010
3.6 Percentage of population living in moderate poverty by municipality, Mexico, 2010
3.7 Percentage of vulnerable population by municipality, Mexico, 2010
3.8 Municipalities where over half the people living in poverty are concentrated, Mexico, 2010
3.9 Number of average deprivations of the population living in poverty by municipality, Mexico,
2010
3.10 Number of average deprivations of the population living in extreme poverty by municipality,
Mexico, 2010
3.11 Intensity of poverty at municipal level, Mexico, 2010
Chapter 4
CHARTS
4.1 Distribution of municipalities according to the percentage of people per type of social
deprivation, Mexico, 2010
4.2 Percentage and number of people with deprivation due to educational gap per federal
entity, Mexico, 2010

157
4.3 Percentage and number of people, according to the components of the educational gap
indicator, Mexico, 2010
4.4 Percentage and number of people with deprivation due to access to health services per
federal entity, Mexico, 2010
4.5 Percentage and number of people, according to the components of the indicator of access
to health services, Mexico, 2010
4.6 Percentage and number of people with deprivation due to access to social security per
federal entity, Mexico, 2010
4.7 Percentage and number of people, according to the components of the indicator of access
to social security, Mexico, 2010
4.8 Percentage and number of people with deprivation due to quality and spaces of the
dwelling per federal entity, Mexico, 2010
4.9 Percentage and number of people, according to the components of the indicator of quality
and spaces of the dwelling, Mexico, 2010
4.10 Percentage and number of people with deprivation due to access to basic services in the
dwelling per federal entity, Mexico, 2010
4.11 Percentage and number of people, according to the components of the indicator of basic
services in the dwelling, Mexico, 2010
4.12 Percentage and number of people deprived due to lack of access to food per federal
entity, Mexico, 2010
4.13 Percentage and number of people according to their location, in relation to the Mexican
Food Insecurity Scale, Mexico, 2010
GRAPHS
4.1 Components of the indicator for the population with deprivation due to quality and spaces
of the dwelling, Mexico, 2010
4.2 Components of the indicator for the population with deprivation due to access to basic
services in the dwelling, Mexico, 2010

158
MAPS
4.1 Percentage of population with deprivation due to educational gap per federal entity,
Mexico, 2010
4.2 Percentage of population with deprivation due to educational gap by municipality, Mexico,
2010
4.3 Percentage of population with deprivation due to access to health services per federal
entity, Mexico, 2010
4.4 Percentage of population with deprivation due to access to health services by municipality,
Mexico, 2010
4.5 Percentage of population with deprivation due to access to social security per federal
entity, Mexico, 2010
4.6 Percentage of population with deprivation due to access to social security by municipality,
Mexico, 2010
4.7 Percentage of population with deprivation due to quality and spaces of the dwelling per
federal entity, Mexico, 2010
4.8 Percentage of population with deprivation due to quality and spaces of the dwelling per
municipality, Mexico, 2010
4.9 Percentage of population with deprivation due to access to basic services in the dwelling
per federal entity, Mexico, 2010
4.10 Percentage of population with deprivation due to access to basic services in the dwelling
by municipality, Mexico, 2010
4.11 Percentage of population with deprivation due to access to food per federal entity, Mexico,
2010
4.12 Percentage of population with deprivation due to access to food per municipality, Mexico,
2010

159
Chapter 5
CHARTS
5.1 National rural and urban total monthly per capita current income, Mexico, 2010
5.2 Total monthly per capita current income by decile, Mexico, 2010
5.3 Total monthly per capita current income according to poverty or vulnerability condition,
Mexico, 2010
5.4 Total monthly per capita current income received from transfers, according to income
deciles, Mexico, 2010
5.5 Total monthly per capita current income per sex, Mexico, 2010
5.6 Total monthly per capita current income of the indigenous-language speaking population,
Mexico, 2010
GRAPHS
5.1 Total monthly per capita current income according to poverty or vulnerability condition and
place of residence, Mexico, 2010
5.2 Effects of monetary transfers and remittances on the distribution of total monthly per capita
current income for the population under the wellbeing lines, Mexico, 2010
MAPS
5.1 Total monthly per capita current income by federal entity, Mexico, 2010
5.2 Total monthly per capita current income by municipality, Mexico, 2010

160
Chapter 6
CHART
6.1 Indicators associated to the territory context, Mexico, 2010
6.2 Indicators associated to the territory context per federal entity, Mexico, 2010
6.3 Percentage distribution and number of people in federal entities with high and low social
cohesion, Mexico, 2010
MAPS
6.1 Gini coefficient per federal entity, Mexico, 2010
6.2 Gini coefficient per municipality, Mexico, 2010
6.3 Income ratio per federal entity, Mexico, 2010
6.4 Income ratio per municipality, Mexico, 2010
6.5 Social polarization per federal entity, Mexico, 2010
6.6 Social networks perception index per federal entity, Mexico, 2010

161
Statistical Annex
At CONEVAL's website (www.coneval.gob.mx) you can check the statistical annex that contains the
information of charts, graphs and maps of the six chapters of the report.

162

163

164
The printing and binding of this work was completed at the workshops of
Impresora y Encuadernadora Progreso S.A. de C.V. (IEPSA), Calz. San
Lorenzo 244, Col. Paraje San Juan, Mexico, Federal District, 09830 in
October, 2012 with a print run of 500 copies


National Council for the Evaluation of
Social Development Policy
National Council for the Evaluation of Social Development Policy Blvd. Adolfo López Mateos 160,
Col. San Ángel Inn, Del. Álvaro Obregón, C.P. 01060 Mexico, Federal District
www.coneval.gob.mx Twitter: @coneval
Facebook: Coneval
Youtube: conevalvideo
Related Documents