Intra-industry Trade Group 23: Nikita Pušņakovs Anete Vabule Ilgvars Nātans Krauja Liina Karlson International Economics Stockholm School of Economics in Riga Riga, September 2009

Welcome message from author
This document is posted to help you gain knowledge. Please leave a comment to let me know what you think about it! Share it to your friends and learn new things together.
Transcript

8/8/2019 Report Final Ik-2
http://slidepdf.com/reader/full/report-final-ik-2 1/13
Intra-industryTrade
Group 23:
Nikita Pušņakovs
Anete Vabule
Ilgvars Nātans Krauja
Liina Karlson
International Economics
Stockholm School of Economics in Riga
Riga, September 2009
8/8/2019 Report Final Ik-2
http://slidepdf.com/reader/full/report-final-ik-2 2/13
Table of ContentsTable of Contents.................................................................................................................2
Introduction..........................................................................................................................2
Methodology........................................................................................................................2
Background information......................................................................................................4
United Kingdom ..............................................................................................................4
Romania...........................................................................................................................5
Gruber – Lloyd indexes.......................................................................................................6
Analysis................................................................................................................................9
United Kingdom...............................................................................................................9
Romania.........................................................................................................................10
Conclusions........................................................................................................................13
...........................................................................................................................................13
IntroductionGeneral motives of a researcher, who is studying intra-industry trade topic, is to
find out what are the industries, where country imports and exports similar goods. In our
report we will also try to find out such industries, by using as a measurement Grubel-
Lloyd index. Moreover, taking United Kingdom and Romania as countries on which to base our analyses, we will try to find out what causes changes in GL index in these two
different economies. As UK and Romania economies are very different, one having a
traditional EU economy, and second being in a transition period for years already, weexpect that the reasons for changes in GL index for UK and Romania should be different.
MethodologyIn order to answer our research question, we went through several steps and
during each step we used various ways for obtaining information.
In the beginning, we gathered information about the intra-industry trade and itsmeasurements from the study-book ‘International Economics. Trade & Policy’ by
P.Krugman and M.Obstfeld and supplementary articles on intra-industry trade to get a
better insight of what intra-industry trade is about.
Secondly, we gathered data about external trade for both UK and Romania from
the Eurostat database, External Trade section. From the values of imports and exports wecalculated the GL index for each group, at the 2-digit level of desegregation. We also
calculated the average index for each big industry. In addition, we calculated the changesof the index over the time period of 1999-2008.
Thirdly, we narrowed our study to the top three most fluctuating product groups in
each country based on our aggregations from data of Eurostat. Then, we gatheredempirical data for each country to understand the two economies, changes in their trade

8/8/2019 Report Final Ik-2
http://slidepdf.com/reader/full/report-final-ik-2 3/13
in 1999, 2004, 2008 and the trading pattern in general. We used different internet
resources for this purpose.
To draw conclusions, we used articles of Journal of International Economics andEconomic Journal as well as information from the book by Sophia Davidova and
Kenneth J. Thomson ‘Romanian agriculture and transition toward the EU’, together with
various governmental websites.

8/8/2019 Report Final Ik-2
http://slidepdf.com/reader/full/report-final-ik-2 4/13
Background information
United Kingdom
On May 1st 1707 Kingdom of England and Kingdom of Scotland were united
under the name of United Kingdom of Great Britain. Till nowadays it has been
developing as one of the world’s leading economies. During three centuries, UK wentthrough revolutions, depressions, crises and consequences of World Wars, which were
the reasons for economic changes inside the country. In the early 18th century agrarian
period was transformed to industrial, in the 19th century into financial capitalism. The
economy of Great Britain has seen many shocks during the years. After recession, which
occurred between 1991 and 1992, UK economy finally had a period of continuous
economic growth, which lasted for around 16 years. From 1999 to 2008 average imports
to United Kingdom were always greater than exports.
From year 1999 all economic parameters were increasing until 2003, when
imports and exports had a little drop, as well as UK’s GDP. However, the percentage
values started to decrease already from 2000. They recovered in 2003, and were growing
until 2006, when they reached their highest levels, as it was a peak of the economy
development. After that, imports, exports, and GDP of the country started to fall.
Graph 1 UK imports & exports (Eurostat)
In the 21st century, from 2000 to early 2008, UK had consistent growth rates of
between 2% and 3%, while inflation rate was at around 2%. Until November 2008,exchange rate against Euro was on the steady level of 1.45 euro per 1 pound. However
Credit crunch lead pound to depreciate against euro and at the end of the year it was
equal to 1.04 euro.

8/8/2019 Report Final Ik-2
http://slidepdf.com/reader/full/report-final-ik-2 5/13
Romania
Romania is a 22 million people populated republic in South-East Europe. The country
borders with Black Sea, Bulgaria, Hungary, Moldova, Serbia and Ukraine and its natural
resources are petroleum, timber, natural gas, coal, iron ore, salt, arable land, hydropower
(www.cia.gov). Since 2004 Romania is a member state of NATO and since 2007 - a member
state of the European
Union. These two
factors have
contributed to the
development of
Romania as it could
be presented by
annual growth rates
on foreign direct
investments. You can
see how FDI has
grown three times inthe year Romania
joined NATO and how
it continued rising
towards joining the
EU. However,
Romania is a different
type of economy as it
used to be under economical and political control of USSR until 1989. During the past 20 years it
has been in a transition progress.
Graph 2 Annual GDP Growth (current prices) and Romania NetFDI
8/8/2019 Report Final Ik-2
http://slidepdf.com/reader/full/report-final-ik-2 6/13
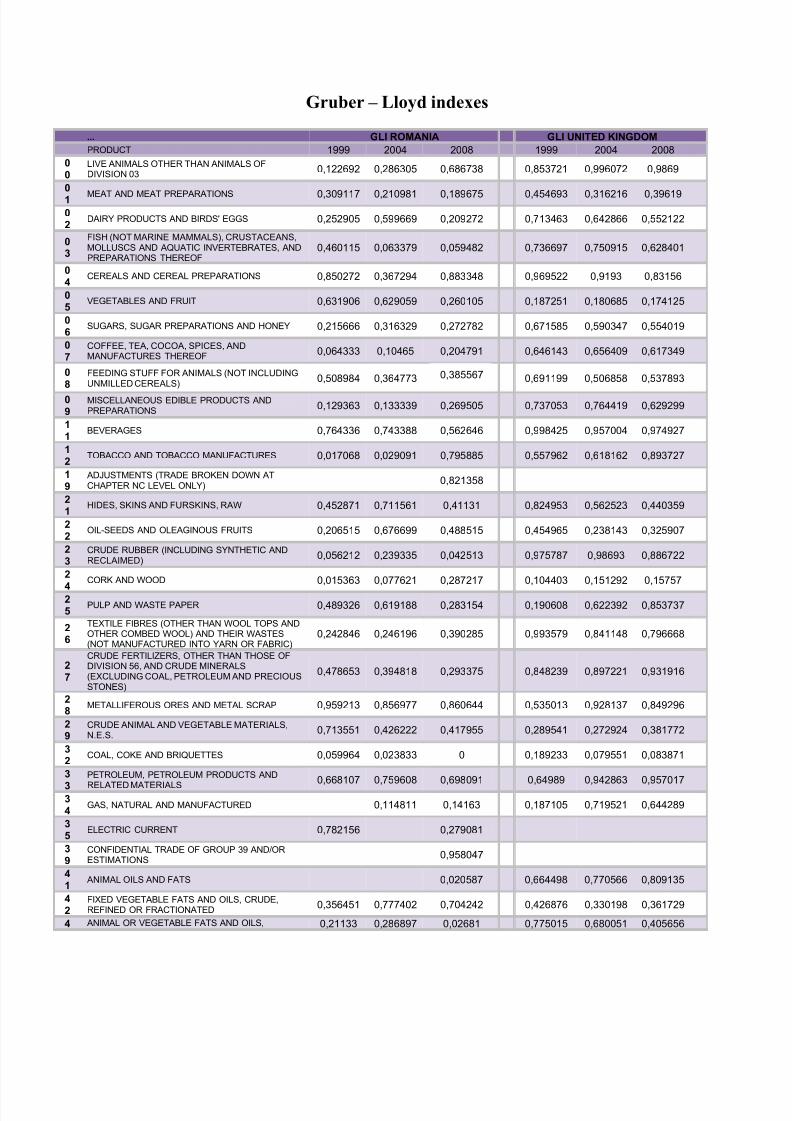
Gruber – Lloyd indexes
... GLI ROMANIA GLI UNITED KINGDOM
PRODUCT 1999 2004 2008 1999 2004 2008
0
0
LIVE ANIMALS OTHER THAN ANIMALS OFDIVISION 03
0,122692 0,286305 0,686738 0,853721 0,996072 0,9869
0
1 MEAT AND MEAT PREPARATIONS 0,309117 0,210981 0,189675 0,454693 0,316216 0,39619
0
2DAIRY PRODUCTS AND BIRDS' EGGS 0,252905 0,599669 0,209272 0,713463 0,642866 0,552122
0
3
FISH (NOT MARINE MAMMALS), CRUSTACEANS,MOLLUSCS AND AQUATIC INVERTEBRATES, ANDPREPARATIONS THEREOF
0,460115 0,063379 0,059482 0,736697 0,750915 0,628401
0
4CEREALS AND CEREAL PREPARATIONS 0,850272 0,367294 0,883348 0,969522 0,9193 0,83156
0
5VEGETABLES AND FRUIT 0,631906 0,629059 0,260105 0,187251 0,180685 0,174125
0
6SUGARS, SUGAR PREPARATIONS AND HONEY 0,215666 0,316329 0,272782 0,671585 0,590347 0,554019
0
7
COFFEE, TEA, COCOA, SPICES, ANDMANUFACTURES THEREOF
0,064333 0,10465 0,204791 0,646143 0,656409 0,617349
0
8
FEEDING STUFF FOR ANIMALS (NOT INCLUDINGUNMILLED CEREALS)
0,508984 0,364773 0,691199 0,506858 0,537893
0
9
MISCELLANEOUS EDIBLE PRODUCTS ANDPREPARATIONS
0,129363 0,133339 0,269505 0,737053 0,764419 0,629299
1
1BEVERAGES 0,764336 0,743388 0,562646 0,998425 0,957004 0,974927
1
2TOBACCO AND TOBACCO MANUFACTURES 0,017068 0,029091 0,795885 0,557962 0,618162 0,893727
1
9
ADJUSTMENTS (TRADE BROKEN DOWN ATCHAPTER NC LEVEL ONLY)
0,821358
2
1HIDES, SKINS AND FURSKINS, RAW 0,452871 0,711561 0,41131 0,824953 0,562523 0,440359
2
2OIL-SEEDS AND OLEAGINOUS FRUITS 0,206515 0,676699 0,488515 0,454965 0,238143 0,325907
2
3
CRUDE RUBBER (INCLUDING SYNTHETIC ANDRECLAIMED)
0,056212 0,239335 0,042513 0,975787 0,98693 0,886722
2
4
CORK AND WOOD 0,015363 0,077621 0,287217 0,104403 0,151292 0,15757
2
5PULP AND WASTE PAPER 0,489326 0,619188 0,283154 0,190608 0,622392 0,853737
2
6
TEXTILE FIBRES (OTHER THAN WOOL TOPS ANDOTHER COMBED WOOL) AND THEIR WASTES(NOT MANUFACTURED INTO YARN OR FABRIC)
0,242846 0,246196 0,390285 0,993579 0,841148 0,796668
2
7
CRUDE FERTILIZERS, OTHER THAN THOSE OFDIVISION 56, AND CRUDE MINERALS(EXCLUDING COAL, PETROLEUM AND PRECIOUSSTONES)
0,478653 0,394818 0,293375 0,848239 0,897221 0,931916
2
8METALLIFEROUS ORES AND METAL SCRAP 0,959213 0,856977 0,860644 0,535013 0,928137 0,849296
2
9
CRUDE ANIMAL AND VEGETABLE MATERIALS,N.E.S.
0,713551 0,426222 0,417955 0,289541 0,272924 0,381772
3
2COAL, COKE AND BRIQUETTES 0,059964 0,023833 0 0,189233 0,079551 0,083871
3
3
PETROLEUM, PETROLEUM PRODUCTS AND
RELATED MATERIALS0,668107 0,759608 0,698091 0,64989 0,942863 0,957017
3
4GAS, NATURAL AND MANUFACTURED 0,114811 0,14163 0,187105 0,719521 0,644289
3
5ELECTRIC CURRENT 0,782156 0,279081
3
9
CONFIDENTIAL TRADE OF GROUP 39 AND/ORESTIMATIONS
0,958047
4
1ANIMAL OILS AND FATS 0,020587 0,664498 0,770566 0,809135
4
2
FIXED VEGETABLE FATS AND OILS, CRUDE,REFINED OR FRACTIONATED
0,356451 0,777402 0,704242 0,426876 0,330198 0,361729
4 ANIMAL OR VEGETABLE FATS AND OILS, 0,21133 0,286897 0,02681 0,775015 0,680051 0,405656
0,385567

8/8/2019 Report Final Ik-2
http://slidepdf.com/reader/full/report-final-ik-2 7/13
3
PROCESSED; WAXES OF ANIMAL ORVEGETABLE ORIGIN; INEDIBLE MIXTURES ORPREPARATIONS OF ANIMAL OR VEGETABLEFATS OR OILS, N.E.S.
4
9
ADJUSTMENTS (TRADE BROKEN DOWN ATCHAPTER NC LEVEL ONLY)
0,594916
5
1ORGANIC CHEMICALS 0,867993 0,993667 0,565301 0,946672 0,929043 0,977892
5
2 INORGANIC CHEMICALS 0,8295 0,923494 0,85654 0,976868 0,956886 0,967828
5
3DYEING, TANNING AND COLOURING MATERIALS 0,081565 0,122754 0,194246 0,784293 0,799493 0,804565
5
4MEDICINAL AND PHARMACEUTICAL PRODUCTS 0,122267 0,062217 0,163077 0,803803 0,823424 0,790437
5
5
ESSENTIAL OILS AND RESINOIDS AND PERFUMEMATERIALS; TOILET, POLISHING ANDCLEANSING PREPARATIONS
0,276099 0,446642 0,396709 0,845708 0,96799 0,991944
5
6
FERTILIZERS (OTHER THAN THOSE OF GROUP272)
0,210464 0,220261 0,418365 0,601037 0,484037 0,427123
5
7PLASTICS IN PRIMARY FORMS 0,915108 0,83347 0,771414 0,858637 0,865062 0,830854
5
8PLASTICS IN NON-PRIMARY FORMS 0,06564 0,219196 0,239009 0,930013 0,908507 0,927912
5
9CHEMICAL MATERIALS AND PRODUCTS, N.E.S. 0,136807 0,111153 0,140206 0,802409 0,834229 0,897873
6
0
COMPLETE INDUSTRIAL PLANT APPROPRIATETO SECTION 6
6
1
LEATHER, LEATHER MANUFACTURES, N.E.S.,AND DRESSED FURSKINS
0,108358 0,191252 0,252576 0,81159 0,99431 0,905914
6
2RUBBER MANUFACTURES, N.E.S. 0,91336 0,977188 0,873386 0,94077 0,814488 0,738421
6
3
CORK AND WOOD MANUFACTURES (EXCLUDINGFURNITURE)
0,723457 0,754875 0,967056 0,372488 0,300481 0,242325
6
4
PAPER, PAPERBOARD AND ARTICLES OF PAPERPULP, OF PAPER OR OF PAPERBOARD
0,336314 0,424949 0,279468 0,620808 0,568 0,584578
6
5
TEXTILE YARN, FABRICS, MADE-UP ARTICLES,N.E.S., AND RELATED PRODUCTS
0,189113 0,288603 0,450574 0,794148 0,800384 0,768664
6
6
NON-METALLIC MINERAL MANUFACTURES,N.E.S.
0,895515 0,60521 0,274767 0,887624 0,961216 0,914359
6
7IRON AND STEEL 0,604877 0,730474 0,87291 0,999152 0,988156 0,992447
6
8NON-FERROUS METALS 0,567879 0,792566 0,913634 0,835103 0,916171 0,966202
6
9MANUFACTURES OF METALS, N.E.S. 0,796817 0,567294 0,587149 0,953715 0,85551 0,829597
7
0
COMPLETE INDUSTRIAL PLANT APPROPRIATETO SECTION 7
7
1
POWER-GENERATING MACHINERY ANDEQUIPMENT
0,813004 0,983839 0,93561 0,793439 0,808418 0,884276
7
2
MACHINERY SPECIALIZED FOR PARTICULARINDUSTRIES
0,367843 0,366851 0,403727 0,867465 0,885594 0,862925
7
3METALWORKING MACHINERY 0,96435 0,611527 0,61712 0,991841 0,94551 0,996911
7
4
GENERAL INDUSTRIAL MACHINERY ANDEQUIPMENT, N.E.S., AND MACHINE PARTS, N.E.S.
0,564793 0,767656 0,724556 0,995528 0,965542 0,940637
7
5
OFFICE MACHINES AND AUTOMATIC DATA-
PROCESSING MACHINES
0,567565 0,141913 0,485429 0,898814 0,750917 0,637379
7
6
TELECOMMUNICATIONS AND SOUND-RECORDING AND REPRODUCING APPARATUSAND EQUIPMENT
0,204471 0,665247 0,618783 0,98841 0,727639 0,548638
7
7
ELECTRICAL MACHINERY, APPARATUS ANDAPPLIANCES, N.E.S., AND ELECTRICAL PARTSTHEREOF (INCLUDING NON-ELECTRICALCOUNTERPARTS, N.E.S., OF ELECTRICALHOUSEHOLD-TYPE EQUIPMENT)
0,600111 0,84482 0,970292 0,913642 0,858551 0,824399
7
8
ROAD VEHICLES (INCLUDING AIR-CUSHIONVEHICLES)
0,723562 0,451916 0,613578 0,767087 0,719441 0,791495
7
9OTHER TRANSPORT EQUIPMENT 0,38564 0,685071 0,746301 0,978336 0,984989 0,62779
8/8/2019 Report Final Ik-2
http://slidepdf.com/reader/full/report-final-ik-2 8/13
8
0
COMPLETE INDUSTRIAL PLANT APPROPRIATETO SECTION 8
8
1
PREFABRICATED BUILDINGS; SANITARY,PLUMBING, HEATING AND LIGHTING FIXTURESAND FITTINGS, N.E.S.
0,825413 0,649525 0,531233 0,72689 0,516809 0,532842
8
2
FURNITURE AND PARTS THEREOF; BEDDING,MATTRESSES, MATTRESS SUPPORTS,CUSHIONS AND SIMILAR STUFFED FURNISHINGS
0,214081 0,316595 0,624973 0,661487 0,393321 0,390114
8
3
TRAVEL GOODS, HANDBAGS AND SIMILAR
CONTAINERS 0,345542 0,306149 0,930499 0,428976 0,389106 0,370258
8
4
ARTICLES OF APPAREL AND CLOTHINGACCESSORIES
0,250097 0,24087 0,473571 0,541037 0,410972 0,401093
8
5FOOTWEAR 0,428619 0,408015 0,594779 0,409861 0,29271 0,363729
8
7
PROFESSIONAL, SCIENTIFIC AND CONTROLLINGINSTRUMENTS AND APPARATUS, N.E.S.
0,182218 0,31384 0,56361 0,90181 0,985202 0,994293
8
8
PHOTOGRAPHIC APPARATUS, EQUIPMENT ANDSUPPLIES AND OPTICAL GOODS, N.E.S.;WATCHES AND CLOCKS
0,257391 0,413256 0,275211 0,878947 0,864177 0,877454
8
9
MISCELLANEOUS MANUFACTURED ARTICLES,N.E.S.
0,381555 0,451745 0,495898 0,920603 0,914052 0,884888
9
1
POSTAL PACKAGES NOT CLASSIFIEDACCORDING TO KIND
0,395759
9
3
SPECIAL TRANSACTIONS AND COMMODITIESNOT CLASSIFIED ACCORDING TO KIND
0,748466 0,548233 0,317831 0,404827
9
4
COMPLETE INDUSTRIAL PLANT NOTELSEWHERE SPECIFIED
9
5CONFIDENTIAL TRADE
9
6
COIN (OTHER THAN GOLD COIN), NOT BEINGLEGAL TENDER
0,507478 0,13783 0,16806
9
7
GOLD, NON-MONETARY (EXCLUDING GOLD,ORES AND CONCENTRATES)
0,751839 0,526365 0,792435
9
9CONFIDENTIAL TRADE 0,970885 0,883894 0,916707 0,858445
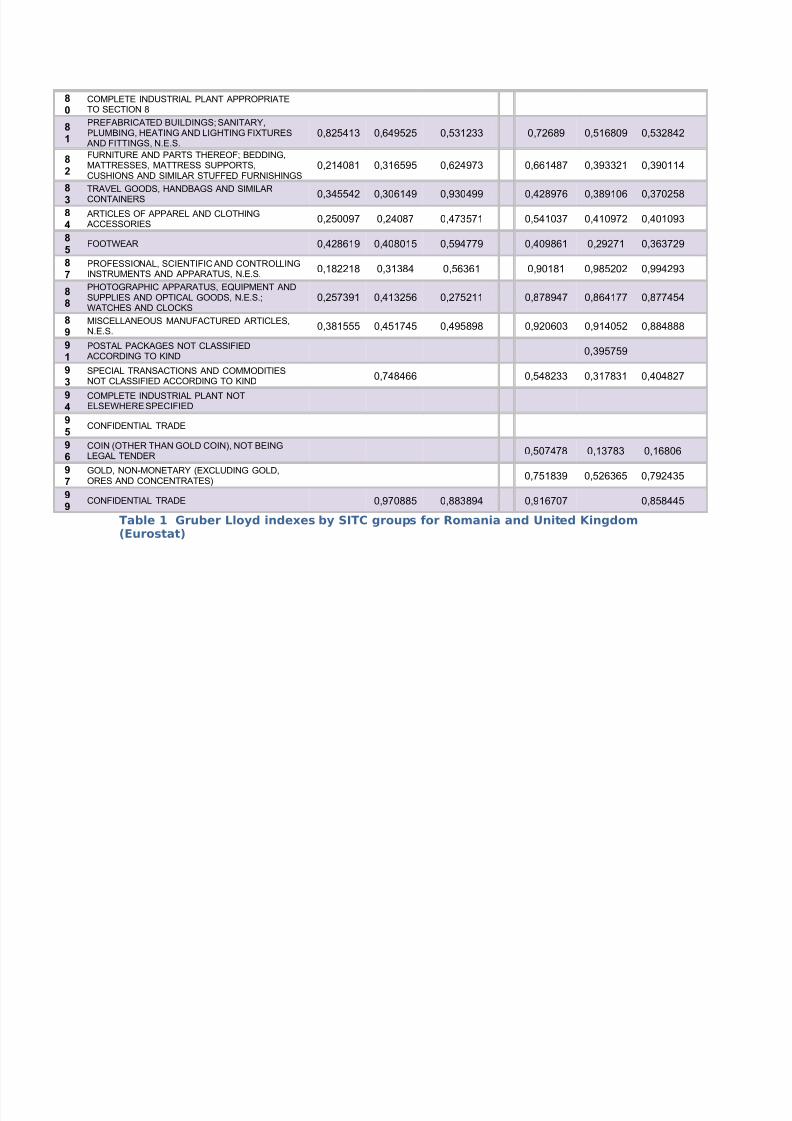
Table 1 Gruber Lloyd indexes by SITC groups for Romania and United Kingdom(Eurostat)

8/8/2019 Report Final Ik-2
http://slidepdf.com/reader/full/report-final-ik-2 9/13
Analysis
United Kingdom
The intra-industry trade prevails between the countries that have similar capital-
labour ratios, technologies and skill level. UK has always had one of the most developed
economies, but during 1999 – 2008 the level of development for other countries has alsoincreased – coming closer to UK’s level of development. This is one of the reasons that
induced intra-industry trade. However, the inflow of labour into UK changed its capital-
labour ratio and this had an ‘inter-industry effect’ on overall GL index. Also, the level of
development for other countries was still not as high as for UK. So, in total, the GL index
for UK decreased slightly – by 2 percent.
Further, we looked at the product groups (taking into account 2-digit level of
desegregation) which, however, had quite substantial changes in GL index over the time
period of 1999 – 2008.
Although the biggest fluctuations were in Confidential Trade (SITC 99) and
Postal Packages (SITC 91), also Gold (SITC 97), we assume these product groups to be
irrelevant to our analysis as the reasons for their fluctuations may not be the product
differentiation, economies of scale, factor endowments – ones that effect intra-industry
trade pattern.
The next three product groups that have the biggest changes and are relevant to
our further analysis were Pulp and Waste Paper (SITC 25), Gas, Natural and
Manufactured (SITC 34) and Metalliferous Ores and Metal Scrap (SITC 28).
Taking into account 2-digit level of disaggregation, the group of products which
had the biggest change from year 1999 to 2008 was Pulp and Waste Paper, which is a
subgroup of Crude Materials, Inedible, Except Fuels. It’s GL index grew from 0.19 to0.85.
Pulp and Waste Paper are capital-intensive goods. Also, the pulp and raw material
industry produce different kind of waste paper. This is an empirical evidence to the
theory that when other countries become more similar in terms of technologies, the intra-
industry trade grows.
The second group which had the most meaningful changes was Gas, Natural and
Manufactured, being a subgroup of Mineral, Fuels, Lubricants and Related Materials.
During the 9 year timeline GL index increased from 1999 to 2004 by 0.53, however until
2008 slightly decreased by 0.075. The reason for that may be the fact that during years
1999-2008 exports were higher than imports. But by 2008 imports grew eight times andexports only two times, which means that in 2008 imports started to exceed exports.
Metalliferous Ores and Metal Scrap was the third group which had significant
changes comparing the three years’ data. It is also a subgroup of Crude Materials,
Inedible, Except Fuels. From data we can see that through all nine years imports were
higher than exports, however from 1999 to 2004 exports of Metalliferous Ores and Metal
Scrap increased much more than imports, which made them almost equal and GL index

8/8/2019 Report Final Ik-2
http://slidepdf.com/reader/full/report-final-ik-2 10/13
reached 0.93. Throughout next period until 2008, there was a bigger expand of imports,
which made the difference between exports and import reasonable enough for GL index
to decrease – 0.85, but to stay on the higher level than in 1999, when it was equal to 0.54.
For these two subgroups we cannot say for sure the reasons for changes in GL
index. Therefore, we looked at EU27 trade of these goods – both imports and exports and
both – inside and outside EU27.
PERIOD FLOW/PARTNER EU27_EXTRA EU27_INTRA
1999 IMPORT 26881561 89543015
1999 EXPORT 183561093 944495726
2004 IMPORT 711772781 509914775
2004 EXPORT 203140853 1971006140
2008 IMPORT 5642097414 2991791344
2008 EXPORT 275725650 3827452994Table 2 Gas, natural and Manufactured
PERIOD FLOW/PARTNER EU27_EXTRA EU27_INTRA
1999 IMPORT 47513 101780
1999 EXPORT 1954316 9520297
2004 IMPORT 51955 6260585
2004 EXPORT 592697 48849065
2008 IMPORT 2578151 1949592
2008 EXPORT 62512822 101903967Table 3 Metalliferous Ores and Metal Scrap
From the table of Gas, Natural and Manufactured, imports and exports inside and
outside EU27, we can clearly see that in 2004 and 2008, UK was a transit country for this product. Meaning, the imports from outside EU to UK are substantially larger than
exports from UK to countries outside EU27.
As for the Scrap Metal and its imports and exports inside and outside EU27, the
trade most likely occurred only among the EU27 countries, because this good is not as
significant in terms of amounts necessary in production processes. Due to the fact that
there are several large harbors in UK, scrap metal was simply transported from, say
Northern-Europe country to Southern-Europe country.
Overall, we can conclude that Grubel-Lloyd index doesn’t necessarily show only
the intra-industry trade pattern, but also shows to what extent a country is a transportation
centre of particular product groups.
Romania
The biggest changes in GL index in Romania from 1999 to 2008 happened in the
following industries: Live Animals Other Than Animals of Division 03 (SITC 00);
Tobacco and Tobacco Manufactures (SITC 12); and Travel Goods, Handbags and Similar
Containers (SITC 83).
8/8/2019 Report Final Ik-2
http://slidepdf.com/reader/full/report-final-ik-2 11/13
In the Live Animals industry the GL index grew from 0.12 in 1999 to 0.29 in
2004 and then to 0.69 in 2008. The main reason for this pattern is that to join the EU,
Romania had to reduce its tariffs on agriculture. Agriculture plays a crucial role in
Romanian economy. In the past, it was heavily protected by tariffs. From 1999 to 2008
tariffs were cut significantly. First, it was done because of the overall tendency of
liberalizing trade and cutting the tariffs in the whole world and, secondly, because
Romania had to cut certain tariffs to join the EU. This boosted the trade in the
agricultural sector overall including the intra-industry trade. The same tendency of
increasing IIT could be observed also in other agricultural sectors. For example, the GL
index in Fixed Vegetable Fats and Oils (SITC 42) has increased from 0.36 to 0.70 from
1999 to 2008.
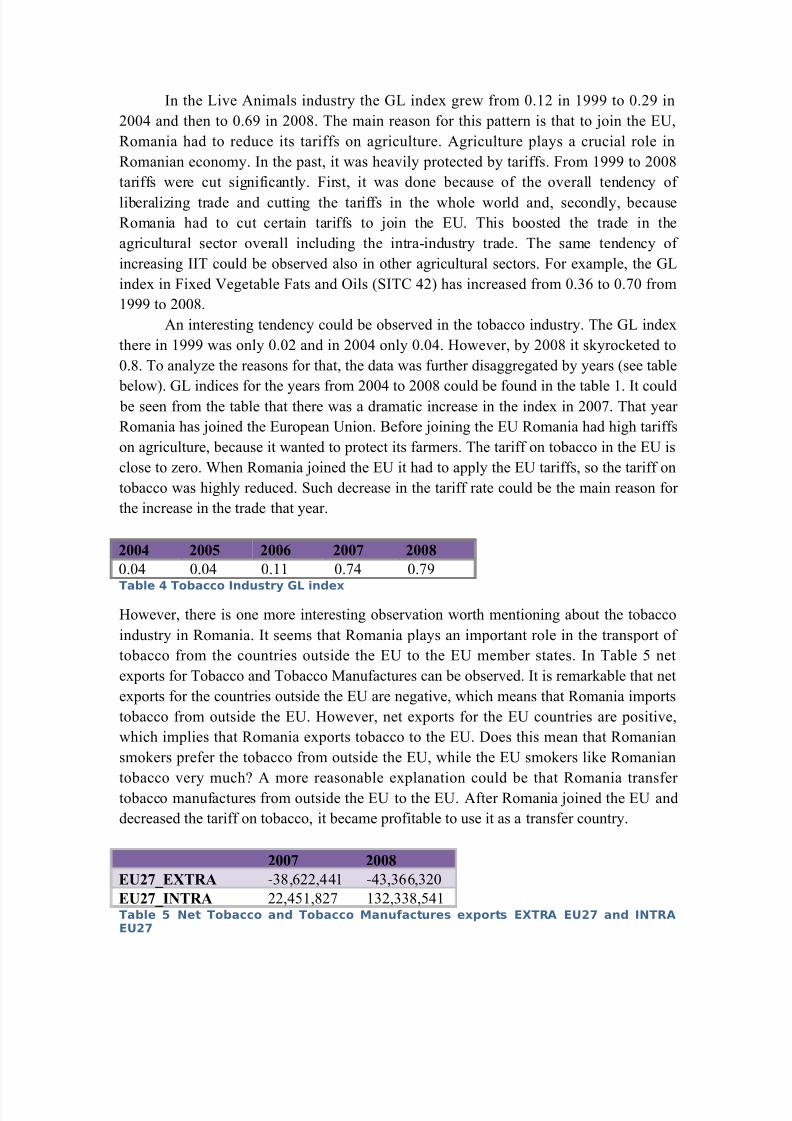
An interesting tendency could be observed in the tobacco industry. The GL index
there in 1999 was only 0.02 and in 2004 only 0.04. However, by 2008 it skyrocketed to
0.8. To analyze the reasons for that, the data was further disaggregated by years (see table
below). GL indices for the years from 2004 to 2008 could be found in the table 1. It could be seen from the table that there was a dramatic increase in the index in 2007. That year
Romania has joined the European Union. Before joining the EU Romania had high tariffs
on agriculture, because it wanted to protect its farmers. The tariff on tobacco in the EU is
close to zero. When Romania joined the EU it had to apply the EU tariffs, so the tariff on
tobacco was highly reduced. Such decrease in the tariff rate could be the main reason for
the increase in the trade that year.
2004 2005 2006 2007 2008
0.04 0.04 0.11 0.74 0.79
Table 4 Tobacco Industry GL index
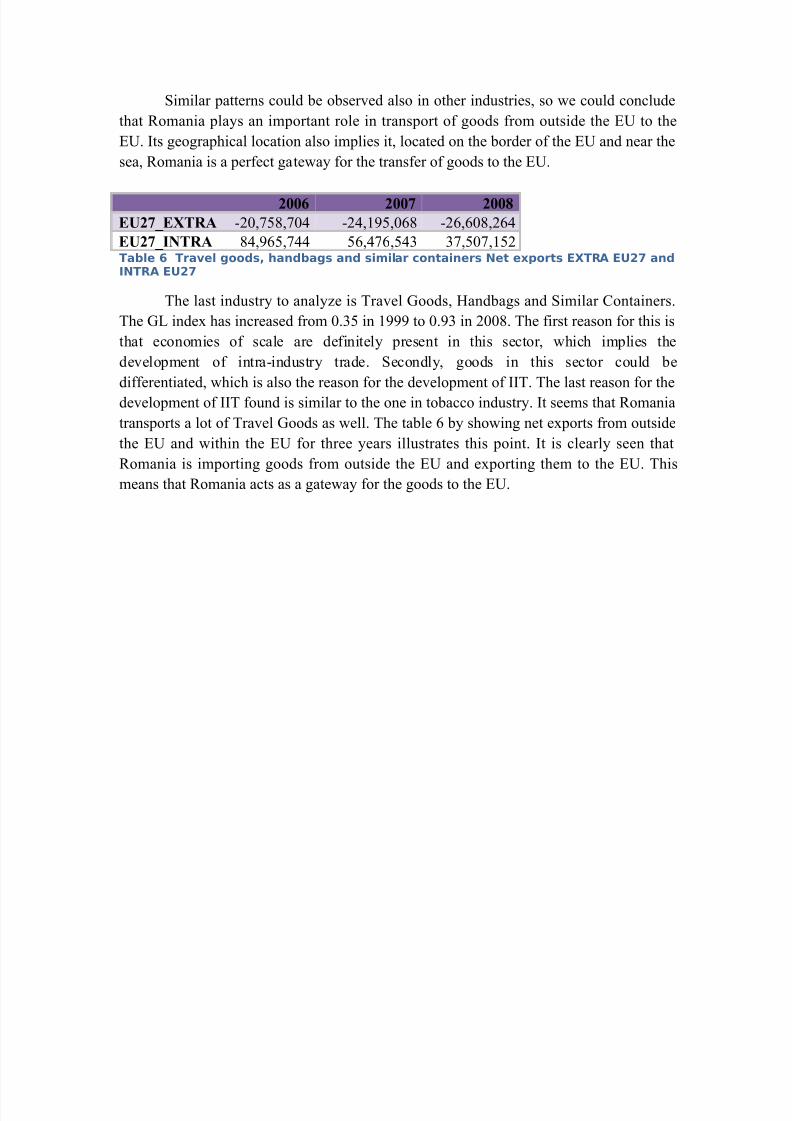
However, there is one more interesting observation worth mentioning about the tobacco
industry in Romania. It seems that Romania plays an important role in the transport of
tobacco from the countries outside the EU to the EU member states. In Table 5 net
exports for Tobacco and Tobacco Manufactures can be observed. It is remarkable that net
exports for the countries outside the EU are negative, which means that Romania imports
tobacco from outside the EU. However, net exports for the EU countries are positive,
which implies that Romania exports tobacco to the EU. Does this mean that Romanian
smokers prefer the tobacco from outside the EU, while the EU smokers like Romanian
tobacco very much? A more reasonable explanation could be that Romania transfer tobacco manufactures from outside the EU to the EU. After Romania joined the EU and
decreased the tariff on tobacco, it became profitable to use it as a transfer country.
2007 2008
EU27_EXTRA -38,622,441 -43,366,320
EU27_INTRA 22,451,827 132,338,541Table 5 Net Tobacco and Tobacco Manufactures exports EXTRA EU27 and INTRAEU27
8/8/2019 Report Final Ik-2
http://slidepdf.com/reader/full/report-final-ik-2 12/13
Similar patterns could be observed also in other industries, so we could conclude
that Romania plays an important role in transport of goods from outside the EU to the
EU. Its geographical location also implies it, located on the border of the EU and near the
sea, Romania is a perfect gateway for the transfer of goods to the EU.
2006 2007 2008
EU27_EXTRA -20,758,704 -24,195,068 -26,608,264
EU27_INTRA 84,965,744 56,476,543 37,507,152Table 6 Travel goods, handbags and similar containers Net exports EXTRA EU27 andINTRA EU27
The last industry to analyze is Travel Goods, Handbags and Similar Containers.
The GL index has increased from 0.35 in 1999 to 0.93 in 2008. The first reason for this is
that economies of scale are definitely present in this sector, which implies the
development of intra-industry trade. Secondly, goods in this sector could be
differentiated, which is also the reason for the development of IIT. The last reason for the
development of IIT found is similar to the one in tobacco industry. It seems that Romania
transports a lot of Travel Goods as well. The table 6 by showing net exports from outside
the EU and within the EU for three years illustrates this point. It is clearly seen that
Romania is importing goods from outside the EU and exporting them to the EU. This
means that Romania acts as a gateway for the goods to the EU.

8/8/2019 Report Final Ik-2
http://slidepdf.com/reader/full/report-final-ik-2 13/13
ConclusionsIt is absolutely clear that the economies of United Kingdom and Romania are
completely different. While the first one has been involved in the ongoing development
of Western Europe, the second one has been a subject to political changes as well as
economic transformations over the past 30 years. This kind of selection of such countries
might serve in various types of economic research; however, we are interested in
acknowledging the reasons for changes in their trade by using the Gruber-Lloyd index.
As a result, we have learned that GL index grows due to several reasons. The
study of United Kingdom’s Pulp and Waste Paper outlined the idea of growing index
because of trade partners becoming similarly technologically advanced. Also, examining
the SITC groups of Gas, Natural and Manufactured as well as for Scrap Metal proposed
acknowledging of the transit/transportation dimension. In the mean time, our study on
Romania’s GL indexes in Live Animals Other Than Animals of Division 03 (SITC 00) as
well as Tobacco and Tobacco Manufactures (SITC 12) convinces us that Gruber-Lloyd
index is truly a measurement for country’s openness – Romania has been transferring toan increasingly open economy and a full EU member state over the last decade. It was
also done by reforming and presetting tariffs on various kinds of products, including the
mentioned ones (SITC 00 and SITC 12). Finally, similarly to United Kingdom’s
overview, we found another example of transit country’s pattern in Travel Goods,
Handbags and Similar Containers (SITC 83).
Concluding, Gruber-Lloyd index can serve as an indicator for measuring
country’s economic integration and trade pattern changes. As we learned from the two
different economies, the changes might come either from technological advancement,
role in international transit/transportation as well as changing regulations and tariff
policies. Of course, these are not the only causes – as long as exports and imports arechangeable, the GL index is as well. However, in our report we examined the changes
that we found characteristic and meaningful for the two economies – United Kingdom
and Romania.
Related Documents