GROUP MEMBERS : Reg# HOSH MOHAMMAD (MBA) 4581 PSO SHELL MUHAMMAD FAROOQ (BBA) 3610 BYCO HAFEEZ-U-RAHMAN (MBA) 4469 ATTOCK Submitted to: SIR IMTIAZ ASKARI HOSH MOHAMMAD (MBA) 0342-3802305 Comparative Analysis of Petroleum Industry in Pakistan Analysis of Financial statements CID:9301

Welcome message from author
This document is posted to help you gain knowledge. Please leave a comment to let me know what you think about it! Share it to your friends and learn new things together.
Transcript

8/8/2019 Final Afs Report(New Report Final)
http://slidepdf.com/reader/full/final-afs-reportnew-report-final 1/37
8/8/2019 Final Afs Report(New Report Final)
http://slidepdf.com/reader/full/final-afs-reportnew-report-final 2/37
8/8/2019 Final Afs Report(New Report Final)
http://slidepdf.com/reader/full/final-afs-reportnew-report-final 3/37
8/8/2019 Final Afs Report(New Report Final)
http://slidepdf.com/reader/full/final-afs-reportnew-report-final 4/37
8/8/2019 Final Afs Report(New Report Final)
http://slidepdf.com/reader/full/final-afs-reportnew-report-final 5/37
8/8/2019 Final Afs Report(New Report Final)
http://slidepdf.com/reader/full/final-afs-reportnew-report-final 6/37
8/8/2019 Final Afs Report(New Report Final)
http://slidepdf.com/reader/full/final-afs-reportnew-report-final 7/37
8/8/2019 Final Afs Report(New Report Final)
http://slidepdf.com/reader/full/final-afs-reportnew-report-final 8/37
8/8/2019 Final Afs Report(New Report Final)
http://slidepdf.com/reader/full/final-afs-reportnew-report-final 9/37

8/8/2019 Final Afs Report(New Report Final)
http://slidepdf.com/reader/full/final-afs-reportnew-report-final 10/37
8/8/2019 Final Afs Report(New Report Final)
http://slidepdf.com/reader/full/final-afs-reportnew-report-final 11/37
8/8/2019 Final Afs Report(New Report Final)
http://slidepdf.com/reader/full/final-afs-reportnew-report-final 12/37
8/8/2019 Final Afs Report(New Report Final)
http://slidepdf.com/reader/full/final-afs-reportnew-report-final 13/37
ATTOCK
The debt management ratios of ATTOCK show the decreasing trend in FY2009, because in 2009 short
term liabilities have been increased and in 2009 and in 2005 the debt ratio is higher because currentassets are low. It includes Trade and other payables and short term borrowings The debt equity holderdecreases in 2009 because equity has been increased more as compared to the liabilities. The havemaximum amount of equity and the debt cost is negligible.
SHELL
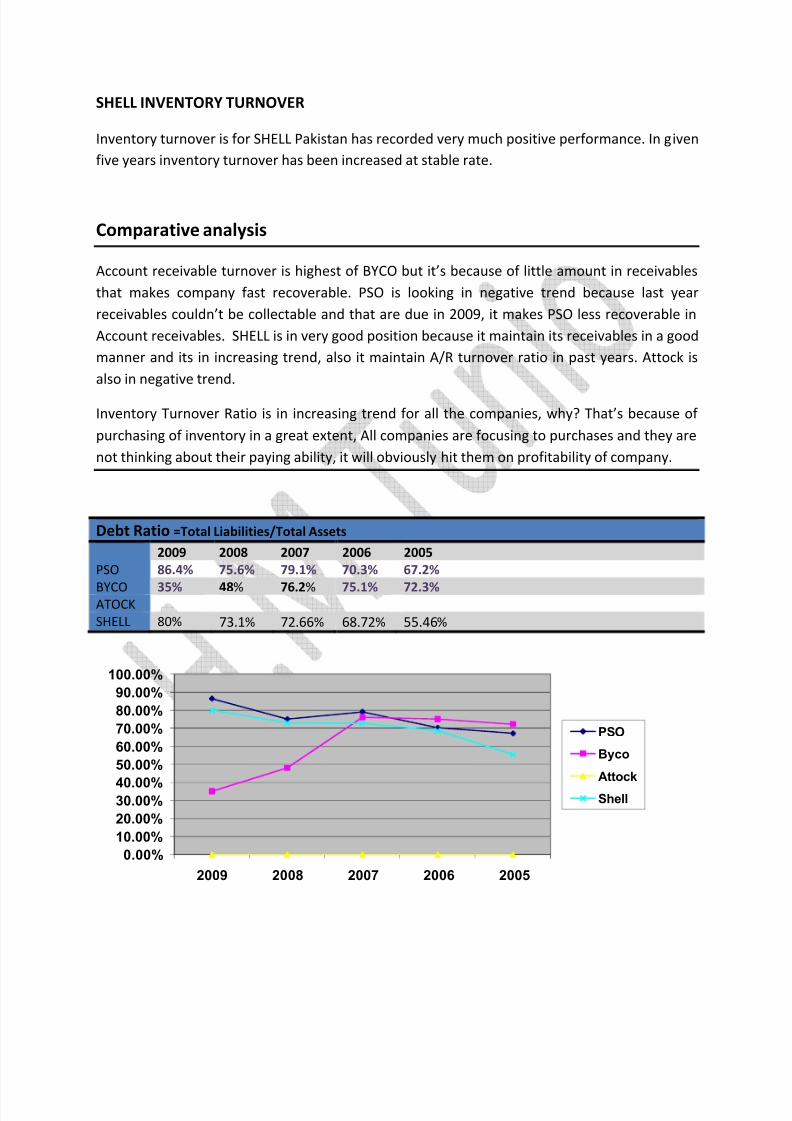
In debt ratio company has been inefficient. Specially in 2009 the debt ratio was on its peek. Bydoing analysis we came to know that In 2005 debt ratio was 55.4% as a time goes on debt ratiohas increased at stable rate.
In debt equity ratio company again has been failed to achieve good performance, indebt/equity ratio company has negative trend and with the passage of time this negativeperformance has increased.
Profitability Ratios
Gross Profit M argin Graph
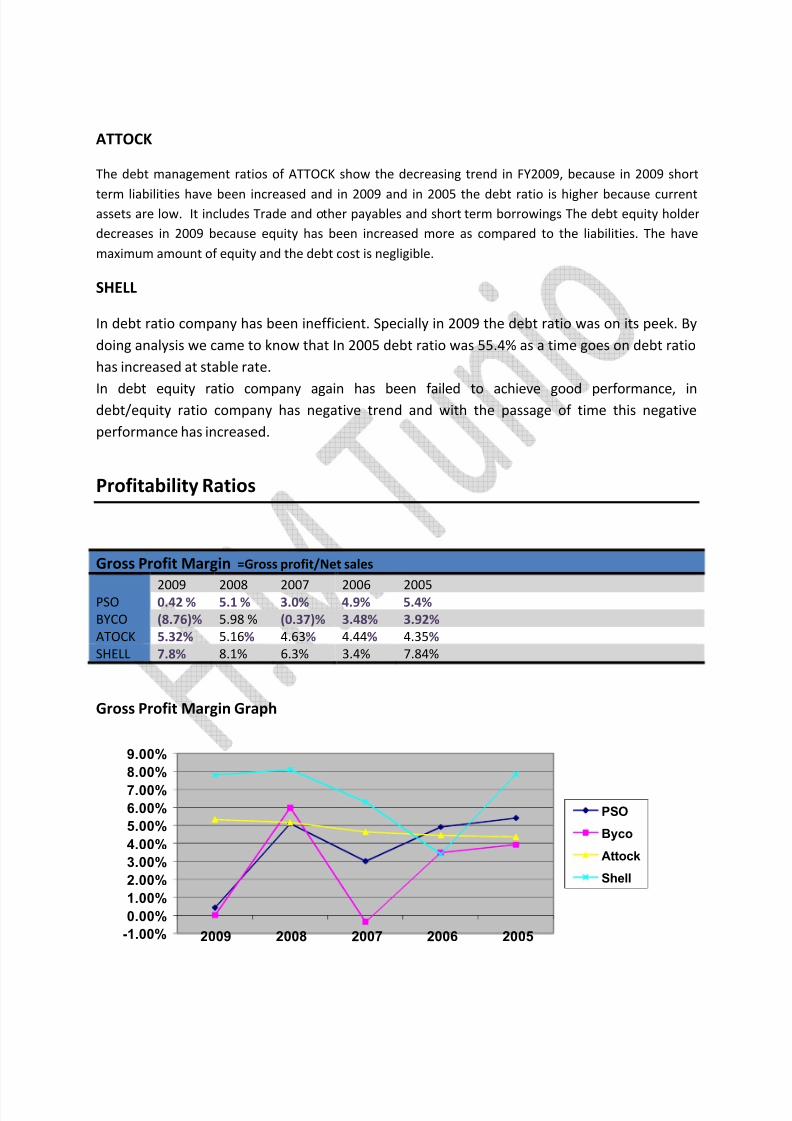
Gross Profit M argin =Gross profit/Net sales
2009 2008 2007 2006 2005 PSO 0.42 % 5.1 % 3.0% 4.9% 5.4%BYCO (8.76)% 5.98 % (0.37)% 3.48% 3.92% ATOCK 5.32% 5.16 % 4.63 % 4.44 % 4.35 % SHELL 7.8% 8.1% 6.3% 3.4% 7.84%
-1.00%0.00%1.00%2.00%3.00%4.00%5.00%6.00%7.00%8.00%9.00%
2009 2008 2007 2006 2005
PS O
Byco
Attock
Shell

8/8/2019 Final Afs Report(New Report Final)
http://slidepdf.com/reader/full/final-afs-reportnew-report-final 14/37
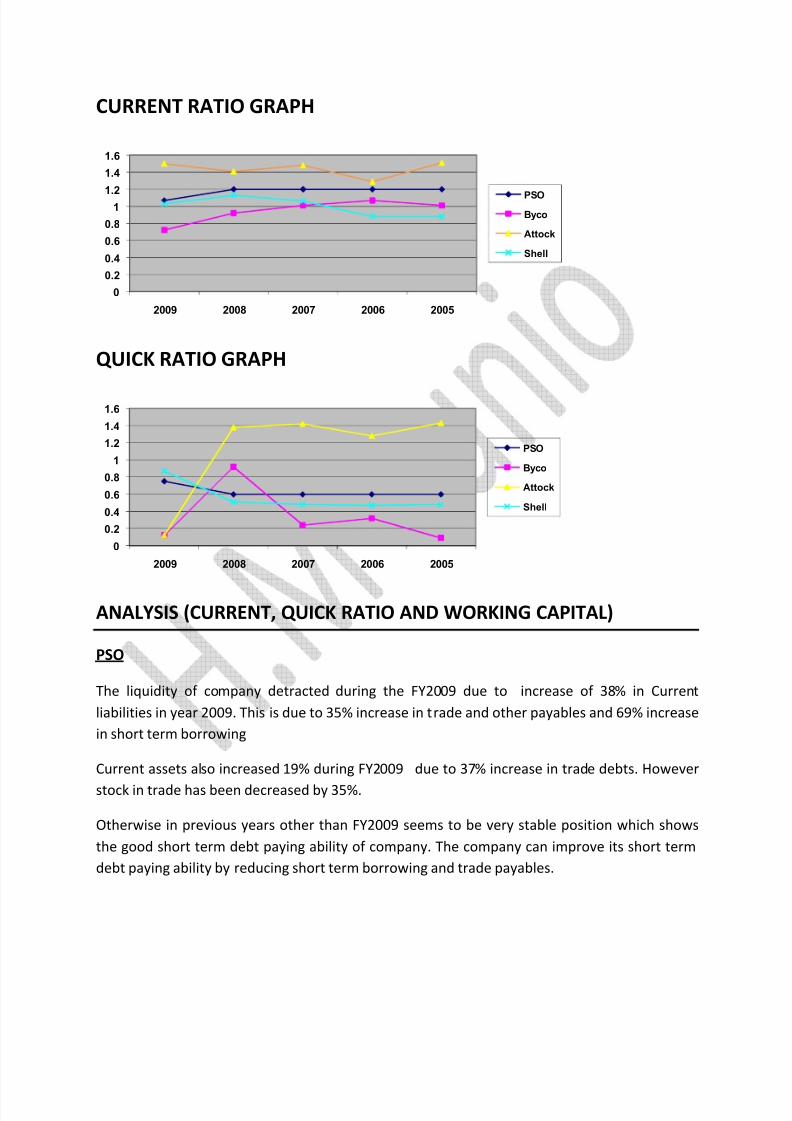
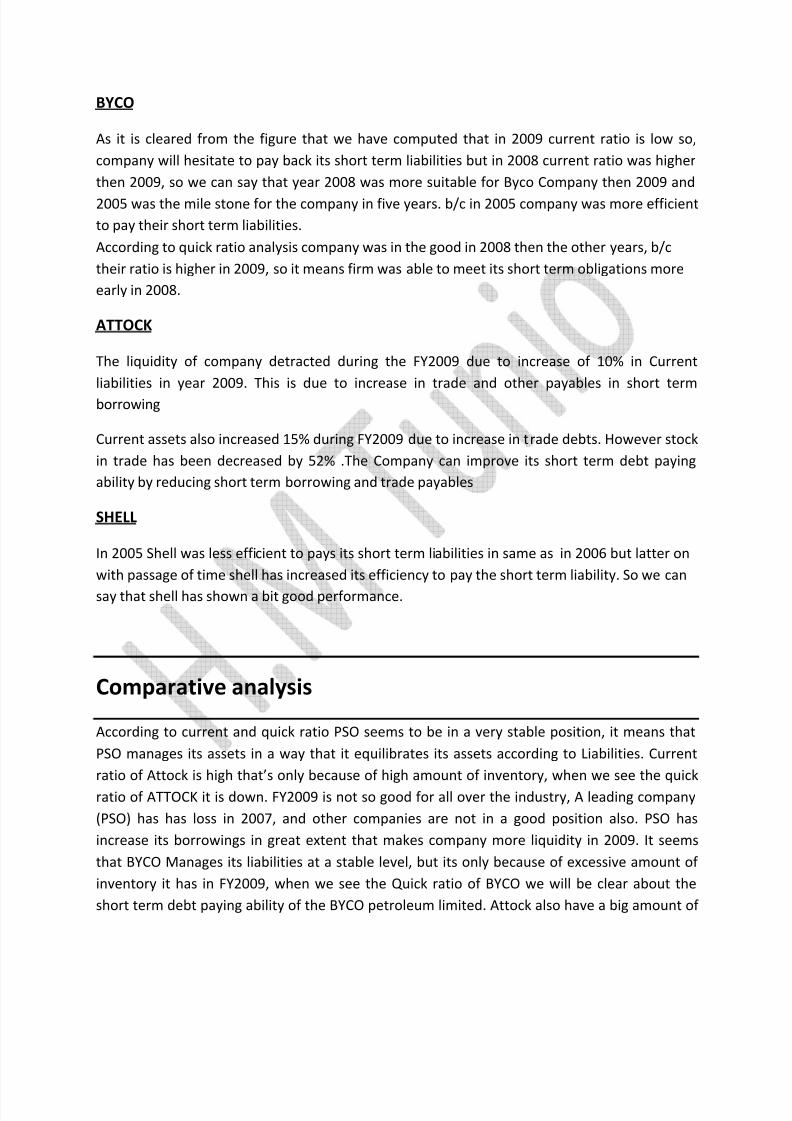
PSO
PSO facing declining in profit an FY2009, it is due to increase in cost of good sold, the cost of goods sold
increase by 31.04% as compare to FY2008, it is the main reason that company incurs loss in FY2009,however net sales also increased by 23.7%, but it is not enough to grow profit margin, company shouldtry to decrease the CGS as well as increase in sales. In 2008 CGS increased by 37.9%, but sales increasedby 42%, that results in increment of 45% in Gross profit. FY2008 seems to be in good position in whichGross profit margin is 5.1%. However FY2007 is less profitable due to increase in CGS.
BYCO
In 2009 company has shown loss in gross profit margin, so one can say that financial health of thecompany is not so good and in the future company will be unable to pay its operating and other
expenses.
ATTOCK
T he gross profit margin increase every year. Because the company increase their sale and thisincrement is due to high prices of petroleum products.
SHELL
As for as Gross profit is concerned company has increased its performance, although in 2006Gross profit ratio has decreased but latter on company recover the loss and increased its ratio
so we can say that this is the quite good sign for the company.
Net Profit M argin = Net Income before minority share of Earnings and Non Recurring Items /Net Sales
2009 2008 2007 2006 2005PSO (.93)% 2.4 % 1.1% 2.1% 2.2% BYCO (23.15)% 0.5% (1.13)% 1.3% 1.3%ATOCK 4.98% 4.96 % 3.92 % 3.41 % 4.65 % SHELL 1.5% 3.6% 6.1% (0.56)% 2.34%
Return on Assets =Net Income before minority shares of earning and nonrecurring items /Average total Assets
2009 2008 2007 2006 2005PSO (4.37)% 11.1% 6.3% 10.7% 10.8% BYCO (4.17)% 2.2% (0.07)% 0.6% 0.4%ATOCK 18.25 21.57 22.18 30.84 24.35SHELL 5% 9.1% 7.2% (1.32)% 11.03%

8/8/2019 Final Afs Report(New Report Final)
http://slidepdf.com/reader/full/final-afs-reportnew-report-final 15/37
PSO
The profitability of the PSO fell by 48% in FY2009. Although the sales of the company increased, but dueto increased in CGS, company face loss, that result in negative ROA in FY2009, overall ROA of the PSO isvery stable, except FY2007 which is due to less profit in 2007.
BYCO
In 2009 company has shown loss, and in 2007 company also incurred loss, than in remaining yearscompany has earned profit, but not as much as other companies.In 2009 company has incurred heavy loss and 2008 was quite good. We can say that company hasearned on their assets, but in 2007 again company got the loss, so we can say that company is ininefficient to get the return on assets.
ATTOCK
The net profit rate of FY2009 is 4.98% and FY2008 4.96%. The net profit margin ratio approximatelysame in FY2009,2008,2005 but in 2007 and 2006 net profit margin go down because their expenseshave been increased in 2007 and 2006.
ROA in FY 2006 is higher and continuously decreasing till 2009. It mean the company don t have abilityto used the assets efficiently and don t earn a handsome return on from the sources available to thecompany
SHELLAs for as Net Profit margin is concerned company has not been good in performance, it hasdecreased the net profit margin continuously, and 2009 net profit margin has been shrieked to1.5% so we can say its not a favorable for company.
In 2005 Return on Asset were 11.03% it means company has earned quit well on their Assets, but in thesecond year 2006 company incurred loss. Then again in the next year company recovered itself andshowed a good sign till 2009.
Return on Equity
2009 2008 2007 2006 2005PSO (32.10)% 44.5% 22.4% 36.2% 32.2%BYCO (24.7) % 7.14 % 4.33 % 4.2 % 3.8 % ATOCK 43.52 % 47.72 % 50.04 % 68 .0 8 % 45.45 % SHELL 22.9% 19.7 % 3% 30.9 % 25.2%
8/8/2019 Final Afs Report(New Report Final)
http://slidepdf.com/reader/full/final-afs-reportnew-report-final 16/37
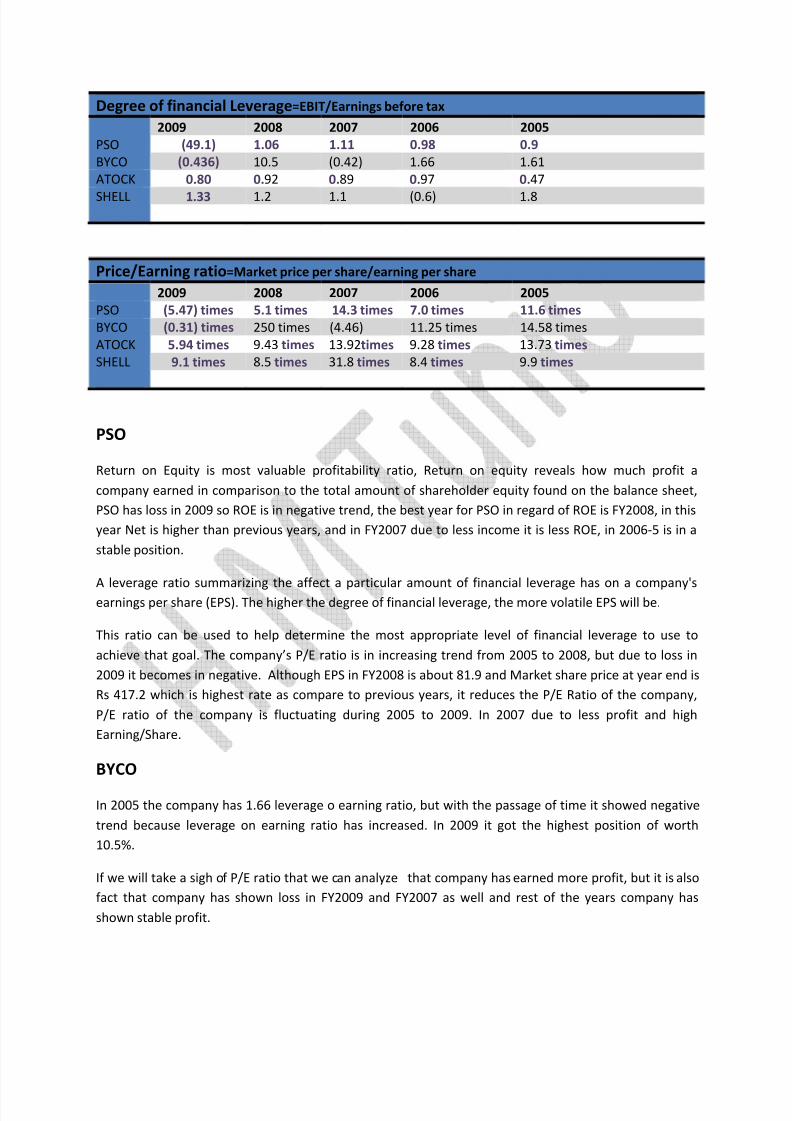
Degree of financial Leverage =EBIT/Earnings before tax
2009 2008 2007 2006 2005PSO (49.1) 1.06 1.11 0.98 0.9BYCO (0.436) 10.5 (0.42) 1.66 1.61ATOCK 0.80 0. 92 0.89 0.97 0.47
SHELL 1.33 1.2 1.1 (0.6) 1.8
Price/Earning ratio =M arket price per share/earning per share
2009 2008 2007 2006 2005PSO (5.47) times 5.1 times 14.3 times 7.0 times 11.6 timesBYCO (0.31) times 250 times (4.46) 11.25 times 14.58 timesATOCK 5.94 times 9.43 times 13.92 times 9.28 times 13.73 times SHELL 9.1 times 8.5 times 31.8 times 8.4 times 9.9 times
PSO
Return on Equity is most valuable profitability ratio, Return on equity reveals how much profit acompany earned in comparison to the total amount of shareholder equity found on the balance sheet,PSO has loss in 2009 so ROE is in negative trend, the best year for PSO in regard of ROE is FY2008, in thisyear Net is higher than previous years, and in FY2007 due to less income it is less ROE, in 2006-5 is in astable position.
A leverage ratio summarizing the affect a particular amount of financial leverage has on a company'searnings per share (EPS). The higher the degree of financial leverage, the more volatile EPS will be.
This ratio can be used to help determine the most appropriate level of financial leverage to use toachieve that goal. The company s P/E ratio is in increasing trend from 2005 to 2008, but due to loss in2009 it becomes in negative. Although EPS in FY2008 is about 81.9 and Market share price at year end isRs 417.2 which is highest rate as compare to previous years, it reduces the P/E Ratio of the company,P/E ratio of the company is fluctuating during 2005 to 2009. In 2007 due to less profit and highEarning/Share.
BYCO
In 2005 the company has 1.66 leverage o earning ratio, but with the passage of time it showed negativetrend because leverage on earning ratio has increased. In 2009 it got the highest position of worth10.5%.
If we will take a sigh of P/E ratio that we can analyze that company has earned more profit, but it is alsofact that company has shown loss in FY2009 and FY2007 as well and rest of the years company hasshown stable profit.
8/8/2019 Final Afs Report(New Report Final)
http://slidepdf.com/reader/full/final-afs-reportnew-report-final 17/37
ATTOCK
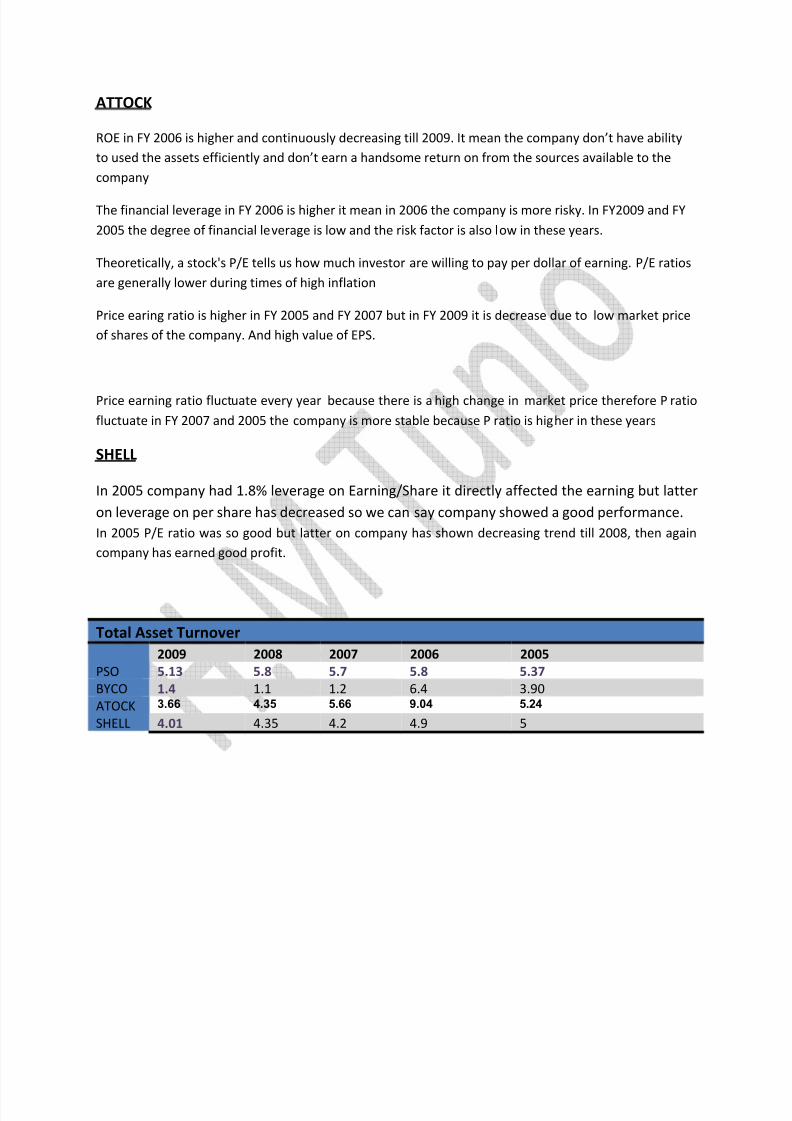
ROE in FY 2006 is higher and continuously decreasing till 2009. It mean the company don t have abilityto used the assets efficiently and don t earn a handsome return on from the sources available to thecompany
The financial leverage in FY 2006 is higher it mean in 2006 the company is more risky. In FY2009 and FY2005 the degree of financial leverage is low and the risk factor is also low in these years.
Theoretically, a stock's P/E tells us how much investor are willing to pay per dollar of earning. P/E ratiosare generally lower during times of high inflation
Price earing ratio is higher in FY 2005 and FY 2007 but in FY 2009 it is decrease due to low market priceof shares of the company. And high value of EPS.
Price earning ratio fluctuate every year because there is a high change in market price therefore P ratiofluctuate in FY 2007 and 2005 the company is more stable because P ratio is higher in these years
SHELL
In 2005 company had 1.8% leverage on Earning/Share it directly affected the earning but latteron leverage on per share has decreased so we can say company showed a good performance.In 2005 P/E ratio was so good but latter on company has shown decreasing trend till 2008, then againcompany has earned good profit.
Total Asset Turnover2009 2008 2007 2006 2005
PSO 5.13 5.8 5.7 5.8 5.37BYCO 1.4 1.1 1.2 6.4 3.90ATOCK 3.66 4.35 5.66 9.04 5.24 SHELL 4.01 4.35 4.2 4.9 5
8/8/2019 Final Afs Report(New Report Final)
http://slidepdf.com/reader/full/final-afs-reportnew-report-final 18/37
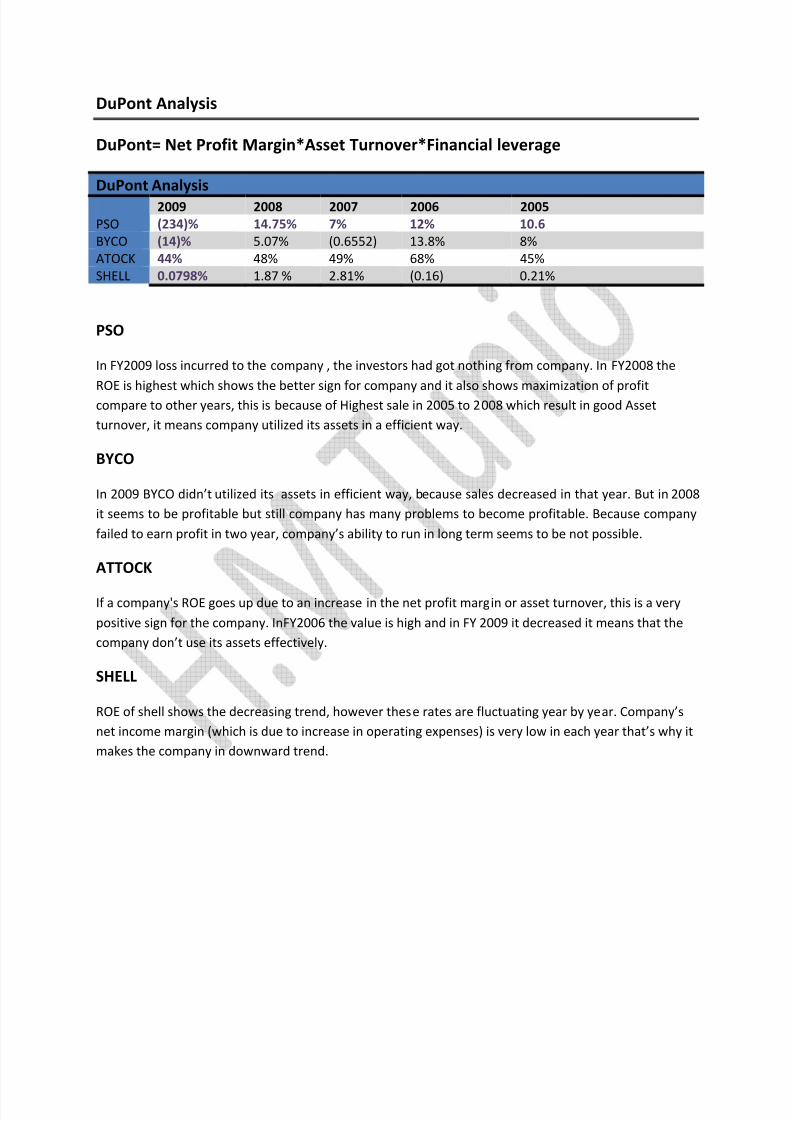
DuPont Analysis
DuPont= Net Profit M argin*Asset Turnover*Financial leverage
DuPont Analysis
2009 2008 2007 2006 2005PSO (234)% 14.75% 7% 12% 10.6BYCO (14)% 5.07% (0.6552) 13.8% 8%ATOCK 44% 48% 49% 68% 45%SHELL 0.0798% 1.87 % 2.81% (0.16) 0.21%
PSO
In FY2009 loss incurred to the company , the investors had got nothing from company. In FY2008 theROE is highest which shows the better sign for company and it also shows maximization of profitcompare to other years, this is because of Highest sale in 2005 to 2008 which result in good Assetturnover, it means company utilized its assets in a efficient way.
BYCO
In 2009 BYCO didn t utilized its assets in efficient way, because sales decreased in that year. But in 2008it seems to be profitable but still company has many problems to become profitable. Because companyfailed to earn profit in two year, company s ability to run in long term seems to be not possible.
ATTOCK
If a company's ROE goes up due to an increase in the net profit margin or asset turnover, this is a verypositive sign for the company. InFY2006 the value is high and in FY 2009 it decreased it means that thecompany don t use its assets effectively.
SHELL
ROE of shell shows the decreasing trend, however these rates are fluctuating year by year. Company snet income margin (which is due to increase in operating expenses) is very low in each year that s why itmakes the company in downward trend.
8/8/2019 Final Afs Report(New Report Final)
http://slidepdf.com/reader/full/final-afs-reportnew-report-final 19/37
Comparative analysis of Profitability and Debt ratio
Debt Ratio of all the firms are in increasing trend, its main reason is that they borrow shortterm loans without interest and they want to take benefit of it that s why companies haveincreasing debt ratio.
When we see the gross profit of the firms; PSO has very low gross profit margin and BYCO hasloss, that is result of High amount of CGS, but ATTOCK and SHELL has a good position in GrossProfit, ATTOCK is seems to be a very good in Gross profit ratio and ROA as compare to othercompanies, that is because the ATTOCK is a small company as compare to PSO and SHELL sothat it seems to be very effective in Gross profit and ROA; for example if ATTOCK gross profit is1000 on sale of Rs. 10000 it will show the margin of 10% that is a good margin for ATTOCK but itwill be no more good for other companies, so we can not compare ATTOCK s GP ratio on othercompanies.
Net Profit margin shows that PSO and BYCO companies are in Loss and reason is described atmany positions, But ATTOCK and SHELL are in Profit. However Shell has low Net income marginwhich is because of increase in Operating expenses, Shell need to control its operatingexpenses, but still its in a good position because overall industry is going in loss and Shell runs inprofit.
Return on Equity of Petroleum Firms seems to be 2:2 ratio, it means that 2 companies earnedprofit in FY2009 and 2 got Losses. But it can not be decided on the basis of ROE that thecompanies who had losses can not run in Long term. PSO is a very stable and profitable in
previous years but due to high Raw material cost it run in Loss, that doesn t mean that PSO willbe liquidify, PSO is in a very strong position, its debt paying ability is very good, and it can run inLong Term relationship with its investors, The BYCO is really in trouble, because it had incurlosses two times within 5 years. And its debt paying ability is also not in a good position, itsamount of Profit is also very low.
ATTOCK has maintained its ROE in a good manner, however it is also in downtrend in FY2009but it is quit possible for Firm to keep it high in next year.
Shell has increasing trend in ROE, that is sign of good move in market, Shell Pakistan is runningin profit and it maintained its sales and Assets very efficiently, although FY2009 is not good formost of the Oil companies but Shell Pakistan proved itself as a stable company, Return onAssets of Shell is in increasing trend which means the company is utilizing its assets veryeffectively.
We can not say that a Single firm has a best performance in this industry, because PSO is alargest petroleum company in the Pakistan and it has 72% market share. However it incurred

8/8/2019 Final Afs Report(New Report Final)
http://slidepdf.com/reader/full/final-afs-reportnew-report-final 20/37
loss in 2009 but it does not mean that It will not cover it in next year, the Firm has a best debtpaying ability, and a it has good control over Receivables and inventory as compare to others.
Although this time Shell is seems to be good profitable in Financial statements.
Changes in Cost, Sale and Gross Profit PSO =====Change in Sale, CGS, and Gross Profit
Sales Volume: Per Year (given)
2009: 92.4 million barrel 2008: 91 million barrel 2007: 82.6 million barrel 2006: 68.6 million barrel 2005: 67.9 million barrel
Change inCost/barrel
CGS (Rs.000)(A)
Barrels sold(B)
Per Barrel costA/B
Change withinyear
2009 609685478 92. 4 m 6598 14682008 465254907 91 m 5112 10272007 337446896 82.6 m 4085 (-12)2006 281042813 68.6 m 4097 11702005 212503650 67.9 m 3129 -
Change inSale/barrel
Sales (Rs.000)(A)
Barrels sold(B)
Per Barrel SalepriceA/B (Rs.)
Change withinyear
2009 612695589 92. 4 m 6631 11892008 495278533 91 m 5442 12082007 349706326 82.6 m 4233 (114)2006 298250039 68.6 m 4348 12192005 198757319 67.9 m 2927 -
Change inGross Profit
Gross Profit /Year
Changewithin year
2009 3010111 (27014)2008 30023626 177652007 12259430 (4948)2006 17207226 34612005 - -
PSO =====Cost Per Unit
2009 2008 2007 2006 2005
OpeningCost 621.8 277 300 262 180Chargesthereon
10.9 9.86 15 11.5 19
Purchasecost 5431 4787 3648.7 3692 2670Chargesthereon
623 37 123 132 56
8/8/2019 Final Afs Report(New Report Final)
http://slidepdf.com/reader/full/final-afs-reportnew-report-final 21/37
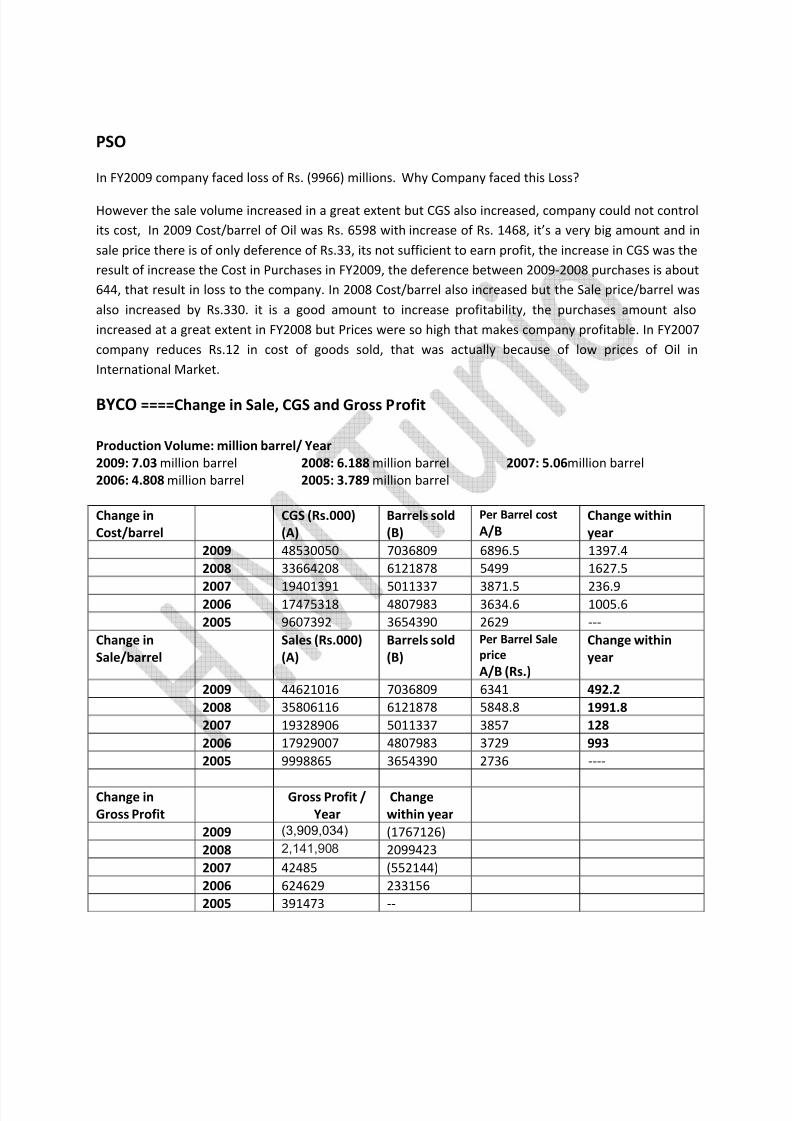
PSO
In FY2009 company faced loss of Rs. (9966) millions. Why Company faced this Loss?
However the sale volume increased in a great extent but CGS also increased, company could not controlits cost, In 2009 Cost/barrel of Oil was Rs. 6598 with increase of Rs. 1468, it s a very big amount and insale price there is of only deference of Rs.33, its not sufficient to earn profit, the increase in CGS was theresult of increase the Cost in Purchases in FY2009, the deference between 2009-2008 purchases is about644, that result in loss to the company. In 2008 Cost/barrel also increased but the Sale price/barrel wasalso increased by Rs.330. it is a good amount to increase profitability, the purchases amount alsoincreased at a great extent in FY2008 but Prices were so high that makes company profitable. In FY2007company reduces Rs.12 in cost of goods sold, that was actually because of low prices of Oil inInternational Market.
BYCO====Change in Sale, CGS and Gross Profit
Production Volume: million barrel/ Year2009: 7.03 million barrel 2008: 6.188 million barrel 2007: 5.06 million barrel 2006: 4.808 million barrel 2005: 3.789 million barrel
Change inCost/barrel
CGS (Rs.000)(A)
Barrels sold(B)
Per Barrel costA/B
Change withinyear
2009 48530050 7036809 6896.5 1397.42008 33664208 6121878 5499 1627.5
2007 19401391 5011337 3871.5 236.92006 17475318 4807983 3634.6 1005.62005 9607392 3654390 2629 ---
Change inSale/barrel
Sales (Rs.000)(A)
Barrels sold(B)
Per Barrel SalepriceA/B (Rs.)
Change withinyear
2009 44621016 7036809 6341 492.22008 35806116 6121878 5848.8 1991.82007 19328906 5011337 3857 1282006 17929007 4807983 3729 9932005 9998865 3654390 2736 ----
Change inGross Profit
Gross Profit /Year
Changewithin year
2009 (3,909,034) (1767126)2008 2,141,90 8 20994232007 42485 (552144)2006 624629 2331562005 391473 --
8/8/2019 Final Afs Report(New Report Final)
http://slidepdf.com/reader/full/final-afs-reportnew-report-final 22/37
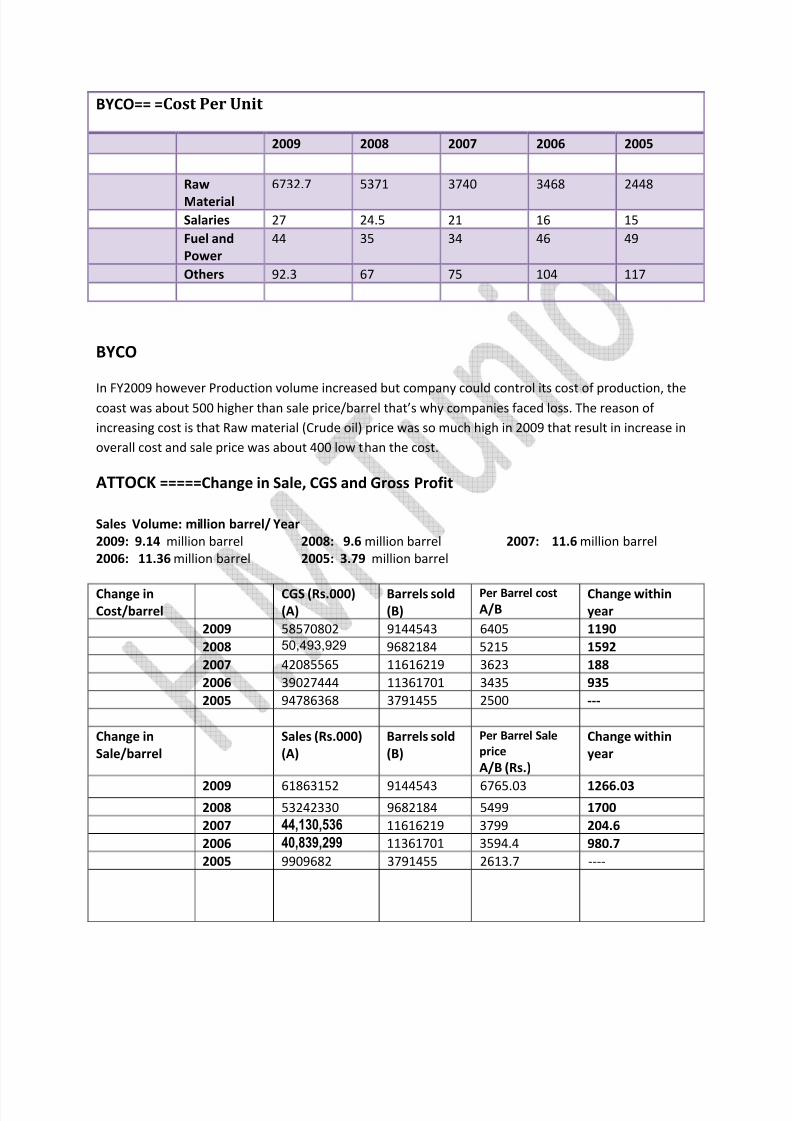
BYCO== =Cost Per Unit
2009 2008 2007 2006 2005
RawM aterial
6732.7 5371 3740 3468 2448
Salaries 27 24.5 21 16 15Fuel andPower
44 35 34 46 49
Others 92.3 67 75 104 117
BYCO
In FY2009 however Production volume increased but company could control its cost of production, thecoast was about 500 higher than sale price/barrel that s why companies faced loss. The reason of increasing cost is that Raw material (Crude oil) price was so much high in 2009 that result in increase inoverall cost and sale price was about 400 low than the cost.
ATTOCK=====Change in Sale, CGS and Gross Profit
Sales Volume: million barrel/ Year2009: 9.14 million barrel 2008: 9.6 million barrel 2007: 11.6 million barrel 2006: 11.36 million barrel 2005: 3.79 million barrel
Change inCost/barrel
CGS (Rs.000)(A)
Barrels sold(B)
Per Barrel costA/B
Change withinyear
2009 58570802 9144543 6405 11902008 50,493,929 9682184 5215 15922007 42085565 11616219 3623 1882006 39027444 11361701 3435 9352005 94786368 3791455 2500 ---
Change inSale/barrel
Sales (Rs.000)(A)
Barrels sold(B)
Per Barrel SalepriceA/B (Rs.)
Change withinyear
2009 61863152 9144543 6765.03 1266.032008 53242330 9682184 5499 17002007 44,130,536 11616219 3799 204.62006 40,839,299 11361701 3594.4 980.72005 9909682 3791455 2613.7 ----
8/8/2019 Final Afs Report(New Report Final)
http://slidepdf.com/reader/full/final-afs-reportnew-report-final 23/37
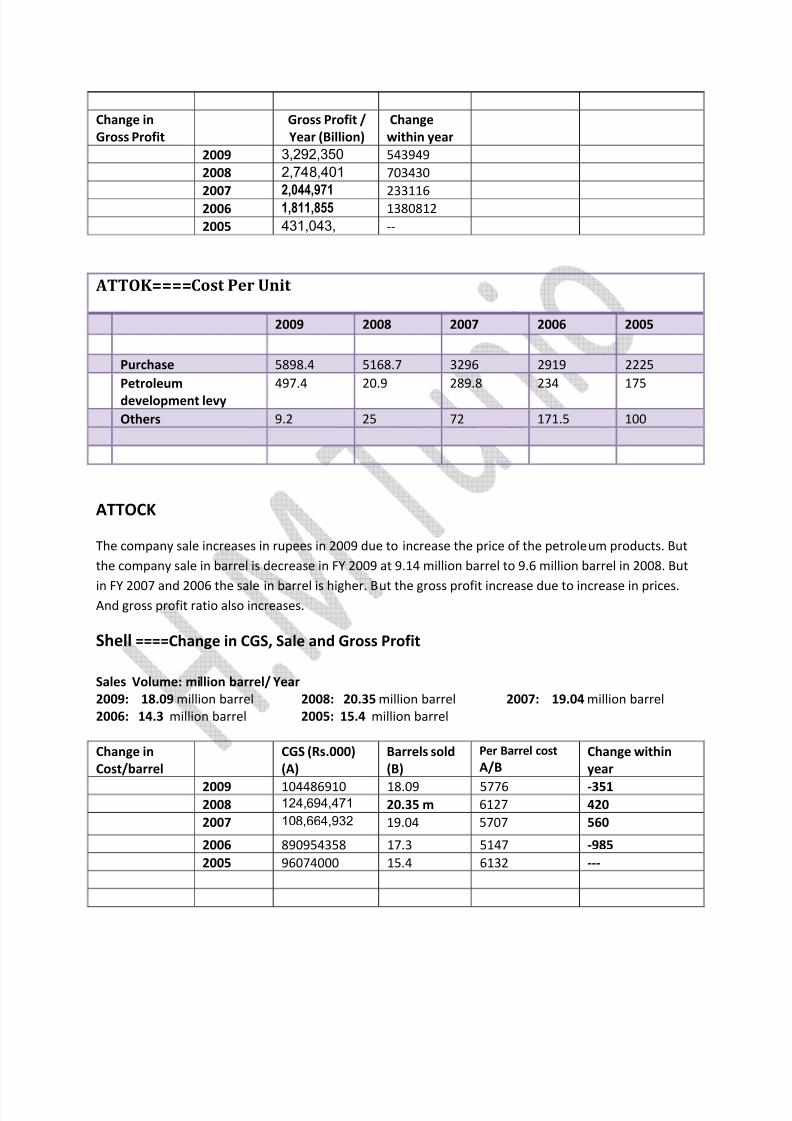
Change inGross Profit
Gross Profit /Year (Billion)
Changewithin year
2009 3,292,350 5439492008 2,74 8 ,401 703430
2007 2,044,971 2331162006 1,811,855 13808122005 431,043, --
ATTOK==== Cost Per Unit
2009 2008 2007 2006 2005
Purchase 5898.4 5168.7 3296 2919 2225Petroleumdevelopment levy
497.4 20.9 289.8 234 175
Others 9.2 25 72 171.5 100
ATTOCK
The company sale increases in rupees in 2009 due to increase the price of the petroleum products. Butthe company sale in barrel is decrease in FY 2009 at 9.14 million barrel to 9.6 million barrel in 2008. But
in FY 2007 and 2006 the sale in barrel is higher. But the gross profit increase due to increase in prices.And gross profit ratio also increases.
Shell ====Change in CGS, Sale and Gross Profit
Sales Volume: million barrel/ Year2009: 18.09 million barrel 2008: 20.35 million barrel 2007: 19.04 million barrel 2006: 14.3 million barrel 2005: 15.4 million barrel
Change inCost/barrel
CGS (Rs.000)(A)
Barrels sold(B)
Per Barrel costA/B
Change withinyear
2009 104486910 18.09 5776 -3512008 124, 6 94,471 20.35 m 6127 4202007 10 8 ,66 4,932 19.04 5707 560
2006 890954358 17.3 5147 -9852005 96074000 15.4 6132 ---
8/8/2019 Final Afs Report(New Report Final)
http://slidepdf.com/reader/full/final-afs-reportnew-report-final 24/37
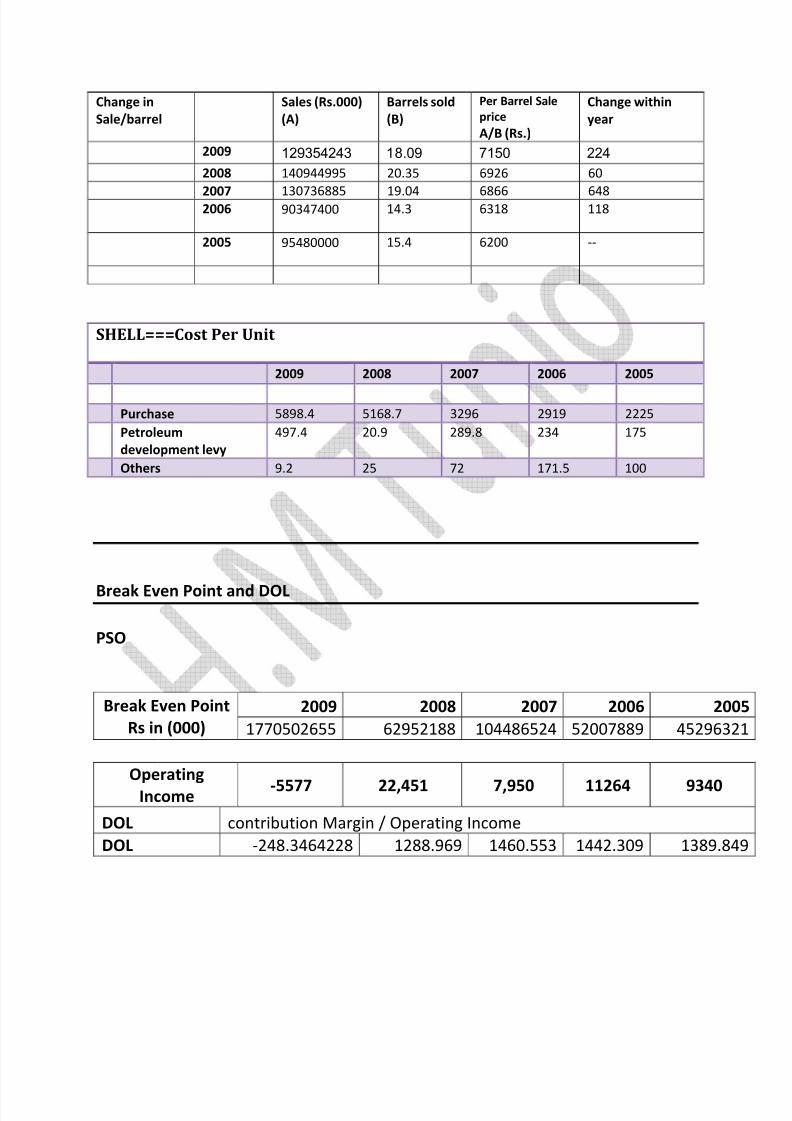
Change inSale/barrel
Sales (Rs.000)(A)
Barrels sold(B)
Per Barrel SalepriceA/B (Rs.)
Change withinyear
2009 129354243 1 8 .09 7150 2242008 140944995 20.35 6926 60
2007 130736885 19.04 6866 6482006 90347400 14.3 6318 118
2005 95480000 15.4 6200 --
SHELL === Cost Per Unit
2009 2008 2007 2006 2005
Purchase 5898.4 5168.7 3296 2919 2225Petroleumdevelopment levy
497.4 20.9 289.8 234 175
Others 9.2 25 72 171.5 100
Break Even Point and DOL
PSO
Break Even PointRs in (000)
2009 2008 2007 2006 20051770502655 62952188 104486524 52007889 45296321
OperatingIncome -5577 22,451 7,950 11264 9340
DOL contribution Margin / Operating Income
DOL -248.3464228 1288.969 1460.553 1442.309 1389.849

8/8/2019 Final Afs Report(New Report Final)
http://slidepdf.com/reader/full/final-afs-reportnew-report-final 25/37
Break Even Point and DOL
Attock
years 2009 2008 2007 2006 2005BreakEven PointRs
5003272819
2969589682
3532535319
2863417311
2216141318
DOLcontribution Margin/Op: Income
DOL 0.84 0.84 0.88 0.089 0.68

8/8/2019 Final Afs Report(New Report Final)
http://slidepdf.com/reader/full/final-afs-reportnew-report-final 26/37
Common Size Anaylsis
PSO
H ORIZONTAL ANALY S IS
2009 2008 2007 2006 2005 ASSETSNon- Current AssetsProperty, plant and equipment 86 .14% 91.9 8 % 9 8 .7 8 % 92.70% 100.00%
Intangibles 2.97% 4.55% 5.45% 6 .68 % 100.00%
Long term investments 92.91% 11 6 .54% 129.03% 141.47% 100.00%
Long term loans, advances and receivables 52.72% 6 2.07% 8 1.59% 90.71% 100.00%
Long term deposits and prepayments 79.55% 75.21% 6 2. 68 % 71.00% 100.00%
Deferred tax 4035.01% 32 6 .55% 321.50% 327.32% 100.00%
Total Non Current Assets 127.29% 97.04% 105.62% 104.84% 100.00% Curr en t Ass e ts
S tores, spare parts and loose tools 8 5. 8 9% 88 .71% 97.9 6 % 95.77% 100.00%
S tock-in-trade 197.72% 302.9 6 % 143. 6 2% 13 6 .8 5% 100.00%
Trade debts 11 8 5.52% 499.25% 200.2 6 % 172.52% 100.00%
Loans and advances 19 6 .02% 1 8 5. 8 0% 171. 6 2% 129.30% 100.00%
Deposits and short term prepayments 75.99% 55.2 8 % 21 8 .12% 177.3 6 % 100.00%
Other receivables 123. 6 4% 151.40% 152.07% 140.59% 100.00%
taxation/short term investments 7039.25% 100.00%
Cash and bank balances150.01% 157.0 6 % 79.21% 9 8 .8 0% 100.00%
Tota l Curr en t Ass e ts 340.47% 284.47% 153.47% 142.47% 100.00%
TOTAL A SS ET S 293.31% 243.00% 142.88% 134.15% 100.00% EQUITY AND LIABILITIE S
S hare Capital 100.00% 100.00% 100.00% 100.00% 100.00%
Reserves 121.01% 1 8 4.7 8 % 121.44% 0.12% 100.00%
Tota l Equity 118.96% 176.49% 119.35% 118.63% 100.00%

8/8/2019 Final Afs Report(New Report Final)
http://slidepdf.com/reader/full/final-afs-reportnew-report-final 27/37
No n -Curr en t Liabi liti e s
Long term deposits 12 6 .59% 123. 6 1% 113.79% 110.19% 100.00%
Retirement and other service benefits 12 6 .39% 11 8 .92% 124.20% 117.47% 100.00%
Tota l No n -Curr en t Liabi liti e s 126.46% 120.51% 120.69% 115.01% 100.00%
Curr en t Liabi liti e s
Trade and other payables 427.00% 314.33% 1 6 0. 6 5% 142.75% 100.00%
Provisions 91.29% 9 6 .27% 91.29% 103.0 6 % 100.00%
Accrued interest / mark-up 8 70.3 8 % 340.92% 20 6 .43% 1 88 .8 7% 100.00%
S hort term borrowings 3 8 7.70% 22 8 .57% 1 88 .39% 15 8 .97% 100.00%
Taxes payable 0.00% 54.0 6 % 5.1 6 % 12 6 .11% 100.00%
Tota l Curr en t Liabi liti e s 396.85% 286.09% 156.83% 143.62% 100.00%
Tota l Equity a nd liabi liti e s 293.31% 243.00% 142.88% 134.15% 100.00%
PSO
V ERTICAL ANALY S IS OF BALANCE S H EET
2009 2008 2007 2006 2005 ASSETSNon- Current Assets
ASSETSNon- Current Assets
Property, plant and equipment 4.55% 5. 8 7% 10.72% 10.72% 15.51%
Intangibles 0.04% 0.0 8 % 0.17% 0.22% 4.43%
Long term investments 1.40% 2.13% 4.00% 4. 6 7% 4.43%
Long term loans, advances and receivables 0.2 6 % 0.3 8 % 0. 8 4% 0.99% 1.47%
Long term deposits and prepayments 0.05% 0.0 6 % 0.09% 0.11% 0.20%
Deferred tax 3.2 8 % 0.32% 0.54% 0.5 8 % 0.24%
Total Non Current Assets 9.60% 8.84% 16.36% 17.29% 22.13%
Curr en t Ass e ts
S tores, spare parts and loose tools 0.07% 0.09% 0.17% 0.1 8 % 0.25%

8/8/2019 Final Afs Report(New Report Final)
http://slidepdf.com/reader/full/final-afs-reportnew-report-final 28/37
S tock-in-trade 2 6 .53% 49.0 6 % 39.55% 40.14% 39.35%
Trade debts 52.4 8 % 2 6 .6 7% 1 8 .20% 1 6 .70% 12.9 8 %
Loans and advances 0.27% 0.31% 0.49% 0.39% 0.41%
Deposits and short term prepayments 0.3 6 % 0.32% 2.12% 1. 8 4% 1.39%
Other receivables 8 .35% 12.34% 21.0 8 % 20.75% 19. 8 0%
taxation/short term investments 0.4 6 % 0.02%
Cash and bank balances 1. 88 % 2.37% 2.04% 2.71% 3. 6 7%
Tota l Curr en t Ass e ts 90.40% 91.16% 83.64% 82.71% 77.87%
TOTAL A SS ET S 100.00% 100.00% 100.00% 100.00% 100.00%
EQUITY AND LIABILITIE S
S hare Capital 1.12% 1.35% 2.29% 2.44% 3.2 8 %
Reserves 12.49% 23.01% 25.72% 0.03% 30.2 6 %
Tota l Equity 13.60% 24.36% 28.02% 29.66% 33.54%
No n -Curr en t Liabi liti e s
Long term deposits 0.5 6 % 0. 66 % 1.03% 1.0 6 % 1.29%
Retirement and other service benefits 1.09% 1.24% 2.20% 2.22% 2.53%
Tota l No n -Curr en t Liabi liti e s 1.65% 1.90% 3.23% 3.28% 3.82%
Curr en t Liabi liti e s
Trade and other payables 71.7 8 % 6 3.7 8 % 55.44% 52.47% 49.30%
Provisions 0.45% 0.57% 0.92% 1.11% 1.44%
Accrued interest / mark-up 0.36 % 0.17% 0.1 8 % 0.17% 0.12%
S hort term borrowings 12.1 6 % 8 .6 5% 12.13% 10.90% 9.20%
Taxes payable 0.00% 0.57% 0.09% 2.42% 2.57%
Tota l Curr en t Liabi liti e s 84.75% 73.74% 68.76% 67.06% 62.64%
Tota l Equity a nd liabi liti e s 100.00% 100.00% 100.00% 100.00% 100.00%

8/8/2019 Final Afs Report(New Report Final)
http://slidepdf.com/reader/full/final-afs-reportnew-report-final 29/37
PSO------INCOME STATEMENT
HORIZONTAL ANALYSIS
In com e stat e m en t 2009 2008 2007 2006 2005 Ne t sa le s
288 .32% 233.07% 1 6 4.5 6 % 140.35% 100%
Cost of products sold 30 6 .75% 234.0 8 % 1 6 9.7 8 % 141.40% 100%
Gross profit 21.90% 218.41% 89.18% 125.18% 100%
Op e rati ng costs
Transportation costs 16 3.97% 107. 86 % 117. 8 9% 11 6 .77% 100%
Distribution and marketingexpenses 16 7.97% 13 8 .44% 11 6 .42% 105.70% 100%
Administrative expenses133. 8 1% 134. 8 5% 11 6 .49% 10 8 .6 9% 100%
Depreciation 11 6 .02% 113.73% 111. 6 0% 110.00% 100%
Amortisation 0.94% 0. 8 5% 0.75% 12 6 .99% 100%
Other operating expenses 371.27% 311. 6 5% 70.21% 20 6 .8 2% 100%
EBITDA 96.70% 83.00% 53.76% 126.99% 100% Other income 6 5.49% 2 6 .4 6 % 35.77% 117.50% 100%
P rofit from op e ratio n s -59.71% 240.37% 85.11% 123.11% 100%
Finance costs168 1.1 6 % 3 6 9.01% 312.41% 23 8 .51% 100%
S hare of profit of associates203.71% 132. 6 9% 14 8 .92% 4 68 .40% 100%
P rofit b e for e taxatio n -121.59% 228.87% 76.25% 123.11% 100%
Taxation -131.7 6 % 207.14% 68 .79% 11 6 .8 0% 100%
P rofit for t he ye ar -118.44% 248.48% 82.92% 133.04% 100%
Ear n ing s p e r s h ar e - basica nd d ilut ed -11 8 .41% 24 8 .45% 8 2.90% 133.02% 100%

8/8/2019 Final Afs Report(New Report Final)
http://slidepdf.com/reader/full/final-afs-reportnew-report-final 30/37
PSO----VERTICAL ANALYSISIn com e stat e m en t 2009 2008 2007 2006 2005
Ne t sa le s 100% 100% 100% 100% 100% Cost of products sold -99.51% -93.94% -9 6 .49% -94.23% -93.53%Gross profit 0.49% 6.06% 3.51% 5.77% 6.47% Other operating income 0.24% 0.2 8 % 0.37% 0.00% 0.00%Op e rati ng costsTransportation costs -0.0 8 4% -0.07% -0.11% -0.12% -0.15%Distribution and marketing expenses -0. 6 46 5% -0. 66 % -0.79% -0. 8 4% -1.11%
Administrative expenses -0.188 0% -0.23% -0.29% -0.31% -0.41%Depreciation -0.1 86 3% -0.23% -0.31% -0.3 6 % -0.4 6 %
Amortisation -0.0086 % -0.01% -0.01% -2.3 8 % -2. 6 3%Other operating expenses -0. 6 519% -0. 68 % -0.22% -0.75% -0.51%Other income 0.12 68 % 0.0 6 % 0.12% 0.47% 0.5 6 %P rofit from op e ratio n s -0.9102% 4.53% 2.27% 3.86% 4.40% Finance costs -1.0172% -0.2 8 % -0.33% -0.30% -0.17%S hare of profit of associates 0.0737% 0.0 6 % 0.09% 0.35% 0.10%P rofit b e for e taxatio n -1.8536% 4.32% 2.04% 3.86% 4.40% Taxation 0.7 6 03% -1.4 8 % -0.70% -1.3 8 % -1. 66 %P rofit for t he ye ar -1.0933% 2.84% 1.34% 2.52% 2.66%
8/8/2019 Final Afs Report(New Report Final)
http://slidepdf.com/reader/full/final-afs-reportnew-report-final 31/37
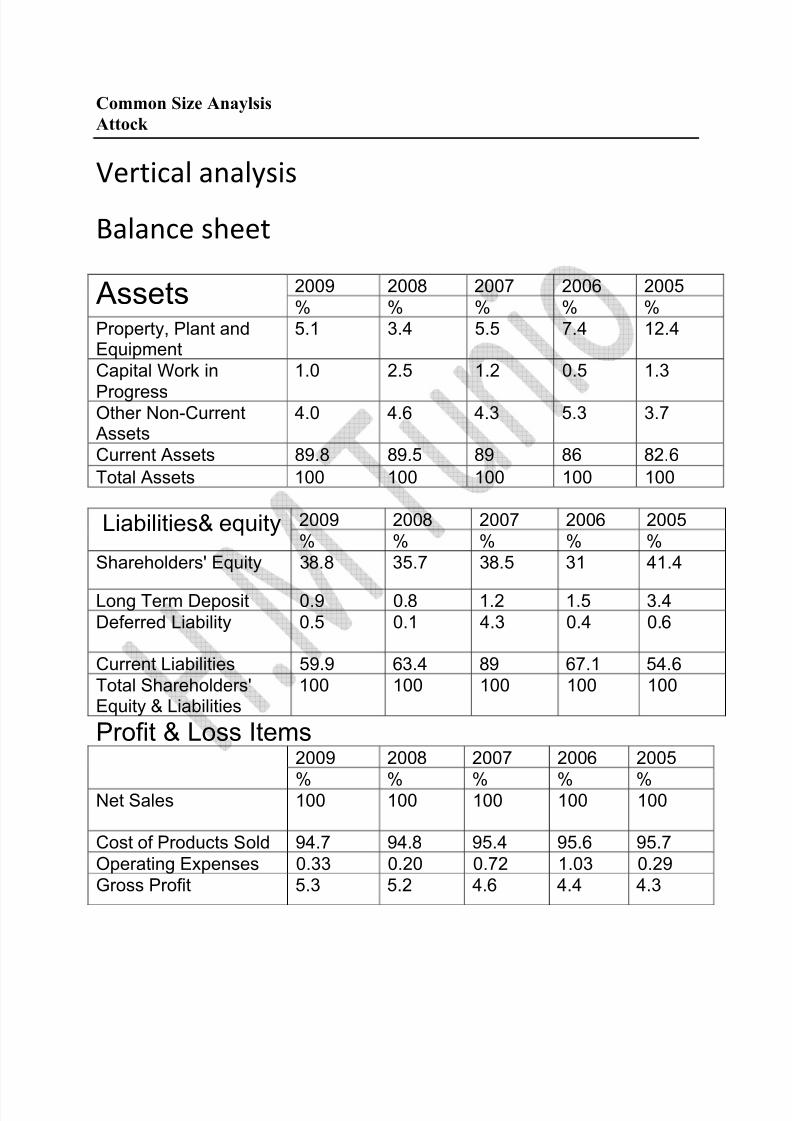
Common Size AnaylsisAttock
Vertical analysis
Balance sheet
Liabilities& equity 2009 200 8 2007 200 6 2005% % % % %
S hareholders' Equity 3 8 .8 35.7 3 8 .5 31 41.4
Long Term Deposit 0.9 0. 8 1.2 1.5 3.4Deferred Liability 0.5 0.1 4.3 0.4 0. 6
Current Liabilities 59.9 6 3.4 8 9 6 7.1 54. 6 Total S hareholders'Equity & Liabilities
100 100 100 100 100
Profit & Loss Items2009 200 8 2007 200 6 2005
% % % % %Net S ales 100 100 100 100 100
Cost of Products S old 94.7 94. 8 95.4 95. 6 95.7Operating Expenses 0.33 0.20 0.72 1.03 0.29Gross Profit 5.3 5.2 4. 6 4.4 4.3
Assets 2009 200 8 2007 200 6 2005% % % % %
Property, Plant andEquipment
5.1 3.4 5.5 7.4 12.4
Capital Work in
Progress
1.0 2.5 1.2 0.5 1.3
Other Non-Current Assets
4.0 4. 6 4.3 5.3 3.7
Current Assets 8 9. 8 8 9.5 8 9 86 8 2. 6 Total Assets 100 100 100 100 100
8/8/2019 Final Afs Report(New Report Final)
http://slidepdf.com/reader/full/final-afs-reportnew-report-final 32/37
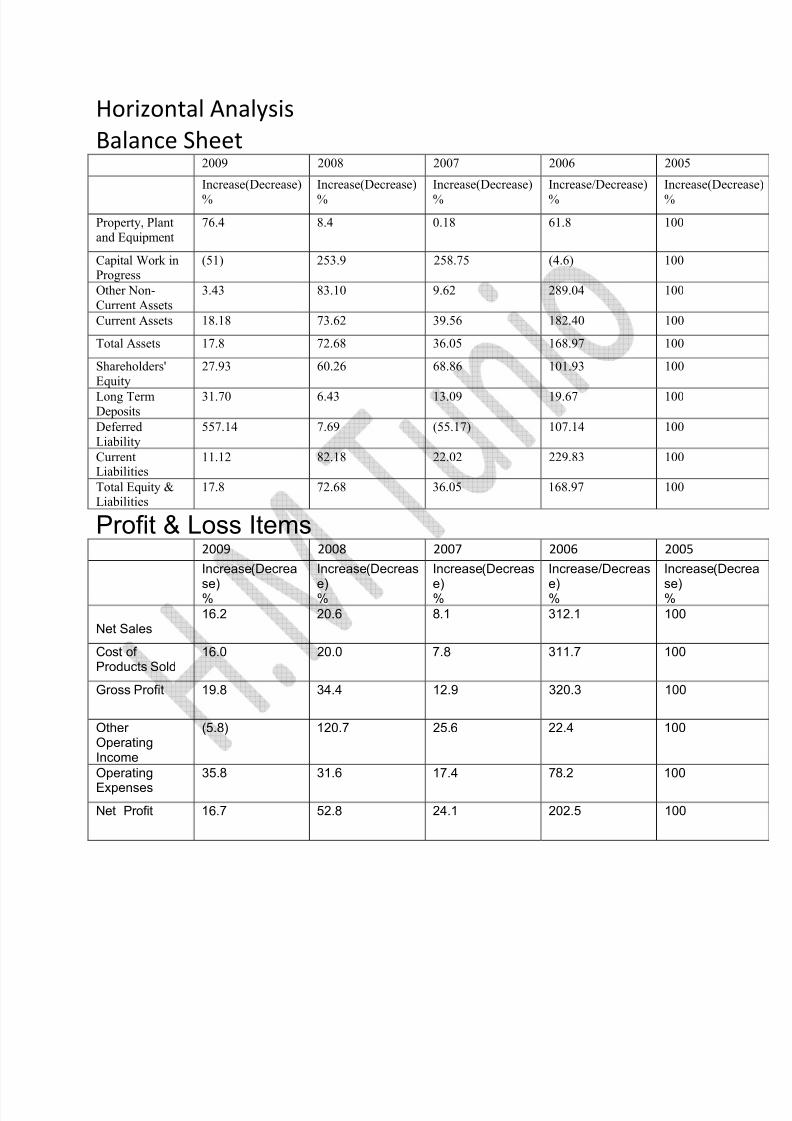
Horizontal AnalysisBalance Sheet
2009 2008 2007 2006 2005
Increase(Decrease)%
Increase(Decrease)%
Increase(Decrease)%
Increase/Decrease)%
Increase(Decrea%
Property, Plantand Eq uipment
76.4 8.4 0.18 61.8 100
C apital Work inProgress
(51) 253.9 258.75 (4.6) 100
Other Non-C urrent A ssets
3.43 83.10 9.62 289.04 100
C urrent A ssets 18.18 73.62 39.56 182.40 100
Total A ssets 17.8 72.68 36.05 168.97 100
Shareholders'Eq uity
27.93 60.26 68.86 101.93 100
Long TermDeposits
31.70 6.43 13.09 19.67 100
DeferredLiability
557.14 7.69 (55.17) 107.14 100
C urrentLiabilities
11.12 82.18 22.02 229.83 100
Total Equity &Liabilities
17.8 72.68 36.05 168.97 100
Profit & Loss Items2009 2008 2007 2006 2005Increase (Decrea
se)%
Increase (Decreas
e)%
Increase (Decreas
e)%
Increase/Decreas
e)%
Increase (Decr
se)%
Net S ales16 .2 20. 6 8 .1 312.1 100
Cost of Products S old
16 .0 20.0 7. 8 311.7 100
Gross Profit 19. 8 34.4 12.9 320.3 100
Other OperatingIncome
(5. 8 ) 120.7 25. 6 22.4 100
OperatingExpenses
35. 8 31. 6 17.4 7 8 .2 100
Net Profit 1 6 .7 52. 8 24.1 202.5 100

8/8/2019 Final Afs Report(New Report Final)
http://slidepdf.com/reader/full/final-afs-reportnew-report-final 33/37
Common Size Analysis
Shell Pakistan
In com e stat e m en t H orizo n ta l An a lysis
2009 2008 2007 2006 2005 Total Revenue 115221.51% 142.09% 11 6 .8 9% 119.14% 100%Cost of Revenue, Total 11 6 504. 8 5% 139.04% 121.1 6 % 119. 6 4% 100%Gross Profit 105688.02% 175.52% 70.32% 113.16% 100% S elling/General/Admin. Expenses, Total 5547.17% 139.40% 120.27% 11 8 .31% 100%Depreciation/Amortization 100.19% 9 8 .8 1% 8 5.42% 9 6 .88 % 100%Op e rati ng In com e 86841.21% 213.43% 29.35% 125.69% 100% Interest Expense, Net Non-Operating -345233. 6 1% 2 6 5.10% 274.9 8 % 120.2 8 % 100%Interest/Invest Income - Non-OperatingInterest Income (Exp), Net Non-
OperatingNe t In com e Be for e Tax e s 70970.22% 212.00% 10.40% 127.37% 100% Provision for Income Taxes 73972.9 8 % 21 6 .9 8 % -27.51% 125.27% 100%Ne t In com e Afte r Tax e s 695100.61% 209.58% 28.83% 128.40% 100% Diluted Normalized EP S 6 9.52% 20 8 .9 8 % 2 8 .8 3% 12 8 .40% 100%
V e rtica l An a lysis
Total Revenue 100% 100% 100% 100% 100%Cost of Revenue, Total 92.14% 8 9.17% 94.45% 91.50% 91.12%Gross Profit 7. 86 % 10.59% 5.1 6 % 8 .14% 8 .57%S elling/General/Admin. Expenses, Total 4. 8 2% 9 8 .23% 103.02% 99.42% 100.12%Depreciation/Amortization 0.00% 0.47% 0.50% 0.5 6 % 0. 68 %Op e rati ng In com e 3.04% 6 .0 6 % 1.01% 4.2 6 % 4.04%Interest Expense, Net Non-Operating 1.01% -0. 6 3% -0.79% -0.34% -0.34%Interest/Invest Income - Non-Operating 0.00% 0.15% 0.11% 0.04%Interest Income (Exp), Net Non-Operating 0.00% -0.07%
Ne t In com e Be for e Tax e s 2.2 8 % 5.52% 0.33% 3.9 6 % 3.70%Provision for Income Taxes 0.7 8 % 1. 8 5% -0.29% 1.27% 1.21%Ne t In com e Afte r Tax e s 15.02% 3. 6 7% 0. 6 1% 2. 68 % 2.49%
8/8/2019 Final Afs Report(New Report Final)
http://slidepdf.com/reader/full/final-afs-reportnew-report-final 34/37
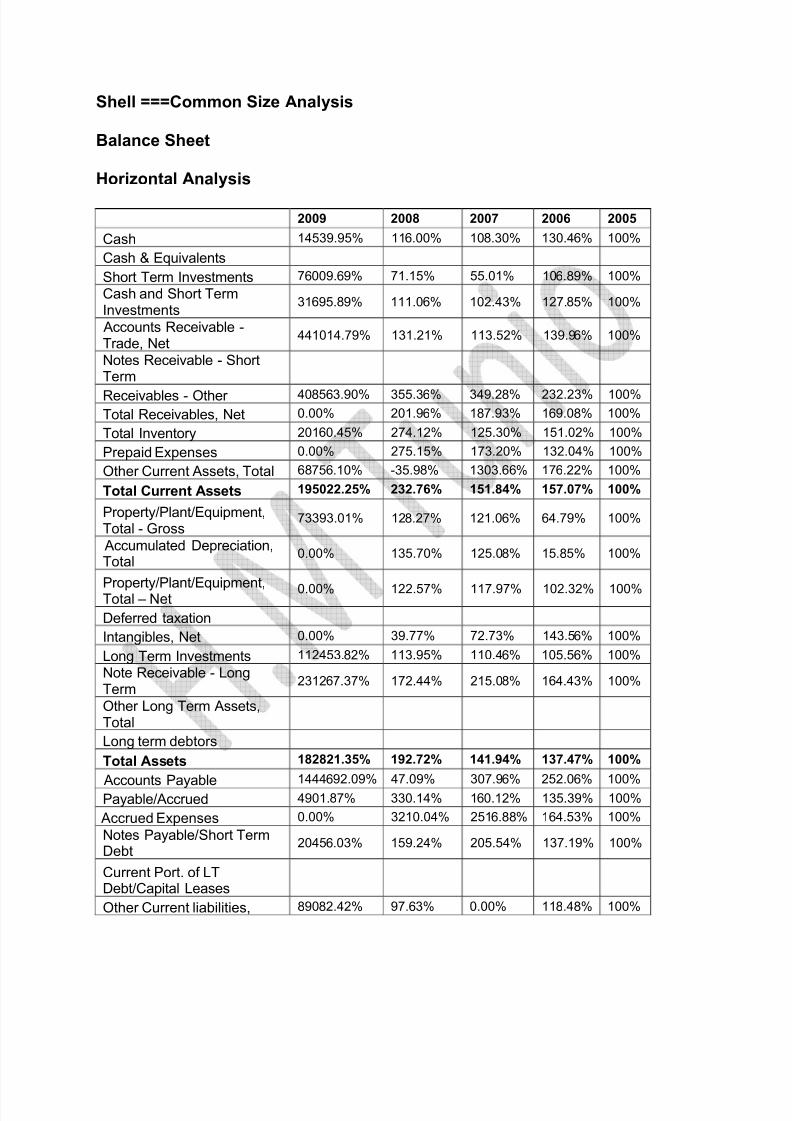
Shell ===Commo n S ize An a lysis
Ba la n c e Shee t
H orizo n ta l An a lysis
2009 2008 2007 2006 2005
Cash 14539.95% 11 6 .00% 10 8 .30% 130.4 6 % 100%
Cash & EquivalentsS hort Term Investments 76 009. 6 9% 71.15% 55.01% 10 6 .8 9% 100%Cash and S hort TermInvestments
31 6 95. 8 9% 111.0 6 % 102.43% 127. 8 5% 100%
Accounts Receivable -Trade, Net
441014.79% 131.21% 113.52% 139.9 6 % 100%
Notes Receivable - S hortTerm
Receivables - Other 40 8 56 3.90% 355.3 6 % 349.2 8 % 232.23% 100%Total Receivables, Net 0.00% 201.9 6 % 1 8 7.93% 1 6 9.0 8 % 100%
Total Inventory 201 6 0.45% 274.12% 125.30% 151.02% 100%
Prepaid Expenses 0.00% 275.15% 173.20% 132.04% 100%
Other Current Assets, Total 68 75 6 .10% -35.9 8 % 1303. 66 % 17 6 .22% 100%
Tota l Curr en t Ass e ts 195022.25% 232.76% 151.84% 157.07% 100%
Property/Plant/Equipment,Total - Gross
73393.01% 12 8 .27% 121.0 6 % 6 4.79% 100%
Accumulated Depreciation,Total
0.00% 135.70% 125.0 8 % 15. 8 5% 100%
Property/Plant/Equipment,Total ± Net 0.00% 122.57% 117.97% 102.32% 100%
Deferred taxationIntangibles, Net 0.00% 39.77% 72.73% 143.5 6 % 100%
Long Term Investments 112453. 8 2% 113.95% 110.4 6 % 105.5 6 % 100%Note Receivable - LongTerm
2312 6 7.37% 172.44% 215.0 8 % 1 6 4.43% 100%
Other Long Term Assets,TotalLong term debtorsTota l Ass e ts 182821.35% 192.72% 141.94% 137.47% 100%
Accounts Payable 14446
92.09% 47.09% 307.96
% 252.06
% 100%Payable/Accrued 4901. 8 7% 330.14% 1 6 0.12% 135.39% 100%
Accrued Expenses 0.00% 3210.04% 251 6 .88 % 1 6 4.53% 100%Notes Payable/ S hort TermDebt
2045 6 .03% 159.24% 205.54% 137.19% 100%
Current Port. of LTDebt/Capital LeasesOther Current liabilities, 8 90 8 2.42% 97. 6 3% 0.00% 11 8 .4 8 % 100%

8/8/2019 Final Afs Report(New Report Final)
http://slidepdf.com/reader/full/final-afs-reportnew-report-final 35/37
TotalTota l Curr en t Liabi litie s 225312.92% 190.91% 160.64% 147.25% 100%
Long Term DebtCapital Lease Obligations 1254907.9 8 % 13.50% 3.07% 42.94% 100%
Total Long Term Debt 122 6 9.94% 15350.92% 3.07% 42.94% 100%
Tota l De bt 0.00% 228.03% 205.52% 136.78% 100% Deferred Income Tax 0.00% 249.2 8 % 0.00% 252. 66 % 100%
Other Liabilities, Total 0.00% 6 00. 6 3% 434.17% 30 8 .15% 100%
Tota l Liabi litie s 246092.44% 212.19% 160.87% 147.71% 100%
Common S tock, Total 1952 8 9.42% 15 6 .23% 15 6 .23% 124.9 8 % 100% Additional Paid-InCapital/reserves
103457.55% 100.00% 100.00% 100.00% 100%
Retained Earnings( Accumulated Deficit)
78 133.1 8 % 1 86 .25% 11 6 .21% 129. 8 0% 100%
Tota l Equity 0.00% 1 6 3.93% 113.94% 122.32% 100%
Tota l Liabi litie s &Sh ar eh o lde rs' Equity182821.35% 192.72% 141.94% 137.47% 100%
Veritcal Analysis
2009 2008 2007 2006 2005
Cash 0.29% 2.20% 2.79% 3.47% 3. 6 5%
Cash & EquivalentsS hort Term Investments 0.19% 0.17% 0.17% 0.35% 0.45%
Cash and S hort Term Investments 0.71% 2.37% 2.9 6 % 3. 8 2% 4.11%
Accounts Receivable - Trade, Net43. 8 1% 12.37% 14.53% 1 8 .49% 1 8 .1 6 %
Notes Receivable - S hort TermReceivables ± Other 18 .72% 15.44% 20. 6 1% 14.15% 8 .3 8 %
Total Receivables, Net 0.00% 27. 8 1% 35.14% 32. 6 4% 2 6 .54%
Total Inventory 3.54% 45. 6 7% 2 8 .35% 35.27% 32.11%
Prepaid Expenses 0.00% 0.3 6 % 0.31% 0.24% 0.25%
Other Current Assets, Total 0.03% -0.01% 0.73% 0.10% 0.0 8 %
Tota l Curr en t Ass e ts 6 7.29% 7 6 .19% 6 7.4 8 % 72.0 8 % 6 3.0 8 %
Property/Plant/Equipment, Total ± Gross19.17% 31.7 8 % 40.72% 22.50% 47.75%
Accumulated Depreciation, Total 0.00% -14.59% -1 8 .2 6 % -2.39% -20.72%
Property/Plant/Equipment, Total ± Net0.00% 17.1 8 % 22.4 6 % 20.11% 27.02%
Deferred taxation 6 .79%
Intangibles, Net 0.00% 0.03% 0.07% 0.13% 0.13%
Long Term Investments 5.75% 5.53% 7.2 8 % 7.1 8 % 9.35%
Note Receivable - Long Term 0.52% 0.37% 0. 6 3% 0.49% 0.41%
Other Long Term Assets, Total 0.29% 0.70% 2.09%

8/8/2019 Final Afs Report(New Report Final)
http://slidepdf.com/reader/full/final-afs-reportnew-report-final 36/37
Long term debtors 0.1 8 %
Tota l Ass e ts 100.00% 100.00% 100.00% 100.00% 100.00%
Accounts Payable 6 2.97% 1.95% 17.29% 14. 6 1% 7.97%
Payable/Accrued 0.47% 30.23% 19.91% 17.3 8 % 17. 6 5%
Accrued Expenses 0.00% 3.79% 4.03% 0.27% 0.23%
Notes Payable/ S hort Term Debt 1.99% 14.72% 25. 8 0% 17.7 8 % 17. 8 1%
Current Port. of LT Debt/Capital Leases0.04% 0.14% 0.11%
Other Current liabilities, Total 7. 6 3% 7.94% 0.00% 13.50% 15. 66 %
Tota l Curr en t Liabi litie s 73.11% 5 8 .7 6 % 6 7.14% 6 3.54% 59.32%
Long Term Debt 6 .6 4% 6 .30% 0.00%
Capital Lease Obligations 0.54% 0.01% 0.00% 0.02% 0.0 8 %
Total Long Term Debt 0.01% 6 .31% 0.00% 0.02% 0.0 8 %
Tota l De bt 0.00% 21.17% 25.91% 17. 8 0% 17. 8 9%
Deferred Income Tax 0.00% 0.13% 0.00% 0.1 8 % 0.10%
Other Liabilities, Total 0.00% 0.4 8 % 0.47% 0.35% 0.15%Tota l Liabi litie s 8 0.30% 6 5. 68 % 6 7. 6 1% 6 4.10% 59. 66 %
Common S tock, Total 1. 8 2% 1.3 8 % 1. 88 % 1.55% 1.70%
Additional Paid-In Capital/reserves 5.57% 5.11% 6 .94% 7.1 6 % 9. 8 4%
Retained Earnings ( Accumulated Deficit)12.31% 27. 8 3% 23.5 8 % 27.19% 2 8 .8 0%
Tota l Equity 0.00% 34.32% 32.39% 35.90% 40.34%
Tota l Liabi litie s & Sh ar eh o lde rs' Equity100.00% 100.00% 100.00% 100.00% 100.00%
8/8/2019 Final Afs Report(New Report Final)
http://slidepdf.com/reader/full/final-afs-reportnew-report-final 37/37
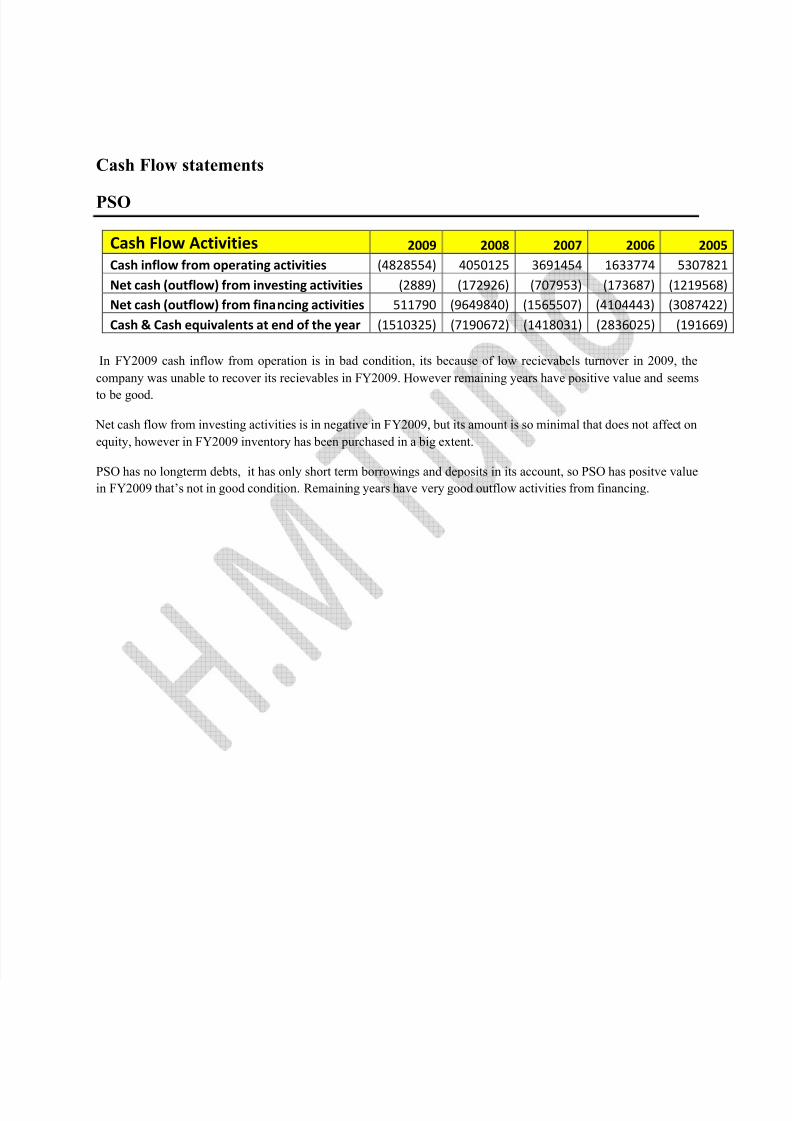
Cash Flow statements
PSO
Cash Flow Activities 2009 2008 2007 2006 2005Cash inflow from operating activities (4828554) 4050125 3691454 1633774 5307821Net cash (outflow) from investing activities (2889) (172926) (707953) (173687) (1219568)Net cash (outflow) from financing activities 511790 (9649840) (1565507) (4104443) (3087422)Cash & Cash equivalents at end of the year (1510325) (7190672) (1418031) (2836025) (191669)
In F Y 2009 cash inflow from operation is in bad condition, its because of low recievabels turnover in 2009, thecompany was unable to recover its recievables in F Y 2009. However remaining years have positive value and seems
to be good.
Net cash flow from investing activities is in negative in F Y 2009, but its amount is so minimal that does not affect onequity, however in F Y 2009 inventory has been purchased in a big extent.
PSO has no longterm debts, it has only short term borrowings and deposits in its account, so PSO has positve valuein F Y 2009 that¶s not in good condition. Remaining years have very good outflow activities from financing.
Related Documents