City of Renton RENTON TRAILS AND BICYCLE MASTER PLAN DRAFT JANUARY 2019

Welcome message from author
This document is posted to help you gain knowledge. Please leave a comment to let me know what you think about it! Share it to your friends and learn new things together.
Transcript

City of Renton
RENTON TRAILS AND BICYCLE MASTER PLAN
DRAFT JANUARY 2019


RENTON TRAILS AND BICYCLE MASTER PLAN
January 2019
Adopted January 28, 2019


ACKNOWLEDGMENTS
Executive
Mayor Denis Law
Chief Administrative Officer Robert Harrison
City Council Members
Don Persson, Council President
Carol Ann Witschi, Council President Pro-tem
Randy Corman
Ryan McIrvin
Armondo Pavone
Ruth Pérez
Ed Prince
Parks Commission
Cynthia Burns
Al Dieckman
Larry Reymann
Tim Searing
Shun Takano
Troy Wigestrand
Marlene Winter
Planning Commission
Angelina Benedetti, Commission Chair
Jamian Smith, Commission Vice Chair
Charles Seil, Commission Secretary
Mara Fiksdal
David Fleetwood
Shannon Matson
Michael O'Halloran
Kevin Poole
Robert Reeder
Technical Advisory Committee
Vicky Clarke, Cascade Bike Club
Bob Elliot, Member, Renton Trails Advisory Committee
Robert Foxworthy, King County Parks, Regional Trails Coordinator
Rhubydee Laurencio, Youth advocate
Pete Maas, Member, Renton Trails Advisory Committee
Tim Moore, City of Renton, GIS Manager

Dai’Jana Perry, Youth advocate
Mike Ullmer, King County Parks, Program/Project Manager
Brian VanHouten, Renton Trails, Non-Profit
Jean White, King County Parks, Regional Trails Program Manager
Project Team
Vangie Garcia, Transportation Planning Manager
Leslie Betlach, Parks Planning and Natural Resources Director
Angie Mathias, Long Range Planning Manager
Aaron Raymond, GIS Analyst
Consultants
2018-2019: BERK Consulting
2017: MacLeod Reckord, Fehr & Peers
YOUR IDEAS – CONNECTING US TO OUR BEST FUTURE
A special thank you to the many Renton community members who
provided their time and thoughtful ideas to inspire this 2019 Trails
and Bicycle Master Plan.

TABLE OF CONTENTS
Executive Summary i
Introduction i
Why Plan? i
Benefits of Walking & Bicycling ii
Relationship to Other Plans iii
Plan Organization iii
Plan Approval Process iv
Trail & Bicycle Master Plan iv
1 Vision, Goals, & Objectives 3
Introduction 3
Vision – Renton Connection 3
Goals & Objectives 4
2 Existing Conditions 11
Trails & Bicycle System Characteristics 11
Citywide Context 13
Planning Area Profiles 14
3 Community Involvement 47
Engagement Activities 47
Open Houses 54
Themes 56
4 Demand & Needs Analysis 61
Gaps & Opportunities 75
Benchmarks 80
Level of Service 81
5 Trail & Bicycle System Plan 87
Guiding Principles 87
Network Recommendations 88
Trail & Bicycle Facility Characteristics 93
Shared Use Path 96
Protected Bike Lane 97
Buffered Bike Lane 98
Striped Bike Lane 99
Neighborhood Greenway 100

Signed Shared Roadway 101
Pedestrian Trails 102
Facility Design Guidelines 103
Projects & Priorities 110
6 Implementation Strategies 121
Monitoring 121
Phasing 121
Partnership & Funding Opportunities 122
Requirements & Incentives 124
Community Education & Promotion 126
Future Recommendations 127
7 References 133
APPENDICES
A. Community Engagement
B. Regional Trail Design and Intersections
C. Project Sheets
D. Project Prioritization Documentation
E. Adopting Resolution

TABLE OF EXHIBITS
Exhibit ES 1. Levels of Traffic Stress vii
Exhibit ES 2. Level of Traffic Stress and Existing Network ix
Exhibit ES 3. Level of Traffic Stress and Proposed Network x
Exhibit ES 4. Existing and Proposed Trail Miles xi
Exhibit ES 5. Proposed Increases in Regional and Local Trail Miles xi
Exhibit ES 6. Proposed Regional and Local System Map xii
Exhibit ES 7. Prioritization Process xiii
Exhibit ES 8. Existing & Proposed Network and Project Map xv
Exhibit 2-1. Existing Trail Network Miles 11
Exhibit 2-2. Existing Trail Network 12
Exhibit 2-3. Citywide Demographic Characteristics 13
Exhibit 2-4. Existing and Proposed Network Miles by Community Planning Area 15
Exhibit 2-5. Community Planning Areas 16
Exhibit 2-6. Benson Hill Demographic Characteristics (within Renton City Limits) 17
Exhibit 2-7. Benson Hill Community Plan Area Characteristics 18
Exhibit 2-8. Benson Hill Planning Area Community Input 19
Exhibit 2-9. Cedar River Demographic Characteristics (within Renton City Limits) 20
Exhibit 2-10. Cedar River Community Plan Area Characteristics 21
Exhibit 2-11. Cedar River Planning Area Community Input 22
Exhibit 2-12. City Center Demographic Characteristics (within Renton City Limits) 23
Exhibit 2-13. City Center Community Plan Area Characteristics 24
Exhibit 2-14. City Center Planning Area Community Input 25
Exhibit 2-15. East Plateau Demographic Characteristics (within Renton City Limits) 26
Exhibit 2-16. East Plateau Community Plan Area Characteristics 27
Exhibit 2-17. East Plateau Planning Area Community Input 28
Exhibit 2-18. Highlands Demographic Characteristics (within Renton City Limits) 29
Exhibit 2-19. Highlands Community Plan Area Characteristics 30
Exhibit 2-20. Highlands Planning Area Community Input 31
Exhibit 2-21. Kennydale Demographic Characteristics 32

Exhibit 2-22. Kennydale Community Plan Area Characteristics 33
Exhibit 2-23. Kennydale Community Planning Area Community Input 34
Exhibit 2-24. Talbot Demographic Characteristics 35
Exhibit 2-25. Talbot Community Plan Area Characteristics 36
Exhibit 2-26. Talbot Planning Area Community Input 37
Exhibit 2-27. Valley Demographic Characteristics 38
Exhibit 2-28. Valley Community Plan Area Characteristics 39
Exhibit 2-29. Valley Planning Area Community Input 40
Exhibit 2-30. West Hill Demographic Characteristics (within Renton City Limits) 41
Exhibit 2-31. West Hill Community Plan Area Characteristics 42
Exhibit 2-32. West Hill Community Planning Area Community Input 43
Exhibit 3-1. Walking Problems 49
Exhibit 3-2. Community Input Walking 51
Exhibit 3-3. Biking Problem Spots 52
Exhibit 3-4. Community Input Biking 53
Exhibit 3-5. Outreach Themes Table 56
Exhibit 4-1. Questionnaire 2017 Walking and Biking Frequency 61
Exhibit 4-2. Population Density and Existing Network 63
Exhibit 4-3. Job Density and Existing Network 64
Exhibit 4-4. Existing Trail Access to High-Density Residential and Job Nodes 65
Exhibit 4-5. Level of Traffic Stress Continuum 66
Exhibit 4-6. Level of Traffic Stress and Existing Network 67
Exhibit 4-7. Parks and Recreation and Existing Network 69
Exhibit 4-8. Low Income Census Tracts and Existing Network 71
Exhibit 4-9. PSRC Opportunity Index and Existing Network 73
Exhibit 4-10. Population Density and Proposed Network 76
Exhibit 4-11. Job Density and Proposed Network 77
Exhibit 4-12. Level of Traffic Stress with ¼ Mile Service Area and Proposed Network ¼ Mile Service Area LTS 1 & 2 78
Exhibit 4-13. PSRC Opportunity Index and Proposed Network 79
Exhibit 4-14. Miles of Trails per 1,000 Population – Renton and Peers 80
Exhibit 4-15. Miles of Trails per 1,000 (2018 – 2035) 81
Exhibit 4-16. Change LTS 1&2 Trail Miles 82
Exhibit 4-17. Existing and Proposed Trail Miles by Community Planning Area 82
Exhibit 4-18. Percentage of Renton Residents within a Quarter Mile Service Area of LTS 1 & 2 Facilities 83

Exhibit 5-1. Existing and Proposed Trail Miles 88
Exhibit 5-2. Regional and Local System Map 89
Exhibit 5-3. Existing and Proposed Regional Trail Miles 90
Exhibit 5-4. Regional Trail Alternatives 91
Exhibit 5-5. Regional and Local Trail Miles – Existing and Proposed 92
Exhibit 5-6. Regional and Local Trail Miles – Total Proposed Network 92
Exhibit 5-7. Facility Options by Roadway Characteristics 93
Exhibit 5-8. Existing and Proposed Network by Facility Type (Miles and Percent) 94
Exhibit 5-9. Existing and Proposed Trails by LTS Rating (Miles and Percent) 95
Exhibit 5-10. Shared-Use Path 96
Exhibit 5-11. Protected Bike Lane 97
Exhibit 5-12. Buffered Bike Lane 98
Exhibit 5-13. Striped Bike Lane 99
Exhibit 5-14. Neighborhood Greenway 100
Exhibit 5-15. Signed Shared Roadway 101
Exhibit 5-16. Pedestrian Trails 102
Exhibit 5-17. Renton Downtown Civic Core Wayfinding System 105
Exhibit 5-18. Bicycle Leaning Rail 107
Exhibit 5-19. Existing & Proposed Network and Project Map 111
Exhibit 5-20. Prioritization Criteria and Indicators 113
Exhibit 5-21. Prioritization Process 114
Exhibit 5-22. Facility Types by Project Tiers (Miles) 115
Exhibit 5-23. Project Ranking 116
Exhibit 6-1. Potential Monitoring Measures and Targets 121

THIS PAGE IS INTENTIONALLY BLANK

CITY OF RENTON � RENTON TRAILS AND BICYCLE MASTER PLAN
JANUARY 2019
EXECUTIVE SUMMARY

RENTON TRAILS AND BICYCLE MASTER PLAN � CITY OF RENTON
THIS PAGE IS INTENTIONALLY BLANK

CITY OF RENTON � RENTON TRAILS AND BICYCLE MASTER PLAN
JANUARY 2019 EXECUTIVE SUMMARY
i
EXECUTIVE SUMMARY
INTRODUCTION
The City of Renton manages over 30 miles of regional and local
trails and bicycle facilities. Most residents walk or bike in Renton in
their neighborhoods. Yet existing trail and bicycle facilities serve
only about one-third of Renton’s population and about two thirds of
employees. Many neighborhoods have limited and disconnected
facilities.
The City of Renton prepared a Trails and Bicycle Master Plan in
2009, one of few municipalities in Washington State addressing
both pedestrian and bicycle modes in one plan. The 2009 plan
steered several trail and bicycle lane extensions, and acquisitions
for future extensions. (See sidebar.)
Building on the prior plan, this Trails and Bicycle Master Plan will
guide Renton’s Trails and Bicycle system for the 2019-2025
timeframe. With the Plan, the City can seek funding and
partnerships to invest in its historic neighborhoods as well as newer
communities annexed with little trail and bicycle facility investments.
Extensive community outreach has inspired this plan. By 2025 and
beyond, this plan seeks to create one connected diverse system to
support Renton’s growing population and thriving economy. The
system will increase comfort and encourage all ages and abilities to
find destinations, recreate, and commute throughout Renton and the
region.
WHY PLAN?
Eligibility for State Funding
An update to this Plan is required every six years to maintain
eligibility for grants administered by the Washington State
Recreation and Conservation Office (RCO). RCO requires
jurisdictional applicants to have a plan as a criterion for grant
applications. This Plan is intended to comply with all RCO
requirements. This plan can also serve as a foundation to seek other
The City of Renton, alone and in partnership, implemented projects guided by the 2009 Trails and Bicycle Master Plan.
Improvements
Cedar River Trail Turnback Eastside Rail Corridor rail
removal (King County lead) Logan Ave Shared Use Trail May Creek Trail construction
(WRPA Trail and Outdoor Access Award 2015)
Springbrook Trail Boardwalk (WRPA Best Trail Project Award 2010)
Bike Lanes, e.g. NE 4th St and Duvall Ave
Signed Shared Roadways, e.g. Taylor Ave
Acquisition & Funding
Lake to Sound Trail: interlocal agreement, construct segment along Black River Riparian Forest to Green River Trail in Tukwila
May Creek Trail Acquisitions: 6 parcels, 14.7 acres
May Creek Trail Property Donations: 4 parcels, 8.4 acres
Sam Chastain Waterfront Trail: Southport Easement, 4 of 4
Tiffany/Cascade Connector acquisition: 1 parcel
Local grants totaling $1,624,500
State Legislative Direct Appropriation: May Creek Trail, $500,000

RENTON TRAILS AND BICYCLE MASTER PLAN � CITY OF RENTON
JANUARY 2019 EXECUTIVE SUMMARY
ii
regional, state, and federal funding opportunities for non-motorized
transportation improvements.
Articulates a Vision that Directs Practices
This plan includes a Vision for an accessible, diverse, and safe trail and
bike system that offers places for active recreation, community connection,
and equitable access to destinations and opportunities. This Vision is
based on community input and inspired proposed projects intended to
increase user comfort and reduce traffic stress to encourage walking and
biking throughout the community.
Efficiently Manages System
This Plan is designed to efficiently manage the trail and bike system by:
Building on the existing regional and local system,
Providing a variety of facility types and phasing to maintain flexibility
to respond to different route conditions and funding resources,
Connecting residents and employees with job centers, shopping,
recreation, and services to advance economic and community
development, and
Serving a diverse and growing population and addressing increased
demands on the system.
BENEFITS OF WALKING & BICYCLING
Well-designed communities with recreation facilities can help Renton
residents to lead more active lifestyles benefiting their health and well-
being. The built environment can severely constrain routine avenues of
physical activity. It is less attractive to walk or bike in areas with no
facilities, high traffic, or long distances between origins and destinations.
Communities designed for exercise can prevent 90 percent of type 2
diabetes, as well as 50% of heart disease, stroke, and site-specific
cancers. There is a 50% increased likelihood that people who live near
trails meet physical activity guidelines. (University of Minnesota. August
2007; Journal of Applied Physiology and Public Health Institute in Urban
Land Institute 2013)
Current System
The current system (yellow) serves the City Center, Cedar River, Springbrook Creek, May Creek, Honey Creek, and major arterials but does not cover most of the Renton’s higher density population centers (blue).

CITY OF RENTON � RENTON TRAILS AND BICYCLE MASTER PLAN
JANUARY 2019 EXECUTIVE SUMMARY
iii
Those participating in Renton’s online questionnaires in 2017 participate in
walking at a rate of about 85%, similar to state survey information.
Improving facilities can help reinforce interest and participation.
Parks and recreation facilities like trails, and access to centers and open
spaces, provide economic value to a community by increasing property
values, attracting long-term residents and employers, and supporting
tourism. (American Planning Association 2001; Trust for Public Land, 2011)
RELATIONSHIP TO OTHER PLANS
This Renton Trails and Bicycle Master Plan is designed to implement
Renton’s Comprehensive Plan Land Use; Parks, Recreation, Natural Areas
and Trails; and Transportation Elements. This Plan establishes the
framework for future improvements and is a source of non-motorized
project improvements for the City’s Capital Facilities Plan Element, Six-year
Capital Investment Program, and the Transportation Improvement Program.
This Plan is a companion system plan to the Renton’s Parks, Recreation, and
Natural Areas Plan. This Plan is designed to be consistent with and
leverage community plans such as the City Center Community Plan, Benson
Hill Community Plan, and the Downtown Renton Civic Core Vision and
Action Plan, and to implement the City Council’s Policy Agenda.
PLAN ORGANIZATION
This plan is organized in seven sections building from a Vision to a Demand
and Needs Analysis to a System Plan with prioritized projects. Community
engagement and input informed each component of the plan.
Implementation strategies complete the plan and identify monitoring and
next steps.
Vision, Goals & Objectives
Existing Conditions
Community Involvement
Demand and Needs Analysis
Trail & Bicycle System Plan
Implementation Strategies
References
Appendices
RENTON TRAILS AND BICYCLE MASTER PLAN � CITY OF RENTON
JANUARY 2019 EXECUTIVE SUMMARY
iv
PLAN APPROVAL PROCESS
Following extensive community and stakeholder outreach in 2017 where
questionnaires and workshops were conducted, this Plan was reviewed and
shaped by the Renton Parks Commission, Renton Planning Commission, and
Renton City Council in 2018 and 2019.
TRAIL & BICYCLE MASTER PLAN
This section highlights major elements of this Plan including the Vision and
Goals, Community Involvement, Demand and Need, Level of Service,
Network Recommendations, Projects and Priorities, and Implementation
Strategies. For details see related Chapters.
2017
•Stakeholder OutreachInventory & Analysis
Winter-Spring 2018
•Project Development
Summer-Fall 2018
•Plan Development
Fall 2018-Winter 2019
•Commission &Council Review

CITY OF RENTON � RENTON TRAILS AND BICYCLE MASTER PLAN
JANUARY 2019 EXECUTIVE SUMMARY
v
Vision & Goals
The Plan Vision and Goals and Objectives directed the development of the
proposed network and projects included in this Master Plan and will
continue to guide planning, funding, and implementing actions in the future.
Community Involvement
The City conducted an extensive public outreach and engagement process
in 2017 to help form this Plan, including:
An online questionnaire with 340 full and partial responses
An interactive online mapping activity attracting 1,380-page views
and 342 data points
Three in-person community open houses
The Plan Vision describes Renton’s ideal future Trails and Bicycle system:
The Trails and Bicycle Master Plan fosters an integrated trail and bicycle system that connects
the City’s neighborhoods, community, and region. Residents, employees, and visitors can
access a diverse system in urban and natural settings that are safe and comfortable for users
of all ages and abilities. People can recreate, exercise, and/or commute for an active,
healthy lifestyle.
Reflecting the Vision, Goals describe desired results of this Plan:
• Improving safety
• Creating an accessible and connected system
• Promoting physical and environmental health
• Achieving equity
• Enhancing the economy and community

RENTON TRAILS AND BICYCLE MASTER PLAN � CITY OF RENTON
JANUARY 2019 EXECUTIVE SUMMARY
vi
Three Technical Advisory Committee meetings, and with regional
stakeholders
Two Interagency Regional Trails planning meetings with King County
Project briefings with the Parks Commission, Planning Commission, and
the Renton City Council
Based on outreach and engagement results, key findings include:
1. Recreation-based walking and biking is still a primary purpose.
2. Respondents preferred to walk shorter distances.
3. Respondents reported longer and more frequent bicycle trips.
4. Respondents preferred to walk and bike on formal facilities, as opposed to
street shoulders.
5. The Cedar River Trail is the most heavily used trail.
6. Addressing pedestrian and bicyclist comfort is necessary to encouraging
more travel and recreation by foot or bike.
7. Connection to transit is an important need.
8. Mountain biking and other more unique forms of bicycling are popular
along lakes, streams, and rivers.
9. Equestrian use was not an identified need.
See Chapter 3 and Appendix A for Community Engagement details.
Demand & Needs for Trails and Bicycle Facilities
To meet state requirements for planning, the City needs to define
community needs and demand for trail and bicycle facilities. By
understanding gaps and trends, the City can develop solutions like projects
and actions. Particular needs and demands are highlighted below.
Discontinuous Trail and Bicycle Network: Renton’s current trail and bike
routes serve several of the highest population and job density areas,
though there are gaps particularly in the northeast and southeast parts of
the city.
Increased Growth and Demand: By 2035, the City has planned to add
16,700 housing units and over 31,000 jobs per the Renton Comprehensive
Plan. The new residents and employees would increase the demand for all
modes of travel including walking and biking.

CITY OF RENTON � RENTON TRAILS AND BICYCLE MASTER PLAN
JANUARY 2019 EXECUTIVE SUMMARY
vii
Limited Low Traffic Stress Routes for Bicycles: Bicycle systems that
provide low traffic stress and high connectivity attract wider usage. Bicycle
routes can be rated based on the level of traffic stress (LTS) a user
experiences. (Mineta Transportation Institute, 2012)
Exhibit ES 1 illustrates that lower LTS facilities serve a broader group of
users because of increased comfort and safety. Renton has some LTS 1 & 2
routes, which are in Kennydale, Cedar River, and the Valley. Most of the
community is not served by LTS 1& 2 routes that offer off-road trails or
dedicated and separated bicycle lanes.
Exhibit ES 1. Levels of Traffic Stress
Source: City of Renton, 2018; BERK, 2018.
Discontinuous Access to Destinations: Schools, parks, and employment
centers are partially linked by trails and bicycle routes. There are missing
links and gaps that deter non-motorized travel.
Limited Access to Opportunities: The Puget Sound Regional Council (PSRC)
has evaluated areas in terms of access to opportunities – education,
economic, housing, transportation, and health/environment. The trail and
bicycle network can increase opportunities by providing access for areas
of lesser opportunity. The existing network is sparser in a few of the
Community Planning Areas of Benson, Highlands, and West Hill (see
sidebar and Chapter 2).

RENTON TRAILS AND BICYCLE MASTER PLAN � CITY OF RENTON
JANUARY 2019 EXECUTIVE SUMMARY
viii
Level of Service
A “level of service” (LOS) refers to the amount and quality of trails and
bicycle facilities that are necessary to meet current and future needs. A
LOS helps establish a capital facility program. Costs and revenue can then
be matched, and projects phased to help achieve the planned LOS. The
City has developed a three-part LOS addressing quantity, quality, and
distribution.
Quantity: Increase the miles of trails per 1,000 persons.
Quality: Increase the extent of LTS 1 and LTS 2 facilities to increase
user comfort and participation.
Connectivity and Extent (Distribution):
a. Reduce gaps and increase the coverage of facilities within all
Renton community planning areas.
b. Increase the share of residents and employees within a quarter
mile of facilities.
By implementing these levels of service, the City can close gaps and meet
demands. For example, population and jobs in proximity to LTS 1& 2
network shows nearly all areas of the community would have improved
access. See Exhibit ES 2 and Exhibit ES 3.
Community Planning Areas
The City of Renton has defined 10 Community Planning Areas. Each have different characteristics and needs. See Chapter 2.

CITY OF RENTON � RENTON TRAILS AND BICYCLE MASTER PLAN
JANUARY 2019 EXECUTIVE SUMMARY
ix
Exhibit ES 2. Level of Traffic Stress and Existing Network

RENTON TRAILS AND BICYCLE MASTER PLAN � CITY OF RENTON
JANUARY 2019 EXECUTIVE SUMMARY
x
Exhibit ES 3. Level of Traffic Stress and Proposed Network

CITY OF RENTON � RENTON TRAILS AND BICYCLE MASTER PLAN
JANUARY 2019 EXECUTIVE SUMMARY
xi
Network Recommendations
Renton’s Trail and Bicycle System is an integrated system that will be
expanded from about 30 miles to 127 miles within the city limits. This
includes approximately 4 miles of existing trail facilities being upgraded
or converted to different facility types. Another 8 miles of new, proposed
trails are planned in areas immediately outside of Renton’s city limits for an
overall plan total of 135 miles. See Exhibit ES 4.
Exhibit ES 4. Existing and Proposed Trail Miles
CITY LIMITS OVERALL PLAN
Existing 30.20 30.20
Proposed 101.94 109.46
TOTAL 127.81 135.32
Source: City of Renton, 2018.
The Trail and Bicycle System features a regional hub where the Cedar
River trail, Lake to Sound Trail and the connection to the Eastside Rail
Corridor connect in the City Center, and an expanded local network of
trails. Regional trails connect Renton to other cities and regional
destinations that lie to the north, east, south, and west. Local Connector
routes tie together multiple Renton neighborhoods to one another and carry
more non-motorized trips. Local Neighborhood routes connect destinations
within the same neighborhood. See Exhibit ES 5 and Exhibit ES 6.
Exhibit ES 5. Proposed Increases in Regional and Local Trail Miles
Source: City of Renton, 2018; BERK, 2018.

RENTON TRAILS AND BICYCLE MASTER PLAN � CITY OF RENTON
JANUARY 2019 EXECUTIVE SUMMARY
xii
Exhibit ES 6. Proposed Regional and Local System Map

CITY OF RENTON � RENTON TRAILS AND BICYCLE MASTER PLAN
JANUARY 2019 EXECUTIVE SUMMARY
xiii
Projects & Priorities
Responding to gaps, needs, and community input, this plan promotes trail
and bicycle facilities of all types across all Community Planning Areas.
Eighty proposed projects were identified and scored with the
following Prioritization Criteria developed from Vision and Goals:
Connectivity and Accessibility, Safety and Trail Experience, Equity,
Economy and Community, Construction and Implementation.
In addition, the City used two qualitative criteria to develop the Highest
Priority Projects list (Tier 1): Partnership Commitments and Geographic
equity. Since all proposed projects are important to the City, Tier 2 (High
Priority) and Tier 3 (Medium) Priority were developed to distinguish the
rest of the projects. See Exhibit ES 7 for the overall process.
Exhibit ES 7. Prioritization Process
Source: BERK, 2018.
Once scored, three tiers of projects were developed with Tier 1 identifying
the top priority projects for the City. The other two tiers spanned the
natural breaks in the scores. Since some projects had identical scores, there
were 27 projects in Tier 1, 26 projects in Tier 2, and 27 projects in Tier 3.
These proposed projects added 101.9 miles to the Trails and Bicycle
network via multiple facilities types.
Define & Weight Priorities
Define & Score Indicators
Rank Projects
Consider Partnerships & Geographic
Equity
Develop Prioritized List


n
n
n
n
n
n
n
n
n
n
n
n
n
n
n
n
n
n
n
n
n
n
n
n
n
n
n
n
n
n
n
n
n
n
n
n
n
n
n
n
n
n
n
!(
!(
!(
!(
!(
!(
!(
!(
!(
!(
!(
!(
!(
!(
!(
!(
!(
!(
!(
!(
!(
!(
!(
!(
!(
!(
!(
!(
!(
!(
!(
!(
!(
!(
!(
!(
!(
!(
!(
!(!(
!(!(
!(
!(
!(
!(
!(
!(
!(
!(
!(
!(
!(
!(
!(
!(
!(
!(
!(
!(
!(
!(
!(
!(!(
!(
!(
!(
!(
!(
!(
!(
!(
!(
!(!(
!(
!(
!(
!(
!(
!(
!(
!(
!(
!(
!(
!(
!(
!(
!(
!(
!(
!(
!(
!(
!(
!(
!(
!(
!(
!(
!(
!(
!(
!(
!(
!(
!(
!(
!(
!(
!(
^
^
^
^
^
^
^
Hoquiam Ave NE
Talbot Rd
S
SEJonesRd
SPug
etDr
Lind Ave SW
Monroe Ave NE
Edmonds Ave NE
S 7th St
Newcastle Way
116th Ave SE
87th Ave S
WellsAve
S
148th Ave SE
128th Ave SE
SE 216th St
Benson Rd S
SE183rdSt
SW 41st St
SE 168th St
Union Ave NE
SW 7th St
Lake
WashingtonBlvd
SE
Puget Dr SE
SEMayValleyRd
SW 34th St East Valley Rd
SW 27th St
E Valley Hwy
84th Ave S
S 216th St
SouthcenterBlvd
SE 192nd St
S 228th St
154thPlSE
S 132nd St
N3rdSt
64th Ave S
Island Crest W
ay
TukwilaPkwy
SE 208th St
68th Ave S
Duvall Ave NE
S129thSt N 4th St SE 128th St
Interurban Ave S
Rainier Ave S
124th Ave SE
NE 4th St
Rainier
Ave
N
4thAve
N
CoalC
reekPkw
ySE
S212thW
ay
NE3rd
St
EMercerW
ay
140th Ave SE
OakesdaleAve
SW
RentonAve
S N
ParkDr
SW 43rd St SE
CarrRd
BeaconAve
S
LoganAve
N
Forest Dr SE
S212thSt
SGradyW
ay
Park Ave N
132nd Ave SE
156th Ave SE
S124thSt
148th Ave SE
Lakem
ont Blvd SE
116th Ave SE
S 180th St
66th Ave S
164th Ave SE
AirportWay
SWGrady
Way
SE 204t
h Way
WMerce
rWay
Monster
Rd
SW
SEMayValleyRd
140thWaySE
SE Petrovitsky Rd
NewcastleGolfClubRd
68thAveS
S 133rd St
UV169
UV900
UV515
UV900
UV181
UV167
¥405
¥405
¥405
27
38
45
S 7th St
SunsetBlvd
N
NE 23rd Pl
NESun
setBlvd
SE 160th St
NE 6th St
NE 19th St
N 30th St
NE 10th St
NE27thSt
SE 164th St
Park Ave N
Main Ave S
NE 24th St
Jericho Ave NE
NE 10th St
TalbotRd
S
NE6thSt
NE 7th St
MontereyAve
NE
125th Ave SE
N 8th St
NE 10th St
NE 4th St
SE 184th St
NE9thStBeacon
W
ayS
NE 2nd St
RentonAveS
Garden Ave N
Nile Ave NE
GrantAveS
SE 164th St
108th Ave SE
HarringtonAve
NE
NE12thSt
Kirkland Ave NE
BensonDrS
SE Petrovitsky Rd
Lake
WashingtonBlvd
N
Talbot Rd S
Black RiverRiparianForest
Cascade Park
Cavanaugh PondNatural Area
Cedar River Natural Area
CedarRiverPark
Cedar River toLake Sammamish
Trail Site
Cedar RiverTrail
Cedar RiverTrail Park
Cleveland /RichardsonProperty
CoalfieldPark
Cougar MountainRegional
Wildland Park
EdlundProperty
Fort Dent
FosterGolf Course
FutureSW AthleticComplex
Gene CoulonMemorial Beach
Park
GreenRiverTrail
Honey CreekGreenway
LakeridgePark
MaplewoodCommunity Park
MaplewoodGolf Course
MaplewoodHeights Park
MayCreek
/ McAskill
May CreekGreenway
MayValley County
Park
McGarveyPark OpenSpace
MetroWaterworkPark
NARCOProperty
Panther CreekWetlands
PetrovitskyPark
Renton Park
RentonWetlands
Riverview Park
Ron RegisPark
SkywayPark
SoosCreek Park andTrail
SpringbrookTrail
SpringbrookWatershed
1
1
2
3
4
4
5
5
6
6
7
8
8
9
9
10
10
11
11
12
12
13
14
14
15
15
16
17
18
19
19
20
20
21
22
23
24
24
24
2526
28
28
29
30
31
32
33
34
35
36
37
39
40
41
42
43
44
46
47
47
4848
49
50
51
52
52
54
55
56
56
5758
59
60
61
62
62
63
63
64
65
65
66
66
67
67
67
68
68
68
69
70
71
72
73
74
74
75
76
77
77
78
79
79
80
63
3
53
53
Existing & Proposed Trails and Bicycle Network
Lake Washington
Existing TrailsShared Use Path
Striped Bike Lane
Signed Shared Roadway
Pedestrian Trail
Proposed TrailsShared Use Path
Protected Bike Lane
Striped Bike Lane
Neighborhood Greenway
Signed Shared Roadway
Pedestrian Trail
Parks & Open Space
^ Community Center
Library
Potential Transit Hub
n School°0 0.5 1Miles
Proposed Project Number, Name
1, 116th Avenue SE Bike Lanes
2, 128th Avenue SE Bike Lanes
3, 156th Avenue SE Bike Lanes
4, Benson Drive S/108th Avenue SE Shared Use Path
5, Benson Neighborhood Greenway
6, Benson Road/Main Avenue S Bike Lanes
7, Cascade Waterline Spur Trail
8, Cedar to Sammamish Trail
9, Duvall Avenue NE Bike Lanes
10, East Valley Road Shared Use Path
11, Eastside Rail Corridor
12, Edmonds Avenue Connector
13, Garden Avenue N Shared Use Path
14, Glencoe Neighborhood Greenway
15, Grant Avenue Neighborhood Greenway
16, Hardie Avenue Bike Lane & Shared Use Path
17, Harrington Ave NE Neighborhood Greenway
18, Highlands Hillclimb
19, Hillcrest Neighborhood Greenway
20, Honey Creek Trail Extensions
21, Houser Way and Factory Avenue
22, Houser Way N Shared Use Path
23, Jericho Avenue NE Bike Lanes
24, Kennydale Neighborhood Greenway
25, Kennydale Signed Shared Roadway
26, Kenyon-Dobson Trail and Trailhead
27, Lake to Sound Trail: East Segment
28, Lake to Sound Trail: West Segment
29, Lake Washington Loop Trail
30, Langston Road/SW 134th Street Hillclimb
31, Logan Avenue N Shared Use Path
32, Maplewood Heights Neighborhood Greenway
33, May Creek Hillclimb
34, May Creek Trail
35, May Valley Trail
36, Mill Avenue S Signed Shared Roadway
37, Monroe Avenue NE Bike Lanes
38, N 4th Street Connector
39, N 6th Street Bike Lanes
40, N 8th Street Shared Use Path
41, Naches Avenue Shared Use Path
42, NE 3rd Street
43, NE 4th Street Bike Lanes
44, NE 12th Street Bike Lanes
45, NE 16th Street Signed Shared Roadway
46, NE Sunset Blvd Shared Use Path
47, Nile Avenue NE Bike Lanes
48, North Highlands Neighborhood Greenway
49, North Southport Drive Shared Use Path
50, Oakesdale Avenue Bike Lanes
51, Pacific Railroad Trailhead & Trail
52, Panther Creek Trail
53, Powerline Trail
54, Puget Drive Bike Lanes & Signed Shared Roadway
55, Renton Connector
56, Renton Park Neighborhood Greenway
57, S 2nd Street Protected Bike Lanes
58, S 3rd Street Signed Shared Roadway
59, S/SW 7th Street Transit Connector
60, Sam Chastain Waterfront Trail
61, SE 168th Street Protected Bike Lanes
62, SE 182nd & 184th Streets Neighborhood Greenway
63, SE Petrovitsky Road Shared Use Path
64, Seattle Waterline Spur Trail
65, Seattle Waterline Trail
66, Shattuck to Airport Connector
67, Soos Creek Trail
68, South Highlands Neighborhood Greenway
69, Springbrook Trail
70, Springbrook Trail Extension
71, Sunset Boulevard Hillclimb
72, SW 16th Street Shared Use Path
73, SW 27th Street Connector
74, Talbot Road S Bike Lanes
75, Thunder Creek Trail
76, Tiffany-Cascade Connector Trail
77, Tiffany Park Neighborhood Greenway
78, Tukwila Station Trail
79, Union Avenue NE Bike Lanes
80, Wells Avenue S Signed Shared Roadway
Highest Priorty Project


CITY OF RENTON � RENTON TRAILS AND BICYCLE MASTER PLAN
JANUARY 2019 EXECUTIVE SUMMARY
xvii
Implementation Strategies
A plan is meaningful when it is implemented. This Master Plan identifies
several strategies and future recommendations to develop a unified trail
and bicycle system for the Renton community.
Monitoring: The City will track its performance periodically to determine
progress on plan implementation and to adaptively manage its resources.
The Performance measures can potentially include:
Percentage of bicycle facility network completed in gaps, to schools,
to parks.
Percentage increase in LTS 1or 2 network.
Percentage of households within ¼ mile of network. Percentage
increase in network serving children, elderly, households in poverty.
Percentage increase in access to high density residential or commercial
zones, transit, or services. Percentage progress on Tier 1 Projects.
Projects programed and completed in six-year CIP.
Phasing and Fee in Lieu: Renton may phase improvements and consider
alternative trail and bicycle facility types and cross sections. The City could
implement development requirements for trail or bicycle facilities or a fee
in lieu.
Partnerships: Continue existing and seek new partnerships to
advance funding for design and construction of priority
projects.
Current and Future Funding: Continue existing funding
sources and pursue other funding sources that would be
dedicated to the provision of trails and bicycle facilities.
Requirements: Update city regulations to reference this plan
and adopt new regulations that require trail easements for
areas where key local or regional trails have been identified
in this plan.
Incentives: Continue incentive programs, like Commute Trip
Reduction programs by large employers develop incentives for developers
when amenities for transit users, bicyclists, and pedestrians are included in
their plans.
Eastside Rail Corridor in Renton, ceremonial spike-pulling event, Renton Reporter, October 2017

RENTON TRAILS AND BICYCLE MASTER PLAN � CITY OF RENTON
JANUARY 2019 EXECUTIVE SUMMARY
xviii
Events & Promotion: Promote community engagement and healthy
lifestyles by:
Promoting awareness of the trail and bicycle system by advertising its
system,
Marketing recreation and community events in association with trails
and bicycle facilities including fun runs, races, and other activities,
Supporting guided walking and biking tours, and
Working in partnership with King County Metro on expanding its
transit to trail program.
Safety & Awareness: Develop traffic safety materials and pursue
implementing design standards that help enforce safe and responsible for
all traffic modes.
Future Policy Explorations: There are many policies and trends the City
can further explore, including but not limited to:
Multimodal transportation levels of service for use in transportation
concurrency standards and mitigation fees.
Sidewalk plan integration with this Trails and Bicycle Plan to
coordinate planning and implementation of its non-motorized system.
Whether and how to implement a Vision Zero program that sets a
goal of zero traffic deaths or severe injuries through holistic,
integrated action strategies.
Renton will determine the best combination of monitoring and
implementation strategies based on available resources and needs.

CITY OF RENTON � RENTON TRAILS AND BICYCLE MASTER PLAN
JANUARY 2019
CHAPTER 1
VISION, GOALS, & OBJECTIVES

RENTON TRAILS AND BICYCLE MASTER PLAN � CITY OF RENTON
THIS PAGE IS INTENTIONALLY BLANK

CITY OF RENTON � RENTON TRAILS AND BICYCLE MASTER PLAN
JANUARY 2019 VISION, GOALS, & OBJECTIVES
3
1 VISION, GOALS, & OBJECTIVES
INTRODUCTION
The Plan Vision, Goals, and Objectives describes the future the community
aspires to achieve and how the City will act to achieve the Vision. The
Vision articulates the ideal future the Plan wishes to achieve. Goals address
outcomes encapsulated in the Vision. Objectives define specific actions that,
if completed, will accomplish a certain goal. The Vision, Goals, and
Objectives together provide a road map for the City to achieve Renton’s
best Trails and Bicycle facilities system.
VISION – RENTON CONNECTION
The Trails and Bicycle Master Plan fosters an integrated trail and
bicycle system that connects the City’s neighborhoods, community, and
region. Residents, employees, and visitors can access a diverse system
in urban and natural settings that are safe and comfortable for users of
all ages and abilities. People can recreate, exercise, and/or commute
for an active, healthy lifestyle.
Source: City of Renton

RENTON TRAILS AND BICYCLE MASTER PLAN � CITY OF RENTON
VISION, GOALS, & OBJECTIVES
GOALS & OBJECTIVES
Five goals and related objectives are stated in the following pages.
Goal A: Improving safety
Improve safety for non-motorized use and facilities.
Objective A.1: Invest in the development and maintenance of high
quality walking and bicycling infrastructure.
Objective A.2: Promote bicycling and pedestrian safety through
educational programs and community outreach.
Objective A.3: Minimize obstructions and conflicts along high speed, high
traffic streets that restrict the movement of non-motorized users.
Objective A.4: Provide safe and convenient storage and parking
facilities for non-motorized users.
Objective A.5: Promote design and maintenance practices that deter
crime including appropriate visibility and comfort through lighting,
proper placement of plantings, access control, and other techniques.

CITY OF RENTON � RENTON TRAILS AND BICYCLE MASTER PLAN
JANUARY 2019 VISION, GOALS, & OBJECTIVES
5
Goal B: Creating an accessible and connected system
Develop an inter-connected trail network.
Objective B.1: Enhance non-motorized connections between
neighborhoods, schools, public transit, recreation facilities and other
community destinations.
Objective B.2: Complete the connections between the regional trails within
Renton.
Objective B.3: Continue to connect to non-motorized networks in adjacent
jurisdictions.
Objective B.4: Mitigate barriers in the non-motorized network, including
freeways, busy intersections, steep slopes, railways, and waterways.
Objective B.5: Fill in gaps and missing links.
Objective B.6: Identify easily accessible trail head and access points
throughout the network.
Objective B.7: Coordinate with citywide planning efforts.
Objective B.8: Balance new acquisition and development with the
sustained maintenance of existing facilities.
Objective B.9: Ensure Renton’s codes and standards advance the
implementation of the Trails and Bicycle Plan cross sections through
appropriate requirements, phasing, and incentives.

RENTON TRAILS AND BICYCLE MASTER PLAN � CITY OF RENTON
VISION, GOALS, & OBJECTIVES
Goal C: Promoting physical and environmental health
Improve the health of the community through sustainable design and increase the rates of walking, running, and bicycling.
Objective C.1: Increase access to the recreational and non-motorized
trail network.
Objective C.2: Promote non-motorized travel as a viable means of
transportation and as an important method for maintaining overall
health and fitness.
Objective C.3: Provide facilities that accommodate users of all ages and
abilities.
Objective C.4: Utilize Complete Streets to provide increased
opportunities for non-motorized access and use and promote improved
air and water quality.
Objective C.5: Increase awareness of the non-motorized and
recreational trail network.
Objective C.6: Support education and appreciation of the natural
environment while protecting wetlands, streams, steep slopes, and
cultural resources.
Objective C.7: Minimize impacts to the environment by employing best
management practices.

CITY OF RENTON � RENTON TRAILS AND BICYCLE MASTER PLAN
JANUARY 2019 VISION, GOALS, & OBJECTIVES
7
Goal D: Achieving equity
Ensure that all members of the community have equitable access to walking and bicycling facilities.
Objective D.1: Employ strategies to include underserved populations in
community outreach.
Objective D.2 Invest in non-motorized facilities across the Renton
community.
Objective D.3: Develop the network to enable a diverse range of
experiences and activities in natural and urban settings.
Objective D.3: Support, encourage and promote active transportation
for users across a wide range of age, income, and physical abilities.
Objective D.4: Ensure signage and informational materials are accessible
and comprehensible by a wide range of users.
Objective D.5: Plan for land use densities and mixed-use development
patterns that encourage walking, hiking, biking and other non-motorized
uses and connectivity.
Objective D.5: Implement a multimodal level of service that maximizes
mobility.
EQUITY
Equal means two or more things are exactly the same, whereas equitable means "fairly" or "with equity" in the sense of fairness.
Renton has a 2017 Policy Agenda with an inclusion and wellbeing policy to be an inclusive city with an opportunity to live a healthy, active, safe, and sustainable lifestyle.

RENTON TRAILS AND BICYCLE MASTER PLAN � CITY OF RENTON
VISION, GOALS, & OBJECTIVES
Goal E: Enhancing the economy and community
Enhance the economy and vibrancy of the community by increasing walking and bicycling.
Objective E.1: Support and promote a non-motorized transportation
culture to attract more businesses and residents.
Objective E.2: Leverage Renton’s position at the convergence of regional
trails to promote the economic vitality of the city.
Objective E.3: Capitalize on the natural area trail systems to promote
outdoor nature activities.
Objective E.4: Implement improvements to promote Renton as a walkable
community.
Objective E.5: Provide secure bicycle parking at community destinations
and incentivize provision of bicycle facilities in private development.
Objective E.6: Continue to develop and nurture partnerships to leverage
resources and implement projects, programs and activities that increase
the reach and effectiveness of the bicycle and trail network.
Objective E.7: Identify and secure a wide variety of funding sources.
Cedar River Trail, City of Renton

CITY OF RENTON � RENTON TRAILS AND BICYCLE MASTER PLAN
JANUARY 2019
CHAPTER 2 EXISTING CONDITIONS

RENTON TRAILS AND BICYCLE MASTER PLAN � CITY OF RENTON
THIS PAGE IS INTENTIONALLY BLANK

CITY OF RENTON � RENTON TRAILS AND BICYCLE MASTER PLAN
JANUARY 2019 EXISTING CONDITIONS
11
2 EXISTING CONDITIONS
TRAILS & BICYCLE SYSTEM CHARACTERISTICS
The City currently has approximately 30 miles of trails of different types –
shared use paths that accommodate pedestrians and bicyclists, dedicated
bike lanes, and dedicated pedestrian trails. See Exhibit 2-1. Trails are
located chiefly along water bodies and major routes but are not fully
connected and there are major population centers that are not currently
being served. See Exhibit 2-2.
Exhibit 2-1. Existing Trail Network Miles
FACILITY EXISTING
Shared Use Path 7.67
Protected Bike Lane -
Protected Bike Lane -
Two-Way Protected Bike Lane -
Striped Bike Lane 9.70
Striped Bike Lane 9.70
Buffered Bike Lane -
Neighborhood Greenway -
Signed Shared Roadway 2.47
Pedestrian Trail 10.36
Boardwalk 0.26
Hard Surface Trail 6.32
Soft Surface Trail 3.79
TOTAL 30.20
Source: City of Renton, 2018.

RENTON TRAILS AND BICYCLE MASTER PLAN � CITY OF RENTON
JANUARY 2019 EXISTING CONDITIONS
12
Exhibit 2-2. Existing Trail Network

CITY OF RENTON � RENTON TRAILS AND BICYCLE MASTER PLAN
JANUARY 2019 EXISTING CONDITIONS
13
CITYWIDE CONTEXT
The City of Renton has seen growth and change in the past three decades
Population increased from 50,052 in 2000 to 104,100 in 2018, partly
through annexations. The City added jobs in the same period, with
employment growing from 55,519 jobs in 2000 to 61,920 in 2018.
Median household income has risen to $66,050 today. As the City has
grown the proportion of older and younger residents remained relatively
constant, hovering at roughly 10% and 23% respectively. Rates of vehicle
ownership have also remained steady citywide, with 90-95% of city
households having access to a car. However, mirroring regional and
national trends, the city has become more racially diverse. The proportion
of non-white residents increased from 35% in 2000 to 54% in 2018.
Exhibit 2-3. Citywide Demographic Characteristics
Source: OFM, 2017; King County Assessor, 2017; PSRC, 2017; On The Map (OTM) (US Census), 2015; 2016 ACS (US Census), 5-Year Estimate; BERK, 2018.

RENTON TRAILS AND BICYCLE MASTER PLAN � CITY OF RENTON
JANUARY 2019 EXISTING CONDITIONS
14
PLANNING AREA PROFILES
The City of Renton and its Potential Annexation Areas are comprised of
many distinct communities, each with their own unique districts and
neighborhoods. Given the need to plan effectively for this diverse set of
communities, the City of Renton and its Potential Annexation Areas are
divided into ten geographically distinct Community Planning Areas as
shown in Exhibit 2-5. Community Planning Areas share community identity,
schools, existing infrastructure, and physical features. Through the
Community Planning process, residents, businesses, and other stakeholders
develop a local vision and establish policies that address issues of growth,
quality of life, design, and capital improvements in their respective
planning area.
Thus far, Community Plans have been adopted for two Community Planning
Areas (City Center and Benson Hill) while others are planned for the future.
Overall, existing trail miles in the city limits indicate a concentration of
facilities in the City Center which includes a hub of regional trails like the
Cedar River Trail, Lake to Sound Trail, connection to the Eastside Rail
Corridor, and waterfront park pedestrian trails and bike lanes. An
additional concentration of existing facilities is situated in the Valley where
the Springbrook Trail is located. See Exhibit 2-4. Recognizing the need for
geographic equity, and to address the County’s limited historical investment
in large annexation areas such as Benson Hill, this Trails and Bicycle Plan
will increase trail miles in all Community Planning Areas. The greatest
increases are planned in Benson Hill and Highlands Community Plan Areas
– two areas that are currently largely underserved.
The following section summarizes demographic and Community Planning
Area Characteristics of nine Community Planning Areas within the City and
places it in the context of the City as whole. Demographic data shown
reflects only those portions of the respective Community Planning Areas
that are located within Renton’s city limits. As a result, the Fairwood
planning area is excluded as it resides entirely outside the City.

CITY OF RENTON � RENTON TRAILS AND BICYCLE MASTER PLAN
JANUARY 2019 EXISTING CONDITIONS
15
Exhibit 2-4. Existing and Proposed Network Miles by Community Planning Area
Source: City of Renton, 2018.

RENTON TRAILS AND BICYCLE MASTER PLAN � CITY OF RENTON
JANUARY 2019 EXISTING CONDITIONS
16
Exhibit 2-5. Community Planning Areas
CITY OF RENTON � RENTON TRAILS AND BICYCLE MASTER PLAN
JANUARY 2019 EXISTING CONDITIONS
17
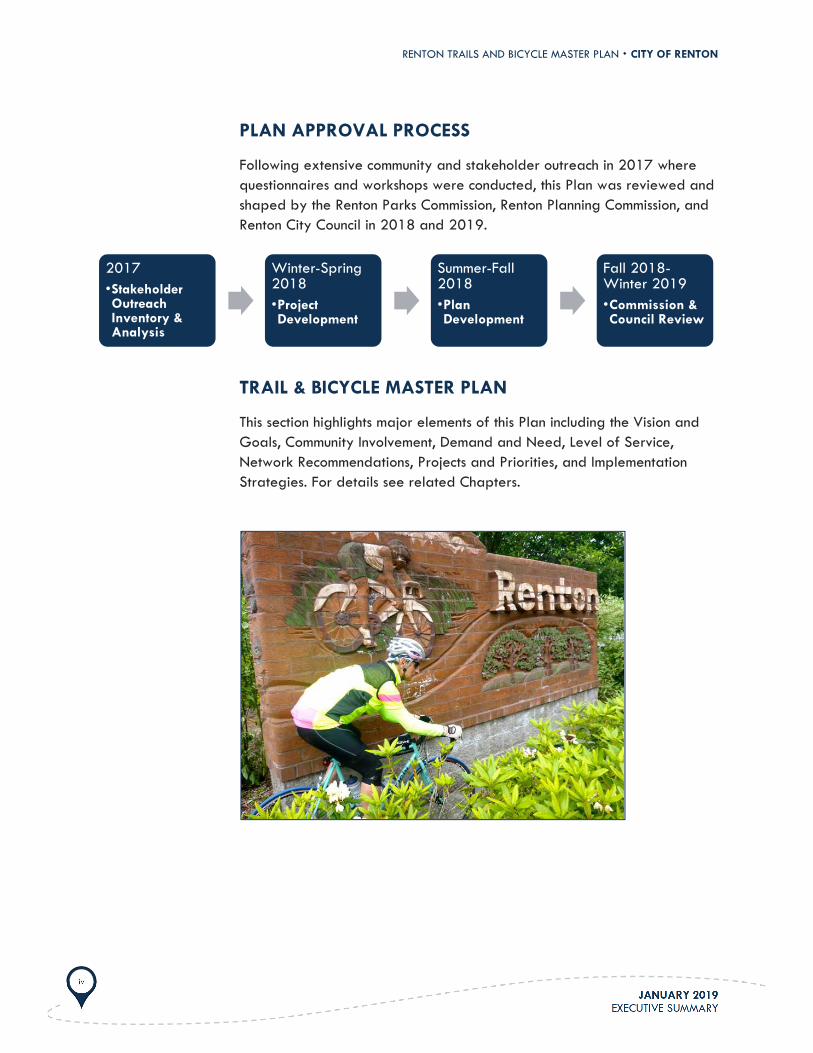
Benson Hill Community Plan Area
The Benson Hill Community Plan area is a predominantly
residential area over four square miles in size. Population for the
entire Community Planning Area is 25,140 people as of 2018.
Benson Hill houses 24% of Renton’s population, and 27% of its
households. Exhibit 2-6 summarizes selected demographic
characteristics of Benson Hill and places it in the context of the
city as whole. Exhibit 2-7. summarizes key Community Plan Area
Characteristics that influence travel patterns and mobility.
Exhibit 2-6. Benson Hill Demographic Characteristics (within Renton City Limits)
Source: OFM, 2017; King County Assessor, 2017; PSRC, 2017; On The Map (OTM) (US Census), 2015; 2016 ACS (US Census), 5-Year Estimate; BERK, 2018.
The Benson Community Planning Area is similar to Renton overall in its age and racial makeup. It is slightly less affluent and has a smaller proportion of households with access to a car than the city as a whole. It has very limited trails and bicycle facilities (3 miles) and lacks other complete streets and parks given different standards in King County prior to annexation.

RENTON TRAILS AND BICYCLE MASTER PLAN � CITY OF RENTON
JANUARY 2019 EXISTING CONDITIONS
18
Exhibit 2-7. Benson Hill Community Plan Area Characteristics
FEATURE SUMMARY
Neighborhood Assets and
Destinations
Assets and destinations include:
Tiffany Park, Cascade Park, and Renton Park (King County) provide walking trails, children’s play areas, and recreational opportunities to area residents. Philip Arnold Park is immediately north of this planning area and is accessible to Benson residents via an unpaved road right-of-way owned by Seattle Public Utilities. The Cedar River Natural Area is along the northern boundary of the area. To the east, the Soos Creek Corridor (King County) and Boulevard Lane Park (King County park) offer large natural areas.
There is a future Family First Community Center on 116th. The commercial areas, including Cascade Village are key destinations. The Renton School District operates seven schools in the area. Several major utility corridors cross the area, providing informal trails, recreation links, and views.
Existing Travel Routes
116th Avenue SE is the central spine of Benson Hill, connecting neighbors to Cascade Village, Cascade and Benson Hill Elementary Schools, and several informal trail networks.
140th Ave SE (existing bike lanes), Benson Road South, and Talbot Road South are used for biking. Puget Drive SE and hiking/walking trails in Cedar River Natural Zone, are heavily used routes. In addition, the City of Seattle water pipeline corridors provide walking routes in the area.
Transit Routes
Major transit routes are along 108th Ave SE, 116th Ave SE, Puget Drive SE, SE 168th Street, SE Carr Road, SR 169 Renton-Maple Valley Road, and Talbot Road South.
Buses 169, 148, 102, and Dart 906 serve the area.
Community Input
Community input identified the need for walking improvements at the following problem spots for walking: 116th Ave, SE 181st St, SE 182nd St, near Soos Creek Park and trail, areas south of 108th Ave SE south of SE Carr Road, and near Thunder Hill Creek Trail. Locations identified as bicycling problem spots include: Benson Road S, SE 192nd St, 108th Ave SE. Finishing the Soos Creek Trail was also identified as a need. An area west of Benson Way S was identified as a popular location for mountain biking. See Exhibit 2-8.

CITY OF RENTON � RENTON TRAILS AND BICYCLE MASTER PLAN
JANUARY 2019 EXISTING CONDITIONS
19
Exhibit 2-8. Benson Hill Planning Area Community Input

RENTON TRAILS AND BICYCLE MASTER PLAN � CITY OF RENTON
JANUARY 2019 EXISTING CONDITIONS
20
Cedar River Community Planning Area
The Cedar River Community Planning area is a predominantly
residential area with a population of 4,210 people as of
2018. This is 4% of Renton’s population, and 16% of its
households. Exhibit 2-9 summarizes selected demographic
characteristics and places the area in the context of the city as
whole. Exhibit 2-10 summarizes key Community Plan Area
Characteristics and community input around destinations, travel
patterns, and overall mobility.
Exhibit 2-9. Cedar River Demographic Characteristics (within Renton City Limits)
Source: OFM, 2017; King County Assessor, 2017; PSRC, 2017; On The Map (OTM) (US Census), 2015; 2016 ACS (US Census), 5-Year Estimate; BERK, 2018.
Compared to the City as a whole, the Cedar River Community Planning Area is more affluent and slightly less racially diverse. It has a slightly larger proportion of older residents and residents with access to a car.

CITY OF RENTON � RENTON TRAILS AND BICYCLE MASTER PLAN
JANUARY 2019 EXISTING CONDITIONS
21
Exhibit 2-10. Cedar River Community Plan Area Characteristics
FEATURE SUMMARY
Neighborhood Assets and
Destinations
Assets and destinations include:
Maplewood Golf Course Ron Regis Park Cedar River Park (includes a non-motorized boat launch as well as other picnic and park facilities).
Renton Community Center Henry Moses Aquatic Center Carco Theatre
Existing Travel Routes
The Cedar River Trail (CRT) follows the Cedar River from where it enters Lake Washington in the City of Renton upriver to Landsburg, the boundary of the City of Seattle’s Cedar River Watershed. The trail follows a historic railroad route along State Route 169, and passes through the City of Renton, City of Maple Valley, and unincorporated King County. It offers views and access to Lake Washington, downtown Renton, Cedar River Park, Maplewood Golf Course, Ron Regis Park, Cedar Grove Park (King County park), and Maple Valley. The CRT is popular with pedestrians, runners, bicyclists, and skaters and provides both recreational and non-motorized commuting opportunities.
Transit Routes
Maple Valley Highway is a bus route for Metro Transit 143, 102, and Dart 907.
Community Input
Community input identified the following locations as a walking problem spots: 154th Pl SE and unofficial dirt trails in the Cedar River Natural Zone. The following location was identified as a bicycling problem spot: 136th Ave SE. An additional three locations along Maple Valley Highway were identified as walking and bicycling destinations. See Exhibit 2-11.

RENTON TRAILS AND BICYCLE MASTER PLAN � CITY OF RENTON
JANUARY 2019 EXISTING CONDITIONS
22
Exhibit 2-11. Cedar River Planning Area Community Input

CITY OF RENTON � RENTON TRAILS AND BICYCLE MASTER PLAN
JANUARY 2019 EXISTING CONDITIONS
23
City Center Community Planning Area
The City Center Community Planning Area includes a
population of 13,030 people as of 2018. This is roughly 13%
of Renton’s population, and 16% of its households. City Center
is a major employment center for Renton with 27,850 jobs or
roughly 45% of the city’s employment. Exhibit 2-12
summarizes selected demographic characteristics and places
the area in the context of the city as whole. Exhibit 2-13
summarizes key Community Plan Area Characteristics and
community input around destinations, travel patterns, and
overall mobility.
Exhibit 2-12. City Center Demographic Characteristics (within Renton City Limits)
Source: OFM, 2017; King County Assessor, 2017; PSRC, 2017; On The Map (OTM) (US Census), 2015; 2016 ACS (US Census), 5-Year Estimate; BERK, 2018.
Compared to the City as a whole, the City Center Community Planning Area is less affluent and less racially diverse. It has a lower proportion of families with children and a higher proportion of older residents. A smaller proportion of residents have access to a car.

RENTON TRAILS AND BICYCLE MASTER PLAN � CITY OF RENTON
JANUARY 2019 EXISTING CONDITIONS
24
Exhibit 2-13. City Center Community Plan Area Characteristics
FEATURE SUMMARY
Neighborhood Assets and
Destinations
Downtown Renton with a traditional retail “main street” on S 3rd Street. The Downtown Library, Senior Center, Renton Pavilion Event Center and Piazza Park are popular community gathering places.
A regional commercial cluster is located primarily in the southern portion of the City Center and serves as a retail hub.
Parks and destinations include Burnett Linear Park, Cedar River Trail, Gene Coulon Memorial Beach Park, Jones Park, Kiwanis Bicentennial Air Park, Liberty Park, Philip Arnold Park, Piazza Park, Downtown Park, Skate Park, Tonkin Park, Veterans Memorial Park, and the Renton Memorial Stadium.
Historic Renton High School and STEM-focused Sartori Elementary School are important to community identity.
The northern portion of this community planning area includes Renton Boeing manufacturing facilities, and mixed-use communities of the Landing and Southport.
Existing Travel Routes
Major existing travel routes include:
Cedar River Trail Lake Washington Blvd. Logan Ave N. Rainier Ave N.
Transit Routes
Currently, the Renton Transit Center existing in the center of downtown, but the South Grady Park and Ride will become the city’s major transit center with future Sound Transit and WSDOT improvements. Metro Transit bus routes 101, 105, 106, 107 143, 148, 153, 167, 169, 240, 342, 907, 908, Sound Transit routes 560, 566, and Rapid Ride F route serves the area. There is also a Park & Ride at Fred Meyer.
Community Input
Community input identified the following locations as problem spots for walking: S 7th St, Houser Way S, near Logan Street bridge, Logan Avenue N, Lake Washington Blvd, and Burnett Avenue N. A connection from the Cedar River Boathouse to Coulon Park was also identified as a need. The following locations were identified as bicycling problem spots: SW 7th St, Rainier Ave S, Houser Way S, Logan Ave N, N 6th St, Lake Washington Blvd., and N Park Dr. A Boeing/Airport bypass trail connecting Coulon Park with Perimeter Road/Rainier and bike racks near stores in the Landing were identified ideas for the future. See Exhibit 2-14.

CITY OF RENTON � RENTON TRAILS AND BICYCLE MASTER PLAN
JANUARY 2019 EXISTING CONDITIONS
25
Exhibit 2-14. City Center Planning Area Community Input

RENTON TRAILS AND BICYCLE MASTER PLAN � CITY OF RENTON
JANUARY 2019 EXISTING CONDITIONS
26
East Plateau Community Planning Area
The East Plateau Community Planning Area includes a
population of 9,770 people as of 2018. This is roughly 9% of
Renton’s population, and 9% of its households. Exhibit 2-15
summarizes selected demographic characteristics and places
the area in the context of the city as whole. Exhibit 2-16
summarizes key Community Plan Area Characteristics and
community input around destinations, travel patterns and
overall mobility.
Exhibit 2-15. East Plateau Demographic Characteristics (within Renton City Limits)
Source: OFM, 2017; King County Assessor, 2017; PSRC, 2017; On The Map (OTM) (US Census), 2015; 2016 ACS (US Census), 5-Year Estimate; BERK, 2018.
Compared to the City as a whole, the East Plateau Community Planning Area is the most affluent and less racially diverse. It has a higher proportion of families with children and older residents. A larger proportion of residents here have access to a car.

CITY OF RENTON � RENTON TRAILS AND BICYCLE MASTER PLAN
JANUARY 2019 EXISTING CONDITIONS
27
Exhibit 2-16. East Plateau Community Plan Area Characteristics
FEATURE SUMMARY
Neighborhood Assets and
Destinations
Schools in the Planning Area include Hazen High School, Apollo Elementary, Maplewood Heights Elementary, Liberty High School, Maywood Middle School, and Briarwood Elementary.
The one-acre Maplewood Park (King County park), Coalfield Park (King County park), and the Hazen Community Pool are other neighborhood assets and destinations.
NE 4th St and Duvall have active commercial areas.
Existing Travel Routes
NE 4th Street, May Valley Road, and SR 900/Sunset Blvd are major travel corridors. 156th Ave SE/154th Pl SE is important connector to SR 169 and Cedar River Trail.
Transit Routes
NE 4th Street is a major bus route.
King County Metro bus routes 111 and Dart 908 serve the area.
Community Input
Community input identified the following locations as problem spots for walking: along Hoquiam Ave NE, Nile Ave NE, along NE 2nd St, along Jericho Ave SE, along NE 4th St, along Duvall Ave NE, along 144th Ave SE and along156th Ave SE. The following locations were identified as problem spots for bicycling: Hoquiam Ave NE, NE 4th St and near 154th Pl SE. See Exhibit 2-17.

RENTON TRAILS AND BICYCLE MASTER PLAN � CITY OF RENTON
JANUARY 2019 EXISTING CONDITIONS
28
Exhibit 2-17. East Plateau Planning Area Community Input

CITY OF RENTON � RENTON TRAILS AND BICYCLE MASTER PLAN
JANUARY 2019 EXISTING CONDITIONS
29
Highlands Community Planning Area
The Highlands Community Planning Area includes a
population of 29,800 people as of 2018. This is roughly
29% of Renton’s population, and 30% of its households.
Exhibit 2-18 summarize selected demographic characteristics
and places the area in the context of the city as whole.
Exhibit 2-19 summarizes key Community Plan Area
Characteristics and community input around destinations,
travel patterns, and overall mobility.
Exhibit 2-18. Highlands Demographic Characteristics (within Renton City Limits)
Source: OFM, 2017; King County Assessor, 2017; PSRC, 2017; On The Map (OTM) (US Census), 2015; 2016 ACS (US Census), 5-Year Estimate; BERK, 2018.
Compared to the City as a whole, the Highlands Community Planning Area is slightly more affluent. It is similar to the city overall in racial makeup; however, it contains a larger concentration of Hispanic residents. It has a slightly smaller proportion of families with children and older residents. It has a slightly larger proportion of residents with access to a car.

RENTON TRAILS AND BICYCLE MASTER PLAN � CITY OF RENTON
JANUARY 2019 EXISTING CONDITIONS
30
Exhibit 2-19. Highlands Community Plan Area Characteristics
FEATURE SUMMARY
Neighborhood Assets and
Destinations
Schools in the Planning Area include McKnight Middle School, Highlands Elementary, Sierra Heights Elementary School, Meadowcrest Early Learning Center, Rainier Christian School, and Honeydew Elementary School. Open space and park assets include Honey Creek and May Creek Natural Areas, Sierra Heights King County), North Highlands and Meadowcrest Playground, and Glencoe Parks. Phase I of Sunset Park recently opened, Phase II will be completed in 2020. Community centers are also located on both sides of SR 900 at Highlands and North Highlands Parks.
The Renton Technical College, Kennydale Memorial Hall, and the Renton Highlands Library.
The Renton Sunset mixed-use neighborhood.
Existing Travel Routes
Sunset Blvd/SR 900 and NE 3rd St/NE 4th St are main east-west routes. Union Avenue NE and Edmonds Ave NE are key north-south routes. Trails near Honey Creek connect to May Creek Natural Area
Transit Routes
Sunset Blvd. and Duvall Ave NE are major transit routes
King County Metro routes 240, 105, 111, and Dart 908 serve the area.
Park & Rides are at St. Matthew’s Lutheran Church and Renton Bible Church.
Community Input
Community input identified the following locations as problem spots for walking: SE 16th St, NE 20th ST, SE 95th Way, and an area near SE 104th St. The following locations were identified as bicycling problem spots: NE 3rd St, Sunset Blvd, and Duvall Ave N. Connections from Honey Creek to Lake Washington and to Union Ave were identified as ideas for the future. See Exhibit 2-20.

CITY OF RENTON � RENTON TRAILS AND BICYCLE MASTER PLAN
JANUARY 2019 EXISTING CONDITIONS
31
Exhibit 2-20. Highlands Planning Area Community Input

RENTON TRAILS AND BICYCLE MASTER PLAN � CITY OF RENTON
JANUARY 2019 EXISTING CONDITIONS
32
Kennydale Community Planning Area
The Kennydale Community Planning Area is a predominantly
residential area that includes a population of 7,570 people as
of 2018. This is roughly 7% of Renton’s population, and 8% of
its households. Exhibit 2-21 summarizes selected demographic
characteristics and places the area in the context of the city as
whole. Exhibit 2-22 summarizes key Community Plan Area
Characteristics and community input around destinations, travel
patterns and overall mobility.
Exhibit 2-21. Kennydale Demographic Characteristics
Source: OFM, 2017; King County Assessor, 2017; PSRC, 2017; On The Map (OTM) (US Census), 2015; 2016 ACS (US Census), 5-Year Estimate; BERK, 2018.
Compared to the city as a whole, the Kennydale Community Planning Area is more affluent and the least racially diverse. It has a slightly larger proportion of older residents and a smaller proportion of households with children. A slightly larger proportion of residents have access to a car.

CITY OF RENTON � RENTON TRAILS AND BICYCLE MASTER PLAN
JANUARY 2019 EXISTING CONDITIONS
33
Exhibit 2-22. Kennydale Community Plan Area Characteristics
FEATURE SUMMARY
Neighborhood Assets and
Destinations
Assets and destinations include:
The Kennydale Elementary School Kennydale Beach Park Kennydale Lions Park May Creek Natural Area and Trail Eastside Rail Corridor Lake Washington Loop Trail Virginia Mason Athletic Center? (VMAC)/Seattle Seahawks Headquarters Commercial area on NE 44th St, just east of I-405
Existing Travel Routes
Lake Washington Blvd., Park Ave. N, NE 30th St, and NE 27th St are major travel routes.
Transit Routes
Interstate 405 is a major transit route that serves King County Metro bus routes 111, 167, 342, 952, 567, and Sound Transit routes 560 and 566.
A Bus Rapid Transit (BRT) station is planned for the NE 44th St exit and there is an existing Park & Ride at Kennydale United Methodist Church.
Community Input
Community input identified the following locations as problem spots for walking: along N 30th St, N 33rd St, along Aberdeen Ave NE, and along Jones Ave NE. Locations along Lake Washington Blvd, along Lincoln Ave NE and along NE 27th St were identified as bicycling problem spots. See Exhibit 2-23. The Eastside Rail Corridor will be the location of a new regional trail, and preferred alignments were discussed at public open houses and with King County.

RENTON TRAILS AND BICYCLE MASTER PLAN � CITY OF RENTON
JANUARY 2019 EXISTING CONDITIONS
34
Exhibit 2-23. Kennydale Community Planning Area Community Input

CITY OF RENTON � RENTON TRAILS AND BICYCLE MASTER PLAN
JANUARY 2019 EXISTING CONDITIONS
35
Talbot Community Planning Area
The Talbot Community Planning Area includes a population of
10,060 people as of 2015. This is roughly 10% of Renton’s
population, and 10% of its households. Exhibit 2-24
summarizes selected demographic characteristics and places
the area in the context of the city as whole. Exhibit 2-25
summarizes key Community Plan Area Characteristics and
community input around destinations, travel patterns and
overall mobility.
Exhibit 2-24. Talbot Demographic Characteristics
Source: American Community Survey, 2015.
Compared to the City as a whole the Talbot Community Planning Area is more affluent and racially diverse. It has a larger proportion of older residents than the city overall. A larger proportion of residents here have access to a car.

RENTON TRAILS AND BICYCLE MASTER PLAN � CITY OF RENTON
JANUARY 2019 EXISTING CONDITIONS
36
Exhibit 2-25. Talbot Community Plan Area Characteristics
FEATURE SUMMARY
Neighborhood Assets and
Destinations
Assets and destinations include:
The Talbot Hill Elementary School. Developed park assets include the 10-acre Thomas Teasdale Park and the public tennis and pickleball courts located at Talbot Hill Reservoir Park.
Panther Creek Wetlands Valley Medical Center and surrounding area is major medical hub.
Existing Travel Routes
Benson Drive South (SR 515) and SE Carr Road are major travel routes for this area.
Transit Routes
King County Metro bus route 169 runs along Talbot Road S. and 108th Ave SE. Metro Dart route 906 serves east-west to the Valley.
Community Input
Community input identified the following locations as problem spots for walking: the hill between SE Carr Rd and SE 200th St. SE 200th was also identified as a bicycling problem spot. Connecting City-owned park property to Panther Creek Wetlands, connecting Panther Creek Wetlands to the Springbrook Trail, and connecting to Strander Blvd in Tukwila on SW 27th St were identified as ideas for the future. See Exhibit 2-26.

CITY OF RENTON � RENTON TRAILS AND BICYCLE MASTER PLAN
JANUARY 2019 EXISTING CONDITIONS
37
Exhibit 2-26. Talbot Planning Area Community Input

RENTON TRAILS AND BICYCLE MASTER PLAN � CITY OF RENTON
JANUARY 2019 EXISTING CONDITIONS
38
Valley Community Planning Area
The Valley Community Planning Area is a major employment
center with 20,350 or roughly 33% of the city’s jobs. The
Valley Medical Center is located in this Planning Area. This is
the least populated planning area with only a population of
180 people as of 2018. Exhibit 2-27 summarizes selected
demographic characteristics and places the area in the context
of the city as whole. Exhibit 2-28 summarizes key Community
Plan Area Characteristics and community input around
destinations, travel patterns and overall mobility.
Exhibit 2-27. Valley Demographic Characteristics
Source: OFM, 2017; King County Assessor, 2017; PSRC, 2017; On The Map (OTM) (US Census), 2015; 2016 ACS (US Census), 5-Year Estimate; BERK, 2018.
Compared to the City as a whole the Valley Community Planning Area is less affluent and more racially diverse. It is similar to the city overall in the proportion of families with children and older residents. A smaller proportion of residents here have access to a car.

CITY OF RENTON � RENTON TRAILS AND BICYCLE MASTER PLAN
JANUARY 2019 EXISTING CONDITIONS
39
Exhibit 2-28. Valley Community Plan Area Characteristics
FEATURE SUMMARY
Neighborhood Assets and
Destinations
There are no schools in this Community Planning Area. Open space assets include the Black River Riparian Forest and the Springbrook Valley Wetlands.
Lake to Sound Trail There are multiple commercial/employment providers in this area, including IKEA, Providence Health & Services, Boeing, and Kaiser Permanente.
Existing Travel Routes
Black River Trail and the Springbrook Trail. Lake to Sound Trail will connect to the Interurban and Green River Trails in 2020.
Transit Routes
SW Grady Way and SR 167 are main transit routes.
King County Metro route 153 and Rapid Ride F route serves the area. Metro routes 952, and Sound Transit routes 566 and 567 run along I-167.
The Tukwila Sounder Station is a key origin/destination for transit users in this area.
Community Input
Community input identified locations along SW 43rd St as problem spots for walking and biking. Specific locations identified along the street as problem spots for bicycling include: S 180th St, SW Grady Way, Oakesdale Ave SW and SW 7th St. A better connection between the Lake to Sound Trail and Interurban Trail and addressing gaps in trails due to private property (Springbrook Trail) were also identified as ideas for the future. See Exhibit 2-29. s

RENTON TRAILS AND BICYCLE MASTER PLAN � CITY OF RENTON
JANUARY 2019 EXISTING CONDITIONS
40
Exhibit 2-29. Valley Planning Area Community Input

CITY OF RENTON � RENTON TRAILS AND BICYCLE MASTER PLAN
JANUARY 2019 EXISTING CONDITIONS
41
West Hill Community Planning Area
The West Hill Community Planning Area is a predominantly
residential area with a population of 4,340 people as of
2018. This is roughly 4% of Renton’s population, and 4% of its
households. Exhibit 2-30 summarize selected demographic
characteristics and places the area in the context of the city as
whole. Exhibit 2-31 summarizes key Community Plan Area
Characteristics and community input around destinations, travel
patterns and overall mobility.
Exhibit 2-30. West Hill Demographic Characteristics (within Renton City Limits)
Source: OFM, 2017; King County Assessor, 2017; PSRC, 2017; On The Map (OTM) (US Census), 2015; 2016 ACS (US Census), 5-Year Estimate; BERK, 2018.
Compared to the City as a whole the West Hill Community Planning Area is the least affluent and most racially diverse. It has a slightly higher proportion of families with children and a smaller proportion of residents with access to a car.

RENTON TRAILS AND BICYCLE MASTER PLAN � CITY OF RENTON
JANUARY 2019 EXISTING CONDITIONS
42
Exhibit 2-31. West Hill Community Plan Area Characteristics
FEATURE SUMMARY
Neighborhood Assets and
Destinations
Schools in the Planning Area include Campbell Hill Elementary, Dimmitt Middle School, Bryn Mawr Elementary, Albert Talley High School and Lakeridge Elementary School
Park assets and destinations include Earlington Park, Skyway Park (King County park), Lakeridge Park (King County park).
Skyway Library is a key destination and asset.
Existing Travel Routes
Rainier Avenue South along Lake Washington is a main travel corridor for the area. Renton Ave South runs through the heart of West Hill. SR 900, west of Rainier Ave S. is major city gateway from I-5.
Transit Routes
Renton Avenue South and SR 900 are bus routes.
King County Metro bus routes 106, 107, 101, 102, and 143X serve the area. There is an existing Park & Ride at City View Church.
Community Input
Community input identified bicycling problem spots at the following locations: along S Sunnycrest Rd, and south of Sunset Blvd. A safe bicycling route connecting to Skyway and West Hill, along SW Langston Rd, was identified as an idea for the future. See Exhibit 2-32.

CITY OF RENTON � RENTON TRAILS AND BICYCLE MASTER PLAN
JANUARY 2019 EXISTING CONDITIONS
43
Exhibit 2-32. West Hill Community Planning Area Community Input


CITY OF RENTON � RENTON TRAILS AND BICYCLE MASTER PLAN
JANUARY 2019
CHAPTER 3
COMMUNITY INVOLVEMENT

RENTON TRAILS AND BICYCLE MASTER PLAN � CITY OF RENTON
THIS PAGE IS INTENTIONALLY BLANK

CITY OF RENTON � RENTON TRAILS AND BICYCLE MASTER PLAN
JANUARY 2019 COMMUNITY INVOLVEMENT
47
3 COMMUNITY INVOLVEMENT
ENGAGEMENT ACTIVITIES
The City conducted an extensive public outreach process, with an online
questionnaire, an interactive mapping activity, and three in-person
community open houses. Three meetings were organized with a Technical
Advisory Committee. The City also met with regional stakeholders. Project
briefings were presented to the Parks Commission, Planning Commission,
and the Renton City Council. Results are summarized in this Chapter with
more detailed information in Appendix A.
Top Takeaways
Based on the outreach the key takeaways include:
Recreation-based walking and biking is still a primary purpose.
Commuting by bike and on foot is also occurring and could be
encouraged more.
Respondents preferred to walk shorter distances, around their
neighborhoods, mainly for recreation. Walking was not seen as a
primary mode of transportation.
Respondents reported longer and more frequent bicycle trips.
Bicyclists bike within and beyond their neighborhood to trails, work
places or school, or civic or recreation facilities.
Respondents preferred to walk and bike on formal facilities such as
sidewalks, streets, or paved trails.
The Cedar River Trail is the most heavily used trail. Not surprisingly,
given its central location within the city and its length, respondents
cited the Cedar River Trail as the most used non-motorized trail. Trails
along other riparian corridors, such as the Springbrook Creek, Honey
Creek, and May Creek were less frequently used.
Addressing pedestrian and bicyclist comfort is necessary to
encourage more travel and recreation by foot or bike. Discontinuous
or missing sidewalks, walking on roads with fast moving traffic, and
difficulty crossing came up as top barriers to walking. Barriers to
biking focused on the absence of biking facilities (e.g. paved
WALKING AND BIKING IN RENTON
88.5% of the Renton survey respondents walk around the neighborhood. This is consistent with findings in the 2017 State Comprehensive Outdoor Recreation Planning (SCORP), which showed 89% participation in the Seattle-King region, and 94% across the state.
Renton's survey respondents have a higher rate of biking with up to 81.1% biking on a trail and 80.2% biking around the neighborhood. In the SCORP, rates were 28% for biking mostly on streets and roads.

RENTON TRAILS AND BICYCLE MASTER PLAN � CITY OF RENTON
JANUARY 2019 COMMUNITY INVOLVEMENT
48
shoulders, bike lanes, shared use paths), dangerous crossings and
streets with fast moving cars. The lack of wayfinding was also cited as
a potential barrier.
Connection to transit is an important need. Transit is often accessed
by walking and biking and connections to current and future transit is a
key link.
Mountain biking and other more unique forms of bicycling are
pursued by about a quarter of questionnaire respondents, who enjoy
riding along lakes, streams, and rivers.
Equestrian use was not an identified need. The questionnaire
included questions on horseback riding, but no respondents offered
input.
Questionnaire
The City issued a questionnaire in summer 2017 for nearly three months
and received 340 responses (131 full and 209 partial). Respondents are
more able-bodied than Census reports for the city. The share of
questionnaire respondents with children is similar to Census reports for
Renton. Questionnaire respondents are more likely to commute by walking
or bicycling than the city as a whole. Results showed:
Purpose of Walking/Biking: Walking, running, and biking activities
tend to be more for recreation purposes rather than for transportation.
Frequency: Most respondents walk at least 2 times per week or more,
and bike 1 day per week or less.
Destinations: Most respondents walk or bike around their
neighborhood or to a public facility. In the case of bicyclists, they also
frequently use trails. While respondents visited a wide number of
Renton park, recreation, and civic facilities, the most well visited ones
were along Lake Washington and the Cedar River.
Traffic Stress: Renton questionnaire respondents indicated that 25%
were confident on any road, about 50% were comfortable with roads
having some traffic but prefer those with wide shoulders or lanes or
trails, and over 20% were concerned about traffic and other factors.
Barriers & Incentives – Walking or Running: Top barriers to running
or walking included street crossings, traffic, discontinuous sidewalks, or
locations along roads. Top improvements to encouraging walking or

CITY OF RENTON � RENTON TRAILS AND BICYCLE MASTER PLAN
JANUARY 2019 COMMUNITY INVOLVEMENT
49
running, include more curb ramps, sidewalks, more shared-use trails,
maintenance, and enforcement of traffic laws and biking.
Barriers & Incentives – Biking: Top barriers to biking include motor
vehicle speed, lack of bicycle facilities, too many cars, and routes that
are stressful or dangerous. Top improvements include safer
intersections, wider shoulders on roads, more shared use trails, and
street calming measures in residential areas.
Interactive Maps
An interactive online map was open to public input from June 10, 2017 to
August 31, 2017. The interactive map site had 1,380-page views and 342
data points. Participants could identify areas where they walked or biked,
and problem areas. Maps and summaries of comments follow.
Walking
Based on input received, walk problems included lack of
sidewalks and connections as well as traffic, speeding, and
other dangerous conditions. Most pedestrian problem spots
were identified in the East Plateau, North Highlands, and
mid-Kennydale Planning Areas. See Exhibit 3-1 and
Exhibit 3-2.
Exhibit 3-1. Walking Problems
Source: Tag Word Cloud.

RENTON TRAILS AND BICYCLE MASTER PLAN � CITY OF RENTON
JANUARY 2019 COMMUNITY INVOLVEMENT
50
The range of comments included:
Nice walk, but would feel much safer with sidewalk (Kennydale area).
No sidewalk for most of this very busy road (Sunset area).
Need signage and wayfinding to connect to Cedar River trail.
Missing ADA ramp.
There is no way to get up and down the hill safely between Carr Rd.
and SE 200th St.... That’s a 1.25-mile sidewalk desert.
Destinations included the Cedar River Trail and May Creek Trail. Many
respondents reported walking in neighborhoods on the Renton plateau
(East Plateau Community Planning Area), as well as in the valley near
Springbrook Trail and Black River Trail (Valley Community Planning Area).

CITY OF RENTON � RENTON TRAILS AND BICYCLE MASTER PLAN
JANUARY 2019 COMMUNITY INVOLVEMENT
51
Exhibit 3-2. Community Input Walking

RENTON TRAILS AND BICYCLE MASTER PLAN � CITY OF RENTON
JANUARY 2019 COMMUNITY INVOLVEMENT
52
Biking
Community comments on biking problem spots were similar to comments
about walking. Biking problems related to concerns about travel lanes and
trails, and traffic and safety conditions. Based on comments, most bike
problem spots follow future alignments of the regional trail system. See
Exhibit 3-3 and Exhibit 3-4.
Exhibit 3-3. Biking Problem Spots
Source: Tag Word Cloud.
Destinations included the Cedar River Trail, Green River Trail, Lake
Washington Loop Trail, and other neighborhood locations. Comments
addressed different connections or safety concerns such as:
Add bike trail between Cedar & Green river trails.
Need a safe bike route connecting to Skyway and West Hill.
Sunset Blvd provides the best grade for connectivity with Highlands,
needs bike lanes.
Best bike route up Benson Hill is not clear. Probably old Benson Rd, but
need bike lanes to continue. Consider road diet south of Puget.
Very narrow shoulder, difficult connection to Jones Road from Cedar
River Trail.
Cars using wrong lane, conflicting with NB left turning bikes and cars.
(Renton/Kent border)
I ride around this area as the bridge is too narrow and unsafe, I have
nearly crashed many times on this bridge. (Renton/Tukwila Border)

CITY OF RENTON � RENTON TRAILS AND BICYCLE MASTER PLAN
JANUARY 2019 COMMUNITY INVOLVEMENT
53
Exhibit 3-4. Community Input Biking

RENTON TRAILS AND BICYCLE MASTER PLAN � CITY OF RENTON
JANUARY 2019 COMMUNITY INVOLVEMENT
54
OPEN HOUSES
Three open houses were held in 2017. Input at the community open houses
included neighborhood specific feedback on needed improvements, as well
as preferred connections and routes. No input on equestrian facilities was
received.
Needed improvements included:
Intersection improvements along the Cedar River Trail downtown,
Houser Way and Lake Washington Boulevard, and the NE 6th and NE
8th at Logan Avenue N.
Improvements for SW 7th to make it more bike-friendly
Sidewalk improvements across neighborhoods
Preferred Connections and Routes included:
Completion of the proposed Sam Chastain trail segment and the Soos
Creek Trail north of 192nd St. (King County responsibility)
Completion of Burnett Linear Park, South and North in Civic Core
Houser Way was cited by many as the preferred alignment of the
Eastside Rail Corridor
•35 persons•Preferred routes and facility types
•Thoughts on potential routes•Problem spots•Wish list projects•Projects to complete•General concerns and ideas
Open House 1
•26 persons•Regional Trail options•Preferences on network•Questions about facility designation
•Plan Priorities
Open House 2
•30 persons•Regional Trail preferences•Final Network options•Facility type discussion•Prioritization and project preferences
Open House 3

CITY OF RENTON � RENTON TRAILS AND BICYCLE MASTER PLAN
JANUARY 2019 COMMUNITY INVOLVEMENT
55
King County Meetings
Coordination with King County Parks and Recreation Division, Capital
Projects Program, and Governmental Relations was essential to plan
development with the convergence of four regional trails within Renton’s
Urban Growth Area: The Cedar River Trail (CR), Eastside Rail Corridor
(ERC), Lake to Sound Trail (L2S), and the Lake Washington Loop Trail.
The purpose of the meetings was to collaborate with King County
representatives on possible and preferred routing for the regional trails
through the City of Renton, discuss alternative facility types for these
corridors, update on the status of the Civic Core planning effort and review
proposed cross sections for the corridors in that plan, and review the status
of other regional trails/routes. Two meetings were held to identify and
agree upon the alignment and facility designation(s) for the regional trails.
Detailed meeting summaries, route concepts, and cross-sections are
included in Appendix B of this plan.
Technical Advisory Committee
Community members volunteered to participate in the Technical Advisory
Committee for this plan which included additional background and
educational discussions to provide feedback for plan development.
Important considerations included:
The importance of connecting regional trails
The importance of the transit center as a destination
Recognition that trail users are not as aware of traffic control devices
like Rectangular Rapid Flash Beacons (RRFB) or C-curbs; this lack of
awareness should be addressed in design options
Cost considerations, and related “low hanging fruit” or easy wins are
important to elevate as criteria
The following trouble spots were identified primarily about bicycling
except where noted:
Near Dimmitt Middle School the location of a pedestrian-vehicle crash
Crossing Sunset Blvd. near Harrington
NE Park Drive Freeway ramps
Gate on Houser Way at Kenworth

RENTON TRAILS AND BICYCLE MASTER PLAN � CITY OF RENTON
JANUARY 2019 COMMUNITY INVOLVEMENT
56
NE 3rd street for bikes
Connection on Factory Ave.
Rainier Ave. and Hardy Ave.
The following barriers were identified:
Lack of comfort in high
speed/volume conditions
Lack of wayfinding
TAC members were in agreement with the projects identified in the
preliminary list and the conceptual plans for intersections. (See Appendix B
of this plan.)
THEMES
Key themes emerged from the broad input received through outreach
activities. The key themes and representative quotes are shown in the
Exhibit 3-5.
Exhibit 3-5. Outreach Themes Table
THEME REPRESENTATIVE QUOTE
Safety
Safety is a high priority theme that benefits users across the board and encourages less experienced riders to use the trail network. The network should be designed to minimize intermodal conflicts, street crossings, and travel along high speed, high traffic streets. In addition to design features, education and enforcement can improve safety.
“I am not willing to walk or ride a bike on the shoulder of a busy or slightly busy road, regardless of whether or not the shoulder is paved, because it is extremely dangerous due to vehicle driver distractions (talking and texting on phone).”
“Major intersections can be nerve-racking for bicyclists.”

CITY OF RENTON � RENTON TRAILS AND BICYCLE MASTER PLAN
JANUARY 2019 COMMUNITY INVOLVEMENT
57
THEME REPRESENTATIVE QUOTE
Connectivity
Connectivity to regional and local destinations such as job centers, entertainment centers and transit, as well within neighborhoods, is an important feature of the network.
“There is a lack of bike paths on the major roads that lead to the most popular destinations. I prefer to bike, but it takes longer than necessary because I find myself having to take roundabout ways in order to stay safe.”
“I would love to see our bike trails connect all around Seattle like the Sammamish Trail which connects to the Burke -Gilman, then down and around to the waterfront, to Alki, then back to Renton.”
“It is too difficult, and dangerous, to bicycle through Renton to connect to major trails leading north, south, and east (Lake Washington Trail, Rainer Ave, Green River Trail, Cedar River Trail.”
“The bike trail connection isn't the greatest when riding around Lake Washington and along 405. With the amount of hotels /shopping /parks in the area in North Renton it would be great to improve those connections to existing trails to the north for daily and recreational use.”
Continuity
Continuity in the network enables longer trips that are useful for commuting or active recreation and a fluid experience.
“I love the Cedar River Trail and ride it often from downtown Renton to Maple Valley. However wish it were paved beyond Maple Valley - a road bike doesn't navigate well on gravel.”
“I commute from the Highlands to Kirkland. I'm an advanced and confident road rider. Some wonderful improvements have been made to signage and other aspects of driving, but there is no safe way to go up to the Highlands from down in the valley by bike. I tend to go all the way around to Kennydale and climb that big hill to come back to the Highlands rather than risk Sunset.”
Comfort and Inclusivity
This refers to the diversity of experiences the network will enable, reaching across a broad range of activities, ages, and abilities.
“I think that all trails, walkways, paths, etc. should be accessible to ALL.”
“I walk for health. I sold my bicycle a few years ago, and have never felt a need to get another one. I am retired, so do not need daily transportation.”
“I want to bike and walk...my car trips kill me literally and keep me isolated. I want an outdoor vibrant community.”

RENTON TRAILS AND BICYCLE MASTER PLAN � CITY OF RENTON
JANUARY 2019 COMMUNITY INVOLVEMENT
58
THEME REPRESENTATIVE QUOTE
Well-Maintained
Trails wear out with time and need sufficient resources to conduct regular maintenance to offer a predictable, consistent experience for all users.
“Surface maintenance is a MUST! Most importantly, keeping the shoulders /trails clear of debris.”
Wayfinding and Awareness
A comprehensive network of wayfinding signage elements tailored for walking and bicycling allows residents to easily navigate the network and make non-motorized and multi-modal trips.
“Safe, shared use is possible if ALL users are aware of and follow trail rules.”
“There needs to be better signage at all entrance points to the park and along walkways.”
Innovative and Flexible
Trail design optimizes for successful sharing of the network. Soft surface trails are a desired alternative to paved trails.
“Make 2-person soft surface on both sides of national standard width trails so folks can run together.”

CITY OF RENTON � RENTON TRAILS AND BICYCLE MASTER PLAN
JANUARY 2019
CHAPTER 4
DEMAND & NEEDS ANALYSIS

RENTON TRAILS AND BICYCLE MASTER PLAN � CITY OF RENTON
THIS PAGE IS INTENTIONALLY BLANK

CITY OF RENTON � RENTON TRAILS AND BICYCLE MASTER PLAN
JANUARY 2019 DEMAND & NEEDS ANALYSIS
61
4 DEMAND & NEEDS ANALYSIS
This Chapter reviews needs and trends including:
Walking and biking activities participation
Future growth and change
Level of traffic stress
Destinations such as transit, schools, and parks
Connection to the community’s center and region
Based on the needs and trends, gaps and opportunities are identified. The
current and proposed system that closes gaps and addresses needs is
benchmarked to peer communities. Level of service concepts are explored.
Participation
Walking and biking are important to Renton residents and visitors, and
Renton’s local activities match the similarly high participation in the region
and state.
Renton Mobility & Recreation Use & Performance Indicators
Renton’s parks and trail system attracts up to 2.5 million visitors each year.
In the questionnaire for this Trails and Bicycle Master Plan, most
respondents walk at least 2 times per week or more, and bike 1 day per
week or less. At least 80% of the respondents walked or biked around the
neighborhood, over two thirds walked on a trail and over three quarters
biked on a trail. See Exhibit 4-1 and Appendix A.
Exhibit 4-1. Questionnaire 2017 Walking and Biking Frequency
MODE 2-7 DAYS PER WEEK
Walking 65.6%
Biking 38.7%
Running 44%
Source: City of Renton, 2017, BERK, 2018

RENTON TRAILS AND BICYCLE MASTER PLAN � CITY OF RENTON
JANUARY 2019 DEMAND & NEEDS ANALYSIS
62
Renton monitors mobility and recreation performance indicators in its
budget, and the 2017-2018 budget reported:
Increasing satisfaction with connectivity to local and regional centers via transit, sidewalks and trails from 52% in 2011 to 56% in 2015.
Relatively high but variable satisfaction with the level of trail connectivity and access at 74% to 83% during the 2012-2014 period.
Overall customer satisfaction ratings of good to excellent in cleanliness and appearance of Trail System, with 84%-93% satisfaction variably over the 2012-2015 period.
State Trails Plan
In 2017 a statistically valid participation rate survey across Washington
found the top activity of all respondents consisted of walking in a park or
trail setting at 84%. Participation equaled 89% considering the Seattle-
King region alone. Walking was also the top activity at over 90% for
families with or without children.
State Comprehensive Outdoor Recreation Planning
The 2017 State Comprehensive Outdoor Recreation Planning (SCORP)
document considers participation in recreation activities across the state
and in different regions. The report found the participation rates for
walking was 94% statewide. Rates were 28% for biking mostly on streets
and roads, and 23% for running (many locations). Across different ages,
races, or incomes, the top recreation activity was consistently walking in a
park or trail setting. About 89% of participants in the Seattle-King region
participated in walking in a park or trail setting. Most participation
locations occurred in a person’s yard or neighborhood.
Future Growth & Change
Renton’s current trail and bike routes serve several of the highest
population and job density areas though there are gaps particularly in the
northeast and southeast geographies. See Exhibit 4-2 and Exhibit 4-3
Dense population and job centers are associated with high-density
residential and commercial/industrial zones. Over a 20-year planning
period concluding in 2035, over 16,700 housing units and 31,000 jobs
would be added per the Renton Comprehensive Plan. New residents and
employees would increase demand for walking and biking. Much of the
growth would occur in the high-density residential and commercial zones
identified in Exhibit 4-4, particularly in the City Center.

CITY OF RENTON � RENTON TRAILS AND BICYCLE MASTER PLAN
JANUARY 2019 DEMAND & NEEDS ANALYSIS
63
Exhibit 4-2. Population Density and Existing Network

RENTON TRAILS AND BICYCLE MASTER PLAN � CITY OF RENTON
JANUARY 2019 DEMAND & NEEDS ANALYSIS
64
Exhibit 4-3. Job Density and Existing Network

CITY OF RENTON � RENTON TRAILS AND BICYCLE MASTER PLAN
JANUARY 2019 DEMAND & NEEDS ANALYSIS
65
Exhibit 4-4. Existing Trail Access to High-Density Residential and Job Nodes

RENTON TRAILS AND BICYCLE MASTER PLAN � CITY OF RENTON
JANUARY 2019 DEMAND & NEEDS ANALYSIS
66
Level of Traffic Stress
Bicycle systems that provide low traffic stress and high connectivity
attract wider usage:
…a bicycling network to attract the widest possible
segment of the population, its most fundamental attribute
should be low-stress connectivity, that is, providing routes
between people’s origins and destinations that do not
require cyclists to use links that exceed their tolerance for
traffic stress, and that do not involve an undue level of
detour. (Mineta Transportation Institute, 2012)
Renton has some low stress routes usable by most adults and
children. These are in Kennydale, Cedar River, and the Valley.
Most of the community does not have low stress facilities within ¼
mile. See Exhibit 4-5 and Exhibit 4-6.
Exhibit 4-5. Level of Traffic Stress Continuum
Source: City of Renton, 2018: BERK, 2018.
FOUR LEVELS OF TRAFFIC STRESS
LTS 1: the level that most children can tolerate.
LTS 2: the level that will be tolerated by the mainstream adult population.
LTS 3: the level tolerated by cyclists who are “enthused and confident” but still prefer having their own dedicated space for riding.
LTS 4: a level tolerated only by those characterized as “strong and fearless.”

CITY OF RENTON � RENTON TRAILS AND BICYCLE MASTER PLAN
JANUARY 2019 DEMAND & NEEDS ANALYSIS
67
Exhibit 4-6. Level of Traffic Stress and Existing Network

RENTON TRAILS AND BICYCLE MASTER PLAN � CITY OF RENTON
JANUARY 2019 DEMAND & NEEDS ANALYSIS
68
Schools
Renton is served by the Renton School District, Issaquah School District, and
Kent School District. There are numerous private school throughout the City.
The Renton School District serves most of the Renton city limits. The district
has 15 elementary schools, 4 middle schools, and 4 high schools.
Renton’s 2017 Trails and Bicycle Questionnaire found that children walk to
a large list of local schools (12 schools), and to a lesser extent bike to them
(6 schools). See Appendix A.
Renton has a sidewalk rehabilitation and replacement program targeting
places where curb, gutter, sidewalks, and curb ramps are needed. Many of
the schools in the district identify “walk to school” route options, and
improvements within those areas would benefit children and families.
Parks & Recreation Facilities
Renton’s parks and recreation facilities include 32 developed public parks,
965 acres of public open space, an 18-hole public golf course, two lake-
front beaches and a public boat launch. Many parks and recreation
facilities are accessed along the Cedar River Trail and Springbrook Trail,
as well as bike lanes and shared roadways. Pedestrian trails also connect
to and through parks and recreation facilities. However, parks and
recreation facilities are not fully connected by the trails and bicycle system.
See Exhibit 4-7.

CITY OF RENTON � RENTON TRAILS AND BICYCLE MASTER PLAN
JANUARY 2019 DEMAND & NEEDS ANALYSIS
69
Exhibit 4-7. Parks and Recreation and Existing Network

RENTON TRAILS AND BICYCLE MASTER PLAN � CITY OF RENTON
JANUARY 2019 DEMAND & NEEDS ANALYSIS
70
Transit Dependent Populations
Renton’s City Center and Valley planning areas have the most frequent bus
service. The Highlands and Benson neighborhoods have a few all-day
routes. Other areas have less frequent service and sparser coverage of
transit. The trail and bicycle network to transit facilities is discontinuous in
areas outside the City Center.
Areas with larger proportions of the elderly, the young, low-income
individuals, and households without access to a car are often considered
transit dependent. The first and last mile problem, one of the most complex
challenges for public transit, refers to the beginning and end of a trip
primarily made by public transit. Renton’s Trails and Bicycle Questionnaire
responses indicate that Renton residents use bicycles or walk to make short,
local trips typically associated with the first and last mile problem. See
Appendix A.
Improving walking and biking infrastructure to appeal to a broad and
diverse range of people – elderly, young, low income – can potentially
help solve the first and last mile problem and thereby make it easier for
more people to access transit. This would benefit one-third of the
community that are younger than 18 and older than 65 years. See Exhibit
2-3 in Chapter 2.
Those earning less than or equal to 80% of the area median income are
concentrated in the City Center, Valley, Benson, and Highlands areas. See
Exhibit 4-8.

CITY OF RENTON � RENTON TRAILS AND BICYCLE MASTER PLAN
JANUARY 2019 DEMAND & NEEDS ANALYSIS
71
Exhibit 4-8. Low Income Census Tracts and Existing Network

RENTON TRAILS AND BICYCLE MASTER PLAN � CITY OF RENTON
JANUARY 2019 DEMAND & NEEDS ANALYSIS
72
Equity – Puget Sound Regional Council Opportunity Index
The Puget Sound Regional Council (PSRC) has evaluated areas that provide
access to opportunities – education, economic, housing, transportation, and
health/environment. The current trail and bicycle network contribute to
opportunities and access for persons of color, and diverse age groups in
the City Center, Valley, and a few other Community Planning Areas. The
existing network is sparser in areas of lesser opportunity in Benson,
Highlands, and West Hill.
Opportunity maps illustrate where opportunity-rich communities exist, assess who has access to those neighborhoods, and help to understand what needs to be remedied in opportunity-poor neighborhoods. Exhibit 4-9 displays the current trail and bicycle network against the latest PSRC Opportunity Index map. This map is a graphical representation of how this plan analyzed demand and need with an equity lens.

CITY OF RENTON � RENTON TRAILS AND BICYCLE MASTER PLAN
JANUARY 2019 DEMAND & NEEDS ANALYSIS
73
Exhibit 4-9. PSRC Opportunity Index and Existing Network

RENTON TRAILS AND BICYCLE MASTER PLAN � CITY OF RENTON
JANUARY 2019 DEMAND & NEEDS ANALYSIS
74
City Center
Renton’s City Center Planning Area contains the historic core of the
community. It is a regional center for manufacturing and service jobs, and
increasingly a mixed-use residential neighborhood offering cultural and
commercial amenities. Many roads and regional trails converge in this hub.
The Renton Library, City Hall, and other government facilities serve the
community. Regional parks and trails provide gathering places and access
to the Cedar River and other open spaces. Renton adopted a City Center
Community Plan to guide the future growth and direction of the center.
City Center Community Plan goals include increasing transportation
connections for multiple modes, improving trail connections and reaching
more destinations, and making civic amenities more accessible. Since the
City Center is a multimodal crossroads to other neighborhoods, meeting
City Center goals will also advance this Trails and Bicycle Master Plan.
Goal 5: Provide better regional transportation connections for a
range of transportation modes to improve access to and from
the City Center.
Goal 6: Provide better internal connections between areas within
the City Center, especially Coulon Park/Lake Washington, The
Landing, North Renton neighborhood, Downtown, and the South
Renton neighborhood.
Goal 7: Connect regional trails in the City Center and build on
these key connections as an economic development strategy.
Goal 8: Protect and enhance the natural features and open
space in the City Center and improve public access to and
connections between the Lake Washington shoreline, the Cedar
River, and the variety of parks and open spaces throughout the
City Center.
The City Center is designated in part a Regional Growth Center and is also
slated to take most of Renton’s residential and commercial growth in the
next 20 years. Today, single-occupancy vehicles comprise 82% of trips in
the City Center. The City’s goal is to decrease drive alone work trips to
below 75%. Improving opportunities to bike and walk to and through the
City Center will help meet the needs of residents and employees across the
Renton planning area.
City Center and Regional Trails
City Center Plan, Makers 2011

CITY OF RENTON � RENTON TRAILS AND BICYCLE MASTER PLAN
JANUARY 2019 DEMAND & NEEDS ANALYSIS
75
Regional Trails
Regional trails in Renton include the Cedar River Trail, Soos Creek Trail,
Lake to Sound Trail, and soon the Eastside Rail Corridor and the Lake to
Sound Trail.
When complete the Eastside Rail Corridor will provide 16.7 miles of new
trail that will connect the cities of Renton, Bellevue, Kirkland, Redmond, and
Woodinville.
The Lake to Sound Trail, when completed by King County, will be a
continuous 16-mile non-motorized, multi-use recreational trail from the south
end of Lake Washington in Renton to the Puget Sound in Des Moines,
connecting the cities of Renton, Tukwila, Sea-Tac, Burien, and Des Moines.
King County has also planned other regional trail extensions with the Soos
Creek Trail with the future goal of connection to the Cedar River Trail.
See Chapter 5 for additional information on increases in Regional Trail miles.
GAPS & OPPORTUNITIES
Renton considered the gap analysis and community comments to identify
opportunities to create a more connected system with capacity for current
and future use.
This plan encourages higher participation rates in walking and biking by
better connecting users to destinations, reducing traffic stress, and
anticipating greater demand from new housing and job growth:
The network increases the extent of facilities in both high population
and high job density. See Exhibit 4-10 and Exhibit 4-11.
Nearly every gap is filled with a connecting route meeting LTS 1 or 2
criteria. See Exhibit 4-12.
The future network knits together all Community Planning Areas
including those of low opportunity. See Exhibit 4-13.

RENTON TRAILS AND BICYCLE MASTER PLAN � CITY OF RENTON
JANUARY 2019 DEMAND & NEEDS ANALYSIS
76
Exhibit 4-10. Population Density and Proposed Network

CITY OF RENTON � RENTON TRAILS AND BICYCLE MASTER PLAN
JANUARY 2019 DEMAND & NEEDS ANALYSIS
77
Exhibit 4-11. Job Density and Proposed Network

RENTON TRAILS AND BICYCLE MASTER PLAN � CITY OF RENTON
JANUARY 2019 DEMAND & NEEDS ANALYSIS
78
Exhibit 4-12. Level of Traffic Stress with ¼ Mile Service Area and Proposed Network ¼ Mile Service Area LTS 1 & 2

CITY OF RENTON � RENTON TRAILS AND BICYCLE MASTER PLAN
JANUARY 2019 DEMAND & NEEDS ANALYSIS
79
Exhibit 4-13. PSRC Opportunity Index and Proposed Network

RENTON TRAILS AND BICYCLE MASTER PLAN � CITY OF RENTON
JANUARY 2019 DEMAND & NEEDS ANALYSIS
80
BENCHMARKS
Benchmarking compares Renton’s trail miles to other agencies to assess
Renton’s performance relative to peer communities.
Renton has the lowest miles per 1,000 population compared to surrounding
communities and other major cities in south and east King County. See
Exhibit 4-14. If only implementing the Highest Priority projects (Tier 1) in
Chapter 5, the City’s network will be in the middle of benchmark
communities and increase its system length by over 65%.
Exhibit 4-14. Miles of Trails per 1,000 Population – Renton and Peers
Source: City of Renton, 2018.

CITY OF RENTON � RENTON TRAILS AND BICYCLE MASTER PLAN
JANUARY 2019 DEMAND & NEEDS ANALYSIS
81
LEVEL OF SERVICE
A “level of service” (LOS) refers to the amount and quality of trails and
bicycle facilities that are necessary to meet current and future needs. A
LOS helps establish a capital facility program. Costs and revenue can
then be matched, and projects phased to help achieve the planned LOS.
LOS policies or standards are locally established and up to each
community to set. Levels of service are often related to a unit of
population, e.g. miles of trail per 1,000 population. In addition to
quantity-based LOS measures, communities often consider quality and
extent (distribution).
This Plan is designed to meet the following three LOS criteria:
Level of Service – Quantity: Increase the miles of trails per 1,000
persons. See Exhibit 4-15.
Exhibit 4-15. Miles of Trails per 1,000 (2018 – 2035)
The Plan will increase miles of trails per 1,000 residents in Renton from its current level of 0.29 miles/l,000 residents in 2018 to 0.44 miles/1,000 residents with the implementation of all highest priority projects and to 0.95 miles/1,000 residents with the implementation of all proposed projects by 2035.
Source: City of Renton, 2018.
Given limited resources, Renton will phase the system over time based on priorities including community input and need.

RENTON TRAILS AND BICYCLE MASTER PLAN � CITY OF RENTON
JANUARY 2019 DEMAND & NEEDS ANALYSIS
82
Level of Service – Quality: Increase the extent of LTS 1 and LTS 2
facilities to increase user comfort and participation. See Exhibit 4-16.
Exhibit 4-16. Change LTS 1&2 Trail Miles
The Plan will increase the total LTS 1 & 2 trail miles in Renton from 23.3 in 2018 to 113 in 2035 by adding 92.8 miles of new LTS 1 & 2 trails.
Source: City of Renton, BERK, 2018.
Level of Service – Connectivity and Extent (Distribution):
a. Reduce gaps and increase the coverage of facilities across all
Renton community planning areas. See Exhibit 4-17.
b. Increase the share of residents and employees within a quarter
mile service area of LTS 1 & 2 facilities. See Exhibit 4-18.
Exhibit 4-17. Existing and Proposed Trail Miles by Community Planning Area
Source: City of Renton, BERK, 2018.

CITY OF RENTON � RENTON TRAILS AND BICYCLE MASTER PLAN
JANUARY 2019 DEMAND & NEEDS ANALYSIS
83
Exhibit 4-18. Percentage of Renton Residents within a Quarter Mile Service Area of LTS 1 & 2 Facilities
Source: City of Renton, BERK, 2018.

RENTON TRAILS AND BICYCLE MASTER PLAN � CITY OF RENTON
JANUARY 2019 DEMAND & NEEDS ANALYSIS
84

CITY OF RENTON � RENTON TRAILS AND BICYCLE MASTER PLAN
JANUARY 2019
CHAPTER 5
TRAIL & BICYCLE SYSTEM PLAN

RENTON TRAILS AND BICYCLE MASTER PLAN � CITY OF RENTON
THIS PAGE IS INTENTIONALLY BLANK

CITY OF RENTON � RENTON TRAILS AND BICYCLE MASTER PLAN
JANUARY 2019 TRAIL & BICYCLE SYSTEM PLAN
87
5 TRAIL & BICYCLE SYSTEM PLAN
GUIDING PRINCIPLES
Based on Chapter 1 Goals and Objectives, Chapter 3 Community
Involvement results, and Chapter 4 Demand and Needs Analysis,
following are guiding principles of the Trail and Bicycle System. The
Guiding Principles are ideas that influenced the proposed network
recommendations, design guidelines, and projects and priorities.
Characteristics
Renton’s Trail and Bicycle System will be:
Accessible, Connected to Destinations, and Continuous
Safe, Comfortable, and Inclusive
Easy to Navigate
Innovative and Flexible
Benefits
An improved Trail and Bicycle System will have positive effects for Renton’s
community by:
Achieving Equity
Increasing Awareness
Promoting Physical and Environmental Health
Enhancing the Economy and Community

RENTON TRAILS AND BICYCLE MASTER PLAN � CITY OF RENTON
JANUARY 2019 TRAIL & BICYCLE SYSTEM PLAN
88
NETWORK RECOMMENDATIONS
Renton’s Trail and Bicycle System is one integrated system that will be
expanded from about 30 miles to 127 miles within the city limits. This
includes approximately 4 miles of existing trail facilities being upgraded
or converted to different facility types. See Exhibit 5-1. Another 8 miles of
new, proposed trails are planned in areas immediately outside of Renton’s
city limits for an overall plan total of 135 miles.
Exhibit 5-1. Existing and Proposed Trail Miles
Source: City of Renton, 2018; BERK, 2018.
The Trail and Bicycle System features a regional hub connecting in the
Downtown Urban Center, and an expanded local network. Regional trails
connect Renton to other cities and regional destinations that lie to the north,
east, south, and west. Local Connector routes tie together multiple Renton
neighborhoods to one another and carry more non-motorized trips. Local
Neighborhood routes connect destinations within the same neighborhood.

CITY OF RENTON � RENTON TRAILS AND BICYCLE MASTER PLAN
JANUARY 2019 TRAIL & BICYCLE SYSTEM PLAN
89
Exhibit 5-2. Regional and Local System Map

RENTON TRAILS AND BICYCLE MASTER PLAN � CITY OF RENTON
JANUARY 2019 TRAIL & BICYCLE SYSTEM PLAN
90
Regional
With the proposed network, regional trail miles will double in Renton under
the Plan from approximately 9.2 miles today to 19.1 by 2035.
Exhibit 5-3. Existing and Proposed Regional Trail Miles
Source: City of Renton, 2018, BERK, 2018
Renton’s Downtown Urban Center will become a hub where several
regional trail connections that come together all linked to the Cedar River
Trail.
The Eastside Rail Corridor will connect from the Cedar River Trail via
the Renton Connector or Houser Way Bypass north towards Bellevue.
The Lake to Sound Trail will connect to the Cedar River Trail to the
east and to the Green River Trail to the west.
The Lake Washington Loop Trail would connect from the Cedar River
northwest along Lake Washington Blvd to Seattle.
A series of trail alternatives were reviewed with King County and the City
of Renton staff. See Exhibit 5-4. Based on the meetings with King County,
concepts were developed for Preferred Lake to Sound and Eastside Rail
Corridor routes. See Appendix B for preferred concepts and intersection
improvements.
Other regional trail improvements include the 1.2-mile Soos Creek Trail
extension from SE 192nd St to Petrovitsky Road, considered a high priority
programmed project in the King County Regional Trails Need Report and
the 2014 - 2019 Capital Improvement Program. Other segments including
the Petrovitsky Crossing, Renton Park Segment, and the Lindberg to Cedar
River Trail, are considered programmed and identified as a Tier 3 priority.
(King County, 2016)

CITY OF RENTON � RENTON TRAILS AND BICYCLE MASTER PLAN
JANUARY 2019 TRAIL & BICYCLE SYSTEM PLAN
91
Exhibit 5-4. Regional Trail Alternatives
Source: MacLeod Reckord, 2017; City of Renton, 2017.

RENTON TRAILS AND BICYCLE MASTER PLAN � CITY OF RENTON
JANUARY 2019 TRAIL & BICYCLE SYSTEM PLAN
92
Local Connector & Local Neighborhood
Community outreach results showed high participation in walking and
biking in and around neighborhoods, and a desire to connect to the
broader trail and bicycle network. The proposed network focuses on
increasing and expanding the local network. Completing all proposed
projects in the plan will increase Local Neighborhood miles by 475% and
Local Connector miles by 412% and better connect local neighborhoods to
the Regional trail network. See Exhibit 5-5 and Exhibit 5-6.
Exhibit 5-5. Regional and Local Trail Miles – Existing and Proposed
Source: City of Renton, 2018, BERK, 2018
Exhibit 5-6. Regional and Local Trail Miles – Total Proposed Network
Source: City of Renton, 2018, BERK, 2018

CITY OF RENTON � RENTON TRAILS AND BICYCLE MASTER PLAN
JANUARY 2019 TRAIL & BICYCLE SYSTEM PLAN
93
TRAIL & BICYCLE FACILITY CHARACTERISTICS
Roadway Characterisitcs & Trail & Bicycle Options
Renton’s unified trail system is made up of different facilities meant to
reduce level of stress given traffic volumes, speed, and number of lanes in
each direction. Shared Use Paths are separated from roadways and have
the most flexible use and are often implemented with Regional or Local-
Connector facilities. Bicycle lanes may be protected, buffered, or striped
on Local-Connector facilities. Local Neighborhood routes feature lower
volume traffic and a range of Shared Roadways, Buffered Lanes,
Neighborhood Greenways, or Soft Surface Trails. See Exhibit 5-7.
Exhibit 5-7. Facility Options by Roadway Characteristics
* LTS 2 may be achieved with protected bike lanes if traffic volumes are less than 10,000-15,000. Source: City of Renton, 2018.
ROADWAY DESCRIPTION SPEED LIMIT (MPH)
LANES PER DIRECTION FACILITY OPTIONS
No vehicle traffic - - Soft Surface Trail Shared Use Path
Low-volume, residential, local street
≤ 25
1 Neighborhood Greenway Shared Roadway
2-3 Shared Roadway Bike Lane Buffered Bike Lane
Mixed use, medium volume collector arterial
30
1 Bike Lane Buffered Bike Lane
2-3
Bike Lane Buffered Bike Lane
Protected Bike Lane*
35 2
Bike Lane Shared Use Path
High volume, high intensity, major arterial
3+ Bike Lane Buffered Bike Lane
40 2+ Protected Bike Lane Shared Use Path
LTS 1 LTS 2 LTS 3 LTS 4

RENTON TRAILS AND BICYCLE MASTER PLAN � CITY OF RENTON
JANUARY 2019 TRAIL & BICYCLE SYSTEM PLAN
94
This Trails and Bicycle Plan will increase the miles of each trail type with an
emphasis on Shared Use Paths that offer the most comfort and safety for
all non-motorized modes. All other trail types will increase from present
numbers. See Exhibit 5-8. Each trail and bicycle facility type is described in
the following section with typical features and design considerations.
Exhibit 5-8. Existing and Proposed Network by Facility Type (Miles and Percent)
FACILITY EXISTING PROPOSED EXISTING PROPOSED
Shared Use Path 7.67 40.03 25% 31%
Protected Bike Lane - 3.05 - 2%
Protected Bike Lane - 0.39 - < 1%
Two-Way Protected Bike Lane - 2.66 - 2%
Striped Bike Lane 9.70 32.03 32% 25%
Striped Bike Lane 9.70 31.24 32% 24%
Buffered Bike Lane - 0.79 - 1%
Neighborhood Greenway - 22.82 - 18%
Signed Shared Roadway 2.47 10.31 8% 8%
Pedestrian Trail 10.36 19.58 34% 15%
Boardwalk 0.26 3.96 1% 3%
Hard Surface Trail 6.32 5.62 21% 4%
Soft Surface Trail 3.79 9.99 13% 8%
TOTAL 30.20 127.81 100% 100%
Notes: Proposed trails include conversion of 4.34 miles of existing facilities to new facility types. Source: City of Renton, 2018.

CITY OF RENTON � RENTON TRAILS AND BICYCLE MASTER PLAN
JANUARY 2019 TRAIL & BICYCLE SYSTEM PLAN
95
Low-Stress Network
The City of Renton can select the facility type that most increases user
comfort where feasible with local conditions. By increasing comfort and
offering more buffered or protected facilities, there could be increased
non-motorized facility usage.
The Trails and Bicycle Plan increases the miles of trail and bicycle facilities
that are suited for all or most users – LTS 1 and LTS 2. See Exhibit 5-9.
These include facilities such as separated Shared Use Paths, Protected and
Buffered Bike Lanes, and others.
For a variety of reasons –physical conditions, design considerations,
partner requirements, funding, and others – LTS 1 and 2 facilities are not
feasible everywhere.
When fully implemented, the plan increases LTS 1& 2 facility miles from
23.34 to 112.97 miles, an increase of 398%. Additionally, the plan
increases LTS 3 & 4 facility miles from 6.86 to 14.84 miles, an increase of
133%. Overall, the plan increases the ratio of LTS 1 & 2 miles to LTS 3 &
4. See Exhibit 5-9.
Exhibit 5-9. Existing and Proposed Trails by LTS Rating (Miles and Percent)
Source: City of Renton, 2018.
CITY LIMITS TOTAL LTS 1&2 LTS 3&4 LTS 1&2 LTS 3&4
Existing 30.20 23.34 6.86 77% 23%
Proposed 127.81 112.97 14.84 88% 12%

RENTON TRAILS AND BICYCLE MASTER PLAN � CITY OF RENTON
JANUARY 2019 TRAIL & BICYCLE SYSTEM PLAN
96
SHARED USE PATH
A shared-use path is physically separated from traffic by open space or a
barrier and allows for two-way travel. A shared-use path can be used by
bicyclists, pedestrians, skaters, wheelchair users, joggers, and other non-
motorized users. Some common locations for shared-use paths are along
rivers, streams, utility rights of way, and abandoned railroad rights of way
and between parks as well as within existing roadway corridors.
Example: Cedar River Trail.
For the purposes of this plan, the Shared-Use Path standard measurements
were used. Physical and financial cost constraints may lead to considering
Side Paths, which separation and width would not be ideal.
Regional Shared Use Paths, like the Cedar River Trail, were the most used
by bicyclists and second-most used locations by walkers per questionnaire
results. Route locations along natural areas and separated routes were
particularly used and desired by off-road bicycle users such as mountain
bikers, BMX users, and Cyclocross users as preferred locations in the
questionnaire. See Chapter 3.
The Washington State Department of Transportation’s Design Manual
suggests: When designing shared-use paths, the bicyclist may not be the
critical design user for every element of design. For example, the crossing
speeds of most intersections between roads and pathways should be
designed for pedestrians, as they are the slowest users. Accommodate all
intended users and minimize conflicts.
Exhibit 5-10. Shared-Use Path
Shared Use Path
Facility physically separated from traffic by open space or a barrier.
May be in the right-of-way or independent right-of-way.
2-way travel. May be used by bicyclists, pedestrians, skaters, wheelchair users, joggers, and other non-motorized users.
Width: o 10’ minimum o 12’ preferred + 2’ shoulder on each side = 14’
or 16’ total 5’ minimum separated from roadway. Surfacing varies.
Renton, 2009; WSDOT Manual Chapter 1515

CITY OF RENTON � RENTON TRAILS AND BICYCLE MASTER PLAN
JANUARY 2019 TRAIL & BICYCLE SYSTEM PLAN
97
PROTECTED BIKE LANE
A protected bike lane combines the user experience of a multi-use trail
with a conventional bike lane. They provide space that is used for bicycles
and are separated from motor vehicle travel lanes, parking lanes and
sidewalks. Two-way protected bike lanes are physically separated cycle
tracks that allow bicycle movement in both directions on one side of the
road. This facility type will be newly implemented in the city and planning
area.
Exhibit 5-11. Protected Bike Lane
Configured as a protected cycle track—at street level with a parking lane or other barrier between the cycle track and the motor vehicle travel lane—and/or as a raised cycle track to provide vertical separation from the adjacent motor vehicle lane.
Require additional considerations at driveway and side-street crossings.
One-way lane width varies from 5-8 feet exclusive of the barrier.
WSDOT Design Manual Exhibit 1520-1 | AASHTO Bike Guide
Two-Way Protected Bike Lane

RENTON TRAILS AND BICYCLE MASTER PLAN � CITY OF RENTON
JANUARY 2019 TRAIL & BICYCLE SYSTEM PLAN
98
BUFFERED BIKE LANE
Buffered bike lanes are conventional bicycle lanes paired with a
designated buffer space separating the bicycle lane from the adjacent
motor vehicle travel lane and/or parking lane. The City does not yet have
an example of a buffered bike lane.
Exhibit 5-12. Buffered Bike Lane
Separated buffered bike lanes are at grade with the roadway, and they include a bike lane and a buffer area.
Buffer: Consider a 3-foot buffer strip whenever possible. Minimum width is 2 feet.
Bike Lane Width: 3 feet to 7 feet. o Minimum: 3 feet. o Recommended: 5 feet to enable passing maneuvers
between cyclists o Increased: High cyclist volume locations should consider
more width to facilitate mobility performance for this mode.
WSDOT Design Manual: 1520.02(3)
Buffered Bike Lane

CITY OF RENTON � RENTON TRAILS AND BICYCLE MASTER PLAN
JANUARY 2019 TRAIL & BICYCLE SYSTEM PLAN
99
STRIPED BIKE LANE
The striped bicycle lane accommodates cyclists in a
designated striped lane that is typically 5-feet wide.
Example: Duvall Avenue NE, north of NE 4th Street
Exhibit 5-13. Striped Bike Lane
Bike Lane
Shared Lane Down/Bike Lane Up
1-way facilities traveling in the direction of traffic, usually on both sides of roadway.
Exclusive use by bicyclists. Width: 5’ minimum to curb face or guardrail, 4’ minimum without curb and gutter.
Lane and Parking Area Combined Width: 13 feet without curb face. 14 feet with a curb face.
Paved surface denoted with pavement markings: o 4” or 6” solid white line demarcating bike lane,
bicycle lane symbol. o 4” solid white line demarcating parking area
Bike lane symbol (6’ high) and directional arrows should be painted on the far side of each intersection.
Renton, 2009

RENTON TRAILS AND BICYCLE MASTER PLAN � CITY OF RENTON
JANUARY 2019 TRAIL & BICYCLE SYSTEM PLAN
100
NEIGHBORHOOD GREENWAY
Neighborhood greenways are safer, calm residential streets.
Neighborhood greenways are a large component of added trail and
bicycle miles in the City Planning Areas, though no examples exist
presently.
Exhibit 5-14. Neighborhood Greenway
Neighborhood Greenway
Typically, residential streets that parallel an arterial route providing a "lower stress" option.Low vehicle volumes and speeds through traffic calming treatments.
Safe and convenient crossings of arterial streets. Signs and pavement markings. Could include storm water facilities (low-impact development facilities).

CITY OF RENTON � RENTON TRAILS AND BICYCLE MASTER PLAN
JANUARY 2019 TRAIL & BICYCLE SYSTEM PLAN
101
SIGNED SHARED ROADWAY
When right-of-way widths and existing roadway conditions
prohibit the addition of dedicated bicycle facilities, a roadway
can be designated for shared use by motorists and bicyclists.
Typically, this design solution is used on roadways with low
traffic speeds and low levels of traffic or with wide curb lanes (i.e. 14 feet
minimum). Signed shared roadways may provide a safer alternative to
travel on busier parallel routes; direct cyclists toward particular
destinations, such as parks, schools, shopping areas; or may serve as a link
between discontinuous segments of dedicated bicycle facilities. Because
signed shared roadways are often local streets, they may not necessarily
be the most direct route. Ideally, signed shared roadways give bicyclists
more priority in traffic maneuvers.
Example: 116th Ave SE
Exhibit 5-15. Signed Shared Roadway
Signed Shared Roadway
Bicyclists share roadway with motorists for safety, wayfinding, or other purposes
No change to roadway configuration required, though routes are often designated with signage and other measures to give bicyclists priority or enhance their safety and comfort
Usually on lower volume, speed roadways/local streets. Signage: every ¼ mile, or at every turn
Renton, 2009

RENTON TRAILS AND BICYCLE MASTER PLAN � CITY OF RENTON
JANUARY 2019 TRAIL & BICYCLE SYSTEM PLAN
102
PEDESTRIAN TRAILS
Pedestrian trails are dedicated facilities made of a variety of surfaces
depending on environmental sensitivity and usage levels. Hard-surface
trails can require less maintenance and accommodate more frequent use
but are more expensive to construct and may not be sited where there are
critical areas. Soft-surface trails can cost less when constructed but are
typically not suited for heavy use and may require more maintenance.
Boardwalks may be appropriate in wetlands or over water bodies.
Exhibit 5-16. Pedestrian Trails
Boardwalk
Boardwalks
Boardwalks are used to span unavoidable wet areas or depressions. It allows adequate drainage and impacts the fragile ecosystem less than other surface types.
Example: Springbrook Trail south of SW 27th Street
Hard Surface Trail
Hard Surface Trails
Trails surfaced with asphalt, concrete, crushed stone, soil cement, or other pervious materials.
Example: Thomas Teasdale to Cascade Park Trail
Soft Surface Trail
Soft Surface Trail
Trails surfaced with earth, woodchips, or other similar natural and pervious materials.
Example: May Creek Trail

CITY OF RENTON � RENTON TRAILS AND BICYCLE MASTER PLAN
JANUARY 2019 TRAIL & BICYCLE SYSTEM PLAN
103
FACILITY DESIGN GUIDELINES
Intersection & Trail Crossing Guidelines
Well-designed intersections and trail crossings are essential in creating a
continuous trail and bicycle system that encourages walking and biking.
There are limited pedestrian bridges and pedestrians must cross lanes of
travel at intersections; bicyclists are often in the flow of vehicular travel
between and at intersections. Separated trails like shared use paths may
cross streets. See guidelines for different types of crossings below.
Pedestrians at Intersections
These intersections, where the paths of people and vehicles come
together, can be the most challenging part of negotiating a
pedestrian network. If pedestrians cannot cross the street safely,
then mobility is severely limited, access is denied, and walking as
a mode of travel is discouraged. (FHWA, Undated)
Ensuring pedestrian safety and comfort follows these design principles:
Make pedestrians as visible as possible.
Make pedestrian actions as predictable as possible.
Slow vehicular traffic, particularly in central business districts or
similar areas. (FHWA, Undated)
Treatments at intersections include curb bulbs, curb ramps, signalization,
crosswalks, pedestrian refuge islands.
Bicyclists
The principle objective when designing intersections for bicycle
mobility and safety performance is to provide a visible, distinct,
predictable, and clearly designated path leading to and through
the intersection while managing potential conflicts between all
other users and cyclists. (WSDOT Design Manual 2015)
The National Association of City Transportation Officials (NACTO)
suggests several methods for increasing bicyclists’ comfort and reducing
the risk of crashes:
Bike Box A bike box is a designated area at the head of a traffic lane at a signalized intersection that provides bicyclists with a safe and visible way to get ahead of queuing traffic during the red signal phase.
Crossing Markings Intersection crossing markings guide bicyclists on a safe and direct path through intersections, including driveways and ramps.
Through Bicycle Lane Allows bicyclists an opportunity to position themselves to avoid conflicts with turning vehicles at an intersection.
Source: NACTO

RENTON TRAILS AND BICYCLE MASTER PLAN � CITY OF RENTON
JANUARY 2019 TRAIL & BICYCLE SYSTEM PLAN
104
Designs should heighten the level of visibility, denoting a clear right-
of-way, and facilitating eye contact and awareness with competing
modes.
Intersection treatments can resolve both queuing and merging
maneuvers for bicyclists and are often coordinated with timed or
specialized signals.
The configuration of a safe intersection for bicyclists may include
elements such as color, signage, medians, signal detection, and
pavement markings.
See the sidebar for several design options. More options and details
can be found in the WSDOT Design Manual 2015 and the NACTO
Urban Bikeway Design Guide, Second Edition, 2014, and others.
Trail Crossings
Clearly define who has the right of way and provide sight
distance for all users at shared use path and roadway
intersections. (WSDOT Design Manual 2015)
Two types of trail crossings are common:
Mid-block – preferably placed perpendicular to a road and with
traffic right of way assignments; traffic control devices; sight distances
for both bicyclists and motor vehicle operators; refuge island use;
access control; and pavement markings
Adjacent Path Crossing – at an intersection where the trail crossing is
placed within public intersection crosswalks
In addition to standards in the WSDOT Design Manual for trail
crossings, the City can consult standards and specifications developed
by the National Park Service Handbook for Trail Design and Construction
and Maintenance, and US Forest Service Standard Trail Plans and
Specifications.
Transit Stop Integration
The first and last mile problem, one of the most complex challenges for
public transit, refers to the beginning and end of a trip primarily made
by public transit. Renton’s questionnaire responses summarized in
Chapter 3 and Appendix A indicate that residents use bicycles or walk
Transit as part of a Mobility Ecosystem King County Metro customers will soon be able to use new mobile apps to hail an on-demand shuttle to and from transit hubs throughout the region, starting at the county’s largest park-and-ride…. Metro is creating a mobility ecosystem with transit at the center, moving large numbers of people over longer distances and along the busiest corridors in King County. (King County Metro, October 2018)
Transit Integration Prioritizing bicycle routes to transit stops and stations, reducing traffic, and improving bicycle and transit integration (bike parking, bikes on-board capacity) is essential to getting transit customers out of their cars and on a bicycle for the first or last mile of travel. (American Public Transportation Association, September 2018)
Bike Sharing Bike share stations can be co-located with transit stops to form mobility hubs.
Wayfinding Bicycle wayfinding signage should be used to guide bicyclists to transit stops, especially for rapid services and other transit lines with significance for long trips. NACTO

CITY OF RENTON � RENTON TRAILS AND BICYCLE MASTER PLAN
JANUARY 2019 TRAIL & BICYCLE SYSTEM PLAN
105
to make short, local trips typically associated with the first and last mile to
or from the destination.
Improving walking and biking infrastructure to appeal to a broad and
diverse range of people can help address the first and last mile problem
and thereby make it easier for more people to access transit. This plan
includes proposed projects that will improve access to high density
residential or commercial zones, transit, or services.
Likewise, there are many things that transit agencies can do to make transit
use more convenient, including:
Allowing bikes on board Providing bicycle parking at transit centers or stops Providing for bike sharing Wayfinding along bike routes Ride sharing to transit hubs in low transit service areas Avoid requiring assigned bike spaces
Signage
This plan promotes a connected system to take trail and bicycle facility
users to everyday destinations. A wayfinding plan for signage can help
them find their destination or discover a new one.
The Renton Downtown Civic Core Vision and Action Plan provides a
wayfinding system to link pedestrians and cyclists to parks, trails, and
places in the Downtown. The wayfinding system advances the design and
character of Downtown. The City anticipates a similar wayfinding
approach citywide with variations unique to each neighborhood.
Exhibit 5-17. Renton Downtown Civic Core Wayfinding System
Source: City of Renton, 2018.

RENTON TRAILS AND BICYCLE MASTER PLAN � CITY OF RENTON
JANUARY 2019 TRAIL & BICYCLE SYSTEM PLAN
106
The City may develop route-specific signage and/or pavement markings to
guide pedestrians and bicyclists to their destinations along preferred
routes. Route designation and guide signs would be installed based on
regional standards. Sign spacings may depend on the regional,
neighborhood, and local destinations on the route. Bike route signs may be
mounted to freestanding posts or to existing utility poles or light standards.
In addition to wayfinding guidelines, this plan addresses roadway caution
signage and pavement markings. Roadside caution signs and pavement
markings follow the standards and guidelines of the Manual of Uniform
Traffic Control Devices and the AASHTO Guidelines for the Development
of Bicycle Facilities.
King County promotes regional trail wayfinding elements through a
general policy in its King County Open Space Plan: Parks, Trails, and
Natural Areas:
CIP-151 King County should/shall provide up-to-date mapping
and consistent wayfinding throughout the regional trails network
to enhance user navigation and travel. Trail wayfinding
programs should be consistent with the USDOT MUTCD and
regionally-accepted wayfinding programs.
King County has also created a King County Regional Trails System (RTS)
Arts Master Plan calling for improved signage standards consistent
between the County and cities:
The RTS needs an appropriate wayfinding approach to signage;
this standard should be included in the RTS Design Guidelines.
Consider improved signage standards consistent among King
County and other jurisdictions, with an eye toward unifying
alignments.
For the Cedar River Tail in King County, the Art Master Plan calls for
Gateway/Trailhead Wayfinding Projects, Elements, and Signage.
Site Amenities
Bike Parking Guidelines
Bicyclists will seek to park as close as possible to their final destination. Per
ASHTO guidance, bicycle racks should be located so that they:
Are easily accessed from the street and protected from motor vehicles.

CITY OF RENTON � RENTON TRAILS AND BICYCLE MASTER PLAN
JANUARY 2019 TRAIL & BICYCLE SYSTEM PLAN
107
Are visible to passers‐by to promote usage and enhance security.
Do not impede or interfere with pedestrian traffic or routine
maintenance activities.
Allow reasonable clearance for opening of passenger‐side doors of
parked cars.
Are covered, if possible, where users will leave their bikes for a longer
amount of time.
Performance criteria for bike parking racks have been developed by the
Association of Pedestrian and Bicycle Professionals, September 2015, in
the Essentials of Bike Parking. Bike racks should be designed to:
Support bikes upright without putting stress on wheels
Accommodate a variety of bicycles and attachments
Allow locking of frame and at least one wheel with a U-lock
Be intuitive to use
Bicycle Lean Rails
The City of Renton may install bicycle lean rails at intersections allowing
bicyclists to rest their arms and feet when waiting at intersections. They
have been installed in Seattle along the Burke-Gilman Trail, together with
a push button at the intersection to initiate a crossing phase.
Exhibit 5-18. Bicycle Leaning Rail
Source: City of Seattle.
Trailheads and Amenities
Trailheads serve as the designated entryways into trails and have clear
signage. Features also include vehicle or bicycle parking, information

RENTON TRAILS AND BICYCLE MASTER PLAN � CITY OF RENTON
JANUARY 2019 TRAIL & BICYCLE SYSTEM PLAN
108
stations, informal recreation areas, seating and picnic areas, plazas or
gathering spaces, and restrooms. For maintenance and emergency vehicle
access, trailheads would be allowed occasional vehicle access. Trailheads
may offer various levels of amenities depending on location, need, and
expected user groups.
Access should be provided and controlled so that ad hoc trails do not occur
on private land or on public lands where access is not desired, e.g.
environmentally sensitive areas.
The following guidelines relate to the development and placement of
trailheads and access points.
Trailhead Location: Trailheads should be placed at each terminus of a
trail corridor, and any place where a large concentration of trail users
is expected, such as at major parks along the trail.
Trailhead Features: Trailheads should at least include parking and a
trail map. Trailheads may also include restrooms, drinking water, picnic
facilities, benches, optional lighting, bike racks, and other recreational
amenities. Site specific designs can also create or enhance
neighborhood identity, incorporate public art, and/or provide cultural
or environmental interpretation opportunities.
Trailhead Special Parking Designs: Trailheads associated with off-
road biking trails or equestrians should provide parking and turn-
around space for trailers.
Trailhead Accessibility: An accessible pathway should be developed
that connects parking and other accessible elements to the trailhead.
ADA access should be provided to as many site features as possible
based on site conditions
Trail Access Points: Trail access points should be placed wherever
trail access is expected, such as at schools, commercial areas, and
parks. Trail access points should include signage identifying the trail
and may include a map and drinking water. These access points serve
to encourage neighborhood and local pedestrian and bicycle access to
the trail system. They provide minimal amenities, most importantly trail
system signs. They should be located at approximately one quarter-
mile intervals along corridors, particularly along regional trail routes
or other routes with large concentrations of uses. Entry nodes typically
do not include parking facilities but could have a few standard size
spaces depending on needs and circumstances.

CITY OF RENTON � RENTON TRAILS AND BICYCLE MASTER PLAN
JANUARY 2019 TRAIL & BICYCLE SYSTEM PLAN
109
Landscaping: Typical landscape elements will include grass and trees
or shrubs to buffer parking areas from the street. Trees may provide
shade relief and accentuate amenities within the trailhead location,
and alert trail users to the presence of a trailhead. Informal
landscaped areas may offer recreation potential.
Signs: Signs should include general and interpretive signs, location
map, and rules/notices.
Additional Design Guidance Resources
AASHTO Guide for the Development of Bicycle Facilities
This manual of design standards is recognized nationally as the “industry
standard for development of bicycle facilities.” All of the design guidelines
included in the recommendations section of this plan will meet the minimum
standards articulated in the AASHTO document.
WSDOT Local Agency Guidelines
This manual identifies specific design standards related to bicycle and
pedestrian facility installations. These standards are referenced in the
design guidelines.
King County Regional Trails Guidelines
King County Regional trail guidelines are closely aligned with the AASHTO
guidelines but are intended to create and unify the regional network by
standardizing regional trail design elements, based on the concerns of
safety, convenience, aesthetic experience, and economical maintenance.
Some King County regional trails see as many as 2,000 users a day. As
such, the regional trail standards are designed to accommodating a large
number and variety of users in a safe, efficient, and enjoyable manner.
Other
The City may also consult standards and specifications developed by the
National Park Service Handbook for Trail Design and Construction and
Maintenance, US Forest Service Standard Trail Plans and Specifications, or
the United States Access Board, A Summary of Accessibility Standards for
Federal Outdoor Developed Areas.

RENTON TRAILS AND BICYCLE MASTER PLAN � CITY OF RENTON
JANUARY 2019 TRAIL & BICYCLE SYSTEM PLAN
110
PROJECTS & PRIORITIES
Projects
Responding to gaps and needs and community input, and Guiding
Principles, this plan promotes trail and bicycle facilities of all types across
all Community Planning Areas. Eighty projects have been identified.
Shared Use Path
Striped Bike Lane
Pedestrian Trail
Protected Bike Lane

n
n
n
n
n
n
n
n
n
n
n
n
n
n
n
n
n
n
n
n
n
n
n
n
n
n
n
n
n
n
n
n
n
n
n
n
n
n
n
n
n
n
n
!(
!(
!(
!(
!(
!(
!(
!(
!(
!(
!(
!(
!(
!(
!(
!(
!(
!(
!(
!(
!(
!(
!(
!(
!(
!(
!(
!(
!(
!(
!(
!(
!(
!(
!(
!(
!(
!(
!(
!(!(
!(!(
!(
!(
!(
!(
!(
!(
!(
!(
!(
!(
!(
!(
!(
!(
!(
!(
!(
!(
!(
!(
!(
!(!(
!(
!(
!(
!(
!(
!(
!(
!(
!(
!(!(
!(
!(
!(
!(
!(
!(
!(
!(
!(
!(
!(
!(
!(
!(
!(
!(
!(
!(
!(
!(
!(
!(
!(
!(
!(
!(
!(
!(
!(
!(
!(
!(
!(
!(
!(
!(
!(
^
^
^
^
^
^
^
Hoquiam Ave NE
Talbot Rd
S
SEJonesRd
SPug
etDr
Lind Ave SW
Monroe Ave NE
Edmonds Ave NE
S 7th St
Newcastle Way
116th Ave SE
87th Ave S
WellsAve
S
148th Ave SE
128th Ave SE
SE 216th St
Benson Rd S
SE183rdSt
SW 41st St
SE 168th St
Union Ave NE
SW 7th St
Lake
WashingtonBlvd
SE
Puget Dr SE
SEMayValleyRd
SW 34th St East Valley Rd
SW 27th St
E Valley Hwy
84th Ave S
S 216th St
SouthcenterBlvd
SE 192nd St
S 228th St
154thPlSE
S 132nd St
N3rdSt
64th Ave S
Island Crest W
ay
TukwilaPkwy
SE 208th St
68th Ave S
Duvall Ave NE
S129thSt N 4th St SE 128th St
Interurban Ave S
Rainier Ave S
124th Ave SE
NE 4th St
Rainier
Ave
N
4thAve
N
CoalC
reekPkw
ySE
S212thW
ay
NE3rd
St
EMercerW
ay
140th Ave SE
OakesdaleAve
SW
RentonAve
S N
ParkDr
SW 43rd St SE
CarrRd
BeaconAve
S
LoganAve
N
Forest Dr SE
S212thSt
SGradyW
ay
Park Ave N
132nd Ave SE
156th Ave SE
S124thSt
148th Ave SE
Lakem
ont Blvd SE
116th Ave SE
S 180th St
66th Ave S
164th Ave SE
AirportWay
SWGrady
Way
SE 204t
h Way
WMerce
rWay
Monster
Rd
SW
SEMayValleyRd
140thWaySE
SE Petrovitsky Rd
NewcastleGolfClubRd
68thAveS
S 133rd St
UV169
UV900
UV515
UV900
UV181
UV167
¥405
¥405
¥405
27
38
45
S 7th St
SunsetBlvd
N
NE 23rd Pl
NESun
setBlvd
SE 160th St
NE 6th St
NE 19th St
N 30th St
NE 10th St
NE27thSt
SE 164th St
Park Ave N
Main Ave S
NE 24th St
Jericho Ave NE
NE 10th St
TalbotRd
S
NE6thSt
NE 7th St
MontereyAve
NE
125th Ave SE
N 8th St
NE 10th St
NE 4th St
SE 184th St
NE9thStBeacon
W
ayS
NE 2nd St
RentonAveS
Garden Ave N
Nile Ave NE
GrantAveS
SE 164th St
108th Ave SE
HarringtonAve
NE
NE12thSt
Kirkland Ave NE
BensonDrS
SE Petrovitsky Rd
Lake
WashingtonBlvd
N
Talbot Rd S
Black RiverRiparianForest
Cascade Park
Cavanaugh PondNatural Area
Cedar River Natural Area
CedarRiverPark
Cedar River toLake Sammamish
Trail Site
Cedar RiverTrail
Cedar RiverTrail Park
Cleveland /RichardsonProperty
CoalfieldPark
Cougar MountainRegional
Wildland Park
EdlundProperty
Fort Dent
FosterGolf Course
FutureSW AthleticComplex
Gene CoulonMemorial Beach
Park
GreenRiverTrail
Honey CreekGreenway
LakeridgePark
MaplewoodCommunity Park
MaplewoodGolf Course
MaplewoodHeights Park
MayCreek
/ McAskill
May CreekGreenway
MayValley County
Park
McGarveyPark OpenSpace
MetroWaterworkPark
NARCOProperty
Panther CreekWetlands
PetrovitskyPark
Renton Park
RentonWetlands
Riverview Park
Ron RegisPark
SkywayPark
SoosCreek Park andTrail
SpringbrookTrail
SpringbrookWatershed
1
1
2
3
4
4
5
5
6
6
7
8
8
9
9
10
10
11
11
12
12
13
14
14
15
15
16
17
18
19
19
20
20
21
22
23
24
24
24
2526
28
28
29
30
31
32
33
34
35
36
37
39
40
41
42
43
44
46
47
47
4848
49
50
51
52
52
54
55
56
56
5758
59
60
61
62
62
63
63
64
65
65
66
66
67
67
67
68
68
68
69
70
71
72
73
74
74
75
76
77
77
78
79
79
80
63
3
53
53
Existing & Proposed Trails and Bicycle Network
Lake Washington
Existing TrailsShared Use Path
Striped Bike Lane
Signed Shared Roadway
Pedestrian Trail
Proposed TrailsShared Use Path
Protected Bike Lane
Striped Bike Lane
Neighborhood Greenway
Signed Shared Roadway
Pedestrian Trail
Parks & Open Space
^ Community Center
Library
Potential Transit Hub
n School°0 0.5 1Miles
Proposed Project Number, Name
1, 116th Avenue SE Bike Lanes
2, 128th Avenue SE Bike Lanes
3, 156th Avenue SE Bike Lanes
4, Benson Drive S/108th Avenue SE Shared Use Path
5, Benson Neighborhood Greenway
6, Benson Road/Main Avenue S Bike Lanes
7, Cascade Waterline Spur Trail
8, Cedar to Sammamish Trail
9, Duvall Avenue NE Bike Lanes
10, East Valley Road Shared Use Path
11, Eastside Rail Corridor
12, Edmonds Avenue Connector
13, Garden Avenue N Shared Use Path
14, Glencoe Neighborhood Greenway
15, Grant Avenue Neighborhood Greenway
16, Hardie Avenue Bike Lane & Shared Use Path
17, Harrington Ave NE Neighborhood Greenway
18, Highlands Hillclimb
19, Hillcrest Neighborhood Greenway
20, Honey Creek Trail Extensions
21, Houser Way and Factory Avenue
22, Houser Way N Shared Use Path
23, Jericho Avenue NE Bike Lanes
24, Kennydale Neighborhood Greenway
25, Kennydale Signed Shared Roadway
26, Kenyon-Dobson Trail and Trailhead
27, Lake to Sound Trail: East Segment
28, Lake to Sound Trail: West Segment
29, Lake Washington Loop Trail
30, Langston Road/SW 134th Street Hillclimb
31, Logan Avenue N Shared Use Path
32, Maplewood Heights Neighborhood Greenway
33, May Creek Hillclimb
34, May Creek Trail
35, May Valley Trail
36, Mill Avenue S Signed Shared Roadway
37, Monroe Avenue NE Bike Lanes
38, N 4th Street Connector
39, N 6th Street Bike Lanes
40, N 8th Street Shared Use Path
41, Naches Avenue Shared Use Path
42, NE 3rd Street
43, NE 4th Street Bike Lanes
44, NE 12th Street Bike Lanes
45, NE 16th Street Signed Shared Roadway
46, NE Sunset Blvd Shared Use Path
47, Nile Avenue NE Bike Lanes
48, North Highlands Neighborhood Greenway
49, North Southport Drive Shared Use Path
50, Oakesdale Avenue Bike Lanes
51, Pacific Railroad Trailhead & Trail
52, Panther Creek Trail
53, Powerline Trail
54, Puget Drive Bike Lanes & Signed Shared Roadway
55, Renton Connector
56, Renton Park Neighborhood Greenway
57, S 2nd Street Protected Bike Lanes
58, S 3rd Street Signed Shared Roadway
59, S/SW 7th Street Transit Connector
60, Sam Chastain Waterfront Trail
61, SE 168th Street Protected Bike Lanes
62, SE 182nd & 184th Streets Neighborhood Greenway
63, SE Petrovitsky Road Shared Use Path
64, Seattle Waterline Spur Trail
65, Seattle Waterline Trail
66, Shattuck to Airport Connector
67, Soos Creek Trail
68, South Highlands Neighborhood Greenway
69, Springbrook Trail
70, Springbrook Trail Extension
71, Sunset Boulevard Hillclimb
72, SW 16th Street Shared Use Path
73, SW 27th Street Connector
74, Talbot Road S Bike Lanes
75, Thunder Creek Trail
76, Tiffany-Cascade Connector Trail
77, Tiffany Park Neighborhood Greenway
78, Tukwila Station Trail
79, Union Avenue NE Bike Lanes
80, Wells Avenue S Signed Shared Roadway
Highest Priorty Project


CITY OF RENTON � RENTON TRAILS AND BICYCLE MASTER PLAN
JANUARY 2019 TRAIL & BICYCLE SYSTEM PLAN
113
Project Prioritization
Methodology
Eighty projects were scored with prioritization criteria addressing five
categories: Connectivity and Accessibility, Safety and Trail Experience,
Equity, Economy and Community, and Construction and Implementation.
Each category was weighted with Connectivity and Accessibility and Safety
and Trail Experience weighted more highly, Equity weighted moderately,
and Economy and Community and Construction and Implementation
weighted lower.
For each category, indicators or variables were developed. For each
indicator, project evaluation criteria were developed, and each rated on
either a 3-part high, medium, or low range or a 5-part high, medium-high,
medium, medium-low, and low range. See Exhibit 5-20 and Appendix D
for detailed information.
Exhibit 5-20. Prioritization Criteria and Indicators
CATEGORY INDICATORS/VARIABLES
Connectivity and Accessibility
Weight: 30%
Does the project:
Fill a gap between existing facilities, or Fill gap in area with no/few facilities, or Remove pedestrian and/or bicycle barriers?
To what extent does this project improve pedestrian/bike access to schools?
Does this project offer connections to parks, recreation, or natural areas?
Safety and Trail Experience
Weight: 30%
Does the project increase the extent of the low stress (LTS 1 or 2) network?
Does the project enhance the natural environment experience?
Does the project address a known issue regarding user experience (intersections, slope/terrain, lighting, wayfinding, formalize informal trail, etc.)?
Equity
Weight: 20%
Does the project reach a large number of people and jobs?
Does the project improve bicycle or pedestrian access for users older than Age 64 and/or users younger than Age 18?
Does the project improve bicycle or pedestrian access for the city's Households in Poverty?

RENTON TRAILS AND BICYCLE MASTER PLAN � CITY OF RENTON
JANUARY 2019 TRAIL & BICYCLE SYSTEM PLAN
114
CATEGORY INDICATORS/VARIABLES
Economy and Community
Weight: 10%
Does the project leverage plans or priorities?
Does the project improve access to high density residential or commercial zones, transit, or services?
Does the project reflect public feedback?
Construction and Implementation
Weight: 10%
Is the project a strong candidate for possible grants?
To what extent can the project be implemented with future construction?
Is the project reasonably attainable? Is the cost reasonably balanced with potential benefits?
Source: City of Renton, 2018; BERK, 2018.
Tiers & Results
Once scored, three tiers of projects were developed: Highest Priority, High
Priority, and Medium Priority. The City used two qualitative criteria in
addition to prioritization scores to develop the Highest Priority projects list
(Tier 1): partnership commitments and geographic equity. Thus, the top
scoring projects include the highest scoring projects, plus projects with
known commitments, and projects that are opportunistic, feasible in the
near term, enhance connectivity across planning areas, or assist with
geographic equity.
Since some projects had identical scores, there were 27 projects in Tier 1,
26 projects in Tier 2, and 27 projects in Tier 3.
The process is illustrated in Exhibit 5-21.
Exhibit 5-21. Prioritization Process
Source: BERK, 2018.
Define & Weight Priorities
Define & Score
Indicators
Rank Projects
Consider Partnerships
& Geographic
Equity
Develop Tier 1, Tier 2, and Tier 3
List

CITY OF RENTON � RENTON TRAILS AND BICYCLE MASTER PLAN
JANUARY 2019 TRAIL & BICYCLE SYSTEM PLAN
115
Project tiers are nearly equal in length, but Tier 1 projects emphasize
Shared Use Paths, and complete all Protected Bike Lanes. Striped Bike
Lanes are also increased. Implementation of Neighborhood Greenways is
initiated but is a smaller share than in later phases. Tier 2 continues to
advance Shared Use Paths, adds Striped Bike Lanes, and adds
Neighborhood Greenways, plus implements most Pedestrian Trails. Tier 3
completes the network with the emphasis on Neighborhood Greenways, as
well as Striped Bike Lanes, and Shared Use Paths. See Exhibit 5-22.
Exhibit 5-22. Facility Types by Project Tiers (Miles)
Note: Numbers are in miles and are rounded. Source: City of Renton, 2018; BERK, 2018.
The project list is provided in Exhibit 5-23. Project cut sheets are included in
Appendix C. Details of the ranking process are provided in Appendix D.
All Tiers Tier I Tier II Tier III
Shared Use Path 32.4 16.5 9.5 6.4
Protected Bike Lane 3.0 3.0 - -
Protected Bike Lane 0.4 0.4 - -
Two-Way Protected Bike Lane 2.7 2.7 - -
Striped Bike Lane 24.2 7.0 9.0 8.2
Striped Bike Lane 23.4 7.0 9.0 7.5
Buffered Bike Lane 0.8 - - 0.8
Neighborhood Greenway 22.8 1.4 7.0 14.4
Signed Shared Roadway 8.6 1.6 1.8 5.2
Pedestrian Trail 10.9 3.0 7.4 0.5
Boardwalk 3.7 0.2 3.5 -
Hard Surface Trail - - - -
Soft Surface Trail 7.2 2.9 3.8 0.5
Total Miles 101.9 32.5 34.7 34.7
Facil ity

RENTON TRAILS AND BICYCLE MASTER PLAN � CITY OF RENTON
JANUARY 2019 TRAIL & BICYCLE SYSTEM PLAN
116
Exhibit 5-23. Project Ranking R
AN
KIN
G
PR
OJE
CT N
UM
.
PROJECT NAME CO
NN
EC
TIV
ITY
&
AC
CESSIB
ILIT
Y
SA
FETY
& T
RA
IL
EX
PER
IEN
CE
EQ
UIT
Y
EC
ON
OM
Y &
C
OM
MU
NIT
Y
CO
NSTR
UC
TIO
N &
IM
PLE
MEN
TA
TIO
N
Tier 1 – HIGHEST PRIORITY
1 55 Renton Connector 4 4 4 4 3
1 28 Lake to Sound Trail: West Segment 4 4 4 4 3
3 57 S 2nd St Protected Bike Lanes 4 3 4 4 4
4 69 Springbrook Trail 3 4 4 4 3
5 11 Eastside Rail Corridor 3 4 3 4 4
5 7 Cascade Waterline Spur Trail 4 4 3 3 2
7 29 Lake Washington Loop Trail 3 3 4 4 4
7 73 SW 27th St Connector 3 3 4 4 4
7 27 Lake to Sound Trail: East Segment 4 3 3 4 3
10 60 Sam Chastain Water Trail 3 3 4 4 3
10 46 NE Sunset Blvd Shared Use Path 3 3 4 4 3
10 12 Edmonds Ave Connector 4 3 3 4 2
10 67 Soos Creek Trail 4 4 1 3 4
14 20 Honey Creek Trail Extension 3 4 2 4 2
14 34 May Creek Trail 3 3 2 4 2
14 9 Duvall Ave NE Bike Lanes 4 1 1 4 4
14 80 Wells Ave S Signed Shared Roadway 2 1 2 4 4
14 43 NE 4th St Bike Lanes 2 1 2 4 2
19 21 Houser Way & Factory Avenue 4 3 2 4 3
19 22 Houser Way N Shared Use Path 3 4 2 4 3
19 13 Garden Ave N Shared Use Path 4 3 3 4 2
22 17 Harrington Ave NE Neighborhood Greenway
4 2 3 4 3
22 61 SE 168th St Protected Bike Lanes 3 3 4 2 3
24 1 116th Ave SE Bike Lanes 2 3 4 4 3
24 59 S/SW 7th St Transit Corridor 2 3 4 4 3
24 38 N 4th St Connector 3 3 4 2 2
24 41 Naches Ave Shared Use Path 3 3 3 4 2
CITY OF RENTON � RENTON TRAILS AND BICYCLE MASTER PLAN
JANUARY 2019 TRAIL & BICYCLE SYSTEM PLAN
117
RA
NK
ING
PR
OJE
CT N
UM
.
PROJECT NAME CO
NN
EC
TIV
ITY
&
AC
CESSIB
ILIT
Y
SA
FETY
& T
RA
IL
EX
PER
IEN
CE
EQ
UIT
Y
EC
ON
OM
Y &
C
OM
MU
NIT
Y
CO
NSTR
UC
TIO
N &
IM
PLE
MEN
TA
TIO
N
Tier 2 – HIGH PRIORITY
28 63 SE Petrovitsky Rd Shared Use Path 2 3 4 4 2
28 64 Seattle Waterline Spur Trail 3 4 2 3 1
28 65 Seattle Waterline Trail 3 4 2 3 1
28 70 Springbrook Trail Extension 3 3 3 2 3
32 49 N Southport Dr Shared Use Path 2 3 3 4 3
32 53 Powerline Trail 3 3 3 2 3
32 76 Tiffany-Cascade Connector Trail 3 4 1 3 2
35 31 Logan Ave N Shared Use Path 2 3 3 4 2
35 6 Benson Rd/Main Ave S Bike Lanes 3 3 2 4 2
37 79 Union Ave NE Bike Lanes 4 2 2 2 2
37 78 Tukwila Station Trail 1 3 4 4 2
37 39 N 6th St Bike Lanes 3 3 2 4 0
37 8 Cedar to Sammamish Trail 3 4 1 3 1
41 26 Kenyon-Dobson Trail & Trailhead 2 4 1 3 2
41 51 Pacific Railroad Trailhead & Trail 2 4 1 3 2
41 74 Talbot Rd S Bike Lanes 4 2 1 3 4
44 50 Oakesdale Ave Bike Lanes 3 1 3 4 2
44 66 Shattuck to Airport Connector 3 2 2 4 2
44 5 Benson Neighborhood Greenway 4 2 2 1 1
47 48 North Highlands Neighborhood Greenway 3 2 2 2 2
47 19 Hillcrest Neighborhood Greenway 3 2 2 3 1
47 36 Mill Ave S Signed Shared Roadway 3 2 2 4 2
50 75 Thunder Creek Trail 2 3 2 2 1
50 37 Monroe Ave NE Bike Lanes 2 2 3 3 2
50 72 SW 16th St Shared Use Path 2 3 4 1 2
50 52 Panther Creek Trail 1 3 2 3 3

RENTON TRAILS AND BICYCLE MASTER PLAN � CITY OF RENTON
JANUARY 2019 TRAIL & BICYCLE SYSTEM PLAN
118
RA
NK
ING
PR
OJE
CT N
UM
.
PROJECT NAME CO
NN
EC
TIV
ITY
&
AC
CESSIB
ILIT
Y
SA
FETY
& T
RA
IL
EX
PER
IEN
CE
EQ
UIT
Y
EC
ON
OM
Y &
C
OM
MU
NIT
Y
CO
NSTR
UC
TIO
N &
IM
PLE
MEN
TA
TIO
N
Tier 3 – MEDIUM PRIORITY
54 40 N 8th St Shared Use Path 2 2 3 2 3
55 16 Hardie Ave Bike Lane & Shared Use Path 0 3 3 4 1
55 30 Langston Rd/SW 134th St Hillclimb 2 2 1 4 1
57 4 Benson Drive S/108th Ave SE Shared Use Path
0 3 3 2 2
57 42 NE 3rd St 2 2 1 4 2
59 56 Renton Park Neighborhood Greenway 2 1 3 1 1
59 18 Highlands Hillclimb 2 2 2 1 1
59 58 S 3rd St Signed Shared Roadway 2 0 3 4 2
62 10 East Valley Rd Shared Use Path 1 2 4 1 1
62 2 128th Ave SE Bike Lanes 2 2 2 0 2
62 68 South Highlands Neighborhood Greenway 3 1 2 1 1
62 77 Tiffany Park Neighborhood Greenway 4 1 1 0 2
66 44 NE 12th St Bike Lanes 1 1 2 3 2
66 45 NE 16th St Signed Shared Roadway 2 2 0 2 1
66 35 May Valley Trail 1 3 1 0 2
69 71 Sunset Blvd Hillclimb 1 1 2 3 2
70 33 May Creek Hillclimb 2 0 0 4 2
70 23 Jericho Ave NE Bike Lanes 3 2 0 0 1
72 62 SE 182nd & 184th Streets Neighborhood Greenway
1 2 0 0 2
73 15 Grant Ave Neighborhood Greenway 2 1 1 2 0
74 32 Maplewood Heights Neighborhood Greenway
0 2 0 0 2
75 54 Puget Dr Bike Lanes & Signed Shared Roadway
0 1 2 2 1
75 24 Kennydale Neighborhood Greenway 1 2 0 0 1
77 14 Glencoe Neighborhood Greenway 0 1 0 0 2
77 25 Kennydale Signed Shared Roadway 1 1 0 0 2
79 47 Nile Ave NE Bike Lanes 0 1 0 0 0
80 3 156th Ave SE Bike Lanes 0 0 0 1 1

CITY OF RENTON � RENTON TRAILS AND BICYCLE MASTER PLAN
JANUARY 2019
CHAPTER 6
IMPLEMENTATION STRATEGIES

RENTON TRAILS AND BICYCLE MASTER PLAN � CITY OF RENTON
THIS PAGE IS INTENTIONALLY BLANK

CITY OF RENTON � RENTON TRAILS AND BICYCLE MASTER PLAN
JANUARY 2019 IMPLEMENTATION STRATEGIES
121
6 IMPLEMENTATION STRATEGIES
This chapter identifies actions the City can take to optimally implement the
goals, objectives, and projects of this plan. It also identifies topics meant
for further exploration.
MONITORING
The City intends to track its performance periodically to determine
progress on implementation of this plan. Potential monitoring strategies are
listed in Exhibit 6-1. Monitoring is recommended biennially in association
with updates to the City budget and capital improvement program.
Performance measurement is a useful strategy in requesting additional
funding and resources.
Exhibit 6-1. Potential Monitoring Measures and Targets
Source: City of Renton, 2018.
PHASING
Given local conditions on each route and available funding, Renton may
phase improvements and consider alternative trail and bicycle facility
types and cross sections. At the project design level, each project will be
reassessed to determine the appropriateness of the suggested
PRIORITY PERFORMANCE MEASURE
Connectivity & Accessibility Percentage of bicycle facility network completed within quarter mile of schools and parks.
Safety & Trail Experience Percentage increase in LTS 1 or 2 network.
Equity Percentage of households within ¼ mile of network
Percentage increase in network serving children, elderly, households in poverty.
Economy & Community Percentage increase in access to high density residential or commercial zones, transit, or services.
Percentage progress on Tier 1 Projects.
Construction & Implementation Projects programed and completed in six-year CIP.

RENTON TRAILS AND BICYCLE MASTER PLAN � CITY OF RENTON
JANUARY 2019 IMPLEMENTATION STRATEGIES
122
improvements, and to determine the available right-of-way, etc. When a
project is in the development phase, a topographic and right-of-way
survey will provide the first clear picture of the actual conditions of the
route, and it may be necessary to implement a different design solution or
combination of design solutions than are shown in this plan. In addition,
there may be development of other capital projects or changes in funding
strategies that dictate a different cross section or facility classification than
the one currently identified.
PARTNERSHIP & FUNDING OPPORTUNITIES
Partnerships
The City’s trail and bicycle system is an integral part of the county and
state transportation and park system. Key regional and state partners
include:
Cities of Newcastle, Issaquah, Kent, Tukwila, and others
King County Parks
King County Metro
Renton, Issaquah, and Kent School Districts
Sound Transit
Washington State Department of Transportation
The City has planned in partnership with these agencies to develop this
plan, and these partners can advance implementation of this system
through joint design, funding, and coordination.
The City seeks to work with additional partners, such as Seattle-King
County Public Health which is advancing a healthy communities program,
and the Puget Sound Regional Council with a Regional Open Space
Strategy.
Funding
The City of Renton includes non-motorized capital investments in the annual
Six-Year Transportation Improvement Program (TIP). The TIP is adopted
annually by the City Council. The 2019-2024 TIP has programmed funding

CITY OF RENTON � RENTON TRAILS AND BICYCLE MASTER PLAN
JANUARY 2019 IMPLEMENTATION STRATEGIES
123
to implement some of the projects identified in the Trail and Bicycle Master
Plan:
$1,450,000 Walkway program.
$1,850,000 Intersection Safety & Mobility Program.
Project level implementation of pedestrian and bicycle routes per this
plan (e.g. Lake Washington Loop Trail).
The funding can be used for planning, design, and construction phases of
the projects as well as for local matches for state and federal grants.
Although it may not be the primary purpose of a particular project or
program, many TIP projects have the potential to assist in implementing
projects within the Trails and Bicycle Master Plan.
The Washington State Recreation and Conservation Office (RCO) provides
matching grants for trail acquisition and development and is open to local
and state agencies. Grant applications are received on even calendar
years. Many funds require a comprehensive plan, such as this master plan.
Funds that are open to local agencies include:
Aquatic Lands Enhancement Account (ALEA) - Provides funding to
buy, protect, and restore aquatic lands habitat and to provide public
access to the waterfront. Projects must be associated with navigable
waters of the state.
Land and Water Conservation Fund (LWCF) - State Program.
Provides funding to buy or develop public outdoor recreation areas
and facilities. Grants support both acquisition and development of
active and passive recreation areas and conservation lands. Public use
is required.
Land and Water Conservation Fund (LWCF) - Outdoor Recreation
Legacy Partnership Program. Provides funding to buy or develop
public outdoor recreation areas and facilities in, or serving, urban
areas with 50,000 or more people. Grants support both acquisition
and development of active and passive recreation areas and
conservation lands. Public use is required.
Washington Wildlife and Recreation Program, Trails Category
(WWRP) - Provides funding to acquire, develop, or renovate
pedestrian, equestrian, bicycle, or cross-country ski trails. Program is
for non-motorized trails that provide connections to neighborhoods,
communities, or regional trails.

RENTON TRAILS AND BICYCLE MASTER PLAN � CITY OF RENTON
JANUARY 2019 IMPLEMENTATION STRATEGIES
124
In 2007, King County voters approved Proposition 2, which included
expanding the regional trail system over a six-year period, with the last
distribution to cities ending in 2013. In 2013, King County voters approved
a second, six-year levy (Proposition 1) which provides for trail acquisition
and development; the last distribution will be in 2019. King County is
considering placing a third levy on the ballot for voters to approve in
2019 which could also be used for trail acquisition and development.
REQUIREMENTS & INCENTIVES
Implementing Standards at Time of Development
The City has enacted ordinances that give it authority to require
developers to implement the trail and bicycle cross sections and projects in
this plan.
Street Frontage and Off-site Street Improvements (RMC 4-6-060): To
implement trail and bicycle standards, the City can require that
facilities that are within the right of way are implemented with street
frontage improvements consistent with the standards in this plan and
the City’s development regulations pertaining to streets. When offsite
improvements are required to support new development, the City can
require implementation of pedestrian and bicycle improvements as
part of its street standards.
Shoreline Public Access Requirements (RMC 4-3-090): The Shoreline
Master Program also requires shoreline public access when demand is
created and is another regulatory program that can advance trails in
shoreline jurisdiction.
In the near-term, the City can amend its environmental review procedures
(RMC 4-9-070) to include this plan in its SEPA Substantive Authority, and
development that would impact the trail and bicycle system could be
conditioned to mitigate impacts, such as implementing improvements that
serve as mitigation. The City already adopts its Comprehensive Plan,
Transportation Improvement Program, and Parks, Recreational, Natural
Areas (PRNA) Plan, and this Trails and Bicycle Master Plan can be similarly
included.
The City can also adopt regulations that require trail easements when a
development is located within an area identified for a local or regional
trail system in this plan.

CITY OF RENTON � RENTON TRAILS AND BICYCLE MASTER PLAN
JANUARY 2019 IMPLEMENTATION STRATEGIES
125
Incentives
There are two types of incentives relevant to this plan:
Incentives for Individuals: The City can continue to require commute trip
reduction programs by large employers, who can incentivize their
employees to use non-motorized forms of commuting or transit. The
City can also support and encourage federal and state tax incentives
or subsidies to encourage bike and transit commuting.
The City can provide development incentives when amenities for transit
users, bicyclists, and pedestrians are included and being implemented.
Where improvements are not required for new development, but
extension of trail or bike facilities is planned, the City could incentivize
voluntary trail and bicycle project implementation such as through
density or height bonuses for new development or allowing onsite
density transfer from trail corridors to other developable parts of the
site.
Fee in Lieu
The City could allow or require development to provide trail or bicycle
facility improvements or pay a fee in lieu when it is not in the City’s interest
to have the improvement installed at the time of permit. This may occur
when the expected improvement is a short segment of a longer trail
improvement and the work should be done all at once. The City allows a
fee in lieu of required street improvements in RMC 4-9-060.
E-bike & Motorized Foot Scooters
Electric bikes and motorized foot scooters are finding popularity in major
cities across the country. These types of vehicles increase more use of trails
and bicycle facilities because they assist with speed and sloped terrain.
The State regulates motorized foot scooters and local communities may
pass their own regulations.
A motorized foot scooter is a device with no more than two 10-
inch or smaller diameter wheels that has handlebars, is designed
to be stood or sat upon by the operator, and is powered by an
internal combustion engine or electric motor that is capable of
propelling the device with or without human propulsion.

RENTON TRAILS AND BICYCLE MASTER PLAN � CITY OF RENTON
JANUARY 2019 IMPLEMENTATION STRATEGIES
126
The City restricts motorized foot scooters in any park, trail, or sidewalk, or
on streets with a maximum speed limit of 25 miles per hour, or any corridor
marked “No non-motorized vehicles.”
Recently, the State passed SB 6434 in 2018 regulating different types of
electric bikes and where they may be allowed on bike lanes or trails.
Similar to Motorized Foot Scooters, the City could determine how to
regulate E-Bikes as allowed under State law.
COMMUNITY EDUCATION & PROMOTION
Events & Promotion
Renton can promote awareness of the trail and bicycle system by
advertising its system in its recreation program, city newsletter, online, and
elsewhere. The City can also continue providing online or print maps and
other materials.
The City could increase recreation and community events in association with
trails and bicycle facilities including fun runs, races, and other activities to
promote awareness and use of the system and promote health and fitness.
The City could also support guided walking and biking tours illustrating key
routes and how to access key destinations. Guides could be volunteers.
The City can work in partnership with King County Metro on expanding its
transit to trail program that was launched in the Issaquah Alps area.
Safety & Awareness
Trail and bicycle safety has many facets. Potential actions to increase
safety include:
The City can provide user safety and etiquette tips and rules on how
pedestrians and bicyclists share facilities.
The City can advertise and support other entities who are providing
safety and awareness programs such as the School District.
The City can implement design standards that promote crime
prevention through environmental design that influence landscaping,
lighting, and location of facilities.

CITY OF RENTON � RENTON TRAILS AND BICYCLE MASTER PLAN
JANUARY 2019 IMPLEMENTATION STRATEGIES
127
Code enforcement officers and police officers can enforce City laws
and reduce civil and criminal infractions.
Continue to expand Renton’s Trail Ranger Program.
FUTURE RECOMMENDATIONS
Incorporate Trails and Bicycle Master Plan in Citywide Comprehensive Plan
The City references the Trails and Bicycle Master Plan in the Transportation
Element. The Comprehensive Plan could be updated to reflect the 2019
plan vision, goals, and policies.
Explorations in Multimodal Transportation Levels of Service
The City’s Comprehensive Plan Transportation Element identifies a
multimodal level of service addressing person trips by motor vehicles,
transit, and non-motorized (bicycle and pedestrian) modes. Person trips are
the number of persons making the same trip in the same mode of travel.
Using person trips provides a common metric for use in concurrency and
also impact or mitigation fees.
Policy T-48: A. Citywide Person Trips: Based on the City’s land
use and growth strategy, establish a citywide level of person
trips by mode, and support each mode with capital
improvements and programs. The general mode categories
include: motor vehicle trips, transit trips, and non-motorized
trips.
The City has established a person trip bank for motor vehicle trips. The City
could establish a bank of non-motorized person trips and link it to capital
improvements.
Utilize Prioritization Criteria for Sidewalk Plan
The City completed a Comprehensive Walkway Study in 2008 that
prioritized needed sidewalk projects. Feedback through the community
outreach included an emphasis on sidewalks and walkways. The City could
incorporate the prioritization methods used in this plan in updating the
Comprehensive Walkway Study for complete network integration.

RENTON TRAILS AND BICYCLE MASTER PLAN � CITY OF RENTON
JANUARY 2019 IMPLEMENTATION STRATEGIES
128
Vision Zero
Started in Sweden in the 1990s, Vision Zero is an approach to traffic
safety for all users that sets a goal of zero traffic deaths or severe injuries
through holistic, integrated action strategies. As an approach, Vision Zero
includes several fundamental principles that differentiate it from traditional
approaches to road safety.
The City can consider whether and how to implement a Vision Zero
program. Implementing Vision Zero typically involves the following
practices:
Build and sustain leadership, collaboration, and accountability: In
addition to strong and visible commitment from the Mayor and Council,
large-scale, cross-sector collaboration that includes transportation,
public health, law enforcement, policy makers, elected officials, and
community members is key to successful implementation.
Collect, analyze, and use data: Data should drive all stages of Vision
Zero planning, from strategy development, to ongoing management,
evaluation, and predictive planning. Collecting, analyzing, and using
data will need coordination across city departments. Local knowledge
and community input are also important to supplement quantitative
data.
Prioritize equity and engagement. Vision Zero planning should include
effective, meaningful community dialogue to gather input from diverse
voices on the issue of road safety.
Lead with roadway design that prioritizes safety.
Manage speed to safe levels. This is a central tenet of Vision Zero and
includes strategies such as designing roads for lower speeds, setting
and communicating safe speed limits, and enforcing these limits.
Maximize technology advances, but don’t overlook low-tech solutions.
Over the longer term, innovation in automated vehicles and other
technologies offer opportunities for improvements in safety. In the
shorter term, relatively inexpensive, low-tech improvements such as the
addition of side guards, cameras, and mirrors on large vehicles and
trucks (since large vehicles are disproportionately involved in crashes)
can save lives.

CITY OF RENTON � RENTON TRAILS AND BICYCLE MASTER PLAN
JANUARY 2019 IMPLEMENTATION STRATEGIES
129
A foundational element to implement the Vision Zero approach is the
creation of a Vision Zero Action Plan that operationalizes these principles.
The Action Plan includes broad community input and lays out specific
measurable action steps, priorities, with clear timelines for implementation.
Increase Local Funding for Non-Motorized Facilities
The City could pursue other funding sources dedicated to the provision of
trails and bicycle facilities. One such source is to collect mitigation fees
from new development that creates a demand for service, requiring
mitigation to reduce adverse impacts on the built environment. The City
could condition development if it has identified impacts in environmental
documents prepared under the State Environmental Policy Act (SEPA).
Impacts could be determined by measuring the number of person trips that
development generates on bicycle and pedestrian facilities. To implement
the SEPA mitigation fee, the City could develop and publish a study of
expected demand and person trip rates, and then apply it to development
subject to SEPA. Fees that are collected must be expended within 5 years
of receipt.


CITY OF RENTON � RENTON TRAILS AND BICYCLE MASTER PLAN
JANUARY 2019
CHAPTER 7
REFERENCES

RENTON TRAILS AND BICYCLE MASTER PLAN � CITY OF RENTON
THIS PAGE IS INTENTIONALLY BLANK

CITY OF RENTON � RENTON TRAILS AND BICYCLE MASTER PLAN
JANUARY 2019 REFERENCES
133
7 REFERENCES
American Association of State Highway and Transportation Officials
(AASHTO). (2012) Guide for the Development of Bicycle Facilities.
See: https://www.transportation.org/.
City of Renton. (2015, June 22; amended November 2017).
Comprehensive Plan. Available:
https://rentonwa.gov/city_hall/community_and_economic_develop
ment/long_range_planning.
City of Renton. (2011). Parks, Recreation, and Natural Areas Plan.
Available:
https://rentonwa.gov/city_hall/community_services/parks_plannin
g_and_development/parks__recreation__and_natural_areas_plan
King County (2016). King County Open Space Plan: Parks, Trails, and
Natural Areas 2016 Update. Available:
https://www.kingcounty.gov/services/parks-
recreation/parks/about/open-space-plan.aspx.
King County. (2016, November 22). Technical Appendix C2: Regional Trails
Needs Report. Retrieved from kingcounty.gov:
https://ww.kingcounty.gov/~/media/depts/executive/performanc
e-strategy-budget/regional-
planning/2016CompPlanUpdate/2016Adopted-KCCP/Appendix-
C2-RegTrailsNeedsReport-2016KCCP-ADO-112216.ashx?la=en
LaCivita, Leah. (2018, April 16). New Legislation Targets E-Bikes.
Retrieved from Municipal Research and Services Center:
http://mrsc.org/Home/Stay-Informed/MRSC-Insight/April-
2018/New-Legislation-Targets-E-Bikes.aspx.
Mineta Transportation Institute. (2012, May). Low-Stress Bicycling and
Network Connectivity. Retrieved from transweb.sjsu.edu:
https://transweb.sjsu.edu/research/low-stress-bicycling-and-
network-connectivity.
National Association of City Transportation Officials. (2014, March). Urban
Bikeway Design Guide, Second Edition. See:
https://nacto.org/publication/urban-bikeway-design-guide/.

RENTON TRAILS AND BICYCLE MASTER PLAN � CITY OF RENTON
JANUARY 2019 REFERENCES
134
National Park Service (NPS) Requirements. Civil (Site) & Environmental
Engineering Standards: NPS Management Policies 2006 - The
Guide to Managing the National Park System. Available:
https://www.nps.gov/dscw/ds-civil-environmental.htm.
United States Access Board (2014, May). Outdoor Developed Areas: A
Summary of Accessibility Standards for Federal Outdoor
Developed Areas. Available: https://www.access-
board.gov/guidelines-and-standards/recreation-facilities/outdoor-
developed-areas/a-summary-of-accessibility-standards-for-
federal-outdoor-developed-areas.
US Forest Service. (2014, November). Standard Trail Plans and
Specifications. Retrieved from www.fs.fed.us:
https://www.fs.fed.us/managing-land/trails/trail-management-
tools/trailplans.
Vision Zero Network, February 2017. Moving from Vision to Action.
Available: https://visionzeronetwork.org/wp-
content/uploads/2017/11/VZN-Moving-from-Vision-to-Action.pdf.
Vision Zero Network, December 2017. Vision, Strategies, Action:
Guidelines for an Effective Vision Zero Action Plan. Available:
https://visionzeronetwork.org/wp-
content/uploads/2017/12/VZN_ActionPlan_FINAL.pdf.
Washington State Department of Transportation (WSDOT). (2018, July)
Design Manual. Available:
http://www.wsdot.wa.gov/Publications/Manuals/M22-
01.htm#Individualchapters.
Related Documents