Rent Policy Review Final Report Mae’r ddogfen yma hefyd ar gael yn Gymraeg. This document is also available in Welsh. © Crown Copyright Digital ISBN 978-1-83876-571-2 SOCIAL RESEARCH NUMBER: 33/2019 PUBLICATION DATE : 17/07/2019

Welcome message from author
This document is posted to help you gain knowledge. Please leave a comment to let me know what you think about it! Share it to your friends and learn new things together.
Transcript

Rent Policy Review
Final Report
Mae’r ddogfen yma hefyd ar gael yn Gymraeg.
This document is also available in Welsh.
© Crown Copyright Digital ISBN 978-1-83876-571-2
SOCIAL RESEARCH NUMBER:
33/2019
PUBLICATION DATE:
17/07/2019

Rent Policy Review
Authors: Mandy Littlewood, James Morgan, Mark Stephens, Gillian Young (The
Urban Institute, Heriot-Watt University), Steve Wilcox and Peter Williams
Views expressed in this report are those of the researchers and not necessarily those of the
Welsh Government
For further information please contact:
Lucie Griffiths
Knowledge and Analytical Services
Welsh Government
Cathays Park
Cardiff
CF10 3NQ

1
Table of contents
List of tables .................................................................................................................................. 2
List of figures ................................................................................................................................. 3
Glossary ........................................................................................................................................ 5
1. Introduction ....................................................................................................................... 6
2. Methodology ................................................................................................................... 15
3. Landlord survey findings ................................................................................................. 23
4. The views of tenants ....................................................................................................... 52
5. Case studies and stakeholder interviews ........................................................................ 69
6. Affordability of Welsh matrix rents ................................................................................... 83
7. Annual uprating and the structure of the rent matrix ..................................................... 102
8. Conclusions and recommendations .............................................................................. 115
References ................................................................................................................................ 119
Appendix A – Landlord questionnaire ............................................................................................. i
Appendix B – Case study and stakeholder interview topic guides .............................................. xvii
Appendix C – Landlord survey results on wider policy impacts ................................................... xxi
Appendix D – Definitions of affordability ................................................................................... xxxii
Appendix E – Schedule of supporting tables .............................................................................. xlvi

2
List of tables
Table 1.1: Policy expectations for rent increases......................................................................... 12
Table 1.2: Number of RSLs above within and below Target Rent Band, 2014/15-2018/19 ......... 12
Table 1.3: Number of Local Housing Authorities above within and below Target Rent Band,
2014/15-2018/19 ............................................................................................................. 13
Table 1.4: Non-Compliant RSLs: Variation of RSL mean rents from Target Rent Bands ............ 13
Table 1.5: Non-Compliant LHAs: Variation of local authority mean rents from Target Rent Bands
........................................................................................................................................ 13
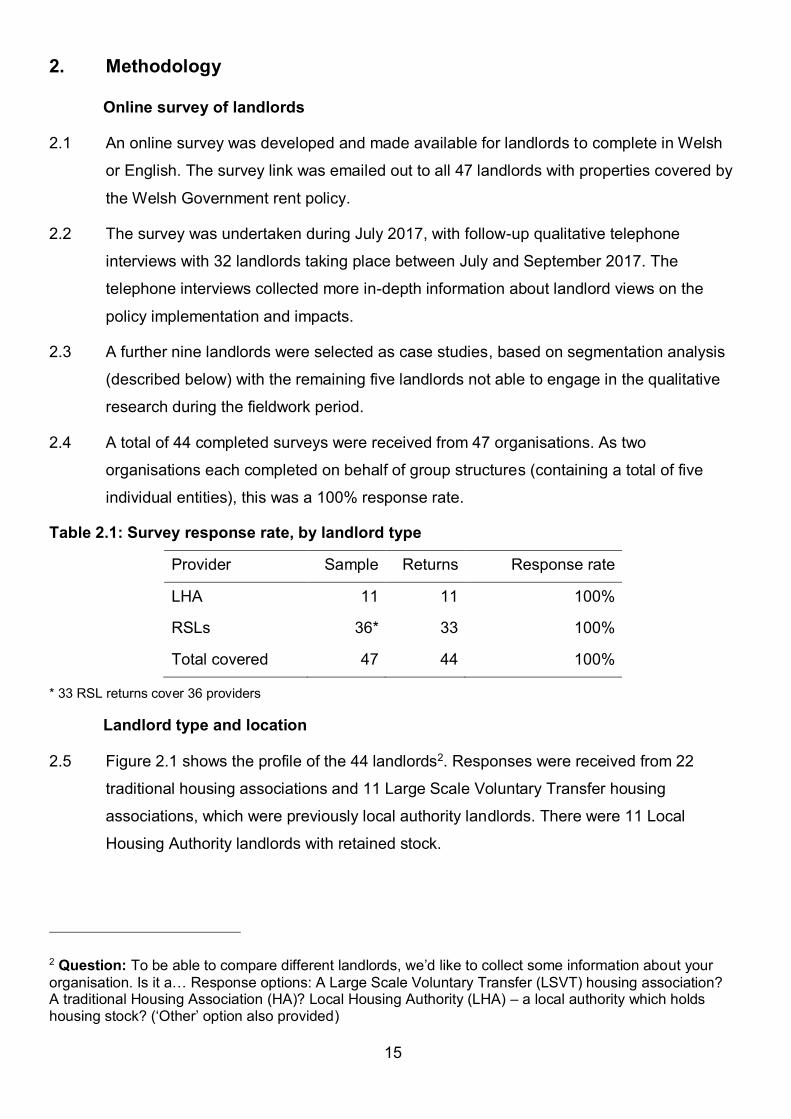
Table 2.1: Survey response rate, by landlord type ...................................................................... 15
Table 2.2: Age and sex of tenants in qualitative research ........................................................... 17
Table 2.3: Household type and Housing Benefit (HB) receipt - tenants ....................................... 18
Table 2.4: Household type and type of social landlord - tenants ................................................. 18
Table 7.1: Forecast increases in Welsh weekly median earnings, 2018-2023 .......................... 103
Table 7.2: Earnings in 2017 in Wales and English regions ........................................................ 105
Table 7.3: Average Welsh and English regional social sector rents in 2021/22 ......................... 106
Table 7.4: Index of forecast earnings and rental growth, 2018/19 – 2021/22 (2018/19 = 100) .. 107
Table 7.5: The relationship between SAP 2009 ratings and SAP 2012 ratings ......................... 111
Table D.1: The housing benefit poverty trap, 2018-19 (£) ........................................................... xlii

3
List of figures
Figure 2.1: Landlord type ............................................................................................................. 16
Figure 3.1: Location of stock ........................................................................................................ 23
Figure 3.2: How landlords have been applying the Welsh Government rent policy, by landlord
type ................................................................................................................................. 25
Figure 3.3: What landlords have been done to prepare for the implementation of the Welsh
Government rent policy ................................................................................................... 26
Figure 3.4: Whether landlords are using the rent matrix to set rents at an individual property level,
by landlord type ............................................................................................................... 27
Figure 3.5: Landlords views on the effectiveness of the rent matrix, by landlord type ................. 28
Figure 3.6: Perceived impact of Welsh Government rent policy on local policy decisions and
tenant affordability ........................................................................................................... 30
Figure 3.7: Views on the impact of location on their local rent policy, by landlord type................ 33
Figure 3.8: Whether rents are generally in line with the target rent bands, by landlord type (all
landlords) ........................................................................................................................ 35
Figure 3.9: When rents are expected to converge with local rents policy, by landlord type ......... 36
Figure 3.10: Whether service charges are de-pooled from rents, by landlord type ...................... 38
Figure 3.11: Whether tenants have been affected by the Welsh Government rent policy, by
landlord type ................................................................................................................... 40
Figure 3.12: Perceived wider impacts of the Welsh Government rent policy on business plans,
investment etc. ................................................................................................................ 42
Figure 3.13: Perceived effectiveness of the rent policy, all landlords........................................... 45
Figure 3.14: How rents compare with other landlords and the Local Housing Allowance ............ 47
Figure 3.15: How rents compare with Local Housing Allowance rates, by landlord type ............. 48
Figure 6.1: Rent to income ratios: minimum wage, 2018/19 ........................................................ 85
Figure 6.2: Rent to income ratios: lower quartile earnings, 2018/19 ............................................ 86
Figure 6.3: Residual incomes: minimum wage, 2018/19 ............................................................. 87
Figure 6.4: Incomes required to cease housing benefit eligibility, 2018/19 .................................. 89
Figure 6.5: Impact of Housing Benefit and Universal Credit schemes on weekly net income after
housing costs, 2018/19 ................................................................................................... 91
Figure 6.6: Gross weekly earnings level at which benefit dependency ceases, 2018/19............. 92
Figure 6.7: Rent to income ratios: minimum wage, 2021/22 ........................................................ 94
Figure 6.8: Residual incomes: average Welsh rents, 2021/22 ..................................................... 96
Figure 6.9: Incomes for families with children to cease Universal Credit eligibility, 2021/22 ........ 97
Figure 7.1: Social rents for Wales and English Regions £ per week, 2018/19 ........................... 104

4
Figure C.1: Potential impact of the LHA cap on properties with service charges, by property size
and type .......................................................................................................................xxviii
Figure C.2: Potential impact of the Local Housing Allowance cap on properties with NO service
charges, by property size and type ............................................................................... xxix
Figure C.3: Whether any particular groups are more or less better-off as a result of the rent
policy, all landlords ........................................................................................................ xxxi
Figure D.1: Affordability ratios: gross and net measures compared ........................................xxxvii
Figure D.2: Affordability ratios for a range of households (£100/pw rent) ............................... xxxviii
Figure D.3: Residual income measures for a range of rents .......................................................... xl
Figure D.4: The cumulative marginal rates of tax and benefit deductions from earnings ............ xliii
Figure D.5: Gross weekly earnings required to escape housing benefit dependency (£100/pw
rent)................................................................................................................................ xliv

5
Glossary
CPI Consumer Price Index
DHP Discretionary Housing Payment
HA Housing Association
MMR Mid Market Rent
LHA Local Housing Authority
LSVT Large Scale Voluntary Transfer Housing Association
RPI Retail Prices Index
SAP Standard Assessment Procedure
TRB Target Rent Band
VFM Value for Money
WHQS Welsh Housing Quality Standard

6
1. Introduction
1.1 The Welsh Government introduced a new rent policy for social landlords in April 2014 for
Registered Social Landlords (RSLs) and April 2015 for local housing authorities (LHAs).
The policy aimed to remove anomalies in rent setting between and within the social
landlord sectors whilst maintaining the capacity of the sector to invest in existing and new
stock.
1.2 This chapter outlines the objectives of the research, the background to the rent policy,
the rent policy itself, wider influences that may impact on the policy, and the existing
knowledge of the implementation of the policy.
Research aims and objectives
1.3 This research aims to review the current Welsh Government Rent Policy to determine
whether it is fit for purpose and achieves its original objectives, particularly in the context
of external developments.
1.4 The research objectives are to examine:
the implementation of Rent Policy and its impact on social landlords and social
tenants
the wider impact on social landlords including on the value of their stock and their
capacity to deliver housing and other Welsh Government objectives
external influences which impact upon the Welsh Government rent policy, social
landlords, their tenants and lenders
the future of the rent policy including in relation to equality and diversity,
sustainability and protection of the interests of Welsh Government, social
landlords, current and future tenants and lenders
how well the Rent Policy model operates and whether the policy and model
require modification
the views of tenants on rent levels and comparability, the rent review policy, the
role of the Welsh Government in rent setting and rent affordability
an analysis of the affordability implications of future rent policy.

7
Background
Rent setting
1.5 Rent setting by social landlords is controversial in terms of perceived fairness between
tenants of the same landlord, between tenants of different social landlords within the
same area, and between tenants in different local authority areas.
1.6 Whether rents are adequate to cover repairs and maintenance has long been an issue.
Of greater importance since the ‘new’ financial regime was introduced for housing
associations in 1989, and especially since grant levels were reduced under this new
regime, has been the role of rental income in generating housing association private
sector borrowing capacity in order to finance investment in new and existing stock.
Borrowing capacity is typically based on the tenanted market value of property, which is
in turn based on the net present value of anticipated future rental income. Thus higher
rent levels are a means for levering in additional finance for development.
1.7 The upward pressure on social rents since the 1980s has also increased dependency on
Housing Benefit, which also provides comfort for lenders, who perceived it as the
government underwriting the landlords’ rental stream. However, since 2010 the UK
Government’s policy of fiscal consolidation in the aftermath of the Global Financial Crisis
has led to restrictions on Housing Benefit, such as the Removal of the Spare Room
Subsidy and the Benefits Cap. The introduction of Universal Credit represents another
important consideration, as it replaces Housing Benefit for working-age claimants.1
1.8 These policies cut across the boundaries of the competencies of the UK and Welsh
governments. Whilst housing policy (including rent policy) is devolved, social security
(including Housing Benefit and Universal Credit) is reserved. Discretionary Housing
Payments are funded by the UK Government, but Welsh local authorities set their own
criteria for their use.
1.9 Moreover, although social security is financed directly by the Department for Work and
Pensions, under the Statement of Funding Policy (2015) and the Concordat between the
DWP and the Welsh Government (2013) policies adopted by the Welsh Government that
lead to a disproportionate increase in non-devolved expenditure in Wales (compared to
England) may be clawed back by the Treasury. The reduction of social rents by 1% p.a.
1 When the current research was commissioned, the Government proposed to limit eligible social housing rents to Local Housing Allowance rates, but the proposal was withdrawn in autumn 2017.

8
in England could potentially impact in this way and affect Welsh Government’s budgets.
The Welsh Rent Policy should also be considered in the context of the Supported
Housing Review (2016) and the Equalities Act (2010).
1.10 The end of the Housing Revenue Account subsidy system for local housing authorities on
1 April 2015 provided the opportunity to reform rents across both housing association
and local authority landlords.
The Essex Review of Rent Policy
1.11 The current rent policy in Wales implements the findings of the Essex Review of
affordable housing in Wales (Essex, et al, 2008) subject to further developments arising
from consultation and experience. The new policy aims to overcome deficiencies
identified in the Review to create a fair and transparent system which overcomes service
charge anomalies and provides incentives for investment. The defining approach of the
new rent policy is to provide a framework for rent setting, rather than attempting to set
rents on individual properties. It is also intended to be revenue neutral, so that total rental
income remains unchanged.
1.12 In order to protect housing associations’ borrowing capacity and investment potential, the
rent policy adopts a ‘national target average weekly rent.’ This set using the HA average
to allow for the convergence of rents towards the HA average rather than the average of
both sectors. The rent policy began for housing associations in 2014/15 and for local
authorities in 2015/16 (after they had left the HRA subsidy system).
External influences on rent policy
Wider Welsh Government objectives
1.13 Supporting private borrowing through appropriate rent levels and safeguarding
organisational viability are necessary for social landlords to meet future housing needs
and contribute to the target of delivering 20,000 new homes from all sectors (13,500
social rented) set out in the programme for government (Welsh Government, 2016a,
2016b). The policy is developed further in Prosperity for All (Welsh Government, 2017),
which includes a commitment to end the Right to Buy to preserve the stock of social
housing. Moreover, the policy should also support Welsh Government’s Wellbeing
Objectives such as “improv[ing] access to secure, safe, efficient and affordable homes”
(The Welsh Government. 2016c).

9
Relationship with UK Government
1.14 HM Treasury’s (2015a) Statement of Funding Policy (SOFP) states that ‘where decisions
taken by any of the devolved administrations or bodies under their jurisdiction have
financial implications for departments or agencies of the UK government…the body
whose decision leads to the additional cost will meet that cost’ (HM Treasury, 2015a, p.
6). A concordat between DWP and the Welsh Government (2012) committed each to
good communication with each other and to alert each other regarding proposals for new
policy initiatives and changes to existing policies that would directly impact on the other's
areas of responsibility. Social rents regulated by the Welsh Government and Housing
Benefit are inextricably linked. Rent Policy can potentially have an impact on the relative
levels of government spending between Wales and England through additional benefits
spending where England has adopted a policy of rent reduction while Welsh rents are
rising. However, it is worth considering whether the relative rent movements should be
assessed over a longer period, rather than just post the English decision to reduce rents
by 1% a year for four years.
1.15 If HM Treasury considers expenditure on Housing Benefit in Wales to be
disproportionately higher than in England, HM Treasury reserves the right to reduce
Welsh Government budgets by a compensating amount, potentially reducing funds for
other elements of the programme for government. This Rent Policy Review will consider
the potential for this situation to arise.
Welfare reform
1.16 The recent decision not to go ahead with proposals to base eligible rents in the social
sector on the Local Housing Allowance rates that are set for Broad Rental Market Areas
(BRMAs) (HM Treasury, 2015b) has lifted a considerable risk from social landlords. While
this has been widely welcomed, were this or a similar policy to be introduced in the
future, it would reframe the nature of debate on rent policy, with potential impacts
especially for social landlords in BRMAs with relatively low market rents compared to
social rents, which are commonly in less prosperous areas.
1.17 The UK Government has now withdrawn its proposal to extend the ‘shared
accommodation rate’ to the social sector (HM Treasury, 2015b). This would have
impacted on single social tenants aged under 35 by limiting their eligible rent for Housing
Benefit to that of shared accommodation – a property type that is extremely rare in the
social sector. The removal of ‘automatic’ entitlement of people aged 18-21 to housing

10
support (a decision reversed in March 2018) was a further source of concern among
landlords at the time of the study fieldwork.
1.18 The UK Government’s impact assessment of the Welfare Reform and Work Bill
concluded that the existing £26,000 benefit cap had increased incentives to work and the
proposed reduction to £20,000 in Great Britain and £23,000 in Greater London further
increase these incentives (DWP, 2015). The lower cap was deemed to strike a balance
between claimants’ and taxpayers’ interests. In a ‘static environment’ this was estimated
to increase the number of claimants affected from around 30,000 to 120,000 across
Great Britain. Affected claimants not moving into work would have their benefits reduced
by a median of £50 per week. £800m would be available for Discretionary Housing
Payments over a five-year period.
1.19 The impact assessment showed issues in relation to equalities mainly related to gender:
64% of claimants affected would be single women, the majority of whom will be lone
parents. The existing cap disproportionately affected black and ethnic minority
households, at least in part because these households are more likely to live in larger
households. Government suggested mitigation would be achieved through flexibility of
delivery of mainstream services and the use of Discretionary Housing Payments.
Supported Housing Review
1.20 The Supported Housing Review (Blood et al, 2016) estimated that by the end of 2015:
651,500 accommodation based supported housing units in Great Britain,
6% of these in Wales,
71% of the supported accommodation units across Great Britain housed older
people,
housing associations provided 71% of all units.
in Wales, 55% of supported housing for older people provided by housing
associations; 41% by local authorities.
1.21 Welsh Social Rent Policy applies to sheltered housing for older people, but not to other
forms of supported housing.
1.22 There was considerable concern amongst providers about the UK Government’s
intention to continue to fund core rent and service charges for supported accommodation
through Housing Benefit or Universal Credit, but to limit payment to the level of the
11
applicable Local Housing Allowance rate. Additional ‘top up’ funding for higher costs of
this provision would be provided to the Welsh Government (Freud, 2016).
1.23 The UK Government withdrew the proposal to apply LHA rates to social housing
(including sheltered accommodation) and issued a policy statement and consultation on
the future funding of supported housing (DCLG/DWP, 2017). The statement provides for
a ‘Sheltered Rent’ which would have regard to eligible service charges and come into
effect in 2020 in England. The UK Government aims for a model of sheltered rent that
‘keeps the funding for sheltered and extra care housing in the welfare system’
(DCLG/DWP, 2017, p. 20) and has committed to work with the Welsh Government to
ensure that this new approach works with Welsh supported housing. The Welsh
Government (2017) highlights concern regarding definitions and consistency in
application of the terms ‘specified’ and ‘supported’ housing used for the Supported
Accommodation Review which differ from terms used in Wales.
Human Rights Act and Equalities Act
1.24 The Human Rights Act 1998 defines public functions and the duties of public authorities
in relation to those functions (lesislation.gov, 1998). Case law has established that the
allocation, management and termination of social housing fall under this definition and
although not all RSL activities will be covered by the Human Rights Act, setting rent
levels is a public function. (Welsh Government 2017).
1.25 The Equality Act (legislation.gov.uk, 2010) identifies protected characteristics against
which discrimination is illegal. Under the Act, the public sector equality duty (PSED) to
eliminate unlawful discrimination; advance opportunities and to foster good relations
came into effect on 5th April 2011. This should be achieved through removing or
minimising disadvantage; taking steps to meet needs and encouraging people from
protected groups to participate (Equality and Human Rights Commission, 2017).
Implementation of the Rent Policy
The Rent Policy
1.26 The rent policy was implemented for RSLs in April 2014 and for LHAs in April 2015. Here
the existing data on the implementation of the rent policy are reviewed. Detailed
quantitative analysis of social rents and their movement since the implementation of the
rent policy is discussed later in this report. Here we highlight some key broad trends
which have emerged.

12
Table 1.1: Policy expectations for rent increases
TRB Expected Rent Increase Discretion
Above Less than CPI +1.5% Plus up to £2.00 p.w. for some
properties if rent restructuring
Within CPI +1.5%
Plus up to £2.00 p.w. for Business Plan
commitments or for some properties to
achieve differential in stock
Below CPI +1.5% plus up to
£2.00 p.w.
Note: TRB = target rent band
Source: Welsh Government (2016d)
1.27 The then Minister set the annual uplift for social rents at CPI +1.5% for the period
2014/15 to 2018/19. Landlords are then expected to increase their average rents by
varying amounts depending on whether they are above, within or below their target rent
bands (TRBs) as shown in Table 1.1.
Table 1.2: Number of RSLs above within and below Target Rent Band, 2014/15-2018/19
TRB 2014/15 2015/16 2016/17 2017/18 2018/19
Above 5 5 4 2 1
Within 25 25 30 31 32
Below 7 6 2 3 3
Source: (Rent Policy Tables prepared by KAS issued with notification letter from Welsh Government to landlords
annually 2014 to 2018)
Note: TRB = target rent band
Base = 37 for 2014/15; 36 for other years
1.28 Table 1.2 shows that the majority of RSLs were within the TRB at the start of the period.
There has been movement toward the TRB from RSLs above and below the band. One
RSL has fallen out of the target rent band.

13
Table 1.3: Number of Local Housing Authorities above within and below Target Rent Band, 2014/15-2018/19
TRB 2014/15 2015/16 2016/17 2017/18 2018/19
Above 1 0 0 0 0
Within 1 2 2 5 5
Below 9 9 9 6 6
Source: Rent Policy Tables prepared by KAS issued with notification letter from Welsh Government to landlords
annually 2014 to 2018
Base = 11
1.29 Table 1.3 shows that the majority of LHAs were below their target band in 2014/15.
Several LHAs have moved towards the TRB but a majority are still below target level.
This slow movement reflects the safeguards which were put in place to protect tenants
from too steep a rise in rent.
Table 1.4: Non-Compliant RSLs: Variation of RSL mean rents from Target Rent Bands
Year Below (£ p.w.) Below (%) Above (£ p.w.) Above (%)
2014/15 -1.88 -2.50 1.81 2.3
2015/16 -1.55 -1.97 1.29 1.6
2016/17 -0.53 -0.70 0.98 1.2
2017/18 -0.53 -0.63 0.50 0.6
2018/19 -1.57 -1.80 0.06 0.1
Source: (Rent Policy Tables prepared by KAS issued with notification letter from Welsh Government to landlords
annually 2014 to 2018)
Table 1.5: Non-Compliant LHAs: Variation of local authority mean rents from Target Rent Bands
Year Below (£ p.w.) Below (%) Above (£ p.w.) Above (%)
2014/15 -3.63 -5.0 0.43 1.0
2015/16 -4.45 -5.6 - -
2016/17 -3.39 -4.1 - -
2017/18 -4.27 -5.0 - -
2018/19 -3.72 -4.2 - -
Source: (Rent Policy Tables prepared by KAS issued with notification letter from Welsh Government to landlords
annually 2014 to 2018)
14
1.30 Tables 1.4 and 1.5 show the average extent to which rents are above or below the TRB
for RSLs and LHAs in pounds per week and as a percentage. Of organisations which
were below the TRB, on average, RSLs have been closer to the target band than LHAs
in each year, both in percentage and monetary terms. The percentage and monetary
level to which RSLs are below the TRB have reduced annually, except in 2018/19. For
LHAs, the percentage and monetary gap below the TRB have fluctuated each year.
RSLs which are below the TRB came very close, with an average of only £0.53 in
2017/18 although the figure for 2018/19 has risen to £1.57. LHAs are further from the
TRB, with a mean shortfall of £3.72 in 2018/19. The largest amount which any LHA is
below the TRB is £11.02 in 2018/19.
1.31 Only one LHA was above the TRB in 2014/15 and this was only by £0.43 per week. None
have been above since then. More RSLs were above the TRB level but the percentage
and monetary value above the target have fallen each year. In 2018/19 only one RSL is
above the TRB and this by only £0.06 per week.
1.32 It can be concluded that the mechanisms for moving rents to within target bands appear
to have been largely successful. By 2018/19 only a few landlords’ rents are outside the
TRBs, mostly to a minimal extent. At the same time, movement has not been abrupt and
so the few landlords which still have a significant way to go (over £11.00 per week in one
case) are not being forced to move at a speed which would adversely impact on their
tenants. The remainder of this report goes on to explore whether the rent policy has met
its original aims including reflecting local market and stock condition and affordability
while safeguarding viability and promoting investment.
The report
1.33 The remainder of the report is structured as follows. The research methodology is
detailed in Chapter 2. The findings of a comprehensive landlord survey are reported in
Chapter 3. The views of tenants are discussed in Chapter 4, followed by the findings of
nine landlord case studies and six stakeholder interviews in Chapter 5. A quantitative
model of rent setting is established in Chapter 6 and options for changing the parameters
to better reflect affordability are examined in Chapter 7. Conclusions and
recommendations follow in Chapter 8.
15
2. Methodology
Online survey of landlords
2.1 An online survey was developed and made available for landlords to complete in Welsh
or English. The survey link was emailed out to all 47 landlords with properties covered by
the Welsh Government rent policy.
2.2 The survey was undertaken during July 2017, with follow-up qualitative telephone
interviews with 32 landlords taking place between July and September 2017. The
telephone interviews collected more in-depth information about landlord views on the
policy implementation and impacts.
2.3 A further nine landlords were selected as case studies, based on segmentation analysis
(described below) with the remaining five landlords not able to engage in the qualitative
research during the fieldwork period.
2.4 A total of 44 completed surveys were received from 47 organisations. As two
organisations each completed on behalf of group structures (containing a total of five
individual entities), this was a 100% response rate.
Table 2.1: Survey response rate, by landlord type
Provider Sample Returns Response rate
LHA 11 11 100%
RSLs 36* 33 100%
Total covered 47 44 100%
* 33 RSL returns cover 36 providers
Landlord type and location
2.5 Figure 2.1 shows the profile of the 44 landlords2. Responses were received from 22
traditional housing associations and 11 Large Scale Voluntary Transfer housing
associations, which were previously local authority landlords. There were 11 Local
Housing Authority landlords with retained stock.
2 Question: To be able to compare different landlords, we’d like to collect some information about your
organisation. Is it a… Response options: A Large Scale Voluntary Transfer (LSVT) housing association? A traditional Housing Association (HA)? Local Housing Authority (LHA) – a local authority which holds housing stock? (‘Other’ option also provided)

16
Figure 2.1: Landlord type
Source: Rent Review survey, July 2017
Focus groups with tenants
2.6 The original aim was to undertake six focus groups with tenants across Wales. These
would enable the research to take place in a number of settings and with different types
of tenants. The tenants were sampled to capture their views taking account of
demographic and household composition, location, type of social housing (local authority
or registered social landlord), and whether they were in receipt of housing benefit.
2.7 Analysis of the National Survey of Wales (NSW) data revealed that the sample of social
tenants agreeing to be re-contacted for further research was geographically widely
dispersed. This meant the scope to recruit focus groups that met the criteria above was
not possible in smaller rural authorities.
2.8 A review of the sample dataset indicated that it would be feasible to conduct three focus
groups – one in each of Cardiff, Swansea and Wrexham, areas that all had at sufficient
contacts from the NSW. The sample frame was also increased by using the 2016-2017
and the 2017-2018 survey data. This enabled the focus groups to include people who
paid full rent or people who were on Housing Benefit. It also allowed a mix of age groups.

17
In-depth interviews with tenants
2.9 In addition to the people whose views were captured in the focus groups, 20 in-depth
interviews were conducted with tenants more widely dispersed throughout Wales. This
enabled the inclusion of a wider range of local areas and people in very remote areas.
These 20 interviews included four interviews with Welsh speaking tenants (in Gwynedd,
Denbighshire and Powys). The remaining 16 interviews covered a range of locations to
capture lower rent areas like the Welsh Valleys and more dispersed settlements like
areas of Mid-Wales. Interviews were undertaken with tenants in Caerphilly, Conwy,
Flintshire, Isle of Anglesey, Merthyr Tydfil, Monmouthshire, Neath Port Talbot, Powys,
Rhondda Cynon Taf and Torfaen.
2.10 Advance letters were sent out to householders to invite them to participate, before
potential respondents were invited to participate by telephone. Respondents were
recruited based on broad quotas to ensure a mix of respondents from different household
types, locations, type of social housing (local authority or registered social landlord) and
whether in receipt of housing benefit.
2.11 A total of 43 respondents participated across the focus groups and in-depth interviews.
The characteristics of the respondent sample are shown in Table 2.2 to Table 2.4. This
shows a mix of respondents across age, sex, household type and location, with a spread
of tenants in council and housing association properties. Tenants paying part or full rent
(who were expected to know more about their rent) were purposefully sampled, so there
were fewer tenants on full housing benefit.
Table 2.2: Age and sex of tenants in qualitative research
Age Female Male All
16-24 2 1 3
25-34 3 2 5
35-44 4 1 5
45-54 8 5 13
55-64 3 5 8
65-74 2 3 5
75+ 2 2 4
All 24 19 43

18
Table 2.3: Household type and Housing Benefit (HB) receipt - tenants
Household type Full HB No HB Partial HB All
Couple 0 9 2 11
Family 1 7 5 13
Single person 8 6 5 19
All 9 22 12 43
Table 2.4: Household type and type of social landlord - tenants
Household type Council Housing Association All
Couple 6 5 11
Family 7 6 13
Single person 10 9 19
All 23 20 43
The Case Studies
2.12 The purpose of the case studies was to allow more detailed insights into the impacts of
rent policies on a sample of landlords that together broadly covered the spectrum in
Wales. It allowed us to pursue issues in greater depth and to bring these out to enrich the
study and make it better informed.
Case Study Selection
2.13 The detailed survey data collected from housing organisations was used to conduct a
segmentation analysis to determine if there were ‘natural groupings’ on which case study
selection could be based. Cases were grouped into clusters where they are significantly
similar to each other, and significantly different from other clusters.
2.14 The variables used in the cluster analysis model, based on the survey results were as
follows:
landlord type
the perceived negative or positive impact of the concentration/spread of the stock
whether average rents are within the Target Rent Band
views on the effectiveness of transition arrangements

19
the perceived level of negative impact on tenants of Local Housing Allowance on
rents, in properties with service charges (based on the number of property types
with a negative impact expected)
the perceived level of negative impact on tenants of Local Housing Allowance on
rents, in properties without service charges (based on the number of property
types with a negative impact expected)
the overall perceived impact of the Welsh Government policy (based on the sum
of scores across all items - the ability to widen rent differentials, flexibility/control
over rents, the level of rent increase that can be applied, the actual rent level
charged and the affordability of rents)
the number of welfare reform mitigation measures in place
the overall perception of how well the rent policy has achieved its aims3
for housing associations, the number of local authorities operated in.
2.15 The rationale for selecting these variables was to cover a range of landlord
characteristics, experiences and views across the survey results. A cluster analysis was
undertaken on these attributes looking at possible models with 3 or 4 clusters. The 3-
cluster model separated the respondents more evenly – with 20 in cluster 1, 17 in cluster
2 and 7 in cluster 3. This was more useful than the 4-cluster model which offered more
complexity but no greater clarity.
Cluster 1 Profile
2.16 More LSVTs, more negative and more adversely impacted by location; 8 of the 11 LSVT
associations were in Cluster 1, along with 9 of the 22 traditional housing associations and
3 of the 11 local housing authorities. These landlords typically operate in more urban
areas and in a single location, though some had 2-4 locations.
2.17 There was a mix of urban LHAs and middle-sized RSLs in this cluster and more LSVT
associations than in the other clusters. 11 of the 20 landlords said that their mix of
locations had a negative impact on their rent policy (often due to being in a single local
authority).
3 This was based on the sum of scores across all the policy effectiveness items – reflecting local variations in affordability and housing market values, reflecting variations in the type/size of the stock, reflecting variations in quality and location, providing a more equitable distribution of rents for social tenants across Wales, ensuring viability for individual social landlords, being fairer to tenants in terms of the rents charged for equivalent homes across landlords and providing convergence of rents over a period of time.

20
2.18 These landlords were generally well-prepared, in terms of business planning and
mitigation, with very mixed views about the impact of the rent policy – half positive and
half negative. They were also generally more negative about the rent policy’s
effectiveness than the other clusters.
Cluster 2 Profile
2.19 LHAs, rural landlords, landlords that were more positive about impacts and those who
were using the rent policy, including 8 of 11 LHAs, were in Cluster 2. There was a mix of
preparedness in terms of business planning and mitigation for welfare reform in this
cluster. They tended to have adopted the rent matrix and had already de-pooled service
charges.
2.20 However, there was a mixed profile with half not yet within the Target Rent Band (TRB)
and some uncertainty about how effective transition had been. There were also
expressed mixed views about how the spread/concentration of rents impacts on local
rent policy – 6 said the impact was positive, 10 said there was little impact and 1 said this
was negative.
2.21 There were more landlords in this cluster that with rents further from the TRB than in the
other clusters. Overall, Cluster 2 landlords were generally more positive about the
potential impact and effectiveness of the policy.
Cluster 3
2.22 Group structures and multi-LA providers. Cluster 3 landlords operated in more locations
and were all traditional housing associations. There were 7 landlords in this cluster,
mainly national providers or landlords with a ‘Group’ structure operating in 5+ locations.
2.23 These landlords were all within the target rent band and so often said they did not know
how effective the transition arrangements had been. They were more positive about the
impact their locational spread had on their local rent policy.
2.24 These landlords are generally well-prepared in terms of planning, analysis and mitigation
activity and positive about the potential impact of the policy. They are less positive about
the effectiveness of the policy meeting its aims, though.
Final Selection
2.25 The principles behind the selection were determined in consultation with the Welsh
Government but the identities of the organisations were not revealed to Government. To
select the nine case studies, the organisations were grouped into the three clusters as a
21
first stratification stage. Then a detailed analysis matrix was produced including the
survey data behind the clusters plus secondary data on stock size, rurality and rent
convergence status. A proportionate number of landlords were then selected from each
cluster – so there were more Cluster 1 and Cluster 2 organisations. This secured a
spread across Wales which in turn allowed a much greater mix by geography and type of
organisation.
2.26 One of the proposed case study organisations – a housing association – was unwilling to
participate and we therefore included another largely similar organisation in the same
region of Wales. The case studies therefore covered 6 housing associations, of which 2
were LSVT and 3 local authorities. Geographically, South East, South West, the Valleys,
Mid and North Wales were covered as well as smaller associations including Welsh
speaking alongside larger group structures.
Stakeholder interviews
2.27 Six interviews were undertaken with national stakeholders representing or with
knowledge of social landlords, local authorities, tenants, regulation and finance. The
purpose of these interviews was to:
identify and assess the impact of external influences on social landlords
inform any recommendations about the future of rent policy
assess the impact of external influences.
Affordability
2.28 An analysis of affordability of rents under the rent model was conducted. The analysis
covered 12 cases involving six property types (from bedsits to 4-bed properties) and nine
household types (for example, single, lone parent with one child, couple with four
children).
2.29 Assumed incomes were based on:
A lower income based on the minimum wage for an adult working 40 hours per
week in 2017/18
A higher income based on the local lower quartile income for one adult working full
time in each local authority area in 2017.

22
2.30 Affordability was measured in two ways:
Rent to income ratios (gross rents against net income including housing benefit).
Residual income levels (after rents over out of work Income Support/ Universal
Credit personal allowances).
2.31 A further assessment was made of the income level required to escape housing benefit
dependency.
Components of the rent model
2.32 The final part of the project examined the components of the rent, particularly in the light
of criticisms of the model identified in the landlord survey and case studies, considering:
The effect of the rent uprating policy of the Welsh Government and its interaction
with the rent model was examined in relation to trends in earnings and policy
elsewhere in the UK.
In addition, the part of the model that allows rents to be increased by an absolute
maximum of £2 per week over the general percentage increase was examined in
relation to its impact on different property types (sizes).
The flexibility of the model was also examined, particularly in the light of the policy
on grant rates for new developments.
The role of SAP ratings in the model as a proxy for quality was also examined, in
particular of the light of the role that incentives to improve stock might play.
Finally, the role of locational factors and the role of dampening were also
considered.
2.33 The analysis sought to quantify the extent and severity of weaknesses in the model, in
terms of the numbers of landlords affected and the consequences of the impact. It further
discussed how any deficiencies identified might best be addressed.
Limitations
2.34 The research was conducted in 2017 and 2018 during which time a number of major
policy changes took place. These included the UK Government’s abandonment of its
policy to limit eligible rents for housing benefit at Local Housing Allowance rates, and the
radical changes to the proposed reforms to the funding of supported accommodation.
Both these changes were announced after the national landlord survey, case studies,
and all but one of the stakeholder interviews had been completed.

23
3. Landlord survey findings
Stock location
3.1 Figure 3.1 shows the spread of local authorities that providers reported having stock in,
with 12 providers (almost one in three landlords) having stock in Cardiff while just four
landlords had stock in each of Flintshire, Gwynedd and the Isle of Anglesey4.
Figure 3.1: Location of stock
Source: Rent Review survey, July 2017 (multiple responses given)
3.2 Among the RSLs, the average (mean) number of local authorities that landlords said they
operated in was 5.2 among traditional housing associations and 1.6 among LSVT
associations, with a range from a single local authority to operating in as many as 15
local authority areas.
4 Question: Which of the following areas describes where you have stock? (please tick all that apply) Response categories as shown in the figure, ranked by number reporting.

24
3.3 Looking across Broad Rental Market Areas (BMRAs) showed similar results, with LSVT
associations operating across an average (mean) of 1.6 BMRAs and 5.1 among
traditional housing associations. The range of locations was from landlords operating in a
single BMRA to a landlord with stock in 16 different BMRAs.
Implementation
How have social landlords implemented the rent policy?
3.4 Overall, 22 landlords were using the Welsh Government rents policy, 13 had retained a
previous policy and seven had developed a new policy while two landlords said they had
done ‘something else’. One of these two landlords had modified an existing policy to align
with the Welsh Government policy while providing a more meaningful local policy. The
other landlord had done modelling work to develop a new policy but had not taken this
forward yet.
3.5 LSVT associations and local housing authorities were slightly more likely to say they
used the rent matrix while traditional housing associations reported a broader mix of
approaches.

25
Figure 3.2: How landlords have been applying the Welsh Government rent policy, by landlord type
Source: Rent Review survey, July 2017
Question: Which of the following best describes how you have been applying the Welsh Government rent policy?
Have you… Response categories: Applied the rent matrix for local rents; Retained your previous rent policy;
Developed a new policy; Done something else
3.6 Landlords reported having undertaken lots of preparation for the implementation of the
Welsh Government rent policy, with most (41 of 44) having modelled impacts,
undertaken rent analysis (39) and stress testing (32) and more than two-thirds (32 of 44)
having consulted tenants. Just under half had undertaken an options appraisal (19) with
slightly fewer (12) saying that they have done staff training.
3.7 The ‘something else’ that organisations had done included analysis of their own rent
policy to check alignment with the Welsh Government rent policy, with a couple of
landlords also holding off changing their policy due to the need for further stress testing
or due to concerns about the future of the Welsh Government policy in the light of the
English rent cut. Other activities mentioned by single landlords included engaging
consultants, a full review of property attributes and consultation with other landlords.

26
Figure 3.3: What landlords have been done to prepare for the implementation of the Welsh Government rent policy
Source: Rent Review survey, July 2017 (multiple responses given)
Question: Which, if any, of the following did your organisation do to prepare for the implementation of the Welsh
Government rent policy? Response categories as presented in the figure
3.8 The main benefits5 of using the rent matrix approach that landlords identified were clarity,
transparency and comparability. Having a ‘common framework’ was felt to be beneficial
and using an approach meeting Welsh Government guidelines was felt to be more
defensible to tenants. Other advantages also commonly mentioned included the
increased rental income to deliver the Welsh Housing Quality Standard (WHQS) and
new-build development.
3.9 The main disadvantages of using the Welsh Government rent matrix were identified as:
Reduced rental income (among those who faced a restricted TRB)
Limited flexibility – mainly in relation to the narrowness of the TRB
5 Questions: What have been the advantages that approach? What have been the disadvantages of that
approach? (Follow-up questions to: Which of the following best describes how you have been applying the Welsh Government rent policy? Have you… Applied the rent matrix for local rents; Retained your previous rent policy; Developed a new policy; Done something else?)

27
The matrix being overly simplistic – in terms of the rents chargeable for flats
versus houses, not reflecting local demand or local market effects, and there not
being an affordability aspect
The TRB was noted to sometimes be higher than the Local Housing Allowance for
some properties, so at odds with the planned policy (at the time of the survey) to
restrict Housing Benefit at the Local Housing Allowance rate
Uncertainty about the precise method used to determine the matrix and the
volatility of the matrix results
The ‘last-minute’ updating of the matrix each year also caused considerable
frustration.
How has the rent policy been linked to local rent setting policy?
3.10 Just under half of landlords were using the rent matrix to set their rents at the individual
property level, with LHAs more commonly using the rent matrix than LSVT or traditional
housing associations. There were a couple of landlords applying the policy overall, but
not at the individual property level.
Figure 3.4: Whether landlords are using the rent matrix to set rents at an individual property level, by landlord type
Source: Rent Review survey, July 2017 (multiple responses given)

28
Question: Are you using the rent matrix to set rents at an individual property level? Response categories as in figure
3.11 Most of those using the rent matrix at the individual property level said that it was
effective, though the LSVTs using the rent matrix were least likely to say so.
Figure 3.5: Landlords views on the effectiveness of the rent matrix, by landlord type
Source: Rent Review survey, July 2017 (multiple responses given)
Question: How effective is using the rent matrix? Response categories: Very effective; Quite effective, Not very
effective; Not at all effective
3.12 Where landlords said that using the rent matrix was ‘not very effective’, the main reasons
given were:
Issues relating to the locational index/damping – which suppressed rents in the
Valleys in particular –
Concern about the volatility of the locational index year-on-year, due to changes in
wages, rents/house prices or a combination of these
That it encouraged a ‘fairly mechanical’ approach, which did not require landlords
to develop their own thinking or consider local issues/factors
Methodological concerns about individual elements of the matrix – e.g. SAP
ratings being a ‘blunt tool’ as a proxy for housing quality, or even an unnecessary

29
element, the lack of nuance in the measure so that flats and houses, new-build,
bungalows and sheltered housing did not have their own target rent levels
Issues about the fairness of the matrix – particularly relating to SAP ratings and
the locational matrix, both of which were felt to disadvantage landlords who
needed to invest in properties in poorer condition and/or lower-demand stock.
Again, the annual increase was mentioned as causing uncertainty, which in turn
discouraged landlords to refine their rent policy locally. This is because of the
limited time available after the annual rent policy announcement each year to
allow for genuine tenant engagement to take place.
3.13 Landlords using their own rent policy within the overall Target Rent Band had often
committed to tenants as part of pre-transfer ballot agreements, or had designed an
approach based on local circumstances. There were also some landlords transitioning to
their own rent policy over a longer period, due to pre-transfer ballot commitments or
because of the need to ‘iron out’ long-term legacy issues relating to local government
reorganisation.
What impacts have there been on local rent policy?
3.14 The Welsh Government policy had many aims which were explored in the survey. The
first set of these aims related to the impact of the policy on local decision-making on rents
and affordability for tenants. The survey asked landlords “What impacts, if any, has the
Welsh Government rent policy had on the following…”
The ability to widen rent differentials within your stock?
The flexibility/control you have over rents?
The level of rent increase that you can apply?
The actual rent levels that you charge?
Affordability of rents for tenants?
3.15 Overall, landlords were more commonly positive rather than negative, but between one in
five (eight landlords) and one in three (fourteen landlords) gave a negative assessment
on some aspects of the impact on local rent policy and affordability.
3.16 Almost half of landlords (20 of 44) said there was ‘little impact’ on the ability to widen rent
differentials, with a similar number (21) saying there was little impact on the affordability
of rent for tenants.
30
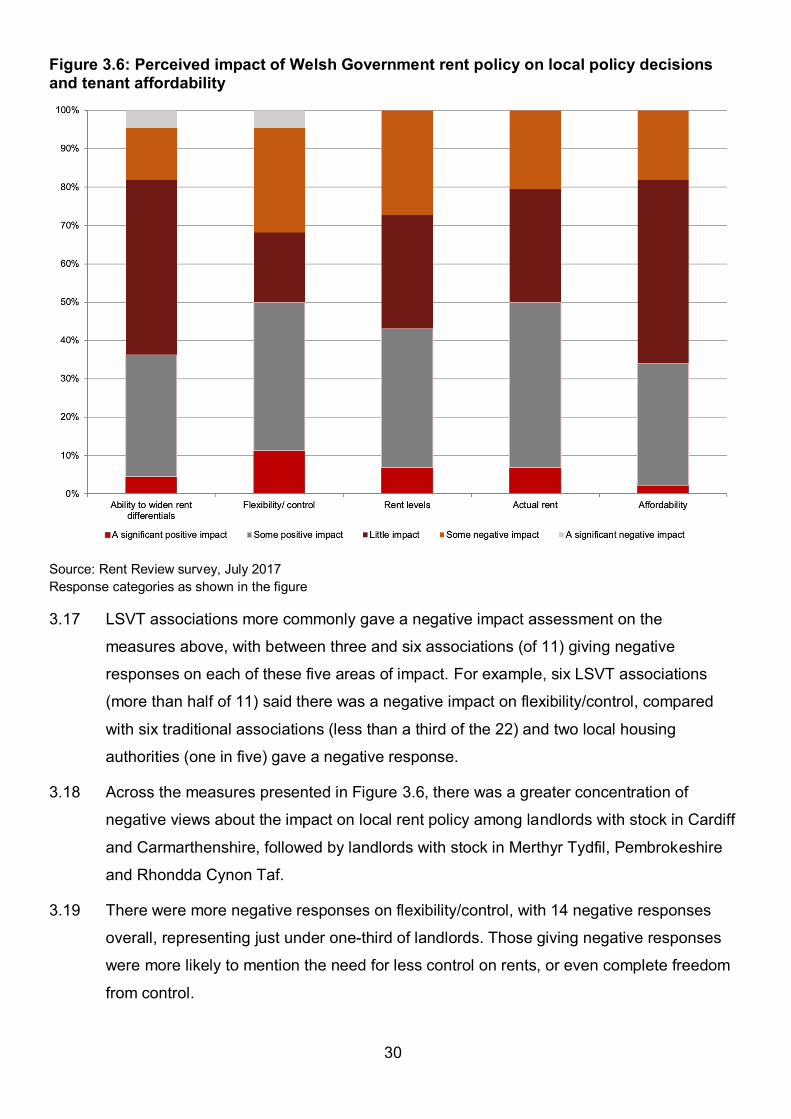
Figure 3.6: Perceived impact of Welsh Government rent policy on local policy decisions and tenant affordability
Source: Rent Review survey, July 2017
Response categories as shown in the figure
3.17 LSVT associations more commonly gave a negative impact assessment on the
measures above, with between three and six associations (of 11) giving negative
responses on each of these five areas of impact. For example, six LSVT associations
(more than half of 11) said there was a negative impact on flexibility/control, compared
with six traditional associations (less than a third of the 22) and two local housing
authorities (one in five) gave a negative response.
3.18 Across the measures presented in Figure 3.6, there was a greater concentration of
negative views about the impact on local rent policy among landlords with stock in Cardiff
and Carmarthenshire, followed by landlords with stock in Merthyr Tydfil, Pembrokeshire
and Rhondda Cynon Taf.
3.19 There were more negative responses on flexibility/control, with 14 negative responses
overall, representing just under one-third of landlords. Those giving negative responses
were more likely to mention the need for less control on rents, or even complete freedom
from control.

31
3.20 The constraints of the rent policy and the challenges of the (then) proposed Local
Housing Allowance cap were also raised by a number of landlords in the qualitative
discussion. Other negative impacts discussed in the qualitative interviews included:
Limited investment and constrained convergence where rents are not increasing
enough or increasing too slowly to allow investment
Limited flexibility due to the size of the Target Rent Band
Concerns about future uncertainty – whether the rent policy will continue and the
future expected limits of the Local Housing Allowance cap on Housing Benefit
Affordability concerns for tenants as rents increased over time while incomes did
not.
3.21 15 of 44 landlords (around one in three) reported that the rent policy had a positive
impact on rent affordability for tenants, with almost half (21) reporting that it had little
impact. Around one in five (eight landlords) felt the rent policy had been negative for rent
affordability.
3.22 When asked about other impacts, the most common themes identified were:
Ten landlords felt the policy gave them less certainty about the future, while six
felt it gave more certainty to plan for the future
Seven landlords reported that it had encouraged investment and active
development
Eight landlords expressed the view that the policy encouraged a consistent
approach, ‘feels fair’ and was defensible
Three landlords felt that it encouraged rent increases, while a further two
perceived that landlords ‘hide behind’ the policy
Three landlords raised the issue of delays in the announcement of the policy each
year here.
3.23 When asked about possible future impacts, landlords raised the following possible future
impacts6:
The impact of the proposed Local Housing Allowance cap7 was felt to be more
critical than the rent policy (13)
6 Questions: What other impacts has the rent policy had for your organisation (good or bad)? What further impacts do you foresee in future? 7 As noted above, this proposal was later withdrawn.

32
Uncertainty about the future Welsh Government rent policy and concern about this
(11)
The need for the policy to look at affordability in future (5)
The rent policy needing to be more flexible in future (5)
Specific issues with the short-term nature of the annual policy announcement (4)
Concerns that they may need to build less/develop less in future (2).
3.24 The importance attached to the anticipated (but later withdrawn) introduction of the Local
Housing Allowance cap is illustrated in these responses:
“Given that our rents are mostly close to or above the Local Housing Allowance cap
the relevance of Rent Policy as directly applying to us will become less in future years.
Instead, unless the Policy moves away from increases, it is the application of changes
to the cap which will have greater relevance to the financial viability of the organisation
and the affordability of rents to tenants.” (LSVT landlord, 5000+ properties).
“The impact of LHA [Local Housing Allowance] is significant and makes Welsh
Government rent policy ineffective, with welfare reform having a much greater impact
than the policy itself.” (LSVT landlord, 5000+ properties).
3.25 One landlord suggested mitigation targeted at the sheltered stock, in the light of
uncertainty about the Local Housing Allowance and service charges:
‘A reduced rent level for supported or sheltered stock to try to minimise the impact of
on-going increases for tenants who are feeling the effect of rent and service charges’.
(LHA)
3.26 In the qualitative interviews, many landlords pointed out that, although the current Welsh
Government rent policy had not had a negative impact on rent affordability so far, rising
inflation in future alongside limited wage growth may mean affordability may become
more of an issue. Some landlords were particularly keen to see affordability included as a
consideration in the Welsh Government rent policy. Affordability is discussed in more
detail below in relation to ‘wider impacts’ in Appendix C.
The impact of location
3.27 The survey asked “What impact does the concentration/spread of your stock have on
your local rent policy?” Overall, most landlords (31 of 44) reported a positive or little
impact of the concentration or spread of their rents on their rent policy. LSVT
associations were more likely to report that location had a negative impact, with almost

33
half reporting this, compared with one in three traditional housing associations and just
one local housing authority.
3.28 The landlords reporting they were adversely affected by their location were those that
were located in areas with very low local rents and low rates. These provided little room
for rents to increase before breaching the anticipated Local Housing Allowance cap.
Figure 3.7: Views on the impact of location on their local rent policy, by landlord type
Source: Rent Review survey, July 2017 (multiple responses given)
Response categories as shown in the figure
3.29 In the qualitative interviews, some landlords discussed the possibility (for their own
organisation or for others) to mitigate against the potential impact of the proposed Local
Housing Allowance cap by offsetting rent freezes or limits on rent increases in some
areas with higher rent increases elsewhere, where there is more ‘headroom’ up to the
Local Housing Allowance rate. Some associations were already using this strategy to
avoid rents in smaller properties going above the Local Housing Allowance rate, while
others were considering this strategy for the future.
3.30 Other associations were less keen on this ‘differential rent increase’ strategy and
expressed concerns that the proposed Local Housing Allowance policy would adversely
influence local rent policy so that rents were unfairly increased for larger households to

34
benefit single people. Some landlords were considering looking at the scope for
introducing differential rents for working people and people on Housing Benefit, but
admitted that issues of fairness made such an approach problematic.
3.31 The associations operating in fewer, lower-rent, areas (typically the Valleys) did not have
the scope to use differential Local Housing Allowance rates across different areas to
achieve an average rent within the TRB while also mitigating against the possible
negative impacts of the proposed Local Housing Allowance cap.
3.32 The landlords who reported being more negatively impacted by the location of their stock
were more concentrated in Carmarthenshire, Blaenau Gwent, Merthyr Tydfil,
Pembrokeshire, Powys and Torfaen.
Transitional arrangements
How effective were the transitional arrangements, which aimed to protect tenants, social
landlords and funders from changes in their financial affairs?
3.33 At the time of the survey (in July 2017) 70% of landlords had rents that were generally in
line with the TRB while the rest were transitioning towards it. LSVT associations and
LHAs tended to be those still transitioning their rents (Figure 3.8).e

35
Figure 3.8: Whether rents are generally in line with the target rent bands, by landlord type (all landlords)
Source: Rent Review survey, July 2017
Question: Are your average rents... Response categories: generally in line with the target rent bands or... are you
undergoing a transition to the target rent bands? (An ‘other option was allowed but not used)
3.34 Of those for whom the transitional arrangements were most relevant, who were still
transitioning to the TRB (14 landlords):
One said transitional arrangements had been ‘very effective’
Nine said these had been ‘quite effective’
Three said transitional arrangements were ‘not very effective’
One landlord said transitional arrangements were ‘not at all effective’.
3.35 Two of those who felt that the transitional arrangements were not effective were local
housing authorities and two were LSVT associations. Issues highlighted in the survey,
among those more negative about transition, were that local political decisions (not to
apply the full transitional amount) had undermined the policy, that low inflation meant that
convergence was slow and that there was a perceived lack of sanctions for those
landlords which were consistently charging rents outside the TRB.

36
3.36 Other issues discussed in the qualitative interviews were the pace of transition being
hampered by pre-transfer rent commitments and low stock turnover rates (since new
tenancies could go straight to the target rent, lower turnover adversely affected the pace
of transition).
3.37 When asked about the process of convergence to the local rent policy, landlords were
split as follows –
More than half (25) were already within the Target Rent Band
Six landlords said local rents will converge within 1-3 years
Six landlords said local rents will converge within 4-5 years
Seven landlords will take longer – mainly due to distance from the target rent,
combined with low tenancy turnover and also stock transfer commitments for one
landlord.
Figure 3.9: When rents are expected to converge with local rents policy, by landlord type
Source: Rent Review survey, July 2017
Question: When do you expect your local rents to be fully converged to your local rents policy? Response options
as in the figure
3.38 Local rent convergence may not have happened yet, even if rents were already within the
Welsh Government TRB. Four LSVT associations, one traditional association and two
37
local housing authorities said it would take more than five years for their local rents to
fully converge to the local rent policy (Figure 3.9).
3.39 The main factors identified in the slow transition towards the local rent policy8 were there
being some very low rent properties that would take a very long time to transition
(approaching 20 years for some properties) unless they became void. The Welsh
Government rent policy, alongside stock transfer commitments, has limited annual rent
increases in these unusually low-rent properties. One landlord also had a dilemma that
they had some properties that were in the lower half of the Target Rent Band but also
above the Local Housing Allowance rate.
Service charges
3.40 Some landlords were also still in the process of de-pooling rents from service charges.
Although four out of five landlords said that their service charges were de-pooled from
rents, there was considerable variation between landlords, with half of LSVT landlords
still to de-pool rents.
8 Question: When is it likely to be? And why might it take this long? (Asked of those who say that it will
take more than 5 years for local rents to be fully converged to their local rents policy)

38
Figure 3.10: Whether service charges are de-pooled from rents, by landlord type
Source: Rent Review survey, July 2017
Question: Are your service charges completely de-pooled from rent for all properties? Response categories – Yes;
No
3.41 Of those who reported that they had not yet de-pooled rents, most said these would be
de-pooled by 2018-2019, with some de-pooling work underway and in progress9. A few
landlords were less certain about timings, due to issues with stock transfer ballot
commitments.
3.42 The main issues/concerns identified with rent de-pooling were where there were
significant service charges that needed to be incorporated into rent over a reasonable
period, as affordability was a concern. As mentioned above, commitments made to
tenants prior to a stock transfer ballot also meant that some landlords needed to conduct
a comprehensive tenant consultation process before fully de-pooling service charges. A
few landlords were particularly concerned about service charges in sheltered
9 Questions asked of those who said they have not de-pooled rents: Please can you explain where you are in the de-pooling process and when you anticipate to complete the exercise? What are the main issues/concerns with de-pooling service charges from rents?

39
accommodation and how these might be de-pooled in a way that avoided considerable
financial hardship for elderly tenants on fixed incomes.
3.43 During the qualitative interviews, some landlords discussed the measures that were
being put in place to ‘future proof’ new developments by ‘designing out’ service charges.
Although ‘designing out’ service charges limited the need for additional service charges
on top of rents, it was not without negative impacts. There was one example given of the
practice of concreting over common green areas around housing to enable the removal
of estate management costs and associated service charges.
3.44 Landlords also spoke about the need to have ‘honest’ discussions with tenants about
what they valued and what that costs, in terms of service charges. There was also a
focus on tenant consultation and looking at ‘Value for Money’ and what service standards
tenants were getting for the service charges paid. Some landlords felt that this had
improved performance by casting a light on efficiency.
3.45 The focus on ‘Value for Money’ was identified as a complex area, though, with specific
reference to fire safety provision in the aftermath of the Grenfell Tower fire, which
happened during the survey period. Landlords were looking at cladding, sprinkler
systems and other fire safety issues. They were making budget provision for these, whilst
also looking to the Welsh Government for guidance on the financing of additional fire
safety provision.
Have the transitional arrangements offered protection for – tenants, landlords and
funders?
3.46 As shown above, most landlords were positive about the transitional arrangements in
place. In the qualitative interviews, the positive aspects of the transitional arrangements
highlighted were the way in which the policy limited the adverse impact on tenants,
landlords, and funders. The fact that the policy gave landlords adequate time to reach the
TRB was important, and the scope to use the £2 additional uplift as well as the ability to
increase the rent of void properties to the TRB were helpful.
3.47 The survey asked landlords whether their tenants had been affected by the rent policy,
with most landlords reporting that tenants had been affected – 23 reported tenants had
been affected ‘a little’ and seven reported they had been affected ‘a lot’. Around one in
three landlords felt that tenants had not been affected by the rent policy.

40
3.48 LSVT associations and local housing authorities more commonly reporting that their
tenants had been affected by the rent policy, compared with traditional housing
associations (Figure 3.11).
Figure 3.11: Whether tenants have been affected by the Welsh Government rent policy, by landlord type
Source: Rent Review survey, July 2017
Question: Have your tenants been affected by the rent policy? Response categories as in the figure.
3.49 The seven landlords reporting that their tenants had been impacted ‘a lot’ by the Welsh
Government rent policy had stock in the following areas – Cardiff, Carmarthenshire,
Ceredigion, Conwy, Denbighshire, Gwynedd, Neath Port Talbot, Newport,
Pembrokeshire, Rhondda Cynon Taf and Swansea.
3.50 When asked to expand on the issue of tenant impacts10, eleven landlords reported that
the rents had increased significantly or above inflation while six said the increase in rents
had been limited.
10 Question: Have your tenants been affected by the rent policy? If yes, please explain how?
41
3.51 A few landlords said that arrears were stable, which they took to be a good sign. A few
did, however, raise specific concerns about affordability now and in the future. However,
a few landlords also said that the rents were fairer now due to greater differentials,
between houses and flats, for example. Others felt the impact of the Welsh Government
rent policy had been marginal, particularly where they had local policies in place.
Protection for landlords and funders
3.52 Landlords were generally more commonly positive rather than negative about the
perceived impact of the rent policy on business planning, access to finance and
development. The survey asked “How much of an impact, if any, do you think the Welsh
Government Rent Policy has had on the following?” –
The valuation of your housing stock
Your ability to borrow
The terms of your borrowing
Your ability to deliver your business plan
Your ability to build/increase housing supply
Your ability to deliver intermediate or market rented units
Your ability to meet WHQS by the agreed timescale and maintain thereafter
3.53 Most positive views were expressed in relation to being able to build/increase supply and
other financial indicators – 25 of 44 landlords (over half) reported there had been a
positive impact on their ability to build/increase housing supply and 22 (half) reported a
positive impact on their ability to deliver their business plan valuation. 18 were positive
about stock valuation and 17 on the ability to borrow and the ability to meet and maintain
the WHQS.
3.54 Housing associations were generally more negative about the perceived impact on the
business than local housing authorities. Between zero and four LSVTs gave negative
scores on the various business impact measures while between one and five traditional
associations did (compared with between zero and two local housing authorities).

42
Figure 3.12: Perceived wider impacts of the Welsh Government rent policy on business plans, investment etc.
Source: Rent Review survey, July 2017
3.55 In the qualitative interviews, housing associations more commonly spoke about the need
for greater flexibility in the rent policy, with some wanting complete control of rent setting.
On business plan impacts, traditional housing associations were more commonly
negative than LSVTs associations in relation to increasing supply and providing mid-
market rented properties while LSVTs were more negative about their stock valuation,
ability to borrow and terms of borrowing.
3.56 The landlords who gave negative scores across the measures in Figure 3.12 more
commonly had stock in – Carmarthenshire, Pembrokeshire, Blaenau Gwent, Caerphilly,
Cardiff, Ceredigion, Merthyr Tydfil, Neath Port Talbot, Rhondda Cynon Taf and the Vale
of Glamorgan.
3.57 In the qualitative interviews landlords commonly highlighted the fact that the assessment
they made in the survey about the financial impacts of the rent policy was based on the
situation at that time. They were less optimistic about the future financial picture due to
concerns about the roll-out of full service Universal Credit, the impact of the proposed
Local Housing Allowance cap and also uncertainty about the funding for supported

43
housing provision. Since the survey was conducted, the UK Government has announced
that it no longer intends to extend the Local Housing Allowance cap to social tenants, and
the proposals to reform the financial support for supported accommodation have been
amended. These changes may provide some stability for rents in future.
3.58 A commonly expressed concern was the short-term nature of the rent policy, with
landlords looking for longer-term commitment. Many landlords felt that annually updating
the matrix created uncertainty and wanted the policy to operate for the life of the term of
government (i.e. until May 2021 and then at 5-yearly intervals).
3.59 The main positive financial impacts highlighted in the qualitative interviews included:
Increased rental income, which had a positive impact on viability
The associated ability to invest in existing properties and new-build developments
Greater flexibility on rents (for some).
3.60 Negative impacts, on the financial side, were perceived to relate to issues of future
certainty. Again, landlords pointed out that their current – relatively positive –assessment
of the impact of the rent policy on the business plan may not hold in future, depending on
the potential impacts of the Local Housing Allowance cap or an adverse change in the
Welsh Government rent policy.
3.61 Enabling landlords to make rent increases of CPI+1.5% plus £2 had provided financial
benefits to many landlords. Some landlords said it had helped them to plan and invest by
having some certainty about income, but others were more inclined to highlight the
short-term nature of the policy.
3.62 Some landlords were increasing rents at the maximum only where they needed to in
order to converge on the TRB, while others were using the maximum (CPI+1.5% plus £2)
wherever they could to maximise investment opportunities. Some landlords suggested
that uncertainty about the ability to put rents up in future may have led to higher rent
increases in recent years. Freezing rents or cutting rents as in England was the ‘worst
case scenario’ envisaged for the future but there was little evidence that landlords felt this
was likely to happen.
3.63 The timing of the announcement about the rent matrix each year was raised by many
landlords as a negative feature of implementation that had led to uncertainty. A
commonly expressed view was the need for a longer lead-in and a longer planning period
to provide greater clarity and certainty for landlords and lenders. As one respondent
commented:

44
“It’s no good talking to us in December about rent changes and expecting us to be
able to do consultation. We need transparency and consistency.” (Traditional Housing
Association, with less than 2,000 properties)
Meeting the original policy aims
To what extent has the current rent policy delivered on the original aims?
3.64 The survey asked respondents to consider whether the rent policy had met the original
aims. Respondents were asked: “The current rent policy had several aims, which are
listed below. From your experience so far, how effective has the policy been in achieving
these aims?”. The individual aims identified in the survey were as follows:
Reflecting local variations in affordability and housing market values
Reflecting variations in the type/size of social landlord’s stock
Reflecting variations in the quality of social landlord’s stock
Reflecting variations in the location of social landlord’s stock
Providing a more equitable distribution of rents for social sector tenants across
Wales
Ensuring the viability of individual social landlords
Being fairer to tenants in terms of the rents charged for equivalent homes across
social landlords
Providing for the convergence of rents over a period of time.
3.65 The perceived effectiveness of the policy was mixed, with more positive views on the
effectiveness in providing for convergence of rents over a period of time and reflecting
variations in the size and type of social landlord’s stock. Other measures were more
generally viewed as having been ‘not very effective’.
3.66 Landlords were more negative about the effectiveness of the rent policy on reflecting
variations in the quality of social landlord’s stock, reflecting variations in the location of
social landlord’s stock and providing a more equitable distribution of rents for social
sector tenants across Wales.

45
Figure 3.13: Perceived effectiveness of the rent policy, all landlords
Source: Rent Review survey, July 2017
3.67 In terms of variation by landlord type, housing associations tended to be more critical
than local housing authorities and less inclined to say that the policy had been effective.
Uncertainty about the likely effectiveness was, however, spread across landlord types.
3.68 Those giving a ‘not at all effective’ assessment were more commonly LSVTs, although
local housing authorities were more negative on the effectiveness of the policy in
reflecting local variations in affordability and market values (3 said the policy is not at all
effective) than on other policy aims.
3.69 LSVTs were commonly more negative on the effectiveness of the policy in reflecting
variations in quality (6 indicated ‘not at all effective’) and variations in location (5 said ‘not
at all effective’), on ensuring viability for social landlords (five said ‘not at all effective’)
and providing a more equitable distribution of rents across tenants (four said ‘not at all
effective’).
3.70 Other housing associations were also most negative on issues of equitable rents (six felt
the policy was ‘not at all effective’), on location (four ‘not very’ or ‘not at all effective’) and
quality (with four providing ‘not very’ or ‘not at all effective’ responses).

46
3.71 The landlords that were more negative about the overall effectiveness of the rents policy,
across the measures in Figure 3.13, more commonly had stock in Cardiff,
Carmarthenshire, Powys, Rhondda Cynon Taf, Torfaen, Bridgend, Caerphilly, Merthyr
Tydfil, Neath Port Talbot, Blaenau Gwent, Newport, Pembrokeshire and Swansea.
3.72 Some of the drivers behind the more negative views on policy effectiveness explored in
the qualitative interviews were:
The perceived ‘redistributive’ effect of the locational matrix, with some landlords
feeling that the locational matrix had a negative impact on viability, was not fair
and produced variable results year on year
Convergence was felt to be limited, by some, as only the average rents needed to
be in the TRB – there was still felt to be considerable variation between landlords
within the same local authority
Some landlords were maximising rent increases (or observed that others were)
which they felt would have a negative impact on affordability
Several landlords felt that SAP was not a good measure of condition, was a ‘blunt
tool’ or was unfair (as those needing to invest had to charge lower rents so were
even less able to invest)
The treatment of new-build properties, bungalows and sheltered properties was
felt by some to create anomalies
There were significant local sub-area variations in demand not captured (though
some local policies did capture this)
Some felt that the Local Housing Allowance cap had ‘overtaken’ the rent matrix, so
the matrix could not be effective in meeting its aims.
3.73 Positive aspects of policy effectiveness identified were:
That the Welsh Government approach had been more collaborative and supportive
than observed in England
The approach is pragmatic, with inevitable choices having to be made
Some landlords thought that the policy had allowed them greater flexibility to
increase rents.
Rent convergence and comparability
3.74 Two of the main aims of the policy outlined above were ‘providing a more equitable
distribution of rents for social sector tenants across Wales and being fairer to tenants in
terms of the rents charged for equivalent homes across social landlords.’

47
3.75 The survey asked landlords how their rents compared to other social landlords, the Local
Housing Allowance rates and the private rented sector. On convergence, just over half of
landlords (24) reported their rents are ‘very similar’ to other social landlords. Around one
in three (16 landlords) felt their rents were ‘somewhat lower’ than other social landlords.
A few landlords had higher rents, though, more similar to the PRS. This was the case for
two traditional housing associations, one LSVT association and one local housing
authority.
3.76 More commonly, landlords reported their rents as being ‘somewhat lower’ than Local
Housing Allowance rates, although two landlords felt their rents were ‘considerably
higher’ and two ‘somewhat higher’ than the Local Housing Allowance. A further nine local
authorities did not offer a response – mainly traditional landlords with stock spread
across several BRMAs, for whom the answer was that it depended on the location.
Figure 3.14: How rents compare with other landlords and the Local Housing Allowance
Source: Rent Review survey, July 2017
Question: How do your rents compare to the following…. The Local Housing Allowance rates(s) in
the BRMA(s) where you operate?; Other social landlords operating in the local area?; The private sector? Response
categories as in the figure

48
3.77 LSVT associations more commonly had rents very similar or somewhat lower than the
Local Housing Allowance rate (Figure 3.15). Local Housing Authorities also had lower
rents, with some considerably below the Local Housing Allowance rate.
3.78 Traditional housing associations more commonly had higher rents compared with the
Local Housing Allowance rate in the BRMA(s) they operate in (or did not respond). Those
not answering tended to have stock spread across a number of areas, operating in an
average of 6 local authorities, so had a more complex experience of the Local Housing
Allowance rates across their stock.
Figure 3.15: How rents compare with Local Housing Allowance rates, by landlord type
Source: Rent Review survey, July 2017
The overall average rent policy
Does the original policy intention not to implement a change in the overall average level
of rents continue to be justified?
3.79 Some landlords (although not the majority) felt that the overall average target rent bands
placed an unhelpful constraint on the balance of rents. Some landlords felt the locational
indicator skewed results and there was an adverse impact of the damping on their (or
other landlords’) rents. These landlords felt that the matrix results reinforced some social

49
problems, limiting rents for landlords in lower demand areas, so limiting investment
opportunities there. This is shown in more detail in the section on ‘Wider impacts’ in
Appendix C.
3.80 When asked about what they would like to see in the future rent policy11, many landlords
wanted to see more flexibility for landlords to set their own rents (15 of the 44
respondents), with a similar number wanting to see more flexibility around the outer limits
of the TRB, or in the policy’s application locally (16 landlords).
3.81 Four landlords said they thought there was enough flexibility and the remaining nine
identified other issues but did not specifically mention flexibility. Where landlords
emphasised the need for greater flexibility, this was commonly in the context of local
decision-making based on analysis of affordability. Examples of what some landlords
would like to see were:
“A flexible rent policy, not set by Welsh Government, which allows each landlord to set
their own rents in return for a commitment to be clear and transparent about
affordability.” (Traditional HA, 5,000+ properties)
“More flexibility and less prescription. More focus on allowing us to set affordable rents
which we think we can collect. Landlords know their areas and know what is
affordable.” (LSVT, 2,000-5,000 properties)
“The real control on rents going forward will be the Local Housing Allowance benefit
cap. Therefore the WG rent policy should be relaxed to enable RSLs to manage their
rents in line with the challenge of the cap, the need for affordability and the need for
keeping the business sustainable in the long term.” (Traditional HA, fewer than 2,000
properties)
“More flexibility at the local level. Within a % of guideline rents but no cap at individual
property level. Too prescribed and controlling.” (LHA)
“Do not link Welsh Government rent policy and the Local Housing Allowance rates. UK
Government pressure to constrain rents but Welsh rents are lower. Keep flexibility -
there is enough flexibility but not sure people are using it. More Guidance on that
might be useful.” (LHA)
11 Question: What changes, if any, would you like to see in the rent policy in future?
50
3.82 Some believed that landlords should not be left without controls on rents:
“To ensure safeguards exist for tenants it is important for there to be a limit on the
maximum rent increase a particular tenant can face.” (Traditional HA, fewer than 2,000
properties)
“We would like to see some local flexibility around rent levels and increases but would
caution against a complete removal of oversight.” (LSVT, 5000+ properties)
“Any changes to the rents policy needs to meet the conflicting agendas of raising
sufficient income to allow for investment in the current housing stock and the
development of new social housing as well tackling the issue of financial hardship
faced by tenants through higher rents and welfare reform”. (LHA)
Summary of survey findings
Implementation
Around half of landlords are using the Welsh Government rents policy, with most
reporting that it was effective; offering clarity, transparency and comparability and
easily understood by tenants
Those who were more negative (often LSVT landlords) felt that the policy had
constrained rent increases/income and was inflexible. Some had seen volatility in the
matrix year on year and felt that the locational index, with damping, was regressive,
forcing down rent increases in lower demand, lower rent areas.
Transitional arrangements
By July 2017, almost three-quarters of landlords had rents in line with the Target Rent
Band. Transition had been less effective where there was a lack of political will or
high-level support for transition, and where rents were felt to not have transitioned
quickly enough due to inflation and the limits of the policy.
Local rent policies and service charge de-pooling has often taken longer due to
commitments made pre-transfer ballot (among LSVTs and LHAs) and where the
distance to the target rent and service charges involved are significant.
Protection for landlords, funders and tenants
Landlords were generally positive about the protection afforded by the transitional
arrangements, with positive impacts of the policy on stock valuation and borrowing
terms.

51
There were concerns expressed for the future, with the need to consider affordability
for tenants and also the need for a longer-term policy term, to provide greater
certainty for landlords and funders.
Meeting policy aims
Views on the effectiveness of the rent policy in meeting policy aims were more mixed,
with more positive views expressed about the policy meeting the aims of rents
converging and the policy encouraging rents to reflect variations in property size and
type but more negative views were expressed about rents reflecting variations in
quality and location and there being an equitable distribution of rents across Wales.
Housing associations and LSVT associations in particular expressed less positive
views about the effectiveness of the rent policy.
Concerns stemmed from the perceived redistributive impact of the matrix and
subsequent constraint on rents in poorer, low rent areas alongside continued local
variations hidden by rents meeting the average TRB.
Some landlords raised methodological concerns about the use of SAP rating to proxy
condition/quality and anomalies between new-build properties and others and
between bungalows and houses. The timing of the announcement, in December each
year, was also raised as a negative feature of implementation.
The overall average rent policy
There were some landlords (though not the majority) who felt that that the overall
average rent policy framework placed an unhelpful constraint on rents and there
needed to be greater flexibility in rent setting.
This was most strongly felt among LSVT associations particularly adversely affected
by the locational matrix and damping.
Some landlords (around one in three) would like to see complete autonomy in rent
setting, while a similar proportion would like to see some flexibility around the limits of
the Target Rent Band.

52
4. The views of tenants
Introduction
4.1 The overall aim of the research with tenants was to understand tenant views on the
affordability of the review of the rent policy and its impacts. This aspect of the work
sought to gain an understanding of:
tenant awareness, understanding and attitudes towards Welsh government rent
review proposals;
tenant understanding that social landlords have flexibility around rent levels
views on impacts of rent policy changes on affordability;
how and why these views were held according to the circumstances of the tenants
(taking account of demographic and household composition, location, whether
they are in receipt of housing benefit, and whether they were tenants of local
authority or RSL social housing;
how the views of tenants compare with those of landlords.
Views on rent levels
4.2 The most common word tenants used to describe rents was ‘reasonable’ :
“I think they are quite reasonable rents, because they always come out and do the
repairs quickly […] and they just recently put in new kitchens” (Older person, Council,
North Wales)
“It’s alright. It is £98 a week for three bedrooms. Private rents locally would be a lot
higher, I think” (Couple with older children, Council, South East)
“The rents are reasonable, because we get all the amenities that we need, like the
hedges and the grass cut” (Older person, Council, North Wales)
“They are quite fair rents – they’re not extortionate” (Family, LSVT HA, South East)
“The rent is reasonable, considering what some of the others round here are paying”
(Family, LSVT HA, South East)
“The landlord puts our rent up every year, but its only around £2 a week. We are now
paying £92 a week. I’d say it’s probably OK compared with what the private rents are
in the area (Older person, HA, North Wales)

53
4.3 Some respondents were more critical, saying rents were ‘increasing’, ‘expensive’ and
‘ridiculous’. This was commonly associated with the negative impacts of welfare reform:
“To me, it seems a little bit expensive […] Until we are settled and find a job, we are on
benefits and they have applied the Benefit Cap at £385, but they have increased the
rent from £119 to £126. At the same time, they decrease the benefits” (Family,
Council, South East)
“For me, it is quite frustrating because I pay the Bedroom Tax for my extra bedroom.
My pension is deferred for four years, so they will get another four years of bedroom
tax from me” (Older, Council, South East)
“The Bedroom Tax is outrageous” (Older, Council, South West)
“Bedroom Tax is an issue – they charge you extra money if you have an extra room.
People have been living in their house for years, they have no choice and are being
forced out, and they really don’t want to leave” (Family, Council, North Wales)
4.4 A few in-depth interviewees with long-standing health problems had also seen their
Employment Support Allowance (ESA) or Personal Independence Payment (PiP)
reduced, which led to a change in circumstances and benefit recalculations and delays.
One disabled tenant said her rent was ‘still up in the air’ due to her PiP payment being
reduced recently, which has a knock-on effect on her Housing Benefit entitlement, which
has not yet been resolved. The family have had experience of wages being arrested due
to ‘bureaucratic screw-ups’.
4.5 It was difficult for respondents to separate out the impacts of decisions taken by local
government/their landlord or the Welsh Government from decisions taken at UK
Government level about welfare reform and entitlement. Although a few tenants referred
to decisions made in Westminster as having a negative impact on Wales, it was far more
common for tenants to refer to issues and concerns with Housing Benefit/other welfare
benefits as a composite set of problems/issues that they faced.
4.6 There were also some older tenants who were struggling a little with the rent:
“I wish it (the rent) could be less” (Older person, LSVT HA, Valleys).
“The rents are still increasing every year though, it’s unfair. It’s been around £5 a week
most years and we are now paying £97.11 a week. It’s difficult to afford on a pension.”
(Older couple, HA, North Wales)

54
Views on rent comparability
4.7 Council and local housing association rents were generally felt to be broadly comparable,
among those who felt able to express an opinion. In the focus groups, some comparisons
identified higher rents in HA stock, but participants sometimes put this down to
differences in size/type, space standards or having a garden.
4.8 In the cities, social rents were compared very favourably with the private rented sector.
“Well, if you base it on private rented, it’s reasonable, but I don’t consider private rental
to be reasonable […] That makes X Council, at £108 (a week) reasonable” (Pensioner,
Council, Urban location)
“Compared to my friends who are in private housing, I pay less than them. One of my
friends pays £735 (a month) for a 3-bedroom property, compared with £538, but it may
depend on the area” (Family, HA, Urban location)
4.9 In some other locations, there was felt to be less of a difference between private renting
and social renting. In one urban setting, the insecurity of the PRS was discussed as a
major concern, which made social renting attractive. One resident in Mid Wales also
noted ‘Once you’re with the Council, you’re there for life’.
4.10 Some residents identified other locations as comparatively cheaper – such as the
Valleys, compared with Cardiff – or more expensive, comparing nearby English local
authorities with Wrexham.
Service charges
4.11 Those who were paying service charges were mainly paying for communal grass cutting,
though there were also a few sheltered housing residents paying for communal areas,
laundry services, wardens and heating.
4.12 Where they were paid, service charges were generally felt to be reasonable and
transparent but a few respondents were not happy with the level of service provided (e.g.
cutting grass but leaving clippings behind, or not attending regularly enough), or felt that
people were charged for services that they didn’t use or that charges were unfair.
“There is a very minimal service charge. There is a community alarm and grass
cutting. It’s about 50p a week for the community alarm and 75p for grass cutting. It’s
very reasonable given how low the rents are”. (Single, Council, Mid Wales)
“You sometimes get charged for facilities that you don’t use” (Older person, HA, South
West)

55
“We get charged something like £1.80 a week for them to come out and mow the
grass but they missed mine out last time!” (Family, HA, North Wales)
“They charge 89p a week (for grass cutting). It’s wrong, I think”. (Older person,
Council, North Wales)
“I saw a leaflet recently saying that the older residents living in the flats on the estate
would have to pay for extra things like the cleaning of communal areas, waste
collection, etc. I was outraged. Some of them are struggling to pay their rent, let alone
charging more on top” (Family, LSVT HA, North Wales)
4.13 Some concerns were also raised about inequity in relation to estate management
services, with some tenants suggesting that some other estates seem to get more
services than they do. A few tenants raised issues about the lack of fencing around
communal areas, also, which was felt to mean that shared gardens were not safe for
children to play in.
4.14 Although most of those paying service charges said that they received detailed
information about what these were for, one or two said that this was not the case.
“There is ground maintenance, TV aerials, lights… all listed out on the rent (letter). It’s
quite cheap – hardly anything” (Young couple, HA, North Wales)
“The service charges are all in with the rent. We get a letter each year that breaks
down the rent and service charges” (Family, LSVT HA, South East)
“They send you a yearly bill, with charges, but it is not clear what it is for” (Older
person, HA, South West)
Quality of service
4.15 Respondents were fairly positive about the value for money of the rent paid. Older
tenants were generally more positive:
“I can’t say that I can fault them. Since moving in, I have had a new kitchen and
bathroom and they are now doing the windows” (Older person, HA, Mid Wales)
“It’s not too bad – about £58 a week (rent) and then the rates on top of that. But they
are pretty good at repairs and things like that. They are putting new roofs on now, and
new bathrooms and kitchen units (Older person, Council, North Wales)
4.16 One respondent in Swansea receiving partial Housing Benefit said that the rent was not
good value for money as it was ‘a bit high’ but also said the physical condition of the
property was ‘good’ and that repairs were dealt with ‘straight away’, and that customer

56
care was ‘ten out of ten’. So, in this case, the rent alone drove their view about poor
value for money.
4.17 For a number of respondents, the physical condition of their property was an ongoing
problem which meant they had negative views about the value for money of their rents.
Common issues identified were:
the poor condition of the property on moving in
dampness and mould
lack of adequate fencing around gardens
exterior property condition
some ageing bathrooms and kitchens
poor quality or dangerous workmanship
disputes over who has responsibility for repair works
delays and inconvenience experienced during upgrading works.
4.18 The value for money offered by repairs and maintenance services for the rent paid varied
considerably, with some tenants speaking about repairs being done within hours or one
or two days and others waiting weeks for an appointment. Contractors that were
‘cowboys’ doing sub-standard work or failing to show up were the issues highlighted by
those with negative views on value for money.
4.19 On balance, it was more common for tenants to report having reasonably modern
facilities, and a fairly positive experience of getting works done (e.g. prompt repairs
service, good choice in units/fittings, quality materials). However, a few tenants do feel
that the rent charged is poor value for money.
“The bathroom upstairs was getting damp and, I’ve got to be fair, I’d never been with a
housing association before […] They were out like that (snaps fingers) and they had it
fixed within the week” (Family, HA, South East)
“I think they are just taking the mick (charging the rents they do)” (Family, Council,
North Wales)
4.20 There were, however, several examples of extremely bad experiences of getting works
completed, though with tenants being left without toilet facilities, workmen not showing
up, ‘botched’ or dangerous work.
“The workmen can take forever to come. You’ve waited in all day for them and they
don’t show up!” […] “And then you’re pegging out washing and they’ve been and put a
57
card through your door!” (An exchange in one of the focus groups between two
different family respondents, Council tenants)
“As of this week, X Council were quoting three week’s minimum (for repair works)
unless it was a gas leak!” (Older person, Council, South East)
“Generally, the windows and doors that they put in aren’t of a great quality. I had a
front door replaced and you can see daylight through it, but apparently that is normal
according to the Council!” (Family, Council, South West)
“They call them ‘Council Cowboys’ in [X area]” (Older person, Council, South West)
“[…] When I have had works done, the contractors have been a nightmare. But if I
have any problems I have contacted those in charge of the renovations and they have
resolved that” (Family, Council, South East)
4.21 Some tenants also felt that money was also wasted through what they perceived to be
inefficient working practices. There were several examples given of workmen coming out
to do repairs without the right materials because they did not have full information about
the nature of the problem. One Council tenant had five visits before his door was
eventually fixed.
4.22 Some Council tenants, particularly in urban areas, who knew of others in housing
association properties felt that the physical standard of HA properties was considerably
better and housing association tenants were, on balance, more positive about their
property condition and the experience of getting repair works done.
“To be honest with you, I have many friends who moved to housing associations and
when we talk with each other we find a really big difference between us and them.
When someone has a Council house they just cry, because they are so old!” (Family,
Council, South East)
“That makes me sick, that does (that HA properties are in better condition). The
Council are still rotting in their own mildew. It’s wrong.” (Single, older tenant, Council,
South West)
4.23 Customer care experiences were generally viewed favourably:
“My housing officer is a lovely lady […] They are good, that way” (Family, Council,
North Wales)
58
“The Housing Officers are quite good. They are very polite and everything. It is just
getting something done that takes the time” (Couple with older children, Council, South
East)
“The Council here are brilliant – they really help you. […] They are ten out of ten”
(Couple with older children, Council, South West)
“They are really nice and they listen to what you want” (Family, LSVT HA, South East)
“They are pretty good - if I need to get in touch with them, I phone them up (Family,
Council, Mid Wales)
“They are very nice – once you get through (on the phone). It takes time to get through
sometimes. I know they must be very busy…” (Older person, Council, North Wales)
4.24 However, some tenants were more negative saying that they needed to ‘nag’ to get
anything done, that they had received poor service or felt that staff lacked respect. One
older tenant in one focus group was appalled when she contacted the Council to report a
leak in her toilet cistern, as the call handler made a joke about her with colleagues while
she was on the phone, implying that the tenant was incontinent. This was the worst
example of customer care reported.
4.25 A few tenants with longstanding property issues felt there was a lack of accountability for
poor service. Some spoke about a tortuous, exhausting process to have repairs issues
resolved.
“For everything, you have to nag and nag and nag” (Family, Council, South West)
“I hardly see them. […] It is not easy – you have to chase after them” (Pensioner,
LSVT HA, Valleys)
“I had water pouring through my chimney, well, the roof, near the chimney. I called to
report the problem and couldn’t get through. I called every day and spoke to someone
eventually and reported the problem. I had to call a few times again and tell them.
Someone did come out eventually, but it actually took three months to get repaired,
after three inspectors looked at it!” (Family, LSVT HA, North Wales)
“There needs to be more accountability from the people you speak to. People need to
take more responsibility and think ‘this is my job to report this’. […] They should get
back to you within 24 or 48 hours. Not be passed from one person to another to
another” (Family, Council, South West).

59
4.26 One of the sheltered housing residents had seen their level of service reduced in recent
years. This was attributed to cuts within the Council’s social care budgets.
“When I moved in, they were getting money from the Council for a warden and now
they just come a couple of days a week” (Older person, HA, Mid Wales)
What is worth paying extra for?
4.27 When asked whether there was anything that would be worth paying extra for, a few
tenants identified estate management (e.g. grass cutting) as worth paying a bit more for.
One person said they would like heating to be included in the rent. He had previously
lived in a property where the rent covered his heating costs and felt that this made
budget management much easier.
4.28 Improving the physical condition of the properties was more generally felt to be a basic
level of service, for which there should not be an additional cost.
“You should not have to live in dampness or mould if you are paying rent” (Family,
Council, South East)
“If the property is falling down, I wouldn’t appreciate paying any rent! As long as it is fit
enough to live in, you pay for what you get (Older person, Council, North)
4.29 A couple of tenants said it would be better to have improvements/better facilities and pay
more rent, though.
“We could really do with a bin store for the bins because they are left on the footpaths.
That would be worth paying a little bit more rent for” (Couple with older children,
Council, South East)
Deciding what to charge for rents
4.30 One aspect of the rent policy review explored with tenants was what factors should be
considered in deciding on the structure of rents. Property size was generally felt to be the
factor that should drive rent the most, with some discussions about overall space versus
number of rooms, and whether houses and flats should have different rents. Most tenants
felt that the differentials based on property size were appropriate, but a few were less
sure.
“Size has got to come into it, because someone staying in a small property shouldn’t
be paying the same as someone somewhere bigger” (Family, HA, South East)
“It is not fair at all. There should be more of a difference by size” (Couple with older
children, Council, South East)

60
4.31 New build versus older properties also caused some debate – with the recognition that
older houses may have better space standards and be more desirable whereas newer
houses may be more energy efficient but of poorer quality.
“Should these have a higher rent (new properties). They are new, fresh and lovely but
maybe not more expensive” (Family, disabled tenant, Council, North Wales)
“I think you can have a nice, four-bedroom new house and a nice four-bedroom old
house. There should not be a difference in price because one is old and one is new. If
they are in the same City they should be the same price” (Family, HA, South East)
4.32 Affordability and the cost of heating were also felt to be important, especially for tenants
on benefits.
“Affordability for tenants, for me comes top because it has to be affordable for anyone
who is in there, really” (Family, Council, South West)
“I think the affordability more than anything, that is important in deciding on the rent”
(Older couple, Council, South East)
4.33 When asked whether more energy efficient properties should have higher rents, views
were mixed. Some felt that it was fair to ask for more rent if people were saving money
on heating, or offer a discount to people with inefficient heating whereas others felt
energy efficiency should be improved as a matter of course. There was a similar view on
condition – rather than having a lower rent for a poorer condition property there was more
generally felt to be the need for a minimum standard.
“Energy efficiency should be better across the board. They should do their best to
improve it.” (Family, LSVT HA, South East)
4.34 Location caused some debate, with some feeling that poorer areas should not have lower
rents, as this causes social problems. However, one respondent felt people should have
lower rents in areas with more social problems as they had to put up with more, on a
daily basis.
“I have ex-offenders near me, and young people who have been in trouble. […] It
encourages integration if rents are not related to location. No place is the same – you
have to respect communities” (Family, Council, Mid Wales)
4.35 Another view was that higher rents should be paid by those choosing to live in
towns/nearer to shops and other facilities, though some disagreed and felt that social
renters in cities should not pay more:

61
“I think location is important. You don’t want to be too far from the shops and the bus
routes so rents should reflect that” (Older person, Council, North Wales)
“They can afford to drive a brand-new car and fill it with petrol and do the hour
commute because they are paying half the rent we are” (Family, HA tenant, urban
location, reflecting on the rents in the Valleys)
4.36 Some tenants felt that they did not have choice about the location of their property, and
so discussions of ‘choice’ in relation to social housing was not appropriate. Some
anomalies were also identified, with tenants providing examples of people in flats paying
more than people in houses within the same local authority. There were also some views
that there is not much difference between different sizes of property and that this was not
fair, because it was felt that differences in size should be reflected in higher or lower
rents. Others felt differences were justifiable in terms of overall space standards, having
a garden, or some other property features.
4.37 Several of the tenants involved in the research reported living in overcrowded properties
and were waiting for a transfer to a larger property. For these tenants, any additional
charge for more space is a secondary consideration to their housing needs, exacerbated
as their children get older.
The comparability of local rents
4.38 Another aspect of the rent policy review, on aligning local rents, was also explored.
Setting rents in line with the private sector or other social landlords was not generally felt
to be that important, though tenants felt rents were broadly similar across the social
sector.
“I don’t think we should set our rents to be in line with other landlords, but it would
make sense if the Government said that they had to be in line in such and such area”
(Older person, Council, South West)
Consultation about rent increases
4.39 Council tenants generally said that they received information about their rent increase by
letter, without further consultation. A couple of Councils had ‘drop-in’ sessions, though,
and several HA tenants had been invited to participate in rent consultations but only a
couple had attended (finding it interesting). Those not participating said the location or
the timing of the event had not suited them, or they had long-standing health issues. One
respondent very involved in his local HA said that his HA struggled to get more than a
handful of tenants to attend ‘rent forum’ type events.

62
4.40 Those receiving letters felt that these were clear about how much the rent would go up by
and why, justifying rent increases through increased costs or outlining service charges. A
few said that the letters say ‘Just pay up, or else’ rather than providing information about
what the rent pays for. Several respondents suggested that tenants didn’t have a choice
about rents ‘They give you your bill and you just have to pay it, don’t you?’ and ‘It is just
something you have to pay’.
4.41 Rent increases were described as ‘a few pounds’ a week extra each year, or £4-£5 of an
increase. Most tenants felt the rent increases were reasonable/minimal whereas a few
felt that they were not, as these increases amounted to a significant part of their income.
This impacted most on those affected by the Bedroom Tax/Benefit Cap.
“Rents go up a small amount each year. It just goes up by inflation, which is fine”
(Family, LSVT HA, South East)
“The rent went up (this year) about a pound (a week). It went up a minimum amount. It
goes up every April. You expect the rent to go up every year”. (Single, disabled,
Council, Mid Wales)
“When we were with the Council, we were paying £55 a week, and now we are paying
£87 a week six years later and it’s going up again soon” (Family, LSVT HA, North
Wales)
“It always seems to go up by more than inflation […] When we were paying full rent it
was harder to keep up, then we had to borrow money” (Family, Council, South Wales)
“They tend to put the rent up by about £2 a year, so it goes up gradually. They’ll do
that in the April and then they will put a ‘fair rent’ in with the statement saying what
they have done to the house, which they have done nothing really. […] They are
looking for my rent to go up from £92 to £105 (a week) (Older person, HA, South East)
The Welsh Government’s role
4.42 It was very uncommon for tenants to be aware about the Welsh Government’s role in rent
setting, the Target Rent Band or the uprating of rents in relation to CPI+1.5%. However,
the vast majority of tenants were positive about the Welsh Government having some
involvement in rent setting. This was felt to be important so that landlords didn’t ‘take the
Mickey’ and charge very high rents, and to ensure that standards were similar across
Wales.

63
“Well, they are our Government, so they should have some say in what goes on to try
and keep our rents fair” (Family, LSVT HA, South East)
“I think that’s quite good. In case our landlord tries charging too much.” (Young couple,
HA, North Wales)
“I know that they (the Welsh Government) have a target of what the rent can go up by.
Imagine if there was no cap – the rents would shoot up” (Older tenant, LSVT HA,
Valleys)
“I thought it was just down to the landlords. I think that is probably a good thing – but it
is just a case of whether it is enforceable or not, whether anything would happen (if a
landlord charged more than the TRB)” (Couple with older child, Council, South East)
“I think it is a good idea (limiting rent increases to CPI+1.5%) or there would be lots of
people charging too much and the rent would go up too quickly” (Family, Council, Mid
Wales).
4.43 In this respect, the views of tenants differed markedly from the views expressed by
landlords. Many landlords wanted more flexibility or even complete autonomy, in rent
setting, while tenants across Wales were keen to see the Welsh Government have a role
in overseeing rent increases to ensure that rents remain affordable for tenants.
4.44 Some tenants who were affected by welfare reform were very negative about the role of
the Welsh Government, or the unfairness of the ‘system’ generally. This reflected a
common lack of understanding that the UK Government and not the Welsh Government
decides welfare policy:
“They (the Welsh Government) don’t care – they all live in their big houses and they
don’t care about us” (Single older tenant affected by Bedroom Tax, HA, South East)
“This Universal Payment is messing everything up. Everybody goes onto one payment
and the Social are taking 8-12 weeks to transfer them and they are going without rent
and everything” (Older tenant, HA, South East)
4.45 On the issue of rents increasing by CPI + 1.5%, several tenants expressed the view that
costs of rents, Council Tax, buses, food shopping etc. were all going up at a faster rate
than wages or benefits, so affordability was a concern (particularly for those on benefits).
“Also, I think we should consider that the prices increase but the incomes stay the
same, so people find it difficult” (Family, affected by Benefit Cap, Council, South East)

64
“Other things, like wages, are not going up. If you get any benefits, or anything –
they’ve been stagnant and there have been caps on certain wages, like the police and
nurses. So, it seems across the board that wages and benefits have not gone up but
the rents and things have. It’s marginalising, if you know what I mean? So, we’re
worse off at the end of the day”. (Family, Council, North Wales)
4.46 One tenant felt that the additional £2 charge should not be encouraged for those rents at
the lower end of the TRB and that it should be CPI+1.5% everywhere. Another
respondent voiced some cynicism about the research – whether the Welsh Government
had plans to ‘average us all out and have us paying the same’.
4.47 The views of tenants were generally to limit the extent of the rent increase as much as
possible, given the low rate of increase of incomes. This may be at odds with the views of
many landlords, who were hoping for the rent uplift of CPI + 1.5% to continue to enable
investment and to support development.
What rent pays for
4.48 When asked what they think their rent pays for, most tenants discussed repairs,
improvements and maintenance of the stock, as well as estate management – ‘keeping
up standards’. It was far less common for tenants to talk about the costs of running the
business, although some did mention staff wages and covering costs. In this respect, the
views of tenants are very different from those of landlords, who see business viability as
critical to rent policy (and flexibility in rent setting key to this).
4.49 Only a small number of tenants identified investing in future housing as what rents pay
for. One tenant said that the rent probably contributes to new building but did not support
this. This is an interesting perspective, with rent seen as almost like a mortgage, with the
rent paid for the individual property occupied rather than for the common good.
“Well, it pays for the roof over our heads – this house. What else? It probably goes
towards building new houses, flats etc. but I don’t agree with this, why should our rent
be paying for this, I don’t understand it”. (Older couple, HA, North Wales)
4.50 When prompted, tenants discussed local new-build properties (which varied from none to
‘not enough’ to lots). The need for more family-sized housing was identified by those who
were overcrowded.
4.51 Tenants were not always aware of what share of new building was social housing. There
was a perception that most new-build properties were HA rather than Council properties,
although a few Council tenants said their Council were building. In rural areas nearer to

65
England, there was felt to be pressure on affordable housing from higher income people
from higher value areas of England.
4.52 Tenants were more likely to think of rents as paying for the upkeep of the current
property, while landlords were looking longer-term to the viability of the business and the
ability to provide more affordable housing for those in need. This inevitably means there
is a tension between tenants wanting very modest rent increases while some landlords
see a need for rents that reflect the demands put on the sector.
Tenants views on affordability
4.53 There were a range of views on the likely affordability of rents, in different scenarios.
Some people felt that rents were reasonable and affordable across the board, particularly
those who made comparisons with private renting.
“Most working families could afford what we pay each month” (Family, LSVT HA,
South East)
“It’s quite alright, actually. We manage fine to pay the rent and have a little left at the
end of the month to do something nice with the family” (Family, Council, Mid Wales)
4.54 Some felt that working families were likely to find rents affordable if two people were
working but changes to Child Tax Credit have an impact, with some people ending up
‘working for nothing’.
4.55 Others felt that on a modest wage (e.g. minimum wage), even with two people working a
family would struggle with rent, Council Tax and childcare costs etc.
“It is not very easy to afford as I’m not working. When I am back at work it should be
easier” (Family, HA, North Wales)
“I think they (the rents) are alright as long as the wages are alright. It depends what
your job is” (Family, LSVT HA, South East)
4.56 Rents, alongside other family expenses, including childcare costs, pose challenging for
those on modest incomes, with wages not felt to be increasing at the same rate as costs.
4.57 On the one hand, people expressed the view that pensioners should get help with their
rent, but examples were given of pensioners struggling because their works pension took
them over the Housing Benefit threshold and they paid full rent.
“I’d say for pensioners, like me, yes, it’s affordable. I manage OK. I wouldn’t be able to
afford the private rent for a two bed - £115 a week. No way!” (Older person, HA, North
Wales)

66
4.58 Single people on the minimum wage were felt most likely to struggle from just having the
one income. Again, having all of the costs of running the home alongside the rent was
discussed - ‘I do feel sorry for young people nowadays’. This was identified as a
disincentive for young people – ‘that’s why a lot of them don’t want to work’.
“I would have thought they’d find it difficult with just one income coming in” (Family,
Council, Mid Wales)
“If you lived on one wage… a single person would struggle. Everything is going up.
Council Tax, Water, Gas, Electric, Food… all the major bills” (Family, LSVT HA, South
East)
4.59 By and large, tenants did not consider affordability in relation to household costs and
outgoings but rather in terms of the level of income of the household. So, households
with a single income source were felt to be more likely to have affordability issues. This is
explored more in the affordability section below, which considers residual incomes and
household size.
4.60 Affordability was also a key issue for those on benefits – with the Bedroom Tax, Benefit
Cap and Universal Credit identified as critical issues, as well as changes to disability
benefits and conditionality/fitness for work tests that effectively reduce disabled people’s
incomes.
“The Bedroom Tax – I want to mention it. It’s awful. Because there are only two of us
in the house, I have to pay an extra £20, as it’s a three-bed house”. (Family, LSVT HA,
North Wales)
Conclusions
4.61 The conclusions are grouped below under the main research questions explore in the
work with tenants.
Tenant awareness, understanding and attitudes towards Welsh government rent review
proposals –
Tenant awareness about the Welsh Government’s role in rent policy in Wales is
patchy, but tenants were still able to take a view about what they thought was
important in setting rents.
Although tenants agreed that property size (or space, like gardens etc.) should
drive rents, there was a lack of consensus about how to take account of property
type, location and age in rent setting.

67
On the issue of property condition and energy efficiency, there was support for a
minimum standard rather than rent reductions for tenants with poorer quality
homes or less efficient heating.
Tenants generally wanted to see modest rent increases in future, with ongoing
concerns about the cost of living.
Views on impacts of rent policy changes on affordability:
Although tenants most commonly felt that their rents were ‘reasonable’, alongside
property size, affordability for tenants was viewed as among the most important
factors in deciding rents.
Some tenants struggled with rents, particularly where there was a sole earner in
the household, their benefits were capped or they were subject to the Bedroom
Tax. The increase in rents (and other household costs) alongside limited wage
and benefit increases was highlighted as a concern for affordability.
There were concerns expressed about the impact of welfare reform on rent
affordability, with a lack of understanding about the role of the Welsh Government
in welfare reform.
How and why these views were held according to the circumstances of the tenants:
There was a considerable level of agreement among tenants about rent setting
and affordability. Tenants in properties where landlords were felt to have not
resolved problems of property condition were more critical about rent increases,
though.
Tenants were generally positive about the value for money of their rent, though
some experienced very poor quality housing or poor service, particularly relating to
larger repairs. Council tenants tended to be more negative than HA tenants, with
the few tenants involved in consultation on rents being HA tenants.
Tenants in urban areas commonly viewed rents as ‘reasonable’ in comparison to
the rents charged in private renting. However, these tenants still wanted to see a
role for the Welsh Government in encouraging restraint around rent increases.
Tenants adversely affected by welfare reform were most negative about the rent
policy and the Welsh Government, despite decisions about benefits being made
by the UK Government.

68
How the views of tenants compare with those of landlords
Tenants strongly supported the role of the Welsh Government in rent policy, with
concerns that without involvement that rents might increase disproportionately.
Most tenants did not have a full appreciation of what rents paid for, linking rents to
maintenance and improvement but less to investment or costs. Although repairs
and improvements may be worth paying more for, there was felt to be a need for a
basic, minimum standard of property condition and energy efficiency.
Tenants were less focused on future investment or the sustainability of the sector
compared with landlords. A few tenants highlighted concerns about the supply of
housing for homeless households or families but the role of rents in maintaining
the viability of the sector in future was a concern for landlords rather than tenants.

69
5. Case studies and stakeholder interviews
Introduction
5.1 This chapter provides discussion offering greater granularity around the issues of rent
policy. It is based on telephone interviews with nine housing organisations and six
representative bodies.
5.2 The purpose of the case studies was to allow more detailed insights into the impacts of
rent policies on a sample of landlords that together broadly covered the spectrum in
Wales. It allowed us to pursue issues in greater depth and to bring these out to enrich the
study and make it better informed.
5.3 The Case Studies were put in place to help develop a better understanding of the wider
context around Rent Policy:
How does the rent policy impact upon the valuation of social landlord’s housing
stock and their borrowing ability? To what extent does this impact upon the ability
of social landlords to deliver on their business plan commitments?
Taking into consideration rents, service charges and Local Housing Allowance
rates, to what extent is there capacity or the ability for social landlords to deliver
social, intermediate and market rented housing across all local authority
areas/BMRAs in Wales?
To what extent does the rent policy impact on social landlords’ ability to deliver
Welsh Government policies particularly where there are different economic or
housing market areas?
5.4 The case studies were conducted by telephone using a semi-structured questionnaire
which was pre-circulated to participants to allow them time to prepare for the discussion.
Where requested, the interviews were carried out in Welsh through a qualified and
accredited translator.
The Findings
5.5 In this section, we report back on the findings thematically based on the headings in the
schedule of questions. Within each theme, the analysis is generally presented for each
type of organisation separately. Issues specific to areas/types of organisations are also
identified. We then conclude by returning to the specific research questions. The
schedule of questions can be found in Appendix B.

70
Background issues raised by landlords
5.6 Interviewees were given the opportunity to highlight any special background housing
issues about their organisation. Issues raised by the organisations, along with a brief
description of organisation characteristics are noted below.
5.7 The three local authorities were in different parts of Wales. All had substantial stock
though very little or indeed none of it was built post 1990. However, there is an
expectation that house building activity will resume in all three authorities. In all cases
they were the largest landlord in the locality. Two were urban authorities and one was
rural. Two of the three had achieved WHQS for all of their stock (subject to acceptable
fails) and the third was making good progress towards it.
5.8 In terms of the associations, the LSVTs were at either end of the rent spectrum –
high/low rents and both were relatively young as organisations. Both highlighted that they
had vulnerable groups of tenants – low incomes, older and younger people and either
poor quality stock or lack of smaller homes. Welfare reform was a threat to both. For
different reasons, both have slipped towards the bottom of the rent bands.
5.9 Traditional non-LSVT associations, were made up of three groups plus a stand-alone
association that had undergone some recent changes. One group highlighted the high
number of small homes, the second its desire to have rent freedom given the proposed
Local Housing Allowance cap (now withdrawn) while the third noted low market rents in
their area and the high percent of tenants not on benefits relative to other associations.
The stand-alone association, which operates principally in rural areas, was now WHQS
compliant, although like others associations interviewed it had quite a few ‘acceptable
fails’ which it intended to reduce over the next few years. Rents were reported to be
mostly 20-25% below local private rents, although there were likely to be exceptions in
low demand areas. A relatively low proportion of the association’s tenants were on
benefits. The introduction of the ‘bedroom tax’ had been managed and its impact on the
association and tenants had been minimised. All associations were concerned about
Universal Credit, which was expected to result in the doubling of rent losses to around
4% of rental income. The now withdrawn proposal to limit eligible rents to Local Housing
Allowance levels was also a source of concern.
Implementing the Rent Policy
71
5.10 This section relates to questions 2-5 in the schedule. Interviewees were asked to outline
their current rent policy, their experience of transitioning to the Welsh Government’s Rent
Policy, progress towards de-pooling service charges, and whether they considered that
there were alternatives to using SAP ratings as a proxy for quality.
5.11 Two of the three local authorities had adopted the rent matrix though one of these did not
include the SAP rating measure (it had previously used floor area and may use SAP
rating for new homes – the authority was close to being compliant with WHQS and felt it
could set aside the SAP issue at present) and the other still has a high proportion of
homes below target rent levels. The third used its own model linked to housing benefit
plus a charge per bedroom/by type of property. Vacancy is the typical trigger for moving
an individual property to target.
5.12 The location measure was also a problem – the logic of paying more for better areas was
accepted but then the question of who defines better has to be addressed. Others were
more concerned that its effects could be regressive, forcing lower rents in low demand
areas which it was felt added to the downward spiral. One felt SAP was less of an issue
after WHQS was achieved. On rents, one commented that applying the flat rate increase
of £2 did mean that it was proportionately a bigger increase for cheaper/smaller homes.
5.13 On service charges, progress towards de-pooling was being achieved and in one case it
was suggested it had been completed. However, as this was often done on change of
tenancy the progress could be slow. Another commented that it wasn’t planning to de-
pool grounds maintenance of common areas as this would be too difficult/too costly.
5.14 Of the housing associations, one LSVT had applied the policy (freezing rents on homes
above target) the other hadn’t though its rents were aligned to conform to the TRB and it
used the formula for annual adjustment. This LSVT association was content that their
income was aligned with the business plan and felt it gave them an internal discipline to
manage costs. Of the traditional housing associations, the stand alone association was
moving from guideline to WG rent policy though concerned about how the now withdrawn
Local Housing Allowance policy would impact given its rents were slightly high. Of the
three groups, none had adopted the policy though all were closely aligned. There was
seen to be no particular advantage of using it and their own policies gave them added
flexibility. Indeed, one issue to emerge strongly from the case studies and other research
was this question of flexibility even if it was using your own policy within the government’s
TRBs it was seen as very important by all case study respondents. Two associations still
used the old Welsh Government benchmark rent framework. Both had intended to

72
develop a new rent setting policy, but this had been postponed until the outcome of the
Welsh Government’s present review was known.
5.15 One association commented at length on the problems posed by TRBs and the
constraints on putting up rents (£2 per week increase beyond CPI plus 1.5%) given the
overall envelope and the application of local indices in single local authorities.
5.16 On a wider front, there was widespread dissatisfaction with the rent settlement process –
it was seen as too late in the financial year and surrounded by too much uncertainty. This
in turn encourages associations to maximise where they can and when they can which
partly runs in the face of the overall intention, a point that emerged strongly in the wider
survey data.
5.17 On de-pooling a number of organisations had always kept rents and service charges
separate. Others had completed the de-pooling process while a third group were in the
process of doing this though the timescales over which it was to be accomplished varied
and were not always clear. However, all accepted the logic of such a move and the
greater clarity it introduced.
5.18 On SAP ratings there was considerable debate. It was seen as a narrow measure and
encouraged associations to focus on improving the SAP rating rather than other aspects
of quality. There was the issue of defined ‘acceptable fails’ inside WHQS and whether
that should be taken into account. Other alternatives canvassed were using age of the
property and WHQS compliance in general. All were really agreeing this was a complex
area but one which needed revisiting.
Impacts of rent policy
5.19 This section refers to the questions 6-13 in the interview schedule. These questions were
designed to capture the impact of the rent policy on issues including the local labour
market rent arrears, demand for property, fairness of rents between properties and
locations, borrowing capacity and investment.
5.20 The local authorities saw no particular tension around housing and labour markets given
that the rent policy was adjusted for local conditions. However, in one area with above
average high house prices and below average wages did mean there were limits as to
what could be done regarding rents. The association which had not adopted the policy
believed that there was little deliberate relationship with the local housing or labour
markets, although there might be an indirect relationship since rents were largely within
the target bands.

73
5.21 In most but not all cases, arrears have been increasing though it is not always clear what
has driven this. Clearly there were concerns that Universal Credit would make matters
worse. Some tenants were taking in lodgers, and others were downsizing to help to pay
the rent.
5.22 In terms of negative impacts upon specific groups one local authority highlighted the
young, the old and the disabled in smaller properties while another flagged up more
positively that it was felt by tenants that there was a better structure to rents even though
location was not reflected.
5.23 It was clear from two of the authorities that the rent policy had given them more capacity
to build new homes and improve existing ones. Authorities had bought back right to buy
properties and one had expanded its welfare support functions.
5.24 Rent policy had generally helped in terms of valuations and borrowing power had
increased. However, there was a cap in place and although talks were underway
regarding pooling such borrowing capacity this was unresolved at the time of the
interviews. It was also the case that where an authority was close to the top of the rent
band this would be a problem.
5.25 For the stock transfer associations one expressed concern that rent policy metrics failed
adequately to take into account high priced areas with low wages and the impacts this
would have on tenants. This was partly a data problem which it was hoped the review
could unpick. In the other LSVT its large stock meant it was able to bring downward
pressure on PRS rents. The target rent for specific types of property were close to Local
Housing Allowance rates and the LSVT’s rents were aligned with JRF living rent
standards.
5.26 Both LSVTs agreed that to date the policy had not driven arrears but that welfare reform
would and UC was already biting in some areas. Both were undertaking checks on
financial viability given the planned regime and trying to work out strategies to ensure
viability and at the same time support tenants. Neither thought there had been any
impact on lettings/departures. One suggested there might be impacts of the Local
Housing Allowance cap on specific types of properties. Neither were of the view that the
policy impacted disproportionately on any specific group and both wanted more flexibility
so they can make adjustments within the overall envelope, e.g., in more remote areas or
where stock was expensive to maintain.

74
5.27 In terms of development, rent policy has been a positive allowing both LSVT
organisations to deliver more on WHQS and supply. One highlighted the need to keep
increases above CPI plus 0.5%. One was clear it had also helped in terms of borrowing
power though it emphasises this was in conjunction with cost control
5.28 Of the four traditional associations the interaction with housing and labour markets was
an issue with the suggestion from one that the policy impeded local flexibility, not least
because of the damping mechanism applied. There was general agreement that the
policy was having little or no impact on arrears or on movements into and out of
tenancies. In terms of fairness there was no great concern that rent policy made that
worse albeit that if organisations tried to take full advantage of the policy they might
amplify differentials. All stressed the need for balance.
5.29 The impacts on development for these associations were often more to do with the
potential impact of welfare reform than rents. Indeed, the Rent Policy has in some cases
stimulated development in lower rent areas. However, one landlord reported that
because development costs were relatively even geographically, it was not viable to build
in some low demand areas as they could not charge sufficiently high rents. For this
landlord flats were seen as being more viable as the cost of building was lower than for
other forms, notably bungalows which were not viable financially despite being in high
demand. Another association argued that rent policy was too inflexible and did not
compensate for cost differentials in development. In terms of finances rent policy was
seen as positive by three of the four in that Wales got a good deal and organisations
have some flexibility. The fourth felt it had constrained increases and weakened cash
flows.
5.30 Finally, with respect to other issues it was suggested that the rent policy was only under
review because of welfare reform even though it was agreed it did need tweaking.
Another mentioned land supply and for the need for the Welsh Government to release
more public land.
The Case for Reform
5.31 This section refers to questions 14-17 in the interview schedule. These relate to
identifying the strengths and weaknesses of the rent policy, and to identify any ideas for
overcoming any weaknesses.
5.32 All the local authorities liked the long-term nature of the policy because it gave certainty
and transparency and allows for the development of their business plans. One noted it

75
was much easier to operate under a Welsh Government policy in this area than having to
justify their own stance. One highlighted the fact that if there were no rent policy and it
was managed via the Local Housing Allowance cap then the authority could put up its
rents quite substantially. In general, the scheme was seen as fair and could be explained
to tenants. However, all were concerned about the lack of flexibility and constraints of
staying within the envelope; this meant they had been unable to make the full range of
desirable adjustments.
5.33 There were a number of suggested reforms. First, that DWP and the Welsh Government
should resolve whether it was more important to build more homes or keep the welfare
bill down. Second, it was noted a number of authorities were close to breaching their rent
rebate subsidy limitation cap12 and if all rents were at target there would be a breach,
especially if service charges were taken into account. Third, the £2 flat rate increase
discriminated against smaller units and should be expressed as a % of the rent. Fourth,
further debate on shared accommodation was overdue and finally all wanted earlier
notification of changes along with a long-term strategy. It was clear welfare reform was
the big issue. There were some positive views on the ways the rent policy had been
implemented.
5.34 The LSVT associations echoed some of this. They felt the policy was relatively simple
and transparent and they liked the central direction. However, there were deemed to be
flaws in the metrics and the tensions between the rent bands and the policy rent process.
One argued there should be no negative consequences if you fall out of the band but
remain with a justifiable policy position. The other suggested that the calculation of target
rents, taking into account earnings and prices, very much limited the headroom for rent
rises in low demand areas despite the fact that all organisations had similar cost bases.
5.35 In terms of reforms, one pointed to the case for higher grant rates in areas where market
rents and social rents are uncomfortably close. Both argued for local/regional flexibilities
so that rents could be fine-tuned to a greater degree. There was some debate on the
Local Housing Allowance and whether it was soundly calculated in areas with little data.
One suggestion was that there should be a link between numbers of tenants on target
rents which are higher than Local Housing Allowance in terms of the distribution of DHP
12 When an LA increases its average weekly rent above a limit set by the Welsh Government, it will only receive subsidy on rebates up to the limit and will have to fund the cost of additional rebates above the limit rent itself (through the rents of tenants not in receipt of rebates).

76
– subject to having demonstrated VFM. Another suggestion was that the distribution of
Local Housing Allowance caps was too wide and should be shrunk with adjustments at
the top and the bottom. Linking rents to Local Housing Allowance levels was seen as a
potential disaster. Both were planning for the future taking into account Local Housing
Allowance albeit staying with the rent policy guidelines.
5.36 For the most part the traditional associations recognised that the policy brought
consistency, was easy to operate and offered a degree of flexibility. All wanted more
flexibility and freedom (with responsibility) so that rents could be better adjusted to local
circumstances. One wanted the rent policy removed and two others asked the question
that given Local Housing Allowance did they need a rent policy? The fourth wanted the
policy to be in place for a reasonable term The organisations wanted freedom to manage
rents across areas and to be controlled via investment requirements, Local Housing
Allowance and overall regulation. The combination of the then proposed Local Housing
Allowance caps in areas of low values and low quality and the limits on benefits that flow
from that put associations in very difficult positions in terms of the rents they set. One
association was planning to increase rents in higher Local Housing Allowance areas and
keep them down elsewhere while at the same time looking to see how it might reduce
service charges and pass more responsibility to residents.
5.37 All wanted more certainty about what the policy will be in medium term, especially on up-
rating, and all complained about the late notice typically December for implementation in
April and with consultation required.
5.38 An association argued that while they can reduce rents by more than £2 they can’t
increase them faster than that. This limits the speed with which change can come
through the system. Similarly, previous policy pushed up rents above Local Housing
Allowance giving little room for manoeuvre now - requiring organisations to shrink their
cost base to get inside the TRB.
5.39 Specifically, it was argued that locational indices should not change annually, the £2 a
week should be more flexible, there should be re-reconsideration of the dampener which
means rents can be out of line with local markets and bungalows should be added in
(though they are already in the scheme but perhaps less explicitly than landlords
recognise?). One association argued that uprating policy should be fixed for a
‘reasonable term’ – for example for five years to allow for financial planning.

77
Conclusions
5.40 It is evident from these case studies how varied the operating context is between
landlords and by type of landlord. Here we have separated out local authorities, stock
transfer associations and traditional associations because it became evident that though
there were some similarities, not least in terms of what they wanted in the future, some
striking differences risked being downplayed if they were dealt with as a group together.
5.41 The case studies were driven by the three research questions. It is evident from the
responses reported on above that the answers to these questions gives a very mixed
picture. Our conclusions are grouped in relation to each of these three questions.
Question 1: How does the rent policy impact upon the valuation of social landlord’s
housing stock and their borrowing ability? To what extent does this impact upon the
ability of social landlords to deliver on their business plan commitments?
5.42 On the first the general sense is that valuations have been maintained and even in some
cases improved. Local authorities were clearly able to deliver on business plans and this
was largely the case for associations but there were some clear tensions around the
combinations of Local Housing Allowance, local market situations and the potential for
charging rents that reflected local reality. All landlords had taken advantage of the annual
uplift in rents albeit in some cases there were limits in how it might be applied. The policy
had been devised to ensure it did not put viability at risk and that had been achieved.
However as was evident from the case studies this is not to say there weren’t views as to
negative aspects of the policy and ways it might be improved
Question 2: Taking into consideration rents, service charges and Local Housing
Allowance rates, to what extent is there capacity or the ability for social landlords to
deliver social, intermediate and market rented housing across all local authority
areas/BMRAs in Wales?
5.43 On the second it was less clear though most would say they were able to deliver the
supply planned. It was more a case of they could do more if rent policy was more flexible.
Some recognised the tensions between increased development capacity and the
somewhat lagged capacity of tenants to pay higher rents. There was little discussion of
intermediate and market rent housing though we know from elsewhere that the planned
cross subsidy was important. Again, this reflected a timing issue that landlords were
more concerned about the social housing sector given planned welfare reforms.

78
Question 3: To what extent does the rent policy impact on social landlord’s ability to
deliver Welsh Government policies particularly where there are different economic or
housing market areas?
5.44 In general, there was no evidence to suggest the policy was blocking the delivery on
policies such as the WHQS. Clearly higher rents would allow quicker progress but
landlords recognised the need to balance off competing objectives. However, on the
wider policy agenda around local economies and housing markets it was less clear.
Though landlords were alert to rents and their consequences for local residents it was
difficult to determine a great sense of efforts to interweave these with an understanding
of local economies and markets. There was some comment on the lack of alignment in
specific areas but generally it did not feel as though landlords had strong intelligence on
the local context and were content to apply the policy without that detailed information
relying instead on their own feedback mechanisms via tenants. No doubt this would be
less true with respect to intermediate and market products where such engagement is
absolutely necessary.
Stakeholder Interviews
5.45 Six interviews were undertaken with national stakeholders representing or with
knowledge of social landlords, local authorities, tenants, regulation and finance. The
purpose of these interviews was twofold:
To identify and assess the impact of external influences on social landlords.
To inform any recommendations about the future of rent policy.
Equalities Act
5.46 The Equalities Act 2010 obliges social landlords to ensure that their rent policy (which is
a public function) does not discriminate. We asked the stakeholders whether this should
be reflected in national rent policy, or whether it should be left to individual landlords.
5.47 There were varying degrees of awareness of the Act among the stakeholders, and most
sectors had clearly not treated it as being a priority issue but rather absorbed it as part of
the operating environment. Nonetheless, there was complete agreement that it should be
taken seriously, none of the stakeholders suggested that the rent policy should be used
as a means of securing its objectives, and none suggested that the regulator should take
the lead on compliance either. Nonetheless, one stakeholder noted that the national rent
policy would, in any case, be subject to an equalities impact assessment.

79
5.48 Most respondents believed that responsibility should lie primarily with social landlords
themselves, one noting that they have to comply with the law anyway, and another that
equalities should be ‘in their DNA’. Several stakeholders suggested that transparency in
rent setting was important for providing reassurance to tenants that the system was
consistent.
5.49 Two respondents pointed to Tai Pawb, a charity, which accredits social landlords with a
Quality in Equality & Diversity (QED) watermark. This does not in itself guarantee that
equalities objectives are being met, but signals that procedures exist that seek to ensure
that they are. The two-stage process costs members £4,812 and non-members £6,255
and accreditation lasts for three years.
Welfare reform
5.50 Welfare reform is an on-going concern among stakeholders and seen as being of great
importance to the sector’s ability to meet Welsh Government housing investment targets
relating to new build and the WHQS.
5.51 Almost all of the interviews were conducted before the UK Government announced that it
no longer intended to extend the limitation on eligible rents for Housing Benefit/ Universal
Credit purposes that currently applies to the private rented sector, i.e. 30% of median
market rents in the Broad Housing Market Area.
5.52 However, it is worth recording responses, not least because one national stakeholder
who was interviewed after the announcement indicated that many people in the social
housing sector believed that it was ‘too good to be true’ and might well resurface in
another form.
5.53 The policy was variously described as having been likely to have ‘dismal’ and ‘very
extensive’ impact which would ‘put supply of housing at risk’, increase homelessness. As
is well known, its impact would have been uneven, being ‘difficult for some and
particularly difficult for others.’ It would affect low demand/ cost areas and smaller
properties the most. It was noted that it is the one bed properties for which there is a
particular need. The application of LHA limits on eligible rents would have brought with
them the extension of the Shared Accommodation Rate to single social tenants aged
under 35. This would have caused serious problems. Developing sharing schemes is one
option that was under consideration by some landlords, although the difficulties in getting
people who are unrelated and unknown to one another to share successfully would have

80
created (and indeed does create) legal and management problems. Making such
schemes consistent with allocations policy was a further challenge.
5.54 Stakeholders suggested that preparedness in the sector varied greatly. Some landlords
had conducted stress tests and begun to explore ways of mitigating its impacts through
measures such as shared accommodation, and encouraging tenants to build up savings
in advance of its implementation. One stakeholder suggested that landlords would be
able to restructure rents by reducing them on smaller properties which are close to or
above the proposed cap, and raising them on larger properties which are below it.
5.55 Other aspects of welfare reform remain a concern. The policy to end to ‘automatic’
entitlement for 18-21 year olds was described as being ‘potentially catastrophic for young
people’, although the exemptions were ‘good and positive’. However, the likely impact on
the sector was judged to be relatively small because the measure would affect relatively
few social tenants. In any case, this policy has now been withdrawn.
5.56 The roll out of Universal Credit is another concern, as the evidence suggests that where
it has been introduced (in four Welsh local authority areas at the tie the research was
undertaken) it has led to a rise in arrears. Both the six-week (now reduced to five) delay
and the default position of paying housing assistance directly to tenants were seen to be
the problem. Two stakeholders noted that the Scottish Government had used its powers
to retain payment directly to the landlord. The Welsh Government does not have the
power to do this, and one stakeholder expressed surprise that it had not been more vocal
lobbying to be granted a similar power. As it stands the switch to Universal Credit across
Wales in 2018 was expected to create uncertainty and limit landlords’ borrowing capacity.
5.57 There were mixed views on whether welfare reform would inhibit the ability of social
landlords to deliver on WHQS and new build targets, with most stakeholders who had an
opinion tending to hedge their bets. One reason for their reticence is that it is difficult to
assess the impact of welfare reform separately from other factors such as the policy on
increasing rents and, in the case of local authorities, the borrowing cap.13
Rent policy in England and rent increases in Wales
13 The UK Government announced in the Autumn Budget 2018 that the borrowing cap is being lifted in England and Wales. The Welsh Government is working with LHAs to terminate HRAS Voluntary Agreements which were used to set the borrowing cap for each Welsh LHA.

81
5.58 The policy in England requiring social landlords to reduce rents by 1% per year was a
source of concern. Due to its possible effect on the Welsh block grant some stakeholders
had been concerned that it would mean that the Welsh Government would feel obliged to
limit increases, so undermining borrowing capacity. The UK Government’s
announcement that the rent reduction policy will end in 2020 was, according to a
stakeholder interviewed after the announcement, ‘really welcome’.
5.59 Most stakeholders raised the tensions between the beneficial effect on borrowing
capacity arising from increasing rents and its deleterious impact on affordability for many
tenants. The emphasis varied between type of landlord and the areas in which they
operated. Large landlords providing a range of ‘products’ through active development
plans would be likely to favour rent increases more than smaller landlords without large
development plans and operating in areas with high levels of poverty. One stakeholder
suggested that housing associations should cease to ‘celebrate’ rent rises and should
instead focus more on their cost bases, and asking themselves whether they were
delivering value for money. More than one stakeholder questioned the sustainability of
the CPI + 1.5% policy for rent increases when CPI had risen (to 3%) whilst wages were
stagnating or falling.
Other external factors
5.60 Other external factors raised by at least one stakeholder included:
Impact of Brexit on the economy and the environment in which lenders were willing
to lend
The likely loss of finance for housing from the European Investment Bank
Labour market change, in particular the shift towards zero-hour contracts and the
‘gig’ economy
Demographic change, including shrinking and ageing populations in many areas
Pension costs, particularly in LSVT landlords which still mostly operate within the
local government scheme
Local government reform
The decline in tenant incomes.
82
Fairness and future of rent policy
5.61 The rent policy relating to rent structures was regarded by most – but not all –
stakeholders as having strengths, including transparency, consistency and fairness, all of
which are valued by tenants. Interestingly, one stakeholder suggested that some local
authority tenants welcomed the increase of their rents relative to housing associations
because they had felt like the ‘poor relations’ in the social housing family, and would
receive inferior services as a result. However, another stakeholder thought that very few
tenants were aware of the rent policy. On the other hand, another stakeholder suggested
that same tendency meant that the policy was ‘unfair to all [local authorities]’.
5.62 The rent policy was in some senses seen as convenient. It allowed landlords to ‘blame’
rent issues on the Welsh Government and to a degree avoid blame themselves. One
commentator suggested that there were real tensions between increased development
capacity flowing out of broadly increasing rents and the underlying impoverishment of
tenants as lower wage inflation and welfare reforms took them in the opposite trajectory.
This led to a call for a new Essex review with rent policy being seen in its wider context. .
5.63 The following reforms were suggested by at least one stakeholder:
The rent policy is insufficiently flexible.
SAP ratings are a poor indicator of quality (although the opposite view was also
expressed).
The Welsh Government should consider revising the Welsh Housing Quality
Standard as the current one ends in 2020.
Affordability should to be built into the model and there should be a greater
concern for Value for Money.
There should be a new review of rent policy from first principles.

83
6. Affordability of Welsh matrix rents
6.1 This chapter provides an assessment of the affordability of the Welsh Matrix rents that
provide the framework against which social landlords in Wales must set their own local
rent policies.
6.2 Affordability is a complex issue, especially in the context of the HB system, and there is
no consensus on how to define an affordable rent. This chapter reports on analysis that
utilised three indicators:
Rent to income ratios (gross rents against net income including HB)
Residual income levels (after rents over out of work Income Support levels)
Income level required to escape housing benefit dependency.
A fourth measure (net income after housing costs - AHC) was also included to aid
interpretation of the residual income measure.
6.3 A fuller discussion of affordability, and the affordability indicators, is included in Appendix
D.
6.4 The affordability analyses have been undertaken for twelve cases, based on household
type and property size:
1 Single under 25 bedsit
2 Single under 25 1 bedroom
3 Single over 25 bedsit
4 Single over 25 1 bedroom
5 Couple over 25 1 bedroom
6 Lone parent + 1 child 2 bedroom
7 Lone parent + 2 children 3 bedroom
8 Lone parent + 3 children 4 bedroom
9 Couple + 1 child 2 bedroom
10 Couple + 2 children 3 bedroom
11 Couple + 3 children 4 bedroom
12 Couple + 4 children 5 bedroom
6.5 In each case affordability has been based on two alternative household income levels.
The lower income level is based on the hypothetical scenario of one adult working full
time (40 hours per week) at the level of the minimum wage. For the year 2018/19 this is
based on the minimum wage level set in April 2018 – of £7.83 per hour (giving £295.20
for a forty-hour week). The higher income level is based on published statistics of lower
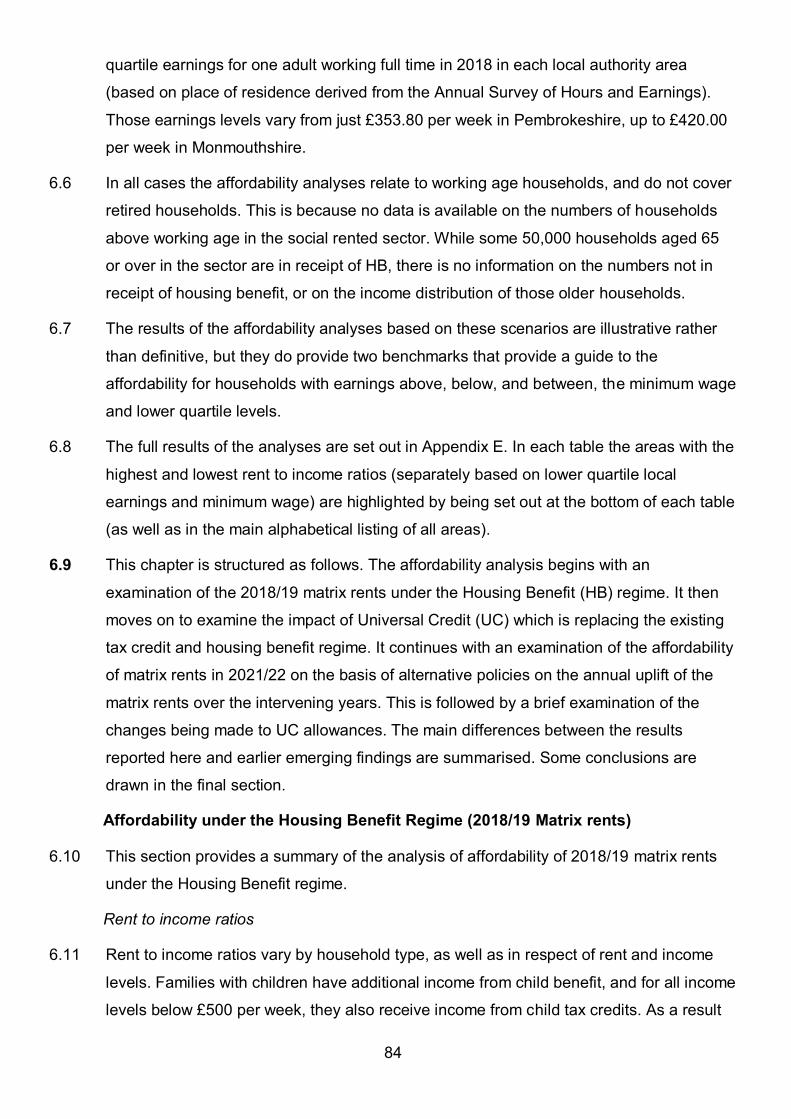
84
quartile earnings for one adult working full time in 2018 in each local authority area
(based on place of residence derived from the Annual Survey of Hours and Earnings).
Those earnings levels vary from just £353.80 per week in Pembrokeshire, up to £420.00
per week in Monmouthshire.
6.6 In all cases the affordability analyses relate to working age households, and do not cover
retired households. This is because no data is available on the numbers of households
above working age in the social rented sector. While some 50,000 households aged 65
or over in the sector are in receipt of HB, there is no information on the numbers not in
receipt of housing benefit, or on the income distribution of those older households.
6.7 The results of the affordability analyses based on these scenarios are illustrative rather
than definitive, but they do provide two benchmarks that provide a guide to the
affordability for households with earnings above, below, and between, the minimum wage
and lower quartile levels.
6.8 The full results of the analyses are set out in Appendix E. In each table the areas with the
highest and lowest rent to income ratios (separately based on lower quartile local
earnings and minimum wage) are highlighted by being set out at the bottom of each table
(as well as in the main alphabetical listing of all areas).
6.9 This chapter is structured as follows. The affordability analysis begins with an
examination of the 2018/19 matrix rents under the Housing Benefit (HB) regime. It then
moves on to examine the impact of Universal Credit (UC) which is replacing the existing
tax credit and housing benefit regime. It continues with an examination of the affordability
of matrix rents in 2021/22 on the basis of alternative policies on the annual uplift of the
matrix rents over the intervening years. This is followed by a brief examination of the
changes being made to UC allowances. The main differences between the results
reported here and earlier emerging findings are summarised. Some conclusions are
drawn in the final section.
Affordability under the Housing Benefit Regime (2018/19 Matrix rents)
6.10 This section provides a summary of the analysis of affordability of 2018/19 matrix rents
under the Housing Benefit regime.
Rent to income ratios
6.11 Rent to income ratios vary by household type, as well as in respect of rent and income
levels. Families with children have additional income from child benefit, and for all income
levels below £500 per week, they also receive income from child tax credits. As a result

85
of those higher levels of income, as well as higher levels of HB allowances, rent to
income ratios are lower for families with children, than for childless households, as can
be seen in Figures 6.1 and 6.2.
6.12 Ratios for single people and childless couples with minimum wage incomes in 1-bedroom
dwellings frequently exceed 25%; and in one case reaches 31% (single people in
Monmouthshire). In contrast in only two cases do rent to income ratios for households
with children reach 25% (lone parents with one child in Cardiff and Monmouthshire). The
ratios are lower still for larger families, and for a couple with four children and a minimum
wage income in a five-bedroom dwelling the highest ratio is 20.1% (Cardiff). As would be
expected, and as can be seen in Figure 6.2, ratios are lower for each family type for
those households with lower quartile level earnings.
6.13 Single adults aged under 25 have lower personal allowances in the HB calculation, so for
a given level of income would receive less HB than single adults aged 25 or over.
However, rent to income ratios for younger single people are identical to those for older
single people, as in none of the cases illustrated here are they eligible for HB, and thus
the lower HB allowances for younger single people have no role in determining their
incomes, and thus their rent to income ratio.
Figure 6.1: Rent to income ratios: minimum wage, 2018/19
Assumptions and source: Appendix E, Annex 1
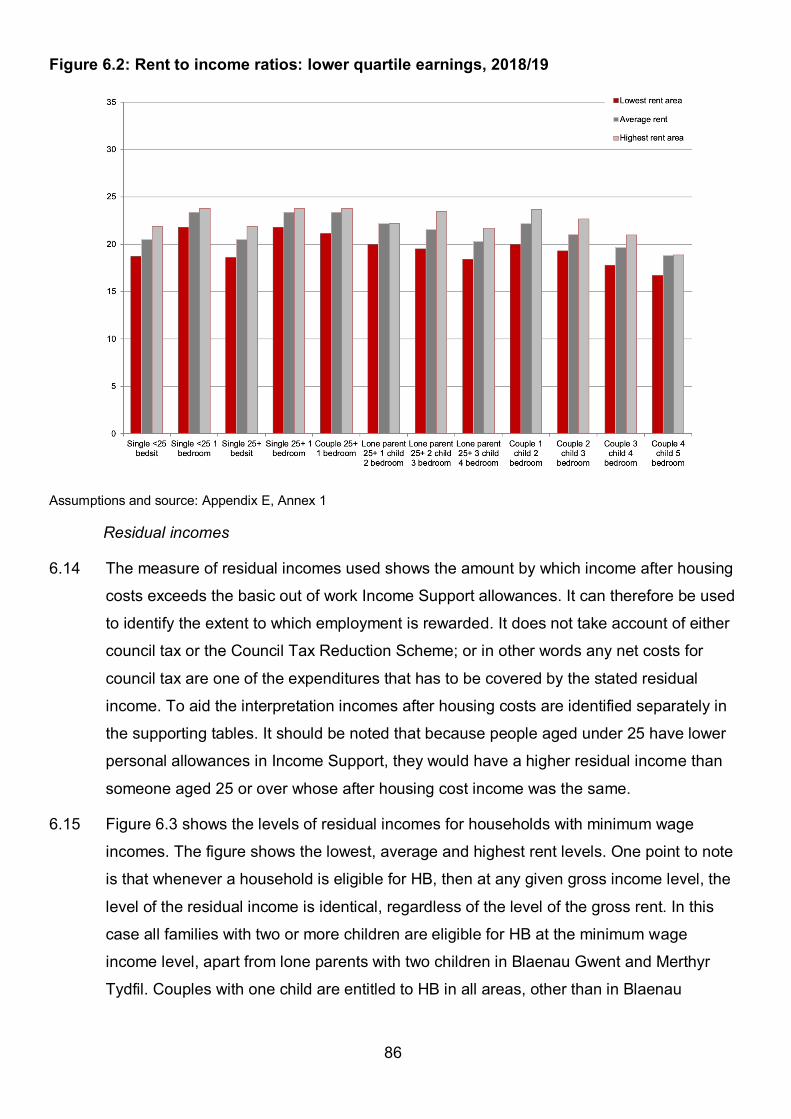
86
Figure 6.2: Rent to income ratios: lower quartile earnings, 2018/19
Assumptions and source: Appendix E, Annex 1
Residual incomes
6.14 The measure of residual incomes used shows the amount by which income after housing
costs exceeds the basic out of work Income Support allowances. It can therefore be used
to identify the extent to which employment is rewarded. It does not take account of either
council tax or the Council Tax Reduction Scheme; or in other words any net costs for
council tax are one of the expenditures that has to be covered by the stated residual
income. To aid the interpretation incomes after housing costs are identified separately in
the supporting tables. It should be noted that because people aged under 25 have lower
personal allowances in Income Support, they would have a higher residual income than
someone aged 25 or over whose after housing cost income was the same.
6.15 Figure 6.3 shows the levels of residual incomes for households with minimum wage
incomes. The figure shows the lowest, average and highest rent levels. One point to note
is that whenever a household is eligible for HB, then at any given gross income level, the
level of the residual income is identical, regardless of the level of the gross rent. In this
case all families with two or more children are eligible for HB at the minimum wage
income level, apart from lone parents with two children in Blaenau Gwent and Merthyr
Tydfil. Couples with one child are entitled to HB in all areas, other than in Blaenau

87
Gwent, Merthyr Tydfil, Neath Port Talbot and Rhondda Cynon Taf (where the two-
bedroom matrix rents are between £4.53 and £9.40 below the Welsh average).
6.16 Residual incomes for younger single people (see Appendix E, Annex 1) are higher than
those for older single people as, while their after housing cost incomes are identical.
Consequently, the gap between their in- and- out of work incomes is greater. Similarly,
the residual incomes for lone parents are higher than those for couples with children, as
the Income Support allowances for lone parents are lower than those for couples, so
again the gap between their in- and out- of work incomes is greater.
Figure 6.3: Residual incomes: minimum wage, 2018/19
Assumptions and source: Appendix E, Annex 1
6.17 For single people and lone parents’ residual incomes (at minimum wage earnings levels)
are always more than £100 above income support levels. While this is also the case for
couples with three or more children, residual incomes are somewhat lower than £100 for
childless couples (in seven areas), and for couples with one child (in all areas). For
couples with one child residual incomes are £93.02 per week above income support
levels (except in the four areas where they are not eligible for HB where they are
between £0.94 and £5.82 higher). For couples with two children residual incomes are
£101.97 per week above income support levels.
6.18 While lone parents may incur child care costs in order to work, those costs will potentially
be partly offset by the child care cost allowances that form part of the child tax credits
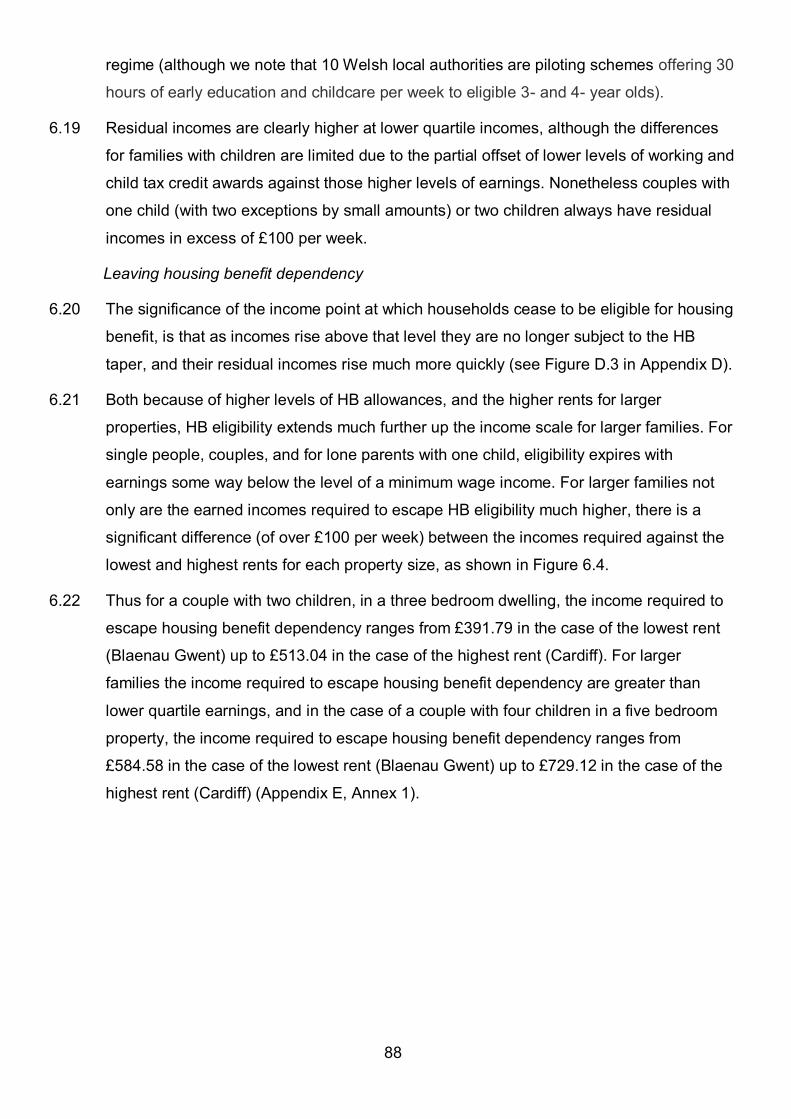
88
regime (although we note that 10 Welsh local authorities are piloting schemes offering 30
hours of early education and childcare per week to eligible 3- and 4- year olds).
6.19 Residual incomes are clearly higher at lower quartile incomes, although the differences
for families with children are limited due to the partial offset of lower levels of working and
child tax credit awards against those higher levels of earnings. Nonetheless couples with
one child (with two exceptions by small amounts) or two children always have residual
incomes in excess of £100 per week.
Leaving housing benefit dependency
6.20 The significance of the income point at which households cease to be eligible for housing
benefit, is that as incomes rise above that level they are no longer subject to the HB
taper, and their residual incomes rise much more quickly (see Figure D.3 in Appendix D).
6.21 Both because of higher levels of HB allowances, and the higher rents for larger
properties, HB eligibility extends much further up the income scale for larger families. For
single people, couples, and for lone parents with one child, eligibility expires with
earnings some way below the level of a minimum wage income. For larger families not
only are the earned incomes required to escape HB eligibility much higher, there is a
significant difference (of over £100 per week) between the incomes required against the
lowest and highest rents for each property size, as shown in Figure 6.4.
6.22 Thus for a couple with two children, in a three bedroom dwelling, the income required to
escape housing benefit dependency ranges from £391.79 in the case of the lowest rent
(Blaenau Gwent) up to £513.04 in the case of the highest rent (Cardiff). For larger
families the income required to escape housing benefit dependency are greater than
lower quartile earnings, and in the case of a couple with four children in a five bedroom
property, the income required to escape housing benefit dependency ranges from
£584.58 in the case of the lowest rent (Blaenau Gwent) up to £729.12 in the case of the
highest rent (Cardiff) (Appendix E, Annex 1).

89
Figure 6.4: Incomes required to cease housing benefit eligibility, 2018/19
Assumptions and source: Appendix E, Annex 1
Conclusions
6.23 Ultimately views on levels of affordability are a matter of judgement. There is no
consensual view on what is or is not affordable. Indeed, drawing a line in the sand is
inherently difficult in the UK given the role of the housing benefit regime.
6.24 As seen above it is only in the case of all categories of single people and childless
couples living in one-bedroom properties that rent to income ratios exceed 25% with
minimum wage incomes nationally, and usually leaves the household with a residual
income (over Income Support levels) of over £100 per week. For larger families, the HB
scheme means that residual incomes remain the same across the whole range of rents
from one area to another (at minimum wage levels). However, the higher rents do make it
far less likely that working households will be able to escape dependency on housing
benefit.
The impact of Universal Credit on affordability
6.25 The roll-out of Universal Credit (UC) is already affecting some people’s affordability
outcomes and will increasingly do so as more people are transitioned onto the scheme.
This can be seen in the following analysis of the impact of UC on the affordability of
2018/19 matrix rents.

90
6.26 The detailed results of the affordability analyses examining the impact of the UC regime,
against the current housing benefit and tax credit regime, can be found at Appendix E,
Annex 2. The analyses show the results for average Welsh rents for all local authority
areas.
6.27 There are multiple concerns about the administration of UC, and its potential impacts on
tenant hardship and rent arrears. The focus here, however, is on the direct impact of the
structure of UC on affordability.
6.28 The key difference between UC and the current HB regime is that it includes the
equivalents of tax credits and housing within its singular structure. It follows that UC has
a far less sharp ‘poverty trap’ as there is only a single taper to reduce UC as earnings
rise, rather than the two separate tax credit and housing benefit tapers that often overlap.
6.29 There are also differences in the levels of the personal allowances between UC and the
current schemes, with the UC scheme having lower levels of allowances for all families
with children, and in particular for lone parents.
6.30 Consequently, lone parents, are quite likely to be worse off under UC than they are under
the current HB regime (albeit that there is some transitional protection for existing
claimants at the point they transfer to UC). However, the extent to which this is the case
varies with the level of rent, and with the numbers of children in the household.
6.31 In this context Figure 6.5 illustrates the case of a lone parent with two children, and a rent
of £100 per week, and shows that they are only better off under UC once their gross
earnings exceed £300 per week.
6.32 The other point to note is that at lower income levels lone parents are far more likely to
be worse off, and this applies in particular to lone parents working part time with hourly
earnings at minimum wage levels, or only a little higher. Couples with children can also
be worse off at very low levels of part time earnings, but to a far lesser extent than lone
parents. At full time minimum wage earnings levels and above they are in all cases better
off under UC.

91
Figure 6.5: Impact of Housing Benefit and Universal Credit schemes on weekly net income after housing costs, 2018/19
Source: authors’ calculations based on 2018/19 scale rates
Assumption: Lone parent with 2 children living in 3 bed accommodation paying rent of £100 per week.
6.33 Thus, with the exceptions noted above, UC tends to reduce rent to income ratios, and
improve households’ disposable incomes (although less than might be suggested by the
‘residual income’ figures in our tables as these also reflect the lower levels of personal
allowances the UC scheme provides for families with children).
6.34 In contrast, as a result of the less severe poverty trap, UC eligibility extends much further
up the income scale than is the case with housing benefit. This is illustrated in Figure 6.6.
It follows that the UC regime, with all its administrative difficulties, will apply to a greater
proportion of working age households in the social rented sector than is currently the
case for housing benefit. This issue is of particular concern for larger families where UC
eligibility extends beyond £800 per week – a level of earnings only achieved by some
10% of all earners in Wales.

92
Figure 6.6: Gross weekly earnings level at which benefit dependency ceases, 2018/19
Assumptions and source: Appendix E, Annexes 1 and 2 (HB and UC); authors’ calculations (Tax Credits)
Note: Rents are Welsh average for these properties
Affordability in 2021/22 on alternative levels of annual rent increases
6.35 Affordability in 2021/22 was assessed on the basis of three alternative levels of annual
rent increases in the three years from 2019/20 to 2021/22 – CPI + 0.5%, CPI + 1.0% and
CPI + 1.5%. The affordability measures applied were the same as with the earlier
analyses and in all cases they assumed that the UC regime would be fully operational in
2021/22. It should be noted that in practice average rents have increased ahead of the
current CPI + 1.5% formula in the years to 2018/19, due to landlords’ use of the provision
to increase rents by up to an additional £2 per week.
6.36 The analyses included all local authorities as well as Welsh average rents. Pending any
decisions on reforms to the current structure of the rent matrix (discussed in the following
chapter) the analyses were based on annual uplifts to the current 2018/19 rent matrix.
6.37 Using April 2018/19 as a base year, average earnings are forecast over three years to be
9.5% higher in 2021/22 based on the Office for Budget Responsibility forecast of March
2019. Tax allowances have been projected to increase in line with CPI in 2020/21.
Universal Credit and other welfare benefit allowances have been assumed to remain
frozen for 2019/20 (apart from work allowance which was adjusted upwards in line with
policy), and then to increase in line with CPI, and for 2020/21 and 2021/22.

93
6.38 The results of the analysis of the impact of the alternative rental uplifts are set out below,
first showing the levels of rent to income ratios under each scenario, then the levels of
residual incomes above UC personal allowances, and finally the income levels at which
household cease to be eligible for UC.
Rent to income ratios
6.39 Rent to income ratios vary by household type, as well as in respect of rent and income
levels. Families with children have additional income from child benefit, as well as higher
levels of UC allowances. Consequently, rent to income ratios are lower for families with
children than for childless households as shown in Figure 6.7, with the situation in
individual local authorities detailed in Appendix E, Annex 3 (CPI + 0.5%), Annex 4 (CPI +
1.0%) and Annex 5 (CPI + 1.5%).
6.40 Ratios for single people and childless couples with minimum wage incomes in 1-bedroom
dwellings frequently exceed 25% on all scenarios. In contrast rent to income ratios for
households with children are always below 25% (although they reach 24.9% in Cardiff
and Monmouthshire for lone parents with on child on the CPI + 1.5% scenario). Ratios
are lower still for larger families, although in most cases they remain above 20%, except
in the case of couples with three or four children. For couples with four children rent to
income ratios only exceed 20% in Cardiff (on the CPI + 1.5% scenario).

94
Figure 6.7: Rent to income ratios: minimum wage, 2021/22
Assumptions and source: Appendix E, Annexes 3, 4 and 5
6.41 Rent to income ratios are somewhat lower at lower quartile earning levels, but the
differences are more limited in areas such as Pembrokeshire and Ceredigion where the
lower quartile earnings are less than £35 above minimum wage levels. In contrast lower
quartile earnings are much higher in Cardiff (£73 above the minimum wage), and as a
result at those income levels the rent to income ratios for Cardiff are not the highest in
Wales for households without children.
6.42 The other point to note is that while affordability in terms of rent to income ratios is
always slightly more problematic with the higher rental uplifts, the differences between
the three uplift options are relatively modest.
Residual incomes
6.43 The measure of residual incomes used in this analysis is of the disposable income after
net rent payments that is above the level of the maximum UC allowances (see 6.17
above).
6.44 Figure 6.8 shows the levels of residual incomes for households with minimum wage
incomes, for average Welsh rents under the three alternative uplift scenarios. One point
to note is that whenever a household is eligible for UC, then at any given gross income
level, the level of the residual income is identical, regardless of the level of the gross rent.

95
In this case only single people, and young single people, who are ineligible for UC at the
minimum wage income level, whose residual incomes are impacted by variations in rents
at this income level.
6.45 It should also be noted that residual incomes for younger single people (lower quartile
earnings) are higher than those for older single people, while their after housing cost
incomes are identical, because younger single people have lower levels of UC
allowances, and thus the gap for them between in and out of work incomes is greater.
This does not hold for those earning the minimum wage because it is set at a lower rate
for under 25s.
6.46 Moreover, such is the structure of the UC allowances that at any given income, the level
of residual incomes only varies for families with children by virtue of the different levels of
child benefit payable based on the number of children in the family.
6.47 While lone parents have the same residual incomes as couples with the same number of
children, their net disposable incomes are considerably lower, mirroring the lower level of
their UC personal allowances. Thus, at 2021/22 levels, the UC allowances for lone
parents are some £43.36 lower than those for couples with children. Moreover, lone
parents are more likely to incur child care costs in order to work, albeit that those costs
may be partly offset by the child care cost allowances that form part of the UC regime.

96
Figure 6.8: Residual incomes: average Welsh rents, 2021/22
Assumptions and source: Appendix E, Annexes 3, 4 and 5
6.48 Residual incomes are clearly higher at lower quartile incomes, although the differences
for couples and families with children are limited due to the partial offset of lower levels of
UC awards against those higher levels of earnings. For all families with children levels of
residual incomes vary based on the local levels of incomes, but are the same for all
levels of rental uplift. For example, for couples with two children, they range from £202.90
per week in Ceredigion, which has the lowest level of lower quartile earnings among our
selection of authorities, up to £220.90 per week in Monmouthshire, which has the highest
earnings.
Leaving Universal Credit dependency
6.49 The significance of the income point at which households cease to be eligible for UC, is
that as incomes rise above that level they are no longer subject to the UC ‘taper’, and
their residual incomes then rise much more quickly. While, as seen above, the UC
‘poverty trap’ is far less severe than that under the current housing benefit and tax credit
regime, a consequence is that it extends much further up the income scale.
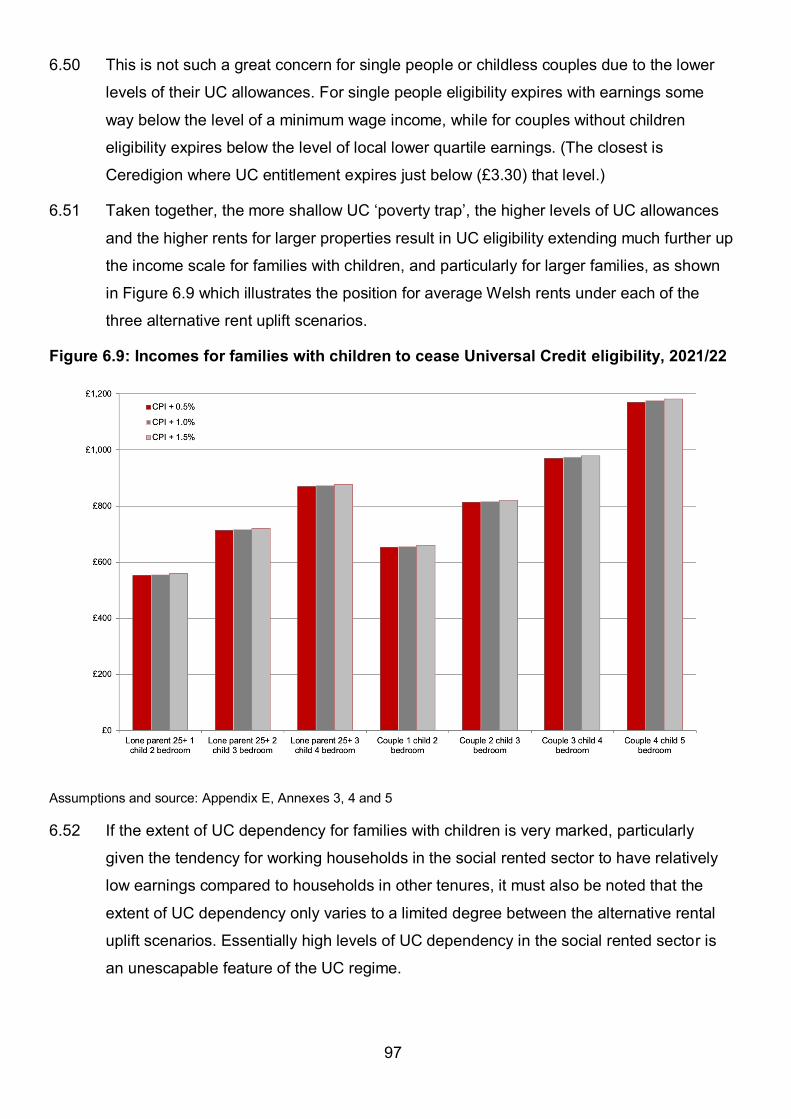
97
6.50 This is not such a great concern for single people or childless couples due to the lower
levels of their UC allowances. For single people eligibility expires with earnings some
way below the level of a minimum wage income, while for couples without children
eligibility expires below the level of local lower quartile earnings. (The closest is
Ceredigion where UC entitlement expires just below (£3.30) that level.)
6.51 Taken together, the more shallow UC ‘poverty trap’, the higher levels of UC allowances
and the higher rents for larger properties result in UC eligibility extending much further up
the income scale for families with children, and particularly for larger families, as shown
in Figure 6.9 which illustrates the position for average Welsh rents under each of the
three alternative rent uplift scenarios.
Figure 6.9: Incomes for families with children to cease Universal Credit eligibility, 2021/22
Assumptions and source: Appendix E, Annexes 3, 4 and 5
6.52 If the extent of UC dependency for families with children is very marked, particularly
given the tendency for working households in the social rented sector to have relatively
low earnings compared to households in other tenures, it must also be noted that the
extent of UC dependency only varies to a limited degree between the alternative rental
uplift scenarios. Essentially high levels of UC dependency in the social rented sector is
an unescapable feature of the UC regime.
98
6.53 There is, however, rather more variation in the levels of income required to escape UC
dependency between the higher and lower rental areas within Wales. Thus, in the case
of a couple with two children, and a rental uplift scenario of CPI + 1.0%, the level of
earnings required to escape UC dependency ranges from £789.67 per week in Blaenau
Gwent up to £844.15 per week in Cardiff (against £817.35 per week in respect of
average Welsh rents).
Changes to Universal Credit Allowances
6.54 The affordability analyses outlined above are all based on families with children born
before April 2017, but over time an increasing proportion of families will have children
born after that date and subject to lower levels of UC allowances. Post April 2017 the
higher allowance for a first child (worth almost £11 per week) is abolished for new claims,
and UC allowances are only provided for a maximum of two children born after that date
for new claims. In January 2019 the UK Government announced that the planned
extension of this two-child limit, which had been due to come into effect from February
2019, would not proceed and that all children born before that date will continue to be
supported by Universal Credit. The full impact of this policy will therefore not be felt until
the 2030s.
6.55 The lower levels of UC allowances for these two adjustments have been analysed using
all three uplift scenarios against both lower quartile and minimum wage levels of earnings
in Appendix E, Annexes 6-8.
6.56 These changes do reduce the incomes available to affected households. However, for
those who remain in receipt of housing assistance through UC, the level of rent does not
affect the level of after housing cost (AHC) income. AHC income is reduced by the same
amount across every local authority area and on every rent rise scenario. The change
does rise rent to income ratios (because AHC income is lowered), and this varies
according rent levels, and therefore between areas and according to different rent uplift
scenarios.
Minimum wage
6.57 For families (couples and lone parents) with one or two children with the minimum wage
assumption this sees increases in rent to income ratios of rather less than 1.0%. Ratios
exceed 25% in the case of lone parents with one child in the two highest rental areas
(Cardiff and Monmouthshire) on uplifts of 1% or more, whilst being at exactly 25% for
these areas on the CPI + 0.5% scenario.
99
6.58 The impacts on families with more than two children are far greater, and they see income
losses of £66.34 per week in the case of families with three children, and £121.82 per
week in the case of families with four children. Rent to income ratios increase by over 2%
for families with three children, and by 3.5-4% for families with four children.
6.59 Rent to income ratios for lone parents with three children reach 25% in Cardiff on the CPI
+ 1% uplift scenario and exceeds it in Cardiff and Monmouthshire on the CPI + 1.5%
uplift scenario (albeit marginally). Rent to income ratios for couples with four children,
however, do not reach 25% on any of the scenarios.
Lower quartile earnings
6.60 Losses arising from the lower levels of UC allowances impact in much the same way for
households under the lower quartile earnings assumption.
6.61 Reductions in weekly AHC income are £10.87 for both lone parents and couples with one
or two children. These rise to £66.35 for lone parents and couples with three children and
to £121.82 for couples with four children.
6.62 Nonetheless, these reductions in AHC income are not sufficient to raise rent to income
ratios to 25% on any rent uplift scenario. Lone parents with three children reach 24% on
the CPI + 1% and CPI + 1.5% uplift scenarios in Cardiff (both these scenarios) and
Monmouthshire (CPI + 1.5% only). The highest rent to income ratio for couples with
children is 23.5% for those with four children on the CPI + 1.5% rent uplift scenario.
Differences with emerging findings
6.63 Results of an earlier iteration of the analysis presented in this chapter was summarised in
The Emerging Findings Report (Littlewood, et al, 2019), and we summarise the main
differences between those emerging findings and those reported here.
6.64 Some of the assumptions used have been revised in this report, as the result of quality
assuring the original data:
Earnings data for 2018 has replaced that for 2017.
The lower minimum wage rate has been applied to adults aged under 25.
The Lone Parent Family Premium, for which very few households are now eligible,
has been removed from the Housing Benefit simulations.
The Universal Credit simulations for 2020/21 rent scenarios use revised rent and
earnings projections and benefit rates to bring them into line with 2019/20 rates

100
(including the uplifted work allowances). The revised outputs are therefore not
directly comparable with the original 2021/22 simulations.
6.65 Some technical adjustments have been made to the HB and UC simulation models.
National Insurance and/ or tax thresholds and benefit tapers were updated, and Council
Tax and Council Tax Reduction Payments have been removed.
6.66 The revised HB affordability estimates are detailed in Appendix E, Annex 1. The use of
updated earnings data and the adoption of the lower under 25 minimum wage have
resulted in small (generally less than 1%) changes in lower quartile rent to earnings
ratios, and a rise in the affordability ratios for young single adults by around 1%, and
minor changes in the ranking of local authorities according to affordability. The removal of
the lone parent family premium from the model had little effect on HB entitlement other
than for lone parents with two children who were receiving small amounts of benefit.
Generally, the technical adjustments had modest impacts on affordability indicators. A
likely typographical error accounts for an isolated substantive change relating to the
earnings required by a couple with four children in Blaenau Gwent were over-estimated
by some £5.
6.67 The UC affordability estimates, which are detailed in Appendix E, Annex 2, have changed
only modestly as a result of the changes noted above. The only substantial change arose
from the correction of an error concerning the use of the under 25 UC personal allowance
for those aged over 25. Consequently, UC entitlement increased considerably with knock
on effects on the level of earnings required to exit UC.
6.68 The three rent uplift scenarios (Appendix E, Annexes 3-5) are affected by the changes
noted above, but do not affect any of the key findings.
Summary: impact of alternative levels of rent increases on affordability
6.69 As seen above it is only in the case of single people and childless couples in one-
bedroom dwellings that rent to income ratios frequently exceed 25% with minimum wage
incomes, and in all cases this also leaves the household with a residual income (over UC
levels) of well over £100. Single people in bedsit dwellings, and lone parents with one
child, only incur rent to income ratios in excess of 25% in a few cases in the areas with
the highest rents. Although lower levels of UC allowances affecting children born after
April 2017 lower AHC incomes they cause rent to income ratios to rise above 25% in only
a few cases.

101
6.70 For childless couples and families with children the UC scheme means that residual
incomes remain the same across the whole range of rents from one area to another, and
under all rental uplift scenarios, varying only based on the number of children in the
family. Against that it is a characteristic of the UC regime that levels of benefit
dependency extend much further up the income scale, especially for larger families.
6.71 Ultimately views on levels of affordability are a matter of judgement. There is no
consensual view on what is or is not affordable. Indeed, drawing a line in the sand to
define affordability is inherently difficult in the UK given that the role of the Universal
credit regime. The higher the rents, the less affordable they become – but the impact is
gradual and there is no obvious ‘tipping point’ at which affordability suddenly becomes far
more severe.
6.72 Hence the variations in the affordability measures under the three alternative rental uplift
scenarios are quite limited. This makes it difficult to identify a preferred rental uplift policy
based solely on considerations of affordability. Other issues need to be considered, such
as the relationship over time between earnings and rents, the relationship between social
sector rents in England and Wales, and the balance between rental levels and the
investment capacity of social sector landlords. These issues are considered in the
following chapter.

102
7. Annual uprating and the structure of the rent matrix
7.1 This chapter first examines the arrangements for the annual uprating of social rents, and
then moves on to consider the structure and component elements of the matrix
methodology, taking note of the various observations made by landlords in the surveys
undertaken for this project. It uses the actual 2018/19 rents, which are collected via
annual returns from Welsh social landlords on stock held by local authorities and
registered social landlords as at 31 March each year, as a baseline.
Annual Uprating
7.2 The policy up to and including 2018/19 was for the matrix rents to be uprated by CPI plus
1.5% annually. This was seen as a broad equivalent to RPI plus 1%, based on the
previously dominant inflation measure. In 2019/20 rents were allowed to rise by CPI only
as an interim measure until the Welsh Government considers the recommendation of its
independent review of Affordable Housing Supply. Decisions about the future levels of
annual uprating need to consider the future levels of earnings growth, beyond those
estimated for the affordability analyses undertaken in the previous section.
7.3 On average over the two decades to 2008 average earnings in Wales increased by 1.2%
over RPI, and 2.1% over CPI. However, in the years from 2009 to 2016 on average
earnings fell by 1.0% against RPI, and 0.6% against CPI. While throughout the whole
period social sector rents have increased well above inflation, in the years running up to
2007 average rents nonetheless increased less rapidly then earnings.
7.4 However, post 2007 this has no longer been the case, and rents have continued to rise in
real terms, while real earnings have fallen. Consequently, average rent to income ratios
for Welsh social sector rents are now at historically high levels.
7.5 Median earnings in Wales were some 8.2% lower in 2018 than in 2007 (Table 7.1). In the
years to 2023 the Office for Budget Responsibility has forecast that real earnings in the
UK will rise at annual rates of between 0.5% and 1.3%. If Welsh earnings were to rise by
the amounts forecast by OBR, then in they would be 4.8% below their 2007 level in 2021
and still 2.3% below their 2007 in 2023 level in real terms, although the gap has
narrowed. A general caveat is that economic forecasts at present are made in the context
of considerable uncertainty over Brexit and are therefore to be treated with more caution
than is usually the case.

103
Table 7.1: Forecast increases in Welsh weekly median earnings, 2018-2023
Forecast
growth in real
earnings (%)
Earnings
(2018 prices,
£ per week)
Earnings in
2007
(2018 prices,
£ per week)
Difference
(£ per week)
Difference
(%)
2018 - 509.00 550.63 41.63 8.2
2019 1.0 514.09 550.63 36.54 7.1
2020 1.1 519.74 550.63 30.89 5.9
2021 1.1 525.46 550.63 25.17 4.8
2022 1.1 531.24 550.63 19.39 3.6
2023 1.3 538.15 550.63 12.48 2.3
Source: Calculated from Annual Survey of Hours and Earnings; OBR Economic and Fiscal Outlook, March 2019,
Table 1.1
Note: Median gross weekly earnings for Wales. 2018 = actual figure. 2019-2023 calculated from Office for Budget
Responsibility forecasts for earnings and CPI at March 2019. 2007 figure uprated to 2018 prices using Bank of
England inflation calculator.
Social sector rents in England and Wales
7.6 The lower levels of earnings growth now pertaining, and forecast for the coming years,
inevitably raise a question about whether a return to the CPI + 1.5% rent policy is
justified. This must also now be seen in the context of the UK Government’s policy to
adopt a CPI + 1% annual uplift policy for social rents in England, following a four-year
period (from April 2016) of reducing rents by 1% annually.
7.7 Over the years since the 1999 devolution settlement average council rents in Wales
increased less rapidly than in England. However, this is based on a very crude measure,
as the impact of large-scale stock transfers and right to buy sales over time have
significantly changed the mix of retained council dwellings in each country. While it also
appears that housing association rents in England increased more rapidly than in Wales
over the years since 1979, the picture is less clear due to the lack of a consistent
measure balancing the changing mix of fair, assured and ‘affordable’ social rents in each
country.
7.8 In either case the extent of the differences in long-term rates of rent increase between
the two countries are in the process of being substantially eroded by the application of
the four years of social sector rent reductions in England that will continue into 2019/20.
In this context our analysis has examined the relationship between Welsh social sector

104
rents, and those in the northern and midland regions of England. These regions were
chosen for comparison because they have similar levels of earnings.
7.9 In 2018/19 average Welsh rents were higher than those in each of the five English
regions with which broad comparisons were made. This applied to each bedroom
category. The difference was somewhat smaller in the West Midlands (as shown in
Figure 7.1).
Figure 7.1: Social rents for Wales and English Regions £ per week, 2018/19
Source: Wales data: Baseline = 2018/19 actual rents collected as part of annual stock and rents data collection.
England 2018/18 data estimated from: MHCLG Local Authority Housing Statistics data returns for 2016 to 2017:
local authority housing; Homes and Communities Agency Statistical Data Return 2016 to 2017: private registered
provider social housing stock.
7.10 This comparison in social sector rent levels should be seen in the context of the levels of
earnings in Wales and each of the regions of, and these are set out in Table 7.2 below.
As can be seen earnings in Wales are lower than in the North West, and the midlands
regions, and a little higher than in Yorkshire & The Humber.
7.11 They are closest to earnings in the North East, being a little lower in respect of lower
quartile earnings, and a little higher in respect of median earnings. However as can be
seen from Figure 7.1 for all sizes of dwellings Welsh rents are a little higher than those
for the North East.

105
Table 7.2: Earnings in 2017 in Wales and English regions
Area Weekly Gross Earnings
Lower Quartile Median
North East £375.20 £504.10
North West £378.00 £514.50
Yorkshire & The Humber £371.40 £502.30
East Midlands £380.60 £515.50
West Midlands £380.60 £517.40
WALES £374.00 £505.90
Note: All figures are for full time earnings based on place of residence, derived from Annual Survey of Hours and
Earnings.
7.12 The relationship between Welsh and English regional rents will change over time,
reflecting differences in future rent policies in the two countries. The English policy for
increases is now set at -1% (in cash terms) in 2019/20, and at CPI + 1% thereafter. Here
we set out a comparison of the Welsh and English regional rents in 2021/22 on the basis
of the adopted rent policy in England and the three alternative options for Welsh rent
uplifts considered in the earlier affordability analyses (i.e. CPI + 0.5%, CPI + 1.0% and
CPI + 1.5%).
7.13 It should be noted that the English rents are for social rented housing only and exclude
affordable rents that have become increasingly used. This allows a like-with-like
comparison to be made between social rents in Wales and England.

106
Table 7.3: Average Welsh and English regional social sector rents in 2021/22
Wales Bedsit 1 Bed 2 Bed 3 Bed 4 Bed 5 Bed ALL
CPI + 0.5% 78.56 85.19 95.48 104.93 121.02 142.87 97.26
CPI + 1.0% 79.72 86.44 96.88 106.47 122.79 144.96 98.68
CPI + 1.5% 80.88 87.70 98.30 108.03 124.59 147.08 100.13
England
N East 62.02 69.96 78.85 86.70 94.68 106.74 79.81
N West 62.96 72.42 83.07 92.33 100.94 109.33 84.61
Yorkshire & The Humber 59.77 69.37 79.24 86.92 96.31 109.00 79.31
E Midlands 60.70 71.03 83.38 90.05 101.39 109.41 82.89
W Midlands 65.83 75.19 85.83 95.60 108.77 123.11 87.12
England 77.63 82.26 94.08 103.56 122.53 141.08 95.01
Source: Wales data: Baseline = 2018/19 actual rents collected as part of annual stock and rents data collection.
England data: MHCLG Local authority housing statistics data returns for 2016 to 2017 (for general needs and
sheltered units); National Statistics Statistical Data Return 2016 to 2017: private registered provider social housing
sock in England (general needs only).
Notes: Wales data: (a) include general needs and sheltered units, and all social landlords; (b) bedsits are self-
contained accommodation only; (c) projections assume stock remains unchanged; (d) no allowance is made for the
discretionary £2; (e) CPI 2019/20 = 2.4% (actual CPI for Sept 2018); 2020/21 = 2.0% (OBR 2019 and 2020);
2021/22 = 2.0% (OBR 2019 and 2020). England data: (a) exclude ‘affordable rent’ properties; (b) 2018/19 figures
projected from published 2016/17 figures based on 1% reduction each year; (c) projections assume stock remains
unchanged; (d) changes applied to 2019/20 is a 1% reduction; (e) 2020/21 uses CPI + 1%, with 2.0% CPI of 2.0%
(OBR figures for 2019 and 2010); (f) 2021/22, uses CPI + 1%, with 2.0% CPI of 2.0% (OBR figures for 2019 and
2010).
7.14 Under all the above scenarios, Welsh rents remain above rents in the five English
northern and midland regions. This holds across every bedroom size, and indeed for
England as a whole.
7.15 On the smallest uplift scenario (CPI + 0.5%) average Welsh rents would be between
£10.14 and £17.95 higher in Wales than in the selected English regions. The smallest
difference is between the Wales and the West Midlands (£10.14). The difference is
£12.65 in the North West and £14.47 in the East Midlands, £17.95 in Yorkshire & The
Humber, and £17.45 in the North East.
7.16 Under the CPI +1.5% scenario average Welsh rents are between £13.01 (West
Midlands) and £20.82 (Yorkshire and The Humber) higher than in the selected English
regions.
7.17 Rent differentials also differ between property types within regions. For example, the
differential between Welsh rents and those in the North East are greater for larger (4 and

107
5 bed) and the smallest (bedsit) properties and smallest for 1-, 2- and 3- bed properties.
In the West Midlands, the difference is largest for Bedsits and 5-bedroom properties, and
smallest for 2 and 4 bed properties.
Rents and earnings
7.18 Table 7.4 presents the growth of rents on the different scenarios which can be compared
by forecast earnings growth. It is important to note that the relationship between rent
increases and earnings are sensitive to forecasts of both inflation (which form the basis
of rent uplift policies) and earnings. Interpretation is made still more difficult by the
additional uncertainty that should be attached to forecasts as a result of Brexit.
Table 7.4: Index of forecast earnings and rental growth, 2018/19 – 2021/22 (2018/19 = 100)
Earnings
forecast CPI CPI+0.5% CPI+1.0% CPI+1.5% England
2018/19 100 100 100 100 100 100
2019/20 103.1 102.4 102.9 103.4 103.9 99.0
2020/21 106.2 104.4 105.5 106.5 107.5 102.0
2021/22 109.5 106.5 108.1 109.7 111.3 105.0
Source: CPI and rent assumptions see Table 7.3. Earnings forecast from Economic and Fiscal Outlook, March 2019,
Table 1.1 and relate to calendar year
7.19 On all three annual rental uplift scenarios, other than CPI + 0.5% Welsh rents would rise
ahead of forecast earnings growth, and ahead of English regional rents over the three
years to 2021/22, even without taking into account the extent to which average Welsh
rents increase above the level of the annual uplift, due to the use of the additional £2 per
week provisions.
7.20 A policy of annual increases of CPI + 1.5% would see Welsh rents rise by around 1.8%
further ahead of earnings by 2021/22. In 2021 Welsh earnings would still be some 4.8%
lower in real terms than they were in 2007 (Table 7.1). Moreover, it is not difficult to
imagine that in time HM Treasury (and DWP) could consider some financial or regulatory
action if the Welsh Government continued with its current CPI + 1.5% policy.
7.21 A policy of CPI + 1.0% would see Welsh rents rise by a little more than earnings by
2021/22. A policy of CPI + 0.5% would see earnings rise a little way above rents by
2021/22. A caveat in each case is that these calculations do not take into account any £2
addition above the inflation-related increases which has been a feature of policy.

108
Conclusions
7.22 Policy on annual rental uplift must clearly strike a balance between concerns about
affordability, and landlords’ financial viability and investment capacity. Ultimately this is a
judgement call and research can do no more than inform a decision. Factors to consider,
as well at the overall movements in rents and earnings, and the relationship between
Welsh and English social sector rents, are the affordability implications for tenants
discussed in the previous section, and the extent to which landlords’ rental capacity
would be constrained by the policy decision on annual rental uplift.
7.23 There are two key points. First, while the affordability analyses showed only limited
differences resulting from the alternative uplift scenarios, it also flagged the negative
impact of UC on affordability for large families subject to the limits imposed on maximum
levels of child allowances. Secondly (as shown below), there are now no landlords with
rents above the upper limit of their matrix target rent bands, and the overwhelming
majority have the potential to increase their rents above the level of the policy set for
uprating the rents matrix, while still keeping their rents within the matrix boundaries.
7.24 Taking all these factors into account the research does allow us to suggest that there is a
case for setting annual matrix increases at no more than CPI + 0.5% in the years to
2021/22, in order to limit the extent to which rents continue to rise ahead of earnings.
Thereafter the increases could rise to CPI + 1.0%, provided that it is by then clear that
average earnings are set to at least match that level in the following years.
7.25 It would prudent for any adopted rent policy to be subject to some adjustment should a
disorderly Brexit cause severe economic disruption as most economic assessments
suggest that it would (e.g. Bank of England 2019).
The structure of the rent matrix
7.26 Linked to the annual uplift policy in Wales are the provisions for additional rent increases
of up to £2 per week, provided that this would not take their rents above the upper end of
their rent band. Beyond 2019/20 this £2 policy will apply only to two local authorities with
rents below the lower level of their TRB (Isle of Anglesey and Pembrokeshire), and
beyond 2020/21 it will only apply to Pembrokeshire.
7.27 It has been suggested that the £2 policy bears disproportionately on the rents of smaller
dwellings, and that there should be some variation in the required increases, based either
on the size or the rent level of dwellings within the landlords’ stock. If this was felt to be
an issue, it could be accommodated, by for example, setting the required additional rent

109
increase at £1 per week for bedsits/I bed dwellings, £1.50 per week for 2 bed dwellings,
and £2 per week for 3 bed (+) dwellings.
7.28 At the other end of the spectrum there are now no social landlords whose rents are
above the higher end of their rent band. It follows that all social landlords can now, at the
very least, fully increase their rents in line with the national rental uplift policy. Indeed, the
great majority can increase their rents some way beyond the level of the national policy
for the rent matrix uplift, as going into 2019/20 only three landlords will have rents less
than £1 a week below the upper level of their matrix rent band.
The structure and composition of the Matrix
7.29 The ‘matrix’ was constructed to provide a common framework for social sector rents in
Wales and to offer a fairer set of arrangements so that tenants of different landlords were
closer to paying a similar rent for the same type/quality of homes. The matrix sets out
indicative rent figures for each size and type of dwelling in each local authority area in
Wales, taking into account a range of locational variables based on local earnings,
private rents and house prices.
7.30 The indicative rents generated by the matrix are then used to derive an average rent for
the stock of each individual landlord based on the location and composition of their stock.
The matrix rents are then adjusted to take account of the SAP ratings for each landlord.
The SAP adjusted average figure (which could also be expressed as a rent envelope for
their whole stock) then provides the centre point in the rent band, that gives individual
landlords the discretion to vary their rents by 5% (+/-) against that overall average.
7.31 The indicative rents set out in the matrix are no more than that. Individual landlords are
free to set the rents for each individual dwelling as they see fit provided that in overall
terms, they remain within their designated rent band. It is nonetheless clear that a
number of landlords have decided to adopt the indicative rents as the basis for setting the
rents for each property.
7.32 One common theme in the survey responses was that landlords sought more flexibility in
the rent policy. Given the total flexibility that they have to set rents for individual
properties, the call for more flexibility can only mean either that some landlords do not
realise the extent of the flexibility that already have; or that they are arguing for the ability
to charge average rents at levels above (or below) their designated rent bands.
7.33 One of the arguments put forward for flexibility to charge rents linked to the rent bands
relates to the structure of grant rates for new developments. When the rent policy was
110
first devised it was envisaged that this would then be reflected in the grant rate policy for
new developments. In practice this has not happened, and as a result there is clearly a
tension between the Welsh Government’s rent policy, and its policy in respect of grant
rates. While it can clearly be argued that they should ideally be consistent, it would be
more logical to review the grant rate policy, than to introduce a division in the rent policy
between the provisions for new and existing dwellings.
7.34 The two features of Cals for Table 7.1 and 7.4he rent matrix that were the focus of most
comments in the interviews were the locational factors, and the arrangements for SAP
ratings. These are discussed in turn below. A further point raised was in respect of
bungalows, which it was argued should have a higher weighting in the rent policy. It is not
clear, however, whether the respondent that raised this issue was aware that at the
moment bungalows are given the same weighting as houses, and thus already rank more
than flats. Alternatively, it is an argument that the weighting for bungalows should be
greater than the 10% differential currently applied for houses and bungalows relative to
flats. Again this is very much a judgement call.
SAP Ratings
7.35 A number of observations were made about the role of SAP ratings in the rent policy.
This currently either scales rent up or down, where data from landlords show that their
average SAP rating is above or below 65. In practice all social landlords now show
average SAP ratings of 65 or over, and consequently only the upward adjustments –
providing a 0.3% increase for every point the SAP rating exceeds 65 – now apply.
7.36 Some respondents argued that given all Welsh social landlords now have average SAP
ratings that meet, or exceed, the standard (65) required by the Welsh Housing Quality
Standard, the SAP element is no longer required as part of the rent policy. Others argued
that while it provided an incentive for landlords to continue to raise average SAP ratings,
at the same time it reduced the rental income available to those landlords with the lower
SAP, and thus their capacity to invest to improve the energy efficiency of their stock.
However, none argued against the rationale that higher SAP ratings provided value to
tenants in terms of potentially lower energy costs.
7.37 More broadly some argued that SAP ratings were not sufficiently wide ranging to provide
an overall measure of property quality. Indeed, that has been acknowledged since the
inception of the rent policy, given the absence of a robust and independent measure of
the quality of the stock of each landlord.

111
7.38 There is also a technical issue about the SAP ratings, given that there have been minor
changes between the SAP 2009 and 2012. The differences between the two measures
are, however, limited, and only apply in respect of dwellings with LPG, solid mineral or
biomass heating, and to an even more limited degree to electricity heated dwellings are
particularly limited.
7.39 Given the limited differences between the ratings for most forms of heating (and with the
main differences relating to the relatively scarce solid mineral and biomass heating
systems) it could be considered that these minor anomalies, between the two rating
systems, can be disregarded. A full schedule of those differences can be seen in Table
7.5 below.
Table 7.5: The relationship between SAP 2009 ratings and SAP 2012 ratings
SAP 2009 SAP 2012 for main heating fuel types
Mains gas Electricity Oil LPG Solid
Mineral Biomass
1 1 -3 (-11) (-9) (-5) 3
10 10 6 (-1) 1 5 12
20 20 16 10 12 15 22
30 30 27 21 23 26 32
40 40 37 32 34 36 42
50 50 47 43 45 47 51
60 60 58 54 56 57 61
70 70 68 65 67 67 71
80 80 78 76 78 78 81
90 90 89 87 89 88 91
100 100 99 98 100 99 100
Source: The Government’s Standard Assessment Procedure for Energy Rating of Dwellings (2012 Edition)
Note: Figures in brackets should be treated with caution
7.40 The primary issue is thus the decision as to whether it is still considered desirable to
provide a continuing incentive for landlords to further improve the energy efficiency of
their stock, and from a tenant perspective to vary the rents to reflect the differences in
their potential energy costs – reducing the costs for those with less efficient homes.
Locational Factors
7.41 A number of comments were made by stakeholders about the locational component of
the matrix. While the broad principle that there should be a factor for locational values in
the matrix was supported, within that two particular concerns were raised. One concern
was about the impact of lower locational values restricting the rent-based investment
112
capacity for impacted landlords, given that their operating costs, and stock investment
requirements, are not inherently lower than for landlords operating in other areas.
Another was about the way in which the locational index varied from year to year, and the
difficulty this imposed on landlords financial planning.
The structure of the locational index
7.42 The location index is based on four local authority level factors – house prices, private
rents, and place of work and place of residence earnings. The house price and private
rent components were included so that rents would, at least to some degree, reflect
variations in market values across Wales. The earnings components were included so
that rents would also to some degree reflect the affordability potential of households in
each area.
7.43 To limit the extent of year on year volatility the locational index is based on rolling
average of three years data for each component element. A policy decision was also
taken to limit the extent of social sector rent differentials across Wales, so the locational
index is also dampened by a third – so that it expresses only 66% of the differentials
derived from the undamped value index. Thus for 2018/19, taking the all Wales average
to be 100%, the undamped index would have ranged from 81.6% in Blaenau Gwent up to
113.4% in Cardiff, whereas the damped index ranges from 87.7% in Blaenau Gwent up
to 108.9% in Cardiff.
7.44 One factor involved in the use of market value components in the index is the desire to
avoid social sector rents overlapping with the costs of market housing in low value areas.
Were only earnings factors included the range of rents across Wales would be even less
than with the current damped index (for 2018/19 ranging from 95.0% in Blaenau Gwent
up to 103.3% in Cardiff.
7.45 However, 2017/18 data shows that even with the current locational index Blaenau Gwent
matrix rents for one- and two- bedroom houses are higher than private sector lower
quartile rents. The matrix rents for one-bedroom houses are also very close to the level
of median rents. In making these comparisons it must be recognised that there are likely
to be differences in quality between social sector properties compared to those at the
lower end of the market, and also that the private sector rent data does not distinguish
between flats and houses. These factors will tend to exaggerate the proximity between
social and private sector rents, a countervailing factor is that the social sector rents
exclude service charges, whereas the private sector rents will typically be inclusive.

113
7.46 The degree of overlap between the matrix and social sector rents in Blaenau Gwent
would be greater still if the extent of the locational differentials were damped further than
under the current system. If, for example, the locational index was solely based on
earnings, the matrix rents for one- and two- bedroom flats would also exceed private
sector lower quartile rents, and the matrix rents for one bedroom houses would also
exceed median private sector rents.
7.47 There are a number of other areas (Isle of Anglesey, Caerphilly, Carmarthenshire,
Gwynedd, Powys and Rhondda Cynon Taff) where the matrix rents for one-bedroom
houses also exceed private sector lower quartile rents. Other than for the Isle of
Anglesey in all other areas any further dampening of the locational index would deepen
the extent of the overlaps between social and private sector rents. Of these the most
extensive overlap in social and private rents (but again only for one-bedroom dwellings)
is in Powys. This is a result of the rental element for Powys in the locational index being
much lower relative to the house price and earnings elements.
7.48 However, aside from the small number of cases outlined above, in the main the locational
index does serve its purpose in ensuring that social sector rents do not overlap with
those in the private sector. It could provide an even greater margin between private and
social sector rents if the extent of dampening in the current index was reduced (so
increasing the differential between the rents in high and low value areas), but that would
also lead to increased concerns about affordability for high value areas, and increased
concerns about social landlords’ viability in lower value areas.
7.49 While some concerns were raised by a number of respondents about the structure and
complexity of the locational index there was not any consensual or widespread view on if,
or how, it might be reformed.
The volatility of the locational index
7.50 There are annual variations in the locational index weightings for each area, but in the
main these are quite limited, and only in exceptional cases do the year on year variations
exceed 1.0% for any area. In 2015/16 the locational index varied by more than 1.0%
compared to the previous year in three local authority areas – Conwy (+1.24%),
Denbighshire (-1.33%) and Powys (+1.04%).
7.51 In 2016/17 the locational index varied by more than 1.0% in five local authority areas – by
amounts ranging from -1.43% to + 1.08%. However, all variations in 2017/18 were by

114
less than 1.0%, and only in two areas were variations greater than 1.0% in 2018/19 –
Conwy (+ 1.06%) and Monmouthshire (+1.50%).
7.52 Some degree of annual variation in the locational indicators is inevitable, partly reflecting
labour and housing market changes over time, but also given the limitations in the data.
This is already recognised in the index as the data for each component is based on a
rolling three-year average, precisely in order to smooth out year on year variations in the
component data.
7.53 While it would be possible to freeze the locational index for a number of years, with only
periodic reviews, this creates the problem of much larger potential variations at the point
of change. In practice concerns about the impact of such periodic revisions tends to see
them put off time and time again. This can readily be seen, for example, with the
experience of property valuations for council tax bands. It might also be noted that the
social rent policy in England continues to this day to be based on 1999 earnings levels
and property values.
7.54 An alternative approach that would limit the extent of year on year variations in the
locational index would be to set a 1.0% cap on variations in any one year, with the
balance deferred to the following year.

115
8. Conclusions and recommendations
8.1 This study has examined the implementation and operation of the Welsh Government’s
Rent Policy, including its impact on landlords and tenants, its compatibility with wider
Welsh Government policies, the impact of external influences on it, and what its future
should be.
8.2 The study found that almost 70% of landlords had rents within the TRB, although this
varied greatly between landlord types. Whilst almost all traditional HAs have rents within
the TRB, most LSVT and LHA landlords do not. Around 80% of landlords had depooled
rents from service charges, and again these varied by landlord type, with half of LSVT
landlords being in the process of de-pooling. Around half of landlords use the Rent Matrix
for the setting of individual rents. Most landlords reported that transitional arrangements
had been broadly effective.
8.3 The study also found that the Rent Policy had been consistent with landlords’ business
plans in terms of their delivery of new affordable housing and bringing older housing up
to Welsh Housing Quality Standards. These also relate to Welsh Government’s
affordable housing targets. The Welsh Government’s rent uplift policy of CPI + 1.5% (up
to and including 2018/19) has clearly been a factor in enabling investment to take place.
Moreover, there are clearly tensions between the Rent Policy and the speed at which
landlords could deliver investment, and delivery is more difficult in low value areas.
8.4 The UK Government’s programme of welfare reform has been a key influence on the
operation of the rent policy. The proposal to limit social rents to LHA levels was a cause
of considerable concern among landlords and stakeholders, but the policy has now been
abandoned. The proposed reforms to sheltered accommodation also caused concern in
the sector, but again these have been dropped. Universal Credit remains a concern
among landlords because of potential loss of income to tenants and because payment to
the tenant rather than the landlord is associated with higher levels of rent arrears, which
could affect borrowing capacity in the future.
8.5 Broadly, the policy can be judged to be meeting its objectives of transparency,
consistency and fairness. Although tenants were largely unaware of the policy,
consistency in rent setting is widely valued by them. Landlords, too, favour the policy of
rents reflecting property size and type, but some felt that it did not adequately reflect
quality or location. However, some landlords felt that it is not sufficiently flexible.
116
8.6 The design of the Rent Matrix clearly has some weaknesses, notably the use of SAP
ratings as the sole indicator of quality for lack of readily available alternatives. The
locational index is also subject to undesirable year-on-year volatility. Further, the
weighting given to bungalows (which is the same as houses) does not fully reflect
popularity and higher cost of building.
8.7 Assuming minimum wage incomes, the Rent Policy is currently generally consistent with
housing affordability expressed by the rent to income ratio, and the residual income
above Income Support or Universal Credit personal allowances remaining after the
tenant has paid their rent. These measures are consistent with tenants’ own perceptions
of affordability. Those tenants who did struggle to pay their rent tended to have been
affected by welfare reform measures such as the ‘bedroom tax’ and Benefit Cap.
8.8 However, the Rent Policy is also operating within the context of real earnings which
remain below 2008 levels, and the perception among some tenants was that rents do not
always reflect value for money. Further, the divergent rent uplift policies of the UK and
Welsh Governments has led to Welsh rents being higher than in some of the English
regions with similar earnings levels. Such divergence would apply in comparison to all of
these English regions with similar earnings levels should above inflation increases
continue in Wales.
Recommendations
8.9 Overall, the Rent Policy is meeting its objectives, is accepted by a range of stakeholders,
and should be retained. There is little to be gained by revisiting the underlying principles
of rent-setting through a ‘new’ Essex Review. However, elements of the design and
operation of the policy should be kept under review and improved.
8.10 This means that we reject the view of some landlords that they should have full autonomy
in rent setting. It is difficult to see how consistency in rent setting, which is widely
regarded as being a key component of ‘fairness’, can be achieved without some co-
ordination. Moreover, rent setting at the individual landlord level cannot be separated
from wider public policy, particularly in relation to objectives of new affordable supply,
investment for minimum quality standards, and the complex interaction between rents,
social security benefits and the block grant. The approach of providing flexibility within an
overall framework is the right one.
8.11 The structure and detail of the Rent Policy inherently involve a series of interlocked
judgements, balancing concerns about affordability, landlord viability, and a sense of

117
what is ‘fair’. On that basis, any element of the policy could be reconsidered. However,
based on the comments received, and the analysis in this paper, there are seven issues
that stand out as requiring further consideration.
8.12 The first, and major, issue is the policy to be adopted on the level of annual uplift for the
Rent Policy. This is fundamentally a political choice that can be informed by the research,
rather than an issue where the research can provide a definitive answer. This is
fundamentally a political choice that can be informed by the research, rather than an
issue where the research can provide a definitive answer. One factor the research
highlights is the impact of the additional £2 per week provisions, in increasing rents some
1% higher than the standard uplift policy.
8.13 The decisions on rent policy clearly need to weigh in the balance their impact on social
landlords’ investment capacities, including their ability to contribute towards the provision
of new affordable housing. Indeed, those wider issues can now be informed by the
Affordable Housing Supply Review. It will also be possible to further review the extent to
which earnings growth in Wales has recovered, and any scope that might give for moving
towards a higher rate of annual rent uplift.
8.14 An increase of CPI + 1.5% would be highly problematic given the growing incompatibility
this would create with rents in England. Whilst the choice between CPI + 0.5% and CPI +
1% inevitably involves trade-offs between investment capacity and affordability, there is a
case to be made for limiting rises to CPI + 0.5% up to 2021/22 taking into account the
divergence with rents in the English northern and midland regions, and the fact that real
earnings remain below 2007 levels.
8.15 Should the Welsh Government opt for an initial annual uplift policy of CPI only or CPI +
0.5% there is a case for flexible application, for example, considering requests for a
higher increase on a case-by-case basis and considering how rent increases interact with
the distribution of grant.
8.16 The case for a rise of CPI + 1% in future years would be stronger if by then it is clear that
the subsequent rent increases would no longer exceed anticipated growth in earnings.
8.17 It would prudent for any adopted rent policy to be subject to some adjustment should a
disorderly Brexit cause severe economic disruption.
8.18 The second issue is the lack of fit between the rent policy and the policy on grant rates
for new developments. This applies in particular in low demand areas. It would, however,
118
be more logical to review the grant rate policy, so that takes into account the rent policy,
rather than to create anomalies between the rents of new and existing dwellings.
8.19 The third issue is the extent of annual variations in the locational index within the rent
matrix. While those variations are already limited, there is a case for introducing an
annual limit of, say, 1.0% in the extent of the variation for any area in any one year.
8.20 The fourth issue for the Welsh Government to consider is whether there is a sufficiently
compelling case for a higher upward differential for bungalows, relative to flats, than the
10% provision that is currently part of the policy.
8.21 The fifth issue is the extent to which some landlords do not appear to understand the
policy, and the flexibility it already provides them with. Related to that are concerns about
the complexity of the policy, and the difficulty they face when trying to explain it to their
tenants. Some landlords complain about the lack of flexibility within the policy, but do not
always appreciate what flexibility is available in terms of setting individual rents within the
TRB, and on re-lets. It would therefore be helpful if the Welsh Government were to
provide some case study examples of the flexible application of the Rent Policy, as was
suggested by some stakeholders.
8.22 Sixth, there is scope for better, more meaningful, engagement with tenants, which is
currently often at the lower end of engagement suggested in the Guidance. However,
current budget constraints may limit greater obligations or the ability of some landlords to
respond to ‘good practice’ guidance.
8.23 Seventh, several stakeholders, tenants and social landlords raised the issue of Value for
Money. Tenants who were less satisfied with the rent charged were those who had
considerable problems with the condition of their property, or the quality of repairs and
improvement works done. This suggests a need for greater focus on Value for Money
alongside affordability. This might involve more specific monitoring of standards, as is the
case in England through a Value for Money (VfM) Standard.14 The standard and
associated metrics do not explicitly link rents to VfM or link rents to the quality of
individual properties, but encourage landlords to demonstrate economy, efficiency and
effectiveness.
14 Regulator of Social Housing: Value for Money Standard

119
References
Birch, J. (2017) The LHA Cap is set to Leave Welsh Landlords in a Sticky Situation, Inside
Housing, 21st April 2017
Blood, I., Copeman, I. and Finlay, S. (2016) Supported Accommodation Review: The scale,
scope and cost of the supported housing sector, Report for DWP and DCLG
DCLG and DWP (2017) Funding Support Housing: Policy Statement and Consultation
DWP (2015) Welfare Reform and Work Bill: Impact Assessment for the benefit cap
DWP and the Welsh Government (2012) Concordat between the UK Government's Department
for Work and Pensions and the Welsh Government
Equality and Human Rights Commission (2017) Public Sector Equality Duty
Essex, S., Smith, B. and Williams, P. (2008) Affordable Housing Task and Finish Group,
Affordable housing in Wales: an independent report to the Minister for Housing (The Essex
Review)
Freud and Green (2016) Housing Benefit and Universal Credit: Written statement - HLWS273,
Lord Freud and Damian Green, 21st November 2016.
Government Equalities Office (2011) Equality Act 2010: Public Sector Equality Duty What Do I
Need To Know? A Quick Start Guide For Public Sector Organisations
HM Treasury (2015a) Statement of funding policy: funding the Scottish Parliament, National
Assembly for Wales and Northern Ireland Assembly
HM Treasury (2015b) Spending Review and Autumn Statement 2015
KAS, (no date) Rent Policy: Additional Analysis of Housing Benefit and Rent Data, Unpublished
internal working document
Legislation.gov.uk (1998) Human Rights Act 1998
Legislation.gov.uk (2006) Government of Wales Act 2006, Schedule 7
Legislation.gov.uk (2010) Equality Act 2010
Legislation.gov.uk (2014) Housing (Wales) Act 2014
Legislation.gov.uk (1996) Housing Act 1996
Mills & Reeve LLP (2009) R (Weaver) v London & Quadrant (2009)
Owen White Solicitors (2009) R (Weaver) v London & Quadrant Housing Trust [2009] Civ 587
120
Pringle S. and Brisley R, SQW Ltd (2010) An Evaluation of the Essex Review Implementation
Programme, Welsh Assembly Government, Merthyr Tydfil, Crown Copyright 2010.
Welsh Government (2013) New Policy for Social Housing Rents, December 2013, Internal
Briefing Paper
Welsh Government (2014) Impacts of Welfare Reforms on the Social Rented Sector Report of a
Welsh Government Task and Finish Group
Welsh Government (Updated 15 July 2015) Housing (Wales) Act 2014
Welsh Government (2016a) Taking Wales Forward 2016-2021
Welsh Government (2016b) Housing pact between Welsh Government, CHC and WLGA
Welsh Government (2016c) Taking Wales Forward Welsh Government’s Well-being Objectives
Welsh Government (2017a) Specification for: Rent Policy Review
Welsh Government (2017b) Prosperity for All: the national strategy
UK Government Select Committee on Social Security (2017) The Future of Supported Housing
i
Appendix A – Landlord questionnaire
The Welsh Government has asked a team of researchers, led by Heriot Watt University to undertake a review of
the Welsh Government’s Social Housing Rent Policy to ensure it remains appropriate and sustainable.
The review will cover the effectiveness of the current rent policy, implications of wider changes
and recommendations for future rent policy.
We are contacting local housing authorities and housing associations to which the rent policy
applies to ask them to take part in this survey. After submitting the Survey Monkey response,
the researchers will be in touch to arrange a time to discuss the issues more fully by
telephone. All the responses provided are treated in confidence and will be reported in an
anonymised way.
For further information about the research, please contact - Heriot Watt research team:
Mandy Littlewood 07866 476 752
Welsh Government:
Lucie Griffiths (research) - 0300 025 5780 [email protected]
Jen Welsby (policy) – 0300 062 8161 [email protected]
Introduction
ii

iii
iv

v

vi

7

8

ix

10

xi
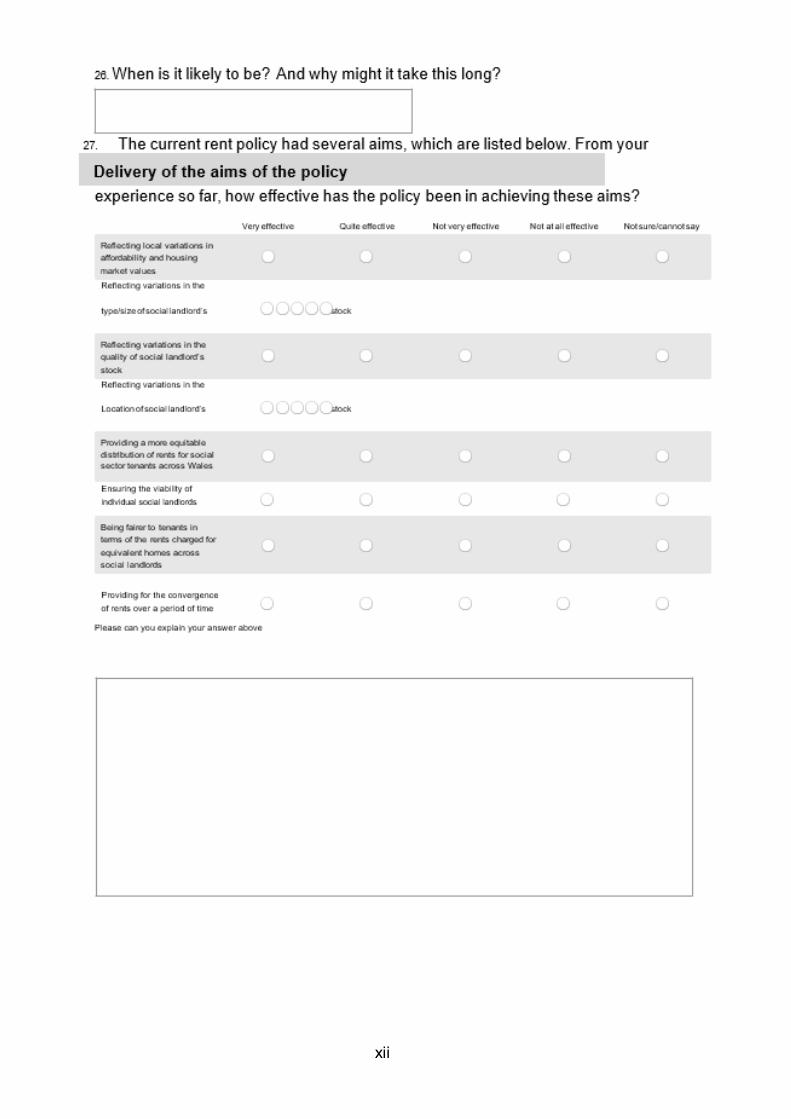
xii

13

xiv

xv

xvi

xvii
Appendix B – Case study and stakeholder interview topic guides
Case Studies
The research is designed to focus on the following;
(a) The impact of rent policy on borrowing capacity
(b) The ability to deliver a range of affordable housing types across Wales
(c) The ability to deliver WG policy in different economic and housing market area
Background (informed by basic data drawn from electronic survey/secondary work).
1. Are there any special background housing issues about your organisation that you
wish to raise, e.g. stock mix, number of areas active in, types of residents, WHQS,
the history of the organisation, relationships with LA(s), social rents v market rents in
your areas and broad impact of welfare reforms?
Rent policy
2. Please outline your current position on rent policy – using existing/new policy/rent
matrix/other?
3. Describe your transitions to target rent bands, by type/area, service charges?
4. Please update us on de-pooling progress?
5. Are there alternatives to using the SAP rating measure to capture the quality of
homes?
Impacts
6. How does your rent policy interact with local housing and labour market(s)?
7. What impact has this policy had on arrears?
8. What impact has this policy had on applications/departures?
9. Can you describe the impact on fairness/capacity to charge rents which reflect
quality/location of dwelling and tenant satisfaction/disadvantaged groups?
10. How has the policy impacted on development programme by type of
property/product?
11. What impact has it had on the quality of new build and planned maintenance
12. What impact has it had on finances, value of stock and not least borrowing capacity?
13. Others? Barriers to developing affordable housing? Lower capacity to respond to
housing need?
The case for reform

xviii
14. What do you see as the strengths and weaknesses of the current government rent
policy?
15. How would you suggest tackling these weaknesses?
16. Do you have other suggestions?
17. What plans do you have for the future in rent policy terms?

xix
Stakeholder interviews
We are conducting research for the Welsh Government to review the operation of its social
rents policy. We have conducted a survey of all social landlords in Wales and are currently
conducting more detailed case studies of 9 landlords.
As part of the project we are conducting interviews with a number of national stakeholders.
The purpose of these interviews is:
To identify and assess the impact of external influences on social landlords.
To inform any recommendations about the future of rent policy.
1. Equalities Act
Does rent policy need to respond to the Equalities Act?
The Equality Act 2010 obliges social landlords to ensure that their rent policy (= a
public function) does not discriminate. Does this need to be reflected in national rent
policy, or should it be left to individual landlords?
2. LHA cap: impact on tenants
What is the impact of the extension of the LHA cap to social tenants likely to be?
What patterns in terms of geography, types and sizes of property will be impacted?
In particular what are the implications for sheltered and supported housing (likely to be
hardest hit due to service charges)?
Should rent policy be adjusted to reflect these impacts?
3. Restrictions on housing support for 18-21s.
What is the impact of the end to automatic entitlement to housing support for 18-21 year
olds likely to be?
Should rent policy be adjusted to reflect these impacts?
4. Shared Accommodation Rate: impact on tenants
What is the impact of the extension of the Shared Accommodation rate to single social
tenants aged under 35?
(How) should rent policy be adjusted to mitigate these impacts?
5. Impact of welfare reform on landlords and lenders
Does welfare reform threaten to undermine the financial stability of individual social
landlords?

xx
Does it threaten to undermine the ability of the sector to deliver Welsh Government targets
on new housebuilding and meeting the Welsh Quality standard?
Are there any regional/ property types variations?
Can rent policy be adjusted to mitigate these impacts?
6. Supported Accommodation Review
From April 2019 LHA rates will apply to all supported accommodation.
What are the implications for landlords and tenants in Wales?
Can rent policy be adjusted to mitigate these impacts?
7. Impact 1% reduction in social rents in England
How will the UK Government policy of reducing social rents by 1% per year in England
impact on the Wales, e.g. through the block grant?
8. Are there any other external influences that we should be aware of?
xxi
Appendix C – Landlord survey results on wider policy impacts
Wider impacts
The wider impacts of the policy were also explored, through consideration of the capacity of
landlords to borrow and develop (as shown in Figure 3.12 in Chapter 3). That showed that
more positive impacts were felt on the ability to increase supply and to deliver the business
plan, followed by the stock valuation and ability to borrow, with less impact on the terms of
borrowing.
“Additional revenues generated have allowed us to contribute towards meeting
WHQS, provide more affordable homes and increase housing supply.”
The positive impact on the delivery of WHQS was greater than on mid-market
rent/intermediate renting, though. A few landlords said they would welcome guidance or
good practice examples on intermediate renting within/alongside the Housing Revenue
Account.
A few other landlords expressed the view that you ‘cannot get intermediate renting to work’
at Local Housing Allowance rates and so (at the time of the survey) felt that intermediate
renting was not a viable option for them. The limits of the Local Housing Allowance on wider
development viability were also raised, in relation to certain types of dwelling (smaller
properties, sheltered/older people’s housing, larger/family housing).
The recent announcements about the proposed halting of the policy to apply the Local
Housing Allowance cap in social renting and the announcement that there will be a
supported accommodation allowance may encourage more development in future.
However, the detail of what an ‘appropriate rent’ for supported accommodation might be
(and what type of sheltered housing would meet the specification of supported
accommodation) remains to be seen.
Some landlords said they were trying to ‘design out’ service charges as far as possible in
new-build developments but this was not possible in all cases (e.g. for sheltered provision).
It was also often at odds with other policies (e.g. fire safety and communal services).
Where ‘wider impacts’ of the rent policy were felt to be positive, this related to the financial
benefits of being able to increase rents by CPI+1.5% and the additional £2. This had given
landlords the scope to invest but there were still some concerns about the future. Some
landlords felt that the Local Housing Allowance cap was a ‘black cloud’ over the rent policy,
while others pointed to the risk of a rent freeze or cut like in England (though others felt
there was no appetite for this within the Welsh Government).
xxii
Landlords identified a range of factors impacting on their capacity to develop and deliver
regeneration activity.
The need for rent increases to fund building at scale (which the policy had so far
enabled)
Nervousness about what the future might hold had led to some risk averse decision-
making. There was a common theme of the need for longer-term clarity to inform
development plans for new-build.
The need for the flexibility to switch from social rents to affordable rents was
suggested by a few landlords, where intermediate rents were not viable due to the
low Local Housing Allowance rate.
The challenge of regeneration in low rent areas was identified, meaning that low
Local Housing Allowance rates might potentially stifle investment.
Development was constrained in different ways – there was land in deprived areas
but lower rents meant this was not viable for development. There was some more
expensive, better-located land but rents were also too low to be viable.
Some noted the need to increase the density of smaller properties to be viable at low
rents.
There was also a lack of supply of family housing and overcrowding in some areas
but the view that family housing was not viable to build either.
Low rents were felt to ‘chip away’ at service quality and viability and were at odds
with the strategic focus on the regeneration of the Valleys and other deprived areas
within the cities.
It was noted that stock could not be remodelled from two and three bedroom
properties into one-bedroom properties overnight and decisions might be regretted if
the policy changed
The recent halt on the policy on the Local Housing Allowance cap provides evidence
of how policy can change unexpectedly.
A few landlords said they were at or approaching the debt ceiling and were hoping that the
Welsh Government would look at the flexibility around development viability and debt
ceilings to enable them to deliver additional new-build through additional borrowing.
External influences - Welfare reform
There was a great amount of concern for the future, arising from the various proposed and
ongoing cuts to social security. Landlords were concerned about a wide range of welfare

xxiii
reforms15, particularly the introduction of Universal Credit full service and the Local Housing
Allowance cap, which almost three-quarters of landlords highlighted as having a negative
impact. The remaining ten landlords said that all the welfare reforms would have a negative
impact. The Benefit Cap and the Local Housing Allowance Shared Accommodation Rate for
the under 35s were raised specifically by around one in three landlords and the Bedroom
Tax was specifically mentioned by one in four landlords.
The main impacts of welfare reform identified for tenants were16:
Poverty/financial hardship for tenants (mentioned by 26 landlords)
Eviction/homelessness or tenancy failure (14)
Rent arrears (11)
Debts (8)
Increased anxiety/stress (4)
Problems due to digital exclusion (2) inability to access housing (2) and enforced
sharing (1).
The main impacts of welfare reform identified for landlords were17:
An increase in rent arrears and bad debts (mentioned by 30 landlords)
More complex tenant needs and a broader range of staff skills to deal with tenants’
issues e.g. money advice, debts (19)
Increased costs and overheads associated with income recovery, void management
and maintenance and tenancy sustainment (18)
Reduced rental income, concerns about cash flow and risk to the viability of the
business (15)
An increase in evictions, abandonment and tenancy sustainment difficulties (9)
A reduction in the level of service quality/the need for cost cutting (8)
New-build/development may be threatened (6)
The stock may need to be re-configured or shared tenancies considered (2).
Landlords summed up the wide array of issues that they would be facing:
15 Question: Which welfare reforms do you consider will negatively impact on your organisation and your tenants? 16 Question: How do you think your tenants are likely to be impacted by the Welfare Reforms you identified? 17 Question: How do you think your organisation will be impacted by the welfare reforms you identified?

xxiv
“Increased court costs, void loss costs, costs of re-servicing voids, increased staff
costs (for less return), increased transaction costs to collect differentials between
Local Housing Allowance and LA rent levels. Higher requirement for support
services and advice. Higher tenancy turnover. Higher debt levels for tenants.”
(LSVT, 5000+ properties)
“Rental income will be much more vulnerable and less reliable (due to the
change from HB to UC), rent arrears will increase, bad debts will increase, there
will be increasing pressures on frontline staff, pressures on income will affect our
ability to deliver services, eviction and abandonment rates will increase; thus
increasing turnover and void costs. This will have a negative impact on
community cohesion and sustainability. There will be greater demand on services
such as money advice, support services etc. and less money available to fund
such services. May impact ability to develop in some areas.” (Traditional HA,
2,000-5,000 properties)
“The impact will be a gradual decline in our overall income collections thus
impacting on our long-term viability to continue to provide the range of services
we currently deploy”. (LSVT, 2,000-5,000 properties)
“Increased arrears and bad debts. Increased demand on limited staff and
financial resources e.g. Tenancy Support and Homeless Prevention. Viability of
some accommodation threatened due to de-pooling of service charges.
Increased staff training. Indirect impact on other services including Social
Services, Health. Increased demand for new build properties (LHA)
Mitigation strategies and activities
The vast majority of landlords (40 of 44) said they provided financial inclusion services and
welfare reform mitigation (42) and two-thirds offered support helping tenants into work (28),
while more than one in three offered other services also (17)18.
18 Question: Which, if any of the following services do you provide to tenants? (Tick all that apply). Response categories: Financial inclusion services; Welfare reform mitigation; Helping tenants into work; Other (write in).

xxv
Landlords were asked what they were doing to respond to welfare reforms that were already
in place19. A wide range of strategic and operational activities have been put in place, under
the following themes.
Increasing or restructuring staffing
One of the most common responses, from most landlords, was to reconfigure staffing to
respond to the greater financial hardship experienced by tenants. Landlords have recruited
additional staff to meet the challenges of welfare reform – staff to deliver money advice,
debt advice and other financial inclusion services, rent collection staff and tenancy
sustainment staff.
In some cases, where resources were tighter, landlords have restructured their existing staff
complement and conducted staff training to meet the changing needs of the business.
An increased focus on prevention activity
Just under half of landlords reported having taken steps to improve their business
intelligence. This included investing in new/additional IT/software solutions to help them to
improve their able to identify the tenants at greatest risk.
Other prevention activity included ‘active outreach’ with staff working to identify those in
need of support – tenants just falling into arrears, young people aged under 35 years and
people under-occupying their property. Some landlords were actively encouraging and
incentivising tenants to transfer to smaller properties.
Some landlords were looking at policies to prevent tenants getting into financial difficulties.
A few landlords said they had restructured rents slightly to reduce the rent charge in smaller
properties (to ease the impact of the proposed Local Housing Allowance cap) and a few
landlords had changed their allocations policies to discourage under-occupancy.
Education and awareness raising activities were reported by some landlords (though a
minority). It may be that the timing of the survey, in July 2017, was felt to be too far in
advance of the timing of the proposed changes to Local Housing Allowance (April 2019) to
merit that strategy.
19 Question: What action has your organisation taken so far to mitigate the impact of welfare reforms already in place?

xxvi
Financial mitigation was also being used to prevent hardship, with local authorities and
others making tenants aware about Discretionary Housing Payments and some
associations also provided monetary support projects to ease extreme hardship.
Business Planning
Restructuring the business to increase the resource available for additional tenancy support
and income recovery had sometimes led to cost-cutting measures. For some landlords, this
was described as ‘efficiency savings’ and better ‘value for money’ while others felt they had
cut costs (or would need to) which would lead to a reduction in service level that was not
delivering value for money.
A few landlords said that they had already increased their bad debt provision in anticipation
of the negative impact of full service Universal Credit, with Direct Payments. Some landlords
had been conducting a revision of their Business Plan and it was quite common for
landlords to be developing a wider range of scenarios in their ‘stress tests’.
Improving operational performance
As well as reducing costs and improving efficiencies, other measures to increase
operational performance were shared. A few landlords mentioned active arrears
management strategies, including early intervention (coupled with better IT) and ‘nudge’
theories to encourage prompt rent payment (e.g. using text alert services).
Although most strategies were built on offering advice and support, there were a few that
were more clearly focused on limiting the financial risk to the organisation – requiring rent to
be paid by Direct Debit, requiring rent in advance and even a proposed affordability test for
new tenants to prevent arrears. Some admitted that the latter strategy was very much at
odds with a need-based allocation system, though.
Expanding ‘wider role’ activities
Some landlords reported that welfare reform had led to an expansion in the range of
activities they were engaged in, to include Digital Inclusion projects, with staff undergoing
‘Digital Champion’ training, as well as employability projects (mainly in larger associations).
Working in partnership
It was quite common for local authorities to refer to the development of strategic
partnerships to mitigate against the impact of welfare reform. However, building
partnerships with other organisations was a strategy used by some housing associations
also, with associations working with the local authority, the third sector and other

xxvii
associations. Some landlords were sharing financial inclusion services, for example, to
reduce overheads.
Several landlords were also involved in partnering arrangements with the DWP through the
Direct Payments pilot. Less active than ‘partnering’ were sign-posting activities – referring
tenants to other agencies at an early stage, for money/debt advice and energy advice if the
association does not have its own provision or to foodbanks or other support providers.
External influences - The Local Housing Allowance cap
At the time of the survey research, there was a lot of activity, planning and development
underway in readiness for the full impact of the LHA cap, (at that stage planned for April
2019) to be felt. Activities that landlords were engaged in included information and advice,
developing staff roles, piloting/looking at shared tenancy approaches and possible
mitigation. However, there were expected to be negative impacts – on financial hardship,
rent arrears, bad debt provision, evictions and consequently homelessness.
Landlords with sheltered housing were very concerned about how the Local Housing
Allowance cap might impact on their tenants. For example, it may well be the case that the
way that services had been designed over recent years, responding to funding constraints
by offering flexible care and support, for example, would now put some provision below the
scope of the supported housing fund. Sheltered housing was one area where landlords felt
there was a need for separate consideration in the rent matrix and wider policy.
Since the survey was conducted, the Government announced that the Local Housing
Allowance cap would not apply to the social rented sector and that there would be separate
provision for supported accommodation. However, detail of the definition of ‘supported
accommodation’ has not yet been provided. It may be that sheltered housing without
support or care on-site may be included in that provision.
Some landlords expressed the view that the Welsh Government rent policy alongside the
Local Housing Allowance cap created a ‘double whammy’ where those who may be able to
be flexible about their rents (across different property types or localities) in order to mitigate
the impact of the proposed Local Housing Allowance cap were unable to do so because of
the constraints of the Welsh Government rent policy.
Another perspective on the Local Housing Allowance cap was that it limited the
effectiveness of the rent policy, as landlords were responding not just to the policy but with
one eye on the Local Housing Allowance rates.

xxviii
“With the current rent policy, our income will fall. With a more flexible rent policy,
we could mitigate this” (Traditional HA, 5,000+ properties)
Potential negative impacts of the Local Housing Allowance cap
For properties with service charges, the most significant negative impact of Local Housing
Allowance limits were expected to affect bedsits, one-bedroom properties and flats with a
lift. This was also true for properties without service charges, but the negative impact was
perceived to be less significant.
Figure C.1: Potential impact of the LHA cap on properties with service charges, by property size and type
Source: Rent Review survey, July 2017
Question: How would you rate the likely impact on tenants of the limits to Local Housing Allowance in the
following size/type of properties with service charges? Bedsits; 1-bedroom properties; 2-bedroom properties;
3-bedroom properties; Flats without a lift; Flats with a lift; Houses. Response categories as in the figure.
The expected negative impact of the Local Housing Allowance cap on smaller properties
and flats with service charges was considerable, with more than two-thirds of landlords
expecting a significant negative impact on tenants.
A total of 27 landlords foresaw a negative impact for tenants across more than four of the
seven property types asked about (for stock with service charges). Eight were LSVTs,
fourteen were traditional housing associations and five were local housing authorities. In 17

xxix
of the 27 cases, rents were below or near the Local Housing Allowance cap while in four
cases rents were higher than the LHA and in six cases data on rents was missing (these
were landlords with a spread of stock across numerous BRMAs).
Properties were still expected to be adversely affected where there were no service
charges, but to a lesser degree (Figure A2).
Figure C.2: Potential impact of the Local Housing Allowance cap on properties with NO service charges, by property size and type
Source: Rent Review survey, July 2017
Question: How would you rate the likely impact on tenants of the limits to Local Housing Allowance in the
following size/type of properties with NO service charges? Bedsits; 1-bedroom properties; 2-bedroom
properties; 3-bedroom properties; Flats without a lift; Flats with a lift; Houses. Response categories as in the
figure.
There were fifteen providers who expected negative impacts for tenants in more than four of
the seven property types, of whom four were LSVTs, nine were traditional housing
associations and two were local housing authorities. Most had rents at just below or near
the Local Housing Allowance cap.
Having rents close to the Local Housing Allowance at present, coupled with service charges
were felt to be a significant challenge for rent affordability in future. Having rents that were
very similar to, or above, the Local Housing Allowance rate (see below under rent
xxx
convergence), was identified as more common for landlords with stock in Blaenau Gwent,
Cardiff, Merthyr Tydfil, Monmouthshire, Powys, Rhondda Cynon Taf and Torfaen.
Planning for the LHA cap and reforms to supported accommodation
When asked what they had done so far in anticipation of future welfare reforms20 many
organisations referred to the activities already discussed above. Those who provided
additional information most commonly said their response so far was “Lots of modelling!”.
Other activities included providing information and advice to tenants, although one landlord
said they were reluctant to engage tenants ‘too early’ in case they were giving out incorrect
information, as the policy impacts were not clear at that stage.
Risk profiling or identifying tenants who were likely to be affected by reforms was also
mentioned. Some landlords were piloting or exploring the potential for shared tenancies for
younger, single tenants and some were reviewing their policy on rents and service charges.
Some of those with sheltered housing were reviewing service charges and funding
mechanisms.
Many landlords were also conducting strategic activities across the local authority or region,
including lobbying the Welsh Government and Westminster Government as well as shared
research/business intelligence activities.
External influences - equalities
In terms of equalities, most landlords expressed the view that tenants were similarly
affected by the rent policy, but some landlords felt that younger tenants, single people and
lower income households would be relatively worse off (Figure A3).
Seven organisations did not provide an answer for this question, spread across a range of
providers and across those in a single local authority and more locations. This was mainly
because these landlords did not feel able to comment on the likely impacts of the policy, or
felt that in order to do so they would need to undertake more detailed analysis.
20 What action has your organisation taken so far to prepare for forthcoming reforms (including the application of the Local Housing Allowance and reforms to supported accommodation)?

xxxi
Figure C.3: Whether any particular groups are more or less better-off as a result of the rent policy, all landlords
Source: Rent Review survey, July 2017
Question: Are any particular groups more or less better-off as a result of the rent policy? Older people;
Younger people; Disabled people; Men; Women; People from minority ethnic groups; Single people; Families;
Low income households; Households on benefits. Response categories as in the figure
Those landlords who provided more information about the differential impact expressed the
views that:
welfare reforms would have a far more detrimental effect on tenants than the rent
policy
those in smaller properties would be worse off (since the £2 allowable increase would
be a higher proportion of the rent on a smaller property compared with a larger one)
everyone benefits or is adversely affected in the same way
the rent policy had limited impact on tenants
people not on Housing Benefit, and older people on fixed incomes in particular,
would be more adversely impacted.

xxxii
Appendix D – Definitions of affordability
Defining affordability for working tenant households
There is ready agreement with the broad principle that social sector rents should be
‘affordable’ for households in low paid work. For example, since the introduction of assured
tenancies in 1989 it has been Housing Corporation policy that RSL lettings should be:
‘accessible to people on low incomes, whether or not they are in paid
employment or in receipt of housing benefit. Associations are therefore
expected to set and maintain their rents at levels which are within the reach
of those in low paid employment.’ (1)
On the other hand, there is less consensus on how to define and measure affordability.
Multiple measures are now in use, reflecting the diversity of views on how measures should
be applied and the appropriate levels at which rents and other housing costs should be
judged to be affordable, whichever measure is used. That said, there are three main groups
of affordability measures in use across the UK:
Rent to income ratios are the most commonly used affordability measures, in
large part because thy are simple to understand and apply. They are usually
specified on the basis of rent as a percentage of household income, taking into
account receipt of housing benefit and other benefit income.
Residual income measures focus on disposable income above a pre-defined
standard for non-housing needs such as Universal Credit Personal Allowances. In
some instances, ‘benefits-in kind” such as the value of free school meals are
factored into the analysis.
Work incentive measures look at the connection between taxes, rents and state
benefits and if the create work incentives or disincentives for tenants. They
typically involve looking at the depth of housing benefit dependency, ‘replacement
ratios’ and effective marginal rates of tax resulting from a combination of tax and
benefit deductions from gross earnings.
The purpose of this Appendix is to:
Consider the background to contemporary discussions of affordability in the
United Kingdom,

xxxiii
Provide a practical guide to the main affordability measures in use today and in
particular the three main affordability measures used to analyse the affordability
of current and projected rent levels in the main paper.
Tease the particular characteristics of each type of measure and to illustrate
these using calculations based on the UK tax and benefit system relate in
2018/19.
The discussion and figures in this annex generally refer to household incomes but, as with
the affordability analysis set out in the main report, any income from earnings is assumed to
come from one earner in the household, with tax and national insurance deducted according
to the rates that applied in 2018/19. As in the main the figures generally exclude Council
Tax and any associated Council Tax Reduction Scheme Rebate.
Limits of affordability
Before examining each of the affordability measures, it should be noted that there are a
number of inherent limitations to all affordability measures. Those limitations mean that
while affordability is a critical issue, it can never be the sole factor involved in determining
views on average rents, or in shaping detailed rent setting policy.
The first limitation is that affordability measures relate to households, while rents must be
set for dwellings. Households, with varying characteristics (e.g. size, age, and disability)
may appropriately occupy dwellings of the same size. Since the introduction of the national
housing benefit scheme to assist low income households in 1972, it has not generally been
considered appropriate to charge differential (i.e. income-related) rents for the same
dwelling.21
The second limitation is that larger families inevitably require higher incomes for their non-
housing expenditures, than smaller households. This is reflected in the levels of Income
Support provided for out of work households, and the income thresholds set for households
to receive the maximum level of housing benefit. Those income requirements are not in any
way related to the patterns of earnings for either different household types, or households
occupying dwellings of the same size.
21 This practice continues in public housing in the Australia and Ireland. In both countries expert opinion is highly critical of the practice which limits the income streams of landlords, making maintenance and borrowing difficult.

xxxiv
On any measure, a given rent and a given level of earnings will consequently give different
affordability scores for different household types. With some measures larger families have
lower affordability scores (e.g. gross rent to net income ratios), while with some other
measures larger families have better affordability scores (e.g. residual income and housing
benefit dependency measures.
In any case constructing a rent policy to produce broadly uniform affordability measures can
result in a pattern of rent differentials between properties of different sizes that are not
desirable. Attempting to equalise rent to income ratios, for example, would result in very
high differentials between the rents for smaller and larger dwellings. Attempting to equalise
residual income measures would, perversely, result in lower rents for larger dwellings.
The third limitation is that affordability measures do not take account of variations in the
wider housing market. Thus, for example, house prices and private market rents vary far
more across Wales than levels of earnings.
It follows that while social sector rents are much lower than private rents in most parts of
Wales, in some cases they are very close to market rents. This raises concerns about the
purpose of social sector housing lettings in those markets, about their viability, and the
continuing potential risk from government policy on housing benefit limits (notwithstanding
the withdrawal of the proposal to introduce LHA caps).
Thus, if social sector rents are to be competitive, and clearly below market levels, and if
detailed rent policies are to set a coherent relationship between rents for properties of
different sizes and characteristics, other factors need to be considered, as well as concerns
about affordability.
A further limitation is that none of the structured affordability measures take account of the
wider impact of the quality and location of the dwelling on the households living standards.
For instance, low standards of thermal efficiency impose increased heating costs on
households, while dwellings located at some distance from either shops or potential places
of employment may impose higher transport costs on households. In that sense a more
comprehensive affordability measure would relate to the energy efficiency and location of
dwellings, rather than just to their rents.
In this context affordability remains a critical issue, and it is important to understand the
characteristics of different affordability measures, and the ways they reflect widely differing
household circumstances, in order to reach a rounded view of the contribution they can

xxxv
make to framing rent policy. Each of the main forms of affordability measure are considered
in turn below.
Rent to income ratios
Rent to income ratios are the most commonly used form of affordability measure, and they
are used in Australia, Canada and the USA, as well as well as by the European
Commission to construct its housing cost ‘overburden rate’ (2).
In the UK they have been widely used in debates about social sector rents, particularly
since the introduction of assured tenancies and rents for housing association lettings since
1989. There are, however, different views both about the most appropriate form of rent to
income ratio, and about the appropriate level of those ratios.
One dimension of the UK debate has been an equitable view that social sector rents should
correspond with the housing costs freely entered into by home buyers, but adjusted to take
account of the fact that home buyers are acquiring a capital asset, as well as seeking the
beneficial occupation of the home they are buying. On that basis, for example, Alan
Holmans suggested that it might be reasonable to expect tenants to pay rents of some 20%
of their incomes (3). Drawing on Family Expenditure Survey data related to all home buyers,
rather than just first-time buyers, John Hills suggested that a more appropriate ratio would
be ‘significantly lower than 16%’ (4).
However, it should also be noted that home buyers with lower incomes devote far higher
proportions of their incomes to their mortgages and related housing costs. In 2010 the
average mortgage costs for home buying households represented 16.5% of their average
disposable incomes; but for home buyers within the two lowest incomes quintiles average
mortgage costs represented 35.4% of their incomes (5).
Many other views on appropriate rent to income ratios have been expressed, but without
there always being any explicit rationale for their selection. It may be noted, however, that a
rent policy based on an affordability target significantly higher than reflected in the
expenditure choices of home buying households will inevitably limit the numbers of working
households that find renting from social sector landlords preferable to house purchase.
xxxvi
Alternative ratio-based measures
As noted in the introduction, there are divergent views on the most appropriate method for
measuring rent to income ratios. There are two main alternative rent to income measures:
Gross rents as a percentage of net incomes before housing costs. Net incomes
comprise net earnings plus, wherever applicable, child benefit, working tax credit
and housing benefit.
Rents net of housing benefit as a percentage of net incomes, comprising net
earnings, and any child benefit or working tax credit.
The net rent to income ratios have the merit of focusing attention on the extent of the
poverty trap, and identifying the peak ratios at the income level where tenants cease to be
dependent on housing benefit. However, this approach can be unintentionally misleading.
This is because peak ratios do not identify those tenants that literally have the greatest
affordability problems, in the sense that they have the lowest disposable incomes after they
have paid their rent.
The advantage of the ratios produced utilising the gross rent to net income approach is that
they meet the ‘common sense’ expectation that the highest ratios are incurred by those with
the lowest incomes. For this reason, these are the rent to income ratio measures used for
the purpose of the analyses in the main paper.
Figure D.1 illustrates how the different definitions of the rent to income ratios operate, and in
particular shows how they converge at the point where tenant incomes are such that they
are no longer eligible for housing benefit.
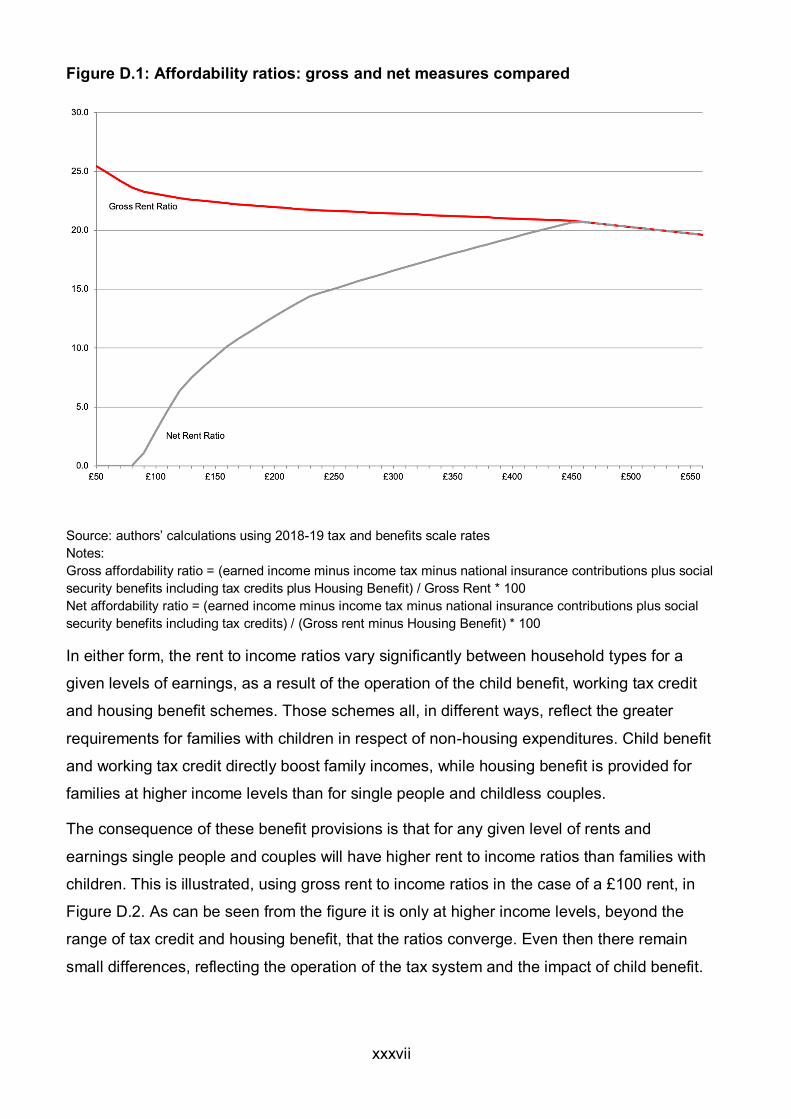
xxxvii
Figure D.1: Affordability ratios: gross and net measures compared
Source: authors’ calculations using 2018-19 tax and benefits scale rates
Notes:
Gross affordability ratio = (earned income minus income tax minus national insurance contributions plus social
security benefits including tax credits plus Housing Benefit) / Gross Rent * 100
Net affordability ratio = (earned income minus income tax minus national insurance contributions plus social
security benefits including tax credits) / (Gross rent minus Housing Benefit) * 100
In either form, the rent to income ratios vary significantly between household types for a
given levels of earnings, as a result of the operation of the child benefit, working tax credit
and housing benefit schemes. Those schemes all, in different ways, reflect the greater
requirements for families with children in respect of non-housing expenditures. Child benefit
and working tax credit directly boost family incomes, while housing benefit is provided for
families at higher income levels than for single people and childless couples.
The consequence of these benefit provisions is that for any given level of rents and
earnings single people and couples will have higher rent to income ratios than families with
children. This is illustrated, using gross rent to income ratios in the case of a £100 rent, in
Figure D.2. As can be seen from the figure it is only at higher income levels, beyond the
range of tax credit and housing benefit, that the ratios converge. Even then there remain
small differences, reflecting the operation of the tax system and the impact of child benefit.

xxxviii
It does not, however, follow that rents for bedsit and one bed dwellings should be set
significantly lower than those for family size dwellings, in order to (more or less) equalize the
rent to income ratios for single people and childless couples with those of families with
children. This would be to ignore the purpose of in work benefits, and the higher non-
housing costs of families that they are designed to assist.
Figure D.2: Affordability ratios for a range of households (£100/pw rent)
Source: authors’ calculations using 2018-19 tax and benefits scale rates
Residual income measures
The shortcomings of simple income have contributed to a growing interest in the use of
‘residual income’ measures of housing affordability (6).
Such measures are routinely used, for example, in the form of the ‘after housing costs’
measures of household poverty published each year by the Department of Work and
Pensions (7). The concept of residual incomes also lies behind statements that after paying
their rent, tenants should be left with sufficient income to pay for other essential expenditure
such as fuel, food, clothing, transport and so on.
There are debates about how residual income measures should be constructed, especially
in terms of defining an appropriate baseline for after housing cost incomes. The approach

xxxix
taken in this study has been to use the basic income allowances for Income Support22 and
the Universal Credit scheme for different household types. This is on the basis that:
These allowances can be taken to represent the UK Government’s implicit view of
the minimum income appropriate for different household types23.
They provide a practical basis for constructing residual income-based measures
of housing affordability.
This is not a wholly satisfactory baseline, as changes in Income Support policy will have a
knock-on effect on affordability scores. Historically, Income Support has been uprated by
inflation, rather than earning, it has become a less challenging standard relative to average
earnings. The 4-year freeze on Income Support and other working age benefits from
2016/17 to 2019/20 may well exacerbate this tendency.
A number of important efforts have been made at constructing independent measures of
minimum household income requirements (8). While the JRF’s ‘Minimum Income Standard’
has obtained a measure of support, there is no officially recognised current standard for
basic income requirements. Moreover, any shortfalls in residual incomes that are the result
of differences between an independently established income standard and the prevailing
Income Support levels cannot be tackled by varying rent levels. This is because Housing
Benefit was designed to prevent post-rent incomes falling below Income Support rates.
On saying that, the introduction of measures such as the LHA cap for private renters and
the ‘bedroom tax’ for social renters has meant that levels of Housing Benefit received are no
longer always sufficient to prevent incomes falling below Income Support levels. This has
led to a growing number of households with incomes below their applicable Income Support
allowances.
For working households that claim housing benefit, levels of residual income above the
Income Support thresholds are determined by the characteristics of the housing benefit
scheme, particularly the ‘earnings disregards’ (earned income that is excluded from the
means-test) and 'tapers' (the percentage by which benefit is reduced as income rises).
22 The Income Support allowances correspond with allowances for other ‘out-of-work’ benefits for people of working age such as Employment and Support Allowance (ESA) and Jobseeker’s Allowance (JSA). The also form the basis for the Housing Benefit Applicable Amounts. 23 Whilst Universal Credit is being phased in, relatively few households received it in 2017/18 and in any case the scheme is undergoing changes as it is introduced.

xl
Unless, some limit is imposed (e.g. by the benefits cap, or LHA rates), higher rent levels
result in a ‘£ for £’ increase in the level of housing benefit entitlement.24 Higher rents
therefore make no difference to the net incomes of tenants that are already in receipt of
housing benefit. This is illustrated in Figure D.3, which shows the case of a couple with two
children. It shows that, for any rent over £70 per week, the residual income measure is the
same for any family earning up to £290 per week.
Figure D.3: Residual income measures for a range of rents
Source: authors’ calculations using 2018-19 scale rates
Higher rents do, however, reduce the after-housing cost incomes and residual incomes of
tenants with higher incomes, especially for those with incomes just above the point where
Housing Benefits entitlement ceases.
It is only at higher earnings levels that differences in rent levels have any impact on the
residual income measure. This is because at that earnings level the family with a rent of £70
per week ceases to qualify for housing benefit. For tenants with higher rents continuing
24 This arises from the formula: Housing Benefit = 100% eligible rent minus 0.65*(net income minus
income support allowance)

xli
housing benefit dependency limits the rise in disposable incomes and thus depresses the
residual income measure.
Consequently, average residual income measures are of limited value, as rent differences
only impact on those households at the higher end of the earnings range. The small
changes in the average measure for all households reflect the far greater impact that higher
rents are having on households above a given level of earnings. In that sense residual
income measures are an indirect measure of housing benefit dependency.
Work incentive measures
The housing benefit scheme has the merit of ensuring that households are generally better
off in work than they are out of work, and dependent on Income Support (or equivalent
benefits, such as JSA or ESA). Whilst the ‘earnings disregards’ and the 65% taper ensure
that incomes are higher in work than out of work, they also imply that so long as a tenant
claims housing benefit they will be only slightly better off in work. Indeed, it is possible for
households to be worse off in work if they incur reasonably high travel to work expenses
and/or unassisted child care costs. For households with children there are further
complications resulting from the overlap of the housing benefit and tax credit schemes.
The earnings disregards are the amounts households are permitted to earn above the level
of the housing benefit personal allowances before they cease to qualify for the maximum
level of housing benefit. For single people the earnings disregard is just £5 per week, and
for couples the standard disregard is £10, whether or not they have any children. Those
disregards have been unchanged since 1988. The earnings disregards for lone parent
households are higher, at £25, but these should be seen in the context of the much lower
levels of personal allowances for lone parents, and the greater likelihood that they will need
to incur child care costs in order to work.
Above the levels of the housing benefit personal allowances and earnings disregards,
benefit entitlement is reduced by the 65% taper, and net disposable incomes grow very
slowly, particularly when the tax credit and council tax reduction schemes tapers apply at
the same time. The cumulative impact of the current housing benefit taper rates, in
conjunction with the tax and other means tested benefits that reduce net disposable
incomes, is shown in Table D.1. The incidence of high marginal rates of cumulative tax and
benefit deductions from gross earnings is generally referred to as ‘the poverty trap’.

xlii
Table D.1: The housing benefit poverty trap, 2018-19 (£)
With tax credits Without tax credits
Extra gross earnings 1.00 1.00
Less Income Tax @20% 0.20 0.20
Less National Insurance @12%
0.12 0.12
Less Tax Credits @41% 0.41 -
= After tax income 0.27 0.68
Less Housing Benefit @65% 0.176 0.442
Less Council Tax Reduction Scheme @20%
0.054 0.136
= New disposable income 0.04 0.102
Note: Cumulative deductions from each £1 of gross earnings
Source: authors’ calculations- note revised layout of table
The table shows, in particular, that where there is an overlap of the housing benefit and tax
credit tapers for families, this can leave them with nine pence disposable income from each
£1 additional gross earnings, falling to as little as four pence disposable income if the
council tax reduction scheme is taken into consideration. These cumulative deductions from
gross earnings can extend over a wide range of earnings, especially for households with
higher rent levels (9).
It is only when net incomes are no longer subject to the impact of benefit tapers, that they
then begin to rise significantly above Income Support levels. The impact of these features
on residual income ratios has already been seen above, and there is a similar effect on the
‘replacement ratios’, which measure Income Support entitlements as a percentage of net
working incomes.
The sharpness and range of the ‘poverty trap’ inevitably raises concerns about the lack of
financial incentives provided for low income households to undertake low paid work. Hence
the indicators of the severity and range of the poverty trap are described as work
disincentive measures. There are three main work disincentive measures. The first measure
is the incidence of housing benefit entitlement in itself, which is used as an indicator in the
main rents report. The second measure focuses on the cumulative marginal rates of
deduction from gross earnings over each £10 range of gross earnings. The impact of higher
rents in extending housing benefit dependency further up the income scale, and thereby
extending the range of very high levels of cumulative marginal deductions from gross
earnings is illustrated in Figure D.4.

xliii
Figure D.4: The cumulative marginal rates of tax and benefit deductions from earnings
Source: authors’ calculations using 2018-19 tax and benefits scale rates.
The third work disincentive measure is ‘replacement ratios’. These are more commonly
used in economic analyses of work incentives than in housing affordability analyses. The
replacement ratio is the ratio between the households’ net income in low paid work,
compared to their income when out of work and claiming full welfare benefits. The higher
net incomes are relative to benefit levels, then the replacement ratio is correspondingly
lower.
In practice work disincentive measures tend to extend further up the income scale for larger
families, and more so for couples than lone parents with the same number of children. This
is illustrated in Figure D.5. Setting aside council tax, it shows that, in the case of a £100 per
week rent, a lone parent with two children would need to earn just over £354 per week
(gross) before they ceased to qualify for housing benefit, while a couple with two children
would need to earn £453 week before they ceased to qualify. A couple with four children
would need to earn over £554 per week before they ceased to qualify for housing benefit.
The extent of the poverty trap for larger families is also that much more extended as they
need to occupy larger dwellings, which in turn will typically have higher rents.

xliv
It should also be noted that assuming the eventual full roll out of the new universal credit
regime this will have a major impact on benefit dependency and work incentives. On the
one hand the integration of housing and baseline benefits, and the removal of the
overlapping tapers shown in Table D.1, will result in a much shallower poverty trap, and in
many cases higher levels of disposable incomes for working households in receipt of
benefit. However, by the same token it will extend that shallower poverty trap much further
up the income scale, so that, for example, a couple with two children and a rent of £100 per
week would need (based on 2018-19 scale rates) to earn over £745 a week before they
ceased to qualify for universal credit.
Figure D.5: Gross weekly earnings required to escape housing benefit dependency (£100/pw rent)
Source: authors’ calculations using 2018-19 tax and benefit scale rates.
A concluding observation on affordability measures
Affordability is a critical, if illusive, concept that has a vital contribution to make towards the
formulation of rent policies. At the same time, the above discussion should have amply
made the point that different affordability measures imply different rent levels for different
households, and that other factors also need to be considered when making decisions on
rent setting policies.
xlv
References
(1) Housing Corporation (1989), Rent Policy and Principles, Circular HC 60/89
(2) A Freeman, C Chaplin & C Whitehead (1997), Rental affordability: A review of
international literature, Department of Land Economy, University of Cambridge;
J Ditch, A Lewis & S Wilcox (2001), Social housing, tenure and housing
allowance: an international review, Department for Work and Pensions.
(3) R Bayley (1988), The Rent Dilemma, Housing Vol 24 No 8, Institute of Housing.
(4) Hills J (1988), Twenty-First Century Housing Subsidies: Durable Rent-Fixing and
Subsidy Arrangements for Social Housing, STICERD, London School of Economics.
(5) Office for National Statistics, Family Spending 2011, Office for National Statistics, 2012.
Note that mortgage costs include capital repayments, but not endowment payments linked
to interest only mortgages
(6) K Hancock (1993), Can’t Pay? Won’t Pay? The economic principles of
affordability, Urban Studies 30:1.
(7) Department of Work and Pensions (Annual), Households below average income,
Department of Work and Pensions.
(8) M Padley & D Hirsch (2017), A Minimum Income Standard for the UK, Joseph Rowntree
Foundation.
(9) S Wilcox, J Perry, M Stephens & P Williams (2017), UK Housing Review 2017 (Table
118), Chartered Institute of Housing.

xlvi
Appendix E – Schedule of supporting tables
Annex 1 Housing Benefit analysis
Annex 2 Universal Credit analysis
Annex 3 Universal Credit analysis (CPI+0.5% scenario)
Annex 4 Universal Credit analysis (CPI+1.0% scenario)
Annex 5 Universal Credit analysis (CPI+1.5% scenario)
Annex 6 Two child policy (CPI+0.5% scenario)
Annex 7 Two child policy (CPI+1.0% scenario)
Annex 8 Two child policy (CPI+1.5% scenario)
Related Documents