membranes Article Removal of Different Dye Solutions: A Comparison Study Using a Polyamide NF Membrane Asunción María Hidalgo 1, * , Gerardo León 2 , MaríaGómez 1 , María Dolores Murcia 1 , Elisa Gómez 1 and José Antonio Macario 1 1 Departamento de Ingeniería Química, Facultad de Química, Campus de Espinardo, Universidad de Murcia, 30100 Murcia, Spain; [email protected] (M.G.); [email protected] (M.D.M.); [email protected] (E.G.); [email protected] (J.A.M.) 2 Departamento de Ingeniería Química y Ambiental, Universidad Politécnica de Cartagena, 30202 Cartagena, Spain; [email protected] * Correspondence: [email protected]; Tel.: +34-868-887-353 Received: 9 November 2020; Accepted: 9 December 2020; Published: 10 December 2020 Abstract: The removal of organic dyes in aquatic media is, nowadays, a very pressing environmental problem. These dyes usually come from industries, such as textiles, food, and pharmaceuticals, among others, and their harm is produced by preventing the penetration of solar radiation in the aquatic medium, which leads to a great reduction in the process of photosynthesis, therefore damaging the aquatic ecosystems. The feasibility of implementing a process of nanofiltration in the purification treatment of an aqueous stream with small size dyes has been studied. Six dyes were chosen: Acid Brown-83, Allura Red, Basic Fuchsin, Crystal Violet, Methyl Orange and Sunset Yellow, with similar molecular volume (from 250 to 380 Å). The nanofiltration membrane NF99 was selected. Five of these molecules with different sizes, shapes and charges were employed in order to study the behavior of the membrane for two system characteristic parameters: permeate flux and rejection coefficient. Furthermore, a microscopy study and a behavior analysis of the membrane were carried out after using the largest molecule. Finally, the Spiegler–Kedem–Katchalsky model was applied to simulate the behavior of the membrane on the elimination of this group of dyes. Keywords: characterization; dyes; molecular structure; nanofiltration; physico-chemical properties 1. Introduction Organic dyes (such as Acid Brown-83, Allura Red, Basic Fuchsin, Crystal Violet, Methyl Orange and Sunset Yellow) can be found in effluents of different industries (food, medical, painting) but the most pollutant industry is the textile. The discharge of these pollutants into the aquatic environment has a strong environmental impact due to the amount of toxic compounds they have and also due to the fact that they cause a decrease in the self-purification capacity of the water they are discharged into. This phenomenon prevents plants from performing photosynthesis and microorganisms from developing their biological activity [1]. Therefore, there are numerous methods of disposal of dye aqueous solutions, which can be grouped into physical, chemical and biological methods, but none of them stand out among the others [2–5]. Following this, new techniques are being investigated, including membrane technologies, because they offer low costs and give good yields [1,6]. As a result, membrane technology is attracting great interest. This technology is based on the separation of compounds by size and charge, as the membrane acts as a filter that retains the molecules which are larger than the pore and allows the water to pass through. In the last decade, more than 65% of research works have been based on the fabrication strategies of nanoporous membranes and their Membranes 2020, 10, 408; doi:10.3390/membranes10120408 www.mdpi.com/journal/membranes

Welcome message from author
This document is posted to help you gain knowledge. Please leave a comment to let me know what you think about it! Share it to your friends and learn new things together.
Transcript
membranes
Article
Removal of Different Dye Solutions: A ComparisonStudy Using a Polyamide NF Membrane
Asunción María Hidalgo 1,* , Gerardo León 2, María Gómez 1, María Dolores Murcia 1 ,Elisa Gómez 1 and José Antonio Macario 1
1 Departamento de Ingeniería Química, Facultad de Química, Campus de Espinardo, Universidad de Murcia,30100 Murcia, Spain; [email protected] (M.G.); [email protected] (M.D.M.); [email protected] (E.G.);[email protected] (J.A.M.)
2 Departamento de Ingeniería Química y Ambiental, Universidad Politécnica de Cartagena,30202 Cartagena, Spain; [email protected]
* Correspondence: [email protected]; Tel.: +34-868-887-353
Received: 9 November 2020; Accepted: 9 December 2020; Published: 10 December 2020�����������������
Abstract: The removal of organic dyes in aquatic media is, nowadays, a very pressing environmentalproblem. These dyes usually come from industries, such as textiles, food, and pharmaceuticals,among others, and their harm is produced by preventing the penetration of solar radiation in theaquatic medium, which leads to a great reduction in the process of photosynthesis, therefore damagingthe aquatic ecosystems. The feasibility of implementing a process of nanofiltration in the purificationtreatment of an aqueous stream with small size dyes has been studied. Six dyes were chosen:Acid Brown-83, Allura Red, Basic Fuchsin, Crystal Violet, Methyl Orange and Sunset Yellow,with similar molecular volume (from 250 to 380 Å). The nanofiltration membrane NF99 was selected.Five of these molecules with different sizes, shapes and charges were employed in order to studythe behavior of the membrane for two system characteristic parameters: permeate flux and rejectioncoefficient. Furthermore, a microscopy study and a behavior analysis of the membrane were carriedout after using the largest molecule. Finally, the Spiegler–Kedem–Katchalsky model was applied tosimulate the behavior of the membrane on the elimination of this group of dyes.
Keywords: characterization; dyes; molecular structure; nanofiltration; physico-chemical properties
1. Introduction
Organic dyes (such as Acid Brown-83, Allura Red, Basic Fuchsin, Crystal Violet, Methyl Orangeand Sunset Yellow) can be found in effluents of different industries (food, medical, painting) but themost pollutant industry is the textile.
The discharge of these pollutants into the aquatic environment has a strong environmental impactdue to the amount of toxic compounds they have and also due to the fact that they cause a decrease inthe self-purification capacity of the water they are discharged into. This phenomenon prevents plantsfrom performing photosynthesis and microorganisms from developing their biological activity [1].
Therefore, there are numerous methods of disposal of dye aqueous solutions, which can begrouped into physical, chemical and biological methods, but none of them stand out among theothers [2–5]. Following this, new techniques are being investigated, including membrane technologies,because they offer low costs and give good yields [1,6].
As a result, membrane technology is attracting great interest. This technology is based on theseparation of compounds by size and charge, as the membrane acts as a filter that retains the moleculeswhich are larger than the pore and allows the water to pass through. In the last decade, more than 65%of research works have been based on the fabrication strategies of nanoporous membranes and their
Membranes 2020, 10, 408; doi:10.3390/membranes10120408 www.mdpi.com/journal/membranes
Membranes 2020, 10, 408 2 of 16
applications in the field of water purification [7–12]. According to Wang et al. the solute and waterpermeability play important roles in the membrane performance. The membrane is able to separatepollutants from water mainly through size exclusion and solute diffusion [7].
The application of pressure driven membrane processes for the removal of low molecular weightorganic compounds from aqueous solutions has been described in several recent publications—for example, phenol and chlorophenol compounds [13]. A comparative study, using different organiccompounds (atrazine, aniline and phenol, and their derivatives 4-chlorophenol, 4-nitrophenol and4-nitroaniline) in aqueous solution and their elimination through NF-97 polyamide membrane,was carried out. The different physicochemical parameters of the organic compounds, the permeateflux and the rejection coefficient values were found to be correlated. The best correlation for therejection coefficient was obtained using the molar refractivity and the water solubility of the compoundsimultaneously. For permeate flux, the best correlation value was obtained using the surface tensionand molecular weight [14].
It is clear that removal efficiency depends on the membrane type and solute, and theinteraction between them. Temperature, pH, pressure and concentration also influence rejection [15].Whether nanofiltration should be used in the treatment of wastewater containing dyes depends on therejection capacity of the membranes and the permeate flux.
In addition, distilled water tests were performed in order to characterize the membrane,and selectivity tests facing salt solutions before and after dyes tests were carried out in order toknow the membrane permeability, studying performance and its changes during the process. In thatway, membrane fouling can be analyzed, as well as the phenomenon in which membrane pores getwider because substances passing, known as swelling, can be observed [16–18].
The discussion on membrane-based treatment processes is incomplete without an elaborateperception of the mechanism governing the transport of solute across the membrane and compressivemodeling of a membrane-based technique [1].
The main goal of this research work is to study the behavior of the NF99 membrane on theelimination of several dyes, which are molecules of different structure, charge and shape, the followingones being chosen: Allura Red, Basic Fuchsin, Crystal Violet, Methyl Orange and Sunset Yellow.These molecules were selected since in the bibliography there are no studies for some of them, such asBasic Fuchsin and Allura Red. Solutions of each dye were used to characterize the system and toobtain the values of the permeate flux and rejection coefficient. Furthermore, a preliminary study onthe characterization of the membrane treated with salt solutions was carried out before and after thedye treatment. Such a study was complemented by scanning electric microscopy (SEM) morphologicstudy of the membrane using the Acid Brown-83 dye. This molecule was selected because it is a realcase of a leather tanning industry located in Murcia (Spain). Finally, the Spiegler–Kedem–Katchalskymodel was applied to simulate the behavior of the membrane on the elimination of this group of dyes.
2. Materials and Methods
2.1. Materials
2.1.1. Membrane
A nanofiltration membrane was employed in this research. Its main technical characteristics areshown in Table 1.
Membranes 2020, 10, 408 3 of 16
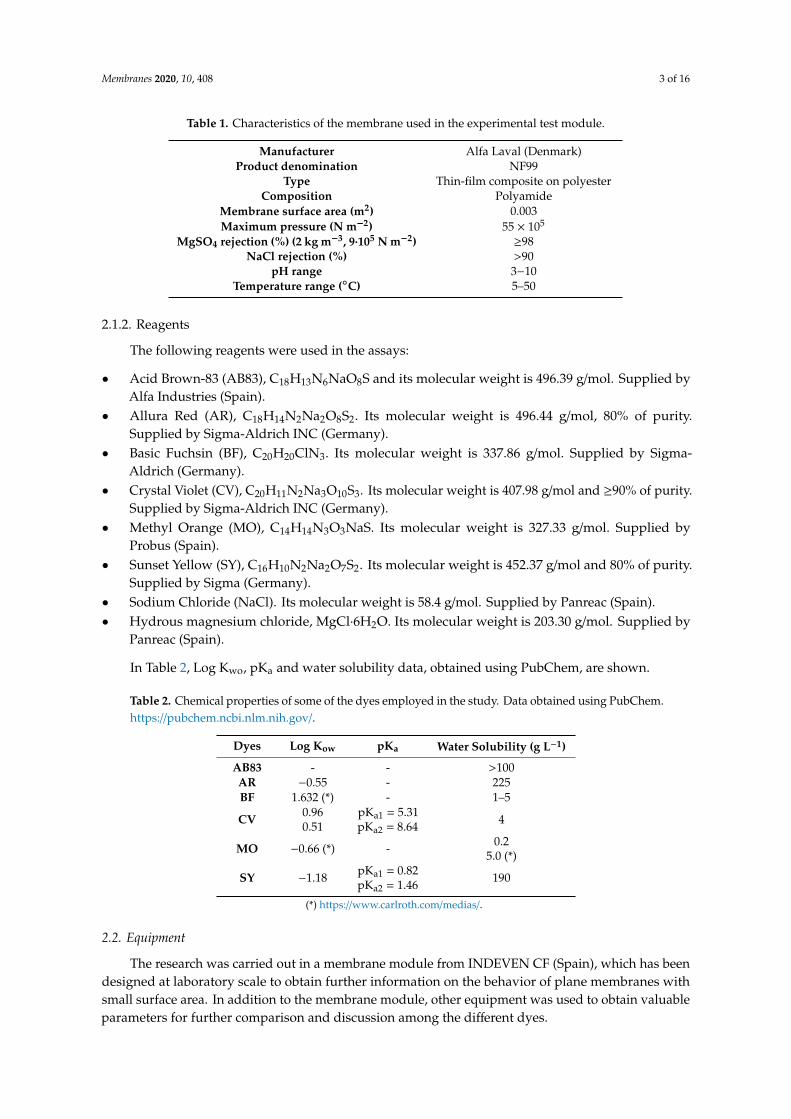
Table 1. Characteristics of the membrane used in the experimental test module.
Manufacturer Alfa Laval (Denmark)Product denomination NF99
Type Thin-film composite on polyesterComposition Polyamide
Membrane surface area (m2) 0.003Maximum pressure (N m−2) 55 × 105
MgSO4 rejection (%) (2 kg m−3, 9·105 N m−2) ≥98NaCl rejection (%) >90
pH range 3−10Temperature range (◦C) 5–50
2.1.2. Reagents
The following reagents were used in the assays:
• Acid Brown-83 (AB83), C18H13N6NaO8S and its molecular weight is 496.39 g/mol. Supplied byAlfa Industries (Spain).
• Allura Red (AR), C18H14N2Na2O8S2. Its molecular weight is 496.44 g/mol, 80% of purity.Supplied by Sigma-Aldrich INC (Germany).
• Basic Fuchsin (BF), C20H20ClN3. Its molecular weight is 337.86 g/mol. Supplied by Sigma-Aldrich (Germany).
• Crystal Violet (CV), C20H11N2Na3O10S3. Its molecular weight is 407.98 g/mol and ≥90% of purity.Supplied by Sigma-Aldrich INC (Germany).
• Methyl Orange (MO), C14H14N3O3NaS. Its molecular weight is 327.33 g/mol. Supplied byProbus (Spain).
• Sunset Yellow (SY), C16H10N2Na2O7S2. Its molecular weight is 452.37 g/mol and 80% of purity.Supplied by Sigma (Germany).
• Sodium Chloride (NaCl). Its molecular weight is 58.4 g/mol. Supplied by Panreac (Spain).• Hydrous magnesium chloride, MgCl·6H2O. Its molecular weight is 203.30 g/mol. Supplied by
Panreac (Spain).
In Table 2, Log Kwo, pKa and water solubility data, obtained using PubChem, are shown.
Table 2. Chemical properties of some of the dyes employed in the study. Data obtained using PubChem.https://pubchem.ncbi.nlm.nih.gov/.
Dyes Log Kow pKa Water Solubility (g L−1)
AB83 - - >100AR −0.55 - 225BF 1.632 (*) - 1–5
CV 0.960.51
pKa1 = 5.31pKa2 = 8.64 4
MO −0.66 (*) - 0.25.0 (*)
SY −1.18 pKa1 = 0.82pKa2 = 1.46 190
(*) https://www.carlroth.com/medias/.
2.2. Equipment
The research was carried out in a membrane module from INDEVEN CF (Spain), which has beendesigned at laboratory scale to obtain further information on the behavior of plane membranes withsmall surface area. In addition to the membrane module, other equipment was used to obtain valuableparameters for further comparison and discussion among the different dyes.
Membranes 2020, 10, 408 4 of 16
2.2.1. Membrane Module
The membrane module consists of three main stages of installation: feed tank, fluid impulsionpump and membrane settlement. Furthermore, there is a manometer and a rotameter that measurerejection pressure.
The feed tank is cylindric and it maintains the internal fluid at a constant temperature. Its capacityis of 12 L. The fluid passes from the feed tank to the driving pump through a flexible rubber pipe.The pump is a triple plunger pump from Flowmax (Spain). It consists of three AISI 316 Steel valvesand of corrosion resistant double collectors. Flow rate is controlled by a manual needle valve.
The membrane inflows are divided into two: permeate flow and concentrate flow. The last onere-enters the feed tank. Moreover, the vent plug discharge and the caudal control are carried out by aflow that leaves the impulsion pump and arrives to the feed tank.
The membrane, whose surface is 30 cm2, is placed near the feeding spacer, with the active layerlooking towards the mainboard. The following step involves placing the permeate spacer and finallythe closing plate. Two o-rings seal the set.
Continuous functioning is guaranteed because the concentrate flow discharges in the feed tank.Operating pressure is regulated by a valve and a manometer, and the flow is measured by a rotameterfrom TechFluid, which detects flows ranging from 50 to 400 L/h.
2.2.2. Spectrophotometer
A spectrophotometer from Shimadzu (UV–160) (Japan) was employed to measure the absorbanceof the dye samples. The measurements were carried out at specific wavelengths, which were 443 nmfor Acid Brown-83, 485 nm for Sunset Yellow, 596 nm for Crystal Violet, 500 nm for Allura Red, 460 nmfor Methyl Orange and 550 nm for Basic Fuchsin.
2.2.3. Variable Pressure Scanning Electron Microscope
To develop the membrane fouling study, a scanning electron microscope from Hitachi (S-3500Nmodel) (Japan) was employed; its main characteristics are the following:
• Resolution: 3 nm (high vacuum mode) or 4.5 nm (low vacuum mode);• Zoom: 15–300,000;• Accelerating voltage: 0.3–30 kv;• Variable pressure range: 1–270 Pa;• Secondary electrons detector;• Robinson’s backscattered electron detector;• Secondary electrons in variable pressure detector;• X-ray detector;• Eucentric plate with computer control and motorized movements in X, Y, Z, R and T;• Crio-SEM cooling plate (−190 ± 60 ◦C);• Peltier’s cooling sample holder (−15 ± 50 ◦C).
2.3. Experimental Series
In order to obtain further knowledge about the membrane behavior, a series of experiments withdifferent dyes were carried out. In these series of experiments, all the operating conditions remainedunchanged excluding that which was subject of study.
2.3.1. Distilled Water Assays
The tank was filled with distilled water and afterwards a series of experiments were carried out.The experiments were of 15 min of length, at 5, 10 and 15 bar operating pressures and with a 150 L/hflow. The main goal of these assays was to get to know the permeability of the membrane.
Membranes 2020, 10, 408 5 of 16
2.3.2. Salts Assays
The objective of the experimental assays using salt solutions was to obtain the membrane rejectioncoefficient and, as a result, its selectivity. In the same way that distilled water assays, the experimentswere carried out at 5, 10 and 15 bar operating pressure and with a 150 L/h flow; however, the durationtime was of 20 min. Aqueous solutions of 1 g/L were used to carry out the experimental assays. The saltsemployed in the experiments were magnesium chloride and sodium chloride.
2.3.3. Dyes Assays
In order to elucidate the membrane elimination power in detail, a 50 mg/L dye dissolution wasemployed to fill the feed tank and 30 min assays were carried out, in which the samples were takenevery 5 min with different operating pressures. Duplicate assays were carried out.
• Firstly, while the pH was maintained constant at 7 and the flow at 150 L/h, the operating pressurewas varied: 10 and 15 bar.
• With the aim of finding out the influence of the pH, the previous experimental series were repeated,changing the pH: first at 8 and afterwards at 3.
• Finally, once all of these assays were carried out, the distilled water assay and the salts assay wererepeated to check if the membrane had lost permeability after its use.
3. Results and Discussion
3.1. Membrane Characterization
The initial membrane characterization was carried out by determining its permeability coefficient,its performance regarding flows and its selectivity against two different salt solutions: sodium chlorideand magnesium chloride.
Permeability Coefficient Determination
In order to determine the permeability coefficient, the following equation was used:
Jv = Lp·(∆P − ∆Π) (1)
The osmotic pressure gradient can be ignored only if the solvent is employed alone. As a result,the previous equation can be described as:
Jv = Lp·∆P (2)
The permeability coefficient value is obtained by representing the final values of the solvent massflow against applied pressure.
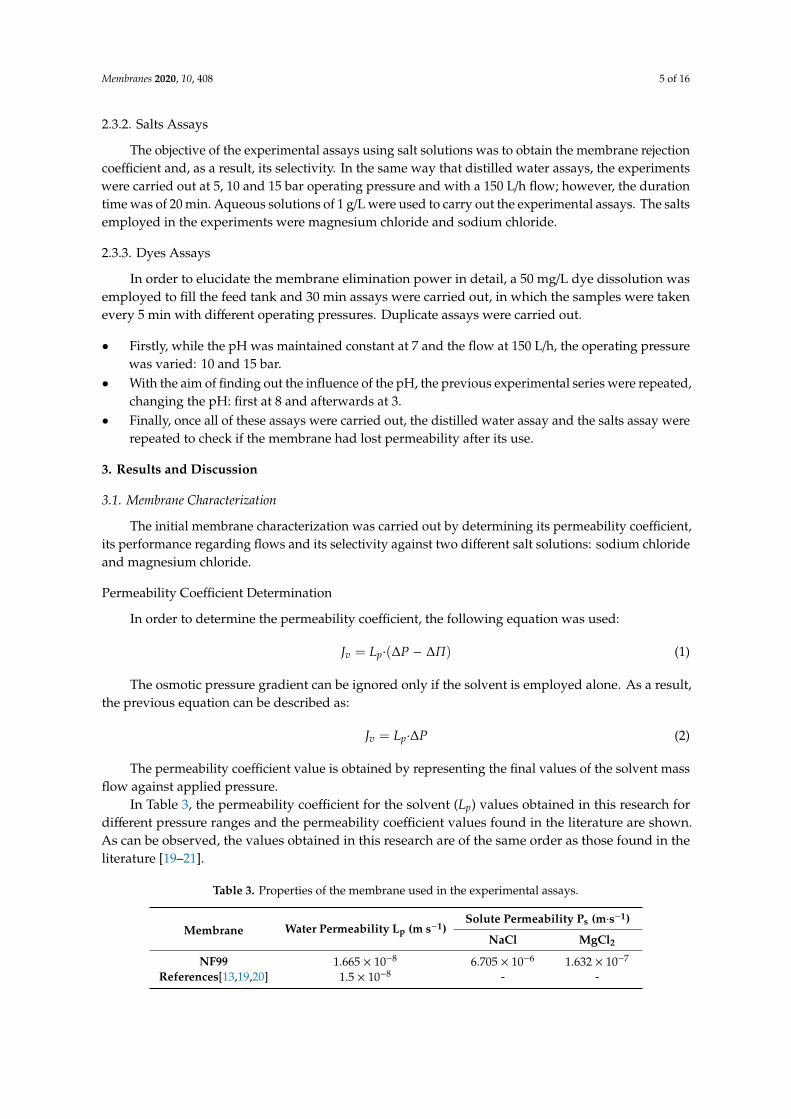
In Table 3, the permeability coefficient for the solvent (Lp) values obtained in this research fordifferent pressure ranges and the permeability coefficient values found in the literature are shown.As can be observed, the values obtained in this research are of the same order as those found in theliterature [19–21].
Table 3. Properties of the membrane used in the experimental assays.
Membrane Water Permeability Lp (m s−1)Solute Permeability Ps (m·s−1)
NaCl MgCl2
NF99 1.665 × 10⁻⁸ 6.705 × 10⁻⁶ 1.632 × 10⁻⁷
References[13,19,20] 1.5 × 10⁻⁸ - -
Membranes 2020, 10, 408 6 of 16
3.2. Determination of Selectivity and Performance of the Membrane against Salt Solutions
The characterization of NF membranes is often carried out using divalent salt solutions. In thisresearch, two salt solutions were used: sodium chloride and magnesium chloride.
To determinate the selectivity of the membrane, the rejection coefficient was established:
%R =(C0 − Cp
)C0
·100 (3)
The experimental values obtained for permeate flux and rejection coefficient were treated byapplying the solution-diffusion model [22]. As a result, the permeability coefficient for the solute (Ps)for each salt solution was obtained.
Table 2 shows the Ps values for each salt solution assayed, which are very close to those obtainedby previous authors [13].
3.3. Influence of the Chemical Structure of Different Dyes
Usually, parameters such as molecular weight, log Kw and pKa, were used to explain themembrane selectivity and the rejection coefficient. However, in recent years, to attempt to explainthe behavior of the nanofiltration systems, based on the two characteristic parameters, the permeateflux and the rejection coefficient, the influence of chemical structure parameters could represent animportant factor to consider.
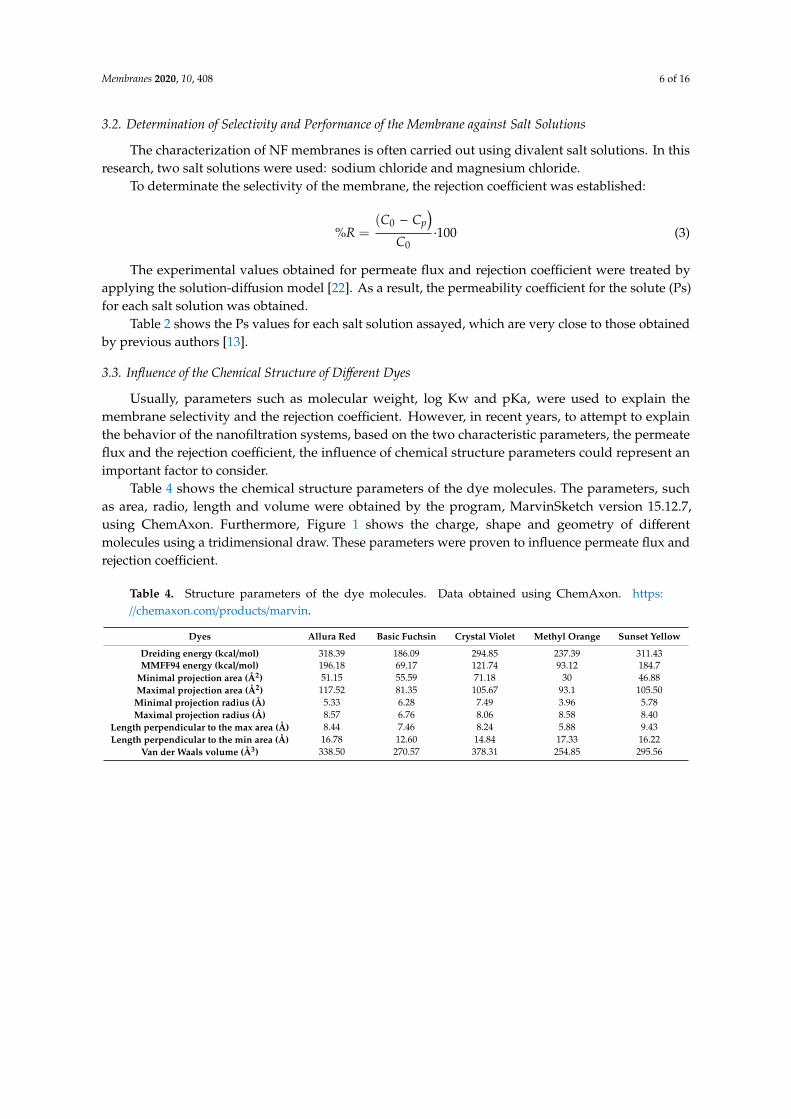
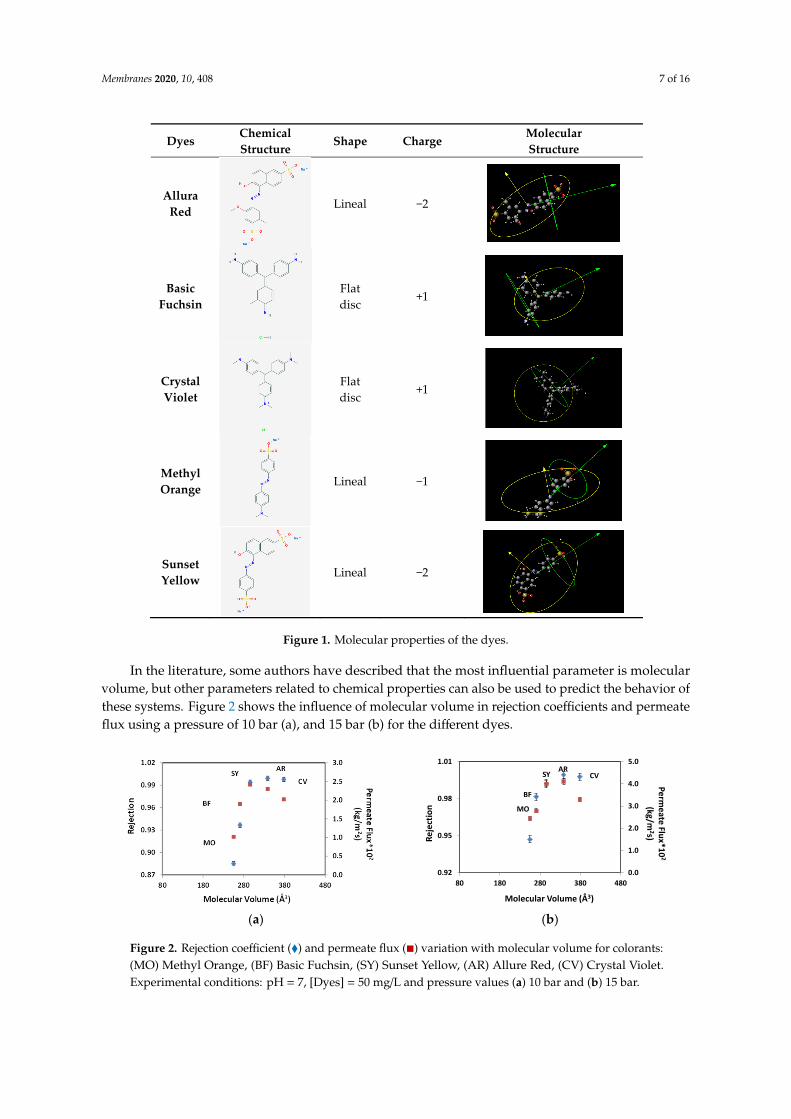
Table 4 shows the chemical structure parameters of the dye molecules. The parameters, suchas area, radio, length and volume were obtained by the program, MarvinSketch version 15.12.7,using ChemAxon. Furthermore, Figure 1 shows the charge, shape and geometry of differentmolecules using a tridimensional draw. These parameters were proven to influence permeate flux andrejection coefficient.
Table 4. Structure parameters of the dye molecules. Data obtained using ChemAxon. https://chemaxon.com/products/marvin.
Dyes Allura Red Basic Fuchsin Crystal Violet Methyl Orange Sunset Yellow
Dreiding energy (kcal/mol) 318.39 186.09 294.85 237.39 311.43MMFF94 energy (kcal/mol) 196.18 69.17 121.74 93.12 184.7
Minimal projection area (Å2) 51.15 55.59 71.18 30 46.88Maximal projection area (Å2) 117.52 81.35 105.67 93.1 105.50Minimal projection radius (Å) 5.33 6.28 7.49 3.96 5.78Maximal projection radius (Å) 8.57 6.76 8.06 8.58 8.40
Length perpendicular to the max area (Å) 8.44 7.46 8.24 5.88 9.43Length perpendicular to the min area (Å) 16.78 12.60 14.84 17.33 16.22
Van der Waals volume (Å3) 338.50 270.57 378.31 254.85 295.56
Membranes 2020, 10, 408 7 of 16
Membranes 2020, 10, x FOR PEER REVIEW 7 of 16
Dyes Chemical Structure Shape Charge Molecular
Structure
Allura Red
Lineal −2
Basic Fuchsin
Flat disc
+1
Crystal Violet
Flat disc +1
Methyl Orange Lineal −1
Sunset Yellow
Lineal −2
Figure 1. Molecular properties of the dyes.
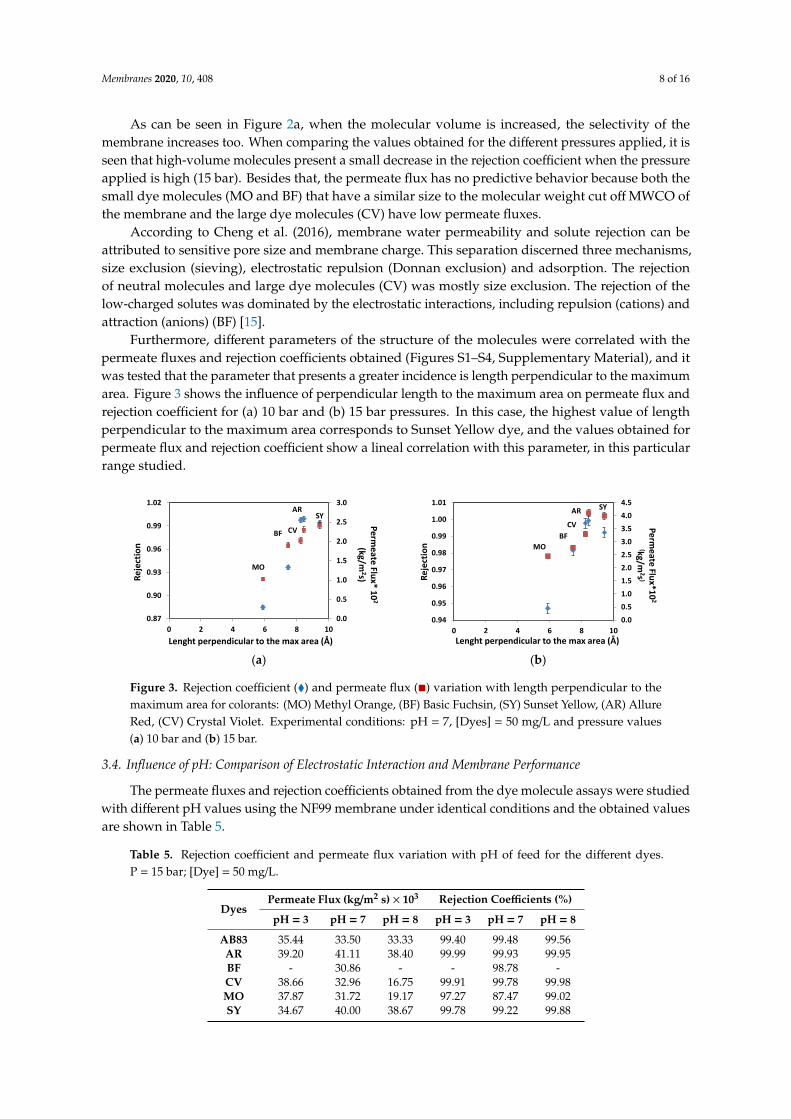
In the literature, some authors have described that the most influential parameter is molecular volume, but other parameters related to chemical properties can also be used to predict the behavior of these systems. Figure 2 shows the influence of molecular volume in rejection coefficients and permeate flux using a pressure of 10 bar (a), and 15 bar (b) for the different dyes.
(a) (b)
Figure 2. Rejection coefficient (♦) and permeate flux (■) variation with molecular volume for colorants: (MO) Methyl Orange, (BF) Basic Fuchsin, (SY) Sunset Yellow, (AR) Allure Red, (CV) Crystal Violet. Experimental conditions: pH = 7, [Dyes] = 50 mg/L and pressure values (a) 10 bar and (b) 15 bar.
AR
BF
CV
MO
SY
0.0
1.0
2.0
3.0
4.0
5.0
0.92
0.95
0.98
1.01
80 180 280 380 480
Permeate Flux*10
2
(kg/m2s)Re
ject
ion
Molecular Volume (Å3)
Figure 1. Molecular properties of the dyes.
In the literature, some authors have described that the most influential parameter is molecularvolume, but other parameters related to chemical properties can also be used to predict the behavior ofthese systems. Figure 2 shows the influence of molecular volume in rejection coefficients and permeateflux using a pressure of 10 bar (a), and 15 bar (b) for the different dyes.
Membranes 2020, 10, x FOR PEER REVIEW 7 of 16
Dyes Chemical Structure Shape Charge Molecular
Structure
Allura Red
Lineal −2
Basic Fuchsin
Flat disc
+1
Crystal Violet
Flat disc +1
Methyl Orange Lineal −1
Sunset Yellow
Lineal −2
Figure 1. Molecular properties of the dyes.
In the literature, some authors have described that the most influential parameter is molecular volume, but other parameters related to chemical properties can also be used to predict the behavior of these systems. Figure 2 shows the influence of molecular volume in rejection coefficients and permeate flux using a pressure of 10 bar (a), and 15 bar (b) for the different dyes.
(a) (b)
Figure 2. Rejection coefficient (♦) and permeate flux (■) variation with molecular volume for colorants: (MO) Methyl Orange, (BF) Basic Fuchsin, (SY) Sunset Yellow, (AR) Allure Red, (CV) Crystal Violet. Experimental conditions: pH = 7, [Dyes] = 50 mg/L and pressure values (a) 10 bar and (b) 15 bar.
AR
BF
CV
MO
SY
0.0
1.0
2.0
3.0
4.0
5.0
0.92
0.95
0.98
1.01
80 180 280 380 480
Permeate Flux*10
2
(kg/m2s)Re
ject
ion
Molecular Volume (Å3)
Figure 2. Rejection coefficient (�) and permeate flux (�) variation with molecular volume for colorants:(MO) Methyl Orange, (BF) Basic Fuchsin, (SY) Sunset Yellow, (AR) Allure Red, (CV) Crystal Violet.Experimental conditions: pH = 7, [Dyes] = 50 mg/L and pressure values (a) 10 bar and (b) 15 bar.
Membranes 2020, 10, 408 8 of 16
As can be seen in Figure 2a, when the molecular volume is increased, the selectivity of themembrane increases too. When comparing the values obtained for the different pressures applied, it isseen that high-volume molecules present a small decrease in the rejection coefficient when the pressureapplied is high (15 bar). Besides that, the permeate flux has no predictive behavior because both thesmall dye molecules (MO and BF) that have a similar size to the molecular weight cut off MWCO ofthe membrane and the large dye molecules (CV) have low permeate fluxes.
According to Cheng et al. (2016), membrane water permeability and solute rejection can beattributed to sensitive pore size and membrane charge. This separation discerned three mechanisms,size exclusion (sieving), electrostatic repulsion (Donnan exclusion) and adsorption. The rejectionof neutral molecules and large dye molecules (CV) was mostly size exclusion. The rejection of thelow-charged solutes was dominated by the electrostatic interactions, including repulsion (cations) andattraction (anions) (BF) [15].
Furthermore, different parameters of the structure of the molecules were correlated with thepermeate fluxes and rejection coefficients obtained (Figures S1–S4, Supplementary Material), and itwas tested that the parameter that presents a greater incidence is length perpendicular to the maximumarea. Figure 3 shows the influence of perpendicular length to the maximum area on permeate flux andrejection coefficient for (a) 10 bar and (b) 15 bar pressures. In this case, the highest value of lengthperpendicular to the maximum area corresponds to Sunset Yellow dye, and the values obtained forpermeate flux and rejection coefficient show a lineal correlation with this parameter, in this particularrange studied.
Membranes 2020, 10, x FOR PEER REVIEW 8 of 16
As can be seen in Figure 2a, when the molecular volume is increased, the selectivity of the membrane increases too. When comparing the values obtained for the different pressures applied, it is seen that high-volume molecules present a small decrease in the rejection coefficient when the pressure applied is high (15 bar). Besides that, the permeate flux has no predictive behavior because both the small dye molecules (MO and BF) that have a similar size to the molecular weight cut off MWCO of the membrane and the large dye molecules (CV) have low permeate fluxes.
According to Cheng et al. (2016), membrane water permeability and solute rejection can be attributed to sensitive pore size and membrane charge. This separation discerned three mechanisms, size exclusion (sieving), electrostatic repulsion (Donnan exclusion) and adsorption. The rejection of neutral molecules and large dye molecules (CV) was mostly size exclusion. The rejection of the low-charged solutes was dominated by the electrostatic interactions, including repulsion (cations) and attraction (anions) (BF) [15].
Furthermore, different parameters of the structure of the molecules were correlated with the permeate fluxes and rejection coefficients obtained (Figures S1–S4, Supplementary Material), and it was tested that the parameter that presents a greater incidence is length perpendicular to the maximum area. Figure 3 shows the influence of perpendicular length to the maximum area on permeate flux and rejection coefficient for (a) 10 bar and (b) 15 bar pressures. In this case, the highest value of length perpendicular to the maximum area corresponds to Sunset Yellow dye, and the values obtained for permeate flux and rejection coefficient show a lineal correlation with this parameter, in this particular range studied.
(a) (b)
Figure 3. Rejection coefficient (♦) and permeate flux (■) variation with length perpendicular to the maximum area for colorants: (MO) Methyl Orange, (BF) Basic Fuchsin, (SY) Sunset Yellow, (AR) Allure Red, (CV) Crystal Violet. Experimental conditions: pH = 7, [Dyes] = 50 mg/L and pressure values (a) 10 bar and (b) 15 bar.
3.4. Influence of pH: Comparison of Electrostatic Interaction and Membrane Performance
The permeate fluxes and rejection coefficients obtained from the dye molecule assays were studied with different pH values using the NF99 membrane under identical conditions and the obtained values are shown in Table 5.
Table 5. Rejection coefficient and permeate flux variation with pH of feed for the different dyes. P = 15 bar; [Dye] = 50 mg/L.
Dyes
Permeate Flux (kg/m2 s) × 103 Rejection Coefficients (%) pH = 3 pH = 7 pH = 8 pH = 3 pH = 7 pH = 8
AB83 35.44 33.50 33.33 99.40 99.48 99.56 AR 39.20 41.11 38.40 99.99 99.93 99.95 BF - 30.86 - - 98.78 - CV 38.66 32.96 16.75 99.91 99.78 99.98 MO 37.87 31.72 19.17 97.27 87.47 99.02 SY 34.67 40.00 38.67 99.78 99.22 99.88
AR
BF CV
MO
SY
0.0
0.5
1.0
1.5
2.0
2.5
3.0
0.87
0.90
0.93
0.96
0.99
1.02
0 2 4 6 8 10
Permeate Flux* 10
2
(kg/m2s)Re
ject
ion
Lenght perpendicular to the max area (Å)
AR
BFCV
MO
SY
0.00.51.01.52.02.53.03.54.04.5
0.94
0.95
0.96
0.97
0.98
0.99
1.00
1.01
0 2 4 6 8 10
Permeate Flux*10
2
(kg/m2s )Re
ject
ion
Lenght perpendicular to the max area (Å)
Figure 3. Rejection coefficient (�) and permeate flux (�) variation with length perpendicular to themaximum area for colorants: (MO) Methyl Orange, (BF) Basic Fuchsin, (SY) Sunset Yellow, (AR) AllureRed, (CV) Crystal Violet. Experimental conditions: pH = 7, [Dyes] = 50 mg/L and pressure values(a) 10 bar and (b) 15 bar.
3.4. Influence of pH: Comparison of Electrostatic Interaction and Membrane Performance
The permeate fluxes and rejection coefficients obtained from the dye molecule assays were studiedwith different pH values using the NF99 membrane under identical conditions and the obtained valuesare shown in Table 5.
Table 5. Rejection coefficient and permeate flux variation with pH of feed for the different dyes.P = 15 bar; [Dye] = 50 mg/L.
DyesPermeate Flux (kg/m2 s) × 103 Rejection Coefficients (%)
pH = 3 pH = 7 pH = 8 pH = 3 pH = 7 pH = 8
AB83 35.44 33.50 33.33 99.40 99.48 99.56AR 39.20 41.11 38.40 99.99 99.93 99.95BF - 30.86 - - 98.78 -CV 38.66 32.96 16.75 99.91 99.78 99.98MO 37.87 31.72 19.17 97.27 87.47 99.02SY 34.67 40.00 38.67 99.78 99.22 99.88
Membranes 2020, 10, 408 9 of 16
According to different authors [11,15,16], electrostatic interactions between the membrane andcharged molecules is an important parameter which determines flux decline. Usually, the pH values ofeffluents from the dyeing industry are between neutral and basic pH [4]. In this pH range, the polyamideNF99 membrane possesses negative charge, and therefore the negatively charged dye molecules (AB83,AR, MO and SY) are not electrostatically attracted towards the membrane, and hence they do notsignificantly reduce the permeate flux. However, AB83 and MO dyes molecules showed a decreasein permeate flux, being more significant in the case of MO. This behavior could be explained due toother types of interactions, such as hydrophobic ones (between the aromatic rings of both the dyesand the polyamide membrane selective layer) or hydrogen bonds that can play an important role inmembrane blocking, especially under the conditions in which the acidic or basic groups in dyes arepartially dissociated.
Positively charged dye molecules (CV) of relatively low molecular weight exhibit a strong foulingeffect in the neutral as well as the alkaline pH of the feed solution. This behavior is according to theresults obtained by Chindambaram et al. [16].
3.5. Fouling Phenomenon after Treatment of Dyes Solutions
A simple means of evaluating the fouling phenomenon effect on the membrane is to repeat thedistilled water assays after the dye assays are carried out. In this research, the fouling factor of themembrane, %FF, was calculated in order to quantify the fouling phenomenon by comparing the initial,Lp0, and final, Lpf, values of the permeability coefficient. The equation is the following:
%FF =
(Lp0 − Lp f
)Lp0
·100 (4)
Table 6 shows the results of the fouling factor of the membrane after the use of the differentdyes studied.
Table 6. Values of fouling factor of the membrane for the different dye assays.
Dyes AB83 AR BF CV MO SY
FF (%) 10.65 0.6 87.23 24.13 35.29 3.44
Considering the molecular weight and molecular volume values obtained for each dye, it wasfound that the smaller dye molecules (MO and BF), whose sizes were close to the molecular weightcut-off (MWCO) of the membrane (200 Da), presented a higher fouling factor. This fact showed thatthese dyes were absorbed in the membrane and, consequently, the fluxes were reduced. Some authorsalso described adsorption phenomena for SY [15]. When comparing two dyes of similar molecular size(MO and BF, or CV and AB83), the dye molecules with negative charges and of a linear size gave alower fouling factor that those of positive charges and with flat disc shape. These results were alreadydescribed in other studies [23,24].
3.6. Morphologic Study of the Membrane
Even though there are many available techniques for observing the membrane surface (includingthe active layer and the sublayer that sustains it), the most employed technique for nanofiltrationmembrane characterization is Scanning Electron Microscopy (SEM).
In this research, the samples of native membrane and used membrane (after carrying out theassay of the dye of higher molecular weight, AB83) were analyzed.
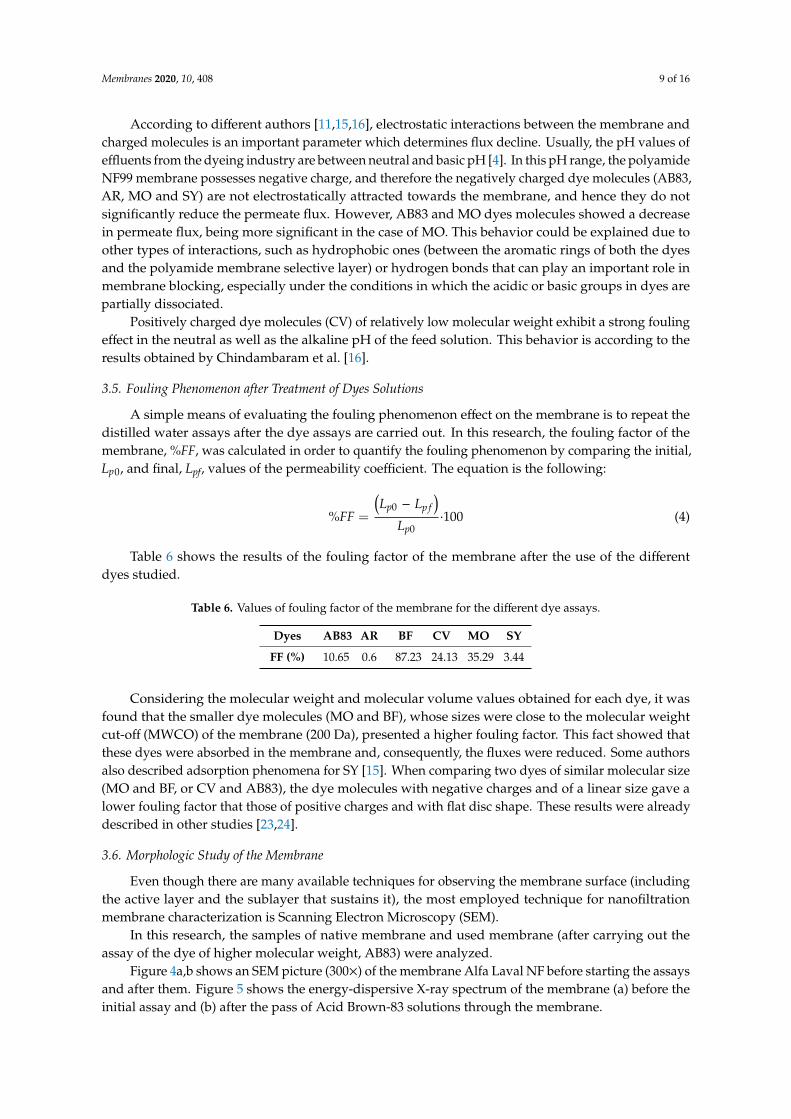
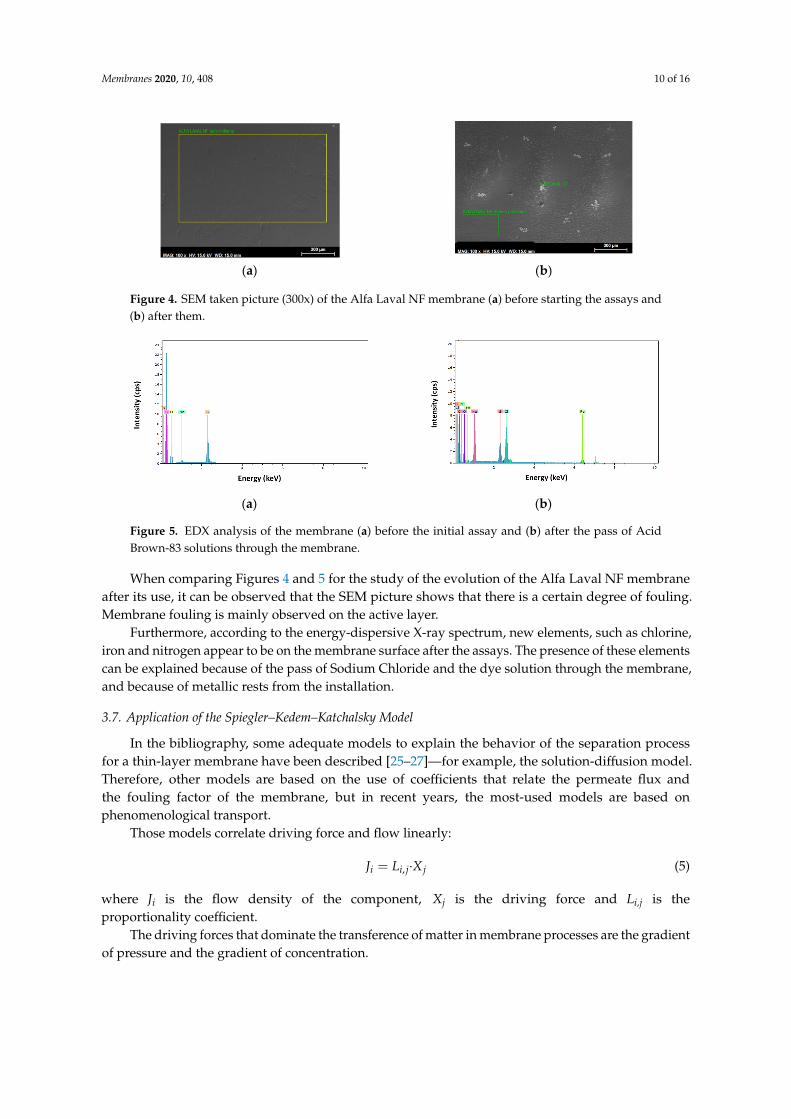
Figure 4a,b shows an SEM picture (300×) of the membrane Alfa Laval NF before starting the assaysand after them. Figure 5 shows the energy-dispersive X-ray spectrum of the membrane (a) before theinitial assay and (b) after the pass of Acid Brown-83 solutions through the membrane.
Membranes 2020, 10, 408 10 of 16
Membranes 2020, 10, x FOR PEER REVIEW 10 of 16
(a) (b)
Figure 4. SEM taken picture (300x) of the Alfa Laval NF membrane (a) before starting the assays and (b) after them.
(a) (b)
Figure 5. EDX analysis of the membrane (a) before the initial assay and (b) after the pass of Acid Brown-83 solutions through the membrane.
When comparing Figures 4 and 5 for the study of the evolution of the Alfa Laval NF membrane after its use, it can be observed that the SEM picture shows that there is a certain degree of fouling. Membrane fouling is mainly observed on the active layer.
Furthermore, according to the energy-dispersive X-ray spectrum, new elements, such as chlorine, iron and nitrogen appear to be on the membrane surface after the assays. The presence of these elements can be explained because of the pass of Sodium Chloride and the dye solution through the membrane, and because of metallic rests from the installation.
3.7. Application of the Spiegler–Kedem–Katchalsky Model
In the bibliography, some adequate models to explain the behavior of the separation process for a thin-layer membrane have been described [25–27]—for example, the solution-diffusion model. Therefore, other models are based on the use of coefficients that relate the permeate flux and the fouling factor of the membrane, but in recent years, the most-used models are based on phenomenological transport.
Those models correlate driving force and flow linearly: 𝐽 = 𝐿 , · 𝑋 (5)
where Ji is the flow density of the component, Xj is the driving force and Li,j is the proportionality coefficient.
The driving forces that dominate the transference of matter in membrane processes are the gradient of pressure and the gradient of concentration.
The Spiegler–Kedem–Katchalsky model [28,29] expresses the initial equations of the previous model in a differential way; not linearly. As a result, it considers that the densities of flux vary through the thickness of the membrane. 𝐽 = 𝐿 ∙ 𝑑𝑃𝑑𝑥 − 𝜎 𝑑𝛱𝑑𝑥 (6)
Figure 4. SEM taken picture (300x) of the Alfa Laval NF membrane (a) before starting the assays and(b) after them.
Membranes 2020, 10, x FOR PEER REVIEW 10 of 16
(a) (b)
Figure 4. SEM taken picture (300x) of the Alfa Laval NF membrane (a) before starting the assays and (b) after them.
(a) (b)
Figure 5. EDX analysis of the membrane (a) before the initial assay and (b) after the pass of Acid Brown-83 solutions through the membrane.
When comparing Figures 4 and 5 for the study of the evolution of the Alfa Laval NF membrane after its use, it can be observed that the SEM picture shows that there is a certain degree of fouling. Membrane fouling is mainly observed on the active layer.
Furthermore, according to the energy-dispersive X-ray spectrum, new elements, such as chlorine, iron and nitrogen appear to be on the membrane surface after the assays. The presence of these elements can be explained because of the pass of Sodium Chloride and the dye solution through the membrane, and because of metallic rests from the installation.
3.7. Application of the Spiegler–Kedem–Katchalsky Model
In the bibliography, some adequate models to explain the behavior of the separation process for a thin-layer membrane have been described [25–27]—for example, the solution-diffusion model. Therefore, other models are based on the use of coefficients that relate the permeate flux and the fouling factor of the membrane, but in recent years, the most-used models are based on phenomenological transport.
Those models correlate driving force and flow linearly: 𝐽 = 𝐿 , · 𝑋 (5)
where Ji is the flow density of the component, Xj is the driving force and Li,j is the proportionality coefficient.
The driving forces that dominate the transference of matter in membrane processes are the gradient of pressure and the gradient of concentration.
The Spiegler–Kedem–Katchalsky model [28,29] expresses the initial equations of the previous model in a differential way; not linearly. As a result, it considers that the densities of flux vary through the thickness of the membrane. 𝐽 = 𝐿 ∙ 𝑑𝑃𝑑𝑥 − 𝜎 𝑑𝛱𝑑𝑥 (6)
Figure 5. EDX analysis of the membrane (a) before the initial assay and (b) after the pass of AcidBrown-83 solutions through the membrane.
When comparing Figures 4 and 5 for the study of the evolution of the Alfa Laval NF membraneafter its use, it can be observed that the SEM picture shows that there is a certain degree of fouling.Membrane fouling is mainly observed on the active layer.
Furthermore, according to the energy-dispersive X-ray spectrum, new elements, such as chlorine,iron and nitrogen appear to be on the membrane surface after the assays. The presence of these elementscan be explained because of the pass of Sodium Chloride and the dye solution through the membrane,and because of metallic rests from the installation.
3.7. Application of the Spiegler–Kedem–Katchalsky Model
In the bibliography, some adequate models to explain the behavior of the separation processfor a thin-layer membrane have been described [25–27]—for example, the solution-diffusion model.Therefore, other models are based on the use of coefficients that relate the permeate flux andthe fouling factor of the membrane, but in recent years, the most-used models are based onphenomenological transport.
Those models correlate driving force and flow linearly:
Ji = Li, j·X j (5)
where Ji is the flow density of the component, Xj is the driving force and Li,j is theproportionality coefficient.
The driving forces that dominate the transference of matter in membrane processes are the gradientof pressure and the gradient of concentration.
Membranes 2020, 10, 408 11 of 16
The Spiegler–Kedem–Katchalsky model [28,29] expresses the initial equations of the previousmodel in a differential way; not linearly. As a result, it considers that the densities of flux vary throughthe thickness of the membrane.
Jv = Lp·
(dPdx− σ
dΠdx
)(6)
Js = Ps·dCs
dx+ (1 − σ)·Cs·Jv (7)
When expressing both equations incrementally:
Jv = Lp·(∆P − σ·∆Π) (8)
Js = Ps·(Cm −Cp
)+ (1 − σ)·Jv·Cs (9)
The Spiegler–Kedem–Katchalsky model was initially developed for reverse osmosis processes;however, it has been proven that it is also applicable in some nanofiltration processes [30,31].
This model assumes that transport coefficients are independent of solute concentration.Nevertheless, these coefficients depend on solute concentration for ionic solutions in nanofiltrationmembranes. As a result, some authors made some changes in the model to consider this fact [32].
There are two parameters to be determined for the Spiegler–Kedem–Katchalsky model:
• Reflection coefficient (σ). This indicates the capacity of the membrane to be permeated by thesolute. A σ= 0 value indicates that the membrane is completely permeable for the solute, whereas aσ = 1 value indicates that the solute is unable to go through the membrane, as it is completelyimpermeable (total reflection).
• Solute permeability coefficient (Ps). It is defined as the speed at which the solute passes throughthe membrane. It is unique for each compound and membrane. It is measured in m/s.
The pass of a solute flux through the membrane is caused by two different fluxes: a convective flux,which is caused by the application of a gradient of pressure through the membrane, and a diffusiveflux, which is caused by the gradient of concentration in both sides of the membrane. The reflectioncoefficient is also an indicator of what type of flux prevails: the closer the σ values are to 1, the lowerparticipation has the convective flux [33].
For ideal reverse osmosis membranes, σ values are close to 1 as they present a dense structureand no pores that would enable convective transport.
The observed rejection was calculated using the following expression:
%Robs =(1 − F)1− σ·F
·100 (10)
where F is a parameter that depends on the reflection coefficient, solvent flux, and solute permeabilitycoefficient [34]:
F = e(1−1−σPs ·Jv) (11)
The transport phenomenon through the membrane is, in fact, a combination of convection, solution,and diffusion. In this case, the transport process can be described as an irreversible thermodynamicphenomenon. The following relations among the parameters of the process: reflection coefficient andsolute permeability (σ and Ps), solvent flux (Jv) and observed rejection (Robs) were proposed by Spiegler,Kedem and Katchalsky:
Ln[X] = 1−1− σ
Ps·Jv (12)
X =
(1
(1− σ)−
11−Robs
)·(1− σ)σ
(13)
Membranes 2020, 10, 408 12 of 16
The parameters of the model were obtained by employing both Equations (12) and (13) alongwith (9). When combining Equations (12) and (13), Equation (14) is obtained:
Ln[(
1(1− σ)
−1
1−Robs
)·(1− σ)σ
]= 1−
1− σPs·Jv (14)
The average Robs value was calculated from the experimental data of rejection coefficients; thus itis now a known value. From this value, a parameter z ( 1
1−Robs) was calculated.
Equations (9) and (14) were employed to determine the rejection coefficient (σ) and the permeabilitycoefficient (Ps). It was determined that solute concentration in the feed was the same as the soluteconcentration in the membrane (Cm ≈ C0), as few polarization processes occur. The analyzed solutefeeding and permeate concentrations are converted to mol/m3 by dividing by the molecular weight ofthe different dyes.
When replacing Js, Jv, C0 and Cp in Equation (9), and after isolating Ps, the following value,dependent on σ, is obtained:
Ps =Js − Jv·Cs·(1 − σ)
C0 −Cp(15)
This would lead to a Ps = a − b·(1 − σ) type of equation, so Equation (14) would becomethe following:
Ln[(
1(1− σ)
− z)·(1− σ)σ
]− 1 +
1− σa− b·(1− σ)
·Jv = 0 (16)
where a = JsC0−Cp
and b = Jv·CsC0−Cp
.In order to solve this equation of one unknown parameter (σ), it is necessary to use a numeric
method, since there is no analytical solution. The program Solver from Excel was employed for thatpurpose. As a result, the parameters σ and Ps were obtained for each different case. The results areshown in Table 7.
Table 7. Solute permeability coefficient and reflection parameter for the different dyes obtained usingSKK model.
Dyes Ps (m s−1) σ Standard Deviation
AB83 1.6418 × 10⁻⁷ 0.9954 0.3605AR 2.6624 × 10⁻⁸ 0.9994 3.8356BF 2.021 × 10⁻⁷ 0.9887 0.1692CV 1.0198 × 10⁻⁷ 0.9974 1.0023MO 7.8114 × 10⁻⁷ 0.9563 0.2147SY 2.5221 × 10⁻⁷ 0.9942 0.3382
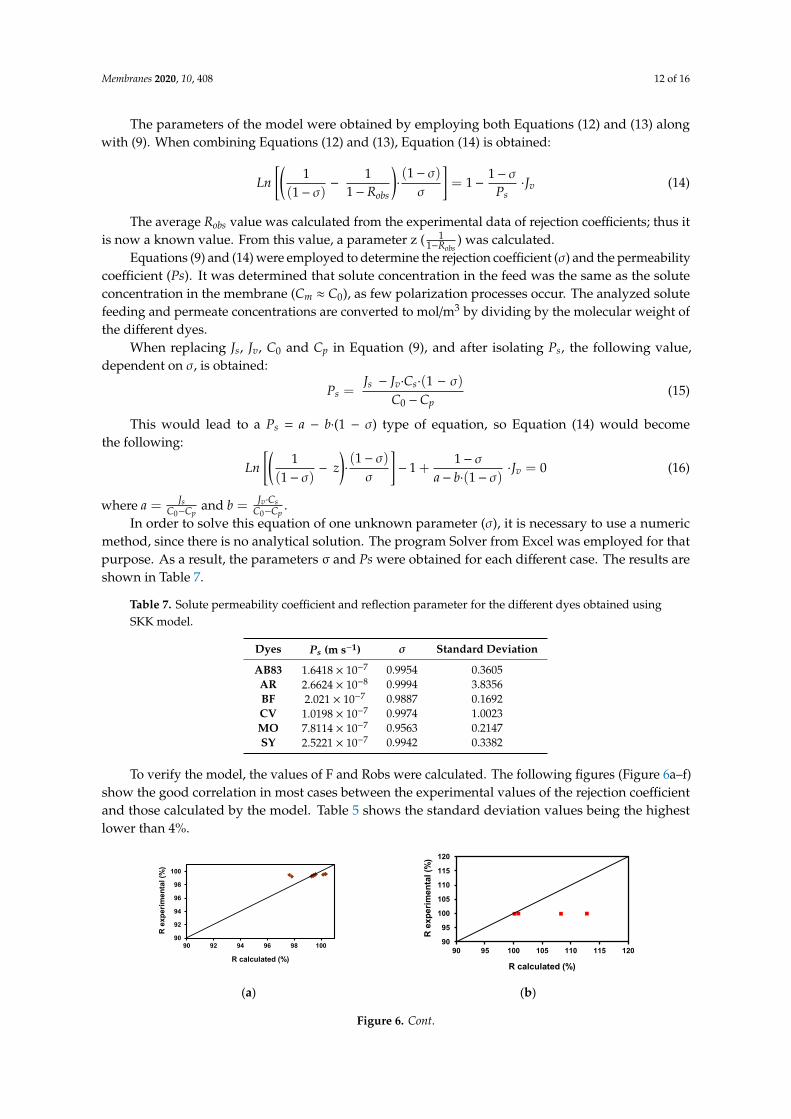
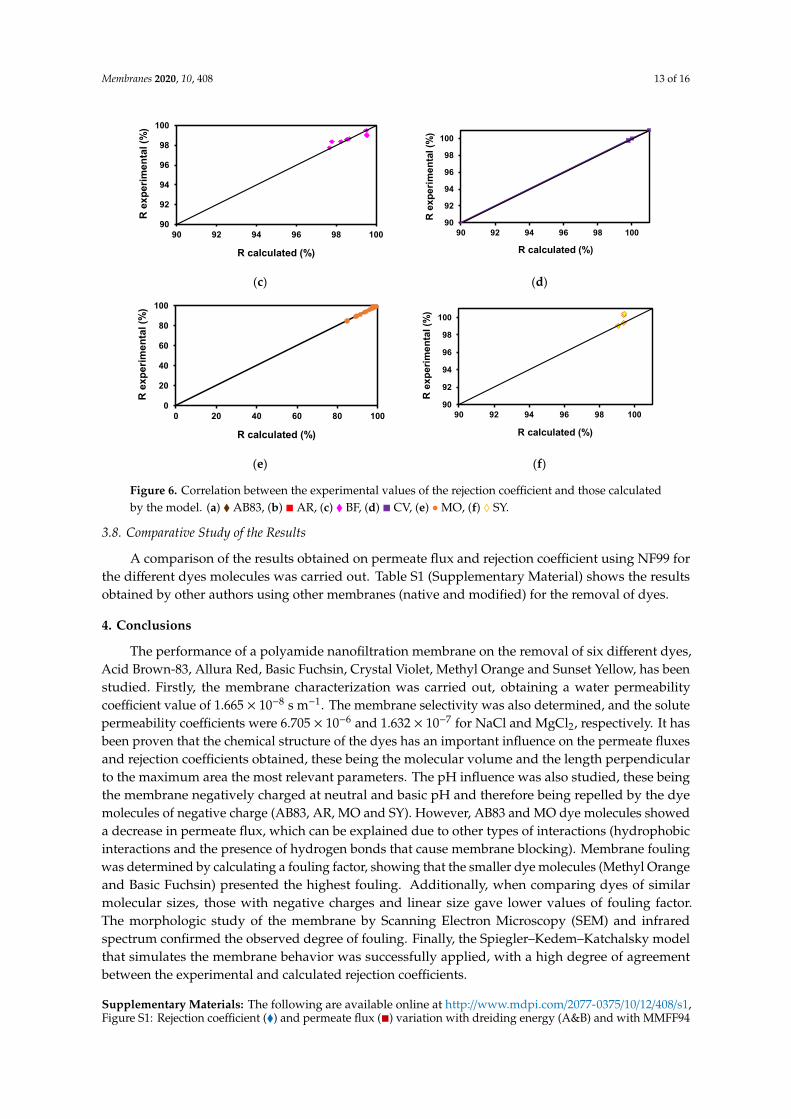
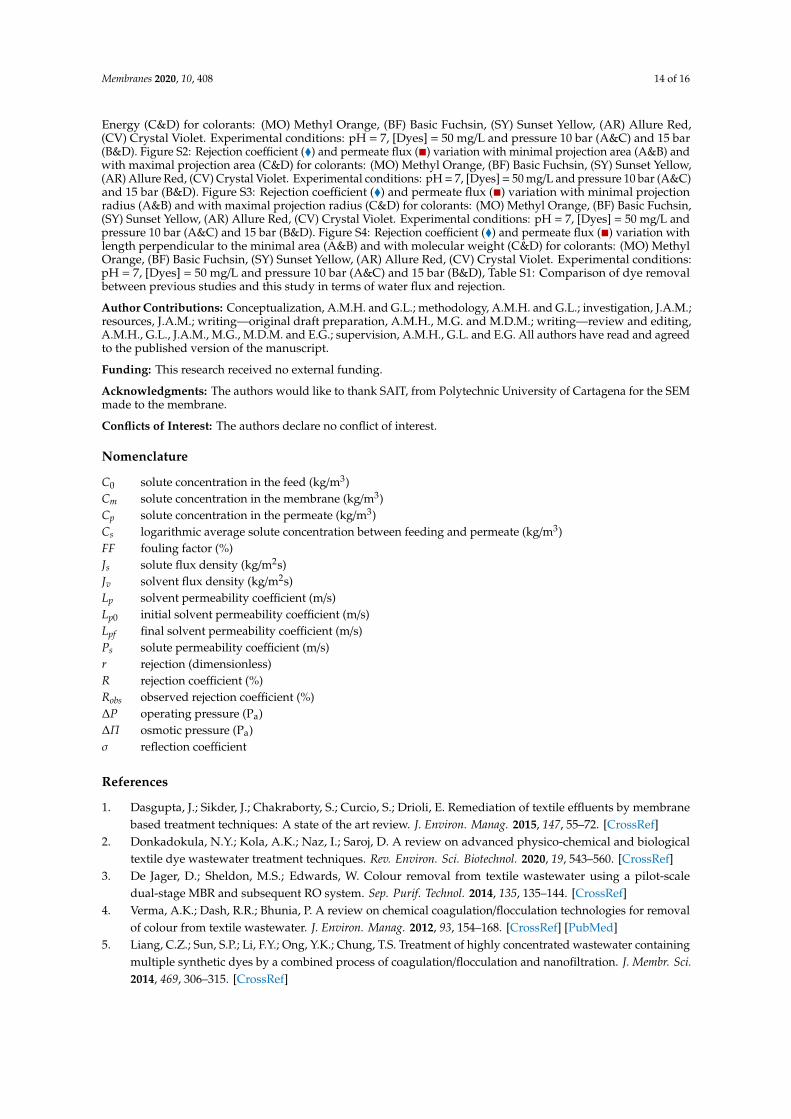
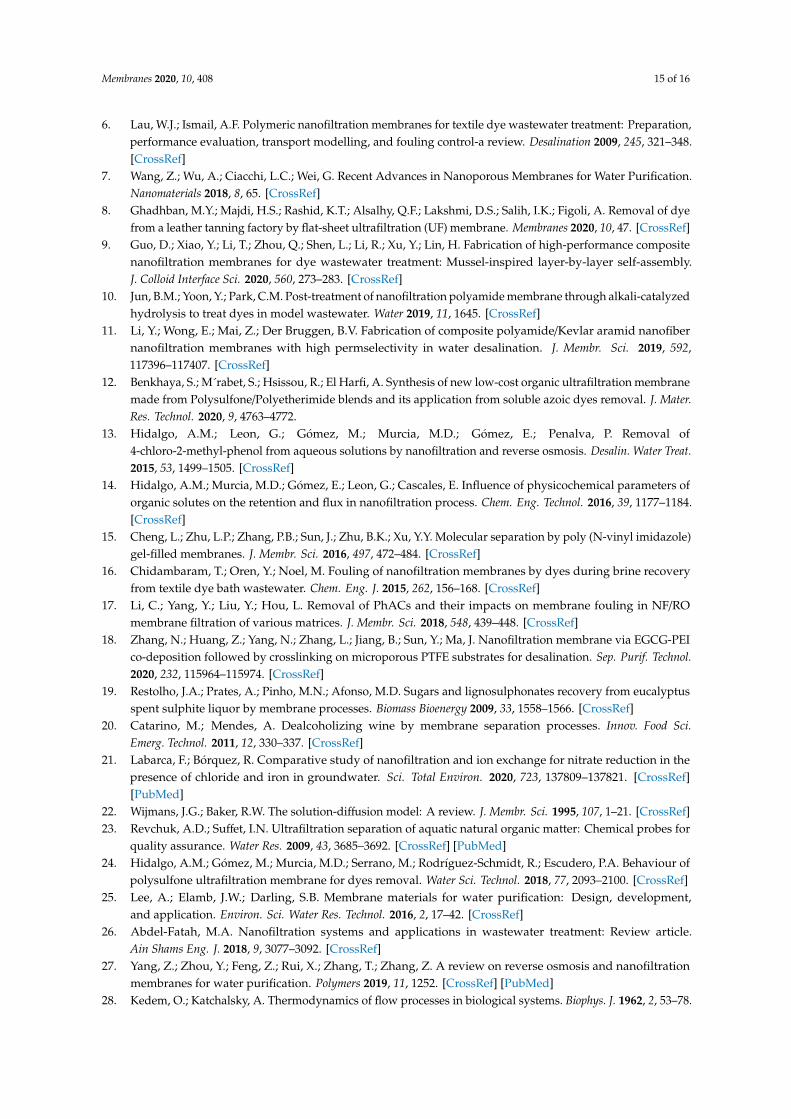
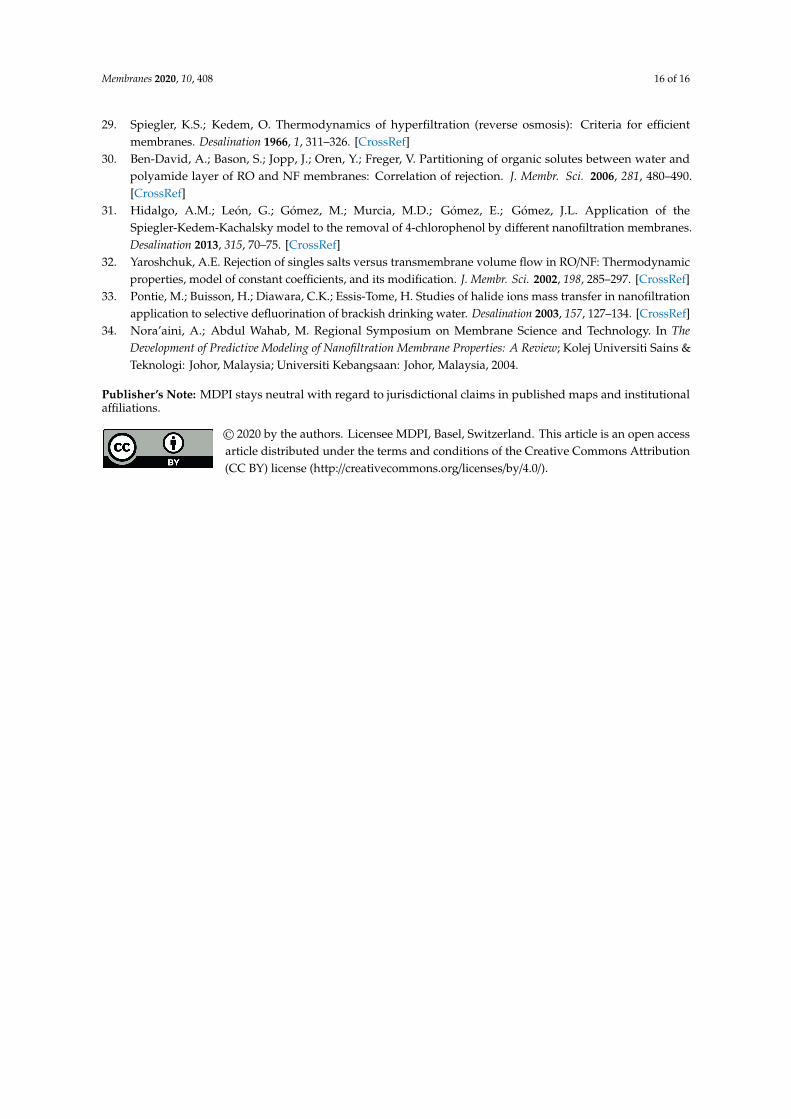
To verify the model, the values of F and Robs were calculated. The following figures (Figure 6a–f)show the good correlation in most cases between the experimental values of the rejection coefficientand those calculated by the model. Table 5 shows the standard deviation values being the highestlower than 4%.
Membranes 2020, 10, x FOR PEER REVIEW 12 of 16
Equations (9) and (14) were employed to determine the rejection coefficient (σ) and the permeability coefficient (Ps). It was determined that solute concentration in the feed was the same as the solute concentration in the membrane (Cm ≈ C0), as few polarization processes occur. The analyzed solute feeding and permeate concentrations are converted to mol/m3 by dividing by the molecular weight of the different dyes.
When replacing Js, Jv, C0 and Cp in Equation (9), and after isolating Ps, the following value, dependent on σ, is obtained: 𝑃 = 𝐽 − 𝐽 · 𝐶 · 1 − 𝜎)𝐶 − 𝐶 (15)
This would lead to a Ps = a – b·(1 − σ) type of equation, so Equation (14) would become the following: 𝐿𝑛 11 − 𝜎) − 𝑧 ∙ 1 − 𝜎)𝜎 − 1 + 1 − 𝜎𝑎 − 𝑏 ∙ 1 − 𝜎) ∙ 𝐽 = 0 (16)
where 𝑎 = and 𝑏 = ·
In order to solve this equation of one unknown parameter (σ), it is necessary to use a numeric method, since there is no analytical solution. The program Solver from Excel was employed for that purpose. As a result, the parameters σ and Ps were obtained for each different case. The results are shown in Table 7.
Table 7. Solute permeability coefficient and reflection parameter for the different dyes obtained using SKK model.
Dyes Ps (m s−1) σ Standard Deviation AB83 1.6418 × 10⁻⁷ 0.9954 0.3605 AR 2.6624 × 10⁻⁸ 0.9994 3.8356 BF 2.021 × 10⁻⁷ 0.9887 0.1692 CV 1.0198 × 10⁻⁷ 0.9974 1.0023 MO 7.8114 × 10⁻⁷ 0.9563 0.2147 SY 2.5221 × 10⁻⁷ 0.9942 0.3382
To verify the model, the values of F and Robs were calculated. The following figures (Figure 6a–f) show the good correlation in most cases between the experimental values of the rejection coefficient and those calculated by the model. Table 5 shows the standard deviation values being the highest lower than 4%.
(a) (b)
90
92
94
96
98
100
90 92 94 96 98 100
R e
xper
imen
tal (
%)
R calculated (%)
90
95
100
105
110
115
120
90 95 100 105 110 115 120
R e
xper
imen
tal (
%)
R calculated (%)
Figure 6. Cont.
Membranes 2020, 10, 408 13 of 16Membranes 2020, 10, x FOR PEER REVIEW 13 of 16
(c) (d)
(e) (f)
Figure 6. Correlation between the experimental values of the rejection coefficient and those calculated by the model. (a) ♦ AB83, (b) ■ AR, (c) ♦ BF, (d) ■ CV, (e) ● MO, (f) ◊ SY.
3.8. Comparative Study of the Results
A comparison of the results obtained on permeate flux and rejection coefficient using NF99 for the different dyes molecules was carried out. Table S1 (supplementary material) shows the results obtained by other authors using other membranes (native and modified) for the removal of dyes.
4. Conclusions
The performance of a polyamide nanofiltration membrane on the removal of six different dyes, Acid Brown-83, Allura Red, Basic Fuchsin, Crystal Violet, Methyl Orange and Sunset Yellow, has been studied. Firstly, the membrane characterization was carried out, obtaining a water permeability coefficient value of 1.665 × 10⁻⁸ s m−1. The membrane selectivity was also determined, and the solute permeability coefficients were 6.705 × 10⁻⁶ and 1.632 × 10⁻⁷ for NaCl and MgCl2, respectively. It has been proven that the chemical structure of the dyes has an important influence on the permeate fluxes and rejection coefficients obtained, these being the molecular volume and the length perpendicular to the maximum area the most relevant parameters. The pH influence was also studied, these being the membrane negatively charged at neutral and basic pH and therefore being repelled by the dye molecules of negative charge (AB83, AR, MO and SY). However, AB83 and MO dye molecules showed a decrease in permeate flux, which can be explained due to other types of interactions (hydrophobic interactions and the presence of hydrogen bonds that cause membrane blocking). Membrane fouling was determined by calculating a fouling factor, showing that the smaller dye molecules (Methyl Orange and Basic Fuchsin) presented the highest fouling. Additionally, when comparing dyes of similar molecular sizes, those with negative charges and linear size gave lower values of fouling factor. The morphologic study of the membrane by Scanning Electron Microscopy (SEM) and infrared spectrum confirmed the observed degree of fouling. Finally, the Spiegler–Kedem–Katchalsky model that simulates the membrane behavior was successfully applied, with a high degree of agreement between the experimental and calculated rejection coefficients.
90
92
94
96
98
100
90 92 94 96 98 100
R e
xper
imen
tal (
%)
R calculated (%)
90
92
94
96
98
100
90 92 94 96 98 100
R ex
perim
enta
l (%
)
R calculated (%)
0
20
40
60
80
100
0 20 40 60 80 100
R e
xper
imen
tal (
%)
R calculated (%)
90
92
94
96
98
100
90 92 94 96 98 100R
exp
erim
enta
l (%
)R calculated (%)
Figure 6. Correlation between the experimental values of the rejection coefficient and those calculatedby the model. (a) � AB83, (b) � AR, (c) � BF, (d) � CV, (e) •MO, (f) ♦ SY.
3.8. Comparative Study of the Results
A comparison of the results obtained on permeate flux and rejection coefficient using NF99 forthe different dyes molecules was carried out. Table S1 (Supplementary Material) shows the resultsobtained by other authors using other membranes (native and modified) for the removal of dyes.
4. Conclusions
The performance of a polyamide nanofiltration membrane on the removal of six different dyes,Acid Brown-83, Allura Red, Basic Fuchsin, Crystal Violet, Methyl Orange and Sunset Yellow, has beenstudied. Firstly, the membrane characterization was carried out, obtaining a water permeabilitycoefficient value of 1.665 × 10⁻⁸ s m−1. The membrane selectivity was also determined, and the solutepermeability coefficients were 6.705 × 10⁻⁶ and 1.632 × 10⁻⁷ for NaCl and MgCl2, respectively. It hasbeen proven that the chemical structure of the dyes has an important influence on the permeate fluxesand rejection coefficients obtained, these being the molecular volume and the length perpendicularto the maximum area the most relevant parameters. The pH influence was also studied, these beingthe membrane negatively charged at neutral and basic pH and therefore being repelled by the dyemolecules of negative charge (AB83, AR, MO and SY). However, AB83 and MO dye molecules showeda decrease in permeate flux, which can be explained due to other types of interactions (hydrophobicinteractions and the presence of hydrogen bonds that cause membrane blocking). Membrane foulingwas determined by calculating a fouling factor, showing that the smaller dye molecules (Methyl Orangeand Basic Fuchsin) presented the highest fouling. Additionally, when comparing dyes of similarmolecular sizes, those with negative charges and linear size gave lower values of fouling factor.The morphologic study of the membrane by Scanning Electron Microscopy (SEM) and infraredspectrum confirmed the observed degree of fouling. Finally, the Spiegler–Kedem–Katchalsky modelthat simulates the membrane behavior was successfully applied, with a high degree of agreementbetween the experimental and calculated rejection coefficients.
Supplementary Materials: The following are available online at http://www.mdpi.com/2077-0375/10/12/408/s1,Figure S1: Rejection coefficient (�) and permeate flux (�) variation with dreiding energy (A&B) and with MMFF94
Membranes 2020, 10, 408 14 of 16
Energy (C&D) for colorants: (MO) Methyl Orange, (BF) Basic Fuchsin, (SY) Sunset Yellow, (AR) Allure Red,(CV) Crystal Violet. Experimental conditions: pH = 7, [Dyes] = 50 mg/L and pressure 10 bar (A&C) and 15 bar(B&D). Figure S2: Rejection coefficient (�) and permeate flux (�) variation with minimal projection area (A&B) andwith maximal projection area (C&D) for colorants: (MO) Methyl Orange, (BF) Basic Fuchsin, (SY) Sunset Yellow,(AR) Allure Red, (CV) Crystal Violet. Experimental conditions: pH = 7, [Dyes] = 50 mg/L and pressure 10 bar (A&C)and 15 bar (B&D). Figure S3: Rejection coefficient (�) and permeate flux (�) variation with minimal projectionradius (A&B) and with maximal projection radius (C&D) for colorants: (MO) Methyl Orange, (BF) Basic Fuchsin,(SY) Sunset Yellow, (AR) Allure Red, (CV) Crystal Violet. Experimental conditions: pH = 7, [Dyes] = 50 mg/L andpressure 10 bar (A&C) and 15 bar (B&D). Figure S4: Rejection coefficient (�) and permeate flux (�) variation withlength perpendicular to the minimal area (A&B) and with molecular weight (C&D) for colorants: (MO) MethylOrange, (BF) Basic Fuchsin, (SY) Sunset Yellow, (AR) Allure Red, (CV) Crystal Violet. Experimental conditions:pH = 7, [Dyes] = 50 mg/L and pressure 10 bar (A&C) and 15 bar (B&D), Table S1: Comparison of dye removalbetween previous studies and this study in terms of water flux and rejection.
Author Contributions: Conceptualization, A.M.H. and G.L.; methodology, A.M.H. and G.L.; investigation, J.A.M.;resources, J.A.M.; writing—original draft preparation, A.M.H., M.G. and M.D.M.; writing—review and editing,A.M.H., G.L., J.A.M., M.G., M.D.M. and E.G.; supervision, A.M.H., G.L. and E.G. All authors have read and agreedto the published version of the manuscript.
Funding: This research received no external funding.
Acknowledgments: The authors would like to thank SAIT, from Polytechnic University of Cartagena for the SEMmade to the membrane.
Conflicts of Interest: The authors declare no conflict of interest.
Nomenclature
C0 solute concentration in the feed (kg/m3)Cm solute concentration in the membrane (kg/m3)Cp solute concentration in the permeate (kg/m3)Cs logarithmic average solute concentration between feeding and permeate (kg/m3)FF fouling factor (%)Js solute flux density (kg/m2s)Jv solvent flux density (kg/m2s)Lp solvent permeability coefficient (m/s)Lp0 initial solvent permeability coefficient (m/s)Lpf final solvent permeability coefficient (m/s)Ps solute permeability coefficient (m/s)r rejection (dimensionless)R rejection coefficient (%)Robs observed rejection coefficient (%)∆P operating pressure (Pa)∆Π osmotic pressure (Pa)σ reflection coefficient
References
1. Dasgupta, J.; Sikder, J.; Chakraborty, S.; Curcio, S.; Drioli, E. Remediation of textile effluents by membranebased treatment techniques: A state of the art review. J. Environ. Manag. 2015, 147, 55–72. [CrossRef]
2. Donkadokula, N.Y.; Kola, A.K.; Naz, I.; Saroj, D. A review on advanced physico-chemical and biologicaltextile dye wastewater treatment techniques. Rev. Environ. Sci. Biotechnol. 2020, 19, 543–560. [CrossRef]
3. De Jager, D.; Sheldon, M.S.; Edwards, W. Colour removal from textile wastewater using a pilot-scaledual-stage MBR and subsequent RO system. Sep. Purif. Technol. 2014, 135, 135–144. [CrossRef]
4. Verma, A.K.; Dash, R.R.; Bhunia, P. A review on chemical coagulation/flocculation technologies for removalof colour from textile wastewater. J. Environ. Manag. 2012, 93, 154–168. [CrossRef] [PubMed]
5. Liang, C.Z.; Sun, S.P.; Li, F.Y.; Ong, Y.K.; Chung, T.S. Treatment of highly concentrated wastewater containingmultiple synthetic dyes by a combined process of coagulation/flocculation and nanofiltration. J. Membr. Sci.2014, 469, 306–315. [CrossRef]
Membranes 2020, 10, 408 15 of 16
6. Lau, W.J.; Ismail, A.F. Polymeric nanofiltration membranes for textile dye wastewater treatment: Preparation,performance evaluation, transport modelling, and fouling control-a review. Desalination 2009, 245, 321–348.[CrossRef]
7. Wang, Z.; Wu, A.; Ciacchi, L.C.; Wei, G. Recent Advances in Nanoporous Membranes for Water Purification.Nanomaterials 2018, 8, 65. [CrossRef]
8. Ghadhban, M.Y.; Majdi, H.S.; Rashid, K.T.; Alsalhy, Q.F.; Lakshmi, D.S.; Salih, I.K.; Figoli, A. Removal of dyefrom a leather tanning factory by flat-sheet ultrafiltration (UF) membrane. Membranes 2020, 10, 47. [CrossRef]
9. Guo, D.; Xiao, Y.; Li, T.; Zhou, Q.; Shen, L.; Li, R.; Xu, Y.; Lin, H. Fabrication of high-performance compositenanofiltration membranes for dye wastewater treatment: Mussel-inspired layer-by-layer self-assembly.J. Colloid Interface Sci. 2020, 560, 273–283. [CrossRef]
10. Jun, B.M.; Yoon, Y.; Park, C.M. Post-treatment of nanofiltration polyamide membrane through alkali-catalyzedhydrolysis to treat dyes in model wastewater. Water 2019, 11, 1645. [CrossRef]
11. Li, Y.; Wong, E.; Mai, Z.; Der Bruggen, B.V. Fabrication of composite polyamide/Kevlar aramid nanofibernanofiltration membranes with high permselectivity in water desalination. J. Membr. Sci. 2019, 592,117396–117407. [CrossRef]
12. Benkhaya, S.; M´rabet, S.; Hsissou, R.; El Harfi, A. Synthesis of new low-cost organic ultrafiltration membranemade from Polysulfone/Polyetherimide blends and its application from soluble azoic dyes removal. J. Mater.Res. Technol. 2020, 9, 4763–4772.
13. Hidalgo, A.M.; Leon, G.; Gómez, M.; Murcia, M.D.; Gómez, E.; Penalva, P. Removal of4-chloro-2-methyl-phenol from aqueous solutions by nanofiltration and reverse osmosis. Desalin. Water Treat.2015, 53, 1499–1505. [CrossRef]
14. Hidalgo, A.M.; Murcia, M.D.; Gómez, E.; Leon, G.; Cascales, E. Influence of physicochemical parameters oforganic solutes on the retention and flux in nanofiltration process. Chem. Eng. Technol. 2016, 39, 1177–1184.[CrossRef]
15. Cheng, L.; Zhu, L.P.; Zhang, P.B.; Sun, J.; Zhu, B.K.; Xu, Y.Y. Molecular separation by poly (N-vinyl imidazole)gel-filled membranes. J. Membr. Sci. 2016, 497, 472–484. [CrossRef]
16. Chidambaram, T.; Oren, Y.; Noel, M. Fouling of nanofiltration membranes by dyes during brine recoveryfrom textile dye bath wastewater. Chem. Eng. J. 2015, 262, 156–168. [CrossRef]
17. Li, C.; Yang, Y.; Liu, Y.; Hou, L. Removal of PhACs and their impacts on membrane fouling in NF/ROmembrane filtration of various matrices. J. Membr. Sci. 2018, 548, 439–448. [CrossRef]
18. Zhang, N.; Huang, Z.; Yang, N.; Zhang, L.; Jiang, B.; Sun, Y.; Ma, J. Nanofiltration membrane via EGCG-PEIco-deposition followed by crosslinking on microporous PTFE substrates for desalination. Sep. Purif. Technol.2020, 232, 115964–115974. [CrossRef]
19. Restolho, J.A.; Prates, A.; Pinho, M.N.; Afonso, M.D. Sugars and lignosulphonates recovery from eucalyptusspent sulphite liquor by membrane processes. Biomass Bioenergy 2009, 33, 1558–1566. [CrossRef]
20. Catarino, M.; Mendes, A. Dealcoholizing wine by membrane separation processes. Innov. Food Sci.Emerg. Technol. 2011, 12, 330–337. [CrossRef]
21. Labarca, F.; Bórquez, R. Comparative study of nanofiltration and ion exchange for nitrate reduction in thepresence of chloride and iron in groundwater. Sci. Total Environ. 2020, 723, 137809–137821. [CrossRef][PubMed]
22. Wijmans, J.G.; Baker, R.W. The solution-diffusion model: A review. J. Membr. Sci. 1995, 107, 1–21. [CrossRef]23. Revchuk, A.D.; Suffet, I.N. Ultrafiltration separation of aquatic natural organic matter: Chemical probes for
quality assurance. Water Res. 2009, 43, 3685–3692. [CrossRef] [PubMed]24. Hidalgo, A.M.; Gómez, M.; Murcia, M.D.; Serrano, M.; Rodríguez-Schmidt, R.; Escudero, P.A. Behaviour of
polysulfone ultrafiltration membrane for dyes removal. Water Sci. Technol. 2018, 77, 2093–2100. [CrossRef]25. Lee, A.; Elamb, J.W.; Darling, S.B. Membrane materials for water purification: Design, development,
and application. Environ. Sci. Water Res. Technol. 2016, 2, 17–42. [CrossRef]26. Abdel-Fatah, M.A. Nanofiltration systems and applications in wastewater treatment: Review article.
Ain Shams Eng. J. 2018, 9, 3077–3092. [CrossRef]27. Yang, Z.; Zhou, Y.; Feng, Z.; Rui, X.; Zhang, T.; Zhang, Z. A review on reverse osmosis and nanofiltration
membranes for water purification. Polymers 2019, 11, 1252. [CrossRef] [PubMed]28. Kedem, O.; Katchalsky, A. Thermodynamics of flow processes in biological systems. Biophys. J. 1962, 2, 53–78.
Membranes 2020, 10, 408 16 of 16
29. Spiegler, K.S.; Kedem, O. Thermodynamics of hyperfiltration (reverse osmosis): Criteria for efficientmembranes. Desalination 1966, 1, 311–326. [CrossRef]
30. Ben-David, A.; Bason, S.; Jopp, J.; Oren, Y.; Freger, V. Partitioning of organic solutes between water andpolyamide layer of RO and NF membranes: Correlation of rejection. J. Membr. Sci. 2006, 281, 480–490.[CrossRef]
31. Hidalgo, A.M.; León, G.; Gómez, M.; Murcia, M.D.; Gómez, E.; Gómez, J.L. Application of theSpiegler-Kedem-Kachalsky model to the removal of 4-chlorophenol by different nanofiltration membranes.Desalination 2013, 315, 70–75. [CrossRef]
32. Yaroshchuk, A.E. Rejection of singles salts versus transmembrane volume flow in RO/NF: Thermodynamicproperties, model of constant coefficients, and its modification. J. Membr. Sci. 2002, 198, 285–297. [CrossRef]
33. Pontie, M.; Buisson, H.; Diawara, C.K.; Essis-Tome, H. Studies of halide ions mass transfer in nanofiltrationapplication to selective defluorination of brackish drinking water. Desalination 2003, 157, 127–134. [CrossRef]
34. Nora’aini, A.; Abdul Wahab, M. Regional Symposium on Membrane Science and Technology. In TheDevelopment of Predictive Modeling of Nanofiltration Membrane Properties: A Review; Kolej Universiti Sains &Teknologi: Johor, Malaysia; Universiti Kebangsaan: Johor, Malaysia, 2004.
Publisher’s Note: MDPI stays neutral with regard to jurisdictional claims in published maps and institutionalaffiliations.
© 2020 by the authors. Licensee MDPI, Basel, Switzerland. This article is an open accessarticle distributed under the terms and conditions of the Creative Commons Attribution(CC BY) license (http://creativecommons.org/licenses/by/4.0/).
Related Documents