ISSN: 0973-4945; CODEN ECJHAO E-Journal of Chemistry http://www.e-journals.net 2011, 8(2), 649-656 Malachite Green Dye Removal Using the Seaweed Enteromorpha R.JAYARAJ § , M. CHANDRA MOHAN, P. MARTIN DEVA PRASATH §* and T. HIDHAYATHULLAH KHAN § PG and Research Department of Chemistry TBML College, Porayar - 609307, Nagapattinam, Tamilnadu, India PG and Research Department of Chemistry Khadir Mohideen College Adirampattinam - 614 701, Tamilnadu, India [email protected] Received 9 September 2010; Revised 9 November 2010; Accepted 11 November 2010 Abstract: Malachite green adsorption from an aqueous solution onto activated Enteromorpha carbon has been studied experimentally using batch adsorption method. Adsorption kinetics and equilibrium were investigated as a function of initial dye concentration, pH, contact time and adsorbent dosage. Kinetics studies indicated that the adsorption followed pseudo second order reaction. Equilibrium data was analyzed using Langmuir and Freundlich isotherm models. The adsorption capacity of Enteromorpha was found to be 94.74%. On the basis of experimental results and the model parameters, it can be inferred that the carbonaceous Enteromorpha is effective for the removal of malachite green from aqueous solution. Keywords: Adsorption, Enteromorpha, Activated carbon, Malachite green dye, Kinetics, Equilibrium. Introduction Dyes normally have a complex aromatic molecular structure which makes them more stable and more difficult to biodegrade 1 . Further dyes have synthetic origin. They are widely used in textiles, paper, rubber, plastics, leather, cosmetics, pharmaceuticals and food industries. At present there are more than 10,000 dyes which are commercially available 2 . Widespread use of dyes often poses pollution problems in the form of coloured waste water discharged into environmental water bodies. It not only affects aesthetic merit but also reduces light penetration and photosynthesis. Also, some dyes are either toxic or mutagenic and carcinogenic 3 . The conventional methods for treating dyes containing waste waters are coagulation and flocculation 4 , oxidation or ozonation 5&6 , membrane separation 7 and activated carbon adsorption 8 . But these technologies do not show considerable efficiency or economic advantage. Though activated carbon is the most popular and widely used dye

Welcome message from author
This document is posted to help you gain knowledge. Please leave a comment to let me know what you think about it! Share it to your friends and learn new things together.
Transcript

ISSN: 0973-4945; CODEN ECJHAO
E-Journal of Chemistry
http://www.e-journals.net 2011, 8(2), 649-656
Malachite Green Dye Removal
Using the Seaweed Enteromorpha
R.JAYARAJ§, M. CHANDRA MOHAN, P. MARTIN DEVA PRASATH
§*
and T. HIDHAYATHULLAH KHAN
§PG and Research Department of Chemistry
TBML College, Porayar - 609307, Nagapattinam, Tamilnadu, India
PG and Research Department of Chemistry
Khadir Mohideen College Adirampattinam - 614 701, Tamilnadu, India
Received 9 September 2010; Revised 9 November 2010; Accepted 11 November 2010
Abstract: Malachite green adsorption from an aqueous solution onto activated
Enteromorpha carbon has been studied experimentally using batch adsorption
method. Adsorption kinetics and equilibrium were investigated as a function of
initial dye concentration, pH, contact time and adsorbent dosage. Kinetics
studies indicated that the adsorption followed pseudo second order reaction.
Equilibrium data was analyzed using Langmuir and Freundlich isotherm
models. The adsorption capacity of Enteromorpha was found to be 94.74%.
On the basis of experimental results and the model parameters, it can be
inferred that the carbonaceous Enteromorpha is effective for the removal of
malachite green from aqueous solution.
Keywords: Adsorption, Enteromorpha, Activated carbon, Malachite green dye, Kinetics, Equilibrium.
Introduction
Dyes normally have a complex aromatic molecular structure which makes them more stable
and more difficult to biodegrade1. Further dyes have synthetic origin. They are widely used
in textiles, paper, rubber, plastics, leather, cosmetics, pharmaceuticals and food industries.
At present there are more than 10,000 dyes which are commercially available2. Widespread
use of dyes often poses pollution problems in the form of coloured waste water discharged
into environmental water bodies. It not only affects aesthetic merit but also reduces light
penetration and photosynthesis. Also, some dyes are either toxic or mutagenic and
carcinogenic3. The conventional methods for treating dyes containing waste waters are
coagulation and flocculation4, oxidation or ozonation
5&6, membrane separation
7 and
activated carbon adsorption8. But these technologies do not show considerable efficiency or
economic advantage. Though activated carbon is the most popular and widely used dye

650 P. MARTIN DEVA PRASATH et al.
sorbent it has certain problems in its usage. The major drawback is its cost. Hence, there is a
widespread awareness in using low cost, easily available biomaterials for the adsorption of
dye colours. Many botanical materials of a very low price have directly been used as sorbent
for dye adsorption from waste water9-20
. Since India is a developing nation and a large
producer of synthetic textile dyes, novel and economical treatment technologies of dye
waste water are the need of the hour.
In the present study, a marine alga which is commonly and abundantly available in the
Bay of Kodiyakkarai coast namely, Enteromorpha was selected as an adsorbent for the
removal of Malachite green from aqueous solution.
Experimental
Enteromorpha was collected from Kodiyakkarai coast in south east coast of India and sun
dried. Dry biomass was cut with a knife into irregular shaped particles between 1 and 3 mm in
size. The biomass was then washed with distilled water, filtered and finally dried overnight at
60 °C and crushed to an average size of 0-63 µ in a mortar and then activated by 0.1 M H2SO4
for 24 h and finally carbonized and subsequently used for adsorption experiment.
Adsorbate solution
A 25 ppm solution of malachite green dye was prepared by weighing accurately 25 mg of
analar grade malachite green dye and dissolving in 1000 mL standard flask. It was made up
to the mark with deionised water. The stock solution was further diluted with deionised
water to desired concentration for obtaining the test solution.
Chemicals
Analytical grade reagents were used for malachite green dye solution; ACS reagent grade
concentrated hydrochloric acid, NaOH and pH buffer solutions were used to adjusted pH
values of samples. In all experimental work, distilled demineralised water was used.
Batch mode adsorption studies
The adsorption of MG dye on the Enteromorpha was studied by batch technique. A known
weight of adsorbent(for example 50-350 mg of adsorbent) was equilibrated with 50 mL of
dye solution of known concentration in a 250 mL reagent bottle in a mechanical shaker for a
known period of time( 30-180 min). After equilibrium, the suspension of the adsorbent was
separated from solution by filtration using Whatman no. 41 filter paper. The concentration
of dye remaining in solution was measured. The effect of some parameters, such as pH,
concentrations, contact time and adsorbent dose on the adsorption was studied. The pH of
the adsorptive solutions was adjusted using hydrochloric acid, sodium hydroxide and buffer
solutions when required. The results of these studies were used to obtain the optimum
conditions for maximum dye removal from aqueous solution.
Results and Discussion
The results of the experiments carried out for the removal of malachite green dye from
aqueous solution using Enteromorpha as adsorbent are discussed below.
Effect of initial concentration of dye
The results for effect of initial concentration on percentage removal of dye using Enteromorpha
is presented in Table 1. It can be seen from the Figure 1 that the percentage removal decreases
with the increase in dye concentration. For Enteromorpha the percentage removal is 94.74% at
the initial concentration of 25 mg/L for 250 mg of adsorbent dose and a contact time of 3 h.
Concentration in ppm
% r
emo
val
of
MG
dy
e
Weight of adsorbent in mg
% M
G d
ye
adso
rpti
on
Malachite Green Dye Removal Using the Seaweed Enteromorpha 651
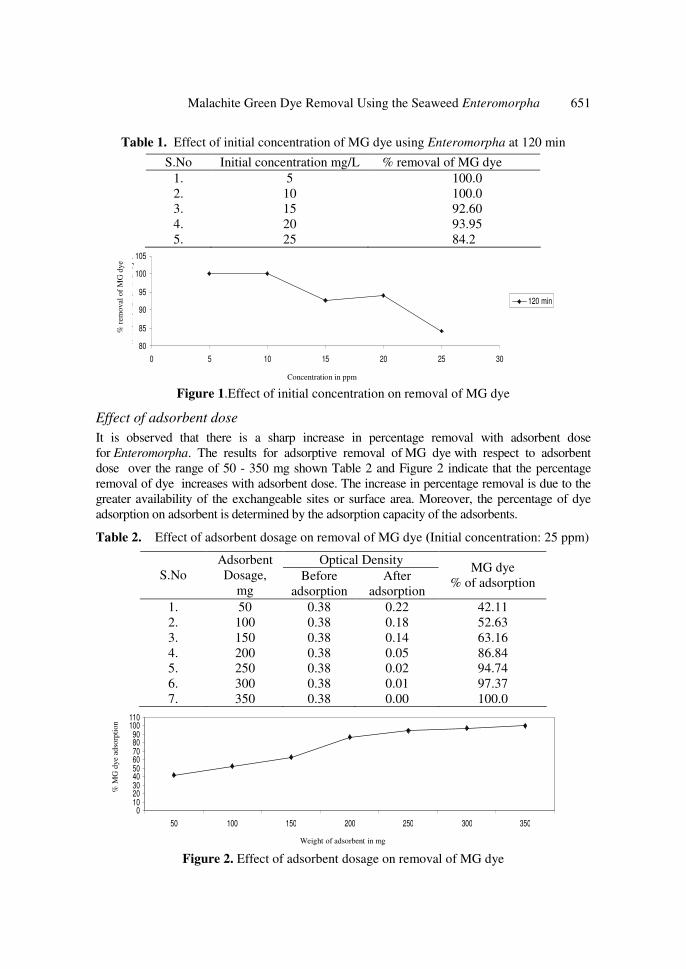
Table 1. Effect of initial concentration of MG dye using Enteromorpha at 120 min
S.No Initial concentration mg/L % removal of MG dye
1. 5 100.0
2. 10 100.0
3. 15 92.60
4. 20 93.95
5. 25 84.2
80
85
90
95
100
105
0 5 10 15 20 25 30
Concentration in ppm
% R
em
ov
al
of
MG
dy
e
120 min
Figure 1.Effect of initial concentration on removal of MG dye
Effect of adsorbent dose
It is observed that there is a sharp increase in percentage removal with adsorbent dose
for Enteromorpha. The results for adsorptive removal of MG dye with respect to adsorbent
dose over the range of 50 - 350 mg shown Table 2 and Figure 2 indicate that the percentage
removal of dye increases with adsorbent dose. The increase in percentage removal is due to the
greater availability of the exchangeable sites or surface area. Moreover, the percentage of dye
adsorption on adsorbent is determined by the adsorption capacity of the adsorbents.
Table 2. Effect of adsorbent dosage on removal of MG dye (Initial concentration: 25 ppm)
0102030405060708090
100110
50 100 150 200 250 300 350
Figure 2. Effect of adsorbent dosage on removal of MG dye
Optical Density
S.No
Adsorbent
Dosage,
mg Before
adsorption
After
adsorption
MG dye
% of adsorption
1. 50 0.38 0.22 42.11
2. 100 0.38 0.18 52.63
3. 150 0.38 0.14 63.16
4. 200 0.38 0.05 86.84
5. 250 0.38 0.02 94.74
6. 300 0.38 0.01 97.37
7. 350 0.38 0.00 100.0
% M
G d
ye
adso
rpti
on
Time in min
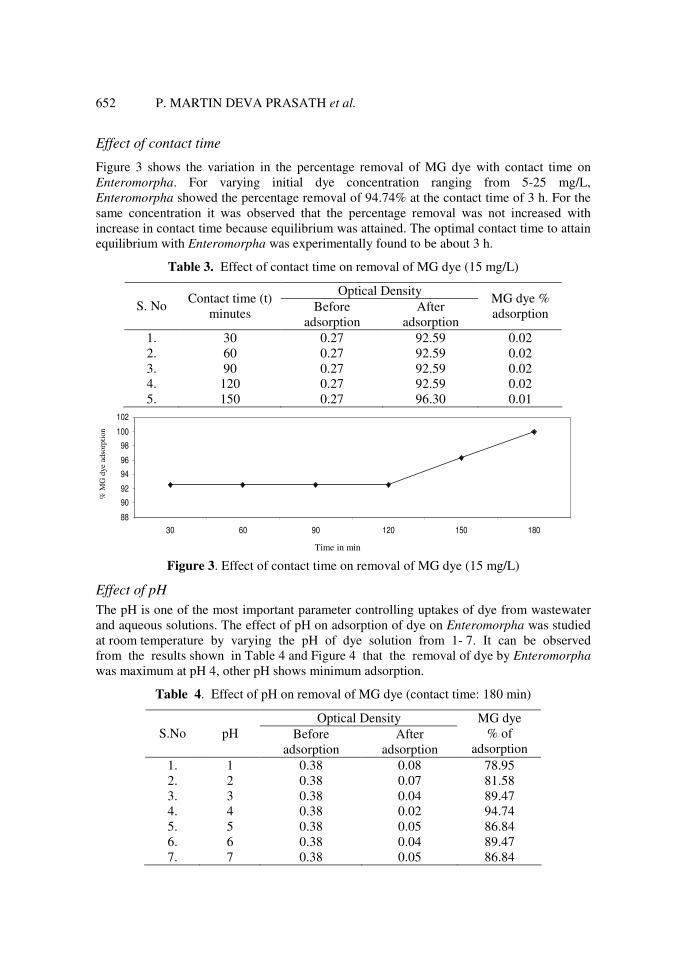
652 P. MARTIN DEVA PRASATH et al.
Effect of contact time
Figure 3 shows the variation in the percentage removal of MG dye with contact time on
Enteromorpha. For varying initial dye concentration ranging from 5-25 mg/L,
Enteromorpha showed the percentage removal of 94.74% at the contact time of 3 h. For the
same concentration it was observed that the percentage removal was not increased with
increase in contact time because equilibrium was attained. The optimal contact time to attain
equilibrium with Enteromorpha was experimentally found to be about 3 h.
Table 3. Effect of contact time on removal of MG dye (15 mg/L)
Optical Density
S. No Contact time (t)
minutes Before
adsorption
After
adsorption
MG dye %
adsorption
1. 30 0.27 92.59 0.02
2. 60 0.27 92.59 0.02
3. 90 0.27 92.59 0.02
4. 120 0.27 92.59 0.02
5. 150 0.27 96.30 0.01
88
90
92
94
96
98
100
102
30 60 90 120 150 180
Figure 3. Effect of contact time on removal of MG dye (15 mg/L)
Effect of pH
The pH is one of the most important parameter controlling uptakes of dye from wastewater
and aqueous solutions. The effect of pH on adsorption of dye on Enteromorpha was studied
at room temperature by varying the pH of dye solution from 1- 7. It can be observed
from the results shown in Table 4 and Figure 4 that the removal of dye by Enteromorpha
was maximum at pH 4, other pH shows minimum adsorption.
Table 4. Effect of pH on removal of MG dye (contact time: 180 min)
Optical Density
S.No pH Before
adsorption
After
adsorption
MG dye
% of
adsorption
1. 1 0.38 0.08 78.95
2. 2 0.38 0.07 81.58
3. 3 0.38 0.04 89.47
4. 4 0.38 0.02 94.74
5. 5 0.38 0.05 86.84
6. 6 0.38 0.04 89.47
7. 7 0.38 0.05 86.84

pH
% M
G d
sorp
tio
n
log Ceq
1+
log
e,
X/M
Malachite Green Dye Removal Using the Seaweed Enteromorpha 653
75
80
85
90
95
100
0 1 2 3 4 5 6 7 8
25ppm
Figure 4. Effect of pH on removal of MG dye
Freundlich Isotherms
Freundlich isotherm is log qe=log Kf+1/n log Ce
Where qe is the amount of dye adsorbed per unit weight of adsorbent (mg/g), Kf is the
measure of sorption capacity and l/n is sorption intensity; Ce is equilibrium concentration of
residual dye in solution. Figure 5 shows the Freundlich adsorption isotherms for
Enteromorpha. The straight line nature of the plots indicates that the process followed was
of Freundlich adsorption type.
Table 5. Data for Freundlich plot (150 min)
S.
No.
Initial
Concentration,
mg/L
MG dye
eq, Ceq log Ceq
MG dye
ad, ‘x’
m
x , qe
x 10-5
loge
m
x
1 + loge
m
x
1. 5 0.00 0.00 5.00 0.500 -0.30 0.70
2. 10 0.00 0.00 10.00 1.000 0.00 1.00
3. 15 0.55 -0.26 14.45 1.445 0.16 1.16
4. 20 1.21 0.08 18.79 1.879 0.27 1.27
5. 25 0.66 -0.18 23.03 2.303 0.32 1.32
0
0.5
1
1.5
-0.3 -0.25 -0.2 -0.15 -0.1 -0.05 0 0.05 0.1
Figure 5. Data for Freundlich plot (150 min)
Langmuir isotherm
It is represented experimentally by the expression. 221K
P
KK
1
m/x
P+=
where K1 and K2 are proportionality constants, P - initial concentration (Ceq), x/m- amount of dye adsorbed at
equilibrium (mg/g), qe. A plot of Ce/qe versus Ce will give a straight line. The slope of
this is 1/K2 and intercept on the y − axis will give 1/K1K2. Figure 6 indicates
adsorption of dye on Enteromorpha is best fit with Langmuir model and so we infer
that it followed Langmuir adsorption isotherms.

Ce
Ce/
Qe
Time in min
t/q
654 P. MARTIN DEVA PRASATH et al.
Table 6. Data for Langmuir plot (120 min)
0
0.5
1
1.5
0 0.5 1 1.5 2 2.5 3
Ce
/Qe
Figure 6. Data for Langmuir plot (120 min)
Lagergren kinetics
Lagergren also proposed kinetics for the adsorption. According to him, if a plot of time in
minutes versus log10 (qe−q) gives a straight line and it follows the first order kinetics. If a
plot of time in minutes versus t/q gives a straight line and it follows the pseudo second order
kinetics.
Where,
qe–Maximum x/m value at maximum time
q –minimum x/m value at minimum time
x–amount of dye adsorbed
m–Mass of the adsorbent
Figure 7 indicated adsorption of dye on Enteromorpha gave the straight line, so it
followed the pseudo second order.
Table 7. Data for Lagergren plot (20 mg/L)
S. No Contact time
(t) minutes MG dye ad ‘X’ µg
m
x q x10−5
qe-q t/q
1. 30 16.36 1.636 0.364 18.34
2. 60 17.58 1.758 0.242 34.13
3. 90 18.18 1.818 0.182 49.50
4. 120 18.79 1.879 0.121 63.86
5. 150 18.79 1.879 0.121 79.83
6. 180 20.00 2.000 0.000 90.00
0
2040
60
80
100
0 50 100 150 200
Figure 7. Data for Lagergren plot (20 mg/L)
S. No. MG dye eq
m
x , qe x 10-5
eq
Ce
1. 0.00 0.500 0.00
2. 0.00 1.000 0.00
3. 1.11 1.389 0.80
4. 1.21 1.879 0.64
5. 2.64 2.105 1.25
2 0
Inte
nsi
ty,
a.u
Malachite Green Dye Removal Using the Seaweed Enteromorpha 655
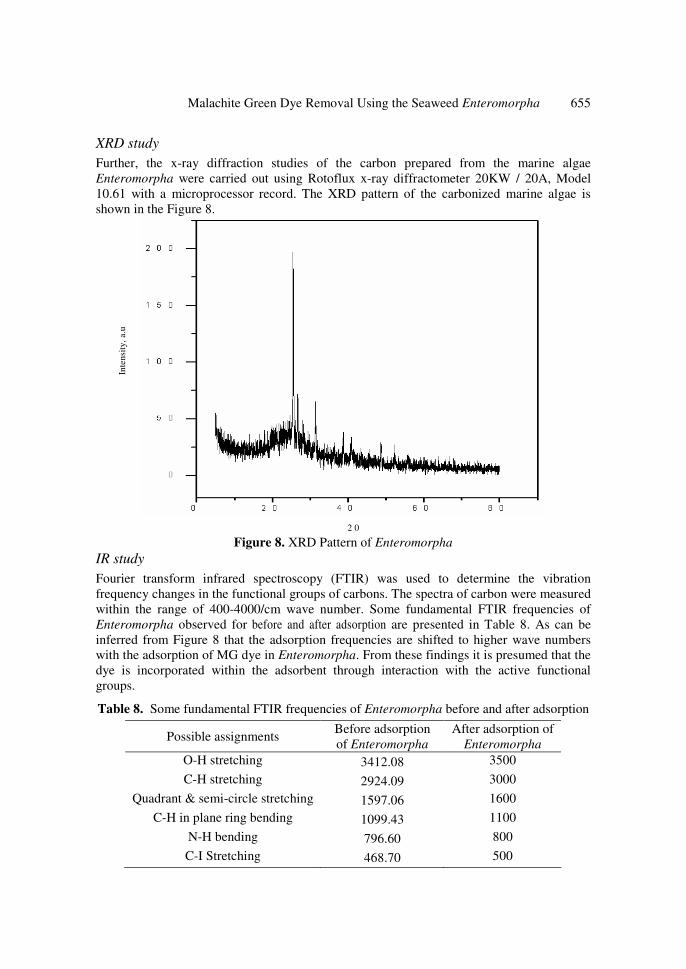
XRD study
Further, the x-ray diffraction studies of the carbon prepared from the marine algae
Enteromorpha were carried out using Rotoflux x-ray diffractometer 20KW / 20A, Model
10.61 with a microprocessor record. The XRD pattern of the carbonized marine algae is
shown in the Figure 8.
Figure 8. XRD Pattern of Enteromorpha
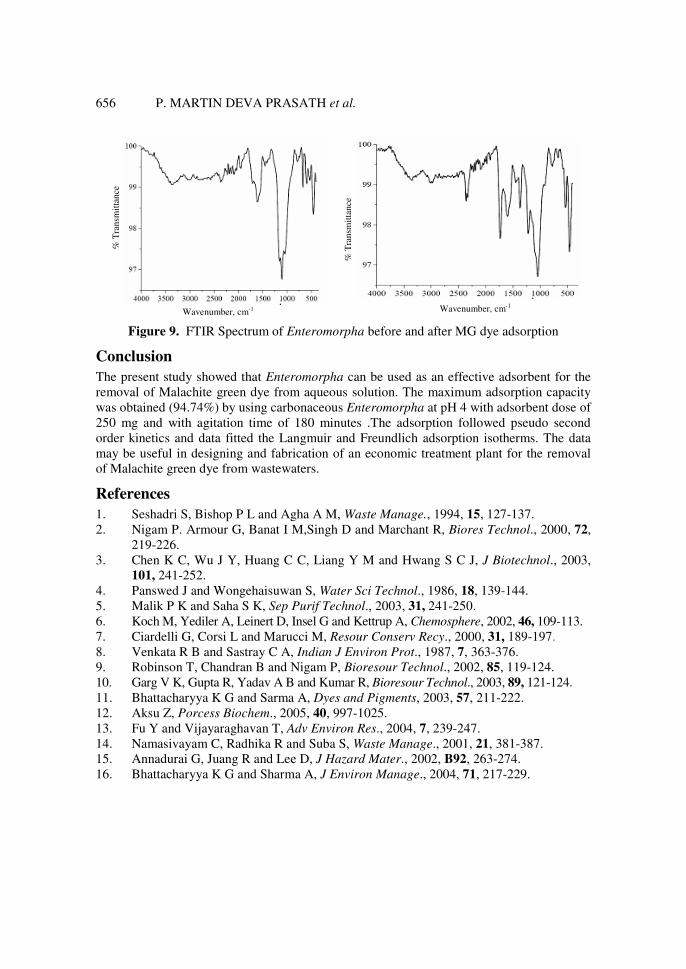
IR study
Fourier transform infrared spectroscopy (FTIR) was used to determine the vibration
frequency changes in the functional groups of carbons. The spectra of carbon were measured
within the range of 400-4000/cm wave number. Some fundamental FTIR frequencies of
Enteromorpha observed for before and after adsorption are presented in Table 8. As can be
inferred from Figure 8 that the adsorption frequencies are shifted to higher wave numbers
with the adsorption of MG dye in Enteromorpha. From these findings it is presumed that the
dye is incorporated within the adsorbent through interaction with the active functional
groups.
Table 8. Some fundamental FTIR frequencies of Enteromorpha before and after adsorption
Possible assignments Before adsorption
of Enteromorpha
After adsorption of
Enteromorpha
O-H stretching 3412.08 3500
C-H stretching 2924.09 3000
Quadrant & semi-circle stretching 1597.06 1600
C-H in plane ring bending 1099.43 1100
N-H bending 796.60 800
C-I Stretching 468.70 500
% T
ran
smit
tan
ce
% T
ran
smit
tan
ce
Wavenumber, cm-1
Wavenumber, cm-1
656 P. MARTIN DEVA PRASATH et al.
Figure 9. FTIR Spectrum of Enteromorpha before and after MG dye adsorption
Conclusion
The present study showed that Enteromorpha can be used as an effective adsorbent for the
removal of Malachite green dye from aqueous solution. The maximum adsorption capacity
was obtained (94.74%) by using carbonaceous Enteromorpha at pH 4 with adsorbent dose of
250 mg and with agitation time of 180 minutes .The adsorption followed pseudo second
order kinetics and data fitted the Langmuir and Freundlich adsorption isotherms. The data
may be useful in designing and fabrication of an economic treatment plant for the removal
of Malachite green dye from wastewaters.
References
1. Seshadri S, Bishop P L and Agha A M, Waste Manage., 1994, 15, 127-137.
2. Nigam P. Armour G, Banat I M,Singh D and Marchant R, Biores Technol., 2000, 72,
219-226.
3. Chen K C, Wu J Y, Huang C C, Liang Y M and Hwang S C J, J Biotechnol., 2003,
101, 241-252.
4. Panswed J and Wongehaisuwan S, Water Sci Technol., 1986, 18, 139-144.
5. Malik P K and Saha S K, Sep Purif Technol., 2003, 31, 241-250.
6. Koch M, Yediler A, Leinert D, Insel G and Kettrup A, Chemosphere, 2002, 46, 109-113.
7. Ciardelli G, Corsi L and Marucci M, Resour Conserv Recy., 2000, 31, 189-197.
8. Venkata R B and Sastray C A, Indian J Environ Prot., 1987, 7, 363-376.
9. Robinson T, Chandran B and Nigam P, Bioresour Technol., 2002, 85, 119-124.
10. Garg V K, Gupta R, Yadav A B and Kumar R, Bioresour Technol., 2003, 89, 121-124.
11. Bhattacharyya K G and Sarma A, Dyes and Pigments, 2003, 57, 211-222.
12. Aksu Z, Porcess Biochem., 2005, 40, 997-1025.
13. Fu Y and Vijayaraghavan T, Adv Environ Res., 2004, 7, 239-247.
14. Namasivayam C, Radhika R and Suba S, Waste Manage., 2001, 21, 381-387.
15. Annadurai G, Juang R and Lee D, J Hazard Mater., 2002, B92, 263-274.
16. Bhattacharyya K G and Sharma A, J Environ Manage., 2004, 71, 217-229.
Research Journal of Chemistry and Environment______________________________________Vol.15 (2) June (2011) Res.J.Chem.Environ
(1)
SSeeppaarraattiioonn ooff LLeeaadd ((IIII)) IIoonnss ffrroomm AAqquueeoouuss SSoolluuttiioonnss bbyy AAddssoorrppttiioonn oonn DDoolloommiittee
Jeyasingh Thanaraj P., Martin Deva Prasath P.,* Jayaraj R. and Thillai Natarajan S. Post Graduate and Research Department of Chemistry, T.B.M.L. College, Porayar-609307, Tamil Nadu, INDIA
Abstract The presence of heavy metals in the environment has adverse effects on plants, animals and humans. Even a low concentration of lead in water is toxic to aquatic life. Lead affects the central nervous system, cardiovascular system and kidney function. The present study was aimed at the development of dolomite, a carbonate mineral, as the adsorbent for the removal of lead(II) ions by adsorption. Separation of lead(II) ions from aqueous solutions containing 10 to 200 mg dm-3 of lead was studied. The effects of change in pH, adsorbent dosage, initial concentration of lead(II) ions, temperature and contact time were studied using batch method. The data were fed into various isotherm equations – Langmuir, Freundlich, Redlich- Peterson and Dubinin- Radushkevich and the best fit was envisaged. Thermodynamic parameters like changes in enthalpy, entropy and Gibbs free energy for the adsorption process were evaluated .Kinetics of the adsorption process was studied using Lagergren’s first order, pseudo-second order, Elovich and Inter particle diffusion model rate equations and the rate constants and other parameters were deduced .Spectral studies (FTIR, XRD and SEM) were conducted on the adsorbent before and after the adsorption process and the data were analysed. Results show that the adsorption of lead(II) ions on dolomite is a spontaneous, endothermic process proceeding with increase in entropy. Keywords: Adsorption, lead(II) ion ,dolomite, Environmental pollution, Isotherms, Kinetics and Randomness. Introduction Lead is widely used in storage batteries ,plumbing, soldering , ammunition ,bearings ,printing and in petroleum, chemical, electrochemical, textile ,paper and paint industries[1-3].It is estimated that about five million tons of the metal are produced all over the world annually[4].Lead contamination is a major environmental health hazard. The exhaust from automobiles contain oxides of lead which are potential air pollutants. These oxides are washed by rain and reach the soil. Tons and tons of effluents containing as much as 0.1 g dm-3 of lead are released into water sources from many industries. Lead accumulates in the blood and in the bones and affects the
soft tissues. It is the culprit behind many health hazards such as anemia, and damage to kidney, lungs, brain and the central nervous system[7]. For the separation of heavy metals like lead from aqueous solutions, several techniques are in use. Some of them are precipitation & filtering, chemical oxidation, membrane separation, adsorption, ion exchange, solvent extraction, reverse osmosis, complex formation and distillation. Many of these processes are associated with disadvantages like high cost, low selectivity, incomplete removal, high energy requirements and generation of toxic slurries[6].Adsorption methods are preferred because of their ease of operation, low maintenance costs and high efficiency[8]. The most efficient and widely used adsorbent is activated carbon but owing to its high cost, alternative cheap, readily available adsorbents are discovered through research. Clay minerals like Kaolinite[9,10], Bentonite[11,12] and Zeolite [13] have been successfully used as adsorbents .The present study makes use of the mineral dolomite (Calcium magnesium carbonate) as the adsorbent. Materials and methods Materials: The dolomite used in this study was from M/s Loba Company, Mumbai. It has the composition as given by Table 1.It was crushed to fine powder in a mortar and sieved to get particles with diameter 0.63 nm or less and then dried in an air oven at 1100C. Lead(II) ion Solutions: A stock solution of lead(II) ions containing 1000 mg dm-3 of lead was prepared by dissolving accurate quantity of analar grade lead nitrate in deionized water. Solutions of desired concentrations were prepared by proper dilutions of this stock solution. The solution PH was adjusted to desired value with 0.1 M HCl and 0.1 M NaOH solutions. Batch adsorption studies: The batch experiments were carried out in 250 cm3 closed bottles kept in a mechanical shaker at 200 rpm. The effect of PH on the adsorption of lead(II) ions onto dolomite was studied by equilibrating the mixture containing 0.15 g of dolomite and 50 cm3 of lead(II) ion solution containing 50 mg dm-3 of lead at different PH values between 1 and 6.The optimum PH was determined as 5.0 and used throughout all adsorption experiments. The effect of adsorbent dosage was studied using dolomite ranging from 50 to 250 mg with 50 cm3 lead(II) ion solution containing 50 mg dm-3 lead. The optimum value for adsorbent dosage was determined as 150 mg and this value was used in all batch experiments.After the adsorption has reached equilibrium the mixture was centrifuged at 3500 rpm for 5 min and the supernatant

Research Journal of Chemistry and Environment______________________________________Vol.15 (2) June (2011) Res.J.Chem.Environ
(2)
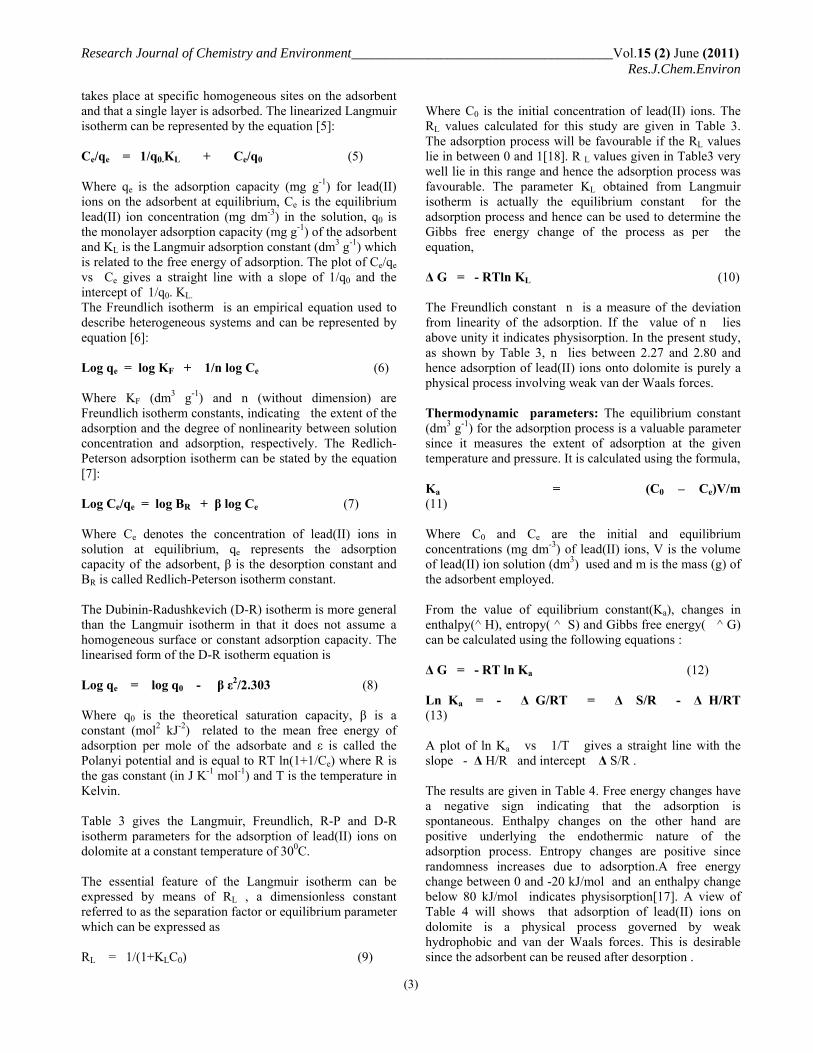
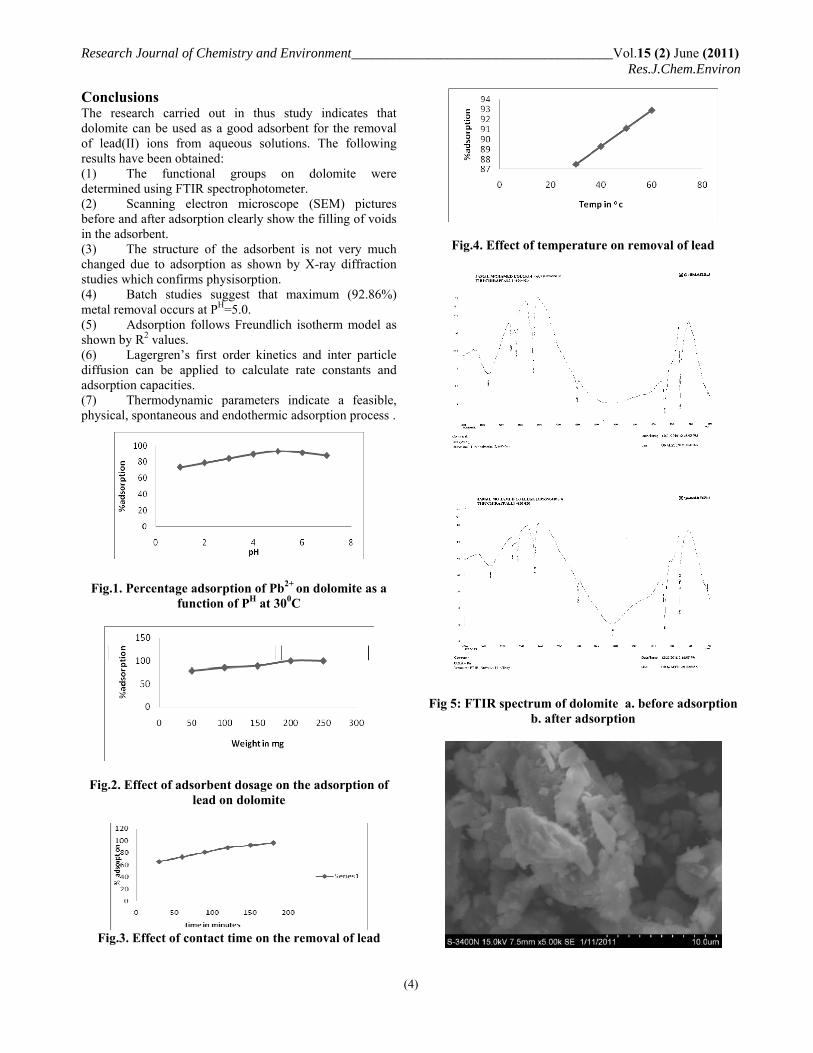
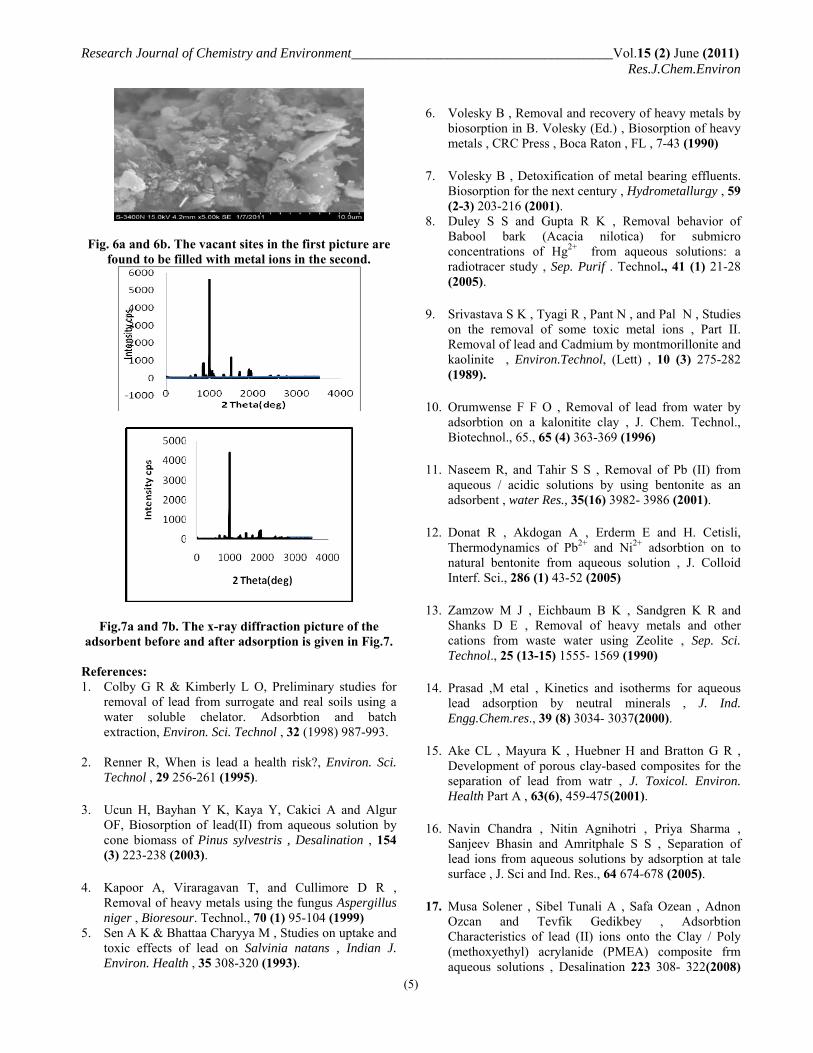
solution subjected to quantitative analysis. For kinetic studies equilibrium concentrations were determined at 10,20,30,40,50 and 60 min intervals and the data fit into various kinetic models. Metal ion solutions ranging from 10 to 60 mg dm-3 were employed in the study of adsorption isotherms. Results and discussions Effect of PH: The effect of PH on the adsorption of lead(II) ions onto dolomite is given in Fig.1.It was observed that the absorption capacity initially increased with increasing PH but decreased after PH=5. Under highly acidic conditions metal binding sites in the adsorbent were associated with H3O+ ions which restricted approach of Pb2+ ions due to electrostatic repulsion. With increasing PH, H3O+ ions get replaced by neutral molecules or negative OH- ions, thereby facilitating approach of metal ions. Metal precipitation was found to occur at higher PH values. Effect of adsorbent concentration on metal removal: The results of the experiment with varying adsorbent dosages is given in Fig.2.Adsorption was found to increase with increasing dosage of adsorbent since the number of metal binding sites would be increased. Maximum adsorption was found to occur with an adsorbent dosage of 200 mg or above . Effect of contact time on metal adsorption:Fig.3 shows the removal of metal ions as a function of contact time. Maximum adsorption was found to occur with a contact time of 180 min. All the batch experiments were carried out for this period. Effect of temperature: Batch adsorption experiments were carried out at four different temperatures namely 30,40,50 and 600C with varying initial concentrations of metal ions: 50,100 and 200 mg dm-3. Increase in temperature was found to be associated with increase in the adsorption of metal ions onto the adsorbent which explains the endothermic nature of the adsorption process. Increase in temperature probably increases the number of metal-binding sites on the adsorbent. A maximum of 93.3% metal removal was found to occur at 600C when the initial concentration of metal ion was 100 mg dm-3. The results are shown in Fig.4 FTIR analysis: The FTIR spectra of dolomite before and after adsorption are shown in Fig.5 a and 5b.The scanning electron microscope (SEM) pictures of dolomite before and after adsorption are SEM analysis: The surface morphology of the dolomite was examined using scanning electron microscopy (SEM), the corresponding SEM micrographs being obtained using at an accelerating voltage of 15 kV (Hitachi SE 900) at 5000× magnification (Figure 6). At such magnification, the dolomite particles showed rough areas of surface within which micropores were clearly identifiable.
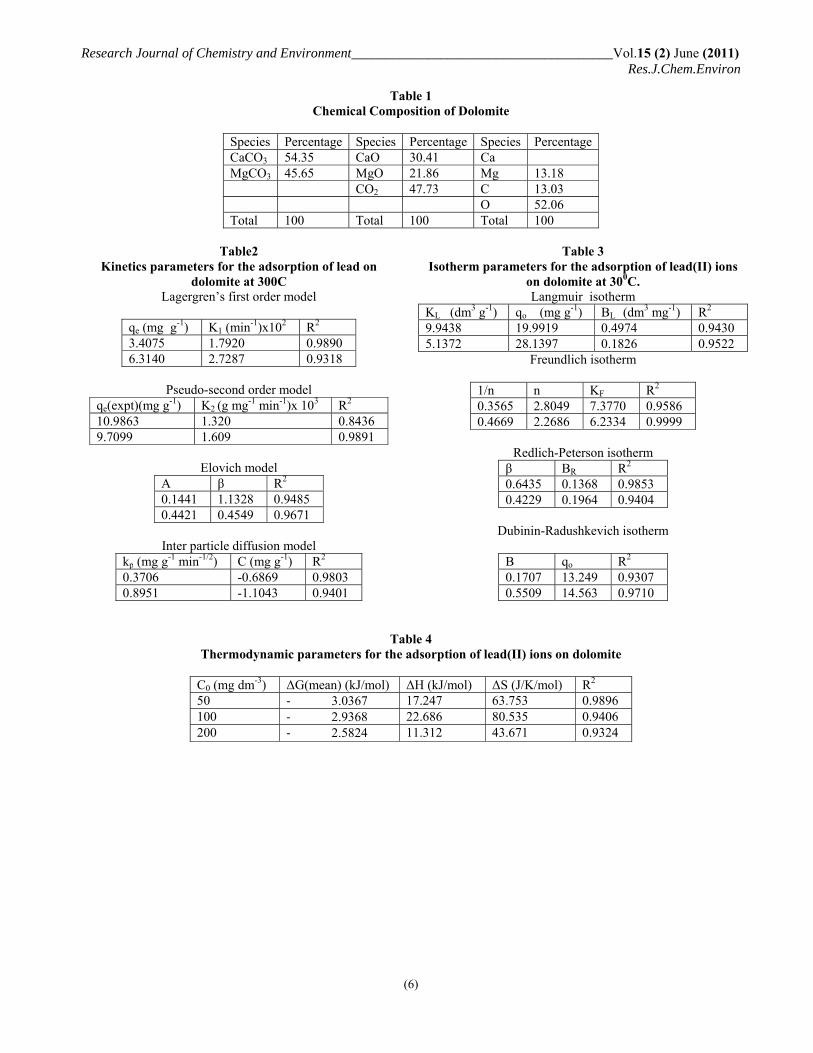
XRD analysis: Further, the Xray Diffraction Studies of the Dolamite were carried out using Rigaku corporation, Japan X-ray Diffractometer 40KV / 30mA, Model D/Max ULTIMA III . The before and after XRD pattern of the Dolamite is shown in the Figure 7a and 7b. Kinetics of adsorption: Kinetics of adsorption is a characteristic responsible for the efficiency of adsorption. Since the initial sorption rate plays a crucial role, adsorption was measured at time intervals 10,20,30,40, 50 and 60 min and kinetics of the process was studied making use of four models namely Lagergren’s first order, Pseudo second order, Elovich and Inter particle diffusion. The Lagergren’s first order rate equation can be written as Log(qe-qt) = loqe – k1t/2.303 (1) Where qe and qt are the amounts of lead(II) ions adsorbed (mg g-1) at equilibrium and at time t and k1 is the Lagergren’s first order rate constant (in min-1). Values of k1 and qe, calculated from the slope and y- intercept, respectively, of the plot of log (qe-qt) against t are given in Table 2. The pseudo-second order kinetics can be expressed by the rate equation, t/qt = 1/k2.qe
2 + t/qe (2) where qe and qt are the amounts of lead(II) ions adsorbed (mg g-1) at equilibrium and at time t; k2 is the second order rate constant(gmg-1min-1). Values of k2 and qe , calculated from plots of t/qt against t, are given in Table 2. The Elovich model can be expressed as qt = 1/β ln αβ + 1/β ln t (3) Where α refers to initial adsorption rate and β is the desorption constant. Both α and β can be calculated from the slope and y-intercept of the plot of qt vs lnt. The inter particle diffusion model of kinetics can be stated as the rate equation, qt = kp . t1/2 (4) where kp is the rate constant for the diffusion process and c is a constant. The kinetics parameters are given in Table 2. Considering the R2 values the data best fits the Lagergren’s first order model and the inter particle diffusion Adsorption isotherms: The adsorption isotherms are one of the promising data to get an idea of the mechanism of adsorption. Four adsorption isotherms are selected in this study namely the Langmuir, Freundlich, Redlich-Peterson (R-P) and Dubinin-Radushkevich (D-R) isotherms. The Langmuir adsorption isotherm assumes that adsorption
Research Journal of Chemistry and Environment______________________________________Vol.15 (2) June (2011) Res.J.Chem.Environ
(3)
takes place at specific homogeneous sites on the adsorbent and that a single layer is adsorbed. The linearized Langmuir isotherm can be represented by the equation [5]: Ce/qe = 1/q0.KL + Ce/q0 (5) Where qe is the adsorption capacity (mg g-1) for lead(II) ions on the adsorbent at equilibrium, Ce is the equilibrium lead(II) ion concentration (mg dm-3) in the solution, q0 is the monolayer adsorption capacity (mg g-1) of the adsorbent and KL is the Langmuir adsorption constant (dm3 g-1) which is related to the free energy of adsorption. The plot of Ce/qe vs Ce gives a straight line with a slope of 1/q0 and the intercept of 1/q0. KL. The Freundlich isotherm is an empirical equation used to describe heterogeneous systems and can be represented by equation [6]: Log qe = log KF + 1/n log Ce (6) Where KF (dm3 g-1) and n (without dimension) are Freundlich isotherm constants, indicating the extent of the adsorption and the degree of nonlinearity between solution concentration and adsorption, respectively. The Redlich-Peterson adsorption isotherm can be stated by the equation [7]: Log Ce/qe = log BR + β log Ce (7) Where Ce denotes the concentration of lead(II) ions in solution at equilibrium, qe represents the adsorption capacity of the adsorbent, β is the desorption constant and BR is called Redlich-Peterson isotherm constant. The Dubinin-Radushkevich (D-R) isotherm is more general than the Langmuir isotherm in that it does not assume a homogeneous surface or constant adsorption capacity. The linearised form of the D-R isotherm equation is Log qe = log q0 - β ε2/2.303 (8) Where q0 is the theoretical saturation capacity, β is a constant (mol2 kJ-2) related to the mean free energy of adsorption per mole of the adsorbate and ε is called the Polanyi potential and is equal to RT ln(1+1/Ce) where R is the gas constant (in J K-1 mol-1) and T is the temperature in Kelvin. Table 3 gives the Langmuir, Freundlich, R-P and D-R isotherm parameters for the adsorption of lead(II) ions on dolomite at a constant temperature of 300C. The essential feature of the Langmuir isotherm can be expressed by means of RL , a dimensionless constant referred to as the separation factor or equilibrium parameter which can be expressed as RL = 1/(1+KLC0) (9)
Where C0 is the initial concentration of lead(II) ions. The RL values calculated for this study are given in Table 3. The adsorption process will be favourable if the RL values lie in between 0 and 1[18]. R L values given in Table3 very well lie in this range and hence the adsorption process was favourable. The parameter KL obtained from Langmuir isotherm is actually the equilibrium constant for the adsorption process and hence can be used to determine the Gibbs free energy change of the process as per the equation, Δ G = - RTln KL (10) The Freundlich constant n is a measure of the deviation from linearity of the adsorption. If the value of n lies above unity it indicates physisorption. In the present study, as shown by Table 3, n lies between 2.27 and 2.80 and hence adsorption of lead(II) ions onto dolomite is purely a physical process involving weak van der Waals forces. Thermodynamic parameters: The equilibrium constant (dm3 g-1) for the adsorption process is a valuable parameter since it measures the extent of adsorption at the given temperature and pressure. It is calculated using the formula, Ka = (C0 – Ce)V/m (11) Where C0 and Ce are the initial and equilibrium concentrations (mg dm-3) of lead(II) ions, V is the volume of lead(II) ion solution (dm3) used and m is the mass (g) of the adsorbent employed. From the value of equilibrium constant(Ka), changes in enthalpy(^ H), entropy( ^ S) and Gibbs free energy( ^ G) can be calculated using the following equations : Δ G = - RT ln Ka (12) Ln Ka = - Δ G/RT = Δ S/R - Δ H/RT (13) A plot of ln Ka vs 1/T gives a straight line with the slope - Δ H/R and intercept Δ S/R . The results are given in Table 4. Free energy changes have a negative sign indicating that the adsorption is spontaneous. Enthalpy changes on the other hand are positive underlying the endothermic nature of the adsorption process. Entropy changes are positive since randomness increases due to adsorption.A free energy change between 0 and -20 kJ/mol and an enthalpy change below 80 kJ/mol indicates physisorption[17]. A view of Table 4 will shows that adsorption of lead(II) ions on dolomite is a physical process governed by weak hydrophobic and van der Waals forces. This is desirable since the adsorbent can be reused after desorption .
Research Journal of Chemistry and Environment______________________________________Vol.15 (2) June (2011) Res.J.Chem.Environ
(4)
Conclusions The research carried out in thus study indicates that dolomite can be used as a good adsorbent for the removal of lead(II) ions from aqueous solutions. The following results have been obtained: (1) The functional groups on dolomite were determined using FTIR spectrophotometer. (2) Scanning electron microscope (SEM) pictures before and after adsorption clearly show the filling of voids in the adsorbent. (3) The structure of the adsorbent is not very much changed due to adsorption as shown by X-ray diffraction studies which confirms physisorption. (4) Batch studies suggest that maximum (92.86%) metal removal occurs at PH=5.0. (5) Adsorption follows Freundlich isotherm model as shown by R2 values. (6) Lagergren’s first order kinetics and inter particle diffusion can be applied to calculate rate constants and adsorption capacities. (7) Thermodynamic parameters indicate a feasible, physical, spontaneous and endothermic adsorption process .
Fig.1. Percentage adsorption of Pb2+ on dolomite as a
function of PH at 300C
Fig.2. Effect of adsorbent dosage on the adsorption of lead on dolomite
Fig.3. Effect of contact time on the removal of lead
Fig.4. Effect of temperature on removal of lead
Fig 5: FTIR spectrum of dolomite a. before adsorption b. after adsorption
Research Journal of Chemistry and Environment______________________________________Vol.15 (2) June (2011) Res.J.Chem.Environ
(5)
Fig. 6a and 6b. The vacant sites in the first picture are found to be filled with metal ions in the second.
Fig.7a and 7b. The x-ray diffraction picture of the adsorbent before and after adsorption is given in Fig.7.
References: 1. Colby G R & Kimberly L O, Preliminary studies for
removal of lead from surrogate and real soils using a water soluble chelator. Adsorbtion and batch extraction, Environ. Sci. Technol , 32 (1998) 987-993.
2. Renner R, When is lead a health risk?, Environ. Sci. Technol , 29 256-261 (1995).
3. Ucun H, Bayhan Y K, Kaya Y, Cakici A and Algur
OF, Biosorption of lead(II) from aqueous solution by cone biomass of Pinus sylvestris , Desalination , 154 (3) 223-238 (2003).
4. Kapoor A, Viraragavan T, and Cullimore D R ,
Removal of heavy metals using the fungus Aspergillus niger , Bioresour. Technol., 70 (1) 95-104 (1999)
5. Sen A K & Bhattaa Charyya M , Studies on uptake and toxic effects of lead on Salvinia natans , Indian J. Environ. Health , 35 308-320 (1993).
6. Volesky B , Removal and recovery of heavy metals by
biosorption in B. Volesky (Ed.) , Biosorption of heavy metals , CRC Press , Boca Raton , FL , 7-43 (1990)
7. Volesky B , Detoxification of metal bearing effluents.
Biosorption for the next century , Hydrometallurgy , 59 (2-3) 203-216 (2001).
8. Duley S S and Gupta R K , Removal behavior of Babool bark (Acacia nilotica) for submicro concentrations of Hg2+ from aqueous solutions: a radiotracer study , Sep. Purif . Technol., 41 (1) 21-28 (2005).
9. Srivastava S K , Tyagi R , Pant N , and Pal N , Studies
on the removal of some toxic metal ions , Part II. Removal of lead and Cadmium by montmorillonite and kaolinite , Environ.Technol, (Lett) , 10 (3) 275-282 (1989).
10. Orumwense F F O , Removal of lead from water by
adsorbtion on a kalonitite clay , J. Chem. Technol., Biotechnol., 65., 65 (4) 363-369 (1996)
11. Naseem R, and Tahir S S , Removal of Pb (II) from
aqueous / acidic solutions by using bentonite as an adsorbent , water Res., 35(16) 3982- 3986 (2001).
12. Donat R , Akdogan A , Erderm E and H. Cetisli,
Thermodynamics of Pb2+ and Ni2+ adsorbtion on to natural bentonite from aqueous solution , J. Colloid Interf. Sci., 286 (1) 43-52 (2005)
13. Zamzow M J , Eichbaum B K , Sandgren K R and
Shanks D E , Removal of heavy metals and other cations from waste water using Zeolite , Sep. Sci. Technol., 25 (13-15) 1555- 1569 (1990)
14. Prasad ,M etal , Kinetics and isotherms for aqueous
lead adsorption by neutral minerals , J. Ind. Engg.Chem.res., 39 (8) 3034- 3037(2000).
15. Ake CL , Mayura K , Huebner H and Bratton G R ,
Development of porous clay-based composites for the separation of lead from watr , J. Toxicol. Environ. Health Part A , 63(6), 459-475(2001).
16. Navin Chandra , Nitin Agnihotri , Priya Sharma ,
Sanjeev Bhasin and Amritphale S S , Separation of lead ions from aqueous solutions by adsorption at tale surface , J. Sci and Ind. Res., 64 674-678 (2005).
17. Musa Solener , Sibel Tunali A , Safa Ozean , Adnon
Ozcan and Tevfik Gedikbey , Adsorbtion Characteristics of lead (II) ions onto the Clay / Poly (methoxyethyl) acrylanide (PMEA) composite frm aqueous solutions , Desalination 223 308- 322(2008)
Research Journal of Chemistry and Environment______________________________________Vol.15 (2) June (2011) Res.J.Chem.Environ
(6)
Table 1 Chemical Composition of Dolomite
Species Percentage Species Percentage Species Percentage CaCO3 54.35 CaO 30.41 Ca MgCO3 45.65 MgO 21.86 Mg 13.18 CO2 47.73 C 13.03 O 52.06 Total 100 Total 100 Total 100
Table2
Kinetics parameters for the adsorption of lead on dolomite at 300C
Lagergren’s first order model
qe (mg g-1) K1 (min-1)x102 R2 3.4075 1.7920 0.9890 6.3140 2.7287 0.9318
Pseudo-second order model
qe(expt)(mg g-1) K2 (g mg-1 min-1)x 103 R2 10.9863 1.320 0.8436 9.7099 1.609 0.9891
Elovich model
Α β R2 0.1441 1.1328 0.9485 0.4421 0.4549 0.9671
Inter particle diffusion model
kp (mg g-1 min-1/2) C (mg g-1) R2 0.3706 -0.6869 0.9803 0.8951 -1.1043 0.9401
Table 3 Isotherm parameters for the adsorption of lead(II) ions
on dolomite at 300C. Langmuir isotherm
KL (dm3 g-1) qo (mg g-1) BL (dm3 mg-1) R2 9.9438 19.9919 0.4974 0.9430 5.1372 28.1397 0.1826 0.9522
Freundlich isotherm
1/n n KF R2 0.3565 2.8049 7.3770 0.9586 0.4669 2.2686 6.2334 0.9999
Redlich-Peterson isotherm
β BR R2 0.6435 0.1368 0.9853 0.4229 0.1964 0.9404
Dubinin-Radushkevich isotherm
Β qo R2 0.1707 13.249 0.9307 0.5509 14.563 0.9710
Table 4
Thermodynamic parameters for the adsorption of lead(II) ions on dolomite
C0 (mg dm-3) ΔG(mean) (kJ/mol) ΔH (kJ/mol) ΔS (J/K/mol) R2 50 ‐ 3.0367 17.247 63.753 0.9896 100 ‐ 2.9368 22.686 80.535 0.9406 200 ‐ 2.5824 11.312 43.671 0.9324
Available on line www.jocpr.com
Journal of Chemical and Pharmaceutical Research __________________________________________________
ISSN No: 0975-7384
CODEN(USA): JCPRC5
J. Chem. Pharm. Res., 2011, 3(2):595-604
595
The removal of heavy metal chromium (VI) from aqueous solution
by using marine algae Graciliria edulis
S. Thillai Natarajan*, R. Jayaraj*, P. Jeyasingh Thanaraj and P. Martin Deva Prasath*
PG and Research Department of Chemistry, TBML College, Porayar, Nagapattinam, Tamilnadu, India
______________________________________________________________________________ ABSTRACT The preparation of activated carbon (AC) from marine algae is a promising way to produce a useful adsorbent for Chromium (VI) removal from aqueous solution. The AC was prepared using marne algae Graciliria edulis with con H2SO4 and physico-chemical properties of AC were investigated. The specific surface area of the activated carbon was determined and its properties studied by scanning electron microscopy (SEM). Adsorptive removal of Chromium(VI) from aqueous solution onto AC prepared from marine algae has been studied under varying conditions of agitation time, metal ion concentration, adsorbent dose and pH to assess the kinetic and equilibrium parameters. Adsorption equilibrium was obtained in 180min for 10 to 50 mg/L of Chromium(VI) concentrations. The Langmuir, Freundlich and DKR equilibrium isotherm models were found to provide an excellent fitting of the adsorption data. In Freundlich equilibrium isotherm, the r2 values obtained were in the range of 0.2 to 1 (0.9698 to 0.7204) for Chromium(VI) concentration of 10 to 60mg/L, which indicates favorable adsorption of Chromium(VI) onto marine algae carbon. The adsorption capacity of Chromium(VI) 98.37%. The percent removal maximum in pH1. This adsorbent was found to be effective and economically attractive. Keywords: Activated carbon, Graciliria edulis, Entalphy, Adsorption, Chromium(VI) removal. ______________________________________________________________________________
INTRODUCTION
Water is essential for survival. But today about 200 million people in India do not have access to safe drinking water due to water pollution. Any change in physical, chemical or
S. Thillai Natarajan et al J. Chem. Pharm. Res., 2011, 3(2):595-604 ______________________________________________________________________________
596
biological properties of water is known as water pollution. Heavy metal is important role of water pollution. The heavy metals are continuously released into the aquatic eco system from natural process such as volcanic activity and weathering of rocks. The effluents from mining, ore processing, metal processing, metal polishing, cleaning, paint manufacturing and battery manufacturing industries and acid rain contribute for the increasing metal loads in the water bodies. The heavy metal contamination of the water system is responsible for serious diseases and death. Chromium is one of the few metallic elements found in the earth’s crust. Large number of important alloys contains chromium as the principle element. Environmental pollution due to chromium arises from industrial and agricultural operations. Chromium has broad industrial applications, such as alloy industries, paper and pulp; basic steel works foundries and petroleum refining industries. Chromium is a trace element that is drinking water essential for most animals, including humans of that iron metabolism and maintenance of blood vessels. Eye irritation has been reported by factory workers exposed to chromium dust. Hence it is essential to remove Chromium from industrial wastewater before discharging in to natural water sources to meet National Regulatory Standards as well as to protect public health. Conventional treatment methods for heavy metals containing waste water, chemical precipitation, Ferrite treatment system, sulphate precipitation, solvent extraction, evaporation, xanthate process etc., but due to operational demerits and the treatment cost is high .The need for cost effective and economic removal of toxic heavy metals from waste water resulted in a research for non-conventional materials and methods. Several low cost adsorbents include sawdust, orange peel, almond husk, parthenium etc. The objective of the present study is to be prepare and characterize quality evaluate the efficiency of using sago waste carbon as an adsorbent for the removal of Chromium. The adsorption study was carried out systematically involving various parameters such as pH, agitation and adsorption dose.
EXPERIMENTAL SECTION Adsorbent Material The raw material dried Graciliria eduliswas treating with concentrated sulphuric acid in a weight ratio of 1:1(w/v) for 12 hrs and the resulting materials was washed with distilled water until a constant pH of the slurry was reached.. The resulting black product was kept in muffle furnace maintained at 4000 C for 8 hrs, followed by ground and the portion retained between 0 – 60 sieves was used in all the experiments.
Adsorption dynamic experiments Batch equilibration method The adsorption experiments were carried out in a batch process at 30, 40, 50 and 60 ˚C temperatures. The known weight of adsorbent material was added to 50 mL of the dye solutions with an initial concentration of 5 mg/L to 25 mg/L. The contents were shaken thoroughly using a mechanical shaker rotating with a speed of 120 rpm. The solution was then filtered at preset time intervals and the residual dye concentration was measured.
S. Thillai Natarajan et al J. Chem. Pharm. Res., 2011, 3(2):595-604 ______________________________________________________________________________
597
Effect of variable parameters: Dosage of adsorbents The various doses of the adsorbents are mixed with the dye solutions and the mixture was agitated in a mechanical shaker. The adsorption capacities for different doses were determined at definite time intervals by keeping all other factors constant. Initial concentration of dye In order to determine the rate of adsorption, experiments were conducted with different initial concentrations of dyes ranging from 10 to 60 mg/L. All other factors have kept constant. Contact time The effect of period of contact on the removal of the dye on adsorbent in a single cycle was determined by keeping particle size, initial concentration, dosage, pH and concentration of other ions constant. pH Adsorption experiments were carried out at pH 1,2,3,4,5,6,and 7. The acidic and alkaline pH of the media was maintained by adding the required amounts of dilute hydrochloric acid and sodium hydroxide solutions. The parameters like particle size of the adsorbents, dye concentration, dosage of the adsorbent and concentration of other ions have kept constant while carrying out the experiments. The pH of the samples was determined using a portable pH meter, Systronics make. The pH meter was calibrated with 4.0 and 9.2 buffers. Temperature The adsorption experiments were performed at four different temperatures viz., 30, 40, 50 and 60˚C in a thermostat attached with a shaker, Hasthas make. The constancy of the temperature was maintained with an accuracy of ± 0.5 ºC.
RESULTS AND DISCUSSION Effect of contact time and initial dye concentration The experimental results of adsorptions of at various concentrations (10,20,30,40 and 50 mg/L) with contact time, the equilibrium data were reveals that, percent adsorption decreased with increase in initial metal concentration, but the actual amount of dye adsorbed per unit mass of carbon increased with increase in metal concentration. It means that the adsorption is highly dependent on initial concentration of metal. It is because of that at lower concentration, the ratio of the initial number of metals to the available surface area is low subsequently the fractional adsorption becomes independent of initial concentration. However, at high concentration the available sites of adsorption becomes fewer and hence the percentage removal of metal is dependent upon initial concentrations. Equilibrium have established at 180 minutes for all concentrations. Figure 1 reveals that the curves are single, smooth, and continuous, leading to saturation, suggesting the possible monolayer coverage of the metals on the carbon surface.
S. Thillai Natarajan et al J. Chem. Pharm. Res., 2011, 3(2):595-604 ______________________________________________________________________________
598
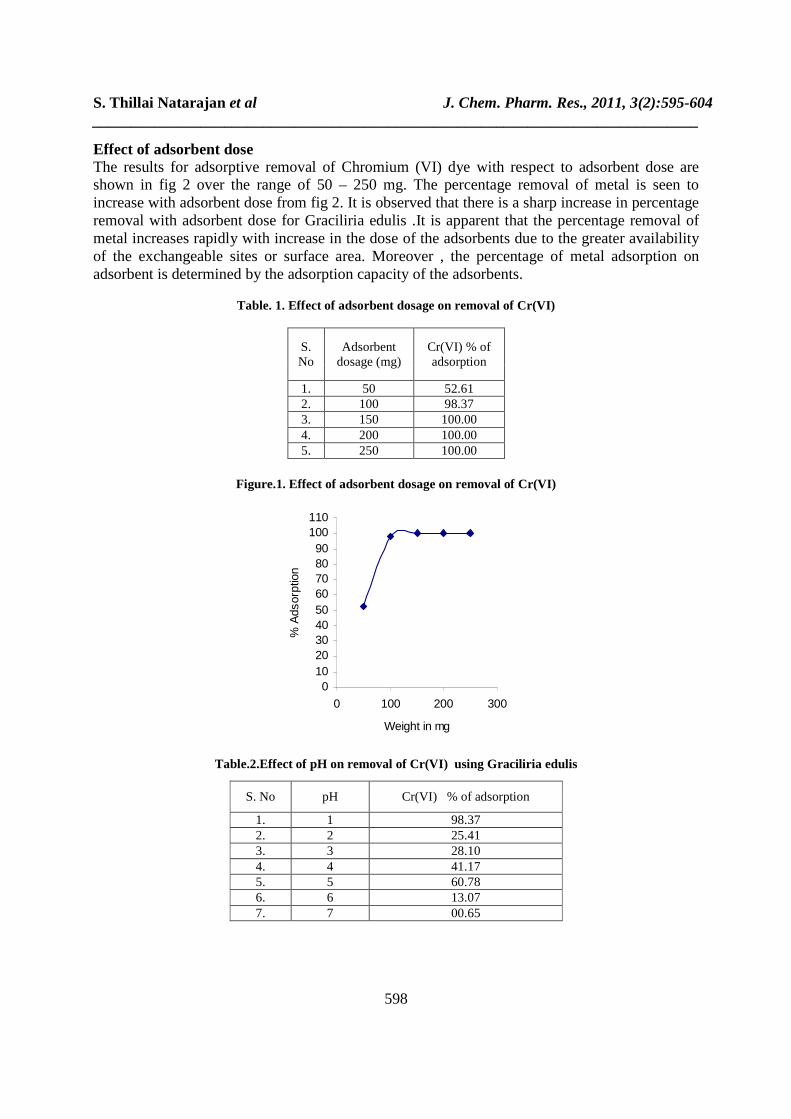
Effect of adsorbent dose The results for adsorptive removal of Chromium (VI) dye with respect to adsorbent dose are shown in fig 2 over the range of 50 – 250 mg. The percentage removal of metal is seen to increase with adsorbent dose from fig 2. It is observed that there is a sharp increase in percentage removal with adsorbent dose for Graciliria edulis .It is apparent that the percentage removal of metal increases rapidly with increase in the dose of the adsorbents due to the greater availability of the exchangeable sites or surface area. Moreover , the percentage of metal adsorption on adsorbent is determined by the adsorption capacity of the adsorbents.
Table. 1. Effect of adsorbent dosage on removal of Cr(VI)
Figure.1. Effect of adsorbent dosage on removal of Cr(VI)
0102030405060708090
100110
0 100 200 300
Weight in mg
% A
dsor
ptio
n
Table.2.Effect of pH on removal of Cr(VI) using Graciliria edulis
S. No
Adsorbent dosage (mg)
Cr(VI) % of adsorption
1. 50 52.61 2. 100 98.37 3. 150 100.00 4. 200 100.00 5. 250 100.00
S. No pH Cr(VI) % of adsorption
1. 1 98.37 2. 2 25.41 3. 3 28.10 4. 4 41.17 5. 5 60.78 6. 6 13.07 7. 7 00.65
S. Thillai Natarajan et al J. Chem. Pharm. Res., 2011, 3(2):595-604 ______________________________________________________________________________
599
Figure.2.Effect of pH on removal of Cr(VI) using Graciliria edulis
0102030405060708090
100110
0 2 4 6 8
pH
% A
dsor
ptio
n
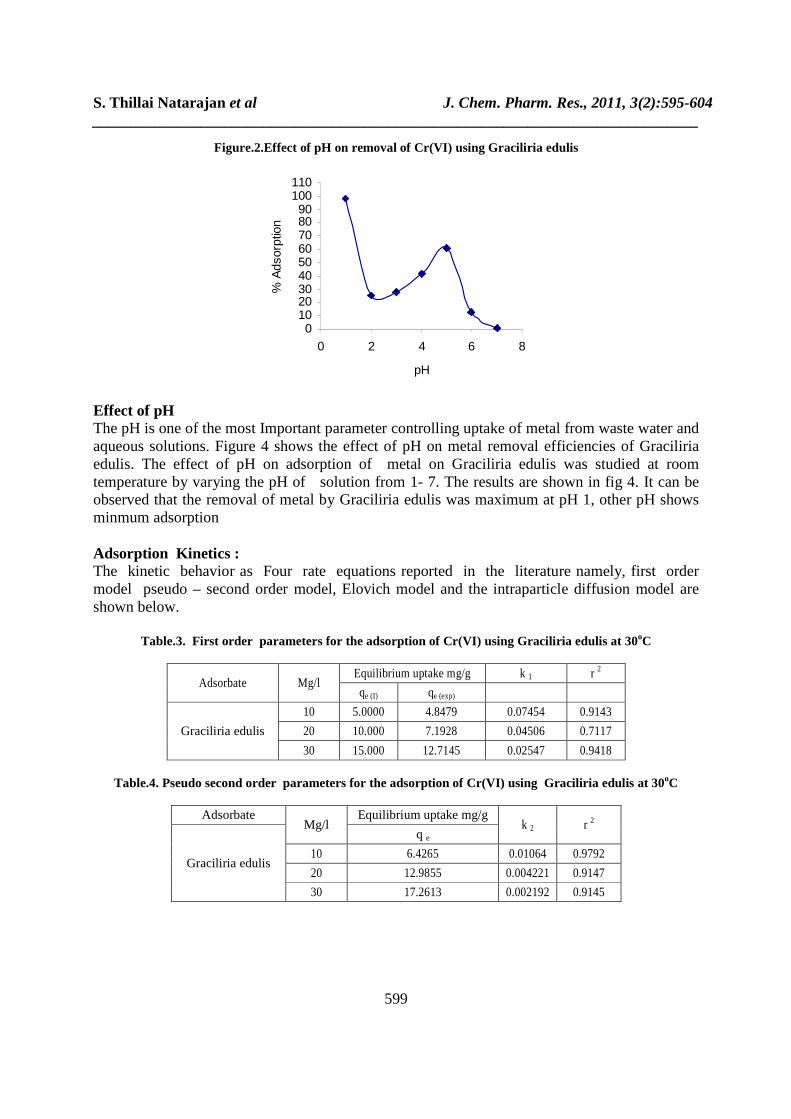
Effect of pH The pH is one of the most Important parameter controlling uptake of metal from waste water and aqueous solutions. Figure 4 shows the effect of pH on metal removal efficiencies of Graciliria edulis. The effect of pH on adsorption of metal on Graciliria edulis was studied at room temperature by varying the pH of solution from 1- 7. The results are shown in fig 4. It can be observed that the removal of metal by Graciliria edulis was maximum at pH 1, other pH shows minmum adsorption Adsorption Kinetics : The kinetic behavior as Four rate equations reported in the literature namely, first order model pseudo – second order model, Elovich model and the intraparticle diffusion model are shown below.
Table.3. First order parameters for the adsorption of Cr(VI) using Graciliria edulis at 30oC
Adsorbate Mg/l Equilibrium uptake mg/g k 1 r 2
qe (I) qe (exp)
Graciliria edulis
10 5.0000 4.8479 0.07454 0.9143
20 10.000 7.1928 0.04506 0.7117
30 15.000 12.7145 0.02547 0.9418
Table.4. Pseudo second order parameters for the adsorption of Cr(VI) using Graciliria edulis at 30oC
Adsorbate Mg/l
Equilibrium uptake mg/g k 2 r 2
Graciliria edulis
q e
10 6.4265 0.01064 0.9792
20 12.9855 0.004221 0.9147
30 17.2613 0.002192 0.9145
S. Thillai Natarajan et al J. Chem. Pharm. Res., 2011, 3(2):595-604 ______________________________________________________________________________
600
Table.5. Elovic parameters for the adsorption of Cr(VI) using Graciliria edulis at 30oC
Adsorbate Mg/l α α βE βE r 2
Graciliria edulis
10 0.8419 0.5486 0.6510 0.9213 20 0.4431 0.4232 0.3115 0.8461 30 1.3328 0.3344 0.2506 0.9243
Table.6. Intraparticle diffusion for the adsorption of Cr(VI) using Graciliria edulis at 30oC
Adsorbate
Mg/l a kid r 2
Graciliria edulis 10 0.4427 18.6899 0.8788 20 0.5271 13.1829 0.8023 30 0.5064 10.5978 0.9382
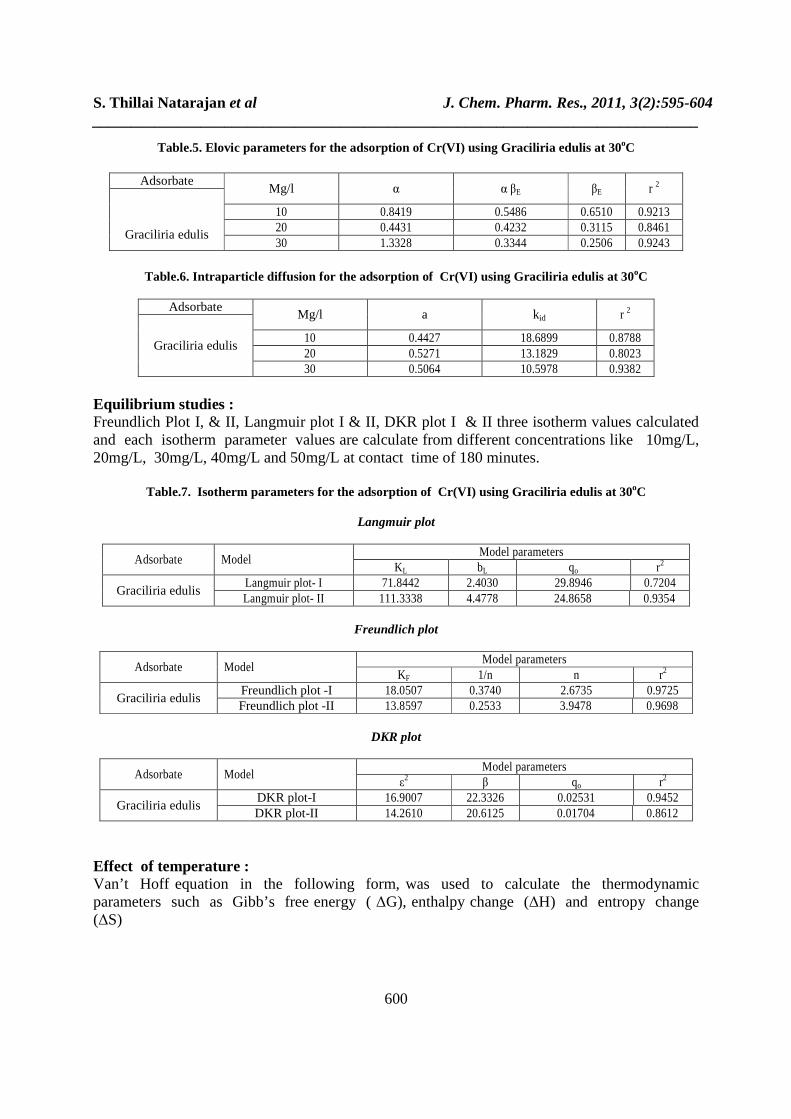
Equilibrium studies : Freundlich Plot I, & II, Langmuir plot I & II, DKR plot I & II three isotherm values calculated and each isotherm parameter values are calculate from different concentrations like 10mg/L, 20mg/L, 30mg/L, 40mg/L and 50mg/L at contact time of 180 minutes.
Table.7. Isotherm parameters for the adsorption of Cr(VI) using Graciliria edulis at 30oC
Langmuir plot
Adsorbate Model Model parameters
KL bL qo r2
Graciliria edulis Langmuir plot- I 71.8442 2.4030 29.8946 0.7204 Langmuir plot- II 111.3338 4.4778 24.8658 0.9354
Freundlich plot
Adsorbate Model Model parameters
KF 1/n n r2
Graciliria edulis Freundlich plot -I 18.0507 0.3740 2.6735 0.9725 Freundlich plot -II 13.8597 0.2533 3.9478 0.9698
DKR plot
Adsorbate Model Model parameters
ε2 β qo r2
Graciliria edulis DKR plot-I 16.9007 22.3326 0.02531 0.9452 DKR plot-II 14.2610 20.6125 0.01704 0.8612
Effect of temperature : Van’t Hoff equation in the following form, was used to calculate the thermodynamic parameters such as Gibb’s free energy ( ∆G), enthalpy change (∆H) and entropy change (∆S)

S. Thillai Natarajan et al J. Chem. Pharm. Res., 2011, 3(2):595-604 ______________________________________________________________________________
601
Log kc = -
Where KC is the equilibrium constant for the distribution of Nickel between the liquid and solid phase. T is absolute Temperature. K and R the gas constant, Van’t Hoff plot were constructed for each system and ∆H and ∆S were calculated from the slope and intercept of the plots respectively .
Table.8. Thermodynamic parameters for the adsorption of Cr(VI) using Graciliria edulis
Adsorbate Mg/l
- ∆G KJ / mol ∆H KJ / mol ∆S J/mol
Graciliria edulis
30oc 40oc 50oc 60oc 50 8.5869 9.4680 10.5658 13.9828 53.4471 201.5039 100 5.6164 6.2984 7.4676 8.1601 37.6109 139.9223 150 4.2978 4.7701 5.2009 5.9251 13.8356 59.4293
XRD Study Further, the Xray Diffraction Studies of the carbon prepared from the marine algae Graciliria edulis were carried out using Rigaku corporation, Japan X-ray Diffractometer 40KV / 30mA, Model D/Max ULTIMA III . The before and after adsorption are shows in fig .3 . It is evident from the figure that there is no appreciable change in the spectra adsorbent after adsorption. This may be due to the fact that adsorption dosen’t alter the chemical nature of the surface of the adsorbent i.e. the adsorption forces in present case is of physical in nature. The XRD pattern of the adsorbent before and after adsorption are given in fig.4 which supports the adsorption process.
-1000
100200300400500600700800900
100011001200130014001500
0 1000 2000 3000 4000
2 Theta
Inte
nsity
(cp
s)
-100
0
100
200
300
400
500
600
700
800
900
1000
1100
1200
0 1000 2000 3000 4000
2 Theta
Figure 3. XRD Pattern of Graciliria edulis before and after adsorption of Chromium(VI) IR Study Fourier transform infrared spectroscopy (FTIR) was used to Shimadzu Fourier transform infrared spectroscopy determine the vibration frequency changes in the functional groups of carbons. The spectras of carbon were measured within the range of 400 -4000/cm wave number. Some fundamental FTIR frequencies of Graciliria edulis observed for before and after adsorption are presented in table 12 . As can be inferred from Figure 5 that the adsorption frequencies are shifted to higher wave numbers with the adsorption of chromium in Graciliria edulis. From these findings it is presumed that the dyes is incorporated within the adsorbent through interaction with the active functional groups.

S. Thillai Natarajan et al J. Chem. Pharm. Res., 2011, 3(2):595-604 ______________________________________________________________________________
602
Figure 4. FTIR Spectrum of Graciliria edulis before and after Chromium(VI) adsorption
S. Thillai Natarajan et al J. Chem. Pharm. Res., 2011, 3(2):595-604 ______________________________________________________________________________
603
Table 9. Some fundamental FTIR frequencies of Graciliria edulis before and after adsorption
Possible assignments Before adsorption of Graciliria edulis After adsorption of Graciliria edulis O-H stretching 3448.87 3459.48
Quadrant & semi-circle stretching 1639.56 1628.95 C-H in plane ring bendihg 1096.58 1034.85
N-H bending 675.11 669.33 C-I Stretching 472.58 462.56
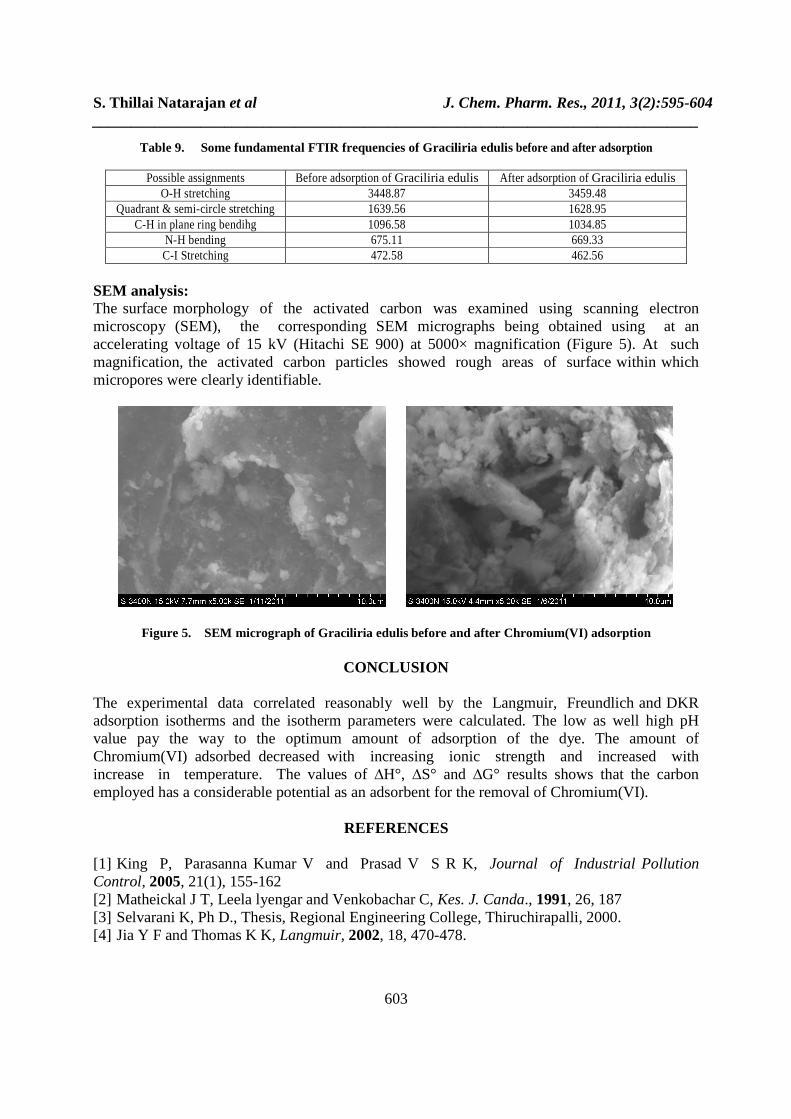
SEM analysis: The surface morphology of the activated carbon was examined using scanning electron microscopy (SEM), the corresponding SEM micrographs being obtained using at an accelerating voltage of 15 kV (Hitachi SE 900) at 5000× magnification (Figure 5). At such magnification, the activated carbon particles showed rough areas of surface within which micropores were clearly identifiable.
Figure 5. SEM micrograph of Graciliria edulis before and after Chromium(VI) adsorption
CONCLUSION
The experimental data correlated reasonably well by the Langmuir, Freundlich and DKR adsorption isotherms and the isotherm parameters were calculated. The low as well high pH value pay the way to the optimum amount of adsorption of the dye. The amount of Chromium(VI) adsorbed decreased with increasing ionic strength and increased with increase in temperature. The values of ∆H°, ∆S° and ∆G° results shows that the carbon employed has a considerable potential as an adsorbent for the removal of Chromium(VI).
REFERENCES [1] King P, Parasanna Kumar V and Prasad V S R K, Journal of Industrial Pollution Control, 2005, 21(1), 155-162 [2] Matheickal J T, Leela lyengar and Venkobachar C, Kes. J. Canda., 1991, 26, 187 [3] Selvarani K, Ph D., Thesis, Regional Engineering College, Thiruchirapalli, 2000. [4] Jia Y F and Thomas K K, Langmuir, 2002, 18, 470-478.
S. Thillai Natarajan et al J. Chem. Pharm. Res., 2011, 3(2):595-604 ______________________________________________________________________________
604
[5] Namasivayam C, Muniasamy N, Gayathri K, Rani M and Renganathan K, Biores Technol, 1996, 57, 37. [6] Namasivayam C and Yamuna R T, Environ Pollution, 1995, 89, 1. [7] Langmuir I, J Amer Chem Soc, 1918, 40, 1361. [8] Freundlich H, Phys Chemie, 1906, 57, 384. [9] Krishna D G and Bhattacharyya G, Appl Clay Sci, 2002, 20, 295. [10] Arivoli S, Viji Jain M and Rajachandrasekar T, Mat Sci Res India, 2006, 3, 241-250. [11] Arivoli S and Hema M, Intern J Phys Sci., 2007, 2, 10-17. [12] Arivoli S, Venkatraman B R, Rajachandrasekar T and Hema M, Res J Chem Environ. 2007, 17, 70-78. [13] Arivoli S, Kalpana K, Sudha R and Rajachandrasekar T, E-J Chem, 2007, 4, 238-254. [14] Renmin Gong, Yingzhi Sun, Jian Chen, Huijun Liu and Chao yang, Dyes and Pigments, 2005, 67, 179. [15] Vadivelan V, Vasanthkumar K, J Colloid Interf Sci, 2005, 286, 91. [16] Weber W J, Principle and Application of Water Chemistry, Edited by Faust S D and Hunter J V Wiley, New York, 1967. [17] Yupeng Guo, Jingzhu Zhao, Hui Zhang, Shaofeng Yang, Zichen Wang and Hongding Xu, Dyes and Pigments, 2005, 66, 123-128.
Available on line www.jocpr.com
Journal of Chemical and Pharmaceutical Research __________________________________________________
ISSN No: 0975-7384
CODEN(USA): JCPRC5
J. Chem. Pharm. Res., 2011, 3(3):389-396
389
Removal of Congo red Dye from Aqueous solution using Acid Activated Eco-Friendly Low Cost Carbon prepared from marine algae Valoria bryopsis
R. Jayaraj, P. Jeyasingh Thanaraj, S. Thillai Natarajan and P. Martin Deva Prasath
PG and Research Department of Chemistry, TBML College, Poraya, Nagapattinam, Tamilnadu, India
______________________________________________________________________________ ABSTRACT Activated carbon (AC) prepared from marine algae was found to be a potential adsorbent for Congo red dye for removal from aqueous solution. The AC was prepared from marine algae Valoria bryopsis by treatment with conc. H2SO4. The surface area of the AC and its properties were studied by scanning electron microscopy (SEM). Adsorptive removal of Congo red from aqueous solution onto AC has been studied under varying conditions of agitation time, metal ion concentration, adsorbent dose and pH to assess the kinetic and equilibrium parameters. Adsorption equilibrium was found to be reached in 180 min for 5 to 25 mg/L of Congo red concentrations. The Langmuir and Freundlich isotherm models were found to provide an excellent fitting of the adsorption data. For the Freundlich isotherm, high r2 values were obtained (0.8460 to 0.6992) for Congo red concentration of 10 to 60mg/L, which indicated favorable adsorption of Congo red onto marine algae carbon. The adsorption capacity of Congo red was found to be 97.77%. The percent removal increased with increase in pH from 1 to 5. This adsorbent was found to be effective and economically attractive. Keywords: Activated carbon, Valoria bryopsis, Adsorption, Congo red. ______________________________________________________________________________
INTRODUCTION
The potable water used by every human being for drinking and cooking should be uncontaminated and pure. Thanks to the over-population, India is suffering from persistent demand for safe drinking water. Industries manufacturing dye and dye intermediates are the largest sector of chemical industries in India, since dyes are used in a variety of industries producing textiles, paints, pulp and paper. More than 80% of their production is utilized by the
R. Jayaraj et al J. Chem. Pharm. Res., 2011, 3(3):389-396 ______________________________________________________________________________
390
textile industries. A huge amount of water is necessary by these industries for the cleaning and washing purposes and they discharge highly coloured effluents containing different dyes. The presence of dyes and colour upsets the biological processes. Dyes are also carcinogenic and pose a major health hazard. Many investigators have studied the feasibility of inexpensive alternative materials like pearl millet husk, date pits, saw dust, buffing dust of leather industry, coir pith, crude oil residue tropical grass, olive stone and almond shells, pine bark, wool waste, coconut shell etc., as carbonaceous precursors for the removal of dyes from water and wastewater. The present study was undertaken to evaluate the efficiency of an acid activated carbon adsorbent prepared from marine algae for removal of congo red dye from aqueous solution. In order to design adsorption treatment systems, knowledge of kinetic and mass transfer processes is essential. The applicability of these processes was studied. The dried marine algae valoria bryopsis were treated with concentrated sulphuric acid in the weight ratio of 1:1 (w/v) for eight hours and the resulting material was washed with double distilled water until a constant pH of the slurry was reached. The resulting black product was kept in muffle furnace maintained at 400o C for 8 hrs. It was then ground and the portion retained between 0 and 60 nm sieves was used in all the experiments.
EXPERIMENTAL SECTION Adsorption Experiments Batch equilibration method The adsorption experiments were carried out in batch process at 30, 40, 50 and 60 ˚C temperatures. A known weight of adsorbent material was added to 50 mL of the dye solutions with an initial concentration of 5 mg/L to 25 mg/L. The contents were shaken thoroughly using a mechanical shaker rotating with a speed of 120 rpm for three hours The solution was then filtered at preset time intervals and the residual dye concentration was measured.
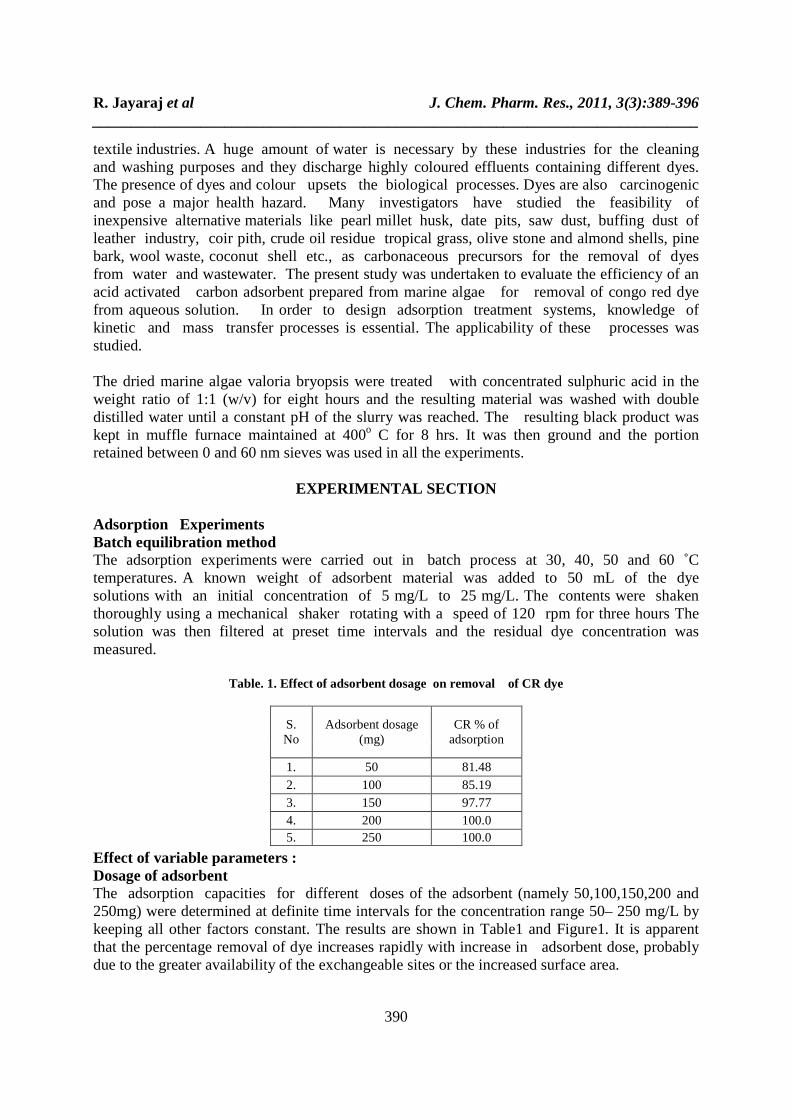
Table. 1. Effect of adsorbent dosage on removal of CR dye
Effect of variable parameters : Dosage of adsorbent The adsorption capacities for different doses of the adsorbent (namely 50,100,150,200 and 250mg) were determined at definite time intervals for the concentration range 50– 250 mg/L by keeping all other factors constant. The results are shown in Table1 and Figure1. It is apparent that the percentage removal of dye increases rapidly with increase in adsorbent dose, probably due to the greater availability of the exchangeable sites or the increased surface area.
S. No
Adsorbent dosage (mg)
CR % of adsorption
1. 50 81.48 2. 100 85.19 3. 150 97.77 4. 200 100.0 5. 250 100.0
R. Jayaraj et al J. Chem. Pharm. Res., 2011, 3(3):389-396 ______________________________________________________________________________
391
Figure.1. Effect of adsorbent dosage on removal of CR dye
0102030405060708090
100110
0 100 200 300
Weight in mg
% A
dsor
ptio
n
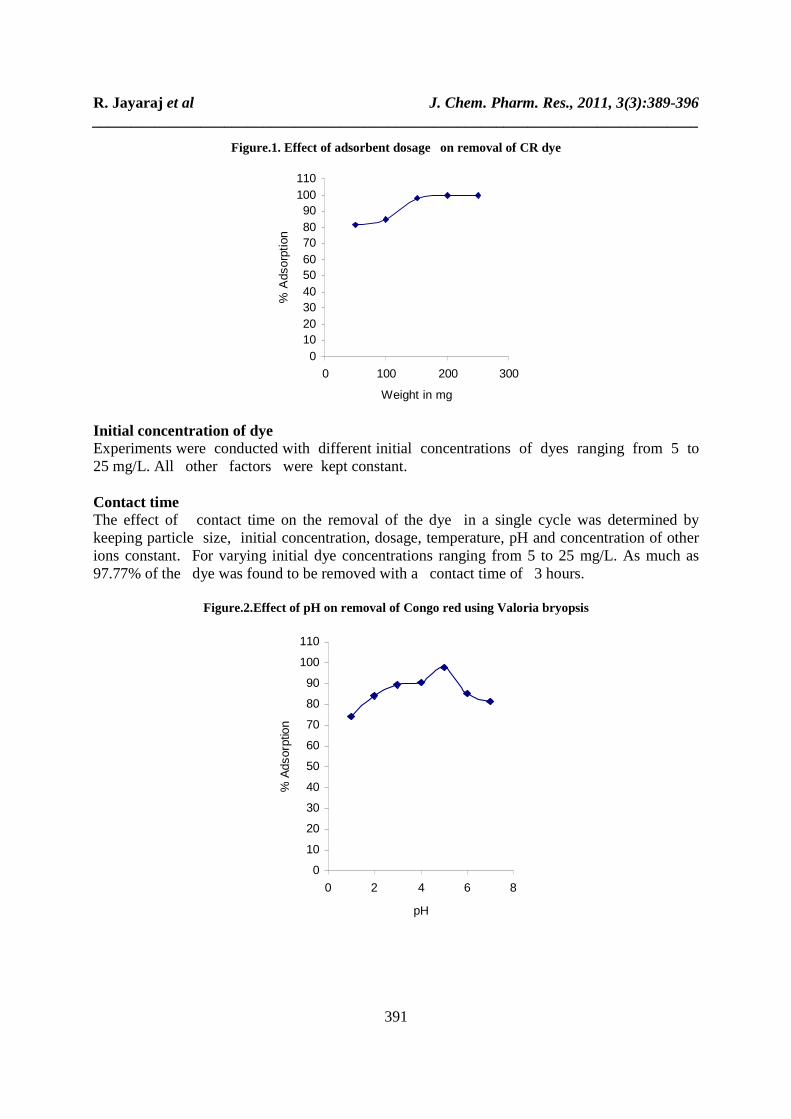
Initial concentration of dye Experiments were conducted with different initial concentrations of dyes ranging from 5 to 25 mg/L. All other factors were kept constant. Contact time The effect of contact time on the removal of the dye in a single cycle was determined by keeping particle size, initial concentration, dosage, temperature, pH and concentration of other ions constant. For varying initial dye concentrations ranging from 5 to 25 mg/L. As much as 97.77% of the dye was found to be removed with a contact time of 3 hours.
Figure.2.Effect of pH on removal of Congo red using Valoria bryopsis
0
10
20
30
40
50
60
70
80
90
100
110
0 2 4 6 8
pH
% A
dsor
ptio
n
R. Jayaraj et al J. Chem. Pharm. Res., 2011, 3(3):389-396 ______________________________________________________________________________
392
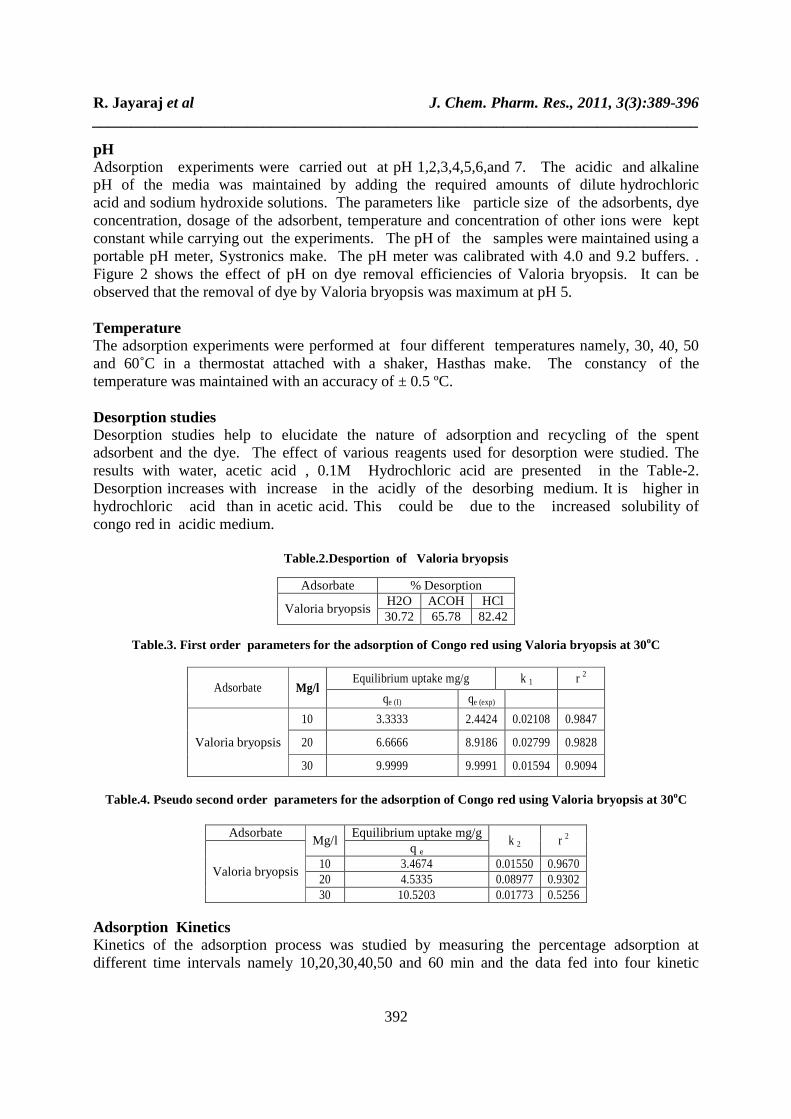
pH Adsorption experiments were carried out at pH 1,2,3,4,5,6,and 7. The acidic and alkaline pH of the media was maintained by adding the required amounts of dilute hydrochloric acid and sodium hydroxide solutions. The parameters like particle size of the adsorbents, dye concentration, dosage of the adsorbent, temperature and concentration of other ions were kept constant while carrying out the experiments. The pH of the samples were maintained using a portable pH meter, Systronics make. The pH meter was calibrated with 4.0 and 9.2 buffers. . Figure 2 shows the effect of pH on dye removal efficiencies of Valoria bryopsis. It can be observed that the removal of dye by Valoria bryopsis was maximum at pH 5. Temperature The adsorption experiments were performed at four different temperatures namely, 30, 40, 50 and 60˚C in a thermostat attached with a shaker, Hasthas make. The constancy of the temperature was maintained with an accuracy of ± 0.5 ºC. Desorption studies Desorption studies help to elucidate the nature of adsorption and recycling of the spent adsorbent and the dye. The effect of various reagents used for desorption were studied. The results with water, acetic acid , 0.1M Hydrochloric acid are presented in the Table-2. Desorption increases with increase in the acidly of the desorbing medium. It is higher in hydrochloric acid than in acetic acid. This could be due to the increased solubility of congo red in acidic medium.
Table.2.Desportion of Valoria bryopsis
Table.3. First order parameters for the adsorption of Congo red using Valoria bryopsis at 30oC
Adsorbate Mg/l Equilibrium uptake mg/g k 1 r 2
qe (I) qe (exp)
Valoria bryopsis
10 3.3333 2.4424 0.02108 0.9847
20 6.6666 8.9186 0.02799 0.9828
30 9.9999 9.9991 0.01594 0.9094
Table.4. Pseudo second order parameters for the adsorption of Congo red using Valoria bryopsis at 30oC
Adsorbate
Mg/l Equilibrium uptake mg/g
k 2 r 2
Valoria bryopsis
q e 10 3.4674 0.01550 0.9670 20 4.5335 0.08977 0.9302 30 10.5203 0.01773 0.5256
Adsorption Kinetics Kinetics of the adsorption process was studied by measuring the percentage adsorption at different time intervals namely 10,20,30,40,50 and 60 min and the data fed into four kinetic
Adsorbate % Desorption
Valoria bryopsis H2O ACOH HCl 30.72 65.78 82.42

R. Jayaraj et al J. Chem. Pharm. Res., 2011, 3(3):389-396 ______________________________________________________________________________
393
models – first order, pseudo – second order, Elovich and the intraparticle diffusion( Tables 3,4,5 & 6). The values of rate constants and adsorption capacities were measured.
Table.5. Elovic parameters for the adsorption of Congo red using Valoria bryopsis at 30oC
Adsorbate
Mg/l Α α βE βE r 2
Valoria bryopsis 10 0.6699 1.1258 1.6804 0.5667 20 0.1169 0.04164 0.3558 0.9671 30 0.4544 0.2174 0.4785 0.7406
Table.6. Intraparticle diffusion for the adsorption of Congo red using Valoria bryopsis at 30oC
Adsorbate
Mg/l A k id r 2
Valoria bryopsis 10 0.4086 2.7346 0.9748 20 1.0859 1.5907 0.9285 30 1.7099 2.5375 0.8499
Table.7. Isotherm parameters for the adsorption of Congo red using Valoria bryopsis at 30oC
Langmuir plot
Adsorbate Model Model parameters
KL bL qo r2
Valoria bryopsis Langmuir plot- I 20.2015 3.5454 5.6977 0.9956 Langmuir plot- II 10.0994 1.0847 9.3135 0.9152
Freundlich plot
Adsorbate Model Model parameters
KF 1/n n r2
Valoria bryopsis Freundlich plot -I 4.9430 0.5224 1.9142 0.8460 Freundlich plot -II 11.0773 0.8007 1.2488 0.6992
DKR plot
Adsorbate Model Model parameters
ε2 β qo r2
Valoria bryopsis DKR plot-I 9.5113 0.04916 5.0470 0.9437
DKR plot-II 9.2830 0.01454 2.3858 0.9992
Adsorption Isotherms : The results of adsorption experiments from Table . 7 were fed into three different isotherm equations- Freundlich, Langmuir and Dubinin-Kaganer-Radushkevich. Various parameters involved were calculated.
R. Jayaraj et al J. Chem. Pharm. Res., 2011, 3(3):389-396 ______________________________________________________________________________
394
Thermodynamic Parameters: Van’t Hoff equation in the following form, was used to calculate the thermodynamic parameters such as Gibb’s free energy change ( ∆G), enthalpy change (∆H) and entropy change (∆S) were listed in Table. 8 :
Table.8. Thermodynamic parameters for the adsorption of Congo red using Valoria bryopsis
Adsorbate Mg/l
- ∆G KJ / mol ∆H KJ / mol ∆S J/mol
Valoria bryopsis
30oc 40oc 50oc 60oc 25 6.7786 8.0696 9.0377 11.2059 30.1877 67.9890 50 4.7217 6.8044 7.3967 10.2660 47.2116 170.2338 100 4.4523 5.6028 6.9021 8.8586 36.8785 135.7409
LogKc = -
Where KC is the equilibrium constant for the adsorption process, T is absolute Temperature and R, the gas constant, Vant Hoff plot were constructed for each system and ∆H and ∆S were calculated from the slope and intercept of the plots respectively .
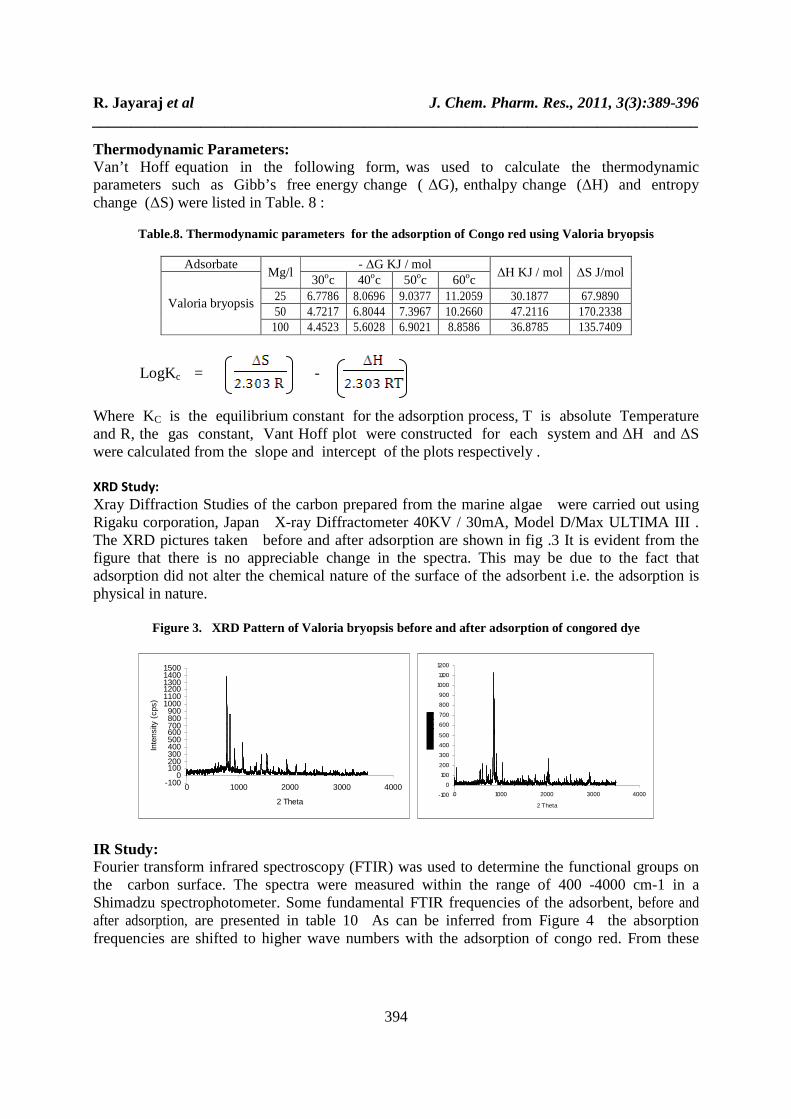
XRD Study:
Xray Diffraction Studies of the carbon prepared from the marine algae were carried out using Rigaku corporation, Japan X-ray Diffractometer 40KV / 30mA, Model D/Max ULTIMA III . The XRD pictures taken before and after adsorption are shown in fig .3 It is evident from the figure that there is no appreciable change in the spectra. This may be due to the fact that adsorption did not alter the chemical nature of the surface of the adsorbent i.e. the adsorption is physical in nature.
Figure 3. XRD Pattern of Valoria bryopsis before and after adsorption of congored dye
-1000
100200300400500600700800900
100011001200130014001500
0 1000 2000 3000 4000
2 Theta
Inte
nsity
(cp
s)
-100
0
100
200
300
400
500
600
700
800
900
1000
1100
1200
0 1000 2000 3000 4000
2 Theta
IR Study: Fourier transform infrared spectroscopy (FTIR) was used to determine the functional groups on the carbon surface. The spectra were measured within the range of 400 -4000 cm-1 in a Shimadzu spectrophotometer. Some fundamental FTIR frequencies of the adsorbent, before and after adsorption, are presented in table 10 As can be inferred from Figure 4 the absorption frequencies are shifted to higher wave numbers with the adsorption of congo red. From these

R. Jayaraj et al J. Chem. Pharm. Res., 2011, 3(3):389-396 ______________________________________________________________________________
395
findings it is presumed that the dye was incorporated onto the adsorbent through interaction with the active functional groups.
Figure 4. FTIR Spectrum of Valoriya bryopsis before and after congored dye adsorption
SEM analysis: The surface morphology of the activated carbon was examined using scanning electron microscopy (SEM), the corresponding SEM micrographs being obtained using at an accelerating voltage of 15 kV (Hitachi SE 900) at 5000× magnification (Figure 5). At such magnification, the activated carbon particles showed rough areas of surface on which micro pores were clearly identifiable.
Figure 5. SEM micrograph of Valoria bryopsis before and after congored dye adsorption
CONCLUSION
The experimental data correlated reasonably well with the Langmuir, Freundlich and DKR adsorption isotherms. Adsorption of the dye is not favoured at around neutral pH. The amount of congo red dye adsorbed decreased with increasing ionic strength and increased with increase in temperature. The values of ∆H°, ∆S° and ∆G° show that the carbon employed has a considerable potential as an adsorbent for the removal of congo red dye.
R. Jayaraj et al J. Chem. Pharm. Res., 2011, 3(3):389-396 ______________________________________________________________________________
396
REFERENCES
[1] King P, Parasanna Kumar V and Prasad V S R K, Journal of Industrial Pollution Control (2005), 21(1), 155-162 [2] Matheickal J T, Leela lyengar and Venkobachar C, Kes. J. Canda (1991), 26, 187 [3] Selvarani K, Ph D., (2000) Thesis, Regional Engineering College, Thiruchirapalli. [4] Jia Y F and Thomas K K, Langmuir (2002), 18, 470-478. [5] Namasivayam C, Muniasamy N, Gayathri K, Rani M and Renganathan K, Biores Technol, (1996), 57, 37. [6] Namasivayam C and Yamuna R T, Environ Pollution, (1995), 89, 1. [7] Langmuir I, J Amer Chem Soc, (1998), 40, 1361. [8] Freundlich H, Phys Chemie, (1906), 57, 384. [9] Krishna D G and Bhattacharyya G, Appl Clay Sci, (2002), 20, 295. [10] 10. Arivoli S, Viji Jain M and Rajachandrasekar T Mat Sci Res India, (2006), 3, 241-250. [11] Arivoli S and Hema M Intern J Phys Sci., (2007), 2, 10-17. [12] Arivoli S, Venkatraman B R, Rajachandrasekar T and Hema M Res J Chem Environ., (2007), 17, 70-78. [13] Arivoli S, Kalpana K, Sudha R and Rajachandrasekar T E-J Chem, (2007), 4, 238-254. [14] Renmin Gong, Yingzhi Sun, Jian Chen, Huijun Liu and Chao yang (2005), Dyes and Pigments, 67, 179. [15] Vadivelan V, Vasanthkumar KJ Colloid Interf Sci, (2005), 286, 91. [16] Weber W J(1967), Principle and Application of Water Chemistry, Edited by Faust S D and Hunter J V Wiley, New York. [17] Yupeng Guo, Jingzhu Zhao, Hui Zhang, Shaofeng Yang, Zichen Wang and Hongding Xu (2005), Dyes and Pigments, 66, 123-128.
Related Documents