Copyright © 2008 IEEE. Reprinted from “2008 PROCEEDINGS Annual RELIABILITY and MAINTAINABIL ITY Symposium ,” Las Vegas, Nevada, USA, January 28-31, 2008. This material is posted here with permission of the IEEE. Such permission of the IEEE does not in any way imply IEEE endorsement of any of ReliaSoft Corporation's products or services. Internal or personal use of this material is permitted. However, permission to reprint/republish this material for advertising or promotional purposes or for creating new collective works for resale or redistribution must be obtained from the IEEE by writing to pubs-permissions@iee e.org. By choosing to view this document, you agree to all provisions of the copyright laws protecting it.

Welcome message from author
This document is posted to help you gain knowledge. Please leave a comment to let me know what you think about it! Share it to your friends and learn new things together.
Transcript
8/4/2019 Reliability Design Inception
http://slidepdf.com/reader/full/reliability-design-inception 1/34
Copyright © 2008 IEEE. Reprinted from “2008 PROCEEDINGSAnnual RELIABILITY and MAINTAINABILITY Symposium ,” LasVegas, Nevada, USA, January 28-31, 2008.
This material is posted here with permission of the IEEE. Suchpermission of the IEEE does not in any way imply IEEEendorsement of any of ReliaSoft Corporation's products orservices. Internal or personal use of this material is permitted.However, permission to reprint/republish this material foradvertising or promotional purposes or for creating newcollective works for resale or redistribution must be obtainedfrom the IEEE by writing to [email protected].
By choosing to view this document, you agree to all provisions
of the copyright laws protecting it.

8/4/2019 Reliability Design Inception
http://slidepdf.com/reader/full/reliability-design-inception 2/34
Tutorial Notes © 2008 AR&MS
2008 Annual RELIABILITY and MAINTAINABILITY Symposium
Reliability from Design Inception to Product Retirement
Duane L. Dietrich, Ph. D.
Duane L. Dietrich, Ph. D.
Director of Consulting Services, ReliaSoftProfessor Emeritus, University of Arizona
4010 E Cocopas Rd
Tucson AZ [email protected]
8/4/2019 Reliability Design Inception
http://slidepdf.com/reader/full/reliability-design-inception 3/34
SUMMARY & PURPOSE
In this presentation a product is followed from design inception to product retirement. The appropriate location and use of
(1) Over Stress Tests, (2) Design Reviews, (3) FMEA, (4) Reliability System Analysis, (5) Accelerated Life Tests, (6) RealTime Life Tests, (7) Reliability Growth Tests, (8) Burn-In, (9) Environmental Stress Screens and (10) Statistical Process Control
are discussed. Finally, field failures and the steps necessary to insure that the resulting engineering change orders yield
improved reliability are covered. This paper is based primarily on the observation and experience of the author which was
gained during a 40-year career in reliability and quality.
Duane L. Dietrich, Ph.D.
Dr. Dietrich has been director of consulting services for ReliaSoft for the last four years. During his 45+ year career he has
served as a consultant to over 60 companies and government agencies both nationally and internationally. Some of his more
notable clients have been the US Army, the US Navy, IBM, Cameron Oil, JPL, John Deere, Guidant, Motorola, Raytheon,General Dynamics and Xerox. In addition, he has taught over 60 short courses for industry in the areas of Engineering Statistics,
Statistical Process Control, Concepts of Reliability, Reliability Testing and Large Scale Reliability Systems Analysis. Dr
Dietrich is a Professor Emeritus at the University of Arizona. During his 30 years on the faculty his teaching responsibilities
were in the areas of statistical quality control, reliability, and engineering statistics. He was the first faculty member in the
College of Engineering to have his courses televised. His courses were televised for 25 consecutive years to numerousgovernment and industrial sites across the USA. He has received five teaching related awards, including the Tau Beta Pi
Professor of the Year Award the first year it was given at the University of Arizona. He has published numerous papers and
graduated 9 Ph.D. students. Prior to entering graduate school he was employed for five years as a project engineer inenvironmental test and evaluation at the US Naval Missile Center, Point Mugu, California. Dr Dietrich was Charter Chairman
of the Tucson Section of the American Society for Quality. He has served as Secretary and Vice Chairman of the Statistics
Committee, and as Secretary of the Statistics Division of the American Society for Quality. He was also a guest co-editor for a
special issue of the IIE Transaction devoted to reliability and quality. He served as an associate editor for the IEEE Transactions on Reliability for 12 years. He is presently Secretary the RAMS Management Committee.
Table of Contents
1. Introductory Comments........................................................................................................................................................1
2. Customer Requirements and Specifications.........................................................................................................................1
3. Reliability Data Systems ......................................................................................................................................................1
4. Design of Reliability Tests ...................................................................................................................................................25. Reliability Tests and Analsys that Occur During Product Design........................................................................................3
6. FMEA/FMECA....................................................................................................................................................................4
7. Preliminary Systems Reliability...........................................................................................................................................5
8. Reliability Evaluation Tests and Prdiction...........................................................................................................................59. Example ALTs .....................................................................................................................................................................6
10. Reliability Growth................................................................................................................................................................7
11. Manufacturing Systems Design............................................................................................................................................7
12. Finalize Manufacturing Systems Design Tests ....................................................................................................................913. A Recommended Reliability Oriented Design Program ......................................................................................................9
14. Acknowledgements............................................................................................................................................................10
15. Tutorial Visuals..................................................................................................................................................................11
ii − Dietrich 2008 AR&MS Tutorial Notes

8/4/2019 Reliability Design Inception
http://slidepdf.com/reader/full/reliability-design-inception 4/34
2008 Annual RELIABILITY and MAINTAINABILITY Symposium Dietrich – 1
1. INTRODUCTORY CONCEPTS
1.1 Reliability is a Long Standing Bridge Between User and Product
The Golden Gate Bridge across the San Francisco Bay
area was so well constructed that since its opening 65 years
ago, it has been used extensively and still carries unrestricted
road traffic reliably. The great reliability of the bridge results
from its relatively simple structure, good construction workers,
and large safety factors. This is an example that shows howreliability is appreciated by the user of the product (or service).
2. CUSTOMER REQUIREMENTS AND SPECIFICATIONS
Few customers will specify traditional Reliability
Requirements in terms of MTBF, Failure Rate or Probability
of Occurrence. Even when they do, there are manymisunderstandings. Designers, Analysts, Manufacturing
and Sales often operate to a set of metrics that are not
important to the customer. These are just a few of the reasonswhy it is paramount that the following steps be incorporated
into the product design process:
(1) Reach a common understanding between buyer and
supplier, of reliability expectations, early in relationship.(2) Make reliability a high priority requirement in each
specification development.(3) Establish an agreed on mission profile, mission time and
operating environment.
(4) Ensure that both buyer and supplier recognize the cost of poor reliability.
(5) Make sure that both consumers and producers understand
that reliability is a long-term goal.
(6) Make sure that both consumers and producers are
measuring reliability the same way. MTBF is the wrongspecification metric. Money is the universal language.
(7) Unless there are real and measurable consequences for
poor reliability, attention will always be weak.3. RELIABILITY DATA SYSTEM
A Failure Reporting, Analysis and Corrective ActionSystem (FRACAS) is one of the most important elements of a
robust reliability program. A FRACAS system can be used to
organize and address a company’s reliability issues on a real-
time basis.The primary purposes of a FRACAS are to provide a
closed-loop failure reporting system, procedures for analysis
of failures to determine root-cause and documentation for
recording corrective action. Failure data are powerful, butneed to be managed properly to ensure accuracy and
timeliness.
The design of a FRACAS depends greatly on the data
collection and analysis needs of an organization, as well as the
capability to collect and analyze the data. However, the mainelements inherent to all FRACAS should be (1) the Failure
Incident Report, (2) the Failure Analysis Report and (3) the
Corrective Action Report. Other reports may be added to meetspecific needs.
3.1 Traceability
In a well run reliability program it is absolutely required
that individual components within a system be traceable.Data on how long a failed component was in actual
operation is critical. To obtain this type of data, components
must be bar-coded. Without bar-coding a company may end
up paying for many failed components that are out of warranty.
3.2 Failure Incident Report
A Failure Incidence Report should contain the followingminimal information:
(1) ID number for the report(2) Name of person writing the report
(3) Component part number and serial number
(4) Hours of component operation at time of incident
(5) Indication of whether a failure occurred or not(6) Location of incident
(7) Date of incident
(8) Descri ption of incident
(9) Date of repair
(10) Description of repair.
3.3 Failure Analysis Report
A Failure Analysis Report should contain the following
minimal information:
(1) ID number for the report
(2) Name of person filling out the report
(3) Initial visual inspection(4) List of fault codes/data downloaded from the
component and or sub-system
(5) Initial work performed to determine root cause(6) Detailed root cause analysis.
3.4 Corrective Action Report
A Corrective Action Report should contain the
following minimal information:
(1)
ID number for the report(2) Owner and Priority
(3) Description of problem
(4) Short term corrective action(5) Description of root cause
(6) Long term corrective action
(7) Preventive action
(8) Follow-up to ensure corrective/preventive actions are
effective.
3.5 Additional Failure Report Data
Additional information can, and should, be captured to
facilitate use by multiple groups within an organization.
Additional Failure Report data that should be considered are:
(1) Was the failure covered under warranty?(2) Was the failure due to a quality problem?
(3) Did the operator, or the way the product was installed,
cause the failure?
(4) If a system is analyzed, was more than one componentreplaced to repair the system?
(5) Identification of the sub-component that caused the
failure, to the level of detail known.
(6) Total time for repair (broken up into Logistics Time,

8/4/2019 Reliability Design Inception
http://slidepdf.com/reader/full/reliability-design-inception 5/34
2 – Dietrich 2008 AR&MS Tutorial Notes
Troubleshooting Time and Repair Time).
3.6 Additional Corrective Action Data
Additional Corrective Action Report data that should be
considered are:
(1) The date of Corrective Action implementation.(2) ID number of any Engineering Change Orders that were
generated to correct the problem.
(3) Did the problem occur on the production line, in thefield, during testing, or in more than one of these
locations?
4. DESIGN OF RELIABILITY TESTS
The design of reliability and reliability related tests,
whether or not they occur as part of product design, reliabilityevaluation or manufacturing process design is dependent on
two types of operational data. These are a detailed mission
profile and a detailed description of the operating
environment. This same data should also be available to the
product design team as the product must be designed to
perform its intended mission with a specified reliability whilein its operational environment.
4.1 Mission ProfileThe more information provided in the mission profile and
integrated into the design process, the more reliable the
product. The following is a hypothetical example of a mission profile for a hydraulically actuated valve designed to control
the flow of oil from a well head:
(1) The valve cycles (x) times per day on the average.
(2) The oil that flows through it is grit laden. Data on theamount and characteristic of grit per gallon of oil should
be provided.
(3) The oil flows at 100 to 120 ft. per sec. Velocity profiles
should be provided.(4) The oil temperature is 300 to 350 deg. F. Temperature
profiles should be provided.(5) The relative oil pressure is 400 to 450 psi. Relative oil
pressure profiles should be provided.(6) During a valve’s operation the relative hydraulic fluid
pressure varies from 0 to 1000 psi.
Information like the above is best obtained by actual
measurement, but this is not always possible. Hence, sourcessuch as past history of similar products and expert opinion
may have to be used. The more accurate the operational data,
the more reliable the product will be.
4.2 Operating Environment
The operating environment is sometimes more important
than the mission profile. In some situations the operatingenvironment has a greater effect on device life than mission
profile. This is often the case for electronics. The followinghypothetical mission profile data incorporates some of the
worst possible operating conditions for an electronic device.
The device is a controller, mounted on a drilling and
production platform, that is used to control all of the under-
ocean valves that are used to direct the oil flow from a wellhead. In operation, the controller actually controls the electric
motors that run the hydraulic pumps that provide the
hydraulic fluid to actuate the valves.
The controller operates in an environment where the
temperature varies from -40 deg. F. to 120 deg. F. Actual
real time data should be supplied on temperatures outsideand internal to the device when in both an operating and
stand-by mode.
The relative humidity can vary from 10% to 100 %.Actual relative humidity versus time profiles should be
supplied.
The controller is subjected to an acoustically generated
high G broadband random vibration environment. Actual
vibration levels should be monitored on the controller or similar devices.
The controller operates in a salt spray environment.
Concentrations of salt should be monitored.Information similar to the above is best obtained by
actual measurement. Data on the operating
environment are usually easier to obtain than data on the
mission profile.
4.3 Strength Stress Relationships
Figure 1 is a simplistic depiction of the stress-strength
relationships for a product. It shows that specified strengthvalues may or may not include the maximum operational
stress levels. Hence, a product designed to meet aspecification may or may not be reliable. It also shows a
design strength considerably larger than maximum operating
stress, which is necessary for a product to be highly reliable.
The difference between the design strength andmaximum operational stress level is similar to a safety factor
in structural design. The design strength is established a- priori based on past history of similar products, expert judgment and knowledge of the product’s operating
environment. It must be high enough to compensate for
uncertainties in the operational environmental levels,
0
Stress-
Strength
Possible Specified Strength
Maximum Operating Stress
Possible Specified Strength
Design Strength
Breaking Point Stress
Figure 1. Hypothetical Stress-Strength Relationships
8/4/2019 Reliability Design Inception
http://slidepdf.com/reader/full/reliability-design-inception 6/34
2008 Annual RELIABILITY and MAINTAINABILITY Symposium Dietrich – 3
irregularities in materials, inconsistencies in manufacturing
and other various factors. It may need to be several times the
measured maximum stress level if there is a large amount of uncertainty in the operating environment and product strength.
5. RELIABILITY TESTS AND ANALYSES THAT
OCCUR DURING PRODUCT DESIGN
The primary purposes of reliability and reliability related
tests, conducted during the product design phase, are to
identify design changes necessary to insure that designstrength is met and to identify the stress levels necessary to
cause failure. This knowledge is critical when designing thereliability evaluation tests that come after design completion.
There are two primary types of reliability tests that occur
during the design process. These are (1) component Over-
Stress Tests and (2) subsystem and system Highly Accelerated
Life Tests (HALTs). These tests are similar in concept, but
are performed at different times in the product design andconsequently have somewhat different objectives. The
acronym HALT has different meanings to different people.
Both of the above types of tests are qualitative, notquantitative in that they are meant to help improve the product
design, not provide direct reliability estimates. It is theauthor’s opinion that every reliability related test conducted
during the product design process should be designed not only
to help improve the product design, but to provide data to aid
in the design of the more sophisticated quantitative reliabilitytests that occur later in the product’s development and
deployment cycle.
5.1 C omponent Over-Stress Tests
Component Over-Stress tests are a very important part of
the design process. These tests are conducted early in the
design cycle. Hence, they cost less than subsystem and systemlevel tests and can be run relatively quickly. Ideally, all
critical components should be Over-Stress tested and their strength improved to where it is considerably above the
maximum operational stress level. With proper component
Over-Stress testing, the only failures that should occur inthe subsystem and system HALT are interface failures. By
definition, component Over-Stress tests are designed to test the
component in an environment that is significantly moreextreme than its predicted operational environment. The
author is a proponent of step-stress tests for component Over-
Stress testing as these provide information on both the
maximum stress levels where components will operate and the
stress levels where they will fail. The maximum stress level
where a component will operate should be above its designstrength. After failure occurs, a failure mode analysis should
be conducted and the product design should be improved to
incorporate the changes dictated by the results of the Over-Stress tests and the subsequent failure mode analysis. The
entire process should then be repeated until the product
demonstrates that it meets or exceeds its design strength.
Not all component level testing need be done in-house as
there are many components available commercially that have been subjected to this type of testing. This is particularly true
of electronic components. For these components it is only
necessary to insure that the vendor’s Over-Stress testing is
consistent with the product’s operational environment.
As a hypothetical example of a component level test
procedure, consider the mission profile for the control valve
previously described. During operation, the mission profileof this valve contains five stress factors. These are oil
pressure, oil velocity, oil temperature, grit level and
hydraulic fluid pressure. Engineering analysis concluded
that there is also one critical operational environmental
factor. Ocean currents cause flexing of the pipes that leadinto and out of the valve. There are several questions that
must be resolved by engineering analysis before a test is
designed. For example:(1) Can and should any of these factors be eliminated from
consideration?
(2) Do any of these factors interact?
(3) Is it physically possible and economically feasible to perform tests that include all the factors not previously
eliminated by engineering analysis?
Stress factors are eliminated from testing by
engineering analysis and possible re-design. In thisexample, the stress factors to be considered are oil pressure,
oil temperature, oil velocity, grit level, and inlet and outlet pipe flexing. Some of these might be eliminated from
consideration as follows:
(1) The pipe flexing problem could be resolved byattaching the pipes to the frame, but this must be done
in a way that does not cause a compression/expansion
problem due to external and internal temperaturevariation. If this temperature variation is small it may
be ignored.
(2) Engineering analysis indicates that oil temperature is
not a significant factor, hence can be excluded.
(3) Because the hydraulic actuators that operate the valvesare external to the actual valve, the effects of this stress
factor can possibly be evaluated by a separate lessexpensive test.Hence, the only three factors that need to be considered
in the Over-Stress test design are: (1) oil pressure, (2) oil
temperature, and (3) grit level.
In the author’s opinion, the following is a realistic
hypothetical test design. Five components will be subjected
to Over-Stress testing. Engineering analysis has concludedthat test grit level can be kept constant, and a level is
selected 20% above the measured maximum operating level.
Since oil pressure and oil velocity are physically dependentfactors, they will be ramped up at the same time. A mean
test level, 10% above the maximum operating levels, is
chosen as the starting point and the mean test level will be
ramped up in steps of 30% of the maximum operating stress.Each ramp step is 24 hours in duration. During the test theoil pressure and velocity will be cycled about their mean
levels consistent with the cycling that occurs in operation.
Testing is continued until all components fail or a
component fails below the design strength. If a component
fails below the design strength, testing is stopped, a failure
mode analysis is conducted and corrective action is taken.This corrective action must result in a product design change
8/4/2019 Reliability Design Inception
http://slidepdf.com/reader/full/reliability-design-inception 7/34
4 – Dietrich 2008 AR&MS Tutorial Notes
or a manufacturing process change. The test sequence will be
repeated with five new components that incorporate the
changes instituted during corrective action. If all additionalfailures occur above the design strength, testing is stopped and
the design is frozen. If no failures have occurred and testing
has reached levels of 200% of design strength, testing is also
stopped and the design frozen. It should be emphasized that
the design strength must be significantly above the estimatedmaximum operating stress level. If the design strength is set
too low, the component will never be reliable. When
establishing the design strength, all mission profile andoperational environment factors must be considered. Also,
factors such as material variation, manufacturing process
variation and others specific to a particular product must be
considered. Establishing the design strength is one of the most
important parts in the design of a high reliability product.
5.2 System and Subsystem HALT
HALTs are similar to component Over-Stress tests, but
are conducted at the sub-system and systems levels. Because
they occur further along in the product design process, they are
more complex and cost more to conduct. If all components
have been adequately Over-Stress tested, the HALT should
identify only interface problems such as weak connectors, badsolder joints, incorrect tolerances and others. If frequent
component failures occur during the HALT, the componentshave not been adequately over-stress tested. In the author’s
opinion, HALT should use step-stress multi-environment tests,
simultaneously incorporating all the stresses likely to occur in
a product’s operation. However, for complex products
subjected to multiple stresses during operation, this may not be
feasible due to the test complexity, the cost of running the testand the cost of building the test equipment to perform the test.
In this situation, engineering analysis must determine whichstress factors have to be tested simultaneously and which can
be tested independently. If a significant interaction effect
occurs between the stresses, these stresses must be included inthe same HALT. An example of such an interaction is a
device that is subjected to both high pressure and extremely
high temperatures during operation, such as superheated steam pipes. The interaction is the reduction of strength, caused by
the high temperatures, that causes a pressure induced failure.
Hence, both temperature and pressure must be appliedsimultaneously.
An example of the type of HALT the author prefers is the
Design Margin Evaluation Tests that were run by the US Navy
in the 1960’s. The author is quite familiar with these tests as
he designed the most complex of them and did the associateddata analysis. In this test entire missiles were subjected to
combined temperature, altitude and random vibration tests.Three levels of each environment were applied in a 3x3x3
nested factorial experiment. The first level of eachenvironment was the average operating level and all the other
levels were progressively higher. This testing sequence
identified several weak areas and resulted in partial product
redesign. It also showed that there was a serious interaction between temperature and random vibration. This type of test
design has its place, but it is probably more complex than
necessary for most routine HALTs.
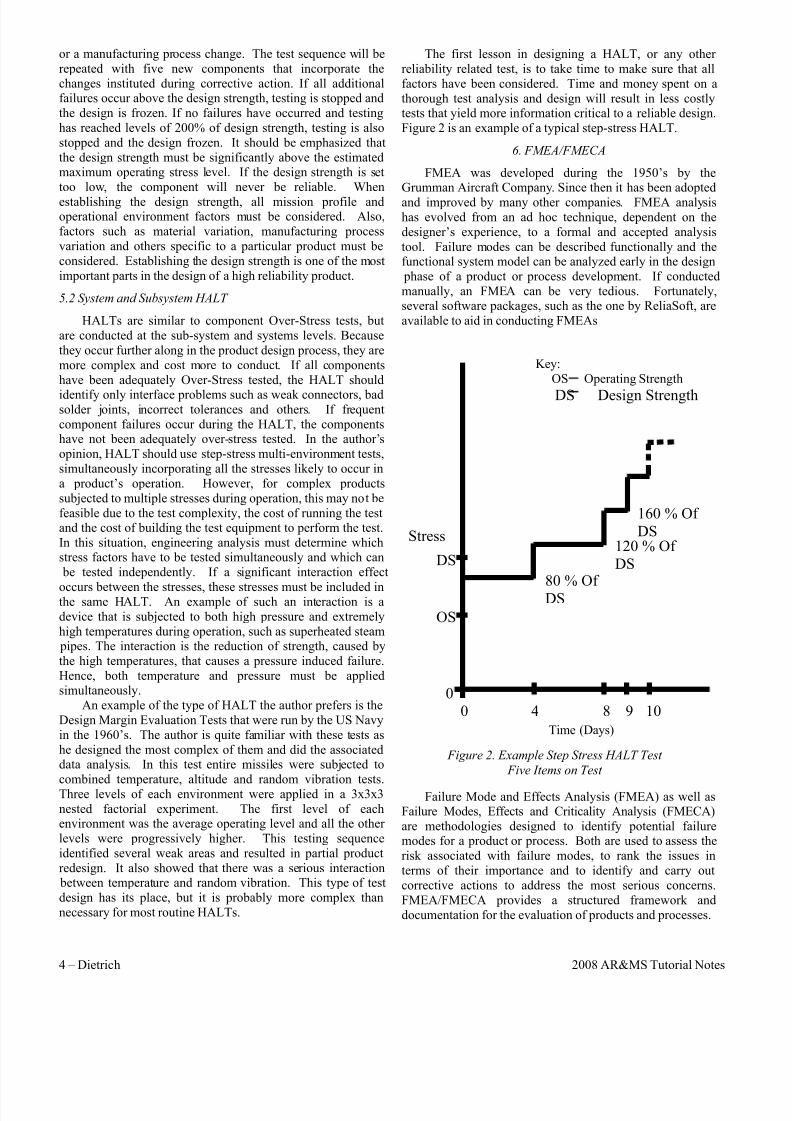
The first lesson in designing a HALT, or any other
reliability related test, is to take time to make sure that all
factors have been considered. Time and money spent on a
thorough test analysis and design will result in less costlytests that yield more information critical to a reliable design.
Figure 2 is an example of a typical step-stress HALT.
6. FMEA/FMECA
FMEA was developed during the 1950’s by theGrumman Aircraft Company. Since then it has been adopted
and improved by many other companies. FMEA analysis
has evolved from an ad hoc technique, dependent on the
designer’s experience, to a formal and accepted analysis
tool. Failure modes can be described functionally and thefunctional system model can be analyzed early in the design
phase of a product or process development. If conducted
manually, an FMEA can be very tedious. Fortunately,several software packages, such as the one by ReliaSoft, are
available to aid in conducting FMEAs
Failure Mode and Effects Analysis (FMEA) as well asFailure Modes, Effects and Criticality Analysis (FMECA)
are methodologies designed to identify potential failuremodes for a product or process. Both are used to assess the
risk associated with failure modes, to rank the issues in
terms of their importance and to identify and carry out
corrective actions to address the most serious concerns.
FMEA/FMECA provides a structured framework and
documentation for the evaluation of products and processes.
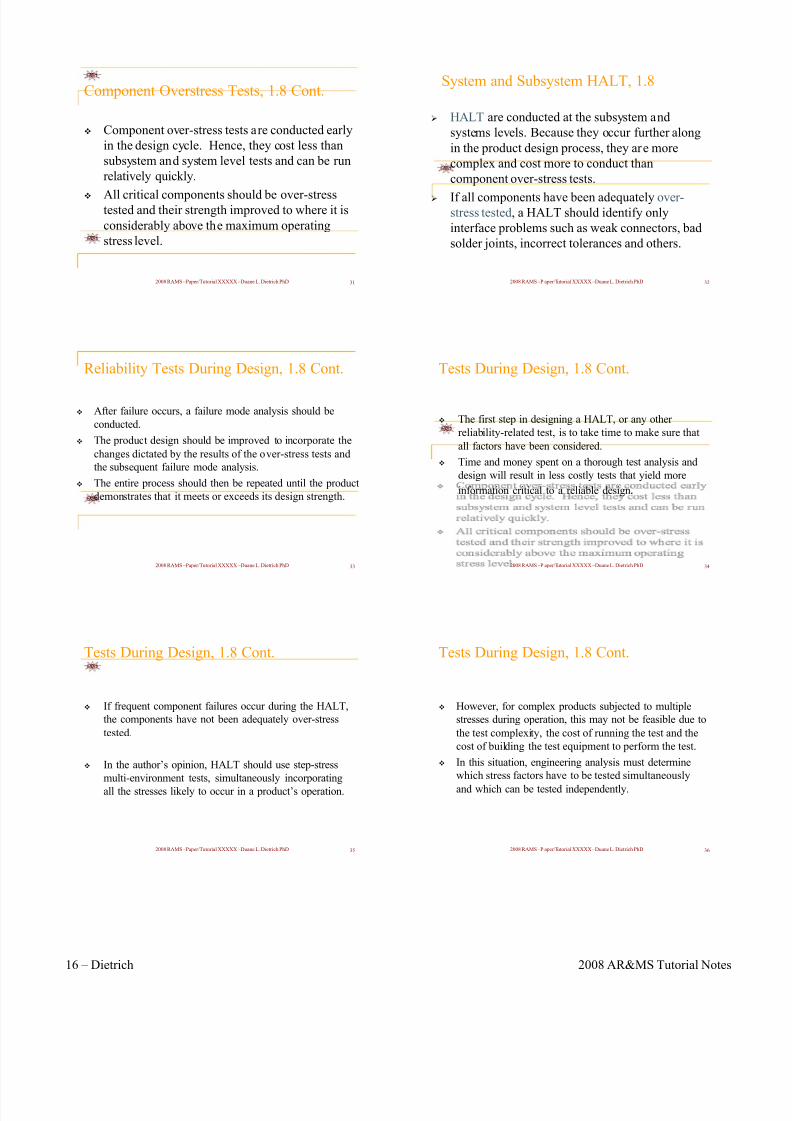
0
Stress
OS
Figure 2. Example Step Stress HALT Test
Five Items on Test
0 4 8 9 10
DS
80 % Of
DS
120 % Of
DS
160 % Of
DS
Key:
OS Operating Strength
DS Design Strength
Time (Days)
8/4/2019 Reliability Design Inception
http://slidepdf.com/reader/full/reliability-design-inception 8/34
2008 Annual RELIABILITY and MAINTAINABILITY Symposium Dietrich – 5
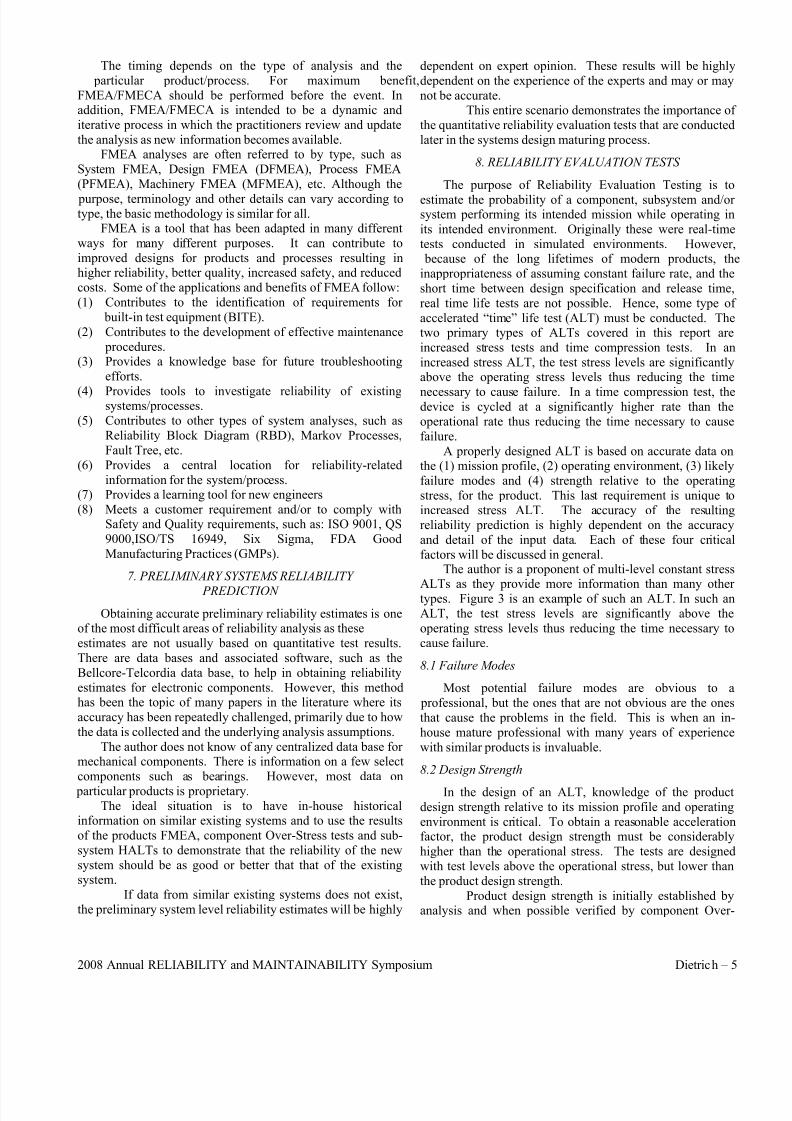
The timing depends on the type of analysis and the
particular product/process. For maximum benefit,
FMEA/FMECA should be performed before the event. Inaddition, FMEA/FMECA is intended to be a dynamic and
iterative process in which the practitioners review and update
the analysis as new information becomes available.FMEA analyses are often referred to by type, such as
System FMEA, Design FMEA (DFMEA), Process FMEA
(PFMEA), Machinery FMEA (MFMEA), etc. Although the
purpose, terminology and other details can vary according totype, the basic methodology is similar for all.
FMEA is a tool that has been adapted in many different
ways for many different purposes. It can contribute to
improved designs for products and processes resulting inhigher reliability, better quality, increased safety, and reduced
costs. Some of the applications and benefits of FMEA follow:
(1) Contributes to the identification of requirements for
built-in test equipment (BITE).
(2) Contributes to the development of effective maintenance
procedures.(3) Provides a knowledge base for future troubleshooting
efforts.
(4) Provides tools to investigate reliability of existingsystems/processes.
(5) Contributes to other types of system analyses, such as
Reliability Block Diagram (RBD), Markov Processes,
Fault Tree, etc.
(6) Provides a central location for reliability-related
information for the system/process.(7) Provides a learning tool for new engineers
(8) Meets a customer requirement and/or to comply withSafety and Quality requirements, such as: ISO 9001, QS
9000,ISO/TS 16949, Six Sigma, FDA Good
Manufacturing Practices (GMPs).
7. PRELIMINARY SYSTEMS RELIABILITY
PREDICTION
Obtaining accurate preliminary reliability estimates is oneof the most difficult areas of reliability analysis as these
estimates are not usually based on quantitative test results.
There are data bases and associated software, such as the
Bellcore-Telcordia data base, to help in obtaining reliability
estimates for electronic components. However, this methodhas been the topic of many papers in the literature where its
accuracy has been repeatedly challenged, primarily due to how
the data is collected and the underlying analysis assumptions.
The author does not know of any centralized data base for mechanical components. There is information on a few select
components such as bearings. However, most data on
particular products is proprietary.
The ideal situation is to have in-house historicalinformation on similar existing systems and to use the results
of the products FMEA, component Over-Stress tests and sub-
system HALTs to demonstrate that the reliability of the new
system should be as good or better that that of the existingsystem.
If data from similar existing systems does not exist,
the preliminary system level reliability estimates will be highly
dependent on expert opinion. These results will be highly
dependent on the experience of the experts and may or may
not be accurate.This entire scenario demonstrates the importance of
the quantitative reliability evaluation tests that are conducted
later in the systems design maturing process.
8. RELIABILITY EVALUATION TESTS
The purpose of Reliability Evaluation Testing is to
estimate the probability of a component, subsystem and/or system performing its intended mission while operating in
its intended environment. Originally these were real-time
tests conducted in simulated environments. However, because of the long lifetimes of modern products, the
inappropriateness of assuming constant failure rate, and the
short time between design specification and release time,
real time life tests are not possible. Hence, some type of
accelerated “time” life test (ALT) must be conducted. Thetwo primary types of ALTs covered in this report are
increased stress tests and time compression tests. In an
increased stress ALT, the test stress levels are significantlyabove the operating stress levels thus reducing the time
necessary to cause failure. In a time compression test, thedevice is cycled at a significantly higher rate than the
operational rate thus reducing the time necessary to cause
failure.
A properly designed ALT is based on accurate data onthe (1) mission profile, (2) operating environment, (3) likely
failure modes and (4) strength relative to the operating
stress, for the product. This last requirement is unique toincreased stress ALT. The accuracy of the resulting
reliability prediction is highly dependent on the accuracy
and detail of the input data. Each of these four critical
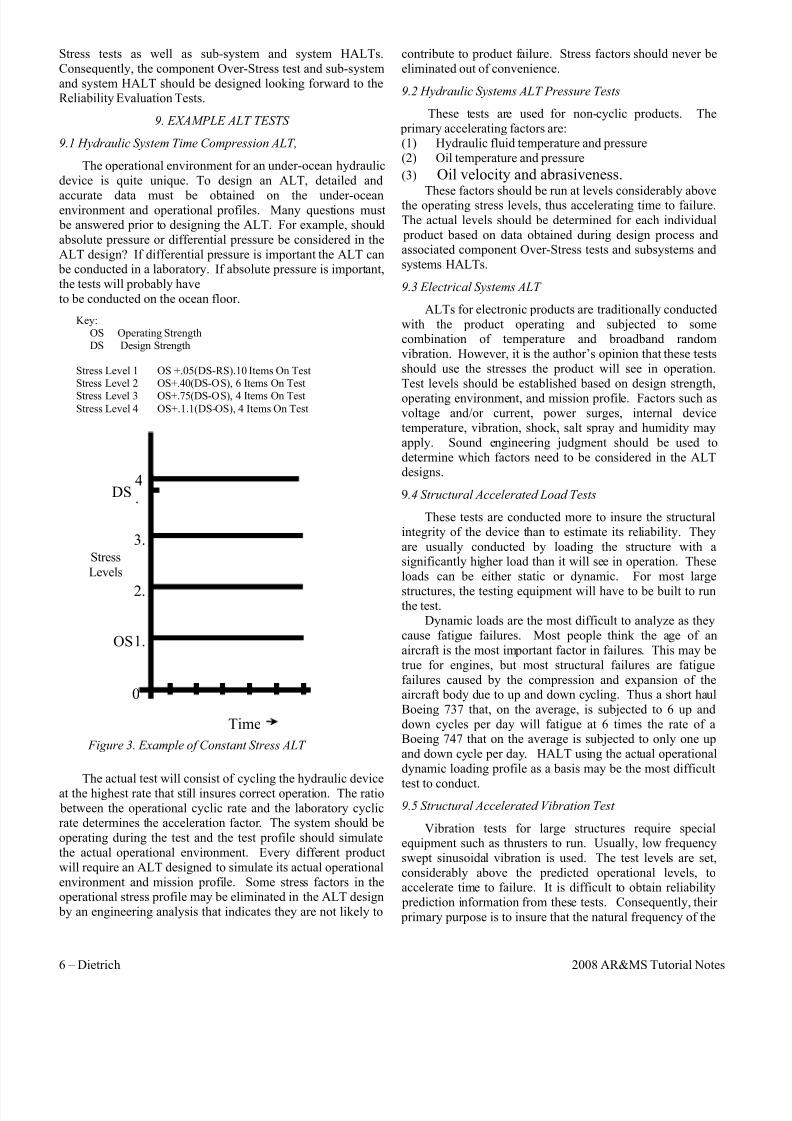
factors will be discussed in general.The author is a proponent of multi-level constant stress
ALTs as they provide more information than many other types. Figure 3 is an example of such an ALT. In such an
ALT, the test stress levels are significantly above the
operating stress levels thus reducing the time necessary to
cause failure.
8.1 Failure Modes
Most potential failure modes are obvious to a
professional, but the ones that are not obvious are the ones
that cause the problems in the field. This is when an in-
house mature professional with many years of experience
with similar products is invaluable.
8.2 Design Strength
In the design of an ALT, knowledge of the product
design strength relative to its mission profile and operating
environment is critical. To obtain a reasonable accelerationfactor, the product design strength must be considerably
higher than the operational stress. The tests are designed
with test levels above the operational stress, but lower than
the product design strength.
Product design strength is initially established byanalysis and when possible verified by component Over-
8/4/2019 Reliability Design Inception
http://slidepdf.com/reader/full/reliability-design-inception 9/34
6 – Dietrich 2008 AR&MS Tutorial Notes
Stress tests as well as sub-system and system HALTs.
Consequently, the component Over-Stress test and sub-system
and system HALT should be designed looking forward to theReliability Evaluation Tests.
9. EXAMPLE ALT TESTS
9.1 Hydraulic System Time Compression ALT,
The operational environment for an under-ocean hydraulic
device is quite unique. To design an ALT, detailed and
accurate data must be obtained on the under-oceanenvironment and operational profiles. Many questions must
be answered prior to designing the ALT. For example, should
absolute pressure or differential pressure be considered in the
ALT design? If differential pressure is important the ALT can be conducted in a laboratory. If absolute pressure is important,
the tests will probably have
to be conducted on the ocean floor.
The actual test will consist of cycling the hydraulic device
at the highest rate that still insures correct operation. The ratio
between the operational cyclic rate and the laboratory cyclicrate determines the acceleration factor. The system should be
operating during the test and the test profile should simulate
the actual operational environment. Every different product
will require an ALT designed to simulate its actual operational
environment and mission profile. Some stress factors in theoperational stress profile may be eliminated in the ALT design
by an engineering analysis that indicates they are not likely to
contribute to product failure. Stress factors should never be
eliminated out of convenience.
9.2 Hydraulic Systems ALT Pressure Tests
These tests are used for non-cyclic products. The
primary accelerating factors are:(1) Hydraulic fluid temperature and pressure
(2) Oil temperature and pressure
(3) Oil velocity and abrasiveness.
These factors should be run at levels considerably abovethe operating stress levels, thus accelerating time to failure.
The actual levels should be determined for each individual
product based on data obtained during design process andassociated component Over-Stress tests and subsystems and
systems HALTs.
9.3 Electrical Systems ALT
ALTs for electronic products are traditionally conducted
with the product operating and subjected to somecombination of temperature and broadband random
vibration. However, it is the author’s opinion that these tests
should use the stresses the product will see in operation.
Test levels should be established based on design strength,
operating environment, and mission profile. Factors such as
voltage and/or current, power surges, internal devicetemperature, vibration, shock, salt spray and humidity may
apply. Sound engineering judgment should be used to
determine which factors need to be considered in the ALTdesigns.
9.4 Structural Accelerated Load Tests
These tests are conducted more to insure the structural
integrity of the device than to estimate its reliability. They
are usually conducted by loading the structure with asignificantly higher load than it will see in operation. These
loads can be either static or dynamic. For most large
structures, the testing equipment will have to be built to runthe test.
Dynamic loads are the most difficult to analyze as they
cause fatigue failures. Most people think the age of an
aircraft is the most important factor in failures. This may be
true for engines, but most structural failures are fatigue
failures caused by the compression and expansion of theaircraft body due to up and down cycling. Thus a short haul
Boeing 737 that, on the average, is subjected to 6 up and
down cycles per day will fatigue at 6 times the rate of aBoeing 747 that on the average is subjected to only one up
and down cycle per day. HALT using the actual operational
dynamic loading profile as a basis may be the most difficult
test to conduct.
9.5 Structural Accelerated Vibration Test
Vibration tests for large structures require specialequipment such as thrusters to run. Usually, low frequency
swept sinusoidal vibration is used. The test levels are set,
considerably above the predicted operational levels, toaccelerate time to failure. It is difficult to obtain reliability
prediction information from these tests. Consequently, their
primary purpose is to insure that the natural frequency of the
0
Stress
Levels
OS
Figure 3. Example of Constant Stress ALT
DS
1.
2.
3.
4.
Time
Key:OS Operating StrengthDS Design Strength
Stress Level 1 OS +.05(DS-RS).10 Items On TestStress Level 2 OS+.40(DS-OS), 6 Items On Test
Stress Level 3 OS+.75(DS-OS), 4 Items On TestStress Level 4 OS+.1.1(DS-OS), 4 Items On Test
8/4/2019 Reliability Design Inception
http://slidepdf.com/reader/full/reliability-design-inception 10/34
2008 Annual RELIABILITY and MAINTAINABILITY Symposium Dietrich – 7
structure is not close to the operational excitation frequency or
any of its harmonics. This problem can be solved by adjusting
the stiffness of the structure, increasing the mass of thestructure or adding damping to the structure. These tests
should be conducted during the design phase with mock
equipment installed and repeated on a limited scale during thereliability evaluation stage with all the operational equipment
they are to support installed.
If systems level reliability tests cannot be conducted
because of the size and complexity of the system, thesubsystems level test data will have to be used along with thesystems level reliability logic diagrams to get a systems level
reliability estimate. There are several commercially available
computer software packages to aid in such calculations.ReliaSoft’s BlocSim is the newest and most comprehensive of
these packages. When a system level estimate must be
obtained in this manner, interface failures that occur in the
connections between subsystems, could result in future
problems. Consequently, it is extremely important that the
interfaces be given critical consideration during the productdesign process.
10. RELIABILITY GROWTH TESTS
Reliability Growth is the continuous improvement inreliability over time. This improvement can occur as the result
of modification of the manufacturing process or modification
of the product design. The basic assumption in Reliability
Growth is that reliability improves over time as a result of bothof these types of changes. There are many models for
reliability growth in existence including several proposed by
the author. However, the model most often used is the Duane-
AMSAA model.The basic procedure for Reliability Growth testing is
to life test a sample of the product until a failure occurs. This
test may be a real time or accelerated time test. Each time a
failure occurs the testing is stopped and the failure mode isanalyzed. If corrective action is considered necessary, to
either the product or process design, they are instituted and the
testing is continued until another failure occurs. This
procedure is called a TAFT i.e. test analyze, fix and retest.
Reliability Growth Tests are quantitative tests. The accuraciesof the reliability estimates obtained from Reliability Growth
Tests are influenced by the assumed growth model and, if the
test is accelerated, by the assumed acceleration model.
11. MANUFACTURING SYSTEMS DESIGN
Manufacturing systems design is like all systems design in
that it is necessary to carefully define the mission profile before the process is designed and the associated reliability
and quality procedures are incorporated. However, the
mission profile for a manufacturing system is considerablydifferent than that for most operational systems. Some of the
information in a manufacturing systems mission profile is as
follows:
(1) A mature product design.
(2) The production rate (throughput) per day.(3) Will the process operate continuously or be shut down for
part of each day?
(4) Will there be a single production line or multiple lines?
(5) What types of operations will be involved in the
process?
(6) Will all subsystems be manufactured or assembled
as part of the process, or will some be purchased from
venders?(7) Will the venders supply components and subsystems
that have been subjected to Over-Stress tests or HALT
consistent with the products mission profile and its
operating environment?Process control procedures should be integrated in the
process design and should change as the design changes
from a preliminary specification to a mature design. The
most important factor in the design of the process controlsystem is the production rate. Process control for high
volume production is based on the use of Statistical Process
Control (SPC) procedures. Process control for low volume production is usually based on 100% inspection. In either
case, the purposes of process control are to detect changes
that occur over time in critical quality characteristics of the
product and to take appropriate corrective action.
11.1 Inspection/SPC Procedures
Both variable data and attribute data are obtained during product inspection. Variable data results when quality
characteristics such as strength, dimensions, voltage, current
and others are actually measured. Attribute data is some
times called classification or count data, as it results whenthe quality characteristic of interest is the number of
defective products or the number of defects per product. A
defective product either fails to operate or operates but does
not meet specifications during inspection. Failure to meetspecifications is usually determined by (go no-go) gauges
and not by actual measurements. Defects are irregularities
in the product, such as sub-standard solder joints, blemishes
in paint or pits in a sand casting that in limited numbers donot affect the product’s operation, but in large numbers
might.
Measured quality characteristics are usually monitored
using X-Bar and R charts. Fraction defective is usually
monitored using either P or NP charts. Defects per unit areusually monitored using U or C charts. There are many
other types of SPC charts available, but most have special
purpose applications.Automatic inspection is usually used if 100% inspection
of a quality characteristic is considered necessary during
high volume production. Manual inspection is usually used
for 100% inspection of quality characteristics during low
volume production. SPC inspection is usually done
manually, but for very high volume production it is oftenautomated.
Inspection stations should be installed after each stageof the production process where a critical quality
characteristic is added to the product. Frequent application
of process control procedures in the production process is
usually very cost effective, relative to down stream
inspection, as only one quality characteristic is inspected at a
time and inspection is relatively easy. If the same quality

8/4/2019 Reliability Design Inception
http://slidepdf.com/reader/full/reliability-design-inception 11/34
8 – Dietrich 2008 AR&MS Tutorial Notes
characteristic is inspected down stream it will usually be much
harder to inspect, and if the process is found to be out of
control, all the work added during the previous manufacturingstages will be wasted.
11.2 ESS Procedures
Today’s competitive market forces companies to spend
considerable time and money in improving the quality and
associated reliability of their products. Much of this effort isspent evaluating and improving both product and process
design. Despite this extensive up-front effort, many products
fall short of their “designed-in” goals. Because many major
business decisions impacting corporate profits are made based
on the predicted reliability of a product, it is imperative that a product achieve its reliability goals.
Unfortunately, many products do not achieve their designed-in
reliability goals due to defects introduced in the product duringmanufacturing. Defects are usually classified as hard defects
or latent defects. Hard defects are those easily found during
normal quality control procedures. Latent defects are those
that can only be found through the use of stress screening. The
Environmental Stress Screen process (ESS) transforms the
latent defects into hard defects thus facilitating their
elimination prior to the product entering the field. Differentstress environments will detect different types of latent
defects. Thus it is necessary to employ the type of screenappropriate to each stage of the production process. Defects
that are not detected by the ESS process in the factory will
likely cause failures in the field where it may cost more than
100 times the cost of detecting the defect before it leaves the
factory.
ESS and Burn-In are sometimes confused due to the factthat they both have the same goal: reducing the occurrence of
early failures in the field. The major difference is that ESS isconducted using accelerated test conditions, whereas Burn-In
is conducted using operating conditions. The ESS conditions
are more severe than operating conditions and in some casesinclude stresses not seen in operation. The author prefers an
ESS stress level about half way between the operating
conditions and the design strength. ESS has an economicadvantage over Burn-In since it detects defects in a much
shorter time than Burn-In. In both cases, it is important that
testing time is sufficient to detect most of the latent defects, but not long enough to significantly impact the product
operational life. The establishing of the test time is probably best done by
testing a small sample of the product until defects are being
detected at a very slow rate. It should be understood that ESS
and Burn-In procedure will not detect all the latent defects
without affecting the products operational life time. Severalrecognized experts in the field have suggested that ESS detects
only about 90% of the latent defects. Hence, it is extremelyimportant that as information becomes available from the
quality procedures and the ESS, the process design is
continually upgraded to reduce the occurrence of all defects.
Screening can be performed at the component, sub-system
or system level. Components are screened for a specifiedduration before being assembled into a sub-system. Defects
introduced during the assembly of the components into a
subsystem are screened at the subsystem level. Defects
introduced during final assembly are screened at the system
level. The screening environments will vary from assembly
level to assembly level.
It should be emphasized that both ESS and Burn-In are primarily quality procedures, not reliability procedures.
They improve a product’s reliability by improving the
products out-going quality and hence, reliability. Their intent is to insure that the outgoing product’s reliability is
close to that estimated during the reliability evaluation tests.
11.3 Manufacturing Systems Test
During the initial production run, problem areas in the
manufacturing process should be corrected. Some questionsthat need to be addressed are:
(1) Does the process flow correctly or are there problems
such as blockages that can be corrected by resizing buffers and/or adding additional parallel machines?
(2) Should the method of manufacturing some components
and/or sub-systems be changed? Once the process is
running, SPC and ESS procedures may indicate that a
particular area of the manufacturing process will never be able to produce to quality standards. Perhaps a
better and less costly way of manufacturing acomponent or sub-system may be identified. It may
seem that these types of problems should have beeneliminated before manufacturing starts, but quite often
they are not. In addition, a modern manufacturing
process should be continually improved as new
manufacturing methods are developed.(3) There may be interface problems between SPC and/or
ESS and manufacturing. It should be emphasized that
SPC and ESS are integral parts of manufacturing and
the results obtained should be used to improve thequality of the outgoing product. Often SPC and/or ESS
are treated as appendages and the results obtained from
them are ignored, especially if they are in disagreementwith management’s objectives.
(4) Often manufacturing interface problems occur. These
problems are usually manifested in difficult or almost
impossible assembly, caused by incorrect tolerances or
faulty product design.
(5) There are often difficulties in performing high speedfunctional test at the sub-system of system level.
These are just a few of the manufacturing problem areas that
might be identified during prototype production.The second objective of the initial production run is to
obtain systems and/or sub-systems for HALT and Reliability
growth testing. Even though the manufacturing system is
being improved, an attempt should be made to insure that the products produced are very similar to the final products.
This is usually accomplished by some manual correctiveaction or other kluge procedures. It should be noted that
prototype products usually yield inaccurate results if used inreliability evaluation tests.
11.4 Production Run
At this point in the product and process evolution, themanufacturing system has been tested and improved during
8/4/2019 Reliability Design Inception
http://slidepdf.com/reader/full/reliability-design-inception 12/34
2008 Annual RELIABILITY and MAINTAINABILITY Symposium Dietrich – 9
the initial production and its semi-final design is in place. The
systems level HALT and Reliability Growth Tests have been
conducted and the product design has been revised based ontheir results. The manufacturing process is now ready for a
trial production run. The number of systems or sub-systems
produced is usually determined by the number needed in thereliability evaluation tests.
One of the major problems that occur, if no additional
problem areas are identified by the trial production run, is that
management does not want to or cannot wait for the reliabilityevaluation test results before starting full production. Thisoften occurs if the manufacturing equipment is very expensive
and/or if the operating crew is large and in place. If
production is started before the reliability evaluation testresults are available, the product should not be shipped until
these results are available and it is determined if design
changes are necessary to meet reliability standards. Based on
these results, retrofits may have to take place, prior to shipping
the product.
12. FINALIZE MANUFACTURING SYSTEMS DESIGN
Based on the results of the system or subsystem level
HALT and Reliability Growth Tests the product may need to be partially redesigned. Once these design changes areimplemented and the manufacturing system is modified
accordingly, the manufacturing process is ready for a
production run.
13. A RECOMMENDED RELIABILITY ORIENTED
DESIGN PROGRAM
The following is a recommended list of the steps that
should be taken to improve the reliability of products. Each of
these items should be converted to detailed instructions and/or
actions to meet the specific needs of a particular product.
1)
Management must understand and support the effort.2) Technicians and Engineering must receive training in the
rudiments of applied reliability.
3) An in-house reliability data base must be established thatincludes failure rates of components, their mission
profile and operating environment.
4) A list of component vendors that have delivered high
quality components in the past should be compiled andmade available to all design teams.
5) Problems that have occurred on past products should be
documented including successful engineering changes.
This data must be readily available to designers. It is
extremely important that past mistakes not be repeated inthe future.
6) Resources must be committed to reliability early in a
product’s developmental cycle.7) Component selection should be based primarily on in-
house data on similar components. If information is not
available on past similar components over-specification
is dictated.
8) All critical components and those where problems haveoccurred in the past should be subjected to accelerated
environment and/or time compression reliability
demonstration testing.
9) The location of all components and sub-systems in the
product should be reviewed to insure that the
components most likely to fail are the most accessible.
A high-time to failure and a low-time to repair arecritical to high systems availability.
10) Components that need preventive maintenance should
also be readily accessible.
11) Both sub-system and system designs should be subjectto FMEA.
12) After problems identified in the FMEA are addressed,
the sub-system or system design should be subjected to
a comprehensive design review. To obtain anindependent perspective, the review teams should
include members that are not on the design team. The
use of outside experts may be cost effective.13) Where possible, sub-systems should be subjected to
accelerated life reliability demonstration testing.
Comprehensive sub-system functionality testing
should always be done.
14) After a prototype tool is produced, a group of
experienced engineers, including some from outsidethe organization, should review the product in concert
with the list of previous problems.
15) Comprehensive systems level functionality testing ismandatory on the prototype products. It may not be
possible to demonstrate reliability in the laboratory,
but it is possible to demonstrate that the product will
perform its intended function in the field. The designof these tests is critical. A test design team should be
constituted to insure that all possible in-the-field
scenarios are incorporated. Emphasis should be placed
on the likely sequencing of events.16) Initially, all products should be Burn-In-tested prior to
shipping. This test should be similar to thefunctionality tests, but shorter in duration.17) An inspection procedure should be established and
applied to all production tools. The assurance of
consistent high quality is mandatory.
18) Field service technicians and engineers should receivecomprehensive training on product operation,
preventive maintenance and corrective maintenance.
Inspection and operating procedures must be in place
to insure that improperly performed maintenance does
not result in reliability problems. This is critical as asmall oversight by a field service technician or
engineer, while performing in-field maintenance, can
result in huge losses.
19) Once the product is in the field, detailed datacollection is paramount. Actual time to failure data
should be recorded to minimize warrantee costs,
provide information for design changes in the present
tool and to facilitate the design of reliable future tools.20) When a significant failure occurs, a design review
team should be instituted to review the present design
to determine what action is mandated.

8/4/2019 Reliability Design Inception
http://slidepdf.com/reader/full/reliability-design-inception 13/34
10 – Dietrich 2008 AR&MS Tutorial Notes
21) All engineer change orders should be reviewed by a
design review team before implemented. If the change is
at the sub-system level, an FMEA is also recommended.22) Data on the performance of all engineering changes
should be recorded for future use.
When the above proposed steps are implemented, other
problems will be identified. Any viable approach to reliability
improvement must be up-graded as new problems areidentified.
14. ACKNOWLEDGMENTS
The author would like to thank the following
people who have recently had a direct or indirect influence
on the thinking behind this document.
Brian Fox Capstone Turbine
Pat Hetherington RACRobert Spear Cameron Oil
Scott Werner SCP Global
Pantelis Vassiliou ReliaSoftLisa Hacker ReliaSoft
There have been many others in the past.
8/4/2019 Reliability Design Inception
http://slidepdf.com/reader/full/reliability-design-inception 14/34
Reliability form Design Inception to
Product Retirement
ByDuane L Dietrich PhDDirector of Consulting Services, ReliaSoftProfessor Emeritus, University of Arizona
2008 RAMS –Paper/Tutorial XXXXX –Duane L. Dietrich PhD 3
Scope (Cont.)
5. Accelerated Life Tests,
6. Real Time Life Tests,
7. Reliability Growth Tests, Burn-In
8. Field failures
9. Engineering change orders
2008 RAMS –Paper/Tutorial XXXXX –Duane L. Dietrich PhD 5
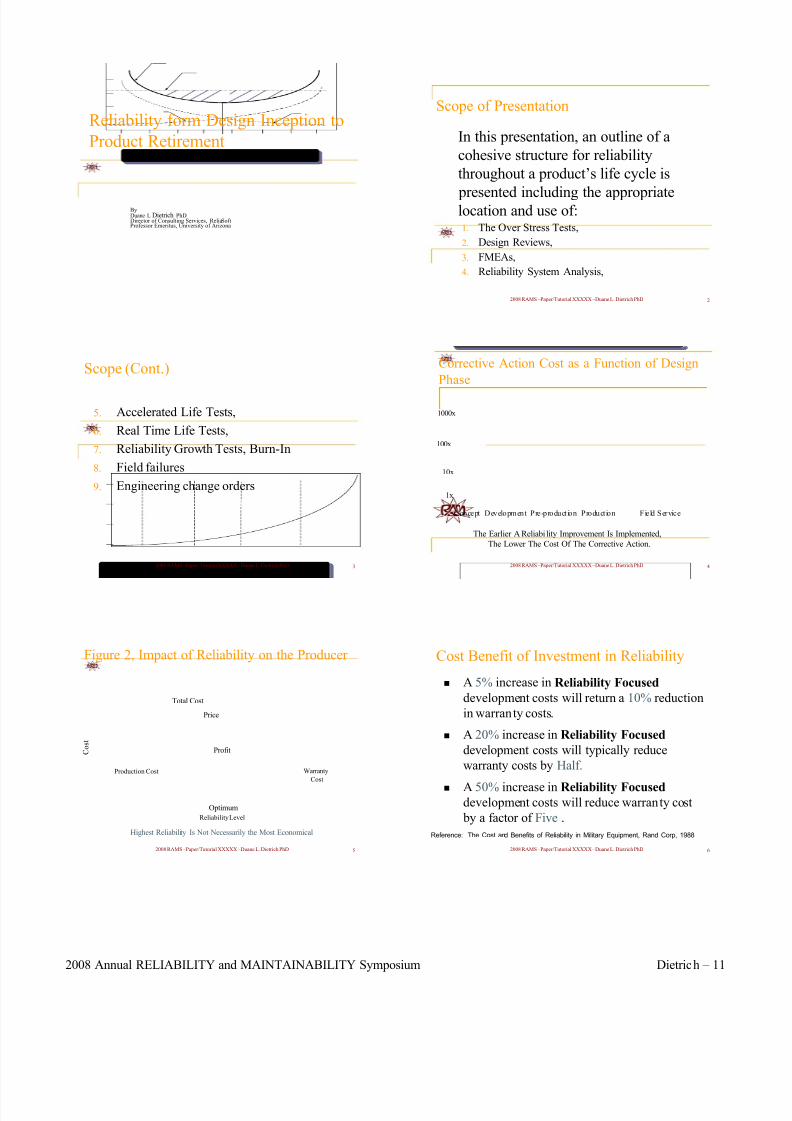
Highest Reliability Is Not Necessarily the Most Economical
Reliability Level
Price
Total Cost
Warranty
Cost
Production Cost
Profit C o s t
Optimum
Figure 2, Impact of Reliability on the Producer
2008 RAMS –Paper/Tutorial XXXXX –Duane L. Dietrich PhD 2
Scope of Presentation
In this presentation, an outline of a
cohesive structure for reliability
throughout a product’s life cycle is
presented including the appropriatelocation and use of:1. The Over Stress Tests,
2. Design Reviews,
3. FMEAs,
4. Reliability System Analysis,
2008 RAMS –Paper/Tutorial XXXXX –Duane L. Dietrich PhD 4
Corrective Action Cost as a Function of Design
Phase
Concept Development Pre-product ion Product ion Field Service
1x
10x
100x
The Earlier A Reliabi lity Improvement Is Implemented,
The Lower The Cost Of The Corrective Action.
1000x
2008 RAMS –Paper/Tutorial XXXXX –Duane L. Dietrich PhD 6
Cost Benefit of Investment in Reliability
A 5% increase in Reliability Focused
development costs will return a 10% reduction
in warranty costs.
A 20% increase in Reliability Focused
development costs will typically reduce
warranty costs by Half.
A 50% increase in Reliability Focuseddevelopment costs will reduce warranty cost
by a factor of Five .
Reference: The Cost and Benefits of Reliability in Military Equipment, Rand Corp, 1988
2008 Annual RELIABILITY and MAINTAINABILITY Symposium Dietrich – 11
8/4/2019 Reliability Design Inception
http://slidepdf.com/reader/full/reliability-design-inception 15/34
2008 RAMS –Paper/Tutorial XXXXX –Duane L. Dietrich PhD 7
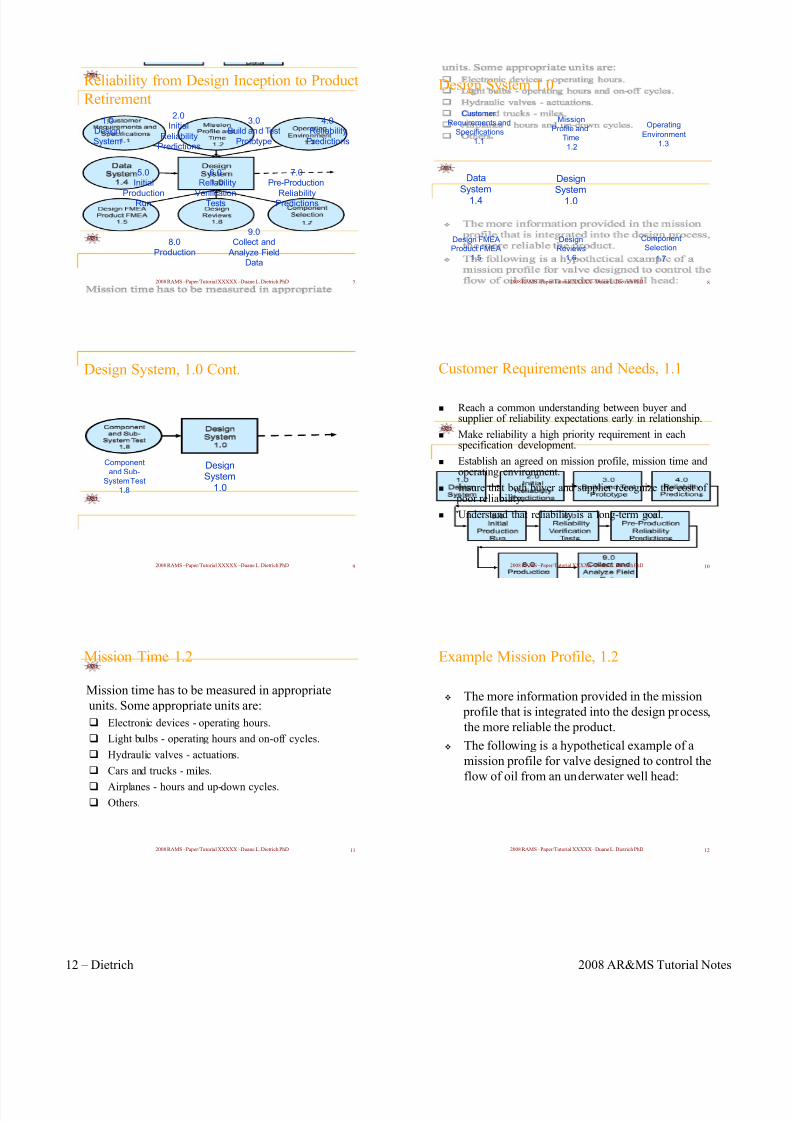
Reliability from Design Inception to Product
Retirement
1.0Design
System
2.0Initial
ReliabilityPredictions
3.0Build and Test
Prototype
4.0Reliability
Predictions
5.0Initial
ProductionRun
6.0Reliability
VerificationTests
7.0Pre-Production
ReliabilityPredictions
8.0
Production
9.0Collect and
Analyze FieldData
2008 RAMS –Paper/Tutorial XXXXX –Duane L. Dietrich PhD 9
Design System, 1.0 Cont.
Component
and Sub-
System Test
1.8
DesignSystem
1.0
2008 RAMS –Paper/Tutorial XXXXX –Duane L. Dietrich PhD 11
Mission Time 1.2
Mission time has to be measured in appropriate
units. Some appropriate units are:
Electronic devices - operating hours.
Light bulbs - operating hours and on-off cycles.
Hydraulic valves - actuations.
Cars and trucks - miles.
Airplanes - hours and up-down cycles.
Others.
2008 RAMS –Paper/Tutorial XXXXX –Duane L. Dietrich PhD 8
Design System 1.0
DesignSystem
1.0
Customer
Requirements and
Specifications
1.1
Operating
Environment
1.3
Mission
Profile andTime
1.2
DesignReviews
1.6
Design FMEAProduct FMEA
1.5
Component
Selection
1.7
DataSystem
1.4
2008 RAMS –Paper/Tutorial XXXXX –Duane L. Dietrich PhD 10
Customer Requirements and Needs, 1.1
Reach a common understanding between buyer andsupplier of reliability expectations early in relationship.
Make reliability a high priority requirement in eachspecification development.
Establish an agreed on mission profile, mission time andoperating environment.
Insure that both buyer and supplier recognize the cost of poor reliability.
Understand that reliability is a long-term goal.
2008 RAMS –Paper/Tutorial XXXXX –Duane L. Dietrich PhD 12
Example Mission Profile, 1.2
The more information provided in the mission
profile that is integrated into the design process,
the more reliable the product.
The following is a hypothetical example of a
mission profile for valve designed to control the
flow of oil from an underwater well head:
12 – Dietrich 2008 AR&MS Tutorial Notes
8/4/2019 Reliability Design Inception
http://slidepdf.com/reader/full/reliability-design-inception 16/34
2008 RAMS –Paper/Tutorial XXXXX –Duane L. Dietrich PhD 13
Example Mission Profile, 1.2 Cont.
1. The oil that flows through the valve is grit laden.
2. The oil temperature is 300 to 350 deg. F.
3. The relative oil pressure is 400 to 450 psi.
4. The oil flows at 100 to 120 ft. per sec.
2008 RAMS –Paper/Tutorial XXXXX –Duane L. Dietrich PhD 15
Example Operating Environment, 1.3 Cont.
The device is a controller for a radar in Alaska.
It is mounted externally to the actual radar and
controls the electric motors that determine the
orientation of the radar.
1. The controller operates in an environment wherethe temperature varies from -60 to 105 deg. F..
2. The relative humidity can vary from 10% to
100%.
2008 RAMS –Paper/Tutorial XXXXX –Duane L. Dietrich PhD 17
Information on the mission profile and operating
environment is best obtained by actual
measurement, but this is not always possible.
Hence, sources such as past history of similar
products and expert opinion may have to be used.
The more accurate the operational data, the morereliable the product will be.
Mission Profile and Operating Environment,
1.2 - 1.3
2008 RAMS –Paper/Tutorial XXXXX –Duane L. Dietrich PhD 14
Example Operating Environment, 1.3
The operating environment is sometimes more
important than the mission profile as it has a greater
effect on device life than mission profile. This is
often the case for electronics. The following
hypothetical example incorporates some of theworst possible operating conditions for an
electronic device.
2008 RAMS –Paper/Tutorial XXXXX –Duane L. Dietrich PhD 16
Example Operating Environment, 1.3 Cont.
3. The controller is subjected to acoustically
generated broad band random vibration and low
frequency sinusoidal vibration.
4. The controller operates in a salt spray and wind
blown snow environment.
2008 RAMS –Paper/Tutorial XXXXX –Duane L. Dietrich PhD 18
A data acquisition system is an integral part
of reliability design. All available in-house
and externally available reliability data
should be used in system design and for
predicting the hazard rate (failure rate)
and/or the reliability of components,
subsystems, or systems.
Reliability Data System 1.4
2008 Annual RELIABILITY and MAINTAINABILITY Symposium Dietrich – 13
8/4/2019 Reliability Design Inception
http://slidepdf.com/reader/full/reliability-design-inception 17/34
2008 RAMS –Paper/Tutorial XXXXX –Duane L. Dietrich PhD 19
Reliability Data System, 1.4 Cont.
In-house reliability lab test reports.
Field service reports on similar products.
Safety analysis reports.
Failure analysis reports.
Manufacturing records.
Quality control records.
Suppliers of quality components.
MIL-HDBK-217, etc.
Others.
2008 RAMS –Paper/Tutorial XXXXX –Duane L. Dietrich PhD 21
FMEA/FMECA, 1.5 Cont.
Failure modes can be described functionally and the
functional system model can be analyzed early in
the design phase of a product or process. Several
software packages are available to aid in conducting
FMEAs, such as the one by ReliaSoft.
2008 RAMS –Paper/Tutorial XXXXX –Duane L. Dietrich PhD 23
Design Review Teams, 1.6 Cont.
Design reviews are different from FMEAs in that they
concentrate on actual physical functionality of the
product.
The primary objectives of design review teams are to
obtain functionally superior and more reliable products
at lower costs.
2008 RAMS –Paper/Tutorial XXXXX –Duane L. Dietrich PhD 20
FMEA is a tool that has been adapted in many
different ways for many different purposes. It can
contribute to improved designs for products and
processes resulting in higher reliability, better
quality, increased safety, and reduced costs.
FMEA/FMECA, 1.5 Cont.
2008 RAMS –Paper/Tutorial XXXXX –Duane L. Dietrich PhD 22
Design Review Teams 1.6
After a subsystem or system is designed the designers
should present the design, with emphasis on why it will
work, to a group of experienced engineers, including
some from the outside
The review team should review the design in concert with
a list of problems that have occurred in previous similar
products.
2008 RAMS –Paper/Tutorial XXXXX –Duane L. Dietrich PhD 24
Since hardware reliability is a function of component
reliabilities and their fitness for the task, component
choice cannot be overemphasized.
The choice is often between standard parts, which just
meet the requirements, or special parts, which
theoretically exceed the requirements but are unproven.
Component Selection, 1.7
14 – Dietrich 2008 AR&MS Tutorial Notes
8/4/2019 Reliability Design Inception
http://slidepdf.com/reader/full/reliability-design-inception 18/34
2008 RAMS –Paper/Tutorial XXXXX –Duane L. Dietrich PhD 25
Component selection should be based primarily on in-house
data on similar components.
If information is not available on past similar components,
derating or over-specification is dictated.
If components are standard parts, estimated failure rates can
sometimes be found in manufacturer's handbooks,
commercial databases, or Mil-Std Handbooks.
Component Selection, 1.7 Cont
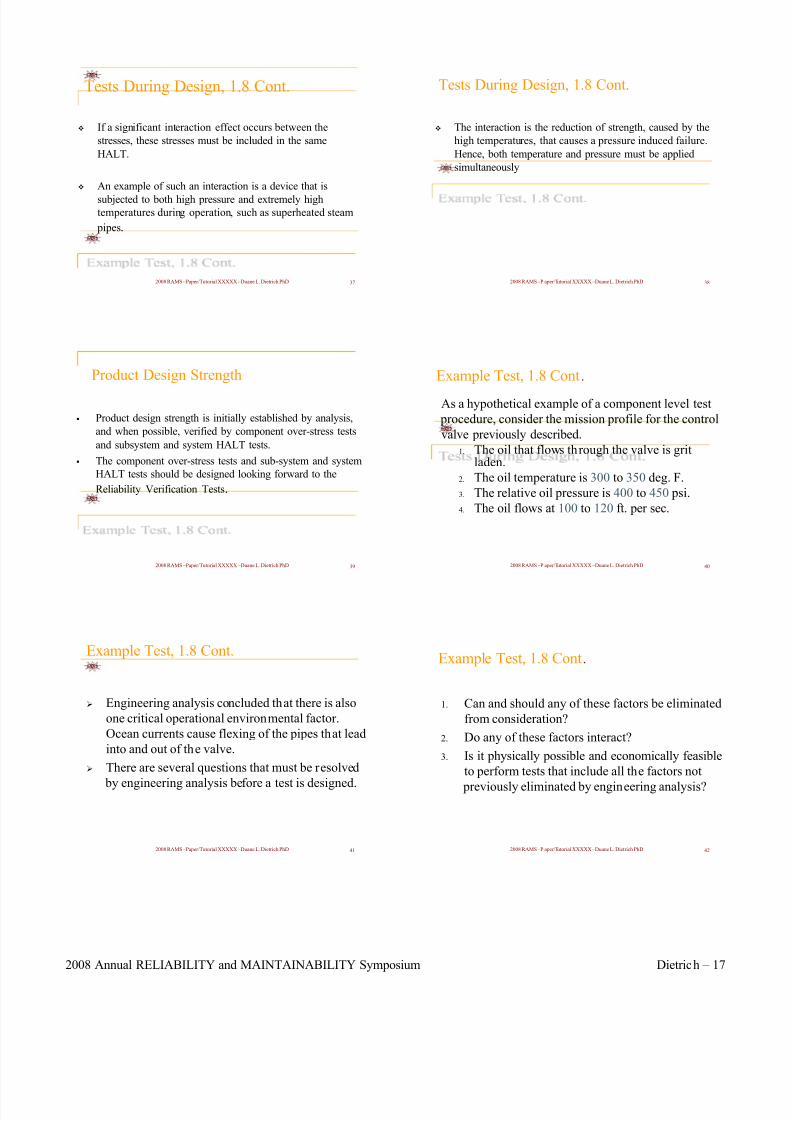
2008 RAMS –Paper/Tutorial XXXXX –Duane L. Dietrich PhD 27
The primary purposes of reliability and reliability
related tests, conducted during the product design
phase, are to:
1. Identify design changes necessary to insure a reliable
product
2. To identify the stress levels necessary to cause failure
(breaking point stress)
3. This latter knowledge is critical when designing the
Accelerated Life Tests (ALTs) that come after design
completion.
Tests During Design, 1.8
2008 RAMS –Paper/Tutorial XXXXX –Duane L. Dietrich PhD 29
There are two primary types of reliability tests used
during the design process. These are:
Subsystem and system Highly Accelerated Life Tests
(HALT),
Component Over-Stress Tests.
These tests are similar in concept, but are performed
at different times in the product design and
consequently have somewhat different objectives.
Types of Tests During Design, 1.8 Cont.
2008 RAMS –Paper/Tutorial XXXXX –Duane L. Dietrich PhD 26
Component Selection, 1.7 Cont.
All critical components and those where problems have
occurred in the past should be subjected to component over-
stress testing.
The location of all components and sub-systems in the box
should be reviewed to insure that the components most likely
to fail are the most accessible.
A high time-to-failure and a low time-to-repair are critical to
high system availability.
2008 RAMS –Paper/Tutorial XXXXX –Duane L. Dietrich PhD 28
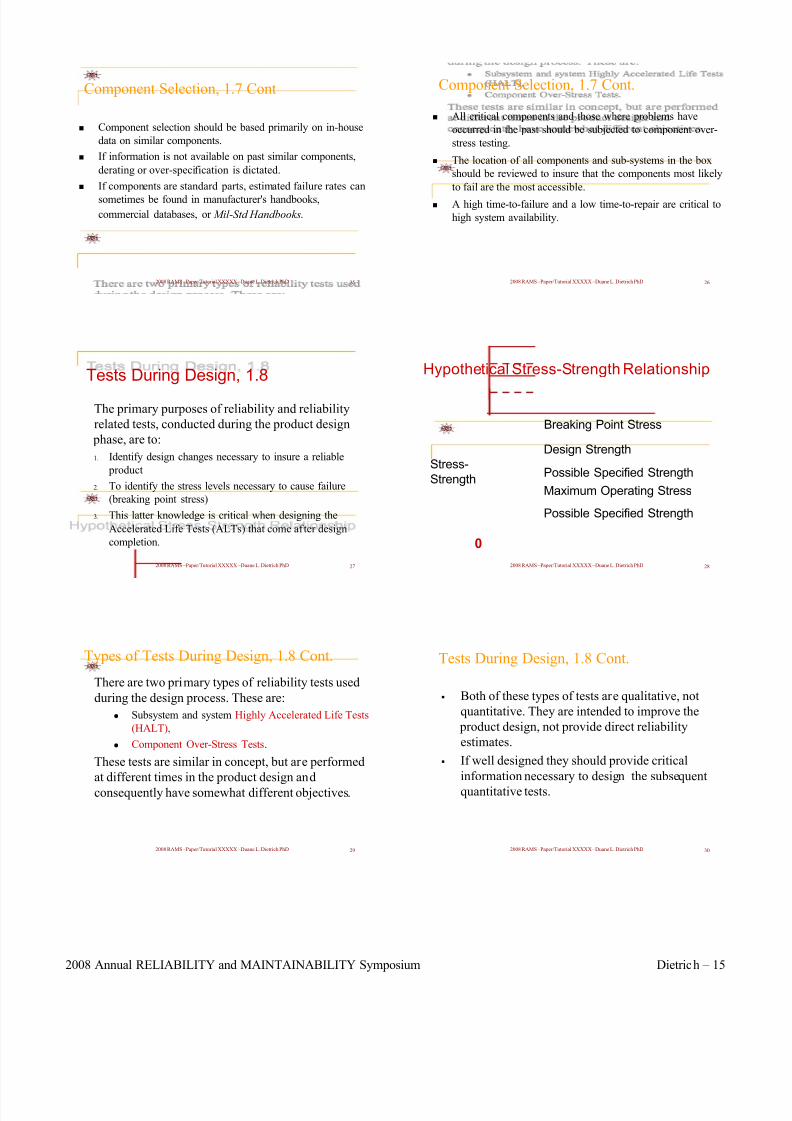
0
Possible Specified Strength
Maximum Operating Stress
Possible Specified Strength
Design Strength
Breaking Point Stress
Stress-
Strength
Hypothetical Stress-Strength Relationship
2008 RAMS –Paper/Tutorial XXXXX –Duane L. Dietrich PhD 30
Both of these types of tests are qualitative, not
quantitative. They are intended to improve the
product design, not provide direct reliability
estimates.
If well designed they should provide critical
information necessary to design the subsequent
quantitative tests.
Tests During Design, 1.8 Cont.
2008 Annual RELIABILITY and MAINTAINABILITY Symposium Dietrich – 15
8/4/2019 Reliability Design Inception
http://slidepdf.com/reader/full/reliability-design-inception 19/34
2008 RAMS –Paper/Tutorial XXXXX –Duane L. Dietrich PhD 31
Component over-stress tests are conducted early
in the design cycle. Hence, they cost less than
subsystem and system level tests and can be run
relatively quickly.
All critical components should be over-stresstested and their strength improved to where it is
considerably above the maximum operating
stress level.
Component Overstress Tests, 1.8 Cont.
2008 RAMS –Paper/Tutorial XXXXX –Duane L. Dietrich PhD 33
Reliability Tests During Design, 1.8 Cont.
After failure occurs, a failure mode analysis should be
conducted.
The pro should be im
changes ver-stress tests and
the subs
The entire process should then be repeated until the product
demonstrates that it meets or exceeds its design strength.
duct design proved to incorporate the
dictated by the results of the o
equent failure mode analysis.
2008 RAMS –Paper/Tutorial XXXXX –Duane L. Dietrich PhD 35
If frequent component failures occur during the HALT,
the components have not been adequately over-stress
tested.
In the author’s opinion, HALT should use step-stress
multi-environment tests, simultaneously incorporating
all the stresses likely to occur in a product’s operation.
Tests During Design, 1.8 Cont.
2008 RAMS –P aper/Tutorial XXXXX –Duane L. Dietrich PhD 32
HALT are conducted at the subsystem and
systems lev ls. Because they occur further alonge
in the product design process, they are more
complex and cost more to conduct than
component over-stress tests.
If all components have been adequately over-stress tested, a HALT should identify only
interface problems such as weak connectors, bad
solder joints, incorrect tolerances and others.
System and Subsystem HALT, 1.8
2008 RAMS –P aper/Tutorial XXXXX –Duane L. Dietrich PhD 34
The first step in designing a HALT, or any other
reliability-related test, is to take time to make sure that
all factors have been considered.
Time and money spent on a thorough test analysis and
design will result in less costly tests that yield more
information critical to a reliable design.
Tests During Design, 1.8 Cont.
2008 RAMS –P aper/Tutorial XXXXX –Duane L. Dietrich PhD 36
However, for complex products subjected to multiple
stresses during operation, this may not be feasible due to
the test complexity, the cost of running the test and the
cost of building the test equipment to perform the test.
In this situation, engineering analysis must determine
which stress factors have to be tested simultaneously
and which can be tested independently.
Tests During Design, 1.8 Cont.
16 – Dietrich 2008 AR&MS Tutorial Notes
8/4/2019 Reliability Design Inception
http://slidepdf.com/reader/full/reliability-design-inception 20/34
2008 RAMS –Paper/Tutorial XXXXX –Duane L. Dietrich PhD 37
If a significant interaction effect occurs between the
stresses, these stresses must be included in the same
HALT.
An example of such an interaction is a device that is
subjected to both high pressure and extremely hightemperatures during operation, such as superheated steam
pipes.
Tests During Design, 1.8 Cont.
2008 RAMS –Paper/Tutorial XXXXX –Duane L. Dietrich PhD 39
Product design strength is initially established by analysis,
and when possible, verified by component over-stress tests
and subsystem and system HALT tests.
The component over-stress tests and sub-system and system
HALT tests should be designed looking forward to the
Reliability Verification Tests.
Product Design Strength
2008 RAMS –Paper/Tutorial XXXXX –Duane L. Dietrich PhD 41
Engineering analysis concluded that there is also
one critical operational environmental factor.
Ocean currents cause flexing of the pipes that lead
into and out of the valve.
There are several questions that must be resolved
by engineering analysis before a test is designed.
Example Test, 1.8 Cont.
2008 RAMS –P aper/Tutorial XXXXX –Duane L. Dietrich PhD 38
The interaction is the reduction of strength, caused by the
high temperatures, that causes a pressure induced failure.
Hence, both temperature and pressure must be applied
simultaneously
Tests During Design, 1.8 Cont.
2008 RAMS –P aper/Tutorial XXXXX –Duane L. Dietrich PhD 40
As a hypothetical example of a component level test
procedure, consider the mission profile for the control
valve previously described.
1. The oil that flows through the valve is gritladen.
2. The oil temperature is 300 to 350 deg. F.
3. The relative oil pressure is 400 to 450 psi.
4. The oil flows at 100 to 120 ft. per sec.
Example Test, 1.8 Cont.
2008 RAMS –P aper/Tutorial XXXXX –Duane L. Dietrich PhD 42
1. Can and should any of these factors be eliminated
from consideration?
2. Do any of these factors interact?
3. Is it physically possible and economically feasible
to perform tests that include all the factors not
previously eliminated by engineering analysis?
Example Test, 1.8 Cont.
2008 Annual RELIABILITY and MAINTAINABILITY Symposium Dietrich – 17
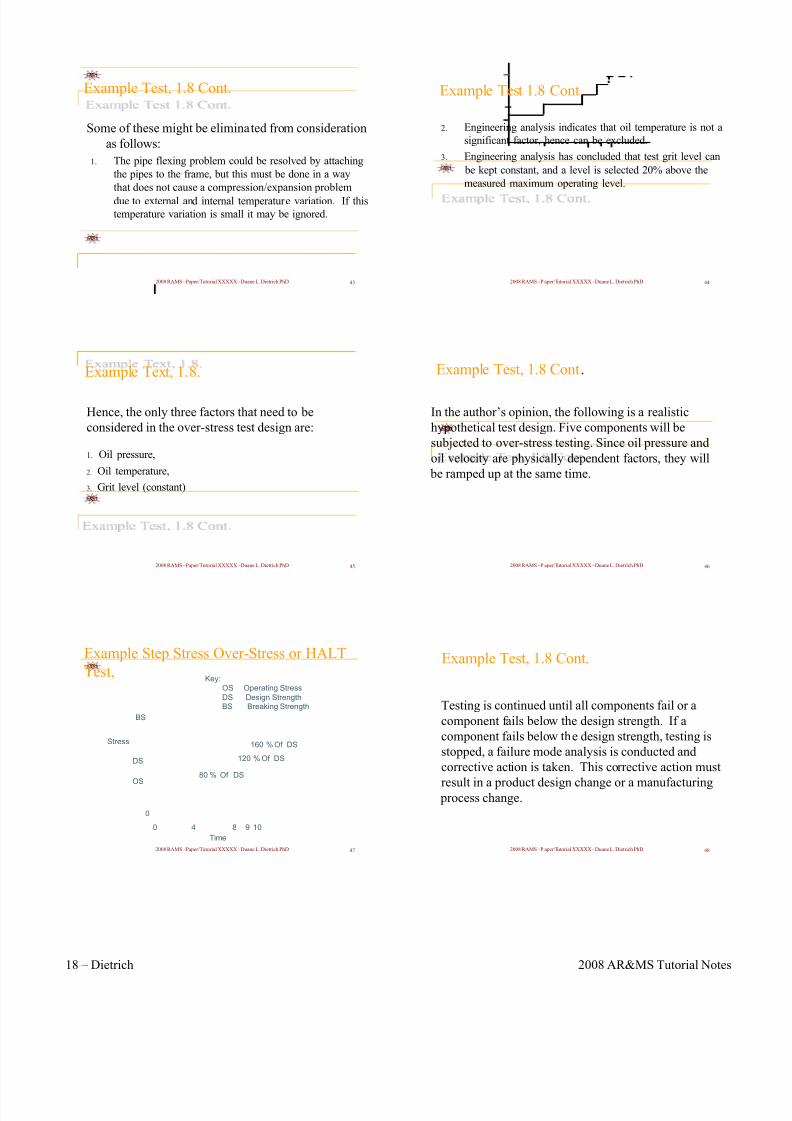
8/4/2019 Reliability Design Inception
http://slidepdf.com/reader/full/reliability-design-inception 21/34
2008 RAMS –Paper/Tutorial XXXXX –Duane L. Dietrich PhD 43
Some of these might be eliminated from consideration
as follows:
1. The pipe flexing problem could be resolved by attaching
the pipes to the frame, but this must be done in a way
that does not cause a compression/expansion problem
due to external and internal temperature variation. If this
temperature variation is small it may be ignored.
Example Test, 1.8 Cont.
2008 RAMS –Paper/Tutorial XXXXX –Duane L. Dietrich PhD 45
Hence, the only three factors that need to be
considered in the over-stress test design are:
1. Oil pressure,
2. Oil temperature,
3. Grit level (constant)
Example Text, 1.8.
2008 RAMS –Paper/Tutorial XXXXX –Duane L. Dietrich PhD 47
Example Step Stress Over-Stress or HALT
Test,
Stress
OS
DS
Key:
OS Operating Stress
DS Design StrengthBS Breaking Strength
Time
90
0
4 8 10
80 % Of DS
120 % Of DS
160 % Of DS
BS
2008 RAMS –P aper/Tutorial XXXXX –Duane L. Dietrich PhD 44
2. Engineering analysis indicates that oil temperature is not a
significant factor, hence can be excluded.
3. Engineering analysis has concluded that test grit level can
be kept constant, and a level is selected 20% above the
measured maximum operating level.
Example Test 1.8 Cont.
2008 RAMS –P aper/Tutorial XXXXX –Duane L. Dietrich PhD 46
In the author’s opinion, the following is a realistic
hypothetical test design. Five components will be
subjected to over-stress testing. Since oil pressure and
oil velocity are physically dependent factors, they will
be ramped up at the same time.
Example Test, 1.8 Cont.
2008 RAMS –P aper/Tutorial XXXXX –Duane L. Dietrich PhD 48
Testing is continued until all components fail or a
component fails below the design strength. If a
component fails below the design strength, testing is
stopped, a failure mode analysis is conducted and
corrective action is taken. This corrective action must
result in a product design change or a manufacturing process change.
Example Test, 1.8 Cont.
18 – Dietrich 2008 AR&MS Tutorial Notes

8/4/2019 Reliability Design Inception
http://slidepdf.com/reader/full/reliability-design-inception 22/34
2008 RAMS –Paper/Tutorial XXXXX –Duane L. Dietrich PhD 49
The test sequence will be repeated with five new
components that incorporate the changes instituted
during corrective action. If all additional failures
occur above the design strength, testing is stopped
and the design is frozen. If no failures have occurredand testing has reached levels of 200% of design
strength, testing is also stopped and the design
frozen.
Example Test, 1.8 Cont.
2008 RAMS –Paper/Tutorial XXXXX –Duane L. Dietrich PhD 51
1. Management must understand and support the effort.
2. Technicians and Engineers must receive training in the
rudiments of applied reliability.
3. An in-house reliability database must be established
that includes failure rates of components, their mission
profile and operating environment.
A Reliability Oriented Design Program (Cont)
2008 RAMS –Paper/Tutorial XXXXX –Duane L. Dietrich PhD 53
A Reliability Oriented Design Program (Cont)
7. Components that need preventive maintenance
should be readily accessible.
8. Component selection should be based primarily on
in-house data on similar components. If information
is not available on past similar components, over-
specification is dictated.
2008 RAMS –P aper/Tutorial XXXXX –Duane L. Dietrich PhD 50
The following is a recommended list of the steps that
should be taken to improve the reliability of products. It
is organized in the sequence that each will occur in the
life of a system. Each of these items should be
converted to detailed instructions and/or actions to meetthe specific needs of a particular system.
A Reliability Oriented Design Program
2008 RAMS –P aper/Tutorial XXXXX –Duane L. Dietrich PhD 52
4. Both subsystem and system designs should be subject to
FMEA.
5. After problems identified in the FMEA are addressed, the
subsystem or system design should be subjected to a
comprehensive design review.
6. To obtain an independent perspective, the review teams
should include members that are not on the design team.
The use of outside experts is usually cost effective.
A Reliability Oriented Design Program
(Cont)
2008 RAMS –P aper/Tutorial XXXXX –Duane L. Dietrich PhD 54
9. All critical components and those where problems haveoccurred in the past should be subjected to over-stresstesting.
10. The location of all components and subsystems in the box should be reviewed to insure that the componentsmost likely to fail are the most accessible. A high time-to-failure and a low time-to-repair are critical to high
system availability.
A Reliability Oriented Design Program
(Cont)
2008 Annual RELIABILITY and MAINTAINABILITY Symposium Dietrich – 19
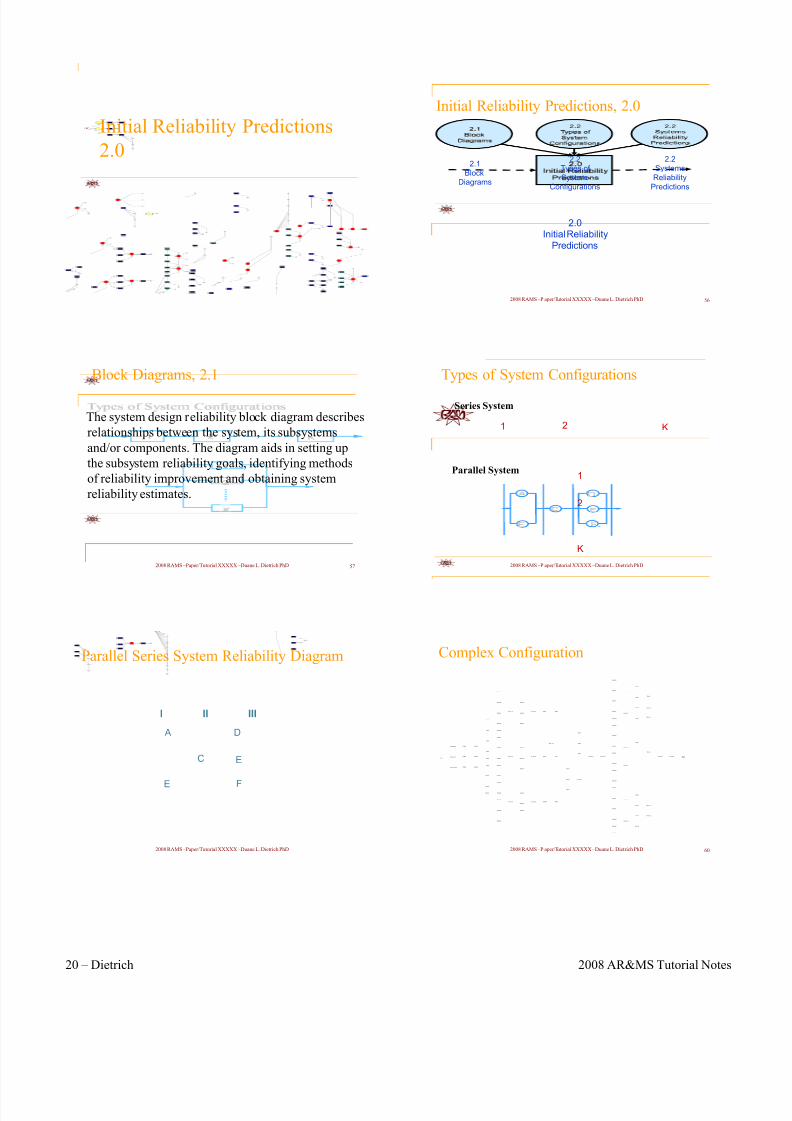
8/4/2019 Reliability Design Inception
http://slidepdf.com/reader/full/reliability-design-inception 23/34
Initial Reliability Predictions
2.0
2008 RAMS –Paper/Tutorial XXXXX –Duane L. Dietrich PhD 57
Block Diagrams, 2.1
The system design reliability block diagram describes
relationships between the system, its subsystems
and/or components. The diagram aids in setting up
the subsystem reliability goals, identifying methods
of reliability improvement and obtaining system
reliability estimates.
2008 RAMS –Paper/Tutorial XXXXX –Duane L. Dietrich PhD
I II III
D
E
F
C
E
A
Parallel Series System Reliability Diagram
2008 RAMS –P aper/Tutorial XXXXX –Duane L. Dietrich PhD 56
Initial Reliability Predictions, 2.0
2.0Initial Reliability
Predictions
2.1
BlockDiagrams
2.2
Systems
Reliability
Predictions
2.2
Types of
System
Configurations
2008 RAMS –P aper/Tutorial XXXXX –Duane L. Dietrich PhD
Series System
Parallel System
1 2 K
2
K
1
Types of System Configurations
2008 RAMS –P aper/Tutorial XXXXX –Duane L. Dietrich PhD 60
Start
Subsystem2
Subsystem3
VCMI-R
VCMI-S
VCMI-T
UCVB-R
UCVB-S
VSVO-R1
VSVO-R2
VSVO-R3
VSVO
VSVO
VSVO
Su b s y s t e m 1
TSVO-RA
TSVO-RB
TSVO-RC
TSVO-RE
TSVO-RD
N o d e 1 /5
TSVO-SA
TSVO-SB
TSVO-SC
TSVO-SD
TSVO-SE
Nod e 1 /5
UCVB-T
VSVO
VSVO
VSVO
TSVO-TA
TSVO-TB
TSVO-TC
TSVO-TD
TSVO-TE
Nod e 1 /5 T BAI-T
Node 1/2
TBAI-R
TBAI-S
VAIC-4
VAIC-5
VAIC-6
VAIC-1
VAIC-2
VAIC-3
N o d e 2 /3
N o d e 2 /3
VAOC-R1
VAOC-R3
VAOC-S1
VAOC-S2
VAOC-S3
VAOC-T1
VAOC-T2
VAOC-T3
N o d e 2 /3
N o d e 2 /3
N o d e 2 /3
VAOC-R2
TBAO-R
TBAO-S
TBAO-TEnd
N o d e 4 /4N o d e 1 /2
VCRC-T6
VCRC-S6
VCRC-R5
VCRC-R6
N o d e 2 /3
TRLY-8
TRLY-10
TRLY-4
N o d e 1 /2
TRLY-6
TRLY -12
Nod e 1 /2
N o d e 1 /2
VCRC-R2
N o d e 2 /3
TRLY-7
TRLY-9
TRLY-1
TRLY -2
TRLY-3
TRLY-5
TRLY-11
VCRC-T5
VCRC-S5
VCRC-R4
VCRC-T4
VCRC-S4
N o d e 2 /3
N o d e 2 /3
N o d e 1 /2
VCRC-S2
VCRC-T2
N o d e 2 /3
N o d e 2 /3
VCRC-R1
VCRC-R3
VCRC-S1
VCRC-T1
VCRC-S3
VCRC-T3
Complex Configuration
20 – Dietrich 2008 AR&MS Tutorial Notes
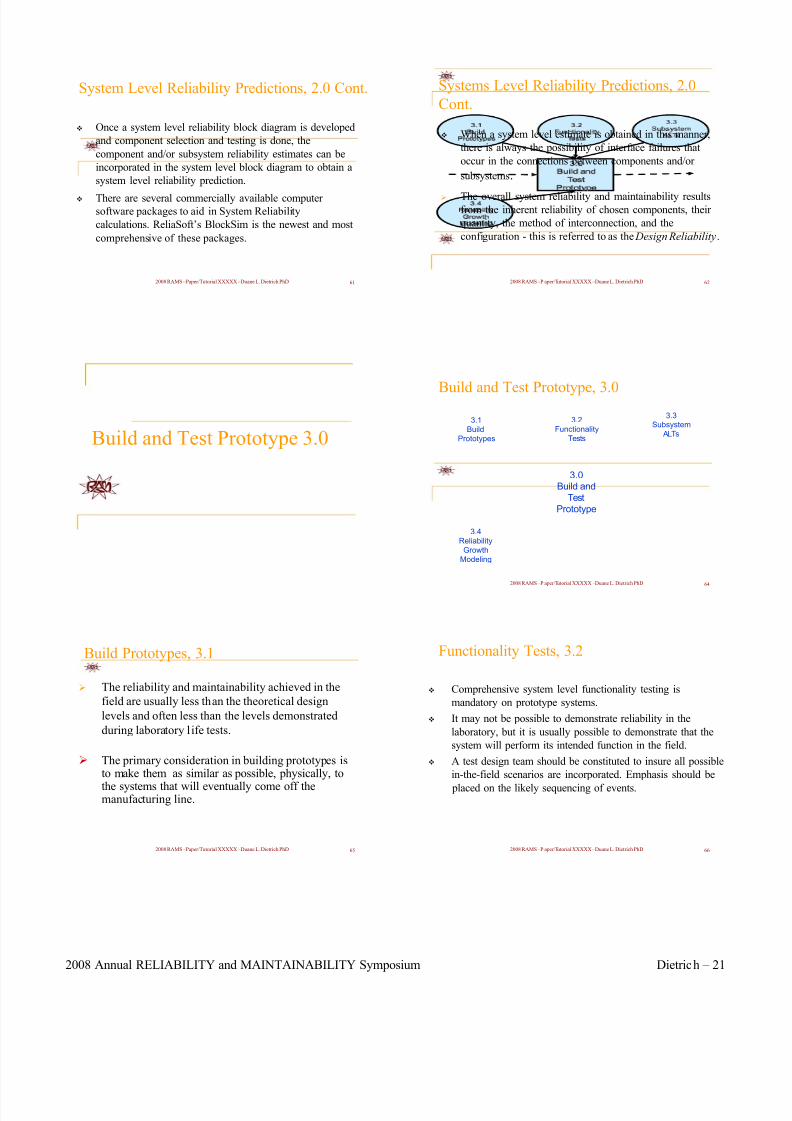
8/4/2019 Reliability Design Inception
http://slidepdf.com/reader/full/reliability-design-inception 24/34
2008 RAMS –Paper/Tutorial XXXXX –Duane L. Dietrich PhD 61
System Level Reliability Predictions, 2.0 Cont.
Once a system level reliability block diagram is developed
and component selection and testing is done, the
component and/or subsystem reliability estimates can be
incorporated in the system level block diagram to obtain a
system level reliability prediction.
There are several commercially available computer software packages to aid in System Reliability
calculations. ReliaSoft’s BlockSim is the newest and most
comprehensive of these packages.
Build and Test Prototype 3.0
2008 RAMS –Paper/Tutorial XXXXX –Duane L. Dietrich PhD 65
Build Prototypes, 3.1
The reliability and maintainability achieved in the
field are usually less than the theoretical design
levels and often less than the levels demonstrated
during laboratory life tests.
The primary consideration in building prototypes isto make them as similar as possible, physically, to
the systems that will eventually come off themanufacturing line.
2008 RAMS –P aper/Tutorial XXXXX –Duane L. Dietrich PhD 62
When a system level estimate is obtained in this manner,
there is always the possibility of interface failures that
occur in the connections between components and/or
subsystems.
The overall system reliability and maintainability resultsfrom the inherent reliability of chosen components, their
quantity, the method of interconnection, and the
configuration - this is referred to as the Design Reliability .
Systems Level Reliability Predictions, 2.0
Cont.
2008 RAMS –P aper/Tutorial XXXXX –Duane L. Dietrich PhD 64
Build and Test Prototype, 3.0
3.2
Functionality
Tests
3.1
Build
Prototypes
3.3Subsystem
ALTs
3.4
Reliability
Growth
Modeling
3.0Build and
Test
Prototype
2008 RAMS –P aper/Tutorial XXXXX –Duane L. Dietrich PhD 66
Comprehensive system level functionality testing is
mandatory on prototype systems.
It may not be possible to demonstrate reliability in the
laboratory, but it is usually possible to demonstrate that the
system will perform its intended function in the field.
A test design team should be constituted to insure all possible
in-the-field scenarios are incorporated. Emphasis should be
placed on the likely sequencing of events.
Functionality Tests, 3.2
2008 Annual RELIABILITY and MAINTAINABILITY Symposium Dietrich – 21
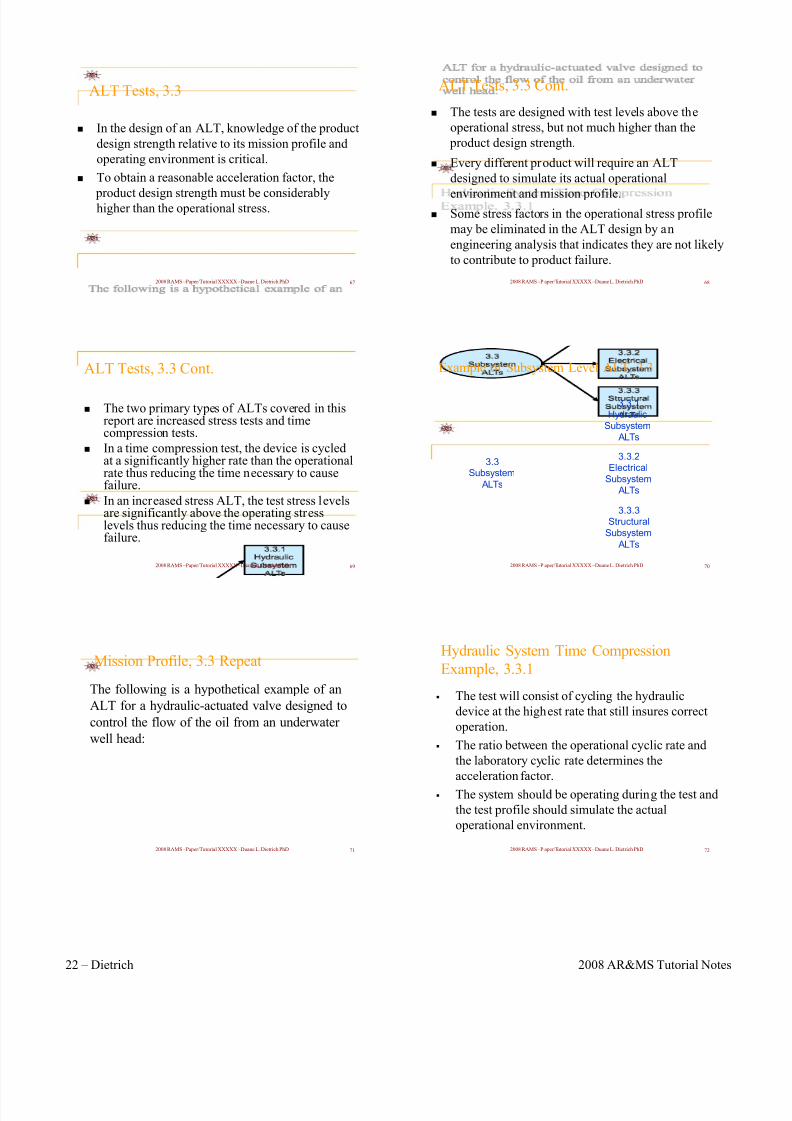
8/4/2019 Reliability Design Inception
http://slidepdf.com/reader/full/reliability-design-inception 25/34
2008 RAMS –Paper/Tutorial XXXXX –Duane L. Dietrich PhD 67
ALT Tests, 3.3
In the design of an ALT, knowledge of the product
design strength relative to its mission profile and
operating environment is critical.
To obtain a reasonable acceleration factor, the
product design strength must be considerablyhigher than the operational stress.
2008 RAMS –Paper/Tutorial XXXXX –Duane L. Dietrich PhD 69
ALT Tests, 3.3 Cont.
The two primary types of ALTs covered in thisreport are increased stress tests and timecompression tests.
In a time compression test, the device is cycledat a significantly higher rate than the operationalrate thus reducing the time necessary to causefailure.
In an increased stress ALT, the test stress levelsare significantly above the operating stresslevels thus reducing the time necessary to causefailure.
2008 RAMS –Paper/Tutorial XXXXX –Duane L. Dietrich PhD 71
Mission Profile, 3.3 Repeat
The following is a hypothetical example of an
ALT for a hydraulic-actuated valve designed to
control the flow of the oil from an underwater
well head:
2008 RAMS –P aper/Tutorial XXXXX –Duane L. Dietrich PhD 68
ALT Tests, 3.3 Cont.
The tests are designed with test levels above the
operational stress, but not much higher than the
product design strength.
Every different product will require an ALT
designed to simulate its actual operational
environment and mission profile. Some stress factors in the operational stress profile
may be eliminated in the ALT design by an
engineering analysis that indicates they are not likely
to contribute to product failure.
2008 RAMS –P aper/Tutorial XXXXX –Duane L. Dietrich PhD 70
3.3.1Hydraulic
Subsystem
ALTs
3.3.2Electrical
Subsystem
ALTs
3.3.3Structural
Subsystem
3.3Subsystem
ALTs
ALTs
Example of Subsystem Level ALT, 3.3
The test will consist of cycling the hydraulic
device at the highest rate that still insures correct
operation.
The ratio between the operational cyclic rate and
the laboratory cyclic rate determines the
acceleration factor.
The system should be operating during the test and
the test profile should simulate the actual
operational environment.
2008 RAMS –P aper/Tutorial XXXXX –Duane L. Dietrich PhD 72
Hydraulic System Time Compression
Example, 3.3.1
22 – Dietrich 2008 AR&MS Tutorial Notes
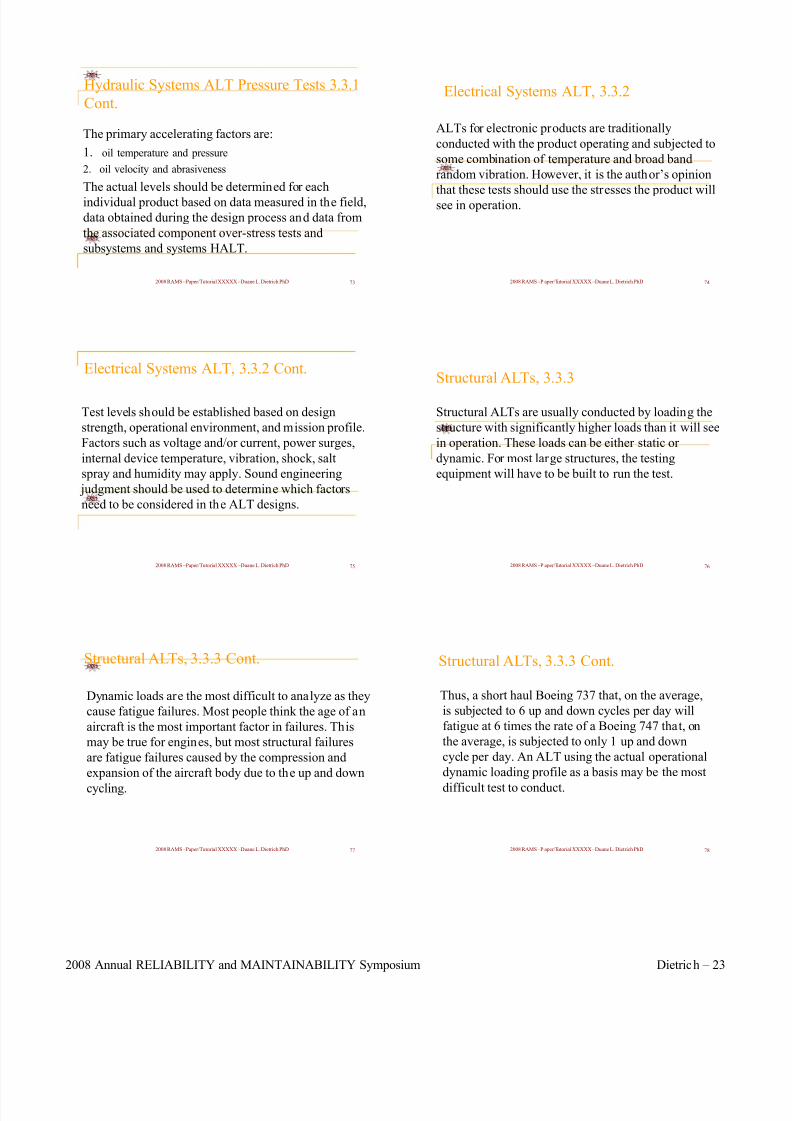
8/4/2019 Reliability Design Inception
http://slidepdf.com/reader/full/reliability-design-inception 26/34
2008 RAMS –Paper/Tutorial XXXXX –Duane L. Dietrich PhD 73
The primary accelerating factors are:
1. oil temperature and pressure
2. oil velocity and abrasiveness
The actual levels should be determined for each
individual product based on data measured in the field,
data obtained during the design process and data from
the associated component over-stress tests and
subsystems and systems HALT.
Hydraulic Systems ALT Pressure Tests 3.3.1
Cont.
2008 RAMS –Paper/Tutorial XXXXX –Duane L. Dietrich PhD 75
Test levels should be established based on design
strength, operational environment, and mission profile.
Factors such as voltage and/or current, power surges,
internal device temperature, vibration, shock, salt
spray and humidity may apply. Sound engineering
judgment should be used to determine which factors
need to be considered in the ALT designs.
Electrical Systems ALT, 3.3.2 Cont.
2008 RAMS –Paper/Tutorial XXXXX –Duane L. Dietrich PhD 77
Dynamic loads are the most difficult to analyze as they
cause fatigue failures. Most people think the age of an
aircraft is the most important factor in failures. This
may be true for engines, but most structural failures
are fatigue failures caused by the compression and
expansion of the aircraft body due to the up and down
cycling.
Structural ALTs, 3.3.3 Cont.
2008 RAMS –P aper/Tutorial XXXXX –Duane L. Dietrich PhD 74
ALTs for electronic products are traditionally
conducted with the product operating and subjected to
some combination of temperature and broad band
random vibration. However, it is the author’s opinion
that these tests should use the stresses the product willsee in operation.
Electrical Systems ALT, 3.3.2
2008 RAMS –P aper/Tutorial XXXXX –Duane L. Dietrich PhD 76
Structural ALTs are usually conducted by loading the
structure with significantly higher loads than it will see
in operation. These loads can be either static or
dynamic. For most large structures, the testing
equipment will have to be built to run the test.
Structural ALTs, 3.3.3
2008 RAMS –P aper/Tutorial XXXXX –Duane L. Dietrich PhD 78
Thus, a short haul Boeing 737 that, on the average,
is subjected to 6 up and down cycles per day will
fatigue at 6 times the rate of a Boeing 747 that, on
the average, is subjected to only 1 up and down
cycle per day. An ALT using the actual operational
dynamic loading profile as a basis may be the most
difficult test to conduct.
Structural ALTs, 3.3.3 Cont.
2008 Annual RELIABILITY and MAINTAINABILITY Symposium Dietrich – 23

8/4/2019 Reliability Design Inception
http://slidepdf.com/reader/full/reliability-design-inception 27/34
2008 RAMS –Paper/Tutorial XXXXX –Duane L. Dietrich PhD 79
Vibration tests for large structures require special
equipment such as thrusters to run. Usually, low
frequency swept sinusoidal vibration is used. The test
levels are set, considerably above the predicted
operational levels, to accelerate time to failure. It isdifficult to obtain reliability prediction information
from these tests.
Structural ALTs, 3.3.3 Cont.
2008 RAMS –Paper/Tutorial XXXXX –Duane L. Dietrich PhD 81
The author is a proponent of multi-level constant stress
ALTs as they provide more information than many
other types. The following is an example of one. There
are software applications available to analyze these
tests, such as ReliaSoft’s ALTA and ALTA PRO.
Multi-Level Constant Stress ALTs
2008 RAMS –Paper/Tutorial XXXXX –Duane L. Dietrich PhD 83
Example of Constant Stress ALT, Cont.
Key:
OS Operating Strength
DS Design Strength
Stress Level 1 OS+..10(DS-OS), 10 Items On Test
Stress Level 2 OS+.50(DS-OS), 6 Items On Test
Stress Level 3 OS+.90 (DS-OS), 4 Items On TestStress Level 4 OS+1.3(DS-OS), 4 Items On Test
2008 RAMS –P aper/Tutorial XXXXX –Duane L. Dietrich PhD 80
Structural ALTs, 3.3.3 Cont.
Consequently, their primary purpose is to insure that
the natural frequency of the structure is not close to
the operational excitation frequency or any of its
harmonics. This problem can be solved by adjusting
the stiffness of the structure, increasing the mass of the structure or adding damping to the structure.
2008 RAMS –P aper/Tutorial XXXXX –Duane L. Dietrich PhD 82
Example of Constant Stress ALT
0
StressLevels
OS
DS
1.
2.
3.
4.
Time
StressLevels
Time
2008 RAMS –P aper/Tutorial XXXXX –Duane L. Dietrich PhD 84
Reliability Growth Definition, 3.4
Reliability growth is defined as the positive
improvement in reliability, mean time before
failures or failure rate.
It can also be defined as the current assessment of
reliability, mean time before failures or failure rate
of a system or subsystem in order to establish trend
data.
24 – Dietrich 2008 AR&MS Tutorial Notes
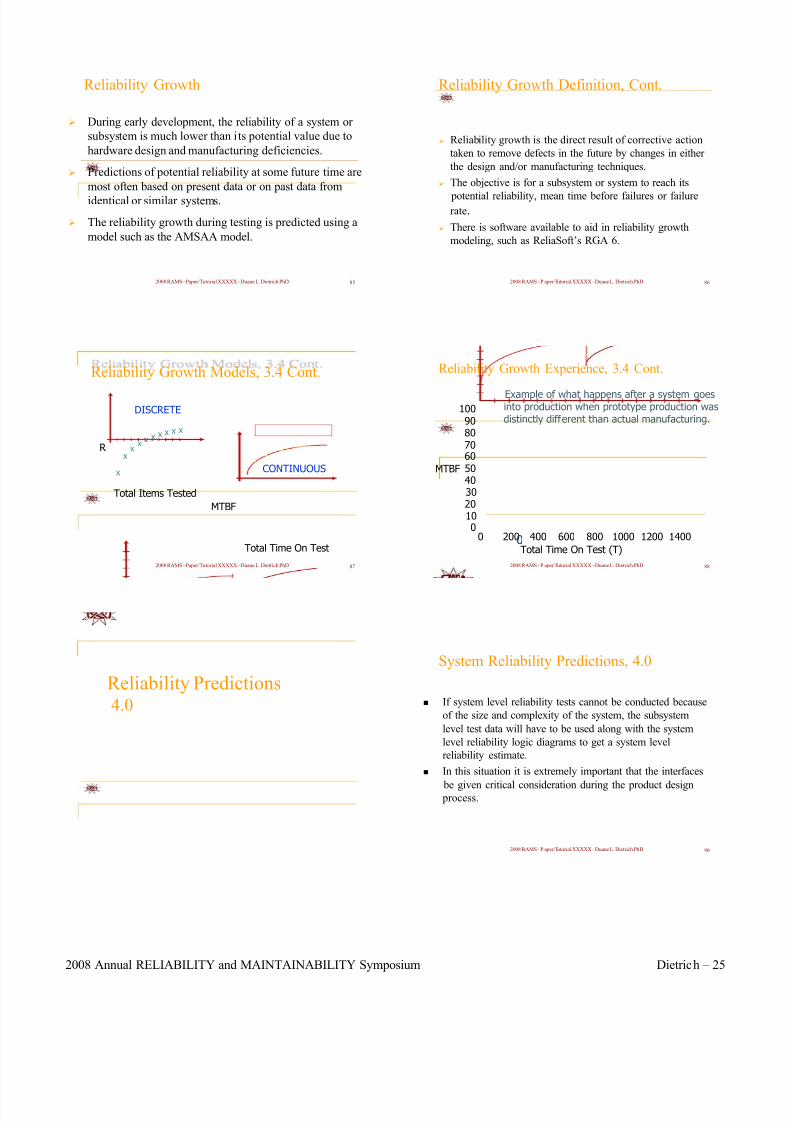
8/4/2019 Reliability Design Inception
http://slidepdf.com/reader/full/reliability-design-inception 28/34
2008 RAMS –Paper/Tutorial XXXXX –Duane L. Dietrich PhD 85
Reliability Growth
During early development, the reliability of a system or
subsystem is much lower than its potential value due to
hardware design and manufacturing deficiencies.
Predictions of potential reliability at some future time are
most often based on present data or on past data from
identical or similar systems.
The reliability growth during testing is predicted using a
model such as the AMSAA model.
2008 RAMS –Paper/Tutorial XXXXX –Duane L. Dietrich PhD 87
Reliability Growth Models, 3.4 Cont.
x
xx
x x x x x x x
Total Items Tested
DISCRETE
R
Total Time On Test
MTBF
CONTINUOUS
Reliability Predictions4.0
2008 RAMS –P aper/Tutorial XXXXX –Duane L. Dietrich PhD 86
Reliability Growth Definition, Cont.
Reliability growth is the direct result of corrective action
taken to remove defects in the future by changes in either
the design and/or manufacturing techniques.
The objective is for a subsystem or system to reach its
potential reliability, mean time before failures or failurerate.
There is software available to aid in reliability growth
modeling, such as ReliaSoft’s RGA 6.
2008 RAMS –P aper/Tutorial XXXXX –Duane L. Dietrich PhD 88
Total Time On Test (T)
MTBF
0102030405060708090
100
0 200 400 600 800 1000 1200 1400
Example of what happens after a system goesinto production when prototype production wasdistinctly different than actual manufacturing.
0
Reliability Growth Experience, 3.4 Cont.
2008 RAMS –P aper/Tutorial XXXXX –Duane L. Dietrich PhD 90
If system level reliability tests cannot be conducted because
of the size and complexity of the system, the subsystem
level test data will have to be used along with the system
level reliability logic diagrams to get a system level
reliability estimate.
In this situation it is extremely important that the interfaces
be given critical consideration during the product design process.
System Reliability Predictions, 4.0
2008 Annual RELIABILITY and MAINTAINABILITY Symposium Dietrich – 25
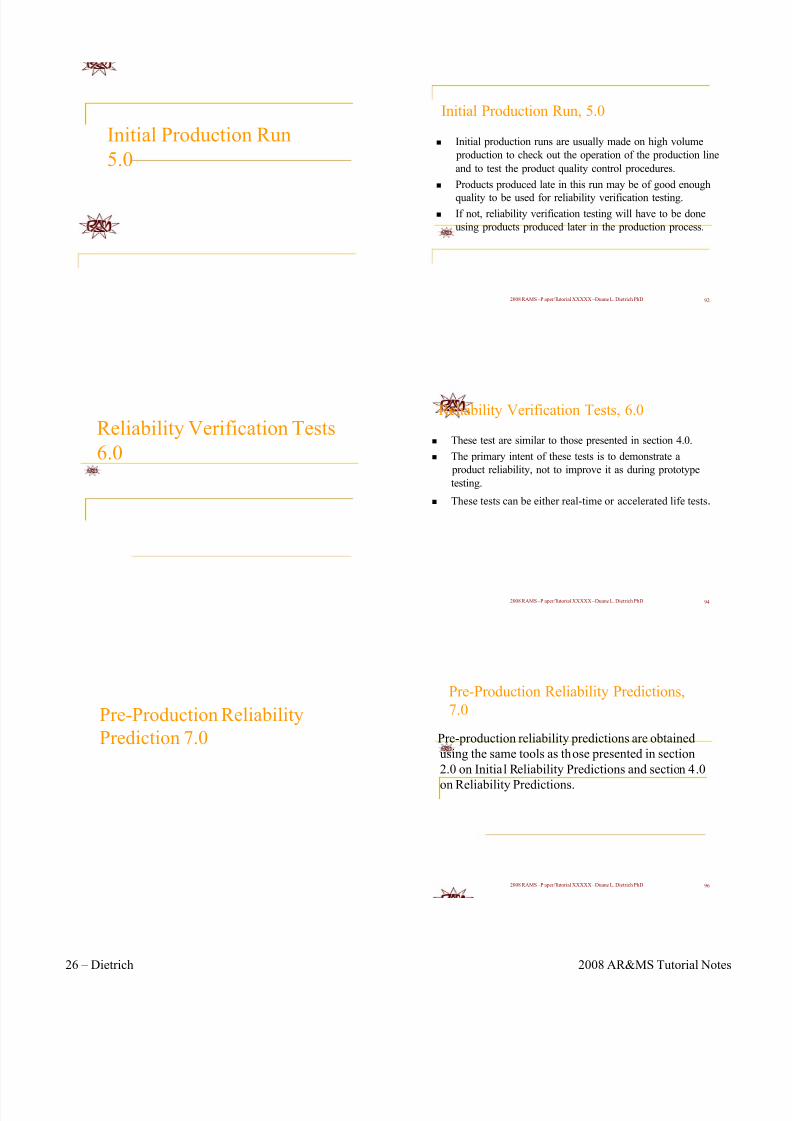
8/4/2019 Reliability Design Inception
http://slidepdf.com/reader/full/reliability-design-inception 29/34
Initial Production Run
5.0
Reliability Verification Tests
6.0
Pre-Production Reliability
Prediction 7.0
2008 RAMS –P aper/Tutorial XXXXX –Duane L. Dietrich PhD 92
Initial Production Run, 5.0
Initial production runs are usually made on high volume
production to check out the operation of the production line
and to test the product quality control procedures.
Products produced late in this run may be of good enough
quality to be used for reliability verification testing.
If not, reliability verification testing will have to be done
using products produced later in the production process.
2008 RAMS –P aper/Tutorial XXXXX –Duane L. Dietrich PhD 94
Reliability Verification Tests, 6.0
These test are similar to those presented in section 4.0.
The primary intent of these tests is to demonstrate a
product reliability, not to improve it as during prototype
testing.
These tests can be either real-time or accelerated life tests.
2008 RAMS –P aper/Tutorial XXXXX –Duane L. Dietrich PhD 96
Pre-Production Reliability Predictions,
7.0
Pre-production reliability predictions are obtained
using the same tools as those presented in section
2.0 on Initial Reliability Predictions and section 4.0
on Reliability Predictions.
26 – Dietrich 2008 AR&MS Tutorial Notes

8/4/2019 Reliability Design Inception
http://slidepdf.com/reader/full/reliability-design-inception 30/34
Production
8.0
2008 RAMS –Paper/Tutorial XXXXX –Duane L. Dietrich PhD 99
Environmental Stress Screen (ESS) and burn-in areometimes confused due to the fact that they both have the
rrence of early failures in the
at ESS is conducted usingaccelerated test conditions, whereas burn-in is conducted
Burn-In, 8.3
ssame goal: reducing the occufield.
The major difference is th
using operating conditions. In some cases an ESS mayinclude stresses not seen in operation.
2008 RAMS –Paper/Tutorial XXXXX –Duane L. Dietrich PhD 101
The Environmental Stress Screen process (ESS)
transforms the latent defects into hard defects thus
facilitating their elimination prior to the product entering
the field.
Different stress environments will detect different types of
latent defects.
Environmental Stress Screen, 8.4
2008 RAMS –P aper/Tutorial XXXXX –Duane L. Dietrich PhD 98
Production, 8.0
8.0Production
8.1
Automatic
Inspection
8.3
Burn-in
8.2
Statistical
Process
Control
8.4
Environmental
Stress
Screening
2008 RAMS –P aper/Tutorial XXXXX –Duane L. Dietrich PhD 100
Defects
Hard defects are those easily found during normal
quality control procedures.
Latent defects are those that can only be found through
the use of stress screening.
2008 RAMS –P aper/Tutorial XXXXX –Duane L. Dietrich PhD 102
Screening can be performed at the component,
subsystem or system level. Components are screened
for a specified duration before being assembled into a
sub-system. Defects introduced during the assembly of
the components into a subsystem are screened at the
subsystem level.
ESS, 8.4 Cont.
2008 Annual RELIABILITY and MAINTAINABILITY Symposium Dietrich – 27

8/4/2019 Reliability Design Inception
http://slidepdf.com/reader/full/reliability-design-inception 31/34
2008 RAMS –Paper/Tutorial XXXXX –Duane L. Dietrich PhD 103
The author prefers an ESS stress level about halfway
between the operating conditions and the design strength.
ESS has an economic advantage over burn-in in that it
detects defects in a much shorter time than burn-in.
In both cases it is important that testing time is sufficient to
detect most of the latent defects, but not long enough to
significantly impact the product’s operational life.
ESS, 8.4 Cont.
2008 RAMS –Paper/Tutorial XXXXX –Duane L. Dietrich PhD 105
It should be emphasized that both ESS and Burn-In are
primarily quality procedures, not reliability procedures.
They improve a product’s reliability by improving the
product’s out-going quality and hence, reliability.
Their intent is to insure that the outgoing product’s
reliability is close to that estimated during the reliability
evaluation tests.
ESS, 8.4 Cont.
2008 RAMS –Paper/Tutorial XXXXX –Duane L. Dietrich PhD 107
Collect and Analyze Field Data, 9.0
9.0Collect and
Analyze
Field Data
9.1
In-house
Data
System
9.3
Reliability
Growth
9.2
Engineering
Changes
2008 RAMS –P aper/Tutorial XXXXX –Duane L. Dietrich PhD 104
Several recognized experts in the field have suggested that
ESS detects only about 90% of the latent defects.
Hence, it is extremely important that as information
becomes available from the quality procedures and the
ESS, the process design is continually upgraded to reduce
the occurrence of all defects.
ESS, 8.4 Cont.
Collect and AnalyzeField Data 9.0
2008 RAMS –P aper/Tutorial XXXXX –Duane L. Dietrich PhD 108
Data System 9.1
All data relevant to any maintenance, repair or re-
design action should be recorded in the in-house
data system for use in the design of future products.
28 – Dietrich 2008 AR&MS Tutorial Notes

8/4/2019 Reliability Design Inception
http://slidepdf.com/reader/full/reliability-design-inception 32/34
2008 RAMS –Paper/Tutorial XXXXX –Duane L. Dietrich PhD 109
Failures that repeatedly occur in the field usually result incomponent upgrades or subsystem redesign.
Before any system, subsystem or component is re-designed
the following should be required:
Engineering Change Orders, 9.2
2008 RAMS –Paper/Tutorial XXXXX –Duane L. Dietrich PhD 111
Number of ECOs Implemented Since Release Date
(Grouped by 5 Weeks )
0
10
20
30
40
50
60
70
80
90
1 6 11 16 21 26 31 36 41 46 51 56 61 66 71 76 81 86ECO Implementation Week
Example of ECOs Implemented, 5 Week
Intervals, 9.2 Cont.
2008 RAMS –Paper/Tutorial XXXXX –Duane L. Dietrich PhD 113
Both FMEAs and Design Reviews should be conducted
on the redesigned component, subsystem or system.
Reliability growth should be monitored for all systems in
the field when design and manufacturing improvements
are continuing to be made.
Reliability Growth, 9.3
2008 RAMS –P aper/Tutorial XXXXX –Duane L. Dietrich PhD 110
Engineering Change Orders, 9.2 Cont.
A detailed description of the mission time,mission profile and operating environment should
be written.
Design specifications should be written thatinclude the concepts discussed in this
presentation. The designer should be prepared to discuss why
he/she thinks the redesign will be reliable.
2008 RAMS –P aper/Tutorial XXXXX –Duane L. Dietrich PhD 112
In the late 1980s, IBM saw a similar trend in one of
its products. Investigation indicated that 80% of all
ECOs were the direct result of previous ECOs.
Engineering Change Orders
2008 RAMS –P aper/Tutorial XXXXX –Duane L. Dietrich PhD 114
Summary
The following is a recommended list of the steps that
should be taken to improve the reliability of products.
Each of these items should be converted to detailed
instructions and/or actions to meet the specific needs
of a particular product.
1. Management must understand and support the effort.
2. Technicians and Engineering must receive training in the
rudiments of applied reliability.
2008 Annual RELIABILITY and MAINTAINABILITY Symposium Dietrich – 29

8/4/2019 Reliability Design Inception
http://slidepdf.com/reader/full/reliability-design-inception 33/34
2008 RAMS –Paper/Tutorial XXXXX –Duane L. Dietrich PhD 115
Summary (Cont.)
3. An in-house reliability data base must be established
that includes failure rates of components, their mission
profile and operating environment.
4. A list of component vendors that have delivered high
quality components in the past should be compiled and
made available to all design teams5. Problems that have occurred on past products should be
documented including successful engineering changes.
This data must be readily available to designers. It is
extremely important that past mistakes not be repeated
in the future.
2008 RAMS –Paper/Tutorial XXXXX –Duane L. Dietrich PhD 117
Summary (Cont.)
9. The location of all components and sub-systems in the
product should be reviewed to insure that the
components most likely to fail are the most accessible.
A high-time to failure and a low-time to repair are
critical to high systems availability.
10. Components that need preventive maintenance should
also be readily accessible.
11. Both sub-system and system designs should be subject
to FMEA.
2008 RAMS –Paper/Tutorial XXXXX –Duane L. Dietrich PhD 119
Summary (Cont.)
14. After a prototype tool is produced, a group of experienced
engineers, including some from outside the organization,
should review the product in concert with the list of
previous problems.
15. Comprehensive systems level functionality testing is
mandatory on the prototype products. It may not be possible
to demonstrate reliability in the laboratory, but it is possible
to demonstrate that the product will perform its intended
function in the field. The design of these tests is critical. A
test design team should be constituted to insure that all
possible in-the-field scenarios are incorporated.
2008 RAMS –P aper/Tutorial XXXXX –Duane L. Dietrich PhD 116
Summary (Cont.)
6. Resources must be committed to reliability early in a
product’s developmental cycle.
7. Component selection should be based primarily on in-
house data on similar components. If information is not
available on past similar components over-specification
is dictated8. All critical components and those where problems have
occurred in the past should be subjected to accelerated
environment and/or time compression reliability
demonstration testing.
2008 RAMS –P aper/Tutorial XXXXX –Duane L. Dietrich PhD 118
Summary (Cont.)
12. After problems identified in the FMEA are addressed,the sub-system or system design should be subjected to
a comprehensive design review. To obtain an
independent perspective, the review teams should
include members that are not on the design team. The
use of outside experts may be cost effective.
13. Where possible, sub-systems should be subjected to
accelerated life reliability demonstration testing.
Comprehensive sub-system functionality testing should
always be done.
2008 RAMS –P aper/Tutorial XXXXX –Duane L. Dietrich PhD 120
Summary (Cont.)
16. Initially, all products should be Burn-In-tested prior toshipping. This test should be similar to thefunctionality tests, but shorter in duration.
17. An inspection procedure should be established andapplied to all production tools. The assurance of consistent high quality is mandatory.
18. Field service technicians and engineers should receivecomprehensive training on product operation,
preventive maintenance and corrective maintenance.
Inspection and operating procedures must be in place toinsure that improperly performed maintenance does notresult in reliability problems. A small oversight by afield service technician or engineer, while performingin-field maintenance, can result in huge losses.
30 – Dietrich 2008 AR&MS Tutorial Notes
8/4/2019 Reliability Design Inception
http://slidepdf.com/reader/full/reliability-design-inception 34/34
2008 RAMS –Paper/Tutorial XXXXX –Duane L. Dietrich PhD 121
Summary (Cont.)
19. Once the product is in the field, detailed data collection
is paramount. Actual time to failure data should be
recorded to minimize warrantee costs, provide
information for design changes in the present tool and
to facilit of reliabi
When a lure occ iew
ate the design le future tools
20. significant fai urs, a design rev teamshould be instituted to review the present design to
determine what action is mandated.
2008 RAMS –P aper/Tutorial XXXXX –Duane L. Dietrich PhD 122
Summary (Cont.)
21. Once the product is in the field, detailed data collection
is paramount. Actual time to failure data should be
recorded to minimize warrantee costs, provide
information for design changes in the present tool and
to facilitate the design of reliable future tools.
22. All engineer change orders should be reviewed by a
design review team before implemented. If the change
is at the sub-system level, an FMEA is also
recommended.
23. Data on the performance of all engineering changes
should be recorded for future use.
Related Documents