1 Ch 10 The Rational Consumer A rational consumer means a consumer who knows what he or she wants and makes the most of the available opportunities. In this chapter, we will analyze the decisions of a rational consumer and show you how to derive the market demand curve based on this decision. Utility: Getting Satisfaction When we analyze consumer behavior, we assume each individual is trying to maximize his/her utility - some personal measure of the satisfaction gained from consuming goods or services. Utility is a subjective measure, it depends on individual taste. Therefore, if two people consume exactly the same amount of the same good, they gain different utility (satisfaction) from it. Utility and Consumption Utility depends on everything the individual consumes. The set of all the goods and services an individual consumes is called the individual’s consumption bundle. Utility function – the relation between an individual’s consumption bundle and the total amount of utility it generates. EX: a person consumes a slice of pizza and one can of potatoe, his utility function is: U=U(a slice of pizza, one can of potatoe) The concept of a utility function is a way of representing the fact that people must make choices to maximize their satisfaction and that they make those choices in a rational way.

Welcome message from author
This document is posted to help you gain knowledge. Please leave a comment to let me know what you think about it! Share it to your friends and learn new things together.
Transcript
1
Ch 10 The Rational Consumer
A rational consumer means a consumer who knows what he or she wants and makes the most of the
available opportunities. In this chapter, we will analyze the decisions of a rational consumer and show you
how to derive the market demand curve based on this decision.
Utility: Getting Satisfaction
When we analyze consumer behavior, we assume each individual is trying to maximize his/her utility - some
personal measure of the satisfaction gained from consuming goods or services.
Utility is a subjective measure, it depends on individual taste. Therefore, if two people consume exactly the
same amount of the same good, they gain different utility (satisfaction) from it.
Utility and Consumption
Utility depends on everything the individual consumes. The set of all the goods and services an individual
consumes is called the individual’s consumption bundle.
Utility function – the relation between an individual’s consumption bundle and the total amount of utility it
generates. EX: a person consumes a slice of pizza and one can of potatoe, his utility function is:
U=U(a slice of pizza, one can of potatoe)
The concept of a utility function is a way of representing the fact that people must make choices to
maximize their satisfaction and that they make those choices in a rational way.
2
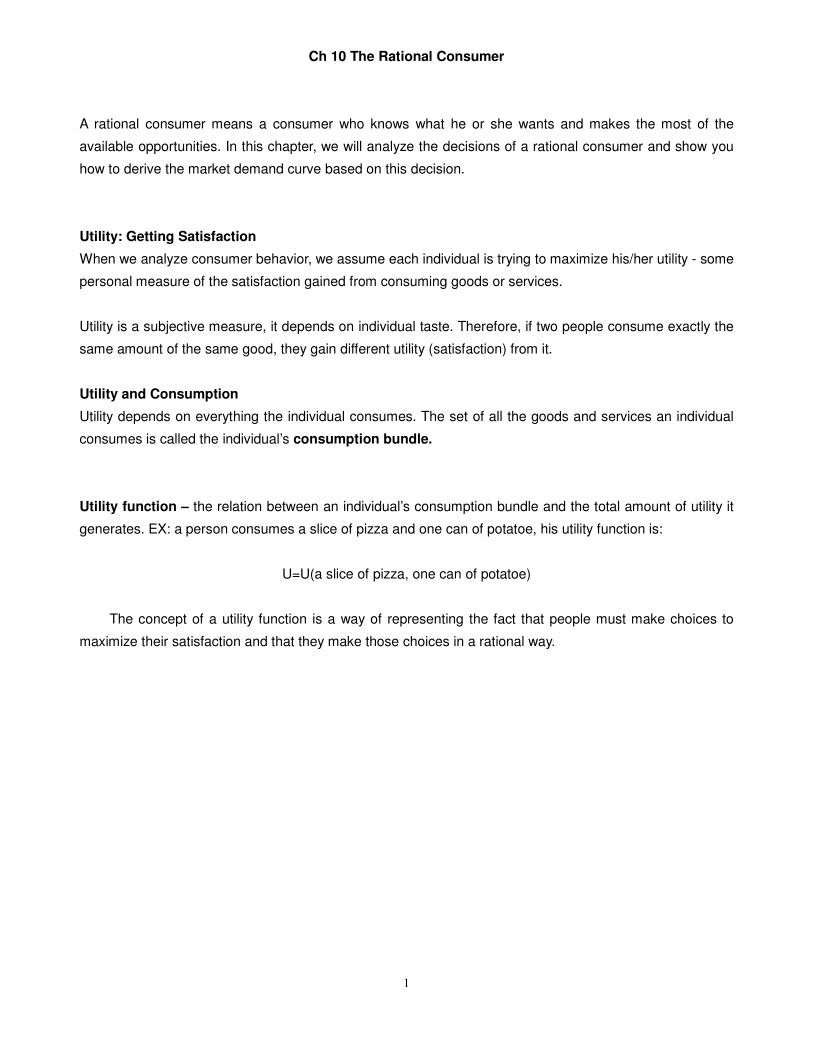
EX: Utility function of eating fried clams
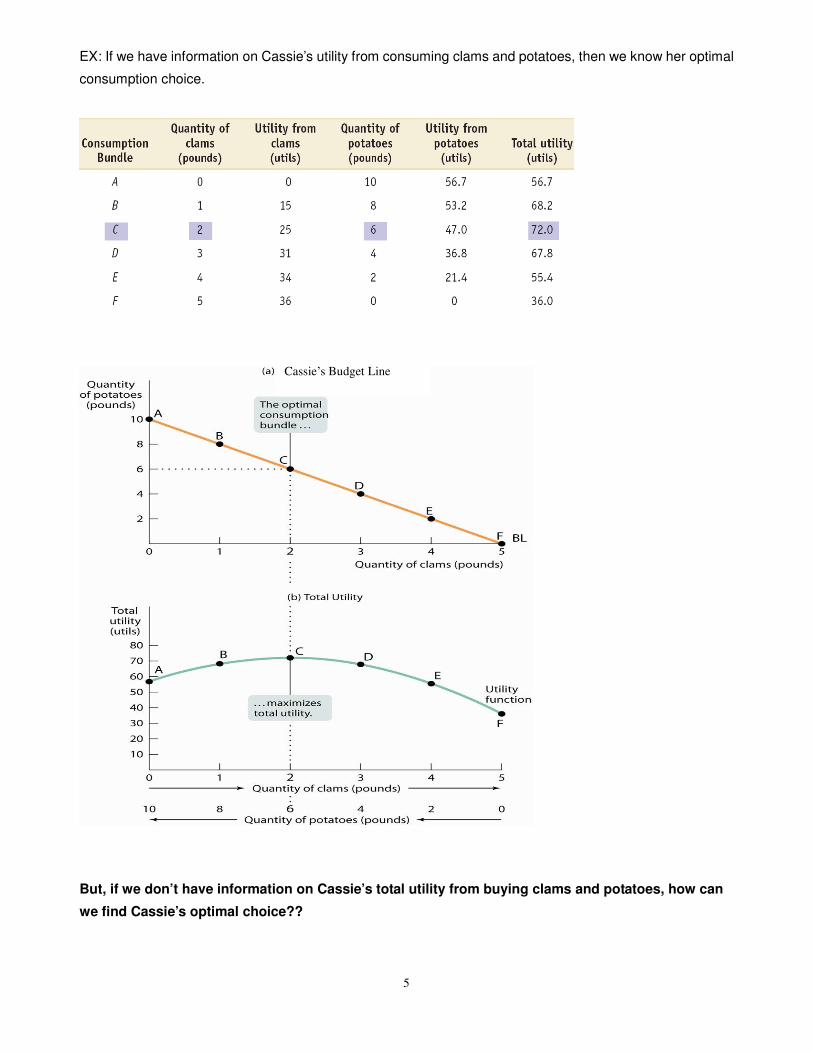
Cassie’s utility function is an upward sloping curve before the 8th clams. This means in this range, there is a
positive relation between utility and the number of clams she eats. After the 8th clam, the utility function
becomes downward sloping. This means eating more than 8 clams is too much. Therefore, if Cassie is a
rational consumer, she wont eat more than 8 clams.
The Principle of Diminishing Marginal Utility
When Cassie decides how many clams to eat, she will make decisions based on her “Marginal Utility” -
The change in total utility from consuming one more clam. If consuming an additional clam decreases
her total utility, she will stop at that point. In our example, the MU becomes negative at the 8th clam. This
means Cassie will choose to eat 8 clams. He wont eat the 9th clam even the 9th clam is free.
We see that the marginal utility curve is downward sloping. This means the marginal utility decreases as
Cassie eats more clams. Similar to the law of demand, it is generally accepted that marginal curves is
downward sloping, so we call this principle of diminishing marginal utility (each additional satisfaction
a consumer gets from one more unit of a good or service declines as the amount of that good or
service consumed rises.)
3
Budgets and Optimal Consumption
The money that consumers have to spend is limited. Therefore, when making consumption choices,
consumers take costs into account.
Budget Constraints and Budget Lines
Suppose Cassie has a weekly income of $20 and she likes both clams and potatoes Let’s assume more of
either good is better than less and clams cost $4 per pound and potatoes cost $2 per pound. What are her
possible choices?
We know whatever her choice is, she cannot spend more than her income. Therefore, we know
The money spent on clams + the money spent on potatoes <= total weekly income
We call this equation Cassie’s budget constraint.
The set of all Cassie’s affordable consumption bundles is her consumption possibilities. The consumption
possibilities depend on Cassie’s income and the price of the good. We know the price of a clam and a can of
potatoe, we can rewrite Cassie’s budget constraint as:
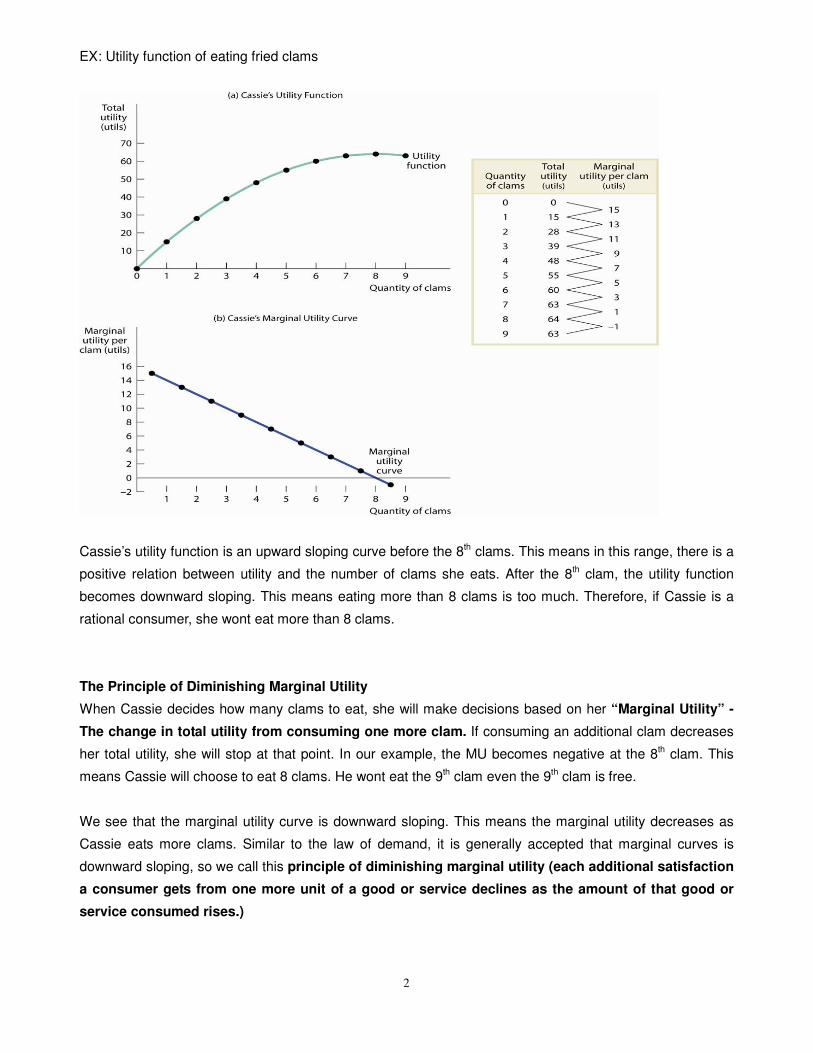
$4×Quantity of clams + $2×quantity of potatoes <= 20
We can put Cassie’s budget line on the graph:
Budget line: it shows all the consumption bundles available to Cassie when she spends all of her income.
Consumption bundles inside and on the budget line are affordable.
4
Will Cassie consume inside the budget line?
No, because she gets utility from consuming both goods and the more the better. So, under the assumption
that she doesn’t get satisfaction from saving her money, she will always choose the bundles on the budget
line.
The slope of the budget line
It measures how much of the other good must be given up in order to consume one more unit of one good.
Therefore it measures the opportunity cost of buying an additional unit of one good.
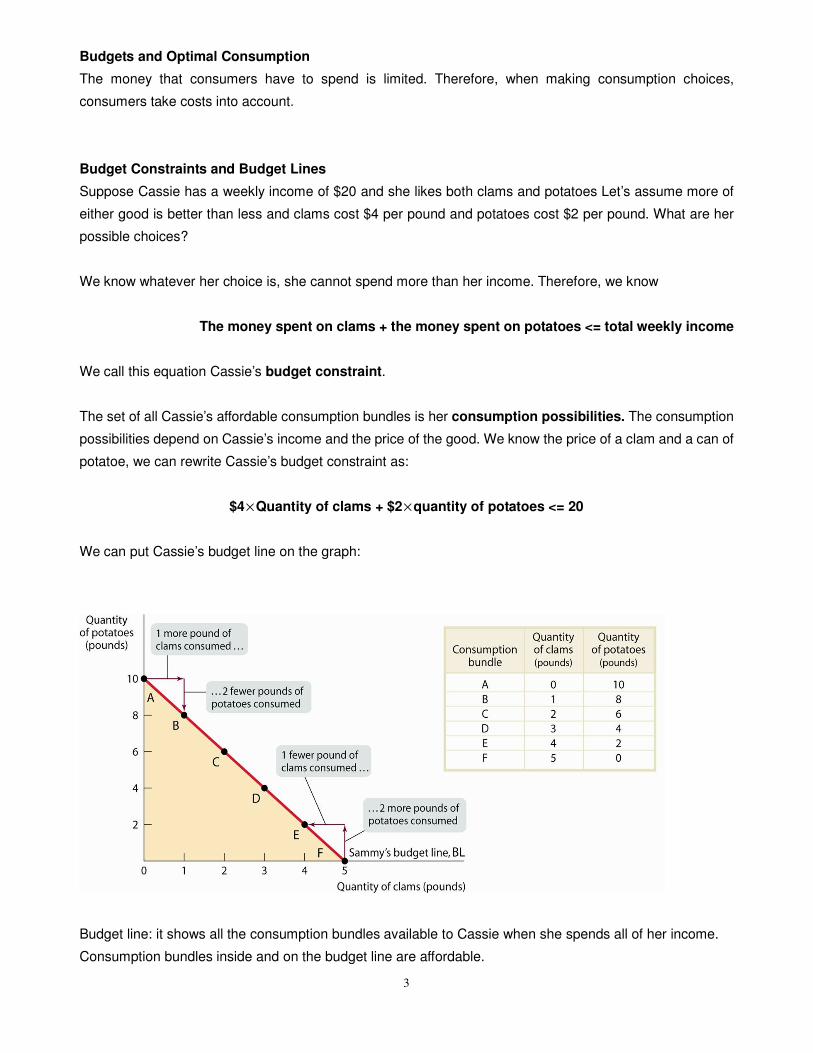
The slope of the budget line depends on the price of the goods. We call the slope of the budget line the
relative price, the relative price of one clam in terms of potatoes. In our example, the slope is -2, meaning
buying one more pound of clams, Cassie has to give up 2 pounds of potatoes.
How far out the budget line is from the origin depends on the consumer’s income.
Optimal Consumption Choice
Now we know Cassie faces a budget constraint and she will choose her consumption bundle on the budget
line. But which one will she choose? She will choose the one that bring her maximum total utility.
Optimal consumption choice: the consumption bundle that maximizes total utility given the budget
constraint.
5
EX: If we have information on Cassie’s utility from consuming clams and potatoes, then we know her optimal
consumption choice.
But, if we don’t have information on Cassie’s total utility from buying clams and potatoes, how can
we find Cassie’s optimal choice??
Cassie’s Budget Line
6
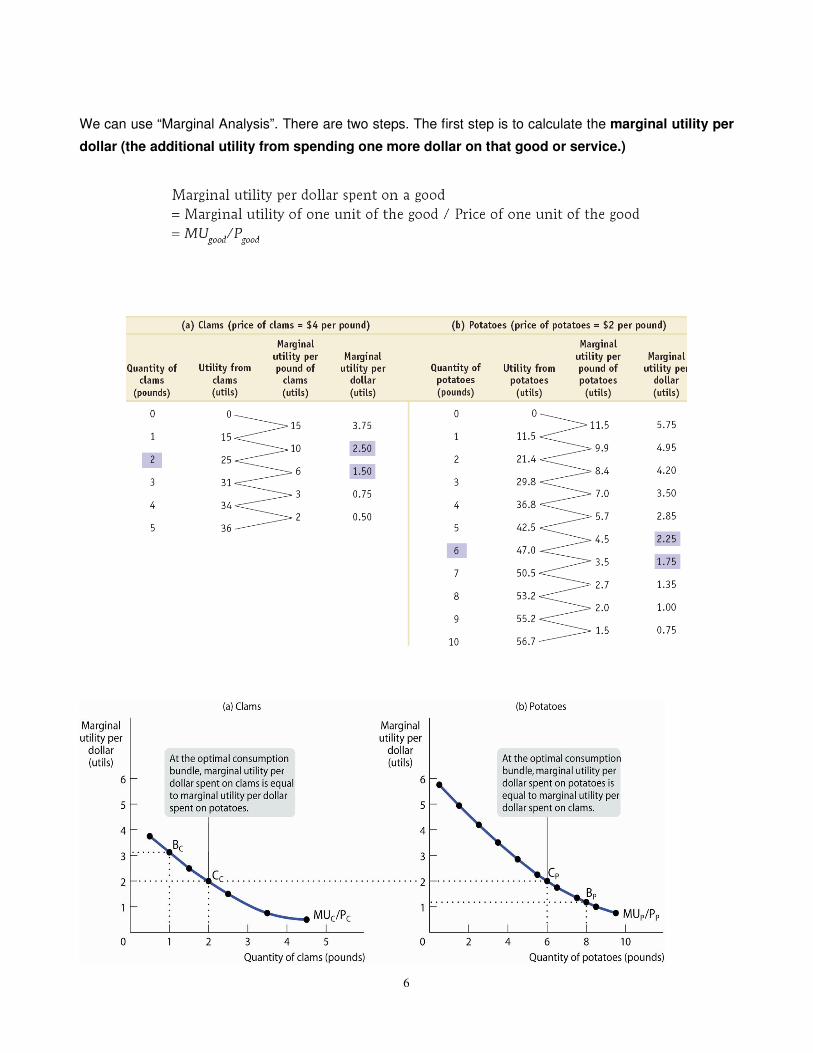
We can use “Marginal Analysis”. There are two steps. The first step is to calculate the marginal utility per
dollar (the additional utility from spending one more dollar on that good or service.)
7
Since MU of clams decreases when the quantity of clams she consumes increases, MU per dollar also
decreases with the quantity of clams.
Optimal Consumption
We know Cassie’s optimal choice is bundle C. At the optimal consumption choice, C, the MU per dollar
spent on clams and potatoes are the same (c
c
p
p
P
MU
P
MU> =2). Why? Let’s consider:
� If c
c
p
p
P
MU
P
MU< , she will spend one dollar more on clams and one dollar less on potatoes because
doing this can bring her more utility (since she spends the same amount of money, she still stays
within her budget.)
� EX: Consider the bundle B (she buys one clam and 8 potatoes). MU per dollar on clam is
3.125 (i.e., (3.75+2.5)/2) and MU per dollar on potatoes is 1.175 (i.e., (1.35+1)/2). Because
per dollar on clam is higher than per dollar on potatoes, reallocating her consumption toward
clams and away from potatoes can raise her TU.
� c
c
p
p
P
MU
P
MU> , she will spend one dollar less on clams and one dollar more on potatoes; she will
reallocate her consumption toward potatoes and away from clams. EX: Consider the bundle D.
� c
c
p
p
P
MU
P
MU= , the consumption bundle maximize her TU, and this is her optimal consumption
choice.
If we have more than two goods to consume, the rule to find the optimal consumption choice will be the
same. For example, if we have L goods. The optimal consumption choice will satisfy:
L
L
P
MU
P
MU
P
MU=== ......
2
2
1
1
8
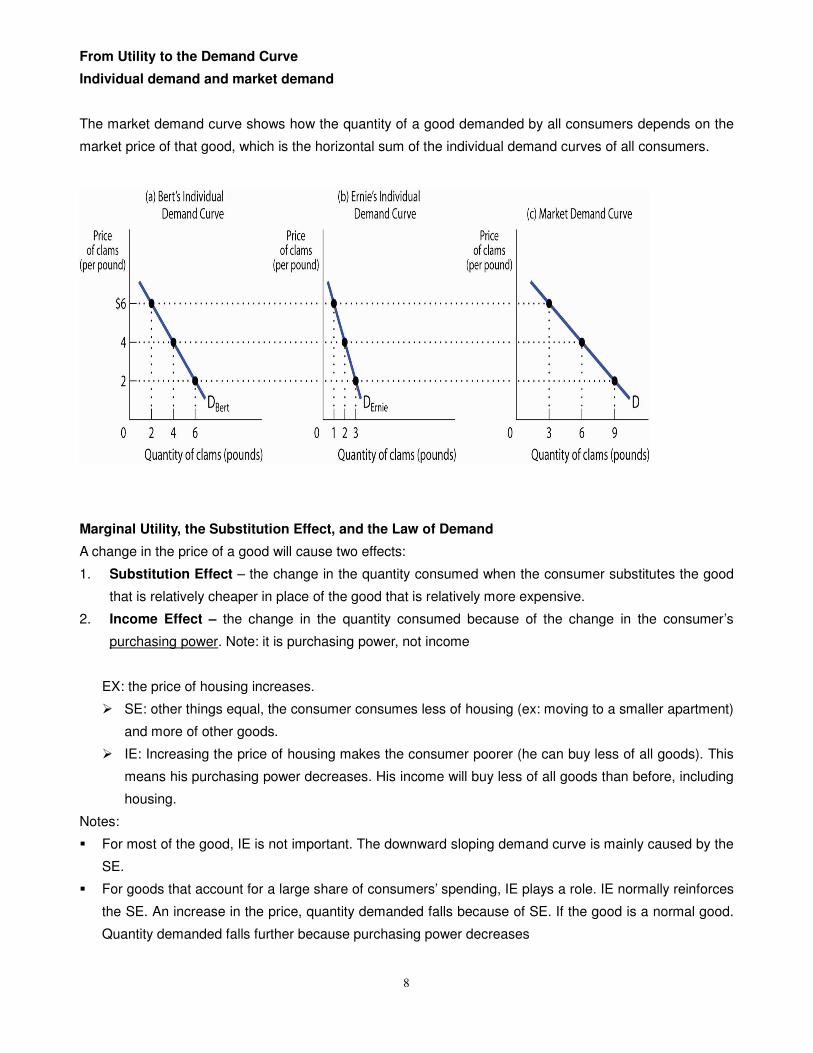
From Utility to the Demand Curve
Individual demand and market demand
The market demand curve shows how the quantity of a good demanded by all consumers depends on the
market price of that good, which is the horizontal sum of the individual demand curves of all consumers.
Marginal Utility, the Substitution Effect, and the Law of Demand
A change in the price of a good will cause two effects:
1. Substitution Effect – the change in the quantity consumed when the consumer substitutes the good
that is relatively cheaper in place of the good that is relatively more expensive.
2. Income Effect – the change in the quantity consumed because of the change in the consumer’s
purchasing power. Note: it is purchasing power, not income
EX: the price of housing increases.
� SE: other things equal, the consumer consumes less of housing (ex: moving to a smaller apartment)
and more of other goods.
� IE: Increasing the price of housing makes the consumer poorer (he can buy less of all goods). This
means his purchasing power decreases. His income will buy less of all goods than before, including
housing.
Notes:
� For most of the good, IE is not important. The downward sloping demand curve is mainly caused by the
SE.
� For goods that account for a large share of consumers’ spending, IE plays a role. IE normally reinforces
the SE. An increase in the price, quantity demanded falls because of SE. If the good is a normal good.
Quantity demanded falls further because purchasing power decreases
9
Practice Questions:
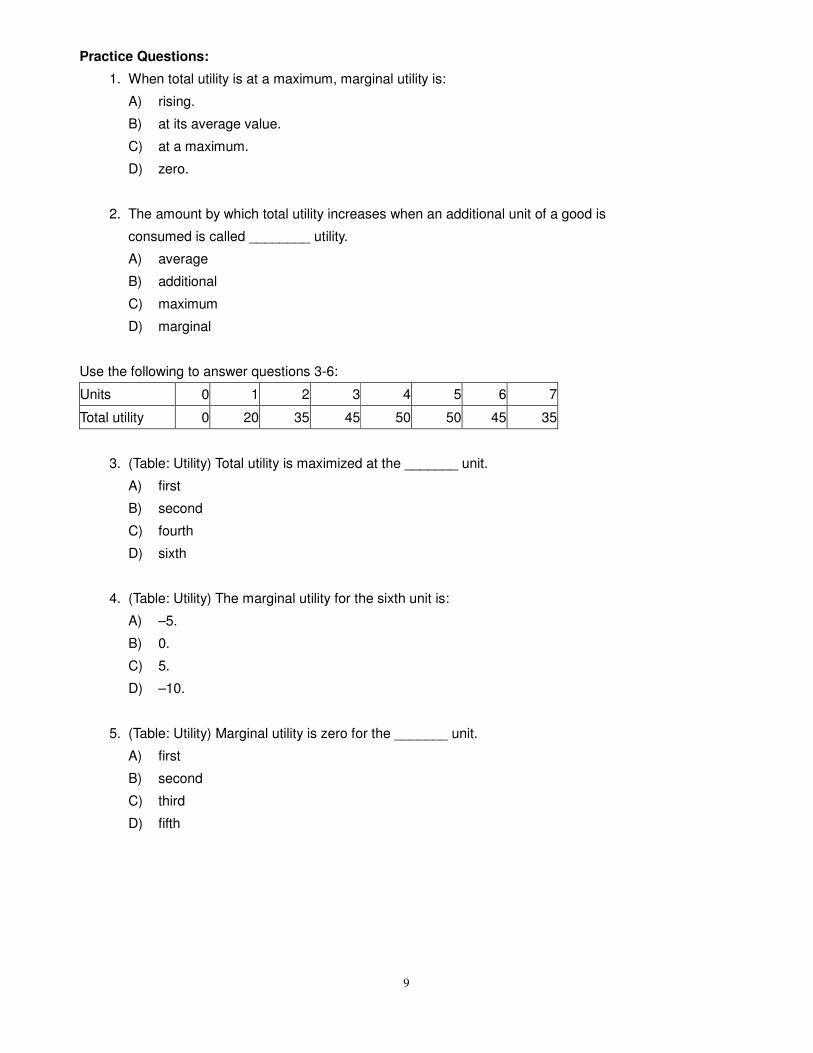
1. When total utility is at a maximum, marginal utility is:
A) rising.
B) at its average value.
C) at a maximum.
D) zero.
2. The amount by which total utility increases when an additional unit of a good is
consumed is called ________ utility.
A) average
B) additional
C) maximum
D) marginal
Use the following to answer questions 3-6:
Units 0 1 2 3 4 5 6 7
Total utility 0 20 35 45 50 50 45 35
3. (Table: Utility) Total utility is maximized at the _______ unit.
A) first
B) second
C) fourth
D) sixth
4. (Table: Utility) The marginal utility for the sixth unit is:
A) –5.
B) 0.
C) 5.
D) –10.
5. (Table: Utility) Marginal utility is zero for the _______ unit.
A) first
B) second
C) third
D) fifth
10
6. (Table: Utility) The marginal utility for the second unit is:
A) 35.
B) 15.
C) 10.
D) 5.
7. Assume that the marginal utilities for the first 3 units of a good consumed are 200, 150,
and 125, respectively. The total utility when 2 units are consumed is:
A) 150.
B) 200.
C) 350.
D) 475.
8. Which of the following statements is true because of the principle of diminishing
marginal utility?
A) When a customer continues to eat more pie at the Pie Palace, each additional
piece of pie gives a larger amount of marginal utility.
B) When a customer continues to eat more pie at the Pie Palace, each additional
piece of pie gives a smaller amount of marginal utility.
C) The marginal utility of a piece of pie is maximized when the total utility of pie is
zero.
D) The total utility of pie is at a maximum while the marginal utility of pie is still
increasing.
9. Which of the following is(are) true?
A) A budget constraint limits what a poor consumer can spend, but there is no similar
constraint on rich people.
B) Utility maximization requires seeking the greatest utility from a given budget.
C) In consumer choice theory, we assume all goods and services are inferior.
D) All of the above are true.
Use the following to answer questions 10-13:
Tom is trying to decide how to allocate his $50 budget for CD purchases and DVD rentals when the price of a
CD is $10 and the price of a DVD rental is $5.
11
10. Which of the following combinations of CD purchases and DVD rentals lie outside Tom's
budget line? (Tom cannot afford this combination.)
A) 5 CDs and 10 DVDs
B) 5 CDs and 0 DVDs
C) 0 CDs and 5 DVDs
D) 2 CDs and 5 DVDs
11. Which of the following combinations of CD purchases and DVD rentals lie on Tom's budget line?
A) 5 CDs and 10 DVDs
B) 5 CDs and 0 DVDs
C) 0 CDs and 5 DVDs
D) 10 CDs and 5 DVDs
12. (Exhibit: Budget Constraint) Which of the following combinations of CD purchases and
DVD rentals lie inside Tom's budget line? (Tom can afford this combination, but he will
not be spending the entire $50.)
A) 5 CDs and 10 DVDs
B) 5 CDs and 0 DVDs
C) 0 CDs and 5 DVDs
D) 10 CDs and 5 DVDs
13. (Exhibit: Budget Constraint) If we measure CD purchases on the horizontal axis and
DVD rentals on the vertical axis, the slope of Tom's budget line is:
A) –10.
B) –5.
C) –2.
D) –1/2.
14. An increase in the consumer's income will do all of the following, except:
A) shift the budget line away from the origin.
B) increase the horizontal intercept.
C) increase the vertical intercept.
D) change the slope of the budget line.
12
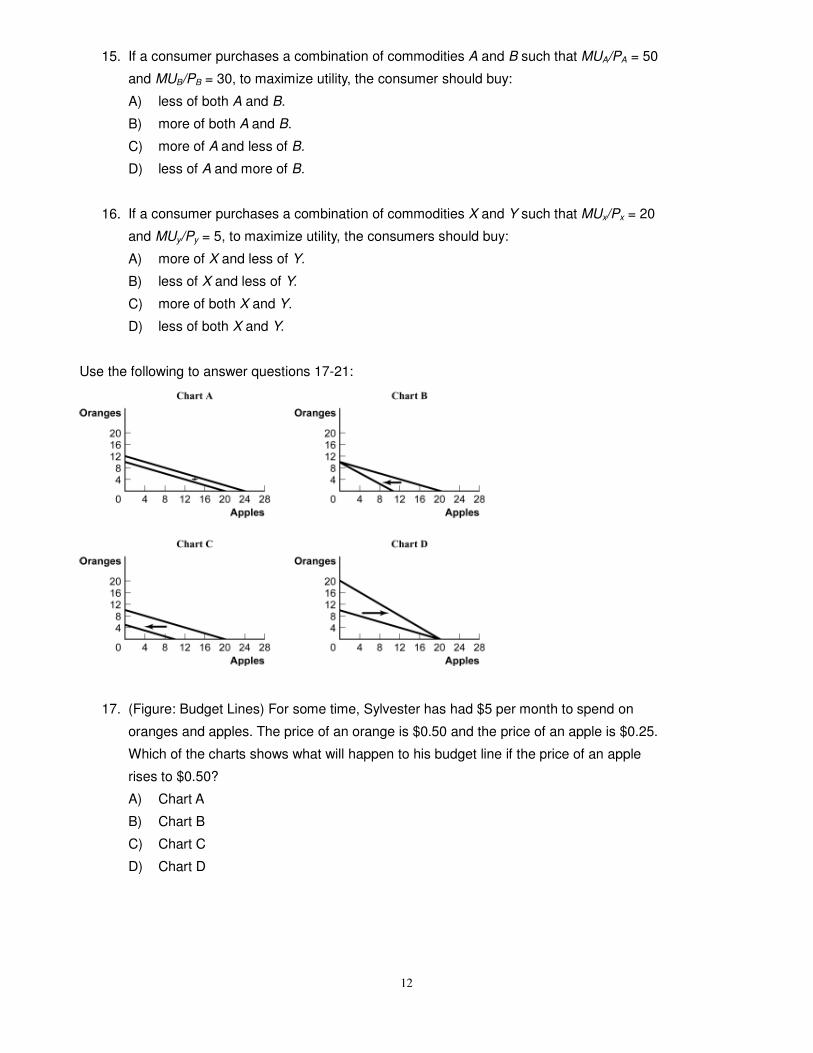
15. If a consumer purchases a combination of commodities A and B such that MUA/PA = 50
and MUB/PB = 30, to maximize utility, the consumer should buy:
A) less of both A and B.
B) more of both A and B.
C) more of A and less of B.
D) less of A and more of B.
16. If a consumer purchases a combination of commodities X and Y such that MUx/Px = 20
and MUy/Py = 5, to maximize utility, the consumers should buy:
A) more of X and less of Y.
B) less of X and less of Y.
C) more of both X and Y.
D) less of both X and Y.
Use the following to answer questions 17-21:
17. (Figure: Budget Lines) For some time, Sylvester has had $5 per month to spend on
oranges and apples. The price of an orange is $0.50 and the price of an apple is $0.25.
Which of the charts shows what will happen to his budget line if the price of an apple
rises to $0.50?
A) Chart A
B) Chart B
C) Chart C
D) Chart D
13
18. (Figure: Budget Lines) For some time, Sylvester has had $5 per month to spend on
oranges and apples. The price of an orange is $0.50 and the price of an apple is $0.25.
Which of the charts shows what will happen to his budget line if the price of an orange
falls to $0.25?
A) Chart A
B) Chart B
C) Chart C
D) Chart D
19. (Figure: Budget Lines) For some time, Sylvester has had $5 per month to spend on
oranges and apples. The price of an orange is $0.50 and the price of an apple is $0.25.
Which of the charts shows what will happen to his budget line if his income and the
prices of the two goods fall by one-half?
A) Chart A
B) Chart B
C) Chart C
D) none of the above
20. (Figure: Budget Lines) For some time, Sylvester has had $5 per month to spend on
oranges and apples. The price of an orange is $0.50 and the price of an apple is $0.25.
Which of the charts shows what will happen to his budget line if his income decreases to
$2.50?
A) Chart A
B) Chart B
C) Chart C
D) Chart D
21. (Figure: Budget Lines) For some time, Sylvester has had $5 per month to spend on
oranges and apples. The price of an orange is $0.50 and the price of an apple is $0.25.
Which of the charts shows what will happen to his budget line if his income and the
prices of the two goods double?
A) Chart A
B) Chart B
C) Chart C
D) none of the above
14
22. If a consumer buys more of good X and less of good Y, the _______ of good X will
_______, and the ________ of good Y will _______.
A) marginal utility; fall; marginal utility; rise
B) marginal utility; rise; marginal utility; fall
C) total utility; fall; marginal utility; rise
D) marginal utility; rise; total utility; rise
23. How much utility is gained by spending an additional dollar on good X?
A) It is the average utility of good X divided by the price of good X.
B) MUx/Px
C) TUx/Px
D) None of the above is correct.
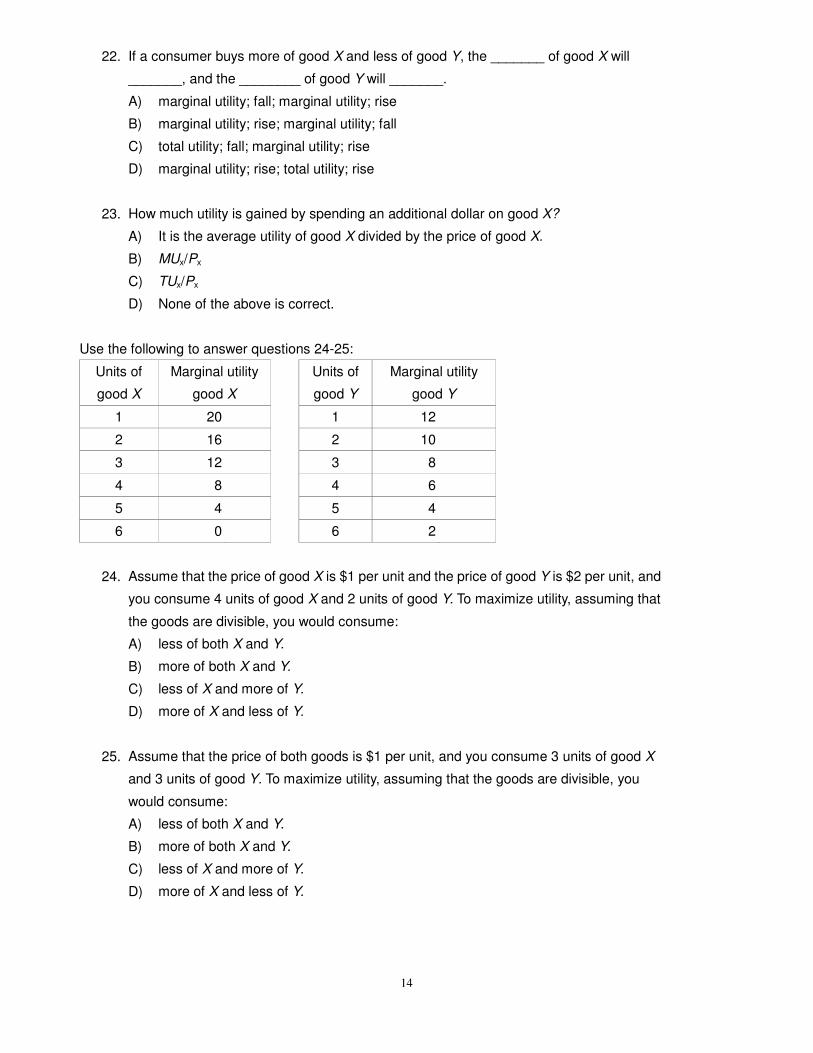
Use the following to answer questions 24-25:
Units of
good X
Marginal utility
good X
Units of
good Y
Marginal utility
good Y
1 20 1 12
2 16 2 10
3 12 3 8
4 8 4 6
5 4 5 4
6 0 6 2
24. Assume that the price of good X is $1 per unit and the price of good Y is $2 per unit, and
you consume 4 units of good X and 2 units of good Y. To maximize utility, assuming that
the goods are divisible, you would consume:
A) less of both X and Y.
B) more of both X and Y.
C) less of X and more of Y.
D) more of X and less of Y.
25. Assume that the price of both goods is $1 per unit, and you consume 3 units of good X
and 3 units of good Y. To maximize utility, assuming that the goods are divisible, you
would consume:
A) less of both X and Y.
B) more of both X and Y.
C) less of X and more of Y.
D) more of X and less of Y.
15
26. If, for a particular consumer, the marginal utility of ties is greater than the marginal utility
of shirts, this consumer should:
A) buy more ties and fewer shirts.
B) buy more shirts and fewer ties.
C) buy the same amount of each.
D) not do anything until more information is available.
27. If a consumer derives more utility by spending an additional $1 on good X rather than on
good Y, then:
A) MUx/Px > MUy/Py.
B) MUx/Px = MUy/Py.
C) MUx/Px < MUy/Py.
D) Px/MUx > Py/MUy.
28. Sally Garcia devotes all of her income to the consumption of two goods, apples and
Reese's Peanut Butter Cups. She has just discovered that at her current level of
consumption the marginal utility of an apple is 6 and the marginal utility of a Reese's
Peanut Butter Cup is 8. Suppose the price of an apple is $0.20, while the price of a
Reese's Peanut Butter Cup is $0.25. To maximize her total utility, assuming that the
goods are divisible, she would:
A) consume more Reese's Butter Cups and fewer apples.
B) consume less of both goods.
C) consume more apples and fewer Reese's Butter Cups.
D) There is not enough information to justify a change in her current level of
consumption.
29. Assume that a person is consuming the utility-maximizing quantities of pork and
chicken. We can conclude that:
A) the price of pork equals the price of chicken.
B) the marginal utility of pork equals the marginal utility of chicken.
C) the ratio of the marginal utility to price is the same for pork and for chicken.
D) both A and B are true.
16
30. John Smedley, a careful maximizer of utility, consumes only two goods, peanut butter
and broccoli. He had just achieved the utility-maximizing solution in his consumption of
the two goods when the price of broccoli rose. As he adjusts to this event, he will
consume:
A) more peanut butter and less broccoli.
B) less peanut butter and less broccoli.
C) more peanut butter and more broccoli.
D) less peanut butter and more broccoli.
31. John Smedley, a careful maximizer of utility, consumes only two goods, peanut butter
and ice cream. He had just achieved the utility-maximizing solution in his consumption
of the two goods when the price of ice cream fell. As he adjusts to this event, he will
consume:
A) more peanut butter and more ice cream.
B) less peanut butter and less ice cream.
C) more peanut butter and less ice cream.
D) less peanut butter and more ice cream.
32. If the price of a good falls and the consumer decides to buy more of the good solely
because it is relatively less expensive, this describes the:
A) income effect.
B) substitution effect.
C) consumer surplus effect.
D) marginal-maximizing rule.
33. Assume that as the price of cauliflower falls, the income effect causes consumers to buy
less cauliflower. We can conclude that cauliflower is:
A) an inferior good.
B) nasty tasting.
C) a normal good.
D) expensive.
34. Market demand is found by:
A) adding individual quantities demanded at each price.
B) adding individual prices at each quantity demanded.
C) multiplying individual quantities demanded at each price.
D) multiplying individual prices at each quantity demanded.
17
35. When the price of an inferior good falls, the substitution effect contributes to a(n)
_______ in the quantity demanded and the income effect _______ the substitution
effect.
A) decrease; reinforces
B) increase; reinforces
C) increase; opposes
D) decrease; opposes
36. According to the substitution effect, a decrease in the price of a product leads to an
increase in the quantity of the product demanded because buyers:
A) have more real income.
B) purchase fewer substitute goods.
C) purchase more of the now relatively less expensive good.
D) purchase more complementary goods.
37. The income effect refers to:
A) changes in income because of changes in business investment.
B) changes in money or nominal income because of changes in wages.
C) a change in the quantity demanded of a good because of an implicit change in the
buyer's income caused by a change in the price of a good or service.
D) a change in the quantity demanded of a good because of a change in the buyer's
money income.
38. Xavier notices that the marginal utility of working with a tutor seems to fall with each
hour the tutor helps him study. If Xavier keeps the tutor until his grade actually begins to
fall, his marginal utility will be:
A) negative.
B) positive, but rising more slowly.
C) zero.
D) immeasurable.
39. The principle of diminishing marginal utility means that when Sarah eats pizza, her
satisfaction from the second slice of pizza is probably:
A) greater than that from the first.
B) equal to that from the first.
C) less than that from the first.
D) not comparable to that from the first.
18
40. Austin spends all his income on food (F) and shelter (S). His budget line is given by the
equation 5F + 20S = 100. Which of the following consumption bundles is part of his
consumption possibilities?
A) 8 units of F and 3 unit of S
B) 12 units of F and 2 units of S
C) 0 units of F and 5 units of S
D) all of the above
Use the following to answer question 41:
Clams (price of clams = $3 per pound) Potatoes (price of potatoes = $1 per pound)
Quantity
of clams
Utility from
clams
Marginal
utility per
pound of
clam
Marginal
utility per
dollar
Quantity
of
potatoes
Utility from
potatoes
Marginal
utility per
pound of
potatoes
Marginal
utility per
dollar
0 0 0 0
15 5 11.5 11.5
1 15 1 11.5
10 3.33 9.9 9.9
2 25 2 21.4
6 2 8.4 8.4
3 31 3 29.8
3 1 7.0 7.0
4 34 4 36.8
2 0.67 5.7 5.7
5 36 5 42.5
4.5 4.5
6 47.0
3.5 3.5
7 50.5
2.7 2.7
8 53.2
2.0 2.0
9 55.2
1.5 1.5
10 56.7
19
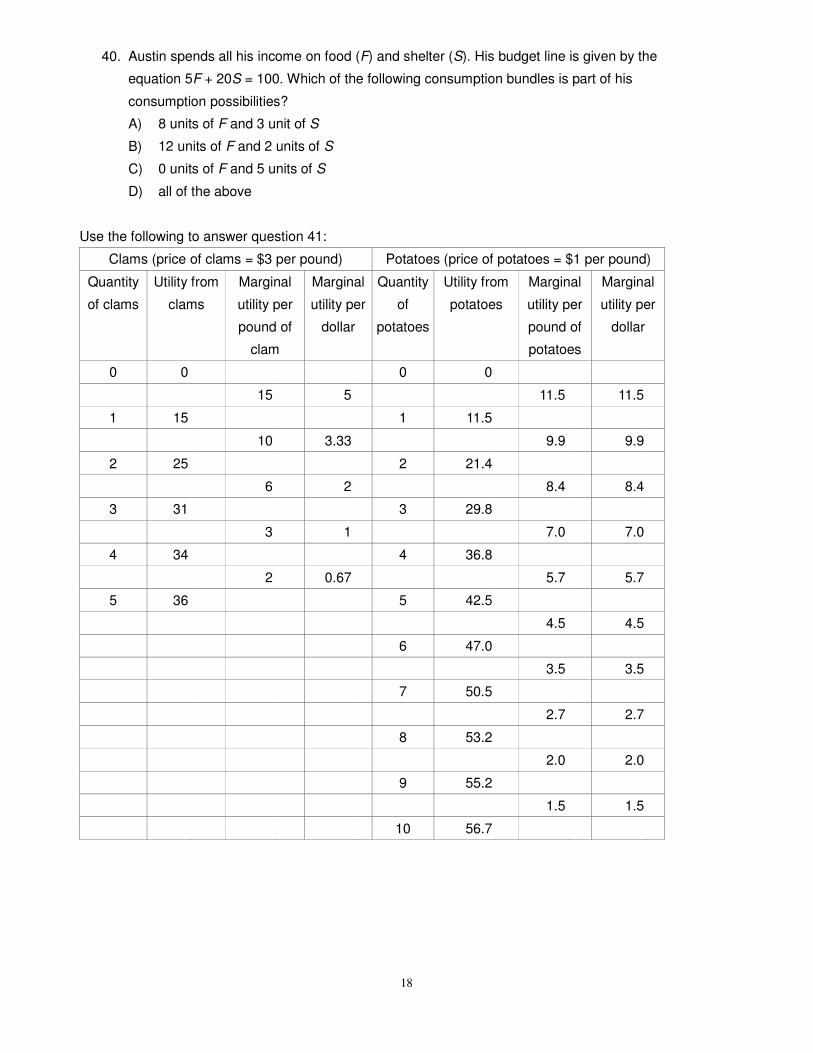
41. According to data in the accompanying table, if the price of clams is $3 per pound, while the price of
potatoes is $1 per pound, and this consumer has $9 to spend on potatoes and clams, then the
utility-maximizing combination is _____ pounds of clams and _____ pounds of potatoes.
A) 0; 9
B) 2; 2
C) 1; 6
D) 2; 3
42. Benny spends all his money buying wine and cheese. The marginal utility of the last
bottle of wine is 60, and the marginal utility of the last block of cheese is 30. The price of
wine is $3, and the price of cheese is $2. Benny:
A) is buying wine and cheese in the utility-maximizing amounts.
B) should buy more wine and less cheese.
C) should buy more cheese and less wine.
D) is spending too much money on wine and cheese.
43. The demand curve for a normal good will always slope downward because:
A) the substitution effect and the income effect reinforce each other, and the
substitution effect always displays an inverse relation between price and quantity
demanded.
B) the substitution effect and the income effect reinforce each other, and the income
effect always displays an inverse relation between price and quantity demanded.
C) even though the substitution effect and the income effect move in opposite
directions, the substitution effect dominates, and it always displays an inverse
relation between price and quantity demanded.
D) even though the substitution effect and the income effect move in opposite
directions, the income effect dominates, and it always displays an inverse relation
between price and quantity demanded.
20
Use the following to answer question 44:
Clams (price of clams = $4 per pound) Potatoes (price of potatoes = $2 per pound)
Quantity
of clams
Utility from
clams
Marginal
utility per
pound of
clam
Marginal
utility per
dollar
Quantity
of
potatoes
Utility from
potatoes
Marginal
utility per
pound of
potatoes
Marginal
utility per
dollar
0 0 0 0
15 3.75 11.5 5.75
1 15 1 11.5
10 2.50 9.9 4.95
2 25 2 21.4
6 1.50 8.4 4.20
3 31 3 29.8
3 0.75 7.0 3.50
4 34 4 36.8
2 0.50 5.7 2.85
5 36 5 42.5
4.5 2.25
6 47.0
3.5 1.75
7 50.5
2.7 1.35
8 53.2
2.0 1
9 55.2
1.5 0.75
10 56.7
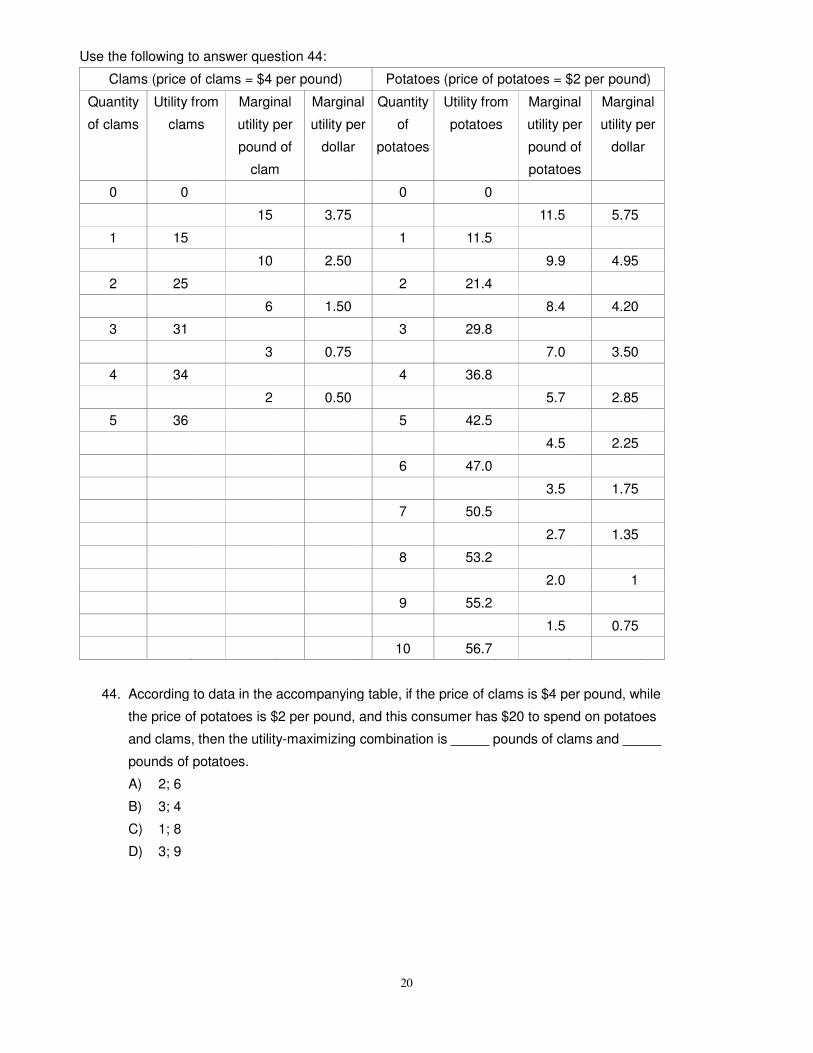
44. According to data in the accompanying table, if the price of clams is $4 per pound, while
the price of potatoes is $2 per pound, and this consumer has $20 to spend on potatoes
and clams, then the utility-maximizing combination is _____ pounds of clams and _____
pounds of potatoes.
A) 2; 6
B) 3; 4
C) 1; 8
D) 3; 9
21
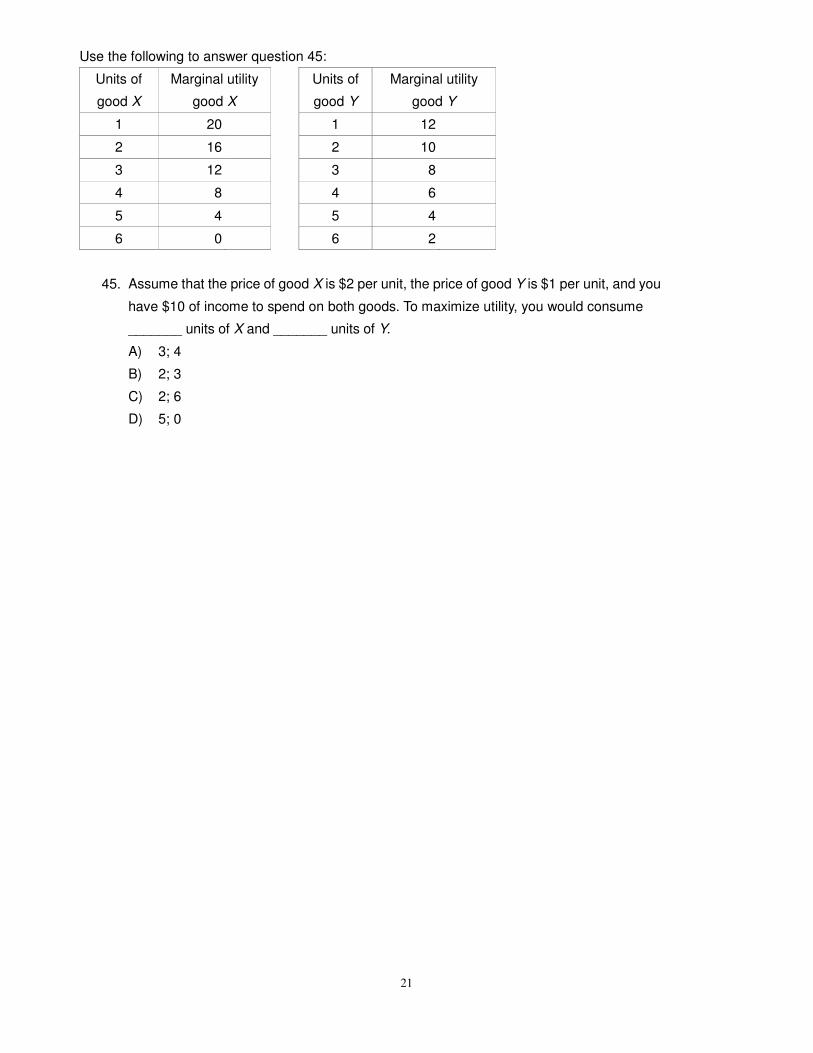
Use the following to answer question 45:
Units of
good X
Marginal utility
good X
Units of
good Y
Marginal utility
good Y
1 20 1 12
2 16 2 10
3 12 3 8
4 8 4 6
5 4 5 4
6 0 6 2
45. Assume that the price of good X is $2 per unit, the price of good Y is $1 per unit, and you
have $10 of income to spend on both goods. To maximize utility, you would consume
_______ units of X and _______ units of Y.
A) 3; 4
B) 2; 3
C) 2; 6
D) 5; 0
Related Documents