HAL Id: hal-02979786 https://hal-brgm.archives-ouvertes.fr/hal-02979786 Submitted on 3 Nov 2020 HAL is a multi-disciplinary open access archive for the deposit and dissemination of sci- entific research documents, whether they are pub- lished or not. The documents may come from teaching and research institutions in France or abroad, or from public or private research centers. L’archive ouverte pluridisciplinaire HAL, est destinée au dépôt et à la diffusion de documents scientifiques de niveau recherche, publiés ou non, émanant des établissements d’enseignement et de recherche français ou étrangers, des laboratoires publics ou privés. Reinforced concrete structures: A review of corrosion mechanisms and advances in electrical methods for corrosion monitoring Romain Rodrigues, Stéphane Gaboreau, Julien Gance, Ioannis Ignatiadis, Stéphanie Betelu To cite this version: Romain Rodrigues, Stéphane Gaboreau, Julien Gance, Ioannis Ignatiadis, Stéphanie Betelu. Re- inforced concrete structures: A review of corrosion mechanisms and advances in electrical meth- ods for corrosion monitoring. Construction and Building Materials, Elsevier, 2020, pp.121240. 10.1016/j.conbuildmat.2020.121240. hal-02979786

Welcome message from author
This document is posted to help you gain knowledge. Please leave a comment to let me know what you think about it! Share it to your friends and learn new things together.
Transcript

HAL Id: hal-02979786https://hal-brgm.archives-ouvertes.fr/hal-02979786
Submitted on 3 Nov 2020
HAL is a multi-disciplinary open accessarchive for the deposit and dissemination of sci-entific research documents, whether they are pub-lished or not. The documents may come fromteaching and research institutions in France orabroad, or from public or private research centers.
L’archive ouverte pluridisciplinaire HAL, estdestinée au dépôt et à la diffusion de documentsscientifiques de niveau recherche, publiés ou non,émanant des établissements d’enseignement et derecherche français ou étrangers, des laboratoirespublics ou privés.
Reinforced concrete structures: A review of corrosionmechanisms and advances in electrical methods for
corrosion monitoringRomain Rodrigues, Stéphane Gaboreau, Julien Gance, Ioannis Ignatiadis,
Stéphanie Betelu
To cite this version:Romain Rodrigues, Stéphane Gaboreau, Julien Gance, Ioannis Ignatiadis, Stéphanie Betelu. Re-inforced concrete structures: A review of corrosion mechanisms and advances in electrical meth-ods for corrosion monitoring. Construction and Building Materials, Elsevier, 2020, pp.121240.10.1016/j.conbuildmat.2020.121240. hal-02979786

1
Reinforced concrete structures: a review of corrosion mechanisms and 1
advances in electrical methods for corrosion monitoring 2
Romain Rodriguesa*, Stéphane Gaboreaub, Julien Gancea, Ioannis Ignatiadisb, Stéphanie Betelub* 3
a: IRIS Instruments, 1 avenue Buffon, 45100 Orléans, France. 4
b: BRGM (French Geological Survey), 3 avenue Claude Guillemin, 45060 Orléans Cedex 2, France. 5
* Corresponding authors: 6
Romain Rodrigues: [email protected] 7
Stéphanie Betelu: [email protected] 8

2
Abstract 9
Steel corrosion is the main cause of deterioration of reinforced concrete (RC) structures. We provide 10
an up-to-date review on corrosion mechanisms and recent advances in electrical methods for 11
corrosion monitoring. When assessing corrosion mechanism, the inherent heterogeneity of RC 12
structures and the significant effect of environmental factors remain major issues in data 13
interpretations. The steel surface condition and local inhomogeneities at the steel-concrete interface 14
appear to have an important effect on corrosion initiation. Considering uniform corrosion in 15
atmospherically exposed reinforced concrete, the two main influencing factors of the corrosion 16
process are the water content and the pore structure at the steel-concrete interface. However, 17
irrespective of the depassivation mechanism, i.e. carbonation or chloride-induced corrosion, non-18
uniform corrosion is expected to be the main process for RC structures due to local variations in 19
environmental exposure or the presence of interconnected rebars with different properties. Future 20
studies may then be focused on their effect on macrocell corrosion to gain further insights in the 21
corrosion mechanisms of RC structures. Concerning corrosion monitoring using electrical methods, 22
the half-cell potential technique with potential mapping is accurate for locating areas with a high 23
corrosion risk. Recent developments in the measurement of concrete resistivity have shown that the 24
use of electrical resistivity tomography allows to consider appropriately the inherent heterogeneity 25
of concrete and provides more insights on transport phenomena (e.g. water and salts ingress) in the 26
material. Nevertheless, during the corrosion propagation stage, the polarization resistance remains 27
the most important parameter to be determined as it provides quantitative information of the 28
corrosion rate. If conventional three-electrode configuration methods can supply an accurate 29
determination in the case of uniform corrosion, they often fail in the case of macrocell corrosion in 30
field experiments. Recent advances have shown that a four-electrode configuration without any 31
connection to the rebar can rather be used for the non-destructive testing and evaluation of 32
corrosion. If studies are still required to quantify the corrosion rate, this method appears sensitive to 33
localized corrosion and thus more suitable to field investigations. Finally, the coupling of numerical 34
simulations with complementary electrical and other non-destructive testing methods is essential for 35
consolidating the results to provide a better diagnosis of the service life of RC structures. 36
Keywords: steel-reinforced concrete; carbon steel; corrosion mechanism; corrosion rate; non-37
destructive testing. 38

3
1. Introduction 39
Concrete and cement-based materials are among the main man-made materials used world-wide in 40
both civil and industrial structures, due to their high mechanical strength and low porosity. 41
Reinforcement with steel rebars has improved the performance of structural elements without 42
modifying the macroscopic cementitious matrix properties [1]. Properly designed and adapted to its 43
environment, reinforced concrete (RC) is an extremely durable material as the concrete is a 44
protective barrier for the rebars. This allowed the development of RC structures, such as bridges, 45
dams or nuclear powerplants [2–4]. Nevertheless, such materials degrade over time, becoming more 46
fragile. 47
One of main fragilities is related to corrosion of the steel rebars, an electrochemical process that 48
involves the anodic dissolution of iron and the cathodic reduction of oxygen, the pore solution of 49
concrete acting as the electrolyte. This phenomenon develops under the influence of aggressive 50
agents, e.g. CO2 and Cl-, that infiltrate the concrete up to the rebar [5–9]. The degradation of the 51
protective layer formed on steel surface in sound concrete results in accelerated corrosion of the 52
rebar, affecting progressively the performance of RC structures. The resulting corrosion products 53
precipitate and generate tensile stress, promoting the appearance of cracks to an unacceptable level 54
regarding their service life [5–9]. Such degradation can result in the collapse of structures such as 55
bridges or buildings. When the first cracks are noticed on the concrete surface, corrosion has 56
generally reached an advanced stage and maintenance action is required. The continuous aging of 57
structures created several decades ago results in aggravated situations as many operate beyond their 58
service life, drastically increasing the economic impact of corrosion [10,11]. The control of such 59
infrastructures is thus of major importance, requiring reliable monitoring techniques that can be 60
used without disturbing the integrity of the structures. 61
Several techniques have been developed for understanding the mechanism and kinetics of the 62
corrosion of steel in concrete. Some techniques focus on determining concrete properties for 63
evaluating the ingress of aggressive agents, while others focus on the rebar properties [12–21]. 64
Among such techniques, electrical/electrochemical methods have been widely developed as they 65
allow the evaluation of the corrosion rate, which is essential when determining the need for future 66
maintenance of RC structures once the steel rebar is depassivated. Three main parameters are 67
generally determined for assessing this parameter: corrosion potential, concrete resistivity, and 68
polarization resistance. 69
This review describes first the constituents of RC structures, i.e. cement-based materials, carbon 70
steel rebar and steel-concrete interface. We then present didactically an up-to-date knowledge of 71
corrosion mechanisms of steel in concrete as a prerequisite to appropriate the different phenomena 72
and evaluate the main factors influencing the corrosion rate. The review is then focused on the use 73
of electrical methods for the non-destructive testing and evaluation (NDT) of corrosion, with the 74
current state-of-the-art monitoring techniques, their advantages and drawbacks, and recent 75
advances in indirect electrical methods which do not required any connection to the reinforcement 76
for the assessment of corrosion, which have been largely ignored in recent reviews. The interest of 77
combining several NDT for field inspection is also developed to overcome the limitation of measuring 78
instantaneous corrosion rates and to improve the estimation of the service life of RC structures. 79
Finally, we present conclusions and perspectives for future researches in corrosion science and 80
engineering. 81

4
2. Composition of reinforced concrete structures 82
2.1. Cement-based materials 83
Cement-based materials are composed of binder (hydrated cement) and aggregates of different sizes 84
and compositions. Cement is produced by heating a mixture of limestone and raw clay minerals (or 85
other materials of similar bulk composition) [22]. Though OPC was the most common cement-based 86
material used world-wide over the past decades, other cement formulations have been designed to 87
adapt the materials to their environmental setting. Organic and inorganic admixtures act on the 88
workability of cement-based materials or improve their performance. Supplementary cementitious 89
materials (SCMs), such as fly ash or blast furnace slag (BFS) [23,24], are also used as partial 90
replacement of clinker for reducing waste and greenhouse-gas emissions, as the cement industry is 91
one of the largest CO2 emitters in the world [25]. Such materials differ in their microstructure and 92
macroscopic behaviour, but their description fall outside the scope of this review. 93
The reaction of cement with water, called hydration, results in the formation of a hydrated cement 94
paste (HCP). The latter is composed of many hydration products, e.g. calcium silicate hydrates (C-S-H) 95
and portlandite Ca(OH)2, but also unhydrated cement particles [26–28]. Over a variable curing 96
period, the cement develops its physical and chemical properties. In laboratory experiments, curing 97
can take place under optimal conditions in terms of relative humidity (RH) and temperature, which 98
allows the definition of standard specimens for research purposes [29]. However, curing conditions 99
are often difficult to control in the field, for which reason a different standard practice has been 100
proposed [30]. Hence, the results obtained from laboratory samples must be used with special care if 101
the objective is to extrapolate them to real structures as their intrinsic properties may significantly 102
differ. 103
After curing, C-S-H represents ~50-60% of the weight of HCP and is responsible for its cohesion [31]; 104
it consists of lamellar nanoparticles with negatively charged silicate layers compensated by interlayer 105
calcium ions, the charge depending on the calcium-to-silica ratio [32]. Their surface chemistry and 106
inter-particles interaction are the driving force of the cohesive properties of hydrated cement, 107
controlling the interactions with charged molecules [31,33]. The role of confined water in C-S-H 108
micropores was demonstrated through molecular dynamic simulation [34,35]. Because of these 109
points, understanding the distribution of water in C-S-H and their thermodynamic and hydration 110
properties is of prime importance when considering the strength and transfer properties of cement 111
materials [36–41]. Nonetheless, all the hydrates must be considered as they play a role in the 112
cement-paste properties. 113
Over the service life of a structure, different thermodynamic equilibria between the solid and liquid 114
phases will develop in the cement-based material, governed by both its environmental setting and its 115
degradation level [42]. The solubility of each phase will dictate the composition of the pore water 116
[43]. At an early stage, the pore solution pH is highly alkaline, between 12.5 and 13.5. With the 117
leaching and dissolution of the materials by chemical attacks, portlandite maintains a pH of about 118
12.5. During the third stage, the pore solution pH is essentially controlled by C-S-H and is buffered in 119
the range 12.5 to 10 [44]. Finally, at later stage, the pH is controlled by all stages of concrete 120
degradation. 121
At a macroscopic scale, both microstructure and reactivity of hydrates control the physical and 122
chemical reactions affecting the durability of cement-based materials. The microstructure of the 123

5
cement paste is highly heterogeneous through the coagulation of nanometric hydrates whose 124
heterogeneities range from macroscopic to nanoscopic scales. In addition to the intra-particles 125
(micro) and inter-particles (meso) porosity of hydrates, the microstructure consists of capillary pores 126
which can range from nanometres up to millimetres. The volume and size of these macropores 127
depend upon the water-to-cement (w/c) ratio, the size of the aggregates and the degree of hydration 128
[45–50]; they are mainly interconnected through a mesoscopic pore network. The presence of 129
aggregates in cement-based materials also introduces important changes with the formation of 130
additional porous regions, known as interfacial transition zones (ITZs). As ITZ may in part be caused 131
by artefacts from sample preparation for microscope analysis, e.g. edge rounding, scratches or 132
imperfect cuts, the experimental protocol for specimen preparation must be reported to avoid any 133
misleading [51]. 134
Cracks also are important features in the microstructure of concrete, introducing additional porosity 135
in HCP. Cracks and microcracks are caused by a multitude of different physical and chemical 136
processes, such as mechanical loading, shrinkage, creep, thermal variations, and expansive chemical 137
reactions [22]. To some extent, almost all cementitious materials are affected by one or more of 138
these processes at different times and, consequently, cracks are endemic to the material. A good 139
knowledge of the structure and microstructure of the concrete is thus essential for assessing 140
concrete durability. Notably, the determination of pore throat and pore size distribution is required 141
for assessing the constrictivity and tortuosity of concrete. Both parameters are mainly determined by 142
mercury intrusion porosimetry (MIP) [52], kerosene porosity, or by imaging methods, e.g. 143
backscattered electron (BSE) imaging [28,53–55] and X-ray micro-computed tomography (X-ray μCT) 144
[56,57]. The last technique is also used for estimating the size and distribution of aggregates in the 145
structure. Spectral induced polarization can also provide relevant information on the mean pore size, 146
pore size distribution and connected porosity of low pH concrete [58]. 147
2.2. Carbon steel reinforcement bars 148
The role of steel reinforcement bars (rebars) is to improve the mechanical properties of the 149
structure, as they provide tensile strength, ductility and crack-growth resistance [1]. Several types of 150
rebar can be used, e.g. carbon steel, epoxy-coated steel, galvanized steel, stainless steel and 151
different alloy steels, but only carbon steel is considered in this review. Generally, ribbed rebars are 152
used in RC structures to provide a strong and interlocking connection between steel and concrete. 153
The chemical composition—metallic and non-metallic elements—of the rebar may vary considerably 154
as several steel grades exist in the world. The distribution of the microstructural phases of steel, e.g. 155
ferrite, cementite, pearlite, martensite, austenite and/or bainite, and the presence of lattice defects 156
or inclusions (e.g. manganese sulphide MnS) can influence corrosion susceptibility, but only few 157
studies are available on this purpose for the corrosion in cement-based materials. If the influence of 158
steel microstructure on corrosion susceptibility has been demonstrated under immersed conditions 159
in simulated concrete pore solution [59–62], the ferritic-martensitic microstructure having generally 160
a better corrosion resistance, the effect of non-uniform water distribution in porous material 161
exposed to atmospheric conditions must be investigated to determine the corrosion susceptibility in 162
concrete. 163
After hot rolling and forging, a thin and brittle oxide coating called mill scale spontaneously forms on 164
steel surface. It is mainly composed of wüstite (FeO), magnetite (Fe3O4), hematite (α-Fe2O3) and 165
maghemite (γ-Fe2O3) [63]. A native rust layer later forms during transport, handling and storage of 166

6
the rebar. Some defects such as cracks, voids and crevices are common between the steel and these 167
initial oxide layers [64]. The composition, thickness and electrochemical properties of both mill scale 168
and native rust are thus very different from one steel to another due to the different manufacturing 169
processes [63–65]. Consequently, even the as-received grade is not well defined, which creates 170
difficulties for ensuring reproducibility of the measurements [65]. If mill scale and native rust can be 171
removed by different processes, e.g. sandblasting, chemical cleaning or mechanical polishing [66], 172
the results from such processes must be used with special care as they are generally not performed 173
for engineered structures. 174
The role of mill scale and native rust layer on the corrosion resistance of steel in still unclear [67–69]. 175
Some studies indicate that it does not affect the corrosion rate or may have a beneficial effect due to 176
the protective behaviour of the layer in the case of a dense and uniform mill scale [70,71], but most 177
studies affirm that it has a negative effect on the corrosion rate as it inhibits the development of an 178
effective passive layer on the rebar or decreases its electrical resistance [72–77]. It was also shown 179
that the corrosion rate is greater for rebars exposed to natural weathering (pre-rusted rebars) than 180
for the as-received rebars [78]. The initial surface state of the rebar and the distribution of native 181
rust are thus major parameters controlling the corrosion susceptibility, and a non-uniform mill scale 182
layer can create weak points for corrosion initiation [79,80]. Hence, as for cement-based materials, a 183
detailed description of the rebar grade, composition, microstructure and initial surface condition is 184
necessary for a correct interpretation of the data and the development of database for the 185
assessment of corrosion mechanisms. 186
2.3. Steel-concrete interface 187
The steel-concrete interface is the most important part of the structure when it comes to 188
determining corrosion mechanisms and corrosion rates of steel rebar [63,80,81]. The embedding of 189
steel in concrete is intended to protect the steel from corrosion. Indeed, in the alkaline medium of 190
the pore solution, a passive film forms spontaneously on the steel surface during the first days/weeks 191
of exposure [82–84]. Such passivation is initiated by the formation of adsorbed species (FeOHads and 192
Fe(OH)+ads), HFeO2
- and Fe(OH)2 [85], and the aging of this passive film results in a progressive 193
decrease in the corrosion rate to values below 0.1 µm year-1 (often described as “no corrosion takes 194
place”). This change is attributable to thickening of the film and to the decrease in Fe2+ content in its 195
inner layer [86,87], which corresponds to the oxidation of magnetite Fe3O4 to Fe(III) oxide and 196
oxyhydroxide, e.g. Fe2O3 or FeOOH [88–90]. The passive film shows an n-type semiconductive 197
behaviour [91,92], but this reaction results in decreasing the electronic conductivity of the film, as 198
Fe(III) oxides are less conductive than magnetite [90]. The resulting passive film is about 10-15 nm 199
thick and is mainly composed of iron oxides and oxyhydroxides, with a progressive increase in 200
valence state and in hydroxide content from inner to outer interface [87,93]. Some elements of the 201
cement paste, e.g. Ca2+, Na+ and K+, can also occur in the passive film, affecting its properties [94,95]. 202
The concrete part of the interface can be seen as another ITZ [63]. The casting direction and 203
orientation of the rebar in the structure affect the distribution of Ca(OH)2 and the porosity of HCP at 204
the steel-concrete interface. For example, the area under a horizontal rebar is exposed to very 205
different conditions, having a Ca(OH)2 content close to 0 and a much higher porosity than the bulk 206
concrete [96,97]. Conversely, for vertical rebars, the steel-concrete interface is relatively uniform 207
without obvious macroscopic defects [97,98]. This difference is explained by the settlement, 208
segregation and bleeding of fresh concrete that can result in the accumulation of defects under 209

7
horizontal rebar [98]. When several horizontal rebars are present in the structure, the upper ones 210
have generally more defects, which is known as the top-bar effect. Special attention must be paid 211
during concrete pouring to limit the formation of these defects that can be preferential seat for 212
corrosion initiation. Other defects, such as cracks, slips and separations, are the result of tensile load 213
on the structure [63]. They all affect the quality of the interface, and thus the corrosion rate [99]. The 214
coalescence of ITZs and cracks can form interconnected porous channels that dramatically increase 215
concrete permeability, creating preferential pathways for the ingress of aggressive agents to the 216
rebar. Finally, the use of spacers and the presence of welding spots can induce supplementary local 217
heterogeneities. 218
The local characteristics of the steel-concrete interface are important parameters as the latter is the 219
seat of the corrosion process. Several techniques can be used to determine the chemistry and 220
microstructure of the interface, such as EDS and BSE imaging [96,100,101]. Special care must be done 221
during sample preparation for such analyses to reduce as much as possible any damage to the steel-222
concrete interface [102,103]. Alternatively, X-ray μCT can be used to examine non-destructively the 223
rebar/cement contact and any heterogeneities such as air voids (Fig. 1). 224
225
Figure 1. (a) Schematic representation of a mortar sample [cement (CEM I 52.5 R, Lafarge)=25 wt%, sand (0-226
4 mm)=75 wt%, w/c ratio=0.5] with one ribbed black carbon steel rebar (Φ=6 mm). (b) X-ray micro-computed 227
tomography 2D slices acquired under 140 kV and a 26 µm voxel size. The slices show concrete heterogeneities 228
(shape and orientation of the aggregates, presence of air bubbles), the shape of the rebar and the structure of 229
the steel-concrete interface. Courtesy: S. Gaboreau. 230
(a) (b)

8
3. Corrosion mechanisms of carbon steel in concrete 231
As proposed by Tuutii [104], the service life of RC structures can be divided into two main time 232
periods: an initiation stage and a propagation stage. The first corresponds to the ingress of aggressive 233
agents—CO2 and chloride—in the concrete to the rebar, resulting in a progressive disruption of the 234
passive film on the steel surface. The propagation stage is the active state of corrosion until the 235
degree of corrosion reaches the damage limit tolerated by building standards. Generally, steel 236
corrosion is considered in a passive state if the current density is below 0.1 µA cm-2, and in the active 237
state for values over 1 µA cm-2 [105]. Based on Tuutii’s model, other models considered the change 238
in corrosion rate during the service life of reinforced concrete [106–108], or included additional 239
stages for differentiating rust expansion, cover cracking and spalling/delamination in the definition of 240
service life (Fig. 2) [109–111]. However, the level of deterioration is not linear as concrete cracking 241
and spalling may accelerate the corrosion rate, whereas the production of corrosion products in 242
cracked concrete may fill the pores, thus decreasing the corrosion rate. 243
244
Figure 2. Schematic representation of the service life of RC structures, adapted from Tuutti’s diagram [106]. 245
Estimating the service life of reinforced concrete requires knowledge of the two main stages of steel 246
corrosion in concrete [112]. Notably, models coupling transport and electrochemical processes are 247
required for improving the prediction of service life [111,113]. Hereafter we discuss the 248
thermodynamic and kinetic aspects of corrosion, the mechanisms of carbonation- and chloride-249
induced corrosion—here developed separately but locally occurring simultaneously—and the 250
formation and consequence of iron corrosion products on the durability of RC structures. Table 1 251
summarizes the main conclusions of this section. 252

9
Table 1. Summary of the main conclusion regarding mechanisms of carbonation- and chloride-induced corrosion of steel in concrete. 253
Mechanism Corrosion initiation Corrosion propagation Main corrosion products
Carbonation * Ingress of CO2 from the atmosphere
Higher penetration rate in the 50-70% RH
range
Dissolution in water as carbonic acid
* Decalcification of concrete
Reaction with Ca-bearing hydrated phases
Non-uniform carbonation front
Decrease in the pH of the pore solution
* Depassivation of the rebar
* Corrosion rate is mainly influenced by the water
content and the pore size distribution in the vicinity
of the rebar for atmospherically exposed RC
structures
* Volume expansion of corrosion products
Pore clogging
Tensile stress in the concrete cover
Formation of corrosion-induced cracks
Increase in the average corrosion rate
Concrete spalling and delamination
* Intermediate products:
Chukanovite Fe2(OH)2CO3
Carbonate green rust GR(CO32-)
Siderite FeCO3
* Final products:
Magnetite Fe3O4
Goethite α-FeOOH
Lepidocrocite γ-FeOOH
Chloride
* Ingress of Cl- from marine environment or the
use of de-icing salts
Non-uniform penetration of Cl- in the material
up to the rebar
Series of depassivation/repassivation until the
chloride content is high enough
* Depassivation of the rebar
* Autocatalytic mechanism of pitting
Deepest pits are generally observed in the
vicinity of interfacial air voids
Formation of macrocell with high corrosion rates
* Volume expansion of corrosion products
Pore clogging
Tensile stress in the concrete cover
Formation of corrosion-induced cracks
Increase in the average corrosion rate
Concrete spalling and delamination
* Intermediate products:
Ferrous hydroxychloride
Chloride green rust GR(Cl-)
* Final products:
Magnetite Fe3O4
Goethite α-FeOOH
Lepidocrocite γ-FeOOH
Feroxyhyte δ-FeOOH
Akaganeite β-FeOOH (Cl- excess)
Combined See above
Carbonation of Friedel’s salt and other chloride-
binding phases will release free Cl- [114–116]
See above
The corrosion rate is higher when both Cl- and CO2
act together as compared to their individual
contribution [117,118]
See above

10
3.1. Electrochemical, thermodynamic and kinetic aspects of corrosion 254
The corrosion of steel in concrete is an electrochemical process that involves the anodic dissolution 255
of iron and, generally, the cathodic reduction of oxygen [119,120]. Depending on the availability of 256
oxygen and the pH near the steel surface, it is also possible to observe the reduction of proton [121]. 257
Finally, an electrical connection between the anode and the cathode is required for transferring the 258
electrons, and an electrolytic environment for transferring the ions in solution (Fig. 3). 259
260
Figure 3. Schematic representation of the corrosion of steel in concrete, involving iron oxidation, oxygen 261
reduction, and the electrical connection and ionic current between the anodic and cathodic sites. 262
The general principle of steel corrosion in concrete can be explained with the stability diagram of the 263
Fe/H2O system (potential-pH or Pourbaix diagram) [122]. Depending upon the experimental 264
conditions, i.e. total Fe content and temperature, the predominance of species can be quite different 265
(Fig. 4). As shown in section 2.2, the thin (~10-15 nm) and passive film developed on the steel surface 266
is preserved under alkaline conditions (passivation domain). If this passive layer remains intact, iron 267
is in the passivation domain and corrosion is slow (less than 0.1 µA cm-2, “passive rebar”). 268
Unfortunately, the continuous degradation of reinforced concrete in environments containing CO2 269
and Cl- affects the integrity of the passive layer. Iron changes to the corrosion domain, which results 270
in the acceleration of corrosion (higher than 1 µA cm-2, “actively corroding rebar”) and the 271
progressive loss of steel cross section associated with the formation of corrosion products. 272
The electrochemical kinetics of corrosion are given by the Butler-Volmer equation (Eq. 1) [123]: 273
(Eq. 1)
where i is the current density (A m-2), i0 is the exchange current density or corrosion current density 274
icorr (A m-2), αa and αc are the anodic and cathodic charge transfer coefficient, respectively, n is the 275
number of electrons exchanged in the reaction, F is the Faraday constant (96485 C mol-1), R is the 276
universal gas constant (8.314 J mol-1 K-1), T is the absolute temperature (K), E is the electrode 277
potential (V) and Ecorr is the corrosion potential (V). The term
is equivalent to the term
, 278

11
where is the Tafel slope (special case of the Butler-Volmer equation, see section 4.3). As it will be 279
developed in the following sections, the corrosion rate depends upon: 280
the water content [124,125]. When RH increases to ~70%, the adsorption of water vapour 281
occurs on external surfaces of C-S-H [38], and the resulting water film is thin and can be 282
considered electrically inactive (high resistance to ionic transport). The further increase in RH 283
from ~70 to ~95% enables the adsorption of multilayer water molecules and the filling up of 284
mesopores [38], decreasing the resistance to ionic transport in concrete; 285
the temperature, which affects the kinetic parameters of the corrosion process, such as Tafel 286
slopes, exchange current density and equilibrium potential [126,127]; 287
the pore size distribution [124,125] and the presence of interfacial voids [128]; 288
the transport properties of aggressive agents in concrete, notably their diffusion coefficients 289
[129,130], and the availability of dissolved oxygen in the cathodic areas, i.e. presence of a 290
cathodic limited current or not [131]; 291
the transport of Fe2+ and the nature and distribution of precipitated corrosion products 292
[132]. 293
294
295
Figure 4. Simplified stability diagrams of the Fe/H2O system indicating the corrosion domain (dissolved iron 296
species) and the passivation domain (precipitated iron species) in the domain of water stability for two total 297
iron content and two temperatures. The hatched area represents the pH and potential range generally 298
reported for carbon steel in sound OPC concrete. These predominance diagrams were obtained with PhreePlot 299
software and the Thermoddem database [133]. Fe-bearing phases considered for calculation were Fe(OH)2, 300

12
magnetite (am), ferrihydrite (6L), goethite and lepidocrocite, which are the main corrosion products of steel in 301
concrete. 302
3.2. Carbonation-induced corrosion 303
3.2.1. CO2 penetration and concrete carbonation 304
Atmospheric carbon dioxide (pCO2≈0.04%) can penetrate into cement-based material mainly by 305
absorption into interconnected capillary pores on the concrete surface and by diffusion in depth 306
through the pore network and microcracks [134]. CO2 diffusion coefficient increases when increasing 307
the water-to-cement ratio as the total porosity of the cement paste increases. The rate of CO2 308
penetration is highest at low RH, when the pores are mostly air-filled [135–137]. The presence of salt 309
in concrete also contributes to block the ingress of CO2 due to pore clogging [138]. During its ingress, 310
CO2 dissolves in the pore water and forms carbonic acid H2CO3. According to the speciation of CO2 311
[139], carbonic acid dissociates in HCO3- and CO3
2- depending on the pH of the pore solution. 312
Carbonation of concrete is the reaction between CO2 and Ca-bearing hydrated phases, e.g. 313
portlandite, C-S-H and ettringite. The reaction kinetics appear governed by the exposure conditions 314
[134,140]. All reactions with hydrated phases occur in solution and are therefore more important 315
and more rapid in saturated concrete. However, as the rate of CO2 penetration is highest at low RH, it 316
is often reported that the carbonation rate is highest in the 50-70% RH range [135,141]. 317
Environmental exposure affects the rate of carbonation; for example, the more rainy days, the lower 318
the carbonation rate [142]. This rate depends also on concrete porosity, and thus on the w/c ratio. A 319
low w/c ratio and a high compressive strength are required to limit as much as possible the 320
carbonation depth, especially in severe environmental conditions [138,143,144]. It is also dependent 321
on the temperature, the CO2 partial pressure, the alkaline reserve in the concrete (CO2 binding 322
capacity), and the presence of cracks [134,145,146]. All these parameters are required for an 323
accurate modelling of carbonation processes in RC structures [147–150]. 324
Carbonation induces changes in mechanical properties and microstructure of cement-based 325
materials [134,151,152]. It results notably in the formation of calcium carbonates CaCO3, calcite 326
being the most stable phase [134]. For OPC concrete, its precipitation results in a lower permeability 327
through total porosity reduction [153] and loss of interconnectivity due to pore clogging as CaCO3 328
occupies a larger volume than Ca(OH)2 [154]. However, as the capillary porosity increases [155], the 329
ionic migration through the cement paste can be increased because of carbonation. But as shrinkage 330
and cracking of the concrete can occur in parallel, it is difficult to predict the change only due to 331
carbonation [134]. 332
As the carbonation of concrete exposed to atmospheric conditions is a slow process, especially for 333
OPC concrete (a few tens of millimetres in 20 years [156]), accelerated laboratory tests are generally 334
performed in an CO2-rich atmosphere under conditions where the rate of carbonation is maximum 335
(≈50-70% RH). As shown by several authors, these accelerated tests are representative of the natural 336
carbonation in terms of changes in mineralogy, microstructure, water retention and cracking as long 337
as the CO2 content is low (pCO2 <3-4%), even if carbonation is only partial and the formation of 338
metastable CaCO3 phases, i.e. aragonite and vaterite, is promoted instead of calcite [157,158]. 339

13
3.2.2. Depassivation and corrosion mechanisms 340
Despite possible self-healing of concrete, carbonation is responsible for a decrease in pH of the pore 341
solution from above 13 to below 9, which results in dissolution of the passive layer of the rebar when 342
the carbonation front reaches its surface [150,159]. According to the Pourbaix diagram (Fig. 4), the 343
process will progressively change from the passivation domain to that of corrosion [160,161]. It is 344
commonly assumed that the corrosion induced by carbonation is generalized and relatively 345
homogeneous [92]. Considering this case, steel is uniformly depassivated, and the anodic and 346
cathodic areas are located at adjacent locations. The term ‘microcell corrosion’ is used for describing 347
this situation [162]. However, because of the heterogeneous structure of concrete (cracks, pore size 348
distribution and interconnectivity), the carbonation front is seldom perfectly uniform on RC 349
structures, and a spatial variability in the carbonation depth near the rebar can be observed [163]. 350
The local variation in indoor and outdoor exposure is also responsible for the steepness of the 351
reaction front [164]. This non-uniformity will create different steel-concrete interface along the same 352
rebar, allowing the formation of ‘macrocell corrosion’ [156]. In addition, the presence of load-353
induced cracks will affect the steel-concrete interface independently of the crack-opening size, 354
promoting local carbonation and damage of the interface [165]. In structures where steel rebars with 355
different conditions are interconnected, macrocell corrosion is thus expected to be the main 356
corrosion process [162,166]. It is, however, still important to consider both microcell and macrocell 357
components, as the neglect of one of these components may result in underestimating the degree of 358
corrosion [167–169]. A schematic representation of the supposed mechanism of carbonation-359
induced corrosion is shown in Fig. 5. 360
361
Figure 5. Schematic representation of the mechanism of carbonation-induced corrosion of steel in concrete 362 according to the literature cited in the text. 363
The evolution of the corrosion rate in carbonated concrete is still not fully understood. For each 364
concrete composition, it is highly dependent upon water content and pore size distribution [170]. 365
Different degree of saturation and porosity could thus explain the different corrosion rates observed 366

14
in carbonated concrete. Some authors reported that the corrosion rate increases up to 90-95% RH 367
before decreasing due to a limitation of the oxygen availability at high RH, indicating the presence of 368
a cathodic limited current [104,129,171]. However, other authors reported that the corrosion rate 369
increases continuously up to 99% RH [124,125,170]. Even at high RH, the material is hardly fully 370
water-saturated as saturation cannot happen only by capillary condensation or capillary suction in 371
large pores (the size being dependent on the pore geometry). This suggests that cathodic control of 372
the corrosion rate due to a limited availability of O2 is relevant only under long-term immersion, i.e. 373
when all gaseous and dissolved O2 is depleted in concrete [124]. This confirms that the two main 374
influencing factors of the corrosion rate of steel in atmospherically exposed RC structures are the 375
water content and the pore structure [125]. Consequently, corrosion is under activation control: the 376
corrosion rate increases during wetting exposure until the electrochemically active surface is water-377
filled, and then decreases during drying exposure [172]. This mechanism controlling the corrosion 378
rate has been proposed for uniformly depassivated rebars in very thin samples. Further studies are 379
required to confirm the validity of the kinetics of iron corrosion for larger cover depth and when the 380
macrocell component is also considered, as non-uniform corrosion is expected on real structures. 381
3.3. Chloride-induced corrosion 382
3.3.1. Chloride penetration 383
The presence of chloride in the concrete can result from chloride-contaminated components of 384
aggregates or contaminated construction water, or by diffusion from the environment, e.g. exposure 385
to a marine environment (e.g. XS microenvironment with wetting/drying cycles) or the use of de-386
icing salts (i.e. CaCl2, MgCl2, NaCl) in winter [7]. The penetration of chloride occurs mainly through 387
capillary pores as free chlorides Cl- by capillary suction, diffusion and permeation [7]. Thus, the 388
initiation time of corrosion strongly depends upon transport parameters, such as the diffusion 389
coefficient of total chloride in concrete [173]. 390
It is, however, difficult to predict correctly this parameter as it may be influenced by many others. 391
First, the diffusion is affected by pore size distribution and pore interconnectivity in the concrete, 392
which is related to the w/c ratio. It is recommended to use a low w/c ratio (0.4-0.5) for increasing the 393
length of the initiation stage, as the total porosity will be decreased [174]. Second, a part of the free 394
chlorides can be physically adsorbed on different hydrates such as C-S-H and monosulfoaluminates 395
(AFm), or can chemically react with other phases such as tri-calcium aluminate (C3A) to form Friedel’s 396
salt when the chloride content is sufficient [175,176]. Physical adsorption depends mainly on the 397
specific surface area of the cement paste, while chemical adsorption through formation of Friedel’s 398
salt is mainly related to the monocarboaluminate content in the paste [177]. SCMs with high alumina 399
and calcium content can also play a role in the chloride binding capacity, and thus on the durability of 400
RC, by limiting Cl- ingress to the rebar [177]. Finally, diffusion of Cl- is affected by water content, 401
temperature, and the properties of the electrical double layer [176,178,179]. The diffusion 402
coefficient varies also in the ITZs of concrete as a function of their volume and tortuosity [180]. As for 403
CO2 and other aggressive species, the presence of cracks in the concrete or the presence of defects at 404
the steel-concrete interface may provide further preferential paths for the ingress of chloride to the 405
steel surface [181–184]. Irrespective of the factors affecting chloride penetration, determining the 406
rate of Cl- ingress is required for modelling the service life of the initiation stage of corrosion [185–407
187]. 408

15
For accelerating the rate of Cl- ingress and thus to initiate more rapidly chloride-induced corrosion, 409
several procedures were investigated, e.g. mixing chloride salt in the cement paste or the 410
electromigration/rapid chloride permeability test (RCPT). However, the results obtained by mixing 411
chloride salt directly in the cement paste can only be used for determining the effect of 412
contaminated aggregates or water, as the passive film will not form properly on the rebar [168] and 413
the hydration products will be different, affecting the microstructure of the concrete [65]. RCPT can 414
also affect the concrete microstructure [188] and thus cracks formation. Thus, the results obtained 415
from accelerated tests must be used with care if they aim at understanding corrosion mechanisms. 416
3.3.2. Depassivation and corrosion mechanisms 417
As for carbonation-induced corrosion, there still is a lack in the physical understanding of the 418
depassivation mechanism of steel exposed to chloride ions [92,187]. Two models are generally 419
proposed: the ion exchange model [189] and the point defect model [190]. In the first one, 420
depassivation is the result of the adsorption and ingress of Cl- through the outer film layer and the 421
progressive thinning of the inner film until dissolution. In the second one, chloride ions remain 422
adsorbed on the film surface and act as a catalyst in the formation of Fe vacancies on the 423
oxide/electrolyte interface, which then diffuse to the oxide/metal interface while O vacancies diffuse 424
in the opposite direction. The combination of Fe vacancies results in the formation of voids and thus 425
in depassivation of the rebar. It appears that the lattice structure of this film and the presence of 426
defects strongly affect the depassivation mechanism [191]. Recent experiments of steel corrosion in 427
simulated concrete pore solutions have shown the modification of the structure and electronic 428
properties of the passive film exposed to chloride. Notably, an increase in the Fe3+/Fe2+ ratio was 429
observed in association with a decrease in film thickness [91,93,192–194]. The donor density ND of 430
the passive film increases in the presence of chloride, resulting in a higher electric conductivity and 431
thus lower corrosion resistance of the film, suggesting the incorporation of chloride ions in the 432
passive film [195]. However, molecular dynamics and density functional theory simulations support 433
the point defect model, as no ingress of chloride has been observed in any simulation [196,197]. 434
It is often reported that a minimum chloride content is required for observing the depassivation of 435
steel, so-called the critical chloride content or the chloride threshold value Ccrit. It is expressed either 436
as the total chloride content relative to binder weight [198], or as the chloride ion activity relative to 437
the pH of the pore solution [199]. Even if only free chlorides are suspected to cause steel corrosion 438
[200], chlorides bounded onto solid phases represent a potential reservoir of free chlorides for 439
corrosion [198]. This is notably observed in the case of the carbonation of chloride-contaminated 440
concrete as carbonation decreases the chloride-binding capacity of hydrates [116,201]. Ccrit ranges 441
from 0.04 to 8.34% by binder weight, or from 0.01 to 45 in terms of [Cl-]/[OH-] molar ratio [199]. It 442
depends on many parameters such as RH, temperature, the pH of the pore solution, local 443
characteristics at the steel-concrete interface and the exposed area of rebar [64,77,202–208]. 444
Though the concept of the chloride threshold value is well accepted, it does not allow an accurate 445
estimation of service life in all cases, even with complex transport models [187,209]. In addition, Ccrit 446
values obtained from small-scale laboratory samples are hardly applicable to real structures as the 447
preparation conditions are not as well controlled in the field [210] and local inhomogeneities at the 448
steel-concrete interface create a size effect [211]. A test method for mimicking realistic conditions in 449
laboratory specimens is still required [65]. If the weakest-link theory is a suitable option to consider 450
the size effect of corrosion [211], a more practical solution consists in measuring Ccrit value on 451

16
samples taken from existing structures. This overcomes the limited applicability of laboratory data 452
and provides case-specific input data to improve the prediction of the service life of the investigated 453
structure [187]. 454
Once the passive film is locally disrupted, anodic dissolution occurs if the water content and oxygen 455
availability are sufficient for the cathodic reduction [212,213]. Due to the localized presence of 456
chloride in the concrete, iron dissolution generates small pits though the surrounding steel surface 457
still retains its passive film. Chloride ions are attracted to the metal dissolution sites for maintaining 458
electroneutrality [214], resulting in the enhancement of iron solubility in the pit due to the formation 459
of iron chlorocomplexes and chloride green rust GR(Cl-) [215]. Pit stability depends upon the 460
competitive migration between Cl- and OH-, which depends on the mobility and concentration of 461
both ions. In the case of insufficient Cl-, a depassivation/repassivation sequence is expected to occur 462
due to the precipitation of iron(II) hydroxide inside the pit [216]. A sufficient [Cl-]/[OH-] ratio is thus 463
needed for achieving stable pit growth. After iron dissolution, the hydrolysis of ferrous iron ions 464
creates local acidification in the pit [217,218] and iron chloride ions Fe(H2O)(n-m)Clm(z-m)+ will diffuse 465
outside the pit where they will be dissociated being no longer stable under higher pH conditions. Due 466
to the presence of well-defined anodic and cathodic areas, chloride will migrate back to the anode 467
for further chloride attack, while ferrous iron ions will migrate to the cathode in an oxygen-rich 468
region, where it will precipitate. As a result, an aggressive microenvironment is preserved in the pit, 469
and an autocatalytic process explains the corrosion process in chloride-contaminated concrete. A 470
schematic representation of the supposed mechanism of chloride-induced corrosion of steel is 471
shown in Fig. 6. 472
473
Figure 6. Schematic representation of the mechanism of chloride-induced corrosion of steel in concrete 474
according to the literature cited in the text. 475
Macrocells with very high corrosion rates are expected in chloride-induced corrosion [219], resulting 476
in important local thinning of steel depending on concrete resistivity [216], driving voltage and 477
cathode-to anode ratio [216]. The growth of anodic sites is more rapid close to the anode/cathode 478
boundary than deeper down in the centre of the pit, due to the non-uniform distribution of current 479
densities [123]. Hence, the extension of the pit is greater across the surface than in depth and the 480

17
ratio between maximum and average corrosion depth, also called the “pitting factor”, ranges 481
between 2.5 and 10 [220,221]. Corrosion should thus be measured over the entire defective area to 482
predict accurately the mechanical behaviour of a corroded structure [222]. 483
In marine environments, in which RC structures are partially immersed, the cathode-anode distance 484
is an important parameter in the corrosion process. Indeed, it has been shown that the macrocell 485
corrosion current can be provided by a cathode located at large distances from the anode [223,224]. 486
Experiments and numerical simulations have shown that a non-negligible current can be provided by 487
cathodes located in unsaturated zones up to several meters away from the anodic area, depending 488
on the geometry of the structure and its resistivity, which was here considered uniform [224]. Hence, 489
even if O2 is depleted near the anodic areas, the cathodic reaction may not be the rate-determining 490
step of corrosion as it can occur far away from them. Nonetheless, resistivity differs in immersed 491
zones compared to tidal and unsaturated zones [225], affecting the distribution of the current 492
between anodic and cathodic areas. Further studies are thus required to gain more insights on this 493
macrocell current by considering representative gradients of concrete resistivity in marine 494
environment. 495
3.4. Nature and reactivity of corrosion products and their impact on durability of the 496
material 497
Different corrosion products (CPs) are observed in RC structures. Table 2 lists possible CPs in 498
concrete with their volume expansion [5,214,226,227]. 499
Table 2. List of possible iron corrosion products in concrete with their volume expansion (NC=unknown). 500
Corrosion products Formula Valence Volume expansion
Iron(II) hydroxide Fe(OH)2 Fe(II) 3.7
Chukanovite Fe2(OH)2CO3 NC
Siderite FeCO3 NC
Ferrous hydroxychloride β-Fe2(OH)3Cl NC
Chloride green rust FeII3FeIII(OH)8Cl, 2 H2O Fe(II-III) NC
Carbonate green rust FeII4FeIII
2(OH)12CO3, 2 H2O NC
Sulphate green rust FeII4FeIII
2(OH)12SO4, 8 H2O NC
Magnetite Fe3O4 2.1
Hematite α-Fe2O3 Fe(III) 2.1
Maghemite γ-Fe2O3 2.4
Iron(III) hydroxide Fe(OH)3 4.2
Ferrihydrite Fe2O3, 3 H2O 6.5
Goethite α-FeOOH 3.0
Akaganeite β-FeOOH
(β-FeO1-x(OH)1+xClx)
3.5
Lepidocrocite γ-FeOOH 3.2
Feroxyhyte δ-FeOOH 2.8
Iron dissolution results first in the production of ferrous iron Fe2+ in solution. Then, iron(II) hydroxide 501
Fe(OH)2 is assumed to be the main precursor of precipitated CPs [218]. If several intermediates can 502
then be formed, they are rapidly oxidized in the presence of oxygen. With a low oxygen supply, 503
partial oxidation is common, resulting in the formation of magnetite Fe3O4. With a high oxygen 504

18
supply, complete oxidation results in the formation of Fe(III) oxides and oxyhydroxides, collectively 505
referred to as “rust”. The occurrence of CPs depends mainly on the nature of the rebar and the 506
environmental parameters. 507
The presence of the rust layer is of great importance as it is directly implied in the mechanism of 508
steel corrosion. It acts as a porous electrode where oxygen reduction can occur [228]. Notably, the 509
exchange current density of O2 reduction is higher where rust is present as compared to a surface 510
where only mill scale occurs [229]. The reduction of rust, notably FeOOH, can also be seen as the 511
cathodic reaction related to iron dissolution [230,231]. Due to the difference in electric conductivity 512
and morphology of the different CPs, determining their local distribution is important as it can 513
influence the rate-determining step of corrosion [232]. 514
3.4.1. Nature and distribution of CPs in carbonation-induced corrosion 515
In carbonated media, chukanovite Fe2(OH)2CO3, siderite FeCO3 and carbonate green rust GR(CO32-) 516
are expected to form as intermediates, and the oxidation of chukanovite results in the formation of 517
lepidocrocite and goethite [233]. Feroxyhyte can also be observed in addition to these two products 518
[234]. Because of the very low solubility of iron oxyhydroxides at near-neutral conditions in 519
carbonated concrete, they tend to precipitate in the porosity at the vicinity of the rebar to form a 520
‘corrosion layer’ [218]. The accumulation of precipitates under confined conditions will cause an 521
expansive pressure, resulting in cracks formation in concrete. 522
The transport of Fe2+ away from the rebar must thus be considered for the evolution of the corrosion 523
rate and the formation of corrosion-induced cracks. It depends on (i) Fe2+ content and (ii) concrete 524
porosity. Indeed, precipitation will occur only after Fe2+ saturation in the solution is reached. If the 525
corrosion rate is slow, which is the case of natural corrosion in carbonated concrete, no saturation of 526
Fe2+ ions is expected close to the steel surface, resulting in their diffusion away from the interface 527
[132]. According to Nernst equation, increasing Fe2+ content in the vicinity of the rebar increases the 528
anodic reversible potential, resulting in a decrease of the corrosion rate. Hence, an increase in total 529
porosity of concrete will facilitate the diffusion of Fe2+ away from the rebar, resulting in a decrease of 530
the anodic reversible potential and in the increase of the effective corrosion current density [125]. 531
Nonetheless, a maximum effective current density is expected beyond a certain opening of the pore 532
structure, from which the system tends to behave as a bulk solution in terms of transport properties 533
(no more transport limitation due to concrete porosity) [125]. The diffusion of Fe2+ away from the 534
rebar competes with the diffusion of O2 in the opposite direction. Hence, the diffusion of Fe2+ can be 535
very limited, depending on the pH, as it is oxidized in Fe3+ and precipitates rapidly as Fe(III)-bearing 536
species, Fe3+ being much less soluble than Fe2+. We must note that even if a thick corrosion layer 537
develops at the vicinity of the rebar, a “virtual” diffusion of Fe2+ can still occur across this layer 538
through electron transfer in the Fe(III) layer, i.e. sorption of one Fe2+ on one side and release of 539
another Fe2+ on the other side, as proposed for Fe diffusion at the steel-bentonite interface [235]. 540
3.4.2. Nature and distribution of CPs in chloride-induced corrosion 541
For chloride-induced corrosion, several intermediates can be formed, such as ferrous 542
hydroxychloride or chloride green rust GR(Cl-), which is thermodynamically stable in the alkaline pore 543
solution and can be observed near the rebar [215,236]. A large variance in the final CPs is reported in 544

19
the literature, the products being a mixture of magnetite, goethite, lepidocrocite and/or ferrihydrite 545
[237–239]. In addition, in the presence of a large excess of chloride, ferrous hydroxychloride β-546
Fe2(OH)3Cl is suspected to be formed as an intermediate product before its oxidation in GR(Cl-), 547
which can be later oxidized into akaganeite with an increased chloride content [240,241]. Currently, 548
there is no physical explanation for this variance, probably because the mechanism of steel 549
depassivation is still not fully understood [92]. 550
In addition to the local acidic conditions induced in the pit, the presence of chloride increases the 551
solubility of Fe2+ ions, which prevents their rapid precipitation and allows their diffusion and 552
migration away from the pit [218]. CPs accumulate first between the steel and the mill scale and then 553
penetrate adjacent porous zones [242]. This penetration strongly depends upon the distribution of 554
the hydration products and the concrete porosity around the rebar. As they diffuse away from the 555
pit, ferrous chloride ions are no longer stable due to the higher pH of the pore solution and rapidly 556
precipitate, filling the pores (‘corrosion-filled paste’) [243] and impeding further diffusion of Fe2+. As 557
corrosion continues, new CPs tend to precipitate near the surface of the rebar, which finally results in 558
the formation of corrosion-induced cracks [244]. Hence, major localized loss of steel cross-section 559
may occur before the appearance of cracks on concrete surface in the case of chloride-induced 560
corrosion. 561
3.4.3. Impact on the structural performance of RC structures 562
The formation of solid-state CPs plays a major role in the structural performance and service life of 563
RC structures [92]. Even if it can be up to 6.5, as shown in Table 2, the expansion coefficient of the 564
mixture of CPs in concrete generally varies between 2 and 4 [245–247]. This volume expansion will 565
exert a radial pressure on concrete, generating corrosion-induced cracks if CPs grow under confined 566
conditions [239,248,249]. The cracking process can be split into three stages: corrosion products 567
filling, concrete cover stress and concrete cover cracking [250]. If the first stage progressively 568
modifies the porosity and can help in preventing corrosion if pore clogging occurs, the two other 569
stages result in accelerated corrosion as they create preferential paths for the ingress of aggressive 570
agents. The time-to-cracking of the concrete related to steel corrosion is thus largely dependent 571
upon its porosity. 572
Moreover, environmental parameters such as temperature can accentuate the cracking process. 573
Indeed, the morphology of the oxide layer can change with temperature [251], and partially 574
reversible redox reactions have been observed during temperature cycling between 5 and 45 °C 575
[252]. The valence state of the shell and the hydroxide content (i.e. oxidation and hydration: 576
transformation of magnetite into goethite or lepidocrocite) is positively correlated with temperature 577
increase, leading to an augmentation in the corrosion potential of the rebar [253]. Thus, the 578
corrosion potential is more linked to redox activity of the oxide layer than to oxygen availability, as 579
the concentration of oxygen decreases with a temperature increase [252]. The opposite trend is 580
observed when temperature decreases (i.e. dehydration and reduction), resulting in a “breathing” of 581
the shell with temperature cycling that can affect the stability of the passive film [253]. 582
The development of CPs and the possible formation of corrosion-induced cracks can be monitored 583
with scanning electron microscopy (SEM), energy dispersive X-ray spectrometry (EDS), X-ray 584
diffraction (XRD), Raman spectroscopy and X-ray μCT (Fig. 7) [128,254–258]. Four different parts can 585
be observed in the material: the steel, the dense product layer, the transformed medium and the 586

20
binder [259,260]. The mill scale can also be sometimes differentiated [261,262]. As the rust 587
distribution is generally non-uniform on the steel surface [263], several models have been developed 588
for predicting corrosion-induced concrete cracking [264–266]. Though the models adequately predict 589
the time-to-cracking for the experiments for which they were calibrated, their predictions may not 590
be as accurate for fitting the results obtained in other studies with different experimental conditions 591
[267]. Hence, the development of a general model for corrosion cracking is still required. 592
593 Figure 7. (a) X-ray µCT 2D slices acquired on a mortar sample like the one of Fig. 1, comparing the same sample 594
before and after corrosion. The 2D slices are extracted from the 3D volume at the same position to visualize 595
the development of corrosion products. The rebar is shown before and after corrosion by thresholding the 596
corrosion products (in pink). X-ray µCT images show that the corrosion products fill the porosity (air voids) and 597
generate cracks on the mortar around the rebar up to its surface (surrounded in yellow). (b) Comparison of 598
surfaces by optical and X-ray µCT acquisition. After accelerated corrosion, the sample was cut to observe the 599
distribution of corrosion products in the sample. Though X-ray µCT is a great technique to determine the 600
distribution of phase and porosity of the material, some corrosion products are hardly detected. Courtesy: S. 601
Gaboreau. 602
4. Electrical methods for non-destructive testing and evaluation of corrosion 603
Non-destructive testing and evaluation (NDT) of the corrosion of steel in concrete is a major issue for 604
predicting the service life of reinforced concrete structures [18]. Among the different techniques, 605
electrical methods allow evaluating the corrosion rate, a parameter of prime importance for 606
estimating the service life of RC structures in the propagation stage. These methods require the use 607
of an electrical system with two-, three- or four-electrode configurations to determine three main 608
parameters: corrosion potential Ecorr, concrete resistivity ρ and polarization resistance Rp [268]. Table 609
3 summarizes the different techniques presented in detail in this section, with their methodology and 610
main advantages and drawbacks. 611
(b) (a)
21
Table 3. List of electrical methods for the assessment of the corrosion rate of steel in concrete, with their main advantages and drawbacks. 612
Method Methodology Advantages and drawbacks
Corrosion potential/
Half-cell potential
Measurement of the open-circuit potential
difference between the rebar and a
reference electrode placed on the concrete
surface or embedded in the concrete
Fast measurement
Allow the identification of the main defect points with high corrosion risk
No quantitative information of the corrosion rate
Absolute value is highly affected by concrete conditions (geometry, resistivity,
presence of cracks), composition of the pore solution (pH, chloride or sulphide
content), the condition of the steel rebar (cathode-to-anode ratio), the
availability of oxygen near the steel surface and environmental factors (RH, T)
Results must be interpreted only as potential gradients
Electrical connection to the rebar is required
Measurements can be performed using at least two reference electrodes
placed on concrete surface and the results must be interpreted as
potential vectors [269–271]
Concrete resistivity
(Wenner configuration)
Injection of a direct or alternating current
between the two outer electrodes and
measurement of the resulting potential
difference between the two inner
electrodes
Usual parameter:
0.01 < f (kHz) < 10
Fast measurement
Provide insights on concrete durability
Allow the identification of the main defect points with high corrosion risk
Corrosion rate can be estimated based on recommendations and correlations
with concrete resistivity
No unique correlation could be determined between the two parameters
Absolute value is highly affected by concrete conditions (geometry, resistivity,
presence of cracks), composition of the pore solution, environmental factors
(RH, T), and the presence of the rebar
Electrical resistivity tomography (ERT) must be performed to consider
accurately the inherent heterogeneity of concrete and to account for the
rebar effect in the measurement
Linear polarization
resistance (LPR)
Linear sweep voltammetry in the anodic or
cathodic direction around the corrosion
Fast measurement
Good agreement with gravimetric loss in case of active corrosion

22
potential
Usual parameters:
Sweep rate = 10 mV min-1
Ecorr ±10-20 mV
Electrical connection to the rebar is required
Use of the Stern-Geary relation to convert Rp in corrosion current
Concrete resistivity must be determined using another technique to
compensate the ohmic drop
Determining the polarized area on RC structures is challenging
The corrosion rate in the case of passive corrosion is overestimated
Slower sweep rate (<2.5 mV min-1) must be used to improve the
measurement of corrosion rate in this case
Tafel scan Methodology similar to LPR
Usual parameters:
Sweep rate = 10 mV min-1
Ecorr ±150-250 mV
Provide directly the corrosion current instead of Rp
Electrical connection to the rebar is required
Can cause irreversible changes to the rebar due to the strong polarization
Determining the polarized area on RC structures is challenging
Galvanostatic pulse
(GP)
Injection of a direct current between the
rebar and a counter electrode during, and
measurement of the resulting potential
difference between the rebar and a
reference electrode
Usual parameters:
I = 5-500 µA (ΔE < 20 mV)
t = 5-30 s
Fast measurement in general
Good agreement with gravimetric loss in case of active corrosion
Electrical connection to the rebar is required
Use of the Stern-Geary relation to convert Rp in corrosion current
Determining the polarized area on RC structures is challenging
The corrosion rate in the case of passive corrosion is overestimated
Longer measurement time (>100 s) must be used to improve the
measurement of corrosion rate in this case
Electrochemical
impedance spectroscopy
(EIS)
Injection of an alternating potential
between the rebar and a counter electrode
during, and measurement of the resulting
current between the rebar and a reference
electrode
Usual parameters:
E = 10 mV RMS
10-3 < f (Hz) < 105
Good agreement with gravimetric loss in case of active and passive corrosion
Provide insights on the corrosion mechanism
Electrical connection to the rebar is required
Selection of the electrical equivalent circuit is of prime importance to
determine accurately Rp
Use of the Stern-Geary relation to convert Rp in corrosion current
Measurement time is long
Possibility to limit the use of low frequencies but the accuracy of the Rp

23
value obtained in this case may be less accurate, irrespective of the
selected EEC
Alternatively, harmonic analysis of the signal obtained at only one low
frequency in the time-domain can be done to obtain the corrosion current
Determining the polarized area on RC structures is challenging
Indirect GP Methodology similar to GP, but using a
four-electrode configuration placed on the
concrete surface, where two probes are
used to inject the direct current and two
probes are used to measure the resulting
potential difference
Fast measurement in general
Good agreement with gravimetric loss in case of active corrosion and passive
corrosion for highly resistive concrete
No electrical connection to the rebar is required
‘Self-confinement’ of the current to determine the polarized area
Simulations are required to determine the current distribution in the material
Studies are still required to quantify accurately the corrosion rate
Indirect EIS Methodology similar to EIS, but using a
four-electrode configuration placed on the
concrete surface, where two probes are
used to inject the alternating current and
two probes are used to measure the
resulting potential difference
Method sensitive to non-uniform corrosion that can separate the contribution
of actively corroding areas and passive areas
No electrical connection to the rebar is required
Measurement time is long
Studies are still required to provide quantitative information on the corrosion
rate
24
4.1. Corrosion potential 613
Corrosion potential Ecorr, also referred to as half-cell potential, is the open circuit potential (OCP) of 614
the rebar. 615
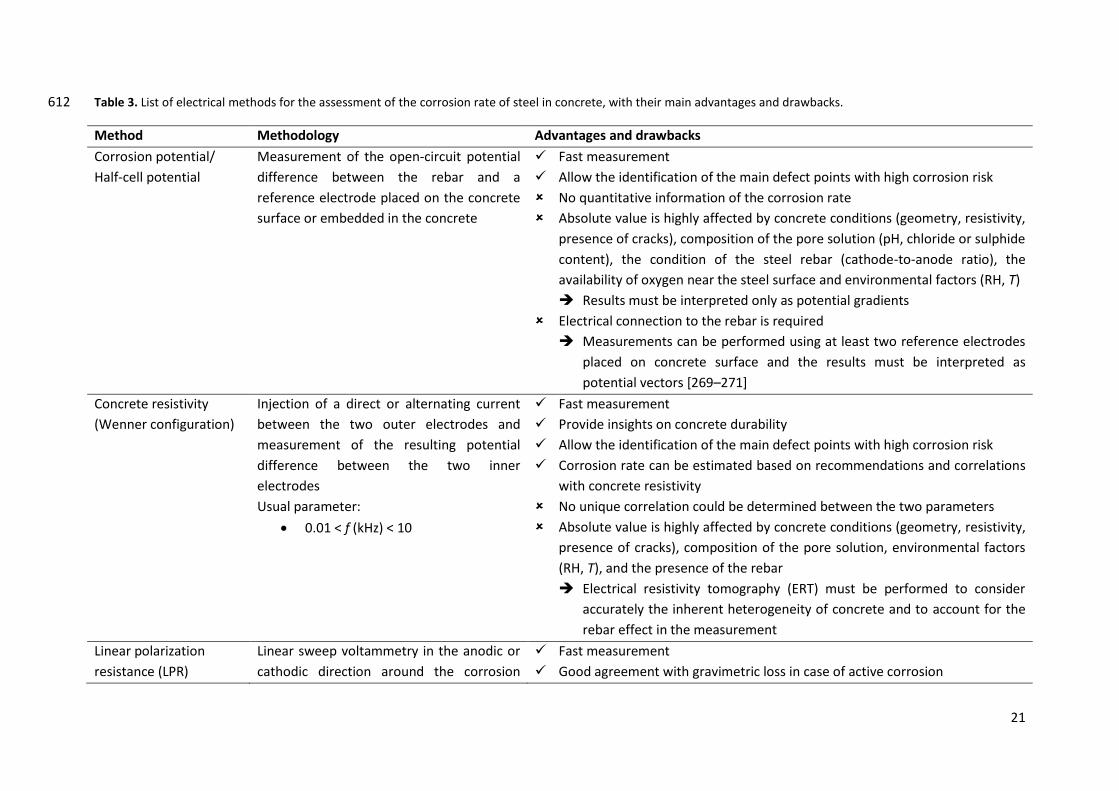
4.1.1. Measurement 616
The measurement is done with a two-electrode configuration, connecting the rebar—the first half of 617
the cell—and a reference electrode (RE)—the other half of the cell—through a high-impedance 618
voltmeter (Fig. 8) [272]. The method was first referenced as the ASTM C876 standard test method for 619
half-cell potentials of uncoated reinforcing steel in concrete. A local breakout of the concrete cover is 620
generally required to create a sound contact as the rebar is not readily accessible [273]. The 621
reference electrode is a silver-chloride electrode, a copper-sulphate electrode (CSE), or a saturated-622
calomel electrode (SCE), which are mostly commercialized as liquid- or gel-filled electrodes. This kind 623
of RE is placed on the concrete surface, requiring a good electrolytic contact with the concrete. This 624
is generally ensured using a sponge wetted with an appropriate solution with a similar pH than that 625
of the pore solution to reduce as much as possible junction potentials [274]. As the position of the 626
electrode and the type of electrolytic contact both affect the OCP measurements, this information 627
must be reported in all studies. 628
629
Figure 8. Schematic diagram of the measuring system of corrosion potential using a surface reference 630
electrode. 631
Alternatively, concrete-embeddable solid-state metal/metal oxide reference electrodes such as 632
manganese oxide MnO2, activated-carbon and graphite electrodes or pseudo-reference electrodes 633
with graphene-cement composites have shown a good stability in concrete for several months or 634
years [275–278]. Silver-based screen-printed electrodes provide another cost-effective sensing 635
system [279]. This is particularly interesting for new structures as the electrodes can directly be 636
embedded during their construction, and for existing structures after maintenance actions [280]. As 637
the pore solution ensures the electrolytic contact with embeddable electrodes, the contact 638
resistance is less problematic and the liquid junction potential is expected to be more constant over 639
time, which can then improve the quality of the data. However, the system is less flexible as the 640
electrodes are fixed. 641

25
As the inspection of RC structures can be challenging, recent advances have indicated the feasibility 642
of using climbing robots/flying drones for the monitoring of the corrosion potential [281]. The 643
advantages of this approach are to guarantee the operator safety, especially in locations hardly 644
accessible, and potentially to decrease the global cost of inspection. 645
4.1.2. Interpretation of results and recommendations 646
As corrosion is non-uniform along the rebar, differences in electrochemical and streaming potential 647
values are expected between actively corroding and passive areas. The distribution of the 648
equipotential lines in the material will be affected by the electric current flowing between these 649
areas. Hence, the use of the half-cell potential technique requires the definition of a grid of 650
measurements on the structure. The measured values can widely range in the water stability domain. 651
Irrespective of the reference electrode used, they should be reported versus the standard hydrogen 652
electrode (SHE) at the measurement temperature. The results can be presented as table, map or in 653
statistical representations, depending on the size of the element and the number of data acquired 654
[282]. 655
The first version of the ASTM C876 standard recommended to interpret the corrosion potential 656
based on the absolute values for evaluating the probability of corrosion in the measured area [283]. 657
For values over -200 mV/CSE (≈116 mV/SHE), the probability of steel corrosion activity is less than 658
10%. For values below -350 mV/CSE (≈-34 mV/SHE), the probability of steel corrosion activity is over 659
90%; in between the probability of such activity remains uncertain. 660
For a better insight into areas with a high corrosion risk, the RILEM recommendations (2003) [282] 661
and the revised ASTM C876 standard (2009) [283] advise the use of potential gradients rather than 662
absolute potential values. The proposed methodology consists of mapping the potential of the entire 663
area of inspection and comparing the relative potential values. This requires the definition of an 664
accurate grid of measurements points, as a decrease in grid space increases the probability of finding 665
the precise location of actively corroding spots [284]. If the grid size remains regular during 666
measurements, it is also possible to use statistical representations, e.g. histograms, frequency 667
distribution or cumulative probability plot, in order to compare more globally different parts of the 668
structure [282]. Also, even if there is no electrical continuity along the rebar, meaningful information 669
about macrocell corrosion can still be obtained using potential gradients [285]. 670
4.1.3. Relation to corrosion rate 671
Many studies have tried to relate the corrosion potential to the corrosion rate, but no quantitative 672
correlation has been found. When measurements are made in highly controlled conditions (RH, T), a 673
robust correlation exists between the two parameters for small specimens, especially for the high 674
corrosion probability range [286]. However, in field investigation, the environmental factors cannot 675
be so controlled. In addition, measurements are influenced by several other factors, e.g. concrete 676
conditions (geometry, resistivity, cover depth, presence of cracks), the composition of the pore 677
solution (pH, chloride or sulphide content), the condition of the steel rebar (cathode-to-anode ratio), 678
and the availability of oxygen near the steel surface [168,272,284,287,288]. For example, very 679
negative potential values can simply be the results of a low level of oxygen. Hence, it is strongly 680
recommended to perform measurements at once in short time, as much as possible, in order to limit 681
any variation of these influencing factors. Despite being one of the most used technique for 682

26
corrosion monitoring in field, the half-cell potential technique must be used only as a qualitative test 683
for locating areas with a high corrosion risk on RC structures. 684
4.2. Concrete resistivity 685
Concrete resistivity (ρ, expressed in Ω m)—also referred to as electrical resistivity—is the ability of 686
the material to oppose electrical circulation [289]. The initial resistivity of concrete is generally 687
between 10 and 106 Ω m [290,291]. This value is mainly influenced by the w/c ratio, the type of 688
binder, the size of the aggregates and the conditions of curing and storage, as they affect pore 689
solution composition and concrete porosity [291,292]. Both parameters are important as they govern 690
the corrosion process. Due to concrete degradation by the ingress of aggressive agents or the 691
formation of corrosion-induced cracks, the resistivity is expected to change during the entire service 692
life of RC structures. It is thus necessary to monitor concrete resistivity over time to assess the 693
evolution of corrosion process. 694
4.2.1. Measurement 695
The resistivity is directly linked to the concrete resistance RΩ (Ω) with the following equation (Eq. 2): 696
(Eq. 2)
where ΔV is the potential difference (V), I is the injected current (A), and k is a geometric factor (m) 697
that depends on the geometry and size of the sample, but also on the experimental device. Indeed, 698
different procedures exist for measuring concrete resistivity [291]. In the bulk resistivity cell (uniaxial 699
configuration, Fig. 9a), two parallel metal plates with moist sponges or a conductive gel, placed at the 700
ends of the concrete sample, apply a current and the resulting potential difference on the two plates 701
is measured [293]. In this case, the geometric factor k is (Eq. 3): 702
(Eq. 3)
where A is the cross-sectional area perpendicular to the current (m²) and L is the sample length (m). 703
Even if the measurement of resistivity is rapid, this technique is used in laboratory experiments but 704
hardly applicable to field work. The resistivity can also be measured using a four-electrode device 705
(generally equipped with stainless-steel probes) on the concrete surface, in which two electrodes C1 706
and C2 inject a current and two electrodes P1 and P2 measure the resulting potential difference. Two 707
systems are commonly used, the linear four-point probe and the square-array four-point probe, but 708
other configurations, for example with embedded probes, exist as well [294]. In Wenner 709
configuration (Fig. 9b), where C1 and C2 are the two external electrodes and P1 and P2 are the two 710
internal electrodes with a similar probe spacing a (m), the geometric factor is (Eq. 4): 711
(Eq. 4)
It is important to note that the use this relation assumed that the concrete is homogeneous and 712
isotropic with a semi-infinite geometry, which is not the case for small concrete samples. To correct 713
boundary effect and determine accurate geometric factors, it is possible to perform numerical 714

27
simulations to determine a correcting factor for Eq. 4 [295] or to calibrate the device using an 715
electrolyte of known resistivities in a core holder of similar geometry than the concrete sample. 716
717
Figure 9. Schematic representation of the resistivity measurement. (a) Bulk resistivity, (b) Surface resistivity in 718
the Wenner configuration (typically, a = 5 cm). 719
The material and size of the electrodes and the way the electrolytic contact with the concrete surface 720
is made can also affect the measurements, as can the measuring frequency. If the concrete resistivity 721
can be measured either in DC or in AC mode, measurements are generally made in AC mode to avoid 722
electrodes polarization [290,296]. Generally, measurements are carried out in the frequency range of 723
0.5 to 10 kHz in the bulk configuration, and in the range of 0.01 to 10 kHz in the Wenner 724
configuration [297]. Impedance spectroscopy must be done to determine the frequency at which the 725
imaginary part of the impedance (reactance) is minimum to correctly assess the concrete resistance. 726
This frequency must be defined case by case as it varies with concrete microstructure and moisture 727
conditions. 728
4.2.2. Relation to concrete durability 729
From the concrete resistivity, one can determine the formation resistivity factor FR, that represents 730
the microstructural aspect of the concrete [294], according to the modified parallel law (Eq. 5): 731
(Eq. 5)
where φR is the porosity of the system and is the connectivity of the pore system, ρ is the 732
resistivity of the bulk sample, and ρ0 is the resistivity of the pore solution [298]. The formation factor 733
is also defined as the ratio of the resistivity of the bulk sample and the resistivity of the pore solution 734
[299]. It can thus be used for determining the capillary porosity and pore tortuosity of fresh and 735
hardened concrete [300,301]. This factor is also related to the diffusion coefficient through the 736
Nernst-Einstein relationship (Eq. 6) [302,303]: 737
(Eq. 6)
where D0 is the self-diffusion coefficient of the ionic species in water (e.g. D0=2.032 10-9 m² s-1 for Cl-) 738
and D is the effective diffusion coefficient (m² s-1). After determining the resistivity of the pore 739

28
solution experimentally or theoretically [304–306], the diffusion coefficient of chloride in concrete 740
can be determined in order to estimate the time to corrosion initiation by using Fick’s second law of 741
diffusion [294,307]. It is also possible to combine the formation factor with Langmuir or Freundlich 742
adsorption isotherm, and to predict either chloride ingress with the Nernst-Planck equation 743
[308,309] or the apparent chloride diffusion coefficient in concrete [310]. The use of concrete 744
resistivity therefore is a good indicator of the concrete durability in terms of ion diffusivity and fluid 745
transport [311–313]. 746
The measurement of concrete resistivity is influenced by several parameters that can adversely 747
affect the determination of the formation factor. The main such factors are water content and 748
temperature; an increase in one of these two increases the ionic transport in the pore solution and 749
decreases the resistivity of the concrete [291,314–316]. The effect of temperature is even more 750
complicated as it also affects the solubility of the hydrated phases in concrete, resulting in a change 751
in pore solution composition [317]. Normalization of the temperature effect on concrete resistivity 752
has been used for predicting the resistivity variation due to temperature changes [318]. As the 753
concrete surface interacts directly with the surrounding atmosphere, the exposure conditions must 754
be correctly defined as they will impact the concrete resistivity and create a resistivity gradient. As 755
discussed in Section 3.2.1, concrete carbonation results in a progressive change of the concrete 756
microstructure, also creating a resistivity gradient in the concrete [319]. 757
When using a four-electrode configuration, other parameters must be considered when performing 758
the measurement as some assumptions are made to interpret the data, i.e. concrete is homogeneous 759
and isotropic with a semi-infinite geometry [320]. The size and geometry of the specimen must then 760
be considered accurately for determining the geometrical factor k as the assumption of a semi-761
infinite medium cannot be respected for small samples [314,321]. In addition, the presence of cracks 762
and the distribution of aggregates in the concrete are inconsistent with a homogeneous and isotropic 763
material [291]; regardless of the type of cracks, the measurements will be under- or over-estimated if 764
they are made nearby [322]. Finally, the presence of rebar affects the measurement of resistivity as a 765
distortion of the current field or a short-circuit are likely to occur (known as rebar effect) 766
[291,323,324], decreasing the part of the current flowing only in the concrete. Several studies have 767
shown that the rebar diameter and spacing, the concrete cover depth, the direction of the probe, the 768
probe spacing and the distance from the rebar all affect the measurements [295,324–332]. Hence, 769
the recommendation suggests measuring the concrete resistivity as far as possible from the 770
reinforcement to obtain the most accurate value [290,296]. If measurements are performed close to 771
the rebar mesh, the most suitable configuration to determine the resistivity has the probe located 772
parallel to and midway between the top rebars [329]. If measurements are done in front of a rebar, a 773
rebar factor can be defined and applied in Eq. 4 for correcting the resistivity for the rebar effect 774
[295,333]. 775
4.2.3. Relation to corrosion rate 776
Many studies have tried to correlate concrete resistivity with corrosion rate of steel, as the rate-777
determining step of corrosion can be related to the ionic transport between anode and cathode 778
which is dependent on concrete resistance [334]. It is generally assumed that the corrosion rate is 779
inversely proportional to concrete resistivity, especially when corrosion is in active state [334–339]. 780
According to RILEM recommendation, the risk of corrosion is high when concrete resistivity is lower 781

29
than 100 Ω m and negligible when it is higher than 1000 Ω m for OPC concrete [290,296]. However, it 782
is not specified whether these values consider the rebar effect while it highly decreases the 783
measured apparent resistivity. Even if a wide scatter exists [105], accurate correlations between the 784
two parameters have been proposed [340,341] and empirical correlations have also been 785
successfully determined for the monitoring of real structures (e.g. [342]). However, this apparent 786
relationship does not mean that the resistance of concrete dominates the overall resistance of the 787
process. In fact, it can be attributed to the degree of pore water saturation as both parameters are 788
influenced by the water content. Indeed, increasing the water content lowers concrete resistivity and 789
increases corrosion rate, and vice versa [170]. 790
If the RILEM recommendation is still commonly used, the range of resistivity values for assessing 791
corrosion activity varies with the studies. For example, the limit of resistivity values indicating high 792
corrosion intensity varies between 50 and 200 Ω m, while the limit of resistivity values indicating low 793
corrosion intensity varies between 85 and 2000 Ω m [334]. This discrepancy can notably be related to 794
the influence of the type of binder on the absolute value of resistivity [334]. It has been shown that a 795
rebar can corrode at relative similar rates when embedded in a low resistive mortar prepared only 796
with Portland cement or in a high resistive mortar prepared with a mix of Portland cement and fly 797
ash [343]. If the cement type is known, the absolute resistivity can be compared to reference value 798
for that cement type obtained in laboratory in the relevant exposure conditions to determine more 799
accurately the risk of corrosion [105,290]. Otherwise, it is very challenging to use these critical values 800
in the case of existing structures with lacking information about their composition. Finally, we must 801
remember that the specimen size has a great influence on the corrosion process [211], which can 802
explain the scatter between laboratory and field experiments. 803
Hence, no general correlation between concrete resistivity and corrosion rate could be determined 804
[337,343–345]. It has also been shown that concrete resistivity and corrosion rate evolve differently 805
with temperature, the first following an Arrhenius-type equation [346] and the second following the 806
Eyring law [347], which could also explain the absence of a general correlation between them. To 807
sum up, the use of concrete resistivity can be interesting for evaluating non-destructively the risk of 808
corrosion and estimating the range of corrosion rate when the cement type is known. It is also 809
possible to compare the gradient in resistivity to obtain a meaningful information on the risk of 810
corrosion, as for the half-cell potential technique. However, it cannot be used as a unique method for 811
determining precisely the corrosion rate. It is nevertheless a parameter of prime interest that must 812
be measured as accurately as possible for further determination of the corrosion rate, as discussed in 813
sections 4.3.1 and 4.3.2. 814
4.2.4. Interest of electrical tomography 815
The concrete resistivity measured as presented in the above sections corresponds to an “apparent” 816
resistivity that considers all elements in the investigated area. Therefore, this value only reflects an 817
average value on a defined volume and does not consider the inherent heterogeneity of concrete 818
[348]. A multi-electrode device, consisting of an assemblage of single devices with four electrodes, 819
can be used to perform an electrical resistivity tomography (ERT) of the concrete [348,349]. With 820
such method, it is possible to determine the resistivity at different levels/depths in order to 821
reconstruct the spatial distribution of the resistivity in the material (Fig. 10). Results are presented as 822
pseudo-sections showing the distribution of apparent resistivities in the material. Inversion models 823

30
are then required to determine the “true” resistivities at the corresponding depth of the concrete 824
from the measured apparent resistivities. Softwares such as Res2Dinv and Res3Dinv are commonly 825
used for such inversion, especially in geophysics [350], but further research is required to define a 826
standardized method for measuring and inversion modelling in reinforced cement-based materials 827
[351]. After performing the inversion algorithm, pseudo-sections of true resistivities are obtained. As 828
a result, the rebar effect observed on the apparent resistivities has been removed as the resistivities 829
are now correctly distributed in the volume [352]. 830
831
Figure 10. Schematic representation of a multi-electrode device in Wenner configuration for ERT 832
measurements. Several probes spacing, e.g. a, 2a and 3a as shown in the figure, are required to investigate the 833
concrete section in depth. A 2D pseudo-section of true resistivities after inversion with Res2Dinv is also 834
provided to illustrate possible results. Courtesy: J. Gance. 835
One limitation when performing ERT is the variation in contact resistance between the electrodes 836
and the concrete surface, which affects the quality of the obtained data. Systems using embeddable 837
electrodes are being developed to ensure a good electrolytic contact during the entire measurement 838
[353,354]. Other limitation concerns the low spatial resolution of electrical tomography [351]. It has 839
to be noted that the probe configuration has an impact on the sensitivity of the measurement: for 840
example, the Wenner array has a good sensitivity to vertical changes but a low sensitivity to 841
horizontal changes [350]. Thus, using several probe configurations and spacing, complementary data 842
may be obtained to increase the data quality and the spatial resolution. An accurate grid of 843
electrodes is thus required for the monitoring of RC structures. 844
Studies have shown that ERT can be used to visualize the carbonation process, the ingress of water 845
and chloride and all transport properties in the material over time, in both undamaged and cracked 846
cement-based materials [351,355–358]. Indeed, for Portland-based materials, an increase in 847
concrete resistivity can generally be attributed to the carbonation front due to pore clogging while a 848
decrease can be attributed to the ingress of water and chlorides or the formation of cracks. However, 849
all these phenomena are susceptible to occur simultaneously depending on the exposure 850
environment. It is then necessary to determine first the influence of each phenomenon separately on 851
the range of resistivity values in order to determine if it is possible to differentiate the contribution of 852
each parameter on the resistivity profile. ERT measurements must be done over time to compare the 853
relative evolution of resistivity pseudo-sections to determine the actual level of concrete 854
deterioration. The results could also be used to determine the diffusion of CO2, carbonates and 855

31
chlorides in the material to better predict the length of the initiation stage. During the propagation 856
stage, ERT measurements could give insights on the water content of the material, especially in the 857
vicinity of the rebar, to determine if steel corrosion occurs in wet or dry conditions at the time of the 858
measure. Despite all these opportunities, many challenges in electrical tomography remain open to 859
its applicability in field studies [351]. 860
4.3. Polarization resistance 861
Polarization resistance (Rp, expressed in Ω) is the resistance of the rebar to oxidation during the 862
application of an external potential, i.e. during polarization of the rebar. Several electrochemical 863
methods have been developed for determining Rp [105,338,359], using three- or four-electrode 864
configurations. The different techniques discussed hereafter are based on the application of an 865
external perturbation on the system to polarize the rebar. The electrochemical noise technique, 866
which appears as a great tool for corrosion analysis because measurements are performed without 867
any electrical perturbation, is not discussed as its applicability to RC structures is still limited. 868
4.3.1. Measurement in three-electrode configuration 869
In the three-electrode configuration, the electrochemical system consists of a working electrode 870
(WE) —the steel rebar—, a reference electrode (RE, as described in section 4.1.1) used for measuring 871
the rebar potential, and a counter electrode (CE, generally stainless steel, titanium or platinum) that 872
closes the electrical circuit (Fig. 11). Providing a description of the electrode configuration is 873
important as all three electrodes can influence the measurement [360,361]. Hence, data on the type 874
and position of the RE, the material and the geometry of the CE, and the use of surface electrodes 875
with a specific electrolytic contact or embedded electrodes should be provided in all studies [362]. 876
877
Figure 11. Schematic representation of a three-electrode configuration. (a) For laboratory experiments, 878
measurements are generally performed on small samples in solution using a potentiostat-galvanostat; the 879
rebar acts as the working electrode (WE), the reference electrode (RE) is generally a saturated calomel 880
electrode (SCE) and the counter electrode (CE) is a mesh cylinder that surrounds the sample to homogenize as 881
much as possible the current distribution in the material. Alternatively, RE and CE can be embedded in 882
concrete. (b) In the field, measurements are generally made with a commercial device equipped with a RE in 883
the centre and a CE (disc with inner and outer diameter), both placed on a moist sponge on the concrete 884

32
surface. Optionally, an auxiliary electrode known as the guard ring is used to supposedly confine the current to 885
a known area of steel. 886
The linear polarization resistance (LPR) technique consists of applying a small potential sweep on the 887
rebar around its open circuit potential (generally OCP±10-20 mV, either in the anodic or in the 888
cathodic direction) and recording the resulting current (Fig. 12) [117,363]. Alternatively, the 889
measurement can be made by applying a current sweep and recording the resulting potential [364]. 890
Polarization resistance is given by the tangent for zero net current of the potential-current curve 891
(Eq. 7). 892
(Eq. 7)
Please note that the slope is not directly equal to Rp, but represents the sum of polarization 893
resistance and concrete resistance [16]. It is therefore necessary to compensate the ohmic drop RΩ to 894
determine IR-free values of Rp [105,365]. If another technique must be used in complement to 895
determine RΩ, some instrumentation directly incorporates an automatic compensation of the ohmic 896
drop. 897
898
Figure 12. Example of an LPR measurement in the cathodic direction from +20 mV to -20 mV vs. OCP. (a) 899
Evolution of the potential with time applying a potential sweep of 10 mV min-1
, (b) Evolution of the potential 900
with a current during the potential sweep, allowing the determination of Rp. 901
The sweep rate is a critical parameter for accurate evaluation of the polarization resistance, as it is 902
required that the system is stabilized at each potential during the measurement. Typically, in 903
agreement with gravimetric mass loss (ASTM G1 standard), a reliable measurement of Rp for active 904
corrosion (i.e. current density values over 1 µA cm-2) can be obtained using a sweep rate between 2.5 905
and 10 mV min-1 in potentiodynamic mode [105], 10 mV min-1 being the common recommended 906
value (ASTM G5 standard). However, in the case of passive reinforcements, the corrosion current 907
density is overestimated by a factor of between 2 and 10 compared to the gravimetric study using 908
this sweep rate value [366]. To obtain a closer value than that expected for passive corrosion (i.e. 909
below 0.1 µA cm-2), slower sweep rates—even less than 2.5 mV min-1—should be used. In controlled 910
conditions such as in laboratory experiments, this is not a problem as the time required for 911
measuring generally is not a limiting factor, and LPR experiments can be systematic. However, for 912
field investigations, as the measurement time is a critical parameter, the results obtained for passive 913
40
50
60
70
80
90
0 50 100 150 200 250
E (m
V/S
HE)
t (s)
40
50
60
70
80
90
-6 -4 -2 0 2 4 6
E (m
V/S
HE)
I (µA)
OCP
(a)
Rp (+RΩ)
(b)

33
rebar must be used with care as the polarization resistance will probably be underestimated 914
[366,367]. 915
The second method used for determining Rp is the pulse technique. The measurements are generally 916
made in galvanostatic mode [368,369], but they can also be done in potentiostatic [370–372] or 917
coulostatic mode [373,374]. In the galvanostatic mode (galvanostatic pulse, GP), a low anodic DC 918
current (generally Iapp=5-500 µA) is applied to the reinforcement during a short time (typically 5-30 s 919
for active corrosion) in anodic or cathodic direction and the transient potential is recorded until 920
stabilization [105]. Rapidly after the polarization, a strong potential increase occurs due to the ohmic 921
resistance of the concrete; a further progressive increase until reaching a steady state occurs 922
afterwards due to the electrical double layer effect (Fig. 13). For validating the assumption of 923
linearity between current and potential, the potential shift should not exceed 20 mV [105]. When the 924
current is turned off, a similar behaviour as that recorded during the charge occurs during discharge. 925
926
Figure 13. Example of GP measurement in the anodic direction showing the injection of 50 µA during 30 s and 927
the evolution of ΔE with time during (A) the charge (current applied) and (B) the discharge (no current applied). 928
Based on the Randles circuit, which consists of the ohmic resistance RΩ in series with a parallel 929
combination of the double layer capacitance Cdl and the polarization resistance Rp, the polarization at 930
any time t can be expressed as (Eq. 8): 931
(Eq. 8)
The expression is generally linearized for calculating Rp and Cdl (Eq. 9): 932
(Eq. 9)
where Emax is the steady-state potential value. A curve fit can also be used for calculating the 933
different parameters (Eq. 10): 934
(Eq. 10)
0
10
20
30
40
50
62
64
66
68
70
72
0 10 20 30 40 50 60
I (µ
A)
E (m
V/S
HE)
t (s)
I*RΩ
I*Rp (ΔE<20 mV)
(A) (B)

34
Alternatively, a modified Randles circuit using a parallel combination of a constant phase element 935
(CPE) and a polarization resistance Rp in series with a Warburg element ZW, can be used for modelling 936
the steel-concrete interface [375]. 937
The area of the rebar that is polarized during measurement must be determined for an accurate 938
conversion of the polarization resistance in corrosion rate. An auxiliary electrode—known as the 939
guard ring (Fig. 11b)—is often used for confining the polarization to a known surface of the rebar, 940
generally assumed to be the area below the counter electrode [376]. When modelling galvanostatic 941
pulse measurements with a finite-element method, it was shown that in the case of uniform 942
corrosion, for small concrete samples with one carbon steel rebar, a decrease in concrete resistivity 943
or an increase in cover depth result in an increased lateral dispersion of the current on the rebar, i.e. 944
in a decrease in the part of the current under the counter electrode, both in the presence (see [377]) 945
or absence (see Fig. 14) of a guard ring. Thus, assuming that only the area below the CE is polarized, 946
only a fraction of the total current impressed by the counter electrode must be considered for a 947
correct assessment of polarization resistance, this fraction depending mainly on concrete resistivity, 948
cover depth, the geometry of the CE and the size of the sample (border effects). 949
950
951
Figure 14. Effect of concrete parameters on the distribution of current density along the upper ridge (the most 952
strongly polarized part) of the rebar using the GP technique in the case of uniform corrosion (i0=10 µA cm-2
). (a) 953
Concrete resistivity ρ (Ω m) for 4 cm cover depth, (b) Cover depth (cm) for ρ=200 Ω m. Simulations solved a 954
secondary current distribution in a temporal study (evaluated here at 30 s) with a finite-element method using 955
COMSOL Multiphysics 5.3a software. The dimension of the concrete domain was 55x34x13 cm3 with one low-956
carbon steel pure iron rebar (Φ=12 mm, σ=5.106 S m
-1). The concrete domain acts as the electrolyte with 957
uniform conductivity and electric isolation at the external boundaries of the material. Potential and current 958
density distribution were solved with Ohm’s law and charge conservation law in the concrete domain with 959
0
0,005
0,01
0,015
0,02
0,025
0,03
0,035
0 0,1 0,2 0,3 0,4 0,5 0,6
Cu
rre
nt
de
nsi
ty (
A m
- ²)
Lrebar (m)
0
0,005
0,01
0,015
0,02
0,025
0,03
0,035
0 0,1 0,2 0,3 0,4 0,5 0,6
Cu
rre
nt
de
nsi
ty (
A m
- ²)
Lrebar (m)
(c)
(a) (b)
dCE
dCE
CE
2 cm
4 cm
6 cm
8 cm
10 Ω m
20 Ω m
50 Ω m
100 Ω m
200 Ω m
500 Ω m
1000 Ω m
2000 Ω m

35
extremely fine mesh. The corrosion reaction on the steel surface was modelled as boundary condition 960
(electrode surface) using the general Butler-Volmer equation (Eq. 1, with αa=αc=0.5, Ecorr=-0.78 V, T=20 °C). (c) 961
The counter electrode of the GP device was modelled using several geometries, here shown as a 7-cm-962
diameter cylinder on the concrete surface directly above the rebar centre. A current source was applied to the 963
counter electrode at 100 µA. The positive sign in the y-axis indicates anodic polarization. 964
In the case of passive rebar, longer times (>100 s) are needed to reach a steady-state potential 965
compared to active corrosion. This can be explained by the low capacity of the passive rebar to 966
consume an anodic polarizing current, resulting in the lateral propagation of current into the rebar, 967
especially when the latter is long [377]. Duration of the pulse is thus the most important parameter 968
in the determination of polarization resistance as it can be significantly underestimated with short-969
time measurements [377,378]. Hence, as for the LPR technique, the results obtained from GP 970
measurements in the field must be used with care in the case of passive reinforcements if the steady-971
state potential is not reached. 972
In the case of a non-uniform corrosion, where anodic and cathodic zones are spatially separated but 973
electrically connected, the direction and magnitude of polarization will affect the current distribution 974
on the rebar [379]. Generally, in anodic polarization mode, the anodic zones will receive more 975
current per area than the cathodic zones, while the opposite is true in cathodic polarization mode 976
[377,379]. Due to the different ohmic and capacitive contributions of the anodic and cathodic areas, 977
it is important to consider the spatial and time-dependent distribution of the impressed current to 978
correctly interpret the results obtained from GP measurements [380]. 979
The third method to determine Rp is electrochemical impedance spectroscopy (EIS) [381,382]. This 980
consists of applying a small-amplitude alternating potential difference (5-20 mV peak-to-peak) or 981
current at different frequencies f and measuring the resulting current or potential, respectively. For a 982
potential modulation (Eq. 11): 983
(Eq. 11)
the current response is (Eq. 12): 984
(Eq. 12)
where ω is the angular frequency (rad, with ω=2πf) and φ is the phase (°). 985
In AC condition, the property related to the opposition of a circuit to an electrical current is called 986
impedance (Z). Each circuit element, whether resistor, capacitor or inductor, has an impedance. If the 987
resistance created by a resistor is independent of the frequency (ZR=R), the resistance created by a 988
capacitor or an inductor depends on the frequency (ZC=
and ZL=jωL), creating a phase shift 989
between voltage and current. As the sinusoidal current or voltage can be represented as a rotating 990
vector, the impedance can be divided into two components, a real component and an imaginary one 991
(Eq. 13) [382]: 992
(Eq. 13)
where the real component is the resistance R and the imaginary one is the reactance X (conductance 993
or inductance). The modulus and phase of the impedance are then defined (Eqs. 14-15): 994

36
(Eq. 14)
(Eq. 15)
Different data plots are used to represent the results obtained by EIS. The Nyquist plot is obtained by 995
plotting Zre on the x-axis and -Zim on the y-axis (Fig. 15a). The Rp value is determined at low 996
frequencies where the plot intercepts the x-axis (on the right side of the plot), considering the 997
concrete resistance that is determined at high frequencies (on the left side). The Bode plot is 998
obtained by plotting log(f) on the x-axis and |Z| or φ on the y-axis (Fig. 15b). On a Bode plot using the 999
Z modulus, the Rp value is determined according to the low-frequency plateau (on the left side), by 1000
considering the concrete resistance that is determined at high frequencies (on the right side). In 1001
practice, only part of the low-frequency loop is obtained, and the plot must be extrapolated for 1002
obtaining the Rp value by using an equivalent electrical circuit (EEC) [375,383,384]. Selection of the 1003
EEC is crucial to accurately evaluate the corrosion process. Among the different EECs [385–387], 1004
some of the most used for simulating steel corrosion in concrete—involving several resistances and 1005
capacitors representing the properties of the electrolyte, the corrosion reaction or even the passive 1006
film—are shown on Fig. 15c. Commonly, the capacitive elements are replaced by constant-phase 1007
elements (CPE, also noted Q) to consider the non-ideal behaviour of the physical elements (leaking 1008
capacitor, ZCPE =
) [388,389]. 1009
1010
1011
Figure 15. Example of (a) Nyquist plot and (b) Bode plot obtained at 10 mV RMS between 104 and 10
-1 Hz with 1012
10 points per decade using a dummy cell with parameters R1=1000 Ω, R2=10000 Ω and C=1 µF. (c) Examples of 1013
electrical equivalent circuits for fitting the experimental results in the case of steel corrosion in concrete, from 1014
left to right: R(QR), R(QR)(QR) and R(Q(R(QR))). In addition to the resistance of the electrolyte, the polarization 1015
resistance and the double layer capacitance, the additional parameters can be attributed to the passive film. 1016
0
4000
8000
12000
0 4000 8000 12000
-Zim
(Ω
)
Zre (Ω)
-60
-40
-20
0 0
4000
8000
12000
0,1 1 10 100 1000 10000
φ (
°)
|Z|
(Ω)
f (Hz)
(a) (b)
R1 R1 + R2 R1
R1 + R2
(c)
fc = 16 Hz

37
EIS is a powerful technique for mechanistic investigations as it can be used to determine several 1017
parameters, such as the bulk concrete properties at high frequencies [390–392], the mass-transfer 1018
phenomena and diffusion coefficients [393–395], or the properties of the passive film on the steel 1019
surface at low frequencies [90]. In alkaline solutions, it was shown that EIS measurements can 1020
provide insight into the mechanism of the cathodic reduction at the oxide layer of carbon steel, 1021
allowing characterization of the oxide film [396]. The proposed methodology includes the use of a 1022
power-law distribution and a complex capacitance representation of the data when using a CPE for 1023
describing the film impedance [396]. 1024
The main advantages of the two DC methods are the short time and “standard” equipment required 1025
for the measurements as compared to EIS. However, the latter generally provides a more accurate 1026
value of polarization resistance in the case of passive reinforcement [366]. If it is possible to limit the 1027
use of low frequencies to decrease to time required for analysis, the accuracy of the Rp value 1028
obtained in this case may be affected irrespective of the selected EEC. Alternatively, an analysis of 1029
the alternative current and potential in the time-domain can also be performed at only one selected 1030
frequency [397,398]. The methodology consists of a fast-Fourier transform and subsequent harmonic 1031
analysis of the time-domain signal. The advantage of the harmonic analysis is that it doesn’t required 1032
any conversion of the polarization resistance as it provides directly the corrosion current density and 1033
the Tafel constants, in addition to decreasing the measurement time. A good agreement with 1034
conventional techniques is found as long as the selected frequency is lower than the characteristic 1035
frequency fc, i.e. the frequency at which the imaginary component of the impedance reaches its 1036
maximum [398]. More studies are still required to demonstrate the applicability of this technique for 1037
the monitoring of RC structures. 1038
Several drawbacks in the determination of the polarization resistance with this three-electrode 1039
configuration exist for field experiments. First, the area of the counter electrode must be larger than 1040
the reinforcement to avoid any perturbation during measurement [361], which is hardly feasible in 1041
real structures. It is also difficult to assess the area of steel polarized during the measurement. 1042
Though the use of a guard ring with modulation has been proposed to confine the current below the 1043
counter electrode, many studies have shown that it often fails and contributes to the polarization of 1044
the rebar, thus compromising the measurement [156,377,379,399–404]. Notably, in the case of 1045
macrocell corrosion, the polarized area can be different than the supposed confinement area if the 1046
anodic site is located far from the counter electrode [402]. During anodic polarization, the current 1047
from the counter electrode and the guard ring will preferentially polarize the active area as the 1048
current follows the path of lowest polarization resistance. During cathodic polarization, this current 1049
will spread over the passive areas, showing the incapacity of the guard ring to effectively confine the 1050
current whatever the polarization direction [405]. Finally, the main drawback of this configuration is 1051
the need of an electrical connection to the rebar, requiring breakout of local parts of the concrete to 1052
make the measurement. Alternatives have thus been proposed to tackle this issue, as discussed 1053
hereafter. 1054
4.3.2. Measurement in four-electrode configuration 1055
Several techniques have been proposed for estimating the polarization resistance without 1056
connection to the rebar, which can be referred to as indirect polarization, using a four-electrode 1057
array on the concrete surface [366,406–413]. The most common one is the Wenner configuration, 1058

38
where the four electrodes are aligned with a constant electrode spacing (as already shown in Fig. 9b). 1059
Measurements can be done by imposing a direct current [414–416] or an alternative current at 1060
several frequencies [417–421]. The DC method can be referred to as indirect GP—similar to time-1061
domain induced polarization (TDIP) used in geophysics—while the AC method can be referred as 1062
indirect EIS—similar to spectral induced polarization (SIP) used in geophysics. 1063
The material of the potential electrodes can be an important parameter, especially for time-domain 1064
measurements. Indeed, the potential difference between two polarizable electrodes, e.g. stainless 1065
steel, is unstable due to self-potential. This self-potential must be accurately determined for 1066
correcting both polarization resistance and double layer capacitance obtained from the transient 1067
potential induced by the current injection. Electrodes of the second kind, e.g. Ag/AgCl or Cu/CuSO4, 1068
can be used as they are more stable, non-polarizable and thus have lower self-potential values than 1069
stainless steel [422]. The size and geometry of the electrodes may also influence the measurement. 1070
In four-electrode configuration, only a fraction of the current injected on concrete surface polarizes 1071
the rebar, the rest will flow exclusively in concrete. The current distribution in the material depends 1072
on the time or frequency of measurement and the state of the rebar. For an actively corroding rebar, 1073
the distribution is very similar at high and low frequencies due to the low polarization resistance, the 1074
current penetrating the rebar perpendicularly to its surface [411]. The current distribution is 1075
symmetric about the centre of the device, one side being anodically polarized and the other being 1076
cathodically polarized [377]. By numerical simulations, it was shown that an increase in the concrete 1077
resistivity, a decrease in the cover depth and a decrease in the rebar diameter result in the increase 1078
in the total current that reach the rebar [377]. In addition, the increase in the electrode spacing of 1079
the monitoring device increases the total current that reach the rebar and the polarized area 1080
(Fig. 16). 1081
1082 -0,04
-0,03
-0,02
-0,01
0
0,01
0,02
0,03
0,04
0 0,1 0,2 0,3 0,4 0,5 0,6
Cu
rren
t d
ensi
ty (
A m
- ²)
Lrebar (m) -0,1
-0,08
-0,06
-0,04
-0,02
0
0,02
0,04
0,06
0,08
0,1
0 0,1 0,2 0,3 0,4 0,5 0,6
Cu
rren
t d
ensi
ty (
A m
- ²)
Lrebar (m)
(a) (b)
C1 C2
C1
C2
10 Ω m
20 Ω m
50 Ω m
100 Ω m
200 Ω m
500 Ω m
1000 Ω m
2000 Ω m
2 cm
4 cm
6 cm
8 cm

39
1083
1084
1085
Figure 16. Effect of concrete and monitoring parameters on the distribution of the current density along the 1086
upper ridge of the rebar using the indirect galvanostatic pulse technique in case of uniform corrosion (i0=10 µA 1087
cm-2
). (a) Concrete resistivity ρ (Ω m) for 4 cm cover depth, Φ=12 mm and electrode spacing a=5 cm. (b) Cover 1088
depth (cm) for ρ=200 Ω m, Φ=12 mm and a=5 cm. (c) Rebar diameter (mm) for ρ= 200 Ω m, 4 cm cover depth 1089
and a=5 cm (d) Electrode spacing a (cm) for ρ=200 Ω m, 4 cm cover depth and Φ=12 mm. Details of the 1090
simulations and input parameters are on Fig. 14. The four electrodes of the Wenner device were modelled as 1091
perfect point objects on the concrete surface (e). Point current sources impressed 100 µA in C1 and -100 µA in 1092
C2. The positive sign in the y-axis indicates anodic polarization. 1093
For passive rebar, the distribution is quite different depending on the frequency. At high frequencies, 1094
the interface behaves essentially as a capacitance and the current penetrates the rebar 1095
perpendicularly to its surface as for actively corroding rebar, whereas at low frequencies the rebar 1096
acts as an insulator and only a small part of the current polarizes the rebar [411]. The current 1097
distribution is not symmetric due to the low capacity of a passive rebar to consume an anodic-1098
polarizing current compared to a cathodic-polarizing current. Hence, errors are expected when 1099
determining the polarization resistance. However, the system tends to become symmetric with 1100
increasing resistivity, resulting in a better estimation of the polarization resistance for highly resistive 1101
concrete (>5000 Ω m) [411]. The time required for reaching the quasi-steady-state is substantially 1102
less as compared to the conventional GP method, as shown by numerical simulations [406,412] and 1103
experiments (Fig. 17). 1104
-0,04
-0,03
-0,02
-0,01
0
0,01
0,02
0,03
0,04
0 0,1 0,2 0,3 0,4 0,5 0,6
Cu
rren
t d
ensi
ty (
A m
- ²)
Lrebar (m) -0,04
-0,03
-0,02
-0,01
0
0,01
0,02
0,03
0,04
0 0,1 0,2 0,3 0,4 0,5 0,6
Cu
rren
t d
ensi
ty (
A m
- ²)
Lrebar (m)
(c) (d)
C1 C2
C1 C1
C1
C2 C2 C2
(e)
C1
C2 P2 P1
6 mm
12 mm
18 mm
25 mm
5 cm
10 cm
15 cm

40
1105
1106
Figure 17. GP measurements using (a) three-electrode and (b) four-electrode configurations on a passive rebar. 1107
Experiments were done on a CEM I 52.5R (Lafarge) mortar sample (55x34x13 cm3, w/c=0.4) with one ribbed 1108
carbon steel rebar (60 cm, Φ=12 mm, cover depth 3.3 cm), at constant relative humidity (dry conditions, ≈30-1109
40% RH) and temperature (23 °C). In the three-electrode configurations (c), measurements were conducted 1110
with a mercury/mercurous sulphate reference electrode located at the centre of the sample, and a stainless-1111
steel counter electrode (55x10 cm) placed on moist sponges on the sample surface directly above the rebar. In 1112
the four-electrode configuration (d), stainless-steel or brass electrodes (Φi=3 mm, Φe=5 mm) were used in 1113
Wenner configuration, centred directly above and parallel to the rebar. The electrolytic contact was made with 1114
moist sponges placed inside the probes. Electrode spacing a was 5, 10 or 15 cm. A potentiostat-galvanostat 1115
(PMC-2000, Princeton Applied Research) was used for galvanostatic pulse measurements. The impressed 1116
current was 10 µA between rebar and counter electrode in the three-electrode configuration, while it was 1117
200 µA between C1 and C2 in the four-electrode configuration. The results indicate that a quasi-steady-state is 1118
not reached after 100 s in the three-point configuration, while it is almost reached after 30 s in the four-point 1119
configuration. 1120
This result could be explained by the fact that the current polarizing the rebar is not constant but 1121
decreases with time before reaching a constant value, which depends notably on the exchange 1122
current density i0 and concrete resistivity (Fig. 18). For a constant i0, the increase in concrete 1123
resistivity results (i) in an increase in the part of the current polarizing the rebar Irebar, as the current 1124
preferentially flows within the least resistive path (i.e. the rebar) and (ii) in a longer time required for 1125
reaching the quasi-steady state. For a constant resistivity, the decrease in the exchange current 1126
density i0 results in a decrease in the total current polarizing the rebar. 1127
0
5
10
15
20
0 20 40 60 80 100
∆E n
orm
(m
V)
t (s)
0
10
20
30
40
0 10 20 30
∆E n
orm
(m
V)
t (s)
5 cm
10 cm
15 cm
(a) (b)
(c) (d)
C1 P1 P2 C2
RE
CE
a = 15 cm

41
1128
1129
1130
Figure 18. Effect of current exchange density i0, considering uniform corrosion, on the current polarizing the 1131
rebar and on the potential measured between P1 and P2 (the ohmic drop is not shown here as the first point 1132
was normalized to 0 V), for a double layer capacitance of 0.2 F m-2
and for resistivities between 50 and 1000 Ω 1133
m. (a and b) i0=10 µA cm-2
(active corrosion), (c and d) i0=0.001 µA cm-2
(passive corrosion). Simulation details 1134
are on Figs. 14 and 16. The cover depth was fixed at 3.3 cm, like the laboratory sample presented on Fig. 17. 1135
The parameters for the Butler-Volmer equation are αa=αc=0.5 and Ecorr=-0.78 V for active corrosion and 1136
αa=0.012, αc=0.5 and Ecorr=0.16 V for passive corrosion. 1137
In the case of non-uniform corrosion, it has been shown that indirect EIS method in Wenner 1138
configuration can be used to localize highly corroding areas if they are beneath to or at the vicinity of 1139
the current-injecting electrodes, as two distinct time constants can be observed instead of one time 1140
constant in uniform corrosion [421]. The authors attributed the high-frequency response to the 1141
actively corroding section and the low-frequency response to the passive areas. Otherwise, when the 1142
corroding area is located beneath the potential probes, almost no sign of active corrosion is 1143
detected. The sensitivity of this method to localize non-uniform corrosion is dependent on the length 1144
of the actively corroding area, the magnitude of the corrosion rate, and the resistivity of the cement-1145
based material [421]. Using indirect GP method, it appears hardly possible to localize non-uniform 1146
corrosion based on a single measurement as a similar response is expected on the zero-frequency 1147
limit for both passive and localized corrosion [421]. It appears still possible to differentiate active and 1148
passive areas by performing several measurements along the rebar and comparing the results to a 1149
reference value. Reversing the polarization direction may also help to identify corroding areas. 1150
0
20
40
60
80
100
0 5 10 15 20 25 30
I re
bar
(µ
A)
t (s)
0
0,2
0,4
0,6
0,8
1
1,2
1,4
0 5 10 15 20 25 30
VP
1-P
2 (
mV
)
t (s)
0
20
40
60
80
100
0 5 10 15 20 25 30
I re
bar
(µ
A)
t (s)
0
50
100
150
200
250
300
0 5 10 15 20 25 30
VP
1-P
2 (
mV
)
t (s)
(a) (b)
(c) (d)
i0 = 10 µA cm-2
i0 = 0.001 µA cm-2
i0 = 10 µA cm-2
i0 = 0.001 µA cm-2

42
Indeed, in GP configuration, the cathodic and anodic zones will be primarily polarized near the 1151
cathodic and anodic probes, respectively [377]. However, even close to the cathodic probe, the 1152
anodic zones will receive more current per area than the cathodic zones, the magnitude depending 1153
on the cathode-to-anode ratio and the concrete resistivity [377]. It is then expected that the resulting 1154
potential difference will be different according to the polarization direction, but this aspect must be 1155
confirmed experimentally. 1156
Another advantage of the four-electrode configuration is the supposed self-confinement of the 1157
current in case of uniform corrosion when the rebar is long enough (>1 m), irrespective of concrete 1158
resistivity, cover depth, rebar diameter or exchange current density [411]. The sensitivity of the 1159
potential probes is different using the four-electrode compared to the three-electrode configuration. 1160
Even if a large section of the rebar is polarized, the potential probes may not be sensitive to changes 1161
that occur too far away from them. An effective polarized area which depends on the probe spacing 1162
can thus be defined [423]. If the highest sensitivity arrays are found near the potential electrodes, 1163
the measured potential difference differs depending on the probe configuration [350]. Thus, using 1164
several probe configurations and probe spacing, complementary data may be obtained to assess the 1165
different corrosion states on a single rebar [348]. 1166
Current developments of the four-electrode configuration are thus very promising, but the method is 1167
not mature and required further experimental and numerical studies. Some parameters that must be 1168
considered for its correct assessment include the contact resistance between the electrodes and the 1169
concrete surface, the non-uniformity of corrosion, and the presence of rebar mesh with different 1170
corrosion states. Also, all simulations presented previously assumed homogeneous cover depth and 1171
concrete resistivity. Gradients in concrete resistivity representative of RC structures must be applied 1172
for correct assessment of the current distribution in the material. As the sensitivity of the indirect EIS 1173
to detection of non-uniform corrosion has been demonstrated, the use of electrical tomography can 1174
be very useful to determine the distribution of the polarization resistance along large rebars and to 1175
estimate the length of the actively corroding area. Due to the similarity with concrete resistivity 1176
measurement device, the development of a multi-electrode device for characterizing both concrete 1177
resistivity and polarization resistance profiles using indirect polarization is of prime interest [424]. 1178
4.3.3. Relation to corrosion rate 1179
Polarization resistance can be used to calculate the corrosion current Icorr in order to estimate the 1180
corrosion rate of steel CR. According to RILEM recommendation [105], the corrosion current is 1181
determined using the Stern-Geary relation (Eq. 16) [363]: 1182
(Eq. 16)
where B is the Stern-Geary constant (V). If B is generally assumed to be 0.026 V for active corrosion 1183
and 0.052 V for passive corrosion of steel in concrete [425], these values do not reflect the 1184
complexity and variation with time of the corrosion process [426,427]. Accurate values of B should 1185
be determined empirically according to Eq. 17: 1186
(Eq. 17)

43
where a and c are the anodic and cathodic Tafel constants (V), respectively. The Tafel constants can 1187
be determined by applying a strong polarization to the electrode (OCP±150-250 mV) and recording 1188
the current. The two coefficients are determined by plotting log(I) as a function of the overpotential 1189
η (E-Eeq), according to the Butler-Volmer equation (Eq. 1). Unfortunately, the Tafel slopes are often 1190
not determined on field and can be difficult to measure accurately, mainly because the anodic part of 1191
the polarization curve is not always linear [168,428–431]. Moreover, the strong polarization during 1192
the Tafel scan can cause irreversible changes to the steel rebar, which is an important drawback of 1193
this technique [432]. Hence, the use of the recommended values of 0.026 and 0.052 V can still 1194
provide an accurate estimate of the corrosion current, with generally an error of less than one order 1195
of magnitude according to the experimental values of a and c reported in the literature 1196
[162,370,431,433]. 1197
Considering uniform corrosion, Faraday’s law is then often used for converting Icorr to CR (Eq. 18): 1198
(Eq. 18)
where CR corresponds to the mass loss (g s-1), Icorr is the corrosion current Icorr (A), M is the molar 1199
mass of iron (g mol-1), n is the number of electrons exchanged in the reaction (n=2) and F is the 1200
Faraday constant. In terms of corrosion penetration rate (cm s-1), the equation is (Eq. 19): 1201
(Eq. 19)
where A is the rebar surface (cm²) and ρsteel is the steel density (g cm-3). For example, considering 1202
uniform corrosion of black carbon steel, a current density (Icorr/A) of 1 µA cm-2 is equivalent to a 1203
corrosion rate of 11.6 µm year-1 [105]. 1204
Gravimetric weight-loss tests are often done according to the ASTM G1 standard to compare the 1205
results obtained by this direct and destructive method to the results obtained indirectly from the 1206
determination of the polarization resistance. It results that LPR, GP and EIS techniques can accurately 1207
estimate the corrosion rate for actively corroding rebars in laboratory conditions, as the polarized 1208
area is known [359,366,434]. As differences in Rp values can be observed depending on the choice of 1209
the technique and its operating conditions, e.g. sweep rate, waiting time, polarization time or applied 1210
frequencies [105,378,435], it may be useful to carry out all methods to determine the most efficient 1211
one for each case, or to obtain an average value [436]. For field experiments, as the polarized area is 1212
generally not known, the accuracy of these techniques can be limited as already developed in section 1213
4.3.1. In the four-electrode configuration, Fahim et al. have shown that the corrosion rate can be 1214
accurately estimated for active corrosion and even for passive corrosion in the case of a highly 1215
resistive concrete [377,411], confirming the great interest of this configuration. Further studies are 1216
still required to determine the applicability of this technique to quantify the corrosion rate on RC 1217
structures. 1218
We must note that the Stern-Geary relationship (Eq. 16) was defined for uniform corrosion on the 1219
basis of the mixed-potential theory by Wagner and Traud, which is fundamentally not applicable for 1220
the corrosion of steel in RC structures where macrocell corrosion is expected [156,426,437,438]. For 1221
a similar reason, the use of Faraday’s law for calculating the penetration rate is generally invalid, 1222
especially in the case of chloride-induced corrosion [439]. A new theoretical analysis has been 1223

44
proposed to calculate the corrosion rate of localized corrosion from GP measurements [380]. This 1224
approach can reduce the overestimation of the corrosion rate to a factor of maximum 2 instead a 1225
factor of 10 or more that can be obtained using the conventional Stern-Geary approach. Two 1226
elements that takes into account the different behaviour of the macrocell elements upon excitation 1227
are considered: the first is related to the fact only a fraction of the injected current flows through the 1228
anodic element and the second to the fact that this current is not constant over time during 1229
measurement. Both elements can be estimated empirically from the concrete resistivity, the cover 1230
depth and the steel surface area related to the concrete surface. As these parameters can be 1231
determined in RC structures, this approach appears feasible in engineering practice [380]. If this 1232
perspective has been proposed for the interpretation of GP measurements with the conventional 1233
three-electrode configuration, a similar approach should be done for the four-electrode 1234
configuration. 1235
4.4. Limitation on the evaluation of corrosion rate and interest of combining NDT methods 1236
The measurement of the polarization resistance only provides an instantaneous estimation of the 1237
corrosion rate, which is strongly dependent on the operating conditions. Hence, a single 1238
measurement cannot determine a representative annual corrosion rate if the daily and seasonal 1239
changes are not properly considered [439–441]. Considering environmental factors is essential for 1240
any accurate evaluation of the corrosion rate, in both laboratory and field studies. In real structures, 1241
the range of water content and temperature values will depend on the geographic location of the 1242
structures, and large variabilities are expected due to natural weathering through day-night and 1243
seasonal cycles, or natural wetting/drying cycles, resulting in gradients for both parameters 1244
[440,442]. 1245
However, changes in environmental conditions may not be directly observed inside concrete. Though 1246
temperature changes are rapidly reflected, even at thicknesses over 30 mm, this is not the case for 1247
RH changes for which only the surface layers are generally affected by drying processes [443–445]. 1248
Hence, temperature appears to be the primary climatic factor affecting the corrosion rate under 1249
atmospheric conditions [443]. It is important to note that the number and frequency of drying events 1250
can affect this conclusion, as the water content can become low even in depth if no wetting event 1251
occur for a long period [446]. The presence of cracks can also influence the effect of drying, which 1252
gives a greater importance of RH on the corrosion rate during corrosion propagation stage [446]. 1253
Finally, it appears that RH and T interact with each other, so they cannot be considered separately 1254
[447]. 1255
As both parameters can strongly vary, even over a single day, a measurement procedure must be 1256
defined for the accurate extrapolation of instantaneous measurements to annual corrosion rates and 1257
to incorporate the RH and T changes into service life models [448–450]. One solution is to carry out 1258
several measurements at specific times with very different conditions, at least four-times a year, to 1259
study the seasonal cycle for calculating an average value. A five-year study has shown that a power 1260
law is a good mathematical function to fit the experimental values of cumulative steel thickness loss 1261
over time for RC contaminated with chloride, exposed to both controlled and outdoor conditions 1262
[451]. This mathematical function can then be used for extrapolating the results to estimate the 1263
service life. 1264

45
Under passive conditions, no strong influence of RH and T on the corrosion rate was reported 1265
[447,452]. It should thus be possible to differentiate passive and active corrosion simply by 1266
measuring the minimum and maximum corrosion rates. However, in the case of active corrosion, 1267
instantaneous corrosion rates are more affected by RH and T, with maximum values measured in 1268
moist and low resistive concrete. In addition, the corrosion rate can be orders of magnitude higher 1269
for corrosion induced by chloride (up to 1 mm year-1) than by carbonation (up to 30 µm year-1) in 1270
outdoor exposure [453]. Determination of the corrosion rate in extreme cases, i.e. low T and RH or 1271
high T and RH, can provide information on the expected minimum and maximum corrosion rates 1272
specific for each structure [454]. However, as the average corrosion rate can be much lower than the 1273
maximum value, this range may be too imprecise to obtain any meaningful information on the 1274
remaining service life. 1275
Hence, it appears that determination of the corrosion rate based on measuring the polarization 1276
resistance should be complemented by other measurements. A multi-parameter approach 1277
combining electrical and other NDT methods should (i) reduce the errors resulting from 1278
measurements, and (ii) improve synergistically the estimation of service life of the reinforced 1279
concrete [5,455,456] (Fig. 19). First, a full surface inspection assesses the global state of the 1280
reinforced concrete. This includes a visual inspection of the concrete reporting any visible 1281
deterioration, e.g. surface cracks, delamination or rust [284,457]. The mapping of cracks, 1282
delamination and other defects in the concrete can be done with a crack-width ruler and acoustic-1283
wave techniques, including the impulse-response method, impact-echo testing or ultrasonic 1284
techniques [17,458–460]. The results of the surface inspection can be provided on photography and 1285
defines the main defect points for further investigations. 1286
Electromagnetic, elastic wave, optical sensing and infrared thermography methods are widely used in 1287
civil engineering for inspecting hard surfaces such as concrete [15,461–464]. They are mainly used for 1288
determining concrete cover depth and locating rebars with an estimate of their diameter [465]. 1289
Recent works have shown that capacitive technique and ground-penetrating radar (GPR) can also be 1290
used for monitoring rebar corrosion [466] and for providing information on water content 1291
[465,467,468] and chloride ingress [469,470]. Comparing the results obtained with ERT 1292
measurements, which can also be used to evaluate the water gradient, chloride penetration or 1293
carbonation depth [355,356], is of great interest to improve the reliability of the service life. It is also 1294
possible to complement these measurements by using embeddable chemical or optical-fibre sensors 1295
for the monitoring of pH, chloride concentration or temperature at several depths [338,471,472]. 1296
This is of great interest for assessing the initiation stage of corrosion, but their installation on existing 1297
structures can be challenging. At the end of this inspection, critical areas with a high corrosion risk 1298
can be determined. 1299
On the weak spots, an in-depth investigation must assess the corrosion rate by determining the 1300
polarization resistance during the propagation stage of service life. The determination of the water 1301
and ionic content in concrete using ERT or embeddable chemical/optical-fibre sensors should allow 1302
to consider the environmental factors and estimate the electrochemically active surface of steel to 1303
correctly convert the polarization resistance into corrosion rate. In addition to NDT measurement, 1304
core sampling can be done at different critical locations to perform gravimetric loss tests. Though this 1305
is a destructive method, further insights on the minimum and maximum corrosion rates and other 1306

46
parameters of importance, e.g. concrete compressive strength, can be obtained under controlled 1307
conditions in laboratory. 1308
Each technique provides specific information for crosschecking the results from other techniques. 1309
Data integration methods used in the operating system will further improve the overall quality of 1310
diagnosis [472], but the advantage and cost associated to each technique should be considered as 1311
well for determining the optimal methodology for each specific case. In the future, automated data 1312
collection by means of flying drones and climbing robots is expected to facilitate the inspection of RC 1313
structures and reduce the global cost of diagnosis [11]. The possibility of using a robotic device 1314
equipped with different NDT equipment is of prime interest to improve the evaluation of corrosion. 1315
1316
Figure 19. Procedure for the evaluation of RC structures by combining electrical and other NDT methods. 1317

47
5. Conclusions and perspectives 1318
We reviewed the current knowledge on corrosion mechanisms of carbon steel in concrete and the 1319
advances in electrical methods for non-destructive testing and evaluation of corrosion rates. One 1320
main challenge for understanding corrosion mechanisms is the heterogeneity of RC structures. 1321
Concerning cement-based materials, the knowledge of pore size distribution and pore 1322
interconnectivity is crucial as they affect the transport of aggressive agents and corrosion products 1323
through the material. Concerning steel rebar, the presence of local surface defects or inclusion 1324
substantially affects the electronic properties of the steel. The steel-concrete interface can then be 1325
very different even for replicate samples, resulting in a lack of data reproducibility. Consequently, the 1326
results obtained from different studies may be hardly comparable, especially where the description 1327
of materials and methods is incomplete. A systematic description of concrete and steel 1328
microstructures and of the operating conditions is required for the development of a database to 1329
improve our understanding of corrosion mechanisms. 1330
Most corrosion experiments are done in laboratory conditions considering uniform corrosion on 1331
small and artificial samples. As natural corrosion is a slow process, notably because of the potentially 1332
long initiation stage, accelerated tests are generally used for studying the corrosion mechanism 1333
induced by carbonation or by chloride. However, the properties of the steel-concrete interface may 1334
not be representative of natural corrosion. In addition, the corrosion process is affected by a size 1335
effect. Hence, extrapolating laboratory results performed with a single rebar to a large structure with 1336
interconnected rebars remains challenging, and special care must be taken regarding the design and 1337
preparation of the samples to obtain meaningful information for field application. 1338
Concerning corrosion mechanisms, the steel surface condition and local inhomogeneities at the 1339
steel-concrete interface appear to have an important effect on corrosion initiation. For actively 1340
corroding rebar, the water content and the pore size distribution around the rebar are crucial 1341
parameters when determining the electrochemically active surface for corrosion reaction. The 1342
corrosion rate increases during wetting exposure until the electrochemically active surface is water-1343
filled, and then decreases during drying exposure. The presence and distribution of corrosion 1344
products are further parameters controlling the corrosion rate, as they can diffuse away in the 1345
concrete and control the anodic reversible potential, or they can act as depolarizing agents instead of 1346
oxygen. Hence, for atmospherically exposed RC structures, it is believed that the corrosion process is 1347
under activation control. Irrespective of the depassivation mechanism, macrocell corrosion may be 1348
the main process due to local variations in environmental exposure or the presence of 1349
interconnected rebars with different properties in engineered structures. It is then required to 1350
determine the accuracy of the proposed mechanism on non-uniform corrosion to gain further 1351
insights in the corrosion of steel in RC structures. 1352
Regarding electrical methods, several techniques exist for determining corrosion potential, concrete 1353
resistivity and polarization resistance, which are used to assess the corrosion rate of steel. Despite 1354
being widely used, the half-cell potential technique must be used only to locate areas with a high 1355
corrosion risk as it does not permit a quantitative diagnosis of corrosion rate. Likewise, concrete 1356
resistivity is not directly related to the corrosion rate of steel. However, it is a good indicator of 1357
concrete durability in terms of water content and ion diffusivity. The use of electrical resistivity 1358
tomography allows to consider the inherent heterogeneity of concrete and provides more insights on 1359
transport phenomena in the material. It should then be possible to better predict both the initiation 1360

48
and the propagation stages for the assessment of the service life. Also, it has been shown that 1361
concrete resistivity influences the distribution of current within the concrete when performing any 1362
electrical measurement, so it is a parameter of prime importance for the determination of the 1363
corrosion rate. 1364
The polarization resistance Rp remains the most important parameter during the corrosion 1365
propagation stage as it provides quantitative information on the corrosion rate. Conventional three-1366
electrode configuration methods require a connection to the rebar to polarize it close to its natural 1367
steady-state. Good agreement with gravimetric loss for assessing the corrosion rate is well 1368
established for actively corroding rebar in laboratory. However, for passive rebar, the accurate 1369
determination of the corrosion rate can only be guaranteed when using low scan rates (<2.5 mV min-1370 1) using LPR, a long measurement time (>100 s) using GP, and low frequencies (<10-3 Hz) using EIS. 1371
For an accurate conversion of Rp into corrosion rate, the effective polarized area of the rebar must be 1372
known but its determination appears very challenging with this conventional configuration. Even if it 1373
was developed to that issue, the use of a guard ring is not recommended as it often fails to confine 1374
the current, thus compromising the measurement. Recent studies indicate that a four-electrode 1375
configuration without any connection to the rebar is suitable for indirect polarization of the rebar. 1376
This technique ensures a self-confinement of the current, which could be helpful for determining 1377
more accurately the effective polarized area. If more studies are still required for non-uniform 1378
corrosion, especially to quantify the corrosion rate, recent advances in the development of the four-1379
electrode configuration are promising for the assessment of non-uniform corrosion. Coupling 1380
experimental measurements with finite-element simulations appears essential to predict the 1381
remaining service life of RC structures. 1382
Some perspectives can be proposed: 1383
* More studies are still required to improve our understanding on corrosion mechanisms in both 1384
small-scale and large-scale structures. Alternatives for fabricating RC structures, e.g. 3D printing, 1385
may provide a solution for reducing the heterogeneity of the material; this can help to define an 1386
optimal formulation/design of concrete and to understand better corrosion mechanisms with 1387
samples of reproducible pore size distribution and steel-concrete interface conditions. 1388
* More fundamental studies are required to convert the polarization resistance into corrosion 1389
rate, as the Stern-Geary equation—defined for uniform corrosion—generally is invalid for 1390
natural corrosion in RC structures. Currently, even with an accurate measurement of the 1391
polarization resistance, errors in the corrosion rate are to be expected with this traditional 1392
approach. 1393
* More development on indirect polarization technique for measuring the polarization resistance 1394
is required for a complete non-destructive evaluation of corrosion on RC structures. It is 1395
required to develop monitoring device that can measure the distribution of concrete resistivity 1396
and polarization resistance in the material. The development of a single device capable of 1397
providing both parameters by electrical tomography is of great interest for the assessment of 1398
the service life of RC structures. 1399
* A standard procedure for assessing the service life of existing RC structures must be defined. The 1400
objective is to accurately estimate an annual corrosion rate based on instantaneous corrosion 1401
rates. Models that consider seasonal variations of T and RH with only a few measurements 1402
49
should be developed. For new structures, the use of various types of embedded sensors could 1403
be envisaged for automatic measurements of the environmental factors and for developing an 1404
Internet of Things (IoT) solution. 1405
List of symbols and abbreviations used in the text 1406
a Electrode spacing (m)
AC Alternating current
B Stern-Geary constant
Ccrit Critical chloride content, chloride threshold value
Cdl Double layer capacitance (F)
CE Counter electrode
CPs Corrosion products
CPE Constant phase element
CSE Copper-sulphate electrode
C-S-H Calcium silicate hydrate
DC Direct current
E Potential (V)
E0 Standard potential (V)
Ecorr Corrosion potential (V)
EEC Electrical equivalent circuit
EIS Electrochemical impedance spectroscopy
ERT Electrical resistivity tomography
f Frequency (Hz)
F Faraday constant (C mol-1)
GP Galvanostatic pulse
i Current density (A m-²)
I Current (A)
i0 Exchange current density (A m-²)
ITZ Interfacial transition zone
k Geometric factor (m)
LPR Linear polarization resistance
M Molar mass (g mol-1)
n Number of electrons
NDT Non-destructive testing and evaluation
OCP Open circuit potential (V)
OPC Ordinary Portland cement
R Gas constant (J mol-1 K-1)
RΩ Concrete resistance (Ω)
Rp Polarization resistance (Ω)
RE Reference electrode
RC Reinforced concrete
RH Relative humidity
SCE Saturated-calomel electrode
SHE Standard hydrogen electrode
t Time (s)

50
T Temperature (K)
ΔV Potential difference (V)
w/c Water-to-cement
WE Working electrode
X-ray µCT X-ray micro-computed tomography
Z Impedance (Ω)
αa, αc Anodic and cathodic charge transfer coefficients, respectively
βa, βc Anodic and cathodic Tafel constants, respectively
ρ Concrete resistivity (Ω m)
ω Angular frequency (rad)
Conflict of interest 1407
The authors declare no conflict of interest regarding the contents of the paper. 1408
Acknowledgments 1409
This study was funded by IRIS Instruments and BRGM as part of the Iris Béton project. The rebar 1410
vector design was found on Vecteezy.com. Dr H.M. Kluijver edited the English version of the 1411
manuscript. 1412
References 1413
[1] H. Van Damme, Concrete material science: Past, present, and future innovations, Cem. Concr. 1414 Res. 112 (2018) 5–24. https://doi.org/10.1016/j.cemconres.2018.05.002. 1415
[2] P. Mehta, P.J.M. Monteiro, Concrete: Microstructure, Properties, and Materials, Third Edition, 1416 McGraw-Hill Companies, Inc., New York, NY, USA, 2006. https://doi.org/10.1036/0071462899. 1417
[3] F. Bart, C. Cau-di-Coumes, F. Frizon, S. Lorente, Cement-Based Materials for Nuclear Waste 1418 Storage, Springer New York, New York, NY, 2013. https://doi.org/10.1007/978-1-4614-3445-0. 1419
[4] V. L’Hostis, R. Gens, Performance Assessment of Concrete Structures and Engineered Barriers 1420 for Nuclear Applications, Springer Netherlands, Dordrecht, 2016. 1421 https://doi.org/10.1007/978-94-024-0904-8. 1422
[5] J.P. Broomfield, Corrosion of Steel in Concrete: Understanding, Investigation, and Repair, E & 1423 FN Spon, 1997. 1424
[6] S. Ahmad, Reinforcement corrosion in concrete structures, its monitoring and service life 1425 prediction – A review, Cem. Concr. Compos. 25 (2003) 459–471. 1426 https://doi.org/10.1016/S0958-9465(02)00086-0. 1427
[7] L. Bertolini, B. Elsener, P. Pedeferri, R.B. Polder, Corrosion of Steel in Concrete: Prevention, 1428 Diagnosis, Repair, Wiley-VCH, 2013. 1429
[8] A. Poursaee, Corrosion of Steel in Concrete Structures, Elsevier, 2016. 1430 https://doi.org/10.1016/C2014-0-01384-6. 1431
[9] R. Fran ois, S. Laurens, F. Deby, Corrosion and its Consequences for Reinforced Concrete 1432 Structures, Elsevier, 2018. https://doi.org/10.1016/C2016-0-01228-7. 1433
[10] R.B. Polder, W.H.A. Peelen, W.M.G. Courage, Non-traditional assessment and maintenance 1434 methods for aging concrete structures - technical and non-technical issues, Mater. Corros. 63 1435

51
(2012) 1147–1153. https://doi.org/10.1002/maco.201206725. 1436
[11] U.M. Angst, Challenges and opportunities in corrosion of steel in concrete, Mater. Struct. 51 1437 (2018) 4. https://doi.org/10.1617/s11527-017-1131-6. 1438
[12] D.M. McCann, M.C. Forde, Review of NDT methods in the assessment of concrete and 1439 masonry structures, NDT E Int. 34 (2001) 71–84. https://doi.org/10.1016/S0963-1440 8695(00)00032-3. 1441
[13] H.-W. Song, V. Saraswathy, Corrosion monitoring of reinforced concrete structures - A review, 1442 Int. J. Electrochem. Sci. 2 (2007) 1–28. 1443
[14] S.K. Verma, S.S. Bhadauria, S. Akhtar, Review of nondestructive testing methods for condition 1444 monitoring of concrete structures, J. Constr. Eng. 2013 (2013) 1–11. 1445 https://doi.org/10.1155/2013/834572. 1446
[15] A. Zaki, H.K. Chai, D.G. Aggelis, N. Alver, Non-destructive evaluation for corrosion monitoring 1447 in concrete: A review and capability of acoustic emission technique, Sensors. 15 (2015) 1448 19069–19101. https://doi.org/10.3390/s150819069. 1449
[16] A. Poursaee, Corrosion measurement and evaluation techniques of steel in concrete 1450 structures, in: Corros. Steel Concr. Struct., Woodhead Publishing, 2016: pp. 169–191. 1451 https://doi.org/10.1016/B978-1-78242-381-2.00009-2. 1452
[17] S. Kashif Ur Rehman, Z. Ibrahim, S.A. Memon, M. Jameel, Nondestructive test methods for 1453 concrete bridges: A review, Constr. Build. Mater. 107 (2016) 58–86. 1454 https://doi.org/10.1016/j.conbuildmat.2015.12.011. 1455
[18] D. Luo, Y. Li, J. Li, K.-S. Lim, N.A.M. Nazal, H. Ahmad, D. Luo, Y. Li, J. Li, K.-S. Lim, N.A.M. Nazal, 1456 H. Ahmad, A recent progress of steel bar corrosion diagnostic techniques in RC structures, 1457 Sensors. 19 (2018) 34. https://doi.org/10.3390/s19010034. 1458
[19] S. Taheri, A review on five key sensors for monitoring of concrete structures, Constr. Build. 1459 Mater. 204 (2019) 492–509. https://doi.org/10.1016/j.conbuildmat.2019.01.172. 1460
[20] D. Breysse, Non destructive assessment of concrete structures: usual combinations of 1461 techniques, in: Non-Destructive Assess. Concr. Struct. Reliab. Limits Single Comb. Tech., 1462 Springer Netherlands, Dordrecht, 2012: pp. 1–16. https://doi.org/10.1007/978-94-007-2736-1463 6_1. 1464
[21] J.-P. Balayssac, V. Garnier, Non-Destructive Testing and Evaluation of Civil Engineering 1465 Structures, Elsevier, 2017. 1466
[22] H.F.W. Taylor, Cement Chemistry, 2nd Edition, Thomas Telford, London, 1997. 1467
[23] B. Lothenbach, K. Scrivener, R.D. Hooton, Supplementary cementitious materials, Cem. Concr. 1468 Res. 41 (2011) 1244–1256. https://doi.org/10.1016/j.cemconres.2010.12.001. 1469
[24] M.C.G. Juenger, R. Siddique, Recent advances in understanding the role of supplementary 1470 cementitious materials in concrete, Cem. Concr. Res. 78 (2015) 71–80. 1471 https://doi.org/10.1016/j.cemconres.2015.03.018. 1472
[25] R.M. Andrew, Global CO2 emissions from cement production, Earth Syst. Sci. Data. 10 (2018) 1473 195–217. https://doi.org/10.5194/essd-10-195-2018. 1474
[26] J.W. Bullard, H.M. Jennings, R.A. Livingston, A. Nonat, G.W. Scherer, J.S. Schweitzer, K.L. 1475 Scrivener, J.J. Thomas, Mechanisms of cement hydration, Cem. Concr. Res. 41 (2011) 1208–1476 1223. https://doi.org/10.1016/j.cemconres.2010.09.011. 1477

52
[27] D. Marchon, R.J. Flatt, Mechanisms of cement hydration, Sci. Technol. Concr. Admixtures. 1478 (2016) 129–145. https://doi.org/10.1016/B978-0-08-100693-1.00008-4. 1479
[28] S. Gaboreau, D. Prêt, V. Montouillout, P. Henocq, J.-C. Robinet, C. Tournassat, Quantitative 1480 mineralogical mapping of hydrated low pH concrete, Cem. Concr. Compos. 83 (2017) 360–1481 373. https://doi.org/10.1016/j.cemconcomp.2017.08.003. 1482
[29] ASTM_C192, Standard practice for making and curing concrete test specimens in the 1483 laboratory, (n.d.). https://www.astm.org/Standards/C192 (accessed September 12, 2018). 1484
[30] ASTM_C31, Standard practice for making and curing concrete test specimens in the field, 1485 2019. https://www.astm.org/Standards/C31.htm (accessed September 12, 2018). 1486
[31] R.J.-M. Pellenq, H. Van Damme, Why does concrete set?: The nature of cohesion forces in 1487 hardened cement-based materials, MRS Bull. 29 (2004) 319–323. 1488 https://doi.org/10.1557/mrs2004.97. 1489
[32] R.J.-M. Pellenq, N. Lequeux, H. Van Damme, Engineering the bonding scheme in C–S–H: The 1490 iono-covalent framework, Cem. Concr. Res. 38 (2008) 159–174. 1491 https://doi.org/10.1016/j.cemconres.2007.09.026. 1492
[33] H. Manzano, S. Moeini, F. Marinelli, A.C.T. van Duin, F.-J. Ulm, R.J.-M. Pellenq, Confined water 1493 dissociation in microporous defective silicates: Mechanism, dipole distribution, and impact on 1494 substrate properties, J. Am. Chem. Soc. 134 (2012) 2208–2215. 1495 https://doi.org/10.1021/ja209152n. 1496
[34] P.A. Bonnaud, Q. Ji, B. Coasne, R.J.-M. Pellenq, K.J. Van Vliet, Thermodynamics of water 1497 confined in porous calcium-silicate-hydrates, Langmuir. 28 (2012) 11422–11432. 1498 https://doi.org/10.1021/la301738p. 1499
[35] P.A. Bonnaud, Q. Ji, K.J. Van Vliet, Effects of elevated temperature on the structure and 1500 properties of calcium–silicate–hydrate gels: the role of confined water, Soft Matter. 9 (2013) 1501 6418. https://doi.org/10.1039/c3sm50975c. 1502
[36] P. Blanc, X. Bourbon, A. Lassin, E.C. Gaucher, Chemical model for cement-based materials: 1503 Temperature dependence of thermodynamic functions for nanocrystalline and crystalline C–1504 S–H phases, Cem. Concr. Res. 40 (2010) 851–866. 1505 https://doi.org/10.1016/j.cemconres.2009.12.004. 1506
[37] P. Blanc, X. Bourbon, A. Lassin, E.C. Gaucher, Chemical model for cement-based materials: 1507 Thermodynamic data assessment for phases other than C–S–H, Cem. Concr. Res. 40 (2010) 1508 1360–1374. https://doi.org/10.1016/j.cemconres.2010.04.003. 1509
[38] C. Roosz, S. Gaboreau, S. Grangeon, D. Prêt, V. Montouillout, N. Maubec, S. Ory, P. Blanc, P. 1510 Vieillard, P. Henocq, Distribution of water in synthetic calcium silicate hydrates, Langmuir. 32 1511 (2016) 6794–6805. https://doi.org/10.1021/acs.langmuir.6b00878. 1512
[39] C. Roosz, P. Vieillard, P. Blanc, S. Gaboreau, H. Gailhanou, D. Braithwaite, V. Montouillout, R. 1513 Denoyel, P. Henocq, B. Madé, Thermodynamic properties of C-S-H, C-A-S-H and M-S-H phases: 1514 Results from direct measurements and predictive modelling, Appl. Geochemistry. 92 (2018) 1515 140–156. https://doi.org/10.1016/j.apgeochem.2018.03.004. 1516
[40] B. Lothenbach, M. Zajac, Application of thermodynamic modelling to hydrated cements, Cem. 1517 Concr. Res. 123 (2019) 105779. https://doi.org/10.1016/j.cemconres.2019.105779. 1518
[41] S. Gaboreau, S. Grangeon, F. Claret, D. Ihiawakrim, O. Ersen, V. Montouillout, N. Maubec, C. 1519 Roosz, P. Henocq, C. Carteret, Hydration properties and interlayer organization in synthetic C-1520

53
S-H, Langmuir. 36 (2020) 9449–9464. https://doi.org/10.1021/acs.langmuir.0c01335. 1521
[42] B. Lothenbach, A. Nonat, Calcium silicate hydrates: Solid and liquid phase composition, Cem. 1522 Concr. Res. 78 (2015) 57–70. https://doi.org/10.1016/j.cemconres.2015.03.019. 1523
[43] C.S. Walker, S. Sutou, C. Oda, M. Mihara, A. Honda, Calcium silicate hydrate (C-S-H) gel 1524 solubility data and a discrete solid phase model at 25 °C based on two binary non-ideal solid 1525 solutions, Cem. Concr. Res. 79 (2016) 1–30. 1526 https://doi.org/10.1016/j.cemconres.2015.07.006. 1527
[44] G.M.N. Baston, A.P. Clacher, T.G. Heath, F.M.I. Hunter, V. Smith, S.W. Swanton, Calcium 1528 silicate hydrate (C-S-H) gel dissolution and pH buffering in a cementitious near field, Mineral. 1529 Mag. 76 (2012) 3045–3053. https://doi.org/10.1180/minmag.2012.076.8.20. 1530
[45] H.W. Whittington, J. McCarter, M.C. Forde, The conduction of electricity through concrete, 1531 Mag. Concr. Res. 33 (1981) 48–60. https://doi.org/10.1680/macr.1981.33.114.48. 1532
[46] R.A. Patel, Q.T. Phung, S.C. Seetharam, J. Perko, D. Jacques, N. Maes, G. De Schutter, G. Ye, K. 1533 Van Breugel, Diffusivity of saturated ordinary Portland cement-based materials: A critical 1534 review of experimental and analytical modelling approaches, Cem. Concr. Res. 90 (2016) 52–1535 72. https://doi.org/10.1016/j.cemconres.2016.09.015. 1536
[47] M. Parisatto, M.C. Dalconi, L. Valentini, G. Artioli, A. Rack, R. Tucoulou, G. Cruciani, G. Ferrari, 1537 Examining microstructural evolution of Portland cements by in-situ synchrotron micro-1538 tomography, J. Mater. Sci. 50 (2015) 1805–1817. https://doi.org/10.1007/s10853-014-8743-9. 1539
[48] M. Moradian, Q. Hu, M. Aboustait, M.T. Ley, J.C. Hanan, X. Xiao, G.W. Scherer, Z. Zhang, Direct 1540 observation of void evolution during cement hydration, Mater. Des. 136 (2017) 137–149. 1541 https://doi.org/10.1016/j.matdes.2017.09.056. 1542
[49] Z. Zhang, G.W. Scherer, A. Bauer, Morphology of cementitious material during early 1543 hydration, Cem. Concr. Res. 107 (2018) 85–100. 1544 https://doi.org/10.1016/j.cemconres.2018.02.004. 1545
[50] A. Elsharief, M.D. Cohen, J. Olek, Influence of aggregate size, water cement ratio and age on 1546 the microstructure of the interfacial transition zone, Cem. Concr. Res. 33 (2003) 1837–1849. 1547 https://doi.org/10.1016/S0008-8846(03)00205-9. 1548
[51] Z. Zhang, U. Angst, A discussion of the paper “Effect of design parameters on microstructure 1549 of steel-concrete interface in reinforced concrete,” Cem. Concr. Res. 128 (2020) 105949. 1550 https://doi.org/10.1016/j.cemconres.2019.105949. 1551
[52] A.B. Abell, K.L. Willis, D.A. Lange, Mercury intrusion porosimetry and image analysis of 1552 cement-based materials, J. Colloid Interface Sci. 211 (1999) 39–44. 1553 https://doi.org/10.1006/jcis.1998.5986. 1554
[53] S. Diamond, The microstructure of cement paste and concrete––a visual primer, Cem. Concr. 1555 Compos. 26 (2004) 919–933. https://doi.org/10.1016/j.cemconcomp.2004.02.028. 1556
[54] K.L. Scrivener, Backscattered electron imaging of cementitious microstructures: 1557 understanding and quantification, Cem. Concr. Compos. 26 (2004) 935–945. 1558 https://doi.org/10.1016/j.cemconcomp.2004.02.029. 1559
[55] H.S. Wong, M.K. Head, N.R. Buenfeld, Pore segmentation of cement-based materials from 1560 backscattered electron images, Cem. Concr. Res. 36 (2006) 1083–1090. 1561 https://doi.org/10.1016/j.cemconres.2005.10.006. 1562
[56] S.-Y. Chung, J.-S. Kim, D. Stephan, T.-S. Han, Overview of the use of micro-computed 1563

54
tomography (micro-CT) to investigate the relation between the material characteristics and 1564 properties of cement-based materials, Constr. Build. Mater. 229 (2019) 116843. 1565 https://doi.org/10.1016/j.conbuildmat.2019.116843. 1566
[57] S. Brisard, M. Serdar, P.J.M. Monteiro, Multiscale X-ray tomography of cementitious 1567 materials: A review, Cem. Concr. Res. 128 (2020) 105824. 1568 https://doi.org/10.1016/j.cemconres.2019.105824. 1569
[58] P. Leroy, A. Hördt, S. Gaboreau, E. Zimmermann, F. Claret, M. Bücker, H. Stebner, J.A. 1570 Huisman, Spectral induced polarization of low-pH cement and concrete, Cem. Concr. Compos. 1571 104 (2019) 103397. https://doi.org/10.1016/j.cemconcomp.2019.103397. 1572
[59] D. Clover, B. Kinsella, B. Pejcic, R. De Marco, The influence of microstructure on the corrosion 1573 rate of various carbon steels, J. Appl. Electrochem. 35 (2005) 139–149. 1574 https://doi.org/10.1007/s10800-004-6207-7. 1575
[60] R.R. Hussain, J.K. Singh, A. Alhozaimy, A. Al-Negheimish, C. Bhattacharya, R.S. Pathania, D.D.N. 1576 Singh, Effect of reinforcing bar microstructure on passive film exposed to simulated concrete 1577 pore solution, ACI Mater. J. 115 (2018) 181–190. https://doi.org/10.14359/51701237. 1578
[61] P.K. Katiyar, P.K. Behera, S. Misra, K. Mondal, Comparative corrosion behavior of five different 1579 microstructures of rebar steels in simulated concrete pore solution with and without chloride 1580 addition, J. Mater. Eng. Perform. 28 (2019) 6275–6286. https://doi.org/10.1007/s11665-019-1581 04339-x. 1582
[62] H. Torbati-Sarraf, A. Poursaee, The influence of phase distribution and microstructure of the 1583 carbon steel on its chloride threshold value in a simulated concrete pore solution, Constr. 1584 Build. Mater. 259 (2020) 119784. https://doi.org/10.1016/j.conbuildmat.2020.119784. 1585
[63] U.M. Angst, M.R. Geiker, A. Michel, C. Gehlen, H. Wong, O.B. Isgor, B. Elsener, C.M. Hansson, 1586 R. François, K. Hornbostel, R. Polder, M.C. Alonso, M. Sanchez, M.J. Correia, M. Criado, A. 1587 Sagüés, N. Buenfeld, The steel–concrete interface, Mater. Struct. 50 (2017) 143. 1588 https://doi.org/10.1617/s11527-017-1010-1. 1589
[64] P. Ghods, O.B. Isgor, G.A. McRae, J. Li, G.P. Gu, Microscopic investigation of mill scale and its 1590 proposed effect on the variability of chloride-induced depassivation of carbon steel rebar, 1591 Corros. Sci. 53 (2011) 946–954. https://doi.org/10.1016/j.corsci.2010.11.025. 1592
[65] L. Tang, J.M. Frederiksen, U.M. Angst, R. Polder, M.C. Alonso, B. Elsener, D. Hooton, J. 1593 Pacheco, Experiences from RILEM TC 235-CTC in recommending a test method for chloride 1594 threshold values in concrete, RILEM Tech. Lett. 3 (2018) 25–31. 1595 https://doi.org/10.21809/rilemtechlett.2018.55. 1596
[66] L. Ding, H. Torbati-Sarraf, A. Poursaee, The influence of the sandblasting as a surface 1597 mechanical attrition treatment on the electrochemical behavior of carbon steel in different 1598 pH solutions, Surf. Coatings Technol. 352 (2018) 112–119. 1599 https://doi.org/10.1016/j.surfcoat.2018.08.013. 1600
[67] L.T. Mammoliti, L.C. Brown, C.M. Hansson, B.B. Hope, The influence of surface finish of 1601 reinforcing steel and pH of the test solution on the chloride threshold concentration for 1602 corrosion initiation in synthetic pore solutions, Cem. Concr. Res. 26 (1996) 545–550. 1603 https://doi.org/10.1016/0008-8846(96)00018-X. 1604
[68] H. Tamura, The role of rusts in corrosion and corrosion protection of iron and steel, Corros. 1605 Sci. 50 (2008) 1872–1883. https://doi.org/10.1016/j.corsci.2008.03.008. 1606
[69] J. Ming, J. Shi, W. Sun, Effect of mill scale on the long-term corrosion resistance of a low-alloy 1607

55
reinforcing steel in concrete subjected to chloride solution, Constr. Build. Mater. 163 (2018) 1608 508–517. https://doi.org/10.1016/j.conbuildmat.2017.12.125. 1609
[70] A.J. Al-Tayyib, M.S. Khan, I.M. Allam, A.I. Al-Mana, Corrosion behavior of pre-rusted rebars 1610 after placement in concrete, Cem. Concr. Res. 20 (1990) 955–960. 1611 https://doi.org/10.1016/0008-8846(90)90059-7. 1612
[71] C. Hansson, B. So rensen, The threshold concentration of chloride in concrete for the initiation 1613 of reinforcement corrosion, in: Corros. Rates Steel Concr., ASTM International, 100 Barr 1614 Harbor Drive, PO Box C700, West Conshohocken, PA 19428-2959, 1990: pp. 3-3–14. 1615 https://doi.org/10.1520/STP25011S. 1616
[72] P. Novak, R. Mala, L. Joska, Influence of pre-rusting on steel corrosion in concrete, Cem. 1617 Concr. Res. 31 (2001) 589–593. https://doi.org/10.1016/S0008-8846(01)00459-8. 1618
[73] E. Mahallati, M. Saremi, An assessment on the mill scale effects on the electrochemical 1619 characteristics of steel bars in concrete under DC-polarization, Cem. Concr. Res. 36 (2006) 1620 1324–1329. https://doi.org/10.1016/j.cemconres.2006.03.015. 1621
[74] T.U. Mohammed, H. Hamada, Corrosion of steel bars in concrete with various steel surface 1622 conditions, ACI Mater. J. 103 (2006) 233–242. https://doi.org/10.14359/16606. 1623
[75] D. Boubitsas, L. Tang, The influence of reinforcement steel surface condition on initiation of 1624 chloride induced corrosion, Mater. Struct. 48 (2015) 2641–2658. 1625 https://doi.org/10.1617/s11527-014-0343-2. 1626
[76] J.A. González, E. Ramírez, A. Bautista, S. Feliu, The behaviour of pre-rusted steel in concrete, 1627 Cem. Concr. Res. 26 (1996) 501–511. https://doi.org/10.1016/S0008-8846(96)85037-X. 1628
[77] C. Chalhoub, R. François, M. Carcasses, Critical chloride threshold values as a function of 1629 cement type and steel surface condition, Cem. Concr. Res. 134 (2020) 106086. 1630 https://doi.org/10.1016/j.cemconres.2020.106086. 1631
[78] M.J. Martinez-Echevarria, M. Lopez-Alonso, D. Cantero Romero, J. Rodríguez Montero, 1632 Influence of the previous state of corrosion of rebars in predicting the service life of 1633 reinforced concrete structures, Constr. Build. Mater. 188 (2018) 915–923. 1634 https://doi.org/10.1016/j.conbuildmat.2018.08.173. 1635
[79] L. Michel, U. Angst, Towards understanding corrosion initiation in concrete – Influence of local 1636 electrochemical properties of reinforcing steel, MATEC Web Conf. 199 (2018) 04001. 1637 https://doi.org/10.1051/matecconf/201819904001. 1638
[80] U.M. Angst, M.R. Geiker, M.C. Alonso, R. Polder, O.B. Isgor, B. Elsener, H. Wong, A. Michel, K. 1639 Hornbostel, C. Gehlen, R. François, M. Sanchez, M. Criado, H. Sørensen, C. Hansson, R. Pillai, S. 1640 Mundra, J. Gulikers, M. Raupach, J. Pacheco, A. Sagüés, The effect of the steel–concrete 1641 interface on chloride-induced corrosion initiation in concrete: a critical review by RILEM TC 1642 262-SCI, Mater. Struct. 52 (2019) 88. https://doi.org/10.1617/s11527-019-1387-0. 1643
[81] X.R. Nóvoa, Electrochemical aspects of the steel‐concrete system. A review, J. Solid State 1644 Electrochem. 20 (2016) 2113–2125. https://doi.org/10.1007/s10008-016-3238-z. 1645
[82] S. Joiret, M. Keddam, X.R. Nóvoa, M.C. Pérez, C. Rangel, H. Takenouti, Use of EIS, ring-disk 1646 electrode, EQCM and Raman spectroscopy to study the film of oxides formed on iron in 1 M 1647 NaOH, Cem. Concr. Compos. 24 (2002) 7–15. https://doi.org/10.1016/S0958-9465(01)00022-1648 1. 1649
[83] A. Poursaee, C.M. Hansson, Reinforcing steel passivation in mortar and pore solution, Cem. 1650
56
Concr. Res. 37 (2007) 1127–1133. https://doi.org/10.1016/j.cemconres.2007.04.005. 1651
[84] S.M. Abd El Haleem, E.E. Abd El Aal, S. Abd El Wanees, A. Diab, Environmental factors 1652 affecting the corrosion behaviour of reinforcing steel: I. The early stage of passive film 1653 formation in Ca(OH)2 solutions, Corros. Sci. 52 (2010) 3875–3882. 1654 https://doi.org/10.1016/j.corsci.2010.07.035. 1655
[85] H. DorMohammadi, Q. Pang, P. Murkute, L. Arnadottir, O. Burkan Isgor, Investigation of iron 1656 passivity in highly alkaline media using reactive-force field molecular dynamics, Corros. Sci. 1657 (2019). https://doi.org/10.1016/j.corsci.2019.05.016. 1658
[86] E. Volpi, A. Olietti, M. Stefanoni, S.P. Trasatti, Electrochemical characterization of mild steel in 1659 alkaline solutions simulating concrete environment, J. Electroanal. Chem. 736 (2015) 38–46. 1660 https://doi.org/10.1016/j.jelechem.2014.10.023. 1661
[87] B. Elsener, A. Rossi, Passivation of steel and stainless steel in alkaline media simulating 1662 concrete, in: Encycl. Interfacial Chem., Elsevier, 2018: pp. 365–375. 1663 https://doi.org/10.1016/B978-0-12-409547-2.13772-2. 1664
[88] C. Andrade, P. Merino, X.R. Nóvoa, M.C. Pérez, L. Soler, Passivation of reinforcing steel in 1665 concrete, Mater. Sci. Forum. 192–194 (1995) 891–898. 1666 https://doi.org/10.4028/www.scientific.net/MSF.192-194.891. 1667
[89] X.R. Nóvoa, M.C. Pérez, On the role of iron oxides in the electrochemical behaviour of steel 1668 embedded in concrete, Corros. Rev. 23 (2005) 195–216. 1669 https://doi.org/10.1515/corrrev.2005.23.2-3.195. 1670
[90] M. Sánchez, J. Gregori, C. Alonso, J.J. García-Jareño, H. Takenouti, F. Vicente, Electrochemical 1671 impedance spectroscopy for studying passive layers on steel rebars immersed in alkaline 1672 solutions simulating concrete pores, Electrochim. Acta. 52 (2007) 7634–7641. 1673 https://doi.org/10.1016/j.electacta.2007.02.012. 1674
[91] J. Williamson, O.B. Isgor, The effect of simulated concrete pore solution composition and 1675 chlorides on the electronic properties of passive films on carbon steel rebar, Corros. Sci. 106 1676 (2016) 82–95. https://doi.org/10.1016/j.corsci.2016.01.027. 1677
[92] A. Poursaee, Corrosion of steel in concrete structures, in: Corros. Steel Concr. Struct., 1678 Woodhead Publishing, 2016: pp. 19–33. https://doi.org/10.1016/B978-1-78242-381-2.00002-1679 X. 1680
[93] H.B. Gunay, O.B. Isgor, P. Ghods, Kinetics of passivation and chloride-induced depassivation of 1681 iron in simulated concrete pore solutions using electrochemical quartz crystal nanobalance, 1682 Corrosion. 71 (2015) 615–627. https://doi.org/10.5006/1346. 1683
[94] M.F. Montemor, A.M.P. Simões, M.G.S. Ferreira, Analytical characterization of the passive film 1684 formed on steel in solutions simulating the concrete interstitial electrolyte, Corrosion. 54 1685 (1998) 347–353. https://doi.org/10.5006/1.3284861. 1686
[95] P. Ghods, O.B. Isgor, G. McRae, T. Miller, The effect of concrete pore solution composition on 1687 the quality of passive oxide films on black steel reinforcement, Cem. Concr. Compos. 31 1688 (2009) 2–11. https://doi.org/10.1016/j.cemconcomp.2008.10.003. 1689
[96] A.T. Horne, I.G. Richardson, R.M.D. Brydson, Quantitative analysis of the microstructure of 1690 interfaces in steel reinforced concrete, Cem. Concr. Res. 37 (2007) 1613–1623. 1691 https://doi.org/10.1016/j.cemconres.2007.08.026. 1692
[97] A. Kenny, A. Katz, Statistical relationship between mix properties and the interfacial transition 1693

57
zone around embedded rebar, Cem. Concr. Compos. 60 (2015) 82–91. 1694 https://doi.org/10.1016/j.cemconcomp.2015.04.002. 1695
[98] Y. Cai, W. Zhang, L. Yu, M. Chen, C. Yang, R. François, K. Yang, Characteristics of the steel-1696 concrete interface and their effect on the corrosion of steel bars in concrete, Constr. Build. 1697 Mater. 253 (2020) 119162. https://doi.org/10.1016/j.conbuildmat.2020.119162. 1698
[99] T.A. Soylev, R. François, Quality of steel–concrete interface and corrosion of reinforcing steel, 1699 Cem. Concr. Res. 33 (2003) 1407–1415. https://doi.org/10.1016/S0008-8846(03)00087-5. 1700
[100] G.K. Glass, R. Yang, T. Dickhaus, N.R. Buenfeld, Backscattered electron imaging of the steel–1701 concrete interface, Corros. Sci. 43 (2001) 605–610. https://doi.org/10.1016/S0010-1702 938X(00)00146-3. 1703
[101] F. Chen, C.-Q. Li, H. Baji, B. Ma, Quantification of steel-concrete interface in reinforced 1704 concrete using backscattered electron imaging technique, Constr. Build. Mater. 179 (2018) 1705 420–429. https://doi.org/10.1016/j.conbuildmat.2018.05.246. 1706
[102] S.K. Goudar, B.B. Das, S.B. Arya, K.N. Shivaprasad, Influence of sample preparation techniques 1707 on microstructure and nano-mechanical properties of steel-concrete interface, Constr. Build. 1708 Mater. 256 (2020) 119242. https://doi.org/10.1016/j.conbuildmat.2020.119242. 1709
[103] Z. Zhang, M. Shakoorioskooie, M. Griffa, P. Lura, U. Angst, A laboratory investigation of cutting 1710 damage to the steel-concrete interface, Cem. Concr. Res. 138 (2020) 106229. 1711 https://doi.org/10.1016/j.cemconres.2020.106229. 1712
[104] K. Tuutti, Corrosion of Steel in Concrete, Swedish Cement and Concrete Research Institute, 1713 Stockholm, 1982. 1714
[105] C. Andrade, C. Alonso, J. Gulikers, R. Polder, R. Cigna, Ø. Vennesland, M. Salta, A. Raharinaivo, 1715 B. Elsener, Test methods for on-site corrosion rate measurement of steel reinforcement in 1716 concrete by means of the polarization resistance method, Mater. Struct. 37 (2004) 623–642. 1717 https://doi.org/10.1007/BF02483292. 1718
[106] C. Qing Li, Reliability based service life prediction of corrosion affected concrete structures, J. 1719 Struct. Eng. 130 (2004) 1570–1577. https://doi.org/10.1061/(ASCE)0733-1720 9445(2004)130:10(1570). 1721
[107] M. Raupach, Models for the propagation phase of reinforcement corrosion – an overview, 1722 Mater. Corros. 57 (2006) 605–613. https://doi.org/10.1002/maco.200603991. 1723
[108] M.B. Otieno, H.D. Beushausen, M.G. Alexander, Modelling corrosion propagation in 1724 reinforced concrete structures – A critical review, Cem. Concr. Compos. 33 (2011) 240–245. 1725 https://doi.org/10.1016/j.cemconcomp.2010.11.002. 1726
[109] D. Chen, S. Mahadevan, Chloride-induced reinforcement corrosion and concrete cracking 1727 simulation, Cem. Concr. Compos. 30 (2008) 227–238. 1728 https://doi.org/10.1016/.cemconcomp.2006.10.007. 1729
[110] F. Chen, H. Baji, C.-Q. Li, A comparative study on factors affecting time to cover cracking as a 1730 service life indicator, Constr. Build. Mater. 163 (2018) 681–694. 1731 https://doi.org/10.1016/j.conbuildmat.2017.12.120. 1732
[111] M. Alexander, H. Beushausen, Durability, service life prediction, and modelling for reinforced 1733 concrete structures – review and critique, Cem. Concr. Res. 122 (2019) 17–29. 1734 https://doi.org/10.1016/j.cemconres.2019.04.018. 1735
[112] O.B. Isgor, A.G. Razaqpur, Modelling steel corrosion in concrete structures, Mater. Struct. 39 1736

58
(2006) 291–302. https://doi.org/10.1007/s11527-005-9022-7. 1737
[113] Z.M. Mir, D. Höche, C. Gomes, R. Sampaio, A.C. Bastos, P. Maincon, M.G.S. Ferreira, M.L. 1738 Zheludkevich, Enhanced predictive modelling of steel corrosion in concrete in submerged 1739 zone based on a dynamic activation approach, Int. J. Concr. Struct. Mater. 13 (2019) 11. 1740 https://doi.org/10.1186/s40069-018-0321-0. 1741
[114] O.A. Kayyali, M.N. Haque, Effect of carbonation on the chloride concentration in pore solution 1742 of mortars with and without flyash, Cem. Concr. Res. 18 (1988) 636–648. 1743 https://doi.org/10.1016/0008-8846(88)90056-7. 1744
[115] X. Zhu, G. Zi, Z. Cao, X. Cheng, Combined effect of carbonation and chloride ingress in 1745 concrete, Constr. Build. Mater. 110 (2016) 369–380. 1746 https://doi.org/10.1016/j.conbuildmat.2016.02.034. 1747
[116] J. Geng, D. Easterbrook, Q.-F. Liu, L.-Y. Li, Effect of carbonation on release of bound chlorides 1748 in chloride-contaminated concrete, Mag. Concr. Res. 68 (2016) 353–363. 1749 https://doi.org/10.1680/jmacr.15.00234. 1750
[117] J.A. Gonzalez, J.S. Algaba, C. Andrade, Corrosion of reinforcing bars in carbonated concrete, 1751 Br. Corros. J. 15 (1980) 135–139. https://doi.org/10.1179/bcj.1980.15.3.135. 1752
[118] C. Alonso, C. Andrade, Corrosion of steel reinforcement in carbonated mortar containing 1753 chlorides, Adv. Cem. Res. 1 (1988) 155–163. https://doi.org/10.1680/1988.1.3.155. 1754
[119] D.A. Hausmann, Steel corrosion in concrete. How does it occur?, J. Mater. Prot. 6 (1967) 19–1755 23. 1756
[120] M. Stratmann, J. Müller, The mechanism of the oxygen reduction on rust-covered metal 1757 substrates, Corros. Sci. 36 (1994) 327–359. https://doi.org/10.1016/0010-938X(94)90161-9. 1758
[121] C.M. Hansson, Comments on electrochemical measurements of the rate of corrosion of steel 1759 in concrete, Cem. Concr. Res. 14 (1984) 574–584. https://doi.org/10.1016/0008-1760 8846(84)90135-2. 1761
[122] M. Pourbaix, Thermodynamics and corrosion, Corros. Sci. 30 (1990) 963–988. 1762 https://doi.org/10.1016/0010-938X(90)90205-J. 1763
[123] R. François, S. Laurens, F. Deby, Steel Corrosion in Reinforced Concrete, in: Corros. Its 1764 Consequences Reinf. Concr. Struct., Elsevier, 2018: pp. 1–41. https://doi.org/10.1016/B978-1-1765 78548-234-2.50001-9. 1766
[124] M. Stefanoni, U.M. Angst, B. Elsener, Electrochemistry and capillary condensation theory 1767 reveal the mechanism of corrosion in dense porous media, Sci. Rep. 8 (2018) 7407. 1768 https://doi.org/10.1038/s41598-018-25794-x. 1769
[125] M. Stefanoni, U.M. Angst, B. Elsener, Kinetics of electrochemical dissolution of metals in 1770 porous media, Nat. Mater. 18 (2019) 942–947. https://doi.org/10.1038/s41563-019-0439-8. 1771
[126] M. Pour-Ghaz, O. Burkan Isgor, P. Ghods, The effect of temperature on the corrosion of steel 1772 in concrete. Part 1: Simulated polarization resistance tests and model development, Corros. 1773 Sci. 51 (2009) 415–425. https://doi.org/10.1016/j.corsci.2008.10.034. 1774
[127] M. Pour-Ghaz, O. Burkan Isgor, P. Ghods, The effect of temperature on the corrosion of steel 1775 in concrete. Part 2: Model verification and parametric study, Corros. Sci. 51 (2009) 426–433. 1776 https://doi.org/10.1016/j.corsci.2008.10.036. 1777
[128] E. Rossi, R. Polder, O. Copuroglu, T. Nijland, B. Šavija, The influence of defects at the 1778

59
steel/concrete interface for chloride-induced pitting corrosion of naturally-deteriorated 20-1779 years-old specimens studied through X-ray Computed Tomography, Constr. Build. Mater. 235 1780 (2020) 117474. https://doi.org/10.1016/j.conbuildmat.2019.117474. 1781
[129] B. Huet, V. L’Hostis, G. Santarini, D. Feron, H. Idrissi, Steel corrosion in concrete: Determinist 1782 modeling of cathodic reaction as a function of water saturation degree, Corros. Sci. 49 (2007) 1783 1918–1932. https://doi.org/10.1016/j.corsci.2006.10.005. 1784
[130] C. Cao, M.M.S. Cheung, B.Y.B. Chan, Modelling of interaction between corrosion-induced 1785 concrete cover crack and steel corrosion rate, Corros. Sci. 69 (2013) 97–109. 1786 https://doi.org/10.1016/j.corsci.2012.11.028. 1787
[131] Y. Zhao, W. Jin, Steel Corrosion in Concrete, in: Steel Corros. Concr. Crack., Butterworth-1788 Heinemann, 2016: pp. 19–29. https://doi.org/10.1016/B978-0-12-809197-5.00002-5. 1789
[132] M. Stefanoni, Z. Zhang, U. Angst, B. Elsener, The kinetic competition between transport and 1790 oxidation of ferrous ions governs precipitation of corrosion products in carbonated concrete, 1791 RILEM Tech. Lett. 3 (2018) 8–16. https://doi.org/10.21809/rilemtechlett.2018.57. 1792
[133] P. Blanc, A. Lassin, P. Piantone, M. Azaroual, N. Jacquemet, A. Fabbri, E.C. Gaucher, 1793 Thermoddem: A geochemical database focused on low temperature water/rock interactions 1794 and waste materials, Appl. Geochemistry. 27 (2012) 2107–2116. 1795 https://doi.org/10.1016/j.apgeochem.2012.06.002. 1796
[134] B. Šavija, M. Luković, Carbonation of cement paste: Understanding, challenges, and 1797 opportunities, Constr. Build. Mater. 117 (2016) 285–301. 1798 https://doi.org/10.1016/j.conbuildmat.2016.04.138. 1799
[135] V.G. Papadakis, C.G. Vayenas, M.N. Fardis, Fundamental modeling and experimental 1800 investigation of concrete carbonation, ACI Mater. J. 88 (1991) 363–373. 1801 https://doi.org/10.14359/1863. 1802
[136] V.G. Papadakis, C.G. Vayenas, M.N. Fardis, Physical and chemical characteristics affecting the 1803 durability of concrete, ACI Mater. J. 88 (1991) 186–196. https://doi.org/10.14359/1993. 1804
[137] Y.F. Houst, F.H. Wittmann, Influence of porosity and water content on the diffusivity of CO2 1805 and O2 through hydrated cement paste, Cem. Concr. Res. 24 (1994) 1165–1176. 1806 https://doi.org/10.1016/0008-8846(94)90040-X. 1807
[138] P. Castro, M.A. Sanjuán, J. Genescá, Carbonation of concretes in the Mexican Gulf, Build. 1808 Environ. 35 (2000) 145–149. https://doi.org/10.1016/S0360-1323(99)00009-8. 1809
[139] J.H.M. Visser, Influence of the carbon dioxide concentration on the resistance to carbonation 1810 of concrete, Constr. Build. Mater. 67 (2014) 8–13. 1811 https://doi.org/10.1016/j.conbuildmat.2013.11.005. 1812
[140] A. Morandeau, M. Thiéry, P. Dangla, Investigation of the carbonation mechanism of CH and C-1813 S-H in terms of kinetics, microstructure changes and moisture properties, Cem. Concr. Res. 56 1814 (2014) 153–170. https://doi.org/10.1016/j.cemconres.2013.11.015. 1815
[141] I. Galan, C. Andrade, M. Castellote, Natural and accelerated CO2 binding kinetics in cement 1816 paste at different relative humidities, Cem. Concr. Res. 49 (2013) 21–28. 1817 https://doi.org/10.1016/j.cemconres.2013.03.009. 1818
[142] Q. Huy Vu, G. Pham, A. Chonier, E. Brouard, S. Rathnarajan, R. Pillai, R. Gettu, M. Santhanam, 1819 F. Aguayo, K.J. Folliard, M.D. Thomas, T. Moffat, C. Shi, A. Sarnot, Impact of different climates 1820 on the resistance of concrete to natural carbonation, Constr. Build. Mater. 216 (2019) 450–1821

60
467. https://doi.org/10.1016/j.conbuildmat.2019.04.263. 1822
[143] S.K. Roy, P.K. Beng, D.O. Northwood, The carbonation of concrete structures in the tropical 1823 environment of singapore and a comparison with published data for temperate climates, 1824 Mag. Concr. Res. 48 (1996) 293–300. https://doi.org/10.1680/macr.1996.48.177.293. 1825
[144] M.N. Haque, H. Al-Khaiat, Carbonation of concrete structures in hot dry coastal regions, Cem. 1826 Concr. Compos. 19 (1997) 123–129. https://doi.org/10.1016/s0958-9465(96)00047-9. 1827
[145] A. Leemann, F. Moro, Carbonation of concrete: the role of CO2 concentration, relative 1828 humidity and CO2 buffer capacity, Mater. Struct. 50 (2017) 30. 1829 https://doi.org/10.1617/s11527-016-0917-2. 1830
[146] E. Drouet, S. Poyet, P. Le Bescop, J.-M. Torrenti, X. Bourbon, Carbonation of hardened cement 1831 pastes: Influence of temperature, Cem. Concr. Res. 115 (2019) 445–459. 1832 https://doi.org/10.1016/j.cemconres.2018.09.019. 1833
[147] A. V. Saetta, B.A. Schrefler, R. V. Vitaliani, The carbonation of concrete and the mechanism of 1834 moisture, heat and carbon dioxide flow through porous materials, Cem. Concr. Res. 23 (1993) 1835 761–772. https://doi.org/10.1016/0008-8846(93)90030-D. 1836
[148] A. V. Saetta, R. V. Vitaliani, Experimental investigation and numerical modeling of carbonation 1837 process in reinforced concrete structures Part I: Theoretical formulation, Cem. Concr. Res. 34 1838 (2004) 571–579. https://doi.org/10.1016/j.cemconres.2003.09.009. 1839
[149] O.B. Isgor, A.G.G. Razaqpur, Finite element modeling of coupled heat transfer, moisture 1840 transport and carbonation processes in concrete structures, Cem. Concr. Compos. 26 (2004) 1841 57–73. https://doi.org/10.1016/S0958-9465(02)00125-7. 1842
[150] V.G. Papadakis, C.G. Vayenas, M.N. Fardis, A reaction engineering approach to the problem of 1843 concrete carbonation, AIChE J. 35 (1989) 1639–1650. https://doi.org/10.1002/aic.690351008. 1844
[151] B. Johannesson, P. Utgenannt, Microstructural changes caused by carbonation of cement 1845 mortar, Cem. Concr. Res. 31 (2001) 925–931. https://doi.org/10.1016/S0008-8846(01)00498-1846 7. 1847
[152] W. Ashraf, Carbonation of cement-based materials: Challenges and opportunities, Constr. 1848 Build. Mater. 120 (2016) 558–570. https://doi.org/10.1016/j.conbuildmat.2016.05.080. 1849
[153] S.E. Pihlajavaara, Some results of the effect of carbonation on the porosity and pore size 1850 distribution of cement paste, Matériaux Constr. 1 (1968) 521–527. 1851 https://doi.org/10.1007/BF02473640. 1852
[154] M. Auroy, S. Poyet, P. Le Bescop, J.-M. Torrenti, T. Charpentier, M. Moskura, X. Bourbon, 1853 Impact of carbonation on unsaturated water transport properties of cement-based materials, 1854 Cem. Concr. Res. 74 (2015) 44–58. https://doi.org/10.1016/j.cemconres.2015.04.002. 1855
[155] V.T. Ngala, C.L. Page, Effects of carbonation on pore structure and diffusional properties of 1856 hydrated cement pastes, Cem. Concr. Res. 27 (1997) 995–1007. 1857 https://doi.org/10.1016/S0008-8846(97)00102-6. 1858
[156] S. Laurens, F. Deby, Electrochemical Methods, in: Non-Destructive Test. Eval. Civ. Eng. Struct., 1859 Elsevier, 2018: pp. 173–197. https://doi.org/10.1016/B978-1-78548-229-8.50005-4. 1860
[157] M. Castellote, L. Fernandez, C. Andrade, C. Alonso, Chemical changes and phase analysis of 1861 OPC pastes carbonated at different CO2 concentrations, Mater. Struct. 42 (2009) 515–525. 1862 https://doi.org/10.1617/s11527-008-9399-1. 1863
61
[158] M. Auroy, S. Poyet, P. Le Bescop, J.-M. Torrenti, T. Charpentier, M. Moskura, X. Bourbon, 1864 Comparison between natural and accelerated carbonation (3% CO2): Impact on mineralogy, 1865 microstructure, water retention and cracking, Cem. Concr. Res. 109 (2018) 64–80. 1866 https://doi.org/10.1016/j.cemconres.2018.04.012. 1867
[159] B. Huet, V. L’Hostis, F. Miserque, H. Idrissi, Electrochemical behavior of mild steel in concrete: 1868 Influence of pH and carbonate content of concrete pore solution, Electrochim. Acta. 51 (2005) 1869 172–180. https://doi.org/10.1016/j.electacta.2005.04.014. 1870
[160] V. Marcos-Meson, A. Michel, A. Solgaard, G. Fischer, C. Edvardsen, T.L. Skovhus, Corrosion 1871 resistance of steel fibre reinforced concrete - A literature review, Cem. Concr. Res. 103 (2018) 1872 1–20. https://doi.org/10.1016/j.cemconres.2017.05.016. 1873
[161] M. Thiery, Modelling of atmospheric carbonation of cement based materials considering the 1874 kinetic effects and modifications of the microstructure and the hydric state, Ecole des Ponts 1875 ParisTech, 2005. 1876
[162] M.G. Sohail, S. Laurens, F. Deby, J.P. Balayssac, Significance of macrocell corrosion of 1877 reinforcing steel in partially carbonated concrete: numerical and experimental investigation, 1878 Mater. Struct. 48 (2015) 217–233. https://doi.org/10.1617/s11527-013-0178-2. 1879
[163] A.B. Revert, K. De Weerdt, K. Hornbostel, M.R. Geiker, Carbonation-induced corrosion: 1880 Investigation of the corrosion onset, Constr. Build. Mater. 162 (2018) 847–856. 1881 https://doi.org/10.1016/j.conbuildmat.2017.12.066. 1882
[164] L.J. Parrott, D.C. Killoh, Carbonation in a 36 year old, in-situ concrete, Cem. Concr. Res. 19 1883 (1989) 649–656. https://doi.org/10.1016/0008-8846(89)90017-3. 1884
[165] R.M. Ghantous, R. Fran ois, S. Poyet, V. L’Hostis, F. Bernachy-Barbe, D. Meinel, L. Portier, N.-1885 C. Tran, Relation between crack opening and extent of the damage induced at the 1886 steel/mortar interface, Constr. Build. Mater. 193 (2018) 97–104. 1887 https://doi.org/10.1016/j.conbuildmat.2018.10.176. 1888
[166] A. Nasser, A. Clément, S. Laurens, A. Castel, Influence of steel–concrete interface condition on 1889 galvanic corrosion currents in carbonated concrete, Corros. Sci. 52 (2010) 2878–2890. 1890 https://doi.org/10.1016/j.corsci.2010.04.037. 1891
[167] C.M. Hansson, A. Poursaee, A. Laurent, Macrocell and microcell corrosion of steel in ordinary 1892 Portland cement and high performance concretes, Cem. Concr. Res. 36 (2006) 2098–2102. 1893 https://doi.org/10.1016/j.cemconres.2006.07.005. 1894
[168] A. Poursaee, C.M. Hansson, Potential pitfalls in assessing chloride-induced corrosion of steel 1895 in concrete, Cem. Concr. Res. 39 (2009) 391–400. 1896 https://doi.org/10.1016/j.cemconres.2009.01.015. 1897
[169] A.B. Revert, K. Hornbostel, K. De Weerdt, M.R. Geiker, Macrocell corrosion in carbonated 1898 Portland and Portland-fly ash concrete - Contribution and mechanism, Cem. Concr. Res. 116 1899 (2019) 273–283. https://doi.org/10.1016/j.cemconres.2018.12.005. 1900
[170] M. Stefanoni, U. Angst, B. Elsener, Corrosion rate of carbon steel in carbonated concrete – A 1901 critical review, Cem. Concr. Res. 103 (2018) 35–48. 1902 https://doi.org/10.1016/j.cemconres.2017.10.007. 1903
[171] P. Dangla, W. Dridi, Rebar corrosion in carbonated concrete exposed to variable humidity 1904 conditions. Interpretation of Tuutti’s curve, Corros. Sci. 51 (2009) 1747–1756. 1905 https://doi.org/10.1016/j.corsci.2009.04.029. 1906

62
[172] M. Stefanoni, U. Angst, B. Elsener, The mechanism controlling corrosion of steel in carbonated 1907 cementitious materials in wetting and drying exposure, Cem. Concr. Compos. 113 (2020) 1908 103717. https://doi.org/10.1016/j.cemconcomp.2020.103717. 1909
[173] M.U. Khan, S. Ahmad, H.J. Al-Gahtani, Chloride-induced corrosion of steel in concrete: An 1910 overview on chloride diffusion and prediction of corrosion initiation time, Int. J. Corros. 2017 1911 (2017) 1–9. https://doi.org/10.1155/2017/5819202. 1912
[174] M.. Pech-Canul, P. Castro, Corrosion measurements of steel reinforcement in concrete 1913 exposed to a tropical marine atmosphere, Cem. Concr. Res. 32 (2002) 491–498. 1914 https://doi.org/10.1016/S0008-8846(01)00713-X. 1915
[175] M. Balonis, B. Lothenbach, G. Le Saout, F.P. Glasser, Impact of chloride on the mineralogy of 1916 hydrated Portland cement systems, Cem. Concr. Res. 40 (2010) 1009–1022. 1917 https://doi.org/10.1016/j.cemconres.2010.03.002. 1918
[176] B. Guo, Y. Hong, G. Qiao, J. Ou, Z. Li, Thermodynamic modeling of the essential 1919 physicochemical interactions between the pore solution and the cement hydrates in chloride-1920 contaminated cement-based materials, J. Colloid Interface Sci. 531 (2018) 56–63. 1921 https://doi.org/10.1016/j.jcis.2018.07.005. 1922
[177] Y. Guo, T. Zhang, W. Tian, J. Wei, Q. Yu, Physically and chemically bound chlorides in hydrated 1923 cement pastes: a comparison study of the effects of silica fume and metakaolin, J. Mater. Sci. 1924 54 (2019) 2152–2169. https://doi.org/10.1007/s10853-018-2953-5. 1925
[178] P.T. Nguyen, O. Amiri, Study of the chloride transport in unsaturated concrete: Highlighting of 1926 electrical double layer, temperature and hysteresis effects, Constr. Build. Mater. 122 (2016) 1927 284–293. https://doi.org/10.1016/j.conbuildmat.2016.05.154. 1928
[179] Y. Zhang, M. Zhang, G. Ye, Influence of moisture condition on chloride diffusion in partially 1929 saturated ordinary Portland cement mortar, Mater. Struct. 51 (2018) 36. 1930 https://doi.org/10.1617/s11527-018-1162-7. 1931
[180] S. Caré, Influence of aggregates on chloride diffusion coefficient into mortar, Cem. Concr. Res. 1932 33 (2003) 1021–1028. https://doi.org/10.1016/S0008-8846(03)00009-7. 1933
[181] P.P. Win, M. Watanabe, A. Machida, Penetration profile of chloride ion in cracked reinforced 1934 concrete, Cem. Concr. Res. 34 (2004) 1073–1079. 1935 https://doi.org/10.1016/j.cemconres.2003.11.020. 1936
[182] A. Poursaee, C.M. Hansson, The influence of longitudinal cracks on the corrosion protection 1937 afforded reinforcing steel in high performance concrete, Cem. Concr. Res. 38 (2008) 1098–1938 1105. https://doi.org/10.1016/j.cemconres.2008.03.018. 1939
[183] J. Shi, J. Ming, Influence of defects at the steel-mortar interface on the corrosion behavior of 1940 steel, Constr. Build. Mater. 136 (2017) 118–125. 1941 https://doi.org/10.1016/j.conbuildmat.2017.01.007. 1942
[184] F.U.A. Shaikh, Effect of cracking on corrosion of steel in concrete, Int. J. Concr. Struct. Mater. 1943 12 (2018) 3. https://doi.org/10.1186/s40069-018-0234-y. 1944
[185] E. Samson, J. Marchand, Modeling the transport of ions in unsaturated cement-based 1945 materials, Comput. Struct. 85 (2007) 1740–1756. 1946 https://doi.org/10.1016/j.compstruc.2007.04.008. 1947
[186] V.Q. Tran, A. Soive, V. Baroghel-Bouny, Modelisation of chloride reactive transport in concrete 1948 including thermodynamic equilibrium, kinetic control and surface complexation, Cem. Concr. 1949

63
Res. 110 (2018) 70–85. https://doi.org/10.1016/j.cemconres.2018.05.007. 1950
[187] U.M. Angst, Predicting the time to corrosion initiation in reinforced concrete structures 1951 exposed to chlorides, Cem. Concr. Res. 115 (2019) 559–567. 1952 https://doi.org/10.1016/j.cemconres.2018.08.007. 1953
[188] A. Covelo, B. Díaz, L. Freire, X.R. Nóvoa, M.C. Pérez, Microstructural changes in a cementitious 1954 membrane due to the application of a DC electric field, J. Environ. Sci. Heal. Part A. 43 (2008) 1955 985–993. https://doi.org/10.1080/10934520801974632. 1956
[189] M.A. Heine, D.S. Keir, M.J. Pryor, The specific effects of chloride and sulfate ions on oxide 1957 covered aluminum, J. Electrochem. Soc. 112 (1965) 24–32. 1958 https://doi.org/10.1149/1.2423459. 1959
[190] D.D. Macdonald, The point defect model for the passive state, J. Electrochem. Soc. 139 (1992) 1960 3434. https://doi.org/10.1149/1.2069096. 1961
[191] P. Marcus, V. Maurice, H.-H. Strehblow, Localized corrosion (pitting): A model of passivity 1962 breakdown including the role of the oxide layer nanostructure, Corros. Sci. 50 (2008) 2698–1963 2704. https://doi.org/10.1016/j.corsci.2008.06.047. 1964
[192] P. Ghods, O. Burkan Isgor, F. Bensebaa, D. Kingston, Angle-resolved XPS study of carbon steel 1965 passivity and chloride-induced depassivation in simulated concrete pore solution, Corros. Sci. 1966 (2012). https://doi.org/10.1016/j.corsci.2012.01.019. 1967
[193] P. Ghods, O. Burkan Isgor, G.J.C. Carpenter, J. Li, G.A. McRae, G.P. Gu, Nano-scale study of 1968 passive films and chloride-induced depassivation of carbon steel rebar in simulated concrete 1969 pore solutions using FIB/TEM, Cem. Concr. Res. 47 (2013) 55–68. 1970 https://doi.org/10.1016/j.cemconres.2013.01.009. 1971
[194] H.B. Gunay, P. Ghods, O. Burkan Isgor, G.J.C. Carpenter, X. Wu, Characterization of atomic 1972 structure of oxide films on carbon steel in simulated concrete pore solutions using EELS, Appl. 1973 Surf. Sci. 274 (2013) 195–202. https://doi.org/10.1016/j.apsusc.2013.03.014. 1974
[195] J. Xu, L. Jiang, Investigation on chloride threshold level for corrosion of reinforcing steel in the 1975 saturated Ca(OH)2 solution simulating the electrolytic environments of concrete, in: Adv. Civ. 1976 Eng. Mater. 50-Year Teach. Res. Anniv. Prof. Sun Wei, Nanjing, China, 2008: pp. 111–119. 1977
[196] Q. Pang, H. DorMohammadi, O. Burkan Isgor, L. Árnadóttir, The effect of surface vacancies on 1978 the interactions of Cl with the α-Fe2O3 (0001) surface and the role of Cl in depassivation, 1979 Corros. Sci. (2019). https://doi.org/10.1016/j.corsci.2019.03.052. 1980
[197] H. DorMohammadi, Q. Pang, P. Murkute, L. Árnadóttir, O.B. Isgor, Investigation of chloride-1981 induced depassivation of iron in alkaline media by reactive force field molecular dynamics, 1982 Npj Mater. Degrad. 3 (2019) 19. https://doi.org/10.1038/s41529-019-0081-6. 1983
[198] G.K. Glass, N.R. Buenfeld, The presentation of the chloride threshold level for corrosion of 1984 steel in concrete, Corros. Sci. 39 (1997) 1001–1013. https://doi.org/10.1016/S0010-1985 938X(97)00009-7. 1986
[199] U. Angst, B. Elsener, C.K. Larsen, Ø. Vennesland, Critical chloride content in reinforced 1987 concrete - A review, Cem. Concr. Res. 39 (2009) 1122–1138. 1988 https://doi.org/10.1016/j.cemconres.2009.08.006. 1989
[200] B. Mar n-Pérez, H. Zibara, R.D. Hooton, M.D.A. Thomas, A study of the effect of chloride 1990 binding on service life predictions, Cem. Concr. Res. 30 (2000) 1215–1223. 1991 https://doi.org/10.1016/S0008-8846(00)00339-2. 1992

64
[201] M. Saillio, V. Baroghel-Bouny, F. Barberon, Chloride binding in sound and carbonated 1993 cementitious materials with various types of binder, Constr. Build. Mater. 68 (2014) 82–91. 1994 https://doi.org/10.1016/j.conbuildmat.2014.05.049. 1995
[202] C. Alonso, C. Andrade, M. Castellote, P. Castro, Chloride threshold values to depassivate 1996 reinforcing bars embedded in a standardized OPC mortar, Cem. Concr. Res. 30 (2000) 1047–1997 1055. https://doi.org/10.1016/S0008-8846(00)00265-9. 1998
[203] U.M. Angst, B. Elsener, C.K. Larsen, Ø. Vennesland, Chloride induced reinforcement corrosion: 1999 Electrochemical monitoring of initiation stage and chloride threshold values, Corros. Sci. 53 2000 (2011) 1451–1464. https://doi.org/10.1016/j.corsci.2011.01.025. 2001
[204] N. Silva, Chloride Induced Corrosion of Reinforcement Steel in Concrete, Chalmers University 2002 of Technology, 2013. 2003
[205] R.B. Figueira, A. Sadovski, A.P. Melo, E. V. Pereira, Chloride threshold value to initiate 2004 reinforcement corrosion in simulated concrete pore solutions: The influence of surface 2005 finishing and pH, Constr. Build. Mater. 141 (2017) 183–200. 2006 https://doi.org/10.1016/j.conbuildmat.2017.03.004. 2007
[206] K.Y. Ann, H.-W. Song, Chloride threshold level for corrosion of steel in concrete, Corros. Sci. 49 2008 (2007) 4113–4133. https://doi.org/10.1016/j.corsci.2007.05.007. 2009
[207] Y. Cao, C. Gehlen, U. Angst, L. Wang, Z. Wang, Y. Yao, Critical chloride content in reinforced 2010 concrete — An updated review considering Chinese experience, Cem. Concr. Res. 117 (2019) 2011 58–68. https://doi.org/10.1016/j.cemconres.2018.11.020. 2012
[208] A. Kenny, A. Katz, Steel-concrete interface influence on chloride threshold for corrosion – 2013 Empirical reinforcement to theory, Constr. Build. Mater. 244 (2020) 118376. 2014 https://doi.org/10.1016/j.conbuildmat.2020.118376. 2015
[209] U.M. Angst, B. Elsener, Chloride threshold values in concrete - A look back and ahead, Spec. 2016 Publ. 308 (2016) 1–12. 2017
[210] C.L. Page, Initiation of chloride-induced corrosion of steel in concrete: role of the interfacial 2018 zone, Mater. Corros. 60 (2009) 586–592. https://doi.org/10.1002/maco.200905278. 2019
[211] U.M. Angst, B. Elsener, The size effect in corrosion greatly influences the predicted life span of 2020 concrete infrastructures, Sci. Adv. 3 (2017) e1700751. 2021 https://doi.org/10.1126/sciadv.1700751. 2022
[212] J.A. Gonzalez, A. Molina, E. Otero, W. López, On the mechanism of steel corrosion in concrete: 2023 the role of oxygen diffusion, Mag. Concr. Res. 42 (1990) 23–27. 2024 https://doi.org/10.1680/macr.1990.42.150.23. 2025
[213] J.A. González, E. Otero, S. Feliu, W. López, Initial steps of corrosion in the steel/Ca(OH)2 + Cl− 2026 system: The role of heterogeneities on the steel surface and oxygen supply, Cem. Concr. Res. 2027 23 (1993) 33–40. https://doi.org/10.1016/0008-8846(93)90132-S. 2028
[214] T.D. Marcotte, Characterization of chloride-induced corrosion products that form in steel-2029 reinforced cementitious materials, University of Waterloo, 2001. 2030
[215] K.K. Sagoe-Crentsil, F.P. Glasser, “Green rust”, iron solubility and the role of chloride in the 2031 corrosion of steel at high pH, Cem. Concr. Res. 23 (1993) 785–791. 2032 https://doi.org/10.1016/0008-8846(93)90032-5. 2033
[216] U. Angst, B. Elsener, C.K. Larsen, Ø. Vennesland, Chloride induced reinforcement corrosion: 2034 Rate limiting step of early pitting corrosion, Electrochim. Acta. 56 (2011) 5877–5889. 2035

65
https://doi.org/10.1016/j.electacta.2011.04.124. 2036
[217] M. Pourbaix, Applications of electrochemistry in corrosion science and in practice, Corros. Sci. 2037 14 (1974) 25–82. https://doi.org/10.1016/S0010-938X(74)80006-5. 2038
[218] U. Angst, B. Elsener, A. Jamali, B. Adey, Concrete cover cracking owing to reinforcement 2039 corrosion - theoretical considerations and practical experience, Mater. Corros. 63 (2012) 2040 1069–1077. https://doi.org/10.1002/maco.201206669. 2041
[219] J. Warkus, M. Raupach, Modelling of reinforcement corrosion - geometrical effects on 2042 macrocell corrosion, Mater. Corros. 61 (2009) 494–504. 2043 https://doi.org/10.1002/maco.200905437. 2044
[220] J.A. González, C. Andrade, C. Alonso, S. Feliu, Comparison of rates of general corrosion and 2045 maximum pitting penetration on concrete embedded steel reinforcement, Cem. Concr. Res. 2046 25 (1995) 257–264. https://doi.org/10.1016/0008-8846(95)00006-2. 2047
[221] L. Yu, R. Fran ois, V.H. Dang, V. L’Hostis, R. Gagné, Distribution of corrosion and pitting factor 2048 of steel in corroded RC beams, Constr. Build. Mater. 95 (2015) 384–392. 2049 https://doi.org/10.1016/j.conbuildmat.2015.07.119. 2050
[222] R. François, S. Laurens, F. Deby, Which parameter to quantify corrosion intensity?, in: Corros. 2051 Its Consequences Reinf. Concr. Struct., Elsevier, 2018: pp. 63–76. 2052 https://doi.org/10.1016/B978-1-78548-234-2.50003-2. 2053
[223] C. Arya, P.R.. Vassie, Influence of cathode-to-anode area ratio and separation distance on 2054 galvanic corrosion currents of steel in concrete containing chlorides, Cem. Concr. Res. 25 2055 (1995) 989–998. https://doi.org/10.1016/0008-8846(95)00094-S. 2056
[224] C. Chalhoub, R. François, M. Carcasses, Effect of cathode–anode distance and electrical 2057 resistivity on macrocell corrosion currents and cathodic response in cases of chloride induced 2058 corrosion in reinforced concrete structures, Constr. Build. Mater. 245 (2020) 118337. 2059 https://doi.org/10.1016/j.conbuildmat.2020.118337. 2060
[225] L. Bourreau, L. Gaillet, V. Bouteiller, F. Schoefs, B. Thauvin, J. Schneider, S. Naar, Spatial 2061 identification of exposure zones of concrete structures exposed to a marine environment with 2062 respect to reinforcement corrosion, Struct. Infrastruct. Eng. 16 (2020) 346–354. 2063 https://doi.org/10.1080/15732479.2019.1655072. 2064
[226] S.J. Jaffer, C.M. Hansson, Chloride-induced corrosion products of steel in cracked-concrete 2065 subjected to different loading conditions, Cem. Concr. Res. 39 (2009) 116–125. 2066 https://doi.org/10.1016/j.cemconres.2008.11.001. 2067
[227] R.M. Cornell, U. Schwertmann, The Iron Oxides: Structure, Properties, Reactions, Occurrences, 2068 and Uses, Wiley-VCH, 2003. 2069
[228] J.A. González, J.M. Miranda, E. Otero, S. Feliu, Effect of electrochemically reactive rust layers 2070 on the corrosion of steel in a Ca(OH)2 solution, Corros. Sci. 49 (2007) 436–448. 2071 https://doi.org/10.1016/j.corsci.2006.04.014. 2072
[229] M. Stefanoni, U. Angst, B. Elsener, Local electrochemistry of reinforcement steel – 2073 Distribution of open circuit and pitting potentials on steels with different surface condition, 2074 Corros. Sci. 98 (2015) 610–618. https://doi.org/10.1016/j.corsci.2015.06.004. 2075
[230] Y. Ji, M. Wu, Z. Tan, F. Gao, F. Liu, Process control of reinforcement corrosion in concrete. Part 2076 2: Time-dependent dominating factors under different environmental conditions, Constr. 2077 Build. Mater. 73 (2014) 214–221. https://doi.org/10.1016/j.conbuildmat.2014.09.103. 2078

66
[231] Y. Ji, G. Zhan, Z. Tan, Y. Hu, F. Gao, Process control of reinforcement corrosion in concrete. 2079 Part 1: Effect of corrosion products, Constr. Build. Mater. 79 (2015) 214–222. 2080 https://doi.org/10.1016/j.conbuildmat.2014.12.083. 2081
[232] E. Burger, J. Monnier, P. Berger, D. Neff, V. L’Hostis, S. Perrin, P. Dillmann, The long-term 2082 corrosion of mild steel in depassivated concrete: Localizing the oxygen reduction sites in 2083 corrosion products by isotopic tracer method, J. Mater. Res. 26 (2011) 3107–3115. 2084 https://doi.org/10.1557/jmr.2011.391. 2085
[233] I. Azoulay, C. Rémazeilles, P. Refait, Corrosion of steel in carbonated media: The oxidation 2086 processes of chukanovite (Fe2(OH)2CO3), Corros. Sci. 85 (2014) 101–108. 2087 https://doi.org/10.1016/j.corsci.2014.04.004. 2088
[234] A. Köliö, M. Honkanen, J. Lahdensivu, M. Vippola, M. Pentti, Corrosion products of 2089 carbonation induced corrosion in existing reinforced concrete facades, Cem. Concr. Res. 78 2090 (2015) 200–207. https://doi.org/10.1016/j.cemconres.2015.07.009. 2091
[235] J. Hadi, P. Wersin, V. Serneels, J.-M. Greneche, Eighteen years of steel–bentonite interaction 2092 in the FEBEX in situ test at the Grimsel Test Site in Switzerland, Clays Clay Miner. 67 (2019) 2093 111–131. https://doi.org/10.1007/s42860-019-00012-5. 2094
[236] K.K. Sagoe-Crentsil, F.P. Glasser, Constitution of green rust and its significance to the 2095 corrosion of steel in Portland cement, Corrosion. 49 (1993) 457–463. 2096 https://doi.org/10.5006/1.3316072. 2097
[237] K. Suda, S. Misra, K. Motohashi, Corrosion products of reinforcing bars embedded in concrete, 2098 Corros. Sci. 35 (1993) 1543–1549. https://doi.org/10.1016/0010-938X(93)90382-Q. 2099
[238] V. L’Hostis, E. Amblard, W. Guillot, C. Paris, L. Bellot-Gurlet, Characterisation of the steel 2100 concrete interface submitted to chloride-induced-corrosion, Mater. Corros. 64 (2013) 185–2101 194. https://doi.org/10.1002/maco.201106488. 2102
[239] J. Shi, J. Ming, Y. Zhang, J. Jiang, Corrosion products and corrosion-induced cracks of low-alloy 2103 steel and low-carbon steel in concrete, Cem. Concr. Compos. 88 (2018) 121–129. 2104 https://doi.org/10.1016/j.cemconcomp.2018.02.002. 2105
[240] P. Refait, J.-M.R. Génin, The mechanisms of oxidation of ferrous hydroxychloride β-2106 Fe2(OH)3Cl in aqueous solution: The formation of akaganeite vs goethite, Corros. Sci. 39 2107 (1997) 539–553. https://doi.org/10.1016/S0010-938X(97)86102-1. 2108
[241] C. Rémazeilles, P. Refait, On the formation of β-FeOOH (Akaganéite) in chloride-containing 2109 environments, Corros. Sci. 49 (2007) 844–857. https://doi.org/10.1016/j.corsci.2006.06.003. 2110
[242] Y. Zhao, Y. Wu, W. Jin, Distribution of millscale on corroded steel bars and penetration of steel 2111 corrosion products in concrete, Corros. Sci. 66 (2013) 160–168. 2112 https://doi.org/10.1016/j.corsci.2012.09.014. 2113
[243] K.K. Aligizaki, M.R. de Rooij, D.D. Macdonald, Analysis of iron oxides accumulating at the 2114 interface between aggregates and cement paste, Cem. Concr. Res. 30 (2000) 1941–1945. 2115 https://doi.org/10.1016/S0008-8846(00)00392-6. 2116
[244] H.S. Wong, Y.X. Zhao, A.R. Karimi, N.R. Buenfeld, W.L. Jin, On the penetration of corrosion 2117 products from reinforcing steel into concrete due to chloride-induced corrosion, Corros. Sci. 2118 52 (2010) 2469–2480. https://doi.org/10.1016/j.corsci.2010.03.025. 2119
[245] T.D. Marcotte, C.M. Hansson, Corrosion products that form on steel within cement paste, 2120 Mater. Struct. 40 (2007) 325–340. https://doi.org/10.1617/s11527-006-9170-4. 2121

67
[246] Y. Zhao, H. Ren, H. Dai, W. Jin, Composition and expansion coefficient of rust based on X-ray 2122 diffraction and thermal analysis, Corros. Sci. 53 (2011) 1646–1658. 2123 https://doi.org/10.1016/j.corsci.2011.01.007. 2124
[247] G. Fang, W. Ding, Y. Liu, J. Zhang, F. Xing, B. Dong, Identification of corrosion products and 3D 2125 distribution in reinforced concrete using X-ray micro computed tomography, Constr. Build. 2126 Mater. 207 (2019) 304–315. https://doi.org/10.1016/j.conbuildmat.2019.02.133. 2127
[248] C. Lu, W. Jin, R. Liu, Reinforcement corrosion-induced cover cracking and its time prediction 2128 for reinforced concrete structures, Corros. Sci. 53 (2011) 1337–1347. 2129 https://doi.org/10.1016/j.corsci.2010.12.026. 2130
[249] B. Sanz, J. Planas, J.M. Sancho, A closer look to the mechanical behavior of the oxide layer in 2131 concrete reinforcement corrosion, Int. J. Solids Struct. 62 (2015) 256–268. 2132 https://doi.org/10.1016/j.ijsolstr.2015.02.040. 2133
[250] Y. Liu, R.E. Weyers, Modeling the time-to-corrosion cracking in chloride contaminated 2134 reinforced concrete structures, ACI Mater. J. 95 (1998) 675–680. 2135 https://doi.org/10.14359/410. 2136
[251] A. Poursaee, Temperature dependence of the formation of the passivation layer on carbon 2137 steel in high alkaline environment of concrete pore solution, Electrochem. Commun. 73 2138 (2016) 24–28. https://doi.org/10.1016/j.elecom.2016.10.003. 2139
[252] B. Díaz, B. Guitián, X.R. Nóvoa, M.C. Pérez, The effect of long-term atmospheric aging and 2140 temperature on the electrochemical behaviour of steel rebars in mortar, Corros. Sci. 140 2141 (2018) 143–150. https://doi.org/10.1016/j.corsci.2018.06.007. 2142
[253] J.M. Deus, L. Freire, M.F. Montemor, X.R. Nóvoa, The corrosion potential of stainless steel 2143 rebars in concrete: Temperature effect, Corros. Sci. 65 (2012) 556–560. 2144 https://doi.org/10.1016/j.corsci.2012.09.001. 2145
[254] A. Česen, T. Kosec, A. Legat, Characterization of steel corrosion in mortar by various 2146 electrochemical and physical techniques, Corros. Sci. 75 (2013) 47–57. 2147 https://doi.org/10.1016/j.corsci.2013.05.015. 2148
[255] B. Šavija, M. Luković, S.A.S. Hosseini, J. Pacheco, E. Schlangen, Corrosion induced cover 2149 cracking studied by X-ray computed tomography, nanoindentation, and energy dispersive X-2150 ray spectrometry (EDS), Mater. Struct. 48 (2015) 2043–2062. https://doi.org/10.1617/s11527-2151 014-0292-9. 2152
[256] B. Dong, G. Fang, Y. Liu, P. Dong, J. Zhang, F. Xing, S. Hong, Monitoring reinforcement 2153 corrosion and corrosion-induced cracking by X-ray microcomputed tomography method, Cem. 2154 Concr. Res. 100 (2017) 311–321. https://doi.org/10.1016/j.cemconres.2017.07.009. 2155
[257] G. Fang, Y. Liu, S. Qin, W. Ding, J. Zhang, S. Hong, F. Xing, B. Dong, Visualized tracing of crack 2156 self-healing features in cement/microcapsule system with X-ray microcomputed tomography, 2157 Constr. Build. Mater. 179 (2018) 336–347. 2158 https://doi.org/10.1016/j.conbuildmat.2018.05.193. 2159
[258] B. Dong, G. Shi, P. Dong, W. Ding, X. Teng, S. Qin, Y. Liu, F. Xing, S. Hong, Visualized tracing of 2160 rebar corrosion evolution in concrete with X-ray micro-computed tomography method, Cem. 2161 Concr. Compos. 92 (2018) 102–109. https://doi.org/10.1016/j.cemconcomp.2018.06.003. 2162
[259] W.-J. Chitty, P. Dillmann, V. L’Hostis, C. Lombard, Long-term corrosion resistance of metallic 2163 reinforcements in concrete—a study of corrosion mechanisms based on archaeological 2164 artefacts, Corros. Sci. 47 (2005) 1555–1581. https://doi.org/10.1016/j.corsci.2004.07.032. 2165

68
[260] V. L’Hostis, D. Neff, L. Bellot-Gurlet, P. Dillmann, Characterization of long-term corrosion of 2166 rebars embedded in concretes sampled on French historical buildings aged from 50 to 80 2167 years, Mater. Corros. 60 (2009) 93–98. https://doi.org/10.1002/maco.200805019. 2168
[261] Y. Zhao, H. Ding, W. Jin, Development of the corrosion-filled paste and corrosion layer at the 2169 steel/concrete interface, Corros. Sci. 87 (2014) 199–210. 2170 https://doi.org/10.1016/j.corsci.2014.06.032. 2171
[262] Y. Zhao, X. Zhang, W. Jin, Influence of environment on the development of corrosion product-2172 filled paste and a corrosion layer at the steel/concrete interface, Corros. Sci. 124 (2017) 1–9. 2173 https://doi.org/10.1016/j.corsci.2017.03.026. 2174
[263] Y. Zhao, B. Hu, J. Yu, W. Jin, Non-uniform distribution of rust layer around steel bar in 2175 concrete, Corros. Sci. 53 (2011) 4300–4308. https://doi.org/10.1016/j.corsci.2011.08.045. 2176
[264] C. Cao, M.M.S. Cheung, Non-uniform rust expansion for chloride-induced pitting corrosion in 2177 RC structures, Constr. Build. Mater. (2014). 2178 https://doi.org/10.1016/j.conbuildmat.2013.10.042. 2179
[265] Y. Zhao, J. Dong, Y. Wu, W. Jin, Corrosion-induced concrete cracking model considering 2180 corrosion product-filled paste at the concrete/steel interface, Constr. Build. Mater. 116 (2016) 2181 273–280. https://doi.org/10.1016/j.conbuildmat.2016.04.097. 2182
[266] X. Xi, S. Yang, C.-Q. Li, A non-uniform corrosion model and meso-scale fracture modelling of 2183 concrete, Cem. Concr. Res. 108 (2018) 87–102. 2184 https://doi.org/10.1016/j.cemconres.2018.03.009. 2185
[267] A. Jamali, U. Angst, B. Adey, B. Elsener, Modeling of corrosion-induced concrete cover 2186 cracking: A critical analysis, Constr. Build. Mater. 42 (2013) 225–237. 2187 https://doi.org/10.1016/j.conbuildmat.2013.01.019. 2188
[268] C. Andrade, I. Martínez, Techniques for measuring the corrosion rate (polarization resistance) 2189 and the corrosion potential of reinforced concrete structures, Non-Destructive Eval. Reinf. 2190 Concr. Struct. (2010) 284–316. https://doi.org/10.1533/9781845699604.2.284. 2191
[269] R. Francois, G. Arliguie, D. Bardy, Electrode potential measurements of concrete 2192 reinforcement for corrosion evaluation, Cem. Concr. Res. 24 (1994) 401–412. 2193 https://doi.org/10.1016/0008-8846(94)90127-9. 2194
[270] K. Reichling, M. Raupach, Method to determine electrochemical potential gradients without 2195 reinforcement connection in concrete structures, Cem. Concr. Compos. 47 (2014) 3–8. 2196 https://doi.org/10.1016/j.cemconcomp.2013.12.007. 2197
[271] S. Garcia, F. Deby, Numerical and experimental development of gradient potential 2198 measurement for corrosion detection of reinforced concrete slab, in: Serv. Life Durab. Reinf. 2199 Concr. Struct., Cefracor, 2019: pp. 71–86. https://doi.org/10.1007/978-3-319-90236-4_6. 2200
[272] M. Pour-Ghaz, O.B. Isgor, P. Ghods, Quantitative interpretation of half-cell potential 2201 measurements in concrete structures, J. Mater. Civ. Eng. 21 (2009) 467–475. 2202 https://doi.org/10.1061/(ASCE)0899-1561(2009)21:9(467). 2203
[273] S.K. Verma, S.S. Bhadauria, S. Akhtar, Monitoring corrosion of steel bars in reinforced 2204 concrete structures, Sci. World J. 2014 (2014) 957904. https://doi.org/10.1155/2014/957904. 2205
[274] U. Angst, Ø. Vennesland, R. Myrdal, Diffusion potentials as source of error in electrochemical 2206 measurements in concrete, Mater. Struct. 42 (2009) 365–375. 2207 https://doi.org/10.1617/s11527-008-9387-5. 2208

69
[275] P. Castro, A.A. Sagüés, E.I. Moreno, L. Maldonado, J. Genescá, Characterization of activated 2209 titanium solid reference electrodes for corrosion testing of steel in concrete, Corrosion. 52 2210 (1996) 609–617. https://doi.org/10.5006/1.3292151. 2211
[276] G.S. Duffó, S.B. Farina, Development of an embeddable sensor to monitor the corrosion 2212 process of new and existing reinforced concrete structures, Constr. Build. Mater. 23 (2009) 2213 2746–2751. https://doi.org/10.1016/j.conbuildmat.2009.04.001. 2214
[277] S.P. Karthick, S. Muralidharan, V. Saraswathy, K. Thangavel, Long-term relative performance 2215 of embedded sensor and surface mounted electrode for corrosion monitoring of steel in 2216 concrete structures, Sensors Actuators B Chem. 192 (2014) 303–309. 2217 https://doi.org/10.1016/j.snb.2013.10.123. 2218
[278] M. Jin, Y. Jiang, L. Jiang, H. Chu, F. Zhi, S. Gao, Fabrication and characterization of pseudo 2219 reference electrode based on graphene-cement composites for corrosion monitoring in 2220 reinforced concrete structure, Constr. Build. Mater. 204 (2019) 144–157. 2221 https://doi.org/10.1016/j.conbuildmat.2019.01.169. 2222
[279] A. Sassolini, N. Colozza, E. Papa, K. Hermansson, I. Cacciotti, F. Arduini, Screen-printed 2223 electrode as a cost-effective and miniaturized analytical tool for corrosion monitoring of 2224 reinforced concrete, Electrochem. Commun. 98 (2019) 69–72. 2225 https://doi.org/10.1016/j.elecom.2018.11.023. 2226
[280] Ø. Vennesland, M. Raupach, C. Andrade, Recommendation of Rilem TC 154-EMC: 2227 “Electrochemical techniques for measuring corrosion in concrete”—measurements with 2228 embedded probes, Mater. Struct. 40 (2007) 745–758. https://doi.org/10.1617/s11527-006-2229 9219-4. 2230
[281] A. Leibbrandt, B. Elsener, C. Hürzeler, G. Caprati, R. Flatt, R. Siegwart, Climbing robot for 2231 corrosion monitoring and sensor for potential mapping, WO2013156142A1, 2013. 2232 https://doi.org/10.2749/2221378027963366. 2233
[282] B. Elsener, C. Andrade, J. Gulikers, R. Polder, M. Raupach, Half-cell potential measurements - 2234 Potential mapping on reinforced concrete structures, Mater. Struct. 36 (2003) 461–671. 2235 https://doi.org/10.1007/BF02481526. 2236
[283] ASTM_C876-09, Standard test method for corrosion potentials of uncoated reinforcing steel 2237 in concrete (2009), (n.d.). https://www.astm.org/Standards/C876.htm. 2238
[284] K. Reichling, M. Raupach, J. Broomfield, J. Gulikers, V. L’Hostis, S. Kessler, K. Osterminski, I. 2239 Pepenar, U. Schneck, G. Sergi, G. Taché, Full surface inspection methods regarding 2240 reinforcement corrosion of concrete structures, Mater. Corros. 64 (2013) 116–127. 2241 https://doi.org/10.1002/maco.201206625. 2242
[285] E. Sassine, S. Laurens, R. François, E. Ringot, A critical discussion on rebar electrical continuity 2243 and usual interpretation thresholds in the field of half-cell potential measurements in steel 2244 reinforced concrete, Mater. Struct. 51 (2018) 93. https://doi.org/10.1617/s11527-018-1221-0. 2245
[286] G.Y. Koga, B. Albert, R.P. Nogueira, Revisiting the ASTM C876 standard for corrosion of 2246 reinforcing steel: On the correlation between corrosion potential and polarization resistance 2247 during the curing of different cement mortars, Electrochem. Commun. 94 (2018) 1–4. 2248 https://doi.org/10.1016/j.elecom.2018.07.017. 2249
[287] P. Gu, J.J. Beaudoin, Obtaining Effective Half-Cell Potential Measurements in Reinforced 2250 Concrete Structures, National R, 1998. 2251
[288] W. Yodsudjai, T. Pattarakittam, Factors influencing half-cell potential measurement and its 2252

70
relationship with corrosion level, Measurement. 104 (2017) 159–168. 2253 https://doi.org/10.1016/j.measurement.2017.03.027. 2254
[289] J.-F. Lataste, G. Villain, Electrical Methods, in: Non-Destructive Test. Eval. Civ. Eng. Struct., 2255 Elsevier, 2018: pp. 139–172. https://doi.org/10.1016/B978-1-78548-229-8.50004-2. 2256
[290] R.B. Polder, Test methods for on site measurement of resistivity of concrete — a RILEM TC-2257 154 technical recommendation, Constr. Build. Mater. 15 (2001) 125–131. 2258 https://doi.org/10.1016/S0950-0618(00)00061-1. 2259
[291] P. Azarsa, R. Gupta, Electrical resistivity of concrete for durability evaluation: A review, Adv. 2260 Mater. Sci. Eng. 2017 (2017) 1–30. https://doi.org/10.1155/2017/8453095. 2261
[292] F. Presuel-Moreno, Y.-Y. Wu, Y. Liu, Effect of curing regime on concrete resistivity and aging 2262 factor over time, Constr. Build. Mater. 48 (2013) 874–882. 2263 https://doi.org/10.1016/j.conbuildmat.2013.07.094. 2264
[293] R. du Plooy, S. Palma Lopes, G. Villain, X. Dérobert, Development of a multi-ring resistivity cell 2265 and multi-electrode resistivity probe for investigation of cover concrete condition, NDT E Int. 2266 54 (2013) 27–36. https://doi.org/10.1016/j.ndteint.2012.11.007. 2267
[294] R. Spragg, C. Qiao, T. Barrett, J. Weiss, Assessing a concrete’s resistance to chloride ion ingress 2268 using the formation factor, Corros. Steel Concr. Struct. (2016) 211–238. 2269 https://doi.org/10.1016/B978-1-78242-381-2.00011-0. 2270
[295] A.J. Garzon, J. Sanchez, C. Andrade, N. Rebolledo, E. Menéndez, J. Fullea, Modification of four 2271 point method to measure the concrete electrical resistivity in presence of reinforcing bars, 2272 Cem. Concr. Compos. 53 (2014) 249–257. 2273 https://doi.org/10.1016/j.cemconcomp.2014.07.013. 2274
[296] R. Polder, C. Andrade, B. Elsener, Ø. Vennesland, J. Gulikers, R. Weidert, M. Raupach, Test 2275 methods for on site measurement of resistivity of concrete, Mater. Struct. 33 (2000) 603–611. 2276 https://doi.org/10.1007/BF02480599. 2277
[297] H. Layssi, P. Ghods, A.R. Alizadeh, M. Salehi, Electrical resistivity of concrete: Concepts, 2278 applications, and measurement techniques, Concr. Int. (2015) 41–46. 2279
[298] W.J. Weiss, R.P. Spragg, O.B. Isgor, M.T. Ley, T. Van Dam, Toward performance specifications 2280 for concrete: Linking resistivity, RCPT and diffusion predictions using the formation factor for 2281 use in specifications, in: High Tech Concr. Where Technol. Eng. Meet, Springer International 2282 Publishing, Cham, 2018: pp. 2057–2065. https://doi.org/10.1007/978-3-319-59471-2_235. 2283
[299] W.J. Weiss, T.J. Barrett, C. Qiao, H. Todak, Toward a specification for transport properties of 2284 concrete based on the formation factor of a sealed specimen, Adv. Civ. Eng. Mater. 5 (2016) 2285 20160004. https://doi.org/10.1520/ACEM20160004. 2286
[300] R. He, H. Ma, R.B. Hafiz, C. Fu, X. Jin, J. He, Determining porosity and pore network 2287 connectivity of cement-based materials by a modified non-contact electrical resistivity 2288 measurement: Experiment and theory, Mater. Des. 156 (2018) 82–92. 2289 https://doi.org/10.1016/j.matdes.2018.06.045. 2290
[301] H. Sallehi, P. Ghods, O.B. Isgor, Formation factor of fresh cementitious pastes, Cem. Concr. 2291 Compos. 91 (2018) 174–188. https://doi.org/10.1016/j.cemconcomp.2018.05.011. 2292
[302] X. Lu, Application of the Nernst-Einstein equation to concrete, Cem. Concr. Res. 27 (1997) 2293 293–302. https://doi.org/10.1016/S0008-8846(96)00200-1. 2294
[303] K.A. Snyder, The relationship between the formation factor and the diffusion coefficient of 2295

71
porous materials saturated with concentrated electrolytes: theoretical and experimental 2296 considerations, Concr. Sci. Eng. 3 (2001). 2297
[304] K.A. Snyder, X. Feng, B.D. Keen, T.O. Mason, Estimating the electrical conductivity of cement 2298 paste pore solutions from OH−, K+ and Na+ concentrations, Cem. Concr. Res. 33 (2003) 793–2299 798. https://doi.org/10.1016/S0008-8846(02)01068-2. 2300
[305] D.P. Bentz, A virtual rapid chloride permeability test, Cem. Concr. Compos. 29 (2007) 723–2301 731. https://doi.org/10.1016/j.cemconcomp.2007.06.006. 2302
[306] M. Tsui Chang, P. Suraneni, O.B. Isgor, D. Trejo, W.J. Weiss, Using X-ray fluorescence to assess 2303 the chemical composition and resistivity of simulated cementitious pore solutions, Int. J. Adv. 2304 Eng. Sci. Appl. Math. 9 (2017) 136–143. https://doi.org/10.1007/s12572-017-0181-x. 2305
[307] Y. Bu, D. Luo, J. Weiss, Using Fick’s second law and Nernst–Planck approach in prediction of 2306 chloride ingress in concrete materials, Adv. Civ. Eng. Mater. 3 (2014) 20140018. 2307 https://doi.org/10.1520/ACEM20140018. 2308
[308] C.A.J. Appelo, Solute transport solved with the Nernst-Planck equation for concrete pores 2309 with ‘free’ water and a double layer, Cem. Concr. Res. 101 (2017) 102–113. 2310 https://doi.org/10.1016/j.cemconres.2017.08.030. 2311
[309] C. Qiao, A.T. Coyle, O.B. Isgor, W.J. Weiss, Prediction of chloride ingress in saturated concrete 2312 using formation factor and chloride binding isotherm, Adv. Civ. Eng. Mater. 7 (2018) 2313 20170141. https://doi.org/10.1520/ACEM20170141. 2314
[310] V. Jafari Azad, A.R. Erbektas, C. Qiao, O.B. Isgor, W.J. Weiss, Relating the formation factor and 2315 chloride binding parameters to the apparent chloride diffusion coefficient of concrete, J. 2316 Mater. Civ. Eng. 31 (2019) 04018392. https://doi.org/10.1061/(ASCE)MT.1943-5533.0002615. 2317
[311] O. Sengul, Use of electrical resistivity as an indicator for durability, Constr. Build. Mater. 73 2318 (2014) 434–441. https://doi.org/10.1016/j.conbuildmat.2014.09.077. 2319
[312] M.K. Moradllo, C. Qiao, B. Isgor, S. Reese, W.J. Weiss, Relating formation factor of concrete to 2320 water absorption, ACI Mater. J. 115 (2018) 887–898. https://doi.org/10.14359/51706844. 2321
[313] O.B. Isgor, W.J. Weiss, A nearly self-sufficient framework for modelling reactive-transport 2322 processes in concrete, Mater. Struct. 52 (2019) 3. https://doi.org/10.1617/s11527-018-1305-2323 x. 2324
[314] R. Spragg, C. Villani, K. Snyder, D. Bentz, J.W. Bullard, J. Weiss, Factors that influence electrical 2325 resistivity measurements in cementitious systems, Transp. Res. Rec. J. Transp. Res. Board. 2326 2342 (2013) 90–98. https://doi.org/10.3141/2342-11. 2327
[315] Y. Wang, Y. Xi, The effect of temperature on moisture transport in concrete, Materials (Basel). 2328 10 (2017) 926. https://doi.org/10.3390/ma10080926. 2329
[316] A. Aït-Mokhtar, R. Belarbi, F. Benboudjema, N. Burlion, B. Capra, M. Carcassès, J.B. Colliat, F. 2330 Cussigh, F. Deby, F. Jacquemot, T. De Larrard, J.F. Lataste, P. Le Bescop, M. Pierre, S. Poyet, P. 2331 Rougeau, T. Rougelot, A. Sellier, J. Séménadisse, J.M. Torrenti, A. Trabelsi, P. Turcry, H. Yanez-2332 Godoy, Experimental investigation of the variability of concrete durability properties, Cem. 2333 Concr. Res. 45 (2013) 21–36. https://doi.org/10.1016/j.cemconres.2012.11.002. 2334
[317] B. Lothenbach, F. Winnefeld, C. Alder, E. Wieland, P. Lunk, Effect of temperature on the pore 2335 solution, microstructure and hydration products of Portland cement pastes, Cem. Concr. Res. 2336 37 (2007) 483–491. https://doi.org/10.1016/j.cemconres.2006.11.016. 2337
[318] Y. Liu, F.J. Presuel-Moreno, Normalization of temperature effect on concrete resistivity by 2338

72
method using Arrhenius law, ACI Mater. J. 111 (2014) 433–442. 2339 https://doi.org/10.14359/51686725. 2340
[319] P.A. Claisse, H.I. El-Sayad, I.G. Shaaban, Permeability and pore volume of carbonated 2341 concrete, ACI Mater. J. 96 (1999) 378–381. https://doi.org/10.14359/636. 2342
[320] U.M. Angst, B. Elsener, On the applicability of Wenner method for resistivity measurements of 2343 concrete, ACI Mater. J. 111 (2014) 661–672. https://doi.org/10.14359/51686831. 2344
[321] C.-T. Chen, J.-J. Chang, W. Yeih, The effects of specimen parameters on the resistivity of 2345 concrete, Constr. Build. Mater. 71 (2014) 35–43. 2346 https://doi.org/10.1016/j.conbuildmat.2014.08.009. 2347
[322] M. Salehi, P. Ghods, O.B. Isgor, Numerical study on the effect of cracking on surface resistivity 2348 of plain and reinforced concrete elements, J. Mater. Civ. Eng. 27 (2015) 04015053. 2349 https://doi.org/10.1061/(ASCE)MT.1943-5533.0001328. 2350
[323] Ł. Sadowski, New non-destructive method for linear polarisation resistance corrosion rate 2351 measurement, Arch. Civ. Mech. Eng. 10 (2010) 109–116. https://doi.org/10.1016/S1644-2352 9665(12)60053-3. 2353
[324] A.Q. Nguyen, G. Klysz, F. Deby, J.-P. Balayssac, Evaluation of water content gradient using a 2354 new configuration of linear array four-point probe for electrical resistivity measurement, Cem. 2355 Concr. Compos. 83 (2017) 308–322. https://doi.org/10.1016/j.cemconcomp.2017.07.020. 2356
[325] S.G. Millard, Reinforced concrete resistivity measurement techniques, Proc. Inst. Civ. Eng. 91 2357 (1991) 71–88. https://doi.org/10.1680/iicep.1991.13583. 2358
[326] K.R. Gowers, S.G. Millard, Measurement of concrete resistivity for assessment of corrosion 2359 severity of steel using Wenner technique, ACI Mater. J. 96 (1999) 536–541. 2360 https://doi.org/10.14359/655. 2361
[327] O. Sengul, O.E. Gjorv, Effect of embedded steel on electrical resistivity measurements on 2362 concrete structures, ACI Mater. J. 106 (2009) 11–18. https://doi.org/10.14359/56311. 2363
[328] F. Presuel-Moreno, Y. Liu, Y.-Y. Wu, Numerical modeling of the effects of rebar presence 2364 and/or multilayered concrete resistivity on the apparent resistivity measured via the Wenner 2365 method, Constr. Build. Mater. 48 (2013) 16–25. 2366 https://doi.org/10.1016/j.conbuildmat.2013.06.053. 2367
[329] M. Salehi, P. Ghods, O. Burkan Isgor, Numerical investigation of the role of embedded 2368 reinforcement mesh on electrical resistivity measurements of concrete using the Wenner 2369 probe technique, Mater. Struct. 49 (2016) 301–316. https://doi.org/10.1617/s11527-014-2370 0498-x. 2371
[330] W. Morris, E.I. Moreno, A.A. Sagüés, Practical evaluation of resistivity of concrete in test 2372 cylinders using a Wenner array probe, Cem. Concr. Res. 26 (1996) 1779–1787. 2373 https://doi.org/10.1016/S0008-8846(96)00175-5. 2374
[331] O. Sengul, O.E. Gjorv, Electrical resistivity measurements for quality control during concrete 2375 construction, ACI Mater. J. 105 (2008) 541–547. https://doi.org/10.14359/20195. 2376
[332] P. Ghosh, Q. Tran, Influence of parameters on surface resistivity of concrete, Cem. Concr. 2377 Compos. 62 (2015) 134–145. https://doi.org/10.1016/j.cemconcomp.2015.06.003. 2378
[333] J. Sanchez, C. Andrade, J. Torres, N. Rebolledo, J. Fullea, Determination of reinforced concrete 2379 durability with on-site resistivity measurements, Mater. Struct. 50 (2017) 41. 2380 https://doi.org/10.1617/s11527-016-0884-7. 2381

73
[334] K. Hornbostel, C.K. Larsen, M.R. Geiker, Relationship between concrete resistivity and 2382 corrosion rate – A literature review, Cem. Concr. Compos. 39 (2013) 60–72. 2383 https://doi.org/10.1016/j.cemconcomp.2013.03.019. 2384
[335] C. Alonso, C. Andrade, J.A. González, Relation between resistivity and corrosion rate of 2385 reinforcements in carbonated mortar made with several cement types, Cem. Concr. Res. 18 2386 (1988) 687–698. https://doi.org/10.1016/0008-8846(88)90091-9. 2387
[336] S. Feliu, J.A. González, S. Feliu, C. Andrade, Relationship between conductivity of concrete and 2388 corrosion of reinforcing bars, Br. Corros. J. 24 (1989) 195–198. 2389 https://doi.org/10.1179/000705989798270027. 2390
[337] B. Yu, J. Liu, Z. Chen, Probabilistic evaluation method for corrosion risk of steel reinforcement 2391 based on concrete resistivity, Constr. Build. Mater. 138 (2017) 101–113. 2392 https://doi.org/10.1016/j.conbuildmat.2017.01.100. 2393
[338] R.B. Figueira, Electrochemical sensors for monitoring the corrosion conditions of reinforced 2394 concrete structures: A review, Appl. Sci. 7 (2017) 1157. https://doi.org/10.3390/app7111157. 2395
[339] W. Morris, A. Vico, M. Vazquez, S.R. de Sanchez, Corrosion of reinforcing steel evaluated by 2396 means of concrete resistivity measurements, Corros. Sci. 44 (2002) 81–99. 2397 https://doi.org/10.1016/S0010-938X(01)00033-6. 2398
[340] J. Gulikers, Theoretical considerations on the supposed linear relationship between concrete 2399 resistivity and corrosion rate of steel reinforcement, Mater. Corros. 56 (2005) 393–403. 2400 https://doi.org/10.1002/maco.200403841. 2401
[341] S. Ahmad, An experimental study on correlation between concrete resistivity and 2402 reinforcement corrosion rate, Anti-Corrosion Methods Mater. 61 (2014) 158–165. 2403 https://doi.org/10.1108/ACMM-07-2013-1285. 2404
[342] F. Akgul, Inspection and evaluation of a network of concrete bridges based on multiple NDT 2405 techniques, Struct. Infrastruct. Eng. (2020) 1–20. 2406 https://doi.org/10.1080/15732479.2020.1790016. 2407
[343] K. Hornbostel, B. Elsener, U.M. Angst, C.K. Larsen, M.R. Geiker, Limitations of the use of 2408 concrete bulk resistivity as an indicator for the rate of chloride-induced macro-cell corrosion, 2409 Struct. Concr. 18 (2017) 326–333. https://doi.org/10.1002/suco.201500141. 2410
[344] K. Hornbostel, U.M. Angst, B. Elsener, C.K. Larsen, M.R. Geiker, On the limitations of 2411 predicting the ohmic resistance in a macro-cell in mortar from bulk resistivity measurements, 2412 Cem. Concr. Res. 76 (2015) 147–158. https://doi.org/10.1016/j.cemconres.2015.05.023. 2413
[345] K. Hornbostel, U.M. Angst, B. Elsener, C.K. Larsen, M.R. Geiker, Influence of mortar resistivity 2414 on the rate-limiting step of chloride-induced macro-cell corrosion of reinforcing steel, Corros. 2415 Sci. 110 (2016) 46–56. https://doi.org/10.1016/j.corsci.2016.04.011. 2416
[346] A.T. Coyle, R.P. Spragg, P. Suraneni, A.N. Amirkhanian, W.J. Weiss, Comparison of linear 2417 temperature corrections and activation energy temperature corrections for electrical 2418 resistivity measurements of concrete, Adv. Civ. Eng. Mater. 7 (2018) 20170135. 2419 https://doi.org/10.1520/ACEM20170135. 2420
[347] J.M. Deus, B. Díaz, L. Freire, X.R. Nóvoa, The electrochemical behaviour of steel rebars in 2421 concrete: an electrochemical impedance spectroscopy study of the effect of temperature, 2422 Electrochim. Acta. 131 (2014) 106–115. https://doi.org/10.1016/j.electacta.2013.12.012. 2423
[348] K. Reichling, M. Raupach, N. Klitzsch, Determination of the distribution of electrical resistivity 2424
74
in reinforced concrete structures using electrical resistivity tomography, Mater. Corros. 66 2425 (2015) 763–771. https://doi.org/10.1002/maco.201407763. 2426
[349] K. Karhunen, A. Seppänen, A. Lehikoinen, P.J.M. Monteiro, J.P. Kaipio, Electrical resistance 2427 tomography imaging of concrete, Cem. Concr. Res. 40 (2010) 137–145. 2428 https://doi.org/10.1016/j.cemconres.2009.08.023. 2429
[350] M.H. Loke, Tutorial: 2-D and 3-D electrical imaging surveys, 2004. www.geoelectrical.com 2430 (accessed July 13, 2018). 2431
[351] D. Smyl, Electrical tomography for characterizing transport properties in cement-based 2432 materials: A review, Constr. Build. Mater. 244 (2020) 118299. 2433 https://doi.org/10.1016/j.conbuildmat.2020.118299. 2434
[352] M.A. Alhajj, S. Palma-Lopes, G. Villain, Accounting for steel rebar effect on resistivity profiles 2435 in view of reinforced concrete structure survey, Constr. Build. Mater. 223 (2019) 898–909. 2436 https://doi.org/10.1016/j.conbuildmat.2019.07.208. 2437
[353] J. Priou, Y. Lecieux, M. Chevreuil, V. Gaillard, C. Lupi, D. Leduc, E. Rozière, R. Guyard, F. 2438 Schoefs, In situ DC electrical resistivity mapping performed in a reinforced concrete wharf 2439 using embedded sensors, Constr. Build. Mater. 211 (2019) 244–260. 2440 https://doi.org/10.1016/j.conbuildmat.2019.03.152. 2441
[354] J. Badr, Y. Fargier, S. Palma-Lopes, F. Deby, J.-P. Balayssac, S. Delepine-Lesoille, L.-M. 2442 Cottineau, G. Villain, Design and validation of a multi-electrode embedded sensor to monitor 2443 resistivity profiles over depth in concrete, Constr. Build. Mater. 223 (2019) 310–321. 2444 https://doi.org/10.1016/j.conbuildmat.2019.06.226. 2445
[355] M. Fares, G. Villain, S. Bonnet, S. Palma Lopes, B. Thauvin, M. Thiery, Determining chloride 2446 content profiles in concrete using an electrical resistivity tomography device, Cem. Concr. 2447 Compos. 94 (2018) 315–326. https://doi.org/10.1016/j.cemconcomp.2018.08.001. 2448
[356] S. Bonnet, J.-P. Balayssac, Combination of the Wenner resistivimeter and Torrent 2449 permeameter methods for assessing carbonation depth and saturation level of concrete, 2450 Constr. Build. Mater. 188 (2018) 1149–1165. 2451 https://doi.org/10.1016/j.conbuildmat.2018.07.151. 2452
[357] D. Smyl, M. Hallaji, A. Seppänen, M. Pour-Ghaz, Three-dimensional electrical impedance 2453 tomography to monitor unsaturated moisture ingress in cement-based materials, Transp. 2454 Porous Media. 115 (2016) 101–124. https://doi.org/10.1007/s11242-016-0756-1. 2455
[358] D. Smyl, R. Rashetnia, A. Seppänen, M. Pour-Ghaz, Can electrical resistance tomography be 2456 used for imaging unsaturated moisture flow in cement-based materials with discrete cracks?, 2457 Cem. Concr. Res. 91 (2017) 61–72. https://doi.org/10.1016/j.cemconres.2016.10.009. 2458
[359] E. V. Pereira, M.M. Salta, I.T.E. Fonseca, On the measurement of the polarisation resistance of 2459 reinforcing steel with embedded sensors: A comparative study, Mater. Corros. 66 (2015) 2460 1029–1038. https://doi.org/10.1002/maco.201407910. 2461
[360] C. Andrade, L. Soler, C. Alonso, X.R. Nóvoa, M. Keddam, The importance of geometrical 2462 considerations in the measurement of steel corrosion in concrete by means of AC impedance, 2463 Corros. Sci. 37 (1995) 2013–2023. https://doi.org/10.1016/0010-938X(95)00095-2. 2464
[361] S. Rengaraju, L. Neelakantan, R.G. Pillai, Investigation on the polarization resistance of steel 2465 embedded in highly resistive cementitious systems – An attempt and challenges, Electrochim. 2466 Acta. 308 (2019) 131–141. https://doi.org/10.1016/j.electacta.2019.03.200. 2467

75
[362] O.B. Isgor, U. Angst, M. Geiker, C. Halmen, C. Hansson, J. Pacheco, D. Tepke, D. Trejo, P. 2468 Vaddey, Recommended practice for reporting experimental data produced from studies on 2469 corrosion of steel in cementitious systems, RILEM Tech. Lett. 4 (2019) 22–32. 2470 https://doi.org/10.21809/rilemtechlett.2019.90. 2471
[363] M. Stern, A.L. Geary, Electrochemical polarization, J. Electrochem. Soc. 104 (1957) 56. 2472 https://doi.org/10.1149/1.2428496. 2473
[364] A. Guyader, F. Huet, R.P. Nogueira, Polarization resistance measurements: Potentiostatically 2474 or galvanostatically?, Corrosion. 65 (2009) 136–144. https://doi.org/10.5006/1.3319118. 2475
[365] S. Ahmad, B. Bhattacharjee, A simple arrangement and procedure for in-situ measurement of 2476 corrosion rate of rebar embedded in concrete, Corros. Sci. 37 (1995) 781–791. 2477 https://doi.org/10.1016/0010-938X(95)80008-5. 2478
[366] A. Fahim, P. Ghods, O.B. Isgor, M.D.A. Thomas, A critical examination of corrosion rate 2479 measurement techniques applied to reinforcing steel in concrete, Mater. Corros. 69 (2018) 2480 1784–1799. https://doi.org/10.1002/maco.201810263. 2481
[367] A.A. Sagüés, S.C. Kranc, E.I. Moreno, The time-domain response of a corroding system with 2482 constant phase angle interfacial component: Application to steel in concrete, Corros. Sci. 37 2483 (1995) 1097–1113. https://doi.org/10.1016/0010-938X(95)00017-E. 2484
[368] C.J. Newton, J.M. Sykes, A galvanostatic pulse technique for investigation of steel corrosion in 2485 concrete, Corros. Sci. 28 (1988) 1051–1074. https://doi.org/10.1016/0010-938X(88)90101-1. 2486
[369] B. Elsener, O. Klinghoffer, T. Frolund, E. Rislund, Y. Schiegg, H. Böhni, Assessment of 2487 reinforcement corrosion by means of galvanostatic pulse technique, in: Repair Concr. Struct., 2488 Svolvær, Norway, 1997: pp. 391–400. 2489
[370] A. Poursaee, Potentiostatic transient technique, a simple approach to estimate the corrosion 2490 current density and Stern–Geary constant of reinforcing steel in concrete, Cem. Concr. Res. 40 2491 (2010) 1451–1458. https://doi.org/10.1016/j.cemconres.2010.04.006. 2492
[371] J.E. Ramón, J.M. Gandía-Romero, R. Bataller, M. Alcañiz, M. Valcuende, J. Soto, Potential step 2493 voltammetry: an approach for corrosion rate measurement of reinforcements in concrete, 2494 Cem. Concr. Compos. (2020) 103590. https://doi.org/10.1016/j.cemconcomp.2020.103590. 2495
[372] D.M. Bastidas, J.A. González, S. Feliu, A. Cobo, J.M. Miranda, A quantitative study of concrete-2496 embedded steel corrosion using potentiostatic pulses, Corrosion. 63 (2007) 1094–1100. 2497 https://doi.org/10.5006/1.3278327. 2498
[373] P. Rodrí, J.A. González, Use of the coulostatic method for measuring corrosion rates of 2499 embedded metal in concrete, Mag. Concr. Res. 46 (1994) 91–97. 2500 https://doi.org/10.1680/macr.1994.46.167.91. 2501
[374] G.K. Glass, An assessment of the coulostatic method applied to the corrosion of steel in 2502 concrete, Corros. Sci. 37 (1995) 597–605. https://doi.org/10.1016/0010-938X(94)00156-Z. 2503
[375] V. Feliu, J.A. Gonzàlez, S. Feliu, Modelling of the steel-concrete interface to obtain information 2504 on reinforcement bar corrosion, J. Appl. Electrochem. 35 (2005) 429–436. 2505 https://doi.org/10.1007/s10800-004-8348-0. 2506
[376] S. Feliu, J.A. González, M.L. Escudero, S. Feliu, M.C. Andrade, Possibilities of the guard ring for 2507 electrical signal confinement in the polarization measurements of reinforcements, Corrosion. 2508 46 (1990) 1015–1020. https://doi.org/10.5006/1.3585049. 2509
[377] A. Fahim, Corrosion of reinforcing steel in concrete: monitoring techniques and mitigation 2510

76
strategies, University of New Brunswick, 2018. 2511
[378] P. V. Nygaard, M.R. Geiker, Measuring the corrosion rate of steel in concrete - effect of 2512 measurement technique, polarisation time and current, Mater. Corros. 63 (2012) 200–214. 2513 https://doi.org/10.1002/maco.201005792. 2514
[379] S. Laurens, P. Hénocq, N. Rouleau, F. Deby, E. Samson, J. Marchand, B. Bissonnette, Steady-2515 state polarization response of chloride-induced macrocell corrosion systems in steel 2516 reinforced concrete — numerical and experimental investigations, Cem. Concr. Res. 79 (2016) 2517 272–290. https://doi.org/10.1016/j.cemconres.2015.09.021. 2518
[380] U. Angst, M. Büchler, A new perspective on measuring the corrosion rate of localized 2519 corrosion, Mater. Corros. 71 (2020) 808–823. https://doi.org/10.1002/maco.201911467. 2520
[381] D.G. John, P.C. Searson, J.L. Dawson, Use of AC impedance technique in studies on steel in 2521 concrete in immersed conditions, Br. Corros. J. 16 (1981) 102–106. 2522 https://doi.org/10.1179/000705981798275002. 2523
[382] M.E. Orazem, B. Tribollet, Electrochemical Impedance Spectroscopy, 2nd Edition, Wiley, 2017. 2524
[383] D. V. Ribeiro, J.C.C. Abrantes, Application of electrochemical impedance spectroscopy (EIS) to 2525 monitor the corrosion of reinforced concrete: A new approach, Constr. Build. Mater. 111 2526 (2016) 98–104. https://doi.org/10.1016/j.conbuildmat.2016.02.047. 2527
[384] G. Liu, Y. Zhang, M. Wu, R. Huang, Study of depassivation of carbon steel in simulated 2528 concrete pore solution using different equivalent circuits, Constr. Build. Mater. 157 (2017) 2529 357–362. https://doi.org/10.1016/j.conbuildmat.2017.09.104. 2530
[385] J.-P. Diard, B. Le Gorrec, C. Montella, Handbook of Electrochemical Impedance Spectroscopy - 2531 Electrical Circuits Containing CPEs, 2013. 2532
[386] M.E. Orazem, B. Tribollet, Electrical Circuits, in: Electrochem. Impedance Spectrosc., John 2533 Wiley & Sons, Inc., Hoboken, NJ, USA, 2017: pp. 75–88. 2534 https://doi.org/10.1002/9781119363682.ch4. 2535
[387] M.E. Orazem, B. Tribollet, Equivalent Circuit Analogs, in: Electrochem. Impedance Spectrosc., 2536 John Wiley & Sons, Inc., Hoboken, NJ, USA, 2017: pp. 191–206. 2537 https://doi.org/10.1002/9781119363682.ch9. 2538
[388] M.E. Orazem, B. Tribollet, Constant-Phase Elements, in: Electrochem. Impedance Spectrosc., 2539 John Wiley & Sons, Inc., Hoboken, NJ, USA, 2017: pp. 395–419. 2540 https://doi.org/10.1002/9781119363682.ch14. 2541
[389] M.R. Shoar Abouzari, F. Berkemeier, G. Schmitz, D. Wilmer, On the physical interpretation of 2542 constant phase elements, Solid State Ionics. 180 (2009) 922–927. 2543 https://doi.org/10.1016/j.ssi.2009.04.002. 2544
[390] M. Keddam, H. Takenouti, X.R. Nóvoa, C. Andrade, C. Alonso, Impedance measurements on 2545 cement paste, Cem. Concr. Res. 27 (1997) 1191–1201. https://doi.org/10.1016/S0008-2546 8846(97)00117-8. 2547
[391] Z. Xu, P. Gu, P. Xie, J.J. Beaudoin, Application of A.C. impedance techniques in studies of 2548 porous cementitious materials: (II): Relationship between ACIS behavior and the porous 2549 microstructure, Cem. Concr. Res. 23 (1993) 853–862. https://doi.org/10.1016/0008-2550 8846(93)90039-C. 2551
[392] X. Hu, C. Shi, X. Liu, J. Zhang, G. de Schutter, A review on microstructural characterization of 2552 cement-based materials by AC impedance spectroscopy, Cem. Concr. Compos. 100 (2019) 1–2553

77
14. https://doi.org/10.1016/j.cemconcomp.2019.03.018. 2554
[393] B. Díaz, X.R. Nóvoa, M.C. Pérez, Study of the chloride diffusion in mortar: A new method of 2555 determining diffusion coefficients based on impedance measurements, Cem. Concr. Compos. 2556 28 (2006) 237–245. https://doi.org/10.1016/j.cemconsomp.2006.01.009. 2557
[394] I. Sánchez, M.P. López, J.M. Ortega, M.Á. Climent, Impedance spectroscopy: An efficient tool 2558 to determine the non-steady-state chloride diffusion coefficient in building materials, Mater. 2559 Corros. 62 (2011) 139–145. https://doi.org/10.1002/maco.201005775. 2560
[395] H. Mercado-Mendoza, S. Lorente, X. Bourbon, The diffusion coefficient of ionic species 2561 through unsaturated materials, Transp. Porous Media. 96 (2013) 469–481. 2562 https://doi.org/10.1007/s11242-012-0100-3. 2563
[396] S. Chakri, I. Frateur, M.E. Orazem, E.M.M. Sutter, T.T.M. Tran, B. Tribollet, V. Vivier, Improved 2564 EIS analysis of the electrochemical behaviour of carbon steel in alkaline solution, Electrochim. 2565 Acta. 246 (2017) 924–930. https://doi.org/10.1016/j.electacta.2017.06.096. 2566
[397] R. Vedalakshmi, S. Manoharan, H.-W. Song, N. Palaniswamy, Application of harmonic analysis 2567 in measuring the corrosion rate of rebar in concrete, Corros. Sci. 51 (2009) 2777–2789. 2568 https://doi.org/10.1016/j.corsci.2009.07.014. 2569
[398] U.M. Angst, B. Elsener, Measuring corrosion rates: A novel AC method based on processing 2570 and analysing signals recorded in the time domain, Corros. Sci. 89 (2014) 307–317. 2571 https://doi.org/10.1016/j.corsci.2014.09.013. 2572
[399] H. Wojtas, Determination of corrosion rate of reinforcement with a modulated guard ring 2573 electrode; analysis of errors due to lateral current distribution, Corros. Sci. 46 (2004) 1621–2574 1632. https://doi.org/10.1016/j.corsci.2003.10.007. 2575
[400] S. Feliu, J.A. González, J.M. Miranda, V. Feliu, Possibilities and problems of in situ techniques 2576 for measuring steel corrosion rates in large reinforced concrete structures, Corros. Sci. 47 2577 (2005) 217–238. https://doi.org/10.1016/j.corsci.2004.04.011. 2578
[401] A. Poursaee, C.M. Hansson, Galvanostatic pulse technique with the current confinement 2579 guard ring: The laboratory and finite element analysis, Corros. Sci. 50 (2008) 2739–2746. 2580 https://doi.org/10.1016/j.corsci.2008.07.017. 2581
[402] P. V. Nygaard, M.R. Geiker, B. Elsener, Corrosion rate of steel in concrete: evaluation of 2582 confinement techniques for on-site corrosion rate measurements, Mater. Struct. 42 (2009) 2583 1059–1076. https://doi.org/10.1617/s11527-008-9443-1. 2584
[403] A. Clément, S. Laurens, G. Arliguie, F. Deby, Numerical study of the linear polarisation 2585 resistance technique applied to reinforced concrete for corrosion assessment, Eur. J. Environ. 2586 Civ. Eng. 16 (2012) 491–504. https://doi.org/10.1080/19648189.2012.668012. 2587
[404] O. Gepraegs, C. Hansson, A comparative evaluation of three commercial unstruments for field 2588 measurements of reinforcing steel corrosion rates, J. ASTM Int. (2005). 2589 https://doi.org/10.1520/JAI11789. 2590
[405] J. Marchand, S. Laurens, Y. Protière, E. Samson, A numerical study of polarization tests applied 2591 to corrosion in reinforced concrete, Spec. Publ. 312 (2016) 1–12. 2592
[406] J. Zhang, P.J.M. Monteiro, H.F. Morrison, Noninvasive surface measurement of corrosion 2593 impedance of reinforcing bar in concrete—Part 1: Experimental results, ACI Mater. J. 98 2594 (2001) 116–125. https://doi.org/10.14359/10195. 2595
[407] S.S. Hubbard, J. Zhang, P.J.M. Monteiro, J.E. Peterson, Y. Rubin, Experimental detection of 2596

78
reinforcing bar corrosion using nondestructive geophysical techniques, ACI Mater. J. 100 2597 (2003) 501–510. https://doi.org/10.14359/12957. 2598
[408] P.J.M. Monteiro, F. Morrison, W. Frangos, Non-destructive measurement of corrosion state of 2599 reinforcing steel in concrete, ACI Mater. J. 95 (1998) 704–709. https://doi.org/10.14359/414. 2600
[409] J. Zhang, P.J.M. Monteiro, H.F. Morrison, Noninvasive surface measurement of corrosion 2601 impedance of reinforcing bar in concrete—Part 2: Forward modeling, ACI Mater. J. 99 (2002) 2602 242–249. https://doi.org/10.14359/11969. 2603
[410] J. Zhang, P.J.M. Monteiro, H.F. Morrison, M. Mancio, Noninvasive surface measurement of 2604 corrosion impedance of reinforcing bar in concrete—Part 3: Effect of geometry and material 2605 properties, ACI Mater. J. 101 (2004) 273–280. 2606
[411] A. Fahim, P. Ghods, R. Alizaded, M. Salehi, S. Decarufel, CEPRA: A new test method for rebar 2607 corrosion rate measurement, Adv. Electrochem. Tech. Corros. Monit. Lab. Corros. Meas. 2608 STP1609 (2019) 59–80. https://doi.org/10.1520/STP160920170227. 2609
[412] Y.-C. Lim, T. Noguchi, S.-W. Shin, Formulation of a nondestructive technique for evaluating 2610 steel corrosion in concrete structures, ISIJ Int. 49 (2009) 275–283. 2611 https://doi.org/10.2355/isijinternational.49.275. 2612
[413] Y.-C. Lim, T. Noguchi, S. Shin, Corrosion evaluation by estimating the surface resistivity of 2613 reinforcing bar, J. Adv. Concr. Technol. 8 (2010) 113–119. https://doi.org/10.3151/jact.8.113. 2614
[414] C. Andrade, I. Martínez, M. Castellote, Feasibility of determining corrosion rates by means of 2615 stray current-induced polarisation, J. Appl. Electrochem. 38 (2008) 1467–1476. 2616 https://doi.org/10.1007/s10800-008-9591-6. 2617
[415] C. Andrade, I. Martínez, Metal corrosion rate determination of different solutions and 2618 reinforced concrete specimens by means of a noncontacting corrosion method, Corrosion. 66 2619 (2010) 056001-056001–10. https://doi.org/10.5006/1.3430465. 2620
[416] C. Andrade, J. Sanchez, I. Martinez, N. Rebolledo, Analogue circuit of the inductive 2621 polarization resistance, Electrochim. Acta. 56 (2011) 1874–1880. 2622 https://doi.org/10.1016/j.electacta.2010.09.057. 2623
[417] M. Keddam, X.R. Nóvoa, V. Vivier, The concept of floating electrode for contact-less 2624 electrochemical measurements: Application to reinforcing steel-bar corrosion in concrete, 2625 Corros. Sci. 51 (2009) 1795–1801. https://doi.org/10.1016/j.corsci.2009.05.006. 2626
[418] M. Keddam, X.R. Nóvoa, B. Puga, V. Vivier, Impedance based method for non-contact 2627 determination of the corrosion rate in buried metallic structures, Eur. J. Environ. Civ. Eng. 15 2628 (2011) 1097–1103. https://doi.org/10.1080/19648189.2011.9695296. 2629
[419] J. Yu, A. Sasamoto, M. Iwata, Wenner method of impedance measurement for health 2630 evaluation of reinforced concrete structures, Constr. Build. Mater. 197 (2019) 576–586. 2631 https://doi.org/10.1016/j.conbuildmat.2018.11.121. 2632
[420] C.L. Alexander, M.E. Orazem, Indirect electrochemical impedance spectroscopy for corrosion 2633 detection in external post-tensioned tendons: 1. Proof of concept, Corros. Sci. 164 (2020) 2634 108331. https://doi.org/10.1016/j.corsci.2019.108331. 2635
[421] C.L. Alexander, M.E. Orazem, Indirect impedance for corrosion detection of external post-2636 tensioned tendons: 2. Multiple steel strands, Corros. Sci. 164 (2020) 108330. 2637 https://doi.org/10.1016/j.corsci.2019.108330. 2638
[422] F. Abdulsamad, N. Florsch, Assessing the high frequency behavior of non-polarizable 2639

79
electrodes for spectral induced polarization measurements, J. Appl. Geophys. 135 (2016) 449–2640 455. https://doi.org/10.1016/j.jappgeo.2016.01.001. 2641
[423] C.L. Alexander, Impedance spectroscopy: The influence of surface heterogeneity and 2642 application to corrosion monitoring of bridge tendons, University of Florida, 2017. 2643
[424] R. Rodrigues, J. Gance, S. Gaboreau, I. Ignatiadis, S. Betelu, Electrochemical Measurement 2644 System and Method for Monitoring a Concrete Structure, EP19188380, 2019. 2645
[425] C. Andrade, J.A. González, Quantitative measurements of corrosion rate of reinforcing steels 2646 embedded in concrete using polarization resistance measurements, Mater. Corros. 29 (1978) 2647 515–519. https://doi.org/10.1002/maco.19780290804. 2648
[426] G. Song, Theoretical analysis of the measurement of polarisation resistance in reinforced 2649 concrete, Cem. Concr. Compos. 22 (2000) 407–415. https://doi.org/10.1016/S0958-2650 9465(00)00040-8. 2651
[427] C. Alonso, C. Andrade, X.R. Nóvoa, M. Izquierdo, M.C. Pérez, Effect of protective oxide scales 2652 in the macrogalvanic behaviour of concrete reinforcements, Corros. Sci. 40 (1998) 1379–1389. 2653 https://doi.org/10.1016/S0010-938X(98)00040-7. 2654
[428] D.A. Jones, N.D. Greene, Electrochemical measurement of low corrosion rates, Corrosion. 22 2655 (1966) 198–205. https://doi.org/10.5006/0010-9312-22.7.198. 2656
[429] D.A. Jones, Principles and Prevention of Corrosion, 2nd Edition, Prentice Hall, Upper Saddle 2657 River, N.J., 1996. 2658
[430] E. Gileadi, E. Kirowa-Eisner, Some observations concerning the Tafel equation and its 2659 relevance to charge transfer in corrosion, Corros. Sci. 47 (2005) 3068–3085. 2660 https://doi.org/10.1016/j.corsci.2005.05.044. 2661
[431] J. Ge, O.B. Isgor, Effects of Tafel slope, exchange current density and electrode potential on 2662 the corrosion of steel in concrete, Mater. Corros. 58 (2007) 573–582. 2663 https://doi.org/10.1002/maco.200604043. 2664
[432] J.A. González, J.M. Miranda, N. Birbilis, S. Feliu, Electrochemical techniques for studying 2665 corrosion of reinforcing steel: Limitations and advantages, Corrosion. 61 (2005) 37–50. 2666 https://doi.org/10.5006/1.3278158. 2667
[433] B. Yu, L. Yang, M. Wu, B. Li, Practical model for predicting corrosion rate of steel 2668 reinforcement in concrete structures, Constr. Build. Mater. 54 (2014) 385–401. 2669 https://doi.org/10.1016/j.conbuildmat.2013.12.046. 2670
[434] J.A. González, A. Molina, M.L. Escudero, C. Andrade, Errors in the electrochemical evaluation 2671 of very small corrosion rates—I. Polarization resistance method applied to corrosion of steel 2672 in concrete, Corros. Sci. 25 (1985) 917–930. https://doi.org/10.1016/0010-938X(85)90021-6. 2673
[435] I. Martínez, C. Andrade, Polarization resistance measurements of bars embedded in concrete 2674 with different chloride concentrations: EIS and DC comparison, Mater. Corros. 62 (2011) 932–2675 942. https://doi.org/10.1002/maco.200905596. 2676
[436] J.A. González, A. Molina, M.L. Escudero, C. Andrade, Errors in the electrochemical evaluation 2677 of very small corrosion rates—II. Other electrochemical techniques applied to corrosion of 2678 steel in concrete, Corros. Sci. 25 (1985) 519–530. https://doi.org/10.1016/0010-2679 938X(85)90030-7. 2680
[437] M. Kouřil, P. Novák, M. Bojko, Limitations of the linear polarization method to determine 2681 stainless steel corrosion rate in concrete environment, Cem. Concr. Compos. 28 (2006) 220–2682

80
225. https://doi.org/10.1016/j.cemconcomp.2006.01.007. 2683
[438] U. Angst, M. Büchler, On the applicability of the Stern-Geary relationship to determine 2684 instantaneous corrosion rates in macro-cell corrosion, Mater. Corros. 66 (2015) 1017–1028. 2685 https://doi.org/10.1002/maco.201407997. 2686
[439] B. Elsener, Corrosion rate of steel in concrete—Measurements beyond the Tafel law, Corros. 2687 Sci. 47 (2005) 3019–3033. https://doi.org/10.1016/j.corsci.2005.06.021. 2688
[440] C. Andrade, C. Alonso, J. Sarr a, Corrosion rate evolution in concrete structures exposed to the 2689 atmosphere, Cem. Concr. Compos. 24 (2002) 55–64. https://doi.org/10.1016/S0958-2690 9465(01)00026-9. 2691
[441] C. Andrade, Propagation of reinforcement corrosion: principles, testing and modelling, Mater. 2692 Struct. 52 (2019) 2. https://doi.org/10.1617/s11527-018-1301-1. 2693
[442] C. Andrade, J. Sarr a, C. Alonso, Relative humidity in the interior of concrete exposed to 2694 natural and artificial weathering, Cem. Concr. Res. 29 (1999) 1249–1259. 2695 https://doi.org/10.1016/S0008-8846(99)00123-4. 2696
[443] J. Jiang, Y. Yuan, Development and prediction strategy of steel corrosion rate in concrete 2697 under natural climate, Constr. Build. Mater. 44 (2013) 287–292. 2698 https://doi.org/10.1016/j.conbuildmat.2013.03.033. 2699
[444] T. Jaśniok, M. Jaśniok, Influence of rapid changes of moisture content in concrete and 2700 temperature on corrosion rate of reinforcing steel, Procedia Eng. 108 (2015) 316–323. 2701 https://doi.org/10.1016/j.proeng.2015.06.153. 2702
[445] C. Andrade, A. Castillo, Evolution of reinforcement corrosion due to climatic variations, Mater. 2703 Corros. 54 (2003) 379–386. https://doi.org/10.1002/maco.200390087. 2704
[446] C. Boschmann Käthler, U.M. Angst, G. Ebell, B. Elsener, Chloride-induced reinforcement 2705 corrosion in cracked concrete: the influence of time of wetness on corrosion propagation, 2706 Corros. Eng. Sci. Technol. (2020) 1–10. https://doi.org/10.1080/1478422X.2020.1789371. 2707
[447] V. Bouteiller, J.-F. Cherrier, V. L’Hostis, N. Rebolledo, C. Andrade, E. Marie-Victoire, Influence 2708 of humidity and temperature on the corrosion of reinforced concrete prisms, Eur. J. Environ. 2709 Civ. Eng. 16 (2012) 471–480. https://doi.org/10.1080/19648189.2012.668004. 2710
[448] B. Yu, J. Liu, B. Li, Improved numerical model for steel reinforcement corrosion in concrete 2711 considering influences of temperature and relative humidity, Constr. Build. Mater. 142 (2017) 2712 175–186. https://doi.org/10.1016/j.conbuildmat.2017.03.045. 2713
[449] A. Chauhan, U.K. Sharma, Influence of temperature and relative humidity variations on non-2714 uniform corrosion of reinforced concrete, Structures. 19 (2019) 296–308. 2715 https://doi.org/10.1016/j.istruc.2019.01.016. 2716
[450] Y.A. Villagrán Zaccardi, A. Bértora, A.A. Di Maio, Temperature and humidity influences on the 2717 on-site active marine corrosion of reinforced concrete elements, Mater. Struct. 46 (2013) 2718 1527–1535. https://doi.org/10.1617/s11527-012-9994-z. 2719
[451] V. Bouteiller, E. Marie-Victoire, C. Cremona, Mathematical relation of steel thickness loss with 2720 time related to reinforced concrete contaminated by chlorides, Constr. Build. Mater. 124 2721 (2016) 764–775. https://doi.org/10.1016/j.conbuildmat.2016.07.078. 2722
[452] A. Michel, P.V. Nygaard, M.R. Geiker, Experimental investigation on the short-term impact of 2723 temperature and moisture on reinforcement corrosion, Corros. Sci. 72 (2013) 26–34. 2724 https://doi.org/10.1016/j.corsci.2013.02.006. 2725

81
[453] U.M. Angst, Durable concrete structures: Cracks & corrosion and corrosion & cracks, in: G. 2726 Pijaudier-Cabot, P. Grassl, C. La Borderi (Eds.), 10th Int. Conf. Fract. Mech. Concr. Concr. 2727 Struct., Bayonne, France, 2019: pp. 1–10. https://doi.org/10.21012/FC10.233307. 2728
[454] M. Jaśniok, T. Jaśniok, Evaluation of maximum and minimum corrosion rate of steel rebars in 2729 concrete structures, based on laboratory measurements on drilled cores, Procedia Eng. 193 2730 (2017) 486–493. https://doi.org/10.1016/j.proeng.2017.06.241. 2731
[455] D. Breysse, G. Klysz, X. Dérobert, C. Sirieix, J.F. Lataste, How to combine several non-2732 destructive techniques for a better assessment of concrete structures, Cem. Concr. Res. 38 2733 (2008) 783–793. https://doi.org/10.1016/j.cemconres.2008.01.016. 2734
[456] G. Loreto, M. Di Benedetti, A. De Luca, A. Nanni, Assessment of reinforced concrete structures 2735 in marine environment: a case study, Corros. Rev. 37 (2019) 57–69. 2736 https://doi.org/10.1515/corrrev-2018-0046. 2737
[457] L. Sadowski, Methodology for assessing the probability of corrosion in concrete structures on 2738 the basis of half-cell potential and concrete resistivity measurements, Sci. World J. 2013 2739 (2013) 714501. https://doi.org/10.1155/2013/714501. 2740
[458] V. Garnier, B. Piwakowski, O. Abraham, G. Villain, C. Payan, J.F. Chaix, Acoustic techniques for 2741 concrete evaluation: Improvements, comparisons and consistency, Constr. Build. Mater. 43 2742 (2013) 598–613. https://doi.org/10.1016/j.conbuildmat.2013.01.035. 2743
[459] P. Ziehl, M. ElBatanouny, Acoustic emission monitoring for corrosion damage detection and 2744 classification, in: Corros. Steel Concr. Struct., Woodhead Publishing, 2016: pp. 193–209. 2745 https://doi.org/10.1016/B978-1-78242-381-2.00010-9. 2746
[460] C. Van Steen, L. Pahlavan, M. Wevers, E. Verstrynge, Localisation and characterisation of 2747 corrosion damage in reinforced concrete by means of acoustic emission and X-ray computed 2748 tomography, Constr. Build. Mater. 197 (2019) 21–29. 2749 https://doi.org/10.1016/j.conbuildmat.2018.11.159. 2750
[461] M.R. Clark, D.M. McCann, M.C. Forde, Application of infrared thermography to the non-2751 destructive testing of concrete and masonry bridges, NDT E Int. 36 (2003) 265–275. 2752 https://doi.org/10.1016/S0963-8695(02)00060-9. 2753
[462] X. Dérobert, Z.M. Sbartaï, J. Dumoulin, Electromagnetic Methods, in: Non-Destructive Test. 2754 Eval. Civ. Eng. Struct., Elsevier, 2018: pp. 87–137. https://doi.org/10.1016/B978-1-78548-229-2755 8.50003-0. 2756
[463] W. Wai-Lok Lai, X. Dérobert, P. Annan, A review of ground penetrating radar application in 2757 civil engineering: A 30-year journey from locating and testing to imaging and diagnosis, NDT E 2758 Int. 96 (2018) 58–78. https://doi.org/10.1016/j.ndteint.2017.04.002. 2759
[464] F. Tosti, C. Ferrante, Using ground penetrating radar methods to investigate reinforced 2760 concrete structures, Surv. Geophys. (2019) 1–46. https://doi.org/10.1007/s10712-019-09565-2761 5. 2762
[465] X. Dérobert, J. Iaquinta, G. Klysz, J.-P. Balayssac, Use of capacitive and GPR techniques for the 2763 non-destructive evaluation of cover concrete, NDT E Int. 41 (2008) 44–52. 2764 https://doi.org/10.1016/j.ndteint.2007.06.004. 2765
[466] S. Hong, H. Wiggenhauser, R. Helmerich, B. Dong, P. Dong, F. Xing, Long-term monitoring of 2766 reinforcement corrosion in concrete using ground penetrating radar, Corros. Sci. 114 (2017) 2767 123–132. https://doi.org/10.1016/j.corsci.2016.11.003. 2768
82
[467] M. Fares, Y. Fargier, G. Villain, X. Derobert, S. Palma Lopes, Determining the permittivity 2769 profile inside reinforced concrete using capacitive probes, NDT E Int. 79 (2016) 150–161. 2770 https://doi.org/10.1016/j.ndteint.2016.01.002. 2771
[468] A. Voss, P. Hosseini, M. Pour-Ghaz, M. Vauhkonen, A. Seppänen, Three-dimensional electrical 2772 capacitance tomography – A tool for characterizing moisture transport properties of cement-2773 based materials, Mater. Des. 181 (2019) 107967. 2774 https://doi.org/10.1016/j.matdes.2019.107967. 2775
[469] R. du Plooy, G. Villain, S. Palma Lopes, A. Ihamouten, X. Dérobert, B. Thauvin, Electromagnetic 2776 non-destructive evaluation techniques for the monitoring of water and chloride ingress into 2777 concrete: a comparative study, Mater. Struct. 48 (2015) 369–386. 2778 https://doi.org/10.1617/s11527-013-0189-z. 2779
[470] X. Dérobert, J.F. Lataste, J.-P. Balayssac, S. Laurens, Evaluation of chloride contamination in 2780 concrete using electromagnetic non-destructive testing methods, NDT E Int. 89 (2017) 19–29. 2781 https://doi.org/10.1016/j.ndteint.2017.03.006. 2782
[471] Y. Seguí Femenias, U. Angst, F. Moro, B. Elsener, Development of a novel methodology to 2783 assess the corrosion threshold in concrete based on simultaneous monitoring of pH and free 2784 chloride concentration, Sensors. 18 (2018) 3101. https://doi.org/10.3390/s18093101. 2785
[472] Z. Zhang, J. Hu, Y. Ma, Y. Wang, H. Huang, Z. Zhang, J. Wei, S. Yin, Q. Yu, A state-of-the-art 2786 review on Ag/AgCl ion-selective electrode used for non-destructive chloride detection in 2787 concrete, Compos. Part B Eng. (2020) 108289. 2788 https://doi.org/10.1016/j.compositesb.2020.108289. 2789
[473] O. Anterrieu, B. Giroux, E. Gloaguen, C. Carde, Non-destructive data assimilation as a tool to 2790 diagnose corrosion rate in reinforced concrete structures, J. Build. Eng. 23 (2019) 193–206. 2791 https://doi.org/10.1016/j.jobe.2019.01.033. 2792
2793
Related Documents