SHEAR CAPACITY ASSESSMENT OF CORROSION-DAMAGED REINFORCED CONCRETE BEAMS Final Report SPR 326

Welcome message from author
This document is posted to help you gain knowledge. Please leave a comment to let me know what you think about it! Share it to your friends and learn new things together.
Transcript
SHEAR CAPACITY ASSESSMENT OF CORROSION-DAMAGED REINFORCED CONCRETE
BEAMS
Final Report
SPR 326

SHEAR CAPACITY ASSESSMENT OF CORROSION-DAMAGED REINFORCED CONCRETE BEAMS
by
Christopher Higgins, William C. Farrow III, Tanarat Potisuk, Thomas H. Miller, Solomon C. Yim
Department of Civil Engineering, Oregon State University, Corvallis OR 97331
and
Gordon R. Holcomb, Stephen D. Cramer, Bernard S. Covino, Jr., Sophie J. Bullard, Margaret Ziomek-Moroz, and Steven A. Matthes
U. S. Department of Energy, Albany Research Center, Albany OR 97321
for
Oregon Department of Transportation Research Unit
200 Hawthorne Ave. SE, Suite B-240 Salem OR 97301-5192
and
Federal Highway Administration
400 Seventh Street S.W. Washington, DC 20590
December 2003

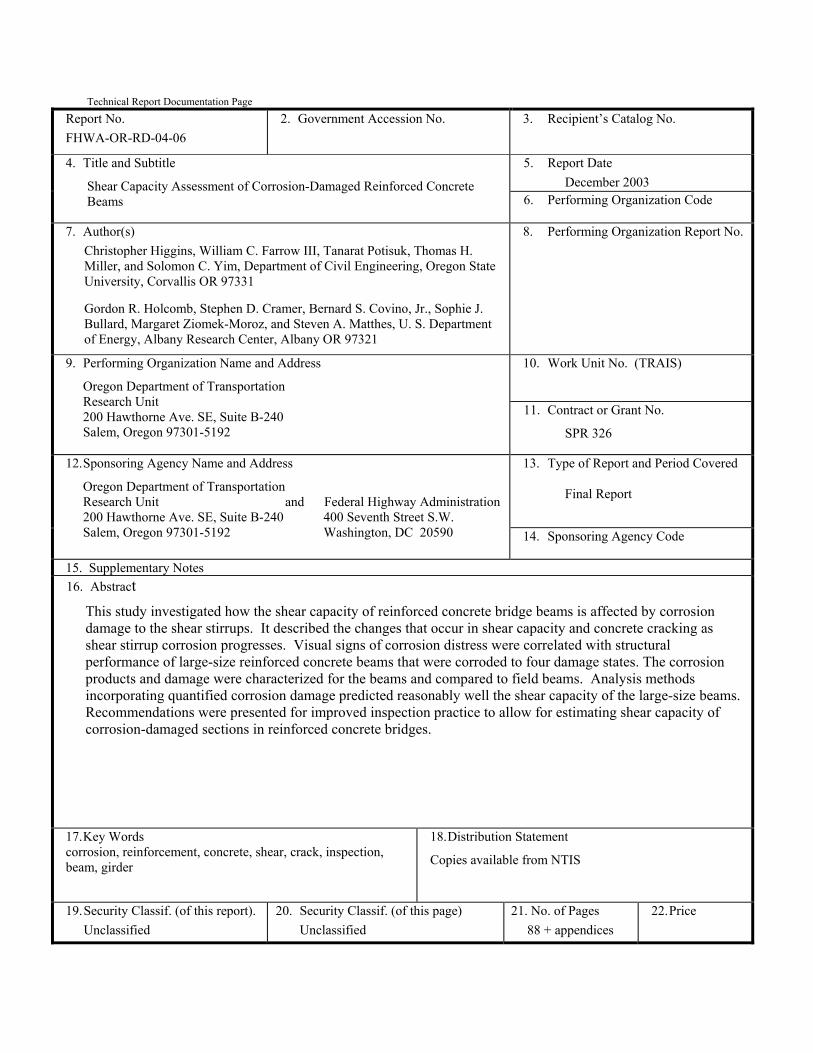
Technical Report Documentation Page
Report No. FHWA-OR-RD-04-06
2. Government Accession No.
3. Recipient’s Catalog No.
5. Report Date December 2003
4. Title and Subtitle
Shear Capacity Assessment of Corrosion-Damaged Reinforced Concrete Beams 6. Performing Organization Code
7. Author(s)
Christopher Higgins, William C. Farrow III, Tanarat Potisuk, Thomas H. Miller, and Solomon C. Yim, Department of Civil Engineering, Oregon State University, Corvallis OR 97331
Gordon R. Holcomb, Stephen D. Cramer, Bernard S. Covino, Jr., Sophie J. Bullard, Margaret Ziomek-Moroz, and Steven A. Matthes, U. S. Department of Energy, Albany Research Center, Albany OR 97321
8. Performing Organization Report No.
10. Work Unit No. (TRAIS)
9. Performing Organization Name and Address
Oregon Department of Transportation Research Unit 200 Hawthorne Ave. SE, Suite B-240 Salem, Oregon 97301-5192
11. Contract or Grant No.
SPR 326
13. Type of Report and Period Covered Final Report
12. Sponsoring Agency Name and Address
Oregon Department of Transportation Research Unit and Federal Highway Administration 200 Hawthorne Ave. SE, Suite B-240 400 Seventh Street S.W. Salem, Oregon 97301-5192 Washington, DC 20590 14. Sponsoring Agency Code
15. Supplementary Notes 16. Abstract
This study investigated how the shear capacity of reinforced concrete bridge beams is affected by corrosion damage to the shear stirrups. It described the changes that occur in shear capacity and concrete cracking as shear stirrup corrosion progresses. Visual signs of corrosion distress were correlated with structural performance of large-size reinforced concrete beams that were corroded to four damage states. The corrosion products and damage were characterized for the beams and compared to field beams. Analysis methods incorporating quantified corrosion damage predicted reasonably well the shear capacity of the large-size beams. Recommendations were presented for improved inspection practice to allow for estimating shear capacity of corrosion-damaged sections in reinforced concrete bridges.
17. Key Words corrosion, reinforcement, concrete, shear, crack, inspection, beam, girder
18. Distribution Statement
Copies available from NTIS
19. Security Classif. (of this report). Unclassified
20. Security Classif. (of this page) Unclassified
21. No. of Pages 88 + appendices
22. Price

Technical Report Form DOT F 1700.7 (8-72) Reproduction of completed page authorized Α Printed on recycled paper

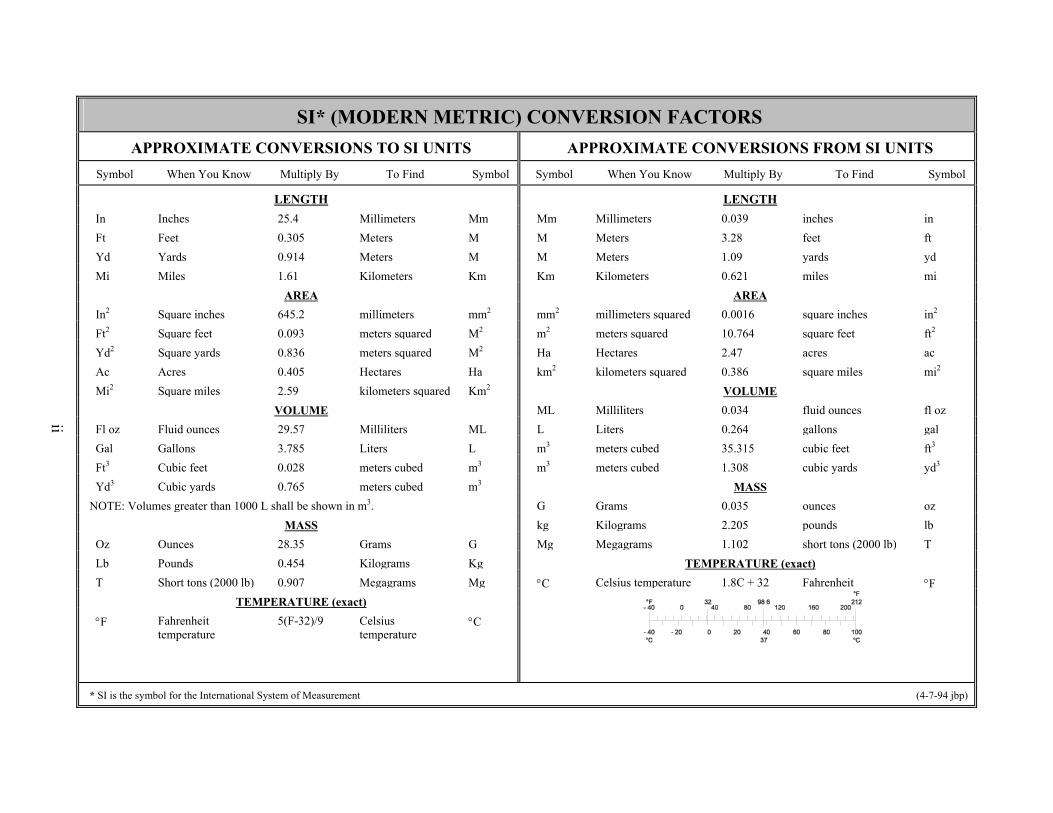
SI* (MODERN METRIC) CONVERSION FACTORS APPROXIMATE CONVERSIONS TO SI UNITS APPROXIMATE CONVERSIONS FROM SI UNITS
Symbol When You Know Multiply By To Find Symbol Symbol When You Know Multiply By To Find Symbol
LENGTH LENGTH
In Inches 25.4 Millimeters Mm Mm Millimeters 0.039 inches in Ft Feet 0.305 Meters M M Meters 3.28 feet ft Yd Yards 0.914 Meters M M Meters 1.09 yards yd Mi Miles 1.61 Kilometers Km Km Kilometers 0.621 miles mi
AREA AREA In2 Square inches 645.2 millimeters mm2 mm2 millimeters squared 0.0016 square inches in2
Ft2 Square feet 0.093 meters squared M2 m2 meters squared 10.764 square feet ft2
Yd2 Square yards 0.836 meters squared M2 Ha Hectares 2.47 acres ac Ac Acres 0.405 Hectares Ha km2 kilometers squared 0.386 square miles mi2
Mi2 Square miles 2.59 kilometers squared Km2 VOLUMEVOLUME ML Milliliters 0.034 fluid ounces fl oz
Fl oz Fluid ounces 29.57 Milliliters ML L Liters 0.264 gallons gal Gal Gallons 3.785 Liters L m3 meters cubed 35.315 cubic feet ft3
Ft3 Cubic feet 0.028 meters cubed m3 m3 meters cubed 1.308 cubic yards yd3
Yd3 Cubic yards 0.765 meters cubed m3 MASSNOTE: Volumes greater than 1000 L shall be shown in m3. G Grams 0.035 ounces oz
MASS kg Kilograms 2.205 pounds lb Oz Ounces 28.35 Grams G Mg Megagrams 1.102 short tons (2000 lb) T Lb Pounds 0.454 Kilograms Kg TEMPERATURE (exact) T Short tons (2000 lb) 0.907 Megagrams Mg °C Celsius temperature 1.8C + 32 Fahrenheit °F
TEMPERATURE (exact)
°F Fahrenheit temperature
5(F-32)/9 Celsius temperature
°C
* SI is the symbol for the International System of Measurement (4-7-94 jbp)
ii
iii
ACKNOWLEDGEMENTS
The authors wish to thank Jeff Swanstrom, Oregon DOT Region 2 Bridge Inspector, for his assistance in locating and interpreting historical coastal bridge inspection records and in providing observations about the current status of shear cracking on Oregon's coastal bridges.
The authors also wish to thank Steve Soltesz and Alan Kirk, Oregon Department of Transportation Research Unit, for their assistance in the preparation of this report.
DISCLAIMER
This document is disseminated under the sponsorship of the Oregon Department of Transportation and the United States Department of Transportation in the interest of information exchange. The State of Oregon and the United States Government assume no liability of its contents or use thereof. The contents of this report reflect the view of the authors who are solely responsible for the facts and accuracy of the material presented. The contents do not necessarily reflect the official views of the Oregon Department of Transportation or the United States Department of Transportation. The State of Oregon and the United States Government do not endorse products of manufacturers. Trademarks or manufacturers’ names appear herein only because they are considered essential to the object of this document. This report does not constitute a standard, specification, or regulation.

iv
v
SHEAR CAPACITY ASSESSMENT OF CORROSION-DAMAGED REINFORCED CONCRETE BEAMS
TABLE OF CONTENTS
1.0 INTRODUCTION AND BACKGROUND..........................................................................1
2.0 EXPERIMENTAL PROGRAM.........................................................................................17 2.1 SPECIMEN DESIGN ........................................................................................................17 2.2 ACCELERATED CORROSION OF STIRRUPS.............................................................20
2.2.1 Current levels.............................................................................................................20 2.2.2 Test beams .................................................................................................................22
2.3 VISUAL DAMAGE ASSESSMENT OF BEAMS...........................................................22
3.0 STRUCTURAL TESTING .................................................................................................25 3.1 STRUCTURAL PERFORMANCE...................................................................................27
3.1.1 Rectangular Beams....................................................................................................27 3.1.2 T-Beams ....................................................................................................................35 3.1.3 Inverted T-Beams ......................................................................................................38
4.0 POST-TEST EXAMINATION OF STIRRUPS AND CORROSION PRODUCTS .....43 4.1 CORROSION DAMAGE TO STIRRUPS........................................................................43 4.2 CORROSION PRODUCTS...............................................................................................46 4.3 ACCELERATED CORROSION.......................................................................................53 4.4 INITIAL CRACKING.......................................................................................................54 4.5 SECTION-LOSS CHARACTERIZATION ......................................................................55
5.0 ANALYSIS OF CORROSION DAMAGED BEAMS FOR SHEAR..............................59 5.1 ACI METHOD...................................................................................................................59 5.2 IMPLICATIONS FOR FIELD INSPECTION..................................................................69
6.0 CONCLUSIONS ..................................................................................................................71
7.0 RECOMMENDATIONS.....................................................................................................73
8.0 BIBLIOGRAPHY ................................................................................................................75
vi
List of Tables
Table 1.1: Oregon DOT Region 2 and 3 CRC bridges with diagonal cracking .....................................................9 Table 1.2: Oregon coastal bridges included in review of maintenance and inspection records for evidence
of significant corrosion impacts ..............................................................................................................10 Table 2.1: Concrete mix design ................................................................................................................................19 Table 2.2: Summary of chloride contents for specimens........................................................................................19 Table 2.3: Specimen designation ..............................................................................................................................22 Table 2.4: Condition assessment using Oregon DOT Coding Guidelines.............................................................23 Table 3.1: Experimental beam response summary.................................................................................................26 Table 3.2: Summary of crack widths .......................................................................................................................27 Table 4.1: Iron and iron oxide properties (Kubaschewski and Hopkins 1962)......................................................46 Table 4.2: Results of X-ray diffraction analysis of rusts ........................................................................................47 Table 4.3: Results of wet chemical analysis of rusts ...............................................................................................49 Table 4.4: Radius loss to first cracking....................................................................................................................54 Table 4.5: Average and local maximum section-losses for stirrups crossing the failure crackError! Bookmark not defined. Table 4.6: Percent section-loss due to corrosion .....................................................................................................56 Table 5.1: Shear strength prediction using Equation 5-2 for undamaged beams................................................64 Table 5.2: Shear strength prediction by Equation 5-11 (shear coefficient of 5) for undamaged beams ............65 Table 5.3: Summary of ACI calculations with measured average section-loss in stirrups and concrete
width back-calculated from Equations 5-1, 5-3, and 5-11 ....................................................................66 Table 5.4: Summary of predicted shear strength with measured average stirrup area and theoretical
concrete width (Equation 5-10b).............................................................................................................68 Table 5.5: Summary of predicted shear strength with measured minimum stirrup area and theoretical
concrete width (Equation 5-10b).............................................................................................................68
List of Figures
Figure 1.1: A CRC bridge cross-section showing areas at risk from deposition and retention of chloride ions on structural elements........................................................................................................................................2
Figure 1.2: Four stages in the corrosion deterioration of CRC bridge elements. Additional stages are possible when the deterioration is more severe. .........................................................................................................3
Figure 1.3: Hypothetical performance of a CRC structure through the four stages of deterioration shown in Fig. 1.2.................................................................................................................................................................4
Figure 1.4: Chloride-induced corrosion damage to RCDG beam A2 removed from the Brush Creek Bridge in 1998. Delaminated concrete has been removed to exposed the corroded steel. Shear stirrup “A” was severed in service and a section removed for analysis. Shear stirrup “B” was also severed in service.......5
Figure 1.5: Broken shear stirrups along base of reinforced concrete deck girders on the Spencer Creek Bridge: (a) south span; (b) north span. There were no broken shear stirrups in the central span. ............................6
Figure 1.6: Oregon DOT maintenance and inspection data on the condition of shear stirrups on 17 coastal RC bridges. Severed shear stirrups are stirrups that become discontinuous during the service life of the structure. Data below 1 represents the fractional section loss of the stirrups from corrosion. A value of 1 represents 100-pct section loss. Values of 1 and above are represent severed shear stirrups.............11
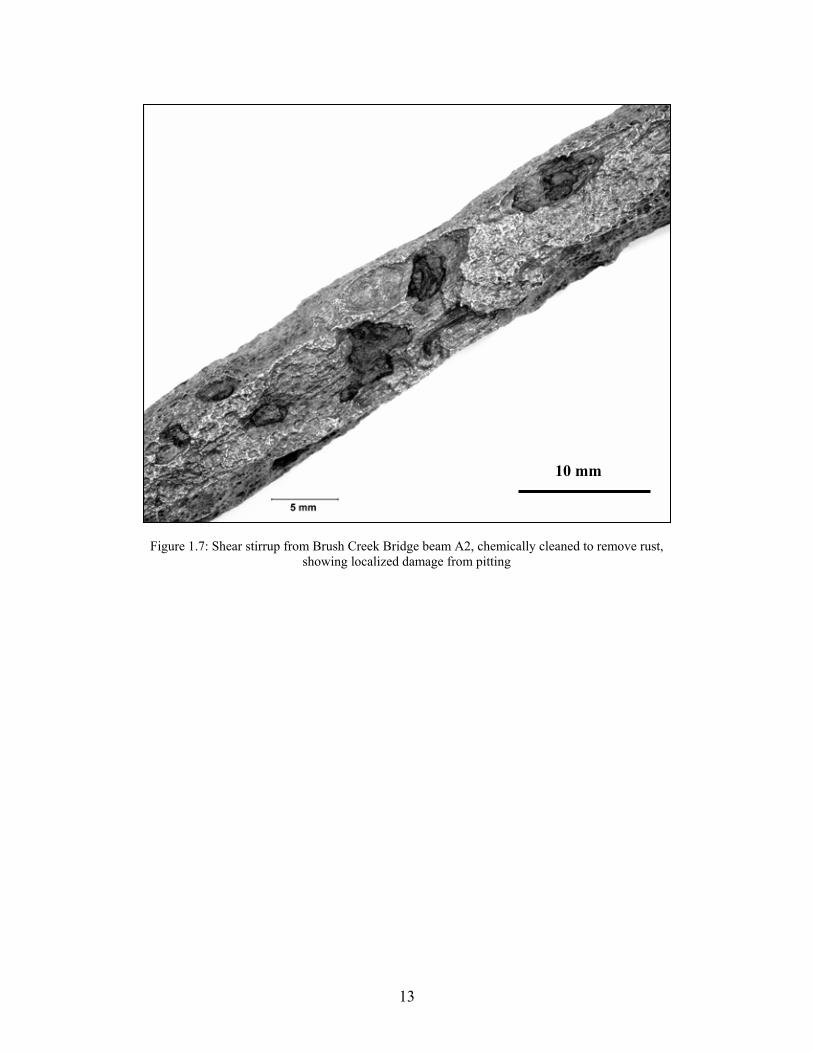
Figure 1.7: Shear stirrup from Brush Creek Bridge beam A2, chemically cleaned to remove rust, showing localized damage from pitting ....................................................................................................................13
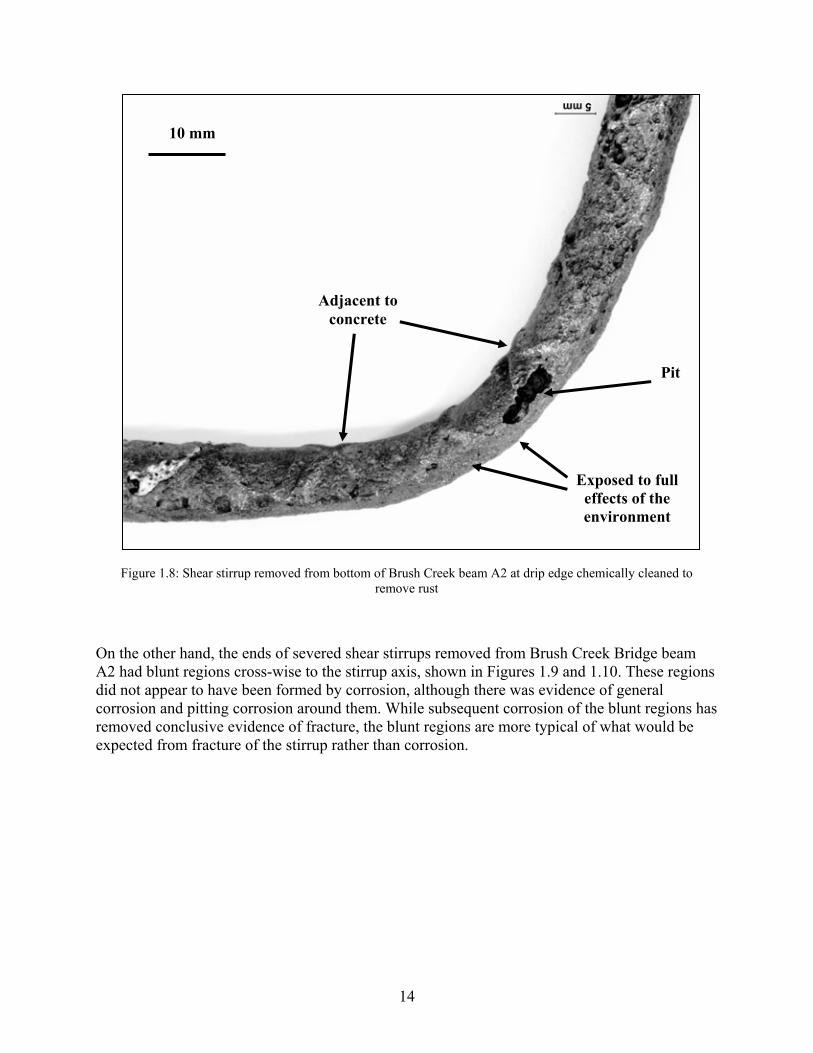
Figure 1.8: Shear stirrup removed from bottom of Brush Creek beam A2 at drip edge chemically cleaned to remove rust.................................................................................................................................................14
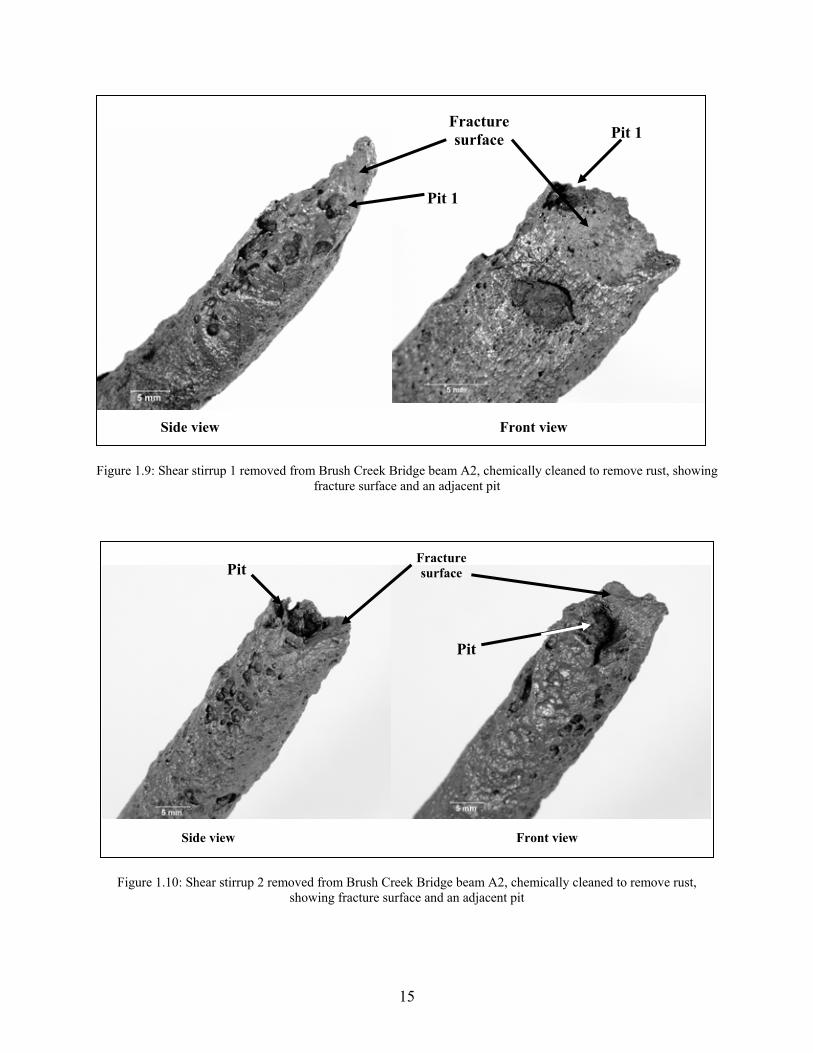
Figure 1.9: Shear stirrup 1 removed from Brush Creek Bridge beam A2, chemically cleaned to remove rust, showing fracture surface and an adjacent pit..............................................................................................15
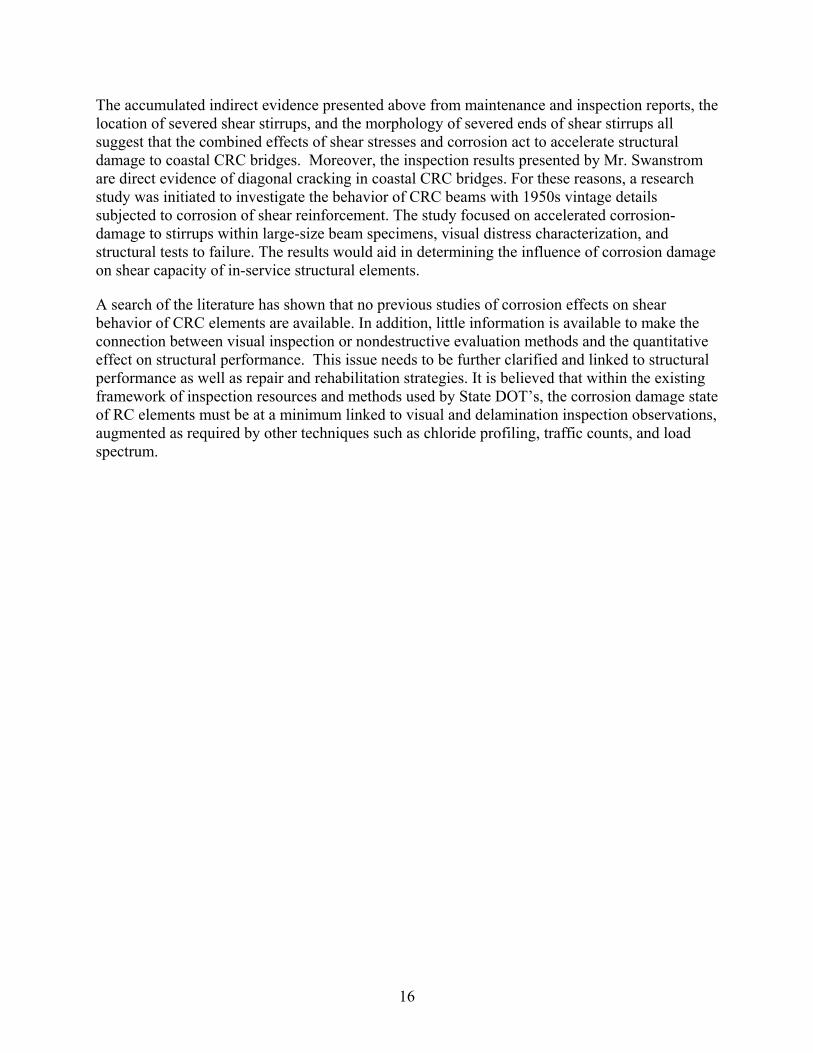
Figure 1.10: Shear stirrup 2 removed from Brush Creek Bridge beam A2, chemically cleaned to remove rust, showing fracture surface and an adjacent pit..............................................................................................15
vii
Figure 2.1: Specimen cross-sections............................................................................................................................18 Figure 2.2: Cross-section designation..........................................................................................................................18 Figure 2.3: Accelerated corrosion of reinforcing steel in a small concrete cylinder. Wetted sponges surround
the concrete cylinder and provide electrical contact to steel anodes surrounding the entire assembly. .....20 Figure 2.4: a) Schematic and b) photograph of corrosion cell (A-anode (+), B-cathode (-)) ......................................21 Figure 2.5: Typical corrosion crack pattern for 10R Series .........................................................................................24 Figure 3.1: Test setup ..................................................................................................................................................26 Figure 3.2: 8R Series load-displacement plots ............................................................................................................28 Figure 3.3: 8R Series crack maps ................................................................................................................................28 Figure 3.4: Deformations measured across cracks within Panel 1 for 8R Series.........................................................29 Figure 3.5: Deformations measured across cracks within Panel 2 for 8R Series.........................................................29 Figure 3.6: 10R Series load-displacement plots ..........................................................................................................30 Figure 3.7: 10R Series crack maps ..............................................................................................................................31 Figure 3.8: Deformations measured across cracks within Panel 1 for 10R Series.......................................................32 Figure 3.9: Deformations measured across cracks within Panel 2 for 10R Series.......................................................32 Figure 3.10: 12R Series load-displacement response ..................................................................................................33 Figure 3.11: 12R Series crack maps ............................................................................................................................33 Figure 3.12: Deformations measured across cracks within Panel 1 for 12R Series.....................................................34 Figure 3.13: Deformations measured across cracks within Panel 2 for 12R Series.....................................................35 Figure 3.14: 10T Series load-displacement response...................................................................................................36 Figure 3.15: 10T Series crack maps.............................................................................................................................36 Figure 3.16: Deformations measured across cracks within Panel 1 for 10T Series.....................................................37 Figure 3.17: Deformations measured across cracks within Panel 2 for 10T Series.....................................................38 Figure 3.18: 10IT Series load-displacement plots .......................................................................................................39 Figure 3.19: 10IT Series crack maps ...........................................................................................................................39 Figure 3.20: Deformations measured across cracks within Panel 1 for 10IT Series....................................................40 Figure 3.21: Deformations measured across cracks within Panel 2 for 10IT Series....................................................41 Figure 4.1: Different levels of corrosion on reinforcing steel removed from test beams (From top to bottom: A -
Original, B - Light, C - Moderate, D - Severe) ..........................................................................................43 Figure 4.2: Typical areas of section loss to shear stirrup.............................................................................................44 Figure 4.3: Completely corroded shear stirrup in bottom third of beam where shear crack formed ...........................45 Figure 4.4: Fractured shear stirrup near flexural tension steel.....................................................................................45 Figure 4.5: Relationship between corrosion product pH and the chloride content of rust removed from test
beams (New rust) and from coastal bridges (Well aged rust). The high chloride content in the low pH “New rust” indicates the presence of substantial hydrochloric acid in the rust, which facilitates further local corrosion of the reinforcing steel. ..........................................................................................50
Figure 4.6: The [FeOOH]/[Fe3O4] ratio for “New rust” removed from the test beams and “Well aged rust” removed from coastal bridges. The “Well aged rust” is more completely oxidized..................................52
Figure 4.7: Measured and predicted average reinforcing steel section loss. The measured section loss was based on Faraday’s law. The shift from the curve where the valence change n = 2 to the valence change n = 3 indicates the corrosion product is becoming move fully oxidized as corrosion proceeds....................53
Figure 5.1: Average and local maximum section-loss of stirrups within a length of beam.........................................61 Figure 5.2: Plan view of concrete cracking in beam web due to corrosion for three different stirrup spacing; (a)
8-in, (b) 10-in, and (c) 12-in.......................................................................................................................63 Figure 5.3: Ratio of experimental to predicted shear strengths for ACI approach including corrosion damage .........67

viii
1
1.0 INTRODUCTION AND BACKGROUND
In 1998 there were approximately 235,000 conventional reinforced concrete (CRC) bridges in service in the United States. Of these, over 21,000 were rated as structurally deficient (Koch, et al. 2002), many due to chloride-induced corrosion damage (Yunovich and Thompson 2003). The majority of these bridges were built since 1950 and are failing well before the intended design life. The direct cost of corrosion for bridge infrastructure in the U.S. – including CRC, prestressed concrete, and steel bridges – was estimated to be $8.3 billion in 1998, with indirect costs estimated to be 10 times the direct cost of corrosion (Koch, et al. 2002).
Due to the large numbers of structurally deficient CRC bridges, the importance of bridges to the communities they serve, and the scarcity of resources for repair, rehabilitation, and replacement, there is a need to keep aging bridges in service even as they are subject to increased volume and weight of truck traffic. Methods are lacking, however, to accurately correlate visual damage states with rating categories that are indicative of structural performance. This study investigated how the shear capacity of CRC bridge beams is affected by corrosion damage to the shear stirrups. It established the presence of shear cracking in Oregon’s coastal CRC bridges and described the changes that occur in shear capacity and cracking maps as shear stirrup corrosion progresses.
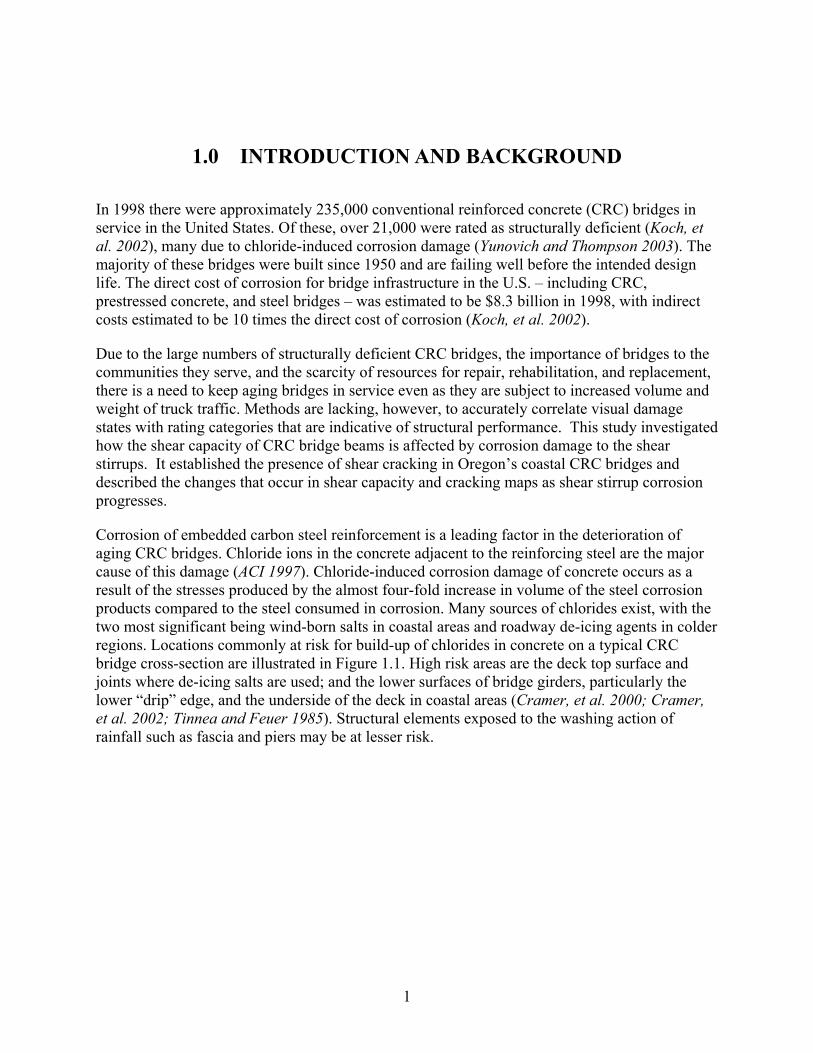
Corrosion of embedded carbon steel reinforcement is a leading factor in the deterioration of aging CRC bridges. Chloride ions in the concrete adjacent to the reinforcing steel are the major cause of this damage (ACI 1997). Chloride-induced corrosion damage of concrete occurs as a result of the stresses produced by the almost four-fold increase in volume of the steel corrosion products compared to the steel consumed in corrosion. Many sources of chlorides exist, with the two most significant being wind-born salts in coastal areas and roadway de-icing agents in colder regions. Locations commonly at risk for build-up of chlorides in concrete on a typical CRC bridge cross-section are illustrated in Figure 1.1. High risk areas are the deck top surface and joints where de-icing salts are used; and the lower surfaces of bridge girders, particularly the lower “drip” edge, and the underside of the deck in coastal areas (Cramer, et al. 2000; Cramer, et al. 2002; Tinnea and Feuer 1985). Structural elements exposed to the washing action of rainfall such as fascia and piers may be at lesser risk.
2
C
B
A
A
B
C
Higher risk from de-icing salts
Higher risk from wind-borne salts
Lower risk due to washing of facia girder
Figure 1.1: A CRC bridge cross-section showing areas at risk from deposition and retention of chloride ions on structural elements
While concrete generally provides inherent corrosion protection for embedded rebar because of its high alkalinity, chlorides can accumulate in the concrete over time and reach a concentration, known as the chloride corrosion threshold, sufficient to cause corrosion (ACI 1997). The time required for chlorides concentrations to reach threshold levels at the depth of the reinforcing steel depends on a number of factors, particularly on the rate chloride is delivered to a concrete surface, the rate chloride is removed by washing, the permeability of the concrete to chloride ions, and the thickness of concrete cover. Review of data available for vintage 1950s coastal CRC bridges in Oregon indicates effective coefficients for the diffusion of chloride though concrete in the range of 0.4x10 -8 to 3.3x10⁻⁸ cm2/s (Covino, et al. 1999; Cramer, et al. 2002). A minimum concrete thickness of 2 in. (5 cm) was specified for these bridges (AASHTO 1953), but actual as-built cover thickness varied considerably, with shallower thickness not uncommon. In fact, the concrete cover over shear stirrups on some CRC bridges was less than 1 inch (2.5 cm) (Cramer, et al. 2000).
Chloride corrosion thresholds are typically expressed in one of three ways: (1) as the weight percent Cl relative to the amount of cement in the concrete (ACI 1997); as the mass of Cl in a cubic yard of concrete (McDonald, et al. 1998; Thomas 1996; West and Hime 1985, Cramer, et al. 2000, 2002); or as the ratio of chloride activity to hydroxyl activity, [Cl]/[OH], in pore water (Hausmann 1967; Hurley and Scully 2002). The American Concrete Institute (ACI 1997) recommends that water-soluble chloride levels be kept below 0.15 wt pct of the cement in concrete used in new construction for dry conditions “to minimize the risk of chloride-induced corrosion” of reinforcing steel (ACI 1997). For Oregon’s 1950s coastal bridges, this translates to about 0.85 lb Cl/yd3 of concrete (0.50 kg Cl/m3 of concrete).
Literature values of the chloride corrosion threshold for reinforcing steel range from 0.8 to 1.4 lb Cl/yd3 of concrete (0.47 to 0.83 kg Cl/m3 of concrete) (McDonald, et al. 1998; Thomas 1996; West and Hime 1985), with an oft cited value of 1.25 lb Cl/yd3 of concrete (0.74 kg Cl/m3 of
3
concrete). Most data on the chloride corrosion threshold for reinforcing steel expressed as the [Cl]/[OH] ratio suggest a value < 1 (Hurley and Scully 2002), with Hausmann giving values of 0.6-0.8 (Hausmann 1967). Expressed in this way, the chloride corrosion threshold is seen to be function of the alkalinity of the concrete and helps explain results from Florida where threshold values were higher for the more alkaline concrete made from local materials (Hartt, et al. 2002). Unfortunately, procedures have not been developed to routinely quantify the chloride content of concrete pore water adjacent to embedded reinforcing steel. Instead, state DOT’s typically use procedures that yield results expressed as a percent of the cement in concrete (ACI 1997) or as lb Cl/yd3 of concrete (Cramer, et al. 2000).
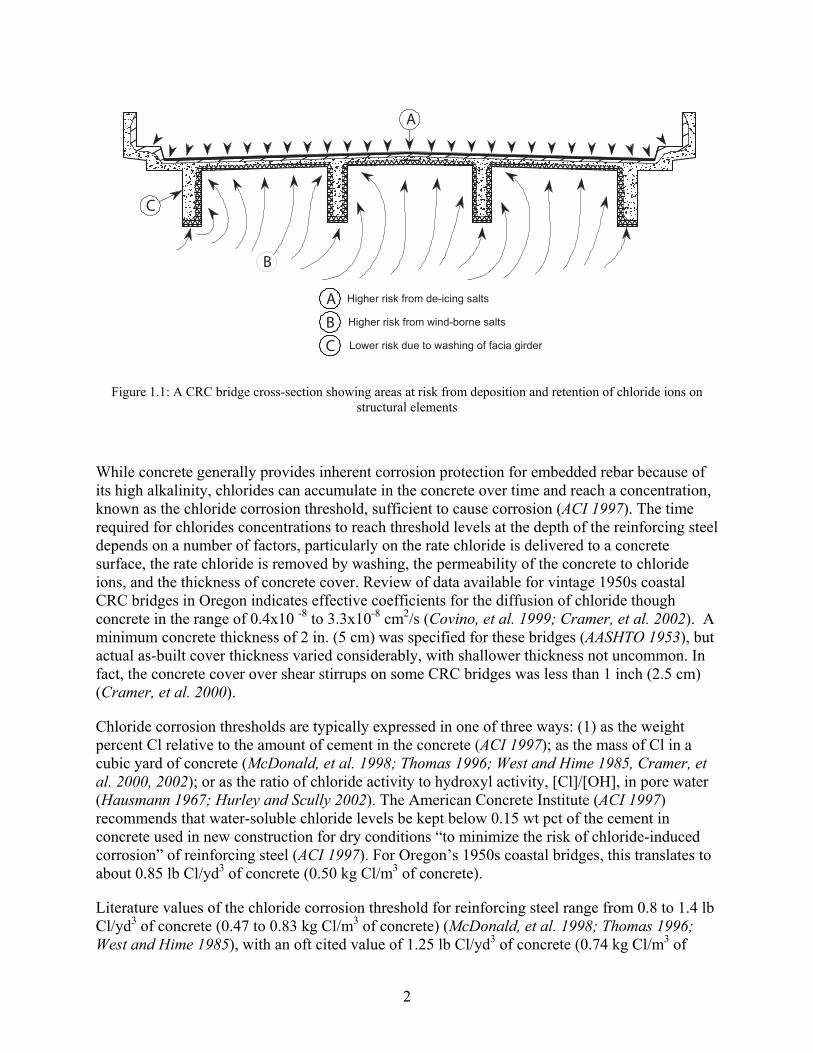
With this in mind, inspection of chloride-induced corrosion damage of reinforced concrete deck girders (RDCG) most often focuses on the four damage stages shown in Figure 1.2. Stage I is a period during which chloride is deposited on the structure surface and diffuses to the depth of the reinforcing steel to initiate corrosion. Stage II is a period during which corrosion propagates, leading eventually to surface manifestations of corrosion such as cracking of the concrete and rust staining of the structure. Stage III is a period brought on by structural deterioration (cracking and delamination) when the reinforcing steel becomes more accessible to the corrosive environment, particularly moisture and chloride ions, and corrosion continues at an accelerated rate with an attendant loss of steel cross-section. Stage IV is characterized by spalling of the concrete to expose the reinforcing steel to the full impact of the corrosive environment. A detailed examination of the Alsea Bay Bridge (Oregon) suggested that reinforcing steel corrosion rates in Stages III and IV may be similar (Tinnea and Feuer 1985). More extreme damage stages would include loss of bond between the reinforcing steel and the core concrete, diagonal cracking of the core concrete, and failure of the structural steel.
Chloride/CarbonationPenetration at Threshold Level
Section LossSpallCracking
Stage I Stage II Stage III Stage IV
Wider and Longer CracksStaining
Figure 1.2: Four stages in the corrosion deterioration of CRC bridge elements. Additional stages are possible when the deterioration is more severe.
4
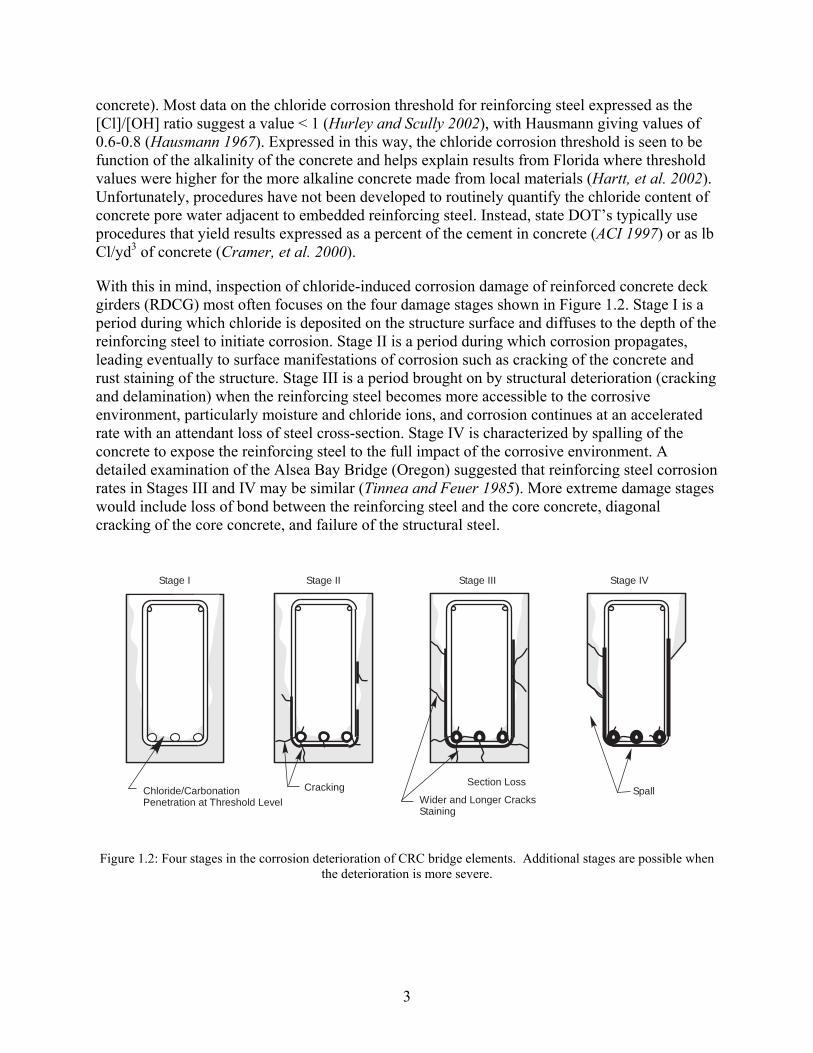
Figure 1.3 shows the progress of a hypothetical CRC bridge through the first four damage stages as a function of structure performance. Stage I is reasonably well understood and can be quantified for well characterized concretes using Fick’s law of diffusion. However, structure-environment interactions that affect this analysis, involving salt deposition, precipitation washing, and cyclic wetting and drying effects over a variety of structure microclimates, are much less well understood.
InitiationStage I Stage II
Stage III
Stage IV
Serviceability limit
Strength limit
Possible Deterioration Path
Pe
rfo
rma
nc
e
100%
Time (years)
Figure 1.3: Hypothetical performance of a CRC structure through the four stages of deterioration shown in Fig. 1.2
In Stage II, corrosion propagation leads to visible corrosion damage such as cracking. These estimates can be made based on the reinforcing bar corrosion rates in chloride contaminated concrete and on an understanding of the volume of corrosion product needed to produce sufficient tensile stress within the concrete to cause cracking (McDonald, et al. 1998). Typical estimates of the Stage II duration range from 3 to 5 years (Sagues 1994; Liu and Weyers 1998) and represent a period where the reinforcement is still isolated from the full impact of the environment and is well bonded to the concrete. From the time of construction (or rehabilitation), the total elapsed time to visible cracking of the concrete is the sum of the times for Stages I and II.
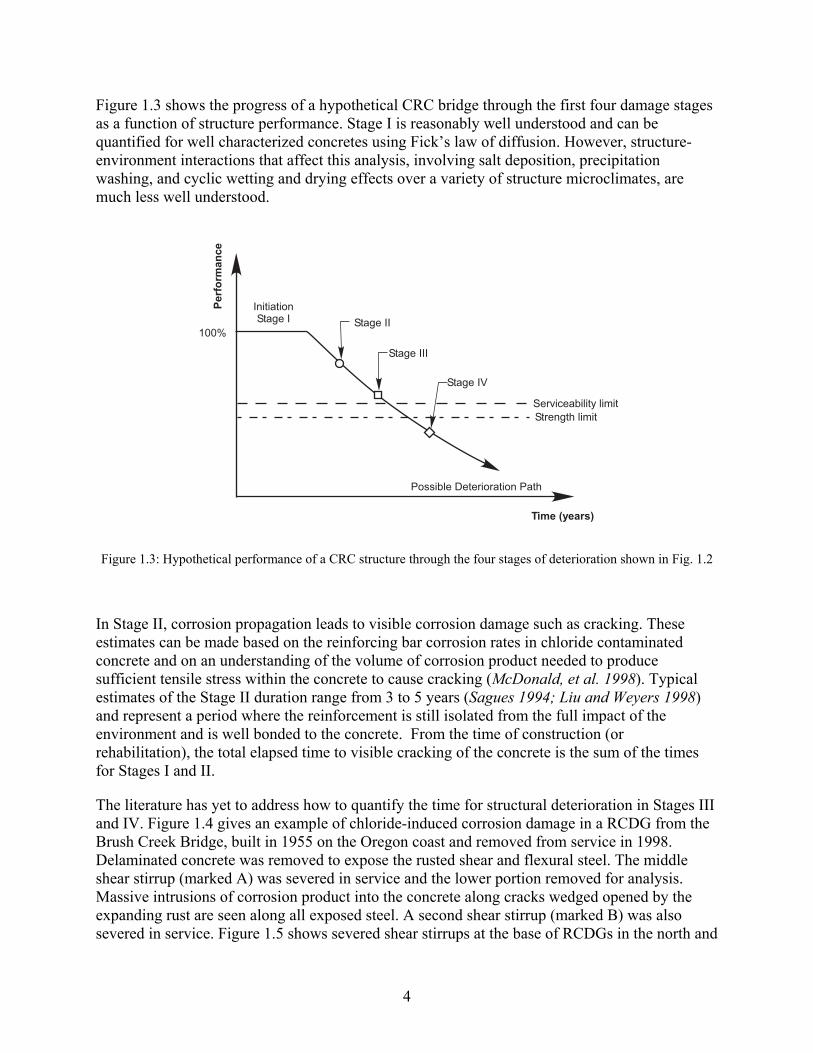
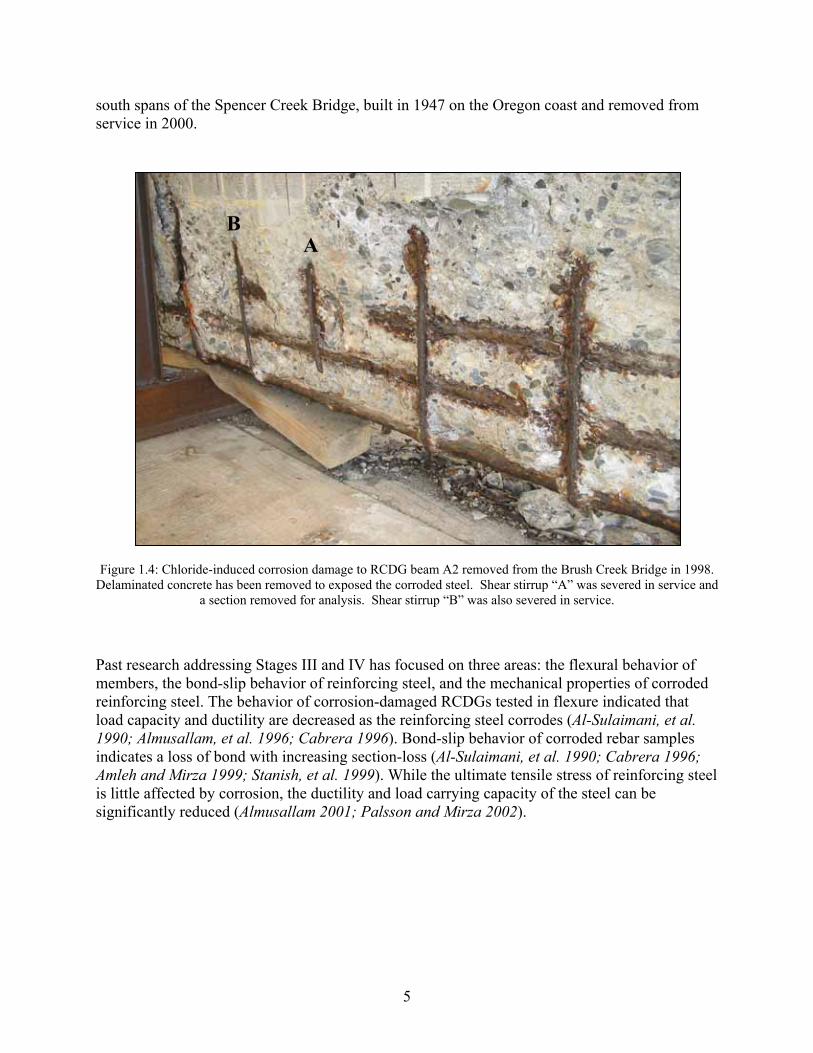
The literature has yet to address how to quantify the time for structural deterioration in Stages III and IV. Figure 1.4 gives an example of chloride-induced corrosion damage in a RCDG from the Brush Creek Bridge, built in 1955 on the Oregon coast and removed from service in 1998. Delaminated concrete was removed to expose the rusted shear and flexural steel. The middle shear stirrup (marked A) was severed in service and the lower portion removed for analysis. Massive intrusions of corrosion product into the concrete along cracks wedged opened by the expanding rust are seen along all exposed steel. A second shear stirrup (marked B) was also severed in service. Figure 1.5 shows severed shear stirrups at the base of RCDGs in the north and
5
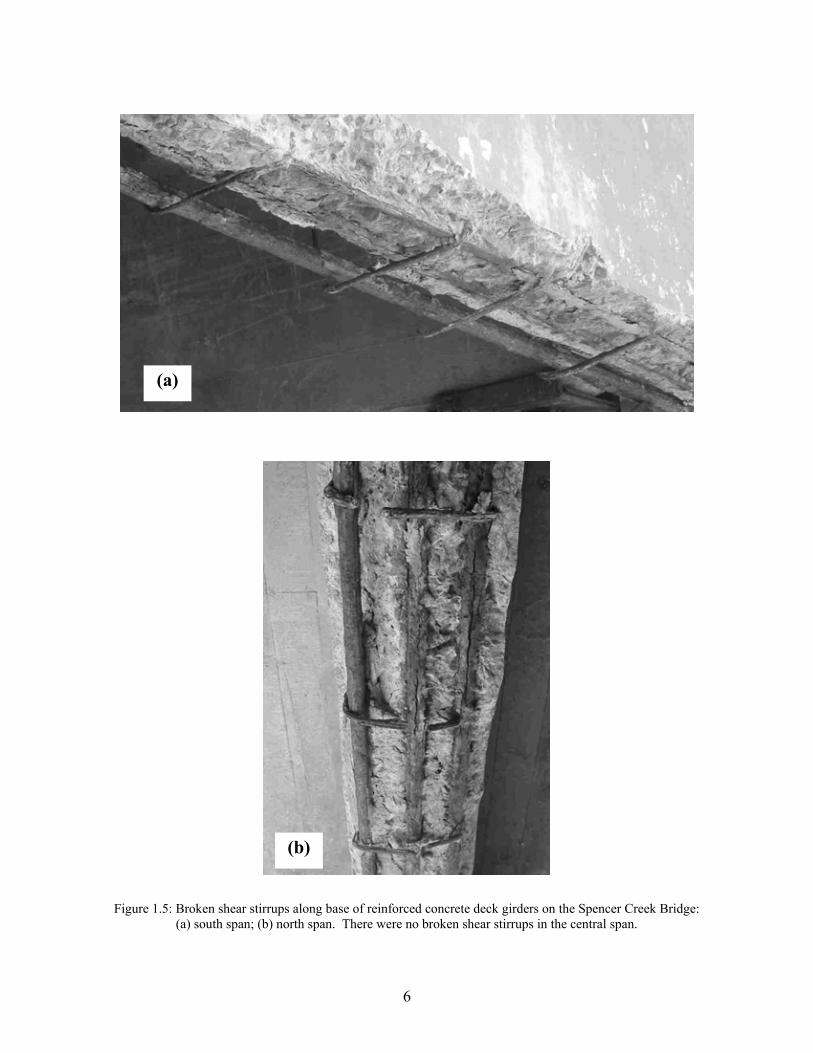
south spans of the Spencer Creek Bridge, built in 1947 on the Oregon coast and removed from service in 2000.
Figure 1.4: Chloride-induced corrosion damage to RCDG beam A2 removed from the Brush Creek Bridge in 1998. Delaminated concrete has been removed to exposed the corroded steel. Shear stirrup “A” was severed in service and
a section removed for analysis. Shear stirrup “B” was also severed in service.
Past research addressing Stages III and IV has focused on three areas: the flexural behavior of members, the bond-slip behavior of reinforcing steel, and the mechanical properties of corroded reinforcing steel. The behavior of corrosion-damaged RCDGs tested in flexure indicated that load capacity and ductility are decreased as the reinforcing steel corrodes (Al-Sulaimani, et al. 1990; Almusallam, et al. 1996; Cabrera 1996). Bond-slip behavior of corroded rebar samples indicates a loss of bond with increasing section-loss (Al-Sulaimani, et al. 1990; Cabrera 1996; Amleh and Mirza 1999; Stanish, et al. 1999). While the ultimate tensile stress of reinforcing steel is little affected by corrosion, the ductility and load carrying capacity of the steel can be significantly reduced (Almusallam 2001; Palsson and Mirza 2002).
A B
6
(a)
(b)
Figure 1.5: Broken shear stirrups along base of reinforced concrete deck girders on the Spencer Creek Bridge: (a) south span; (b) north span. There were no broken shear stirrups in the central span.
7
In contrast to these results, the most significant corrosion damage reported in periodic inspections of Oregon coastal RCDG bridges has been severed shear stirrups rather than flexural steel section loss. The term “severed” is the one used in the inspection reports to describe a shear stirrup that is no longer continuous, i.e., that has been parted by corrosion damage, by shear loading, or by a combination of corrosion damage and shear loading. This would not be important if there were no evidence of diagonal cracking in Oregon’s 1950s vintage coastal bridges. In the absence of diagonal cracking, there could be no coupling of corrosion processes with traffic loading effects to accelerate damage to and deterioration of coastal bridges. In the absence of diagonal cracking, the effects of shear stirrup corrosion on RCDGs would proceed unaffected by traffic loading of the structure.
The observations of Oregon DOT Region 2 Bridge Inspector Jeff Swanstrom suggests otherwise, however (Swanstrom 2003). Region 2 includes the bridges of the central and north Oregon coast. Mr. Swanstrom states unequivocally that diagonal cracking occurs in coastal CRC bridges. His full statement follows. [Note – The following abbreviations are used in this statement: MP is milepost numbered from north to south on US Highway 101; NBI ratings refer to Oregon DOT’s pocket inspection coding guide, which ranges from “9” = new condition, to “0” = bridge closed and beyond corrective action.]
“Oregon is well-known for its coastal bridge designs, most notable of which were the structures designed by Conde B. McCullough. Many of the bridges along the Oregon Coast (Hwy 009, US Hwy 101) were built in the 1930’s and several others were built between 1940 and 1960. Corrosion has been the main problem affecting the longevity of these bridges but they are also afflicted with other structural problems. At least two dozen bridges along Hwy 101 from MP 30.62 to MP 336.94 have Stage “1” to Stage “3” shear cracking (Stage “3” being the worst condition, see attached lists). The structure types range from haunched and straight RCDGs to RC box designs. This [shear cracking] deterioration should not be attributed to corrosion-induced cracking because the cracking does not occur directly over the stirrups but occurs along an angle (up to 45 degrees) across the vertical rebar locations. Therefore, I believe a strong argument can be made that the cracks appearing near the bents are stress-induced cracks and not corrosion-related.
Over the past 5-10 years, a few of our coastal bridges exhibiting corrosion problems and shear cracking have either been rehabilitated or replaced. Some examples of these are Hwy 9, MP 167.51 Cook’s Chasm Br. no. 01174 (replacement nearly completed) which had severe corrosion but also had shear cracking near each bent. The size of the cracks could not be determined because the majority of them were grouted over during past maintenance repairs. Hwy 009, MP 141.67 Yaquina Bay Br. no. 01820 and MP 175.02 Big Creek Br. no. 01180 have shear cracking in some of the RCDGs that since have been covered over with zinc protection during rehab projects.
The shear cracking in these bridges and the other two dozen in the attached lists are addressed in the element condition ratings in the inspection reports. These elements include RCDGs (elem. 110), RC caps (elem. 234), and RC boxes (elem. 105). We also assign an NBI rating (0-9) for the condition of these superstructure and substructure ratings.
8
To my knowledge we have not had to rehabilitate a coastal bridge for shear cracking only and currently we are monitoring the cracking in these structures with crack gauges.”
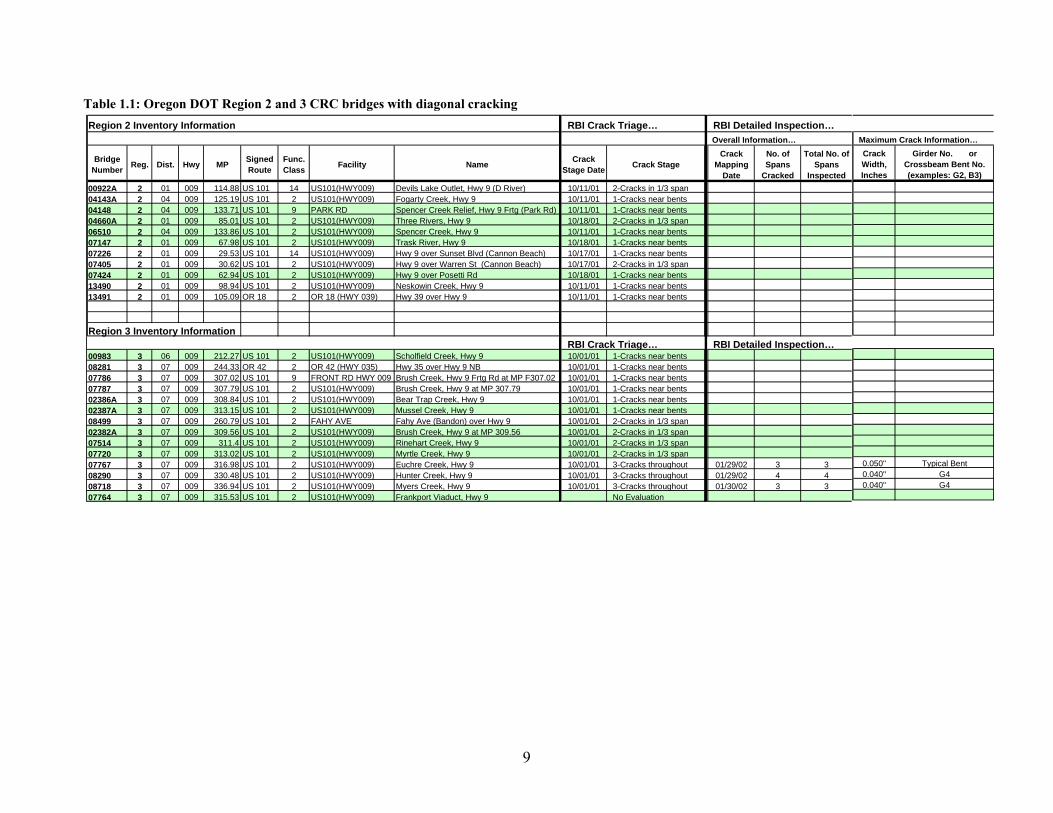
The list of bridges along U.S. Highway 101 (State Highway 9) Mr. Swanstrom compiled from State records exhibiting diagonal cracking is shown in Table 1.1. Twenty-five coastal CRC bridges from Oregon DOT Regions 2 and 3 are included on the list. In addition, Mr. Swanstrom noted that replaced and rehabilitated bridges such as Cooks Chasm, Big Creek, and the Yaquina Bay Bridge also exhibited diagonal cracking. Recent inspection information and some details regarding crack width are also included in Table 1.1. Of particular interest for the future is the application of grout and thermal-sprayed zinc over diagonal cracks on bridges that have been repaired or rehabilitated. This is expected to make inspection and analysis of the structural condition of those specific bridges more difficult.
To further understand the damage history of the coastal bridges, maintenance and inspection reports from Oregon DOT Regions 2 and 3 and dating back 40 or more years were examined for evidence of significant corrosion impacts to RCDGs. The reports from 17 coastal RCDG bridges were examined. These bridges and their locations along the Oregon coast are given in Table 1.2, along with estimates of site corrosivity based on the chloride concentration at a depth of 1.0-1.5 inches in the concrete. Until the 1980s, these reports typically described corrosion damage in qualitative terms such as mild, light, extensive, heavy, and severe. There was no reported evidence of severed or failed flexural steel in these early reports. In fact, RCDG beam A4 was removed from span 3 of the Brush Creek Bridge during bridge replacement and tested to failure under static load. Despite exhibiting considerable corrosion damage in terms of spalled concrete and rusted reinforcing steel, the beam was found to retain 74 pct of its design strength (Oregon DOT 1999), suggesting that the core concrete was intact and the flexural steel was still sound and well bonded to the concrete.
9
Table 1.1: Oregon DOT Region 2 and 3 CRC bridges with diagonal cracking Region 2 Inventory Information RBI Crack Triage… RBI Detailed Inspection…
Overall Information…
Bridge Number Reg. Dist. Hwy MP Signed
RouteFunc. Class Facility Name Crack
Stage Date Crack StageCrack
Mapping Date
No. of Spans
Cracked
Total No. of Spans
Inspected00922A 2 01 009 114.88 US 101 14 US101(HWY009) Devils Lake Outlet, Hwy 9 (D River) 10/11/01 2-Cracks in 1/3 span04143A 2 04 009 125.19 US 101 2 US101(HWY009) Fogarty Creek, Hwy 9 10/11/01 1-Cracks near bents04148 2 04 009 133.71 US 101 9 PARK RD Spencer Creek Relief, Hwy 9 Frtg (Park Rd) 10/11/01 1-Cracks near bents04660A 2 01 009 85.01 US 101 2 US101(HWY009) Three Rivers, Hwy 9 10/18/01 2-Cracks in 1/3 span06510 2 04 009 133.86 US 101 2 US101(HWY009) Spencer Creek, Hwy 9 10/11/01 1-Cracks near bents07147 2 01 009 67.98 US 101 2 US101(HWY009) Trask River, Hwy 9 10/18/01 1-Cracks near bents07226 2 01 009 29.53 US 101 14 US101(HWY009) Hwy 9 over Sunset Blvd (Cannon Beach) 10/17/01 1-Cracks near bents07405 2 01 009 30.62 US 101 2 US101(HWY009) Hwy 9 over Warren St (Cannon Beach) 10/17/01 2-Cracks in 1/3 span07424 2 01 009 62.94 US 101 2 US101(HWY009) Hwy 9 over Posetti Rd 10/18/01 1-Cracks near bents13490 2 01 009 98.94 US 101 2 US101(HWY009) Neskowin Creek, Hwy 9 10/11/01 1-Cracks near bents13491 2 01 009 105.09 OR 18 2 OR 18 (HWY 039) Hwy 39 over Hwy 9 10/11/01 1-Cracks near bents
Region 3 Inventory Information RBI Crack Triage… RBI Detailed Inspection…
00983 3 06 009 212.27 US 101 2 US101(HWY009) Scholfield Creek, Hwy 9 Y 10/01/01 1-Cracks near bents08281 3 07 009 244.33 OR 42 2 OR 42 (HWY 035) Hwy 35 over Hwy 9 NB Y 10/01/01 1-Cracks near bents07786 3 07 009 307.02 US 101 9 FRONT RD HWY 009 Brush Creek, Hwy 9 Frtg Rd at MP F307.02 10/01/01 1-Cracks near bents07787 3 07 009 307.79 US 101 2 US101(HWY009) Brush Creek, Hwy 9 at MP 307.79 10/01/01 1-Cracks near bents02386A 3 07 009 308.84 US 101 2 US101(HWY009) Bear Trap Creek, Hwy 9 10/01/01 1-Cracks near bents02387A 3 07 009 313.15 US 101 2 US101(HWY009) Mussel Creek, Hwy 9 10/01/01 1-Cracks near bents08499 3 07 009 260.79 US 101 2 FAHY AVE Fahy Ave (Bandon) over Hwy 9 10/01/01 2-Cracks in 1/3 span02382A 3 07 009 309.56 US 101 2 US101(HWY009) Brush Creek, Hwy 9 at MP 309.56 10/01/01 2-Cracks in 1/3 span07514 3 07 009 311.4 US 101 2 US101(HWY009) Rinehart Creek, Hwy 9 10/01/01 2-Cracks in 1/3 span07720 3 07 009 313.02 US 101 2 US101(HWY009) Myrtle Creek, Hwy 9 10/01/01 2-Cracks in 1/3 span07767 3 07 009 316.98 US 101 2 US101(HWY009) Euchre Creek, Hwy 9 10/01/01 3-Cracks throughout 01/29/02 3 308290 3 07 009 330.48 US 101 2 US101(HWY009) Hunter Creek, Hwy 9 10/01/01 3-Cracks throughout 01/29/02 4 408718 3 07 009 336.94 US 101 2 US101(HWY009) Myers Creek, Hwy 9 10/01/01 3-Cracks throughout 01/30/02 3 307764 3 07 009 315.53 US 101 2 US101(HWY009) Frankport Viaduct, Hwy 9 No Evaluation
Maximum Crack Information…Crack Width, Inches
Girder No. or Crossbeam Bent No. (examples: G2, B3)
0.050" Typical Bent0.040" G40.040" G4
10
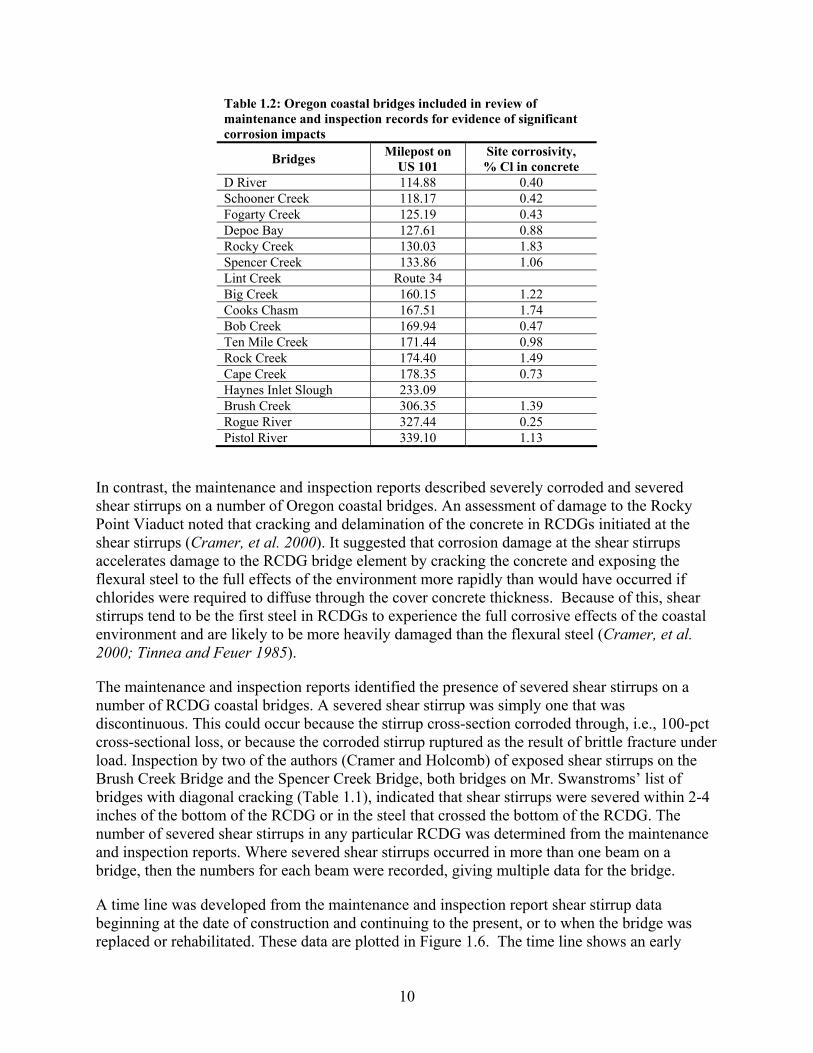
Table 1.2: Oregon coastal bridges included in review of maintenance and inspection records for evidence of significant corrosion impacts
Bridges Milepost on US 101
Site corrosivity, % Cl in concrete
D River 114.88 0.40 Schooner Creek 118.17 0.42 Fogarty Creek 125.19 0.43 Depoe Bay 127.61 0.88 Rocky Creek 130.03 1.83 Spencer Creek 133.86 1.06 Lint Creek Route 34 Big Creek 160.15 1.22 Cooks Chasm 167.51 1.74 Bob Creek 169.94 0.47 Ten Mile Creek 171.44 0.98 Rock Creek 174.40 1.49 Cape Creek 178.35 0.73 Haynes Inlet Slough 233.09 Brush Creek 306.35 1.39 Rogue River 327.44 0.25 Pistol River 339.10 1.13
In contrast, the maintenance and inspection reports described severely corroded and severed shear stirrups on a number of Oregon coastal bridges. An assessment of damage to the Rocky Point Viaduct noted that cracking and delamination of the concrete in RCDGs initiated at the shear stirrups (Cramer, et al. 2000). It suggested that corrosion damage at the shear stirrups accelerates damage to the RCDG bridge element by cracking the concrete and exposing the flexural steel to the full effects of the environment more rapidly than would have occurred if chlorides were required to diffuse through the cover concrete thickness. Because of this, shear stirrups tend to be the first steel in RCDGs to experience the full corrosive effects of the coastal environment and are likely to be more heavily damaged than the flexural steel (Cramer, et al. 2000; Tinnea and Feuer 1985).
The maintenance and inspection reports identified the presence of severed shear stirrups on a number of RCDG coastal bridges. A severed shear stirrup was simply one that was discontinuous. This could occur because the stirrup cross-section corroded through, i.e., 100-pct cross-sectional loss, or because the corroded stirrup ruptured as the result of brittle fracture under load. Inspection by two of the authors (Cramer and Holcomb) of exposed shear stirrups on the Brush Creek Bridge and the Spencer Creek Bridge, both bridges on Mr. Swanstroms’ list of bridges with diagonal cracking (Table 1.1), indicated that shear stirrups were severed within 2-4 inches of the bottom of the RCDG or in the steel that crossed the bottom of the RCDG. The number of severed shear stirrups in any particular RCDG was determined from the maintenance and inspection reports. Where severed shear stirrups occurred in more than one beam on a bridge, then the numbers for each beam were recorded, giving multiple data for the bridge.
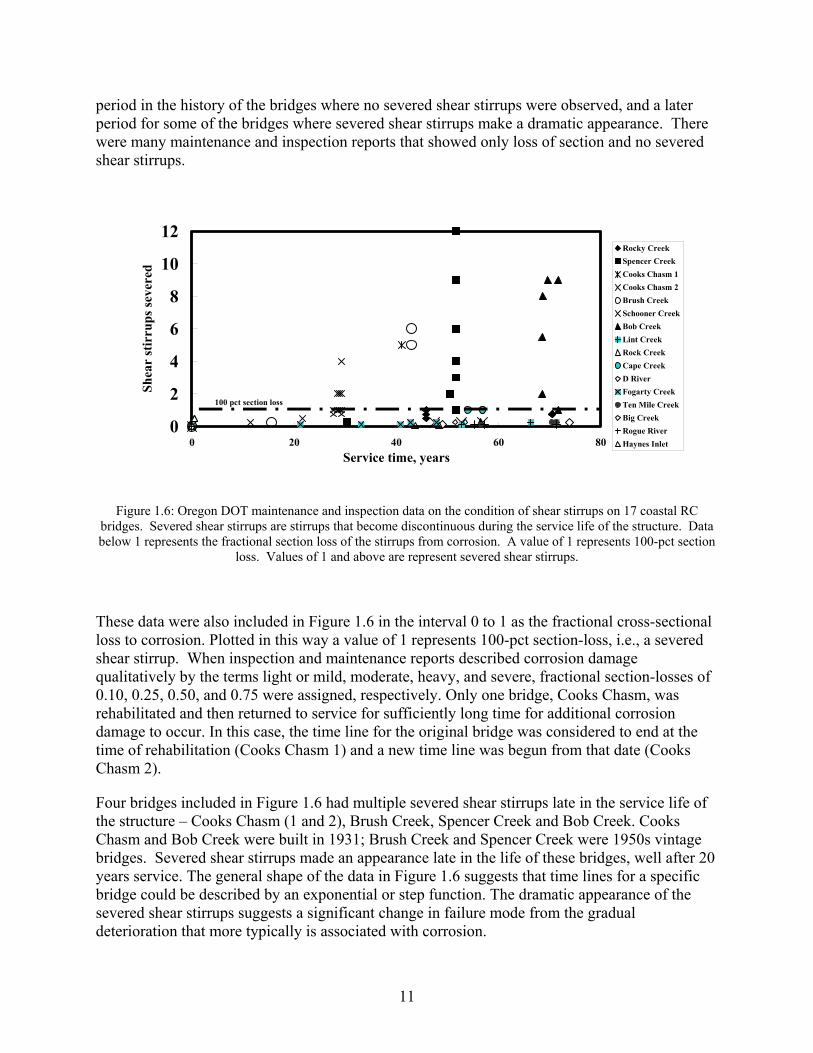
A time line was developed from the maintenance and inspection report shear stirrup data beginning at the date of construction and continuing to the present, or to when the bridge was replaced or rehabilitated. These data are plotted in Figure 1.6. The time line shows an early
11
period in the history of the bridges where no severed shear stirrups were observed, and a later period for some of the bridges where severed shear stirrups make a dramatic appearance. There were many maintenance and inspection reports that showed only loss of section and no severed shear stirrups.
0
2
4
6
8
10
12
0 20 40 60 80Service time, years
Shea
r st
irru
ps se
vere
d
Rocky CreekSpencer CreekCooks Chasm 1Cooks Chasm 2Brush CreekSchooner CreekBob CreekLint CreekRock Creek Cape CreekD RiverFogarty CreekTen Mile CreekBig CreekRogue RiverHaynes Inlet
100 pct section loss
Figure 1.6: Oregon DOT maintenance and inspection data on the condition of shear stirrups on 17 coastal RC bridges. Severed shear stirrups are stirrups that become discontinuous during the service life of the structure. Data below 1 represents the fractional section loss of the stirrups from corrosion. A value of 1 represents 100-pct section
loss. Values of 1 and above are represent severed shear stirrups.
These data were also included in Figure 1.6 in the interval 0 to 1 as the fractional cross-sectional loss to corrosion. Plotted in this way a value of 1 represents 100-pct section-loss, i.e., a severed shear stirrup. When inspection and maintenance reports described corrosion damage qualitatively by the terms light or mild, moderate, heavy, and severe, fractional section-losses of 0.10, 0.25, 0.50, and 0.75 were assigned, respectively. Only one bridge, Cooks Chasm, was rehabilitated and then returned to service for sufficiently long time for additional corrosion damage to occur. In this case, the time line for the original bridge was considered to end at the time of rehabilitation (Cooks Chasm 1) and a new time line was begun from that date (Cooks Chasm 2).
Four bridges included in Figure 1.6 had multiple severed shear stirrups late in the service life of the structure – Cooks Chasm (1 and 2), Brush Creek, Spencer Creek and Bob Creek. Cooks Chasm and Bob Creek were built in 1931; Brush Creek and Spencer Creek were 1950s vintage bridges. Severed shear stirrups made an appearance late in the life of these bridges, well after 20 years service. The general shape of the data in Figure 1.6 suggests that time lines for a specific bridge could be described by an exponential or step function. The dramatic appearance of the severed shear stirrups suggests a significant change in failure mode from the gradual deterioration that more typically is associated with corrosion.
12
As Mr. Swanstrom’s statement suggests, shear stresses in coastal CRC should be a leading factor in producing a change in failure mode. The coincidence of shear stresses of sufficient magnitude and shear stirrups of progressively decreasing cross-section can eventually lead to fracture of the shear stirrups. The traffic loads that produce shear stresses are actually a spectrum of values ranging from the lightest to the heaviest loads. Values on the heavy end are those that would be expected to produce failure of shear stirrups through fracture.
In a somewhat different context, Tinnea and Feuer (1985) have noted considerable overstressing of flexural steel in the Alsea Bay Bridge (Oregon) and its negative impact on the durability of the structure. In fact, their maps of high corrosion activity were coincident with areas of high stress within RCDGs and other structural elements.
Shear stresses in typical RCDGs are larger near the ends of the beam, with some variation depending on factors such as the spacing and distribution of shear stirrups. Two of the authors (Cramer and Holcomb) inspected beams on the Spencer Creek Bridge (removed from service but still standing) to determine the location of severed shear stirrups. The Spencer Creek Bridge is a three span bridge. There were no severed shear stirrups in the central span. Nine severed shear stirrups in the south span occurred in the outermost beam on the east side (northbound traffic lane) beginning at the ¼-point from the south abutment and extending to the mid-point of the beam. Several additional severed stirrups occurred just beyond the mid-point of this beam. Three severed shear stirrups occurred on the adjacent interior beam near the mid-point from the south abutment. One more severed stirrup occurred just beyond the mid-point of the beam. No other severed stirrups were observed on the south span, although a number of shear stirrups were exposed to the atmosphere by concrete spalling from the drip edges of beams.
On the north span, three severed stirrups were observed on the outermost beam on the east side (northbound traffic) near the ¼-point from the north abutment. Three additional severed shear stirrups were also present near the mid-point of this beam. Four severed stirrups occurred on the adjacent interior beam beginning near the ¼-point from the north abutment and extending towards the mid-point. Five more severed shear stirrups occurred near the mid-point and extended towards the ¾-point from the north abutment. Four more severed shear stirrups occurred in the next adjacent interior beam (southbound traffic) near the mid-point and extended towards the ¾-point from the north abutment. The observations from the Spencer Creek Bridge indicate that severed shear stirrups on coastal bridges can occur at high shear stress locations. Shear stirrups from Brush Creek Bridge beam A2 were removed and chemically cleaned to remove rust. Figure 1.7 shows pitting along a length of straight shear stirrup removed near the bottom of the beam. Figure 1.8 shows the bend area of a shear stirrup. The outer surface of the bend, exposed by spalling at the beam drip edge to the full impact of the environment, suffered substantial and relatively uniform corrosion loss. The interior surface adjacent to the remaining concrete often was much more lightly corroded, including preserving the ribs of the reinforcing steel. This agrees with the observations of Tinnea and Feuer (1985) regarding their detailed inspection of the Alsea Bay Bridge. Steel surfaces in contact with the more basic concrete environment exhibited substantially lower corrosion losses than those exposed by delamination and spalling to the full impact of the weather and salt deposition.
13
Figure 1.7: Shear stirrup from Brush Creek Bridge beam A2, chemically cleaned to remove rust, showing localized damage from pitting
10 mm
14
Figure 1.8: Shear stirrup removed from bottom of Brush Creek beam A2 at drip edge chemically cleaned to remove rust
On the other hand, the ends of severed shear stirrups removed from Brush Creek Bridge beam A2 had blunt regions cross-wise to the stirrup axis, shown in Figures 1.9 and 1.10. These regions did not appear to have been formed by corrosion, although there was evidence of general corrosion and pitting corrosion around them. While subsequent corrosion of the blunt regions has removed conclusive evidence of fracture, the blunt regions are more typical of what would be expected from fracture of the stirrup rather than corrosion.
Exposed to full effects of the environment
Adjacent to concrete
Pit
10 mm
15
Figure 1.9: Shear stirrup 1 removed from Brush Creek Bridge beam A2, chemically cleaned to remove rust, showing fracture surface and an adjacent pit
Figure 1.10: Shear stirrup 2 removed from Brush Creek Bridge beam A2, chemically cleaned to remove rust, showing fracture surface and an adjacent pit
Fracture surface Pit 1
Pit 1
Side view Front view
Fracture surfacePit
Pit
Side view Front view
16
The accumulated indirect evidence presented above from maintenance and inspection reports, the location of severed shear stirrups, and the morphology of severed ends of shear stirrups all suggest that the combined effects of shear stresses and corrosion act to accelerate structural damage to coastal CRC bridges. Moreover, the inspection results presented by Mr. Swanstrom are direct evidence of diagonal cracking in coastal CRC bridges. For these reasons, a research study was initiated to investigate the behavior of CRC beams with 1950s vintage details subjected to corrosion of shear reinforcement. The study focused on accelerated corrosion-damage to stirrups within large-size beam specimens, visual distress characterization, and structural tests to failure. The results would aid in determining the influence of corrosion damage on shear capacity of in-service structural elements.
A search of the literature has shown that no previous studies of corrosion effects on shear behavior of CRC elements are available. In addition, little information is available to make the connection between visual inspection or nondestructive evaluation methods and the quantitative effect on structural performance. This issue needs to be further clarified and linked to structural performance as well as repair and rehabilitation strategies. It is believed that within the existing framework of inspection resources and methods used by State DOT’s, the corrosion damage state of RC elements must be at a minimum linked to visual and delamination inspection observations, augmented as required by other techniques such as chloride profiling, traffic counts, and load spectrum.
17
2.0 EXPERIMENTAL PROGRAM
2.1 SPECIMEN DESIGN
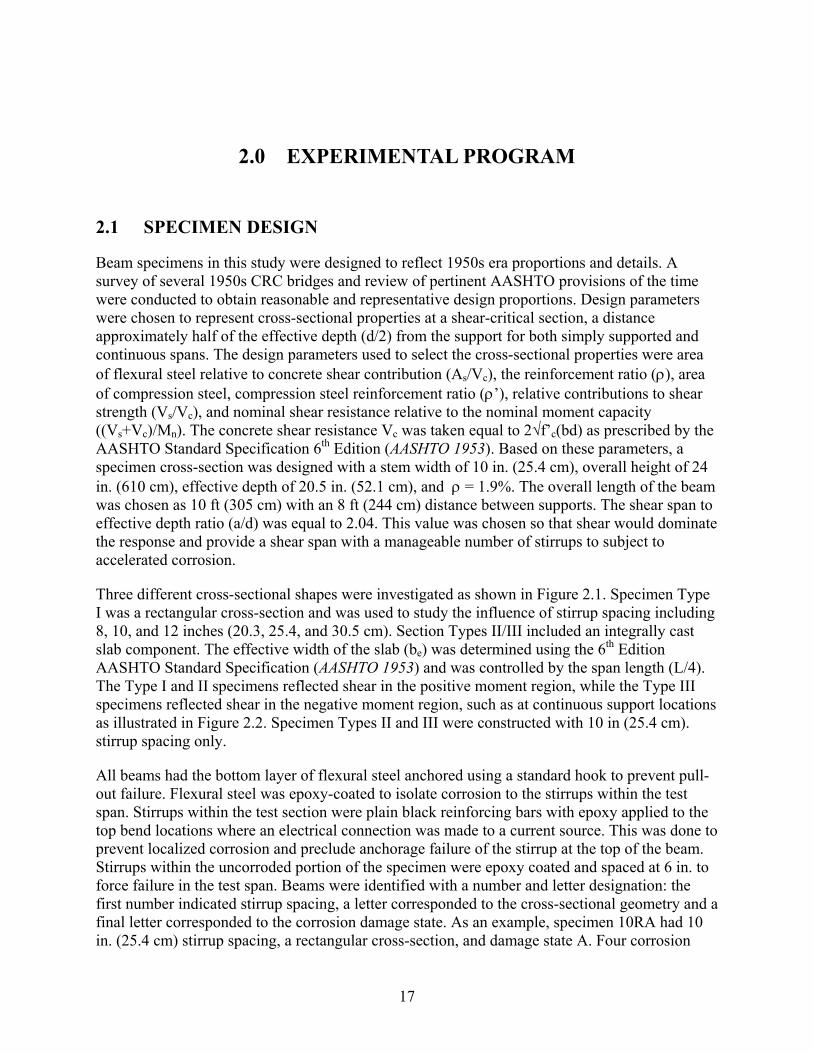
Beam specimens in this study were designed to reflect 1950s era proportions and details. A survey of several 1950s CRC bridges and review of pertinent AASHTO provisions of the time were conducted to obtain reasonable and representative design proportions. Design parameters were chosen to represent cross-sectional properties at a shear-critical section, a distance approximately half of the effective depth (d/2) from the support for both simply supported and continuous spans. The design parameters used to select the cross-sectional properties were area of flexural steel relative to concrete shear contribution (As/Vc), the reinforcement ratio (ρ), area of compression steel, compression steel reinforcement ratio (ρ’), relative contributions to shear strength (Vs/Vc), and nominal shear resistance relative to the nominal moment capacity ((Vs+Vc)/Mn). The concrete shear resistance Vc was taken equal to 2√f’c(bd) as prescribed by the AASHTO Standard Specification 6th Edition (AASHTO 1953). Based on these parameters, a specimen cross-section was designed with a stem width of 10 in. (25.4 cm), overall height of 24 in. (610 cm), effective depth of 20.5 in. (52.1 cm), and ρ = 1.9%. The overall length of the beam was chosen as 10 ft (305 cm) with an 8 ft (244 cm) distance between supports. The shear span to effective depth ratio (a/d) was equal to 2.04. This value was chosen so that shear would dominate the response and provide a shear span with a manageable number of stirrups to subject to accelerated corrosion.
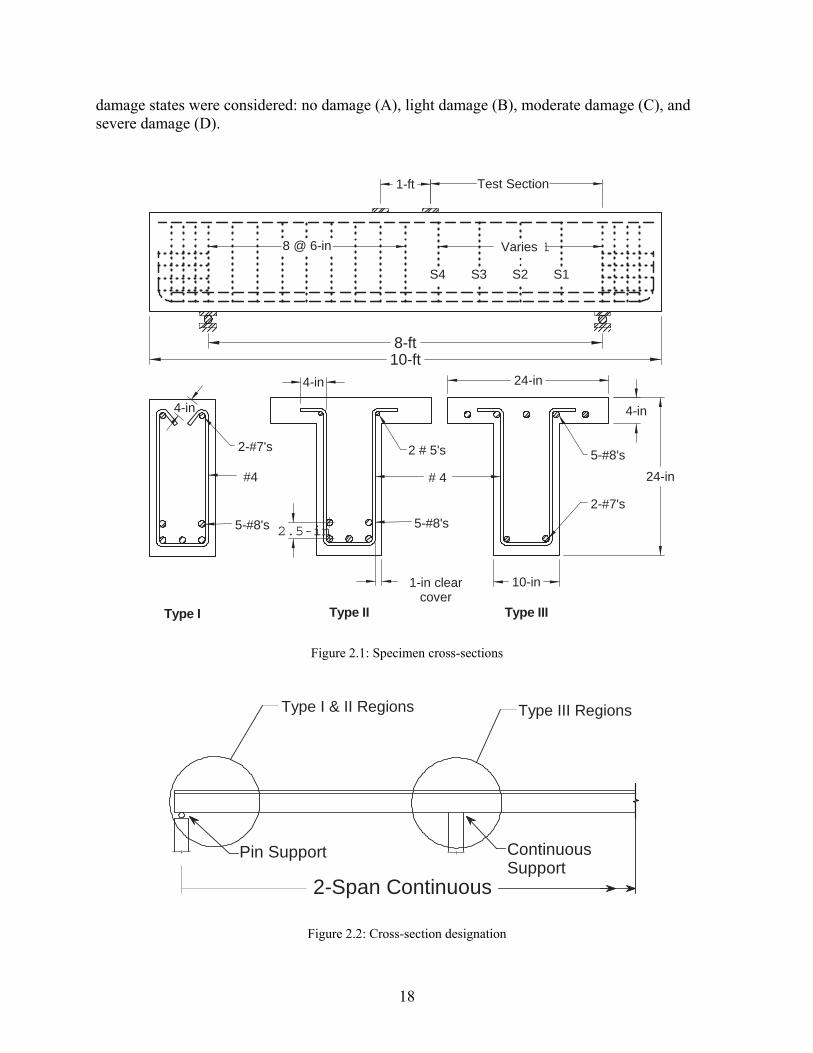
Three different cross-sectional shapes were investigated as shown in Figure 2.1. Specimen Type I was a rectangular cross-section and was used to study the influence of stirrup spacing including 8, 10, and 12 inches (20.3, 25.4, and 30.5 cm). Section Types II/III included an integrally cast slab component. The effective width of the slab (be) was determined using the 6th Edition AASHTO Standard Specification (AASHTO 1953) and was controlled by the span length (L/4). The Type I and II specimens reflected shear in the positive moment region, while the Type III specimens reflected shear in the negative moment region, such as at continuous support locations as illustrated in Figure 2.2. Specimen Types II and III were constructed with 10 in (25.4 cm). stirrup spacing only.
All beams had the bottom layer of flexural steel anchored using a standard hook to prevent pull-out failure. Flexural steel was epoxy-coated to isolate corrosion to the stirrups within the test span. Stirrups within the test section were plain black reinforcing bars with epoxy applied to the top bend locations where an electrical connection was made to a current source. This was done to prevent localized corrosion and preclude anchorage failure of the stirrup at the top of the beam. Stirrups within the uncorroded portion of the specimen were epoxy coated and spaced at 6 in. to force failure in the test span. Beams were identified with a number and letter designation: the first number indicated stirrup spacing, a letter corresponded to the cross-sectional geometry and a final letter corresponded to the corrosion damage state. As an example, specimen 10RA had 10 in. (25.4 cm) stirrup spacing, a rectangular cross-section, and damage state A. Four corrosion
18
damage states were considered: no damage (A), light damage (B), moderate damage (C), and severe damage (D).
24-in
10-in
24-in
Type I Type II Type III
10-ft8-ft
S1S2S3S4
2.677 2.2318 @ 6-in Varies
2.338Test Section1-ft
# 4
2 # 5's 5-#8's
5-#8's2-#7's
#4
2-#7's
5-#8's
4-in
.0891-in clearcover
4-in
4-in
2.5-in
Figure 2.1: Specimen cross-sections
Type I & II Regions Type III Regions
2-Span Continuous
Pin Support ContinuousSupport
Figure 2.2: Cross-section designation
19
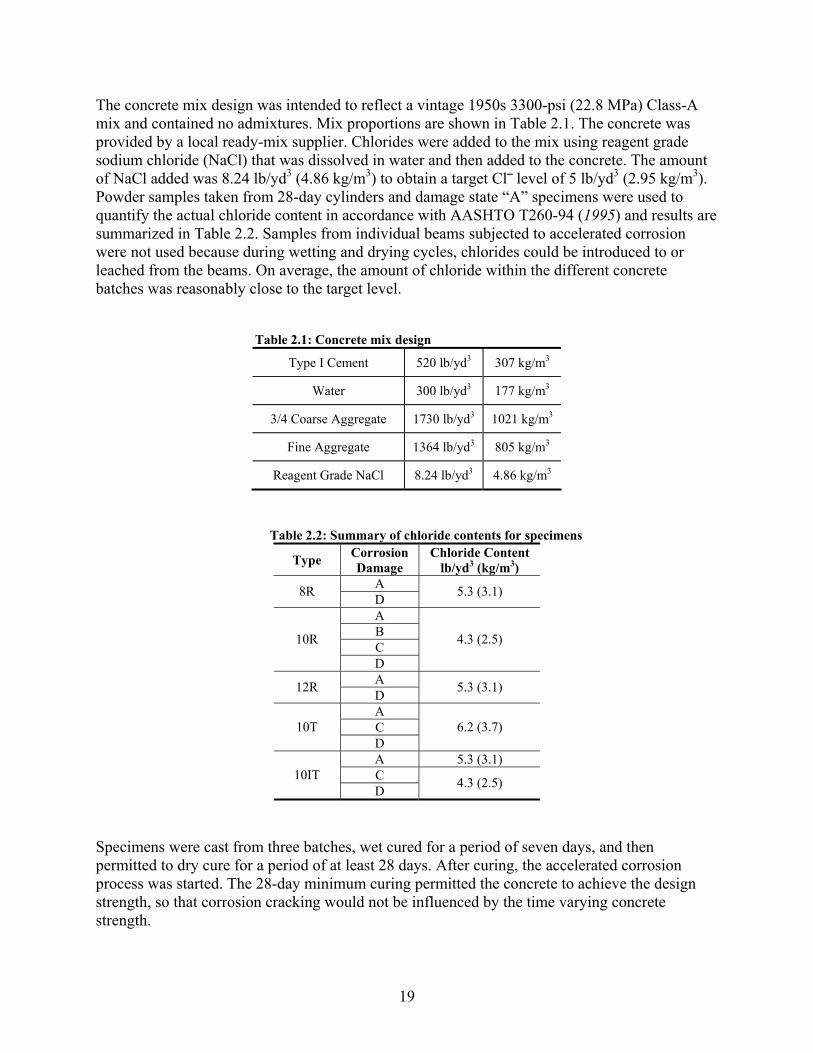
The concrete mix design was intended to reflect a vintage 1950s 3300-psi (22.8 MPa) Class-A mix and contained no admixtures. Mix proportions are shown in Table 2.1. The concrete was provided by a local ready-mix supplier. Chlorides were added to the mix using reagent grade sodium chloride (NaCl) that was dissolved in water and then added to the concrete. The amount of NaCl added was 8.24 lb/yd3 (4.86 kg/m3) to obtain a target Cl⎯ level of 5 lb/yd3 (2.95 kg/m3). Powder samples taken from 28-day cylinders and damage state “A” specimens were used to quantify the actual chloride content in accordance with AASHTO T260-94 (1995) and results are summarized in Table 2.2. Samples from individual beams subjected to accelerated corrosion were not used because during wetting and drying cycles, chlorides could be introduced to or leached from the beams. On average, the amount of chloride within the different concrete batches was reasonably close to the target level.
Table 2.1: Concrete mix design
Type I Cement 520 lb/yd3 307 kg/m3
Water 300 lb/yd3 177 kg/m3
3/4 Coarse Aggregate 1730 lb/yd3 1021 kg/m3
Fine Aggregate 1364 lb/yd3 805 kg/m3
Reagent Grade NaCl 8.24 lb/yd3 4.86 kg/m3
Table 2.2: Summary of chloride contents for specimens
Type Corrosion Damage
Chloride Content lb/yd3 (kg/m3)
A 8R D 5.3 (3.1)
A B C 10R
D
4.3 (2.5)
A 12R D 5.3 (3.1)
A C 10T D
6.2 (3.7)
A 5.3 (3.1) C 10IT D 4.3 (2.5)
Specimens were cast from three batches, wet cured for a period of seven days, and then permitted to dry cure for a period of at least 28 days. After curing, the accelerated corrosion process was started. The 28-day minimum curing permitted the concrete to achieve the design strength, so that corrosion cracking would not be influenced by the time varying concrete strength.
20
2.2 ACCELERATED CORROSION OF STIRRUPS
2.2.1 Current levels
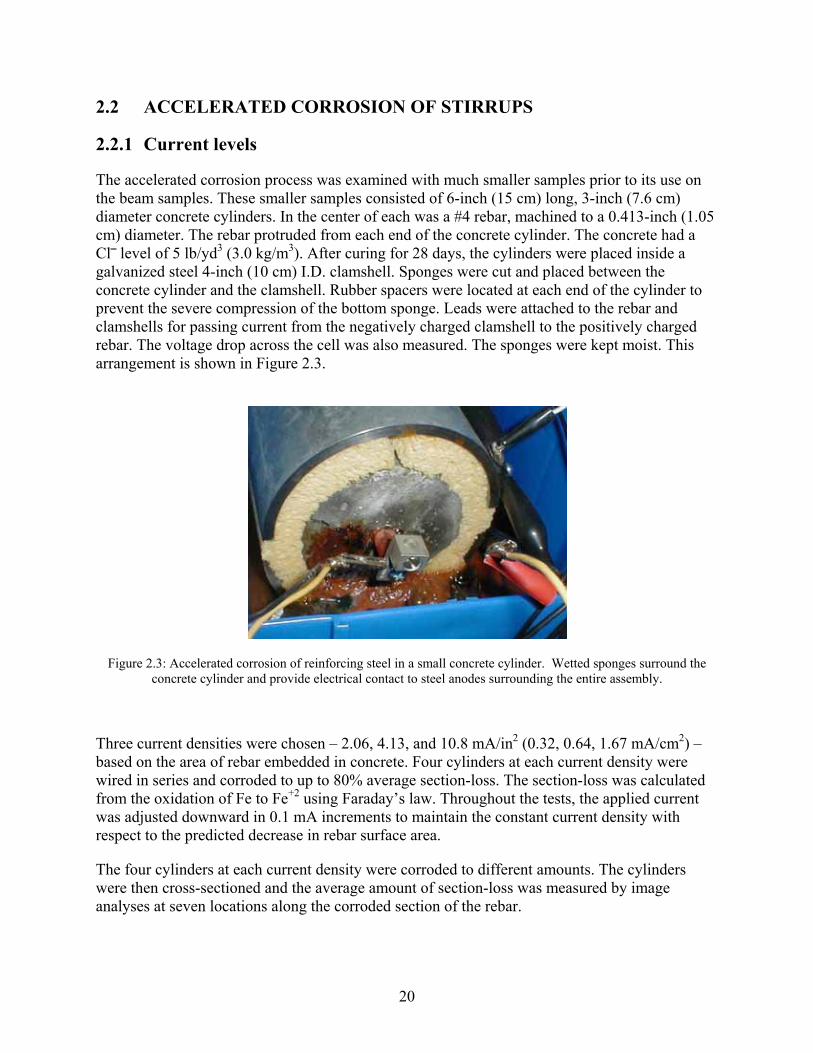
The accelerated corrosion process was examined with much smaller samples prior to its use on the beam samples. These smaller samples consisted of 6-inch (15 cm) long, 3-inch (7.6 cm) diameter concrete cylinders. In the center of each was a #4 rebar, machined to a 0.413-inch (1.05 cm) diameter. The rebar protruded from each end of the concrete cylinder. The concrete had a Cl⎯ level of 5 lb/yd3 (3.0 kg/m3). After curing for 28 days, the cylinders were placed inside a galvanized steel 4-inch (10 cm) I.D. clamshell. Sponges were cut and placed between the concrete cylinder and the clamshell. Rubber spacers were located at each end of the cylinder to prevent the severe compression of the bottom sponge. Leads were attached to the rebar and clamshells for passing current from the negatively charged clamshell to the positively charged rebar. The voltage drop across the cell was also measured. The sponges were kept moist. This arrangement is shown in Figure 2.3.
Figure 2.3: Accelerated corrosion of reinforcing steel in a small concrete cylinder. Wetted sponges surround the concrete cylinder and provide electrical contact to steel anodes surrounding the entire assembly.
Three current densities were chosen – 2.06, 4.13, and 10.8 mA/in2 (0.32, 0.64, 1.67 mA/cm2) – based on the area of rebar embedded in concrete. Four cylinders at each current density were wired in series and corroded to up to 80% average section-loss. The section-loss was calculated from the oxidation of Fe to Fe+2 using Faraday’s law. Throughout the tests, the applied current was adjusted downward in 0.1 mA increments to maintain the constant current density with respect to the predicted decrease in rebar surface area.
The four cylinders at each current density were corroded to different amounts. The cylinders were then cross-sectioned and the average amount of section-loss was measured by image analyses at seven locations along the corroded section of the rebar.
21
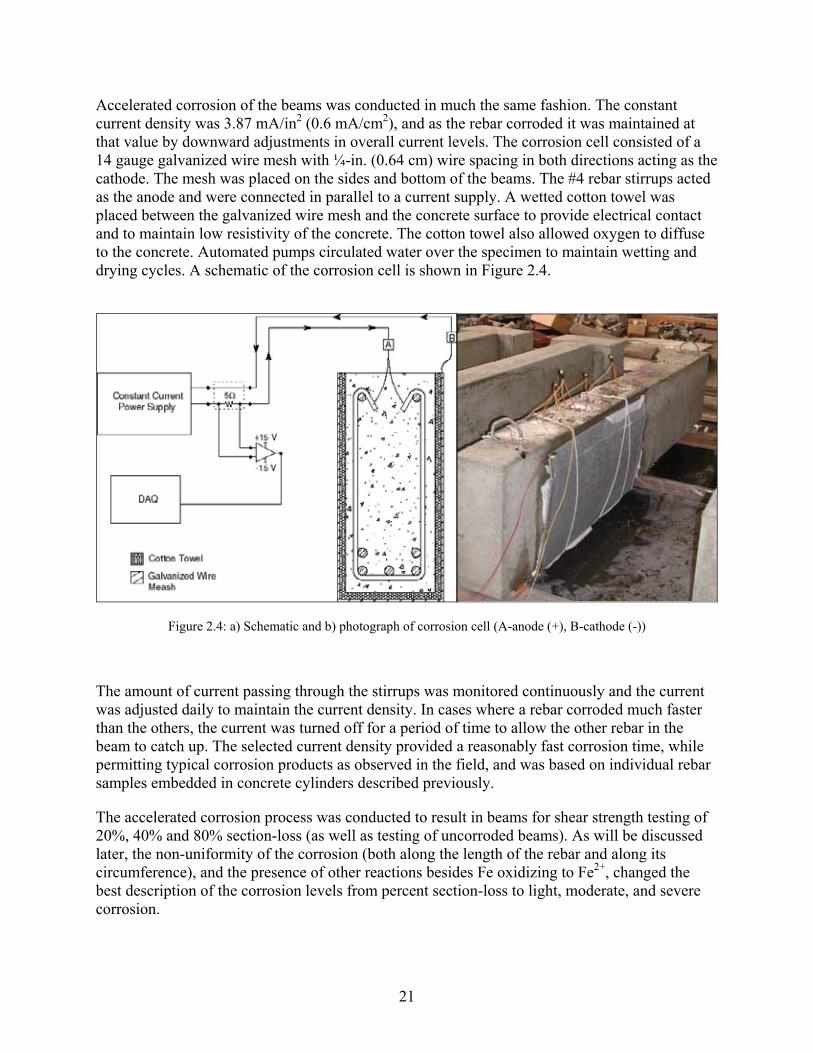
Accelerated corrosion of the beams was conducted in much the same fashion. The constant current density was 3.87 mA/in2 (0.6 mA/cm2), and as the rebar corroded it was maintained at that value by downward adjustments in overall current levels. The corrosion cell consisted of a 14 gauge galvanized wire mesh with ¼-in. (0.64 cm) wire spacing in both directions acting as the cathode. The mesh was placed on the sides and bottom of the beams. The #4 rebar stirrups acted as the anode and were connected in parallel to a current supply. A wetted cotton towel was placed between the galvanized wire mesh and the concrete surface to provide electrical contact and to maintain low resistivity of the concrete. The cotton towel also allowed oxygen to diffuse to the concrete. Automated pumps circulated water over the specimen to maintain wetting and drying cycles. A schematic of the corrosion cell is shown in Figure 2.4.
Figure 2.4: a) Schematic and b) photograph of corrosion cell (A-anode (+), B-cathode (-))
The amount of current passing through the stirrups was monitored continuously and the current was adjusted daily to maintain the current density. In cases where a rebar corroded much faster than the others, the current was turned off for a period of time to allow the other rebar in the beam to catch up. The selected current density provided a reasonably fast corrosion time, while permitting typical corrosion products as observed in the field, and was based on individual rebar samples embedded in concrete cylinders described previously.
The accelerated corrosion process was conducted to result in beams for shear strength testing of 20%, 40% and 80% section-loss (as well as testing of uncorroded beams). As will be discussed later, the non-uniformity of the corrosion (both along the length of the rebar and along its circumference), and the presence of other reactions besides Fe oxidizing to Fe2+, changed the best description of the corrosion levels from percent section-loss to light, moderate, and severe corrosion.
22
2.2.2 Test beams
After curing, specimens were subjected to accelerated corrosion. The 10R series was corroded to achieve four damage states. The 8R and 12R series were tested at two damage states. Series 10T and 10IT were tested at three damage states. State A corresponded to a beam with no corrosion damage. Damage state B (Light) corresponded to a target average nominal section-loss of 12%. Damage state C (Moderate) corresponded to a target average section-loss of 20%. The final damage state, D (Severe), corresponded to a target average section-loss of approximately 40%. Localized cross-sectional loss could be much larger than the average value. Specimens and their corresponding corrosion damage states are summarized in Table 2.3.
Table 2.3: Specimen designation
Beam Cross Section
Stirrup Spacing
Corrosion Level
8RA I 8 None 10RA I 10 None 12RA I 12 None 10TA II 10 None 10ITA III 10 None 10RB I 10 Light 10RC I 10 Moderate 10TC II 10 Moderate 10ITC III 10 Moderate 8RD I 8 Severe
10RD I 10 Severe 12RD I 12 Severe 10TD II 10 Severe 10ITD III 10 Severe
After subsequent structural tests of the beams, stirrups located within the failure region were removed from the specimen to determine the actual amount of section-loss and extent of corrosion damage. After removal, the stirrup legs were cut into manageable pieces (a length of about 16 in. (41 cm)) and cleaned in accordance with ASTM G1-99 (2001). The corrosion damage was quantified to determine both average and local maximum cross-sectional area loss. The average section-loss was determined by the gravimetric method. The local maximum section-loss was determined using a contour gage. Use of a contour gage permitted direct measurement of the nonuniform perimeter for corroded rebars. Local areas were determined by transferring the contour shape to graph paper, scanning the images into a computer aided drafting program (Intergraph Corporation 1999) and using the Measure Area tool.
2.3 VISUAL DAMAGE ASSESSMENT OF BEAMS
During the accelerated corrosion process, cracks produced from corrosion were mapped and recorded. Areas of delaminations and spalls were also recorded. Prior to testing, all beams were given a final inspection and were rated according the Oregon Department of Transportation Bridge Inspection Pocket Coding Guide (Oregon DOT 2001) which corresponds to the National
23
Bridge Inspection (NBI) guidelines. To ensure the laboratory specimen rating was consistent with field practice, ODOT inspection personnel provided independent ratings for initial specimens. The items that were rated for this study relate to beam elements only and included the following: Item #12 “Concrete Deck-bare,” Item #110 “Open Girder/Beam,” Smart Flag #358 “Deck Cracking,” and Smart Flag #359 “Soffit Cracking.” A description of these elements and the range of rating values are shown in Table 2.4. All elements, except for Item #12, are assigned a number and then a percentage that represents the area affected. Item #12 is only rated with a number. For example, a beam with severe damage on only half of the span would be rated for Item #110 as 4-50%.
The ratings assigned to each of the beams were fairly consistent for the different beam series as shown in Table 2.4. Although embedded stirrups in the specimens had undergone significant corrosion damage (based on monitoring the current passing through each stirrup), rating values for the specimens were not severe. The lowest NBI Item #59 rating that was given was a 4/3. This specimen, 10ITD, had areas of spalling with significant delaminations and severe rust staining. Most of the corroded beams were given an Item #59 rating of 5 or 4. The other significant rating characteristic was for Item #110. For all specimens, the rating was 3-100%, meaning evidence of corrosion was present on the test section. The assigned ratings would not clearly indicate deviation in performance between the specimens.
Table 2.4: Condition assessment using Oregon DOT Coding Guidelines
Specimen
Designation Beam Type
Rebar Spacing, in (cm)
Corrosion Level
Open Girder/Beam ODOT-110
1-4
Superstructure NBI-59
9-0
8RA I 8 (20) None 1—100% 9 8RD I 8 (20) Severe 3—100% 4
10RA I 10 (25) None 1—100% 9 10RB I 10 (25) Light 3—100% 5 10RC I 10 (25) Moderate 3—100% 5/4 10RD I 10 (25) Severe 3—100% 4 12RA I 12 (30) None 1—100% 9 12RD I 12 (30) Severe 3—100% 4 10TA II 10 (25) None 1—100% 9 10TC II 10 (25) Moderate 3—100% 5 10TD II 10 (25) Severe 3—100% 5 10ITA III 10 (25) None 1—100% 9 10ITC III 10 (25) Moderate 3—100% 4 10ITD III 10 (25) Severe 3—100% 4/3
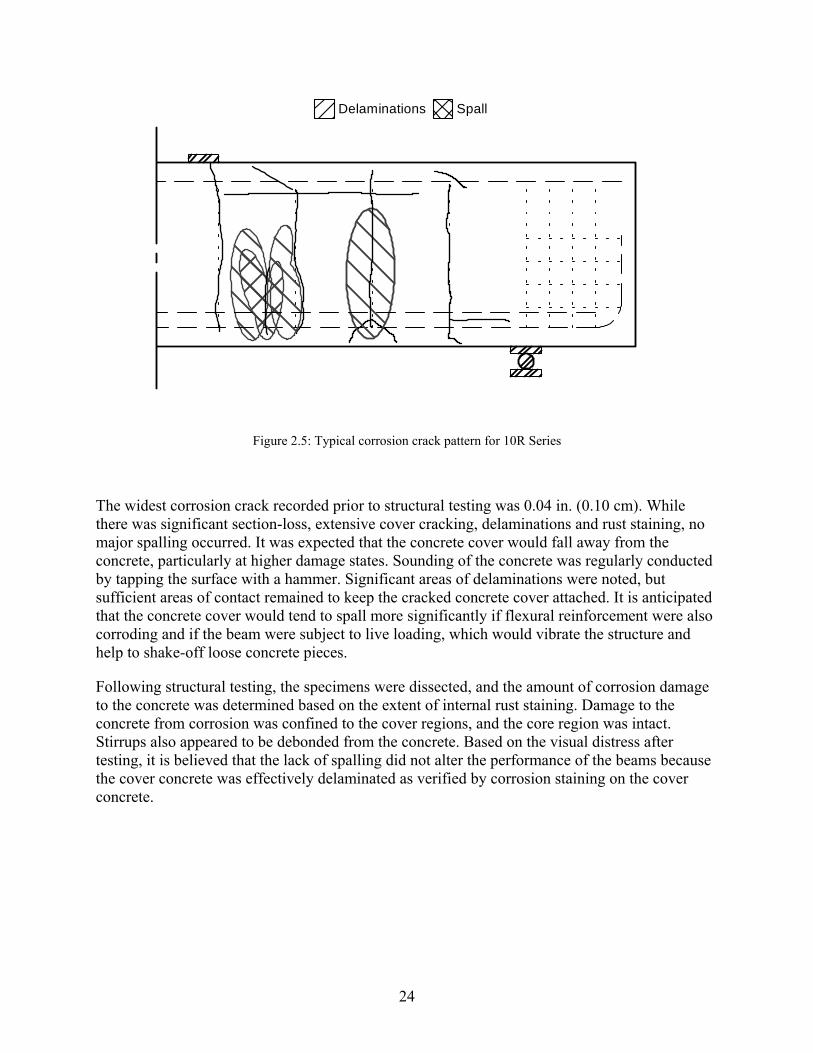
Based on regular visual inspections, cracking due to corrosion was documented for each of the specimens. Observed corrosion cracking patterns were consistent for all specimens. Initially, cracks occurred in the fascia of the beam and then propagated along the stem face to the top and bottom of the beam. As initial cracks grew, additional cracking occurred around the stirrups forming a wedge shaped incipient spall. A longitudinal crack propagated at or near the location of the longitudinal steel although the flexural steel was not corroding. Typical cracking and delamination patterns are shown in Figure 2.5 at the severest damage state tested.
24
Delaminations Spall
Figure 2.5: Typical corrosion crack pattern for 10R Series
The widest corrosion crack recorded prior to structural testing was 0.04 in. (0.10 cm). While there was significant section-loss, extensive cover cracking, delaminations and rust staining, no major spalling occurred. It was expected that the concrete cover would fall away from the concrete, particularly at higher damage states. Sounding of the concrete was regularly conducted by tapping the surface with a hammer. Significant areas of delaminations were noted, but sufficient areas of contact remained to keep the cracked concrete cover attached. It is anticipated that the concrete cover would tend to spall more significantly if flexural reinforcement were also corroding and if the beam were subject to live loading, which would vibrate the structure and help to shake-off loose concrete pieces.
Following structural testing, the specimens were dissected, and the amount of corrosion damage to the concrete was determined based on the extent of internal rust staining. Damage to the concrete from corrosion was confined to the cover regions, and the core region was intact. Stirrups also appeared to be debonded from the concrete. Based on the visual distress after testing, it is believed that the lack of spalling did not alter the performance of the beams because the cover concrete was effectively delaminated as verified by corrosion staining on the cover concrete.
25
3.0 STRUCTURAL TESTING
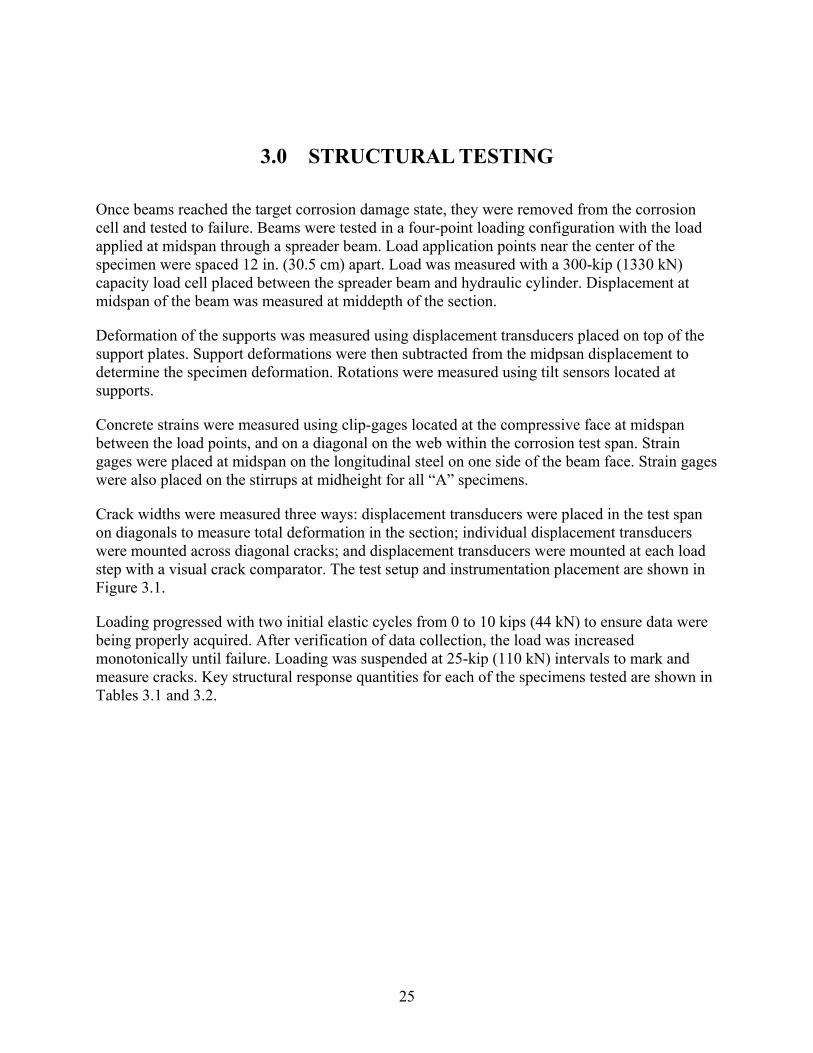
Once beams reached the target corrosion damage state, they were removed from the corrosion cell and tested to failure. Beams were tested in a four-point loading configuration with the load applied at midspan through a spreader beam. Load application points near the center of the specimen were spaced 12 in. (30.5 cm) apart. Load was measured with a 300-kip (1330 kN) capacity load cell placed between the spreader beam and hydraulic cylinder. Displacement at midspan of the beam was measured at middepth of the section.
Deformation of the supports was measured using displacement transducers placed on top of the support plates. Support deformations were then subtracted from the midpsan displacement to determine the specimen deformation. Rotations were measured using tilt sensors located at supports.
Concrete strains were measured using clip-gages located at the compressive face at midspan between the load points, and on a diagonal on the web within the corrosion test span. Strain gages were placed at midspan on the longitudinal steel on one side of the beam face. Strain gages were also placed on the stirrups at midheight for all “A” specimens.
Crack widths were measured three ways: displacement transducers were placed in the test span on diagonals to measure total deformation in the section; individual displacement transducers were mounted across diagonal cracks; and displacement transducers were mounted at each load step with a visual crack comparator. The test setup and instrumentation placement are shown in Figure 3.1.
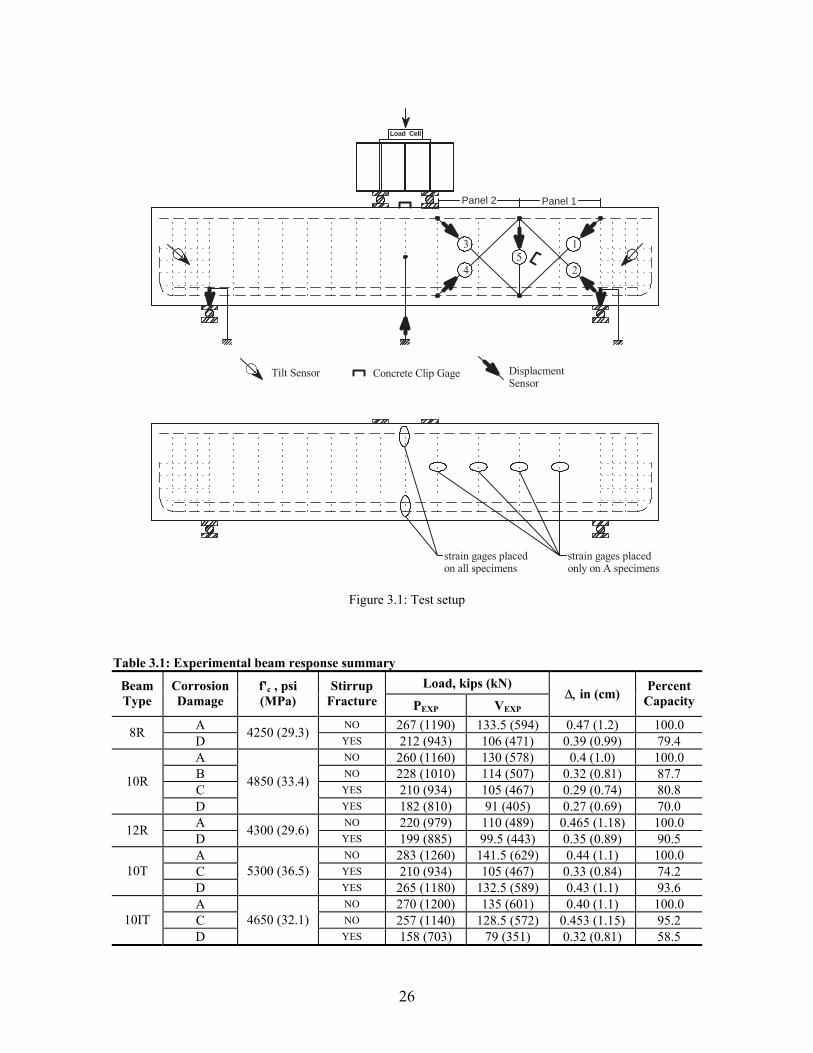
Loading progressed with two initial elastic cycles from 0 to 10 kips (44 kN) to ensure data were being properly acquired. After verification of data collection, the load was increased monotonically until failure. Loading was suspended at 25-kip (110 kN) intervals to mark and measure cracks. Key structural response quantities for each of the specimens tested are shown in Tables 3.1 and 3.2.
26
Tilt Sensor DisplacmentSensor
Concrete Clip Gage
strain gages placedon all specimens
strain gages placedonly on A specimens
Load Cell
1
2
3
45
Panel 1Panel 2
Figure 3.1: Test setup
Table 3.1: Experimental beam response summary Load, kips (kN) Beam
Type Corrosion Damage
f'c , psi (MPa)
Stirrup Fracture PEXP VEXP
∆, in (cm) Percent Capacity
A NO 267 (1190) 133.5 (594) 0.47 (1.2) 100.0 8R D 4250 (29.3) YES 212 (943) 106 (471) 0.39 (0.99) 79.4
A NO 260 (1160) 130 (578) 0.4 (1.0) 100.0 B NO 228 (1010) 114 (507) 0.32 (0.81) 87.7 C YES 210 (934) 105 (467) 0.29 (0.74) 80.8 10R
D
4850 (33.4)
YES 182 (810) 91 (405) 0.27 (0.69) 70.0 A NO 220 (979) 110 (489) 0.465 (1.18) 100.0 12R D 4300 (29.6)
YES 199 (885) 99.5 (443) 0.35 (0.89) 90.5 A NO 283 (1260) 141.5 (629) 0.44 (1.1) 100.0 C YES 210 (934) 105 (467) 0.33 (0.84) 74.2 10T D
5300 (36.5) YES 265 (1180) 132.5 (589) 0.43 (1.1) 93.6
A NO 270 (1200) 135 (601) 0.40 (1.1) 100.0 C NO 257 (1140) 128.5 (572) 0.453 (1.15) 95.2 10IT D
4650 (32.1) YES 158 (703) 79 (351) 0.32 (0.81) 58.5
27
Table 3.2: Summary of crack widths
Beam Type
Corrosion Damage
VEXP kips (kN)
Midspan Disp in (cm)
VEXP @ First Shear Crack,
kips (kN)
50%VEXP kips, (kN)
wcr (50%VEXP) in, (cm)
75%VEXP kips, (kN)
wcr (75%VEXP) in (cm)
A 133.5 (594) 0.47 (1.2) 37.5 (167) 0.016 (0.041) 0.025 (0.064) 8R
D 106 (472) 0.39 (0.99) 62.5 (278) 62.5 (278)
0.008 (0.02) 100 (445)
0.01 (0.03)
A 130 (578) 0.40 (1.0) 50 (222) 0.013 (0.033) 0.02 (0.05)
B 114 (507) 0.32 (0.81) 75 (334) ≤ 0.008 (0.02) 0.02 (0.05)
C 105 (467) 0.29 (0.74) 62.5 (278) ≤ 0.008 (0.02) 0.025 (0.064) 10R
D1 91 (405) 0.27 (0.69) 50 (222)
62.5 (278)
≤ 0.008 (0.02)
100 (445)
0.016 (0.041)
A 110 (489) 0.465 (1.18) 37.5 (167) ≤ 0.008 (0.02) 0.02 (0.05) 12R
D 99.5 (443) 0.35 (0.89) 50 (222) 50 (222)
0.01 (0.025) 75 (334)
0.03 (0.08)
A 141.5 (629) 0.44 (1.1) 50 (222) .013+ (0.033+) .016+ (0.041+)
C 105 (467) 0.33 (0.84) 75 (334) .016- (0.041-) 0.04 (0.1) 10T
D 132.5 (589) 0.43 (1.1) 62.5 (278)
75 (334)
0.016 (0.041)
100 (445)
0.03 (0.08)
A 135 (601) 0.40 (1.0) 37.5 (167) 0.016 (0.041) .02+ (0.05+)
C 128.5 (572) 0.453 (1.15) 75 (334) ≤ 0.008 (0.02) 0.025 (0.064) 10IT
D 79 (351) 0.32 (0.81) 50 (222)
75 (334)
≤ 0.008 (0.02)
100 (445)
0.06 (0.2)
Beam failed before 75% VEXP. Crack width taken at maximum at load step before failure
3.1 STRUCTURAL PERFORMANCE
3.1.1 Rectangular Beams
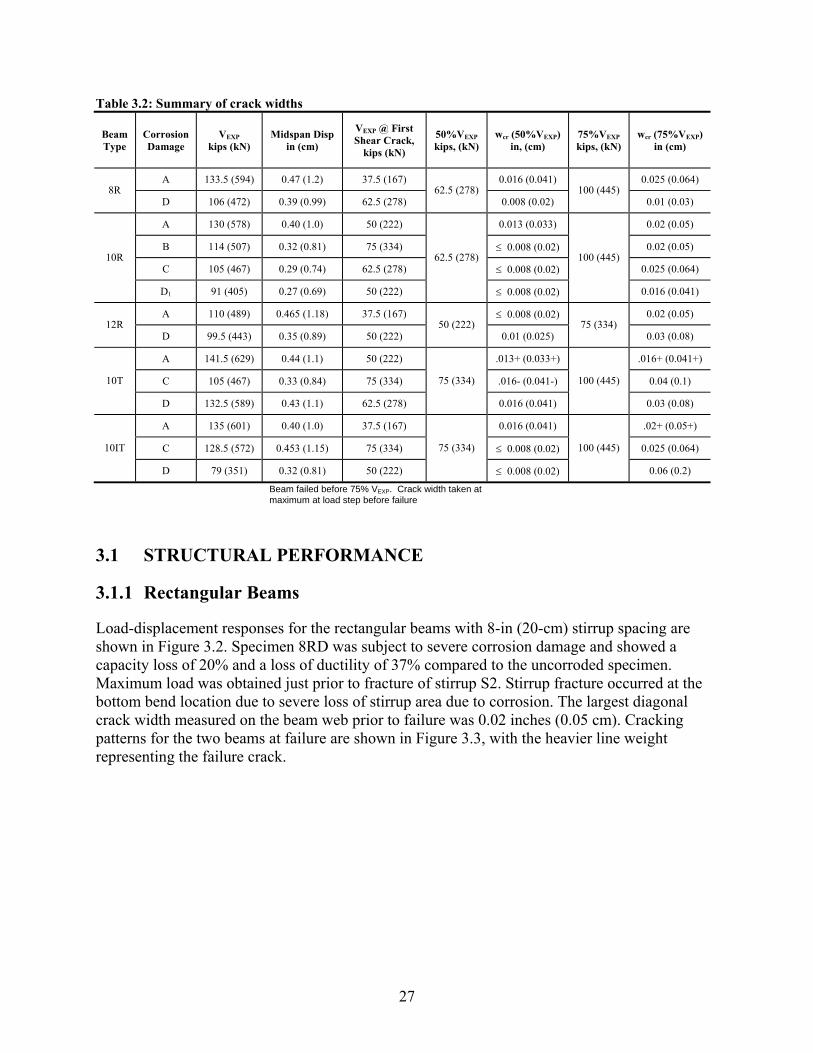
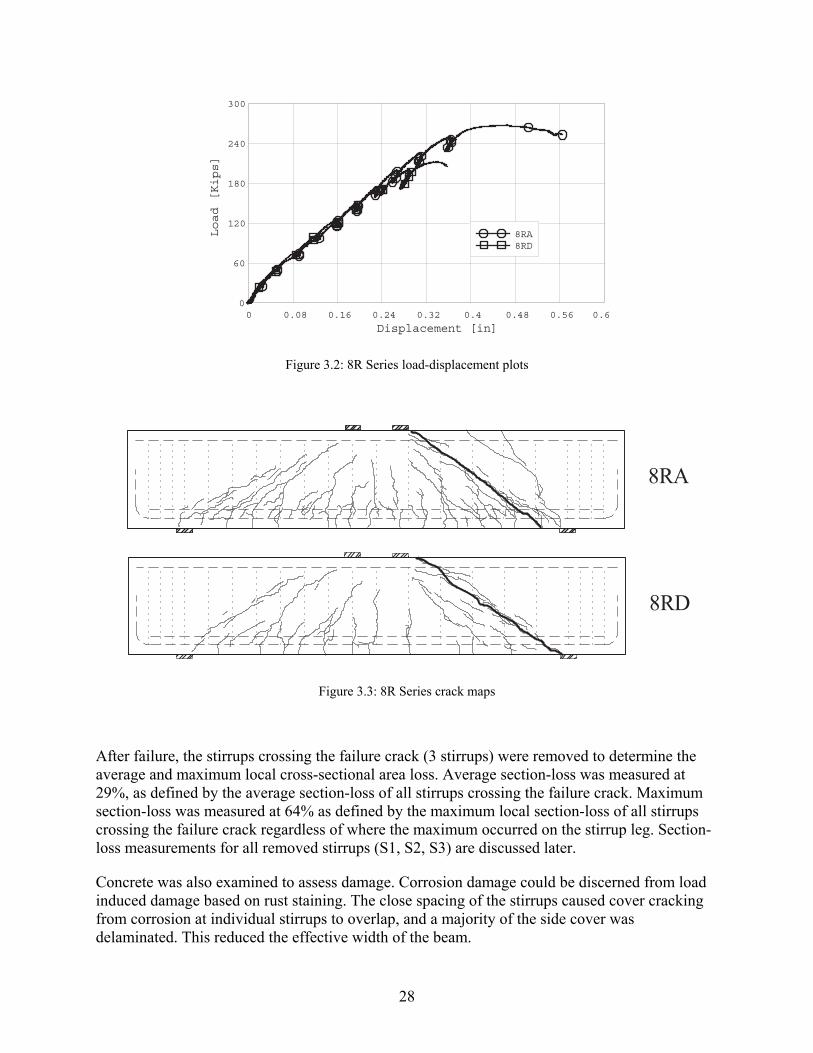
Load-displacement responses for the rectangular beams with 8-in (20-cm) stirrup spacing are shown in Figure 3.2. Specimen 8RD was subject to severe corrosion damage and showed a capacity loss of 20% and a loss of ductility of 37% compared to the uncorroded specimen. Maximum load was obtained just prior to fracture of stirrup S2. Stirrup fracture occurred at the bottom bend location due to severe loss of stirrup area due to corrosion. The largest diagonal crack width measured on the beam web prior to failure was 0.02 inches (0.05 cm). Cracking patterns for the two beams at failure are shown in Figure 3.3, with the heavier line weight representing the failure crack.
28
Displacement [in]
Load [Kips]
0 0.08 0.16 0.24 0.32 0.4 0.48 0.56 0.60
60
120
180
240
300
8RA8RD
Figure 3.2: 8R Series load-displacement plots
8RA
8RD
Figure 3.3: 8R Series crack maps
After failure, the stirrups crossing the failure crack (3 stirrups) were removed to determine the average and maximum local cross-sectional area loss. Average section-loss was measured at 29%, as defined by the average section-loss of all stirrups crossing the failure crack. Maximum section-loss was measured at 64% as defined by the maximum local section-loss of all stirrups crossing the failure crack regardless of where the maximum occurred on the stirrup leg. Section-loss measurements for all removed stirrups (S1, S2, S3) are discussed later.
Concrete was also examined to assess damage. Corrosion damage could be discerned from load induced damage based on rust staining. The close spacing of the stirrups caused cover cracking from corrosion at individual stirrups to overlap, and a majority of the side cover was delaminated. This reduced the effective width of the beam.
29
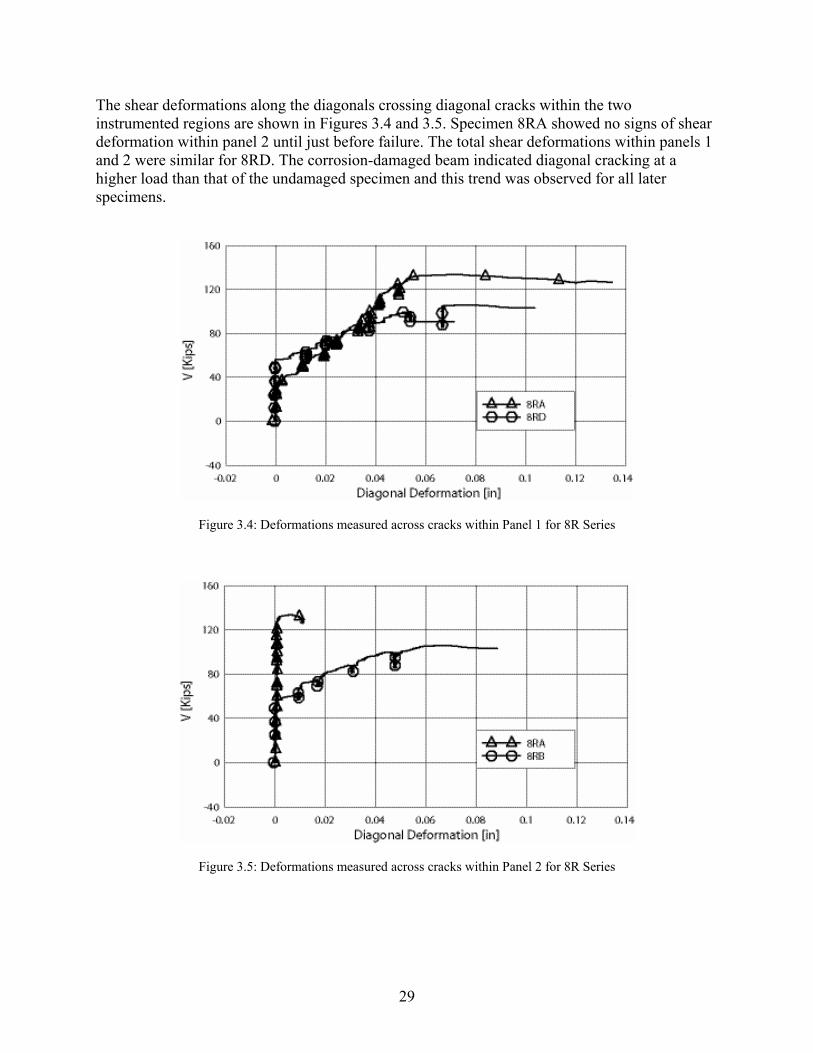
The shear deformations along the diagonals crossing diagonal cracks within the two instrumented regions are shown in Figures 3.4 and 3.5. Specimen 8RA showed no signs of shear deformation within panel 2 until just before failure. The total shear deformations within panels 1 and 2 were similar for 8RD. The corrosion-damaged beam indicated diagonal cracking at a higher load than that of the undamaged specimen and this trend was observed for all later specimens.
Figure 3.4: Deformations measured across cracks within Panel 1 for 8R Series
Figure 3.5: Deformations measured across cracks within Panel 2 for 8R Series
30
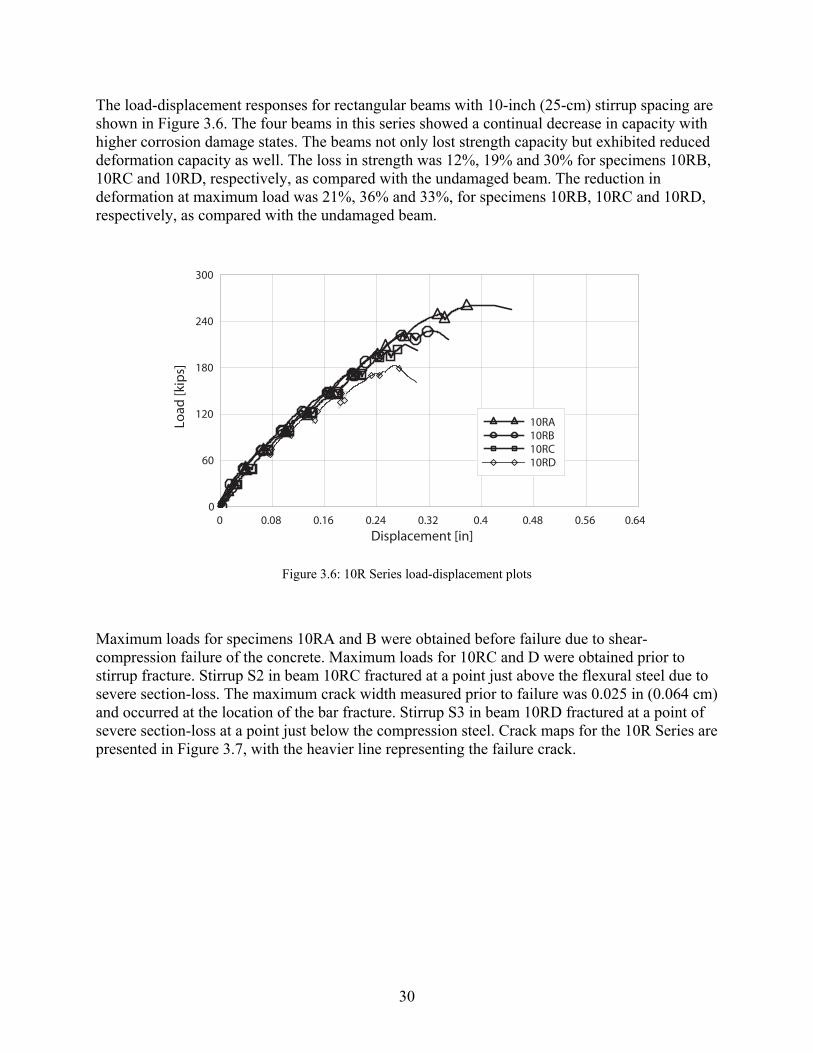
The load-displacement responses for rectangular beams with 10-inch (25-cm) stirrup spacing are shown in Figure 3.6. The four beams in this series showed a continual decrease in capacity with higher corrosion damage states. The beams not only lost strength capacity but exhibited reduced deformation capacity as well. The loss in strength was 12%, 19% and 30% for specimens 10RB, 10RC and 10RD, respectively, as compared with the undamaged beam. The reduction in deformation at maximum load was 21%, 36% and 33%, for specimens 10RB, 10RC and 10RD, respectively, as compared with the undamaged beam.
Displacement [in]
Load
[kip
s]
0 0.08 0.16 0.24 0.32 0.4 0.48 0.56 0.640
60
120
180
240
300
10RA10RB10RC10RD
Figure 3.6: 10R Series load-displacement plots
Maximum loads for specimens 10RA and B were obtained before failure due to shear-compression failure of the concrete. Maximum loads for 10RC and D were obtained prior to stirrup fracture. Stirrup S2 in beam 10RC fractured at a point just above the flexural steel due to severe section-loss. The maximum crack width measured prior to failure was 0.025 in (0.064 cm) and occurred at the location of the bar fracture. Stirrup S3 in beam 10RD fractured at a point of severe section-loss at a point just below the compression steel. Crack maps for the 10R Series are presented in Figure 3.7, with the heavier line representing the failure crack.
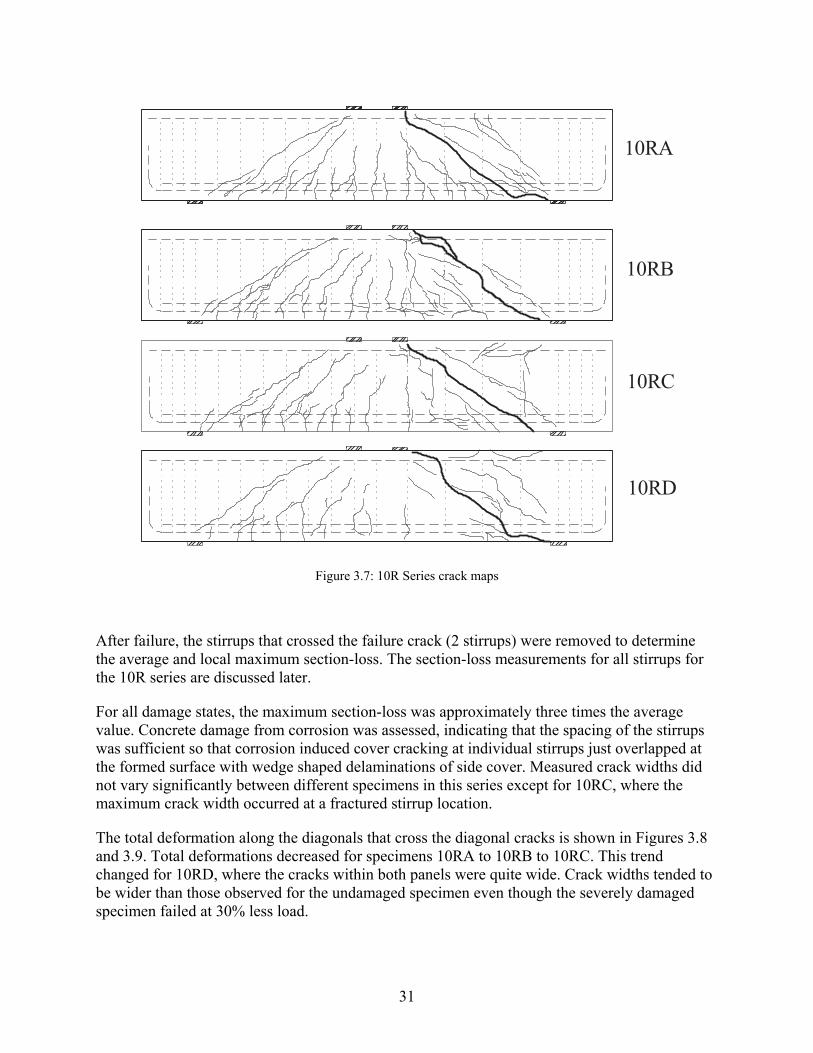
31
10RA
10RD
10RB
10RC
Figure 3.7: 10R Series crack maps
After failure, the stirrups that crossed the failure crack (2 stirrups) were removed to determine the average and local maximum section-loss. The section-loss measurements for all stirrups for the 10R series are discussed later.
For all damage states, the maximum section-loss was approximately three times the average value. Concrete damage from corrosion was assessed, indicating that the spacing of the stirrups was sufficient so that corrosion induced cover cracking at individual stirrups just overlapped at the formed surface with wedge shaped delaminations of side cover. Measured crack widths did not vary significantly between different specimens in this series except for 10RC, where the maximum crack width occurred at a fractured stirrup location.
The total deformation along the diagonals that cross the diagonal cracks is shown in Figures 3.8 and 3.9. Total deformations decreased for specimens 10RA to 10RB to 10RC. This trend changed for 10RD, where the cracks within both panels were quite wide. Crack widths tended to be wider than those observed for the undamaged specimen even though the severely damaged specimen failed at 30% less load.
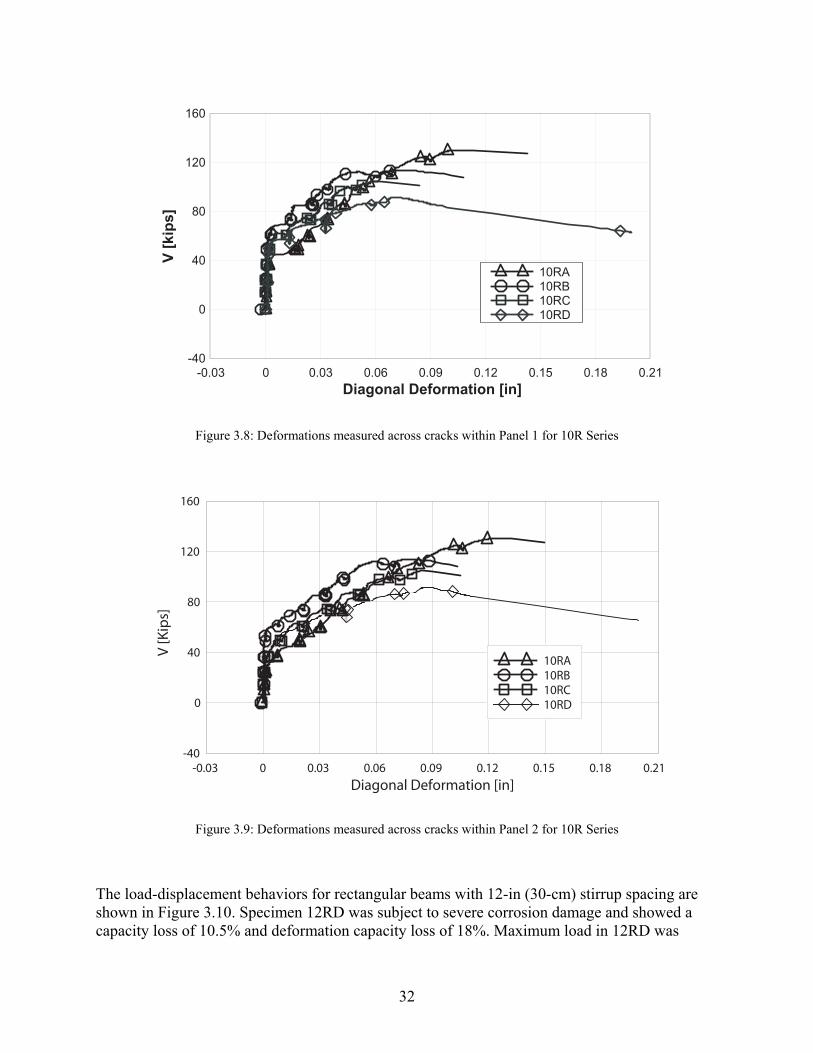
32
Diagonal Deformation [in]
V [
kip
s]
-0.03 0 0.03 0.06 0.09 0.12 0.15 0.18 0.21-40
0
40
80
120
160
10RA10RB10RC10RD
Figure 3.8: Deformations measured across cracks within Panel 1 for 10R Series
Diagonal Deformation [in]
V [K
ips]
-0.03 0 0.03 0.06 0.09 0.12 0.15 0.18 0.21-40
0
40
80
120
160
10RA10RB10RC10RD
Figure 3.9: Deformations measured across cracks within Panel 2 for 10R Series
The load-displacement behaviors for rectangular beams with 12-in (30-cm) stirrup spacing are shown in Figure 3.10. Specimen 12RD was subject to severe corrosion damage and showed a capacity loss of 10.5% and deformation capacity loss of 18%. Maximum load in 12RD was
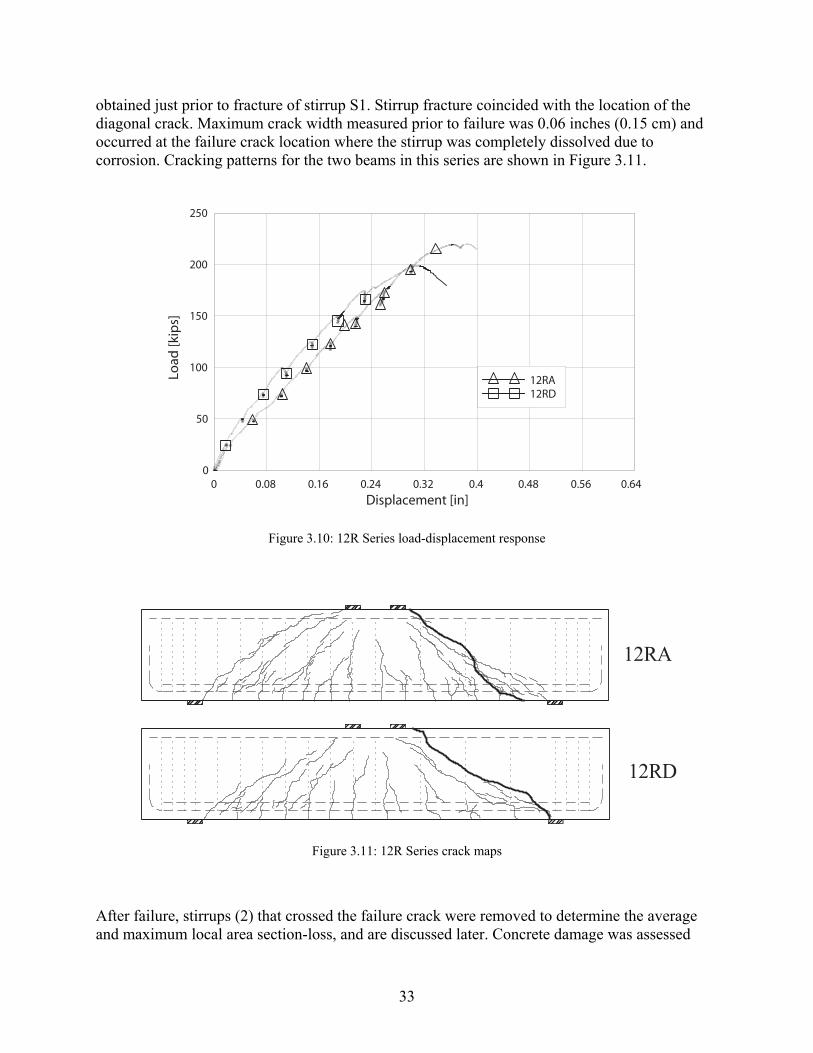
33
obtained just prior to fracture of stirrup S1. Stirrup fracture coincided with the location of the diagonal crack. Maximum crack width measured prior to failure was 0.06 inches (0.15 cm) and occurred at the failure crack location where the stirrup was completely dissolved due to corrosion. Cracking patterns for the two beams in this series are shown in Figure 3.11.
Displacement [in]
Load
[kip
s]
0 0.08 0.16 0.24 0.32 0.4 0.48 0.56 0.640
50
100
150
200
250
12RA12RD
Figure 3.10: 12R Series load-displacement response
12RA
12RD
Figure 3.11: 12R Series crack maps
After failure, stirrups (2) that crossed the failure crack were removed to determine the average and maximum local area section-loss, and are discussed later. Concrete damage was assessed
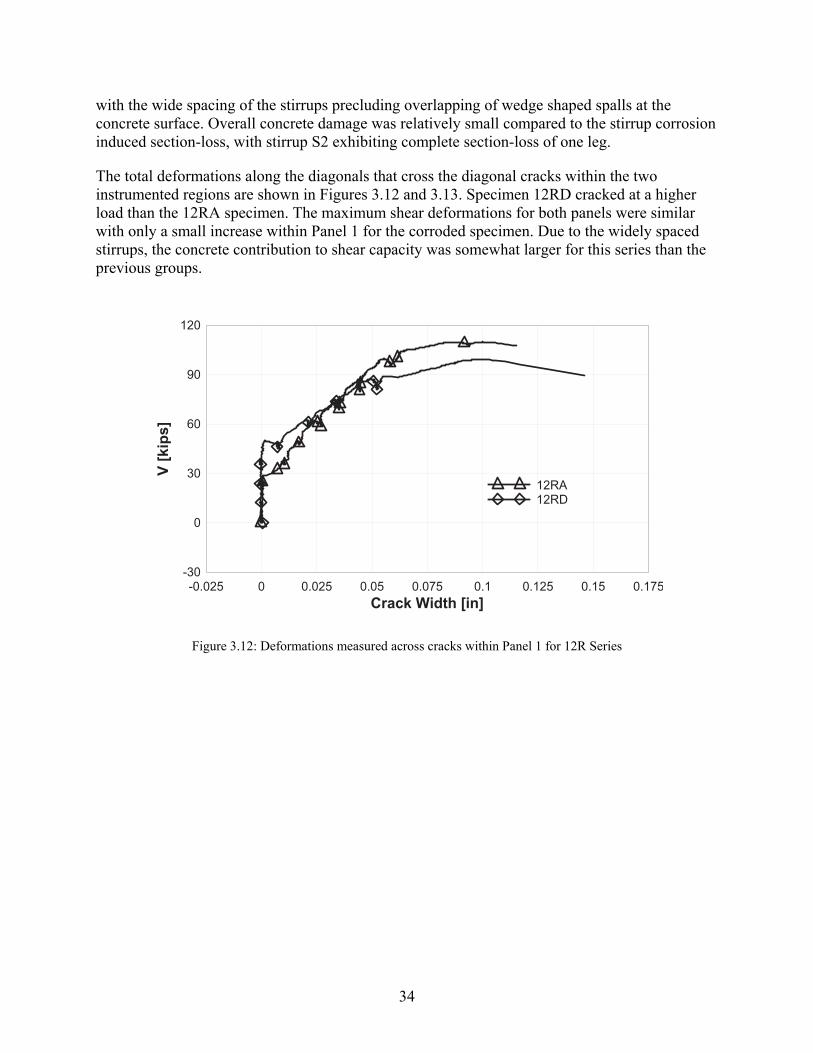
34
with the wide spacing of the stirrups precluding overlapping of wedge shaped spalls at the concrete surface. Overall concrete damage was relatively small compared to the stirrup corrosion induced section-loss, with stirrup S2 exhibiting complete section-loss of one leg.
The total deformations along the diagonals that cross the diagonal cracks within the two instrumented regions are shown in Figures 3.12 and 3.13. Specimen 12RD cracked at a higher load than the 12RA specimen. The maximum shear deformations for both panels were similar with only a small increase within Panel 1 for the corroded specimen. Due to the widely spaced stirrups, the concrete contribution to shear capacity was somewhat larger for this series than the previous groups.
Crack Width [in]
V [
kip
s]
-0.025 0 0.025 0.05 0.075 0.1 0.125 0.15 0.175-30
0
30
60
90
120
12RA12RD
Figure 3.12: Deformations measured across cracks within Panel 1 for 12R Series
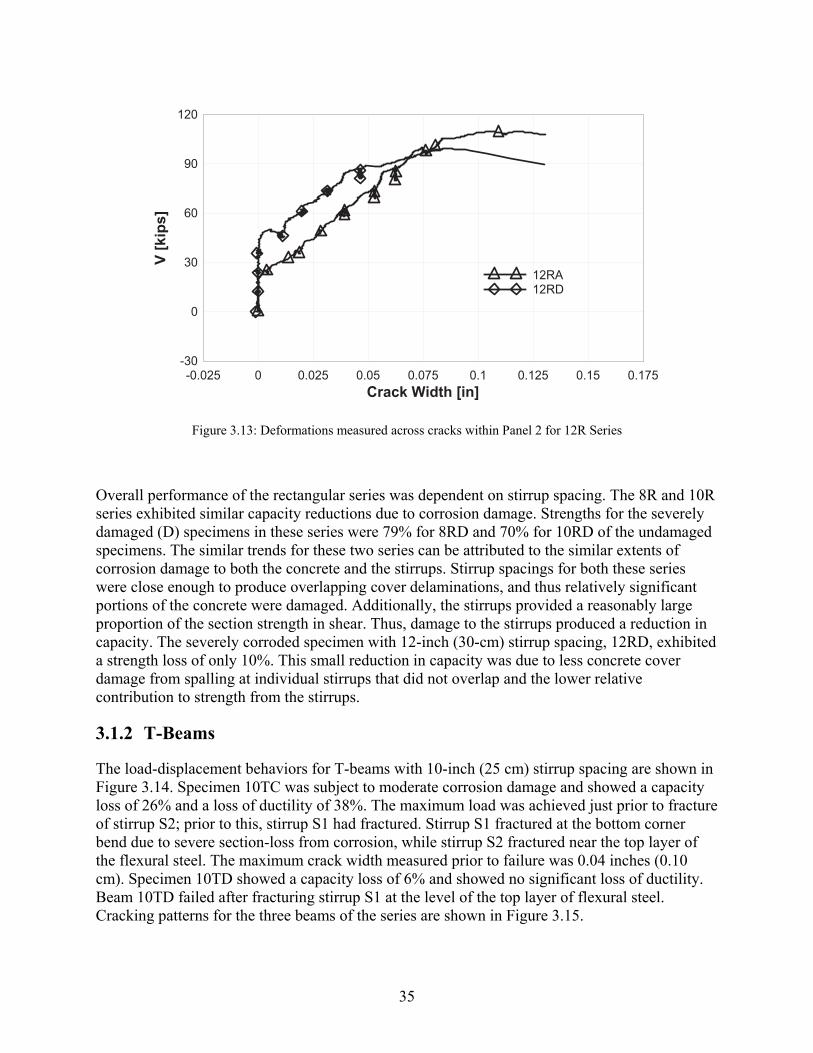
35
Crack Width [in]
V [
kip
s]
-0.025 0 0.025 0.05 0.075 0.1 0.125 0.15 0.175-30
0
30
60
90
120
12RA12RD
Figure 3.13: Deformations measured across cracks within Panel 2 for 12R Series
Overall performance of the rectangular series was dependent on stirrup spacing. The 8R and 10R series exhibited similar capacity reductions due to corrosion damage. Strengths for the severely damaged (D) specimens in these series were 79% for 8RD and 70% for 10RD of the undamaged specimens. The similar trends for these two series can be attributed to the similar extents of corrosion damage to both the concrete and the stirrups. Stirrup spacings for both these series were close enough to produce overlapping cover delaminations, and thus relatively significant portions of the concrete were damaged. Additionally, the stirrups provided a reasonably large proportion of the section strength in shear. Thus, damage to the stirrups produced a reduction in capacity. The severely corroded specimen with 12-inch (30-cm) stirrup spacing, 12RD, exhibited a strength loss of only 10%. This small reduction in capacity was due to less concrete cover damage from spalling at individual stirrups that did not overlap and the lower relative contribution to strength from the stirrups.
3.1.2 T-Beams
The load-displacement behaviors for T-beams with 10-inch (25 cm) stirrup spacing are shown in Figure 3.14. Specimen 10TC was subject to moderate corrosion damage and showed a capacity loss of 26% and a loss of ductility of 38%. The maximum load was achieved just prior to fracture of stirrup S2; prior to this, stirrup S1 had fractured. Stirrup S1 fractured at the bottom corner bend due to severe section-loss from corrosion, while stirrup S2 fractured near the top layer of the flexural steel. The maximum crack width measured prior to failure was 0.04 inches (0.10 cm). Specimen 10TD showed a capacity loss of 6% and showed no significant loss of ductility. Beam 10TD failed after fracturing stirrup S1 at the level of the top layer of flexural steel. Cracking patterns for the three beams of the series are shown in Figure 3.15.
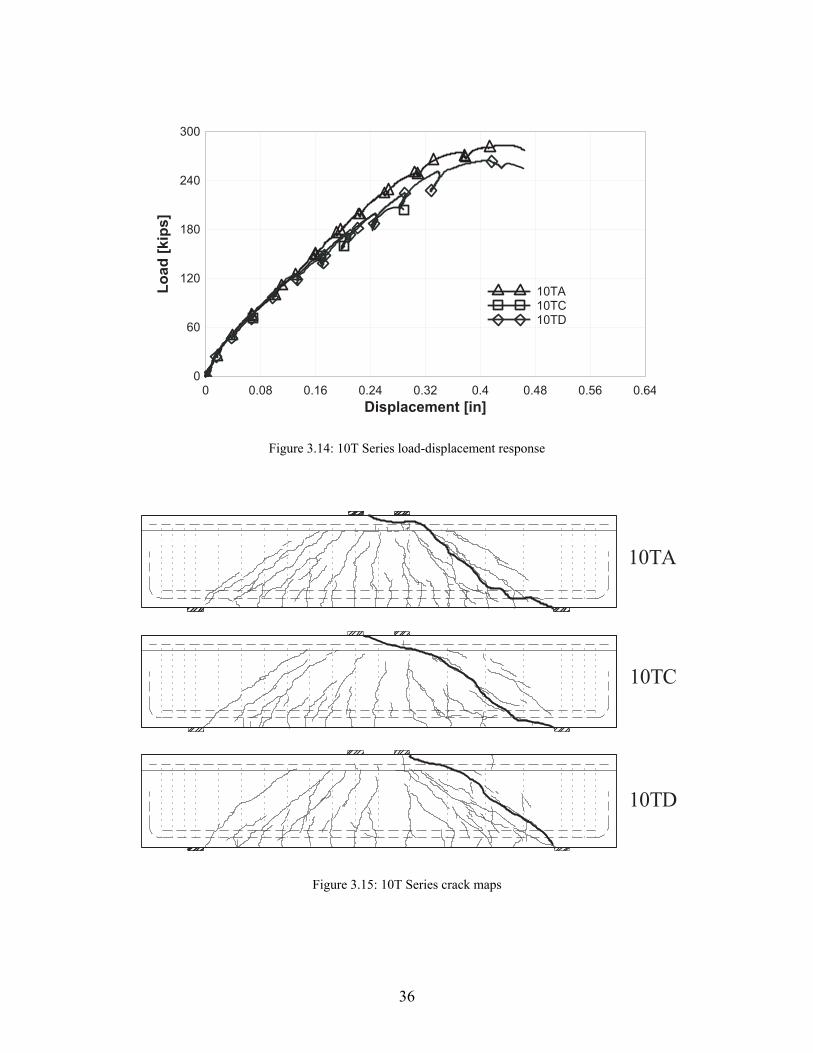
36
Displacement [in]
Lo
ad
[k
ips
]
0 0.08 0.16 0.24 0.32 0.4 0.48 0.56 0.640
60
120
180
240
300
10TA10TC10TD
Figure 3.14: 10T Series load-displacement response
10TA
10TC
10TD
Figure 3.15: 10T Series crack maps
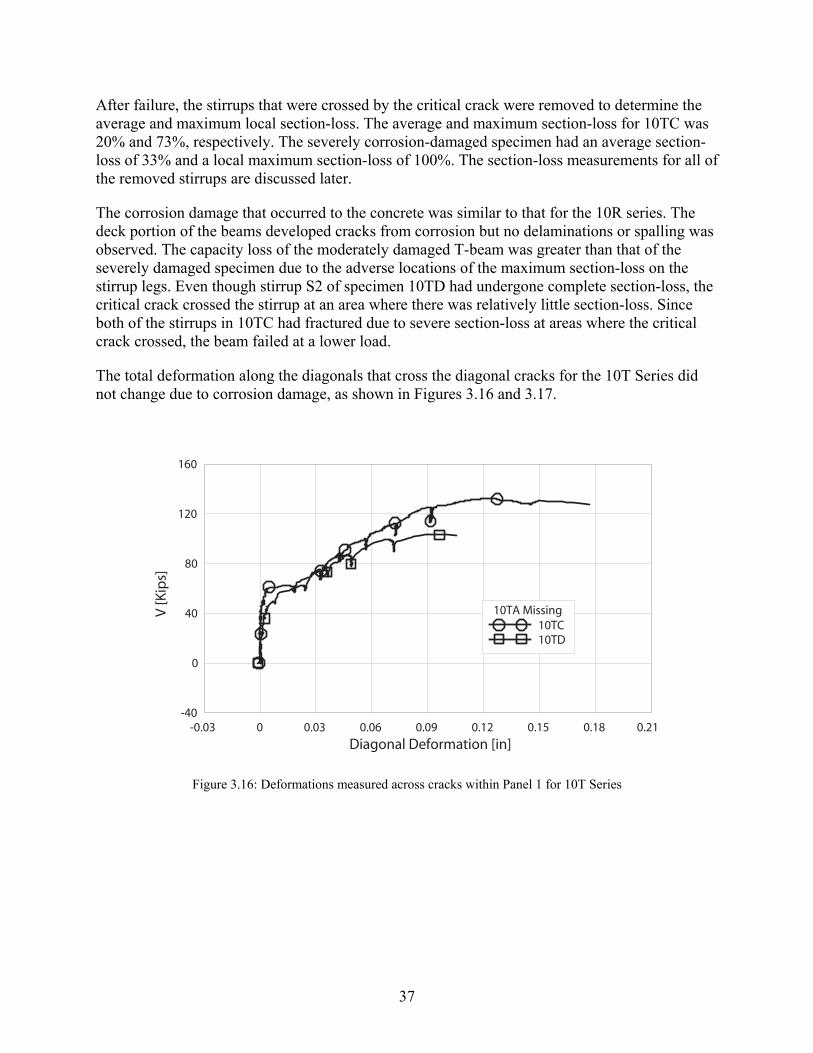
37
After failure, the stirrups that were crossed by the critical crack were removed to determine the average and maximum local section-loss. The average and maximum section-loss for 10TC was 20% and 73%, respectively. The severely corrosion-damaged specimen had an average section-loss of 33% and a local maximum section-loss of 100%. The section-loss measurements for all of the removed stirrups are discussed later.
The corrosion damage that occurred to the concrete was similar to that for the 10R series. The deck portion of the beams developed cracks from corrosion but no delaminations or spalling was observed. The capacity loss of the moderately damaged T-beam was greater than that of the severely damaged specimen due to the adverse locations of the maximum section-loss on the stirrup legs. Even though stirrup S2 of specimen 10TD had undergone complete section-loss, the critical crack crossed the stirrup at an area where there was relatively little section-loss. Since both of the stirrups in 10TC had fractured due to severe section-loss at areas where the critical crack crossed, the beam failed at a lower load.
The total deformation along the diagonals that cross the diagonal cracks for the 10T Series did not change due to corrosion damage, as shown in Figures 3.16 and 3.17.
Diagonal Deformation [in]
V [K
ips]
-0.03 0 0.03 0.06 0.09 0.12 0.15 0.18 0.21-40
0
40
80
120
160
10TC10TD
10TA Missing
Figure 3.16: Deformations measured across cracks within Panel 1 for 10T Series
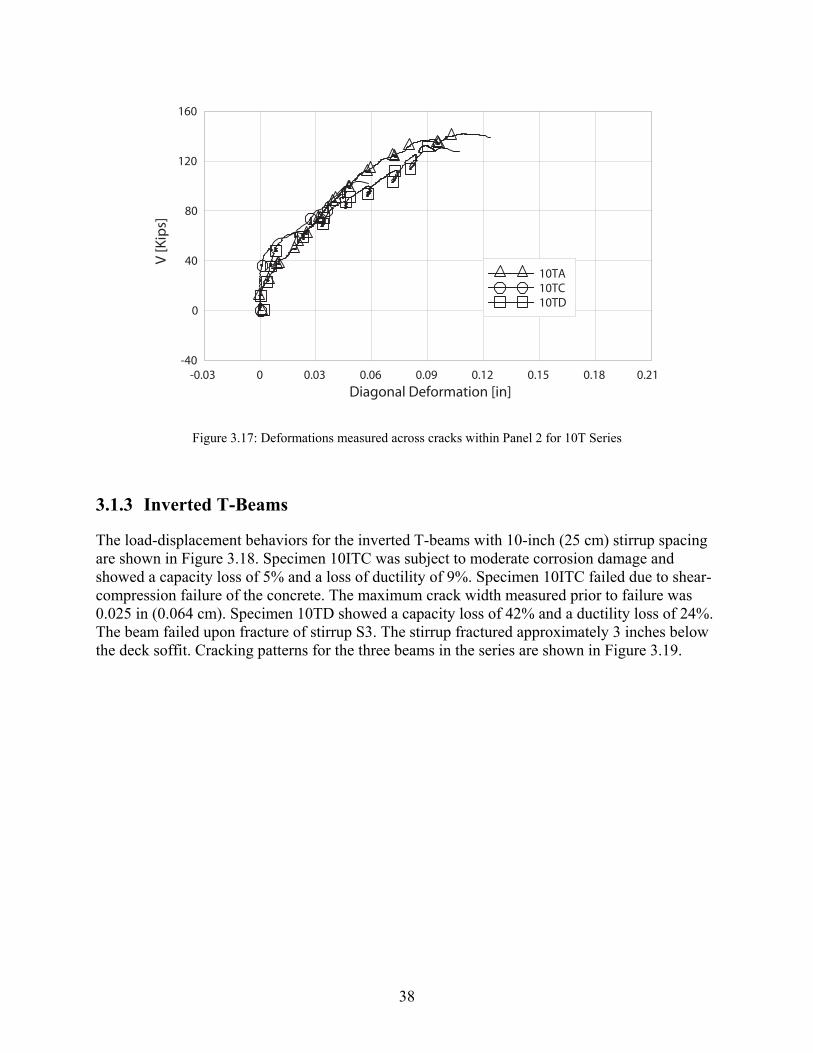
38
Diagonal Deformation [in]
V [K
ips]
-0.03 0 0.03 0.06 0.09 0.12 0.15 0.18 0.21-40
0
40
80
120
160
10TA10TC10TD
Figure 3.17: Deformations measured across cracks within Panel 2 for 10T Series
3.1.3 Inverted T-Beams
The load-displacement behaviors for the inverted T-beams with 10-inch (25 cm) stirrup spacing are shown in Figure 3.18. Specimen 10ITC was subject to moderate corrosion damage and showed a capacity loss of 5% and a loss of ductility of 9%. Specimen 10ITC failed due to shear-compression failure of the concrete. The maximum crack width measured prior to failure was 0.025 in (0.064 cm). Specimen 10TD showed a capacity loss of 42% and a ductility loss of 24%. The beam failed upon fracture of stirrup S3. The stirrup fractured approximately 3 inches below the deck soffit. Cracking patterns for the three beams in the series are shown in Figure 3.19.
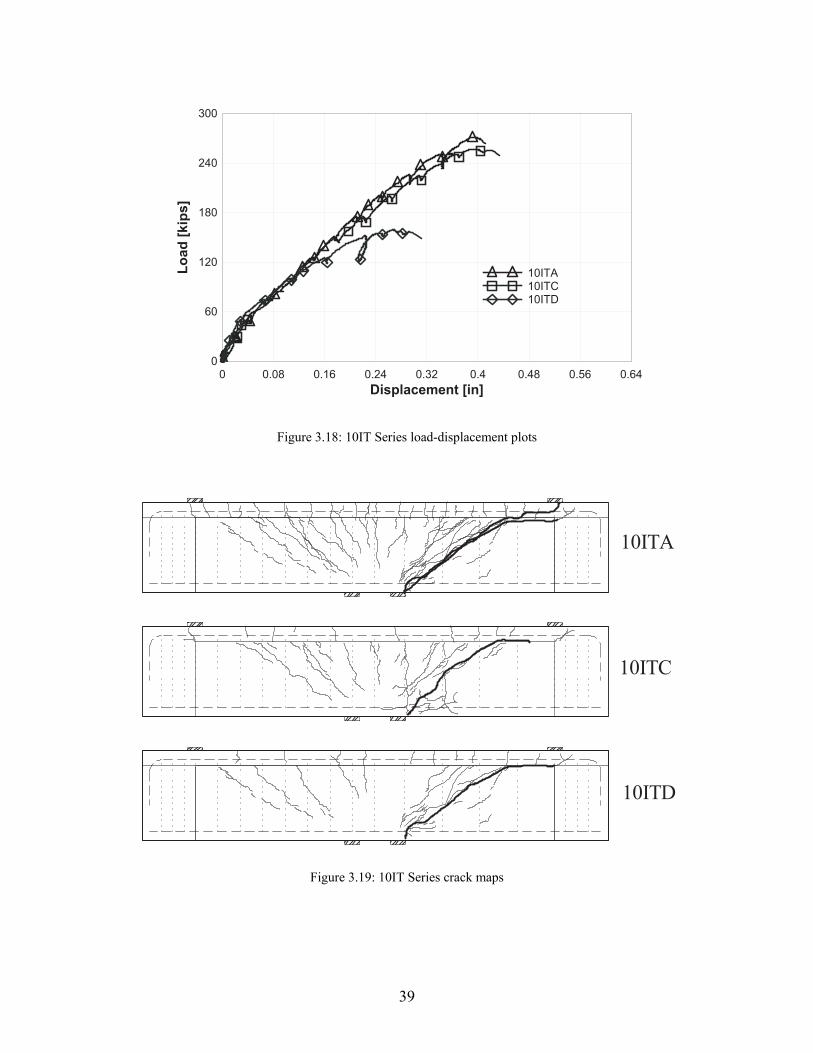
39
Displacement [in]
Lo
ad
[kip
s]
0 0.08 0.16 0.24 0.32 0.4 0.48 0.56 0.640
60
120
180
240
300
10ITA10ITC10ITD
Figure 3.18: 10IT Series load-displacement plots
10ITA
10ITC
10ITD
Figure 3.19: 10IT Series crack maps
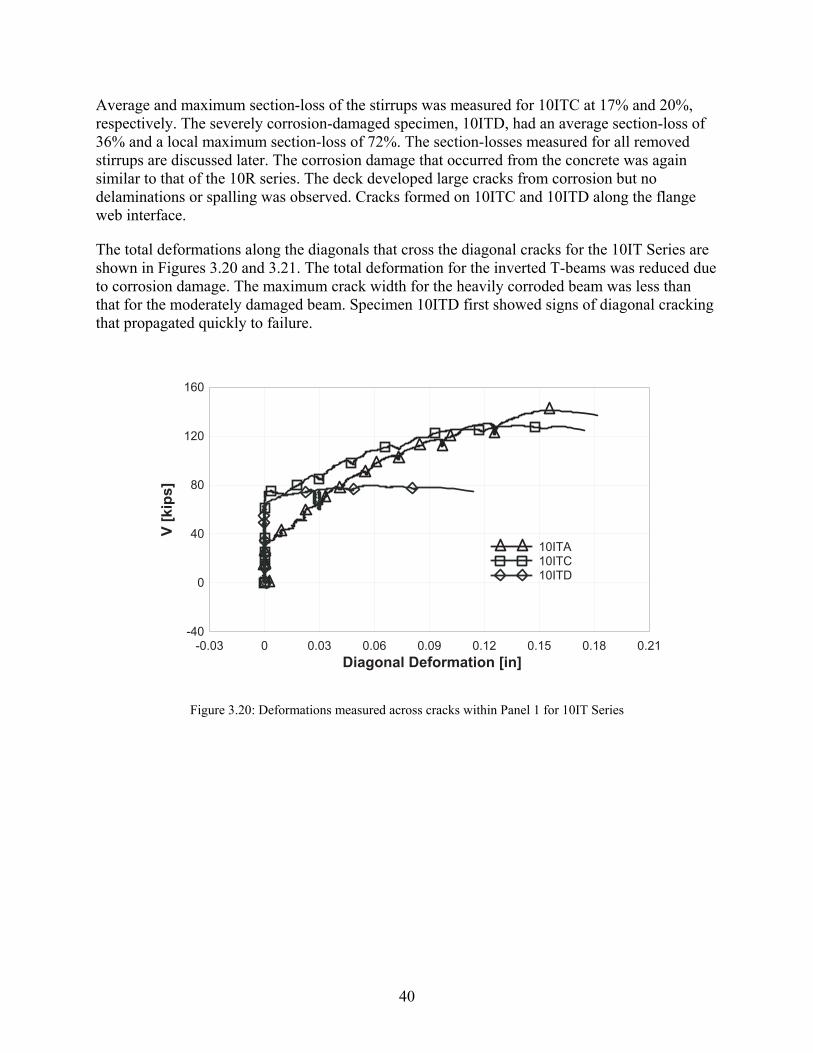
40
Average and maximum section-loss of the stirrups was measured for 10ITC at 17% and 20%, respectively. The severely corrosion-damaged specimen, 10ITD, had an average section-loss of 36% and a local maximum section-loss of 72%. The section-losses measured for all removed stirrups are discussed later. The corrosion damage that occurred from the concrete was again similar to that of the 10R series. The deck developed large cracks from corrosion but no delaminations or spalling was observed. Cracks formed on 10ITC and 10ITD along the flange web interface.
The total deformations along the diagonals that cross the diagonal cracks for the 10IT Series are shown in Figures 3.20 and 3.21. The total deformation for the inverted T-beams was reduced due to corrosion damage. The maximum crack width for the heavily corroded beam was less than that for the moderately damaged beam. Specimen 10ITD first showed signs of diagonal cracking that propagated quickly to failure.
Diagonal Deformation [in]
V [
kip
s]
-0.03 0 0.03 0.06 0.09 0.12 0.15 0.18 0.21-40
0
40
80
120
160
10ITA10ITC10ITD
Figure 3.20: Deformations measured across cracks within Panel 1 for 10IT Series
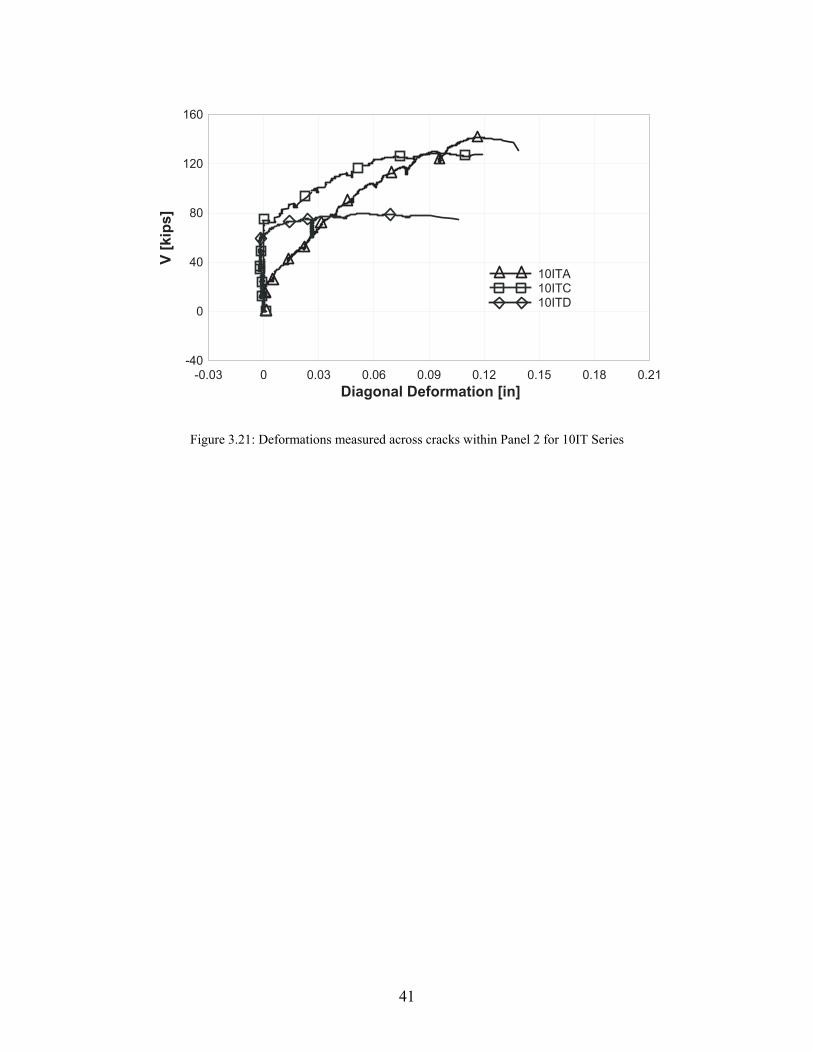
41
Diagonal Deformation [in]
V [
kip
s]
-0.03 0 0.03 0.06 0.09 0.12 0.15 0.18 0.21-40
0
40
80
120
160
10ITA10ITC10ITD
Figure 3.21: Deformations measured across cracks within Panel 2 for 10IT Series

42
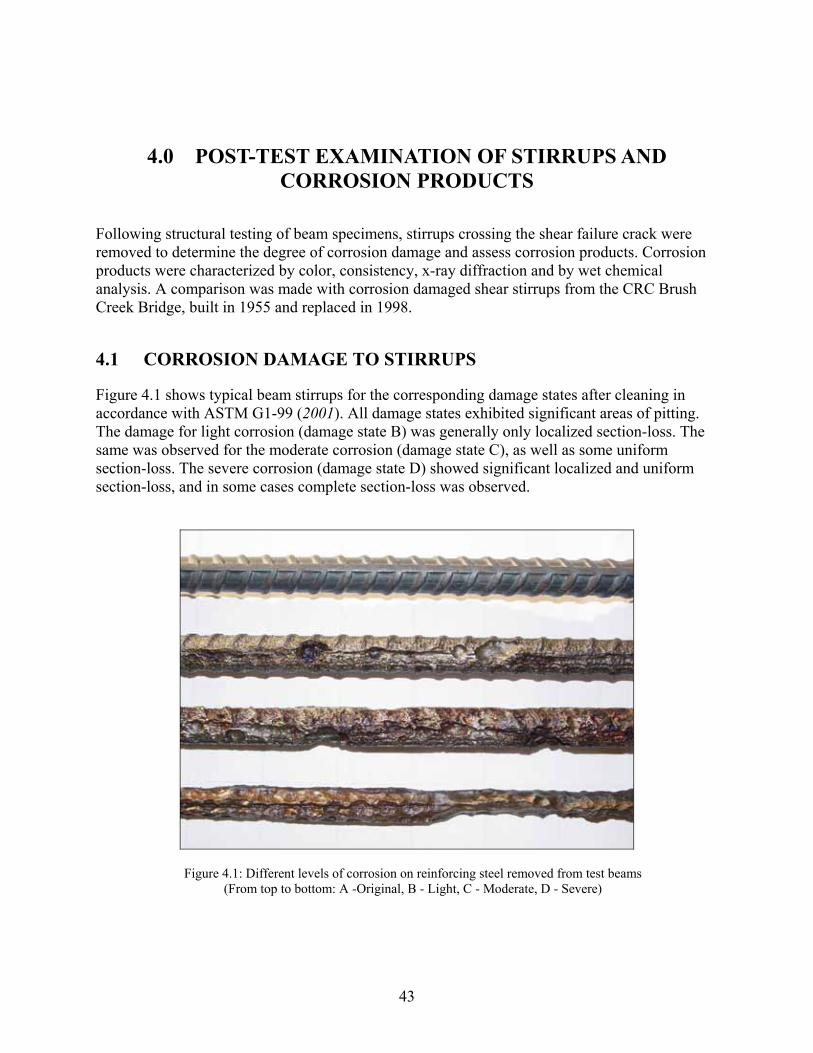
43
4.0 POST-TEST EXAMINATION OF STIRRUPS AND CORROSION PRODUCTS
Following structural testing of beam specimens, stirrups crossing the shear failure crack were removed to determine the degree of corrosion damage and assess corrosion products. Corrosion products were characterized by color, consistency, x-ray diffraction and by wet chemical analysis. A comparison was made with corrosion damaged shear stirrups from the CRC Brush Creek Bridge, built in 1955 and replaced in 1998.
4.1 CORROSION DAMAGE TO STIRRUPS
Figure 4.1 shows typical beam stirrups for the corresponding damage states after cleaning in accordance with ASTM G1-99 (2001). All damage states exhibited significant areas of pitting. The damage for light corrosion (damage state B) was generally only localized section-loss. The same was observed for the moderate corrosion (damage state C), as well as some uniform section-loss. The severe corrosion (damage state D) showed significant localized and uniform section-loss, and in some cases complete section-loss was observed.
Figure 4.1: Different levels of corrosion on reinforcing steel removed from test beams (From top to bottom: A -Original, B - Light, C - Moderate, D - Severe)
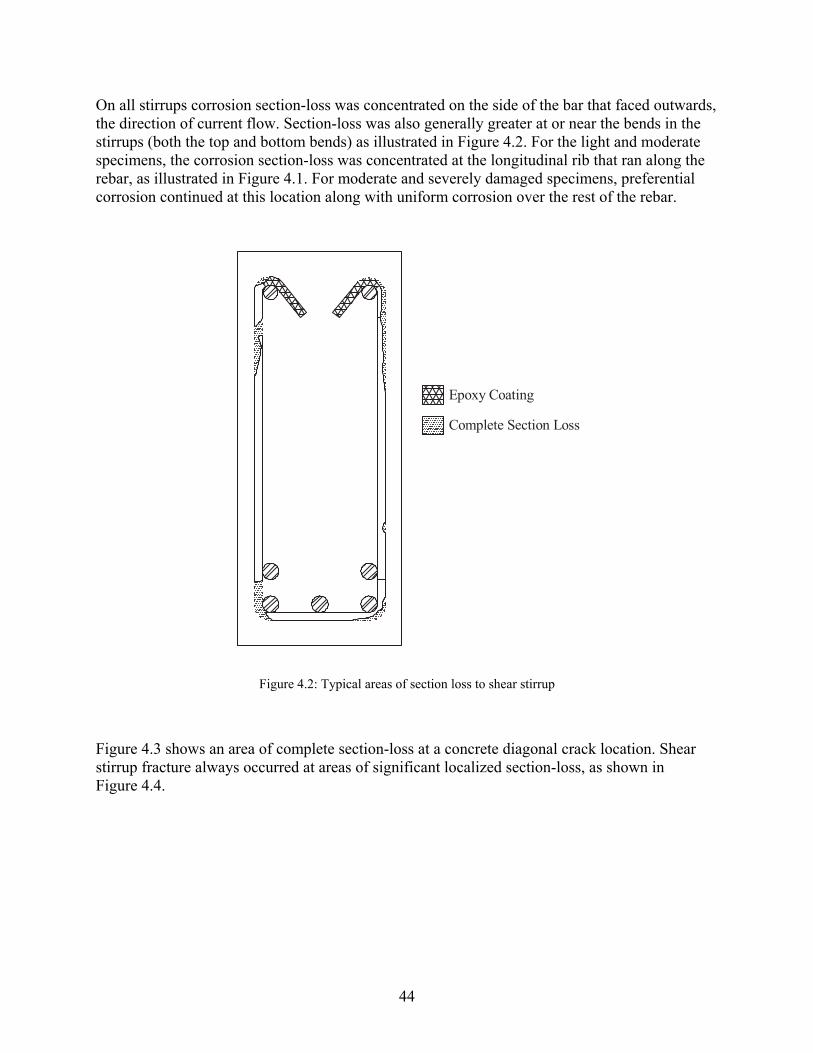
44
On all stirrups corrosion section-loss was concentrated on the side of the bar that faced outwards, the direction of current flow. Section-loss was also generally greater at or near the bends in the stirrups (both the top and bottom bends) as illustrated in Figure 4.2. For the light and moderate specimens, the corrosion section-loss was concentrated at the longitudinal rib that ran along the rebar, as illustrated in Figure 4.1. For moderate and severely damaged specimens, preferential corrosion continued at this location along with uniform corrosion over the rest of the rebar.
Epoxy Coating
Complete Section Loss
Figure 4.2: Typical areas of section loss to shear stirrup
Figure 4.3 shows an area of complete section-loss at a concrete diagonal crack location. Shear stirrup fracture always occurred at areas of significant localized section-loss, as shown in Figure 4.4.
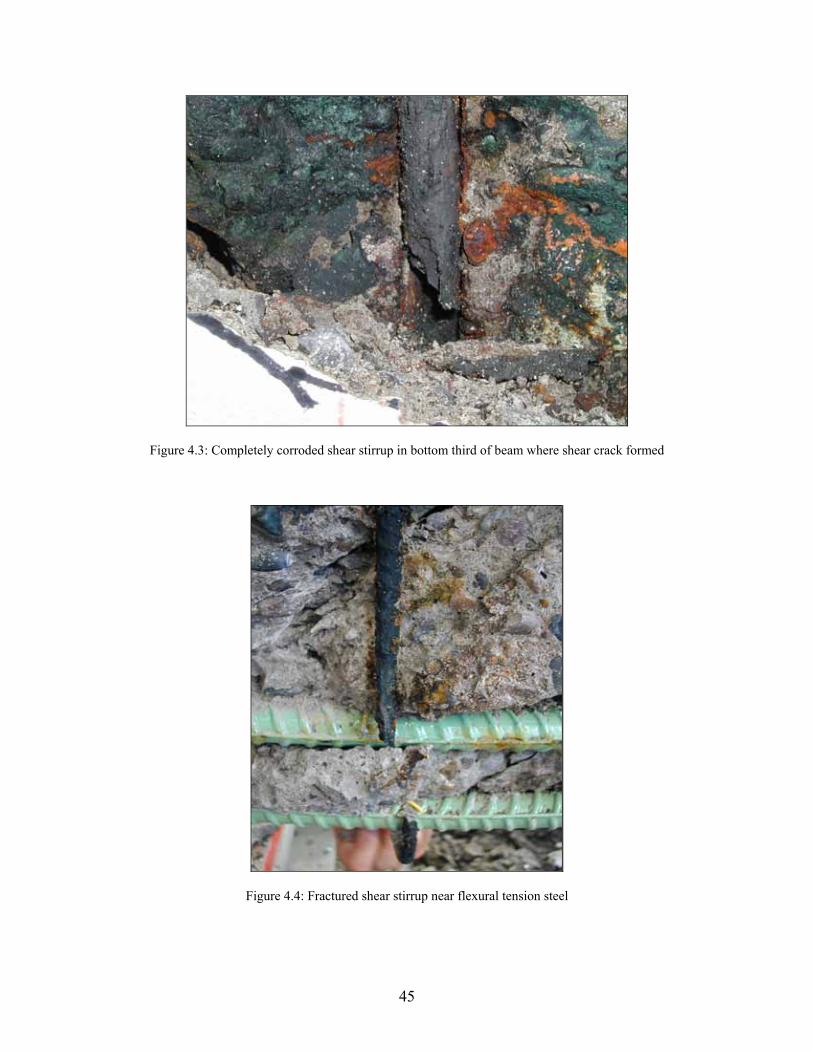
45
Figure 4.3: Completely corroded shear stirrup in bottom third of beam where shear crack formed
Figure 4.4: Fractured shear stirrup near flexural tension steel
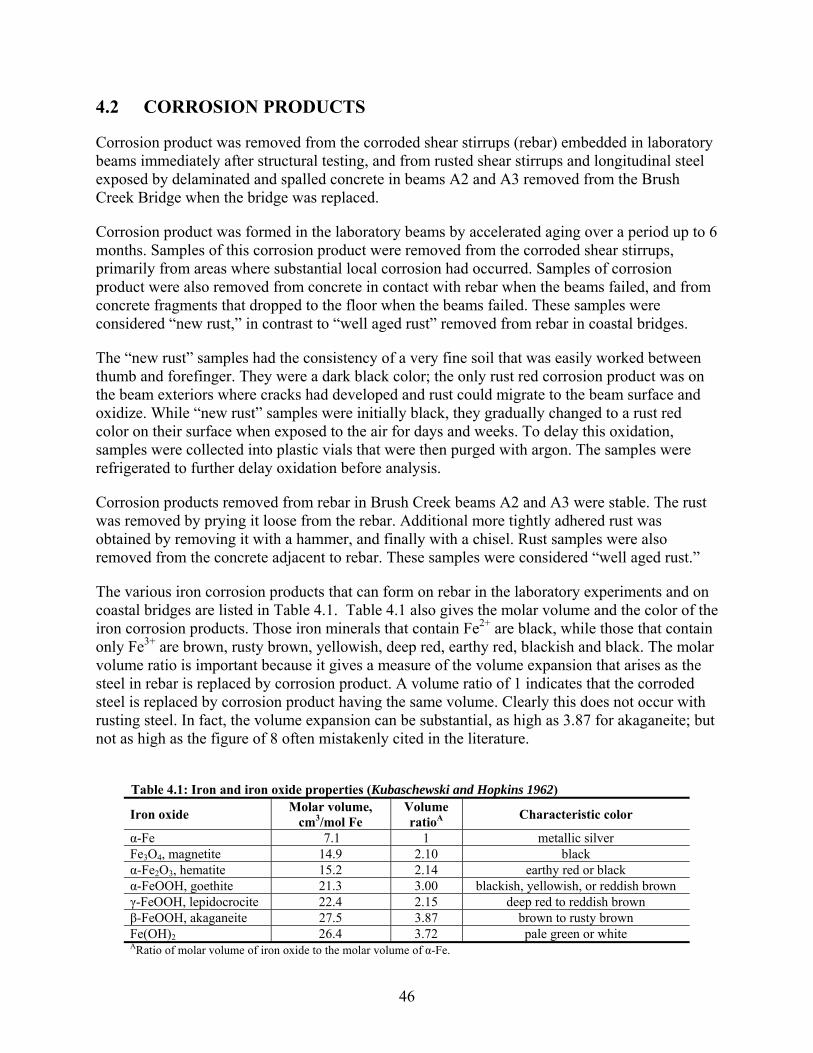
46
4.2 CORROSION PRODUCTS
Corrosion product was removed from the corroded shear stirrups (rebar) embedded in laboratory beams immediately after structural testing, and from rusted shear stirrups and longitudinal steel exposed by delaminated and spalled concrete in beams A2 and A3 removed from the Brush Creek Bridge when the bridge was replaced.
Corrosion product was formed in the laboratory beams by accelerated aging over a period up to 6 months. Samples of this corrosion product were removed from the corroded shear stirrups, primarily from areas where substantial local corrosion had occurred. Samples of corrosion product were also removed from concrete in contact with rebar when the beams failed, and from concrete fragments that dropped to the floor when the beams failed. These samples were considered “new rust,” in contrast to “well aged rust” removed from rebar in coastal bridges.
The “new rust” samples had the consistency of a very fine soil that was easily worked between thumb and forefinger. They were a dark black color; the only rust red corrosion product was on the beam exteriors where cracks had developed and rust could migrate to the beam surface and oxidize. While “new rust” samples were initially black, they gradually changed to a rust red color on their surface when exposed to the air for days and weeks. To delay this oxidation, samples were collected into plastic vials that were then purged with argon. The samples were refrigerated to further delay oxidation before analysis.
Corrosion products removed from rebar in Brush Creek beams A2 and A3 were stable. The rust was removed by prying it loose from the rebar. Additional more tightly adhered rust was obtained by removing it with a hammer, and finally with a chisel. Rust samples were also removed from the concrete adjacent to rebar. These samples were considered “well aged rust.”
The various iron corrosion products that can form on rebar in the laboratory experiments and on coastal bridges are listed in Table 4.1. Table 4.1 also gives the molar volume and the color of the iron corrosion products. Those iron minerals that contain Fe2+ are black, while those that contain only Fe3+ are brown, rusty brown, yellowish, deep red, earthy red, blackish and black. The molar volume ratio is important because it gives a measure of the volume expansion that arises as the steel in rebar is replaced by corrosion product. A volume ratio of 1 indicates that the corroded steel is replaced by corrosion product having the same volume. Clearly this does not occur with rusting steel. In fact, the volume expansion can be substantial, as high as 3.87 for akaganeite; but not as high as the figure of 8 often mistakenly cited in the literature.
Table 4.1: Iron and iron oxide properties (Kubaschewski and Hopkins 1962)
Iron oxide Molar volume, cm3/mol Fe
Volume ratioA Characteristic color
α-Fe 7.1 1 metallic silver Fe3O4, magnetite 14.9 2.10 black α-Fe2O3, hematite 15.2 2.14 earthy red or black α-FeOOH, goethite 21.3 3.00 blackish, yellowish, or reddish brown γ-FeOOH, lepidocrocite 22.4 2.15 deep red to reddish brown β-FeOOH, akaganeite 27.5 3.87 brown to rusty brown Fe(OH)2 26.4 3.72 pale green or white ARatio of molar volume of iron oxide to the molar volume of α-Fe.
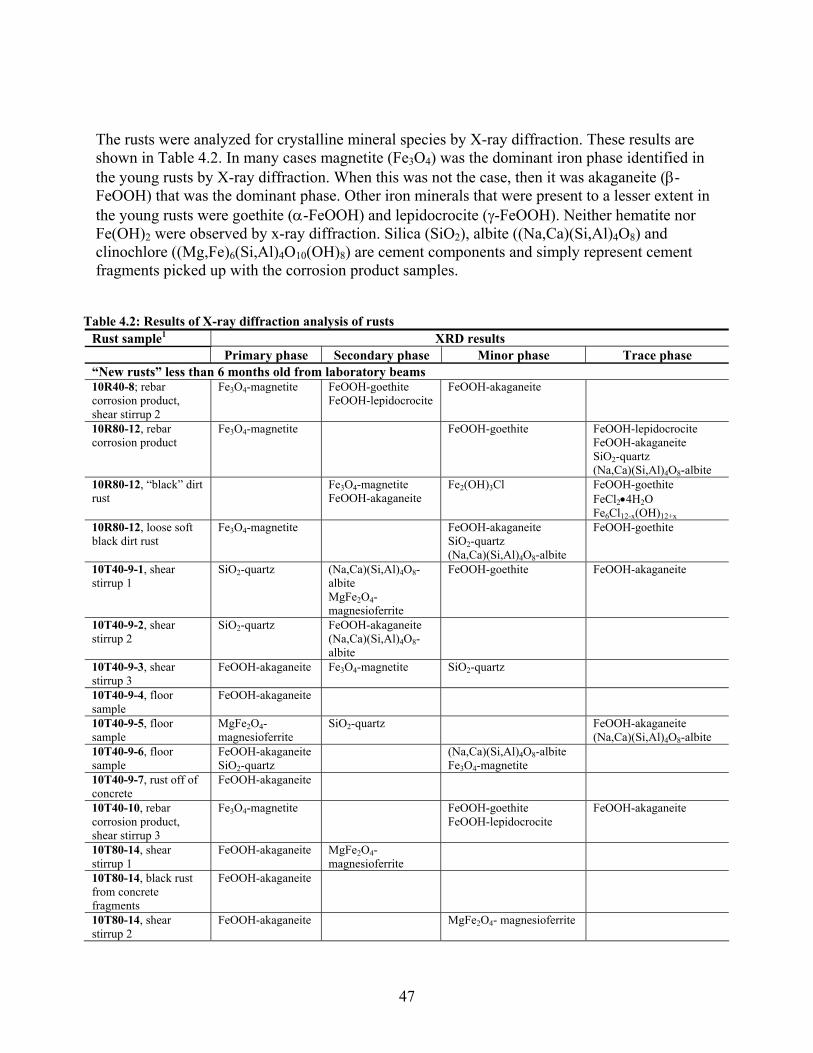
47
The rusts were analyzed for crystalline mineral species by X-ray diffraction. These results are shown in Table 4.2. In many cases magnetite (Fe3O4) was the dominant iron phase identified in the young rusts by X-ray diffraction. When this was not the case, then it was akaganeite (β-FeOOH) that was the dominant phase. Other iron minerals that were present to a lesser extent in the young rusts were goethite (α-FeOOH) and lepidocrocite (γ-FeOOH). Neither hematite nor Fe(OH)2 were observed by x-ray diffraction. Silica (SiO2), albite ((Na,Ca)(Si,Al)4O8) and clinochlore ((Mg,Fe)6(Si,Al)4O10(OH)8) are cement components and simply represent cement fragments picked up with the corrosion product samples.
Table 4.2: Results of X-ray diffraction analysis of rusts
Rust sample1 XRD results Primary phase Secondary phase Minor phase Trace phase “New rusts” less than 6 months old from laboratory beams 10R40-8; rebar corrosion product, shear stirrup 2
Fe3O4-magnetite FeOOH-goethite FeOOH-lepidocrocite
FeOOH-akaganeite
10R80-12, rebar corrosion product
Fe3O4-magnetite FeOOH-goethite
FeOOH-lepidocrocite FeOOH-akaganeite SiO2-quartz (Na,Ca)(Si,Al)4O8-albite
10R80-12, “black” dirt rust
Fe3O4-magnetite FeOOH-akaganeite
Fe2(OH)3Cl FeOOH-goethite FeCl2•4H2O Fe6Cl12-x(OH)12+x
10R80-12, loose soft black dirt rust
Fe3O4-magnetite FeOOH-akaganeite SiO2-quartz (Na,Ca)(Si,Al)4O8-albite
FeOOH-goethite
10T40-9-1, shear stirrup 1
SiO2-quartz (Na,Ca)(Si,Al)4O8-albite MgFe2O4- magnesioferrite
FeOOH-goethite FeOOH-akaganeite
10T40-9-2, shear stirrup 2
SiO2-quartz FeOOH-akaganeite (Na,Ca)(Si,Al)4O8-albite
10T40-9-3, shear stirrup 3
FeOOH-akaganeite Fe3O4-magnetite SiO2-quartz
10T40-9-4, floor sample
FeOOH-akaganeite
10T40-9-5, floor sample
MgFe2O4- magnesioferrite
SiO2-quartz FeOOH-akaganeite (Na,Ca)(Si,Al)4O8-albite
10T40-9-6, floor sample
FeOOH-akaganeite SiO2-quartz
(Na,Ca)(Si,Al)4O8-albite Fe3O4-magnetite
10T40-9-7, rust off of concrete
FeOOH-akaganeite
10T40-10, rebar corrosion product, shear stirrup 3
Fe3O4-magnetite FeOOH-goethite FeOOH-lepidocrocite
FeOOH-akaganeite
10T80-14, shear stirrup 1
FeOOH-akaganeite MgFe2O4- magnesioferrite
10T80-14, black rust from concrete fragments
FeOOH-akaganeite
10T80-14, shear stirrup 2
FeOOH-akaganeite MgFe2O4- magnesioferrite
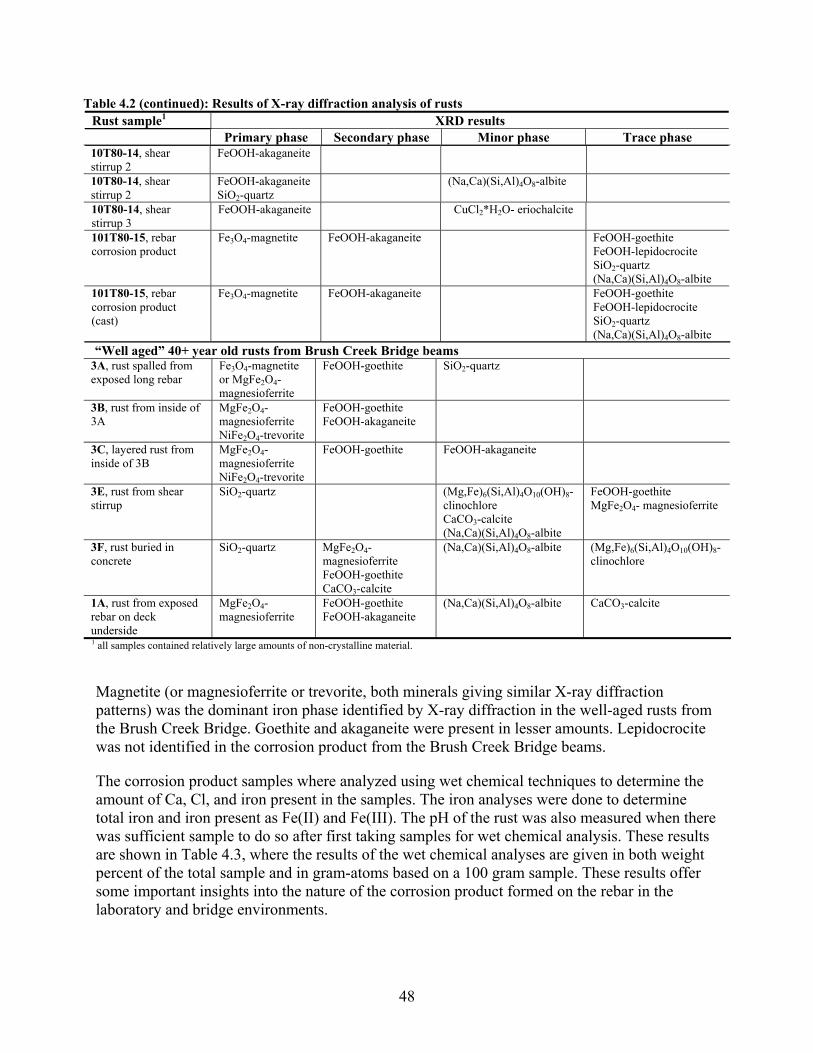
48
Table 4.2 (continued): Results of X-ray diffraction analysis of rusts Rust sample1 XRD results Primary phase Secondary phase Minor phase Trace phase 10T80-14, shear stirrup 2
FeOOH-akaganeite
10T80-14, shear stirrup 2
FeOOH-akaganeite SiO2-quartz
(Na,Ca)(Si,Al)4O8-albite
10T80-14, shear stirrup 3
FeOOH-akaganeite CuCl2*H2O- eriochalcite
101T80-15, rebar corrosion product
Fe3O4-magnetite FeOOH-akaganeite FeOOH-goethite FeOOH-lepidocrocite SiO2-quartz (Na,Ca)(Si,Al)4O8-albite
101T80-15, rebar corrosion product (cast)
Fe3O4-magnetite FeOOH-akaganeite FeOOH-goethite FeOOH-lepidocrocite SiO2-quartz (Na,Ca)(Si,Al)4O8-albite
“Well aged” 40+ year old rusts from Brush Creek Bridge beams 3A, rust spalled from exposed long rebar
Fe3O4-magnetite or MgFe2O4- magnesioferrite
FeOOH-goethite SiO2-quartz
3B, rust from inside of 3A
MgFe2O4- magnesioferrite NiFe2O4-trevorite
FeOOH-goethite FeOOH-akaganeite
3C, layered rust from inside of 3B
MgFe2O4- magnesioferrite NiFe2O4-trevorite
FeOOH-goethite FeOOH-akaganeite
3E, rust from shear stirrup
SiO2-quartz (Mg,Fe)6(Si,Al)4O10(OH)8- clinochlore CaCO3-calcite (Na,Ca)(Si,Al)4O8-albite
FeOOH-goethite MgFe2O4- magnesioferrite
3F, rust buried in concrete
SiO2-quartz MgFe2O4- magnesioferrite FeOOH-goethite CaCO3-calcite
(Na,Ca)(Si,Al)4O8-albite (Mg,Fe)6(Si,Al)4O10(OH)8- clinochlore
1A, rust from exposed rebar on deck underside
MgFe2O4- magnesioferrite
FeOOH-goethite FeOOH-akaganeite
(Na,Ca)(Si,Al)4O8-albite CaCO3-calcite
1 all samples contained relatively large amounts of non-crystalline material.
Magnetite (or magnesioferrite or trevorite, both minerals giving similar X-ray diffraction patterns) was the dominant iron phase identified by X-ray diffraction in the well-aged rusts from the Brush Creek Bridge. Goethite and akaganeite were present in lesser amounts. Lepidocrocite was not identified in the corrosion product from the Brush Creek Bridge beams.
The corrosion product samples where analyzed using wet chemical techniques to determine the amount of Ca, Cl, and iron present in the samples. The iron analyses were done to determine total iron and iron present as Fe(II) and Fe(III). The pH of the rust was also measured when there was sufficient sample to do so after first taking samples for wet chemical analysis. These results are shown in Table 4.3, where the results of the wet chemical analyses are given in both weight percent of the total sample and in gram-atoms based on a 100 gram sample. These results offer some important insights into the nature of the corrosion product formed on the rebar in the laboratory and bridge environments.
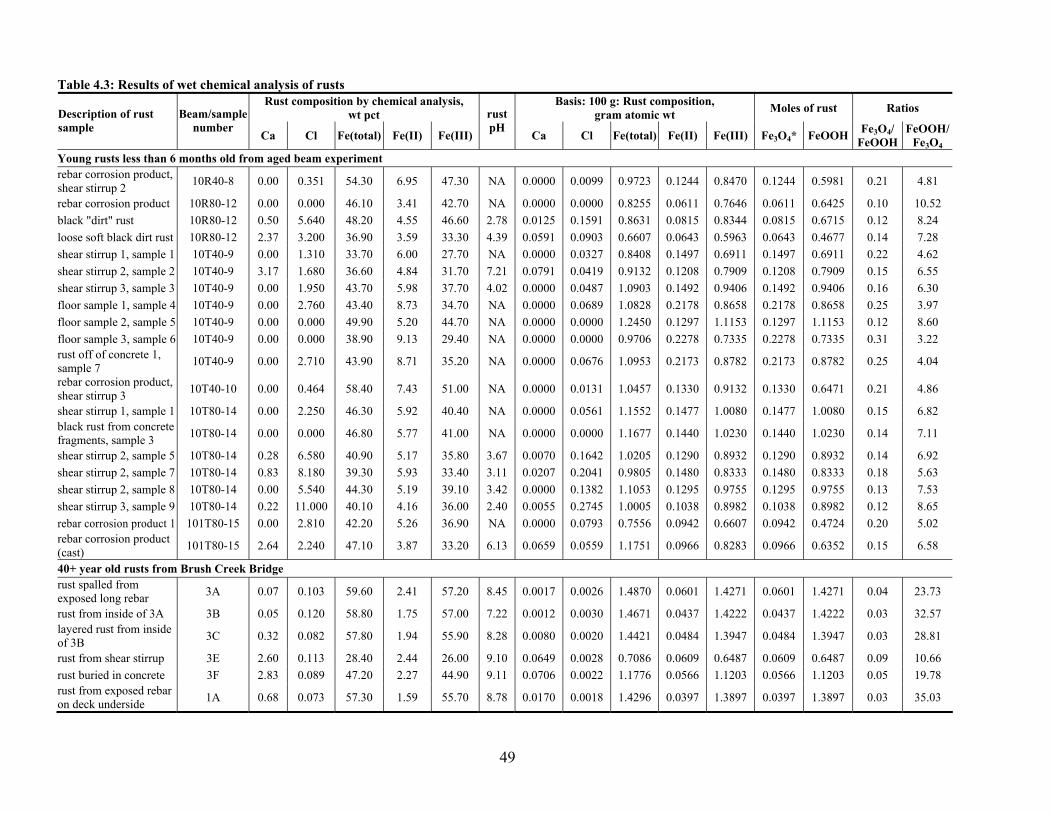
49
Table 4.3: Results of wet chemical analysis of rusts Rust composition by chemical analysis,
wt pct Basis: 100 g: Rust composition,
gram atomic wt Moles of rust Ratios Description of rust sample
Beam/sample number
Ca Cl Fe(total) Fe(II) Fe(III)
rust pH
Ca Cl Fe(total) Fe(II) Fe(III) Fe3O4* FeOOH Fe3O4/ FeOOH
FeOOH/Fe3O4
Young rusts less than 6 months old from aged beam experiment rebar corrosion product, shear stirrup 2 10R40-8 0.00 0.351 54.30 6.95 47.30 NA 0.0000 0.0099 0.9723 0.1244 0.8470 0.1244 0.5981 0.21 4.81
rebar corrosion product 10R80-12 0.00 0.000 46.10 3.41 42.70 NA 0.0000 0.0000 0.8255 0.0611 0.7646 0.0611 0.6425 0.10 10.52 black "dirt" rust 10R80-12 0.50 5.640 48.20 4.55 46.60 2.78 0.0125 0.1591 0.8631 0.0815 0.8344 0.0815 0.6715 0.12 8.24 loose soft black dirt rust 10R80-12 2.37 3.200 36.90 3.59 33.30 4.39 0.0591 0.0903 0.6607 0.0643 0.5963 0.0643 0.4677 0.14 7.28 shear stirrup 1, sample 1 10T40-9 0.00 1.310 33.70 6.00 27.70 NA 0.0000 0.0327 0.8408 0.1497 0.6911 0.1497 0.6911 0.22 4.62 shear stirrup 2, sample 2 10T40-9 3.17 1.680 36.60 4.84 31.70 7.21 0.0791 0.0419 0.9132 0.1208 0.7909 0.1208 0.7909 0.15 6.55 shear stirrup 3, sample 3 10T40-9 0.00 1.950 43.70 5.98 37.70 4.02 0.0000 0.0487 1.0903 0.1492 0.9406 0.1492 0.9406 0.16 6.30 floor sample 1, sample 4 10T40-9 0.00 2.760 43.40 8.73 34.70 NA 0.0000 0.0689 1.0828 0.2178 0.8658 0.2178 0.8658 0.25 3.97 floor sample 2, sample 5 10T40-9 0.00 0.000 49.90 5.20 44.70 NA 0.0000 0.0000 1.2450 0.1297 1.1153 0.1297 1.1153 0.12 8.60 floor sample 3, sample 6 10T40-9 0.00 0.000 38.90 9.13 29.40 NA 0.0000 0.0000 0.9706 0.2278 0.7335 0.2278 0.7335 0.31 3.22 rust off of concrete 1, sample 7 10T40-9 0.00 2.710 43.90 8.71 35.20 NA 0.0000 0.0676 1.0953 0.2173 0.8782 0.2173 0.8782 0.25 4.04
rebar corrosion product, shear stirrup 3 10T40-10 0.00 0.464 58.40 7.43 51.00 NA 0.0000 0.0131 1.0457 0.1330 0.9132 0.1330 0.6471 0.21 4.86
shear stirrup 1, sample 1 10T80-14 0.00 2.250 46.30 5.92 40.40 NA 0.0000 0.0561 1.1552 0.1477 1.0080 0.1477 1.0080 0.15 6.82 black rust from concrete fragments, sample 3 10T80-14 0.00 0.000 46.80 5.77 41.00 NA 0.0000 0.0000 1.1677 0.1440 1.0230 0.1440 1.0230 0.14 7.11
shear stirrup 2, sample 5 10T80-14 0.28 6.580 40.90 5.17 35.80 3.67 0.0070 0.1642 1.0205 0.1290 0.8932 0.1290 0.8932 0.14 6.92 shear stirrup 2, sample 7 10T80-14 0.83 8.180 39.30 5.93 33.40 3.11 0.0207 0.2041 0.9805 0.1480 0.8333 0.1480 0.8333 0.18 5.63 shear stirrup 2, sample 8 10T80-14 0.00 5.540 44.30 5.19 39.10 3.42 0.0000 0.1382 1.1053 0.1295 0.9755 0.1295 0.9755 0.13 7.53 shear stirrup 3, sample 9 10T80-14 0.22 11.000 40.10 4.16 36.00 2.40 0.0055 0.2745 1.0005 0.1038 0.8982 0.1038 0.8982 0.12 8.65 rebar corrosion product 1 101T80-15 0.00 2.810 42.20 5.26 36.90 NA 0.0000 0.0793 0.7556 0.0942 0.6607 0.0942 0.4724 0.20 5.02 rebar corrosion product (cast) 101T80-15 2.64 2.240 47.10 3.87 33.20 6.13 0.0659 0.0559 1.1751 0.0966 0.8283 0.0966 0.6352 0.15 6.58
40+ year old rusts from Brush Creek Bridge rust spalled from exposed long rebar 3A 0.07 0.103 59.60 2.41 57.20 8.45 0.0017 0.0026 1.4870 0.0601 1.4271 0.0601 1.4271 0.04 23.73
rust from inside of 3A 3B 0.05 0.120 58.80 1.75 57.00 7.22 0.0012 0.0030 1.4671 0.0437 1.4222 0.0437 1.4222 0.03 32.57 layered rust from inside of 3B 3C 0.32 0.082 57.80 1.94 55.90 8.28 0.0080 0.0020 1.4421 0.0484 1.3947 0.0484 1.3947 0.03 28.81
rust from shear stirrup 3E 2.60 0.113 28.40 2.44 26.00 9.10 0.0649 0.0028 0.7086 0.0609 0.6487 0.0609 0.6487 0.09 10.66 rust buried in concrete 3F 2.83 0.089 47.20 2.27 44.90 9.11 0.0706 0.0022 1.1776 0.0566 1.1203 0.0566 1.1203 0.05 19.78 rust from exposed rebar on deck underside 1A 0.68 0.073 57.30 1.59 55.70 8.78 0.0170 0.0018 1.4296 0.0397 1.3897 0.0397 1.3897 0.03 35.03
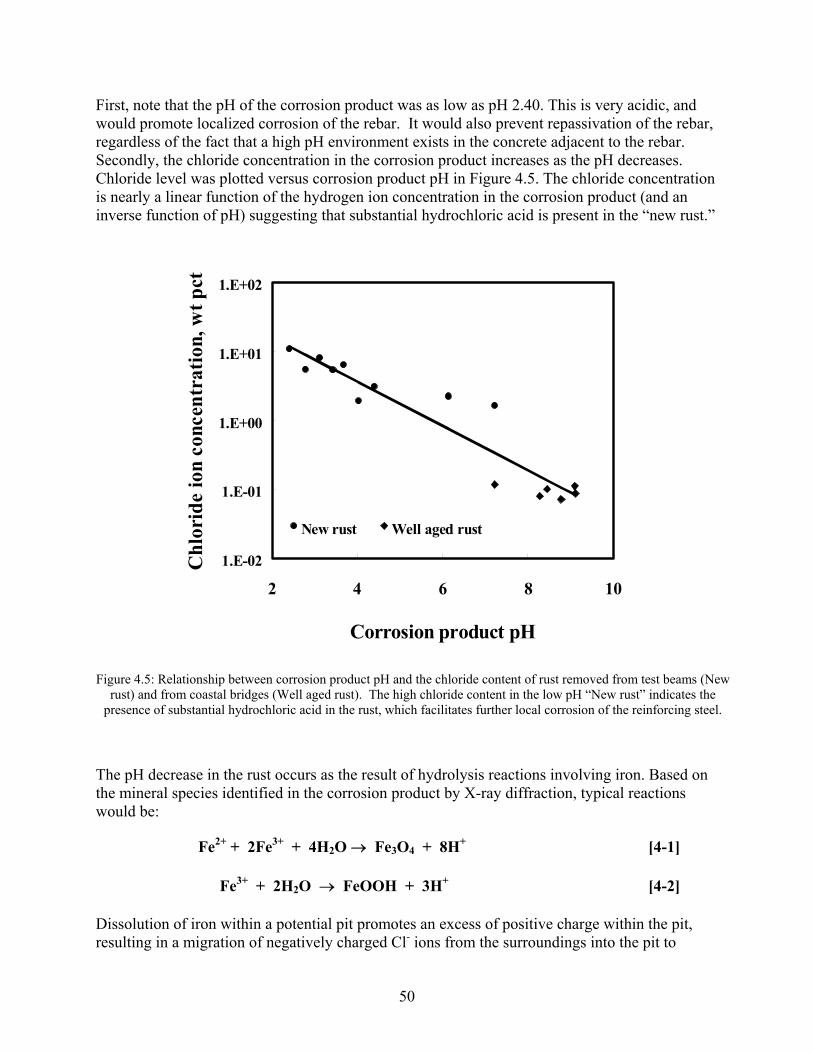
50
First, note that the pH of the corrosion product was as low as pH 2.40. This is very acidic, and would promote localized corrosion of the rebar. It would also prevent repassivation of the rebar, regardless of the fact that a high pH environment exists in the concrete adjacent to the rebar. Secondly, the chloride concentration in the corrosion product increases as the pH decreases. Chloride level was plotted versus corrosion product pH in Figure 4.5. The chloride concentration is nearly a linear function of the hydrogen ion concentration in the corrosion product (and an inverse function of pH) suggesting that substantial hydrochloric acid is present in the “new rust.”
1.E-02
1.E-01
1.E+00
1.E+01
1.E+02
2 4 6 8 10
Corrosion product pH
Chl
orid
e io
n co
ncen
trat
ion,
wt p
ct
New rust Well aged rust
Figure 4.5: Relationship between corrosion product pH and the chloride content of rust removed from test beams (New rust) and from coastal bridges (Well aged rust). The high chloride content in the low pH “New rust” indicates the
presence of substantial hydrochloric acid in the rust, which facilitates further local corrosion of the reinforcing steel.
The pH decrease in the rust occurs as the result of hydrolysis reactions involving iron. Based on the mineral species identified in the corrosion product by X-ray diffraction, typical reactions would be:
Fe2+ + 2Fe3+ + 4H2O → Fe3O4 + 8H+ [4-1]
Fe3+ + 2H2O → FeOOH + 3H+ [4-2]
Dissolution of iron within a potential pit promotes an excess of positive charge within the pit, resulting in a migration of negatively charged Cl- ions from the surroundings into the pit to
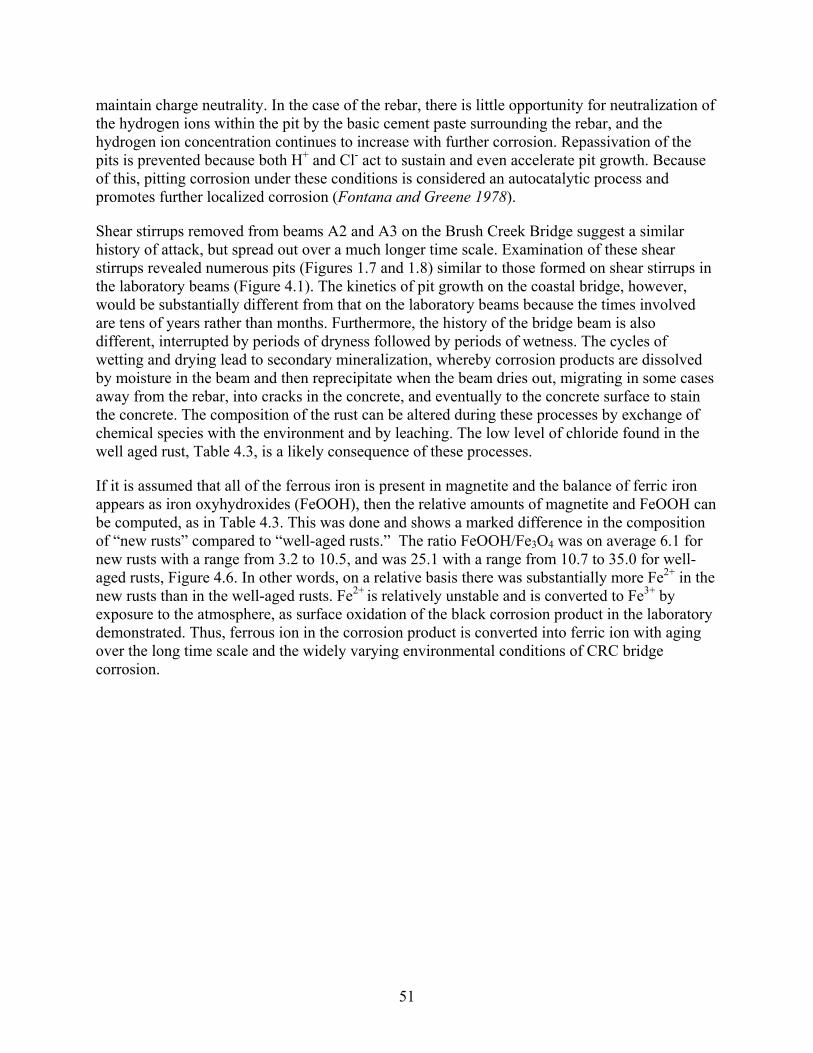
51
maintain charge neutrality. In the case of the rebar, there is little opportunity for neutralization of the hydrogen ions within the pit by the basic cement paste surrounding the rebar, and the hydrogen ion concentration continues to increase with further corrosion. Repassivation of the pits is prevented because both H+ and Cl- act to sustain and even accelerate pit growth. Because of this, pitting corrosion under these conditions is considered an autocatalytic process and promotes further localized corrosion (Fontana and Greene 1978).
Shear stirrups removed from beams A2 and A3 on the Brush Creek Bridge suggest a similar history of attack, but spread out over a much longer time scale. Examination of these shear stirrups revealed numerous pits (Figures 1.7 and 1.8) similar to those formed on shear stirrups in the laboratory beams (Figure 4.1). The kinetics of pit growth on the coastal bridge, however, would be substantially different from that on the laboratory beams because the times involved are tens of years rather than months. Furthermore, the history of the bridge beam is also different, interrupted by periods of dryness followed by periods of wetness. The cycles of wetting and drying lead to secondary mineralization, whereby corrosion products are dissolved by moisture in the beam and then reprecipitate when the beam dries out, migrating in some cases away from the rebar, into cracks in the concrete, and eventually to the concrete surface to stain the concrete. The composition of the rust can be altered during these processes by exchange of chemical species with the environment and by leaching. The low level of chloride found in the well aged rust, Table 4.3, is a likely consequence of these processes.
If it is assumed that all of the ferrous iron is present in magnetite and the balance of ferric iron appears as iron oxyhydroxides (FeOOH), then the relative amounts of magnetite and FeOOH can be computed, as in Table 4.3. This was done and shows a marked difference in the composition of “new rusts” compared to “well-aged rusts.” The ratio FeOOH/Fe3O4 was on average 6.1 for new rusts with a range from 3.2 to 10.5, and was 25.1 with a range from 10.7 to 35.0 for well-aged rusts, Figure 4.6. In other words, on a relative basis there was substantially more Fe2+ in the new rusts than in the well-aged rusts. Fe2+ is relatively unstable and is converted to Fe3+ by exposure to the atmosphere, as surface oxidation of the black corrosion product in the laboratory demonstrated. Thus, ferrous ion in the corrosion product is converted into ferric ion with aging over the long time scale and the widely varying environmental conditions of CRC bridge corrosion.
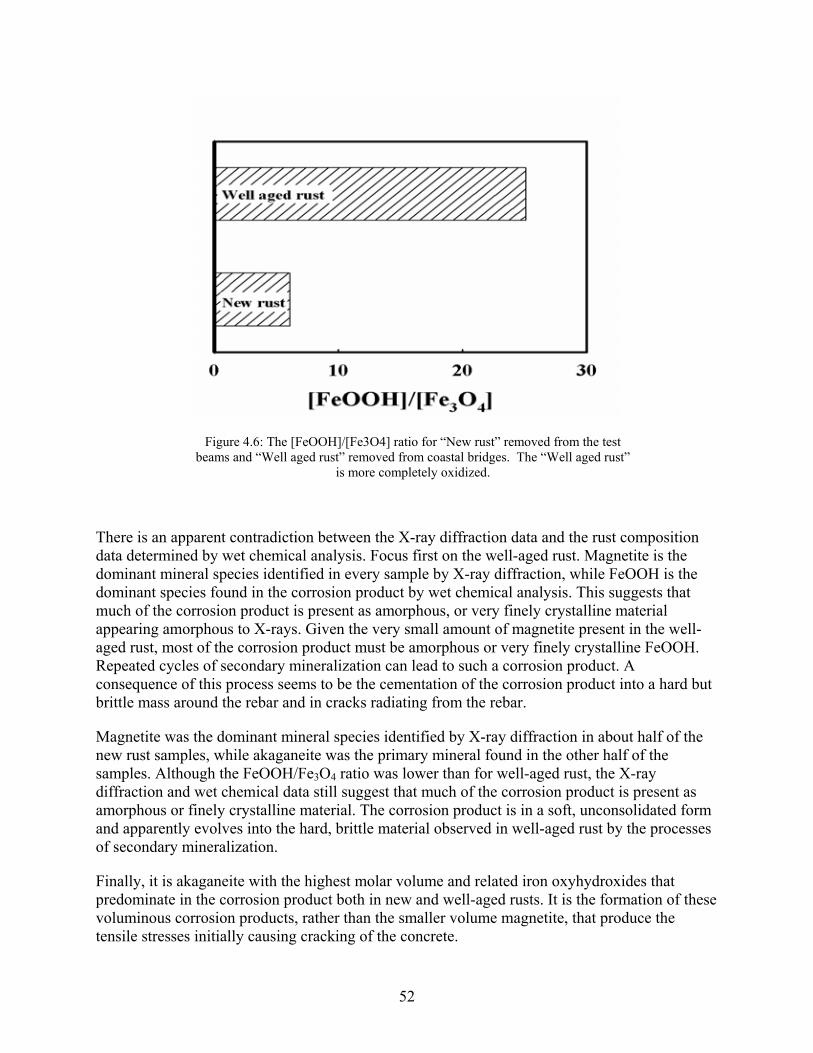
52
Figure 4.6: The [FeOOH]/[Fe3O4] ratio for “New rust” removed from the test beams and “Well aged rust” removed from coastal bridges. The “Well aged rust”
is more completely oxidized.
There is an apparent contradiction between the X-ray diffraction data and the rust composition data determined by wet chemical analysis. Focus first on the well-aged rust. Magnetite is the dominant mineral species identified in every sample by X-ray diffraction, while FeOOH is the dominant species found in the corrosion product by wet chemical analysis. This suggests that much of the corrosion product is present as amorphous, or very finely crystalline material appearing amorphous to X-rays. Given the very small amount of magnetite present in the well-aged rust, most of the corrosion product must be amorphous or very finely crystalline FeOOH. Repeated cycles of secondary mineralization can lead to such a corrosion product. A consequence of this process seems to be the cementation of the corrosion product into a hard but brittle mass around the rebar and in cracks radiating from the rebar.
Magnetite was the dominant mineral species identified by X-ray diffraction in about half of the new rust samples, while akaganeite was the primary mineral found in the other half of the samples. Although the FeOOH/Fe3O4 ratio was lower than for well-aged rust, the X-ray diffraction and wet chemical data still suggest that much of the corrosion product is present as amorphous or finely crystalline material. The corrosion product is in a soft, unconsolidated form and apparently evolves into the hard, brittle material observed in well-aged rust by the processes of secondary mineralization.
Finally, it is akaganeite with the highest molar volume and related iron oxyhydroxides that predominate in the corrosion product both in new and well-aged rusts. It is the formation of these voluminous corrosion products, rather than the smaller volume magnetite, that produce the tensile stresses initially causing cracking of the concrete.
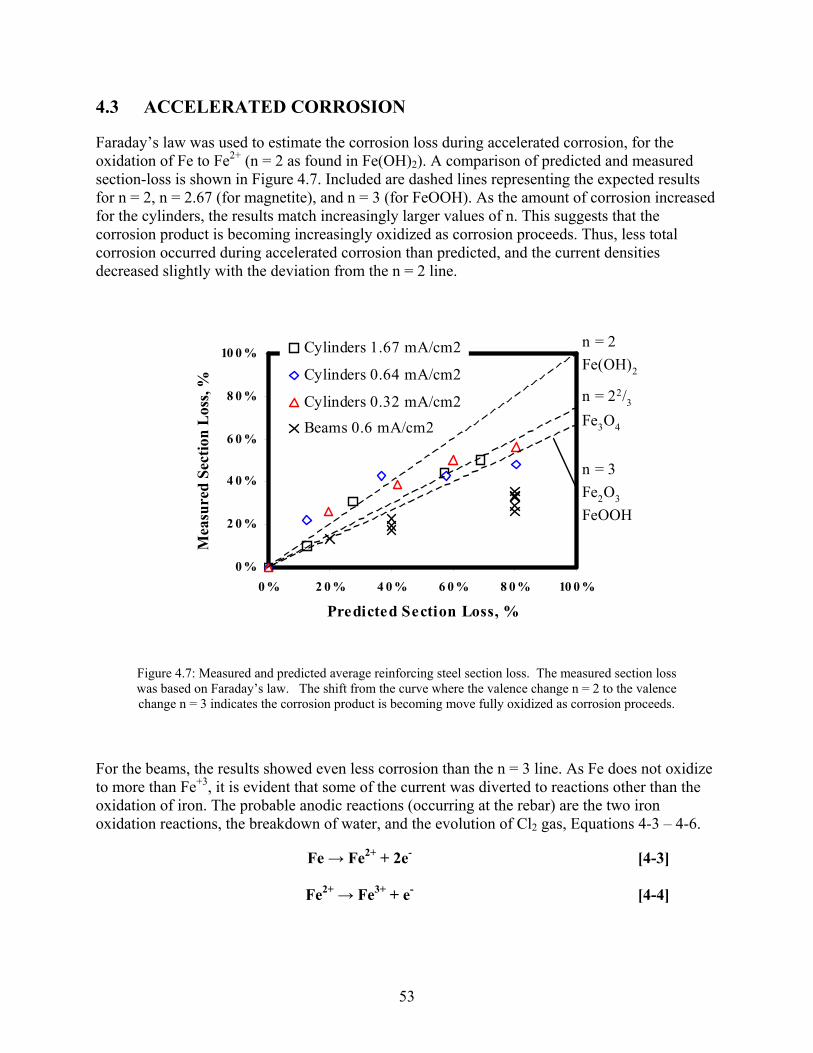
53
4.3 ACCELERATED CORROSION
Faraday’s law was used to estimate the corrosion loss during accelerated corrosion, for the oxidation of Fe to Fe2+ (n = 2 as found in Fe(OH)2). A comparison of predicted and measured section-loss is shown in Figure 4.7. Included are dashed lines representing the expected results for n = 2, n = 2.67 (for magnetite), and n = 3 (for FeOOH). As the amount of corrosion increased for the cylinders, the results match increasingly larger values of n. This suggests that the corrosion product is becoming increasingly oxidized as corrosion proceeds. Thus, less total corrosion occurred during accelerated corrosion than predicted, and the current densities decreased slightly with the deviation from the n = 2 line.
0 %
2 0 %
4 0 %
6 0 %
8 0 %
10 0 %
0 % 2 0 % 4 0 % 6 0 % 8 0 % 10 0 %
Predicted Section Loss, %
Mea
sure
d Se
ctio
n L
oss,
%
Cylinders 1.67 mA/cm2
Cylinders 0.64 mA/cm2
Cylinders 0.32 mA/cm2Beams 0.6 mA/cm2
n = 2Fe(OH)2
n = 3Fe2O3
FeOOH
n = 22/3
Fe3O4
Figure 4.7: Measured and predicted average reinforcing steel section loss. The measured section loss was based on Faraday’s law. The shift from the curve where the valence change n = 2 to the valence change n = 3 indicates the corrosion product is becoming move fully oxidized as corrosion proceeds.
For the beams, the results showed even less corrosion than the n = 3 line. As Fe does not oxidize to more than Fe+3, it is evident that some of the current was diverted to reactions other than the oxidation of iron. The probable anodic reactions (occurring at the rebar) are the two iron oxidation reactions, the breakdown of water, and the evolution of Cl2 gas, Equations 4-3 – 4-6.
Fe → Fe2+ + 2e- [4-3]
Fe2+ → Fe3+ + e- [4-4]
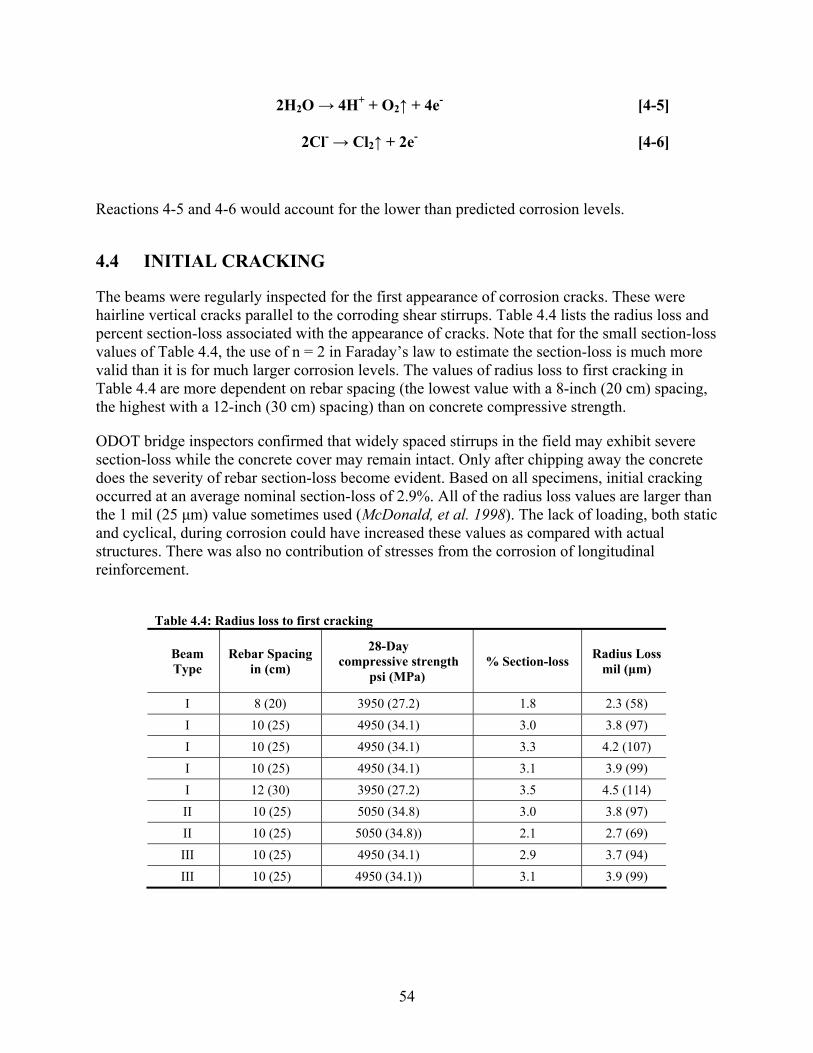
54
2H2O → 4H+ + O2↑ + 4e- [4-5]
2Cl- → Cl2↑ + 2e- [4-6]
Reactions 4-5 and 4-6 would account for the lower than predicted corrosion levels.
4.4 INITIAL CRACKING
The beams were regularly inspected for the first appearance of corrosion cracks. These were hairline vertical cracks parallel to the corroding shear stirrups. Table 4.4 lists the radius loss and percent section-loss associated with the appearance of cracks. Note that for the small section-loss values of Table 4.4, the use of n = 2 in Faraday’s law to estimate the section-loss is much more valid than it is for much larger corrosion levels. The values of radius loss to first cracking in Table 4.4 are more dependent on rebar spacing (the lowest value with a 8-inch (20 cm) spacing, the highest with a 12-inch (30 cm) spacing) than on concrete compressive strength.
ODOT bridge inspectors confirmed that widely spaced stirrups in the field may exhibit severe section-loss while the concrete cover may remain intact. Only after chipping away the concrete does the severity of rebar section-loss become evident. Based on all specimens, initial cracking occurred at an average nominal section-loss of 2.9%. All of the radius loss values are larger than the 1 mil (25 µm) value sometimes used (McDonald, et al. 1998). The lack of loading, both static and cyclical, during corrosion could have increased these values as compared with actual structures. There was also no contribution of stresses from the corrosion of longitudinal reinforcement.
Table 4.4: Radius loss to first cracking
Beam Type
Rebar Spacing in (cm)
28-Day compressive strength
psi (MPa) % Section-loss Radius Loss
mil (µm)
I 8 (20) 3950 (27.2) 1.8 2.3 (58) I 10 (25) 4950 (34.1) 3.0 3.8 (97) I 10 (25) 4950 (34.1) 3.3 4.2 (107) I 10 (25) 4950 (34.1) 3.1 3.9 (99) I 12 (30) 3950 (27.2) 3.5 4.5 (114) II 10 (25) 5050 (34.8) 3.0 3.8 (97) II 10 (25) 5050 (34.8)) 2.1 2.7 (69) III 10 (25) 4950 (34.1) 2.9 3.7 (94) III 10 (25) 4950 (34.1)) 3.1 3.9 (99)
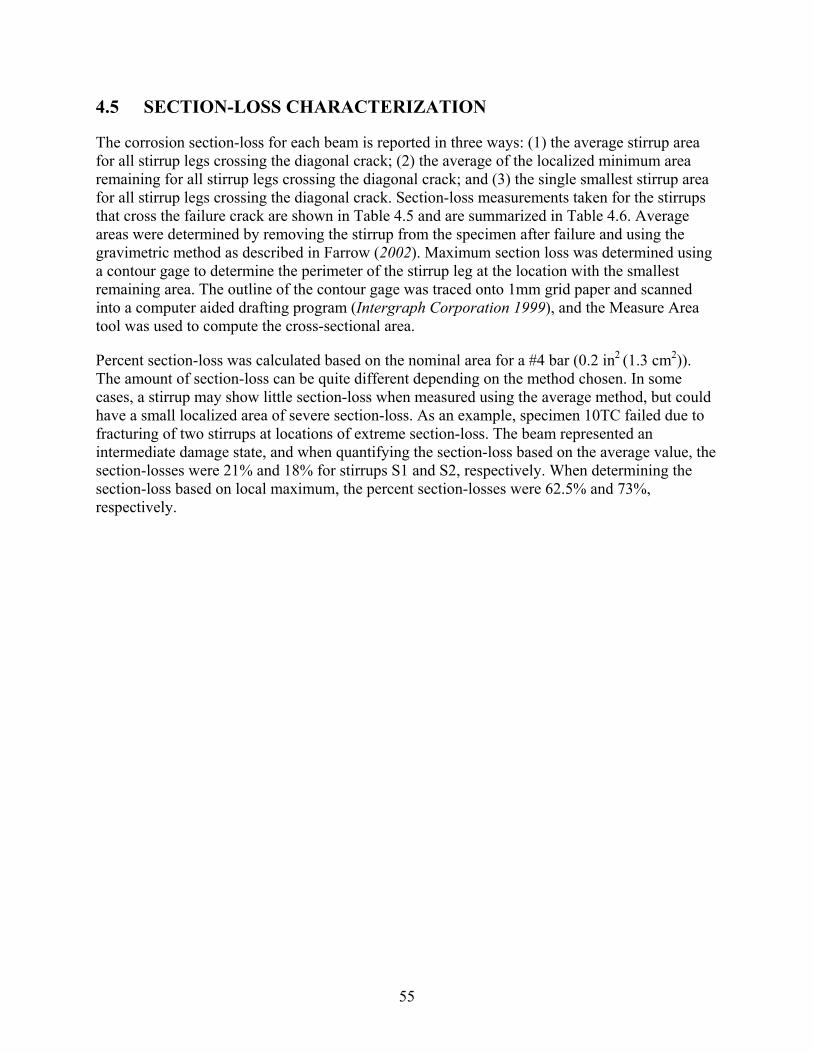
55
4.5 SECTION-LOSS CHARACTERIZATION
The corrosion section-loss for each beam is reported in three ways: (1) the average stirrup area for all stirrup legs crossing the diagonal crack; (2) the average of the localized minimum area remaining for all stirrup legs crossing the diagonal crack; and (3) the single smallest stirrup area for all stirrup legs crossing the diagonal crack. Section-loss measurements taken for the stirrups that cross the failure crack are shown in Table 4.5 and are summarized in Table 4.6. Average areas were determined by removing the stirrup from the specimen after failure and using the gravimetric method as described in Farrow (2002). Maximum section loss was determined using a contour gage to determine the perimeter of the stirrup leg at the location with the smallest remaining area. The outline of the contour gage was traced onto 1mm grid paper and scanned into a computer aided drafting program (Intergraph Corporation 1999), and the Measure Area tool was used to compute the cross-sectional area.
Percent section-loss was calculated based on the nominal area for a #4 bar (0.2 in2 (1.3 cm2)). The amount of section-loss can be quite different depending on the method chosen. In some cases, a stirrup may show little section-loss when measured using the average method, but could have a small localized area of severe section-loss. As an example, specimen 10TC failed due to fracturing of two stirrups at locations of extreme section-loss. The beam represented an intermediate damage state, and when quantifying the section-loss based on the average value, the section-losses were 21% and 18% for stirrups S1 and S2, respectively. When determining the section-loss based on local maximum, the percent section-losses were 62.5% and 73%, respectively.
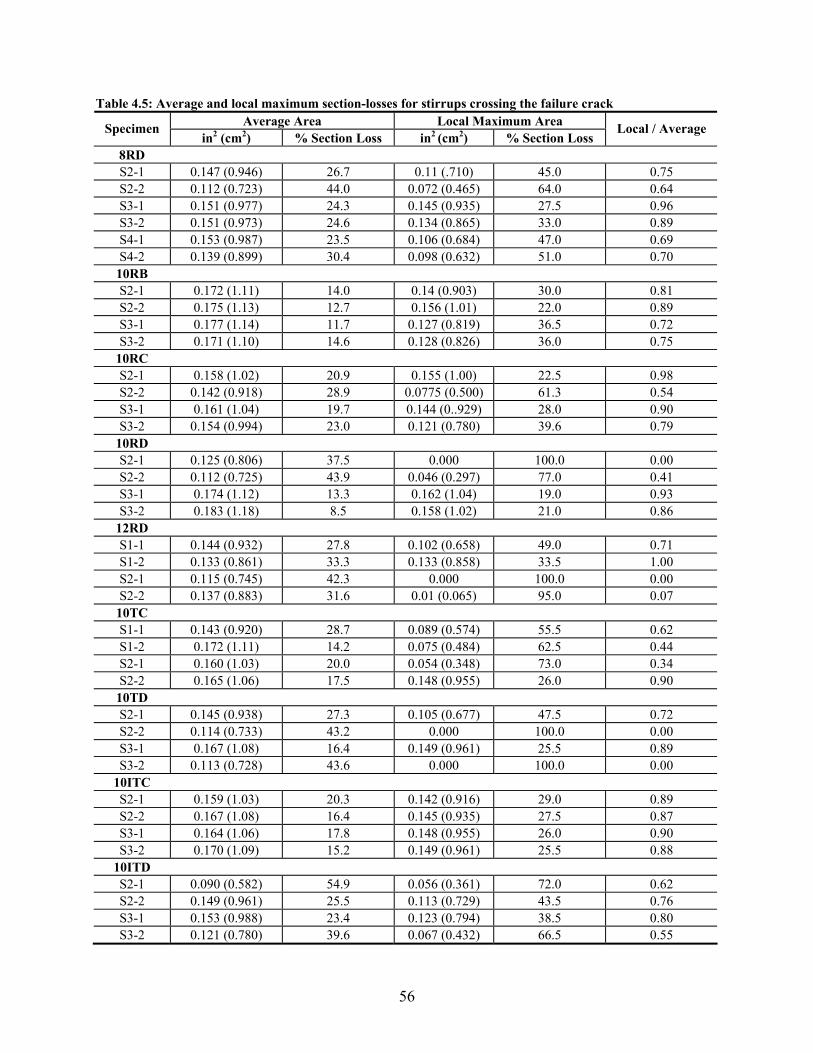
56
Table 4.5: Average and local maximum section-losses for stirrups crossing the failure crack Average Area Local Maximum Area Specimen
in2 (cm2) % Section Loss in2 (cm2) % Section Loss Local / Average
8RD S2-1 0.147 (0.946) 26.7 0.11 (.710) 45.0 0.75 S2-2 0.112 (0.723) 44.0 0.072 (0.465) 64.0 0.64 S3-1 0.151 (0.977) 24.3 0.145 (0.935) 27.5 0.96 S3-2 0.151 (0.973) 24.6 0.134 (0.865) 33.0 0.89 S4-1 0.153 (0.987) 23.5 0.106 (0.684) 47.0 0.69 S4-2 0.139 (0.899) 30.4 0.098 (0.632) 51.0 0.70
10RB S2-1 0.172 (1.11) 14.0 0.14 (0.903) 30.0 0.81 S2-2 0.175 (1.13) 12.7 0.156 (1.01) 22.0 0.89 S3-1 0.177 (1.14) 11.7 0.127 (0.819) 36.5 0.72 S3-2 0.171 (1.10) 14.6 0.128 (0.826) 36.0 0.75
10RC S2-1 0.158 (1.02) 20.9 0.155 (1.00) 22.5 0.98 S2-2 0.142 (0.918) 28.9 0.0775 (0.500) 61.3 0.54 S3-1 0.161 (1.04) 19.7 0.144 (0..929) 28.0 0.90 S3-2 0.154 (0.994) 23.0 0.121 (0.780) 39.6 0.79
10RD S2-1 0.125 (0.806) 37.5 0.000 100.0 0.00 S2-2 0.112 (0.725) 43.9 0.046 (0.297) 77.0 0.41 S3-1 0.174 (1.12) 13.3 0.162 (1.04) 19.0 0.93 S3-2 0.183 (1.18) 8.5 0.158 (1.02) 21.0 0.86
12RD S1-1 0.144 (0.932) 27.8 0.102 (0.658) 49.0 0.71 S1-2 0.133 (0.861) 33.3 0.133 (0.858) 33.5 1.00 S2-1 0.115 (0.745) 42.3 0.000 100.0 0.00 S2-2 0.137 (0.883) 31.6 0.01 (0.065) 95.0 0.07
10TC S1-1 0.143 (0.920) 28.7 0.089 (0.574) 55.5 0.62 S1-2 0.172 (1.11) 14.2 0.075 (0.484) 62.5 0.44 S2-1 0.160 (1.03) 20.0 0.054 (0.348) 73.0 0.34 S2-2 0.165 (1.06) 17.5 0.148 (0.955) 26.0 0.90
10TD S2-1 0.145 (0.938) 27.3 0.105 (0.677) 47.5 0.72 S2-2 0.114 (0.733) 43.2 0.000 100.0 0.00 S3-1 0.167 (1.08) 16.4 0.149 (0.961) 25.5 0.89 S3-2 0.113 (0.728) 43.6 0.000 100.0 0.00
10ITC S2-1 0.159 (1.03) 20.3 0.142 (0.916) 29.0 0.89 S2-2 0.167 (1.08) 16.4 0.145 (0.935) 27.5 0.87 S3-1 0.164 (1.06) 17.8 0.148 (0.955) 26.0 0.90 S3-2 0.170 (1.09) 15.2 0.149 (0.961) 25.5 0.88
10ITD S2-1 0.090 (0.582) 54.9 0.056 (0.361) 72.0 0.62 S2-2 0.149 (0.961) 25.5 0.113 (0.729) 43.5 0.76 S3-1 0.153 (0.988) 23.4 0.123 (0.794) 38.5 0.80 S3-2 0.121 (0.780) 39.6 0.067 (0.432) 66.5 0.55
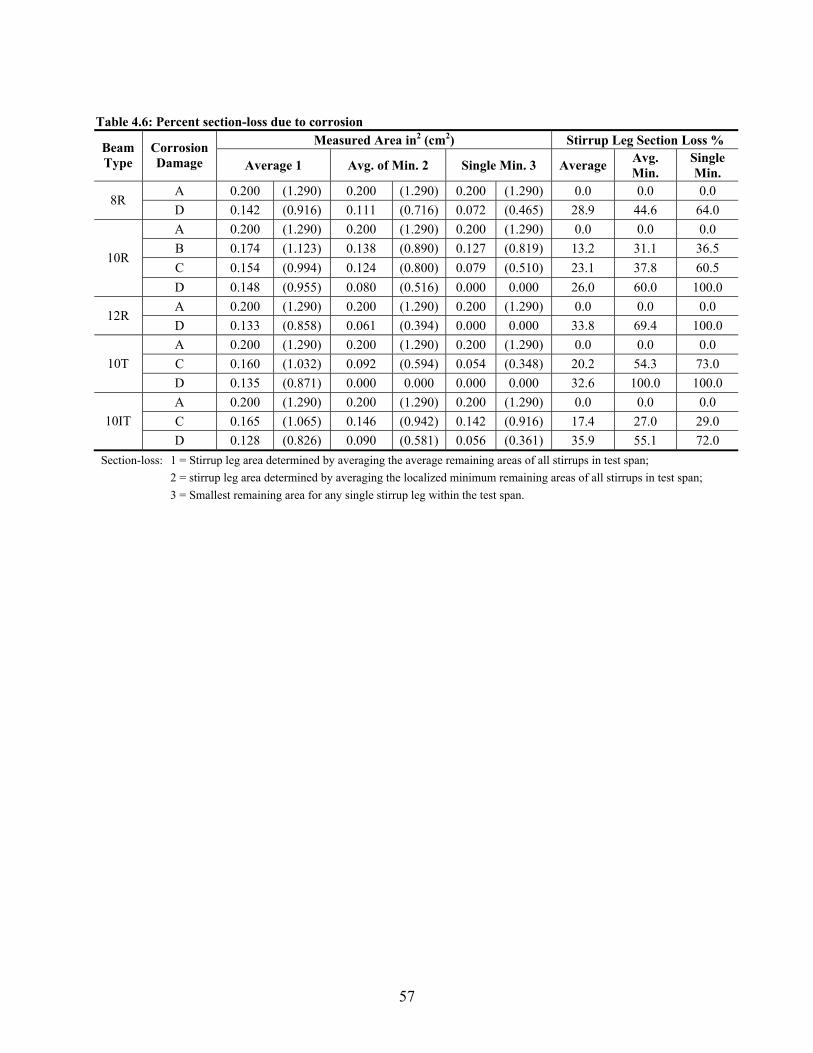
57
Table 4.6: Percent section-loss due to corrosion
Measured Area in2 (cm2) Stirrup Leg Section Loss % Beam Type
Corrosion Damage Average 1 Avg. of Min. 2 Single Min. 3 Average Avg.
Min. Single Min.
A 0.200 (1.290) 0.200 (1.290) 0.200 (1.290) 0.0 0.0 0.0 8R
D 0.142 (0.916) 0.111 (0.716) 0.072 (0.465) 28.9 44.6 64.0 A 0.200 (1.290) 0.200 (1.290) 0.200 (1.290) 0.0 0.0 0.0 B 0.174 (1.123) 0.138 (0.890) 0.127 (0.819) 13.2 31.1 36.5 C 0.154 (0.994) 0.124 (0.800) 0.079 (0.510) 23.1 37.8 60.5
10R
D 0.148 (0.955) 0.080 (0.516) 0.000 0.000 26.0 60.0 100.0 A 0.200 (1.290) 0.200 (1.290) 0.200 (1.290) 0.0 0.0 0.0
12R D 0.133 (0.858) 0.061 (0.394) 0.000 0.000 33.8 69.4 100.0 A 0.200 (1.290) 0.200 (1.290) 0.200 (1.290) 0.0 0.0 0.0 C 0.160 (1.032) 0.092 (0.594) 0.054 (0.348) 20.2 54.3 73.0 10T D 0.135 (0.871) 0.000 0.000 0.000 0.000 32.6 100.0 100.0 A 0.200 (1.290) 0.200 (1.290) 0.200 (1.290) 0.0 0.0 0.0 C 0.165 (1.065) 0.146 (0.942) 0.142 (0.916) 17.4 27.0 29.0 10IT D 0.128 (0.826) 0.090 (0.581) 0.056 (0.361) 35.9 55.1 72.0
Section-loss: 1 = Stirrup leg area determined by averaging the average remaining areas of all stirrups in test span; 2 = stirrup leg area determined by averaging the localized minimum remaining areas of all stirrups in test span; 3 = Smallest remaining area for any single stirrup leg within the test span.

58
59
5.0 ANALYSIS OF CORROSION DAMAGED BEAMS FOR SHEAR
Five different analysis methods were used to predict strength of corrosion damaged beam specimens. These include: traditional ACI approach (AASHTO 1996), Strut-and-Tie Method (STM) (ACI 2002), Modified Compression Field Theory (MCFT) (AASHTO 2002), Response 2000TM (Bentz 2000) and the finite element method. The ACI approach is described subsequently to demonstrate the recommended modifications used to incorporate corrosion damage into shear strength prediction for CRC beams.
Finite element analyses are described in detail in Appendix B and characterize the contribution of each damage component to strength and deformation capacity reduction. The major findings of this analysis are the importance of cover cracking, stirrup debonding from the concrete, average and localized section-loss and the spatial distribution of localized damage on structural performance. Results indicate a need for inspection procedures to identify sequential stirrup section-loss that may adversely affect structural performance.
The STM, MCFT, and Response 2000 analysis methods are described in detail in Appendix C. Corrosion effects were incorporated in these methods by including concrete damage due to spalling and rebar section-loss. Rebar section-loss was quantified using both average section-loss along the bars as well as local maximum section-loss. Predicted shear capacities were compared with experimental values and indicated that each method, modified to incorporate corrosion damage, can reasonably predict the remaining capacity of damaged sections in shear.
The analyses presented in this section are conducted with values in English units only in order to accommodate the common form of empirical relationships reported in the literature.
5.1 ACI METHOD
The traditional method for computing the shear strength of CRC elements consists of the superposition of the concrete and stirrup contributions to shear resistance (AASHTO 1996):
scn VVV += [5-1]
dbfV wcc '2= [5-2]
s
dfAV yv
s = [5-3]
where Vn is the nominal shear resistance, Vc is the shear resistance of the concrete, Vs is the shear resistance of the transverse steel, f′c is the compressive strength of the concrete, Av is the area of
60
the transverse steel, fy is the yield strength of the transverse steel, d is the effective depth, and s is the spacing of the transverse steel.
A more detailed equation for the concrete contribution to shear is based on empirical fit for shear test results of beams without shear reinforcement (AASHTO 1996):
dbfdbM
dVfV wcw
u
ucc )'5.3()2500'9.1( ≤+= ρ [5-4]
where ρ is the reinforcement ratio, Vu is the factored shear at the design section, and Mu is the factored moment at the design section.
Prediction of the shear capacity of corrosion damaged CRC sections requires modeling the damage to the concrete from cracking and spalling as well as the section-loss and debonding of transverse steel. Methods were developed to treat these aspects of corrosion damage, and the results were compared with experimental findings.
Section-loss to the transverse steel from corrosion was directly quantified through measurement using two methods: average area and local minimum area within a shear length of d. Example stirrup corrosion damage is illustrated in Figure 5.1. Each of the legs is measured to quantify the remaining rebar area. Average area was determined by computing the number of stirrups, n, crossing a potential diagonal crack oriented at an angle of 45o as:
sdn = [5-5]
where s is the stirrup spacing and d is the beam depth.
The average area (ivA ) for each stirrup was determined by summing the average area
measurements of each leg:
21 leglegv AAA
i+= [5-6]
The average stirrup area within the region is determined by computing an equivalent stirrup area to be applied at the same spacing as that of the undamaged stirrups:
n
AA
n
iv
v
i∑== 1 [5-7]
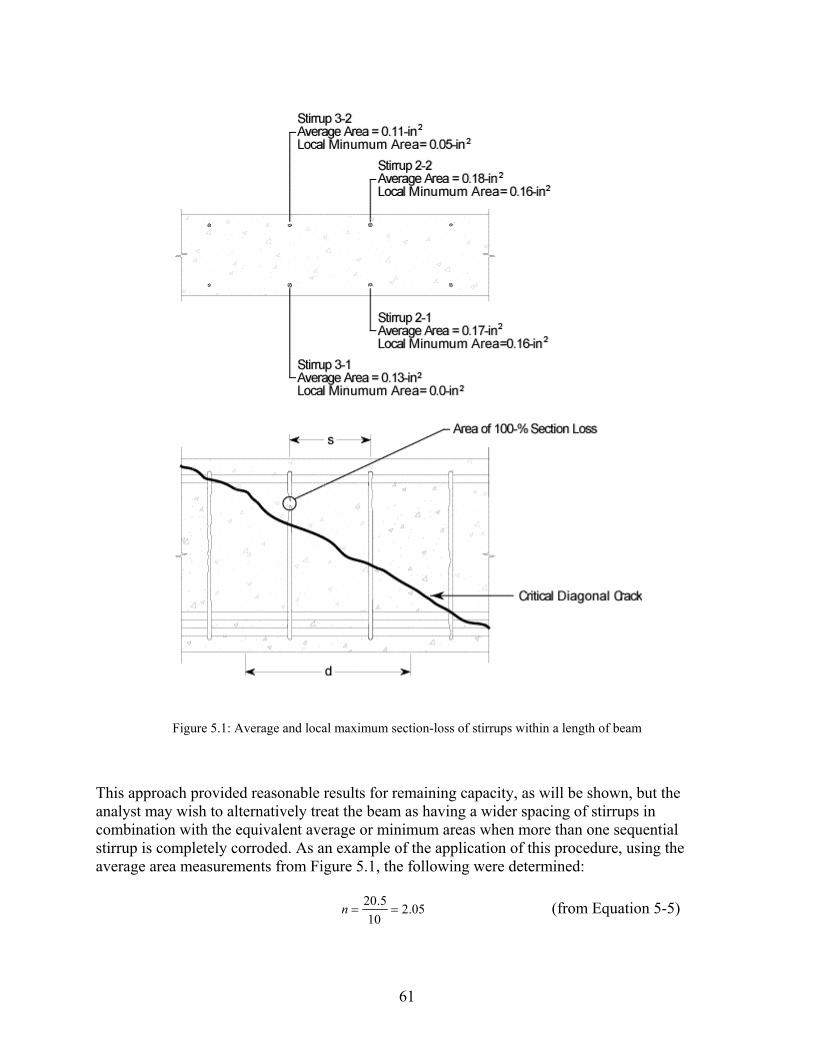
61
Figure 5.1: Average and local maximum section-loss of stirrups within a length of beam
This approach provided reasonable results for remaining capacity, as will be shown, but the analyst may wish to alternatively treat the beam as having a wider spacing of stirrups in combination with the equivalent average or minimum areas when more than one sequential stirrup is completely corroded. As an example of the application of this procedure, using the average area measurements from Figure 5.1, the following were determined:
05.210
5.20==n (from Equation 5-5)
62
222 356.0183.0173.01
inininAv =+= (from Equation 5-6)
222 237.0112.0125.02
inininAv =+= (from Equation 5-6)
222
296.005.2
237.0356.0 inininAv =+
= (from Equation 5-7)
To estimate local maximum section-loss, the number of stirrups within the critical beam length for an assumed 45o diagonal crack are computed by Equation 5-5, and then the minimum area for each stirrup within this region is determined. If a stirrup has undergone complete section-loss of one leg, the stirrup would not be capable of effectively restraining a crack, and thus the area for both legs is set equal to zero. The smallest area for each stirrup (
ivA& ) is determined by summing the local minimum area measurements for each leg:
21 leglegv AAA
i&&& += ; if 0=
ilegA& then 0=ivA& [5-8]
The minimum stirrup area within the region is determined by computing an equivalent stirrup area to be applied at the same spacing as that of the undamaged stirrups:
n
AA
n
iv
v
i∑== 1
&
& [5-9]
As an example of this procedure, using the local minimum area measurements from Figure 5.1, the following were determined:
05.210
5.20==n (from Equation 5-5)
222 32.0158.0162.01
inininAv =+=& (from Equation 5-8)
20.005.00.02
inAv ≡+=& (Completely corroded leg) (from Equation 5-8)
216.005.2
0.032.0 inAv =+
=& (from Equation 5-9)
Note the discontinuous stirrup condition of Equation 5-8 applied to stirrup # 2. The first stirrup leg had undergone complete section-loss, while the other leg had undergone severe loss. This significantly reduced the minimum equivalent stirrup area.
Average areas were found according to the Gravimetric method, which requires removal of the stirrup from the member. This is not possible in practice, and thus digital calipers are recommended to determine the remaining area of the stirrups. Judgment is required of the
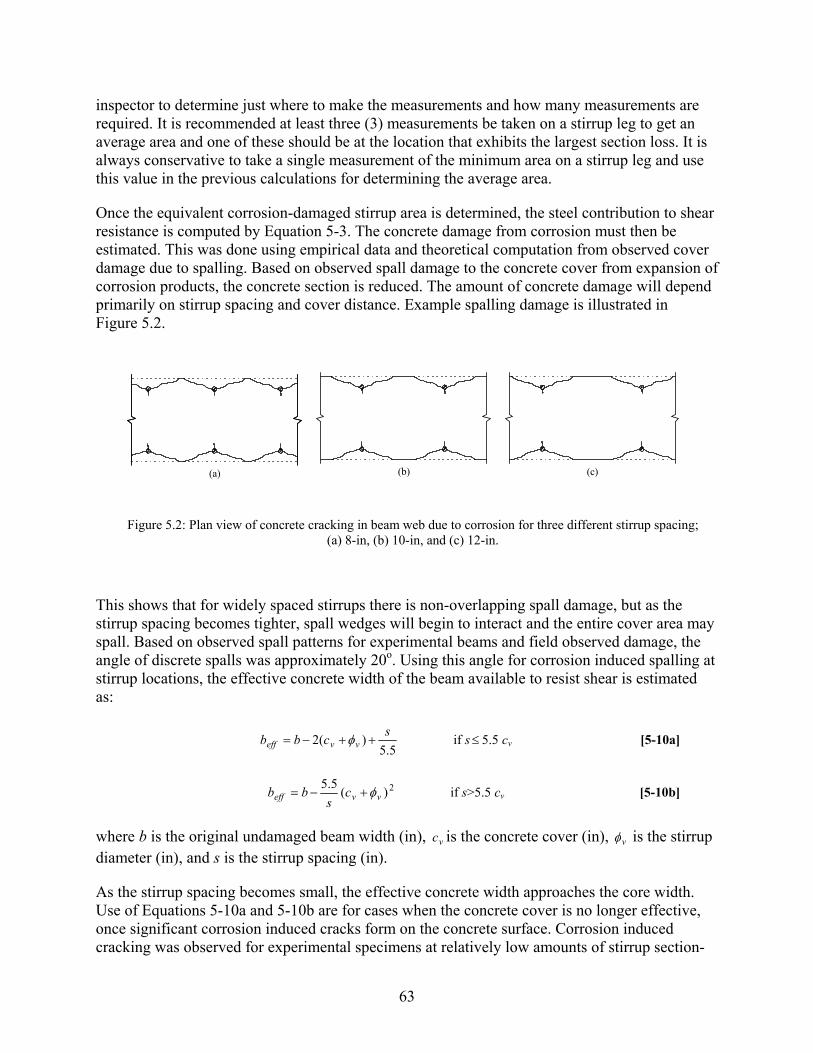
63
inspector to determine just where to make the measurements and how many measurements are required. It is recommended at least three (3) measurements be taken on a stirrup leg to get an average area and one of these should be at the location that exhibits the largest section loss. It is always conservative to take a single measurement of the minimum area on a stirrup leg and use this value in the previous calculations for determining the average area.
Once the equivalent corrosion-damaged stirrup area is determined, the steel contribution to shear resistance is computed by Equation 5-3. The concrete damage from corrosion must then be estimated. This was done using empirical data and theoretical computation from observed cover damage due to spalling. Based on observed spall damage to the concrete cover from expansion of corrosion products, the concrete section is reduced. The amount of concrete damage will depend primarily on stirrup spacing and cover distance. Example spalling damage is illustrated in Figure 5.2.
(a) (b) (c)
Figure 5.2: Plan view of concrete cracking in beam web due to corrosion for three different stirrup spacing; (a) 8-in, (b) 10-in, and (c) 12-in.
This shows that for widely spaced stirrups there is non-overlapping spall damage, but as the stirrup spacing becomes tighter, spall wedges will begin to interact and the entire cover area may spall. Based on observed spall patterns for experimental beams and field observed damage, the angle of discrete spalls was approximately 20o. Using this angle for corrosion induced spalling at stirrup locations, the effective concrete width of the beam available to resist shear is estimated as:
5.5
)(2 scbb vveff ++−= φ if s ≤ 5.5 cv [5-10a]
2)(5.5vveff c
sbb φ+−= if s>5.5 cv [5-10b]
where b is the original undamaged beam width (in), vc is the concrete cover (in), vφ is the stirrup diameter (in), and s is the stirrup spacing (in).
As the stirrup spacing becomes small, the effective concrete width approaches the core width. Use of Equations 5-10a and 5-10b are for cases when the concrete cover is no longer effective, once significant corrosion induced cracks form on the concrete surface. Corrosion induced cracking was observed for experimental specimens at relatively low amounts of stirrup section-
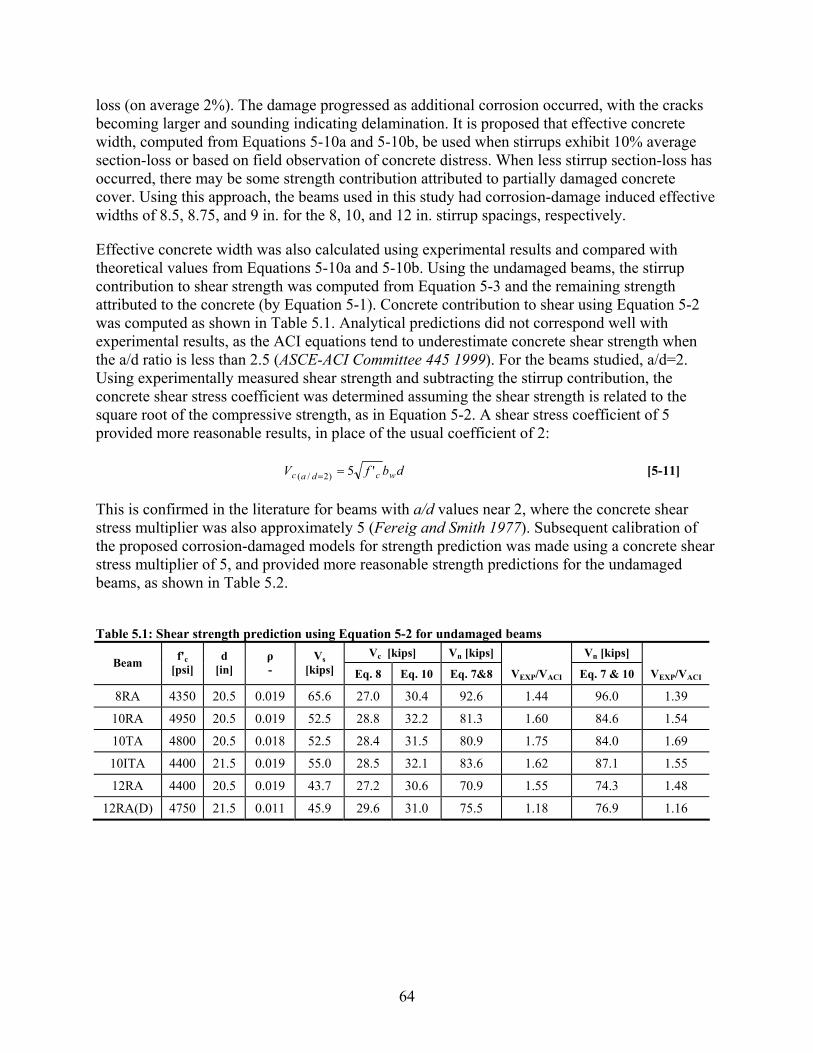
64
loss (on average 2%). The damage progressed as additional corrosion occurred, with the cracks becoming larger and sounding indicating delamination. It is proposed that effective concrete width, computed from Equations 5-10a and 5-10b, be used when stirrups exhibit 10% average section-loss or based on field observation of concrete distress. When less stirrup section-loss has occurred, there may be some strength contribution attributed to partially damaged concrete cover. Using this approach, the beams used in this study had corrosion-damage induced effective widths of 8.5, 8.75, and 9 in. for the 8, 10, and 12 in. stirrup spacings, respectively.
Effective concrete width was also calculated using experimental results and compared with theoretical values from Equations 5-10a and 5-10b. Using the undamaged beams, the stirrup contribution to shear strength was computed from Equation 5-3 and the remaining strength attributed to the concrete (by Equation 5-1). Concrete contribution to shear using Equation 5-2 was computed as shown in Table 5.1. Analytical predictions did not correspond well with experimental results, as the ACI equations tend to underestimate concrete shear strength when the a/d ratio is less than 2.5 (ASCE-ACI Committee 445 1999). For the beams studied, a/d=2. Using experimentally measured shear strength and subtracting the stirrup contribution, the concrete shear stress coefficient was determined assuming the shear strength is related to the square root of the compressive strength, as in Equation 5-2. A shear stress coefficient of 5 provided more reasonable results, in place of the usual coefficient of 2:
dbfV wcdac '5)2/( == [5-11]
This is confirmed in the literature for beams with a/d values near 2, where the concrete shear stress multiplier was also approximately 5 (Fereig and Smith 1977). Subsequent calibration of the proposed corrosion-damaged models for strength prediction was made using a concrete shear stress multiplier of 5, and provided more reasonable strength predictions for the undamaged beams, as shown in Table 5.2.
Table 5.1: Shear strength prediction using Equation 5-2 for undamaged beams
Vc [kips] Vn [kips] Vn [kips] Beam f'c
[psi] d
[in] ρ -
Vs [kips] Eq. 8 Eq. 10 Eq. 7&8 VEXP/VACI Eq. 7 & 10 VEXP/VACI
8RA 4350 20.5 0.019 65.6 27.0 30.4 92.6 1.44 96.0 1.39
10RA 4950 20.5 0.019 52.5 28.8 32.2 81.3 1.60 84.6 1.54
10TA 4800 20.5 0.018 52.5 28.4 31.5 80.9 1.75 84.0 1.69
10ITA 4400 21.5 0.019 55.0 28.5 32.1 83.6 1.62 87.1 1.55
12RA 4400 20.5 0.019 43.7 27.2 30.6 70.9 1.55 74.3 1.48
12RA(D) 4750 21.5 0.011 45.9 29.6 31.0 75.5 1.18 76.9 1.16
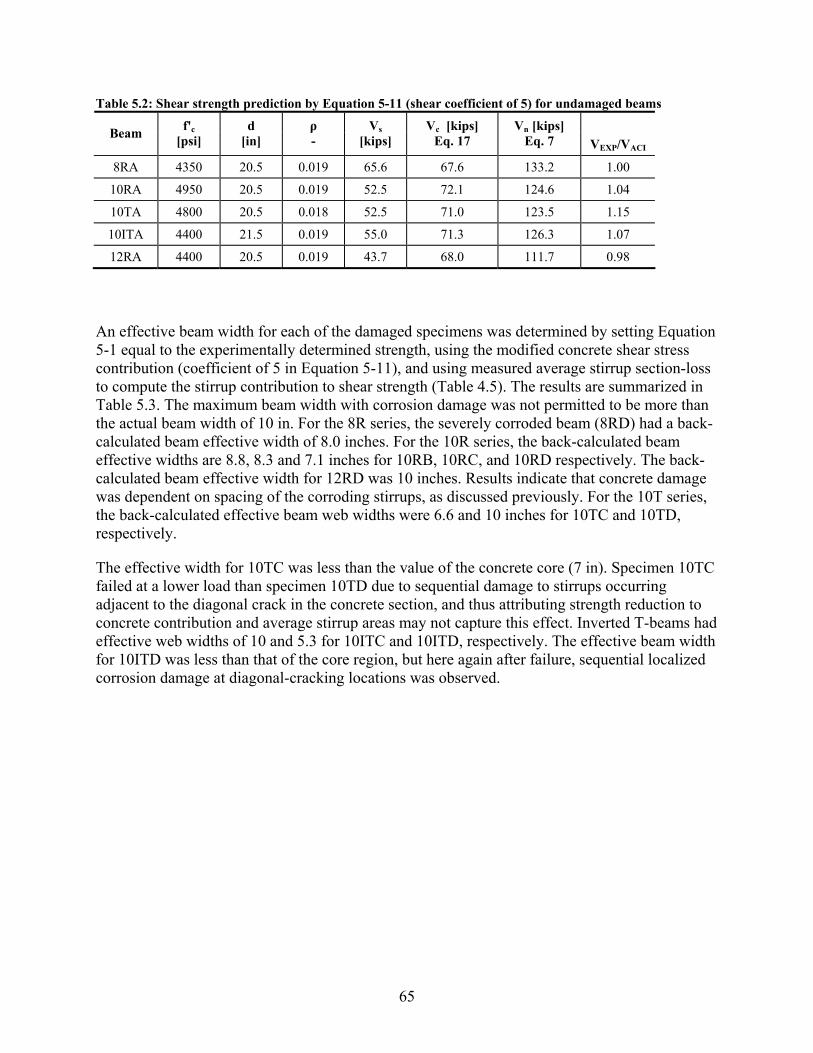
65
Table 5.2: Shear strength prediction by Equation 5-11 (shear coefficient of 5) for undamaged beams
Beam f'c [psi]
d [in]
ρ -
Vs [kips]
Vc [kips] Eq. 17
Vn [kips] Eq. 7 VEXP/VACI
8RA 4350 20.5 0.019 65.6 67.6 133.2 1.00
10RA 4950 20.5 0.019 52.5 72.1 124.6 1.04
10TA 4800 20.5 0.018 52.5 71.0 123.5 1.15
10ITA 4400 21.5 0.019 55.0 71.3 126.3 1.07
12RA 4400 20.5 0.019 43.7 68.0 111.7 0.98
An effective beam width for each of the damaged specimens was determined by setting Equation 5-1 equal to the experimentally determined strength, using the modified concrete shear stress contribution (coefficient of 5 in Equation 5-11), and using measured average stirrup section-loss to compute the stirrup contribution to shear strength (Table 4.5). The results are summarized in Table 5.3. The maximum beam width with corrosion damage was not permitted to be more than the actual beam width of 10 in. For the 8R series, the severely corroded beam (8RD) had a back-calculated beam effective width of 8.0 inches. For the 10R series, the back-calculated beam effective widths are 8.8, 8.3 and 7.1 inches for 10RB, 10RC, and 10RD respectively. The back-calculated beam effective width for 12RD was 10 inches. Results indicate that concrete damage was dependent on spacing of the corroding stirrups, as discussed previously. For the 10T series, the back-calculated effective beam web widths were 6.6 and 10 inches for 10TC and 10TD, respectively.
The effective width for 10TC was less than the value of the concrete core (7 in). Specimen 10TC failed at a lower load than specimen 10TD due to sequential damage to stirrups occurring adjacent to the diagonal crack in the concrete section, and thus attributing strength reduction to concrete contribution and average stirrup areas may not capture this effect. Inverted T-beams had effective web widths of 10 and 5.3 for 10ITC and 10ITD, respectively. The effective beam width for 10ITD was less than that of the core region, but here again after failure, sequential localized corrosion damage at diagonal-cracking locations was observed.
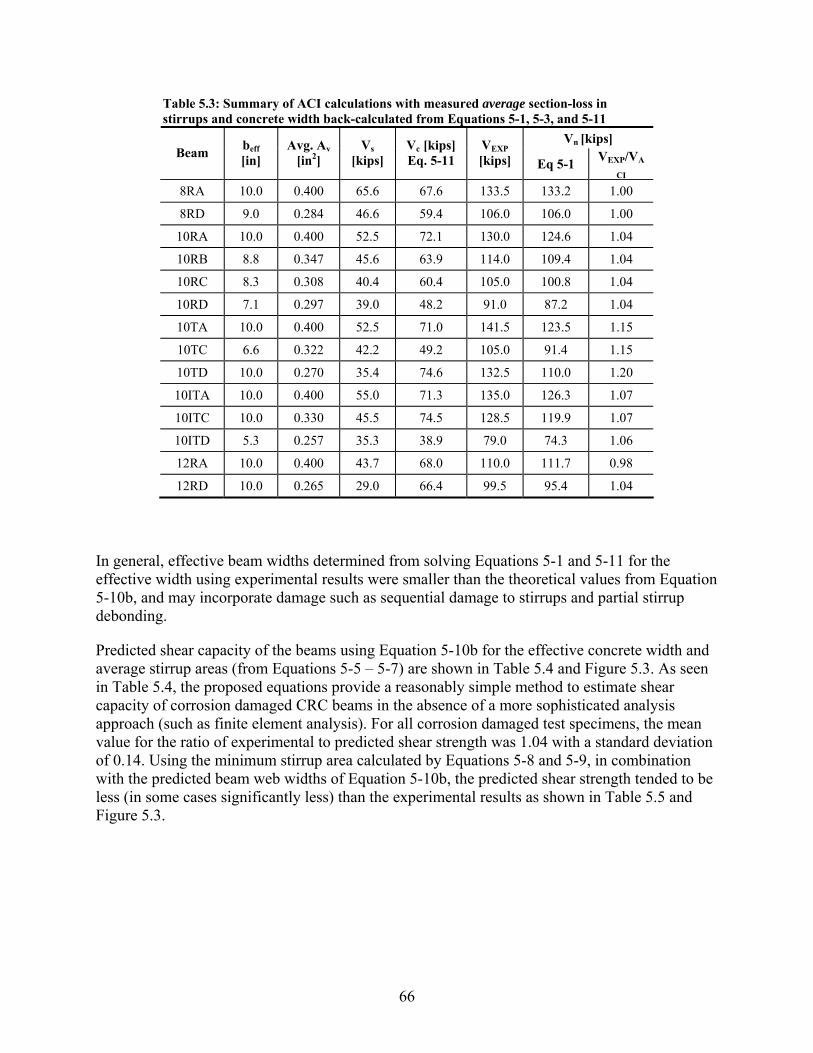
66
Table 5.3: Summary of ACI calculations with measured average section-loss in stirrups and concrete width back-calculated from Equations 5-1, 5-3, and 5-11
Vn [kips] Beam beff
[in]
Avg. Av [in2]
Vs [kips]
Vc [kips] Eq. 5-11
VEXP [kips] Eq 5-1 VEXP/VA
CI
8RA 10.0 0.400 65.6 67.6 133.5 133.2 1.00
8RD 9.0 0.284 46.6 59.4 106.0 106.0 1.00
10RA 10.0 0.400 52.5 72.1 130.0 124.6 1.04
10RB 8.8 0.347 45.6 63.9 114.0 109.4 1.04
10RC 8.3 0.308 40.4 60.4 105.0 100.8 1.04
10RD 7.1 0.297 39.0 48.2 91.0 87.2 1.04
10TA 10.0 0.400 52.5 71.0 141.5 123.5 1.15
10TC 6.6 0.322 42.2 49.2 105.0 91.4 1.15
10TD 10.0 0.270 35.4 74.6 132.5 110.0 1.20
10ITA 10.0 0.400 55.0 71.3 135.0 126.3 1.07
10ITC 10.0 0.330 45.5 74.5 128.5 119.9 1.07
10ITD 5.3 0.257 35.3 38.9 79.0 74.3 1.06
12RA 10.0 0.400 43.7 68.0 110.0 111.7 0.98
12RD 10.0 0.265 29.0 66.4 99.5 95.4 1.04
In general, effective beam widths determined from solving Equations 5-1 and 5-11 for the effective width using experimental results were smaller than the theoretical values from Equation 5-10b, and may incorporate damage such as sequential damage to stirrups and partial stirrup debonding.
Predicted shear capacity of the beams using Equation 5-10b for the effective concrete width and average stirrup areas (from Equations 5-5 – 5-7) are shown in Table 5.4 and Figure 5.3. As seen in Table 5.4, the proposed equations provide a reasonably simple method to estimate shear capacity of corrosion damaged CRC beams in the absence of a more sophisticated analysis approach (such as finite element analysis). For all corrosion damaged test specimens, the mean value for the ratio of experimental to predicted shear strength was 1.04 with a standard deviation of 0.14. Using the minimum stirrup area calculated by Equations 5-8 and 5-9, in combination with the predicted beam web widths of Equation 5-10b, the predicted shear strength tended to be less (in some cases significantly less) than the experimental results as shown in Table 5.5 and Figure 5.3.
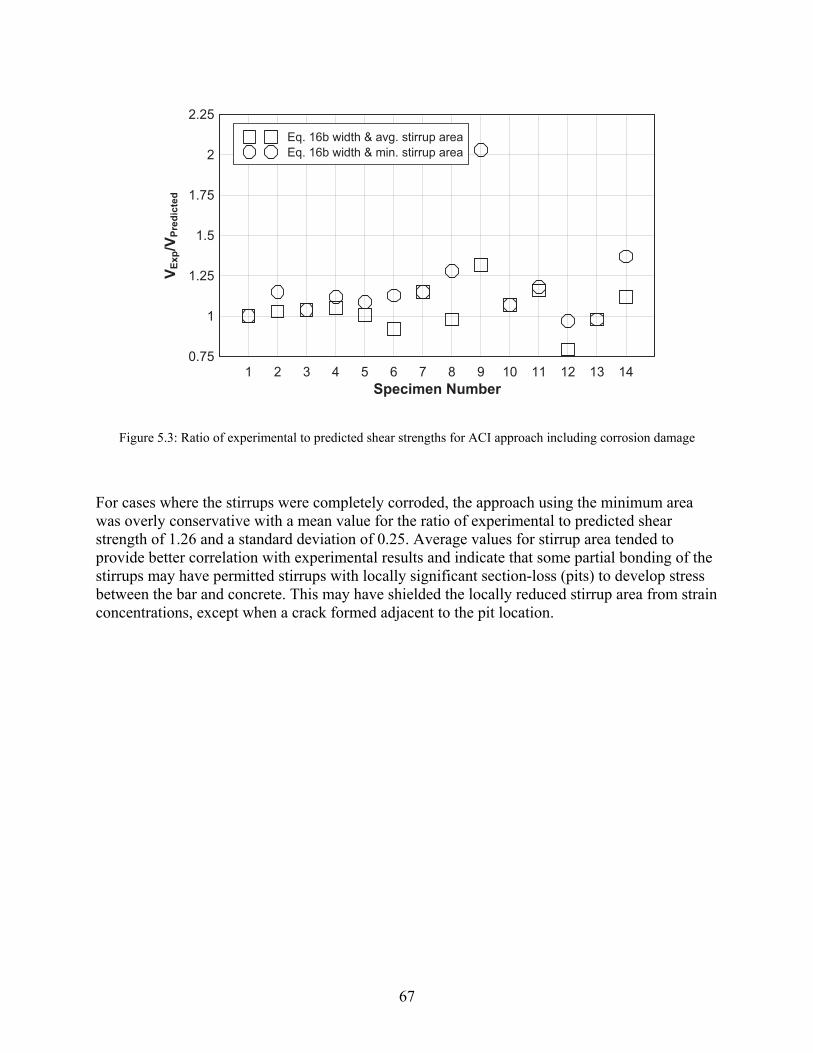
67
Specimen Number
VE
xp/V
Pre
dic
ted
1 2 3 4 5 6 7 8 9 10 11 12 13 140.75
1
1.25
1.5
1.75
2
2.25
Eq. 16b width & avg. stirrup area
Eq. 16b width & min. stirrup area
Figure 5.3: Ratio of experimental to predicted shear strengths for ACI approach including corrosion damage
For cases where the stirrups were completely corroded, the approach using the minimum area was overly conservative with a mean value for the ratio of experimental to predicted shear strength of 1.26 and a standard deviation of 0.25. Average values for stirrup area tended to provide better correlation with experimental results and indicate that some partial bonding of the stirrups may have permitted stirrups with locally significant section-loss (pits) to develop stress between the bar and concrete. This may have shielded the locally reduced stirrup area from strain concentrations, except when a crack formed adjacent to the pit location.
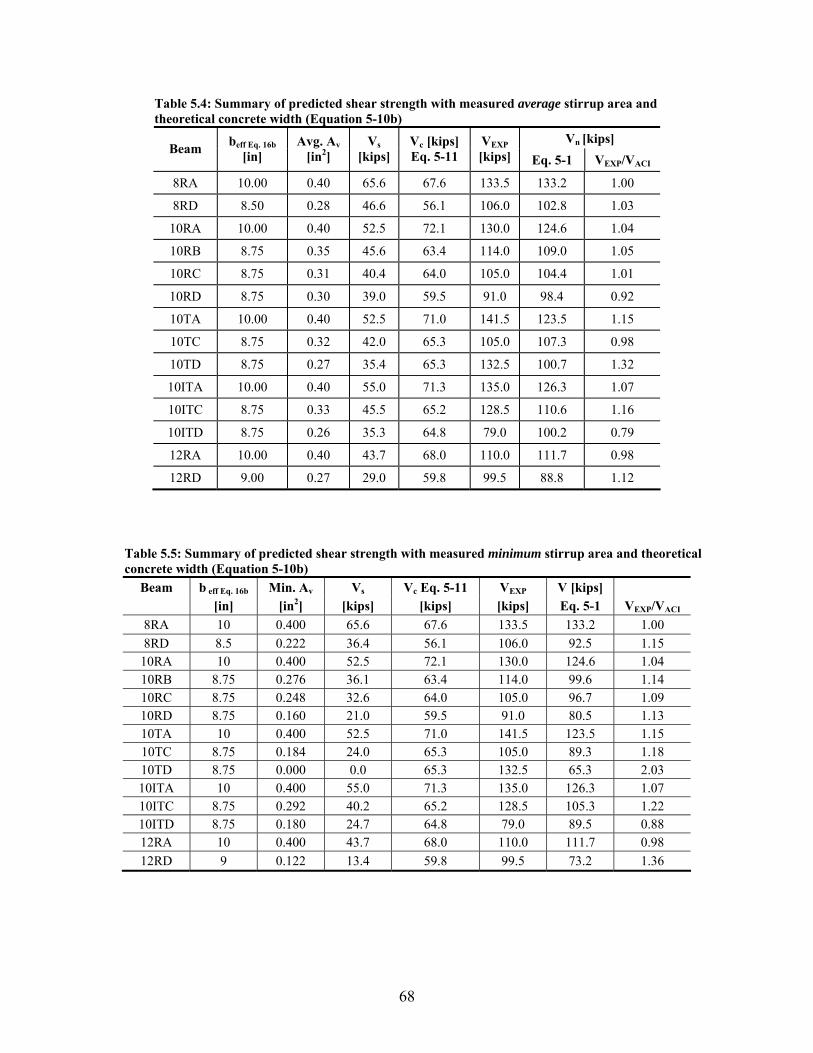
68
Table 5.4: Summary of predicted shear strength with measured average stirrup area and theoretical concrete width (Equation 5-10b)
Vn [kips] Beam beff Eq. 16b
[in]
Avg. Av [in2]
Vs [kips]
Vc [kips] Eq. 5-11
VEXP [kips] Eq. 5-1 VEXP/VACI
8RA 10.00 0.40 65.6 67.6 133.5 133.2 1.00
8RD 8.50 0.28 46.6 56.1 106.0 102.8 1.03
10RA 10.00 0.40 52.5 72.1 130.0 124.6 1.04
10RB 8.75 0.35 45.6 63.4 114.0 109.0 1.05
10RC 8.75 0.31 40.4 64.0 105.0 104.4 1.01
10RD 8.75 0.30 39.0 59.5 91.0 98.4 0.92
10TA 10.00 0.40 52.5 71.0 141.5 123.5 1.15
10TC 8.75 0.32 42.0 65.3 105.0 107.3 0.98
10TD 8.75 0.27 35.4 65.3 132.5 100.7 1.32
10ITA 10.00 0.40 55.0 71.3 135.0 126.3 1.07
10ITC 8.75 0.33 45.5 65.2 128.5 110.6 1.16
10ITD 8.75 0.26 35.3 64.8 79.0 100.2 0.79
12RA 10.00 0.40 43.7 68.0 110.0 111.7 0.98
12RD 9.00 0.27 29.0 59.8 99.5 88.8 1.12
Table 5.5: Summary of predicted shear strength with measured minimum stirrup area and theoretical concrete width (Equation 5-10b)
Beam b eff Eq. 16b Min. Av Vs Vc Eq. 5-11 VEXP V [kips] [in] [in2] [kips] [kips] [kips] Eq. 5-1 VEXP/VACI
8RA 10 0.400 65.6 67.6 133.5 133.2 1.00 8RD 8.5 0.222 36.4 56.1 106.0 92.5 1.15
10RA 10 0.400 52.5 72.1 130.0 124.6 1.04 10RB 8.75 0.276 36.1 63.4 114.0 99.6 1.14 10RC 8.75 0.248 32.6 64.0 105.0 96.7 1.09 10RD 8.75 0.160 21.0 59.5 91.0 80.5 1.13 10TA 10 0.400 52.5 71.0 141.5 123.5 1.15 10TC 8.75 0.184 24.0 65.3 105.0 89.3 1.18 10TD 8.75 0.000 0.0 65.3 132.5 65.3 2.03 10ITA 10 0.400 55.0 71.3 135.0 126.3 1.07 10ITC 8.75 0.292 40.2 65.2 128.5 105.3 1.22 10ITD 8.75 0.180 24.7 64.8 79.0 89.5 0.88 12RA 10 0.400 43.7 68.0 110.0 111.7 0.98 12RD 9 0.122 13.4 59.8 99.5 73.2 1.36
69
5.2 IMPLICATIONS FOR FIELD INSPECTION
The condition assessment of the beams just prior to strength testing provided little differentiation between the light, moderate, and severe corrosion levels. Table 2.4 illustrates these findings. The Open Girder/Beam assessment was “1” for all of the uncorroded beams and “3” for all of the corroded beams. The NBI Superstructure assessment was somewhat better, with a “9” for all of the uncorroded beams and “5”, “5/4”, and “4” for the corroded beams. Still, more separation in the assessment values is desirable in light of the large differences in shear capacity.
An additional inspection technique would be to identify stirrups within a given span length (equal to the beam depth) to locate sequential reduced stirrup sections. Inspection should focus on the quarter span length from each support for girders and along the entire bent-cap length. The area of corroded stirrups should be determined by mechanically removing as much surface rust as possible and estimating the remaining cross-sectional area. This can best be done using a contour gage to describe the random corroded rebar perimeter or using digital calipers and estimating the cross-sectional shape. Average areas can be estimated based on multiple measurements of the cross section on a given stirrup or by conservatively taking a single measurement of the minimum area on the stirrup leg.
The damaged region of the beam should be located relative to the supports so that forces and moments produced at the critical section can be quantified from analysis. Beams should then be evaluated for remaining shear capacity by one of the methods described, using the damaged concrete and reduced stirrup areas to compute shear resistances over these “beam depth lengths.”

70
71
6.0 CONCLUSIONS
A research program was performed on the structural performance of CRC beams that had undergone corrosion damage to the embedded shear reinforcing steel. Visual signs of corrosion distress were correlated with structural performance of CRC beams that were corroded to four damage states. Rebar section-loss was quantified, corrosion products were evaluated, and analysis methods were developed. Based on the findings, the following conclusions are made:
• Inspection data show diagonal cracking occurs in Oregon’s CRC coastal bridges. These results are supported by indirect evidence related to the fracture morphology of severed shear stirrups, the location of severed shear stirrups in bridge beams, and the time line for damage to shear stirrups.
• Additional damage states are needed to describe the deterioration of CRC bridges affected by chloride-induced corrosion damage and diagonal cracking.
• Inspection of shear reinforcement is more difficult after mortar repair and/or application of zinc anodes for cathodic protection.
• Similar pitting corrosion occurs on shear stirrups from Oregon’s coastal CRC bridges and from laboratory beams that undergo accelerated corrosion. Section-loss along stirrups is highly non-uniform and related to pitting corrosion and variations in general corrosion. This is particularly true when corrosion damage is the greatest.
• Damage to the concrete from shear reinforcement corrosion is dependent upon stirrup spacing. As the stirrup spacing decreases, the amount of corrosion required to crack the concrete also decreases. In areas of tightly spaced stirrups the cover cracking overlaps and causes greater areas of delamination and/or spalling. When stirrups are widely spaced, the damage to the concrete is more localized.
• Shear stirrups with locally reduced cross-sections can exhibit localized yielding and reduced beam ductility.
• Brittle fracture of shear stirrups under load can occur at locally reduced cross-sections produced by corrosion.
• Damage to the concrete produced by corrosion of reinforcing steel is dependent on the type and quantity of the corrosion products. Corrosion products such as akaganeite with large molar volumes are the likely cause of the initial concrete cracking around the reinforcing steel, leading to cover damage and loss of bond.
• The principal corrosion products in new and well-aged rusts are akaganeite, magnetite, and related minerals. The bulk of the iron corrosion products are amorphous or very fine grained.
72
With increased age, the corrosion products become more fully oxidized and comprise largely iron oxyhydroxide minerals.
• Corrosion damage reduces the ability of the stirrup to constrain the width of the diagonal crack(s) that crosses that stirrup.
• Diagonal cracking did not occur at lower loads for the corroded specimens, indicating that the cover concrete does not appear to be as significant as the core concrete contribution to shear strength.
• Remaining shear capacity of beams containing corroded stirrups is reasonably predicted by the different analysis methods, when including concrete cover damage and average cross-sectional area of the corroded stirrups, applied at the original stirrup spacing.
• Current inspection ratings do not accurately differentiate the structural performance of corroded reinforced concrete beams. In the past, most of the emphasis has been on the loss of cover concrete and corrosion of flexural steel.
• Inspections should identify sequential reduced stirrup sections within a span length equal to the beam depth to identify at risk girder regions for more detailed assessment.
• It is likely that shear stirrup corrosion damage and diagonal cracking combine to shorten the service life of coastal bridges compared to that which would occur in the absence of diagonal cracking.
• Bridge girders with significant rebar corrosion and localized cross-sectional loss may fail abruptly after diagonal cracking of the core concrete.
73
7.0 RECOMMENDATIONS
The following recommendations are made:
1. Inspections of coastal bridges should be expanded to put additional emphasis on the shear
capacity of the bridges. The inspection should include diagonal crack widths and location, and quantitative stirrup section-loss and location. Special emphasis should be on identification of sequential severely corroded stirrups.
2. Inspections would be aided by the availability of a pocket guide that would show the appearance of reinforcing steel as a function of section-loss for the steel sizes commonly used in coastal bridge construction. Such a guide should approximate the cross-section changes that occur with the higher corrosion rate on the exposed outer surface of the steel and the lower corrosion rate on the sheltered side in contact with the concrete. It could also show how localized corrosion affects the cross-section estimates.
3. Bridges that have been rehabilitated and/or thermal-sprayed with zinc should be inspected for evidence of diagonal cracking, particularly evidence that may have been covered up by repair and rehabilitation work.
4. An analysis of the impacts of corrosion on the shear capacity and service life of coastal bridges would provide Oregon DOT with a better understanding of the performance of the older coastal bridges and ways to translate inspection results into estimates of performance.

74
75
8.0 BIBLIOGRAPHY
AASHTO (1953). Standard Specification for Highway Bridges, Sixth Edition. AASHTO. Washington, DC.
AASHTO (1996). Standard Specification for Highway Bridges, Sixteenth Edition. AASHTO. Washington, DC.
AASHTO (2002). LRFD Bridge Design Specifications, Second Edition. AASHTO. Washington, DC.
AASHTO T 260-94 (1995). “Sampling and Testing for Chloride Ion in Concrete and Concrete Raw Materials.” Standard Specifications for Transportation Materials and Methods of Sampling and Testing, 17th Edition. Part II, Tests.
ACI (1997). “Corrosion of Metals in Concrete.” ACI Committee Report 222R-96. Manual of Concrete Practice. American Concrete Institute. Farmington Hills, MI. 30 pp.
ACI 318-99 (1999). “Building Code Requirements for Structural Concrete.” American Concrete Institute. Farmington Hills, MI.
ACI 318-02 (2002). “Building Code Requirements for Structural Concrete.” American Concrete Institute. Farmington Hills, MI.
Almusallam A. A., Al-Gahtani A. S., Aziz A. R., Dakhil F. H., Rasheeduzzafar (1996). “Effect of Reinforcement Corrosion on Flexural Behavior of Concrete Slabs.” Journal of Materials in Civil Engineering, V. 8, No. 3, pp 123-127.
Almusallam A. A. (2001). “Effect of Degree of Corrosion on the Properties of Reinforcing Steel Bars.” Construction and Building Materials, V. 15, pp 361-368.
Al-Sulaimani G. J., Kaleemullah M., Basunbui I. A., Rasheeduzzafar (1990). “Influence of Corrosion and Cracking on Bond Behavior and Strength of Reinforced Concrete Members.” ACI Structural Journal, V. 87, No. 2, pp 220-231.
Amleh L., Mirza S. (1999). “Corrosion Influence on Bond between Steel and Concrete.” ACI Structural Journal, V. 96, No. 3, pp 415-423.
ASCE-ACI Committee 445 (1999). “Recent Approaches to Shear Design of Structural Concrete.” Journal of Structural Engineering, V. 124, No. 12, pp 1375-1417.
ASTM G 1-99 (2001). “Standard Practice for Preparing, Cleaning, and Evaluating Corrosion Test Specimens.” 1996 Book of ASTM Standards, Section 1: Iron and Steel Products, V. 3.02, pp 9-21.
76
Bentur A., Diamond S., Berke N. S. (1997). “Steel Corrosion in Concrete.” E & FN Spon. New York, NY.
Bentz E. (2000). “Sectional Analysis of Reinforced Concrete Members.” Unpublished thesis. University of Toronto. Toronto, Canada.
Cabrera J. G. (1996). “Deterioration of Concrete Due to Reinforcement Steel Corrosion.” Cement and Concrete Composites, Vol. 18, pp 47-59.
Covino B. S., Cramer S. D., Holcomb G. R., Bullard S. J., and H. M. Laylor (1999). “Postmortem of a Failed Bridge.” Concrete International. ACI, pp 39-45.
Cramer S.D., Covino, Jr. B.S., Holcomb G.R., Bullard S.J., Dahlin C. L., Summers C.A., Laylor H.M. and S.M. Soltesz (2000). Evaluation of Rocky Point Viaduct Concrete Beam – Final Report. Report No. FHWA-OR-RD-00-18. Oregon Department of Transportation. Salem, OR. 80 pp.
Cramer S. D., Covino B. S., Bullard S. J., Holcomb G. R., Russell J. H., Nelson F. J., Laylor H. M., and S. M. Soltesz (2002). “Corrosion Prevention and Remediation Strategies for Reinforced Concrete Coastal Bridges.” Cement and Concrete Composites, Vol. 24, pp 101-117.
Farrow W.C.F. III (2002). Shear Capacity Assessment of Corrosion-Damaged Reinforced Concrete Beams. Unpublished MS. Thesis. Department of Civil, Construction and Environmental Engineering. Oregon State University. Corvallis, OR.
Fereig S.M. and Smith K.N. (1977). “Indirect Loading on Beams with Short Shear Spans.” American Concrete Institute (ACI), Journal Proceedings, Vol.74, No. 5, pp.220-222.
Fontana M. G. and N. D. Greene (1978). Corrosion Engineering. 2nd Ed. McGraw-Hill. New York, NY. pp. 50-51.
Francois R., and G. Arliguie (1998). “Influence of Service Cracking on Reinforcement Steel Corrosion.” Journal of Materials in Civil Engineering, V. 10, No. 1, pp 14-20.
Hartt W. H., J. Nam, and L. Li (2002). Critical Issues Related to Corrosion Induced Deterioration Projection for Concrete Marine Bridge Substructures. Final Report BC776, Florida Department of Transportation. Tallahassee FL. 28 pp.
Hausmann D. A. (1967). “Steel Corrosion in Concrete.” Materials Protection, Vol. 6, No. 11, pp. 19-23.
Hurley M. F. and J. R. Scully (2002). “Chloride Threshold Levels in Clad 316L and Solid 136LN Stainless Steel Rebar” Paper No. 02224. Corrosion/2002, NACE International. Houston TX. 24 pp.
Intergraph Corporation (1999). SmartSketchLE Version 3.0. Huntsville, AL.
77
Kay T. (1992). “Assessment and Renovation of Concrete Structures.” Longman Scientific & Technical. New York, NY.
Koch G. H., M. H. P. Brongers, N. G. Thompson, Y. P. Virmani, and J. H. Payer (2002). Corrosion Cost and Preventive Strategies in the United States. Report no. FHWA-RD-01-156. Federal Highway Administration, U. S. Department of Transportation. Washington, DC. 773 pp.
Kubaschewski O. and B. E. Hopkins (1962). Oxidation of Metals. Butterworths. London, UK. pp. 5-12.
Liu Y. and R. E. Weyers (1998). “Modeling the Time-to-Corrosion Cracking in Chloride Contaminated Reinforced Concrete Structures.” ACI Materials Journal. pp. 675-681.
McDonald D.B., Pfeifer D.W. and M.R. Sherman (1998). Corrosion Evaluation of Epoxy-Coated, Metallic-Clad and Solid Metallic Reinforcing Bars in Concrete. Report No. FHWA-RD-98-153. Federal Highway Administration, U. S. Department of Transportation. Washington, DC. 127 pp.
Oregon DOT (1999). Brush Creek Bridge #7785: Strength Test Report. Bridge Section, Oregon Department of Transportation. Salem, OR. April 13, 1999.
Oregon DOT (2001). “Oregon Department of Transportation Bridge Inspection Pocket Coding Guide.” Bridge Section, Oregon Department of Transportation. Salem, OR.
Palsson R., and M. S Mirza (2002). “Mechanical Response of Corroded Steel Reinforcement of Abandoned Concrete Bridge.” ACI Structural Journal, V. 99, No. 2, pp 157-162.
Sagues A. A. (1994). Corrosion of Epoxy Coated Rebar in Florida Bridges. Final Report. (WPI No. 0510603, University of South Florida, Tampa FL). Florida Department of Transportation. Tallahassee FL.
Stanish K, Hooton R. D., Pantazopoulou S. J. (1999). “Corrosion Effects on Bond Strength in Reinforced Concrete.” ACI Structural Journal, V. 96, No. 6, pp 915-921.
Swanstrom J. (2003). Personal communication, dated June 20, 2003. Bridge Inspector, Region 2, Oregon Department of Transportation, Salem OR. Available from S. D. Cramer, Albany Research Center, U. S. Department of Energy, Albany OR 97321.
Thomas M. (1996). “Chloride Thresholds in Marine Concrete.” Cement and Concrete Research. V. 26, No. 4, pp. 513-519.
Tinnea J. S. and N. J. Feuer (1985). “Evaluation of Structural Fatigue and Reinforcement Corrosion Interrelationships Using Close Grid Computer Generated Equipotential Mapping.” Paper No. 85259. Corrosion/1985. NACE International. Houston, TX. 15 pp.
Todeshini C. E., Bianchini A. C. and Kesler C.E. (1964). “Behavior of Concrete Columns Reinforced with High Strength Steels.” ACI Journal, Proceedings, V. 61, No. 6, pp. 701-716.
78
Vecchio F. J., Collins M. P., (1986). “The Modified Compression-Field Theory for Reinforced Concrete Elements Subjected to Shear.” ACI Journal, Vol. 83, No. 2, pp. 219-231.
West R. E. and S. W. Hime (1985). “Chloride Profiles in Salty Concrete.” Materials Performance, V. 24, No. 7, pp. 29-36.
Yunovich M. and Thompson N.G. (2003). “Corrosion of Highway Bridges: Economic Impact and Control Methodologies.” Concrete International, Vol. 25, No. 1, pp 52-57.
Related Documents